UNITED STATES
SECURITIES AND EXCHANGE COMMISSION
Washington, D.C. 20549
FORM N-CSR
CERTIFIED SHAREHOLDER REPORT OF
REGISTERED MANAGEMENT INVESTMENT COMPANIES
| Investment Company Act file number: | 811-22132 |
| Exact name of registrant as specified in charter: | abrdn Funds |
| Address of principal executive offices: | 1900 Market Street, Suite 200 |
Philadelphia, PA 19103
| Name and address of agent for service: | Ms. Andrea Melia |
abrdn Inc.
1900 Market Street, Suite 200
Philadelphia, PA 19103
| Registrant’s telephone number, including area code: | 866-667-9231 |
| Date of fiscal year end: | October 31 |
| Date of reporting period: | April 30, 2022 |
Item 1. Reports to Shareholders.
(a) A copy of the report transmitted to shareholders pursuant to Rule 30e-1 under the Investment Company Act of 1940 (the “1940 Act”) is filed herewith.
(b) Not applicable.

abrdn Funds
Equity Series
Semi-Annual Report
April 30, 2022
abrdn China A Share Equity Fund (formerly, Aberdeen China A Share Equity Fund)
Class A – GOPAX ■ Class C – GOPCX ■ Class R – GOPRX ■ Institutional Class – GOPIX ■ Institutional Service Class – GOPSX
abrdn Dynamic Dividend Fund (formerly, Aberdeen Dynamic Dividend Fund)
Class A – ADAVX ■ Institutional Class – ADVDX
abrdn Emerging Markets ex-China Fund (formerly, Aberdeen Global Equity Fund)
Class A – GLLAX ■ Class C – GLLCX ■ Class R – GWLRX ■ Institutional Class – GWLIX ■ Institutional Service Class – GLLSX
abrdn Emerging Markets Fund (formerly, Aberdeen Emerging Markets Fund)
Class A – GEGAX ■ Class C – GEGCX ■ Class R – GEMRX ■ Institutional Class – ABEMX ■ Institutional Service Class – AEMSX
abrdn Emerging Markets Sustainable Leaders Fund (formerly, Aberdeen Emerging Markets Sustainable Leaders Fund)
Class A – GIGAX ■ Class C – GIGCX ■ Class R – GIRRX ■ Institutional Class – GIGIX ■ Institutional Service Class – GIGSX
abrdn Global Equity Impact Fund (formerly, Aberdeen Global Equity Impact Fund)
Class A – JETAX ■ Institutional Class – JETIX
abrdn Global Infrastructure Fund (formerly, Aberdeen Global Infrastructure Fund)
Class A – AIAFX ■ Institutional Class – AIFRX
abrdn International Real Estate Equity Fund (formerly, Aberdeen International Real Estate Equity Fund)
Class A – EGALX ■ Institutional Class – EGLRX
abrdn International Small Cap Fund (formerly, Aberdeen International Small Cap Fund)
Class A – WVCCX ■ Class C – CPVCX ■ Class R – WPVAX ■ Institutional Class – ABNIX
abrdn International Sustainable Leaders Fund (formerly, Aberdeen International Sustainable Leaders Fund)
Class A – BJBIX ■ Institutional Class – JIEIX
abrdn Realty Income & Growth Fund (formerly, Aberdeen Realty Income & Growth Fund)
Class A – AIAGX ■ Institutional Class – AIGYX
abrdn U.S. Small Cap Equity Fund (formerly, Aberdeen U.S. Small Cap Equity Fund)
Class A – GSXAX ■ Class C – GSXCX ■ Class R – GNSRX ■ Institutional Class – GSCIX ■ Institutional Service Class – GSXIX
abrdn U.S. Sustainable Leaders Fund (formerly, Aberdeen U.S. Sustainable Leaders Fund)
Class A – GXXAX ■ Class C – GXXCX ■ Institutional Class – GGLIX ■ Institutional Service Class – GXXIX
abrdn U.S. Sustainable Leaders Smaller Companies Fund (formerly, Aberdeen U.S. Sustainable Leaders Smaller Companies Fund)
Class A – MLSAX ■ Class C – MLSCX ■ Class R – GLSRX ■ Institutional Class – GGUIX ■ Institutional Service Class – AELSX

Table of Contents
| abrdn China A Share Equity Fund | Page 1 | |
| abrdn Dynamic Dividend Fund | Page 4 | |
| abrdn Emerging Markets ex-China Fund | Page 9 | |
| abrdn Emerging Markets Fund | Page 13 | |
| abrdn Emerging Markets Sustainable Leaders Fund | Page 18 | |
| abrdn Global Equity Impact Fund | Page 22 | |
| abrdn Global Infrastructure Fund | Page 26 | |
| abrdn International Real Estate Equity Fund | Page 30 | |
| abrdn International Small Cap Fund | Page 34 | |
| abrdn International Sustainable Leaders Fund | Page 38 | |
| abrdn Realty Income & Growth Fund | Page 42 | |
| abrdn U.S. Small Cap Equity Fund | Page 45 | |
| abrdn U.S. Sustainable Leaders Fund | Page 49 | |
| abrdn U.S. Sustainable Leaders Smaller Companies Fund | Page 52 | |
| Financial Statements | Page 80 | |
| Notes to Financial Statements | Page 108 | |
| Shareholder Expense Examples | Page 136 | |
| Liquidity Risk Management Program | Page 138 |
Investors should carefully consider a fund's investment objectives, risks, fees, charges and expenses before investing any money. To obtain this and other fund information, please call 866-667-9231 to request a prospectus, or download a prospectus at https://www.abrdn.com/en-us/investor/fund-centre/fund-literature. Please read it carefully before investing any money.
Investing in mutual funds involves risk, including possible loss of principal.
abrdn Funds is distributed by Aberdeen Fund Distributors LLC, Member FINRA, 1900 Market Street, Suite 200, Philadelphia, PA 19103.
arbdn Inc. (AI) has been registered as an investment adviser under the Investment Advisers Act of 1940 since August 23, 1995.
The complete schedule of portfolio holdings for each fund of abrdn Funds (each a "Fund" and collectively, the "Funds") is included in the Funds' semi-annual and annual reports to shareholders. abrdn Funds also files complete schedules of portfolio holdings for each Fund with the Securities and Exchange Commission (the "Commission") for the first and third quarters of each fiscal year as an exhibit to its reports on Form N-PORT. The Funds' Form N-PORT filings are available on the Commission's website at http://www.sec.gov and the Funds make the information on the exhibit to Form N-PORT available to shareholders upon request without charge by calling 1-866-667-9231.
Statement Regarding Availability of Proxy Voting Record.
Information regarding the policies and procedures that the Funds use to determine how to vote proxies relating to portfolio securities is available without charge, upon request, by calling 1-866-667-9231. The information is also included in the Funds' Statement of Additional Information, which is available on the Funds' website at https://www.abrdn.com/en-us/investor/fund-centre/fund-literature and on the Commission's website at www.sec.gov.
Information relating to how each Fund voted proxies relating to portfolio securities held during the most recent twelve months ended June 30 is available by August 30 of the relevant year: (i) upon request and without charge by calling 1-866-667-9231; and (ii) on the Commission's website at www.sec.gov.
abrdn China A Share Equity Fund (Unaudited)
| Average Annual Total Return1 (For periods ended April 30, 2022) | Six Month† | 1 Yr. | 5 Yr. | 10 Yr. | |||||||||||
| Class A | w/o SC | (26.25%) | (28.90%) | 8.11% | 4.46% | ||||||||||
| w/ SC2 | (30.48%) | (32.99%) | 6.84% | 3.85% | |||||||||||
| Class C | w/o SC | (26.48%) | (29.38%) | 7.38% | 3.74% | ||||||||||
| w/ SC3 | (27.20%) | (30.07%) | 7.38% | 3.74% | |||||||||||
| Class R4 | w/o SC | (26.35%) | (29.13%) | 7.77% | 4.10% | ||||||||||
| Institutional Service Class4 | w/o SC | (26.14%) | (28.73%) | 8.37% | 4.71% | ||||||||||
| Institutional Class4 | w/o SC | (26.10%) | (28.65%) | 8.48% | 4.78% | ||||||||||
All figures showing the effect of a sales charge (SC) reflect the maximum charge possible because it has the most significant effect on performance data. The total returns shown above do not include the impact of financial statement rounding of the net asset value (NAV) per share and/or financial statement adjustments.
| † | Not Annualized | |
| 1 | The Fund changed its investment strategies effective June 13, 2019. Performance information for periods prior to June 13, 2019 does not reflect the current investment strategy. In connection with the change in investment strategy, the Fund changed its name from Aberdeen China Opportunities Fund to Aberdeen China A Share Equity Fund. Please consult the Fund's prospectus for more detail. | |
| 2 | A 5.75% front-end sales charge was deducted. | |
| 3 | A 1.00% contingent deferred sales charge (CDSC) was deducted from the one year return because it is charged when Class C shares are sold within the first year after purchase. | |
| 4 | Not subject to any sales charges. |
Performance of a $1,000,000 Investment* (as of April 30, 2022)

* Minimum Initial Investment
Performance of $1,000,000 invested in Institutional Class shares of the abrdn China A Share Equity Fund, MSCI China A (Onshore) Index (Net Dividends) and the Consumer Price Index (CPI) over a 10-year period ended April 30, 2022. Unlike the Fund, the returns for these unmanaged indexes do not reflect any fees, expenses, or sales charges. Investors cannot invest directly in market indexes.
The MSCI China A (Onshore) Index captures large and mid cap representation across China securities listed on the Shanghai and Shenzhen exchanges.
The CPI is a measure of the average change over time in the prices paid by urban consumers for a market basket of consumer goods and services.
Investment return and principal value will fluctuate, and when redeemed, shares may be worth more or less than original cost. Past performance is no guarantee of future results. The Average Annual Total Return table and Performance graph do not reflect the deduction of taxes that a shareholder would pay on fund distributions or the redemption of fund shares. Investing in mutual funds involves market risk, including loss of principal. Performance returns assume the reinvestment of all distributions. Total returns reflect waivers and reimbursements in effect, without which returns would have been lower.
| 2022 Semi-Annual Report | 1 |
abrdn China A Share Equity Fund (Unaudited)
Portfolio Summary (as a percentage of net assets)
April 30, 2022 (Unaudited)
| Asset Allocation | ||||
| Common Stocks | 94.6% | |||
| Short-Term Investment | 5.7% | |||
| Exchange-Traded Funds | –% | |||
| Liabilities in Excess of Other Assets | (0.3%) | |||
| 100.0% |
The following table summarizes the composition of the Fund's portfolio, in S&P Global Industry Classification Standard (GICS) sectors.
| Sectors | ||||
| Consumer Staples | 17.8% | |||
| Industrials | 17.5% | |||
| Information Technology | 16.1% | |||
| Financials | 15.0% | |||
| Health Care | 10.6% | |||
| Consumer Discretionary | 10.4% | |||
| Materials | 5.0% | |||
| Real Estate | 2.2% | |||
| Energy | –% | |||
| Short-Term Investment | 5.7% | |||
| Liabilities in Excess of Other Assets | (0.3%) | |||
| 100.0% | ||||
| Top Ten Holdings | ||||
| Kweichow Moutai Co. Ltd., A Shares (Stock Connect) | 7.4 | % | ||
| China Merchants Bank Co. Ltd., A Shares | 5.2 | % | ||
| China Tourism Group Duty Free Corp. Ltd., A Shares (Stock Connect) | 5.0 | % | ||
| Contemporary Amperex Technology Co. Ltd., A Shares | 4.1 | % | ||
| Centre Testing International Group Co. Ltd., A Shares (Stock Connect) | 3.6 | % | ||
| LONGi Green Energy Technology Co. Ltd., A Shares | 3.4 | % | ||
| Midea Group Co. Ltd., A Shares (Stock Connect) | 3.3 | % | ||
| Shenzhen Mindray Bio-Medical Electronics Co. Ltd., A Shares | 3.1 | % | ||
| Bank of Ningbo Co. Ltd., A Shares | 3.0 | % | ||
| Ping An Insurance Group Co. of China Ltd., A Shares | 2.7 | % |
| Countries | ||||
| China | 94.6% | |||
| Short Term Investment | 5.7% | |||
| Liabilities in Excess of Other Assets | (0.3%) | |||
| 100.0% | ||||
Amounts listed as "–" are 0% or round to 0%.
| 2 | 2022 Semi-Annual Report |
Statement of Investments
April 30, 2022 (Unaudited)
abrdn China A Share Equity Fund
| Shares or Principal Amount | Value | |||||
| COMMON STOCKS (94.6%) | ||||||
| CHINA (94.6%) | ||||||
| Consumer Discretionary (10.4%) | ||||||
| China Tourism Group Duty Free Corp. Ltd., A Shares (Stock Connect) (a) | 96,295 | $ | 2,598,188 | |||
| Fuyao Glass Industry Group Co. Ltd., A Shares (a) | 205,641 | 1,090,940 | ||||
| Midea Group Co. Ltd., A Shares (Stock Connect) (a) | 198,142 | 1,686,008 | ||||
| 5,375,136 | ||||||
| Consumer Staples (17.8%) | ||||||
| By-health Co. Ltd., A Shares (a) | 239,588 | 719,629 | ||||
| Chacha Food Co. Ltd., A Shares (a) | 87,600 | 697,088 | ||||
| Foshan Haitian Flavouring & Food Co. Ltd., A Shares (a) | 105,393 | 1,284,961 | ||||
| Inner Mongolia Yili Industrial Group Co. Ltd., A Shares (a) | 174,800 | 1,007,246 | ||||
| Kweichow Moutai Co. Ltd., A Shares (Stock Connect) (a) | 13,963 | 3,832,788 | ||||
| Proya Cosmetics Co. Ltd., A Shares (a) | 23,600 | 714,143 | ||||
| Wuliangye Yibin Co. Ltd., A Shares (a) | 39,037 | 945,818 | ||||
| 9,201,673 | ||||||
| Energy (0.0%) | ||||||
| G3 Exploration Ltd. (b)(c)(d) | 53,000 | — | ||||
| Financials (15.0%) | ||||||
| Bank of Ningbo Co. Ltd., A Shares (a) | 284,316 | 1,539,777 | ||||
| China International Capital Corp. Ltd., H Shares (e) | 322,000 | 645,408 | ||||
| China International Capital Corp. Ltd.,A Shares (a) | 43,400 | 242,331 | ||||
| China Merchants Bank Co. Ltd., A Shares (a) | 445,732 | 2,663,560 | ||||
| Ping An Bank Co. Ltd., A Shares (a) | 549,900 | 1,260,259 | ||||
| Ping An Insurance Group Co. of China Ltd., A Shares (a) | 210,037 | 1,398,934 | ||||
| 7,750,269 | ||||||
| Health Care (10.6%) | ||||||
| Aier Eye Hospital Group Co. Ltd., A Shares (a) | 257,558 | 1,378,140 | ||||
| Hangzhou Tigermed Consulting Co. Ltd., A Shares (a) | 95,067 | 1,266,639 | ||||
| Hangzhou Tigermed Consulting Co. Ltd., H Shares (e) | 14,800 | 143,434 | ||||
| Jiangsu Hengrui Medicine Co. Ltd., A Shares (a) | 238,895 | 1,055,131 | ||||
| Shenzhen Mindray Bio-Medical Electronics Co. Ltd., A Shares (a) | 34,710 | 1,627,040 | ||||
| 5,470,384 | ||||||
| Industrials (17.5%) | ||||||
| Centre Testing International Group Co. Ltd., A Shares (Stock Connect) (a) | 564,388 | 1,843,719 | ||||
| Contemporary Amperex Technology Co. Ltd., A Shares (a) | 34,679 | 2,101,831 | ||||
| Guangzhou Baiyun International Airport Co. Ltd., A Shares (a) | 243,200 | 434,293 | ||||
| NARI Technology Co. Ltd., A Shares (Stock Connect) (a) | 247,860 | 1,181,429 | ||||
| Shanghai International Airport Co. Ltd., A Shares (Stock Connect) (a)(b) | 65,010 | 479,838 | ||||
| Shanghai M&G Stationery, Inc., A Shares (a) | 182,680 | 1,311,930 | ||||
| Shenzhen Inovance Technology Co. Ltd., A Shares (a) | 94,389 | 811,035 | ||||
| Sungrow Power Supply Co. Ltd., A Shares (Stock Connect) (a) | 96,078 | 901,030 | ||||
| 9,065,105 | ||||||
| Shares or Principal Amount | Value | |||||
| Information Technology (16.1%) | ||||||
| Glodon Co. Ltd., A Shares (a) | 196,489 | $ | 1,354,662 | |||
| Hundsun Technologies, Inc., A Shares (a) | 169,150 | 964,097 | ||||
| LONGi Green Energy Technology Co. Ltd., A Shares (a) | 177,420 | 1,784,087 | ||||
| Luxshare Precision Industry Co. Ltd., A Shares (a) | 182,270 | 838,006 | ||||
| Maxscend Microelectronics Co. Ltd., A Shares (a) | 17,300 | 476,700 | ||||
| NAURA Technology Group Co. Ltd., A Shares (a) | 17,200 | 608,105 | ||||
| SG Micro Corp., A Shares (a) | 14,440 | 600,109 | ||||
| Venustech Group, Inc., A Shares (a) | 349,100 | 913,050 | ||||
| Yonyou Network Technology Co. Ltd., A Shares (a) | 274,699 | 783,122 | ||||
| 8,321,938 | ||||||
| Materials (5.0%) | ||||||
| Anhui Conch Cement Co. Ltd., A Shares (a) | 102,656 | 614,953 | ||||
| Wanhua Chemical Group Co. Ltd., A Shares (a) | 52,017 | 605,140 | ||||
| Yunnan Energy New Material Co. Ltd., A Shares (Stock Connect) (a) | 44,320 | 1,338,265 | ||||
| 2,558,358 | ||||||
| Real Estate (2.2%) | ||||||
| China Vanke Co. Ltd., A Shares (a) | 391,173 | 1,139,324 | ||||
| 48,882,187 | ||||||
| Total Common Stocks | 48,882,187 | |||||
| EXCHANGE-TRADED FUNDS (0.0%) | ||||||
| UNITED STATES (0.0%) | ||||||
| KraneShares Bosera MSCI China A 50 Connect Index ETF | 330 | 11,173 | ||||
| Total Exchange-Traded Funds | 11,173 | |||||
| SHORT-TERM INVESTMENT (5.7%) | ||||||
| UNITED STATES (5.7%) | ||||||
| State Street Institutional U.S. Government Money Market Fund, Premier Class, 0.29% (f) | 2,976,470 | 2,976,470 | ||||
| 2,976,470 | ||||||
| Total Short-Term Investment | 2,976,470 | |||||
| Total Investments (Cost $69,302,297) (g)—100.3% | 51,869,830 | |||||
| Liabilities in Excess of Other Assets—(0.3)% | (176,717 | ) | ||||
| Net Assets—100.0% | $ | 51,693,113 | ||||
| (a) | China A Shares. These shares are issued in local currency, traded in the local stock markets and are held through either a Qualified Foreign Institutional Investor (QFII) license or the Shanghai or Shenzhen Hong-Kong Stock Connect program. |
| (b) | Non-income producing security. |
| (c) | Illiquid security. |
| (d) | Delisted. Fair Value is determined pursuant to procedures approved by the Fund's Board of Trustees. See Note 2(a) of the accompanying Notes to Financial Statements. |
| (e) | Denotes a security issued under Regulation S or Rule 144A. |
| (f) | Registered investment company advised by State Street Global Advisors. The rate shown is the 7 day yield as of April 30, 2022. |
| (g) | See accompanying Notes to Financial Statements for tax unrealized appreciation/(depreciation) of securities. |
| ETF | Exchange-Traded Fund |
See accompanying Notes to Financial Statements.
| 2022 Semi-Annual Report | 3 |
abrdn Dynamic Dividend Fund (Unaudited)
| Average Annual Total Return1 (For periods ended April 30, 2022) | Six Month† | 1 Yr. | 5 Yr. | 10 Yr. | |||||||||||
| Class A | w/o SC | (8.37%) | (5.34%) | 7.75% | 8.05% | ||||||||||
| w/ SC2 | (13.65%) | (10.84%) | 6.45% | 7.40% | |||||||||||
| Institutional Class3 | w/o SC | (8.26%) | (5.30%) | 8.01% | 8.31% | ||||||||||
All figures showing the effect of a sales charge (SC) reflect the maximum charge possible because it has the most significant effect on performance data. The total returns shown above do not include the impact of financial statement rounding of the net asset value (NAV) per share and/or financial statement adjustments.
| † | Not Annualized |
| 1 | Returns prior to May 7, 2018 reflect the performance of a predecessor fund (the "Predecessor Fund"). Returns of the Predecessor Fund have not been adjusted to reflect the expenses applicable to the respective classes. The Fund and the Predecessor Fund have substantially similar investment objectives and strategies. Please consult the Fund's prospectus for more detail. |
| 2 | A 5.75% front-end sales charge was deducted. |
| 3 | Not subject to any sales charges. |
Performance of a $1,000,000 Investment* (as of April 30, 2022)

* Minimum Initial Investment
Comparative performance of $1,000,000 invested in Institutional Class shares of the abrdn Dynamic Dividend Fund, Morgan Stanley Capital International All Country World Index (MSCI ACWI) (Net
Dividends) and the Consumer Price Index (CPI) over a 10-year period ended April 30, 2022. Unlike the Fund, the returns for these unmanaged indexes do not reflect any fees, expenses or sales charges. Investors cannot invest directly in market indexes.
The MSCI ACWI captures large and mid cap representation across 23 Developed Markets (DM) and 24 Emerging Markets (EM) countries. With 2,937 constituents, the index covers approximately 85% of the global investable equity opportunity set. DM countries in the Index are: Australia, Austria, Belgium, Canada, Denmark, Finland, France, Germany, Hong Kong, Ireland, Israel, Italy, Japan, Netherlands, New Zealand, Norway, Portugal, Singapore, Spain, Sweden, Switzerland, the UK and the US. EM countries in the Index are: Brazil, Chile, China, Colombia, Czech Republic, Egypt, Greece, Hungary, India, Indonesia, Korea, Kuwait, Malaysia, Mexico, Peru, Philippines, Poland, Qatar, Saudi Arabia, South Africa, Taiwan, Thailand, Turkey and United Arab Emirates.
The CPI is a measure of the average change over time in the prices paid by urban consumers for a market basket of consumer goods and services.
Investment return and principal value will fluctuate, and when redeemed, shares may be worth more or less than original cost. Past performance is no guarantee of future results. The Average Annual Total Return table and Performance graph do not reflect the deduction of taxes that a shareholder would pay on fund distributions or the redemption of fund shares. Investing in mutual funds involves market risk, including loss of principal. Performance returns assume the reinvestment of all distributions. Total returns reflect waivers and reimbursements in effect, without which returns would have been lower.
| 4 | 2022 Semi-Annual Report |
abrdn Dynamic Dividend Fund (Unaudited)
Portfolio Summary (as a percentage of net assets)
April 30, 2022 (Unaudited)
| Asset Allocation | |||
| Common Stocks | 98.3% | ||
| Short-Term Investment | 1.4% | ||
| Preferred Stocks | 1.3% | ||
| Liabilities in Excess of Other Assets | (1.0%) | ||
| 100.0% |
The following table summarizes the composition of the Fund's portfolio, in S&P Global Industry Classification Standard (GICS) sectors.
| Sectors | |||
| Information Technology | 17.0% | ||
| Financials | 15.6% | ||
| Health Care | 13.3% | ||
| Industrials | 10.2% | ||
| Consumer Discretionary | 9.5% | ||
| Consumer Staples | 8.5% | ||
| Communication Services | 6.4% | ||
| Materials | 5.5% | ||
| Utilities | 5.3% | ||
| Energy | 4.3% | ||
| Real Estate | 4.0% | ||
| Short-Term Investment | 1.4% | ||
| Liabilities in Excess of Other Assets | (1.0%) | ||
| 100.0% | |||
| Top Ten Holdings | |||
| Apple, Inc. | 3.3% | ||
| Microsoft Corp. | 2.4% | ||
| Alphabet, Inc., Class C | 1.8% | ||
| AbbVie, Inc. | 1.6% | ||
| Broadcom, Inc. | 1.6% | ||
| Williams Cos., Inc. (The) | 1.6% | ||
| Bristol-Myers Squibb Co. | 1.5% | ||
| Coca-Cola Co. (The) | 1.5% | ||
| Enbridge, Inc. | 1.5% | ||
| Target Corp. | 1.5% |
| Countries | |||
| United States | 51.7% | ||
| Germany | 5.7% | ||
| France | 5.1% | ||
| United Kingdom | 5.0% | ||
| Switzerland | 3.6% | ||
| China | 3.0% | ||
| Netherlands | 2.9% | ||
| Canada | 2.8% | ||
| Brazil | 2.4% | ||
| South Korea | 2.2% | ||
| Sweden | 2.2% | ||
| Japan | 2.0% | ||
| Other, less than 2% each | 11.0% | ||
| Short-Term Investment | 1.4% | ||
| Liabilities in Excess of Other Assets | (1.0%) | ||
| 100.0% | |||
| 2022 Semi-Annual Report | 5 |
Statement of Investments
April 30, 2022 (Unaudited)
abrdn Dynamic Dividend Fund
| Shares or Principal Amount | Value | ||||
| COMMON STOCKS (98.3%) | |||||
| AUSTRALIA (0.6%) | |||||
| Materials (0.6%) | |||||
| Rio Tinto PLC, ADR | 9,600 | $ 682,752 | |||
| BRAZIL (2.4%) | |||||
| Industrials (1.4%) | |||||
| CCR SA | 630,700 | 1,583,145 | |||
| Materials (1.0%) | |||||
| Vale SA, ADR | 66,300 | 1,119,807 | |||
| 2,702,952 | |||||
| CANADA (2.8%) | |||||
| Energy (1.5%) | |||||
| Enbridge, Inc. | 39,000 | 1,701,960 | |||
| Materials (1.3%) | |||||
| Barrick Gold Corp. | 64,800 | 1,445,688 | |||
| 3,147,648 | |||||
| CHINA (3.0%) | |||||
| Communication Services (1.0%) | |||||
| Tencent Holdings Ltd. | 24,300 | 1,145,135 | |||
| Consumer Discretionary (0.0%) | |||||
| JD.com, Inc., Class A (a) | 1,157 | 36,073 | |||
| Financials (1.0%) | |||||
| Ping An Insurance Group Co. of China Ltd., H Shares | 184,000 | 1,163,011 | |||
| Real Estate (1.0%) | |||||
| China Vanke Co. Ltd., H Shares | 472,000 | 1,112,976 | |||
| 3,457,195 | |||||
| DENMARK (1.0%) | |||||
| Financials (1.0%) | |||||
| Tryg A/S | 49,300 | 1,172,211 | |||
| FINLAND (1.9%) | |||||
| Financials (1.1%) | |||||
| Nordea Bank Abp | 121,400 | 1,210,367 | |||
| Information Technology (0.8%) | |||||
| Nokia OYJ (a) | 181,800 | 921,739 | |||
| 2,132,106 | |||||
| FRANCE (5.1%) | |||||
| Consumer Discretionary (0.5%) | |||||
| LVMH Moet Hennessy Louis Vuitton SE | 900 | 582,422 | |||
| Consumer Staples (1.2%) | |||||
| Danone SA | 21,700 | 1,312,226 | |||
| Energy (1.3%) | |||||
| TOTAL SE, ADR | 29,500 | 1,436,945 | |||
| Health Care (1.4%) | |||||
| Sanofi | 15,100 | 1,595,993 | |||
| Industrials (0.7%) | |||||
| Alstom SA | 38,322 | 842,333 | |||
| 5,769,919 |
| Shares or Principal Amount | Value | ||||
| GERMANY (5.7%) | |||||
| Consumer Discretionary (1.0%) | |||||
| Mercedes-Benz Group AG | 16,700 | $ 1,182,145 | |||
| Financials (2.2%) | |||||
| Deutsche Boerse AG | 8,000 | 1,392,756 | |||
| Muenchener Rueckversicherungs-Gesellschaft AG in Muenchen | 4,611 | 1,098,067 | |||
| 2,490,823 | |||||
| Materials (1.1%) | |||||
| Linde PLC (a) | 3,900 | 1,223,187 | |||
| Utilities (1.4%) | |||||
| RWE AG | 37,900 | 1,573,585 | |||
| 6,469,740 | |||||
| HONG KONG (0.7%) | |||||
| Financials (0.7%) | |||||
| Hong Kong Exchanges & Clearing Ltd. | 18,700 | 793,235 | |||
| ISRAEL (0.8%) | |||||
| Industrials (0.8%) | |||||
| ZIM Integrated Shipping Services Ltd. | 17,200 | 956,836 | |||
| ITALY (1.3%) | |||||
| Utilities (1.3%) | |||||
| Enel SpA | 220,200 | 1,431,937 | |||
| JAPAN (2.0%) | |||||
| Financials (1.0%) | |||||
| Mitsubishi UFJ Financial Group, Inc. | 199,500 | 1,159,768 | |||
| Real Estate (1.0%) | |||||
| GLP J-REIT | 800 | 1,079,500 | |||
| 2,239,268 | |||||
| NETHERLANDS (2.9%) | |||||
| Consumer Staples (1.3%) | |||||
| Heineken NV | 14,600 | 1,425,120 | |||
| Information Technology (1.6%) | |||||
| ASML Holding NV | 1,900 | 1,078,323 | |||
| BE Semiconductor Industries NV | 12,500 | 761,983 | |||
| 1,840,306 | |||||
| 3,265,426 | |||||
| NORWAY (1.2%) | |||||
| Communication Services (1.2%) | |||||
| Telenor ASA | 92,700 | 1,307,391 | |||
| SINGAPORE (1.2%) | |||||
| Financials (1.2%) | |||||
| Oversea-Chinese Banking Corp. Ltd. | 157,000 | 1,393,938 | |||
| SOUTH KOREA (0.9%) | |||||
| Materials (0.9%) | |||||
| LG Chem Ltd. | 2,540 | 1,040,295 |
See accompanying Notes to Financial Statements.
| 6 | 2022 Semi-Annual Report |
Statement of Investments (continued)
April 30, 2022 (Unaudited)
abrdn Dynamic Dividend Fund
| Shares or Principal Amount | Value | ||||
| COMMON STOCKS (continued) | |||||
| SPAIN (1.2%) | |||||
| Industrials (1.2%) | |||||
| Ferrovial SA | 54,242 | $ 1,391,001 | |||
| SWEDEN (2.2%) | |||||
| Communication Services (1.2%) | |||||
| Tele2 AB, B Shares | 99,287 | 1,315,978 | |||
| Industrials (1.0%) | |||||
| Volvo AB, B Shares | 73,700 | 1,175,768 | |||
| 2,491,746 | |||||
| SWITZERLAND (3.6%) | |||||
| Consumer Staples (1.0%) | |||||
| Nestle SA | 8,900 | 1,148,937 | |||
| Financials (1.3%) | |||||
| Zurich Insurance Group AG | 3,150 | 1,434,099 | |||
| Health Care (1.3%) | |||||
| Roche Holding AG | 4,000 | 1,483,255 | |||
| 4,066,291 | |||||
| TAIWAN (1.1%) | |||||
| Information Technology (1.1%) | |||||
| Taiwan Semiconductor Manufacturing Co. Ltd., ADR | 13,700 | 1,273,141 | |||
| UNITED KINGDOM (5.0%) | |||||
| Communication Services (1.2%) | |||||
| Vodafone Group PLC, ADR | 89,700 | 1,362,543 | |||
| Consumer Staples (0.8%) | |||||
| Tate & Lyle PLC | 88,177 | 857,045 | |||
| Health Care (2.1%) | |||||
| AstraZeneca PLC, ADR | 23,800 | 1,580,320 | |||
| Dechra Pharmaceuticals PLC | 17,500 | 793,019 | |||
| 2,373,339 | |||||
| Industrials (0.9%) | |||||
| Melrose Industries PLC | 717,326 | 1,042,344 | |||
| 5,635,271 | |||||
| UNITED STATES (51.7%) | |||||
| Communication Services (1.8%) | |||||
| Alphabet, Inc., Class C (a) | 880 | 2,023,410 | |||
| Consumer Discretionary (8.0%) | |||||
| Aptiv PLC (a) | 10,100 | 1,074,640 | |||
| Genuine Parts Co. | 11,400 | 1,482,570 | |||
| Hanesbrands, Inc. | 60,600 | 803,556 | |||
| Las Vegas Sands Corp. (a) | 32,600 | 1,155,018 | |||
| Lowe's Cos., Inc. | 7,500 | 1,482,975 | |||
| Target Corp. | 7,400 | 1,692,010 | |||
| TJX Cos., Inc. (The) | 22,400 | 1,372,672 | |||
| 9,063,441 | |||||
| Consumer Staples (4.2%) | |||||
| Coca-Cola Co. (The) | 26,600 | 1,718,626 | |||
| Kraft Heinz Co. (The) | 32,300 | 1,376,949 | |||
| Mondelez International, Inc., Class A | 25,600 | 1,650,688 | |||
| 4,746,263 |
| Shares or Principal Amount | Value | |||||||
| Energy (1.5%) | ||||||||
| Williams Cos., Inc. (The) | 51,700 | $ | 1,772,793 | |||||
| Financials (6.1%) | ||||||||
| Bank of America Corp. | 33,900 | 1,209,552 | ||||||
| Blackstone, Inc., Class A | 9,500 | 964,915 | ||||||
| Goldman Sachs Group, Inc. (The) | 3,800 | 1,160,862 | ||||||
| Huntington Bancshares, Inc. | 90,900 | 1,195,335 | ||||||
| Intercontinental Exchange, Inc. | 11,600 | 1,343,396 | ||||||
| JPMorgan Chase & Co. | 8,500 | 1,014,560 | ||||||
| 6,888,620 | ||||||||
| Health Care (8.5%) | ||||||||
| AbbVie, Inc. | 12,803 | 1,880,505 | ||||||
| Baxter International, Inc. | 17,400 | 1,236,444 | ||||||
| Bristol-Myers Squibb Co. | 23,100 | 1,738,737 | ||||||
| CVS Health Corp. | 8,300 | 797,879 | ||||||
| Eli Lilly & Co. | 5,000 | 1,460,650 | ||||||
| Medtronic PLC | 12,100 | 1,262,756 | ||||||
| UnitedHealth Group, Inc. | 2,400 | 1,220,520 | ||||||
| 9,597,491 | ||||||||
| Industrials (4.2%) | ||||||||
| FedEx Corp. | 6,300 | 1,252,062 | ||||||
| Norfolk Southern Corp. | 4,400 | 1,134,672 | ||||||
| Schneider Electric SE | 9,400 | 1,348,610 | ||||||
| Stanley Black & Decker, Inc. | 8,600 | 1,033,290 | ||||||
| 4,768,634 | ||||||||
| Information Technology (12.2%) | ||||||||
| Amdocs Ltd. | 11,200 | 892,528 | ||||||
| Analog Devices, Inc. | 7,600 | 1,173,288 | ||||||
| Apple, Inc. | 23,800 | 3,752,070 | ||||||
| Avast PLC (b) | 103,100 | 731,187 | ||||||
| Broadcom, Inc. | 3,200 | 1,774,048 | ||||||
| Cisco Systems, Inc. | 26,800 | 1,312,664 | ||||||
| Fidelity National Information Services, Inc. | 15,600 | 1,546,740 | ||||||
| Microsoft Corp. | 9,700 | 2,691,944 | ||||||
| 13,874,469 | ||||||||
| Materials (0.6%) | ||||||||
| Air Products and Chemicals, Inc. | 2,800 | 655,396 | ||||||
| Real Estate (2.0%) | ||||||||
| American Tower Corp., REIT | 4,600 | 1,108,692 | ||||||
| Gaming & Leisure Properties, Inc., REIT | 26,000 | 1,153,880 | ||||||
| 2,262,572 | ||||||||
| Utilities (2.6%) | ||||||||
| CMS Energy Corp. | 11,300 | 776,197 | ||||||
| FirstEnergy Corp. | 25,700 | 1,113,067 | ||||||
| NextEra Energy, Inc. | 14,700 | 1,043,994 | ||||||
| 2,933,258 | ||||||||
| 58,586,347 | ||||||||
| Total Common Stocks | 111,406,646 | |||||||
See accompanying Notes to Financial Statements.
| 2022 Semi-Annual Report | 7 |
Statement of Investments (concluded)
April 30, 2022 (Unaudited)
abrdn Dynamic Dividend Fund
| Shares or Principal Amount | Value | |||||||
| PREFERRED STOCKS (1.3%) | ||||||||
| SOUTH KOREA (1.3%) | ||||||||
| Information Technology (1.3%) | ||||||||
| Samsung Electronics Co. Ltd. | 32,000 | $ | 1,500,276 | |||||
| Total Preferred Stocks | 1,500,276 | |||||||
| UNITED STATES (1.4%) | ||||||||
| State Street Institutional U.S. Government Money Market Fund, Premier Class, 0.29% (c) | 1,539,229 | 1,539,229 | ||||||
| Total Short-Term Investment | 1,539,229 | |||||||
| Total Investments (Cost $97,247,974) (d)—101.0% | 114,446,151 | |||||||
| Liabilities in Excess of Other Assets—(1.0)% | (1,139,081 | ) | ||||||
| Net Assets—100.0% | $ | 113,307,070 | ||||||
| (a) | Non-income producing security. |
| (b) | Denotes a security issued under Regulation S or Rule 144A. |
| (c) | Registered investment company advised by State Street Global Advisors. The rate shown is the 7 day yield as of April 30, 2022. |
| (d) | See accompanying Notes to Financial Statements for tax unrealized appreciation/(depreciation) of securities. |
| ADR | American Depositary Receipt |
| PLC | Public Limited Company |
| REIT | Real Estate Investment Trust |
At April 30, 2022, the Fund's open forward foreign currency exchange contracts were as follows:
| Sale Contracts Settlement Date | Counterparty | Amount Purchased | Amount Sold | Fair Value | Unrealized Appreciation | ||||||
| United States Dollar/Euro | |||||||||||
| 07/14/2022 | Royal Bank of Canada | USD 2,861,404 | EUR 2,600,000 | $2,752,820 | $108,584 | ||||||
See accompanying Notes to Financial Statements.
| 8 | 2022 Semi-Annual Report |
abrdn Emerging Markets ex-China Fund (Unaudited)
| Average Annual Total Return1 (For periods ended April 30, 2022) | Six Month† | 1 Yr. | 5 Yr. | 10 Yr. | |||||||||||||
| Class A | w/o SC | (16.33 | %) | (9.45 | %) | 6.81 | % | 5.48 | % | ||||||||
| w/ SC2 | (21.15 | %) | (14.64 | %) | 5.55 | % | 4.85 | % | |||||||||
| Class C | w/o SC | (16.57 | %) | (9.97 | %) | 6.13 | % | 4.80 | % | ||||||||
| w/ SC3 | (17.31 | %) | (10.77 | %) | 6.13 | % | 4.80 | % | |||||||||
| Class R4 | w/o SC | (16.46 | %) | (9.73 | %) | 6.40 | % | 5.13 | % | ||||||||
| Institutional Service Class4,5 | w/o SC | (16.20 | %) | (9.17 | %) | 7.08 | % | 5.81 | % | ||||||||
| Institutional Class4 | w/o SC | (16.17 | %) | (9.11 | %) | 7.14 | % | 5.82 | % | ||||||||
All figures showing the effect of a sales charge (SC) reflect the maximum charge possible because it has the most significant effect on performance data. The total returns shown above do not include the impact of financial statement rounding of the net asset value (NAV) per share and/or financial statement adjustments.
| † | Not annualized |
| 1 | The Fund changed its investment strategies effective February 28, 2022. Performance information for periods prior to February 28, 2022 does not reflect the current investment strategy. In connection with the change in investment strategy, the Fund changed its name from Aberdeen Global Equity Fund to abrdn Emerging Markets ex-China Fund. Please consult the Fund's prospectus for more detail. |
| 2 | A 5.75% front-end sales charge was deducted. |
| 3 | A 1.00% contingent deferred sales charge (CDSC) was deducted from the one year return because it is charged when Class C shares are sold within the first year after purchase. |
| 4 | Not subject to any sales charges. |
| 5 | Returns before the first offering of the Institutional Service Class (December 19, 2011) are based on the previous performance of the Fund's Class A shares. Excluding the effect of any fee waivers or reimbursements, this performance is substantially similar to what the Institutional Service Class would have produced because both classes invest in the same portfolio of securities. Returns would only differ to the extent of the differences in expenses of the classes. |
Performance of a $10,000 Investment (as of April 30, 2022)

Comparative performance of $10,000 invested in Class A shares of the abrdn Emerging Markets ex-China Fund, Morgan Stanley Capital International (MSCI) Emerging Markets ex-China Index (Net Dividends), MSCI All Country World Index (ACWI) (Net Dividends) and the Consumer Price Index (CPI) over a 10-year period ended April 30, 2022. Effective February 28, 2022, the MSCI Emerging Markets ex-China Index (Net Dividends) replaced the MSCI ACWI (Net Dividends) as the Fund's primary benchmark in connection with the change in the Fund's investment strategy. Unlike the Fund, the
returns for these unmanaged indexes do not reflect any fees, expenses or sales charges. Investors cannot invest directly in market indexes.
The MSCI Emerging Markets ex China Index (Net Dividends) captures large and mid cap representation across 23 of the 24 Emerging Markets (EM) countries excluding China. With 654 constituents, the index covers approximately 85% of the free float-adjusted market capitalization in each country. EM countries in the Index are: Brazil, Chile, Colombia, Czech Republic, Egypt, Greece, Hungary, India, Indonesia, Korea, Kuwait, Malaysia, Mexico, Peru, Philippines, Poland, Qatar, Saudi Arabia, South Africa, Taiwan, Thailand, Turkey and United Arab Emirates.
The MSCI ACWI captures large and mid cap representation across 23 Developed Markets (DM) and 24 Emerging Markets (EM) countries. With more than 2,900 constituents, the index covers approximately 85% of the global investable equity opportunity set. DM countries in the Index are: Australia, Austria, Belgium, Canada, Denmark, Finland, France, Germany, Hong Kong, Ireland, Israel, Italy, Japan, Netherlands, New Zealand, Norway, Portugal, Singapore, Spain, Sweden, Switzerland, the UK and the US. EM countries in the Index are: Brazil, Chile, China, Colombia, Czech Republic, Egypt, Greece, Hungary, India, Indonesia, Korea, Kuwait, Malaysia, Mexico, Peru, Philippines, Poland, Qatar, Saudi Arabia, South Africa, Taiwan, Thailand, Turkey and United Arab Emirates.
The CPI is a measure of the average change over time in the prices paid by urban consumers for a market basket of consumer goods and services.
Investment return and principal value will fluctuate, and when redeemed, shares may be worth more or less than original cost. Past performance is no guarantee of future results. The Average Annual Total Return table and Performance graph do not reflect the deduction of taxes that a shareholder would pay on fund distributions or the redemption of fund shares. Investing in mutual funds involves market risk, including loss of principal. Performance returns assume the reinvestment of all distributions. Total returns reflect waivers and reimbursements in effect, without which returns would have been lower.
| 2022 Semi-Annual Report | 9 |
abrdn Emerging Markets ex-China Fund (Unaudited)
Portfolio Summary (as a percentage of net assets)
April 30, 2022 (Unaudited)
| Asset Allocation | |||
| Common Stocks | 89.6% | ||
| Preferred Stocks | 10.1% | ||
| Short-Term Investment | 0.7% | ||
| Liabilities in Excess of Other Assets | (0.4%) | ||
| 100.0% | |||
The following table summarizes the composition of the Fund's portfolio, in S&P Global Industry Classification Standard (GICS) sectors.
| Sectors | |||
| Information Technology | 32.4%* | ||
| Financials | 22.6% | ||
| Materials | 10.8% | ||
| Consumer Staples | 8.9% | ||
| Industrials | 6.0% | ||
| Consumer Discretionary | 4.8% | ||
| Energy | 4.7% | ||
| Health Care | 3.4% | ||
| Utilities | 3.2% | ||
| Communication Services | 2.3% | ||
| Real Estate | 0.6% | ||
| Short-Term Investment | 0.7% | ||
| Liabilities in Excess of Other Assets | (0.4%) | ||
| 100.0% | |||
| * | As of April 30, 2022, the Fund's holdings in the Information Technology sector were allocated to four industries: Semiconductors & Semiconductor Equipment (14.2%), Technology Hardware, Storage & Peripherals (8.3%), Electronic Equipment Instruments & Components (6.7%) and Information Technology Services (3.2%). |
| Top Ten Holdings | ||||
| Samsung Electronics Co. Ltd., GDR, Preferred Shares | 8.3 | % | ||
| Taiwan Semiconductor Manufacturing Co. Ltd. | 6.6 | % | ||
| Housing Development Finance Corp. Ltd. | 2.8 | % | ||
| Taiwan Semiconductor Manufacturing Co. Ltd., ADR | 2.4 | % | ||
| Kotak Mahindra Bank Ltd. | 2.4 | % | ||
| Reliance Industries Ltd. | 2.2 | % | ||
| Delta Electronics, Inc. | 2.2 | % | ||
| Hon Hai Precision Industry Co. Ltd. | 2.1 | % | ||
| Hindustan Unilever Ltd. | 2.0 | % | ||
| Banco Bradesco SA, ADR, Preferred Shares, 1.94% | 1.8 | % | ||
| Countries | |||
| India | 25.1% | ||
| Taiwan | 17.9% | ||
| South Korea | 17.5% | ||
| Brazil | 8.6% | ||
| Mexico | 5.1% | ||
| Thailand | 3.5% | ||
| South Africa | 3.0% | ||
| Indonesia | 2.7% | ||
| Netherlands | 2.1% | ||
| Poland | 2.0% | ||
| Other, less than 2% each | 12.2% | ||
| Short-Term Investment | 0.7% | ||
| Liabilities in Excess of Other Assets | (0.4%) | ||
| 100.0% | |||
| 10 | 2022 Semi-Annual Report |
Statement of Investments
April 30, 2022 (Unaudited)
abrdn Emerging Markets ex-China Fund
| Shares or Principal Amount | Value | |||||
| COMMON STOCKS (89.6%) | ||||||
| ARGENTINA (0.6%) | ||||||
| Information Technology (0.6%) | ||||||
| Globant SA (a) | 703 | $ | 151,841 | |||
| AUSTRALIA (1.8%) | ||||||
| Materials (1.8%) | ||||||
| BHP Group Ltd. | 13,100 | 447,934 | ||||
| AUSTRIA (1.5%) | ||||||
| Materials (1.5%) | ||||||
| Mondi PLC | 19,416 | 366,082 | ||||
| BRAZIL (6.8%) | ||||||
| Consumer Discretionary (0.6%) | ||||||
| MercadoLibre, Inc. (a) | 146 | 142,150 | ||||
| Consumer Staples (1.6%) | ||||||
| Raia Drogasil SA | 92,290 | 390,706 | ||||
| Energy (1.4%) | ||||||
| 3R Petroleum Oleo E Gas SA (a) | 36,636 | 342,577 | ||||
| Financials (1.1%) | ||||||
| B3 SA – Brasil Bolsa Balcao | 97,464 | 262,193 | ||||
| Industrials (2.1%) | ||||||
| Localiza Rent a Car SA | 24,961 | 267,283 | ||||
| WEG SA | 42,152 | 256,632 | ||||
| 523,915 | ||||||
| 1,661,541 | ||||||
| CHILE (1.1%) | ||||||
| Financials (1.1%) | ||||||
| Banco Santander Chile, ADR | 14,368 | 279,314 | ||||
| CHINA (0.1%) | ||||||
| Consumer Discretionary (0.1%) | ||||||
| JD.com, Inc., Class A (a) | 676 | 21,077 | ||||
| INDIA (25.1%) | ||||||
| Consumer Discretionary (1.0%) | ||||||
| Maruti Suzuki India Ltd. | 2,400 | 239,228 | ||||
| Consumer Staples (3.3%) | ||||||
| Hindustan Unilever Ltd. | 16,800 | 490,318 | ||||
| ITC Ltd. | 94,800 | 319,454 | ||||
| 809,772 | ||||||
| Energy (2.2%) | ||||||
| Reliance Industries Ltd. | 14,555 | 529,149 | ||||
| Financials (7.7%) | ||||||
| Housing Development Finance Corp. Ltd. | 24,100 | 694,490 | ||||
| Kotak Mahindra Bank Ltd. | 25,400 | 588,700 | ||||
| Piramal Enterprises Ltd. | 9,800 | 275,484 | ||||
| SBI Life Insurance Co. Ltd. (b) | 23,000 | 330,058 | ||||
| 1,888,732 | ||||||
| Health Care (1.2%) | ||||||
| Syngene International Ltd. (a)(b) | 37,500 | 304,732 | ||||
| Shares or Principal Amount | Value | |||||
| Industrials (1.0%) | ||||||
| Larsen & Toubro Ltd. | 11,200 | $ | 246,824 | |||
| Information Technology (2.6%) | ||||||
| Infosys Ltd. | 11,800 | 239,221 | ||||
| Tata Consultancy Services Ltd. | 8,600 | 396,505 | ||||
| 635,726 | ||||||
| Materials (2.3%) | ||||||
| Asian Paints Ltd. | 6,400 | 269,949 | ||||
| UltraTech Cement Ltd. | 3,488 | 299,707 | ||||
| 569,656 | ||||||
| Real Estate (0.6%) | ||||||
| Godrej Properties Ltd. (a) | 6,800 | 138,002 | ||||
| Utilities (3.2%) | ||||||
| Azure Power Global Ltd. (a) | 9,299 | 130,651 | ||||
| Power Grid Corp. of India Ltd. | 146,000 | 436,355 | ||||
| ReNew Energy Global PLC, Class A (a) | 27,438 | 218,955 | ||||
| 785,961 | ||||||
| 6,147,782 | ||||||
| INDONESIA (2.7%) | ||||||
| Financials (2.7%) | ||||||
| Bank Central Asia Tbk PT (e) | 639,500 | 358,677 | ||||
| Bank Rakyat Indonesia Persero Tbk PT (e) | 870,400 | 290,006 | ||||
| 648,683 | ||||||
| ISRAEL (0.9%) | ||||||
| Information Technology (0.9%) | ||||||
| Nova Ltd. (a) | 2,098 | 206,884 | ||||
| ITALY (1.3%) | ||||||
| Consumer Staples (1.3%) | ||||||
| Coca-Cola HBC AG | 16,131 | 327,038 | ||||
| MALAYSIA (1.1%) | ||||||
| Health Care (1.1%) | ||||||
| IHH Healthcare Bhd | 175,900 | 265,315 | ||||
| MEXICO (5.1%) | ||||||
| Consumer Staples (1.2%) | ||||||
| Fomento Economico Mexicano SAB de CV, ADR | 4,101 | 306,509 | ||||
| Financials (1.8%) | ||||||
| Grupo Financiero Banorte SAB de CV, Class O | 66,798 | 440,268 | ||||
| Industrials (0.9%) | ||||||
| Grupo Aeroportuario del Centro Norte SAB de CV | 3,800 | 212,534 | ||||
| Materials (1.2%) | ||||||
| Grupo Mexico SAB de CV, Class B | 64,072 | 300,132 | ||||
| 1,259,443 | ||||||
| NETHERLANDS (2.1%) | ||||||
| Information Technology (2.1%) | ||||||
| ASM International NV | 680 | 204,335 | ||||
| ASML Holding NV | 561 | 318,389 | ||||
| 522,724 | ||||||
See accompanying Notes to Financial Statements.
| 2022 Semi-Annual Report | 11 |
Statement of Investments (concluded)
April 30, 2022 (Unaudited)
abrdn Emerging Markets ex-China Fund
| Shares or Principal Amount | Value | |||||
| COMMON STOCKS (continued) | ||||||
| PERU (1.0%) | ||||||
| Financials (1.0%) | ||||||
| Credicorp Ltd. | 1,825 | $ | 253,474 | |||
| PHILIPPINES (1.1%) | ||||||
| Financials (1.1%) | ||||||
| Bank of the Philippine Islands | 141,110 | 256,514 | ||||
| POLAND (2.0%) | ||||||
| Consumer Discretionary (0.6%) | ||||||
| Allegro.eu SA (a)(b) | 29,316 | 150,786 | ||||
| Consumer Staples (0.5%) | ||||||
| Dino Polska SA (a)(b) | 1,997 | 129,190 | ||||
| Industrials (0.9%) | ||||||
| InPost SA (a) | 35,463 | 217,419 | ||||
| 497,395 | ||||||
| SOUTH AFRICA (3.0%) | ||||||
| Communication Services (1.0%) | ||||||
| Vodacom Group Ltd. | 24,690 | 237,605 | ||||
| Financials (0.6%) | ||||||
| Sanlam Ltd. | 38,159 | 158,075 | ||||
| Materials (1.4%) | ||||||
| Anglo American Platinum Ltd. | 2,985 | 331,659 | ||||
| 727,339 | ||||||
| SOUTH KOREA (9.2%) | ||||||
| Communication Services (0.9%) | ||||||
| Kakao Corp. | 3,160 | 220,737 | ||||
| Financials (1.6%) | ||||||
| KB Financial Group, Inc., ADR | 8,487 | 389,723 | ||||
| Health Care (1.1%) | ||||||
| Samsung Biologics Co. Ltd. (a)(b) | 402 | 265,155 | ||||
| Industrials (1.1%) | ||||||
| Samsung Engineering Co. Ltd. (a) | 13,234 | 270,014 | ||||
| Information Technology (2.9%) | ||||||
| Samsung SDI Co. Ltd., GDR (b)(e) | 3,244 | 384,628 | ||||
| SK Hynix, Inc., GDR (e) | 3,932 | 345,036 | ||||
| 729,664 | ||||||
| Materials (1.6%) | ||||||
| LG Chem Ltd. | 955 | 391,134 | ||||
| 2,266,427 | ||||||
| TAIWAN (17.9%) | ||||||
| Communication Services (0.4%) | ||||||
| Sea Ltd., ADR (a) | 1,102 | 91,202 | ||||
| Consumer Discretionary (2.5%) | ||||||
| Makalot Industrial Co. Ltd. | 35,000 | 215,305 | ||||
| momo.com, Inc. | 8,000 | 211,177 | ||||
| Poya International Co. Ltd. | 19,000 | 202,026 | ||||
| 628,508 | ||||||
| Shares or Principal Amount | Value | |||||
| Information Technology (15.0%) | ||||||
| Chroma ATE, Inc. | 41,000 | $ | 227,918 | |||
| Delta Electronics, Inc. | 63,000 | 525,898 | ||||
| Globalwafers Co. Ltd. | 11,000 | 191,703 | ||||
| Hon Hai Precision Industry Co. Ltd. | 150,000 | 513,912 | ||||
| Taiwan Semiconductor Manufacturing Co. Ltd. | 90,000 | 1,627,438 | ||||
| Taiwan Semiconductor Manufacturing Co. Ltd., ADR | 6,400 | 594,752 | ||||
| 3,681,621 | ||||||
| 4,401,331 | ||||||
| THAILAND (3.5%) | ||||||
| Energy (1.1%) | ||||||
| PTT Exploration & Production PCL, Foreign Shares | 64,100 | 280,464 | ||||
| Financials (1.4%) | ||||||
| Kasikornbank PCL, Foreign Shares | 76,700 | 339,529 | ||||
| Materials (1.0%) | ||||||
| SCG Packaging PCL, Foreign Shares | 146,200 | 234,240 | ||||
| 854,233 | ||||||
| TURKEY (1.0%) | ||||||
| Consumer Staples (1.0%) | ||||||
| Coca-Cola Icecek AS | 30,568 | 253,579 | ||||
| UNITED KINGDOM (0.7%) | ||||||
| Financials (0.7%) | ||||||
| Prudential PLC | 14,414 | 179,432 | ||||
| Total Common Stocks | 21,995,382 | |||||
| PREFERRED STOCKS (10.1%) | ||||||
| BRAZIL (1.8%) | ||||||
| Financials (1.8%) | ||||||
| Banco Bradesco SA, ADR, Preferred Shares, 1.94% | 125,270 | 450,973 | ||||
| SOUTH KOREA (8.3%) | ||||||
| Information Technology (8.3%) | ||||||
| Samsung Electronics Co. Ltd., GDR, Preferred Shares | 1,748 | 2,029,451 | ||||
| Total Preferred Stocks | 2,480,424 | |||||
| SHORT-TERM INVESTMENT (0.7%) | ||||||
| UNITED STATES (0.7%) | ||||||
| State Street Institutional U.S. Government Money Market Fund, Premier Class, 0.29% (c) | 183,115 | 183,115 | ||||
| Total Short-Term Investment | 183,115 | |||||
| Total Investments (Cost $26,078,033) (d)—100.4% | 24,658,921 | |||||
| Liabilities in Excess of Other Assets—(0.4)% | (108,701) | |||||
| Net Assets—100.0% | $ | 24,550,220 | ||||
| (a) | Non-income producing security. |
| (b) | Denotes a security issued under Regulation S or Rule 144A. |
| (c) | Registered investment company advised by State Street Global Advisors. The rate shown is the 7 day yield as of April 30, 2022. |
| (d) | See accompanying Notes to Financial Statements for tax unrealized appreciation/(depreciation) of securities. |
| (e) | Illiquid Security |
| ADR | American Depositary Receipt |
| GDR | Global Depositary Receipt |
| PLC | Public Limited Company |
See accompanying Notes to Financial Statements.
| 12 | 2022 Semi-Annual Report |
abrdn Emerging Markets Fund (Unaudited)
| Average Annual Total Return1 (For periods ended April 30, 2022) | Six Month† | 1 Yr. | 5 Yr. | 10 Yr. | |||||||
| Class A | w/o SC | (25.34 | %) | (27.39 | %) | 1.81 | % | 1.70 | % | ||
| w/ SC2 | (29.63 | %) | (31.55 | %) | 0.60 | % | 1.10 | % | |||
| Class C | w/o SC | (25.54 | %) | (27.83 | %) | 1.28 | % | 1.11 | % | ||
| w/ SC3 | (26.21 | %) | (28.47 | %) | 1.28 | % | 1.11 | % | |||
| Class R4 | w/o SC | (25.43 | %) | (27.54 | %) | 1.63 | % | 1.45 | % | ||
| Institutional Service Class4 | w/o SC | (25.22 | %) | (27.16 | %) | 2.17 | % | 1.94 | % | ||
| Institutional Class4 | w/o SC | (25.16 | %) | (27.06 | %) | 2.30 | % | 2.12 | % | ||
All figures showing the effect of a sales charge (SC) reflect the maximum charge possible because it has the most significant effect on performance data. The total returns shown above do not include the impact of financial statement rounding of the net asset value (NAV) per share and/or financial statement adjustments.
| † | Not annualized |
| 1 | Returns before the first offering of Class A, Class C and Class R (May 21, 2012) are based on the previous performance of the Institutional Class. Excluding the effect of any fee waivers or reimbursements, this performance is substantially similar to what Class A, Class C and Class R would have produced because all classes invest in the same portfolio of securities. Returns would only differ to the extent of the differences in expenses of the classes. |
| 2 | A 5.75% front-end sales charge was deducted. |
| 3 | A 1.00% contingent deferred sales charge (CDSC) was deducted from the one year return because it is charged when Class C shares are sold within the first year after purchase. |
| 4 | Not subject to any sales charges. |
Performance of a $1,000,000* Investment (as of April 30, 2022)

* Minimum Initial Investment
Comparative performance of $1,000,000 invested in Institutional Class shares of the abrdn Emerging Markets Fund, Morgan Stanley Capital International (MSCI) Emerging Markets Index (Net Dividends) and the Consumer Price Index (CPI) over a 10-year period ended April 30, 2022. Unlike the Fund, the returns for these unmanaged indexes do not reflect any fees, expenses, or sales charges. Investors cannot invest directly in market indexes.
The MSCI Emerging Markets Index captures large and mid cap representation across 24 Emerging Markets (EM) countries. With 1,398 constituents, the index covers approximately 85% of the free float-adjusted market capitalization in each country. EM countries in the Index are: Brazil, Chile, China, Colombia, Czech Republic, Egypt, Greece, Hungary, India, Indonesia, Korea, Kuwait, Malaysia, Mexico, Peru, Philippines, Poland, Qatar, Saudi Arabia, South Africa, Taiwan, Thailand, Turkey and United Arab Emirates.
The CPI is a measure of the average change over time in the prices paid by urban consumers for a market basket of consumer goods and services.
Investment return and principal value will fluctuate, and when redeemed, shares may be worth more or less than original cost. Past performance is no guarantee of future results. The Average Annual Total Return table and Performance graph do not reflect the deduction of taxes that a shareholder would pay on fund distributions or the redemption of fund shares. Investing in mutual funds involves market risk, including loss of principal. Performance returns assume the reinvestment of all distributions. Total returns reflect waivers and reimbursements in effect, without which returns would have been lower.
| 2022 Semi-Annual Report | 13 |
abrdn Emerging Markets Fund (Unaudited)
Portfolio Summary (as a percentage of net assets)
April 30, 2022 (Unaudited)
| Asset Allocation | |
| Common Stocks | 90.7% |
| Preferred Stocks | 9.3% |
| Short-Term Investment | 0.3% |
| Liabilities in Excess of Other Assets | (0.3%) |
| 100.0% | |
The following table summarizes the composition of the Fund's portfolio, in S&P Global Industry Classification Standard (GICS) sectors.
| Sectors | |
| Information Technology | 26.2%* |
| Financials | 24.9% |
| Consumer Discretionary | 14.0% |
| Materials | 9.5% |
| Consumer Staples | 7.2% |
| Communication Services | 6.8% |
| Industrials | 5.8% |
| Health Care | 1.8% |
| Utilities | 1.4% |
| Real Estate | 1.2% |
| Energy | 1.2% |
| Short-Term Investment | 0.3% |
| Liabilities in Excess of Other Assets | (0.3%) |
| 100.0% | |
| * | As of April 30, 2022, the Fund's holdings in the Information Technology sector were allocated to five industries: Semiconductors & Semiconductor Equipment (12.7%), Technology Hardware, Storage & Peripherals (7.5%), Electronic Equipment Instruments & Components (2.8%), Information Technology Services (2.7%) and Software (0.5%). |
| Top Ten Holdings | |
| Taiwan Semiconductor Manufacturing Co. Ltd. | 9.0% |
| Samsung Electronics Co. Ltd. | 7.5% |
| Tencent Holdings Ltd. | 5.7% |
| Alibaba Group Holding Ltd. | 3.9% |
| Housing Development Finance Corp. Ltd. | 3.4% |
| Bank Central Asia Tbk PT | 2.4% |
| Anglo American Platinum Ltd. | 2.3% |
| Grupo Mexico SAB de CV, Class B | 2.3% |
| Grupo Financiero Banorte SAB de CV, Class O | 2.3% |
| NARI Technology Co. Ltd., A Shares (Stock Connect) | 2.2% |
| Countries | |
| China | 30.0% |
| India | 14.0% |
| Taiwan | 11.9% |
| South Korea | 10.3% |
| Mexico | 7.2% |
| Brazil | 5.5% |
| Hong Kong | 4.3% |
| Indonesia | 4.0% |
| South Africa | 3.5% |
| Thailand | 2.3% |
| Other, less than 2% each | 7.0% |
| Short-Term Investment | 0.3% |
| Liabilities in Excess of Other Assets | (0.3%) |
| 100.0% | |
| 14 | 2022 Semi-Annual Report |
Statement of Investments
April 30, 2022 (Unaudited)
abrdn Emerging Markets Fund
| Shares or Principal Amount | Value | |||||||
| COMMON STOCKS (90.7%) | ||||||||
| ARGENTINA (0.7%) | ||||||||
| Information Technology (0.7%) | ||||||||
| Globant SA (a) | 105,128 | $ | 22,706,597 | |||||
| AUSTRIA (1.4%) | ||||||||
| Materials (1.4%) | ||||||||
| Mondi PLC | 2,448,055 | 46,157,233 | ||||||
| BRAZIL (3.7%) | ||||||||
| Consumer Discretionary (0.5%) | ||||||||
| MercadoLibre, Inc. (a) | 16,492 | 16,057,106 | ||||||
| Consumer Staples (0.7%) | ||||||||
| Raia Drogasil SA | 5,126,745 | 21,703,854 | ||||||
| Financials (1.1%) | ||||||||
| B3 SA – Brasil Bolsa Balcao | 13,162,904 | 35,410,274 | ||||||
| Industrials (1.4%) | ||||||||
| Rumo SA | 7,646,337 | 25,317,921 | ||||||
| WEG SA | 3,562,404 | 21,688,804 | ||||||
| 47,006,725 | ||||||||
| 120,177,959 | ||||||||
| CHILE (0.6%) | ||||||||
| Financials (0.6%) | ||||||||
| Banco Santander Chile, ADR | 905,108 | 17,595,300 | ||||||
| CHINA (30.0%) | ||||||||
| Communication Services (5.7%) | ||||||||
| Tencent Holdings Ltd. | 3,907,500 | 184,140,489 | ||||||
| Consumer Discretionary (11.2%) | ||||||||
| Alibaba Group Holding Ltd. (a) | 10,322,700 | 125,912,967 | ||||||
| China Tourism Group Duty Free Corp. Ltd., A Shares (Stock Connect) (b) | 1,669,403 | 45,433,874 | ||||||
| JD.com, Inc., Class A (a) | 900,319 | 28,070,628 | ||||||
| Li Ning Co. Ltd. | 4,833,500 | 37,673,105 | ||||||
| Midea Group Co. Ltd., A Shares (Stock Connect) (b) | 3,727,416 | 31,992,092 | ||||||
| Prosus NV (a) | 345,940 | 16,684,224 | ||||||
| Shenzhou International Group Holdings Ltd. | 2,858,800 | 38,790,957 | ||||||
| Zhongsheng Group Holdings Ltd. | 6,079,500 | 40,172,213 | ||||||
| 364,730,060 | ||||||||
| Consumer Staples (2.2%) | ||||||||
| Foshan Haitian Flavouring & Food Co. Ltd., A Shares (b) | 3,380,557 | 41,573,664 | ||||||
| Kweichow Moutai Co. Ltd., A Shares (Stock Connect) (b) | 108,315 | 29,989,995 | ||||||
| 71,563,659 | ||||||||
| Financials (1.7%) | ||||||||
| China Merchants Bank Co. Ltd., H Shares | 9,318,500 | 56,164,880 | ||||||
| Shares or Principal Amount | Value | |||||||
| Health Care (1.8%) | ||||||||
| Hangzhou Tigermed Consulting Co. Ltd., A Shares (b) | 1,234,495 | $ | 16,590,678 | |||||
| Hangzhou Tigermed Consulting Co. Ltd., H Shares (c) | 200,700 | 1,945,082 | ||||||
| Wuxi Biologics Cayman, Inc. (a)(c) | 5,350,500 | 39,491,027 | ||||||
| 58,026,787 | ||||||||
| Industrials (3.1%) | ||||||||
| NARI Technology Co. Ltd., A Shares (Stock Connect) (b) | 14,782,743 | 71,073,507 | ||||||
| Sungrow Power Supply Co. Ltd., A Shares (Stock Connect) (b) | 3,222,184 | 30,480,176 | ||||||
| 101,553,683 | ||||||||
| Information Technology (2.5%) | ||||||||
| GDS Holdings Ltd., Class A (a) | 899,400 | 3,612,621 | ||||||
| LONGi Green Energy Technology Co. Ltd., A Shares (b) | 6,101,798 | 61,890,357 | ||||||
| Yonyou Network Technology Co. Ltd., A Shares (b) | 5,118,410 | 14,718,350 | ||||||
| 80,221,328 | ||||||||
| Materials (0.6%) | ||||||||
| Yunnan Energy New Material Co. Ltd., A Shares (Stock Connect) (b) | 671,675 | 20,457,544 | ||||||
| Real Estate (1.2%) | ||||||||
| China Resources Land Ltd. | 8,726,000 | 38,972,170 | ||||||
| 975,830,600 | ||||||||
| HONG KONG (4.3%) | ||||||||
| Consumer Staples (1.2%) | ||||||||
| Budweiser Brewing Co. APAC Ltd. (c) | 15,296,700 | 38,061,193 | ||||||
| Financials (3.1%) | ||||||||
| AIA Group Ltd. | 6,259,800 | 61,494,757 | ||||||
| Hong Kong Exchanges & Clearing Ltd. | 953,465 | 40,445,009 | ||||||
| 101,939,766 | ||||||||
| 140,000,959 | ||||||||
| INDIA (14.0%) | ||||||||
| Consumer Discretionary (1.0%) | ||||||||
| Maruti Suzuki India Ltd. | 313,830 | 31,282,077 | ||||||
| Consumer Staples (1.3%) | ||||||||
| Hindustan Unilever Ltd. | 1,502,472 | 43,850,594 | ||||||
| Financials (7.3%) | ||||||||
| Housing Development Finance Corp. Ltd. | 3,795,277 | 109,368,507 | ||||||
| Kotak Mahindra Bank Ltd. | 2,984,905 | 69,181,691 | ||||||
| SBI Life Insurance Co. Ltd. (c) | 4,195,246 | 60,203,159 | ||||||
| 238,753,357 | ||||||||
| Information Technology (1.9%) | ||||||||
| Tata Consultancy Services Ltd. | 1,318,829 | 60,804,909 |
See accompanying Notes to Financial Statements.
| 2022 Semi-Annual Report | 15 |
Statement of Investments (continued)
April 30, 2022 (Unaudited)
abrdn Emerging Markets Fund
| Shares or Principal Amount | Value | |||||||
| COMMON STOCKS (continued) | ||||||||
| INDIA (continued) | ||||||||
| Materials (1.1%) | ||||||||
| UltraTech Cement Ltd. | 409,920 | $ | 35,222,462 | |||||
| Utilities (1.4%) | ||||||||
| Power Grid Corp. of India Ltd. | 15,599,597 | 46,622,948 | ||||||
| 456,536,347 | ||||||||
| INDONESIA (4.0%) | ||||||||
| Financials (4.0%) | ||||||||
| Bank Central Asia Tbk PT (i) | 139,562,900 | 78,276,868 | ||||||
| Bank Rakyat Indonesia Persero Tbk PT (i) | 158,895,144 | 52,941,798 | ||||||
| 131,218,666 | ||||||||
| MACAO (0.8%) | ||||||||
| Consumer Discretionary (0.8%) | ||||||||
| Sands China Ltd. (a) | 10,850,400 | 23,916,180 | ||||||
| MEXICO (7.2%) | ||||||||
| Consumer Staples (1.8%) | ||||||||
| Fomento Economico Mexicano SAB de CV, ADR | 802,839 | 60,004,187 | ||||||
| Financials (2.3%) | ||||||||
| Grupo Financiero Banorte SAB de CV, Class O | 11,201,345 | 73,828,481 | ||||||
| Industrials (0.8%) | ||||||||
| Grupo Aeroportuario del Sureste SAB de CV, Class B | 1,165,598 | 25,417,936 | ||||||
| Materials (2.3%) | ||||||||
| Grupo Mexico SAB de CV, Class B | 16,106,279 | 75,446,510 | ||||||
| 234,697,114 | ||||||||
| NETHERLANDS (1.8%) | ||||||||
| Information Technology (1.8%) | ||||||||
| ASM International NV | 80,170 | 24,090,453 | ||||||
| ASML Holding NV | 60,836 | 34,526,771 | ||||||
| 58,617,224 | ||||||||
| PERU (0.6%) | ||||||||
| Financials (0.6%) | ||||||||
| Credicorp Ltd. | 128,378 | 17,830,420 | ||||||
| PHILIPPINES (0.6%) | ||||||||
| Financials (0.6%) | ||||||||
| Bank of the Philippine Islands | 10,876,794 | 19,772,201 | ||||||
| POLAND (0.5%) | ||||||||
| Consumer Discretionary (0.5%) | ||||||||
| Allegro.eu SA (a)(c) | 3,326,422 | 17,109,398 | ||||||
| RUSSIA (0.0%) | ||||||||
| Energy (0.0%) | ||||||||
| LUKOIL PJSC, ADR (d)(e)(i) | 986,507 | – | ||||||
| Novatek PJSC (d)(e)(i) | 3,278,243 | – | ||||||
| – | ||||||||
| Shares or Principal Amount | Value | |||||||
| Financials (0.0%) | ||||||||
| Sberbank of Russia PJSC (d)(e)(i) | 3,099,609 | $ | — | |||||
| — | ||||||||
| SOUTH AFRICA (3.5%) | ||||||||
| Communication Services (0.5%) | ||||||||
| Vodacom Group Ltd. | 1,688,246 | 16,246,929 | ||||||
| Financials (0.7%) | ||||||||
| Sanlam Ltd. | 5,147,961 | 21,325,635 | ||||||
| Materials (2.3%) | ||||||||
| Anglo American Platinum Ltd. | 684,987 | 76,107,835 | ||||||
| 113,680,399 | ||||||||
| SOUTH KOREA (2.8%) | ||||||||
| Industrials (0.5%) | ||||||||
| Samsung Engineering Co. Ltd. (a) | 834,535 | 17,027,037 | ||||||
| Information Technology (0.5%) | ||||||||
| Samsung SDI Co. Ltd. | 36,713 | 17,488,395 | ||||||
| Materials (1.8%) | ||||||||
| LG Chem Ltd. | 140,460 | 57,527,495 | ||||||
| 92,042,927 | ||||||||
| TAIWAN (11.9%) | ||||||||
| Communication Services (0.6%) | ||||||||
| Sea Ltd., ADR (a) | 220,148 | 18,219,448 | ||||||
| Information Technology (11.3%) | ||||||||
| Delta Electronics, Inc. | 4,398,000 | 36,712,680 | ||||||
| Hon Hai Precision Industry Co. Ltd. | 11,288,000 | 38,673,586 | ||||||
| Taiwan Semiconductor Manufacturing Co. Ltd. | 16,259,017 | 294,006,023 | ||||||
| 369,392,289 | ||||||||
| 387,611,737 | ||||||||
| THAILAND (2.3%) | ||||||||
| Energy (1.2%) | ||||||||
| PTT Exploration & Production PCL, Foreign Shares | 8,562,500 | 37,464,459 | ||||||
| Financials (1.1%) | ||||||||
| Kasikornbank PCL, Foreign Shares | 8,332,200 | 36,884,251 | ||||||
| 74,348,710 | ||||||||
| Total Common Stocks | 2,949,849,971 | |||||||
| PREFERRED STOCKS (9.3%) | ||||||||
| BRAZIL (1.8%) | ||||||||
| Financials (1.8%) | ||||||||
| Banco Bradesco SA, ADR, Preferred Shares, 1.94% | 16,608,114 | 59,789,209 | ||||||
| SOUTH KOREA (7.5%) | ||||||||
| Information Technology (7.5%) | ||||||||
| Samsung Electronics Co. Ltd. | 5,195,800 | 243,598,004 | ||||||
| Total Preferred Stocks | 303,387,213 | |||||||
See accompanying Notes to Financial Statements.
| 16 | 2022 Semi-Annual Report |
Statement of Investments (concluded)
April 30, 2022 (Unaudited)
abrdn Emerging Markets Fund
| Shares or Principal Amount | Value | |||||||
| SHORT-TERM INVESTMENT (0.3%) | ||||||||
| MONEY MARKET FUNDS (0.3%) | ||||||||
| UNITED STATES (0.3%) | ||||||||
| State Street Institutional U.S. Government Money Market Fund, Premier Class, 0.29% (f) | 9,615,181 | $ | 9,615,181 | |||||
| Total Money Market Funds | 9,615,181 | |||||||
| Total Short-Term Investment | 9,615,181 | |||||||
| Total Investments (Cost $3,443,288,533) (g)—100.3% | 3,262,852,365 | |||||||
| Liabilities in Excess of Other Assets—(0.3)% | (10,004,482 | ) | ||||||
| Net Assets—100.0% | $ | 3,252,847,883 | ||||||
| (a) | Non-income producing security. |
| (b) | China A Shares. These shares are issued in local currency, traded in the local stock markets and are held through either a Qualified Foreign Institutional Investor (QFII) license or the Shanghai or Shenzhen Hong-Kong Stock Connect program. | |
| (c) | Denotes a security issued under Regulation S or Rule 144A. | |
| (d) | Fair Values are determined pursuant to procedures approved by the Fund's Board of Trustees. Unless otherwise noted, securities are valued by applying valuation factors to the exchange traded price. See Note 2(a) of the accompanying Notes to Financial Statements. | |
| (e) | Level 3 security. See Note 2(a) of the accompanying Notes to Financial Statements. | |
| (f) | Registered investment company advised by State Street Global Advisors. The rate shown is the 7 day yield as of April 30, 2022. | |
| (g) | See accompanying Notes to Financial Statements for tax unrealized appreciation/(depreciation) of securities. | |
| (i) | Illiquid security |
| ADR | American Depositary Receipt |
| PLC | Public Limited Company |
See accompanying Notes to Financial Statements.
| 2022 Semi-Annual Report | 17 |
abrdn Emerging Markets Sustainable Leaders Fund (Unaudited)
| Average Annual Total Return1 (For periods ended April 30, 2022) | Six Month† | 1 Yr. | 5 Yr. | 10 Yr. | ||||||||||
| Class A | w/o SC | (25.55%) | (27.33%) | 1.12% | 1.72% | |||||||||
| w/ SC2 | (29.84%) | (31.52%) | (0.07%) | 1.12% | ||||||||||
| Class C | w/o SC | (25.78%) | (27.80%) | 0.45% | 1.04% | |||||||||
| w/ SC3 | (26.35%) | (28.35%) | 0.45% | 1.04% | ||||||||||
| Class R4 | w/o SC | (25.63%) | (27.54%) | 0.85% | 1.45% | |||||||||
| Institutional Service Class4 | w/o SC | (25.40%) | (27.06%) | 1.45% | 2.00% | |||||||||
| Institutional Class4 | w/o SC | (25.38%) | (27.04%) | 1.51% | 2.08% | |||||||||
All figures showing the effect of a sales charge (SC) reflect the maximum charge possible because it has the most significant effect on performance data. The total returns shown above do not include the impact of financial statement rounding of the net asset value (NAV) per share and/or financial statement adjustments.
| † | Not annualized |
| 1 | The Fund changed its investment strategies effective December 1, 2020. Performance information for periods prior to December 1, 2020 does not reflect the current investment strategy. In connection with the change in investment strategy, the Fund changed its name from Aberdeen International Equity Fund to Aberdeen Emerging Markets Sustainable Leaders Fund. Please consult the Fund's prospectus for more detail. |
| 2 | A 5.75% front-end sales charge was deducted. |
| 3 | A 1.00% contingent deferred sales charge (CDSC) was deducted from the one year return because it is charged when Class C shares are sold within the first year after purchase. |
| 4 | Not subject to any sales charges. |
Performance of a $10,000 Investment (as of April 30, 2022)

Comparative performance of $10,000 invested in Class A shares of the abrdn Emerging Markets Sustainable Leaders Fund, the Morgan Stanley Capital International (MSCI) Emerging Markets Index (Net Dividends) and the Consumer Price Index (CPI) over a 10-year period ending April 30, 2022. Unlike the Fund, the returns for these unmanaged indexes do not reflect any fees, expenses, or sales charges. Investors cannot invest directly in market indexes.
The MSCI Emerging Markets Index captures large and mid cap representation across 24 Emerging Markets (EM) countries. With 1,398 constituents, the index covers approximately 85% of the free float-adjusted market capitalization in each country. EM countries in the Index are: Brazil, Chile, China, Colombia, Czech Republic, Egypt, Greece, Hungary, India, Indonesia, Korea, Kuwait, Malaysia, Mexico, Peru, Philippines, Poland, Qatar, Saudi Arabia, South Africa, Taiwan, Thailand, Turkey and United Arab Emirates.
The CPI is a measure of the average change over time in the prices paid by urban consumers for a market basket of consumer goods and services.
Investment return and principal value will fluctuate, and when redeemed, shares may be worth more or less than original cost. Past performance is no guarantee of future results. The Average Annual Total Return table and Performance graph do not reflect the deduction of taxes that a shareholder would pay on fund distributions or the redemption of fund shares. Investing in mutual funds involves market risk, including loss of principal. Performance returns assume the reinvestment of all distributions. Total returns reflect waivers and reimbursements in effect, without which returns would have been lower.
| 18 | 2022 Semi-Annual Report |
abrdn Emerging Markets Sustainable Leaders Fund (Unaudited)
Portfolio Summary (as a percentage of net assets)
April 30, 2022 (Unaudited)
| Asset Allocation | |||||
| Common Stocks | 89.5 | % | |||
| Preferred Stocks | 9.6 | % | |||
| Short-Term Investment | 0.9 | % | |||
| Liabilities in Excess of Other Assets | – | % | |||
| 100.0 | % | ||||
The following table summarizes the composition of the Fund's portfolio, in S&P Global Industry Classification Standard (GICS) sectors.
| Sectors | |||||
| Information Technology | 28.1 | %* | |||
| Financials | 20.9 | % | |||
| Consumer Discretionary | 10.7 | % | |||
| Industrials | 9.7 | % | |||
| Consumer Staples | 7.1 | % | |||
| Communication Services | 6.0 | % | |||
| Materials | 5.0 | % | |||
| Real Estate | 4.5 | % | |||
| Health Care | 3.7 | % | |||
| Utilities | 3.4 | % | |||
| Short-Term Investment | 0.9 | % | |||
| Liabilities in Excess of Other Assets | – | % | |||
| 100.0 | % | ||||
| * | As of April 30, 2022, the Fund's holdings in the Information Technology sector were allocated to five industries: Semiconductors & Semiconductor Equipment (12.6%), Technology Hardware, Storage & Peripherals (7.9%), Information Technology Services (2.9%), Electronic Equipment Instruments & Components (2.8%) and Software (1.9%). |
| Top Ten Holdings | |||||
| Taiwan Semiconductor Manufacturing Co. Ltd. | 8.6 | % | |||
| Samsung Electronics Co. Ltd. | 7.9 | % | |||
| Tencent Holdings Ltd. | 5.5 | % | |||
| Alibaba Group Holding Ltd. | 4.3 | % | |||
| Housing Development Finance Corp. Ltd. | 3.2 | % | |||
| Grupo Financiero Banorte SAB de CV, Class O | 2.9 | % | |||
| Power Grid Corp. of India Ltd. | 2.6 | % | |||
| LG Chem Ltd. | 2.3 | % | |||
| Tata Consultancy Services Ltd. | 2.0 | % | |||
| Banco Santander Chile, ADR | 1.9 | % | |||
| Countries | |||||
| China | 30.8 | % | |||
| India | 14.9 | % | |||
| Taiwan | 12.0 | % | |||
| South Korea | 10.2 | % | |||
| Brazil | 7.8 | % | |||
| Mexico | 4.7 | % | |||
| Hong Kong | 4.6 | % | |||
| Netherlands | 3.2 | % | |||
| Indonesia | 2.5 | % | |||
| Other, less than 2% each | 8.4 | % | |||
| Short-Term Investment | 0.9 | % | |||
| Liabilities in Excess of Other Assets | – | % | |||
| 100.0 | % | ||||
Amounts listed as "–" are 0% or round to 0%.
| 2022 Semi-Annual Report | 19 |
Statement of Investments
April 30, 2022 (Unaudited)
abrdn Emerging Markets Sustainable Leaders Fund
| Shares or Principal Amount | Value | ||||||
| COMMON STOCKS (89.5%) | |||||||
| AUSTRIA (1.6%) | |||||||
| Materials (1.6%) | |||||||
| Mondi PLC | 118,361 | $ | 2,231,656 | ||||
| BRAZIL (6.1%) | |||||||
| Consumer Discretionary (0.8%) | |||||||
| MercadoLibre, Inc. (a) | 1,169 | 1,138,173 | |||||
| Consumer Staples (2.4%) | |||||||
| Adecoagro SA | 165,278 | 1,859,378 | |||||
| Raia Drogasil SA | 348,394 | 1,474,911 | |||||
| 3,334,289 | |||||||
| Industrials (1.5%) | |||||||
| WEG SA | 338,310 | 2,059,716 | |||||
| Real Estate (1.4%) | |||||||
| Multiplan Empreendimentos Imobiliarios SA | 382,815 | 1,908,674 | |||||
| 8,440,852 | |||||||
| CHILE (1.9%) | |||||||
| Financials (1.9%) | |||||||
| Banco Santander Chile, ADR | 134,218 | 2,609,198 | |||||
| CHINA (30.8%) | |||||||
| Communication Services (5.4%) | |||||||
| Tencent Holdings Ltd. | 160,100 | 7,544,694 | |||||
| Consumer Discretionary (7.6%) | |||||||
| Alibaba Group Holding Ltd. (a) | 487,500 | 5,946,368 | |||||
| JD.com, Inc., Class A (a) | 6,700 | 208,896 | |||||
| Midea Group Co. Ltd., A Shares (Stock Connect) (b) | 244,729 | 2,100,488 | |||||
| Zhongsheng Group Holdings Ltd. | 354,000 | 2,339,167 | |||||
| 10,594,919 | |||||||
| Financials (1.8%) | |||||||
| China Merchants Bank Co. Ltd., H Shares | 411,000 | 2,477,198 | |||||
| Health Care (2.5%) | |||||||
| Hangzhou Tigermed Consulting Co. Ltd., H Shares (c) | 122,700 | 1,189,146 | |||||
| Wuxi Biologics Cayman, Inc. (a)(c) | 299,500 | 2,210,553 | |||||
| 3,399,699 | |||||||
| Industrials (7.9%) | |||||||
| Centre Testing International Group Co. Ltd., A Shares (Stock Connect) (b) | 494,580 | 1,629,691 | |||||
| China Conch Environment Protection Holdings Ltd. (a) | 327,500 | 280,464 | |||||
| China Conch Venture Holdings Ltd. | 327,500 | 850,443 | |||||
| Contemporary Amperex Technology Co. Ltd., A Shares (b) | 28,200 | 1,723,979 | |||||
| Estun Automation Co. Ltd., A Shares (b) | 856,794 | 1,902,688 | |||||
| NARI Technology Co. Ltd., A Shares (Stock Connect) (b) | 344,564 | 1,656,619 | |||||
| Sungrow Power Supply Co. Ltd., A Shares (Stock Connect) (b) | 149,842 | 1,417,427 | |||||
| Shares or Principal Amount | Value | ||||||
| Xinjiang Goldwind Science & Technology Co. Ltd., H Shares | 997,000 | $ | 1,417,080 | ||||
| 10,878,391 | |||||||
| Information Technology (4.6%) | |||||||
| GDS Holdings Ltd., ADR (a) | 12,700 | 399,034 | |||||
| GDS Holdings Ltd., Class A (a) | 213,800 | 858,771 | |||||
| Glodon Co. Ltd., A Shares (b) | 174,040 | 1,210,302 | |||||
| Hundsun Technologies, Inc., A Shares (b) | 255,097 | 1,466,580 | |||||
| LONGi Green Energy Technology Co. Ltd., A Shares (b) | 245,005 | 2,485,078 | |||||
| 6,419,765 | |||||||
| Real Estate (1.0%) | |||||||
| China Vanke Co. Ltd., H Shares | 563,500 | 1,328,732 | |||||
| 42,643,398 | |||||||
| EGYPT (1.0%) | |||||||
| Financials (1.0%) | |||||||
| Commercial International Bank Egypt SAE (d) | 571,323 | 1,379,423 | |||||
| HONG KONG (4.6%) | |||||||
| Consumer Staples (1.4%) | |||||||
| Vitasoy International Holdings Ltd. | 1,024,000 | 1,856,589 | |||||
| Financials (3.2%) | |||||||
| AIA Group Ltd. | 264,100 | 2,594,454 | |||||
| Hong Kong Exchanges & Clearing Ltd. | 43,800 | 1,857,951 | |||||
| 4,452,405 | |||||||
| 6,308,994 | |||||||
| INDIA (14.9%) | |||||||
| Consumer Discretionary (1.1%) | |||||||
| Crompton Greaves Consumer Electricals Ltd. | 315,858 | 1,578,524 | |||||
| Consumer Staples (1.5%) | |||||||
| Hindustan Unilever Ltd. | 69,551 | 2,029,890 | |||||
| Financials (4.6%) | |||||||
| Housing Development Finance Corp. Ltd. | 155,046 | 4,467,961 | |||||
| Kotak Mahindra Bank Ltd. | 78,910 | 1,828,912 | |||||
| 6,296,873 | |||||||
| Health Care (1.2%) | |||||||
| Syngene International Ltd. (a)(c) | 208,519 | 1,694,464 | |||||
| Information Technology (2.0%) | |||||||
| Tata Consultancy Services Ltd. | 60,260 | 2,778,301 | |||||
| Materials (1.1%) | |||||||
| Asian Paints Ltd. | 35,468 | 1,496,023 | |||||
| Utilities (3.4%) | |||||||
| Power Grid Corp. of India Ltd. | 1,223,634 | 3,657,109 | |||||
| ReNew Energy Global PLC, Class A (a) | 136,209 | 1,086,948 | |||||
| 4,744,057 | |||||||
| 20,618,132 | |||||||
See accompanying Notes to Financial Statements.
| 20 | 2022 Semi-Annual Report |
Statement of Investments (concluded)
April 30, 2022 (Unaudited)
abrdn Emerging Markets Sustainable Leaders Fund
| Shares or Principal Amount | Value | ||||||
| COMMON STOCKS (continued) | |||||||
| INDONESIA (2.5%) | |||||||
| Consumer Discretionary (0.7%) | |||||||
| Ace Hardware Indonesia Tbk PT (d) | 14,031,300 | $ | 1,011,431 | ||||
| Financials (1.8%) | |||||||
| Bank Central Asia Tbk PT (d) | 4,500,000 | 2,523,922 | |||||
| 3,535,353 | |||||||
| KAZAKHSTAN (1.0%) | |||||||
| Financials (1.0%) | |||||||
| Kaspi.KZ JSC., GDR (c)(d) | 20,934 | 1,360,710 | |||||
| MEXICO (4.7%) | |||||||
| Consumer Staples (1.8%) | |||||||
| Arca Continental SAB de CV | 406,182 | 2,581,022 | |||||
| Financials (2.9%) | |||||||
| Grupo Financiero Banorte SAB de CV, Class O | 606,085 | 3,994,729 | |||||
| 6,575,751 | |||||||
| NETHERLANDS (3.2%) | |||||||
| Information Technology (2.2%) | |||||||
| ASM International NV | 4,559 | 1,369,944 | |||||
| ASML Holding NV | 2,833 | 1,607,836 | |||||
| 2,977,780 | |||||||
| Real Estate (1.0%) | |||||||
| CTP NV (c) | 98,411 | 1,393,387 | |||||
| 4,371,167 | |||||||
| PHILIPPINES (1.1%) | |||||||
| Real Estate (1.1%) | |||||||
| Ayala Land, Inc. | 2,398,200 | 1,463,786 | |||||
| POLAND (0.8%) | |||||||
| Consumer Discretionary (0.5%) | |||||||
| Allegro.eu SA (a)(c) | 127,724 | 656,946 | |||||
| Industrials (0.3%) | |||||||
| InPost SA (a) | 81,689 | 500,825 | |||||
| 1,157,771 | |||||||
| SOUTH AFRICA (1.0%) | |||||||
| Financials (1.0%) | |||||||
| Sanlam Ltd. | 320,133 | 1,326,164 | |||||
| SOUTH KOREA (2.3%) | |||||||
| Materials (2.3%) | |||||||
| LG Chem Ltd. | 7,744 | 3,171,671 | |||||
| TAIWAN (12.0%) | |||||||
| Communication Services (0.6%) | |||||||
| Sea Ltd., ADR (a) | 10,777 | 891,904 | |||||
| Shares or Principal Amount | Value | ||||||
| Information Technology (11.4%) | |||||||
| Chroma ATE, Inc. | 324,000 | $ | 1,801,109 | ||||
| Hon Hai Precision Industry Co. Ltd. | 605,000 | 2,072,778 | |||||
| Taiwan Semiconductor Manufacturing Co. Ltd. | 659,000 | 11,916,463 | |||||
| 15,790,350 | |||||||
| 16,682,254 | |||||||
| Total Common Stocks | 123,876,280 | ||||||
| PREFERRED STOCKS (9.6%) | |||||||
| BRAZIL (1.7%) | |||||||
| Financials (1.7%) | |||||||
| Banco Bradesco SA, ADR, Preferred Shares, 1.94% | 666,141 | 2,398,109 | |||||
| SOUTH KOREA (7.9%) | |||||||
| Information Technology (7.9%) | |||||||
| Samsung Electronics Co. Ltd. | 232,180 | 10,885,443 | |||||
| Total Preferred Stocks | 13,283,552 | ||||||
| SHORT-TERM INVESTMENT (0.9%) | |||||||
| MONEY MARKET FUNDS (0.9%) | |||||||
| UNITED STATES (0.9%) | |||||||
| State Street Institutional U.S. Government Money Market Fund, Premier Class, 0.29% (e) | 1,299,529 | 1,299,529 | |||||
| Total Money Market Funds | 1,299,529 | ||||||
| Total Short-Term Investment | 1,299,529 | ||||||
| Total Investments (Cost $171,536,313)—100.0% | 138,459,361 | ||||||
| Liabilities in Excess of Other Assets—0.0% | (30,709 | ) | |||||
| Net Assets—100.0% | $ | 138,428,652 | |||||
| (a) | Non-income producing security. | |
| (b) | China A Shares. These shares are issued in local currency, traded in the local stock markets and are held through either a Qualified Foreign Institutional Investor (QFII) license or the Shanghai or Shenzhen Hong-Kong Stock Connect program. | |
| (c) | Denotes a security issued under Regulation S or Rule 144A. | |
| (d) | Illiquid security. | |
| (e) | Registered investment company advised by State Street Global Advisors. The rate shown is the 7 day yield as of April 30, 2022. |
| ADR | American Depositary Receipt | |
| GDR | Global Depositary Receipt | |
| PLC | Public Limited Company |
See accompanying Notes to Financial Statements.
| 2022 Semi-Annual Report | 21 |
abrdn Global Equity Impact Fund (Unaudited)
Average Annual Total Return1 (For periods ended April 30, 2022)* | Six Month† | 1 Yr. | 5 Yr. | 10 Yr. | |||||||
| Class A | w/o SC | (22.15%) | (13.99%) | 7.04% | 5.05% | ||||||
| w/ SC2 | (26.64%) | (18.94%) | 5.78% | 4.43% | |||||||
| Institutional Class3 | w/o SC | (22.06%) | (13.81%) | 7.32% | 5.32% | ||||||
| * | Performance shown for periods after February 1, 2017 reflect the Fund's receipt of payment from some European jurisdictions related to prior years (2005-2009) in accordance with European Union law under Article 63 of the Treaty on the Functioning of the European Union (the "Article 63 EU Tax Reclaims"). The receipt of these extraordinary payments increased the Fund's performance for all periods that include February 2017, October 2017, August 2018, February 2019 and September 2019 in a manner that may not recur in the future, and the Fund's performance was significantly higher than it would have been absent receipt of the Article 63 EU Tax Reclaims. At the time of receipt, those payments resulted in an increase in net assets of approximately 3.1%, 0.3% and 0.9%, in 2017, 2018 and 2019, respectively. Past returns would have been higher had the Fund not originally paid the withholding taxes that relate to the EU reclaims that are now being returned. There can be no assurance that the Fund will receive additional Article 63 EU Tax Reclaim payments or maintain this level of performance in the future. |
| † | Not annualized |
| 1 | Returns prior to December 3, 2021 reflect the performance of a predecessor fund (the "Predecessor Fund"). Returns of the Predecessor Fund have not been adjusted to reflect the expenses applicable to the respective classes. The Fund and the Predecessor Fund have substantially similar investment objectives and strategies. Please consult the Fund's prospectus for more detail. |
| 2 | A 5.75% front-end sales charge was deducted. |
| 3 | Not subject to any sales charges. |
Performance of a $10,000 Investment (as of April 30, 2022)
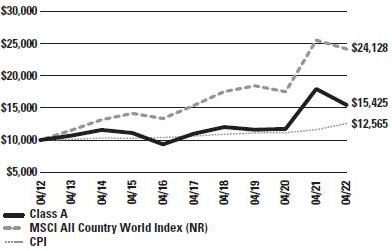
Comparative performance of $10,000 invested in Class A shares of the abrdn Global Equity Impact Fund, Morgan Stanley Capital International (MSCI) All Country World Index (ACWI) (Net Dividends) and the Consumer Price Index (CPI) over a 10-year period ended
April 30, 2022. Unlike the Fund's returns, the returns for these unmanaged indexes do not reflect any fees or expenses. Investors cannot invest directly in market indexes.
The MSCI ACWI is an unmanaged index considered representative of developed and emerging market stock markets.
The MSCI ACWI captures large and mid cap representation across 23 Developed Markets (DM) and 24 Emerging Markets (EM) countries. With more than 2,900 constituents, the index covers approximately 85% of the global investable equity opportunity set. DM countries in the Index are: Australia, Austria, Belgium, Canada, Denmark, Finland, France, Germany, Hong Kong, Ireland, Israel, Italy, Japan, Netherlands, New Zealand, Norway, Portugal, Singapore, Spain, Sweden, Switzerland, the UK and the US. EM countries in the Index are: Brazil, Chile, China, Colombia, Czech Republic, Egypt, Greece, Hungary, India, Indonesia, Korea, Kuwait, Malaysia, Mexico, Peru, Philippines, Poland, Qatar, Saudi Arabia, South Africa, Taiwan, Thailand, Turkey and United Arab Emirates.
The CPI is a measure of the average change over time in the prices paid by urban consumers for a market basket of consumer goods and services.
Investment return and principal value will fluctuate, and when redeemed, shares may be worth more or less than original cost. Past performance is no guarantee of future results. The Average Annual Total Return table and performance graph do not reflect the deduction of taxes that a shareholder would pay on Fund distributions or the redemption of Fund shares. Investing in mutual funds involves market risk, including loss of principal. Performance returns assume the reinvestment of all distributions. Performance returns reflect fee waivers and reimbursements in effect without which returns would have been lower.
| 22 | 2022 Semi-Annual Report |
abrdn Global Equity Impact Fund (Unaudited)
Portfolio Summary (as a percentage of net assets)
April 30, 2022 (Unaudited)
| Asset Allocation | |||||
| Common Stocks | 103.2 | % | |||
| Short-Term Investment | 2.1 | % | |||
| Liabilities in Excess of Other Assets | (5.3%) | ||||
| 100.0 | % | ||||
The following table summarizes the composition of the Fund's portfolio, in S&P Global Industry Classification Standard (GICS) sectors.
| Sectors | |||||
| Health Care | 21.2 | % | |||
| Industrials | 20.7 | % | |||
| Financials | 16.8 | % | |||
| Real Estate | 14.8 | % | |||
| Information Technology | 10.6 | % | |||
| Materials | 7.5 | % | |||
| Utilities | 6.6 | % | |||
| Communication Services | 3.6 | % | |||
| Consumer Discretionary | 1.4 | % | |||
| Short-Term Investment | 2.1 | % | |||
| Liabilities in Excess of Other Assets | (5.3%) | ||||
| 100.0 | % | ||||
| Top Ten Holdings | |||||
| Prologis, Inc., REIT | 5.9 | % | |||
| UnitedHealth Group, Inc. | 4.7 | % | |||
| Tetra Tech, Inc. | 4.6 | % | |||
| Samsung SDI Co. Ltd. | 4.4 | % | |||
| Novo Nordisk AS, Class B | 3.9 | % | |||
| AstraZeneca PLC | 3.8 | % | |||
| Safaricom PLC | 3.6 | % | |||
| Equinix, Inc. | 3.6 | % | |||
| NextEra Energy, Inc. | 3.6 | % | |||
| Schneider Electric SE | 3.5 | % | |||
| Countries | |||||
| United States | 47.1 | % | |||
| United Kingdom | 8.5 | % | |||
| Netherlands | 6.0 | % | |||
| Denmark | 5.9 | % | |||
| India | 5.5 | % | |||
| South Korea | 4.4 | % | |||
| Kenya | 3.6 | % | |||
| Hong Kong | 3.1 | % | |||
| Australia | 3.0 | % | |||
| France | 2.6 | % | |||
| Indonesia | 2.4 | % | |||
| Israel | 2.4 | % | |||
| Republic of Ireland | 2.2 | % | |||
| Belgium | 2.0 | % | |||
| Other, less than 2% each | 4.5 | % | |||
| Short-Term Investment | 2.1 | % | |||
| Liabilities in Excess of Other Assets | (5.3%) | ||||
| 100.0 | % | ||||
| 2022 Semi-Annual Report | 23 |
Statement of Investments
April 30, 2022 (Unaudited)
abrdn Global Equity Impact Fund
| Shares | Value | ||||||
| COMMON STOCKS (103.2%) | |||||||
| AUSTRALIA (3.0%) | |||||||
| Real Estate (3.0%) | |||||||
| Goodman Group, REIT | 96,600 | $ | 1,607,800 | ||||
| BELGIUM (2.0%) | |||||||
| Materials (2.0%) | |||||||
| Umicore SA | 28,653 | 1,101,520 | |||||
| BRAZIL (1.2%) | |||||||
| Financials (1.2%) | |||||||
| Banco Bradesco SA | 207,147 | 624,715 | |||||
| CHINA (1.9%) | |||||||
| Health Care (1.9%) | |||||||
| Wuxi Biologics Cayman, Inc. (a)(b) | 139,500 | 1,029,623 | |||||
| DENMARK (5.9%) | |||||||
| Health Care (3.9%) | |||||||
| Novo Nordisk AS, Class B | 18,545 | 2,118,325 | |||||
| Industrials (1.0%) | |||||||
| Vestas Wind Systems AS | 21,030 | 536,286 | |||||
| Utilities (1.0%) | |||||||
| Orsted AS (a) | 4,884 | 540,319 | |||||
| 3,194,930 | |||||||
| FRANCE (2.6%) | |||||||
| Financials (2.6%) | |||||||
| AXA SA | 52,749 | 1,395,476 | |||||
| HONG KONG (3.1%) | |||||||
| Financials (3.1%) | |||||||
| AIA Group Ltd. | 170,500 | 1,674,951 | |||||
| INDIA (5.5%) | |||||||
| Financials (3.5%) | |||||||
| Housing Development Finance Corp. Ltd. | 65,911 | 1,899,357 | |||||
| Utilities (2.0%) | |||||||
| Azure Power Global Ltd. (b) | 75,631 | 1,062,616 | |||||
| 2,961,973 | |||||||
| INDONESIA (2.4%) | |||||||
| Financials (2.4%) | |||||||
| Bank Rakyat Indonesia Persero Tbk PT | 3,902,295 | 1,300,194 | |||||
| ISRAEL (2.4%) | |||||||
| Industrials (2.4%) | |||||||
| Kornit Digital Ltd. (b) | 19,567 | 1,301,205 | |||||
| KENYA (3.6%) | |||||||
| Communication Services (3.6%) | |||||||
| Safaricom PLC | 6,756,780 | 1,949,040 | |||||
| NETHERLANDS (6.0%) | |||||||
| Information Technology (2.7%) | |||||||
| ASML Holding NV | 2,500 | 1,418,846 | |||||
| Shares | Value | ||||||
| Materials (3.3%) | |||||||
| Koninklijke DSM NV | 10,631 | $ | 1,787,173 | ||||
| 3,206,019 | |||||||
| REPUBLIC OF IRELAND (2.2%) | |||||||
| Industrials (2.2%) | |||||||
| Kingspan Group PLC | 12,641 | 1,176,713 | |||||
| SOUTH KOREA (4.4%) | |||||||
| Information Technology (4.4%) | |||||||
| Samsung SDI Co. Ltd. | 4,981 | 2,372,721 | |||||
| TAIWAN (1.4%) | |||||||
| Industrials (1.4%) | |||||||
| Voltronic Power Technology Corp. | 17,610 | 770,453 | |||||
| UNITED KINGDOM (8.5%) | |||||||
| Health Care (5.9%) | |||||||
| AstraZeneca PLC | 15,430 | 2,058,999 | |||||
| GlaxoSmithKline PLC | 48,515 | 1,093,653 | |||||
| 3,152,652 | |||||||
| Industrials (2.6%) | |||||||
| RELX PLC | 47,320 | 1,409,686 | |||||
| 4,562,338 | |||||||
| UNITED STATES (47.1%) | |||||||
| Consumer Discretionary (1.4%) | |||||||
| Coursera, Inc. (b) | 41,868 | 787,537 | |||||
| Financials (4.0%) | |||||||
| Hannon Armstrong Sustainable Infrastructure Capital, Inc. | 35,437 | 1,417,126 | |||||
| Live Oak Bancshares, Inc. | 17,120 | 724,689 | |||||
| 2,141,815 | |||||||
| Health Care (9.5%) | |||||||
| Insulet Corp. (b) | 5,261 | 1,257,327 | |||||
| Merck & Co., Inc. | 14,828 | 1,315,095 | |||||
| UnitedHealth Group, Inc. | 4,973 | 2,529,019 | |||||
| 5,101,441 | |||||||
| Industrials (11.1%) | |||||||
| Johnson Controls International PLC | 18,872 | 1,129,867 | |||||
| Schneider Electric SE | 13,250 | 1,900,966 | |||||
| Shoals Technologies Group, Inc., Class A (b) | 48,791 | 486,934 | |||||
| Tetra Tech, Inc. | 17,800 | 2,479,184 | |||||
| 5,996,951 | |||||||
| Information Technology (3.5%) | |||||||
| Analog Devices, Inc. | 12,094 | 1,867,072 | |||||
| Materials (2.2%) | |||||||
| Crown Holdings, Inc. | 10,603 | 1,166,754 | |||||
| Real Estate (11.8%) | |||||||
| American Tower Corp., REIT | 5,403 | 1,302,231 | |||||
| Equinix, Inc. | 2,686 | 1,931,449 | |||||
| Prologis, Inc., REIT | 19,604 | 3,142,325 | |||||
| 6,376,005 | |||||||
See accompanying Notes to Financial Statements.
| 24 | 2022 Semi-Annual Report |
Statement of Investments (concluded)
April 30, 2022 (Unaudited)
abrdn Global Equity Impact Fund
| Shares | Value | ||||||
| COMMON STOCKS (continued) | |||||||
| UNITED STATES (continued) | |||||||
| Utilities (3.6%) | |||||||
| NextEra Energy, Inc. | 27,140 | $ | 1,927,483 | ||||
| 25,365,058 | |||||||
| Total Common Stocks | 55,594,729 | ||||||
| SHORT-TERM INVESTMENT (2.1%) | |||||||
| UNITED STATES (2.1%) | |||||||
| State Street Institutional U.S. Government Money Market Fund, Premier Class, 0.29% (c) | 1,125,151 | 1,125,151 | |||||
| Total Short-Term Investment | 1,125,151 | ||||||
| Total Investments (Cost $48,773,721) (d)—105.3% | 56,719,880 | ||||||
| Liabilities in Excess of Other Assets—(5.3)% | (2,831,487 | ) | |||||
| Net Assets—100.0% | $ | 53,888,393 | |||||
| (a) | Denotes a security issued under Regulation S or Rule 144A. | |
| (b) | Non-income producing security. | |
| (c) | Registered investment company advised by State Street Global Advisors. The rate shown is the 7 day yield as of April 30, 2022. | |
| (d) | See accompanying Notes to Financial Statements for tax unrealized appreciation/(depreciation) of securities. |
| PLC | Public Limited Company | |
| REIT | Real Estate Investment Trust |
See accompanying Notes to Financial Statements.
| 2022 Semi-Annual Report | 25 |
abrdn Global Infrastructure Fund (Unaudited)
Average Annual Total Return1 (For periods ended April 30, 2022) | Six Month† | 1 Yr. | 5 Yr. | 10 Yr. | |||||||
| Class A | w/o SC | (1.48%) | 2.10% | 7.77% | 8.33% | ||||||
| w/ SC2 | (7.17%) | (3.75%) | 6.51% | 7.69% | |||||||
| Institutional Class3 | w/o SC | (1.35%) | 2.34% | 8.04% | 8.61% |
All figures showing the effect of a sales charge (SC) reflect the maximum charge possible because it has the most significant effect on performance data. The total returns shown above do not include the impact of financial statement rounding of the net asset value (NAV) per share and/or financial statement adjustments.
| † | Not annualized |
| 1 | Returns prior to May 7, 2018 reflect the performance of a predecessor fund (the "Predecessor Fund"). Returns of the Predecessor Fund have not been adjusted to reflect the expenses applicable to the respective classes. The Fund and the Predecessor Fund have substantially similar investment objectives and strategies. Please consult the Fund's prospectus for more detail. |
| 2 | A 5.75% front-end sales charge was deducted. |
| 3 | Not subject to any sales charges. |
Performance of a $1,000,000 Investment* (as of April 30, 2022)

* Minimum Initial Investment
Comparative performance of $1,000,000 invested in Institutional Class shares of the abrdn Global Infrastructure Fund, Morgan Stanley Capital International All Country World Index (MSCI ACWI) (Net Dividends), S&P Global Infrastructure Index (Net Dividends) and the Consumer Price Index (CPI) over a 10-year period ended April 30, 2022. Unlike the Fund, the returns for these unmanaged indexes do not reflect any fees, expenses or sales charges. Investors cannot invest directly in market indexes.
The MSCI ACWI captures large and mid cap representation across 23 Developed Markets (DM) and 24 Emerging Markets (EM) countries. With more than 2,900 constituents, the index covers approximately 85% of the global investable equity opportunity set. DM countries in the Index are: Australia, Austria, Belgium, Canada, Denmark, Finland, France, Germany, Hong Kong, Ireland, Israel, Italy, Japan, Netherlands, New Zealand, Norway, Portugal, Singapore, Spain, Sweden, Switzerland, the UK and the US. EM countries in the Index are: Brazil, Chile, China, Colombia, Czech Republic, Egypt, Greece, Hungary, India, Indonesia, Korea, Kuwait, Malaysia, Mexico, Peru, Philippines, Poland, Qatar, Saudi Arabia, South Africa, Taiwan, Thailand, Turkey and United Arab Emirates.
The S&P Global Infrastructure Index is a total return index that is designed to track 75 companies from around the world chosen to represent the listed infrastructure industry while maintaining liquidity and tradability. To create diversified exposure, the index includes three distinct infrastructure clusters: energy, transportation, and utilities. Net Total Return (NTR) indexes include reinvestments of all dividends minus taxes.
The CPI is a measure of the average change over time in the prices paid by urban consumers for a market basket of consumer goods and services.
Investment return and principal value will fluctuate, and when redeemed, shares may be worth more or less than original cost. Past performance is no guarantee of future results. The Average Annual Total Return table and Performance graph do not reflect the deduction of taxes that a shareholder would pay on fund distributions or the redemption of fund shares. Investing in mutual funds involves market risk, including loss of principal. Performance returns assume the reinvestment of all distributions. Total returns reflect waivers and reimbursements in effect, without which returns would have been lower.
| 26 | 2022 Semi-Annual Report |
abrdn Global Infrastructure Fund (Unaudited)
Portfolio Summary (as a percentage of net assets)
April 30, 2022 (Unaudited)
| Asset Allocation | |||||
| Common Stocks | 98.5 | % | |||
| Short-Term Investment | 1.3 | % | |||
| Other Assets in Excess of Liabilities | 0.2 | % | |||
| 100.0 | % | ||||
The following table summarizes the composition of the Fund's portfolio, in S&P Global Industry Classification Standard (GICS) sectors.
| Sectors | |||||
| Industrials | 38.2 | %* | |||
| Utilities | 30.0 | %* | |||
| Communication Services | 14.0 | % | |||
| Energy | 9.3 | % | |||
| Real Estate | 4.4 | % | |||
| Materials | 1.8 | % | |||
| Information Technology | 0.4 | % | |||
| Consumer Discretionary | 0.4 | % | |||
| Short-Term Investment | 1.3 | % | |||
| Other Assets in Excess of Liabilities | 0.2 | % | |||
| 100.0 | % | ||||
| * | As of April 30, 2022, the Fund's holdings in the Industrials sector were allocated to four industries: Transportation Infrastructure (18.1%), Road & Rail (9.7%), Construction & Engineering (8.1%) and Commercial Services & Supplies (2.3%). As of April 30, 2022, the Fund's holdings in the Utilities sector were allocated to four industries: Independent Power & Renewable Electricity Producers (10.8%), Multi-Utilities (9.5%), Electric Utilities (9.0%) and Water Utilities (0.7%). |
| Top Ten Holdings | |||||
| Williams Cos., Inc. (The) | 3.3 | % | |||
| Kinder Morgan, Inc. | 3.0 | % | |||
| RWE AG | 3.0 | % | |||
| Cellnex Telecom SA | 3.0 | % | |||
| Enbridge, Inc. | 2.9 | % | |||
| CCR SA | 2.7 | % | |||
| Ferrovial SA | 2.7 | % | |||
| Canadian Pacific Railway Ltd. | 2.6 | % | |||
| International Container Terminal Services, Inc. | 2.4 | % | |||
| Vinci SA | 2.3 | % | |||
| Countries | |||||
| United States | 32.4 | % | |||
| Spain | 10.9 | % | |||
| France | 10.0 | % | |||
| United Kingdom | 6.5 | % | |||
| Italy | 6.3 | % | |||
| Canada | 5.6 | % | |||
| Germany | 5.4 | % | |||
| Brazil | 5.3 | % | |||
| China | 3.0 | % | |||
| Philippines | 2.4 | % | |||
| Other, less than 2% each | 10.7 | % | |||
| Short-Term Investment | 1.3 | % | |||
| Other Assets in Excess of Liabilities | 0.2 | % | |||
| 100.0 | % | ||||
| 2022 Semi-Annual Report | 27 |
Statement of Investments
April 30, 2022 (Unaudited)
abrdn Global Infrastructure Fund
| Shares or Principal Amount | Value | |||||||
| COMMON STOCKS (98.5%) | ||||||||
| ARGENTINA (1.9%) | ||||||||
| Industrials (1.1%) | ||||||||
| Corp. America Airports SA (a) | 95,600 | $ | 615,664 | |||||
| Materials (0.8%) | ||||||||
| Loma Negra Cia Industrial Argentina SA, ADR | 75,800 | 425,996 | ||||||
| 1,041,660 | ||||||||
| BRAZIL (5.3%) | ||||||||
| Industrials (4.4%) | ||||||||
| CCR SA | 586,300 | 1,471,694 | ||||||
| Rumo SA | 287,000 | 950,291 | ||||||
| 2,421,985 | ||||||||
| Utilities (0.9%) | ||||||||
| Omega Energia SA (a) | 238,307 | 514,795 | ||||||
| 2,936,780 | ||||||||
| CANADA (5.6%) | ||||||||
| Energy (3.0%) | ||||||||
| Enbridge, Inc. | 37,000 | 1,614,619 | ||||||
| Industrials (2.6%) | ||||||||
| Canadian Pacific Railway Ltd. | 19,700 | 1,442,434 | ||||||
| 3,057,053 | ||||||||
| CHINA (3.0%) | ||||||||
| Industrials (1.9%) | ||||||||
| COSCO SHIPPING Ports Ltd. | 733,775 | 523,208 | ||||||
| Zhejiang Expressway Co. Ltd., Class H | 626,100 | 517,827 | ||||||
| 1,041,035 | ||||||||
| Information Technology (0.4%) | ||||||||
| GDS Holdings Ltd., ADR (a) | 7,900 | 248,218 | ||||||
| Utilities (0.7%) | ||||||||
| Beijing Enterprises Water Group Ltd. | 1,154,000 | 373,305 | ||||||
| 1,662,558 | ||||||||
| COLOMBIA (0.7%) | ||||||||
| Communication Services (0.7%) | ||||||||
| Millicom International Cellular SA ADR (a) | 17,300 | 390,024 | ||||||
| FRANCE (10.0%) | ||||||||
| Industrials (5.9%) | ||||||||
| Eiffage SA | 11,000 | 1,086,236 | ||||||
| Getlink SE | 47,800 | 874,697 | ||||||
| Vinci SA | 13,200 | 1,280,847 | ||||||
| 3,241,780 | ||||||||
| Utilities (4.1%) | ||||||||
| Engie SA | 93,100 | 1,098,623 | ||||||
| Veolia Environnement SA | 40,000 | 1,167,063 | ||||||
| 2,265,686 | ||||||||
| 5,507,466 | ||||||||
| Shares or Principal Amount | Value | |||||||
| GERMANY (5.4%) | ||||||||
| Communication Services (1.3%) | ||||||||
| Vantage Towers AG | 21,845 | $ | 742,767 | |||||
| Industrials (1.1%) | ||||||||
| Fraport AG Frankfurt Airport Services Worldwide (a) | 10,900 | 582,488 | ||||||
| Utilities (3.0%) | ||||||||
| RWE AG | 40,000 | 1,660,776 | ||||||
| 2,986,031 | ||||||||
| INDIA (0.6%) | ||||||||
| Utilities (0.6%) | ||||||||
| Azure Power Global Ltd. (a) | 22,000 | 309,100 | ||||||
| INDONESIA (1.0%) | ||||||||
| Communication Services (1.0%) | ||||||||
| Sarana Menara Nusantara Tbk PT (f) | 7,820,900 | 544,533 | ||||||
| ITALY (6.3%) | ||||||||
| Communication Services (1.2%) | ||||||||
| Infrastrutture Wireless Italiane SpA (b) | 63,300 | 675,432 | ||||||
| Industrials (2.2%) | ||||||||
| Atlantia SpA (a) | 49,900 | 1,190,391 | ||||||
| Materials (1.0%) | ||||||||
| Buzzi Unicem SpA | 31,200 | 577,783 | ||||||
| Utilities (1.9%) | ||||||||
| Enel SpA | 157,400 | 1,023,555 | ||||||
| 3,467,161 | ||||||||
| JAPAN (0.6%) | ||||||||
| Industrials (0.6%) | ||||||||
| East Japan Railway Co. | 6,100 | 318,095 | ||||||
| LUXEMBOURG (1.4%) | ||||||||
| Communication Services (1.4%) | ||||||||
| SES SA, Class A | 83,800 | 749,801 | ||||||
| MALAYSIA (1.6%) | ||||||||
| Industrials (1.6%) | ||||||||
| Malaysia Airports Holdings Bhd (a) | 550,100 | 866,817 | ||||||
| MEXICO (1.7%) | ||||||||
| Industrials (1.7%) | ||||||||
| Promotora y Operadora de Infraestructura SAB de CV | 129,400 | 947,934 | ||||||
| NORWAY (1.2%) | ||||||||
| Communication Services (1.2%) | ||||||||
| Telenor ASA | 46,300 | 652,990 | ||||||
| PHILIPPINES (2.4%) | ||||||||
| Industrials (2.4%) | ||||||||
| International Container Terminal Services, Inc. | 318,200 | 1,306,526 | ||||||
See accompanying Notes to Financial Statements.
| 28 | 2022 Semi-Annual Report |
Statement of Investments (concluded)
April 30, 2022 (Unaudited)
abrdn Global Infrastructure Fund
| Shares or Principal Amount | Value | |||||||
| COMMON STOCKS (continued) | ||||||||
| SPAIN (10.9%) | ||||||||
| Communication Services (3.0%) | ||||||||
| Cellnex Telecom SA (b) | 35,200 | $ | 1,640,682 | |||||
| Industrials (4.4%) | ||||||||
| Aena SME SA (a)(b) | 6,800 | 964,985 | ||||||
| Ferrovial SA | 56,791 | 1,456,368 | ||||||
| 2,421,353 | ||||||||
| Utilities (3.5%) | ||||||||
| Atlantica Sustainable Infrastructure PLC | 25,400 | 784,860 | ||||||
| EDP Renovaveis SA | 47,300 | 1,119,457 | ||||||
| 1,904,317 | ||||||||
| 5,966,352 | ||||||||
| UNITED KINGDOM (6.5%) | ||||||||
| Communication Services (2.5%) | ||||||||
| Helios Towers PLC (a) | 415,900 | 586,254 | ||||||
| Vodafone Group PLC | 502,900 | 761,370 | ||||||
| 1,347,624 | ||||||||
| Industrials (1.3%) | ||||||||
| National Express Group PLC (a) | 231,500 | 717,574 | ||||||
| Utilities (2.7%) | ||||||||
| National Grid PLC, ADR | 11,200 | 830,592 | ||||||
| SSE PLC | 28,900 | 671,226 | ||||||
| 1,501,818 | ||||||||
| 3,567,016 | ||||||||
| UNITED STATES (32.4%) | ||||||||
| Communication Services (1.7%) | ||||||||
| DISH Network Corp., Class A (a) | 15,200 | 433,352 | ||||||
| Verizon Communications, Inc. | 11,000 | 509,300 | ||||||
| 942,652 | ||||||||
| Consumer Discretionary (0.4%) | ||||||||
| TravelCenters of America, Inc. (a) | 5,400 | 205,254 | ||||||
| Energy (6.3%) | ||||||||
| Kinder Morgan, Inc. | 91,700 | 1,664,355 | ||||||
| Williams Cos., Inc. (The) | 52,100 | 1,786,509 | ||||||
| 3,450,864 | ||||||||
| Industrials (7.0%) | ||||||||
| CoreCivic, Inc., REIT (a) | 31,000 | 385,330 | ||||||
| Dycom Industries, Inc. (a) | 7,600 | 645,316 |
| Shares or Principal Amount | Value | |||||||
| GEO Group, Inc. (The), REIT (a) | 13,600 | $ | 88,808 | |||||
| Norfolk Southern Corp. | 3,400 | 876,792 | ||||||
| Union Pacific Corp. | 4,400 | 1,030,876 | ||||||
| Waste Connections, Inc. | 5,700 | 786,429 | ||||||
| 3,813,551 | ||||||||
| Real Estate (4.4%) | ||||||||
| American Tower Corp., REIT | 5,100 | 1,229,202 | ||||||
| Crown Castle International Corp., REIT | 6,400 | 1,185,344 | ||||||
| 2,414,546 | ||||||||
| Utilities (12.6%) | ||||||||
| American Electric Power Co., Inc. (c) | 10,300 | 1,020,833 | ||||||
| CenterPoint Energy, Inc. | 34,400 | 1,052,984 | ||||||
| Clearway Energy, Inc., Class C | 20,600 | 628,918 | ||||||
| CMS Energy Corp. | 15,900 | 1,092,171 | ||||||
| FirstEnergy Corp. | 26,400 | 1,143,384 | ||||||
| NextEra Energy, Inc. | 14,600 | 1,036,892 | ||||||
| Vistra Corp. | 38,300 | 958,266 | ||||||
| 6,933,448 | ||||||||
| 17,760,315 | ||||||||
| Total Common Stocks | 54,038,212 | |||||||
| SHORT-TERM INVESTMENT (1.3%) | ||||||||
| UNITED STATES (1.3%) | ||||||||
| State Street Institutional U.S. Government Money Market Fund, Premier Class, 0.29% (d) | 697,049 | 697,049 | ||||||
| Total Short-Term Investment | 697,049 | |||||||
| Total Investments (Cost $46,679,940) (e)—99.8% | 54,735,261 | |||||||
| Other Assets in Excess of Liabilities—0.2% | 107,443 | |||||||
| Net Assets—100.0% | $ | 54,842,704 | ||||||
| (a) | Non-income producing security. |
| (b) | Denotes a security issued under Regulation S or Rule 144A. |
| (c) | All or a portion of the security has been designated as collateral for unrealized depreciation on forward foreign currency contracts. |
| (d) | Registered investment company advised by State Street Global Advisors. The rate shown is the 7 day yield as of April 30, 2022. |
| (e) | See accompanying Notes to Financial Statements for tax unrealized appreciation/(depreciation) of securities. |
| (f) | Illiquid Security |
| ADR | American Depositary Receipt |
| PLC | Public Limited Company |
| REIT | Real Estate Investment Trust |
At April 30, 2022, the Fund's open forward foreign currency exchange contracts were as follows:
| Sale Contracts Settlement Date | Counterparty | Amount Purchased | Amount Sold | Fair Value | Unrealized Appreciation | |||||||||
| United States Dollar/Hong Kong Dollar | ||||||||||||||
| 07/14/2022 | Royal Bank of Canada | USD 1,662,066 | HKD 13,000,000 | $1,659,252 | $2,814 | |||||||||
See accompanying Notes to Financial Statements.
| 2022 Semi-Annual Report | 29 |
abrdn International Real Estate Equity Fund (Unaudited)
| Average Annual Total Return1 (For periods ended April 30, 2022) | Six Month† | 1 Yr. | 5 Yr. | 10 Yr. | ||||||
| Class A | w/o SC | (10.88%) | (11.52%) | 1.02% | 1.23% | |||||
| w/ SC2 | (16.01%) | (16.62%) | (0.18%) | 0.63% | ||||||
| Institutional Class3 | w/o SC | (10.74%) | (11.30%) | 1.26% | 1.48% |
All figures showing the effect of a sales charge (SC) reflect the maximum charge possible because it has the most significant effect on performance data. The total returns shown above do not include the impact of financial statement rounding of the net asset value (NAV) per share and/or financial statement adjustments.
| † | Not annualized |
| 1 | Returns prior to May 7, 2018 reflect the performance of a predecessor fund (the "Predecessor Fund"). Returns of the Predecessor Fund have not been adjusted to reflect the expenses applicable to the respective classes. The Fund and the Predecessor Fund have substantially similar investment objectives and strategies. Please consult the Fund's prospectus for more detail. |
| 2 | A 5.75% front-end sales charge was deducted. |
| 3 | Not subject to any sales charges. |
Performance of a $1,000,000 Investment* (as of April 30, 2022)

| * | Minimum Initial Investment |
Comparative performance of $1,000,000 invested in Institutional Class shares of the abrdn International Real Estate Equity Fund, the Morgan Stanley Capital International (MSCI) EAFE Index (Net
Dividends), FTSE EPRA/NAREIT Global ex US Index (Net Dividends) and the Consumer Price Index (CPI) over a 10-year period ended April 30, 2022. Unlike the Fund, the returns for these unmanaged indexes do not reflect any fees, expenses or sales charges. Investors cannot invest directly in market indexes.
The MSCI EAFE Index is an equity index which captures large and mid cap representation across 21 Developed Markets countries around the world, excluding the US and Canada. With 825 constituents, the index covers approximately 85% of the free float adjusted market capitalization in each country. Developed Markets countries in the MSCI EAFE Index include: Australia, Austria, Belgium, Denmark, Finland, France, Germany, Hong Kong, Ireland, Israel, Italy, Japan, the Netherlands, New Zealand, Norway, Portugal, Singapore, Spain, Sweden, Switzerland and the UK.
The FTSE EPRA/NAREIT Global ex-U.S. Index is a total return index that is designed to represent general trends in eligible real estate equities outside the United States.
The CPI is a measure of the average change over time in the prices paid by urban consumers for a market basket of consumer goods and services.
Investment return and principal value will fluctuate, and when redeemed, shares may be worth more or less than original cost. Past performance is no guarantee of future results. The Average Annual Total Return table and Performance graph do not reflect the deduction of taxes that a shareholder would pay on fund distributions or the redemption of fund shares. Investing in mutual funds involves market risk, including loss of principal. Performance returns assume the reinvestment of all distributions. Total returns reflect waivers and reimbursements in effect, without which returns would have been lower.
| 30 | 2022 Semi-Annual Report |
abrdn International Real Estate Equity Fund (Unaudited)
Portfolio Summary (as a percentage of net assets)
April 30, 2022 (Unaudited)
| Asset Allocation | ||
| Common Stocks | 95.8% | |
| Short-Term Investment | 4.3% | |
| Liabilities in Excess of Other Assets | (0.1%) | |
| 100.0% |
The following table summarizes the composition of the Fund's portfolio, in S&P Global Industry Classification Standard (GICS) sectors.
| Sub-Industries | ||
| Diversified Real Estate Activities | 17.7% | |
| Industrial REITs | 17.5% | |
| Office REITs | 11.4% | |
| Real Estate Operating Companies | 10.4% | |
| Real Estate Development | 10.1% | |
| Retail REITs | 9.8% | |
| Diversified REITs | 9.3% | |
| Specialized REITs | 4.8% | |
| Residential REITs | 3.3% | |
| Health Care REITs | 1.1% | |
| Homebuilding | 0.4% | |
| Short-Term Invesment | 4.3% | |
| Liabilities in Excess of Other Assets | (0.1%) | |
| 100.0% | ||
| Top Ten Holdings | ||
| Segro PLC | 4.7% | |
| Mitsui Fudosan Co. Ltd., REIT | 4.1% | |
| Link REIT | 3.6% | |
| CK Asset Holdings Ltd. | 3.5% | |
| Vonovia SE | 3.4% | |
| Nippon Building Fund, Inc., REIT | 3.2% | |
| Capitaland Investment Ltd. | 3.1% | |
| Mitsubishi Estate Co., Ltd. | 3.0% | |
| Dexus, REIT | 2.9% | |
| Prologis, Inc., REIT | 2.8% |
| Top Countries | ||
| Japan | 20.7% | |
| Singapore | 10.7% | |
| United Kingdom | 9.9% | |
| Hong Kong | 9.7% | |
| Australia | 8.0% | |
| Germany | 6.7% | |
| China | 6.0% | |
| United States | 5.6% | |
| Belgium | 3.2% | |
| Canada | 2.6% | |
| Mexico | 2.4% | |
| Spain | 2.2% | |
| Sweden | 2.1% | |
| Other, less than 2% each | 6.0% | |
| Short-Term Investment | 4.3% | |
| Liabilities in Excess of Other Assets | (0.1%) | |
| 100.0% |
| 2022 Semi-Annual Report | 31 |
Statement of Investments
April 30, 2022 (Unaudited)
abrdn International Real Estate Equity Fund
| Shares or Principal Amount | Value | |||||
| COMMON STOCKS (95.8%) | ||||||
| AUSTRALIA (8.0%) | ||||||
| Real Estate (8.0%) | ||||||
| Charter Hall Group | 13,133 | $ 141,146 | ||||
| Dexus, REIT | 63,249 | 494,517 | ||||
| Goodman Group, REIT | 10,970 | 182,583 | ||||
| Lendlease Corp., Ltd. | 15,856 | 135,828 | ||||
| Mirvac Group, REIT | 247,738 | 418,700 | ||||
| 1,372,774 | ||||||
| BELGIUM (3.2%) | ||||||
| Real Estate (3.2%) | ||||||
| Aedifica SA, REIT | 1,560 | 184,911 | ||||
| Cofinimmo SA, REIT | 1,323 | 177,659 | ||||
| Warehouses De Pauw CVA, REIT | 4,751 | 182,772 | ||||
| 545,342 | ||||||
| BRAZIL (0.4%) | ||||||
| Consumer Discretionary (0.4%) | ||||||
| Cyrela Brazil Realty SA Empreendimentos e Participacoes | 25,048 | 71,690 | ||||
| CANADA (2.6%) | ||||||
| Real Estate (2.6%) | ||||||
| Allied Properties Real Estate Investment Trust | 5,864 | 190,484 | ||||
| Canadian Apartment Properties, REIT | 6,464 | 253,196 | ||||
| 443,680 | ||||||
| CHINA (6.0%) | ||||||
| Real Estate (6.0%) | ||||||
| China Overseas Land & Investment Ltd. | 124,500 | 384,615 | ||||
| China Resources Land Ltd. | 89,971 | 401,830 | ||||
| ESR Cayman Ltd. (a)(b) | 84,349 | 256,050 | ||||
| 1,042,495 | ||||||
| FRANCE (1.9%) | ||||||
| Real Estate (1.9%) | ||||||
| Gecina SA, REIT | 832 | 93,723 | ||||
| Unibail-Rodamco-Westfield (b) | 3,385 | 238,896 | ||||
| 332,619 | ||||||
| GERMANY (6.7%) | ||||||
| Real Estate (6.7%) | ||||||
| Instone Real Estate Group SE (a) | 19,912 | 305,690 | ||||
| LEG Immobilien SE | 2,490 | 255,301 | ||||
| Vonovia SE | 14,842 | 591,319 | ||||
| 1,152,310 | ||||||
| HONG KONG (9.7%) | ||||||
| Real Estate (9.7%) | ||||||
| CK Asset Holdings Ltd. | 89,000 | 603,343 | ||||
| Link REIT | 70,961 | 612,946 | ||||
| Sun Hung Kai Properties Ltd. | 40,311 | 464,265 | ||||
| 1,680,554 | ||||||
| Shares or Principal Amount | Value | ||||
| JAPAN (20.7%) | |||||
| Real Estate (20.7%) | |||||
| Canadian Solar Infrastructure Fund, Inc., UNIT (b) | 137 | $ 129,995 | |||
| CRE Logistics REIT, Inc. (b) | 269 | 411,370 | |||
| Global One Real Estate Investment Corp., REIT | 266 | 228,014 | |||
| Kenedix Retail REIT Corp. | 90 | 189,471 | |||
| Mitsubishi Estate Co., Ltd. | 35,100 | 511,287 | |||
| Mitsubishi Estate Logistics REIT Investment Corp., REIT (b) | 71 | 254,728 | |||
| Mitsui Fudosan Co. Ltd., REIT | 33,750 | 715,289 | |||
| Mori Hills REIT Investment Corp., REIT | 161 | 182,596 | |||
| Nippon Building Fund, Inc., REIT | 108 | 560,661 | |||
| Sankei Real Estate, Inc., REIT | 167 | 127,300 | |||
| Tokyu Fudosan Holdings Corp. | 51,400 | 267,469 | |||
| 3,578,180 | |||||
| MEXICO (2.4%) | |||||
| Real Estate (2.4%) | |||||
| Corp Inmobiliaria Vesta SAB de CV, REIT | 111,276 | 205,795 | |||
| Prologis Property Mexico SA de CV, REIT | 74,524 | 200,128 | |||
| 405,923 | |||||
| NETHERLANDS (1.0%) | |||||
| Real Estate (1.0%) | |||||
| CTP NV (a) | 12,455 | 176,349 | |||
| PHILIPPINES (1.3%) | |||||
| Real Estate (1.3%) | |||||
| Ayala Land, Inc. | 279,392 | 170,532 | |||
| Megaworld Corp. | 1,019,705 | 55,269 | |||
| 225,801 | |||||
| SINGAPORE (10.7%) | |||||
| Real Estate (10.7%) | |||||
| Ascendas India Trust, UNIT | 226,500 | 204,644 | |||
| CapitaLand Integrated Commercial Trust, REIT | 237,800 | 398,456 | |||
| Capitaland Investment Ltd. (b) | 173,600 | 526,390 | |||
| Daiwa House Logistics Trust, REIT (b) | 457,400 | 279,477 | |||
| Lendlease Global Commercial REIT | 448,200 | 256,014 | |||
| Mapletree Logistics Trust | 136,900 | 175,824 | |||
| 1,840,805 | |||||
| SOUTH KOREA (1.4%) | |||||
| Real Estate (1.4%) | |||||
| ESR Kendall Square REIT Co. Ltd. | 40,526 | 236,509 | |||
| SPAIN (2.2%) | |||||
| Real Estate (2.2%) | |||||
| Inmobiliaria Colonial Socimi SA, REIT | 22,300 | 185,433 | |||
| Merlin Properties Socimi SA | 18,241 | 198,164 | |||
| 383,597 | |||||
See accompanying Notes to Financial Statements.
| 32 | 2022 Semi-Annual Report |
Statement of Investments (concluded)
April 30, 2022 (Unaudited)
abrdn International Real Estate Equity Fund
| Shares or Principal Amount | Value | ||||||
| COMMON STOCKS (continued) | |||||||
| SWEDEN (2.1%) | |||||||
| Real Estate (2.1%) | |||||||
| Castellum AB | 4,074 | $ 80,679 | |||||
| Catena AB | 2,557 | 133,716 | |||||
| Fabege AB | 12,591 | 152,831 | |||||
| 367,226 | |||||||
| UNITED KINGDOM (9.9%) | |||||||
| Real Estate (9.9%) | |||||||
| Land Securities Group PLC | 25,870 | 242,624 | |||||
| LondonMetric Property PLC, REIT | 66,704 | 225,451 | |||||
| Safestore Holdings PLC, REIT | 15,664 | 246,422 | |||||
| Segro PLC | 48,743 | 816,063 | |||||
| South Asian Real Estate Pvt. Ltd. (a)(b)(c)(d) | 2,000,000 | — | |||||
| UNITE Group PLC (The), REIT | 12,420 | 175,870 | |||||
| 1,706,430 | |||||||
| UNITED STATES (5.6%) | |||||||
| Real Estate (5.6%) | |||||||
| American Tower Corp., REIT | 389 | 93,757 | |||||
| Equinix, Inc. | 131 | 94,199 | |||||
| Mid-America Apartment Communities, Inc., REIT | 704 | 138,463 | |||||
| Prologis, Inc., REIT | 3,063 | 490,968 | |||||
| Public Storage | 404 | 150,086 | |||||
| 967,473 | |||||||
| Total Common Stocks | 16,529,757 | ||||||
| Shares or Principal Amount | Value | ||||||
| SHORT-TERM INVESTMENT (4.3%) | |||||||
| UNITED STATES (4.3%) | |||||||
| State Street Institutional U.S. Government Money Market Fund, Premier Class, 0.29% (e) | 733,623 | $ 733,623 | |||||
| Total Short-Term Investment | 733,623 | ||||||
| Total Investments (Cost $29,589,519) (f)—100.1% | 17,263,380 | ||||||
| Liabilities in Excess of Other Assets—(0.1)% | (11,128 | ) | |||||
| Net Assets—100.0% | $17,252,252 | ||||||
| (a) | Denotes a security issued under Regulation S or Rule 144A. |
| (b) | Non-income producing security. |
| (c) | Illiquid security. |
| (d) | Fair Value is determined pursuant to procedures approved by the Fund's Board of Trustees. See Note 2(a) of the accompanying Notes to Financial Statements for inputs used. |
| (e) | Registered investment company advised by State Street Global Advisors. The rate shown is the 7 day yield as of April 30, 2022. |
| (f) | See accompanying Notes to Financial Statements for tax unrealized appreciation/(depreciation) of securities. |
| CVA | Dutch Certificate |
| PLC | Public Limited Company |
| REIT | Real Estate Investment Trust |
See accompanying Notes to Financial Statements.
| 2022 Semi-Annual Report | 33 |
abrdn International Small Cap Fund (Unaudited)
| Average Annual Total Return1 (For periods ended April 30, 2022) | Six Month† | 1 Yr. | 5 Yr. | 10 Yr. | |||||||||||||||
| Class A | w/o SC | (28.32 | %) | (18.65 | %) | 7.21 | % | 7.42 | % | ||||||||||
| w/ SC2 | (32.44 | %) | (23.33 | %) | 5.95 | % | 6.78 | % | |||||||||||
| Class C | w/o SC | (28.54 | %) | (19.17 | %) | 6.51 | % | 6.70 | % | ||||||||||
| w/ SC3 | (29.20 | %) | (19.92 | %) | 6.51 | % | 6.70 | % | |||||||||||
| Class R4 | w/o SC | (28.41 | %) | (18.87 | %) | 6.88 | % | 7.11 | % | ||||||||||
| Institutional Class4 | w/o SC | (28.17 | %) | (18.33 | %) | 7.59 | % | 7.78 | % | ||||||||||
All figures showing the effect of a sales charge (SC) reflect the maximum charge possible because it has the most significant effect on performance data. The total returns shown above do not include the impact of financial statement rounding of the net asset value (NAV) per share and/or financial statement adjustments.
| † | Not annualized |
| 1 | The Fund changed its investment strategy effective February 29, 2016. Performance information for periods prior to February 29, 2016 does not reflect the current investment strategy. Please consult the Fund's prospectus for more detail. |
| 2 | A 5.75% front-end sales charge was deducted. |
| 3 | A 1.00% contingent deferred sales charge (CDSC) was deducted from the one year return because it is charged when Class C shares are sold within the first year after purchase. |
| 4 | Not subject to any sales charges. |
Performance of a $10,000 Investment (as of April 30, 2022)

Comparative performance of $10,000 invested in Class A shares of the abrdn International Small Cap Fund, Morgan Stanley Capital Index (MSCI) All Country World (ACWI) ex-USA Small Cap Index (Net Dividends) and the Consumer Price Index (CPI) over a 10-year period
ended April 30, 2022. Unlike the Fund, the returns for these unmanaged indexes do not reflect any fees, expenses, or sales charges. Investors cannot invest directly in market indexes.
The MSCI ACWI ex USA Small Cap Index captures small cap representation across 22 of 23 Developed Markets (DM) countries (excluding the US) and 24 Emerging Markets (EM) countries. With 4,334 constituents, the index covers approximately 14% of the global equity opportunity set outside the US. DM countries include: Australia, Austria, Belgium, Canada, Denmark, Finland, France, Germany, Hong Kong, Ireland, Israel, Italy, Japan, Netherlands, New Zealand, Norway, Portugal, Singapore, Spain, Sweden, Switzerland and the UK. EM countries include: Brazil, Chile, China, Colombia, Czech Republic, Egypt, Greece, Hungary, India, Indonesia, Korea, Kuwait, Malaysia, Mexico, Peru, Philippines, Poland, Qatar, Saudi Arabia, South Africa, Taiwan, Thailand, Turkey and United Arab Emirates.
The CPI is a measure of the average change over time in the prices paid by urban consumers for a market basket of consumer goods and services.
Investment return and principal value will fluctuate, and when redeemed, shares may be worth more or less than original cost. Past performance is no guarantee of future results. The Average Annual Total Return table and Performance graph do not reflect the deduction of taxes that a shareholder would pay on fund distributions or the redemption of fund shares. Investing in mutual funds involves market risk, including loss of principal. Performance returns assume the reinvestment of all distributions. Total returns reflect waivers and reimbursements in effect, without which returns would have been lower.
| 34 | 2022 Semi-Annual Report |
abrdn International Small Cap Fund (Unaudited)
Portfolio Summary (as a percentage of net assets)
April 30, 2022 (Unaudited)
| Asset Allocation | |||||
| Common Stocks | 94.5 | % | |||
| Preferred Stocks | 2.7 | % | |||
| Short-Term Investment | 2.1 | % | |||
| Other Assets in Excess of Liabilities | 0.7 | % | |||
| 100.0 | % |
The following table summarizes the composition of the Fund's portfolio, in S&P Global Industry Classification Standard (GICS) sectors, expressed as a percentage of net assets as of April 30, 2022.
| Sectors | |||||
| Industrials | 26.9 | %* | |||
| Health Care | 16.6 | % | |||
| Information Technology | 14.6 | % | |||
| Communication Services | 9.3 | % | |||
| Consumer Discretionary | 8.8 | % | |||
| Consumer Staples | 7.4 | % | |||
| Financials | 7.0 | % | |||
| Materials | 6.6 | % | |||
| Short-Term Investment | 2.1 | % | |||
| Other Assets in Excess of Liabilities | 0.7 | % | |||
| 100.0 | % | ||||
| * | As of April 30, 2022, the Fund's holdings in the Industrials sector were allocated to seven industries: Machinery (8.2%), Marine (4.5%), Commercial Services & Supplies (4.3%), Transportation Infrastructure (3.7%), Professional Services (2.2%), Trading Companies & Distributors (2.1%) and Electrical Equipment (1.9%). |
| Top Ten Holdings | |||||
| Pacific Basin Shipping Ltd. | 4.5 | % | |||
| CyberArk Software Ltd. | 4.1 | % | |||
| Grupo Aeroportuario del Sureste SAB de CV, Class B | 3.8 | % | |||
| Hansol Chemical Co. Ltd. | 3.7 | % | |||
| CTS Eventim AG & Co. KGaA | 3.4 | % | |||
| Dechra Pharmaceuticals PLC | 3.4 | % | |||
| Kornit Digital Ltd. | 3.1 | % | |||
| Endava PLC, ADR | 3.1 | % | |||
| Affle India Ltd. | 2.9 | % | |||
| Syngene International Ltd. | 2.9 | % | |||
| Top Countries | |||||
| Israel | 12.9 | % | |||
| United Kingdom | 9.1 | % | |||
| India | 8.1 | % | |||
| Germany | 8.1 | % | |||
| Japan | 6.7 | % | |||
| South Korea | 6.6 | % | |||
| Hong Kong | 4.5 | % | |||
| Sweden | 4.4 | % | |||
| Taiwan | 4.3 | % | |||
| Canada | 4.2 | % | |||
| Australia | 3.9 | % | |||
| Mexico | 3.7 | % | |||
| United States | 3.4 | % | |||
| Romania | 3.1 | % | |||
| France | 2.8 | % | |||
| Poland | 2.6 | % | |||
| Switzerland | 2.5 | % | |||
| Belgium | 2.1 | % | |||
| Other, less than 2% each | 4.2 | % | |||
| Short-Term Investment | 2.1 | % | |||
| Other Assets in Excess of Liabilities | 0.7 | % | |||
| 100.0 | % |
| 2022 Semi-Annual Report | 35 |
Statement of Investments
April 30, 2022 (Unaudited)
abrdn International Small Cap Fund
| Shares or Principal Amount | Value | ||||||
| COMMON STOCKS (94.5%) | |||||||
| AUSTRALIA (3.9%) | |||||||
| Consumer Discretionary (1.5%) | |||||||
| ARB Corp. Ltd. | 143,610 | $ 3,980,501 | |||||
| Financials (2.4%) | |||||||
| Steadfast Group Ltd. | 1,772,900 | 6,418,577 | |||||
| 10,399,078 | |||||||
| BELGIUM (2.1%) | |||||||
| Industrials (2.1%) | |||||||
| Azelis Group NV (a) | 227,100 | 5,593,107 | |||||
| CANADA (4.2%) | |||||||
| Consumer Staples (2.0%) | |||||||
| Jamieson Wellness, Inc. (b) | 212,700 | 5,347,924 | |||||
| Industrials (2.2%) | |||||||
| Ritchie Bros Auctioneers, Inc. | 107,800 | 5,937,748 | |||||
| 11,285,672 | |||||||
| CHINA (0.8%) | |||||||
| Consumer Discretionary (0.8%) | |||||||
| Baozun, Inc., Class A (a) | 863,200 | 2,171,322 | |||||
| FRANCE (2.8%) | |||||||
| Consumer Staples (2.8%) | |||||||
| Interparfums SA | 133,689 | 7,417,820 | |||||
| GERMANY (5.4%) | |||||||
| Communication Services (3.4%) | |||||||
| CTS Eventim AG & Co. KGaA (a) | 131,500 | 9,025,643 | |||||
| Financials (2.0%) | |||||||
| Hypoport SE (a) | 19,000 | 5,252,619 | |||||
| 14,278,262 | |||||||
| HONG KONG (4.5%) | |||||||
| Industrials (4.5%) | |||||||
| Pacific Basin Shipping Ltd. | 26,231,800 | 12,035,429 | |||||
| INDIA (8.1%) | |||||||
| Communication Services (2.9%) | |||||||
| Affle India Ltd. (a) | 494,380 | 7,787,001 | |||||
| Health Care (5.2%) | |||||||
| Sanofi India Ltd. | 65,400 | 5,945,457 | |||||
| Syngene International Ltd. (a)(b) | 955,800 | 7,767,010 | |||||
| 13,712,467 | |||||||
| 21,499,468 | |||||||
| INDONESIA (1.3%) | |||||||
| Consumer Discretionary (1.3%) | |||||||
| Ace Hardware Indonesia Tbk PT | 49,032,400 | 3,534,446 | |||||
| ISRAEL (12.9%) | |||||||
| Consumer Discretionary (2.8%) | |||||||
| Maytronics Ltd. | 421,603 | 7,485,901 | |||||
| Shares or Principal Amount | Value | |||||||
| Industrials (3.1%) | ||||||||
| Kornit Digital Ltd. (a) | 124,600 | $ | 8,285,900 | |||||
| Information Technology (7.0%) | ||||||||
| CyberArk Software Ltd. (a) | 69,200 | 10,874,088 | ||||||
| Nova Ltd. (a) | 78,400 | 7,731,024 | ||||||
| 18,605,112 | ||||||||
| 34,376,913 | ||||||||
| JAPAN (6.7%) | ||||||||
| Industrials (6.7%) | ||||||||
| Daiseki Co. Ltd. | 156,400 | 5,625,110 | ||||||
| Nabtesco Corp. | 278,300 | 6,347,352 | ||||||
| TechnoPro Holdings, Inc. | 227,700 | 5,799,085 | ||||||
| 17,771,547 | ||||||||
| MEXICO (3.7%) | ||||||||
| Industrials (3.7%) | ||||||||
| Grupo Aeroportuario del Sureste SAB de CV, Class B | 455,100 | 9,924,264 | ||||||
| NETHERLANDS (0.9%) | ||||||||
| Information Technology (0.9%) | ||||||||
| BE Semiconductor Industries NV | 37,400 | 2,279,853 | ||||||
| POLAND (2.6%) | ||||||||
| Consumer Staples (2.6%) | ||||||||
| Dino Polska SA (a)(b) | 105,200 | 6,805,575 | ||||||
| ROMANIA (3.1%) | ||||||||
| Information Technology (3.1%) | ||||||||
| Endava PLC, ADR (a) | 82,021 | 8,251,313 | ||||||
| SOUTH KOREA (6.6%) | ||||||||
| Materials (6.6%) | ||||||||
| Chunbo Co. Ltd. | 35,400 | 7,685,642 | ||||||
| Hansol Chemical Co. Ltd. | 51,300 | 9,870,337 | ||||||
| 17,555,979 | ||||||||
| SWEDEN (4.4%) | ||||||||
| Communication Services (1.8%) | ||||||||
| Hemnet Group AB (a) | 380,300 | 4,744,215 | ||||||
| Financials (2.6%) | ||||||||
| Nordnet AB publ | 396,900 | 6,884,129 | ||||||
| 11,628,344 | ||||||||
| SWITZERLAND (2.5%) | ||||||||
| Health Care (2.5%) | ||||||||
| SKAN Group AG | 57,500 | 3,824,467 | ||||||
| Tecan Group AG (a) | 9,417 | 2,829,975 | ||||||
| 6,654,442 | ||||||||
| TAIWAN (4.3%) | ||||||||
| Industrials (1.9%) | ||||||||
| Voltronic Power Technology Corp. | 114,500 | 5,009,475 | ||||||
See accompanying Notes to Financial Statements.
| 36 | 2022 Semi-Annual Report |
Statement of Investments (concluded)
April 30, 2022 (Unaudited)
abrdn International Small Cap Fund
| Shares or Principal Amount | Value | |||||||
| COMMON STOCKS (continued) | ||||||||
| Information Technology (2.4%) | ||||||||
| Chroma ATE, Inc. | 1,135,000 | $ 6,309,439 | ||||||
| 11,318,914 | ||||||||
| UNITED KINGDOM (9.1%) | ||||||||
| Communication Services (1.2%) | ||||||||
| Future PLC | 112,300 | 3,075,694 | ||||||
| Consumer Discretionary (2.4%) | ||||||||
| Games Workshop Group PLC | 70,350 | 6,501,597 | ||||||
| Health Care (5.5%) | ||||||||
| Dechra Pharmaceuticals PLC | 195,326 | 8,851,265 | ||||||
| Genus PLC | 184,857 | 5,807,992 | ||||||
| 14,659,257 | ||||||||
| 24,236,548 | ||||||||
| UNITED STATES (3.4%) | ||||||||
| Health Care (3.4%) | ||||||||
| Inmode Ltd. (a) | 138,500 | 3,477,735 | ||||||
| PolyPeptide Group AG (b) | 62,300 | 5,451,858 | ||||||
| 8,929,593 | ||||||||
| VIETNAM (1.2%) | ||||||||
| Information Technology (1.2%) | ||||||||
| FPT Corp. | 680,700 | 3,090,779 | ||||||
| Total Common Stocks | 251,038,668 | |||||||
| PREFERRED STOCKS (2.7%) | ||||||||
| GERMANY (2.7%) | ||||||||
| Industrials (2.7%) | ||||||||
| Jungheinrich AG | 292,100 | 7,144,190 | ||||||
| Total Preferred Stocks | 7,144,190 | |||||||
| Shares or Principal Amount | Value | ||
| SHORT-TERM INVESTMENT (2.1%) | |||
| UNITED STATES (2.1%) | |||
| State Street Institutional U.S. Government Money Market Fund, Premier Class, 0.29% (c) | 5,452,275 | $ 5,452,275 | |
| Total Short-Term Investment | 5,452,275 | ||
| Total Investments (Cost $286,744,376) (d)—99.3% | 263,635,133 | ||
| Other Assets in Excess of Liabilities—0.7% | 1,853,785 | ||
| Net Assets—100.0% | $ 265,488,918 | ||
| (a) | Non-income producing security. |
| (b) | Denotes a security issued under Regulation S or Rule 144A. |
| (c) | Registered investment company advised by State Street Global Advisors. The rate shown is the 7 day yield as of April 30, 2022. |
| (d) | See accompanying Notes to Financial Statements for tax unrealized appreciation/(depreciation) of securities. |
ADR American Depositary Receipt
PLC Public Limited Company
See accompanying Notes to Financial Statements.
| 2022 Semi-Annual Report | 37 |
abrdn International Sustainable Leaders Fund (Unaudited)
| Average Annual Total Return1 (For periods ended April 30, 2022)* | Six Month† | 1 Yr. | 5 Yr. | 10 Yr. | |||||||
| Class A | w/o SC | (27.66%) | (20.46%) | 1.73% | 2.44% | ||||||
| w/ SC2 | (31.81%) | (25.04%) | 0.53% | 1.83% | |||||||
| Institutional Class3 | w/o SC | (27.59%) | (20.29%) | 1.98% | 2.69% |
| * | Performance shown for periods after December 16, 2016 reflect the Fund's receipt of payment from some European jurisdictions related to prior years (2005-2008) in accordance with European Union law under Article 63 of the Treaty on the Functioning of the European Union (the "Article 63 EU Tax Reclaims"). The receipt of these extraordinary payments increased the Fund's performance for all periods that include December 2016, February 2017, July 2017, October 2017, February 2019, March 2019 and September 2019 in a manner that may not recur in the future, and the Fund's performance was significantly higher than it would have been absent receipt of the Article 63 EU Tax Reclaims. At the time of receipt, those payments resulted in an increase in net assets of approximately 5.4% and 2.1%, in 2017 and 2019, respectively. Past returns would have been higher had the Fund not originally paid the withholding taxes that relate to the EU reclaims that are now being returned. There can be no assurance that the Fund will receive additional Article 63 EU Tax Reclaim payments or maintain this level of performance in the future. |
| † | Not annualized |
| 1 | Returns prior to December 3, 2021 reflect the performance of a predecessor fund (the "Predecessor Fund"). Returns of the Predecessor Fund have not been adjusted to reflect the expenses applicable to the respective classes. The Fund and the Predecessor Fund have substantially similar investment objectives and strategies. Please consult the Fund's prospectus for more detail. |
| 2 | A 5.75% front-end sales charge was deducted. |
| 3 | Not subject to any sales charges. |
Performance of a $10,000 Investment (as of April 30, 2022)

Comparative performance of $10,000 invested in Class A shares of the abrdn International Sustainable Leaders Fund, Morgan Stanley Capital International (MSCI) All Country World ex-USA Index (ACWI ex-USA) (Net Dividends) and the Consumer Price Index (CPI) over a 10-year period ended April 30, 2022. Unlike the Fund's returns, the
returns for these unmanaged indexes do not reflect any fees or expenses. Investors cannot invest directly in market indexes.
The MSCI ACWI ex-USA Index (Net Dividends) captures large and mid-cap representation across 22 of 23 Developed Markets (DM) countries (excluding the United States (U.S.) and 24 Emerging Markets (EM) countries). With 2,311 constituents, the index covers approximately 85% of the global equity opportunity set outside the U.S. DM countries include: Australia, Austria, Belgium, Canada, Denmark, Finland, France, Germany, Hong Kong, Ireland, Israel, Italy, Japan, Netherlands, New Zealand, Norway, Portugal, Singapore, Spain, Sweden, Switzerland and the UK. EM countries include: Brazil, Chile, China, Colombia, Czech Republic, Egypt, Greece, Hungary, India, Indonesia, Korea, Kuwait, Malaysia, Mexico, Peru, Philippines, Poland, Qatar, Saudi Arabia, South Africa, Taiwan, Thailand, Turkey and United Arab Emirates. The MSCI ACWI ex-USA Index (Net Dividends) is calculated net of withholding taxes to which the Fund is generally subject.
The CPI is a measure of the average change over time in the prices paid by urban consumers for a market basket of consumer goods and services.
Investment return and principal value will fluctuate, and when redeemed, shares may be worth more or less than original cost. Past performance is no guarantee of future results. The Average Annual Total Return table and performance graph do not reflect the deduction of taxes that a shareholder would pay on Fund distributions or the redemption of Fund shares. Investing in mutual funds involves market risk, including loss of principal. Performance returns assume the reinvestment of all distributions. Performance returns reflect fee waivers and reimbursements in effect, without which returns would have been lower.
| 38 | 2022 Semi-Annual Report |
abrdn International Sustainable Leaders Fund (Unaudited)
Portfolio Summary (as a percentage of net assets)
April 30, 2022 (Unaudited)
| Asset Allocation | ||
| Common Stocks | 109.9% | |
| Short-Term Investment | 1.4% | |
| Liabilities in Excess of Other Assets | (11.3%) | |
| 100.0% | ||
The following table summarizes the composition of the Fund's portfolio, in S&P Global Industry Classification Standard (GICS) sectors.
| Sectors | ||
| Health Care | 24.0% | |
| Information Technology | 19.6% | |
| Financials | 16.8% | |
| Consumer Staples | 14.8% | |
| Industrials | 11.7% | |
| Materials | 11.0% | |
| Consumer Discretionary | 6.6% | |
| Real Estate | 3.5% | |
| Utilities | 1.9% | |
| Short-Term Investment | 1.4% | |
| Liabilities in Excess of Other Assets | (11.3%) | |
| 100.0% | ||
| Top Ten Holdings | ||
| Cochlear Ltd. | 4.7% | |
| Genmab AS | 4.5% | |
| Nestle SA | 4.4% | |
| CSL Ltd. | 4.4% | |
| AIA Group Ltd. | 4.3% | |
| Taiwan Semiconductor Manufacturing Co. Ltd., ADR | 4.2% | |
| L'Oreal SA | 3.6% | |
| Raia Drogasil SA | 3.6% | |
| Housing Development Finance Corp. Ltd. | 3.5% | |
| Goodman Group, REIT | 3.5% | |
| Countries | ||
| Australia | 14.6% | |
| Denmark | 11.4% | |
| United Kingdom | 10.0% | |
| Japan | 9.5% | |
| Netherlands | 7.7% | |
| India | 5.6% | |
| Brazil | 5.4% | |
| Sweden | 5.0% | |
| Israel | 4.6% | |
| Switzerland | 4.4% | |
| Hong Kong | 4.3% | |
| Taiwan | 4.2% | |
| New Zealand | 4.0% | |
| France | 3.6% | |
| United States | 2.8% | |
| Singapore | 2.7% | |
| Germany | 2.6% | |
| China | 2.3% | |
| Canada | 2.1% | |
| South Korea | 2.1% | |
| Other, less than 2% each | 1.0% | |
| Short-Term Investment | 1.4% | |
| Liabilities in Excess of Other Assets | (11.3%) | |
| 100.0% | ||
| 2022 Semi-Annual Report | 39 |
Statement of Investments
April 30, 2022 (Unaudited)
abrdn International Sustainable Leaders Fund
| Shares | Value | |||||||
| COMMON STOCKS (109.9%) | ||||||||
| AUSTRALIA (14.6%) | ||||||||
| Financials (2.0%) | ||||||||
| Steadfast Group Ltd. | 550,267 | $ | 1,992,177 | |||||
| Health Care (9.1%) | ||||||||
| Cochlear Ltd. | 29,113 | 4,689,153 | ||||||
| CSL Ltd. | 22,776 | 4,346,802 | ||||||
| 9,035,955 | ||||||||
| Real Estate (3.5%) | ||||||||
| Goodman Group, REIT | 208,419 | 3,468,903 | ||||||
| 14,497,035 | ||||||||
| BELGIUM (1.0%) | ||||||||
| Industrials (1.0%) | ||||||||
| Azelis Group NV (a) | 39,800 | 980,210 | ||||||
| BRAZIL (5.4%) | ||||||||
| Consumer Discretionary (1.8%) | ||||||||
| MercadoLibre, Inc. (a) | 1,848 | 1,799,268 | ||||||
| Consumer Staples (3.6%) | ||||||||
| Raia Drogasil SA | 838,721 | 3,550,690 | ||||||
| 5,349,958 | ||||||||
| CANADA (2.1%) | ||||||||
| Financials (1.5%) | ||||||||
| CI Financial Corp. | 111,945 | 1,459,603 | ||||||
| Information Technology (0.6%) | ||||||||
| Shopify, Inc., Class A (a) | 1,546 | 659,863 | ||||||
| 2,119,466 | ||||||||
| CHINA (2.3%) | ||||||||
| Health Care (2.3%) | ||||||||
| Wuxi Biologics Cayman, Inc. (a)(b) | 305,500 | 2,254,838 | ||||||
| DENMARK (11.4%) | ||||||||
| Financials (2.8%) | ||||||||
| Tryg A/S | 116,242 | 2,763,898 | ||||||
| Health Care (4.5%) | ||||||||
| Genmab AS (a) | 12,677 | 4,457,759 | ||||||
| Information Technology (2.2%) | ||||||||
| SimCorp A/S | 30,727 | 2,151,093 | ||||||
| Utilities (1.9%) | ||||||||
| Orsted AS (b) | 17,083 | 1,889,899 | ||||||
| 11,262,649 | ||||||||
| FRANCE (3.6%) | ||||||||
| Consumer Staples (3.6%) | ||||||||
| L'Oreal SA | 9,873 | 3,591,895 | ||||||
| Shares | Value | |||||||
| GERMANY (2.6%) | ||||||||
| Materials (2.6%) | ||||||||
| Linde PLC (a) | 8,333 | $ | 2,613,542 | |||||
| HONG KONG (4.3%) | ||||||||
| Financials (4.3%) | ||||||||
| AIA Group Ltd. | 436,200 | 4,285,124 | ||||||
| INDIA (5.6%) | ||||||||
| Financials (3.5%) | ||||||||
| Housing Development Finance Corp. Ltd. | 120,969 | 3,485,964 | ||||||
| Materials (2.1%) | ||||||||
| Asian Paints Ltd. | 50,065 | 2,111,718 | ||||||
| 5,597,682 | ||||||||
| ISRAEL (4.6%) | ||||||||
| Consumer Staples (3.2%) | ||||||||
| Strauss Group Ltd. | 119,358 | 3,190,570 | ||||||
| Industrials (1.4%) | ||||||||
| Kornit Digital Ltd. (a) | 20,400 | 1,356,600 | ||||||
| 4,547,170 | ||||||||
| JAPAN (9.5%) | ||||||||
| Consumer Discretionary (2.3%) | ||||||||
| Sony Group Corp. | 26,200 | 2,261,086 | ||||||
| Health Care (3.0%) | ||||||||
| Chugai Pharmaceutical Co. Ltd. | 98,400 | 2,948,570 | ||||||
| Industrials (1.8%) | ||||||||
| Nabtesco Corp. | 80,200 | 1,829,169 | ||||||
| Information Technology (2.4%) | ||||||||
| Keyence Corp. | 6,000 | 2,412,025 | ||||||
| 9,450,850 | ||||||||
| LATVIA (0.0%) | ||||||||
| Financials (0.0%) | ||||||||
| AS Parex Banka (a)(c)(d)(e) | 1,424,182 | – | ||||||
| NETHERLANDS (7.7%) | ||||||||
| Information Technology (4.6%) | ||||||||
| Adyen NV (a)(b) | 978 | 1,640,393 | ||||||
| ASML Holding NV | 5,093 | 2,890,473 | ||||||
| 4,530,866 | ||||||||
| Materials (3.1%) | ||||||||
| Koninklijke DSM NV | 18,441 | 3,100,109 | ||||||
| 7,630,975 | ||||||||
| NEW ZEALAND (4.0%) | ||||||||
| Health Care (2.4%) | ||||||||
| Fisher & Paykel Healthcare Corp. Ltd. | 169,421 | 2,341,788 | ||||||
See accompanying Notes to Financial Statements.
| 40 | 2022 Semi-Annual Report |
Statement of Investments (concluded)
April 30, 2022 (Unaudited)
abrdn International Sustainable Leaders Fund
| Shares | Value | |||||||
| COMMON STOCKS (continued) | ||||||||
| Information Technology (1.6%) | ||||||||
| Xero Ltd. (a) | 24,174 | $ | 1,594,085 | |||||
| 3,935,873 | ||||||||
| SINGAPORE (2.7%) | ||||||||
| Financials (2.7%) | ||||||||
| DBS Group Holdings Ltd. | 109,000 | 2,644,407 | ||||||
| SOUTH KOREA (2.1%) | ||||||||
| Information Technology (2.1%) | ||||||||
| Samsung SDI Co. Ltd. | 4,298 | 2,047,371 | ||||||
| SWEDEN (5.0%) | ||||||||
| Consumer Discretionary (2.5%) | ||||||||
| Thule Group AB (b) | 71,014 | 2,463,270 | ||||||
| Industrials (2.5%) | ||||||||
| Atlas Copco AB, A Shares (a) | 54,299 | 2,461,746 | ||||||
| 4,925,016 | ||||||||
| SWITZERLAND (4.4%) | ||||||||
| Consumer Staples (4.4%) | ||||||||
| Nestle SA | 33,873 | 4,372,804 | ||||||
| TAIWAN (4.2%) | ||||||||
| Information Technology (4.2%) | ||||||||
| Taiwan Semiconductor Manufacturing Co. Ltd., ADR | 44,263 | 4,113,361 | ||||||
| UNITED KINGDOM (10.0%) | ||||||||
| Health Care (2.7%) | ||||||||
| Dechra Pharmaceuticals PLC | 59,540 | 2,698,076 | ||||||
| Industrials (2.2%) | ||||||||
| Spirax-Sarco Engineering PLC | 14,213 | 2,144,678 | ||||||
| Information Technology (1.9%) | ||||||||
| AVEVA Group PLC | 70,456 | 1,893,580 | ||||||
| Materials (3.2%) | ||||||||
| Croda International PLC | 32,231 | 3,130,486 | ||||||
| 9,866,820 | ||||||||
| UNITED STATES (2.8%) | ||||||||
| Industrials (2.8%) | ||||||||
| Schneider Electric SE | 19,100 | 2,740,260 | ||||||
| Total Common Stocks | 108,827,306 | |||||||
| Shares | Value | |||||||
| SHORT-TERM INVESTMENT (1.4%) | ||||||||
| UNITED STATES (1.4%) | ||||||||
| State Street Institutional U.S. Government Money Market Fund, Premier Class, 0.29% (f) | 1,348,952 | $ | 1,348,952 | |||||
| Total Short-Term Investment | 1,348,952 | |||||||
| Total Investments (Cost $133,053,615) (g)—111.3% | 110,176,258 | |||||||
| Liabilities in Excess of Other Assets—(11.3)% | (11,153,479 | ) | ||||||
| Net Assets—100.0% | $ | 99,022,779 | ||||||
| (a) | Non-income producing security. |
| (b) | Denotes a security issued under Regulation S or Rule 144A. |
| (c) | Illiquid security. |
| (d) | The Fund's adviser has deemed this security to be illiquid based upon procedures approved by the Board of Trustees. Illiquid securities held by the Fund represent 0.00% of net assets as of April 30, 2022. |
| (e) | Level 3 security. See Note 2(a) of the accompanying Notes to Financial Statements. |
| (f) | Registered investment company advised by State Street Global Advisors. The rate shown is the 7 day yield as of April 30, 2022. |
| (g) | See accompanying Notes to Financial Statements for tax unrealized appreciation/(depreciation) of securities. |
ADR American Depositary Receipt
PLC Public Limited Company
REIT Real Estate Investment Trust
See accompanying Notes to Financial Statements.
| 2022 Semi-Annual Report | 41 |
abrdn Realty Income & Growth Fund (Unaudited)
| Average Annual Total Return1 (For periods ended April 30, 2022) | Six Month† | 1 Yr. | 5 Yr. | 10 Yr. | |||||||||||||||
| Class A | w/o SC | (1.72%) | 10.16% | 8.23% | 8.81% | ||||||||||||||
| w/ SC2 | (7.39%) | 3.80% | 9.96% | 8.17% | |||||||||||||||
| Institutional Class3 | w/o SC | (1.62%) | 10.44% | 8.50% | 9.08% | ||||||||||||||
All figures showing the effect of a sales charge (SC) reflect the maximum charge possible because it has the most significant effect on performance data. The total returns shown above do not include the impact of financial statement rounding of the net asset value (NAV) per share and/or financial statement adjustments.
| † | Not annualized |
| 1 | Returns prior to May 7, 2018 reflect the performance of a predecessor fund (the "Predecessor Fund"). Returns of the Predecessor Fund have not been adjusted to reflect the expenses applicable to the respective classes. The Fund and the Predecessor Fund have substantially similar investment objectives and strategies. Please consult the Fund's prospectus for more detail. |
| 2 | A 5.75% front-end sales charge was deducted. |
| 3 | Not subject to any sales charges. |
Performance of a $1,000,000 Investment* (as of April 30, 2022)
* Minimum Initial Investment
Comparative performance of $1,000,000 invested in Institutional Class shares of the abrdn Realty Income and Growth Fund, the Morgan Stanley Capital International (MSCI) US REIT Index, the S&P 500® Index and the Consumer Price Index (CPI) over a 10-year period ended April 30, 2022. Unlike the Fund, the returns for these | unmanaged indexes do not reflect any fees, expenses or sales charges. Investors cannot invest directly in market indexes.
The MSCI US REIT Index is a free float-adjusted market capitalization weighted index that is comprised of equity Real Estate Investment Trusts (REITs). The index is based on the MSCI USA Investable Market Index (IMI), its parent index, which captures the large, mid and small cap segments of the USA market. With 133 constituents, it represents about 99% of the US REIT universe and securities are classified under the Equity REITs Industry (under the Real Estate Sector) according to the Global Industry Classification Standard (GICS®), have core real estate exposure (i.e., only selected Specialized REITs are eligible) and carry REIT tax status. This index reinvests as much as possible of a company's dividend distributions. The reinvested amount is equal to the total dividend amount distributed to persons residing in the country of the dividend-paying company. Gross total return indexes do not, however, include any tax credits.
The S&P 500® Index represents large-cap U.S. equities. The index includes 500 leading companies and captures approximately 80% coverage of available U.S. market capitalization.
The CPI is a measure of the average change over time in the prices paid by urban consumers for a market basket of consumer goods and services. |

Investment return and principal value will fluctuate, and when redeemed, shares may be worth more or less than original cost. Past performance is no guarantee of future results. The Average Annual Total Return table and Performance graph do not reflect the deduction of taxes that a shareholder would pay on fund distributions or the redemption of fund shares. Investing in mutual funds involves market risk, including loss of principal. Performance returns assume the reinvestment of all distributions. Total returns reflect waivers and reimbursements in effect, without which returns would have been lower.
| 42 | 2022 Semi-Annual Report |
abrdn Realty Income & Growth Fund (Unaudited)
Portfolio Summary (as a percentage of net assets)
April 30, 2022 (Unaudited)
| Asset Allocation | ||
| Common Stocks | 98.2% | |
| Short-Term Investment | 2.1% | |
| Liabilities in Excess of Other Assets | (0.3%) | |
| 100.0% | ||
The following table summarizes the composition of the Fund's portfolio, in S&P Global Industry Classification Standard (GICS) sectors, expressed as a percentage of net assets as of April 30, 2022.
| Sub-Industries | ||
| Specialized REITs | 23.3% | |
| Residential REITs | 21.1% | |
| Industrial REITs | 16.6% | |
| Retail REITs | 16.3% | |
| Office REITs | 9.0% | |
| Health Care REITs | 7.3% | |
| Hotel & Resort REITs | 3.7% | |
| Diversified REITs | 0.9% | |
| Short- Term Invesment | 2.1% | |
| Liabilities in Excess of Other Assets | (0.3%) | |
| 100.0% | ||
| Top Ten Holdings | ||
| Prologis, Inc., REIT | 11.4% | |
| Public Storage | 6.0% | |
| Equinix, Inc. | 5.2% | |
| Welltower, Inc. | 4.3% | |
| Realty Income Corp., REIT | 4.0% | |
| Equity Residential, REIT | 4.0% | |
| AvalonBay Communities, Inc. | 3.7% | |
| Simon Property Group, Inc., REIT | 3.7% | |
| Mid-America Apartment Communities, Inc., REIT | 3.1% | |
| Invitation Homes, Inc. | 3.0% | |
| Countries | ||
| United States | 98.2% | |
| Short-Term Investment | 2.1% | |
| Liabilities in Excess of Other Assets | (0.3%) | |
| 100.0% | ||
| 2022 Semi-Annual Report | 43 |
Statement of Investments
April 30, 2022 (Unaudited)
abrdn Realty Income & Growth Fund
| Shares or Principal Amount | Value | |||||
| COMMON STOCKS (98.2%) | ||||||
| UNITED STATES (98.2%) | ||||||
| Diversified REITs (0.9%) | ||||||
| STORE Capital Corp. | 17,427 | $ | 495,450 | |||
| Health Care REITs (7.3%) | ||||||
| Omega Healthcare Investors, Inc. | 16,821 | 428,599 | ||||
| Ventas, Inc. | 21,353 | 1,186,159 | ||||
| Welltower, Inc. | 25,158 | 2,284,598 | ||||
| 3,899,356 | ||||||
| Hotel & Resort REITs (3.7%) | ||||||
| DiamondRock Hospitality Co. (a) | 66,633 | 707,642 | ||||
| Host Hotels & Resorts, Inc. | 64,040 | 1,303,214 | ||||
| 2,010,856 | ||||||
| Industrial REITs (16.6%) | ||||||
| Duke Realty Corp. | 29,371 | 1,608,062 | ||||
| Prologis, Inc. | 37,989 | 6,089,257 | ||||
| STAG Industrial, Inc. | 31,520 | 1,176,327 | ||||
| 8,873,646 | ||||||
| Office REITs (9.0%) | ||||||
| Boston Properties, Inc. | 13,042 | 1,533,739 | ||||
| Cousins Properties, Inc. | 24,224 | 869,642 | ||||
| Highwoods Properties, Inc. | 17,738 | 724,420 | ||||
| Kilroy Realty Corp. | 14,570 | 1,019,900 | ||||
| SL Green Realty Corp. | 10,183 | 704,867 | ||||
| 4,852,568 | ||||||
| Residential REITs (21.1%) | ||||||
| American Homes 4 Rent | 21,324 | 844,644 | ||||
| AvalonBay Communities, Inc. | 8,736 | 1,987,265 | ||||
| Camden Property Trust | 8,760 | 1,374,356 | ||||
| Equity LifeStyle Properties, Inc. | 3,895 | 301,006 | ||||
| Equity Residential | 25,936 | 2,113,784 | ||||
| Invitation Homes, Inc. | 40,912 | 1,629,116 | ||||
| Mid-America Apartment Communities, Inc. | 8,559 | 1,683,384 | ||||
| Sun Communities, Inc. | 7,806 | 1,370,499 | ||||
| 11,304,054 | ||||||
| Retail REITs (16.3%) | ||||||
| Brixmor Property Group, Inc. | 35,109 | 891,066 | ||||
| Kimco Realty Corp. | 47,525 | 1,203,808 | ||||
| National Retail Properties, Inc. | 23,095 | 1,012,485 | ||||
| Realty Income Corp. | 30,775 | 2,134,554 | ||||
| Simon Property Group, Inc. | 16,643 | 1,963,874 | ||||
| SITE Centers Corp. | 46,723 | 742,896 | ||||
| Spirit Realty Capital, Inc. | 17,610 | 765,155 | ||||
| 8,713,838 | ||||||
| Specialized REITs (23.3%) | ||||||
| American Tower Corp. | 1,117 | 269,219 | ||||
| Digital Realty Trust, Inc. | 10,066 | 1,470,844 | ||||
| Equinix, Inc. | 3,904 | 2,807,288 | ||||
| Extra Space Storage, Inc. | 8,422 | 1,600,180 | ||||
| Gaming & Leisure Properties, Inc. | 19,036 | 844,818 | ||||
| Shares or Principal Amount | Value | |||||
| Life Storage, Inc. | 8,266 | $ | 1,095,162 | |||
| Public Storage | 8,677 | 3,223,506 | ||||
| SBA Communications Corp. | 1,619 | 561,971 | ||||
| VICI Properties, Inc. | 20,310 | 605,432 | ||||
| 12,478,420 | ||||||
| 52,628,188 | ||||||
| Total Common Stocks | 52,628,188 | |||||
| SHORT-TERM INVESTMENT (2.1%) | ||||||
| United States (2.1%) | ||||||
| State Street Institutional U.S. Government Money Market Fund, Premier Class, 0.29% (b) | 1,104,245 | 1,104,245 | ||||
| Total Short-Term Investment | 1,104,245 | |||||
| Total Investments (Cost $37,414,738) (c)—100.3% | 53,732,433 | |||||
| Liabilities in Excess of Other Assets—(0.3)% | (153,141 | ) | ||||
| Net Assets—100.0% | $ | 53,579,292 | ||||
| (a) | Non-income producing security. |
| (b) | Registered investment company advised by State Street Global Advisors. The rate shown is the 7 day yield as of April 30, 2022. |
| (c) | See accompanying Notes to Financial Statements for tax unrealized appreciation/(depreciation) of securities. |
| REIT | Real Estate Investment Trust |
See accompanying Notes to Financial Statements.
| 44 | 2022 Semi-Annual Report |
abrdn U.S. Small Cap Equity Fund (Unaudited)
| Average Annual Total Return (For periods ended April 30, 2022) | Six Month† | 1 Yr. | 5 Yr. | 10 Yr. | |||||||||||
| Class A | w/o SC | (21.98%) | (12.32%) | 9.13% | 12.26% | ||||||||||
| w/ SC1 | (26.46%) | (17.36%) | 7.85% | 11.60% | |||||||||||
| Class C | w/o SC | (22.25%) | (12.93%) | 8.39% | 11.50% | ||||||||||
| w/ SC2 | (22.83%) | (13.58%) | 8.39% | 11.50% | |||||||||||
| Class R3 | w/o SC | (22.11%) | (12.61%) | 8.76% | 11.94% | ||||||||||
| Institutional Service Class3 | w/o SC | (21.90%) | (12.14%) | 9.41% | 12.57% | ||||||||||
| Institutional Class3 | w/o SC | (21.85%) | (12.03%) | 9.49% | 12.63% | ||||||||||
All figures showing the effect of a sales charge (SC) reflect the maximum charge possible because it has the most significant effect on performance data. The total returns shown above do not include the impact of financial statement rounding of the net asset value (NAV) per share and/or financial statement adjustments.
| † | Not annualized |
| 1 | A 5.75% front-end sales charge was deducted. |
| 2 | A 1.00% contingent deferred sales charge (CDSC) was deducted from the one year return because it is charged when Class C shares are sold within the first year after purchase. |
| 3 | Not subject to any sales charges. |
Performance of a $1,000,000 Investment (as of April 30, 2022)
Comparative performance of $1,000,000 invested in Institutional Class shares of the abrdn U.S. Small Cap Equity Fund, the | Russell 2000® Index and the Consumer Price Index (CPI) over a 10-year period ended April 30, 2022. Unlike the Fund, the returns for these unmanaged indexes do not reflect any fees, expenses, or sales charges. Investors cannot invest directly in market indexes.
The Russell 2000® Index measures performance of the small-cap segment of the U.S. equity universe. It is a subset of the Russell 3000® Index and it represents approximately 10% of the U.S. market. It includes approximately 2000 of the smallest securities based on a combination of their market cap and current index membership. The Russell 2000® Index is constructed to provide a comprehensive and unbiased barometer for the small-cap segment and is completely reconstituted annually to ensure larger stocks do not distort the performance and characteristics of the true small-cap opportunity set.
The CPI is a measure of the average change over time in the prices paid by urban consumers for a market basket of consumer goods and services. |
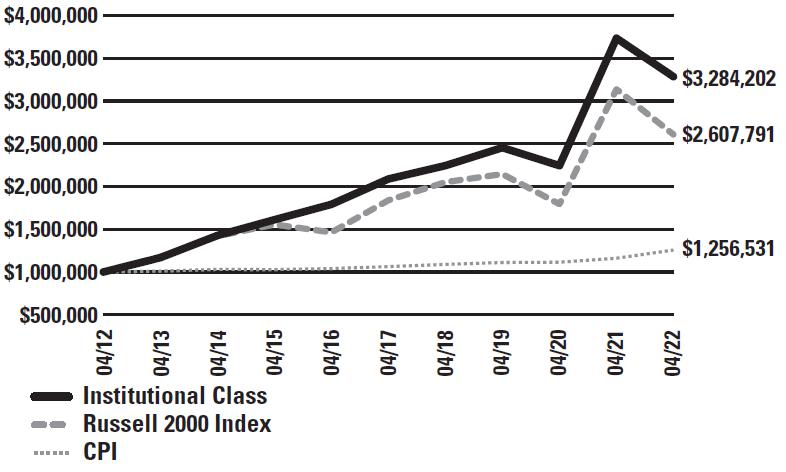
Investment return and principal value will fluctuate, and when redeemed, shares may be worth more or less than original cost. Past performance is no guarantee of future results. The Average Annual Total Return table and Performance graph do not reflect the deduction of taxes that a shareholder would pay on fund distributions or the redemption of fund shares. Investing in mutual funds involves market risk, including loss of principal. Performance returns assume the reinvestment of all distributions. Total returns reflect waivers and reimbursements in effect, without which returns would have been lower.
| 2022 Semi-Annual Report | 45 |
abrdn U.S. Small Cap Equity Fund (Unaudited)
Portfolio Summary (as a percentage of net assets)
April 30, 2022 (Unaudited)
| Asset Allocation | ||
| Common Stocks | 99.2% | |
| Short-Term Investment | 1.0% | |
| Liabilities in Excess of Other Assets | (0.2%) | |
| 100.0% | ||
The following table summarizes the composition of the Fund's portfolio, in S&P Global Industry Classification Standard (GICS) sectors.
| Sectors | ||
| Industrials | 23.0% | |
| Financials | 18.7% | |
| Information Technology | 15.2% | |
| Consumer Discretionary | 14.1% | |
| Health Care | 8.7% | |
| Materials | 8.7% | |
| Consumer Staples | 5.6% | |
| Communication Services | 3.1% | |
| Utilities | 1.1% | |
| Energy | 1.0% | |
| Short-Term Investment | 1.0% | |
| Liabilities in Excess of Other Assets | (0.2%) | |
| 100.0% | ||
| Top Ten Holdings | ||
| Atkore, Inc. | 3.1% | |
| Materion Corp. | 3.0% | |
| Stride, Inc. | 2.8% | |
| Verint Systems, Inc. | 2.8% | |
| Dorman Products, Inc. | 2.7% | |
| Graphic Packaging Holding Co. | 2.6% | |
| Hostess Brands, Inc. | 2.5% | |
| First Interstate BancSystem, Inc., Class A | 2.4% | |
| PRA Group, Inc. | 2.4% | |
| WNS Holdings Ltd., ADR | 2.3% | |
| Countries | ||
| United States | 88.5% | |
| Canada | 6.6% | |
| India | 2.2% | |
| Israel | 1.9% | |
| Short-Term Investment | 1.0% | |
| Liabilities in Excess of Other Assets | (0.2%) | |
| 100.0% | ||
| 46 | 2022 Semi-Annual Report |
Statement of Investments
April 30, 2022 (Unaudited)
abrdn U.S. Small Cap Equity Fund
| Shares or Principal Amount | Value | |||
| COMMON STOCKS (99.2%) | ||||
| CANADA (6.6%) | ||||
| Consumer Discretionary (1.4%) | ||||
| Aritzia, Inc. (a) | 345,656 | $ 12,309,782 | ||
| Consumer Staples (1.5%) | ||||
| Jamieson Wellness, Inc. (b) | 507,478 | 12,759,537 | ||
| Financials (2.7%) | ||||
| CI Financial Corp. | 1,291,360 | 16,837,489 | ||
| TMX Group Ltd. | 66,435 | 6,763,736 | ||
| 23,601,225 | ||||
| Industrials (1.0%) | ||||
| ATS Automation Tooling Systems, Inc. (a) | 306,014 | 8,930,421 | ||
| 57,600,965 | ||||
| INDIA (2.2%) | ||||
| Information Technology (2.2%) | ||||
| WNS Holdings Ltd., ADR (a) | 252,070 | 19,754,726 | ||
| ISRAEL (1.9%) | ||||
| Information Technology (1.9%) | ||||
| CyberArk Software Ltd. (a) | 106,381 | 16,716,710 | ||
| UNITED STATES (88.5%) | ||||
| Communication Services (3.1%) | ||||
| Cogent Communications Holdings, Inc. | 251,735 | 14,726,497 | ||
| TechTarget, Inc. (a) | 181,161 | 12,193,947 | ||
| 26,920,444 | ||||
| Consumer Discretionary (12.7%) | ||||
| Dorman Products, Inc. (a) | 235,143 | 23,213,317 | ||
| Fiverr International Ltd. (a) | 204,204 | 10,873,863 | ||
| LCI Industries | 141,247 | 13,746,158 | ||
| LGI Homes, Inc. (a) | 143,326 | 13,431,080 | ||
| Monro, Inc. | 194,837 | 8,909,896 | ||
| National Vision Holdings, Inc. (a) | 434,293 | 16,351,131 | ||
| Stride, Inc. (a) | 627,457 | 24,659,060 | ||
| 111,184,505 | ||||
| Consumer Staples (4.1%) | ||||
| elf Beauty, Inc. (a) | 559,496 | 13,612,538 | ||
| Hostess Brands, Inc. (a) | 975,929 | 22,143,829 | ||
| 35,756,367 | ||||
| Energy (1.0%) | ||||
| ChampionX Corp. | 406,492 | 8,576,981 | ||
| Financials (16.0%) | ||||
| Axos Financial, Inc. (a) | 326,622 | 12,372,441 | ||
| Donnelley Financial Solutions, Inc. (a) | 454,965 | 13,316,826 | ||
| First Interstate BancSystem, Inc., Class A | 646,160 | 21,013,123 | ||
| Hannon Armstrong Sustainable Infrastructure Capital, Inc. | 321,726 | 12,865,823 | ||
| Shares or Principal Amount | Value | |||
| Live Oak Bancshares, Inc. | 288,279 | $ 12,202,850 | ||
| PJT Partners, Inc., Class A | 244,945 | 16,163,921 | ||
| PRA Group, Inc. (a) | 492,232 | 20,688,511 | ||
| Seacoast Banking Corp. of Florida | 544,382 | 17,692,415 | ||
| Wintrust Financial Corp. | 164,270 | 14,344,056 | ||
| 140,659,966 | ||||
| Health Care (8.7%) | ||||
| CONMED Corp. | 106,887 | 14,211,696 | ||
| CryoPort, Inc. (a) | 342,275 | 7,721,724 | ||
| Health Catalyst, Inc. (a) | 590,571 | 9,827,101 | ||
| Heska Corp. (a) | 130,912 | 14,379,374 | ||
| Integer Holdings Corp. (a) | 245,353 | 18,443,185 | ||
| Ligand Pharmaceuticals, Inc. (a) | 130,718 | 12,138,474 | ||
| 76,721,554 | ||||
| Industrials (22.0%) | ||||
| Ameresco, Inc., Class A (a) | 309,842 | 15,628,431 | ||
| ArcBest Corp. | 196,633 | 14,189,037 | ||
| ASGN, Inc. (a) | 86,367 | 9,798,336 | ||
| Atkore, Inc. (a) | 284,601 | 27,350,156 | ||
| Brady Corp., Class A | 314,194 | 14,060,182 | ||
| Casella Waste Systems, Inc., Class A (a) | 230,346 | 18,943,655 | ||
| EnPro Industries, Inc. | 143,325 | 13,359,323 | ||
| Helios Technologies, Inc. | 214,096 | 14,382,969 | ||
| Hub Group, Inc., Class A (a) | 251,400 | 16,884,024 | ||
| Mercury Systems, Inc. (a) | 107,917 | 6,020,689 | ||
| RBC Bearings, Inc. (a) | 90,929 | 15,307,897 | ||
| Shyft Group, Inc. | 503,619 | 12,827,176 | ||
| Werner Enterprises, Inc. | 346,468 | 13,730,527 | ||
| 192,482,402 | ||||
| Information Technology (11.1%) | ||||
| Cohu, Inc. (a) | 623,857 | 16,569,642 | ||
| Domo, Inc.,Class B (a) | 274,751 | 11,380,187 | ||
| Onto Innovation, Inc. (a) | 220,031 | 15,653,006 | ||
| Perficient, Inc. (a) | 194,503 | 19,335,543 | ||
| Verint Systems, Inc. (a) | 449,054 | 24,500,386 | ||
| Workiva, Inc. (a) | 103,432 | 9,982,222 | ||
| 97,420,986 | ||||
| Materials (8.7%) | ||||
| Graphic Packaging Holding Co. | 1,049,829 | 22,886,272 | ||
| Kaiser Aluminum Corp. | 161,657 | 15,599,900 | ||
| Materion Corp. | 310,066 | 26,402,120 | ||
| Ranpak Holdings Corp. (a) | 731,533 | 11,031,518 | ||
| 75,919,810 | ||||
| Utilities (1.1%) | ||||
| ONE Gas, Inc. | 110,557 | 9,327,694 | ||
| 774,970,709 | ||||
| Total Common Stocks | 869,043,110 |
See accompanying Notes to Financial Statements.
| 2022 Semi-Annual Report | 47 |
Statement of Investments (concluded)
April 30, 2022 (Unaudited)
abrdn U.S. Small Cap Equity Fund
| Shares or Principal Amount | Value | |||
| SHORT-TERM INVESTMENT (1.0%) | ||||
| State Street Institutional U.S. Government Money Market Fund, Premier Class, 0.29% (c) | $8,736,654 | $ 8,736,654 | ||
| Total Short-Term Investment | 8,736,654 | |||
| Total Investments (Cost $976,565,931) (d)—100.2% | 877,779,764 | |||
| Liabilities in Excess of Other Assets—(0.2)% | (2,115,844) | |||
| Net Assets—100.0% | $875,663,920 |
(a) Non-income producing security.
(b) Denotes a security issued under Regulation S or Rule 144A.
| (c) | Registered investment company advised by State Street Global Advisors. The rate shown is the 7 day yield as of April 30, 2022. |
| (d) | See accompanying Notes to Financial Statements for tax unrealized appreciation/(depreciation) of securities. |
ADR American Depositary Receipt
See accompanying Notes to Financial Statements.
| 48 | 2022 Semi-Annual Report |
abrdn U.S. Sustainable Leaders Fund (Unaudited)
| Average Annual Total Return1 (For periods ended April 30, 2022) | Six Month† | 1 Yr. | 5 Yr. | 10 Yr. | ||||||
| Class A | w/o SC | (18.37%) | (7.59%) | 12.78% | 11.42% | |||||
| w/ SC2 | (23.08%) | (12.89%) | 11.45% | 10.76% | ||||||
| Class C | w/o SC | (18.69%) | (8.37%) | 11.94% | 10.60% | |||||
| w/ SC3 | (19.24%) | (9.00%) | 11.94% | 10.60% | ||||||
| Institutional Service Class4 | w/o SC | (18.31%) | (7.44%) | 13.01% | 11.64% | |||||
| Institutional Class4 | w/o SC | (18.35%) | (7.40%) | 13.07% | 11.73% |
All figures showing the effect of a sales charge (SC) reflect the maximum charge possible because it has the most significant effect on performance data. The total returns shown above do not include the impact of financial statement rounding of the net asset value (NAV) per share and/or financial statement adjustments.
| † | Not annualized |
| 1 | The Fund changed its investment strategies effective December 1, 2020. Performance information for periods prior to December 1, 2020 does not reflect the current investment strategy. In connection with the change in investment strategy, the Fund changed its name from Aberdeen U.S. Multi-Cap Equity Fund to abrdn U.S. Sustainable Leaders Fund. Returns prior to October 9, 2011 reflect the performance of a predecessor fund (the "Predecessor Fund"). Returns of the Predecessor Fund have not been adjusted to reflect the expenses applicable to the respective classes. Please consult the Fund's prospectus for more detail. |
| 2 | A 5.75% front-end sales charge was deducted. |
| 3 | A 1.00% contingent deferred sales charge (CDSC) was deducted from the one year return because it is charged when Class C shares are sold within the first year after purchase. |
| 4 | Not subject to any sales charges. |
Performance of a $10,000 Investment (as of April 30, 2022)

Comparative performance of $10,000 invested in Class A shares of the abrdn U.S. Sustainable Leaders Fund, Russell 3000® Index, Russell 3000® Growth Index and the Consumer Price Index (CPI) over a 10-year period ended April 30, 2022. Unlike the Fund, the returns for these unmanaged indexes do not reflect any fees, expenses, or sales charges. Investors cannot invest directly in market indexes.
The Russell 3000® Index measures the performance of the largest 3,000 U.S. companies representing approximately 97% of the investable U.S. equity market. The Russell 3000® Index is constructed to provide a comprehensive, unbiased, and stable barometer of the broad market and is completely reconstituted annually to ensure new and growing equities are reflected.
The Russell 3000® Growth Index measures the performance of the broad growth segment of the U.S. equity universe. It includes those Russell 3000® companies with relatively higher price-to-book ratios, higher I/B/E/S forecast medium term (2 year) growth and higher sales per share historical growth (5 years). The Russell 3000® Growth Index is constructed to provide a comprehensive, unbiased and stable barometer of the broad growth market. The index is completely reconstituted annually to ensure new and growing equities are included and that the represented companies continue to reflect growth characteristics.
The CPI is a measure of the average change over time in the prices paid by urban consumers for a market basket of consumer goods and services.
Investment return and principal value will fluctuate, and when redeemed, shares may be worth more or less than original cost. Past performance is no guarantee of future results. The Average Annual Total Return table and Performance graph do not reflect the deduction of taxes that a shareholder would pay on fund distributions or the redemption of fund shares. Investing in mutual funds involves market risk, including loss of principal. Performance returns assume the reinvestment of all distributions. Total returns reflect waivers and reimbursements in effect, without which returns would have been lower.
| 2022 Semi-Annual Report | 49 |
abrdn U.S. Sustainable Leaders Fund (Unaudited)
Portfolio Summary (as a percentage of net assets)
April 30, 2022 (Unaudited)
| Asset Allocation | ||
| Common Stocks | 98.2% | |
| Short-Term Investment | 1.8% | |
| Liabilities in Excess of Other Assets | –% | |
| 100.0% |
The following table summarizes the composition of the Fund's portfolio, in S&P Global Industry Classification Standard (GICS) sectors, expressed as a percentage of net assets as of April 30, 2022.
| Sectors | ||
| Information Technology | 28.5%* | |
| Industrials | 18.2% | |
| Financials | 14.3% | |
| Health Care | 11.5% | |
| Consumer Discretionary | 6.3% | |
| Consumer Staples | 5.4% | |
| Materials | 5.0% | |
| Utilities | 4.3% | |
| Energy | 3.0% | |
| Communication Services | 1.7% | |
| Short-Term Investment | 1.8% | |
| Liabilities in Excess of Other Assets | –% | |
| 100.0% | ||
| * | As of April 30, 2022, the Fund's holdings in the Information Technology sector were allocated to three industries: Software (14.3%), Information Technology Services (10.0%) and Semiconductors & Semiconductor Equipment (4.2%) |
| Top Ten Holdings | ||
| Microsoft Corp. | 9.5% | |
| Mastercard, Inc., Class A | 4.4% | |
| LPL Financial Holdings, Inc. | 3.8% | |
| American Express Co. | 3.8% | |
| Tetra Tech, Inc. | 3.6% | |
| Akamai Technologies, Inc. | 3.5% | |
| ICON PLC | 3.4% | |
| Atkore, Inc. | 3.4% | |
| NICE Ltd., ADR | 3.3% | |
| Horizon Therapeutics PLC | 3.1% |
| Countries | ||
| United States | 81.9% | |
| Canada | 9.6% | |
| Ireland | 3.4% | |
| Israel | 3.3% | |
| Short-Term Investment | 1.8% | |
| Liabilities in Excess of Other Assets | –% | |
| 100.0% | ||
Amounts listed as "–" are 0% or round to 0%.
| 50 | 2022 Semi-Annual Report |
Statement of Investments
April 30, 2022 (Unaudited)
abrdn U.S. Sustainable Leaders Fund
| Shares or Principal Amount | Value | |||
| COMMON STOCKS (98.2%) | ||||
| CANADA (9.6%) | ||||
| Consumer Staples (2.9%) | ||||
| Jamieson Wellness, Inc. (a) | 446,372 | $ 11,223,147 | ||
| Financials (2.6%) | ||||
| CI Financial Corp. | 790,952 | 10,312,884 | ||
| INDUSTRIALS (4.1%) | ||||
| ATS Automation Tooling Systems, Inc. (b) | 164,500 | 4,800,611 | ||
| Canadian National Railway Co. | 97,492 | 11,467,009 | ||
| 16,267,620 | ||||
| 37,803,651 | ||||
| IRELAND (3.4%) | ||||
| Health Care (3.4%) | ||||
| ICON PLC (b) | 59,706 | 13,506,094 | ||
| ISRAEL (3.3%) | ||||
| Information Technology (3.3%) | ||||
| NICE Ltd., ADR (b) | 62,974 | 12,998,464 | ||
| UNITED STATES (81.9%) | ||||
| Communication Services (1.7%) | ||||
| Cable One, Inc. | 5,903 | 6,884,079 | ||
| Consumer Discretionary (6.3%) | ||||
| Burlington Stores, Inc. (b) | 56,701 | 11,542,056 | ||
| Hanesbrands, Inc. | 301,148 | 3,993,222 | ||
| Pool Corp. | 22,950 | 9,299,799 | ||
| 24,835,077 | ||||
| Consumer Staples (2.5%) | ||||
| Colgate-Palmolive Co. | 131,123 | 10,103,027 | ||
| Energy (3.0%) | ||||
| New Fortress Energy, Inc. | 305,819 | 11,859,661 | ||
| Financials (11.7%) | ||||
| American Express Co. | 86,465 | 15,106,300 | ||
| Hannon Armstrong Sustainable Infrastructure Capital, Inc. | 131,722 | 5,267,563 | ||
| Huntington Bancshares, Inc. | 477,138 | 6,274,365 | ||
| Live Oak Bancshares, Inc. | 105,883 | 4,482,027 | ||
| LPL Financial Holdings, Inc. | 80,505 | 15,124,474 | ||
| 46,254,729 | ||||
| Health Care (8.1%) | ||||
| CONMED Corp. | 72,886 | 9,690,923 | ||
| Horizon Therapeutics PLC (b) | 123,441 | 12,166,345 | ||
| Integer Holdings Corp. (b) | 133,331 | 10,022,491 | ||
| 31,879,759 | ||||
| Industrials (14.1%) | ||||
| Advanced Drainage Systems, Inc. | 56,770 | 5,816,654 | ||
| Atkore, Inc. (b) | 139,726 | 13,427,669 | ||
| Chart Industries, Inc. (b) | 47,162 | 7,961,889 | ||
| Tetra Tech, Inc. | 100,848 | 14,046,109 | ||
| Shares or Principal Amount | Value | |||||||
| Trex Co., Inc. (b) | 96,789 | $ | 5,632,152 | |||||
| Vertiv Holdings Co. | 697,217 | 8,736,129 | ||||||
| 55,620,602 | ||||||||
| Information Technology (25.2%) | ||||||||
| Akamai Technologies, Inc. (b) | 124,619 | 13,992,221 | ||||||
| Amdocs Ltd. | 106,021 | 8,448,814 | ||||||
| Marvell Technology, Inc. | 163,391 | 9,489,749 | ||||||
| Mastercard, Inc., Class A | 48,068 | 17,466,950 | ||||||
| Microsoft Corp. | 135,549 | 37,617,558 | ||||||
| RingCentral, Inc., Class A (b) | 70,056 | 5,944,252 | ||||||
| SolarEdge Technologies, Inc. (b) | 27,696 | 6,935,355 | ||||||
| 99,894,899 | ||||||||
| Materials (5.0%) | ||||||||
| Crown Holdings, Inc. | 93,260 | 10,262,330 | ||||||
| Ecolab, Inc. | 57,547 | 9,745,009 | ||||||
| 20,007,339 | ||||||||
| Utilities (4.3%) | ||||||||
| American Water Works Co., Inc. | 56,947 | 8,774,394 | ||||||
| CenterPoint Energy, Inc. | 265,126 | 8,115,507 | ||||||
| 16,889,901 | ||||||||
| 324,229,073 | ||||||||
| Total Common Stocks | 388,537,282 | |||||||
| SHORT-TERM INVESTMENT (1.8%) | ||||||||
| United States (1.8%) | ||||||||
| State Street Institutional U.S. Government Money Market Fund, Premier Class, 0.29% (c) | 7,123,086 | 7,123,086 | ||||||
| Total Short-Term Investment | 7,123,086 | |||||||
| Total Investments (Cost $395,909,262) (d)—100.0% | 395,660,368 | |||||||
| Liabilities in Excess of Other Assets—0.0% | (40,970 | ) | ||||||
| Net Assets—100.0% | $ | 395,619,398 | ||||||
| (a) | Denotes a security issued under Regulation S or Rule 144A. |
| (b) | Non-income producing security. |
| (c) | Registered investment company advised by State Street Global Advisors. The rate shown is the 7 day yield as of April 30, 2022. |
| (d) | See accompanying Notes to Financial Statements for tax unrealized appreciation/(depreciation) of securities. |
| ADR | American Depositary Receipt |
| PLC | Public Limited Company |
See accompanying Notes to Financial Statements.
| 2022 Semi-Annual Report | 51 |
abrdn U.S. Sustainable Leaders Smaller Companies Fund (Unaudited)
| Average Annual Total Return1 (For periods ended April 30, 2022) | Six Month† | 1 Yr. | 5 Yr. | 10 Yr. | ||||
| Class A | w/o SC | (22.55%) | (11.00%) | 12.42% | 7.47% | |||
| w/ SC2 | (27.03%) | (16.12%) | 11.11% | 6.83% | ||||
| Class C | w/o SC | (23.20%) | (12.15%) | 11.45% | 6.66% | |||
| w/ SC3 | (23.80%) | (12.83%) | 11.45% | 6.66% | ||||
| Class R4 | w/o SC | (22.67%) | (11.33%) | 12.05% | 7.08% | |||
| Institutional Service Class4 | w/o SC | (22.46%) | (10.86%) | 12.63% | 7.63% | |||
| Institutional Class4 | w/o SC | (22.49%) | (10.80%) | 12.79% | 7.83% |
All figures showing the effect of a sales charge (SC) reflect the maximum charge possible because it has the most significant effect on performance data. The total returns shown above do not include the impact of financial statement rounding of the net asset value (NAV) per share and/or financial statement adjustments.
| † | Not annualized |
| 1 | The Fund changed its investment strategies effective December 1, 2020. Performance information for periods prior to December 1, 2020 does not reflect the current investment strategy. In connection with the change in investment strategy, the Fund changed its name from Aberdeen Focused U.S. Equity Fund to abrdn U.S. Sustainable Leaders Smaller Companies Fund. The Fund changed its investment strategies effective November 15, 2017. Performance information for periods prior to November 15, 2017 does not reflect the current investment strategy. Please consult the Fund's prospectus for more detail. |
| 2 | A 5.75% front-end sales charge was deducted. |
| 3 | A 1.00% contingent deferred sales charge (CDSC) was deducted from the one year return because it is charged when Class C shares are sold within the first year after purchase. |
| 4 | Not subject to any sales charges. |
Performance of a $10,000 Investment (as of April 30, 2022)

Comparative performance of $10,000 invested in Class A shares of the abrdn U.S. Sustainable Leaders Smaller Companies Fund, the Russell 2500® Index, the Russell 2500® Growth Index and the Consumer Price Index (CPI) over a 10-year period ended April 30, 2022. Unlike the Fund, the returns for these unmanaged indexes do
not reflect any fees, expenses, or sales charges. Investors cannot invest directly in market indexes.
The Russell 2500® Index measures the performance of the small to mid-cap segment of the US equity universe, commonly referred to as "smid" cap. The Russell 2500® Index is a subset of the Russell 3000® Index. It includes approximately 2,500 of the smallest securities based on a combination of their market cap and current index membership.
The Russell 2500® Growth Index measures the performance of the small to mid-cap growth segment of the US equity universe. It includes those Russell 2500® companies with relatively higher price-to-book ratios, higher I/B/E/S forecast medium term (2 year) growth and higher sales per share historical growth (5 years). The Russell 2500 Growth Index is constructed to provide a comprehensive and unbiased barometer of the small to mid-cap growth market. The index is completely reconstituted annually to ensure larger stocks do not distort the performance and characteristics of the true small to mid-cap opportunity set and that the represented companies continue to reflect growth characteristics.
The CPI is a measure of the average change over time in the prices paid by urban consumers for a market basket of consumer goods and services.
Investment return and principal value will fluctuate, and when redeemed, shares may be worth more or less than original cost. Past performance is no guarantee of future results. The Average Annual Total Return table and Performance graph do not reflect the deduction of taxes that a shareholder would pay on fund distributions or the redemption of fund shares. Investing in mutual funds involves market risk, including loss of principal. Performance returns assume the reinvestment of all distributions. Total returns reflect waivers and reimbursements in effect, without which returns would have been lower.
| 52 | 2022 Semi-Annual Report |
abrdn U.S. Sustainable Leaders Smaller Companies Fund (Unaudited)
Portfolio Summary (as a percentage of net assets)
April 30, 2022 (Unaudited)
| Asset Allocation | |||
| Common Stocks | 97.1% | ||
| Short-Term Investment | 3.0% | ||
| Liabilities in Excess of Other Assets | (0.1% | ) | |
| 100.0% | |||
The following table summarizes the composition of the Fund's portfolio, in S&P Global Industry Classification Standard (GICS) sectors.
| Sectors | |||
| Industrials | 24.7% | ||
| Information Technology | 20.1% | ||
| Financials | 19.6% | ||
| Health Care | 10.6% | ||
| Materials | 5.3% | ||
| Consumer Staples | 4.4% | ||
| Consumer Discretionary | 4.0% | ||
| Communication Services | 3.0% | ||
| Utilities | 2.9% | ||
| Energy | 2.5% | ||
| Short-Term Investment | 3.0% | ||
| Liabilities in Excess of Other Assets | (0.1% | ) | |
| 100.0% | |||
| Top Ten Holdings | |||
| Perficient, Inc. | 3.2% | ||
| PJT Partners, Inc., Class A | 3.0% | ||
| Essential Utilities, Inc. | 2.9% | ||
| Chart Industries, Inc. | 2.8% | ||
| First Interstate BancSystem, Inc., Class A | 2.8% | ||
| Integer Holdings Corp. | 2.7% | ||
| Graphic Packaging Holding Co. | 2.7% | ||
| CyberArk Software Ltd. | 2.7% | ||
| CI Financial Corp. | 2.7% | ||
| CONMED Corp. | 2.6% | ||
| Countries | |||
| United States | 80.7% | ||
| Canada | 9.2% | ||
| Israel | 5.2% | ||
| Ireland | 2.0% | ||
| Short-Term Investment | 3.0% | ||
| Liabilities in Excess of Other Assets | (0.1% | ) | |
| 100.0% | |||
| 2022 Semi-Annual Report | 53 |
Statement of Investments
April 30, 2022 (Unaudited)
abrdn U.S. Sustainable Leaders Smaller Companies Fund
| Shares or Principal Amount | Value | ||||
| COMMON STOCKS (97.1%) | |||||
| Communication Services (3.0%) | |||||
| Cable One, Inc. | 233 | $ | 271,725 | ||
| Cogent Communications Holdings, Inc. | 4,860 | 284,310 | |||
| 556,035 | |||||
| Consumer Discretionary (4.0%) | |||||
| Aritzia, Inc. (a) | 8,023 | 285,721 | |||
| Burlington Stores, Inc. (a) | 2,223 | 452,514 | |||
| 738,235 | |||||
| Consumer Staples (4.4%) | |||||
| Darling Ingredients, Inc. (a) | 6,145 | 450,981 | |||
| Jamieson Wellness, Inc. (b) | 13,925 | 350,117 | |||
| 801,098 | |||||
| Energy (2.5%) | |||||
| New Fortress Energy, Inc. | 11,928 | 462,568 | |||
| Financials (19.6%) | |||||
| CI Financial Corp. | 37,565 | 489,807 | |||
| First Interstate BancSystem, Inc., Class A | 15,694 | 510,369 | |||
| Hannon Armstrong Sustainable Infrastructure Capital, Inc. | 8,821 | 352,752 | |||
| Huntington Bancshares, Inc. | 24,774 | 325,778 | |||
| Live Oak Bancshares, Inc. | 7,949 | 336,481 | |||
| LPL Financial Holdings, Inc. | 2,489 | 467,608 | |||
| PJT Partners, Inc., Class A | 8,358 | 551,544 | |||
| Seacoast Banking Corp. of Florida | 8,171 | 265,558 | |||
| TMX Group Ltd. | 2,993 | 304,717 | |||
| 3,604,614 | |||||
| Health Care (10.6%) | |||||
| CONMED Corp. | 3,600 | 478,656 | |||
| CryoPort, Inc. (a) | 6,872 | 155,032 | |||
| Health Catalyst, Inc. (a) | 12,270 | 204,173 | |||
| ICON PLC (a) | 1,606 | 363,293 | |||
| Inmode Ltd. (a) | 9,579 | 240,529 | |||
| Integer Holdings Corp. (a) | 6,671 | 501,459 | |||
| 1,943,142 | |||||
| Industrials (24.7%) | |||||
| Advanced Drainage Systems, Inc. | 2,403 | 246,211 | |||
| Ameresco, Inc., Class A (a) | 6,972 | 351,668 | |||
| Atkore, Inc. (a) | 4,420 | 424,762 | |||
| ATS Automation Tooling Systems, Inc. (a) | 8,845 | 258,124 | |||
| Axon Enterprise, Inc. (a) | 2,982 | 334,580 | |||
| Casella Waste Systems, Inc., Class A (a) | 3,350 | 275,504 | |||
| Chart Industries, Inc. (a) | 3,091 | 521,823 | |||
| Helios Technologies, Inc. | 4,070 | 273,423 | |||
| JB Hunt Transport Services, Inc. | 2,522 | 430,884 | |||
| Shyft Group, Inc. | 13,365 | 340,406 | |||
| Tetra Tech, Inc. | 2,883 | 401,544 | |||
| Trex Co., Inc. (a) | 4,788 | 278,614 | |||
| Vertiv Holdings Co. | 31,741 | 397,715 | |||
| 4,535,258 | |||||
| Shares or Principal Amount | Value | ||||
| Information Technology (20.1%) | |||||
| Akamai Technologies, Inc. (a) | 3,353 | $ | 376,475 | ||
| Amdocs Ltd. | 5,019 | 399,964 | |||
| CyberArk Software Ltd. (a) | 3,137 | 492,948 | |||
| NICE Ltd., ADR (a) | 2,217 | 457,611 | |||
| Onto Innovation, Inc. (a) | 5,972 | 424,848 | |||
| Perficient, Inc. (a) | 5,977 | 594,174 | |||
| RingCentral, Inc., Class A (a) | 2,466 | 209,240 | |||
| SolarEdge Technologies, Inc. (a) | 1,161 | 290,726 | |||
| Wolfspeed, Inc. (a) | 4,786 | 438,924 | |||
| 3,684,910 | |||||
| Materials (5.3%) | |||||
| Crown Holdings, Inc. | 4,320 | 475,373 | |||
| Graphic Packaging Holding Co. | 22,650 | 493,770 | |||
| 969,143 | |||||
| Utilities (2.9%) | |||||
| Essential Utilities, Inc. | 11,857 | 530,719 | |||
| Total Common Stocks | 17,825,722 | ||||
| SHORT-TERM INVESTMENT (3.0%) | |||||
| State Street Institutional U.S. Government Money Market Fund, Premier Class, 0.29% (c) | 558,177 | 558,177 | |||
| Total Short-Term Investment | 558,177 | ||||
| Total Investments (Cost $20,952,258) (d)—100.1% | 18,383,899 | ||||
| Liabilities in Excess of Other Assets—(0.1)% | (19,231 | ) | ||
| Net Assets—100.0% | $ | 18,364,668 |
| (a) | Non-income producing security. |
| (b) | Denotes a security issued under Regulation S or Rule 144A. |
| (c) | Registered investment company advised by State Street Global Advisors. The rate shown is the 7 day yield as of April 30, 2022. |
| (d) | See accompanying Notes to Financial Statements for tax unrealized appreciation/(depreciation) of securities. |
| ADR | American Depositary Receipt |
| PLC | Public Limited Company |
See accompanying Notes to Financial Statements.
| 54 | 2022 Semi-Annual Report |
Statements of Assets and Liabilities (Unaudited)
April 30, 2022
| abrdn China A Share Equity Fund | abrdn Dynamic Dividend Fund | abrdn Emerging Markets ex-China Fund | abrdn Emerging Markets Fund | abrdn Emerging Markets Sustainable Leaders Fund | ||||||||||||||||
| Assets: | ||||||||||||||||||||
| Investments, at value | $ | 51,869,830 | $ | 114,446,151 | $ | 24,658,921 | $ | 3,262,852,365 | $ | 138,459,361 | ||||||||||
| Foreign currency, at value | 27,479 | 104,681 | 4,547 | 22,192,997 | 66,887 | |||||||||||||||
| Receivable for capital shares issued | 8,248 | 87,313 | 697 | 6,359,202 | 23,182 | |||||||||||||||
| Interest and dividends receivable | 216 | 851,245 | 39,616 | 4,900,758 | 303,212 | |||||||||||||||
| Receivable for investments sold | – | 1,407,583 | – | 4,157,742 | – | |||||||||||||||
| Receivable from Adviser | 17,892 | 5,813 | 14,081 | 271,252 | 9,114 | |||||||||||||||
| Unrealized appreciation on forward foreign currency exchange contracts | – | 108,584 | – | – | – | |||||||||||||||
| Tax reclaim receivable | – | 313,239 | 23,521 | – | 247,065 | |||||||||||||||
| Prepaid expenses | 34,301 | – | 37,316 | 221,408 | 40,440 | |||||||||||||||
| Total assets | 51,957,966 | 117,324,609 | 24,778,699 | 3,300,955,724 | 139,149,261 | |||||||||||||||
| Liabilities: | ||||||||||||||||||||
| Payable for investments purchased | 64,907 | 2,765,029 | 80,494 | 18,198,810 | 80,992 | |||||||||||||||
| Payable for capital shares redeemed | 76,686 | 20,302 | 2,078 | 13,937,567 | 139,431 | |||||||||||||||
| Contingent liability of withholding taxes (See Note 2(i) of the Notes to Financial Statements) | – | 987,002 | – | – | – | |||||||||||||||
| Accrued foreign capital gains tax | – | – | 34,575 | 10,070,094 | 260,436 | |||||||||||||||
| Accrued expenses and other payables: | ||||||||||||||||||||
| Investment advisory fees | 39,258 | 98,467 | 19,224 | 2,581,061 | 96,171 | |||||||||||||||
| Custodian fees | 2,445 | 43,192 | 22,861 | 1,577,617 | 23,586 | |||||||||||||||
| Sub-transfer agent and administrative services fees | 9,281 | 6,783 | 1,682 | 585,705 | 15,290 | |||||||||||||||
| Interest expense on line of credit | – | – | 110 | – | – | |||||||||||||||
| Printing fees | 10,195 | – | 3,263 | 312,127 | 14,319 | |||||||||||||||
| Administration fees | 3,695 | 7,150 | 1,709 | 229,428 | 9,617 | |||||||||||||||
| Fund accounting fees | 4,054 | 5,900 | 1,373 | 224,997 | 9,488 | |||||||||||||||
| Audit fees | 21,767 | 21,053 | 21,767 | 22,807 | 21,768 | |||||||||||||||
| Transfer agent fees | 2,975 | 2,338 | 1,986 | 79,756 | 5,830 | |||||||||||||||
| Distribution fees | 6,303 | 798 | 5,283 | 68,221 | 4,884 | |||||||||||||||
| Legal fees | 326 | 447 | 88 | 21,785 | 702 | |||||||||||||||
| Other accrued expenses | 22,961 | 59,078 | 31,986 | 197,866 | 38,095 | |||||||||||||||
| Total liabilities | 264,853 | 4,017,539 | 228,479 | 48,107,841 | 720,609 | |||||||||||||||
| Net Assets | $ | 51,693,113 | $ | 113,307,070 | $ | 24,550,220 | $ | 3,252,847,883 | $ | 138,428,652 | ||||||||||
| Cost: | ||||||||||||||||||||
| Investments | $ | 69,302,297 | $ | 97,247,974 | $ | 26,078,033 | $ | 3,443,288,533 | $ | 171,536,313 | ||||||||||
| Foreign currency | 27,429 | 104,204 | 4,550 | 22,268,755 | 101,429 | |||||||||||||||
| Represented by: | ||||||||||||||||||||
| Capital | $ | 73,325,562 | $ | 93,387,528 | $ | 22,878,169 | $ | 3,207,457,150 | $ | 175,038,635 | ||||||||||
| Distributable earnings (accumulated loss) | (21,632,449 | ) | 19,919,542 | 1,672,051 | 45,390,733 | (36,609,983 | ) | |||||||||||||
| Net Assets | $ | 51,693,113 | $ | 113,307,070 | $ | 24,550,220 | $ | 3,252,847,883 | $ | 138,428,652 | ||||||||||
| Net Assets: | ||||||||||||||||||||
| Class A Shares | $ | 13,029,466 | $ | 4,586,095 | $ | 22,176,586 | $ | 78,581,469 | $ | 14,920,241 | ||||||||||
| Class C Shares | 2,222,766 | – | 153,980 | 6,608,241 | 433,214 | |||||||||||||||
| Class R Shares | 2,909,913 | – | 742,769 | 106,308,943 | 2,803,460 | |||||||||||||||
| Institutional Service Class Shares | 509,129 | – | 258,903 | 536,432,716 | 64,909,858 | |||||||||||||||
| Institutional Class Shares | 33,021,839 | 108,720,975 | 1,217,982 | 2,524,916,514 | 55,361,879 | |||||||||||||||
| Total | $ | 51,693,113 | $ | 113,307,070 | $ | 24,550,220 | $ | 3,252,847,883 | $ | 138,428,652 | ||||||||||
Amounts listed as "–" are $0 or round to $0.
See accompanying Notes to Financial Statements.
| 2022 Semi-Annual Report | 55 |
Statements of Assets and Liabilities (Unaudited) (concluded)
April 30, 2022
| abrdn China A Share Equity Fund | abrdn Dynamic Dividend Fund | abrdn Emerging Markets ex-China Fund | abrdn Emerging Markets Fund | abrdn Emerging Markets Sustainable Leaders Fund | ||||||||||||||||
| Shares Outstanding (unlimited number of shares authorized): | ||||||||||||||||||||
| Class A Shares | 480,037 | 1,084,045 | 1,630,175 | 5,821,736 | 1,366,257 | |||||||||||||||
| Class C Shares | 87,331 | – | 12,433 | 497,136 | 43,488 | |||||||||||||||
| Class R Shares | 110,529 | – | 58,219 | 7,992,053 | 274,765 | |||||||||||||||
| Institutional Service Class Shares | 18,597 | – | 18,644 | 39,618,314 | 5,771,743 | |||||||||||||||
| Institutional Class Shares | 1,199,588 | 25,685,715 | 88,835 | 185,704,473 | 4,891,579 | |||||||||||||||
| Total | 1,896,082 | 26,769,760 | 1,808,306 | 239,633,712 | 12,347,832 | |||||||||||||||
| Net asset value and redemption price per share (Net assets by class divided by shares outstanding by class, respectively): | ||||||||||||||||||||
| Class A Shares | $ | 27.14 | $ | 4.23 | $ | 13.60 | $ | 13.50 | $ | 10.92 | ||||||||||
| Class C Shares (a) | $ | 25.45 | $ | – | $ | 12.38 | $ | 13.29 | $ | 9.96 | ||||||||||
| Class R Shares | $ | 26.33 | $ | – | $ | 12.76 | $ | 13.30 | $ | 10.20 | ||||||||||
| Institutional Service Class Shares | $ | 27.38 | $ | – | $ | 13.89 | $ | 13.54 | $ | 11.25 | ||||||||||
| Institutional Class Shares | $ | 27.53 | $ | 4.23 | $ | 13.71 | $ | 13.60 | $ | 11.32 | ||||||||||
| Maximum offering price per share (100%/(100% – maximum sales charge) of net asset value adjusted to the nearest cent): | ||||||||||||||||||||
| Class A Shares | $ | 28.80 | $ | 4.49 | $ | 14.43 | $ | 14.32 | $ | 11.59 | ||||||||||
| Maximum Sales Charge: | ||||||||||||||||||||
| Class A Shares | 5.75 | % | 5.75 | % | 5.75 | % | 5.75 | % | 5.75 | % | ||||||||||
(a) For Class C Shares, the redemption price per share is reduced by 1.00% for shares held less than one year.
Amounts listed as "–" are $0 or round to $0.
See accompanying Notes to Financial Statements.
| 56 | 2022 Semi-Annual Report |
Statements of Assets and Liabilities (Unaudited)
April 30, 2022
| abrdn Global Equity Impact Fund | abrdn Global Infrastructure Fund | abrdn International Real Estate Equity Fund | abrdn International Small Cap Fund | abrdn International Sustainable Leaders Fund | ||||||||||||||||
| Assets: | ||||||||||||||||||||
| Investments in securities, at fair value | $ | 56,719,880 | $ | 54,735,261 | $ | 17,263,380 | $ | 263,635,133 | $ | 110,176,258 | ||||||||||
| Foreign currency, at fair value | 47,439 | 14,686 | 10,952 | 117,685 | 75,458 | |||||||||||||||
| Interest and dividends receivable | 25,875 | 198,658 | 74,932 | 2,707,331 | 107,365 | |||||||||||||||
| Receivable for investments sold | 1,615,129 | – | – | – | 1,449,529 | |||||||||||||||
| Receivable from Adviser (Note 3) | 26,662 | 18,501 | 11,811 | 24,009 | 25,865 | |||||||||||||||
| Receivable for capital shares issued | 6,691 | 8,634 | – | 81,910 | 373 | |||||||||||||||
| Unrealized appreciation on forward foreign currency exchange contracts | – | 2,814 | – | – | – | |||||||||||||||
| Tax reclaim receivable | 72,059 | 13,911 | 15,033 | 51,470 | 216,292 | |||||||||||||||
| Prepaid expenses | – | – | 7,299 | 41,903 | – | |||||||||||||||
| Total assets | 58,513,735 | 54,992,465 | 17,383,407 | 266,659,441 | 112,051,140 | |||||||||||||||
| Liabilities: | ||||||||||||||||||||
| Payable for investments purchased | 1,156,631 | – | – | – | 1,088,940 | |||||||||||||||
| Payable for capital shares redeemed | 49 | 6,995 | 1,670 | 511,625 | 23,531 | |||||||||||||||
| Payable for income taxes (See Note 2(i) of the Notes to Financial Statements) | 3,337,795 | – | – | – | 11,682,227 | |||||||||||||||
| Accrued foreign capital gains tax | – | – | – | 255,920 | 43,788 | |||||||||||||||
| Accrued expenses and other payables: | ||||||||||||||||||||
| Custodian fees | 61,892 | 30,356 | 42,265 | 57,781 | 75,133 | |||||||||||||||
| Investment advisory fees | – | 40,084 | 14,841 | 184,648 | – | |||||||||||||||
| Audit fees | 22,120 | 23,064 | 23,455 | 22,804 | 22,120 | |||||||||||||||
| Interest expense payable | 120 | – | – | – | 15 | |||||||||||||||
| Sub-transfer agent and administrative services fees | 8,614 | 4,258 | 2,330 | 22,654 | 26,174 | |||||||||||||||
| Distribution fees | 6,854 | 1,815 | 152 | 18,189 | 18,189 | |||||||||||||||
| Administration fees | 3,784 | 3,412 | 609 | 18,819 | 6,997 | |||||||||||||||
| Transfer agent fees | 7,884 | 1,121 | 949 | 4,084 | 10,920 | |||||||||||||||
| Printing fees | – | – | – | 20,182 | – | |||||||||||||||
| Fund accounting fees | – | 2,613 | 971 | 12,417 | – | |||||||||||||||
| Legal fees | 2,232 | 203 | 62 | 748 | 6,114 | |||||||||||||||
| Other accrued expenses | 17,367 | 35,840 | 43,851 | 40,652 | 24,213 | |||||||||||||||
| Total liabilities | 4,625,342 | 149,761 | 131,155 | 1,170,523 | 13,028,361 | |||||||||||||||
| Net Assets | $ | 53,888,393 | $ | 54,842,704 | $ | 17,252,252 | $ | 265,488,918 | $ | 99,022,779 | ||||||||||
| Cost: | ||||||||||||||||||||
| Investments in securities, at cost | $ | 48,773,721 | $ | 46,679,940 | $ | 29,589,519 | $ | 286,744,376 | $ | 133,053,615 | ||||||||||
| Foreign currency | 47,958 | 14,706 | 11,280 | 118,830 | 75,489 | |||||||||||||||
| Net Assets Consist of: | ||||||||||||||||||||
| Par value | $ | 3,748 | $ | – | $ | – | $ | – | $ | 3,899 | ||||||||||
| Paid in capital in excess of par value | 60,948,227 | 44,555,890 | 102,994,008 | 290,672,068 | 513,880,055 | |||||||||||||||
| Distributable earnings (accumulated loss) | (7,063,582 | ) | 10,286,814 | (85,741,756 | ) | (25,183,150 | ) | (414,861,175 | ) | |||||||||||
| Net Assets | $ | 53,888,393 | $ | 54,842,704 | $ | 17,252,252 | $ | 265,488,918 | $ | 99,022,779 | ||||||||||
| Net Assets | ||||||||||||||||||||
| Class A Shares | $ | 31,280,722 | $ | 13,179,012 | $ | 33,756 | $ | 75,319,149 | $ | 82,348,412 | ||||||||||
| Class C Shares | – | – | – | 425,254 | – | |||||||||||||||
| Class R Shares | – | – | – | 2,012,274 | – | |||||||||||||||
| Institutional Class Shares | 22,607,671 | 41,663,692 | 17,218,496 | 187,732,241 | 16,674,367 | |||||||||||||||
| Total | $ | 53,888,393 | $ | 54,842,704 | $ | 17,252,252 | $ | 265,488,918 | $ | 99,022,779 | ||||||||||
Amounts listed as "–" are $0 or round to $0.
See accompanying Notes to Financial Statements.
| 2022 Semi-Annual Report | 56 |
Statements of Assets and Liabilities (Unaudited) (concluded)
April 30, 2022
| abrdn Global Equity Impact Fund | abrdn Global Infrastructure Fund | abrdn International Real Estate Equity Fund | abrdn International Small Cap Fund | abrdn International Sustainable Leaders Fund | ||||||||||||||||
| Shares Outstanding | ||||||||||||||||||||
| Class A Shares | 2,178,204 | 567,573 | 1,912 | 2,642,415 | 3,258,670 | |||||||||||||||
| Class C Shares | – | – | – | 16,890 | – | |||||||||||||||
| Class R Shares | – | – | – | 75,985 | – | |||||||||||||||
| Institutional Class Shares | 1,569,761 | 1,790,591 | 980,842 | 6,505,989 | 640,217 | |||||||||||||||
| Total | 3,747,965 | 2,358,164 | 982,754 | 9,241,279 | 3,898,887 | |||||||||||||||
| Net asset value and redemption price per share | ||||||||||||||||||||
| Class A Shares | $ | 14.36 | $ | 23.22 | $ | 17.65 | $ | 28.50 | $ | 25.27 | ||||||||||
| Class C Shares (a) | $ | – | $ | – | $ | – | $ | 25.18 | $ | – | ||||||||||
| Class R Shares | $ | – | $ | – | $ | – | $ | 26.48 | $ | – | ||||||||||
| Institutional Class Shares | $ | 14.40 | $ | 23.27 | $ | 17.55 | $ | 28.86 | $ | 26.04 | ||||||||||
| Maximum offering price per share (100%/(100% – maximum sales charge) of net asset value adjusted to the nearest cent): | ||||||||||||||||||||
| Class A Shares | $ | 15.24 | $ | 24.64 | $ | 18.73 | $ | 30.24 | $ | 26.81 | ||||||||||
| Maximum Sales Charge: | ||||||||||||||||||||
| Class A Shares | 5.75 | % | 5.75 | % | 5.75 | % | 5.75 | % | 5.75 | % | ||||||||||
(a) For Class C Shares, the redemption price per share is reduced by 1.00% for shares held less than one year.
Amounts listed as "–" are $0 or round to $0.
See accompanying Notes to Financial Statements.
| 58 | 2022 Semi-Annual Report |
Statements of Assets and Liabilities (Unaudited)
April 30, 2022
| abrdn Realty Income & Growth Fund | abrdn U.S. Small Cap Equity Fund | abrdn U.S. Sustainable Leaders Fund | abrdn U.S. Sustainable Leaders Smaller Companies Fund | |||||||||||||
| Assets: | ||||||||||||||||
| Investments, at value | $ | 53,732,433 | $ | 877,779,764 | $ | 395,660,368 | $ | 18,383,899 | ||||||||
| Receivable for investments sold | – | 2,193,597 | 482,109 | – | ||||||||||||
| Receivable for capital shares issued | 5,455 | 808,887 | 22,561 | 969 | ||||||||||||
| Interest and dividends receivable | 38,371 | 168,852 | 130,962 | 122 | ||||||||||||
| Receivable from Adviser | 18,785 | 42,251 | 17,841 | 15,261 | ||||||||||||
| Prepaid expenses | – | 62,655 | 31,938 | 42,187 | ||||||||||||
| Total assets | 53,795,044 | 881,056,006 | 396,345,779 | 18,442,438 | ||||||||||||
| Liabilities: | ||||||||||||||||
| Payable for investments purchased | – | 1,071,821 | – | – | ||||||||||||
| Payable for capital shares redeemed | 100,036 | 3,189,772 | 246,118 | 2,137 | ||||||||||||
| Accrued expenses and other payables: | ||||||||||||||||
| Investment advisory fees | 46,717 | 627,442 | 261,748 | 12,288 | ||||||||||||
| Printing fees | – | 127,431 | 6,750 | 2,201 | ||||||||||||
| Distribution fees | 1,162 | 55,062 | 57,989 | 3,726 | ||||||||||||
| Interest expense on line of credit | 3,962 | – | – | – | ||||||||||||
| Sub-transfer agent and administrative services fees | 2,889 | 91,674 | 22,329 | 817 | ||||||||||||
| Administration fees | 3,037 | 61,511 | 27,920 | 1,311 | ||||||||||||
| Custodian fees | 15,988 | 34,027 | 28,036 | 14,463 | ||||||||||||
| Audit fees | 22,944 | 21,767 | 21,249 | 23,323 | ||||||||||||
| Fund accounting fees | 2,578 | 50,329 | 22,001 | 850 | ||||||||||||
| Transfer agent fees | 1,152 | 13,106 | 3,412 | 1,457 | ||||||||||||
| Legal fees | 164 | 2,959 | 1,180 | 339 | ||||||||||||
| Other accrued expenses | 15,123 | 45,185 | 27,649 | 14,858 | ||||||||||||
| Total liabilities | 215,752 | 5,392,086 | 726,381 | 77,770 | ||||||||||||
| Net Assets | $ | 53,579,292 | $ | 875,663,920 | $ | 395,619,398 | $ | 18,364,668 | ||||||||
| Cost: | ||||||||||||||||
| Investments | $ | 37,414,738 | $ | 976,565,931 | $ | 395,909,262 | $ | 20,952,258 | ||||||||
| Represented by: | ||||||||||||||||
| Capital | $ | 34,264,027 | $ | 902,136,003 | $ | 369,472,204 | $ | 20,319,089 | ||||||||
| Distributable earnings (accumulated loss) | 19,315,265 | (26,472,083 | ) | 26,147,194 | (1,954,421 | ) | ||||||||||
| Net Assets | $ | 53,579,292 | $ | 875,663,920 | $ | 395,619,398 | $ | 18,364,668 | ||||||||
| Net Assets: | ||||||||||||||||
| Class A Shares | $ | 749,967 | $ | 120,681,386 | $ | 261,889,292 | $ | 9,723,222 | ||||||||
| Class C Shares | – | 30,448,266 | 279,923 | 501,092 | ||||||||||||
| Class R Shares | – | 3,917,875 | – | 2,448,534 | ||||||||||||
| Institutional Service Class Shares | – | 32,283,682 | 122,591,180 | 375,474 | ||||||||||||
| Institutional Class Shares | 52,829,325 | 688,332,711 | 10,859,003 | 5,316,346 | ||||||||||||
| Total | $ | 53,579,292 | $ | 875,663,920 | $ | 395,619,398 | $ | 18,364,668 | ||||||||
Amounts listed as "–" are $0 or round to $0.
See accompanying Notes to Financial Statements.
| 2022 Semi-Annual Report | 59 |
Statements of Assets and Liabilities (Unaudited) (concluded)
April 30, 2022
| abrdn Realty Income & Growth Fund | abrdn U.S. Small Cap Equity Fund | abrdn U.S. Sustainable Leaders Fund | abrdn U.S. Sustainable Leaders Smaller Companies Fund | |||||||||||||
| Shares Outstanding (unlimited number of shares authorized): | ||||||||||||||||
| Class A Shares | 55,682 | 3,903,427 | 24,810,200 | 1,490,130 | ||||||||||||
| Class C Shares | – | 1,312,138 | 36,697 | 553,894 | ||||||||||||
| Class R Shares | – | 147,385 | – | 438,214 | ||||||||||||
| Institutional Service Class Shares | – | 945,561 | 10,328,073 | 54,589 | ||||||||||||
| Institutional Class Shares | 3,903,793 | 20,102,544 | 907,581 | 736,380 | ||||||||||||
| Total | 3,959,475 | 26,411,055 | 36,082,551 | 3,273,207 | ||||||||||||
| Net asset value and redemption price per share (Net assets by class | ||||||||||||||||
| divided by shares outstanding by class, respectively): | ||||||||||||||||
| Class A Shares | $ | 13.47 | $ | 30.92 | $ | 10.56 | $ | 6.53 | ||||||||
| Class C Shares (a) | $ | – | $ | 23.21 | $ | 7.63 | $ | 0.90 | ||||||||
| Class R Shares | $ | – | $ | 26.58 | $ | – | $ | 5.59 | ||||||||
| Institutional Service Class Shares | $ | – | $ | 34.14 | $ | 11.87 | $ | 6.88 | ||||||||
| Institutional Class Shares | $ | 13.53 | $ | 34.24 | $ | 11.96 | $ | 7.22 | ||||||||
| Maximum offering price per share (100%/(100% – maximum | ||||||||||||||||
| sales charge) of net asset value adjusted to the nearest cent): | ||||||||||||||||
| Class A Shares | $ | 14.29 | $ | 32.81 | $ | 11.20 | $ | 6.93 | ||||||||
| Maximum Sales Charge: | ||||||||||||||||
| Class A Shares | 5.75 | % | 5.75 | % | 5.75 | % | 5.75 | % | ||||||||
(a) For Class C Shares, the redemption price per share is reduced by 1.00% for shares held less than one year.
Amounts listed as "–" are $0 or round to $0.
See accompanying Notes to Financial Statements.
| 60 | 2022 Semi-Annual Report |
Statements of Operations (Unaudited)
For the Six-Month Period Ended April 30, 2022
| abrdn China A Share Equity Fund | abrdn Dynamic Dividend Fund | abrdn Emerging Markets ex-China Fund | abrdn Emerging Markets Fund | abrdn Emerging Markets Sustainable Leaders Fund | ||||||||||||||||
| INVESTMENT INCOME: | ||||||||||||||||||||
| Dividend income | $ | 202,777 | $ | 3,894,712 | $ | 216,902 | $ | 40,517,450 | $ | 1,676,145 | ||||||||||
| Interest income | 587 | 501 | 122 | 11,652 | 31,954 | |||||||||||||||
| Securities lending income, net | – | – | – | – | 1,750 | |||||||||||||||
| Foreign tax withholding (See Note 2(i) of the Notes to Financial Statements) | (5,683 | ) | (1,422,382 | ) | (20,616 | ) | (4,915,564 | ) | (237,752 | ) | ||||||||||
| Total Income | 197,681 | 2,472,831 | 196,408 | 35,613,538 | 1,472,097 | |||||||||||||||
| EXPENSES: | ||||||||||||||||||||
| Investment advisory fees | 322,266 | 618,518 | 127,388 | 18,474,040 | 694,072 | |||||||||||||||
| Trustee fees | 3,126 | 4,794 | 1,103 | 172,397 | 7,244 | |||||||||||||||
| Administration fees | 30,331 | 49,481 | 11,323 | 1,642,137 | 69,407 | |||||||||||||||
| Legal fees | 3,658 | 5,547 | 1,280 | 203,411 | 8,507 | |||||||||||||||
| Audit fees | 18,475 | 18,305 | 18,475 | 19,515 | 18,475 | |||||||||||||||
| Printing fees | 3,349 | 4,133 | 2,761 | 80,114 | 7,861 | |||||||||||||||
| Custodian fees | 20,274 | 15,760 | 10,204 | 906,095 | 35,778 | |||||||||||||||
| Transfer agent fees | 15,363 | 18,961 | 22,396 | 305,612 | 58,584 | |||||||||||||||
| Distribution fees Class A | 20,167 | 6,129 | 31,966 | 120,167 | 24,001 | |||||||||||||||
| Distribution fees Class C | 16,525 | – | 912 | 43,694 | 4,089 | |||||||||||||||
| Distribution fees Class R | 9,744 | – | 2,101 | 304,126 | 11,891 | |||||||||||||||
| Sub-transfer agent and administrative service fees Institutional Class | 16,673 | 38,053 | 440 | 1,609,231 | 20,422 | |||||||||||||||
| Sub-transfer agent and administrative service fees Class A | 7,105 | 1,830 | 10,995 | 118,364 | 12,979 | |||||||||||||||
| Sub-transfer agent and administrative service fees Class C | 1,144 | – | 180 | 3,255 | 430 | |||||||||||||||
| Sub-transfer agent and administrative service fees Class R | 2,662 | – | 980 | 95,004 | 4,223 | |||||||||||||||
| Sub-transfer agent and administrative service fees Institutional Service Class | 424 | – | 154 | 349,386 | 26,685 | |||||||||||||||
| Fund accounting fees | 1,517 | 2,474 | 566 | 82,107 | 3,470 | |||||||||||||||
| Registration and filing fees | 42,823 | 16,864 | 31,473 | 85,522 | 33,587 | |||||||||||||||
| Other | 19,199 | 31,506 | 20,597 | 348,561 | 32,845 | |||||||||||||||
| Total expenses before reimbursed/waived expenses | 554,825 | 832,355 | 295,294 | 24,962,738 | 1,074,550 | |||||||||||||||
| Interest expense (Note 10) | 228 | – | 119 | 30,849 | 1,496 | |||||||||||||||
| Total operating expenses before reimbursed/waived expenses | 555,053 | 832,355 | 295,413 | 24,993,587 | 1,076,046 | |||||||||||||||
| Expenses reimbursed | (122,852 | ) | (53,040 | ) | (83,692 | ) | (1,379,893 | ) | (36,334 | ) | ||||||||||
| Net expenses | 432,201 | 779,315 | 211,721 | 23,613,694 | 1,039,712 | |||||||||||||||
| Net Investment Income/(Loss) | (234,520 | ) | 1,693,516 | (15,313 | ) | 11,999,844 | 432,385 | |||||||||||||
| REALIZED/UNREALIZED GAIN/(LOSS) FROM INVESTMENTS: | ||||||||||||||||||||
| Realized gain/(loss) on investment transactions | (3,862,864 | ) | 4,306,769 | 7,133,811 | 249,003,795 | (3,379,092 | ) | |||||||||||||
| Realized gain/(loss) on forward foreign currency exchange contracts | – | 165,054 | – | – | – | |||||||||||||||
| Realized gain/(loss) on foreign currency transactions | 2,151 | (5,063 | ) | (25,778 | ) | (1,350,815 | ) | (24,175 | ) | |||||||||||
| Net realized gain/(loss) from investments and foreign currency transactions | (3,860,713 | ) | 4,466,760 | 7,108,033 | 247,652,980 | (3,403,267 | ) | |||||||||||||
| Net change in unrealized appreciation/(depreciation) on investment transactions (including $0, $0, $23,950, $15,267,550 and $216,775 change in deferred capital gains tax, respectively) | (17,593,305 | ) | (16,428,675 | ) | (11,918,593 | ) | (1,403,638,840 | ) | (46,722,937 | ) | ||||||||||
| Net change in unrealized appreciation/(depreciation) on forward foreign currency exchange rate contracts | – | 110,598 | – | – | – | |||||||||||||||
| Net change in unrealized appreciation/(depreciation) on translation of assets and liabilities denominated in foreign currencies | (1,003 | ) | 16,943 | (2,587 | ) | (288,373 | ) | (56,723 | ) | |||||||||||
| Net change in unrealized appreciation/(depreciation) from investments and translation of assets and liabilities denominated in foreign currencies | (17,594,308 | ) | (16,301,134 | ) | (11,921,180 | ) | (1,403,927,213 | ) | (46,779,660 | ) | ||||||||||
| Net realized/unrealized (loss) from investments and foreign currency transactions | (21,455,021 | ) | (11,834,374 | ) | (4,813,147 | ) | (1,156,274,233 | ) | (50,182,927 | ) | ||||||||||
| CHANGE IN NET ASSETS RESULTING FROM OPERATIONS | $ | (21,689,541 | ) | $ | (10,140,858 | ) | $ | (4,828,460 | ) | $ | (1,144,274,389 | ) | $ | (49,750,542 | ) | |||||
Amounts listed as "–" are $0 or round to $0.
See accompanying Notes to Financial Statements.
| 2022 Semi-Annual Report | 61 |
Statements of Operations (Unaudited) (continued)
For the Six-Month Period Ended April 30, 2022
| abrdn Global Equity Impact Fund | abrdn Global Infrastructure Fund | abrdn International Real Estate Equity Fund | abrdn International Small Cap Fund | abrdn International Sustainable Leaders Fund | ||||||||||||||||
| INVESTMENT INCOME: | ||||||||||||||||||||
| Dividend income | $ | 412,369 | $ | 1,099,422 | $ | 280,374 | $ | 3,553,948 | $ | 811,166 | ||||||||||
| Interest income | 596 | 232 | 212 | 3,239 | 519 | |||||||||||||||
| Foreign tax withholding | (24,295 | ) | (117,558 | ) | (23,775 | ) | (186,889 | ) | (106,719 | ) | ||||||||||
| Total Income | 388,670 | 982,096 | 256,811 | 3,370,298 | 704,966 | |||||||||||||||
| EXPENSES: | ||||||||||||||||||||
| Investment advisory fees | 242,395 | 240,932 | 95,032 | 1,176,018 | 464,428 | |||||||||||||||
| Trustee fees | 13,571 | 2,165 | 745 | 11,188 | 25,834 | |||||||||||||||
| Administration fees | 20,175 | 22,676 | 7,602 | 120,153 | 38,429 | |||||||||||||||
| Legal fees | 181 | 2,492 | 875 | 12,611 | 895 | |||||||||||||||
| Audit fees | 18,828 | 20,216 | 19,795 | 19,512 | 18,828 | |||||||||||||||
| Printing fees | 28,142 | 3,385 | 2,983 | 9,368 | 51,187 | |||||||||||||||
| Custodian fees | 69,695 | 26,117 | 25,357 | 31,543 | 90,161 | |||||||||||||||
| Transfer agent fees | 23,910 | 12,079 | 9,769 | 43,844 | 34,206 | |||||||||||||||
| Distribution fees Class A | 45,799 | 16,744 | 46 | 121,184 | 126,951 | |||||||||||||||
| Distribution fees Class C | – | – | – | 2,496 | – | |||||||||||||||
| Distribution fees Class R | – | – | – | 5,534 | – | |||||||||||||||
| Sub-transfer agent and administrative service fees Class A | 22,803 | 5,090 | 46 | 52,491 | 71,890 | |||||||||||||||
| Sub-transfer agent and administrative service fees Institutional Class | 13,272 | 17,611 | 12,092 | 102,144 | 6,089 | |||||||||||||||
| Sub-transfer agent and administrative service fees Class C | – | – | – | 311 | – | |||||||||||||||
| Sub-transfer agent and administrative service fees Class R | – | – | – | 1,600 | – | |||||||||||||||
| Fund accounting fees | – | 1,134 | 380 | 6,008 | – | |||||||||||||||
| Registration and filing fees | 24,358 | 15,771 | 16,239 | 37,717 | 16,003 | |||||||||||||||
| Other | 21,141 | 15,118 | 15,036 | 35,488 | 29,331 | |||||||||||||||
| Total expenses before reimbursed/waived expenses | 544,270 | 401,530 | 205,997 | 1,789,210 | 974,232 | |||||||||||||||
| Interest expense | 147 | – | 195 | – | 27 | |||||||||||||||
| Total operating expenses before reimbursed/waived expenses | 544,417 | 401,530 | 206,192 | 1,789,210 | 974,259 | |||||||||||||||
| Expenses reimbursed | (197,943 | ) | (104,152 | ) | (75,757 | ) | (119,018 | ) | (271,087 | ) | ||||||||||
| Expenses waived by investment adviser | (333 | ) | – | – | – | (651 | ) | |||||||||||||
| Total operating expenses | 346,141 | 297,378 | 130,435 | 1,670,192 | 702,521 | |||||||||||||||
| Net Investment Income | 42,529 | 684,718 | 126,376 | 1,700,106 | 2,445 | |||||||||||||||
| Realized gain/(loss) on investment transactions | 2,773,159 | 2,558,617 | (350,138 | ) | (3,315,498 | ) | 1,568,167 | |||||||||||||
| Realized gain/(loss) on forward foreign currency exchange contracts | – | 8,916 | – | – | – | |||||||||||||||
| Realized gain/(loss) on foreign currency transactions | (20,059 | ) | 1,017 | (2,077 | ) | (44,929 | ) | (20,473 | ) | |||||||||||
| Net realized gain/(loss) from investments, futures, written options, credit default swaps, forward foreign currency exchange contracts and foreign currency transactions | 2,753,100 | 2,568,550 | (352,215 | ) | (3,360,427 | ) | 1,547,694 | |||||||||||||
| Net change in unrealized appreciation/(depreciation) on investment transactions (including $21,579, $0, $0, $130,975 and $249,940 change in deferred capital gains tax, respectively) | (18,894,330 | ) | (3,981,289 | ) | (1,908,546 | ) | (97,293,888 | ) | (40,301,514 | ) | ||||||||||
| Net change in unrealized appreciation/(depreciation) on forward foreign currency exchange rate contracts | – | 4,093 | – | – | – | |||||||||||||||
| Net change in unrealized appreciation/(depreciation) on translation of assets and liabilities denominated in foreign currencies | (6,877 | ) | (1,282 | ) | (4,594 | ) | (16,122 | ) | (2,713 | ) | ||||||||||
| Net change in unrealized appreciation/(depreciation) from investments, futures, forward foreign currency exchange contracts and translation of assets and liabilities denominated in foreign currencies | (18,901,207 | ) | (3,978,478 | ) | (1,913,140 | ) | (97,310,010 | ) | (40,304,227 | ) | ||||||||||
| Net realized/unrealized (loss) from investments, futures, forward foreign currency exchange contracts and translation of assets and liabilities denominated in foreign currencies | (16,148,107 | ) | (1,409,928 | ) | (2,265,355 | ) | (100,670,437 | ) | (38,756,533 | ) | ||||||||||
| CHANGE IN NET ASSETS RESULTING FROM OPERATIONS | $ | (16,105,578 | ) | $ | (725,210 | ) | $ | (2,138,979 | ) | $ | (98,970,331 | ) | $ | (38,754,088 | ) | |||||
Amounts listed as "–" are $0 or round to $0.
See accompanying Notes to Financial Statements.
| 62 | 2022 Semi-Annual Report |
Statements of Operations (Unaudited) (concluded)
For the Six-Month Period Ended April 30, 2022
| abrdn Realty Income & Growth Fund | abrdn U.S. Small Cap Equity Fund | abrdn U.S. Sustainable Leaders Fund | abrdn U.S. Sustainable Leaders Smaller Companies Fund | |||||||||||||
| INVESTMENT INCOME: | ||||||||||||||||
| Dividend income | $ | 817,437 | $ | 3,556,954 | $ | 1,863,370 | $ | 77,468 | ||||||||
| Interest income | 400 | 6,748 | 2,398 | 266 | ||||||||||||
| Foreign tax withholding | – | (99,039 | ) | (54,731 | ) | (2,639 | ) | |||||||||
| Total Income | 817,837 | 3,464,663 | 1,811,037 | 75,095 | ||||||||||||
| EXPENSES: | ||||||||||||||||
| Investment advisory fees | 279,967 | 4,312,923 | 1,732,253 | 75,815 | ||||||||||||
| Trustee fees | 2,121 | 40,273 | 17,550 | 728 | ||||||||||||
| Administration fees | 22,397 | 423,854 | 184,948 | 8,087 | ||||||||||||
| Legal fees | 2,455 | 47,591 | 20,621 | 3,076 | ||||||||||||
| Audit fees | 19,284 | 18,475 | 17,957 | 20,031 | ||||||||||||
| Printing fees | 2,659 | 26,963 | 7,339 | 2,131 | ||||||||||||
| Custodian fees | 7,279 | 15,399 | 18,981 | 6,084 | ||||||||||||
| Transfer agent fees | 11,013 | 85,868 | 86,648 | 11,951 | ||||||||||||
| Distribution fees Class A | 1,192 | 187,934 | 382,902 | 13,234 | ||||||||||||
| Distribution fees Class C | – | 191,697 | 1,566 | 3,317 | ||||||||||||
| Distribution fees Class R | – | 12,123 | – | 7,218 | ||||||||||||
| Sub-transfer agent and administrative service fees Institutional Class | 18,142 | 369,513 | 4,045 | 3,468 | ||||||||||||
| Sub-transfer agent and administrative service fees Class A | 289 | 87,662 | 65,783 | 3,808 | ||||||||||||
| Sub-transfer agent and administrative service fees Class C | – | 15,656 | 221 | 237 | ||||||||||||
| Sub-transfer agent and administrative service fees Class R | – | 3,869 | – | 2,169 | ||||||||||||
| Sub-transfer agent and administrative service fees Institutional Service Class | – | 26,305 | 47,897 | 250 | ||||||||||||
| Fund accounting fees | 1,120 | 21,193 | 9,247 | 404 | ||||||||||||
| Registration and filing fees | 15,121 | 51,905 | 28,662 | 32,202 | ||||||||||||
| Other | 12,908 | 76,152 | 38,166 | 10,790 | ||||||||||||
| Total expenses before reimbursed/waived expenses | 395,947 | 6,015,355 | 2,664,786 | 205,000 | ||||||||||||
| Interest expense (Note 10) | 82 | 1,064 | 408 | – | ||||||||||||
| Total operating expenses before reimbursed/waived expenses | 396,029 | 6,016,419 | 2,665,194 | 205,000 | ||||||||||||
| Expenses reimbursed | (114,788 | ) | (283,270 | ) | (85,978 | ) | (84,027 | ) | ||||||||
| Net expenses | 281,241 | 5,733,149 | 2,579,216 | 120,973 | ||||||||||||
| Net Investment Income/(Loss) | 536,596 | (2,268,486 | ) | (768,179 | ) | (45,878 | ) | |||||||||
| REALIZED/UNREALIZED GAIN/(LOSS) FROM INVESTMENTS: | ||||||||||||||||
| Realized gain on investment transactions | 2,847,652 | 78,945,303 | 27,145,746 | 682,055 | ||||||||||||
| Realized gain/(loss) on foreign currency transactions | – | 31,958 | 18,651 | 2,008 | ||||||||||||
| Net realized gain from investments and foreign currency transactions | 2,847,652 | 78,977,261 | 27,164,397 | 684,063 | ||||||||||||
| Net change in unrealized appreciation/(depreciation) on investment transactions | (4,184,911 | ) | (326,745,085 | ) | (117,281,856 | ) | (5,899,216 | ) | ||||||||
| Net change in unrealized appreciation/(depreciation) from investments and translation of assets and liabilities denominated in foreign currencies | (4,184,911 | ) | (326,745,085 | ) | (117,281,856 | ) | (5,899,216 | ) | ||||||||
| Net realized/unrealized (loss) from investments and foreign currency transactions | (1,337,259 | ) | (247,767,824 | ) | (90,117,459 | ) | (5,215,153 | ) | ||||||||
| CHANGE IN NET ASSETS RESULTING FROM OPERATIONS | $ | (800,663 | ) | $ | (250,036,310 | ) | $ | (90,885,638 | ) | $ | (5,261,031 | ) | ||||
Amounts listed as "–" are $0 or round to $0.
See accompanying Notes to Financial Statements.
| 2022 Semi-Annual Report | 63 |
Statements of Changes in Net Assets
| abrdn China A Share Equity Fund | abrdn Dynamic Dividend Fund | abrdn Emerging Markets ex-China Fund | ||||||||||||||||||||||
| Six-Month Period Ended April 30, 2022 (Unaudited) | Year Ended October 31, 2021 | Six-Month Period Ended April 30, 2022 (Unaudited) | Year Ended October 31, 2021 | Six-Month Period Ended April 30, 2022 (Unaudited) | Year Ended October 31, 2021 | |||||||||||||||||||
| FROM INVESTMENT ACTIVITIES: | ||||||||||||||||||||||||
| Operations: | ||||||||||||||||||||||||
| Net investment income/(loss) | $ | (234,520 | ) | $ | 54,912 | $ | 1,693,516 | $ | 6,597,742 | $ | (15,313 | ) | $ | (103,384 | ) | |||||||||
| Net realized gain/(loss) from investments and foreign currency transactions | (3,860,713 | ) | 2,204,301 | 4,466,760 | 5,325,250 | 7,108,033 | 4,488,279 | |||||||||||||||||
| Net change in unrealized appreciation/ (depreciation) on investments and translation of assets and liabilities denominated in foreign currencies | (17,594,308 | ) | (3,858,510 | ) | (16,301,134 | ) | 24,012,917 | (11,921,180 | ) | 4,728,633 | ||||||||||||||
| Changes in net assets resulting from operations | (21,689,541 | ) | (1,599,297 | ) | (10,140,858 | ) | 35,935,909 | (4,828,460 | ) | 9,113,528 | ||||||||||||||
| Distributions to Shareholders From: | ||||||||||||||||||||||||
| Distributable earnings: | ||||||||||||||||||||||||
| Class A | (454,659 | ) | (187,758 | ) | (131,397 | ) | (246,233 | ) | (2,940,025 | ) | – | |||||||||||||
| Class C | (99,787 | ) | (30,331 | ) | – | – | (22,504 | ) | – | |||||||||||||||
| Class R | (119,125 | ) | (60,627 | ) | – | – | (100,452 | ) | – | |||||||||||||||
| Institutional Service Class | (23,223 | ) | (10,077 | ) | – | – | (35,904 | ) | – | |||||||||||||||
| Institutional Class | (1,556,884 | ) | (227,834 | ) | (3,329,821 | ) | (6,307,092 | ) | (161,867 | ) | – | |||||||||||||
| Change in net assets from shareholder distributions | (2,253,678 | ) | (516,627 | ) | (3,461,218 | ) | (6,553,325 | ) | (3,260,752 | ) | – | |||||||||||||
| Change in net assets from capital transactions | (12,437,126 | ) | 69,942,065 | (1,242,881 | ) | (5,465,206 | ) | 1,801,434 | (3,492,261 | ) | ||||||||||||||
| Change in net assets | (36,380,345 | ) | 67,826,141 | (14,844,957 | ) | 23,917,378 | (6,287,778 | ) | 5,621,267 | |||||||||||||||
| Net Assets: | ||||||||||||||||||||||||
| Beginning of period | 88,073,458 | 20,247,317 | 128,152,027 | 104,234,649 | 30,837,998 | 25,216,731 | ||||||||||||||||||
| End of period | $ | 51,693,113 | $ | 88,073,458 | $ | 113,307,070 | $ | 128,152,027 | $ | 24,550,220 | $ | 30,837,998 | ||||||||||||
Amounts listed as "–" are $0 or round to $0.
See accompanying Notes to Financial Statements.
| 64 | 2022 Semi-Annual Report |
Statements of Changes in Net Assets (continued)
| abrdn China A Share Equity Fund | abrdn Dynamic Dividend Fund | abrdn Emerging Markets ex-China Fund | ||||||||||||||||||||||
| Six-Month Period Ended April 30, 2022 (Unaudited) | Year Ended October 31, 2021 | Six-Month Period Ended April 30, 2022 (Unaudited) | Year Ended October 31, 2021 | Six-Month Period Ended April 30, 2022 (Unaudited) | Year Ended October 31, 2021 | |||||||||||||||||||
| CAPITAL TRANSACTIONS: | ||||||||||||||||||||||||
| Class A Shares | ||||||||||||||||||||||||
| Proceeds from shares issued | $ | 2,173,736 | $ | 13,943,316 | $ | 288,546 | $ | 533,059 | $ | 267,815 | $ | 420,868 | ||||||||||||
| Dividends reinvested | 376,768 | 148,240 | 93,602 | 173,000 | 2,746,115 | – | ||||||||||||||||||
| Cost of shares redeemed | (2,838,019 | ) | (7,236,721 | ) | (230,928 | ) | (731,898 | ) | (1,348,021 | ) | (3,223,417 | ) | ||||||||||||
| Total Class A | (287,515 | ) | 6,854,835 | 151,220 | (25,839 | ) | 1,665,909 | (2,802,549 | ) | |||||||||||||||
| Class C Shares | ||||||||||||||||||||||||
| Proceeds from shares issued | 240,693 | 4,436,043 | – | – | 1,500 | 200 | ||||||||||||||||||
| Dividends reinvested | 99,579 | 29,772 | – | – | 22,485 | – | ||||||||||||||||||
| Cost of shares redeemed | (792,760 | ) | (1,132,154 | ) | – | – | (10,728 | ) | (76,825 | ) | ||||||||||||||
| Total Class C | (452,488 | ) | 3,333,661 | – | – | 13,257 | (76,625 | ) | ||||||||||||||||
| Class R Shares | ||||||||||||||||||||||||
| Proceeds from shares issued | 421,153 | 4,143,882 | – | – | 68,517 | 178,224 | ||||||||||||||||||
| Dividends reinvested | 119,125 | 60,456 | – | – | 98,734 | – | ||||||||||||||||||
| Cost of shares redeemed | (958,135 | ) | (3,125,168 | ) | – | – | (78,853 | ) | (466,581 | ) | ||||||||||||||
| Total Class R | (417,857 | ) | 1,079,170 | – | – | 88,398 | (288,357 | ) | ||||||||||||||||
| Institutional Service Class Shares | ||||||||||||||||||||||||
| Proceeds from shares issued | 26,515 | 343,114 | – | – | – | 30 | ||||||||||||||||||
| Dividends reinvested | 23,119 | 10,017 | – | – | 35,904 | – | ||||||||||||||||||
| Cost of shares redeemed | (249,812 | ) | (93,518 | ) | – | – | (34,003 | ) | (1,527 | ) | ||||||||||||||
| Total Institutional Service Class | (200,178 | ) | 259,613 | – | – | 1,901 | (1,497 | ) | ||||||||||||||||
| Institutional Class Shares | ||||||||||||||||||||||||
| Proceeds from shares issued | 16,879,144 | 91,638,132 | 2,986,620 | 5,950,144 | 93,396 | 382,098 | ||||||||||||||||||
| Dividends reinvested | 1,523,305 | 226,673 | 2,825,152 | 5,323,147 | 154,472 | – | ||||||||||||||||||
| Cost of shares redeemed | (29,481,537 | ) | (33,450,019 | ) | (7,205,873 | ) | (16,712,658 | ) | (215,899 | ) | (705,331 | ) | ||||||||||||
| Total Institutional Class | (11,079,088 | ) | 58,414,786 | (1,394,101 | ) | (5,439,367 | ) | 31,969 | (323,233 | ) | ||||||||||||||
| Change in net assets from capital transactions: | $ | (12,437,126 | ) | $ | 69,942,065 | $ | (1,242,881 | ) | $ | (5,465,206 | ) | $ | 1,801,434 | $ | (3,492,261 | ) | ||||||||
Amounts listed as "–" are $0 or round to $0.
See accompanying Notes to Financial Statements.
| 2022 Semi-Annual Report | 65 |
Statements of Changes in Net Assets (concluded)
| abrdn China A Share Equity Fund | abrdn Dynamic Dividend Fund | abrdn Emerging Markets ex-China Fund | ||||||||||||||||||||||
| Six-Month Period Ended April 30, 2022 (Unaudited) | Year Ended October 31, 2021 | Six-Month Period Ended April 30, 2022 (Unaudited) | Year Ended October 31, 2021 | Six-Month Period Ended April 30, 2022 (Unaudited) | Year Ended October 31, 2021 | |||||||||||||||||||
| SHARE TRANSACTIONS: | ||||||||||||||||||||||||
| Class A Shares | ||||||||||||||||||||||||
| Issued | 65,861 | 355,589 | 62,157 | 119,625 | 16,693 | 25,756 | ||||||||||||||||||
| Reinvested | 10,460 | 3,997 | 20,118 | 37,880 | 167,039 | – | ||||||||||||||||||
| Redeemed | (85,594 | ) | (191,423 | ) | (50,584 | ) | (159,465 | ) | (84,264 | ) | (194,582 | ) | ||||||||||||
| Total Class A Shares | (9,273 | ) | 168,163 | 31,691 | (1,960 | ) | 99,468 | (168,826 | ) | |||||||||||||||
| Class C Shares | ||||||||||||||||||||||||
| Issued | 7,498 | 119,782 | – | – | 107 | 13 | ||||||||||||||||||
| Reinvested | 2,941 | 847 | – | – | 1,499 | – | ||||||||||||||||||
| Redeemed | (29,388 | ) | (32,587 | ) | – | – | (798 | ) | (5,132 | ) | ||||||||||||||
| Total Class C Shares | (18,949 | ) | 88,042 | – | – | 808 | (5,119 | ) | ||||||||||||||||
| Class R Shares | ||||||||||||||||||||||||
| Issued | 12,814 | 111,825 | – | – | 4,685 | 11,483 | ||||||||||||||||||
| Reinvested | 3,406 | 1,672 | – | – | 6,395 | – | ||||||||||||||||||
| Redeemed | (29,847 | ) | (86,546 | ) | – | – | (5,392 | ) | (30,516 | ) | ||||||||||||||
| Total Class R Shares | (13,627 | ) | 26,951 | – | – | 5,688 | (19,033 | ) | ||||||||||||||||
| Institutional Service Class Shares | ||||||||||||||||||||||||
| Issued | 732 | 8,659 | – | – | – | 1 | ||||||||||||||||||
| Reinvested | 637 | 268 | – | – | 2,141 | – | ||||||||||||||||||
| Redeemed | (7,971 | ) | (2,452 | ) | – | – | (2,027 | ) | (94 | ) | ||||||||||||||
| Total Institutional Service Class Shares | (6,602 | ) | 6,475 | – | – | 114 | (93 | ) | ||||||||||||||||
| Institutional Class Shares | ||||||||||||||||||||||||
| Issued | 486,013 | 2,343,579 | 644,372 | 1,290,323 | 5,975 | 23,033 | ||||||||||||||||||
| Reinvested | 41,746 | 6,051 | 606,815 | 1,164,900 | 9,334 | – | ||||||||||||||||||
| Redeemed | (904,868 | ) | (916,518 | ) | (1,547,171 | ) | (3,696,031 | ) | (13,120 | ) | (42,843 | ) | ||||||||||||
| Total Institutional Class Shares | (377,109 | ) | 1,433,112 | (295,984 | ) | (1,240,808 | ) | 2,189 | (19,810 | ) | ||||||||||||||
| Total change in shares: | (425,560 | ) | 1,722,743 | (264,293 | ) | (1,242,768 | ) | 108,267 | (212,881 | ) | ||||||||||||||
Amounts listed as "–" are 0 or round to 0.
See accompanying Notes to Financial Statements.
| 66 | 2022 Semi-Annual Report |
Statements of Changes in Net Assets
| abrdn Emerging Markets Fund | abrdn Emerging Markets Sustainable Leaders Fund | abrdn Global Equity Impact Fund | ||||||||||||||||||||||
| Six-Month Period Ended April 30, 2022 (Unaudited) | Year Ended October 31, 2021 | Six-Month Period Ended April 30, 2022 (Unaudited) | Year Ended October 31, 2021 | Six-Month Period Ended April 30, 2022 (Unaudited) | Year Ended October 31, 2021 | |||||||||||||||||||
| FROM INVESTMENT ACTIVITIES: | ||||||||||||||||||||||||
| Operations: | ||||||||||||||||||||||||
| Net investment income | $ | 11,999,844 | $ | 33,838,906 | $ | 432,385 | $ | 844,212 | $ | 42,529 | $ | 68,336 | ||||||||||||
| Net realized gain/(loss) from investments and foreign currency transactions | 247,652,980 | 544,170,322 | (3,403,267 | ) | 72,178,595 | 2,753,100 | 6,480,101 | |||||||||||||||||
| Net change in unrealized appreciation/ (depreciation) on investments and translation of assets and liabilities denominated in foreign currencies | (1,403,927,213 | ) | 252,663,788 | (46,779,660 | ) | (33,797,673 | ) | (18,901,207 | ) | 17,354,940 | ||||||||||||||
| Changes in net assets resulting from operations | (1,144,274,389 | ) | 830,673,016 | (49,750,542 | ) | 39,225,134 | (16,105,578 | ) | 23,903,377 | |||||||||||||||
| Distributions to Shareholders From: | ||||||||||||||||||||||||
| Distributable earnings: | ||||||||||||||||||||||||
| Class A | (10,450,111 | ) | (840,787 | ) | (4,773,694 | ) | (3,298 | ) | (10,881 | ) | (139,504 | ) | ||||||||||||
| Class C | (982,396 | ) | (95,512 | ) | (230,068 | ) | – | – | – | |||||||||||||||
| Class R | (13,100,936 | ) | (929,422 | ) | (1,308,584 | ) | – | – | – | |||||||||||||||
| Institutional Service Class | (43,720,503 | ) | (3,669,233 | ) | (18,601,335 | ) | (243,818 | ) | – | – | ||||||||||||||
| Institutional Class | (397,648,558 | ) | (36,648,250 | ) | (15,010,365 | ) | (207,630 | ) | (22,288 | ) | (214,903 | ) | ||||||||||||
| Change in net assets from shareholder distributions | (465,902,504 | ) | (42,183,204 | ) | (39,924,046 | ) | (454,746 | ) | (33,169 | ) | (354,407 | ) | ||||||||||||
| Change in net assets from capital transactions | (58,428,143 | ) | 123,609,123 | 11,703,607 | (39,743,964 | ) | (5,343,412 | ) | (8,197,775 | ) | ||||||||||||||
| Change in net assets | (1,668,605,036 | ) | 912,098,935 | (77,970,981 | ) | (973,576 | ) | (21,482,159 | ) | 15,351,195 | ||||||||||||||
| Net Assets: | ||||||||||||||||||||||||
| Beginning of period | 4,921,452,919 | 4,009,353,984 | 216,399,633 | 217,373,209 | 75,370,552 | 60,019,357 | ||||||||||||||||||
| End of period | $ | 3,252,847,883 | $ | 4,921,452,919 | $ | 138,428,652 | $ | 216,399,633 | $ | 53,888,393 | $ | 75,370,552 | ||||||||||||
Amounts listed as "–" are $0 or round to $0.
See accompanying Notes to Financial Statements.
| 2022 Semi-Annual Report | 67 |
Statements of Changes in Net Assets (continued)
| abrdn Emerging Markets Fund | abrdn Emerging Markets Sustainable Leaders Fund | abrdn Global Equity Impact Fund | ||||||||||||||||||||||
| Six-Month Period Ended April 30, 2022 (Unaudited) | Year Ended October 31, 2021 | Six-Month Period Ended April 30, 2022 (Unaudited) | Year Ended October 31, 2021 | Six-Month Period Ended April 30, 2022 (Unaudited) | Year Ended October 31, 2021 | |||||||||||||||||||
| CAPITAL TRANSACTIONS: | ||||||||||||||||||||||||
| Class A Shares | ||||||||||||||||||||||||
| Proceeds from shares issued | $ | 14,167,392 | $ | 44,072,988 | $ | 1,149,099 | $ | 3,287,050 | $ | 958,663 | $ | 3,242,022 | ||||||||||||
| Dividends reinvested | 7,804,763 | 582,889 | 4,278,213 | 2,916 | 10,348 | 136,271 | ||||||||||||||||||
| Cost of shares redeemed | (22,053,645 | ) | (57,713,958 | ) | (4,166,979 | ) | (5,020,426 | ) | (3,443,707 | ) | (5,364,495 | ) | ||||||||||||
| Total Class A | (81,490 | ) | (13,058,081 | ) | 1,260,333 | (1,730,460 | ) | (2,474,696 | ) | (1,986,202 | ) | |||||||||||||
| Class C Shares | ||||||||||||||||||||||||
| Proceeds from shares issued | 204,706 | 1,441,890 | – | 79,312 | – | – | ||||||||||||||||||
| Dividends reinvested | 783,716 | 77,269 | 230,068 | – | – | – | ||||||||||||||||||
| Cost of shares redeemed | (1,598,998 | ) | (4,997,733 | ) | (498,486 | ) | (1,871,902 | ) | – | – | ||||||||||||||
| Total Class C | (610,576 | ) | (3,478,574 | ) | (268,418 | ) | (1,792,590 | ) | – | – | ||||||||||||||
| Class R Shares | ||||||||||||||||||||||||
| Proceeds from shares issued | 10,004,119 | 11,577,172 | 379,367 | 3,183,934 | – | – | ||||||||||||||||||
| Dividends reinvested | 13,078,200 | 926,091 | 1,306,259 | – | – | – | ||||||||||||||||||
| Cost of shares redeemed | (2,412,793 | ) | (15,143,748 | ) | (2,319,660 | ) | (854,393 | ) | – | – | ||||||||||||||
| Total Class R | 20,669,526 | (2,640,485 | ) | (634,034 | ) | 2,329,541 | – | – | ||||||||||||||||
| Institutional Service Class Shares | ||||||||||||||||||||||||
| Proceeds from shares issued | 465,668,495 | 70,197,666 | 511,556 | 4,136,896 | – | – | ||||||||||||||||||
| Dividends reinvested | 43,708,321 | 3,668,031 | 17,726,195 | 230,323 | – | – | ||||||||||||||||||
| Cost of shares redeemed | (268,556,422 | ) | (32,891,462 | ) | (6,102,843 | ) | (9,685,115 | ) | – | – | ||||||||||||||
| Total Institutional Service Class | 240,820,394 | 40,974,235 | 12,134,908 | (5,317,896 | ) | – | – | |||||||||||||||||
| Institutional Class Shares | ||||||||||||||||||||||||
| Proceeds from shares issued | 389,256,176 | 1,310,442,243 | 5,371,953 | 56,283,383 | 221,277 | 604,566 | ||||||||||||||||||
| Dividends reinvested | 292,773,343 | 27,712,844 | 14,948,995 | 206,400 | 19,988 | 195,614 | ||||||||||||||||||
| Cost of shares redeemed | (1,001,255,516 | ) | (1,236,343,059 | ) | (21,110,130 | ) | (89,722,342 | ) | (3,109,981 | ) | (7,011,753 | ) | ||||||||||||
| Total Institutional Class | (319,225,997 | ) | 101,812,028 | (789,182 | ) | (33,232,559 | ) | (2,868,716 | ) | (6,211,573 | ) | |||||||||||||
| Change in net assets from capital transactions: | $ | (58,428,143 | ) | $ | 123,609,123 | $ | 11,703,607 | $ | (39,743,964 | ) | $ | (5,343,412 | ) | $ | (8,197,775 | ) | ||||||||
Amounts listed as "–" are $0 or round to $0.
See accompanying Notes to Financial Statements.
| 68 | 2022 Semi-Annual Report |
Statements of Changes in Net Assets (concluded)
| abrdn Emerging Markets Fund | abrdn Emerging Markets Sustainable Leaders Fund | abrdn Global Equity Impact Fund | |||||||||||||||||||||||
| Six-Month Period Ended April 30, 2022 (Unaudited) | Year Ended October 31, 2021 | Six-Month Period Ended April 30, 2022 (Unaudited) | Year Ended October 31, 2021 | Six-Month Period Ended April 30, 2022 (Unaudited) | Year Ended October 31, 2021 | ||||||||||||||||||||
| SHARE TRANSACTIONS: | |||||||||||||||||||||||||
| Class A Shares | |||||||||||||||||||||||||
| Issued | 863,830 | 2,135,263 | 77,811 | 171,270 | 58,200 | 206,363 | |||||||||||||||||||
| Reinvested | 460,186 | 29,999 | 314,575 | 161 | 593 | 8,912 | |||||||||||||||||||
| Redeemed | (1,272,305 | ) | (2,802,093 | ) | (295,557 | ) | (262,985 | ) | (214,811 | ) | (329,366 | ) | |||||||||||||
| Total Class A Shares | 51,711 | (636,831 | ) | 96,829 | (91,554 | ) | (156,018 | ) | (114,091 | ) | |||||||||||||||
| Class C Shares | |||||||||||||||||||||||||
| Issued | 12,230 | 69,251 | – | 4,498 | – | – | |||||||||||||||||||
| Reinvested | 46,845 | 4,008 | 18,509 | – | – | – | |||||||||||||||||||
| Redeemed | (97,626 | ) | (244,367 | ) | (40,974 | ) | (103,046 | ) | – | – | |||||||||||||||
| Total Class C Shares | (38,551 | ) | (171,108 | ) | (22,465 | ) | (98,548 | ) | – | – | |||||||||||||||
| Class R Shares | |||||||||||||||||||||||||
| Issued | 632,219 | 570,983 | 29,173 | 173,550 | – | – | |||||||||||||||||||
| Reinvested | 782,189 | 48,234 | 102,693 | – | – | – | |||||||||||||||||||
| Redeemed | (145,326 | ) | (746,651 | ) | (199,848 | ) | (47,386 | ) | – | – | |||||||||||||||
| Total Class R Shares | 1,269,082 | (127,434 | ) | (67,982 | ) | 126,164 | – | – | |||||||||||||||||
| Institutional Service Class Shares | |||||||||||||||||||||||||
| Issued | 31,497,581 | 3,428,774 | 36,839 | 207,050 | – | – | |||||||||||||||||||
| Reinvested | 2,572,591 | 188,297 | 1,267,062 | 12,443 | – | – | |||||||||||||||||||
| Redeemed | (17,949,545 | ) | (1,616,390 | ) | (422,852 | ) | (498,200 | ) | – | – | |||||||||||||||
| Total Institutional Service Class Shares | 16,120,627 | 2,000,681 | 881,049 | (278,707 | ) | – | – | ||||||||||||||||||
| Institutional Class Shares | |||||||||||||||||||||||||
| Issued | 23,365,634 | 62,992,325 | 366,613 | 2,828,408 | 13,412 | 36,993 | |||||||||||||||||||
| Reinvested | 17,171,457 | 1,418,989 | 1,062,473 | 11,097 | 1,142 | 12,794 | |||||||||||||||||||
| Redeemed | (60,599,603 | ) | (60,646,610 | ) | (1,247,239 | ) | (4,765,341 | ) | (192,692 | ) | (414,603 | ) | |||||||||||||
| Total Institutional Class Shares | (20,062,512 | ) | 3,764,704 | 181,847 | (1,925,836 | ) | (178,138 | ) | (364,816 | ) | |||||||||||||||
| Total change in shares: | (2,659,643 | ) | 4,830,012 | 1,069,278 | (2,268,481 | ) | (334,156 | ) | (478,907 | ) | |||||||||||||||
Amounts listed as "–" are 0 or round to 0.
See accompanying Notes to Financial Statements.
| 2022 Semi-Annual Report | 69 |
Statements of Changes in Net Assets
| abrdn Global Infrastructure Fund | abrdn International Real Estate Equity Fund | abrdn International Small Cap Fund | |||||||||||||||||||||||
| Six-Month Period Ended April 30, 2022 (Unaudited) | Year Ended October 31, 2021 | Six-Month Period Ended April 30, 2022 (Unaudited) | Year Ended October 31, 2021 | Six-Month Period Ended April 30, 2022 (Unaudited) | Year Ended October 31, 2021 | ||||||||||||||||||||
| FROM INVESTMENT ACTIVITIES: | |||||||||||||||||||||||||
| Operations: | |||||||||||||||||||||||||
| Net investment income/(loss) | $ | 684,718 | $ | 1,149,222 | $ | 126,376 | $ | 441,963 | $ | 1,700,106 | $ | (737,373 | ) | ||||||||||||
| Net realized gain/(loss) from investments and foreign currency transactions | 2,568,550 | 2,315,989 | (352,215 | ) | 1,188,269 | (3,360,427 | ) | 24,053,691 | |||||||||||||||||
| Net change in unrealized appreciation/ (depreciation) on investments and translation of assets and liabilities denominated in foreign currencies | (3,978,478 | ) | 9,547,124 | (1,913,140 | ) | 2,064,797 | (97,310,010 | ) | 45,444,052 | ||||||||||||||||
| Changes in net assets resulting from operations | (725,210 | ) | 13,012,335 | (2,138,979 | ) | 3,695,029 | (98,970,331 | ) | 68,760,370 | ||||||||||||||||
| Distributions to Shareholders From: | |||||||||||||||||||||||||
| Distributable earnings: | |||||||||||||||||||||||||
| Class A | (352,710 | ) | (357,482 | ) | (1,497 | ) | (447 | ) | (7,629,460 | ) | – | ||||||||||||||
| Class C | – | – | – | – | (43,299 | ) | – | ||||||||||||||||||
| Class R | – | – | – | – | (178,327 | ) | – | ||||||||||||||||||
| Institutional Class | (1,180,476 | ) | (1,335,765 | ) | (796,185 | ) | (772,267 | ) | (14,015,543 | ) | – | ||||||||||||||
| Change in net assets from shareholder distributions | (1,533,186 | ) | (1,693,247 | ) | (797,682 | ) | (772,714 | ) | (21,866,629 | ) | – | ||||||||||||||
| Change in net assets from capital transactions | (1,202,378 | ) | 5,138,930 | (1,010,149 | ) | (2,314,278 | ) | 79,578,733 | 98,893,077 | ||||||||||||||||
| Change in net assets | (3,460,774 | ) | 16,458,018 | (3,946,810 | ) | 608,037 | (41,258,227 | ) | 167,653,447 | ||||||||||||||||
| Net Assets: | |||||||||||||||||||||||||
| Beginning of period | 58,303,478 | 41,845,460 | 21,199,062 | 20,591,025 | 306,747,145 | 139,093,698 | |||||||||||||||||||
| End of period | $ | 54,842,704 | $ | 58,303,478 | $ | 17,252,252 | $ | 21,199,062 | $ | 265,488,918 | $ | 306,747,145 | |||||||||||||
Amounts listed as "–" are $0 or round to $0.
See accompanying Notes to Financial Statements.
| 70 | 2022 Semi-Annual Report |
Statements of Changes in Net Assets (continued)
| abrdn Global Infrastructure Fund | abrdn International Real Estate Equity Fund | abrdn International Small Cap Fund | |||||||||||||||||||||||
| Six-Month Period Ended April 30, 2022 (Unaudited) | Year Ended October 31, 2021 | Six-Month Period Ended April 30, 2022 (Unaudited) | Year Ended October 31, 2021 | Six-Month Period Ended April 30, 2022 (Unaudited) | Year Ended October 31, 2021 | ||||||||||||||||||||
| CAPITAL TRANSACTIONS: | |||||||||||||||||||||||||
| Class A Shares | |||||||||||||||||||||||||
| Proceeds from shares issued | $ | 1,302,094 | $ | 3,399,084 | $ | 1,811 | $ | 17,982 | $ | 8,324,944 | $ | 35,856,728 | |||||||||||||
| Dividends reinvested | 294,785 | 291,973 | 993 | 259 | 7,350,418 | – | |||||||||||||||||||
| Cost of shares redeemed | (1,101,032 | ) | (2,176,253 | ) | (2,529 | ) | (3,899 | ) | (13,529,996 | ) | (49,254,721 | ) | |||||||||||||
| Total Class A | 495,847 | 1,514,804 | 275 | 14,342 | 2,145,366 | (13,397,993 | ) | ||||||||||||||||||
| Class C Shares | |||||||||||||||||||||||||
| Proceeds from shares issued | – | – | – | – | 38,286 | 161,335 | |||||||||||||||||||
| Dividends reinvested | – | – | – | – | 43,299 | – | |||||||||||||||||||
| Cost of shares redeemed | – | – | – | – | (8,507 | ) | (356,629 | ) | |||||||||||||||||
| Total Class C | – | – | – | – | 73,078 | (195,294 | ) | ||||||||||||||||||
| Class R Shares | |||||||||||||||||||||||||
| Proceeds from shares issued | – | – | – | – | 516,559 | 726,609 | |||||||||||||||||||
| Dividends reinvested | – | – | – | – | 178,046 | – | |||||||||||||||||||
| Cost of shares redeemed | – | – | – | – | (302,134 | ) | (548,023 | ) | |||||||||||||||||
| Total Class R | – | – | – | – | 392,471 | 178,586 | |||||||||||||||||||
| Institutional Class Shares | |||||||||||||||||||||||||
| Proceeds from shares issued | 1,118,335 | 9,837,291 | 55,589 | 103,706 | 105,537,581 | 132,013,360 | |||||||||||||||||||
| Dividends reinvested | 1,162,325 | 1,312,012 | 767,767 | 750,678 | 13,937,907 | – | |||||||||||||||||||
| Cost of shares redeemed | (3,978,885 | ) | (7,525,177 | ) | (1,833,780 | ) | (3,183,004 | ) | (42,507,670 | ) | (19,705,582 | ) | |||||||||||||
| Total Institutional Class | (1,698,225 | ) | 3,624,126 | (1,010,424 | ) | (2,328,620 | ) | 76,967,818 | 112,307,778 | ||||||||||||||||
| Change in net assets from capital transactions: | $ | (1,202,378 | ) | $ | 5,138,930 | $ | (1,010,149 | ) | $ | (2,314,278 | ) | $ | 79,578,733 | $ | 98,893,077 | ||||||||||
Amounts listed as "–" are $0 or round to $0.
See accompanying Notes to Financial Statements.
| 2022 Semi-Annual Report | 71 |
Statements of Changes in Net Assets (concluded)
| abrdn Global Infrastructure Fund | abrdn International Real Estate Equity Fund | abrdn International Small Cap Fund | |||||||||||||||||||||||
| Six-Month Period Ended April 30, 2022 (Unaudited) | Year Ended October 31, 2021 | Six-Month Period Ended April 30, 2022 (Unaudited) | Year Ended October 31, 2021 | Six-Month Period Ended April 30, 2022 (Unaudited) | Year Ended October 31, 2021 | ||||||||||||||||||||
| SHARE TRANSACTIONS: | |||||||||||||||||||||||||
| Class A Shares | |||||||||||||||||||||||||
| Issued | 54,349 | 143,830 | 99 | 883 | 221,376 | 973,407 | |||||||||||||||||||
| Reinvested | 12,466 | 12,790 | 52 | 13 | 192,470 | – | |||||||||||||||||||
| Redeemed | (46,322 | ) | (93,312 | ) | (136 | ) | (195 | ) | (401,803 | ) | (1,343,639 | ) | |||||||||||||
| Total Class A Shares | 20,493 | 63,308 | 15 | 701 | 12,043 | (370,232 | ) | ||||||||||||||||||
| Class C Shares | |||||||||||||||||||||||||
| Issued | – | – | – | – | 1,189 | 4,708 | |||||||||||||||||||
| Reinvested | – | – | – | – | 1,281 | – | |||||||||||||||||||
| Redeemed | – | – | – | – | (253 | ) | (10,448 | ) | |||||||||||||||||
| Total Class C Shares | – | – | – | – | 2,217 | (5,740 | ) | ||||||||||||||||||
| Class R Shares | |||||||||||||||||||||||||
| Issued | – | – | – | – | 16,462 | 20,419 | |||||||||||||||||||
| Reinvested | – | – | – | – | 5,013 | – | |||||||||||||||||||
| Redeemed | – | – | – | – | (8,903 | ) | (15,252 | ) | |||||||||||||||||
| Total Class R Shares | – | – | – | – | 12,572 | 5,167 | |||||||||||||||||||
| Institutional Class Shares | |||||||||||||||||||||||||
| Issued | 46,576 | 417,957 | 2,909 | 5,034 | 2,982,318 | 3,426,460 | |||||||||||||||||||
| Reinvested | 49,066 | 57,376 | 40,345 | 39,077 | 360,992 | – | |||||||||||||||||||
| Redeemed | (166,252 | ) | (327,354 | ) | (94,947 | ) | (157,574 | ) | (1,269,306 | ) | (520,211 | ) | |||||||||||||
| Total Institutional Class Shares | (70,610 | ) | 147,979 | (51,693 | ) | (113,463 | ) | 2,074,004 | 2,906,249 | ||||||||||||||||
| Total change in shares: | (50,117 | ) | 211,287 | (51,678 | ) | (112,762 | ) | 2,100,836 | 2,535,444 | ||||||||||||||||
Amounts listed as "–" are 0 or round to 0.
See accompanying Notes to Financial Statements.
| 72 | 2022 Semi-Annual Report |
Statements of Changes in Net Assets
| abrdn International Sustainable Leaders Fund | abrdn Realty Income & Growth Fund | abrdn U.S. Small Cap Equity Fund | |||||||||||||||||||||||
| Six-Month Period Ended April 30, 2022 (Unaudited) | Year Ended October 31, 2021 | Six-Month Period Ended April 30, 2022 (Unaudited) | Year Ended October 31, 2021 | Six-Month Period Ended April 30, 2022 (Unaudited) | Year Ended October 31, 2021 | ||||||||||||||||||||
| FROM INVESTMENT ACTIVITIES: | |||||||||||||||||||||||||
| Operations: | |||||||||||||||||||||||||
| Net investment income/(loss) | $ | 2,445 | $ | (448,882 | ) | $ | 536,596 | $ | 535,640 | $ | (2,268,486 | ) | $ | (3,170,915 | ) | ||||||||||
| Net realized gain from investments, futures, written options, credit default swaps, forward foreign currency exchange contracts and foreign currency transactions | 1,547,694 | 33,560,115 | 2,847,652 | 7,737,328 | 78,977,261 | 254,359,887 | |||||||||||||||||||
| Net change in unrealized appreciation/ (depreciation) on investments, futures, forward foreign currency exchange contracts and translation of assets and liabilities denominated in foreign currencies | (40,304,227 | ) | 6,867,462 | (4,184,911 | ) | 10,847,684 | (326,745,085 | ) | 172,320,085 | ||||||||||||||||
| Changes in net assets resulting from operations | (38,754,088 | ) | 39,978,695 | (800,663 | ) | 19,120,652 | (250,036,310 | ) | 423,509,057 | ||||||||||||||||
| Distributions to Shareholders From: | |||||||||||||||||||||||||
| Distributable earnings: | |||||||||||||||||||||||||
| Class A | – | (712,615 | ) | (137,569 | ) | (132,211 | ) | (33,412,568 | ) | (8,820,880 | ) | ||||||||||||||
| Class C | – | – | – | – | (10,627,887 | ) | (3,106,149 | ) | |||||||||||||||||
| Class R | – | – | – | – | (1,193,211 | ) | (263,620 | ) | |||||||||||||||||
| Institutional Service Class | – | – | – | – | (7,641,334 | ) | (2,057,615 | ) | |||||||||||||||||
| Institutional Class | – | (218,647 | ) | (7,369,818 | ) | (6,158,978 | ) | (170,135,539 | ) | (35,151,160 | ) | ||||||||||||||
| Change in net assets from shareholder distributions | – | (931,262 | ) | (7,507,387 | ) | (6,291,189 | ) | (223,010,539 | ) | (49,399,424 | ) | ||||||||||||||
| Change in net assets from capital transactions | (7,555,616 | ) | (14,542,170 | ) | 4,203,924 | (3,351,392 | ) | 152,863,677 | 88,369,619 | ||||||||||||||||
| Change in net assets | (46,309,704 | ) | 24,505,263 | (4,104,126 | ) | 9,478,071 | (320,183,172 | ) | 462,479,252 | ||||||||||||||||
| Net Assets: | |||||||||||||||||||||||||
| Beginning of period | 145,332,483 | 120,827,220 | 57,683,418 | 48,205,347 | 1,195,847,092 | 733,367,840 | |||||||||||||||||||
| End of period | $ | 99,022,779 | $ | 145,332,483 | $ | 53,579,292 | $ | 57,683,418 | $ | 875,663,920 | $ | 1,195,847,092 | |||||||||||||
Amounts listed as "–" are $0 or round to $0.
See accompanying Notes to Financial Statements.
| 2022 Semi-Annual Report | 73 |
Statements of Changes in Net Assets (continued)
| abrdn International Sustainable Leaders Fund | abrdn Realty Income & Growth Fund | abrdn U.S. Small Cap Equity Fund | ||||||||||||||||||||||
| Six-Month Period Ended April 30, 2022 (Unaudited) | Year Ended October 31, 2021 | Six-Month Period Ended April 30, 2022 (Unaudited) | Year Ended October 31, 2021 | Six-Month Period Ended April 30, 2022 (Unaudited) | Year Ended October 31, 2021 | |||||||||||||||||||
| CAPITAL TRANSACTIONS: | ||||||||||||||||||||||||
| Class A Shares | ||||||||||||||||||||||||
| Proceeds from shares issued | $ | 421,437 | $ | 1,159,778 | $ | 142,312 | $ | 242,415 | $ | 13,210,261 | $ | 23,006,316 | ||||||||||||
| Dividends reinvested | – | 697,660 | 121,584 | 118,055 | 26,361,790 | 7,112,684 | ||||||||||||||||||
| Cost of shares redeemed | (5,896,375 | ) | (15,087,013 | ) | (461,122 | ) | (1,560,020 | ) | (22,987,662 | ) | (40,856,034 | ) | ||||||||||||
| Total Class A | (5,474,938 | ) | (13,229,575 | ) | (197,226 | ) | (1,199,550 | ) | 16,584,389 | (10,737,034 | ) | |||||||||||||
| Class C Shares | ||||||||||||||||||||||||
| Proceeds from shares issued | – | – | – | – | 1,619,904 | 3,386,802 | ||||||||||||||||||
| Dividends reinvested | – | – | – | – | 9,893,910 | 2,630,798 | ||||||||||||||||||
| Cost of shares redeemed | – | – | – | – | (5,612,477 | ) | (13,933,885 | ) | ||||||||||||||||
| Total Class C | – | – | – | – | 5,901,337 | (7,916,285 | ) | |||||||||||||||||
| Class R Shares | ||||||||||||||||||||||||
| Proceeds from shares issued | – | – | – | – | 253,576 | 1,023,812 | ||||||||||||||||||
| Dividends reinvested | – | – | – | – | 1,152,789 | 246,182 | ||||||||||||||||||
| Cost of shares redeemed | – | – | – | – | (543,309 | ) | (1,069,593 | ) | ||||||||||||||||
| Total Class R | – | – | – | – | 863,056 | 200,401 | ||||||||||||||||||
| Institutional Service Class Shares | ||||||||||||||||||||||||
| Proceeds from shares issued | – | – | – | – | 3,897,086 | 6,191,761 | ||||||||||||||||||
| Dividends reinvested | – | – | – | – | 7,333,017 | 1,986,418 | ||||||||||||||||||
| Cost of shares redeemed | – | – | – | – | (3,950,281 | ) | (12,716,020 | ) | ||||||||||||||||
| Total Institutional Service Class | – | – | – | – | 7,279,822 | (4,537,841 | ) | |||||||||||||||||
| Institutional Class Shares | ||||||||||||||||||||||||
| Proceeds from shares issued | 310,992 | 1,133,183 | 768,799 | 1,558,600 | 158,290,953 | 291,313,162 | ||||||||||||||||||
| Dividends reinvested | – | 207,612 | 7,189,205 | 5,990,413 | 142,349,678 | 29,290,180 | ||||||||||||||||||
| Cost of shares redeemed | (2,391,670 | ) | (2,653,390 | ) | (3,556,854 | ) | (9,700,855 | ) | (178,405,558 | ) | (209,242,964 | ) | ||||||||||||
| Total Institutional Class | (2,080,678 | ) | (1,312,595 | ) | 4,401,150 | (2,151,842 | ) | 122,235,073 | 111,360,378 | |||||||||||||||
| Change in net assets from capital transactions: | $ | (7,555,616 | ) | $ | (14,542,170 | ) | $ | 4,203,924 | $ | (3,351,392 | ) | $ | 152,863,677 | $ | 88,369,619 | |||||||||
Amounts listed as "–" are $0 or round to $0.
See accompanying Notes to Financial Statements.
| 74 | 2022 Semi-Annual Report |
Statements of Changes in Net Assets (concluded)
| abrdn International Sustainable Leaders Fund | abrdn Realty Income & Growth Fund | abrdn U.S. Small Cap Equity Fund | ||||||||||||||||||||||
| Six-Month Period Ended April 30, 2022 (Unaudited) | Year Ended October 31, 2021 | Six-Month Period Ended April 30, 2022 (Unaudited) | Year Ended October 31, 2021 | Six-Month Period Ended April 30, 2022 (Unaudited) | Year Ended October 31, 2021 | |||||||||||||||||||
| SHARE TRANSACTIONS: | ||||||||||||||||||||||||
| Class A Shares | ||||||||||||||||||||||||
| Issued | 13,913 | 35,557 | 10,116 | 17,991 | 333,386 | 538,007 | ||||||||||||||||||
| Reinvested | – | 23,040 | 8,487 | 9,766 | 674,560 | 185,082 | ||||||||||||||||||
| Redeemed | (192,945 | ) | (469,556 | ) | (32,450 | ) | (117,101 | ) | (593,701 | ) | (950,207 | ) | ||||||||||||
| Total Class A Shares | (179,032 | ) | (410,959 | ) | (13,847 | ) | (89,344 | ) | 414,245 | (227,118 | ) | |||||||||||||
| Class C Shares | ||||||||||||||||||||||||
| Issued | – | – | – | – | 54,501 | 100,138 | ||||||||||||||||||
| Reinvested | – | – | – | – | 336,528 | 84,809 | ||||||||||||||||||
| Redeemed | – | – | – | – | (192,020 | ) | (404,364 | ) | ||||||||||||||||
| Total Class C Shares | – | – | – | – | 199,009 | (219,417 | ) | |||||||||||||||||
| Class R Shares | ||||||||||||||||||||||||
| Issued | – | – | – | – | 7,308 | 26,643 | ||||||||||||||||||
| Reinvested | – | – | – | – | 34,268 | 7,188 | ||||||||||||||||||
| Redeemed | – | – | – | – | (16,901 | ) | (29,099 | ) | ||||||||||||||||
| Total Class R Shares | – | – | – | – | 24,675 | 4,732 | ||||||||||||||||||
| Institutional Service Class Shares | ||||||||||||||||||||||||
| Issued | – | – | – | – | 96,573 | 131,919 | ||||||||||||||||||
| Reinvested | – | – | – | – | 170,021 | 47,854 | ||||||||||||||||||
| Redeemed | – | – | – | – | (95,803 | ) | (279,784 | ) | ||||||||||||||||
| Total Institutional Service Class Shares | – | – | – | – | 170,791 | (100,011 | ) | |||||||||||||||||
| Institutional Class Shares | ||||||||||||||||||||||||
| Issued | 10,331 | 33,788 | 51,024 | 112,658 | 3,809,356 | 6,279,695 | ||||||||||||||||||
| Reinvested | – | 6,676 | 499,504 | 492,542 | 3,292,845 | 704,938 | ||||||||||||||||||
| Redeemed | (72,443 | ) | (81,282 | ) | (242,651 | ) | (726,895 | ) | (4,331,391 | ) | (4,532,758 | ) | ||||||||||||
| Total Institutional Class Shares | (62,112 | ) | (40,818 | ) | 307,877 | (121,695 | ) | 2,770,810 | 2,451,875 | |||||||||||||||
| Total change in shares: | (241,144 | ) | (451,777 | ) | 294,030 | (211,039 | ) | 3,579,530 | 1,910,061 | |||||||||||||||
Amounts listed as "–" are 0 or round to 0.
See accompanying Notes to Financial Statements.
| 2022 Semi-Annual Report | 75 |
Statements of Changes in Net Assets
| abrdn U.S. Sustainable Leaders Fund | abrdn U.S. Sustainable Leaders Smaller Companies Fund | |||||||||||||||
| Six-Month Period Ended April 30, 2022 (Unaudited) | Year Ended October 31, 2021 | Six-Month Period Ended April 30, 2022 (Unaudited) | Year Ended October 31, 2021 | |||||||||||||
| FROM INVESTMENT ACTIVITIES: | ||||||||||||||||
| Operations: | ||||||||||||||||
| Net investment loss | $ | (768,179 | ) | $ | (1,201,535 | ) | $ | (45,878 | ) | $ | (70,825 | ) | ||||
| Net realized gain from investments and foreign currency transactions | 27,164,397 | 131,925,314 | 684,063 | 6,101,911 | ||||||||||||
| Net change in unrealized appreciation/(depreciation) on investments and translation of assets and liabilities denominated in foreign currencies | (117,281,856 | ) | 27,391,542 | (5,899,216 | ) | 813,341 | ||||||||||
| Changes in net assets resulting from operations | (90,885,638 | ) | 158,115,321 | (5,261,031 | ) | 6,844,427 | ||||||||||
| Distributions to Shareholders From: | ||||||||||||||||
| Distributable earnings: | ||||||||||||||||
| Class A | (86,439,173 | ) | (32,838,262 | ) | (2,703,472 | ) | (901,851 | ) | ||||||||
| Class C | (101,349 | ) | (162,943 | ) | (181,578 | ) | (230,092 | ) | ||||||||
| Class R | – | – | (775,300 | ) | (271,918 | ) | ||||||||||
| Institutional Service Class | (36,416,872 | ) | (13,939,695 | ) | (115,420 | ) | (32,120 | ) | ||||||||
| Institutional Class | (3,524,570 | ) | (1,285,641 | ) | (1,464,436 | ) | (382,181 | ) | ||||||||
| Change in net assets from shareholder distributions | (126,481,964 | ) | (48,226,541 | ) | (5,240,206 | ) | (1,818,162 | ) | ||||||||
| Change in net assets from capital transactions | 93,486,395 | 10,897,865 | 9,440,047 | 509,577 | ||||||||||||
| Change in net assets | (123,881,207 | ) | 120,786,645 | (1,061,190 | ) | 5,535,842 | ||||||||||
| Net Assets: | ||||||||||||||||
| Beginning of period | 519,500,605 | 398,713,960 | 19,425,858 | 13,890,016 | ||||||||||||
| End of period | $ | 395,619,398 | $ | 519,500,605 | $ | 18,364,668 | $ | 19,425,858 | ||||||||
Amounts listed as "–" are $0 or round to $0.
See accompanying Notes to Financial Statements.
| 76 | 2022 Semi-Annual Report |
Statements of Changes in Net Assets (continued)
| abrdn U.S. Sustainable Leaders Fund | abrdn U.S. Sustainable Leaders Smaller Companies Fund | |||||||||||||||
| Six-Month Period Ended April 30, 2022 (Unaudited) | Year Ended October 31, 2021 | Six-Month Period Ended April 30, 2022 (Unaudited) | Year Ended October 31, 2021 | |||||||||||||
| CAPITAL TRANSACTIONS: | ||||||||||||||||
| Class A Shares | ||||||||||||||||
| Proceeds from shares issued | $ | 2,284,332 | $ | 3,192,815 | $ | 4,504,508 | $ | 810,347 | ||||||||
| Dividends reinvested | 79,023,829 | 29,872,297 | 2,304,020 | 763,859 | ||||||||||||
| Cost of shares redeemed | (18,347,567 | ) | (24,314,645 | ) | (1,678,873 | ) | (1,960,220 | ) | ||||||||
| Total Class A | 62,960,594 | 8,750,467 | 5,129,655 | (386,014 | ) | |||||||||||
| Class C Shares | ||||||||||||||||
| Proceeds from shares issued | 43,961 | 19,828 | 619,618 | 92,440 | ||||||||||||
| Dividends reinvested | 101,349 | 157,978 | 168,111 | 227,027 | ||||||||||||
| Cost of shares redeemed | (26,679 | ) | (1,113,057 | ) | (543,841 | ) | (210,112 | ) | ||||||||
| Total Class C | 118,631 | (935,251 | ) | 243,888 | 109,355 | |||||||||||
| Class R Shares | ||||||||||||||||
| Proceeds from shares issued | – | – | 496,027 | 563,910 | ||||||||||||
| Dividends reinvested | – | – | 775,300 | 271,918 | ||||||||||||
| Cost of shares redeemed | – | – | (389,639 | ) | (465,547 | ) | ||||||||||
| Total Class R | – | – | 881,688 | 370,281 | ||||||||||||
| Institutional Service Class Shares | ||||||||||||||||
| Proceeds from shares issued | 524,056 | 1,380,446 | 719,182 | 85,854 | ||||||||||||
| Dividends reinvested | 35,857,287 | 13,645,836 | 115,420 | 32,120 | ||||||||||||
| Cost of shares redeemed | (7,965,392 | ) | (12,669,731 | ) | (364,393 | ) | (367,340 | ) | ||||||||
| Total Institutional Service Class | 28,415,951 | 2,356,551 | 470,209 | (249,366 | ) | |||||||||||
| Institutional Class Shares | ||||||||||||||||
| Proceeds from shares issued | 1,340,234 | 2,316,376 | 2,758,569 | 1,040,176 | ||||||||||||
| Dividends reinvested | 3,445,850 | 1,257,892 | 1,429,154 | 369,548 | ||||||||||||
| Cost of shares redeemed | (2,794,865 | ) | (2,848,170 | ) | (1,473,116 | ) | (744,403 | ) | ||||||||
| �� Total Institutional Class | 1,991,219 | 726,098 | 2,714,607 | 665,321 | ||||||||||||
| Change in net assets from capital transactions: | $ | 93,486,395 | $ | 10,897,865 | $ | 9,440,047 | $ | 509,577 | ||||||||
Amounts listed as "–" are $0 or round to $0.
See accompanying Notes to Financial Statements.
| 2022 Semi-Annual Report | 77 |
Statements of Changes in Net Assets (concluded)
| abrdn U.S. Sustainable Leaders Fund | abrdn U.S. Sustainable Leaders Smaller Companies Fund | |||||||||||||||
| Six-Month Period Ended April 30, 2022 (Unaudited) | Year Ended October 31, 2021 | Six-Month Period Ended April 30, 2022 (Unaudited) | Year Ended October 31, 2021 | |||||||||||||
| SHARE TRANSACTIONS: | ||||||||||||||||
| Class A Shares | ||||||||||||||||
| Issued | 179,462 | 213,509 | 532,533 | 81,901 | ||||||||||||
| Reinvested | 6,125,878 | 2,159,963 | 272,343 | 88,205 | ||||||||||||
| Redeemed | (1,448,313 | ) | (1,629,190 | ) | (219,407 | ) | (208,896 | ) | ||||||||
| Total Class A Shares | 4,857,027 | 744,282 | 585,469 | (38,790 | ) | |||||||||||
| Class C Shares | ||||||||||||||||
| Issued | 4,632 | 1,518 | 509,730 | 66,551 | ||||||||||||
| Reinvested | 10,839 | 14,271 | 142,467 | 190,779 | ||||||||||||
| Redeemed | (2,654 | ) | (92,517 | ) | (516,991 | ) | (126,431 | ) | ||||||||
| Total Class C Shares | 12,817 | (76,728 | ) | 135,206 | 130,899 | |||||||||||
| Class R Shares | ||||||||||||||||
| Issued | – | – | 64,480 | 66,118 | ||||||||||||
| Reinvested | – | – | 106,938 | 36,401 | ||||||||||||
| Redeemed | – | – | (54,989 | ) | (56,150 | ) | ||||||||||
| Total Class R Shares | – | – | 116,429 | 46,369 | ||||||||||||
| Institutional Service Class Shares | ||||||||||||||||
| Issued | 35,556 | 87,358 | 76,097 | 8,071 | ||||||||||||
| Reinvested | 2,472,916 | 905,497 | 12,954 | 3,526 | ||||||||||||
| Redeemed | (564,627 | ) | (775,538 | ) | (48,080 | ) | (38,207 | ) | ||||||||
| Total Institutional Service Class Shares | 1,943,845 | 217,317 | 40,971 | (26,610 | ) | |||||||||||
| Institutional Class Shares | ||||||||||||||||
| Issued | 89,649 | 139,481 | 297,839 | 93,140 | ||||||||||||
| Reinvested | 235,856 | 83,029 | 152,851 | 38,859 | ||||||||||||
| Redeemed | (203,851 | ) | (170,668 | ) | (167,359 | ) | (72,045 | ) | ||||||||
| Total Institutional Class Shares | 121,654 | 51,842 | 283,331 | 59,954 | ||||||||||||
| Total change in shares: | 6,935,343 | 936,713 | 1,161,406 | 171,822 | ||||||||||||
Amounts listed as "–" are 0 or round to 0.
See accompanying Notes to Financial Statements.
| 78 | 2022 Semi-Annual Report |
Financial Highlights
For a Share Outstanding Throughout the Periods Indicated
abrdn China A Share Equity Fund
| Investment Activities | Distributions | |||||||||||||||
| Net Asset Value, Beginning of Period | Net Investment Income (Loss) (a) | Net Realized and Unrealized Gains (Losses) on Investments | Total from Investment Activities | Net Investment Income | Net Realized Gains | Total Distributions | Net Asset Value, End of Period | |||||||||
| Class A Shares | ||||||||||||||||
| Six Months Ended April 30, 2022* | $ 37.76 | $ (0.13 | ) | $ (9.55 | ) | $ (9.68 | ) | $ – | $ (0.94 | ) | $ (0.94 | ) | $ 27.14 | |||
| Year Ended October 31, 2021 | 33.90 | (0.11 | ) | 4.50 | 4.39 | – | (0.53 | ) | (0.53 | ) | 37.76 | |||||
| Year Ended October 31, 2020 | 25.61 | 0.08 | 9.29 | 9.37 | – | (i) | (1.08 | ) | (1.08 | ) | 33.90 | |||||
| Year Ended October 31, 2019 | 19.86 | 0.07 | 5.72 | 5.79 | (0.04 | ) | – | (0.04 | ) | 25.61 | ||||||
| Year Ended October 31, 2018 | 22.48 | 0.06 | (2.45 | ) | (2.39 | ) | (0.23 | ) | – | (0.23 | ) | 19.86 | ||||
| Year Ended October 31, 2017 | 18.46 | 0.20 | 4.02 | 4.22 | (0.20 | ) | – | (0.20 | ) | 22.48 | ||||||
| Class C Shares | ||||||||||||||||
| Six Months Ended April 30, 2022* | 35.58 | (0.23 | ) | (8.96 | ) | (9.19 | ) | – | (0.94 | ) | (0.94 | ) | 25.45 | |||
| Year Ended October 31, 2021 | 32.18 | (0.31 | ) | 4.24 | 3.93 | – | (0.53 | ) | (0.53 | ) | 35.58 | |||||
| Year Ended October 31, 2020 | 24.52 | (0.09 | ) | 8.83 | 8.74 | – | (1.08 | ) | (1.08 | ) | 32.18 | |||||
| Year Ended October 31, 2019 | 19.12 | (0.21 | ) | 5.61 | 5.40 | – | – | – | 24.52 | |||||||
| Year Ended October 31, 2018 | 21.59 | (0.09 | ) | (2.35 | ) | (2.44 | ) | (0.03 | ) | – | (0.03 | ) | 19.12 | |||
| Year Ended October 31, 2017 | 17.64 | 0.03 | 3.92 | 3.95 | – | – | – | 21.59 | ||||||||
| Class R Shares | ||||||||||||||||
| Six Months Ended April 30, 2022* | 36.71 | (0.17 | ) | (9.27 | ) | (9.44 | ) | – | (0.94 | ) | (0.94 | ) | 26.33 | |||
| Year Ended October 31, 2021 | 33.07 | (0.23 | ) | 4.40 | 4.17 | – | (0.53 | ) | (0.53 | ) | 36.71 | |||||
| Year Ended October 31, 2020 | 25.08 | (0.06 | ) | 9.13 | 9.07 | – | (1.08 | ) | (1.08 | ) | 33.07 | |||||
| Year Ended October 31, 2019 | 19.48 | 0.02 | 5.58 | 5.60 | – | – | – | 25.08 | ||||||||
| Year Ended October 31, 2018 | 22.07 | 0.04 | (2.46 | ) | (2.42 | ) | (0.17 | ) | – | (0.17 | ) | 19.48 | ||||
| Year Ended October 31, 2017 | 18.13 | 0.15 | 3.94 | 4.09 | (0.15 | ) | – | (0.15 | ) | 22.07 | ||||||
| Institutional Service Class Shares | ||||||||||||||||
| Six Months Ended April 30, 2022* | 38.05 | (0.09 | ) | (9.62 | ) | (9.71 | ) | (0.02 | ) | (0.94 | ) | (0.96 | ) | 27.38 | ||
| Year Ended October 31, 2021 | 34.11 | (0.04 | ) | 4.53 | 4.49 | (0.02 | ) | (0.53 | ) | (0.55 | ) | 38.05 | ||||
| Year Ended October 31, 2020 | 25.75 | 0.15 | 9.34 | 9.49 | (0.05 | ) | (1.08 | ) | (1.13 | ) | 34.11 | |||||
| Year Ended October 31, 2019 | 19.98 | 0.11 | 5.76 | 5.87 | (0.10 | ) | – | (0.10 | ) | 25.75 | ||||||
| Year Ended October 31, 2018 | 22.62 | 0.11 | (2.46 | ) | (2.35 | ) | (0.29 | ) | – | (0.29 | ) | 19.98 | ||||
| Year Ended October 31, 2017 | 18.55 | 0.22 | 4.08 | 4.30 | (0.23 | ) | – | (0.23 | ) | 22.62 | ||||||
| Institutional Class Shares | ||||||||||||||||
| Six Months Ended April 30, 2022* | 38.24 | (0.08 | ) | (9.66 | ) | (9.74 | ) | (0.03 | ) | (0.94 | ) | (0.97 | ) | 27.53 | ||
| Year Ended October 31, 2021 | 34.26 | 0.12 | 4.43 | 4.55 | (0.04 | ) | (0.53 | ) | (0.57 | ) | 38.24 | |||||
| Year Ended October 31, 2020 | 25.85 | 0.05 | 9.51 | 9.56 | (0.07 | ) | (1.08 | ) | (1.15 | ) | 34.26 | |||||
| Year Ended October 31, 2019 | 20.03 | 0.26 | 5.64 | 5.90 | (0.08 | ) | – | (0.08 | ) | 25.85 | ||||||
| Year Ended October 31, 2018 | 22.65 | 0.05 | (2.38 | ) | (2.33 | ) | (0.29 | ) | – | (0.29 | ) | 20.03 | ||||
| Year Ended October 31, 2017 | 18.58 | 0.19 | 4.13 | 4.32 | (0.25 | ) | – | (0.25 | ) | 22.65 | ||||||
| * | Unaudited |
| (a) | Net investment income/(loss) is based on average shares outstanding during the period. |
| (b) | Excludes sales charge. |
| (c) | Not annualized for periods less than one year. |
| (d) | Annualized for periods less than one year. |
| (e) | During the period, certain fees were waived and/or reimbursed. If such waivers/reimbursements had not occurred, the ratios would have been as indicated. |
Amounts listed as "–" are $0 or round to $0.
See accompanying Notes to Financial Statements.
| 80 | 2022 Semi-Annual Report |
Financial Highlights (continued)
For a Share Outstanding Throughout the Periods Indicated
abrdn China A Share Equity Fund (concluded)
| Ratios/Supplemental Data | ||||||||||||||||||
| Total Return (b)(c) | Net Assets at End of Period (000's) | Ratio of Expenses (Net of Reimbursements/ Waivers) to Average Net Assets (d) | Ratio of Expenses (Prior to Reimbursements) to Average Net Assets (d)(e) | Ratio of Net Investment Income (Loss) to Average Net Assets (d) | Portfolio Turnover (c)(f) | |||||||||||||
| (26.25%) | $13,029 | 1.33%(g) | 1.61%(g) | (0.78%) | 11.98% | |||||||||||||
| 12.98%(h) | 18,476 | 1.32%(g) | 1.58%(g) | (0.28%) | 45.21% | |||||||||||||
| 38.06%(h) | 10,888 | 1.32%(g) | 2.55%(g) | 0.28% | 56.48% | |||||||||||||
| 29.21% | 8,685 | 1.60%(g) | 3.19%(g) | 0.30% | 115.09% | |||||||||||||
| (10.76%) | 5,978 | 1.95%(g) | 3.01%(g) | 0.27% | 26.13% | |||||||||||||
| 23.15% | 7,492 | 1.97%(g) | 3.04%(g) | 0.98% | 23.58% | |||||||||||||
| (26.48%) | 2,223 | 1.99%(g) | 2.34%(g) | (1.45%) | 11.98% | |||||||||||||
| 12.23% | 3,782 | 1.99%(g) | 2.33%(g) | (0.86%) | 45.21% | |||||||||||||
| 37.13% | 587 | 1.99%(g) | 3.37%(g) | (0.37%) | 56.48% | |||||||||||||
| 28.24% | 839 | 2.38%(g) | 3.99%(g) | (0.96%) | 115.09% | |||||||||||||
| (11.32%) | 1,568 | 2.62%(g) | 3.81%(g) | (0.42%) | 26.13% | |||||||||||||
| 22.39% | 2,437 | 2.62%(g) | 3.83%(g) | 0.14% | 23.58% | |||||||||||||
| (26.35%) | 2,910 | 1.63%(g) | 1.91%(g) | (1.07%) | 11.98% | |||||||||||||
| 12.63%(h) | 4,557 | 1.64%(g) | 1.90%(g) | (0.62%) | 45.21% | |||||||||||||
| 37.63%(h) | 3,215 | 1.62%(g) | 2.85%(g) | (0.23%) | 56.48% | |||||||||||||
| 28.75% | 2,682 | 1.92%(g) | 3.52%(g) | 0.07% | 115.09% | |||||||||||||
| (11.07%) | 1,664 | 2.27%(g) | 3.33%(g) | 0.18% | 26.13% | |||||||||||||
| 22.77% | 1,851 | 2.31%(g) | 3.38%(g) | 0.74% | 23.58% | |||||||||||||
| (26.14%) | 509 | 1.09%(g) | 1.37%(g) | (0.56%) | 11.98% | |||||||||||||
| 13.21% | 959 | 1.08%(g) | 1.34%(g) | (0.10%) | 45.21% | |||||||||||||
| 38.37% | 639 | 1.09%(g) | 2.32%(g) | 0.55% | 56.48% | |||||||||||||
| 29.52% | 543 | 1.40%(g) | 2.96%(g) | 0.45% | 115.09% | |||||||||||||
| (10.57%) | 532 | 1.72%(g) | 2.78%(g) | 0.49% | 26.13% | |||||||||||||
| 23.54% | 620 | 1.71%(g) | 2.78%(g) | 1.12% | 23.58% | |||||||||||||
| (26.10%) | 33,022 | 0.99%(g) | 1.33%(g) | (0.48%) | 11.98% | |||||||||||||
| 13.33% | 60,300 | 0.99%(g) | 1.33%(g) | 0.32% | 45.21% | |||||||||||||
| 38.55% | 4,919 | 0.99%(g) | 2.34%(g) | 0.20% | 56.48% | |||||||||||||
| 29.59% | 1,336 | 1.16%(g) | 2.97%(g) | 1.09% | 115.09% | |||||||||||||
| (10.46%) | 299 | 1.62%(g) | 2.78%(g) | 0.21% | 26.13% | |||||||||||||
| 23.62% | 927 | 1.62%(g) | 2.78%(g) | 0.94% | 23.58% | |||||||||||||
(f) Portfolio turnover is calculated on the basis of the Fund as a whole without distinguishing among the classes of shares.
(g) Includes interest expense that amounts to less than 0.01%
(h) The total return shown above includes the impact of financial statement rounding of the NAV per share and/or financial statement adjustments.
(i) Less than $0.005 per share.
| 2022 Semi-Annual Report | 81 |
Financial Highlights (continued)
For a Share Outstanding Throughout the Periods Indicated
abrdn Dynamic Dividend Fund
| Investment Activities | Distributions | ||||||||||||||||||||||||||||||||||||
| Net Asset Value, Beginning of Period | Net Investment Income | Net Realized and Unrealized Gains (Losses) on Invest- ments | Total from Invest- ment Activities | Net Invest- ment Income | Net Realized Gains | Tax Return of Capital | Total Distri- butions | Redemp- tion Fees | Net Asset Value, End of Period | ||||||||||||||||||||||||||||
| Class A Shares | |||||||||||||||||||||||||||||||||||||
| Six Months Ended April 30, 2022* | $ 4.74 | $ 0.06 | (f) | $ (0.45 | ) | $ (0.39 | ) | $ (0.11 | ) | $ (0.01 | ) | $ – | $ (0.12 | ) | $ – | $ 4.23 | |||||||||||||||||||||
| Year Ended October 31, 2021 | 3.68 | 0.23 | (f) | 1.06 | 1.29 | (0.23 | ) | – | – | (0.23 | ) | – | 4.74 | ||||||||||||||||||||||||
| Year Ended October 31, 2020 | 3.99 | 0.20 | (f) | (0.28 | ) | (0.08 | ) | (0.23 | ) | – | – | (0.23 | ) | – | 3.68 | ||||||||||||||||||||||
| Year Ended October 31, 2019 | 3.85 | 0.23 | (f) | 0.14 | 0.37 | (0.23 | ) | – | – | (0.23 | ) | – | 3.99 | ||||||||||||||||||||||||
| Year Ended October 31, 2018(h) | 4.04 | 0.17 | (f) | (0.13 | ) | 0.04 | (0.23 | ) | – | 0.00 | (i) | (0.23 | ) | 0.00 | (i) | 3.85 | |||||||||||||||||||||
| Year Ended October 31, 2017 | 3.49 | 0.22 | 0.56 | 0.78 | (0.22 | ) | – | (0.01 | ) | (0.23 | ) | 0.00 | (i) | 4.04 | |||||||||||||||||||||||
| Institutional Class Shares | |||||||||||||||||||||||||||||||||||||
| Six Months Ended April 30, 2022* | 4.74 | 0.06 | (f) | (0.44 | ) | (0.38 | ) | (0.12 | ) | (0.01 | ) | – | (0.13 | ) | – | 4.23 | |||||||||||||||||||||
| Year Ended October 31, 2021 | 3.69 | 0.24 | (f) | 1.05 | 1.29 | (0.24 | ) | – | – | (0.24 | ) | – | 4.74 | ||||||||||||||||||||||||
| Year Ended October 31, 2020 | 4.00 | 0.21 | (f) | (0.28 | ) | (0.07 | ) | (0.24 | ) | – | – | (0.24 | ) | – | 3.69 | ||||||||||||||||||||||
| Year Ended October 31, 2019 | 3.85 | 0.24 | (f) | 0.15 | 0.39 | (0.24 | ) | – | – | (0.24 | ) | – | 4.00 | ||||||||||||||||||||||||
| Year Ended October 31, 2018(h) | 4.04 | 0.18 | (f) | (0.13 | ) | 0.05 | (0.24 | ) | – | 0.00 | (i) | (0.24 | ) | 0.00 | (i) | 3.85 | |||||||||||||||||||||
| Year Ended October 31, 2017 | 3.49 | 0.22 | 0.57 | 0.79 | (0.23 | ) | – | (0.01 | ) | (0.24 | ) | 0.00 | (i) | 4.04 | |||||||||||||||||||||||
| * | Unaudited |
| (a) | Excludes sales charge. |
| (b) | Not annualized for periods less than one year. |
| (c) | Annualized for periods less than one year. |
| (d) | During the period, certain fees were waived and/or reimbursed. If such waivers/reimbursements had not occurred, the ratios would have been as indicated. |
| (e) | Portfolio turnover is calculated on the basis of the Fund as a whole without distinguishing among the classes of shares. |
Amounts listed as "–" are $0 or round to $0.
See accompanying Notes to Financial Statements.
| 82 | 2022 Semi-Annual Report |
Financial Highlights (continued)
For a Share Outstanding Throughout the Periods Indicated
abrdn Dynamic Dividend Fund (concluded)
| Ratios/Supplemental Data | |||||||||||||||||
| Total Return (a)(b) | Net Assets at End of Period (000's) | Ratio of Expenses (Net of Reimbursements/ Waivers) to Average Net Assets (c) | Ratio of Expenses (Prior to Reimbursements) to Average Net Assets (c)(d) | Ratio of Net Investment Income to Average Net Assets (c) | Portfolio Turnover (b)(e) | ||||||||||||
| (8.37%) | $ 4,586 | 1.50% | 1.60% | 2.54% | 31.23% | ||||||||||||
| 35.40% | 4,986 | 1.50% | 1.66% | 5.03% | 59.28% | ||||||||||||
| (2.04%)(g) | 3,885 | 1.50% | 1.60% | 5.20% | 85.01% | ||||||||||||
| 10.02%(g) | 4,399 | 1.50% | 1.61% | 6.00% | 105.70% | ||||||||||||
| 0.79% | 4,505 | 1.52%(j) | 1.60%(j) | 4.17% | 66.16% | ||||||||||||
| 22.92% | 3,379 | 1.54%(j) | 1.58%(j) | 6.14% | 82.00% | ||||||||||||
| (8.26%) | 108,721 | 1.25% | 1.34% | 2.75% | 31.23% | ||||||||||||
| 35.36% | 123,166 | 1.25% | 1.39% | 5.26% | 59.28% | ||||||||||||
| (1.77%) | 100,350 | 1.25% | 1.35% | 5.37% | 85.01% | ||||||||||||
| 10.60% | 122,197 | 1.25% | 1.33% | 6.21% | 105.70% | ||||||||||||
| 1.02% | 135,262 | 1.28%(j) | 1.35%(j) | 4.44% | 66.16% | ||||||||||||
| 23.22% | 160,696 | 1.29%(j) | 1.33%(j) | 5.95% | 82.00% | ||||||||||||
| (f) | Net investment income/(loss) is based on average shares outstanding during the period. |
| (g) | The total return shown above includes the impact of financial statement rounding of the NAV per share and/or financial statement adjustments. |
| (h) | Beginning with the year ended October 31, 2018, the Fund has been audited by KPMG LLP. Previous years were audited by different independent registered public accounting firms. |
| (i) | Less than $0.005 per share. |
| (j) | Includes interest expense that amounts to 0.03%, and 0.04% for Class A and Institutional Class for the years ended October 31, 2018 and October 31, 2017, respectively. |
| 2022 Semi-Annual Report | 83 |
Financial Highlights (continued)
For a Share Outstanding Throughout the Periods Indicated
abrdn Emerging Markets ex-China Fund
| Investment Activities | Distributions | |||||||||||||||||||||||
| Net Asset Value, Beginning of Period | Net Investment Income (Loss) (a) | Net Realized and Unrealized Gains (Losses) on Investments | Total from Investment Activities | Net Investment Income | Net Realized Gains | Total Distributions | Net Asset Value, End of Period | |||||||||||||||||
| Class A Shares | ||||||||||||||||||||||||
| Six Months Ended April 30, 2022* | $ 18.17 | $(0.01 | ) | $(2.62 | ) | $(2.63 | ) | $ – | $(1.94 | ) | $(1.94 | ) | $13.60 | |||||||||||
| Year Ended October 31, 2021 | 13.21 | (0.06 | ) | 5.02 | 4.96 | – | – | – | 18.17 | |||||||||||||||
| Year Ended October 31, 2020 | 12.87 | (0.01 | ) | 0.77 | 0.76 | (0.08 | ) | (0.34 | ) | (0.42 | ) | 13.21 | ||||||||||||
| Year Ended October 31, 2019 | 12.75 | 0.08 | 1.08 | 1.16 | (0.09 | ) | (0.95 | ) | (1.04 | ) | 12.87 | |||||||||||||
| Year Ended October 31, 2018 | 14.66 | 0.09 | (0.72 | ) | (0.63 | ) | (0.10 | ) | (1.18 | ) | (1.28 | ) | 12.75 | |||||||||||
| Year Ended October 31, 2017 | 12.35 | 0.10 | 2.30 | 2.40 | (0.09 | ) | – | (0.09 | ) | 14.66 | ||||||||||||||
| Class C Shares | ||||||||||||||||||||||||
| Six Months Ended April 30, 2022* | 16.77 | (0.06 | ) | (2.39 | ) | (2.45 | ) | – | (1.94 | ) | (1.94 | ) | 12.38 | |||||||||||
| Year Ended October 31, 2021 | 12.27 | (0.15 | ) | 4.65 | 4.50 | – | – | – | 16.77 | |||||||||||||||
| Year Ended October 31, 2020 | 11.98 | (0.08 | ) | 0.71 | 0.63 | – | (0.34 | ) | (0.34 | ) | 12.27 | |||||||||||||
| Year Ended October 31, 2019 | 11.93 | 0.01 | 0.99 | 1.00 | – | (0.95 | ) | (0.95 | ) | 11.98 | ||||||||||||||
| Year Ended October 31, 2018 | 13.78 | – | (i) | (0.67 | ) | (0.67 | ) | – | (1.18 | ) | (1.18 | ) | 11.93 | |||||||||||
| Year Ended October 31, 2017 | 11.65 | 0.01 | 2.18 | 2.19 | (0.06 | ) | – | (0.06 | ) | 13.78 | ||||||||||||||
| Class R Shares | ||||||||||||||||||||||||
| Six Months Ended April 30, 2022* | 17.19 | (0.04 | ) | (2.45 | ) | (2.49 | ) | – | (1.94 | ) | (1.94 | ) | 12.76 | |||||||||||
| Year Ended October 31, 2021 | 12.54 | (0.11 | ) | 4.76 | 4.65 | – | – | – | 17.19 | |||||||||||||||
| Year Ended October 31, 2020 | 12.21 | (0.05 | ) | 0.73 | 0.68 | (0.01 | ) | (0.34 | ) | (0.35 | ) | 12.54 | ||||||||||||
| Year Ended October 31, 2019 | 12.15 | 0.03 | 1.01 | 1.04 | (0.03 | ) | (0.95 | ) | (0.98 | ) | 12.21 | |||||||||||||
| Year Ended October 31, 2018 | 14.04 | 0.03 | (0.68 | ) | (0.65 | ) | (0.06 | ) | (1.18 | ) | (1.24 | ) | 12.15 | |||||||||||
| Year Ended October 31, 2017 | 11.88 | 0.04 | 2.22 | 2.26 | (0.10 | ) | – | (0.10 | ) | 14.04 | ||||||||||||||
| Institutional Service Class Shares | ||||||||||||||||||||||||
| Six Months Ended April 30, 2022* | 18.49 | 0.01 | (2.67 | ) | (2.66 | ) | – | (1.94 | ) | (1.94 | ) | 13.89 | ||||||||||||
| Year Ended October 31, 2021 | 13.41 | (0.02 | ) | 5.10 | 5.08 | – | – | – | 18.49 | |||||||||||||||
| Year Ended October 31, 2020 | 13.05 | 0.02 | 0.80 | 0.82 | (0.12 | ) | (0.34 | ) | (0.46 | ) | 13.41 | |||||||||||||
| Year Ended October 31, 2019 | 12.94 | 0.11 | 1.08 | 1.19 | (0.13 | ) | (0.95 | ) | (1.08 | ) | 13.05 | |||||||||||||
| Year Ended October 31, 2018 | 14.87 | 0.13 | (0.73 | ) | (0.60 | ) | (0.15 | ) | (1.18 | ) | (1.33 | ) | 12.94 | |||||||||||
| Year Ended October 31, 2017 | 12.53 | 0.13 | 2.34 | 2.47 | (0.13 | ) | – | (0.13 | ) | 14.87 | ||||||||||||||
| Institutional Class Shares | ||||||||||||||||||||||||
| Six Months Ended April 30, 2022* | 18.27 | 0.02 | (2.64 | ) | (2.62 | ) | – | (1.94 | ) | (1.94 | ) | 13.71 | ||||||||||||
| Year Ended October 31, 2021 | 13.24 | – | (i) | 5.03 | 5.03 | – | – | – | 18.27 | |||||||||||||||
| Year Ended October 31, 2020 | 12.88 | 0.03 | 0.79 | 0.82 | (0.12 | ) | (0.34 | ) | (0.46 | ) | 13.24 | |||||||||||||
| Year Ended October 31, 2019 | 12.77 | 0.13 | 1.06 | 1.19 | (0.13 | ) | (0.95 | ) | (1.08 | ) | 12.88 | |||||||||||||
| Year Ended October 31, 2018 | 14.69 | 0.14 | (0.73 | ) | (0.59 | ) | (0.15 | ) | (1.18 | ) | (1.33 | ) | 12.77 | |||||||||||
| Year Ended October 31, 2017 | 12.40 | 0.16 | 2.26 | 2.42 | (0.13 | ) | – | (0.13 | ) | 14.69 | ||||||||||||||
| * | Unaudited |
| (a) | Net investment income/(loss) is based on average shares outstanding during the period. |
| (b) | Excludes sales charge. |
| (c) | Not annualized for periods less than one year. |
| (d) | Annualized for periods less than one year. |
Amounts listed as "–" are $0 or round to $0.
See accompanying Notes to Financial Statements.
| 84 | 2022 Semi-Annual Report |
Financial Highlights (continued)
For a Share Outstanding Throughout the Periods Indicated
abrdn Emerging Markets ex-China Fund (concluded)
| Ratios/Supplemental Data | |||||||||||||||||
| Total Return (b)(c) | Net Assets at End of Period (000's) | Ratio of Expenses (Net of Reimbursements/ Waivers) to Average Net Assets (d) | Ratio of Expenses (Prior to Reimbursements) to Average Net Assets (d)(e) | Ratio of Net Investment Income (Loss) to Average Net Assets (d) | Portfolio Turnover (c)(f) | ||||||||||||
| (16.33 | %) | $ 22,177 | 1.50 | %(g) | 2.09 | %(g) | (0.11 | %) | 107.72 | % | |||||||
| 37.55 | % | 27,814 | 1.53 | % | 2.17 | % | (0.35 | %) | 21.98 | % | |||||||
| 5.93 | %(h) | 22,455 | 1.53 | %(g) | 2.17 | %(g) | (0.06 | %) | 29.04 | % | |||||||
| 10.40 | %(h) | 26,719 | 1.53 | %(g) | 2.07 | %(g) | 0.66 | % | 32.68 | % | |||||||
| (4.97 | %) | 27,530 | 1.53 | % | 1.92 | % | 0.67 | % | 22.06 | % | |||||||
| 19.58 | % | 34,296 | 1.56 | %(g) | 1.68 | %(g) | 0.71 | % | 24.98 | % | |||||||
| (16.64 | %)(h) | 154 | 2.16 | %(g) | 2.95 | %(g) | (0.77 | %) | 107.72 | % | |||||||
| 36.67 | % | 195 | 2.19 | % | 3.03 | % | (1.01 | %) | 21.98 | % | |||||||
| 5.24 | % | 205 | 2.19 | %(g) | 3.04 | %(g) | (0.68 | %) | 29.04 | % | |||||||
| 9.62 | % | 638 | 2.19 | %(g) | 2.95 | %(g) | 0.05 | % | 32.68 | % | |||||||
| (5.53 | %) | 1,713 | 2.19 | % | 2.77 | % | 0.02 | % | 22.06 | % | |||||||
| 18.85 | % | 2,181 | 2.19 | %(g) | 2.51 | %(g) | 0.06 | % | 24.98 | % | |||||||
| (16.46 | %) | 743 | 1.90 | %(g) | 2.49 | %(g) | (0.50 | %) | 107.72 | % | |||||||
| 37.08 | % | 903 | 1.87 | % | 2.51 | % | (0.69 | %) | 21.98 | % | |||||||
| 5.58 | % | 898 | 1.91 | %(g) | 2.55 | %(g) | (0.42 | %) | 29.04 | % | |||||||
| 9.83 | % | 1,554 | 1.94 | %(g) | 2.48 | %(g) | 0.26 | % | 32.68 | % | |||||||
| (5.27 | %) | 2,120 | 1.94 | % | 2.33 | % | 0.26 | % | 22.06 | % | |||||||
| 19.15 | % | 3,107 | 1.90 | %(g) | 2.02 | %(g) | 0.31 | % | 24.98 | % | |||||||
| (16.20 | %) | 259 | 1.26 | %(g) | 1.85 | %(g) | 0.11 | % | 107.72 | % | |||||||
| 37.88 | % | 343 | 1.29 | % | 1.93 | % | (0.12 | %) | 21.98 | % | |||||||
| 6.25 | % | 250 | 1.29 | %(g) | 1.93 | %(g) | 0.18 | % | 29.04 | % | |||||||
| 10.56 | % | 265 | 1.29 | %(g) | 1.83 | %(g) | 0.88 | % | 32.68 | % | |||||||
| (4.65 | %) | 460 | 1.26 | % | 1.65 | % | 0.94 | % | 22.06 | % | |||||||
| 19.97 | % | 570 | 1.29 | %(g) | 1.41 | %(g) | 0.94 | % | 24.98 | % | |||||||
| (16.17 | %) | 1,218 | 1.16 | %(g) | 1.81 | %(g) | 0.22 | % | 107.72 | % | |||||||
| 37.99 | % | 1,583 | 1.19 | % | 1.88 | % | (0.02 | %) | 21.98 | % | |||||||
| 6.39 | % | 1,409 | 1.19 | %(g) | 1.88 | %(g) | 0.27 | % | 29.04 | % | |||||||
| 10.71 | % | 1,390 | 1.19 | %(g) | 1.77 | %(g) | 1.01 | % | 32.68 | % | |||||||
| (4.63 | %) | 2,104 | 1.19 | % | 1.62 | % | 1.01 | % | 22.06 | % | |||||||
| 19.75 | % | 2,699 | 1.19 | %(g) | 1.32 | %(g) | 1.21 | % | 24.98 | % | |||||||
| (e) | During the period, certain fees were waived and/or reimbursed. If such waivers/reimbursements had not occurred, the ratios would have been as indicated. |
| (f) | Portfolio turnover is calculated on the basis of the Fund as a whole without distinguishing among the classes of shares. |
| (g) | Includes interest expense that amounts to less than 0.01%. |
| (h) | The total return shown above includes the impact of financial statement rounding of the NAV per share and/or financial statement adjustments. |
| (i) | Less than $0.005 per share. |
| 2022 Semi-Annual Report | 85 |
Financial Highlights (continued)
For a Share Outstanding Throughout the Periods Indicated
abrdn Emerging Markets Fund
| Investment Activities | Distributions | |||||||||||||||||||||||
| Net Asset Value, Beginning of Period | Net Investment Income (Loss) (a) | Net Realized and Unrealized Gains (Losses) on Investments | Total from Investment Activities | Net Investment Income | Net Realized Gains | Total Distributions | Net Asset Value, End of Period | |||||||||||||||||
| Class A Shares | ||||||||||||||||||||||||
| Six Months Ended April 30, 2022* | $20.15 | $ 0.01 | $ (4.72 | ) | $ (4.71 | ) | $ (0.02 | ) | $ (1.92 | ) | $ (1.94 | ) | $ 13.50 | |||||||||||
| Year Ended October 31, 2021 | 16.79 | 0.04 | 3.46 | 3.50 | – | (0.14 | ) | (0.14 | ) | 20.15 | ||||||||||||||
| Year Ended October 31, 2020 | 15.30 | 0.01 | 1.71 | 1.72 | (0.22 | ) | (0.01 | ) | (0.23 | ) | 16.79 | |||||||||||||
| Year Ended October 31, 2019 | 13.12 | 0.07 | 2.26 | 2.33 | (0.13 | ) | (0.02 | ) | (0.15 | ) | 15.30 | |||||||||||||
| Year Ended October 31, 2018 | 15.74 | 0.07 | (2.53 | ) | (2.46 | ) | (0.16 | ) | – | (0.16 | ) | 13.12 | ||||||||||||
| Year Ended October 31, 2017 | 13.53 | 0.10 | 2.22 | 2.32 | (0.11 | ) | – | (0.11 | ) | 15.74 | ||||||||||||||
| Class C Shares | ||||||||||||||||||||||||
| Six Months Ended April 30, 2022* | 19.90 | (0.03 | ) | (4.66 | ) | (4.69 | ) | – | (1.92 | ) | (1.92 | ) | 13.29 | |||||||||||
| Year Ended October 31, 2021 | 16.68 | (0.08 | ) | 3.44 | 3.36 | – | (0.14 | ) | (0.14 | ) | 19.90 | |||||||||||||
| Year Ended October 31, 2020 | 15.18 | (0.06 | ) | 1.69 | 1.63 | (0.12 | ) | (0.01 | ) | (0.13 | ) | 16.68 | ||||||||||||
| Year Ended October 31, 2019 | 12.97 | – | (h) | 2.24 | 2.24 | (0.01 | ) | (0.02 | ) | (0.03 | ) | 15.18 | ||||||||||||
| Year Ended October 31, 2018 | 15.55 | – | (h) | (2.51 | ) | (2.51 | ) | (0.07 | ) | – | (0.07 | ) | 12.97 | |||||||||||
| Year Ended October 31, 2017 | 13.35 | 0.02 | 2.21 | 2.23 | (0.03 | ) | – | (0.03 | ) | 15.55 | ||||||||||||||
| Class R Shares | ||||||||||||||||||||||||
| Six Months Ended April 30, 2022* | 19.89 | – | (h) | (4.67 | ) | (4.67 | ) | – | (h) | (1.92 | ) | (1.92 | ) | 13.30 | ||||||||||
| Year Ended October 31, 2021 | 16.60 | 0.01 | 3.42 | 3.43 | – | (0.14 | ) | (0.14 | ) | 19.89 | ||||||||||||||
| Year Ended October 31, 2020 | 15.14 | – | (h) | 1.68 | 1.68 | (0.21 | ) | (0.01 | ) | (0.22 | ) | 16.60 | ||||||||||||
| Year Ended October 31, 2019 | 13.00 | 0.07 | 2.21 | 2.28 | (0.12 | ) | (0.02 | ) | (0.14 | ) | 15.14 | |||||||||||||
| Year Ended October 31, 2018 | 15.61 | 0.06 | (2.52 | ) | (2.46 | ) | (0.15 | ) | – | (0.15 | ) | 13.00 | ||||||||||||
| Year Ended October 31, 2017 | 13.43 | 0.08 | 2.19 | 2.27 | (0.09 | ) | – | (0.09 | ) | 15.61 | ||||||||||||||
| Institutional Service Class Shares | ||||||||||||||||||||||||
| Six Months Ended April 30, 2022* | 20.26 | 0.04 | (4.74 | ) | (4.70 | ) | (0.10 | ) | (1.92 | ) | (2.02 | ) | 13.54 | |||||||||||
| Year Ended October 31, 2021 | 16.85 | 0.12 | 3.46 | 3.58 | (0.03 | ) | (0.14 | ) | (0.17 | ) | 20.26 | |||||||||||||
| Year Ended October 31, 2020 | 15.37 | 0.07 | 1.70 | 1.77 | (0.28 | ) | (0.01 | ) | (0.29 | ) | 16.85 | |||||||||||||
| Year Ended October 31, 2019 | 13.19 | 0.23 | 2.16 | 2.39 | (0.19 | ) | (0.02 | ) | (0.21 | ) | 15.37 | |||||||||||||
| Year Ended October 31, 2018 | 15.78 | 0.14 | (2.55 | ) | (2.41 | ) | (0.18 | ) | – | (0.18 | ) | 13.19 | ||||||||||||
| Year Ended October 31, 2017 | 13.55 | 0.14 | 2.23 | 2.37 | (0.14 | ) | – | (0.14 | ) | 15.78 | ||||||||||||||
| Institutional Class Shares | ||||||||||||||||||||||||
| Six Months Ended April 30, 2022* | 20.34 | 0.05 | (4.76 | ) | (4.71 | ) | (0.11 | ) | (1.92 | ) | (2.03 | ) | 13.60 | |||||||||||
| Year Ended October 31, 2021 | 16.90 | 0.14 | 3.48 | 3.62 | (0.04 | ) | (0.14 | ) | (0.18 | ) | 20.34 | |||||||||||||
| Year Ended October 31, 2020 | 15.39 | 0.09 | 1.72 | 1.81 | (0.29 | ) | (0.01 | ) | (0.30 | ) | 16.90 | |||||||||||||
| Year Ended October 31, 2019 | 13.20 | 0.13 | 2.27 | 2.40 | (0.19 | ) | (0.02 | ) | (0.21 | ) | 15.39 | |||||||||||||
| Year Ended October 31, 2018 | 15.81 | 0.15 | (2.55 | ) | (2.40 | ) | (0.21 | ) | – | (0.21 | ) | 13.20 | ||||||||||||
| Year Ended October 31, 2017 | 13.58 | 0.17 | 2.22 | 2.39 | (0.16 | ) | – | (0.16 | ) | 15.81 | ||||||||||||||
| * | Unaudited |
| (a) | Net investment income/(loss) is based on average shares outstanding during the period. |
| (b) | Excludes sales charge. |
| (c) | Not annualized for periods less than one year. |
| (d) | Annualized for periods less than one year. |
Amounts listed as "–" are $0 or round to $0.
See accompanying Notes to Financial Statements.
| 86 | 2022 Semi-Annual Report |
Financial Highlights (continued)
For a Share Outstanding Throughout the Periods Indicated
abrdn Emerging Markets Fund (concluded)
| Ratios/Supplemental Data | |||||||||||||||||
| Total Return (b)(c) | Net Assets at End of Period (000's) | Ratio of Expenses (Net of Reimbursements/ Waivers) to Average Net Assets (d) | Ratio of Expenses (Prior to Reimbursements) to Average Net Assets (d)(e) | Ratio of Net Investment Income (Loss) to Average Net Assets (d) | Portfolio Turnover (c)(f) | ||||||||||||
| (25.34 | %) | $ 78,581 | 1.58 | %(g) | 1.58 | %(g) | 0.15 | % | 18.14 | % | |||||||
| 20.87 | % | 116,268 | 1.56 | %(g) | 1.56 | %(g) | 0.20 | % | 37.26 | % | |||||||
| 11.31 | % | 107,572 | 1.59 | %(g) | 1.59 | %(g) | 0.09 | % | 26.13 | % | |||||||
| 17.89 | % | 134,382 | 1.59 | %(g) | 1.59 | %(g) | 0.46 | % | 14.86 | % | |||||||
| (15.80 | %) | 143,297 | 1.59 | %(g) | 1.59 | %(g) | 0.49 | % | 20.39 | % | |||||||
| 17.39 | % | 208,084 | 1.56 | % | 1.56 | % | 0.70 | % | 16.55 | % | |||||||
| (25.54 | %) | 6,608 | 2.10 | %(g) | 2.16 | %(g) | (0.37 | %) | 18.14 | % | |||||||
| 20.16 | % | 10,662 | 2.10 | %(g) | 2.13 | %(g) | (0.38 | %) | 37.26 | % | |||||||
| 10.74 | % | 11,786 | 2.10 | %(g) | 2.19 | %(g) | (0.40 | %) | 26.13 | % | |||||||
| 17.26 | % | 15,611 | 2.10 | %(g) | 2.20 | %(g) | (0.03 | %) | 14.86 | % | |||||||
| (16.20 | %) | 15,886 | 2.10 | %(g) | 2.21 | %(g) | – | (i) | 20.39 | % | |||||||
| 16.75 | % | 28,618 | 2.10 | % | 2.28 | % | 0.16 | % | 16.55 | % | |||||||
| (25.43 | %) | 106,309 | 1.75 | %(g) | 1.75 | %(g) | 0.01 | % | 18.14 | % | |||||||
| 20.68 | % | 133,696 | 1.72 | %(g) | 1.72 | %(g) | 0.04 | % | 37.26 | % | |||||||
| 11.13 | % | 113,707 | 1.73 | %(g) | 1.73 | %(g) | 0.01 | % | 26.13 | % | |||||||
| 17.72 | % | 108,487 | 1.75 | %(g) | 1.75 | %(g) | 0.48 | % | 14.86 | % | |||||||
| (15.93 | %) | 89,874 | 1.75 | %(g) | 1.75 | %(g) | 0.40 | % | 20.39 | % | |||||||
| 17.13 | % | 79,767 | 1.78 | % | 1.78 | % | 0.55 | % | 16.55 | % | |||||||
| (25.22 | %) | 536,433 | 1.24 | %(g) | 1.24 | %(g) | 0.53 | % | 18.14 | % | |||||||
| 21.29 | % | 476,046 | 1.21 | %(g) | 1.21 | %(g) | 0.56 | % | 37.26 | % | |||||||
| 11.64 | %(j) | 362,229 | 1.24 | %(g) | 1.24 | %(g) | 0.50 | % | 26.13 | % | |||||||
| 18.38 | %(j) | 297,466 | 1.24 | %(g) | 1.24 | %(g) | 1.55 | % | 14.86 | % | |||||||
| (15.48 | %) | 118,917 | 1.16 | %(g) | 1.16 | %(g) | 0.89 | % | 20.39 | % | |||||||
| 17.75 | % | 205,880 | 1.28 | % | 1.28 | % | 0.96 | % | 16.55 | % | |||||||
| (25.16 | %) | 2,524,917 | 1.10 | %(g) | 1.18 | %(g) | 0.63 | % | 18.14 | % | |||||||
| 21.45 | % | 4,184,781 | 1.10 | %(g) | 1.14 | %(g) | 0.69 | % | 37.26 | % | |||||||
| 11.86 | % | 3,414,059 | 1.10 | %(g) | 1.18 | %(g) | 0.59 | % | 26.13 | % | |||||||
| 18.45 | % | 4,420,838 | 1.10 | %(g) | 1.16 | %(g) | 0.91 | % | 14.86 | % | |||||||
| (15.38 | %) | 5,511,182 | 1.10 | %(g) | 1.14 | %(g) | 1.00 | % | 20.39 | % | |||||||
| 17.89 | % | 8,179,870 | 1.10 | % | 1.13 | % | 1.17 | % | 16.55 | % | |||||||
| (e) | During the period, certain fees were waived and/or reimbursed. If such waivers/reimbursements had not occurred, the ratios would have been as indicated. |
| (f) | Portfolio turnover is calculated on the basis of the Fund as a whole without distinguishing among the classes of shares. |
| (g) | Includes interest expense that amounts to less than 0.01%. |
| (h) | Less than $0.005 per share. |
| (i) | Amount is less than 0.005%. |
| (j) | The total return shown above includes the impact of financial statement rounding of the NAV per share and/or financial statement adjustments. |
| 2022 Semi-Annual Report | 87 |
Financial Highlights (continued)
For a Share Outstanding Throughout the Periods Indicated
abrdn Emerging Markets Sustainable Leaders Fund
| Investment Activities | Distributions | |||||||||||||||||||||||
| Net Asset Value, Beginning of Period | Net Investment Income (Loss) (a) | Net Realized and Unrealized Gains (Losses) on Investments | Total from Investment Activities | Net Investment Income | Net Realized Gains | Total Distributions | Net Asset Value, End of Period | |||||||||||||||||
| Class A Shares | ||||||||||||||||||||||||
| Six Months Ended April 30, 2022* | $18.83 | $ 0.01 | $(4.06 | ) | $(4.05 | ) | $(0.01 | ) | $(3.85 | ) | $(3.86 | ) | $10.92 | |||||||||||
| Year Ended October 31, 2021 | 15.74 | 0.02 | 3.07 | 3.09 | – | (h) | – | – | (h) | 18.83 | ||||||||||||||
| Year Ended October 31, 2020 | 14.68 | – | (h) | 1.21 | 1.21 | (0.15 | ) | – | (0.15 | ) | 15.74 | |||||||||||||
| Year Ended October 31, 2019 | 13.28 | 0.12 | 1.57 | 1.69 | (0.29 | ) | – | (0.29 | ) | 14.68 | ||||||||||||||
| Year Ended October 31, 2018 | 15.04 | 0.15 | (1.78 | ) | (1.63 | ) | (0.13 | ) | – | (0.13 | ) | 13.28 | ||||||||||||
| Year Ended October 31, 2017 | 12.70 | 0.15 | 2.36 | 2.51 | (0.17 | ) | – | (0.17 | ) | 15.04 | ||||||||||||||
| Class C Shares | ||||||||||||||||||||||||
| Six Months Ended April 30, 2022* | 17.58 | (0.03 | ) | (3.74 | ) | (3.77 | ) | – | (3.85 | ) | (3.85 | ) | 9.96 | |||||||||||
| Year Ended October 31, 2021 | 14.79 | (0.11 | ) | 2.90 | 2.79 | – | – | – | 17.58 | |||||||||||||||
| Year Ended October 31, 2020 | 13.76 | (0.08 | ) | 1.12 | 1.04 | (0.01 | ) | – | (0.01 | ) | 14.79 | |||||||||||||
| Year Ended October 31, 2019 | 12.44 | 0.03 | 1.48 | 1.51 | (0.19 | ) | – | (0.19 | ) | 13.76 | ||||||||||||||
| Year Ended October 31, 2018 | 14.09 | 0.04 | (1.66 | ) | (1.62 | ) | (0.03 | ) | – | (0.03 | ) | 12.44 | ||||||||||||
| Year Ended October 31, 2017 | 11.89 | 0.04 | 2.23 | 2.27 | (0.07 | ) | – | (0.07 | ) | 14.09 | ||||||||||||||
| Class R Shares | ||||||||||||||||||||||||
| Six Months Ended April 30, 2022* | 17.87 | (0.01 | ) | (3.81 | ) | (3.82 | ) | – | (3.85 | ) | (3.85 | ) | 10.20 | |||||||||||
| Year Ended October 31, 2021 | 14.98 | (0.02 | ) | 2.91 | 2.89 | – | – | – | 17.87 | |||||||||||||||
| Year Ended October 31, 2020 | 13.97 | (0.03 | ) | 1.14 | 1.11 | (0.10 | ) | – | (0.10 | ) | 14.98 | |||||||||||||
| Year Ended October 31, 2019 | 12.65 | 0.08 | 1.50 | 1.58 | (0.26 | ) | – | (0.26 | ) | 13.97 | ||||||||||||||
| Year Ended October 31, 2018 | 14.33 | 0.10 | (1.68 | ) | (1.58 | ) | (0.10 | ) | – | (0.10 | ) | 12.65 | ||||||||||||
| Year Ended October 31, 2017 | 12.11 | 0.10 | 2.25 | 2.35 | (0.13 | ) | – | (0.13 | ) | 14.33 | ||||||||||||||
| Institutional Service Class Shares | ||||||||||||||||||||||||
| Six Months Ended April 30, 2022* | 19.25 | 0.04 | (4.17 | ) | (4.13 | ) | (0.02 | ) | (3.85 | ) | (3.87 | ) | 11.25 | |||||||||||
| Year Ended October 31, 2021 | 16.08 | 0.08 | 3.14 | 3.22 | (0.05 | ) | – | (0.05 | ) | 19.25 | ||||||||||||||
| Year Ended October 31, 2020 | 15.00 | 0.06 | 1.22 | 1.28 | (0.20 | ) | – | (0.20 | ) | 16.08 | ||||||||||||||
| Year Ended October 31, 2019 | 13.58 | 0.17 | 1.60 | 1.77 | (0.35 | ) | – | (0.35 | ) | 15.00 | ||||||||||||||
| Year Ended October 31, 2018 | 15.37 | 0.20 | (1.80 | ) | (1.60 | ) | (0.19 | ) | – | (0.19 | ) | 13.58 | ||||||||||||
| Year Ended October 31, 2017 | 12.98 | 0.19 | 2.41 | 2.60 | (0.21 | ) | – | (0.21 | ) | 15.37 | ||||||||||||||
| Institutional Class Shares | ||||||||||||||||||||||||
| Six Months Ended April 30, 2022* | 19.34 | 0.04 | (4.19 | ) | (4.15 | ) | (0.02 | ) | (3.85 | ) | (3.87 | ) | 11.32 | |||||||||||
| Year Ended October 31, 2021 | 16.15 | 0.09 | 3.15 | 3.24 | (0.05 | ) | – | (0.05 | ) | 19.34 | ||||||||||||||
| Year Ended October 31, 2020 | 15.06 | 0.06 | 1.23 | 1.29 | (0.20 | ) | – | (0.20 | ) | 16.15 | ||||||||||||||
| Year Ended October 31, 2019 | 13.63 | 0.17 | 1.61 | 1.78 | (0.35 | ) | – | (0.35 | ) | 15.06 | ||||||||||||||
| Year Ended October 31, 2018 | 15.43 | 0.21 | (1.82 | ) | (1.61 | ) | (0.19 | ) | – | (0.19 | ) | 13.63 | ||||||||||||
| Year Ended October 31, 2017 | 13.04 | 0.20 | 2.42 | 2.62 | (0.23 | ) | – | (0.23 | ) | 15.43 | ||||||||||||||
| * | Unaudited |
| (a) | Net investment income/(loss) is based on average shares outstanding during the period. |
| (b) | Excludes sales charge. |
| (c) | Not annualized for periods less than one year. |
| (d) | Annualized for periods less than one year. |
Amounts listed as “–” are $0 or round to $0.
See accompanying Notes to Financial Statements.
| 88 | 2022 Semi-Annual Report |
Financial Highlights (continued)
For a Share Outstanding Throughout the Periods Indicated
abrdn Emerging Markets Sustainable Leaders Fund (concluded)
| Ratios/Supplemental Data | |||||||||||
| Total Return (b)(c) | Net Assets at End of Period (000's) | Ratio of Expenses (Net of Reimbursements/ Waivers) to Average Net Assets (d) | Ratio of Expenses (Prior to Reimbursements) to Average Net Assets (d)(e) | Ratio of Net Investment Income (Loss) to Average Net Assets (d) | Portfolio Turnover (c)(f) | ||||||
| (25.55%) | $ 14,920 | 1.49%(g) | 1.51%(g) | 0.21% | 17.64% | ||||||
| 19.65% | 23,898 | 1.46%(g) | 1.46%(g) | 0.11% | 120.50% | ||||||
| 8.24% | 21,418 | 1.49%(g) | 1.49%(g) | 0.02% | 37.50% | ||||||
| 13.13% | 24,719 | 1.52%(i) | 1.52%(i) | 0.89% | 28.30% | ||||||
| (10.93%) | 24,957 | 1.38% | 1.38% | 0.99% | 20.75% | ||||||
| 20.05% | 39,619 | 1.39% | 1.39% | 1.09% | 13.11% | ||||||
| (25.78%) | 433 | 2.10%(g) | 2.22%(g) | (0.48%) | 17.64% | ||||||
| 18.86% | 1,159 | 2.11%(g) | 2.21%(g) | (0.59%) | 120.50% | ||||||
| 7.56%(j) | 2,432 | 2.10%(g) | 2.20%(g) | (0.55%) | 37.50% | ||||||
| 12.43%(j) | 4,330 | 2.12%(i) | 2.24%(i) | 0.21% | 28.30% | ||||||
| (11.54%) | 8,074 | 2.10% | 2.10% | 0.27% | 20.75% | ||||||
| 19.27% | 12,375 | 2.10% | 2.18% | 0.35% | 13.11% | ||||||
| (25.63%) | 2,803 | 1.78%(g) | 1.80%(g) | (0.10%) | 17.64% | ||||||
| 19.29% | 6,126 | 1.74%(g) | 1.74%(g) | (0.10%) | 120.50% | ||||||
| 7.97% | 3,244 | 1.74%(g) | 1.74%(g) | (0.22%) | 37.50% | ||||||
| 12.80% | 3,992 | 1.79%(i) | 1.79%(i) | 0.58% | 28.30% | ||||||
| (11.14%) | 5,041 | 1.64% | 1.64% | 0.74% | 20.75% | ||||||
| 19.70% | 7,335 | 1.70% | 1.70% | 0.75% | 13.11% | ||||||
| (25.40%) | 64,910 | 1.17%(g) | 1.19%(g) | 0.55% | 17.64% | ||||||
| 20.02% | 94,132 | 1.16%(g) | 1.16%(g) | 0.41% | 120.50% | ||||||
| 8.58%(j) | 83,121 | 1.15%(g) | 1.15%(g) | 0.36% | 37.50% | ||||||
| 13.49%(j) | 85,934 | 1.16%(i) | 1.16%(i) | 1.23% | 28.30% | ||||||
| (10.58%) | 84,902 | 1.06% | 1.06% | 1.31% | 20.75% | ||||||
| 20.46% | 106,424 | 1.08% | 1.08% | 1.35% | 13.11% | ||||||
| (25.38%) | 55,362 | 1.10%(g) | 1.18%(g) | 0.57% | 17.64% | ||||||
| 20.06% | 91,084 | 1.11%(g) | 1.15%(g) | 0.45% | 120.50% | ||||||
| 8.63%(j) | 107,158 | 1.10%(g) | 1.13%(g) | 0.41% | 37.50% | ||||||
| 13.55%(j) | 99,475 | 1.12%(i) | 1.13%(i) | 1.21% | 28.30% | ||||||
| (10.56%) | 272,152 | 1.02% | 1.02% | 1.37% | 20.75% | ||||||
| 20.47% | 367,341 | 1.02% | 1.02% | 1.43% | 13.11% | ||||||
| (e) | During the period, certain fees were waived and/or reimbursed. If such waivers/reimbursements had not occurred, the ratios would have been as indicated. |
| (f) | Portfolio turnover is calculated on the basis of the Fund as a whole without distinguishing among the classes of shares. |
| (g) | Includes interest expense that amounts to less than 0.01%. |
| (h) | Less than $0.005 per share. |
| (i) | Includes interest expense that amounts to 0.02% for Class C and Institutional class. Includes interest expense that amounts to 0.01% for Class A, Class R and Institutional Service Class. |
| (j) | The total return shown above includes the impact of financial statement rounding of the NAV per share and/or financial statement adjustments. |
| 2022 Semi-Annual Report | 89 |
Financial Highlights (continued)
For a Share Outstanding Throughout the Periods Indicated
abrdn Global Equity Impact Fund
| Investment Activities | Distributions | ||||||||||||||||||||
| Net Asset Value, Beginning of Period | Net Investment Income (a) | Net Realized and Unrealized Gains (Losses) on Investments | Total from Investment Activities | Net Investment Income | Total Distributions | Net Asset Value, End of Period | |||||||||||||||
| Class A Shares | |||||||||||||||||||||
| Six Months Ended April 30, 2022* | $18.45 | $ – | (g) | $(4.09 | ) | $(4.09 | ) | $ – | (g) | $ – | (g) | $14.36 | |||||||||
| Year Ended October 31, 2021 | 13.14 | – | 5.37 | 5.37 | (0.06 | ) | (0.06 | ) | 18.45 | ||||||||||||
| Year Ended October 31, 2020 | 11.59 | 0.05 | 1.77 | 1.82 | (0.27 | ) | (0.27 | ) | 13.14 | ||||||||||||
| Year Ended October 31, 2019 | 10.29 | 0.18 | (i) | 1.30 | 1.48 | (0.18 | ) | (0.18 | ) | 11.59 | |||||||||||
| Year Ended October 31, 2018 | 11.95 | 0.08 | (1.41 | ) | (1.33 | ) | (0.33 | ) | (0.33 | ) | 10.29 | ||||||||||
| Year Ended October 31, 2017 | 9.79 | 0.43 | (j) | 1.89 | 2.32 | (0.16 | ) | (0.16 | ) | 11.95 | |||||||||||
| Institutional Class Shares | |||||||||||||||||||||
| Six Months Ended April 30, 2022* | 18.49 | 0.02 | (4.10 | ) | (4.08 | ) | (0.01 | ) | (0.01 | ) | 14.40 | ||||||||||
| Year Ended October 31, 2021 | 13.18 | 0.04 | 5.37 | 5.41 | (0.10 | ) | (0.10 | ) | 18.49 | ||||||||||||
| Year Ended October 31, 2020 | 11.62 | 0.08 | 1.79 | 1.87 | (0.31 | ) | (0.31 | ) | 13.18 | ||||||||||||
| Year Ended October 31, 2019 | 10.30 | 0.21 | (i) | 1.30 | 1.51 | (0.19 | ) | (0.19 | ) | 11.62 | |||||||||||
| Year Ended October 31, 2018 | 11.96 | 0.10 | (1.40 | ) | (1.30 | ) | (0.36 | ) | (0.36 | ) | 10.30 | ||||||||||
| Year Ended October 31, 2017 | 9.81 | 0.45 | (j) | 1.88 | 2.33 | (0.18 | ) | (0.18 | ) | 11.96 | |||||||||||
| * | Unaudited |
| (a) | Net investment income/(loss) is based on average shares outstanding during the period. |
| (b) | Not annualized for periods less than one year. |
| (c) | Annualized for periods less than one year. |
| (d) | During the period, certain fees were waived and/or reimbursed. If such waivers/reimbursements had not occurred, the ratios would have been as indicated. |
| (e) | Includes interest expense that amounts to less than 0.01%. |
| (f) | Portfolio turnover is calculated on the basis of the Fund as a whole without distinguishing among the classes of shares. |
| (g) | Less than $0.005 per share. |
Amounts listed as "–" are $0 or round to $0.
See accompanying Notes to Financial Statements.
| 90 | 2022 Semi-Annual Report |
Financial Highlights (continued)
For a Share Outstanding Throughout the Periods Indicated
abrdn Global Equity Impact Fund (concluded)
| Ratios/Supplemental Data | ||||||||||||||
| Total Return (b) | Net Assets at End of Period (000's) | Ratio of Expenses (Net of Reimbursement/ Waivers and Excluding Accruals for Estimated Tax Due on Foreign Tax Refund Recoveries) to Average Net Assets | Ratio of Expenses (Net of Reimbursements/ Waivers) to Average Net Assets (c)(d)(e) | Ratio of Expenses (Prior to Reimbursements) to Average Net Assets (c)(d)(e) | Ratio of Net Investment Income to Average Net Assets (c) | Portfolio Turnover (b)(f) | ||||||||
| (22.15 | %) | $ 31,281 | 1.19% | 1.19% | 1.82% | 0.03% | 21% | |||||||
| 40.95 | % | 43,059 | 1.38% | 1.38% | 1.73% | 0.02% | 17% | |||||||
| 15.93 | %(h) | 32,180 | 1.41% | 1.41% | 1.92% | 0.40% | 32% | |||||||
| 14.76 | %(i) | 34,933 | 1.53% | 2.21% | 2.47% | 1.69%(i) | 125% | |||||||
| (11.48 | %) | 35,964 | 1.77% | 2.44% | 2.44% | 0.72% | 19% | |||||||
| 24.10 | %(j) | 49,363 | 1.58% | 3.14% | 3.15% | 3.98%(j) | 13% | |||||||
| (22.06 | %) | 22,608 | 0.94% | 0.94% | 1.55% | 0.27% | 21% | |||||||
| 41.23 | % | 32,312 | 1.13% | 1.13% | 1.45% | 0.24% | 17% | |||||||
| 16.30 | %(h) | 27,839 | 1.16% | 1.16% | 1.61% | 0.65% | 32% | |||||||
| 14.99 | %(i) | 27,937 | 1.28% | 1.97% | 2.20% | 1.95%(i) | 125% | |||||||
| (11.23 | %) | 28,477 | 1.52% | 2.22% | 2.23% | 0.89% | 19% | |||||||
| 24.32 | %(j) | 44,659 | 1.33% | 2.88% | 2.89% | 4.22%(j) | 13% | |||||||
| (h) | Included within Total Return is the effect of withholding tax refunds and income taxes on recovered refunds (Note 2(i) of the Notes to Financial Statements). If such amounts were excluded, the Total Return for Class A Shares would have been 15.82%. For Institutional Class Shares, this amount would have been 16.12%. |
| (i) | Included within Net Investment Income per share, Total Return, and Ratio of Net Investment Income to Average Net Assets are the effects of withholding tax refunds and income taxes on recovered refunds (Note 2(i) of the Notes to Financial Statements). If such amounts were excluded, the Net Investment Income per share, Total Return, and Ratio of Net Investment Loss to Average Net Assets for Class A Shares would have been $0.08, 13.56%, and 0.77%, respectively. For Institutional Class Shares, these amounts would have been $0.11, 13.81%, and 1.03%, respectively. |
| (j) | Included within Net Investment Income per share, Total Return, and Ratio of Net Investment Income to Average Net Assets are the effects of withholding tax refunds and income taxes on recovered refunds (Note 2(i) of the Notes to Financial Statements). If such amounts were excluded, the Net Investment Loss per share, Total Return, and Ratio of Net Investment Loss to Average Net Assets for Class A Shares would have been $(0.06), 20.03%, and (0.61)%, respectively. For Institutional Class Shares, these amounts would have been $(0.04), 20.24%, and (0.37)%, respectively. |
| 2022 Semi-Annual Report | 91 |
Financial Highlights (continued)
For a Share Outstanding Throughout the Periods Indicated
abrdn Global Infrastructure Fund
| Investment Activities | Distributions | ||||||||||||||||||||||||||||||
| Net Asset Value, Beginning of Period | Net Investment Income | Net Realized and Unrealized Gains (Losses) on Invest- ments | Total from Invest- ment Activities | Net Invest- ment Income | Net Realized Gains | Tax Return of Capital | Total Distri- butions | Redemp- tion Fees | Net Asset Value, End of Period | ||||||||||||||||||||||
| Class A Shares | |||||||||||||||||||||||||||||||
| Six Months Ended April 30, 2022* | $ 24.18 | $0.26 | (f) | $(0.60 | ) | $(0.34 | ) | $(0.36 | ) | $(0.26 | ) | $ – | $(0.62 | ) | $ – | $23.22 | |||||||||||||||
| Year Ended October 31, 2021 | 19.03 | 0.45 | (f) | 5.41 | 5.86 | (0.71 | ) | – | – | (0.71 | ) | – | 24.18 | ||||||||||||||||||
| Year Ended October 31, 2020 | 21.93 | 0.53 | (f) | (2.59 | ) | (2.06 | ) | (0.56 | ) | (0.14 | ) | (0.14 | ) | (0.84 | ) | – | 19.03 | ||||||||||||||
| Year Ended October 31, 2019 | 18.82 | 0.30 | (f) | 3.48 | 3.78 | (0.64 | ) | (0.03 | ) | – | (0.67 | ) | – | 21.93 | |||||||||||||||||
| Year Ended October 31, 2018(h) | 20.65 | 0.46 | (f) | (1.54 | ) | (1.08 | ) | (0.71 | ) | (0.04 | ) | – | (0.75 | ) | 0.00 | (i) | 18.82 | ||||||||||||||
| Year Ended October 31, 2017 | 17.55 | 0.66 | 3.15 | 3.81 | (0.71 | ) | – | – | (0.71 | ) | 0.00 | (i) | 20.65 | ||||||||||||||||||
| Institutional Class Shares | |||||||||||||||||||||||||||||||
| Six Months Ended April 30, 2022* | 24.22 | 0.29 | (f) | (0.60 | ) | (0.31 | ) | (0.38 | ) | (0.26 | ) | – | (0.64 | ) | – | 23.27 | |||||||||||||||
| Year Ended October 31, 2021 | 19.05 | 0.52 | (f) | 5.41 | 5.93 | (0.76 | ) | – | – | (0.76 | ) | – | 24.22 | ||||||||||||||||||
| Year Ended October 31, 2020 | 21.97 | 0.58 | (f) | (2.60 | ) | (2.02 | ) | (0.62 | ) | (0.14 | ) | (0.14 | ) | (0.90 | ) | – | 19.05 | ||||||||||||||
| Year Ended October 31, 2019 | 18.85 | 0.34 | (f) | 3.50 | 3.84 | (0.69 | ) | (0.03 | ) | – | (0.72 | ) | – | 21.97 | |||||||||||||||||
| Year Ended October 31, 2018(h) | 20.68 | 0.54 | (f) | (1.57 | ) | (1.03 | ) | (0.76 | ) | (0.04 | ) | – | (0.80 | ) | 0.00 | (i) | 18.85 | ||||||||||||||
| Year Ended October 31, 2017 | 17.58 | 0.70 | 3.16 | 3.86 | (0.76 | ) | – | – | (0.76 | ) | 0.00 | (i) | 20.68 | ||||||||||||||||||
| * | Unaudited |
| (a) | Excludes sales charge. |
| (b) | Not annualized for periods less than one year. |
| (c) | Annualized for periods less than one year. |
| (d) | During the period, certain fees were waived and/or reimbursed. If such waivers/reimbursements had not occurred, the ratios would have been as indicated. |
| (e) | Portfolio turnover is calculated on the basis of the Fund as a whole without distinguishing among the classes of shares. |
Amounts listed as "–" are $0 or round to $0.
See accompanying Notes to Financial Statements.
| 92 | 2022 Semi-Annual Report |
Financial Highlights (continued)
For a Share Outstanding Throughout the Periods Indicated
abrdn Global Infrastructure Fund (concluded)
| Ratios/Supplemental Data | |||||||||||||||
| Total Return (a)(b) | Net Assets at End of Period (000's) | Ratio of Expenses (Net of Reimbursements/ Waivers) to Average Net Assets (c) | Ratio of Expenses (Prior to Reimbursements) to Average Net Assets (c)(d) | Ratio of Net Investment Income to Average Net Assets (c) | Portfolio Turnover (b)(e) | ||||||||||
| (1.44 | %)(g) | $ 13,179 | 1.24% | 1.60 | % | 2.24 | % | 12.06 | % | ||||||
| 31.09 | % | 13,227 | 1.24% | 1.63 | % | 1.95 | % | 30.75 | % | ||||||
| (9.49 | %) | 9,206 | 1.33% | 1.55 | % | 2.61 | % | 23.76 | % | ||||||
| 20.41 | % | 12,776 | 1.45% | 1.59 | % | 1.46 | % | 31.62 | % | ||||||
| (5.39 | %) | 12,310 | 1.45% | 1.58 | % | 2.29 | % | 48.54 | % | ||||||
| 22.13 | % | 20,132 | 1.46%(j) | 1.58 | %(j) | 3.48 | % | 77.00 | % | ||||||
| (1.31 | %)(g) | 41,664 | 0.99% | 1.36 | % | 2.47 | % | 12.06 | % | ||||||
| 31.43 | % | 45,076 | 0.99% | 1.38 | % | 2.25 | % | 30.75 | % | ||||||
| (9.30 | %) | 32,640 | 1.08% | 1.27 | % | 2.90 | % | 23.76 | % | ||||||
| 20.73 | % | 87,441 | 1.20% | 1.31 | % | 1.68 | % | 31.62 | % | ||||||
| (5.13 | %) | 95,025 | 1.20% | 1.32 | % | 2.70 | % | 48.54 | % | ||||||
| 22.39 | % | 115,567 | 1.21%(j) | 1.33 | %(j) | 3.56 | % | 77.00 | % | ||||||
| (f) | Net investment income/(loss) is based on average shares outstanding during the period. |
| (g) | The total return shown above includes the impact of financial statement rounding of the NAV per share and/or financial statement adjustments. |
| (h) | Beginning with the year ended October 31, 2018, the Fund has been audited by KPMG LLP. Previous years were audited by different independent registered public accounting firms. |
| (i) | Less than $0.005 per share. |
| (j) | Includes interest expense that amounts to less than 0.01% for Class A and Institutional Class for the year ended October 31, 2017. |
| 2022 Semi-Annual Report | 93 |
Financial Highlights (continued)
For a Share Outstanding Throughout the Periods Indicated
abrdn International Real Estate Equity Fund
| Investment Activities | Distributions | |||||||||||||||||||||||
| Net Asset Value, Beginning of Period | Net Investment Income | Net Realized and Unrealized Gains (Losses) on Investments | Total from Investment Activities | Net Investment Income | Total Distributions | Redemption Fees | Net Asset Value, End of Period | |||||||||||||||||
| Class A Shares | ||||||||||||||||||||||||
| Six Months Ended April 30, 2022* | $20.62 | $ 0.10 | (f) | $ (2.28 | ) | $ (2.18 | ) | $ (0.79 | ) | $ (0.79 | ) | $ – | $ 17.65 | |||||||||||
| Year Ended October 31, 2021 | 17.80 | 0.47 | (f) | 2.72 | 3.19 | (0.37 | ) | (0.37 | ) | – | 20.62 | |||||||||||||
| Year Ended October 31, 2020 | 23.71 | 0.30 | (f) | (3.52 | ) | (3.22 | ) | (2.69 | ) | (2.69 | ) | – | 17.80 | |||||||||||
| Year Ended October 31, 2019 | 20.02 | 0.33 | (f) | 3.99 | 4.32 | (0.63 | ) | (0.63 | ) | – | 23.71 | |||||||||||||
| Year Ended October 31, 2018(h) | 22.82 | 0.14 | (f) | (2.46 | ) | (2.32 | ) | (0.48 | ) | (0.48 | ) | 0.00 | (i) | 20.02 | ||||||||||
| Year Ended October 31, 2017 | 19.33 | 0.02 | 3.47 | 3.49 | – | – | 0.00 | (i) | 22.82 | |||||||||||||||
| Institutional Class Shares | ||||||||||||||||||||||||
| Six Months Ended April 30, 2022* | 20.49 | 0.13 | (f) | (2.27 | ) | (2.14 | ) | (0.80 | ) | (0.80 | ) | – | 17.55 | |||||||||||
| Year Ended October 31, 2021 | 17.95 | 0.41 | (f) | 2.82 | 3.23 | (0.69 | ) | (0.69 | ) | – | 20.49 | |||||||||||||
| Year Ended October 31, 2020 | 23.87 | 0.35 | (f) | (3.53 | ) | (3.18 | ) | (2.74 | ) | (2.74 | ) | – | 17.95 | |||||||||||
| Year Ended October 31, 2019 | 20.17 | 0.38 | (f) | 4.01 | 4.39 | (0.69 | ) | (0.69 | ) | – | 23.87 | |||||||||||||
| Year Ended October 31, 2018(h) | 22.99 | 0.21 | (f) | (2.49 | ) | (2.28 | ) | (0.54 | ) | (0.54 | ) | 0.00 | (i) | 20.17 | ||||||||||
| Year Ended October 31, 2017 | 19.46 | 0.20 | 3.36 | 3.56 | (0.03 | ) | (0.03 | ) | 0.00 | (i) | 22.99 | |||||||||||||
| * | Unaudited |
| (a) | Excludes sales charge. |
| (b) | Not annualized for periods less than one year. |
| (c) | Annualized for periods less than one year. |
| (d) | During the period, certain fees were waived and/or reimbursed. If such waivers/reimbursements had not occurred, the ratios would have been as indicated. |
| (e) | Portfolio turnover is calculated on the basis of the Fund as a whole without distinguishing among the classes of shares. |
| (f) | Net investment income/(loss) is based on average shares outstanding during the period. |
Amounts listed as "–" are $0 or round to $0.
See accompanying Notes to Financial Statements.
| 94 | 2022 Semi-Annual Report |
Financial Highlights (continued)
For a Share Outstanding Throughout the Periods Indicated
abrdn International Real Estate Equity Fund (concluded)
| Ratios/Supplemental Data | ||||||||||||||||
| Total Return (a)(b) | Net Assets at End of Period (000's) | Ratio of Expenses (Net of Reimbursements/ Waivers) to Average Net Assets (c) | Ratio of Expenses (Prior to Reimbursements) to Average Net Assets (c)(d) | Ratio of Net Investment Income to Average Net Assets (c) | Portfolio Turnover (b)(e) | |||||||||||
| (10.88 | %) | $ 34 | 1.62 | %(g) | 2.54 | %(g) | 1.07 | % | 32.40 | % | ||||||
| 18.04 | % | 39 | 1.62 | %(g) | 2.45 | %(g) | 2.26 | % | 63.68 | % | ||||||
| (15.48 | %) | 21 | 1.65 | %(g) | 1.98 | %(g) | 1.58 | % | 57.05 | % | ||||||
| 22.29 | % | 177 | 1.62 | %(g) | 1.65 | %(g) | 1.51 | % | 60.73 | % | ||||||
| (10.52 | %) | 135 | 1.63 | %(g) | 1.67 | %(g) | 0.62 | % | 89.59 | % | ||||||
| 18.05 | % | 176 | 1.61 | %(g) | 1.62 | %(g) | 0.75 | % | 60.00 | % | ||||||
| (10.74 | %) | 17,218 | 1.37 | %(g) | 2.17 | %(g) | 1.33 | % | 32.40 | % | ||||||
| 18.28 | % | 21,160 | 1.37 | %(g) | 2.07 | %(g) | 1.99 | % | 63.68 | % | ||||||
| (15.27 | %) | 20,570 | 1.40 | %(g) | 1.73 | %(g) | 1.74 | % | 57.05 | % | ||||||
| 22.57 | %(j) | 56,510 | 1.37 | %(g) | 1.40 | %(g) | 1.74 | % | 60.73 | % | ||||||
| (10.35 | %) | 97,453 | 1.38 | %(g) | 1.39 | %(g) | 0.89 | % | 89.59 | % | ||||||
| 18.36 | % | 117,484 | 1.35 | %(g) | 1.37 | %(g) | 0.94 | % | 60.00 | % | ||||||
| (g) | Includes interest expense that amounts to less than 0.01% for Class A and Institutional Class for the six months ended April 30, 2022. Includes interest expense that amounts to less than 0.01%, 0.02%, 0.01%, 0.02% and less than 0.01% for Class A and Institutional Class for the years ended October 31, 2021, October 31, 2020, October 31, 2019, October 31, 2018, and October 31, 2017, respectively. |
| (h) | Beginning with the year ended October 31, 2018, the Fund has been audited by KPMG LLP. Previous years were audited by different independent registered public accounting firms. |
| (i) | Less than $0.005 per share. |
| (j) | The total return shown above includes the impact of financial statement rounding of the NAV per share and/or financial statement adjustments. |
| 2022 Semi-Annual Report | 95 |
Financial Highlights (continued)
For a Share Outstanding Throughout the Periods Indicated
abrdn International Small Cap Fund
| Investment Activities | Distributions | |||||||||||||||||||||||
| Net Asset Value, Beginning of Period | Net Investment Income (Loss) (a) | Net Realized and Unrealized Gains (Losses) on Investments | Total from Investment Activities | Net Investment Income | Net Realized Gains | Total Distributions | Net Asset Value, End of Period | |||||||||||||||||
| Class A Shares | ||||||||||||||||||||||||
| Six Months Ended April 30, 2022* | $ 42.73 | $ 0.12 | $(11.49 | ) | $(11.37 | ) | $ – | $(2.86 | ) | $(2.86 | ) | $28.50 | ||||||||||||
| Year Ended October 31, 2021 | 30.18 | (0.20 | ) | 12.75 | 12.55 | – | – | – | 42.73 | |||||||||||||||
| Year Ended October 31, 2020 | 28.11 | (0.09 | ) | 3.63 | 3.54 | (0.34 | ) | (1.13 | ) | (1.47 | ) | 30.18 | ||||||||||||
| Year Ended October 31, 2019 | 29.23 | 0.23 | 3.03 | 3.26 | (0.65 | ) | (3.73 | ) | (4.38 | ) | 28.11 | |||||||||||||
| Year Ended October 31, 2018 | 31.35 | 0.47 | (1.56 | ) | (1.09 | ) | (0.17 | ) | (0.86 | ) | (1.03 | ) | 29.23 | |||||||||||
| Year Ended October 31, 2017 | 25.97 | 0.11 | 5.49 | 5.60 | (0.14 | ) | (0.08 | ) | (0.22 | ) | 31.35 | |||||||||||||
| Class C Shares | ||||||||||||||||||||||||
| Six Months Ended April 30, 2022* | 38.21 | 0.03 | (10.20 | ) | (10.17 | ) | – | (2.86 | ) | (2.86 | ) | 25.18 | ||||||||||||
| Year Ended October 31, 2021 | 27.16 | (0.39 | ) | 11.44 | 11.05 | – | – | – | 38.21 | |||||||||||||||
| Year Ended October 31, 2020 | 25.43 | (0.25 | ) | 3.27 | 3.02 | (0.16 | ) | (1.13 | ) | (1.29 | ) | 27.16 | ||||||||||||
| Year Ended October 31, 2019 | 26.73 | (0.04 | ) | 2.84 | 2.80 | (0.37 | ) | (3.73 | ) | (4.10 | ) | 25.43 | ||||||||||||
| Year Ended October 31, 2018 | 28.78 | 0.20 | (1.39 | ) | (1.19 | ) | – | (0.86 | ) | (0.86 | ) | 26.73 | ||||||||||||
| Year Ended October 31, 2017 | 23.88 | (0.04 | ) | 5.02 | 4.98 | – | (0.08 | ) | (0.08 | ) | 28.78 | |||||||||||||
| Class R Shares | ||||||||||||||||||||||||
| Six Months Ended April 30, 2022* | 39.97 | 0.10 | (10.73 | ) | (10.63 | ) | – | (2.86 | ) | (2.86 | ) | 26.48 | ||||||||||||
| Year Ended October 31, 2021 | 28.31 | (0.28 | ) | 11.94 | 11.66 | – | – | – | 39.97 | |||||||||||||||
| Year Ended October 31, 2020 | 26.46 | (0.15 | ) | 3.40 | 3.25 | (0.27 | ) | (1.13 | ) | (1.40 | ) | 28.31 | ||||||||||||
| Year Ended October 31, 2019 | 27.74 | 0.12 | 2.88 | 3.00 | (0.55 | ) | (3.73 | ) | (4.28 | ) | 26.46 | |||||||||||||
| Year Ended October 31, 2018 | 29.82 | 0.30 | (1.43 | ) | (1.13 | ) | (0.09 | ) | (0.86 | ) | (0.95 | ) | 27.74 | |||||||||||
| Year Ended October 31, 2017 | 24.77 | 0.04 | 5.20 | 5.24 | (0.11 | ) | (0.08 | ) | (0.19 | ) | 29.82 | |||||||||||||
| Institutional Class Shares | ||||||||||||||||||||||||
| Six Months Ended April 30, 2022* | 43.15 | 0.24 | (11.67 | ) | (11.43 | ) | – | (2.86 | ) | (2.86 | ) | 28.86 | ||||||||||||
| Year Ended October 31, 2021 | 30.37 | (0.06 | ) | 12.84 | 12.78 | – | – | – | 43.15 | |||||||||||||||
| Year Ended October 31, 2020 | 28.25 | 0.01 | 3.65 | 3.66 | (0.41 | ) | (1.13 | ) | (1.54 | ) | 30.37 | |||||||||||||
| Year Ended October 31, 2019 | 29.33 | 0.27 | 3.11 | 3.38 | (0.73 | ) | (3.73 | ) | (4.46 | ) | 28.25 | |||||||||||||
| Year Ended October 31, 2018 | 31.43 | 0.58 | (1.57 | ) | (0.99 | ) | (0.25 | ) | (0.86 | ) | (1.11 | ) | 29.33 | |||||||||||
| Year Ended October 31, 2017 | 26.04 | 0.19 | 5.49 | 5.68 | (0.21 | ) | (0.08 | ) | (0.29 | ) | 31.43 | |||||||||||||
| * | Unaudited |
| (a) | Net investment income/(loss) is based on average shares outstanding during the period. |
| (b) | Excludes sales charge. |
| (c) | Not annualized for periods less than one year. |
| (d) | Annualized for periods less than one year. |
Amounts listed as "–" are $0 or round to $0.
See accompanying Notes to Financial Statements.
| 96 | 2022 Semi-Annual Report |
Financial Highlights (continued)
For a Share Outstanding Throughout the Periods Indicated
abrdn International Small Cap Fund (concluded)
| Ratios/Supplemental Data | ||||||||||||||||
| Total Return (b)(c) | Net Assets at End of Period (000's) | Ratio of Expenses (Net of Reimbursements/ Waivers) to Average Net Assets (d) | Ratio of Expenses (Prior to Reimbursements) to Average Net Assets (d)(e) | Ratio of Net Investment Income (Loss) to Average Net Assets (d) | Portfolio Turnover (c)(f) | |||||||||||
| (28.30 | %)(g) | $ 75,319 | 1.35 | % | 1.36 | % | 0.69 | % | 14.18 | % | ||||||
| 41.58 | %(g) | 112,408 | 1.34 | %(h) | 1.42 | %(h) | (0.54 | %) | 42.63 | % | ||||||
| 13.02 | % | 90,560 | 1.40 | % | 1.61 | % | (0.33 | %) | 29.65 | % | ||||||
| 13.93 | % | 75,754 | 1.49 | %(h) | 1.82 | %(h) | 0.86 | % | 35.37 | % | ||||||
| (3.68 | %) | 49,391 | 1.53 | %(h) | 1.88 | %(h) | 1.48 | % | 18.07 | % | ||||||
| 21.79 | % | 59,477 | 1.63 | %(h) | 2.07 | %(h) | 0.40 | % | 20.60 | % | ||||||
| (28.52 | %)(g) | 425 | 1.99 | % | 2.12 | % | 0.17 | % | 14.18 | % | ||||||
| 40.68 | %(g) | 561 | 1.99 | %(h) | 2.18 | %(h) | (1.15 | %) | 42.63 | % | ||||||
| 12.27 | % | 554 | 2.05 | % | 2.38 | % | (1.02 | %) | 29.65 | % | ||||||
| 13.21 | % | 829 | 2.15 | %(h) | 2.59 | %(h) | (0.17 | %) | 35.37 | % | ||||||
| (4.31 | %) | 565 | 2.22 | %(h) | 2.65 | %(h) | 0.69 | % | 18.07 | % | ||||||
| 20.94 | % | 1,591 | 2.30 | %(h) | 2.84 | %(h) | (0.17 | %) | 20.60 | % | ||||||
| (28.41 | %) | 2,012 | 1.63 | % | 1.64 | % | 0.62 | % | 14.18 | % | ||||||
| 41.19 | % | 2,535 | 1.62 | %(h) | 1.70 | %(h) | (0.80 | %) | 42.63 | % | ||||||
| 12.68 | % | 1,649 | 1.69 | % | 1.90 | % | (0.61 | %) | 29.65 | % | ||||||
| 13.62 | % | 1,945 | 1.80 | %(h) | 2.13 | %(h) | 0.47 | % | 35.37 | % | ||||||
| (3.98 | %) | 2,309 | 1.84 | %(h) | 2.19 | %(h) | 1.02 | % | 18.07 | % | ||||||
| 21.34 | % | 1,707 | 1.99 | %(h) | 2.43 | %(h) | 0.14 | % | 20.60 | % | ||||||
| (28.16 | %)(g) | 187,732 | 0.99 | % | 1.10 | % | 1.35 | % | 14.18 | % | ||||||
| 42.08 | %(g) | 191,244 | 0.99 | %(h) | 1.15 | %(h) | (0.15 | %) | 42.63 | % | ||||||
| 13.41 | % | 46,330 | 1.04 | % | 1.35 | % | 0.03 | % | 29.65 | % | ||||||
| 14.39 | % | 35,248 | 1.15 | %(h) | 1.57 | %(h) | 1.01 | % | 35.37 | % | ||||||
| (3.34 | %) | 12,418 | 1.20 | %(h) | 1.61 | %(h) | 1.84 | % | 18.07 | % | ||||||
| 22.14 | % | 17,141 | 1.30 | %(h) | 1.79 | %(h) | 0.69 | % | 20.60 | % | ||||||
(e) During the period, certain fees were waived and/or reimbursed. If such waivers/reimbursements had not occurred, the ratios would have been as indicated.
(f) Portfolio turnover is calculated on the basis of the Fund as a whole without distinguishing among the classes of shares.
(g) The total return shown above includes the impact of financial statement rounding of the NAV per share and/or financial statement adjustments.
(h) Includes interest expense that amounts to less than 0.01%.
| 2022 Semi-Annual Report | 97 |
Financial Highlights (continued)
For a Share Outstanding Throughout the Periods Indicated
abrdn International Sustainable Leaders Fund
| Investment Activities | Distributions | |||||||||||||||||||||||
| Net Asset Value, Beginning of Period | Net Investment Income (Loss) (a) | Net Realized and Unrealized Gains (Losses) on Invest- ments | Total from Invest- ment Activities | Net Invest- ment Income | Tax Return of Capital | Total Distri- butions | Net Asset Value, End of Period | |||||||||||||||||
| Class A Shares | ||||||||||||||||||||||||
| Six Months Ended April 30, 2022* | $34.93 | $(0.01 | ) | $(9.65 | ) | $(9.66 | ) | $ – | $ – | $ – | $25.27 | |||||||||||||
| Year Ended October 31, 2021 | 26.19 | (0.12 | ) | 9.05 | 8.93 | (0.19 | ) | – | (0.19 | ) | 34.93 | |||||||||||||
| Year Ended October 31, 2020 | 26.95 | 0.17 | 0.29 | 0.46 | (1.22 | ) | – | (1.22 | ) | 26.19 | ||||||||||||||
| Year Ended October 31, 2019 | 23.64 | 0.81 | (h) | 2.70 | 3.51 | (0.20 | ) | – | (0.20 | ) | 26.95 | |||||||||||||
| Year Ended October 31, 2018 | 28.01 | 0.01 | (3.20 | ) | (3.19 | ) | (1.15 | ) | (0.03 | ) | (1.18 | ) | 23.64 | |||||||||||
| Year Ended October 31, 2017 | 22.26 | 1.75 | (i) | 4.22 | 5.97 | (0.22 | ) | – | (0.22 | ) | 28.01 | |||||||||||||
| Institutional Class Shares | ||||||||||||||||||||||||
| Six Months Ended April 30, 2022* | 35.96 | 0.03 | (9.95 | ) | (9.92 | ) | – | – | – | 26.04 | ||||||||||||||
| Year Ended October 31, 2021 | 26.98 | (0.04 | ) | 9.32 | 9.28 | (0.30 | ) | – | (0.30 | ) | 35.96 | |||||||||||||
| Year Ended October 31, 2020 | 27.74 | 0.24 | 0.30 | 0.54 | (1.30 | ) | – | (1.30 | ) | 26.98 | ||||||||||||||
| Year Ended October 31, 2019 | 24.27 | 0.91 | (h) | 2.77 | 3.68 | (0.21 | ) | – | (0.21 | ) | 27.74 | |||||||||||||
| Year Ended October 31, 2018 | 28.73 | 0.09 | (3.30 | ) | (3.21 | ) | (1.22 | ) | (0.03 | ) | (1.25 | ) | 24.27 | |||||||||||
| Year Ended October 31, 2017 | 22.84 | 1.72 | (i) | 4.46 | 6.18 | (0.29 | ) | – | (0.29 | ) | 28.73 | |||||||||||||
| * | Unaudited |
| (a) | Net investment income/(loss) is based on average shares outstanding during the period. |
| (b) | Not annualized for periods less than one year. |
| (c) | Annualized for periods less than one year. |
| (d) | Includes interest expense that amounts to less than 0.01%. |
| (e) | During the period, certain fees were waived and/or reimbursed. If such waivers/reimbursements had not occurred, the ratios would have been as indicated. |
| (f) | Portfolio turnover is calculated on the basis of the Fund as a whole without distinguishing among the classes of shares. |
Amounts listed as "–" are $0 or round to $0.
See accompanying Notes to Financial Statements.
| 98 | 2022 Semi-Annual Report |
Financial Highlights (continued)
For a Share Outstanding Throughout the Periods Indicated
abrdn International Sustainable Leaders Fund (concluded)
| Ratios/Supplemental Data | |||||||||||||||||||
| Total Return (b) | Net Assets at End of Period (000's) | Ratio of Expenses (Net of Reimbursement/ Waivers and Excluding Accruals for Estimated Tax Due on Foreign Tax Refund Recoveries) to Average Net Assets | Ratio of Expenses (Net of Reimbursements/ Waivers) to Average Net Assets (c)(d) | Ratio of Expenses (Prior to Reimbursements) to Average Net Assets (c)(d)(e) | Ratio of Net Investment Income (Loss) to Average Net Assets (c) | Portfolio Turnover (b)(f) | |||||||||||||
| (27.66% | ) | $ 82,348 | 1.19% | 1.19% | 1.65% | (0.04% | ) | 20% | |||||||||||
| 34.20% | 120,080 | 1.38% | 1.38% | 1.62% | (0.36% | ) | 114% | ||||||||||||
| 1.63% | (g) | 100,780 | 1.38% | 1.38% | 1.71% | 0.67% | 34% | ||||||||||||
| 15.02% | (h) | 120,472 | 1.44% | 2.99% | 3.06% | 3.24% | (h) | 132% | |||||||||||
| (11.93% | ) | 126,383 | 1.54% | 2.50% | 2.50% | 0.05% | 19% | ||||||||||||
| 27.14% | (i) | 177,342 | 1.42% | 3.93% | 3.93% | 7.02% | (i) | 18% | |||||||||||
| (27.59% | ) | 16,674 | 0.94% | 0.94% | 1.31% | 0.21% | 20% | ||||||||||||
| 34.56% | 25,253 | 1.13% | 1.13% | 1.31% | (0.11% | ) | 114% | ||||||||||||
| 1.86% | (g) | 20,047 | 1.13% | 1.13% | 1.33% | 0.90% | 34% | ||||||||||||
| 15.34% | (h) | 27,390 | 1.18% | 2.77% | 2.82% | 3.53% | (h) | 132% | |||||||||||
| (11.71% | ) | 26,633 | 1.30% | 2.22% | 2.23% | 0.33% | 19% | ||||||||||||
| 27.42% | (i) | 35,318 | 1.17% | 3.46% | 3.46% | 6.65% | (i) | 18% | |||||||||||
| (g) | Included within Total Return is the effect of withholding tax refunds and income taxes on recovered refunds (Note 2(i) of the Notes to Financial Statements). If such amounts were excluded, the Total Return for Class A Shares would have been (0.38%). For Institutional Class Shares, this amount would have been (0.11%). |
| (h) | Included within Net Investment Income per share, Total Return, and Ratio of Net Investment Income to Average Net Assets are the effects of withholding tax refunds and income taxes on recovered refunds (Note 2(i) of the Notes to Financial Statements). If such amounts were excluded, the Net Investment Income per share, Total Return, and Ratio of Net Investment Loss to Average Net Assets for Class A Shares would have been $0.28, 12.13%, and 1.13%, respectively. For Institutional Class Shares, these amounts would have been $0.37, 12.41%, and 1.42%, respectively. |
| (i) | Included within Net Investment Income per share, Total Return, and Ratio of Net Investment Income to Average Net Assets are the effects of withholding tax refunds and income taxes on recovered refunds (Note 2(i) of the Notes to Financial Statements). If such amounts were excluded, the Net Investment Loss per share, Total Return, and Ratio of Net Investment Loss to Average Net Assets for Class A Shares would have been $(0.14), 20.27%, and (0.55)%, respectively. For Institutional Class Shares, these amounts would have been $(0.24), 20.55%, and (0.92)%, respectively. |
| 2022 Semi-Annual Report | 99 |
Financial Highlights (continued)
For a Share Outstanding Throughout the Periods Indicated
abrdn Realty Income & Growth Fund
| Investment Activities | Distributions | |||||||||||||||||||||||||||||||||||
| Net Asset Value, Beginning of Period | Net Investment Income (Loss) | Net Realized and Unrealized Gains (Losses) on Investments | Total from Invest- ment Activities | Net Invest- ment Income | Net Realized Gains | Total Distri- butions | Redemp- tion Fees | Net Asset Value, End of Period | ||||||||||||||||||||||||||||
| Class A Shares | ||||||||||||||||||||||||||||||||||||
| Six Months Ended April 30, 2022* | $ 15.68 | $ 0.12 | (f) | $ (0.27 | ) | $ (0.15 | ) | $ (0.10 | ) | $(1.96 | ) | $(2.06 | ) | $ – | $ 13.47 | |||||||||||||||||||||
| Year Ended October 31, 2021 | 12.40 | 0.11 | (f) | 4.84 | 4.95 | (0.13 | ) | (1.54 | ) | (1.67 | ) | – | 15.68 | |||||||||||||||||||||||
| Year Ended October 31, 2020 | 17.98 | 0.25 | (f) | (3.17 | ) | (2.92 | ) | (0.60 | ) | (2.06 | ) | (2.66 | ) | – | 12.40 | |||||||||||||||||||||
| Year Ended October 31, 2019 | 21.38 | 0.32 | (f) | 3.28 | 3.60 | (0.52 | ) | (6.48 | ) | (7.00 | ) | – | 17.98 | |||||||||||||||||||||||
| Year Ended October 31, 2018(h) | 22.93 | 0.47 | (f) | (0.74 | ) | (0.27 | ) | (0.69 | ) | (0.59 | ) | (1.28 | ) | 0.00 | (i) | 21.38 | ||||||||||||||||||||
| Year Ended October 31, 2017 | 22.09 | (0.41 | ) | 2.42 | 2.01 | (0.70 | ) | (0.47 | ) | (1.17 | ) | 0.00 | (i) | 22.93 | ||||||||||||||||||||||
| Institutional Class Shares | ||||||||||||||||||||||||||||||||||||
| Six Months Ended April 30, 2022* | 15.74 | 0.14 | (f) | (0.28 | ) | (0.14 | ) | (0.11 | ) | (1.96 | ) | (2.07 | ) | – | 13.53 | |||||||||||||||||||||
| Year Ended October 31, 2021 | 12.44 | 0.14 | (f) | 4.86 | 5.00 | (0.16 | ) | (1.54 | ) | (1.70 | ) | – | 15.74 | |||||||||||||||||||||||
| Year Ended October 31, 2020 | 18.02 | 0.28 | (f) | (3.16 | ) | (2.88 | ) | (0.64 | ) | (2.06 | ) | (2.70 | ) | – | 12.44 | |||||||||||||||||||||
| Year Ended October 31, 2019 | 21.41 | 0.36 | (f) | 3.29 | 3.65 | (0.56 | ) | (6.48 | ) | (7.04 | ) | – | 18.02 | |||||||||||||||||||||||
| Year Ended October 31, 2018(h) | 22.97 | 0.54 | (f) | (0.76 | ) | (0.22 | ) | (0.75 | ) | (0.59 | ) | (1.34 | ) | 0.00 | (i) | 21.41 | ||||||||||||||||||||
| Year Ended October 31, 2017 | 22.11 | 0.20 | 1.88 | 2.08 | (0.75 | ) | (0.47 | ) | (1.22 | ) | 0.00 | (i) | 22.97 | |||||||||||||||||||||||
| * | Unaudited |
| (a) | Excludes sales charge. |
| (b) | Not annualized for periods less than one year. |
| (c) | Annualized for periods less than one year. |
| (d) | During the period, certain fees were waived and/or reimbursed. If such waivers/reimbursements had not occurred, the ratios would have been as indicated. |
| (e) | Portfolio turnover is calculated on the basis of the Fund as a whole without distinguishing among the classes of shares. |
Amounts listed as "–" are $0 or round to $0.
See accompanying Notes to Financial Statements.
| 100 | 2022 Semi-Annual Report |
Financial Highlights (continued)
For a Share Outstanding Throughout the Periods Indicated
abrdn Realty Income & Growth Fund (concluded)
| Ratios/Supplemental Data | |||||||||||||||||
| Total Return (a)(b) | Net Assets at End of Period (000's) | Ratio of Expenses (Net of Reimbursements/ Waivers) to Average Net Assets (c) | Ratio of Expenses (Prior to Reimbursements) to Average Net Assets (c)(d) | Ratio of Net Investment Income to Average Net Assets (c) | Portfolio Turnover (b)(e) | ||||||||||||
| (1.72%) | $ 750 | 1.25%(g) | 1.65%(g) | 1.70% | 6.43% | ||||||||||||
| 44.07% | 1,090 | 1.26%(g) | 1.72%(g) | 0.80% | 32.52% | ||||||||||||
| (18.12%) | 1,971 | 1.30%(g) | 1.71%(g) | 1.84% | 22.61% | ||||||||||||
| 25.65% | 2,341 | 1.28%(g) | 1.71%(g) | 1.83% | 20.70% | ||||||||||||
| (1.35%) | 1,751 | 1.34%(g) | 1.71%(g) | 2.16% | 42.71% | ||||||||||||
| 9.37% | 1,565 | 1.46%(g) | 1.65%(g) | 0.66% | 7.00% | ||||||||||||
| (1.62%) | 52,829 | 1.00%(g) | 1.41%(g) | 1.92% | 6.43% | ||||||||||||
| 44.41% | 56,593 | 1.01%(g) | 1.47%(g) | 1.01% | 32.52% | ||||||||||||
| (17.85%) | 46,235 | 1.05%(g) | 1.48%(g) | 2.05% | 22.61% | ||||||||||||
| 25.97% | 75,232 | 1.03%(g) | 1.39%(g) | 2.10% | 20.70% | ||||||||||||
| (1.15%) | 83,573 | 1.10%(g) | 1.45%(g) | 2.46% | 42.71% | ||||||||||||
| 9.65% | 107,042 | 1.21%(g) | 1.40%(g) | 0.92% | 7.00% | ||||||||||||
| (f) | Net investment income/(loss) is based on average shares outstanding during the period. |
| (g) | Includes interest expense that amounts to less than 0.01% for Class A and Institutional Class for the six months ended April 30, 2022. Includes interest expense that amounts to 0.01%, 0.05%, 0.03%, 0.10%, and 0.10% for Class A and Institutional Class for the years ended October 31, 2021, October 31, 2020, October 31, 2019, October 31, 2018, and October 31, 2017, respectively. |
| (h) | Beginning with the year ended October 31, 2018, the Fund has been audited by KPMG LLP. Previous years were audited by different independent registered public accounting firms. |
| (i) | Less than $0.005 per share. |
| 2022 Semi-Annual Report | 101 |
Financial Highlights (continued)
For a Share Outstanding Throughout the Periods Indicated
abrdn U.S. Small Cap Equity Fund
| Investment Activities | Distributions | |||||||||||||||||||||||||||||||
| Net Asset Value, Beginning of Period | Net Investment Income (Loss) (a) | Net Realized and Unrealized Gains (Losses) on Investments | Total from Investment Activities | Net Investment Income | Net Realized Gains | Total Distributions | Net Asset Value, End of Period | |||||||||||||||||||||||||
| Class A Shares | ||||||||||||||||||||||||||||||||
| Six Months Ended April 30, 2022* | $ 49.57 | $ (0.13 | ) | $ (8.72 | ) | $ (8.85 | ) | $ – | $(9.80 | ) | $(9.80 | ) | $30.92 | |||||||||||||||||||
| Year Ended October 31, 2021 | 33.55 | (0.24 | ) | 18.64 | 18.40 | – | (2.38 | ) | (2.38 | ) | 49.57 | |||||||||||||||||||||
| Year Ended October 31, 2020 | 33.19 | (0.20 | ) | 3.08 | 2.88 | – | (2.52 | ) | (2.52 | ) | 33.55 | |||||||||||||||||||||
| Year Ended October 31, 2019 | 35.39 | (0.10 | ) | 1.78 | 1.68 | – | (h) | (3.88 | ) | (3.88 | ) | 33.19 | ||||||||||||||||||||
| Year Ended October 31, 2018 | 35.61 | (0.08 | ) | (0.14 | ) | (0.22 | ) | – | – | – | 35.39 | |||||||||||||||||||||
| Year Ended October 31, 2017 | 28.71 | (0.11 | ) | 7.01 | 6.90 | – | – | – | 35.61 | |||||||||||||||||||||||
| Class C Shares | ||||||||||||||||||||||||||||||||
| Six Months Ended April 30, 2022* | 39.79 | (0.20 | ) | (6.58 | ) | (6.78 | ) | – | (9.80 | ) | (9.80 | ) | 23.21 | |||||||||||||||||||
| Year Ended October 31, 2021 | 27.48 | (0.42 | ) | 15.11 | 14.69 | – | (2.38 | ) | (2.38 | ) | 39.79 | |||||||||||||||||||||
| Year Ended October 31, 2020 | 27.79 | (0.33 | ) | 2.54 | 2.21 | – | (2.52 | ) | (2.52 | ) | 27.48 | |||||||||||||||||||||
| Year Ended October 31, 2019 | 30.53 | (0.27 | ) | 1.41 | 1.14 | – | (3.88 | ) | (3.88 | ) | 27.79 | |||||||||||||||||||||
| Year Ended October 31, 2018 | 30.94 | (0.30 | ) | (0.11 | ) | (0.41 | ) | – | – | – | 30.53 | |||||||||||||||||||||
| Year Ended October 31, 2017 | 25.12 | (0.30 | ) | 6.12 | 5.82 | – | – | – | 30.94 | |||||||||||||||||||||||
| Class R Shares | ||||||||||||||||||||||||||||||||
| Six Months Ended April 30, 2022* | 44.07 | (0.16 | ) | (7.53 | ) | (7.69 | ) | – | (9.80 | ) | (9.80 | ) | 26.58 | |||||||||||||||||||
| Year Ended October 31, 2021 | 30.12 | (0.32 | ) | 16.65 | 16.33 | – | (2.38 | ) | (2.38 | ) | 44.07 | |||||||||||||||||||||
| Year Ended October 31, 2020 | 30.14 | (0.27 | ) | 2.77 | 2.50 | – | (2.52 | ) | (2.52 | ) | 30.12 | |||||||||||||||||||||
| Year Ended October 31, 2019 | 32.64 | (0.19 | ) | 1.57 | 1.38 | – | (3.88 | ) | (3.88 | ) | 30.14 | |||||||||||||||||||||
| Year Ended October 31, 2018 | 32.97 | (0.18 | ) | (0.15 | ) | (0.33 | ) | – | – | – | 32.64 | |||||||||||||||||||||
| Year Ended October 31, 2017 | 26.67 | (0.21 | ) | 6.51 | 6.30 | – | – | – | 32.97 | |||||||||||||||||||||||
| Institutional Service Class Shares | ||||||||||||||||||||||||||||||||
| Six Months Ended April 30, 2022* | 53.65 | (0.10 | ) | (9.61 | ) | (9.71 | ) | – | (9.80 | ) | (9.80 | ) | 34.14 | |||||||||||||||||||
| Year Ended October 31, 2021 | 36.06 | (0.15 | ) | 20.12 | 19.97 | – | (2.38 | ) | (2.38 | ) | 53.65 | |||||||||||||||||||||
| Year Ended October 31, 2020 | 35.41 | (0.12 | ) | 3.29 | 3.17 | – | (2.52 | ) | (2.52 | ) | 36.06 | |||||||||||||||||||||
| Year Ended October 31, 2019 | 37.39 | (0.01 | ) | 1.93 | 1.92 | (0.02 | ) | (3.88 | ) | (3.90 | ) | 35.41 | ||||||||||||||||||||
| Year Ended October 31, 2018 | 37.51 | 0.01 | (0.13 | ) | (0.12 | ) | – | – | – | 37.39 | ||||||||||||||||||||||
| Year Ended October 31, 2017 | 30.17 | (0.03 | ) | 7.37 | 7.34 | – | – | – | 37.51 | |||||||||||||||||||||||
| Institutional Class Shares | ||||||||||||||||||||||||||||||||
| Six Months Ended April 30, 2022* | 53.75 | (0.07 | ) | (9.64 | ) | (9.71 | ) | – | (9.80 | ) | (9.80 | ) | 34.24 | |||||||||||||||||||
| Year Ended October 31, 2021 | 36.09 | (0.10 | ) | 20.14 | 20.04 | – | (2.38 | ) | (2.38 | ) | 53.75 | |||||||||||||||||||||
| Year Ended October 31, 2020 | 35.40 | (0.09 | ) | 3.30 | 3.21 | – | (2.52 | ) | (2.52 | ) | 36.09 | |||||||||||||||||||||
| Year Ended October 31, 2019 | 37.37 | 0.01 | 1.92 | 1.93 | (0.02 | ) | (3.88 | ) | (3.90 | ) | 35.40 | |||||||||||||||||||||
| Year Ended October 31, 2018 | 37.49 | 0.02 | (0.14 | ) | (0.12 | ) | – | – | – | 37.37 | ||||||||||||||||||||||
| Year Ended October 31, 2017 | 30.14 | (0.02 | ) | 7.37 | 7.35 | – | – | – | 37.49 | |||||||||||||||||||||||
| * | Unaudited |
| (a) | Net investment income/(loss) is based on average shares outstanding during the period. |
| (b) | Excludes sales charge. |
| (c) | Not annualized for periods less than one year. |
| (d) | Annualized for periods less than one year. |
Amounts listed as "–" are $0 or round to $0.
See accompanying Notes to Financial Statements
| 102 | 2022 Semi-Annual Report |
Financial Highlights (continued)
For a Share Outstanding Throughout the Periods Indicated
abrdn U.S. Small Cap Equity Fund (concluded)
| Ratios/Supplemental Data | ||||||||||||||||||
| Total Return (b)(c) | Net Assets at End of Period (000's) | Ratio of Expenses (Net of Reimbursements/ Waivers) to Average Net Assets (d) | Ratio of Expenses (Prior to Reimbursements) to Average Net Assets (d)(e) | Ratio of Net Investment Income (Loss) to Average Net Assets (d) | Portfolio Turnover (c)(f) | |||||||||||||
| (21.98%) | $ 120,681 | 1.33%(g) | 1.33%(g) | (0.68%) | 35.93% | |||||||||||||
| 56.92% | 172,963 | 1.35% | 1.35% | (0.56%) | 78.38% | |||||||||||||
| 8.97% | 124,673 | 1.40%(g) | 1.40%(g) | (0.62%) | 60.67% | |||||||||||||
| 7.15% | 159,391 | 1.41%(g) | 1.41%(g) | (0.33%) | 55.00% | |||||||||||||
| (0.62%) | 224,804 | 1.35%(g) | 1.35%(g) | (0.23%) | 38.28% | |||||||||||||
| 24.03% | 316,766 | 1.38% | 1.38% | (0.33%) | 42.71% | |||||||||||||
| (22.22%)(i) | 30,448 | 1.99%(g) | 2.05%(g) | (1.34%) | 35.93% | |||||||||||||
| 55.93% | 44,295 | 1.99% | 2.06% | (1.20%) | 78.38% | |||||||||||||
| 8.25% | 36,621 | 2.05%(g) | 2.10%(g) | (1.26%) | 60.67% | |||||||||||||
| 6.41% | 48,382 | 2.10%(g) | 2.10%(g) | (0.99%) | 55.00% | |||||||||||||
| (1.33%) | 75,913 | 2.06%(g) | 2.06%(g) | (0.95%) | 38.28% | |||||||||||||
| 23.17% | 95,913 | 2.10% | 2.10% | (1.05%) | 42.71% | |||||||||||||
| (22.11%) | 3,918 | 1.63%(g) | 1.63%(g) | (0.97%) | 35.93% | |||||||||||||
| 56.50% | 5,408 | 1.63% | 1.63% | (0.84%) | 78.38% | |||||||||||||
| 8.59% | 3,554 | 1.75%(g) | 1.75%(g) | (0.96%) | 60.67% | |||||||||||||
| 6.78% | 5,272 | 1.75%(g) | 1.75%(g) | (0.65%) | 55.00% | |||||||||||||
| (1.00%) | 8,430 | 1.72%(g) | 1.72%(g) | (0.55%) | 38.28% | |||||||||||||
| 23.62%(i) | 20,595 | 1.72% | 1.72% | (0.67%) | 42.71% | |||||||||||||
| (21.90%) | 32,284 | 1.11%(g) | 1.11%(g) | (0.45%) | 35.93% | |||||||||||||
| 57.33% | 41,568 | 1.11% | 1.11% | (0.31%) | 78.38% | |||||||||||||
| 9.24% | 31,548 | 1.13%(g) | 1.13%(g) | (0.35%) | 60.67% | |||||||||||||
| 7.44% | 40,476 | 1.12%(g) | 1.12%(g) | (0.04%) | 55.00% | |||||||||||||
| (0.32%) | 50,163 | 1.08%(g) | 1.08%(g) | 0.03% | 38.28% | |||||||||||||
| 24.33%(i) | 61,897 | 1.13% | 1.13% | (0.08%) | 42.71% | |||||||||||||
| (21.85%) | 688,333 | 0.99%(g) | 1.06%(g) | (0.34%) | 35.93% | |||||||||||||
| 57.48% | 931,614 | 0.99% | 1.06% | (0.21%) | 78.38% | |||||||||||||
| 9.37% | 536,973 | 1.04%(g) | 1.10%(g) | (0.27%) | 60.67% | |||||||||||||
| 7.48% | 607,103 | 1.11%(g) | 1.11%(g) | 0.03% | 55.00% | |||||||||||||
| (0.32%) | 1,263,907 | 1.07%(g) | 1.07%(g) | 0.04% | 38.28% | |||||||||||||
| 24.39% | 1,467,787 | 1.10% | 1.10% | (0.06%) | 42.71% | |||||||||||||
| (e) | During the period, certain fees were waived and/or reimbursed. If such waivers/reimbursements had not occurred, the ratios would have been as indicated. |
| (f) | Portfolio turnover is calculated on the basis of the Fund as a whole without distinguishing among the classes of shares. |
| (g) | Includes interest expense that amounts to less than 0.01%. |
| (h) | Less than $0.005 per share. |
| (i) | The total return shown above includes the impact of financial statement rounding of the NAV per share and/or financial statement adjustments. |
| 2022 Semi-Annual Report | 103 |
Financial Highlights (continued)
For a Share Outstanding Throughout the Periods Indicated
abrdn U.S. Sustainable Leaders Fund
| Investment Activities | Distributions | |||||||||||||||||||||||||||||||
| Net Asset Value, Beginning of Period | Net Investment Income (Loss) (a) | Net Realized and Unrealized Gains (Losses) on Investments | Total from Investment Activities | Net Investment Income | Net Realized Gains | Total Distributions | Net Asset Value, End of Period | |||||||||||||||||||||||||
| Class A Shares | ||||||||||||||||||||||||||||||||
| Six Months Ended April 30, 2022* | $ 17.32 | $ (0.03 | ) | $(2.36 | ) | $(2.39 | ) | $ – | $(4.37 | ) | $(4.37 | ) | $10.56 | |||||||||||||||||||
| Year Ended October 31, 2021 | 13.79 | (0.05 | ) | 5.31 | 5.26 | – | (1.73 | ) | (1.73 | ) | 17.32 | |||||||||||||||||||||
| Year Ended October 31, 2020 | 12.95 | (0.03 | ) | 2.17 | 2.14 | (0.01 | ) | (1.29 | ) | (1.30 | ) | 13.79 | ||||||||||||||||||||
| Year Ended October 31, 2019 | 12.53 | 0.01 | 1.79 | 1.80 | (0.02 | ) | (1.36 | ) | (1.38 | ) | 12.95 | |||||||||||||||||||||
| Year Ended October 31, 2018 | 13.05 | 0.02 | 0.83 | 0.85 | (0.04 | ) | (1.33 | ) | (1.37 | ) | 12.53 | |||||||||||||||||||||
| Year Ended October 31, 2017 | 12.13 | 0.04 | 2.34 | 2.38 | (0.02 | ) | (1.44 | ) | (1.46 | ) | 13.05 | |||||||||||||||||||||
| Class C Shares | ||||||||||||||||||||||||||||||||
| Six Months Ended April 30, 2022* | 13.77 | (0.05 | ) | (1.72 | ) | (1.77 | ) | – | (4.37 | ) | (4.37 | ) | 7.63 | |||||||||||||||||||
| Year Ended October 31, 2021 | 11.36 | (0.12 | ) | 4.26 | 4.14 | – | (1.73 | ) | (1.73 | ) | 13.77 | |||||||||||||||||||||
| Year Ended October 31, 2020 | 10.94 | (0.10 | ) | 1.81 | 1.71 | – | (1.29 | ) | (1.29 | ) | 11.36 | |||||||||||||||||||||
| Year Ended October 31, 2019 | 10.87 | (0.06 | ) | 1.49 | 1.43 | – | (1.36 | ) | (1.36 | ) | 10.94 | |||||||||||||||||||||
| Year Ended October 31, 2018 | 11.53 | (0.06 | ) | 0.73 | 0.67 | – | (1.33 | ) | (1.33 | ) | 10.87 | |||||||||||||||||||||
| Year Ended October 31, 2017 | 10.93 | (0.04 | ) | 2.08 | 2.04 | – | (1.44 | ) | (1.44 | ) | 11.53 | |||||||||||||||||||||
| Institutional Service Class Shares | ||||||||||||||||||||||||||||||||
| Six Months Ended April 30, 2022* | 18.91 | (0.01 | ) | (2.66 | ) | (2.67 | ) | – | (4.37 | ) | (4.37 | ) | 11.87 | |||||||||||||||||||
| Year Ended October 31, 2021 | 14.89 | (0.02 | ) | 5.77 | 5.75 | – | (1.73 | ) | (1.73 | ) | 18.91 | |||||||||||||||||||||
| Year Ended October 31, 2020 | 13.88 | – | (h) | 2.34 | 2.34 | (0.04 | ) | (1.29 | ) | (1.33 | ) | 14.89 | ||||||||||||||||||||
| Year Ended October 31, 2019 | 13.33 | 0.04 | 1.92 | 1.96 | (0.05 | ) | (1.36 | ) | (1.41 | ) | 13.88 | |||||||||||||||||||||
| Year Ended October 31, 2018 | 13.79 | 0.05 | 0.88 | 0.93 | (0.06 | ) | (1.33 | ) | (1.39 | ) | 13.33 | |||||||||||||||||||||
| Year Ended October 31, 2017 | 12.74 | 0.06 | 2.46 | 2.52 | (0.03 | ) | (1.44 | ) | (1.47 | ) | 13.79 | |||||||||||||||||||||
| Institutional Class Shares | ||||||||||||||||||||||||||||||||
| Six Months Ended April 30, 2022* | 19.03 | (0.01 | ) | (2.69 | ) | (2.70 | ) | – | (4.37 | ) | (4.37 | ) | 11.96 | |||||||||||||||||||
| Year Ended October 31, 2021 | 14.96 | (0.01 | ) | 5.81 | 5.80 | – | (1.73 | ) | (1.73 | ) | 19.03 | |||||||||||||||||||||
| Year Ended October 31, 2020 | 13.93 | 0.01 | 2.35 | 2.36 | (0.04 | ) | (1.29 | ) | (1.33 | ) | 14.96 | |||||||||||||||||||||
| Year Ended October 31, 2019 | 13.37 | 0.04 | 1.93 | 1.97 | (0.05 | ) | (1.36 | ) | (1.41 | ) | 13.93 | |||||||||||||||||||||
| Year Ended October 31, 2018 | 13.82 | 0.06 | 0.89 | 0.95 | (0.07 | ) | (1.33 | ) | (1.40 | ) | 13.37 | |||||||||||||||||||||
| Year Ended October 31, 2017 | 12.76 | 0.08 | 2.46 | 2.54 | (0.04 | ) | (1.44 | ) | (1.48 | ) | 13.82 | |||||||||||||||||||||
* Unaudited
(a) Net investment income/(loss) is based on average shares outstanding during the period.
(b) Excludes sales charge.
(c) Not annualized for periods less than one year.
(d) Annualized for periods less than one year.
Amounts listed as "–" are $0 or round to $0.
See accompanying Notes to Financial Statements.
| 104 | 2022 Semi-Annual Report |
1
Financial Highlights (continued)
For a Share Outstanding Throughout the Periods Indicated
abrdn U.S. Sustainable Leaders Fund (concluded)
| Ratios/Supplemental Data | ||||||||||||
| Total Return (b)(c) | Net Assets at End of Period (000's) | Ratio of Expenses (Net of Reimbursements/ Waivers) to Average Net Assets (d) | Ratio of Expenses (Prior to Reimbursements) to Average Net Assets (d)(e) | Ratio of Net Investment Income (Loss) to Average Net Assets (d) | Portfolio Turnover (c)(f) | |||||||
| (18.37%) | $261,889 | 1.19%(g) | 1.23%(g) | (0.41%) | 26.38% | |||||||
| 41.35% | 345,638 | 1.19% | 1.23% | (0.33%) | 111.07% | |||||||
| 17.50% | 264,977 | 1.19% | 1.26% | (0.24%) | 49.68% | |||||||
| 17.60% | 247,926 | 1.19% | 1.27% | 0.06% | 47.13% | |||||||
| 6.63% | 233,717 | 1.19%(g) | 1.25%(g) | 0.14% | 38.68% | |||||||
| 21.13% | 242,085 | 1.19%(g) | 1.26%(g) | 0.29% | 33.79% | |||||||
| (18.69%) | 280 | 1.90%(g) | 2.08%(g) | (1.12%) | 26.38% | |||||||
| 40.20% | 329 | 1.90% | 2.07% | (1.01%) | 111.07% | |||||||
| 16.71% | 1,143 | 1.90% | 2.08% | (0.94%) | 49.68% | |||||||
| 16.75% | 1,428 | 1.90% | 2.11% | (0.58%) | 47.13% | |||||||
| 5.88% | 2,963 | 1.90%(g) | 2.07%(g) | (0.56%) | 38.68% | |||||||
| 20.26% | 3,544 | 1.90%(g) | 2.09%(g) | (0.40%) | 33.79% | |||||||
| (18.31%) | 122,591 | 0.97%(g) | 1.01%(g) | (0.18%) | 26.38% | |||||||
| 41.61% | 158,581 | 0.97% | 1.01% | (0.11%) | 111.07% | |||||||
| 17.79% | 121,611 | 0.97% | 1.04% | (0.01%) | 49.68% | |||||||
| 17.84% | 113,600 | 0.97% | 1.05% | 0.29% | 47.13% | |||||||
| 6.90% | 106,337 | 0.97%(g) | 1.03%(g) | 0.36% | 38.68% | |||||||
| 21.33% | 109,418 | 0.98%(g) | 1.05%(g) | 0.49% | 33.79% | |||||||
| (18.35%) | 10,859 | 0.90%(g) | 1.00%(g) | (0.12%) | 26.38% | |||||||
| 41.77% | 14,953 | 0.90% | 1.00% | (0.05%) | 111.07% | |||||||
| 17.89% | 10,982 | 0.90% | 1.01% | 0.05% | 49.68% | |||||||
| 17.90% | 8,839 | 0.90% | 1.03% | 0.34% | 47.13% | |||||||
| 6.99% | 6,801 | 0.90%(g) | 1.01%(g) | 0.43% | 38.68% | |||||||
| 21.45% | 6,507 | 0.90%(g) | 1.01%(g) | 0.59% | 33.79% | |||||||
| (e) | During the period, certain fees were waived and/or reimbursed. If such waivers/reimbursements had not occurred, the ratios would have been as indicated. |
| (f) | Portfolio turnover is calculated on the basis of the Fund as a whole without distinguishing among the classes of shares. |
| (g) | Includes interest expense that amounts to less than 0.01%. |
| (h) | Less than $0.005 per share. |
| 2022 Semi-Annual Report | 105 |
2
Financial Highlights (continued)
For a Share Outstanding Throughout the Periods Indicated
abrdn U.S. Sustainable Leaders Smaller Companies Fund
| Investment Activities | Distributions | ||||||||||||||||||||||||||||
| Net Asset Value, Beginning of Period | Net Investment Income (Loss) (a) | Net Realized and Unrealized Gains (Losses) on Investments | Total from Investment Activities | Net Investment Income | Net Realized Gains | Total Distributions | Net Asset Value, End of Period | ||||||||||||||||||||||
| Class A Shares | |||||||||||||||||||||||||||||
| Six Months Ended April 30, 2022* | $11.09 | $(0.02 | ) | $ (1.87 | ) | $ (1.89 | ) | $ – | $(2.67 | ) | $(2.67 | ) | $ 6.53 | ||||||||||||||||
| Year Ended October 31, 2021 | 8.08 | (0.04 | ) | 4.06 | 4.02 | – | (1.01 | ) | (1.01 | ) | 11.09 | ||||||||||||||||||
| Year Ended October 31, 2020 | 7.59 | (0.01 | ) | 0.96 | 0.95 | – | (j) | (0.46 | ) | (0.46 | ) | 8.08 | |||||||||||||||||
| Year Ended October 31, 2019 | 6.85 | 0.01 | 1.09 | 1.10 | – | (0.36 | ) | (0.36 | ) | 7.59 | |||||||||||||||||||
| Year Ended October 31, 2018 | 8.52 | 0.02 | 0.62 | 0.64 | – | (2.31 | ) | (2.31 | ) | 6.85 | |||||||||||||||||||
| Year Ended October 31, 2017 | 8.81 | (0.12 | ) | 0.90 | 0.78 | – | (1.07 | ) | (1.07 | ) | 8.52 | ||||||||||||||||||
| Class C Shares | |||||||||||||||||||||||||||||
| Six Months Ended April 30, 2022* | 1.51 | (0.01 | ) | (0.26 | ) | (0.27 | ) | – | (0.34 | ) | (0.34 | ) | 0.90 | ||||||||||||||||
| Year Ended October 31, 2021 | 1.84 | (0.02 | ) | 0.70 | 0.68 | – | (1.01 | ) | (1.01 | ) | 1.51 | ||||||||||||||||||
| Year Ended October 31, 2020 | 2.08 | (0.02 | ) | 0.25 | 0.23 | (0.01 | ) | (0.46 | ) | (0.47 | ) | 1.84 | |||||||||||||||||
| Year Ended October 31, 2019 | 2.17 | (0.01 | ) | 0.28 | 0.27 | – | (0.36 | ) | (0.36 | ) | 2.08 | ||||||||||||||||||
| Year Ended October 31, 2018 | 4.22 | (0.01 | ) | 0.27 | 0.26 | – | (2.31 | ) | (2.31 | ) | 2.17 | ||||||||||||||||||
| Year Ended October 31, 2017 | 4.92 | (0.09 | ) | 0.46 | 0.37 | – | (1.07 | ) | (1.07 | ) | 4.22 | ||||||||||||||||||
| Class R Shares | |||||||||||||||||||||||||||||
| Six Months Ended April 30, 2022* | 9.54 | (0.03 | ) | (1.60 | ) | (1.63 | ) | – | (2.32 | ) | (2.32 | ) | 5.59 | ||||||||||||||||
| Year Ended October 31, 2021 | 7.09 | (0.06 | ) | 3.52 | 3.46 | – | (1.01 | ) | (1.01 | ) | 9.54 | ||||||||||||||||||
| Year Ended October 31, 2020 | 6.73 | (0.03 | ) | 0.85 | 0.82 | – | (0.46 | ) | (0.46 | ) | 7.09 | ||||||||||||||||||
| Year Ended October 31, 2019 | 6.13 | (0.01 | ) | 0.97 | 0.96 | – | (0.36 | ) | (0.36 | ) | 6.73 | ||||||||||||||||||
| Year Ended October 31, 2018 | 7.88 | – | (j) | 0.56 | 0.56 | – | (2.31 | ) | (2.31 | ) | 6.13 | ||||||||||||||||||
| Year Ended October 31, 2017 | 8.25 | (0.13 | ) | 0.83 | 0.70 | – | (1.07 | ) | (1.07 | ) | 7.88 | ||||||||||||||||||
| Institutional Service Class Shares | |||||||||||||||||||||||||||||
| Six Months Ended April 30, 2022* | 11.68 | (0.01 | ) | (1.97 | ) | (1.98 | ) | – | (2.82 | ) | (2.82 | ) | 6.88 | ||||||||||||||||
| Year Ended October 31, 2021 | 8.45 | (0.03 | ) | 4.27 | 4.24 | – | (1.01 | ) | (1.01 | ) | 11.68 | ||||||||||||||||||
| Year Ended October 31, 2020 | 7.92 | – | (j) | 1.00 | 1.00 | (0.01 | ) | (0.46 | ) | (0.47 | ) | 8.45 | |||||||||||||||||
| Year Ended October 31, 2019 | 7.11 | 0.03 | 1.14 | 1.17 | – | (0.36 | ) | (0.36 | ) | 7.92 | |||||||||||||||||||
| Year Ended October 31, 2018 | 8.75 | 0.04 | 0.63 | 0.67 | – | (2.31 | ) | (2.31 | ) | 7.11 | |||||||||||||||||||
| Year Ended October 31, 2017 | 9.00 | (0.10 | ) | 0.92 | 0.82 | – | (1.07 | ) | (1.07 | ) | 8.75 | ||||||||||||||||||
| Institutional Class Shares | |||||||||||||||||||||||||||||
| Six Months Ended April 30, 2022* | 12.21 | (0.01 | ) | (2.07 | ) | (2.08 | ) | – | (2.91 | ) | (2.91 | ) | 7.22 | ||||||||||||||||
| Year Ended October 31, 2021 | 8.78 | (0.01 | ) | 4.45 | 4.44 | – | (1.01 | ) | (1.01 | ) | 12.21 | ||||||||||||||||||
| Year Ended October 31, 2020 | 8.20 | 0.01 | 1.04 | 1.05 | (0.01 | ) | (0.46 | ) | (0.47 | ) | 8.78 | ||||||||||||||||||
| Year Ended October 31, 2019 | 7.34 | 0.04 | 1.18 | 1.22 | – | (0.36 | ) | (0.36 | ) | 8.20 | |||||||||||||||||||
| Year Ended October 31, 2018 | 8.95 | 0.05 | 0.65 | 0.70 | – | (2.31 | ) | (2.31 | ) | 7.34 | |||||||||||||||||||
| Year Ended October 31, 2017 | 9.17 | (0.10 | ) | 0.95 | 0.85 | – | (1.07 | ) | (1.07 | ) | 8.95 | ||||||||||||||||||
| * | Unaudited |
| (a) | Net investment income/(loss) is based on average shares outstanding during the period. |
| (b) | Excludes sales charge. |
| (c) | Not annualized for periods less than one year. |
| (d) | Annualized for periods less than one year. |
| (e) | During the period, certain fees were waived and/or reimbursed. If such waivers/reimbursements had not occurred, the ratios would have been as indicated. |
| (f) | Indicates the dividend expense charged for the period to average net assets. |
Amounts listed as "–" are $0 or round to $0.
See accompanying Notes to Financial Statements.
| 106 | 2022 Semi-Annual Report |
3
Financial Highlights (concluded)
For a Share Outstanding Throughout the Periods Indicated
abrdn U.S. Sustainable Leaders Smaller Companies Fund (concluded)
| Ratios/Supplemental Data | ||||||||||||||
| Total Return (b)(c) | Net Assets at End of Period (000's) | Ratio of Expenses (Net of Reimbursements/ Waivers) to Average Net Assets (d) | Ratio of Expenses (Prior to Reimbursements) to Average Net Assets (d)(e) | Ratio of Net Investment Income (Loss) to Average Net Assets (d) | Dividend Expense (f)(g) | Portfolio Turnover (c)(h) | ||||||||
| (22.55%) | $ 9,723 | 1.22% | 2.01% | (0.47%) | – | 27.67% | ||||||||
| 53.27% | 10,032 | 1.22%(i) | 2.42%(i) | (0.45%) | – | 157.35% | ||||||||
| 12.88% | 7,618 | 1.24%(i) | 2.13%(i) | (0.17%) | – | 45.98% | ||||||||
| 17.62% | 8,481 | 1.25% | 2.09% | 0.20% | – | 54.04% | ||||||||
| 8.32% | 7,466 | 1.32%(i) | 2.03%(i) | 0.34% | 0.04% | 112.97% | ||||||||
| 9.69% | 9,479 | 2.80%(i) | 3.22%(i) | (1.39%) | 1.18% | 35.38% | ||||||||
| (23.20%) | 501 | 1.90% | 2.77% | (1.18%) | – | 27.67% | ||||||||
| 51.76% | 633 | 1.90%(i) | 3.16%(i) | (1.14%) | – | 157.35% | ||||||||
| 11.83% | 528 | 1.90%(i) | 2.84%(i) | (0.85%) | – | 45.98% | ||||||||
| 17.22% | 4,734 | 1.90% | 2.83% | (0.48%) | – | 54.04% | ||||||||
| 7.45% | 1,345 | 1.97%(i) | 2.77%(i) | (0.32%) | 0.04% | 112.97% | ||||||||
| 8.89% | 1,837 | 3.47%(i) | 4.09%(i) | (2.05%) | 1.21% | 35.38% | ||||||||
| (22.67%) | 2,449 | 1.55% | 2.34% | (0.80%) | – | 27.67% | ||||||||
| 52.76% | 3,071 | 1.55%(i) | 2.75%(i) | (0.78%) | – | 157.35% | ||||||||
| 12.54% | 1,952 | 1.43%(i) | 2.32%(i) | (0.37%) | – | 45.98% | ||||||||
| 17.39% | 1,924 | 1.55% | 2.39% | (0.09%) | – | 54.04% | ||||||||
| 7.89% | 1,895 | 1.69%(i) | 2.40%(i) | (0.04%) | 0.04% | 112.97% | ||||||||
| 9.35% | 2,269 | 3.14%(i) | 3.56%(i) | (1.72%) | 1.18% | 35.38% | ||||||||
| (22.46%) | 375 | 1.02% | 1.81% | (0.36%) | – | 27.67% | ||||||||
| 53.56% | 159 | 1.05%(i) | 2.25%(i) | (0.33%) | – | 157.35% | ||||||||
| 12.96% | 340 | 1.04%(i) | 1.93%(i) | 0.02% | – | 45.98% | ||||||||
| 17.96% | 480 | 1.05% | 1.89% | 0.45% | – | 54.04% | ||||||||
| 8.50% | 679 | 1.07%(i) | 1.79%(i) | 0.55% | 0.04% | 112.97% | ||||||||
| 9.96% | 840 | 2.62%(i) | 3.04%(i) | (1.21%) | 1.17% | 35.38% | ||||||||
| (22.49%) | 5,316 | 0.90% | 1.82% | (0.16%) | – | 27.67% | ||||||||
| 53.85% | 5,531 | 0.90%(i) | 2.24%(i) | (0.12%) | – | 157.35% | ||||||||
| 13.14% | 3,451 | 0.90%(i) | 1.94%(i) | 0.17% | – | 45.98% | ||||||||
| 18.10% | 4,580 | 0.90% | 1.89% | 0.58% | – | 54.04% | ||||||||
| 8.69% | 5,583 | 0.98%(i) | 1.83%(i) | 0.63% | 0.06% | 112.97% | ||||||||
| 10.12% | 12,413 | 2.56%(i) | 3.07%(i) | (1.13%) | 1.30% | 35.38% | ||||||||
| (g) | Dividend expense ratio includes broker related expenses for securities sold short. |
| (h) | Portfolio turnover is calculated on the basis of the Fund as a whole without distinguishing among the classes of shares. |
| (i) | Includes interest expense that amounts to less than 0.01% for Class A, Class C, Class R, Institutional Service Class and Institutional Class for the years ended October 31, 2021, October 31, 2020 and October 31, 2018. Includes interest expense that amounts to 0.01% for Class A, Class C, Class R, Institutional Service Class and Institutional Class for the year ended October 31, 2017. |
| (j) | Less than $0.005 per share. |
| 2022 Semi-Annual Report | 107 |
4
Notes to Financial Statements
April 30, 2022 (Unaudited)
1. Organization
abrdn Funds (the "Trust"), formerly Aberdeen Funds, was organized as a statutory trust under the laws of the state of Delaware by a Certificate of Trust filed on September 27, 2007 and is registered under the Investment Company Act of 1940, as amended (the "1940 Act"), as an open-end management investment company. As of April 30, 2022, the Trust had authorized an unlimited number of shares of beneficial interest ("shares") without par value. As of April 30, 2022, the Trust operated twenty (20) separate series, or mutual funds, each with its own investment objective(s) and strategies. This report contains the financial statements and financial highlights of the fourteen (14) funds listed below (each a "Fund"; collectively, the "Funds"):
| – | abrdn China A Share Equity Fund (formerly, Aberdeen China A Share Equity Fund) ("China A Share Equity Fund") |
| – | abrdn Dynamic Dividend Fund (formerly, Aberdeen Dynamic Dividend Fund) ("Dynamic Dividend Fund") |
| – | abrdn Emerging Markets ex-China Fund (formerly, Aberdeen Global Equity Fund) ("Emerging Markets ex-China Fund") |
| – | abrdn Emerging Markets Fund (formerly, Aberdeen Emerging Markets Fund) ("Emerging Markets Fund") |
| – | abrdn Emerging Markets Sustainable Leaders Fund (formerly, Aberdeen Emerging Markets Sustainable Leaders Fund) ("Emerging Markets Sustainable Leaders Fund") |
| – | abrdn Global Equity Impact Fund (formerly, Aberdeen Global Equity Impact Fund) ("Global Equity Impact Fund") |
| – | abrdn Global Infrastructure Fund (formerly, Aberdeen Global Infrastructure Fund) ("Global Infrastructure Fund") |
| – | abrdn International Real Estate Equity Fund (formerly, Aberdeen International Real Estate Equity Fund) ("International Real Estate Equity Fund") |
| – | abrdn International Small Cap Fund (formerly, Aberdeen International Small Cap Fund) ("International Small Cap Fund") |
| – | abrdn International Sustainable Leaders Fund (formerly, Aberdeen International Sustainable Leaders Fund) ("International Sustainable Leaders Fund") |
| – | abrdn Realty Income & Growth Fund (formerly, Aberdeen Realty Income & Growth Fund) ("Realty Income & Growth Fund") |
| – | abrdn U.S. Small Cap Equity Fund (formerly, Aberdeen U.S. Small Cap Equity Fund) ("U.S. Small Cap Equity Fund") |
| – | abrdn U.S. Sustainable Leaders Fund (formerly, Aberdeen U.S. Sustainable Leaders Fund) ("U.S. Sustainable Leaders Fund") |
| – | abrdn U.S. Sustainable Leaders Smaller Companies Fund (formerly, Aberdeen U.S. Sustainable Leaders Smaller Companies Fund) ("U.S. Sustainable Leaders Smaller Companies Fund") |
2. Summary of Significant Accounting Policies
The Trust is an investment company and accordingly follows the investment company accounting and reporting guidance of the Financial Accounting Standards Board ("FASB") Accounting Standard Codification Topic 946 Financial Services-Investment Companies. The following is a summary of significant accounting policies followed by the Funds in the preparation of their financial statements. The policies conform to generally accepted accounting principles in the United States of America ("GAAP"). The preparation of financial statements requires management to make estimates and assumptions that affect the reported amounts of assets and liabilities, disclosure of contingent assets and liabilities at the date of the financial statements, and the reported amounts of income and expenses for the period. Actual results could differ from those estimates. The accounting records of the Funds are maintained in U.S. Dollars.
| a. | Security Valuation |
The Funds value their securities at current market value or fair value, consistent with regulatory requirements. "Fair value" is defined in the Funds' Valuation and Liquidity Procedures as the price that could be received to sell an asset or paid to transfer a liability in an orderly transaction between willing market participants without a compulsion to transact at the measurement date.
Equity securities that are traded on an exchange are valued at the last quoted sale price on the principal exchange on which the security is traded at the "Valuation Time" subject to application, when appropriate, of the valuation factors described in the paragraph below. Under normal circumstances, the Valuation Time is as of the close of regular trading on the New York Stock Exchange (usually 4:00 p.m. Eastern Time). In the absence of a sale price, the security is valued at the mean of the bid/ask price quoted at the close on the principal exchange on which the security is traded. Securities traded on NASDAQ are valued at the NASDAQ official closing price.
In accordance with the authoritative guidance on fair value measurements and disclosures under generally accepted accounting principles in the United States of America, the Funds disclose the fair value of their investments using a three-level hierarchy that classifies the inputs to valuation techniques used to measure the fair value. The hierarchy assigns Level 1, the highest level, measurements to valuations based upon unadjusted quoted prices in active markets for identical assets, Level 2 measurements to valuations based upon other significant observable inputs, including adjusted quoted prices in active markets for similar assets, and Level 3, the lowest level, measurements to valuations based upon unobservable inputs that are significant to the valuation. Inputs refer broadly to the assumptions that market participants would use in pricing the asset or liability, including assumptions about risk, for example, the risk inherent in a particular valuation technique used to
| 108 | 2022 Semi-Annual Report |
Notes to Financial Statements (continued)
April 30, 2022 (Unaudited)
measure fair value including a pricing model and/or the risk inherent in the inputs to the valuation technique. Inputs may be observable or unobservable. Observable inputs are inputs that reflect the assumptions market participants would use in pricing the asset or liability, which are based on market data obtained from sources independent of the reporting entity. Unobservable inputs are inputs that reflect the reporting entity's own assumptions about the assumptions market participants would use in pricing the asset or liability developed based on the best information available in the circumstances. A financial instrument's level within the fair value hierarchy is based upon the lowest level of any input that is significant to the fair value measurement. Open-end mutual funds are valued at the respective net asset value ("NAV") as reported by such company. The prospectuses for the registered open-end management investment companies in which a Fund invests explain the circumstances under which those companies will use fair value pricing and the effects of using fair value pricing. Closed-end funds and exchange-traded funds ("ETFs") are valued at the market price of the security at the Valuation Time. A security using any of these pricing methodologies is determined to be a Level 1 investment.
Foreign equity securities that are traded on foreign exchanges that close prior to the Valuation Time are valued by applying valuation factors to the last sale price or the mean price as noted above. Valuation factors are provided by an independent pricing service provider approved by the Board. These valuation factors are used when pricing a Fund's portfolio holdings to estimate market movements between the time foreign markets close and the time a Fund values such foreign securities. These valuation factors are based on inputs such as depositary receipts, indices, futures, sector indices/ETFs, exchange rates, and local exchange opening and closing prices of each security. When prices with the application of valuation factors are utilized, the value assigned to the foreign securities may not be the same as quoted or published prices of the securities on their primary markets. A security that applies a valuation factor is determined to be a Level 2 investment because the exchange-traded price has been adjusted. Valuation factors are not utilized if the independent pricing service provider is unable to provide a valuation factor or if the valuation factor falls below a predetermined threshold; in such case, the security is determined to be a Level 1 investment.
Long-term debt and other fixed-income securities are valued at the last quoted or evaluated bid price on the valuation date provided by an independent pricing service provider approved by the Board of Trustees of the Trust (the "Board"). If there are no current day bids, the security is valued at the previously applied bid. Pricing services generally price debt securities assuming orderly transactions of an institutional "round lot" size, and the strategies employed by abrdn Inc. (formerly, Aberdeen Standard Investments Inc.) ("abrdn" or the "Adviser") generally trade in round lot sizes. In certain circumstances, fixed income securities may be held or transactions may be conducted in smaller, "odd lot" sizes. Odd lots may trade at lower or, occasionally, higher prices than institutional round lot trades. Short-term debt securities (such as commercial paper and U.S. treasury bills) having a remaining maturity of 60 days or less are valued at the last quoted or evaluated bid price on the valuation date provided by an independent pricing service, or on the basis of amortized cost if it represents the best approximation for fair value. Debt and other fixed-income securities are generally determined to be Level 2 investments.
Short-term investments are comprised of cash and cash equivalents invested in short-term investment funds which are redeemable daily. Each Fund sweeps available cash into the State Street Institutional U.S. Government Money Market Fund, which has elected to qualify as a "government money market fund" pursuant to Rule 2a-7 under the 1940 Act, and has an objective, which is not guaranteed, to maintain a $1.00 NAV. Generally, these investment types are categorized as Level 1 investments.
Forward foreign currency contracts are generally valued based on the bid price of the forward rates and the current spot rate. Forward exchange rate quotations are available for scheduled settlement dates, such as 1-, 3-, 6-, 9- and 12-month periods. An interpolated valuation is derived based on the actual settlement dates of the forward contracts held. Futures contracts are valued at the settlement price or at the last bid price if no settlement price is available. Interest rate swaps agreements are generally valued by an approved pricing agent based on the terms of the swap agreement (including future cash flows).
In the event that a security's market quotations are not readily available or are deemed unreliable (for reasons other than because the foreign exchange on which it trades closed before the Valuation Time), the security is valued at fair value as determined by the Funds' Pricing Committee (the "Pricing Committee"), taking into account the relevant factors and surrounding circumstances using Valuation and Liquidity Procedures approved by the Board. A security that has been fair valued by the Pricing Committee may be classified as Level 2 or Level 3 depending on the nature of the inputs.
The three-level hierarchy of inputs is summarized below:
| • | Level 1 – quoted prices in active markets for identical investments; |
| • | Level 2 – other significant observable inputs (including quoted prices for similar securities, interest rates, prepayment speeds, and credit risk); or |
| • | Level 3 – significant unobservable inputs (including a Fund's own assumptions in determining the fair value of investments). |
| 2022 Semi-Annual Report | 109 |
Notes to Financial Statements (continued)
April 30, 2022 (Unaudited)
A summary of standard inputs is listed below:
| Security Type | Standard Inputs | |
| Foreign equities utilizing a fair value factor | Depositary receipts, indices, futures, sector indices/ETFs, exchange rates, and local exchange opening and closing prices of each security. | |
The following is a summary of the inputs used as of April 30, 2022 in valuing the Funds' investments at fair value. The inputs or methodologies used for valuing securities are not necessarily an indication of the risk associated with investing in those securities.
Please refer to the Statements of Investments for a detailed breakout of the security types:
| Investments, at Value | LEVEL 1 – Quoted Prices ($) | LEVEL 2 – Other Significant Observable Inputs ($) | LEVEL 3 – Significant Unobservable Inputs ($) | Total ($) | ||||||||||||
| China A Share Equity Fund | ||||||||||||||||
| Investments in Securities | ||||||||||||||||
| Common Stocks | 0 | 48,882,187 | – | 48,882,187 | ||||||||||||
| Exchange-Traded Funds | 11,173 | – | – | 11,173 | ||||||||||||
| Short-Term Investment | 2,976,470 | – | – | 2,976,470 | ||||||||||||
| 2,987,643 | 48,882,187 | – | 51,869,830 | |||||||||||||
| Dynamic Dividend Fund | ||||||||||||||||
| Investments in Securities | ||||||||||||||||
| Common Stocks | 71,563,019 | 39,843,627 | – | 111,406,646 | ||||||||||||
| Preferred Stocks | – | 1,500,276 | – | 1,500,276 | ||||||||||||
| Short-Term Investment | 1,539,229 | – | – | 1,539,229 | ||||||||||||
| Other Financial Instruments | ||||||||||||||||
| Assets | ||||||||||||||||
| Forward Foreign Currency Exchange Contracts | – | 108,584 | – | 108,584 | ||||||||||||
| 73,102,248 | 41,452,487 | – | 114,554,735 | |||||||||||||
| Emerging Markets ex-China Fund | ||||||||||||||||
| Investments in Securities | ||||||||||||||||
| Common Stocks | 6,511,492 | 15,483,890 | – | 21,995,382 | ||||||||||||
| Preferred Stocks | 450,973 | 2,029,451 | – | 2,480,424 | ||||||||||||
| Short-Term Investment | 183,115 | – | – | 183,115 | ||||||||||||
| 7,145,580 | 17,513,341 | – | 24,658,921 | |||||||||||||
| Emerging Markets Fund | ||||||||||||||||
| Investments in Securities | ||||||||||||||||
| Common Stocks | 543,353,803 | 2,406,496,168 | 0 | 2,949,849,971 | ||||||||||||
| Preferred Stocks | 59,789,209 | 243,598,004 | – | 303,387,213 | ||||||||||||
| Short-Term Investment | 9,615,181 | – | – | 9,615,181 | ||||||||||||
| 612,758,193 | 2,650,094,172 | 0 | 3,262,852,365 | |||||||||||||
| Emerging Markets Sustainable Leaders Fund | ||||||||||||||||
| Investments in Securities | ||||||||||||||||
| Common Stocks | 22,656,292 | 101,219,988 | – | 123,876,280 | ||||||||||||
| Preferred Stocks | 2,398,109 | 10,885,443 | – | 13,283,552 | ||||||||||||
| Short-Term Investment | 1,299,529 | – | – | 1,299,529 | ||||||||||||
| 26,353,930 | 112,105,431 | – | 138,459,361 | |||||||||||||
| 110 | 2022 Semi-Annual Report |
Notes to Financial Statements (continued)
April 30, 2022 (Unaudited)
| Investments, at Value | LEVEL 1 – Quoted Prices ($) | LEVEL 2 – Other Significant Observable Inputs ($) | LEVEL 3 – Significant Unobservable Inputs ($) | Total ($) | ||||||||||||
| Global Equity Impact Fund | ||||||||||||||||
| Investments in Securities | ||||||||||||||||
| Common Stocks | 26,452,628 | 29,142,101 | – | 55,594,729 | ||||||||||||
| Short-Term Investment | 1,125,151 | – | – | 1,125,151 | ||||||||||||
| 27,577,779 | 29,142,101 | – | 56,719,880 | |||||||||||||
| Global Infrastructure Fund | ||||||||||||||||
| Investments in Securities | ||||||||||||||||
| Common Stocks | 29,887,410 | 24,150,802 | – | 54,038,212 | ||||||||||||
| Short-Term Investment | 697,049 | – | – | 697,049 | ||||||||||||
| Other Financial Instruments | ||||||||||||||||
| Assets | ||||||||||||||||
| Forward Foreign Currency Exchange Contracts | – | 2,814 | – | 2,814 | ||||||||||||
| 30,584,459 | 24,153,616 | – | 54,738,075 | |||||||||||||
| International Real Estate Equity Fund | ||||||||||||||||
| Investments in Securities | ||||||||||||||||
| Common Stocks | 2,538,468 | 13,991,289 | 0 | 16,529,757 | ||||||||||||
| Short-Term Investment | 733,623 | – | – | 733,623 | ||||||||||||
| 3,272,091 | 13,991,289 | 0 | 17,263,380 | |||||||||||||
| International Small Cap Fund | ||||||||||||||||
| Investments in Securities | ||||||||||||||||
| Common Stocks | 67,188,909 | 183,849,759 | – | 251,038,668 | ||||||||||||
| Preferred Stocks | – | 7,144,190 | – | 7,144,190 | ||||||||||||
| Short-Term Investment | 5,452,275 | – | – | 5,452,275 | ||||||||||||
| 72,641,184 | 190,993,949 | – | 263,635,133 | |||||||||||||
| International Sustainable Leaders Fund | ||||||||||||||||
| Investments in Securities | ||||||||||||||||
| Common Stocks | 12,939,385 | 95,887,921 | 0 | 108,827,306 | ||||||||||||
| Short-Term Investment | 1,348,952 | – | – | 1,348,952 | ||||||||||||
| 14,288,337 | 95,887,921 | 0 | 110,176,258 | |||||||||||||
| Realty Income & Growth Fund | ||||||||||||||||
| Investments in Securities | ||||||||||||||||
| Common Stocks | 52,628,188 | – | – | 52,628,188 | ||||||||||||
| Short-Term Investment | 1,104,245 | – | – | 1,104,245 | ||||||||||||
| 53,732,433 | – | – | 53,732,433 | |||||||||||||
| U.S. Small Cap Equity Fund | ||||||||||||||||
| Investments in Securities | ||||||||||||||||
| Common Stocks | 869,043,110 | – | – | 869,043,110 | ||||||||||||
| Short-Term Investment | 8,736,654 | – | – | 8,736,654 | ||||||||||||
| 877,779,764 | – | – | 877,779,764 | |||||||||||||
| 2022 Semi-Annual Report | 111 |
Notes to Financial Statements (continued)
April 30, 2022 (Unaudited)
| Investments, at Value | LEVEL 1 – Quoted Prices ($) | LEVEL 2 – Other Significant Observable Inputs ($) | LEVEL 3 – Significant Unobservable Inputs ($) | Total ($) | ||||||||||||
| U.S. Sustainable Leaders Fund | ||||||||||||||||
| Investments in Securities | ||||||||||||||||
| Common Stocks | 388,537,282 | – | – | 388,537,282 | ||||||||||||
| Short-Term Investment | 7,123,086 | – | – | 7,123,086 | ||||||||||||
| 395,660,368 | – | – | 395,660,368 | |||||||||||||
| U.S. Sustainable Leaders Smaller Companies Fund | ||||||||||||||||
| Investments in Securities | ||||||||||||||||
| Common Stocks | 17,825,722 | – | – | 17,825,722 | ||||||||||||
| Short-Term Investment | 558,177 | – | – | 558,177 | ||||||||||||
| 18,383,899 | – | – | 18,383,899 | |||||||||||||
Amounts listed as "–" are $0 or round to $0.
For the six-months ended April 30, 2022, there were no significant changes to the fair valuation methodologies. Level 3 investments held during and at the end of the six-month period ended April 30, 2022 in relation to net assets, of the International Real Estate Equity Fund and International Sustainable Leaders Fund, were not significant (0.0% of total net assets) and accordingly, a reconciliation of Level 3 assets for the six-month period ended April 30, 2022 is not presented. The valuation technique used at April 30, 2022 was fair valuation at zero pursuant to procedures approved by the Fund's Board of Trustees.
A reconciliation of the Level 3 investments held during and at the end of the six-month period ended April 30, 2022 for the Emerging Markets Fund is presented below. The valuation technique used at April 30, 2022 was fair valuation at zero pursuant to procedures approved by the Fund's Board of Trustees.
| Investments in Securities | Balance as of October 31, 2021 | Accrued Discounts (Premiums) | Realized Gain (Loss) | Change in Unrealized Appreciation (Depreciation) | Net Purchases | Net Sales | Net Transfers in to Level 3 | Net Transfers out of Level 3 | Balance as of April, 2022 | Change in Unrealized Appreciation (Depreciation) from Investments Held at April 30, 2022 | |||||||||||||||||||||||||||||||||||||
| Emerging Markets Fund | |||||||||||||||||||||||||||||||||||||||||||||||
| Common Stocks | |||||||||||||||||||||||||||||||||||||||||||||||
| Russia | $– | $– | $– | $(248,433,616 | ) | $– | $– | $248,433,616 | $– | $– | $(248,433,616 | ) | |||||||||||||||||||||||||||||||||||
| TOTAL | $– | $– | $– | $(248,433,616 | ) | $– | $– | $248,433,616 | $– | $– | $(248,433,616 | ) | |||||||||||||||||||||||||||||||||||
Amounts listed as "–" are $0 or round to $0.
| b. | Restricted Securities |
Restricted securities are privately-placed securities whose resale is restricted under U.S. securities laws. The Funds may invest in restricted securities, including unregistered securities eligible for resale without registration pursuant to Rule 144A and privately-placed securities of U.S. and non-U.S. issuers offered outside the U.S. without registration pursuant to Regulation S under the Securities Act of 1933, as amended (the "1933 Act"). Rule 144A securities may be freely traded among certain qualified institutional investors, such as the Funds, but resale of such securities in the U.S. is permitted only in limited circumstances.
| c. | Foreign Currency Translation |
Foreign securities, currencies and other assets and liabilities denominated in foreign currencies are translated into U.S. dollars at the exchange rate of said currencies against the U.S. dollar, as of the Valuation Time, as provided by an independent pricing service. Purchases and sales of securities, and income and expenses are translated at the prevailing rate of exchange on the respective date of these transactions. The Funds do not isolate that portion of the results of operations resulting from changes in foreign exchange rates on investments from fluctuations
| 112 | 2022 Semi-Annual Report |
Notes to Financial Statements (continued)
April 30, 2022 (Unaudited)
arising from changes in market prices of securities held. These fluctuations are included with the net realized and unrealized gain or loss from investments and foreign currencies within the Statements of Operations.
| d. | Rights Issues and Warrants |
Rights issues give the right, normally to existing shareholders, to buy a proportional number of additional securities at a given price (generally at a discount) within a fixed period (generally a short-term period) and are offered at the company's discretion. Warrants are securities that give the holder the right to buy common stock at a specified price for a specified period of time. Rights issues and warrants are speculative and have no value if they are not exercised before the expiration date. Rights issues and warrants are valued at the last sale price on the exchange on which they are traded.
| e. | Derivative Financial Instruments |
Certain Funds are authorized to use derivatives to manage currency risk, credit risk, and interest rate risk and to replicate, or use as a substitute for, physical securities. Losses may arise due to changes in the value of the contract or if the counterparty does not perform under the contract. The use of derivative instruments involves, to varying degrees, elements of market risk in excess of the amount recognized in the Statements of Assets and Liabilities (See Note 10).
Forward Foreign Currency Exchange Contracts
A forward foreign currency exchange contract ("forward contract") involves an obligation to purchase and sell a specific currency at a future date, which may be any fixed number of days from the date of the contract agreed upon by the parties, at a price set at the time of the contract. Forward contracts are used to manage a Fund's currency exposure in an efficient manner. They are used to sell unwanted currency exposure that comes with holding securities in a market, or to buy currency exposure where the exposure from holding securities is insufficient to give the desired currency exposure either in absolute terms or relative to the benchmark. The use of forward contracts allows the separation of decision-making between markets and their currencies. The forward contract is marked-to market daily and the change in market value is recorded by a Fund as unrealized appreciation/(depreciation). Forward contracts' prices are received daily from an independent pricing provider. When the forward contract is closed, a Fund records a realized gain or loss equal to the difference between the value at the time it was opened and the value at the time it was closed. These realized and unrealized gains and losses are reported on the Statements of Operations. During the period, the Funds used forward contracts for the purposes of efficient portfolio management and managing active currency risk relative to the benchmark, the latter of which involves both hedging currency risk and adding currency risk in excess of underlying bond positions.
While a Fund may enter into forward contracts to seek to reduce currency exchange rate risks, transactions in such contracts involve certain risks. A Fund could be exposed to risks if the counterparties to the contracts are unable to meet the terms of their contracts and from unanticipated movements in exchange rates. Thus, while a Fund may benefit from such transactions, unanticipated changes in currency prices may result in a poorer overall performance for a Fund than if it had not engaged in any such transactions. Moreover, there may be an imperfect correlation between a Fund's portfolio holdings or securities quoted or denominated in a particular currency and forward contracts entered into by the Fund. Such imperfect correlation may prevent a Fund from achieving a complete hedge, which will expose the Fund to the risk of foreign exchange loss.
Forward contracts are subject to the risk that the counterparties to such contracts may default on their obligations. Since a forward foreign currency exchange contract is not guaranteed by an exchange or clearing house, a default on the contract would deprive a Fund of unrealized profits, transaction costs or the benefits of a currency hedge or force a Fund to cover its purchase or sale commitments, if any, at the market price at the time of the default.
Summary of Derivative Instruments
Certain Funds may use derivatives for various purposes as noted above. The following is a summary of the location of fair value amounts of derivatives, not accounted for as hedging instruments, as of April 30, 2022:
| Location on the Statement of Assets and Liabilities | ||||
| Derivative Instrument Risk Type | Asset Derivatives | Liability Derivatives | ||
| Foreign Exchange Risk | Unrealized appreciation on forward foreign currency exchange contracts | Unrealized depreciation on forward foreign currency exchange contracts | ||
| 2022 Semi-Annual Report | 113 |
Notes to Financial Statements (continued)
April 30, 2022 (Unaudited)
The following is a summary of the fair value of derivative instruments, not accounted for as hedging instruments, as of April 30, 2022:
| Asset Derivatives | |||||||||||||
| Funds | Total Value at April 30, 2022 | Written Options, at value (Equity Risk) | Centrally Cleared Credit Default Swaps (Credit Risk) | Centrally Cleared Interest Rate Swaps (Interest Rate Risk) | Forward Foreign Exchange Contracts (Foreign Exchange Risk) | Futures Contracts (Interest Rate Risk) | |||||||
| Dynamic Dividend Fund | $108,584 | $– | $– | $– | $108,584 | $– | |||||||
| Global Infrastructure Fund | 2,814 | – | – | – | 2,814 | – | |||||||
Certain funds have transactions that may be subject to enforceable master netting arrangements. A reconciliation of the gross amounts on the Statements of Assets and Liabilities as of April 30, 2022 to the net amounts by broker and derivative type, including any collateral received or pledged, is included in the following tables:
| Gross Amounts Not Offset in Statement of Assets & Liabilities | Gross Amounts Not Offset in Statement of Assets and Liabilities | ||||||||||||||||
| Gross Amounts of Assets Presented in Statement of Financial Position | Financial Instruments | Collateral Received(1) | Net Amount(3) | Gross Amounts of Liabilities Presented in Statement of Financial Position | Financial Instruments | Collateral Pledged(1) | Net Amount(3) | ||||||||||
| Description | Assets | Liabilities | |||||||||||||||
| Dynamic Dividend Fund | |||||||||||||||||
| Forward foreign currency(2) | |||||||||||||||||
| Royal Bank of Canada | $108,584 | $– | $– | $108,584 | $– | $– | $– | $– | |||||||||
| 1. | In some instances, the actual collateral received and/or pledged may be more than the amount shown here due to overcollateralization. |
| 2. | Includes financial instrument which is not subject to a master netting arrangement across funds, or another similar arrangement. |
| 3. | Net amounts represent the net receivables/(payable) that would be due from/to the counterparty in the event of default. Exposure from financial derivative instruments can only be netted across transactions governed under the same master netting agreement with the same legal entity. |
| Gross Amounts Not Offset in Statement of Assets & Liabilities | Gross Amounts Not Offset in Statement of Assets and Liabilities | ||||||||||||||||
| Gross Amounts of Assets Presented in Statement of Financial Position | Financial Instruments | Collateral Received(1) | Net Amount(3) | Gross Amounts of Liabilities Presented in Statement of Financial Position | Financial Instruments | Collateral Pledged(1) | Net Amount(3) | ||||||||||
| Description | Assets | Liabilities | |||||||||||||||
| Global Infrastructure Fund | |||||||||||||||||
| Forward foreign currency(2) | |||||||||||||||||
| Royal Bank of Canada | $2,814 | $– | $– | $2,814 | $– | $– | $– | $– | |||||||||
| 1. | In some instances, the actual collateral received and/or pledged may be more than the amount shown here due to overcollateralization. |
| 2. | Includes financial instrument which is not subject to a master netting arrangement across funds, or another similar arrangement. |
| 3. | Net amounts represent the net receivables/(payable) that would be due from/to the counterparty in the event of default. Exposure from financial derivative instruments can only be netted across transactions governed under the same master netting agreement with the same legal entity. |
The following is a summary of the location of realized gain/(loss) and net change in unrealized appreciation/(depreciation) on derivatives in the Statement of Operations for the six-month period ended April 30, 2022:
| Derivative Instrument Risk Type | Location on the Statement of Operations | |
| Foreign Exchange Risk | Realized gain/(loss) on forward foreign currency exchange contracts/ Net change in unrealized appreciation/(depreciation) on forward foreign currency exchange contracts |
| 114 | 2022 Semi-Annual Report |
Notes to Financial Statements (continued)
April 30, 2022 (Unaudited)
The following is a summary of the effect of derivative instruments on the Statement of Operations for the six-month period ended April 30, 2022:
| Realized Gain or (Loss) on Derivatives Recognized in the Statement of Operations | |||||||||||||||
| Funds | Total | Investment Transactions (Equity Risk) | Written Options (Equity Risk) | Credit Default Swaps (Credit Risk) | Interest Rate Swaps (Interest Rate Risk) | Forward Foreign Exchange Contracts (Foreign Exchange Risk) | Futures Contracts (Interest Rate Risk) | ||||||||
| Dynamic Dividend Fund | $165,054 | $– | $– | $– | $– | $165,054 | $– | ||||||||
| Global Infrastructure Fund | 8,916 | – | – | – | – | 8,916 | – | ||||||||
| Change in Unrealized Appreciation/(Depreciation) on Derivatives Recognized in the Statement of Operations | |||||||||||||||
| Funds | Total | Investment Transactions (Equity Risk) | Written Options (Equity Risk) | Credit Default Swaps (Credit Risk) | Interest Rate Swaps (Interest Rate Risk) | Forward Foreign Exchange Contracts (Foreign Exchange Risk) | Futures Contracts (Interest Rate Risk) | ||||||||
| Dynamic Dividend Fund | $110,598 | $– | $– | $– | $– | $110,598 | $– | ||||||||
| Global Infrastructure Fund | 4,093 | – | – | – | – | 4,093 | – | ||||||||
Information about derivatives reflected as of the date of this report is generally indicative of the type of activity for the six-month period ended April 30, 2022. The table below summarizes the weighted average values of derivatives holdings by the Funds during the six-month period ended April 30, 2022.
| Fund | Purchase Forward Foreign Currency Contracts (Average Notional Value) | Sale Forward Foreign Currency Contracts (Average Notional Value) | |||
| Dynamic Dividend Fund | $– | $2,954,032 | |||
| Global Infrastructure Fund | – | 1,774,009 |
| f. | Security Transactions, Investment Income and Expenses |
Security transactions are recorded on the trade date. Realized and unrealized gains/(losses) from security and currency transactions are calculated on the identified cost basis. Dividend income and corporate actions are recorded generally on the ex-date, except for certain dividends and corporate actions which may be recorded after the ex-date, as soon as a Fund acquires information regarding such dividends or corporate actions.
Interest income and expenses are recorded on an accrual basis. Expenses directly attributable to a Fund are charged to that Fund. Expenses not directly attributable to a Fund are allocated proportionately among the relevant Funds based on net assets of each Fund as of month-end. For each of the Funds, the method for allocating income, fund level expenses, and realized and unrealized gains or losses to a class is based on the average net asset value of that class' shares in proportion to the average net assets of the relevant Fund when incurred. Expenses specific to a class (such as Rule 12b-1 and administrative services fees) are charged to that class.
| g. | Distributions |
Distributions from net investment income, if any, are declared and paid annually for all Funds except the Dynamic Dividend Fund, which declares and pays monthly, and the Global Infrastructure Fund and Realty Income & Growth Fund, which declare and pay quarterly. The Funds will also declare and pay distributions at least annually from net realized gains on investment transactions and net realized foreign exchange
| 2022 Semi-Annual Report | 115 |
Notes to Financial Statements (continued)
April 30, 2022 (Unaudited)
gains, if any. Dividends and distributions to shareholders are recorded on the ex-dividend date. The Funds will also declare and pay distributions at least annually from net realized gains on investment transactions and net realized foreign exchange gains, if any.
Dividends and distributions to shareholders are determined in accordance with federal income tax regulations, which may differ from GAAP. These differences are primarily due to differing treatments for foreign currencies and loss deferrals.
| h. | Federal Income Taxes |
Each Fund intends to continue to qualify as a "regulated investment company" by complying with the provisions available to certain investment companies, as defined in Subchapter M of the Internal Revenue Code of 1986, as amended, and to make distributions of net investment income and net realized capital gains sufficient to relieve the Funds from all federal income taxes. Therefore, no federal income tax provision is required. Management of the Funds has concluded that there are no significant uncertain tax positions that would require recognition in the financial statements. Since tax authorities can examine previously filed tax returns, the Funds' U.S. federal and state tax returns for each of the most recent four fiscal years up to the most recent fiscal year ended October 31, 2021 are subject to such review.
| i. | Foreign Withholding Tax |
Dividend and interest income from non-U.S. sources received by the Fund are generally subject to non-U.S. withholding taxes and are recorded on the Statement of Operations. The Funds file for tax reclaims for the refund of such withholdings taxes according to tax treaties. Tax reclaims that are deemed collectible are booked as tax reclaim receivable on the Statement of Assets and Liabilities. Foreign tax authorities can examine previously filed withholding tax reclaims for various periods of time, depending on the statute of limitations in each foreign jurisdiction. In some cases, amounts that have been refunded by foreign tax authorities and received by the Funds are still subject to such review.
The Dynamic Dividend Fund has received requests from the German Federal Tax Office ("GTO") for additional documents and information relating to withholding tax refunds from 2009-2011 that the Fund has previously received and recorded. The tax refunds previously received amount to approximately 1.19% of the Dynamic Dividend Fund's net assets as of April 30, 2022. Of the 1.19%, 0.82% are contested by the GTO. The Dynamic Dividend Fund may be required to return all or certain amounts or pay a settlement in connection with the GTO request. Based on information available as of the date of this semi annual report, an estimated repayment amount has been accrued as a liability and is reflected within the Dynamic Dividend Fund's net asset value, which impacts its performance. Furthermore, upon final determination of the GTO, if the actual amount payable is greater than the amount currently accrued, and subject to the level of assets under management at the time of any subsequent adjustments, the Dynamic Dividend Fund's net asset value and performance may be materially adversely impacted. The precise amount of the repayment remains uncertain as the matter remains unsettled with the GTO.
In addition, the Funds may be subject to capital gains tax in certain countries in which they invest. The above taxes may be reduced or eliminated under the terms of applicable U.S. income tax treaties with some of these countries. The Funds accrue such taxes when the related income is earned.
In addition, when the Funds sell securities within certain countries in which they invest, the capital gains realized may be subject to tax. Based on these market requirements and as required under GAAP, the Funds accrue deferred capital gains tax on securities currently held that have unrealized appreciation within these countries. The amount of deferred capital gains tax accrued is reported on the Statement of Operations as part of the Net Change in Unrealized Appreciation/Depreciation on Investments.
Performance shown for periods after December 16, 2016 for the Predecessor Fund of the abrdn International Sustainable Leaders Fund and after February 1, 2017 for the Predecessor Fund of the abrdn Global Equity Impact Fund reflect the Predecessor Funds' receipt of various payments of Article 63 EU Tax Reclaims related to the prior years. Prior to this receipt there was no certainty that the Predecessor Funds would receive any amounts, and thus each Predecessor Fund's performance previously did not reflect any anticipated receipt of these payments. The receipt of these extraordinary payments effectively increased each Predecessor Fund's performance for all periods that include payments in a manner that may not recur in the future, and the Fund's performance was significantly higher for those periods than it would have been had the Fund not received payment of the Article 63 EU Tax Reclaims.
abrdn International Sustainable Leaders Fund. The performance shown in "Performance" in the Fund's Average Annual Total Return table reflects the receipt of the payment of Article 63 EU Tax Reclaims. At the time of receipt, those payments resulted in an increase in net assets of approximately 5.4% and 2.1%, in 2017 and 2019, respectively. Past returns would have been higher had the Predecessor Fund not originally paid the withholding taxes that relate to the EU reclaims that are now being returned. There can be no assurance that the Fund will receive additional Article 63 EU Tax Reclaim payments or maintain this level of performance in the future.
| 116 | 2022 Semi-Annual Report |
Notes to Financial Statements (continued)
April 30, 2022 (Unaudited)
The abrdn International Sustainable Leaders Fund has Article 63 EU Tax Reclaims outstanding related to prior years (2006-2020). Consistent with U.S. GAAP accrual requirements, the Fund has recognized the Article 63 EU Tax Reclaims when a payment has been received, and has not recorded a receivable amount for any outstanding Article 63 EU Tax Reclaims because there is limited historical precedent for U.S. funds collecting reclaims of this magnitude and the total amount of the reclaims that the Fund may receive in the future is uncertain. Any additional amounts to which the Fund may be entitled, if and when recorded, likely would result in an increase in the net asset value per share of the Fund at that time. In addition, Article 63 EU Tax Reclaims amounts received will be subject to tax. As noted above, the Internal Revenue Service has not yet finalized the amount of taxes that the Fund must pay on these amounts; however, based on information available as of the date of this Semi-annual report, an estimated tax amount has been accrued and is reflected (approx. 11.8% of net assets). For tax accounting purposes, interest payments received on these payments (if any) are treated as income and are distributed in due course. Additionally, fluctuations in the value of foreign currencies may affect the Fund's tax liability, because the Internal Revenue Service may require the Fund to pay any taxes owed on interest payments on Article 63 EU Tax Reclaims amounts in U.S Dollars based on the foreign currency exchange rate with the applicable jurisdiction that was in effect at the time the Article 63 EU Tax Reclaims amounts were received by the Predecessor Fund. As of April 30, 2022, the total amount of reclaims filed for which no payments have been received by the Fund in the countries that may be affected by the European courts' decisions (namely, Spain, Germany, France, Poland, and Sweden) represents approximately 6.84% of net assets of the Fund before the impact of interest or any tax or additional costs incurred in the pursuit of such reclaims. These amounts net of estimated taxes (but excluding the impact of interest or tax on such interest) represented 2.05% of net assets of the Fund. Receipt by the Fund of these amounts would make the Fund's performance seem higher than it would be as a result of the performance of its portfolio investments.
abrdn Global Equity Impact Fund. The performance shown in "Performance" in the Fund's Average Annul Total Return table reflects the receipt of the payment of Article 63 EU Tax Reclaims. At the time of receipt, those payments resulted in an increase in net assets of approximately 3.1%, 0.3% and 0.9%, in 2017, 2018 and 2019, respectively. Past returns would have been higher had the Predecessor Fund not originally paid the withholding taxes that relate to the EU reclaims that are now being returned. There can be no assurance that the Fund will receive additional Article 63 EU Tax Reclaim payments or maintain this level of performance in the future.
The abrdn Global Equity Impact Fund has Article 63 EU Tax Reclaims outstanding related to prior years (2005-2015). Consistent with U.S. GAAP accrual requirements, the Fund has recognized the Article 63 EU Tax Reclaims when a payment has been received, and has not recorded a receivable amount for any outstanding Article 63 EU Tax Reclaims because there is limited historical precedent for U.S. funds collecting reclaims of this magnitude and the total amount of the reclaims that the Fund may receive in the future is uncertain. Any additional amounts to which the Fund may be entitled, if and when recorded, likely would result in an increase in the net asset value per share of each fund at that time. In addition, Article 63 EU Tax Reclaims amounts received will be subject to tax. As noted above, the Internal Revenue Service has not yet finalized the amount of taxes that the Fund must pay on these amounts; however, based on information available as of the date of this Semi-annual report, an estimated tax amount has been accrued and is reflected (approx. 6.2% of net assets). For tax accounting purposes, interest payments received on these payments (if any) are treated as income and are distributed in due course. Additionally, fluctuations in the value of foreign currencies may affect the Fund's tax liability, because the Internal Revenue Service may require the Fund to pay any taxes owed on interest payments on Article 63 EU Tax Reclaims amounts in U.S Dollars based on the foreign currency exchange rate with the applicable jurisdiction that was in effect at the time the Article 63 EU Tax Reclaims amounts were received by the Predecessor Fund. As of April 30, 2022, the total amount of reclaims filed for which no payments have been received by the Fund in the countries that may be affected by the European courts' decisions (namely, Spain, Germany, France, and Sweden) represented approximately 8.43% of net assets of the Fund before the impact of interest or any tax or additional costs incurred in the pursuit of such reclaims. These amounts net of estimated taxes (but excluding the impact of interest or tax on such interest) represented 2.53% of net assets of the Predecessor Fund. Receipt by the Fund of these amounts would make the Fund's performance seem higher than it would be as a result of the performance of its portfolio investments.
There were no payments received on tax reclaims for the six-month period ended April 30, 2022. The payments received on tax reclaims from prior periods were as follows:
| Amount | Percent of Total Net Assets | Received Date Range | |||||
| Global Equity Impact Fund | |||||||
| Withholding Tax Refunds Received from Country: | |||||||
| Finland | $ 500,000 | 0.25%* | 5/21/2015 | ||||
| Poland | 4,400,193 | 4.68%** | 2/1/2017-2/24/2017 | ||||
| Poland | 380,000 | 0.59%*** | 8/22/2018 | ||||
| Poland | 1,011,000 | 1.62%**** | 2/12/2019-9/4/2019 |
| 2022 Semi-Annual Report | 117 |
Notes to Financial Statements (continued)
April 30, 2022 (Unaudited)
| Amount | Percent of Total Net Assets | Received Date Range | |||||
| International Sustainable Leaders Fund | |||||||
| Withholding Tax Refunds Received from Country: | |||||||
| Finland | $ 1,355,000 | 0.35%* | 5/21/2015 | ||||
| Poland | 16,452,314 | 7.74%** | 12/16/16-2/24/2017 | ||||
| Poland | 5,504,000 | 3.68%**** | 12/12/2018-9/4/2019 |
| * | As of October 31, 2015 | |
| ** | As of October 31, 2017 | |
| *** | As of October 31, 2018 | |
| **** | As of October 31, 2019 |
| j. | Securities Lending |
Through an agreement with Securities Finance Trust Company as the Lending Agent and State Street Bank and Trust Company (the Funds' custodian), the Funds may lend their portfolio securities to brokers, dealers and other financial institutions that pay a negotiated fee in order to generate additional income. The Funds receive non-cash collateral in the form of U.S. Government Securities, with respect to each loan of U.S. securities, typically equal to at least 102% of the value of the portfolio securities loaned, and, with respect to each loan of non-U.S. securities, typically equal to at least 105% of the value of the portfolio securities loaned, and at all times thereafter require the borrower to mark to market such collateral on a daily basis so that the market value of such collateral does not fall below 100% of the market value of the portfolio securities so loaned.
Income generated from securities lending includes the difference between (i) the sum of income received from the investment of collateral received from the borrowers that are counterparties to loans, loan fees received from loans, and fees paid by borrower on loans collateralized with collateral other than cash collateral; and ii) any rebate paid to a borrower, and any other allocable fees and expenses in connection with loans of securities. All income is accrued daily and is apportioned 90% to the Funds and 10% to the Lending Agent.
The Funds continue to own the loaned securities and continue to recognize unrealized gains and losses on the securities on loan. However, securities lending involves certain risks including the event of default or insolvency of the borrower and possible delays or restrictions upon a Fund's ability to recover the loaned securities or dispose of the collateral for the loan. Securities on loan are noted within the Statement of Investments. Non-cash securities lending collateral held by the Lending Agent on behalf of the Funds cannot be sold or repledged by the Funds and, therefore, this amount is not presented on the Funds' Statements of Investments.
At April 30, 2022, the Funds did not have any securities on loan.
3. Agreements and Transactions with Affiliates
| a. | Investment Adviser |
Under the Investment Advisory Agreement with the Trust, abrdn manages the Funds in accordance with the policies and procedures established by the Board.
For services provided under the terms of the current Investment Advisory Agreement, each Fund pays the Adviser an annual management fee (as a percentage of its average daily net assets) paid monthly according to the following schedule:
| Fund | Fee Schedule | ||||
| China A Share Equity Fund | Up to $500 million | 0.85% | |||
| $500 million up to $2 billion | 0.80% | ||||
| On $2 billion and more | 0.75% | ||||
| Dynamic Dividend Fund | Up to $250 million | 1.00% | |||
| On $250 million and more | 0.95% | ||||
| Emerging Markets ex-China Fund | Up to $500 million | 0.90% | |||
| $500 million up to $2 billion | 0.85% | ||||
| On $2 billion and more | 0.80% | ||||
| Emerging Markets Fund | On all assets | 0.90% | |||
| Emerging Markets Sustainable Leaders Fund | On all assets | 0.80% |
| 118 | 2022 Semi-Annual Report |
Notes to Financial Statements (continued)
April 30, 2022 (Unaudited)
| Fund | Fee Schedule | ||||
| Global Equity Impact Fund | Up to $500 million | 0.75% | |||
| $500 million up to $2 billion | 0.73% | ||||
| On $2 billion and more | 0.70% | ||||
| Global Infrastructure Fund | Up to $250 million | 0.85% | |||
| $250 million up to $750 million | 0.80% | ||||
| $750 million to $1 billion | 0.75% | ||||
| On $1 billion and more | 0.65% | ||||
| International Real Estate Equity Fund | On all assets | 1.00% | |||
| International Small Cap Fund | Up to $100 million | 0.85% | |||
| On $100 million and more | 0.75% | ||||
| International Sustainable Leaders Fund | Up to $500 million | 0.75% | |||
| $500 million up to $2 billion | 0.73% | ||||
| On $2 billion and more | 0.70% | ||||
| Realty Income & Growth Fund | Up to $250 million | 1.00% | |||
| $250 million up to $750 million | 0.95% | ||||
| $750 million up to $1 billion | 0.90% | ||||
| On $1 billion and more | 0.80% | ||||
| U.S. Small Cap Equity Fund | Up to $100 million | 0.95% | |||
| On $100 million and more | 0.80% | ||||
| U.S. Sustainable Leaders Fund | Up to $500 million | 0.75% | |||
| $500 million up to $2 billion | 0.70% | ||||
| On $2 billion and more | 0.65% | ||||
| U.S. Sustainable Leaders Smaller Companies Fund | Up to $500 million | 0.75% | |||
| $500 million up to $2 billion | 0.70% | ||||
| On $2 billion and more | 0.65% |
The Adviser has engaged the services of affiliates abrdn Asia Limited (formerly, Aberdeen Standard Investments (Asia) Limited) and Aberdeen Asset Managers Limited ("AAML") as subadvisers (the "Subadvisers") pursuant to subadvisory agreements. The Subadvisers manage a portion of certain Funds' investments and have the responsibility for making all investment decisions for the portion of a Fund's assets they manage. Pursuant to the subadvisory agreements, the Adviser pays fees to the Subadvisers.
The Trust and abrdn have entered into written contracts ("Expense Limitation Agreements") limiting operating expenses for all classes of the Funds from exceeding the amounts listed in the tables below. For each Fund this contractual limitation may not be terminated before February 28, 2023 without the approval of the Trustees who are not "interested persons" of the Trust, as such term is defined by the 1940 Act (the "Independent Trustees"). For each Fund except the Dynamic Dividend Fund, Global Infrastructure Fund, Global Equity Impact Fund and International Sustainable Leaders Fund, this limit excludes certain expenses, including any taxes, interest, brokerage fees, short-sale dividend expenses, acquired fund fees and expenses, Rule 12b-1 fees, administrative services fees, transfer agent out-of-pocket expenses for Class A shares, Class R shares, and Institutional Service Class shares and extraordinary expenses. The Expense Limitation Agreement with respect to the Dynamic Dividend Fund and Global Infrastructure Fund excludes certain expenses, including any interest, brokerage commissions, acquired fund fees and expenses, and extraordinary expenses. The Expense Limitation Agreement with respect to the Global Equity Impact Fund and International Sustainable Leaders Fund excludes certain expenses, including any taxes, interest, brokerage fees, short-sale dividend expenses, acquired fund fees and expenses and Rule 12b-1 fees for Class A shares and extraordinary expenses.
| Fund | Limit | |
| China A Share Equity Fund | 0.99% | |
| Emerging Markets ex-China Fund | 1.10% | |
| Emerging Markets Fund | 1.10% | |
| Emerging Markets Sustainable Leaders Fund | 1.10% | |
| International Small Cap Fund | 0.99% | |
| U.S. Small Cap Equity Fund | 0.99% | |
| U.S. Sustainable Leaders Fund | 0.90% | |
| U.S. Sustainable Leaders Smaller Companies Fund | 0.90% |
| 2022 Semi-Annual Report | 119 |
Notes to Financial Statements (continued)
April 30, 2022 (Unaudited)
| Fund | Class A Limit | Institutional Class Limit | ||
| Dynamic Dividend Fund | 1.50% | 1.25% | ||
| Global Equity Impact Fund | 1.15% | 0.90% | ||
| Global Infrastructure Fund | 1.24% | 0.99% | ||
| International Real Estate Equity Fund | 1.62% | 1.37% | ||
| International Sustainable Leaders Fund | 1.15% | 0.90% | ||
| Realty Income & Growth Fund | 1.25% | 1.00% |
abrdn may request and receive reimbursement from a Fund of the advisory fees waived and other expenses reimbursed pursuant to the Expense Limitation Agreements as of a date not more than three years after the date when the Adviser limited the fees or reimbursed the expenses; provided that the following requirements are met: the reimbursements do not cause a class to exceed the lesser of the applicable expense limitation in the contract at the time the fees were limited or expenses are paid or the applicable expense limitation in effect at the time the expenses are being recouped by the Adviser, and the payment of such reimbursement is approved by the Board on a quarterly basis (the "Reimbursement Requirements"). Except as provided for in the Expense Limitation Agreements, reimbursement of amounts previously waived or assumed by abrdn is not permitted.
As of April 30, 2022, to the extent the Reimbursement Requirements are met, the cumulative potential reimbursements to abrdn for each Fund, based on expenses reimbursed by abrdn, including adjustments described above, would be:
| Fund | Amount Fiscal Year 2019 (Expires 10/31/22) | Amount Fiscal Year 2020 (Expires 10/31/23) | Amount Fiscal Year 2021 (Expires 10/31/24) | Amount Six Months Ended April 30, 2022 (Expires 4/30/25) | Total* | |||||||||||||||
| China A Share Equity Fund | $ 103,367 | $ 194,764 | $ 244,894 | $ 122,852 | $ 665,877 | |||||||||||||||
| Dynamic Dividend Fund | 62,161 | 114,147 | 180,278 | 53,040 | 409,626 | |||||||||||||||
| Emerging Markets ex-China Fund | 89,482 | 173,186 | 191,740 | 83,692 | 538,100 | |||||||||||||||
| Emerging Markets Fund | 1,416,211 | 2,887,668 | 1,800,053 | 1,379,893 | 7,483,825 | |||||||||||||||
| Emerging Markets Sustainable Leaders Fund | 223 | 32,170 | 38,869 | 36,334 | 107,596 | |||||||||||||||
| Global Equity Impact Fund | 73,503 | 288,816 | 240,122 | 197,943 | 800,384 | |||||||||||||||
| Global Infrastructure Fund | 37,080 | 162,223 | 207,420 | 104,152 | 510,875 | |||||||||||||||
| International Real Estate Equity Fund | – | 134,634 | 156,298 | 75,757 | 366,689 | |||||||||||||||
| International Small Cap Fund | 166,253 | 291,518 | 261,986 | 119,018 | 838,775 | |||||||||||||||
| International Sustainable Leaders Fund | 16,400 | 391,729 | 324,735 | 271,087 | 1,003,951 | |||||||||||||||
| Realty Income & Growth Fund | 144,358 | 254,885 | 245,459 | 114,788 | 759,490 | |||||||||||||||
| U.S. Small Cap Equity Fund | – | 327,286 | 604,829 | 283,270 | 1,215,385 | |||||||||||||||
| U.S. Sustainable Leaders Fund | 147,545 | 257,392 | 216,967 | 85,978 | 707,882 | |||||||||||||||
| U.S. Sustainable Leaders Smaller Companies Fund | 85,244 | 164,571 | 202,597 | 84,027 | 536,439 | |||||||||||||||
| * | Amounts reported are due to expire throughout the respective 3-year expiration period presented above. |
Amounts listed as "–" are $0 or round to $0.
| b. | Fund Administration |
Under the terms of the Fund Administration Agreement, abrdn provides various administrative and accounting services, including daily valuation of the Funds' shares, preparation of financial statements, tax returns, regulatory reports, and presentation of quarterly reports to the Board. For services provided pursuant to the Fund Administration Agreement, the Trust pays abrdn an annual fee of 0.08% based on the Trust's average daily net assets. The fee is then allocated proportionately among all funds within the Trust (including the Funds) in relation to the average daily net assets of each fund. This asset-based fee is subject to an annual minimum fee based on the number of funds served.
| 120 | 2022 Semi-Annual Report |
Notes to Financial Statements (continued)
April 30, 2022 (Unaudited)
Pursuant to a sub-administration agreement with abrdn, State Street Bank and Trust Company ("State Street") provides sub-administration services with respect to the Funds. abrdn pays State Street for providing such services.
| c. | Distributor and Shareholder Servicing |
The Trust and Aberdeen Fund Distributors, LLC (the "Distributor") are parties to the current Underwriting Agreement (the "Underwriting Agreement") whereby the Distributor acts as principal underwriter for the Trust's shares.
The Trust has adopted a Distribution Plan (the "Plan") pursuant to Rule 12b-1 under the 1940 Act with respect to certain classes of shares. The Plan permits the Funds to compensate the Distributor, for expenses associated with the distribution-related and/or shareholder services provided by such entities. These fees are paid to the Distributor and are either kept or paid to shareholders' financial advisors or other intermediaries for distribution and shareholder services. Although actual distribution expenses may be more or less, under the Plan, the Funds pay the Distributor an annual fee of the following amounts, based on the total net assets of each, respective class:
| Fund | Class A Shares | Class C Shares (a) | Class R Shares (a) | |||||||
| China A Share Equity Fund | 0.25 | % | 1.00 | % | 0.50% | |||||
| Dynamic Dividend Fund | 0.25 | % | – | – | ||||||
| Emerging Markets ex-China Fund | 0.25 | % | 1.00 | % | 0.50% | |||||
| Emerging Markets Fund | 0.25 | % | 1.00 | % | 0.50% | |||||
| Emerging Markets Sustainable Leaders Fund | 0.25 | % | 1.00 | % | 0.50% | |||||
| Global Equity Impact Fund | 0.25 | % | – | – | ||||||
| Global Infrastructure Fund | 0.25 | % | – | – | ||||||
| International Real Estate Equity Fund | 0.25 | % | – | – | ||||||
| International Small Cap Fund | 0.25 | % | 1.00 | % | 0.50% | |||||
| International Sustainable Leaders Fund | 0.25 | % | – | – | ||||||
| Realty Income & Growth Fund | 0.25 | % | – | – | ||||||
| U.S. Small Cap Equity Fund | 0.25 | % | 1.00 | % | 0.50% | |||||
| U.S. Sustainable Leaders Fund | 0.25 | % | 1.00 | % | – | |||||
| U.S. Sustainable Leaders Smaller Companies Fund | 0.25 | % | 1.00 | % | 0.50% | |||||
(a) 0.25% of which is service fees.
The Adviser or an affiliate of the Adviser may pay additional amounts from its own resources to dealers or other financial intermediaries, for aid in distribution or for aid in providing administrative services to shareholders.
Pursuant to the current Underwriting Agreement, the Distributor will also receive the proceeds of contingent deferred sales charges ("CDSCs") of 1.00% imposed on certain redemptions of Class C (and up to 1.00% for certain Class A) shares.
In addition, the Distributor will re-allow to dealers 5.00% of sales charges on Class A shares of the Funds, which have a maximum front-end sales charge of 5.75% and the Distributor or the Adviser may compensate broker dealers or financial intermediaries from its own resources at the rate of 1.00% on sales of Class C shares of the Funds, which have a maximum CDSC of 1.00% (the CDSC assessed on sales within one year of purchase). The amount the Distributor retained for commissions from front-end sales charges and CDSC fees for the six-month period ended April 30, 2022 was as follows:
| Fund | Commissions retained from front-end sales charges of Class A shares | Commissions retained from CDSC fees of Class C (and certain Class A) shares | |||||
| China A Share Equity Fund | $ 24,449 | $ 4,924 | |||||
| Dynamic Dividend Fund | 2,584 | – | |||||
| Emerging Markets ex-China Fund | 2,491 | – | |||||
| Emerging Markets Fund | 485 | 449 | |||||
| Emerging Markets Sustainable Leaders Fund | 125 | – | |||||
| 2022 Semi-Annual Report | 121 |
Notes to Financial Statements (continued)
April 30, 2022 (Unaudited)
| Fund | Commissions retained from front-end sales charges of Class A shares | Commissions retained from CDSC fees of Class C (and certain Class A) shares | |||||
| Global Equity Impact Fund | $ 16,210 | $ – | |||||
| Global Infrastructure Fund | 7,515 | – | |||||
| International Small Cap Fund | 1,898 | 27 | |||||
| International Sustainable Leaders Fund | 5,396 | – | |||||
| U.S. Small Cap Equity Fund | 51,852 | 1,559 | |||||
| U.S. Sustainable Leaders Fund | 2,572 | – | |||||
| U.S. Sustainable Leaders Smaller Companies Fund | 13,161 | 3,037 | |||||
| Total Retained | $ 128,738 | $ 9,996 | |||||
| d. | Administrative Services Fees/Transfer Agent Out-of-Pocket Expenses |
The Funds may pay and/or reimburse administrative services fees/sub-transfer agent expenses to certain broker-dealers and financial intermediaries who provide administrative support services to beneficial shareholders on behalf of the Funds (sometimes referred to as "sub-transfer agency fees"), subject to certain limitations approved by the Board. These fees may be in addition to Rule 12b-1 fees. Sub-transfer agency fees generally include, but are not limited to, costs associated with recordkeeping, networking, sub-transfer agency or other administrative or shareholder services.
Class A, Class R and Institutional Service Class shares of the Funds pay for such services pursuant to an Administrative Services Plan adopted by the Board. Under the Administrative Services Plan, a Fund may pay a broker-dealer or other intermediary a maximum annual administrative services fee of 0.25% for Class A, Class R and Institutional Service Class shares. Under an amendment to the Administrative Services Plan that is in effect until at least February 28, 2023, the administrative service fee for a Fund is limited to a maximum of 0.15% for contracts with fees that are calculated as a percentage of Fund assets and a maximum of $16 per account for contracts with fees that are calculated on a dollar per account basis; however, many intermediaries do not charge the maximum permitted fee or even a portion thereof. Class C and Institutional Class shares may also pay for the services described above directly and not pursuant to an Administrative Services Plan.
The aggregate amount of sub-transfer agent and administrative service fees paid during the six-month period ended April 30, 2022 was as follows:
| Fund | Class A | Class C | Class R | Institutional Service | Institutional | ||||||
| China A Share Equity Fund | 7,105 | 1,144 | 2,662 | 424 | 16,673 | ||||||
| Dynamic Dividend Fund | 1,830 | – | – | – | 38,053 | ||||||
| Emerging Markets ex-China Fund | 10,995 | 180 | 980 | 154 | 440 | ||||||
| Emerging Markets Fund | 118,364 | 3,255 | 95,004 | 349,386 | 1,609,231 | ||||||
| Emerging Markets Sustainable Leaders Fund | 12,979 | 430 | 4,223 | 26,685 | 20,422 | ||||||
| Global Equity Impact Fund | 22,803 | – | – | – | 13,272 | ||||||
| Global Infrastructure Fund | 5,090 | – | – | – | 17,611 | ||||||
| International Real Estate Equity Fund | 46 | – | – | – | 12,092 | ||||||
| International Small Cap Fund | 52,491 | 311 | 1,600 | – | 102,144 | ||||||
| International Sustainable Leaders Fund | 71,890 | – | – | – | 6,089 | ||||||
| Realty Income & Growth Fund | 289 | – | – | – | 18,142 | ||||||
| U.S. Small Cap Equity Fund | 87,662 | 15,656 | 3,869 | 26,305 | 369,513 | ||||||
| U.S. Sustainable Leaders Fund | 65,783 | 221 | – | 47,897 | 4,045 | ||||||
| U.S. Sustainable Leaders Smaller Companies Fund | 3,808 | 237 | 2,169 | 250 | 3,468 |
| 122 | 2022 Semi-Annual Report |
Notes to Financial Statements (continued)
April 30, 2022 (Unaudited)
| e. | Purchase/Sale Transactions Between Affiliates |
The Funds are permitted to buy or sell securities with funds that have a common investment adviser (or investment advisers which are affiliates) under specific procedures which have been approved by the Board. The procedures are designed to satisfy the requirements of Rule 17a-7 of the Investment Company Act of 1940 ("Rule 17a-7"). During the six-month period ended April 30, 2022, the Funds did not engage in any of these trades.
4. Investment Transactions
Purchases and sales of securities (excluding short-term securities) for the six-month period ended April 30, 2022, were as follows:
| Fund | Purchases | Sales | ||||||
| China A Share Equity Fund | $ | 8,759,001 | $ | 24,628,226 | ||||
| Dynamic Dividend Fund | 38,145,135 | 38,914,891 | ||||||
| Emerging Markets ex-China Fund | 30,108,462 | 30,865,153 | ||||||
| Emerging Markets Fund | 737,391,744 | 1,270,768,563 | ||||||
| Emerging Markets Sustainable Leaders Fund | 30,587,502 | 57,917,900 | ||||||
| Global Equity Impact Fund | 13,585,185 | 19,921,416 | ||||||
| Global Infrastructure Fund | 6,752,126 | 8,017,758 | ||||||
| International Real Estate Equity Fund | 6,041,714 | 7,555,966 | ||||||
| International Small Cap Fund | 104,559,850 | 41,531,115 | ||||||
| International Sustainable Leaders Fund | 25,683,806 | 31,404,196 | ||||||
| Realty Income & Growth Fund | 3,577,630 | 7,110,844 | ||||||
| U.S. Small Cap Equity Fund | 373,117,133 | 400,955,936 | ||||||
| U.S. Sustainable Leaders Fund | 119,912,486 | 147,745,700 | ||||||
| U.S. Sustainable Leaders Smaller Companies Fund | 9,504,716 | 5,434,128 | ||||||
5. Portfolio Investment Risks
| a. | Concentration Risk |
The Global Infrastructure Fund, International Real Estate Equity Fund and Realty Income & Growth Fund are subject to concentration risk. Each Fund's strategy of concentrating in companies in a specific industry means that its performance will be closely tied to the performance of a particular market segment. Each Fund's concentration in these companies may present more risks than if it were broadly diversified over numerous industries and sectors of the economy. A downturn in these companies would have a larger impact on each Fund than on a mutual fund that does not concentrate in such companies. At times, the performance of these companies will lag the performance of other industries or the broader market as a whole.
| b. | Cybersecurity Risk |
Cybersecurity incidents may allow an unauthorized party to gain access to Fund assets, customer data (including private shareholder information), or proprietary information, or cause each Fund, the Adviser and/or their service providers (including, but not limited to, Fund accountants, custodians, sub-custodians, transfer agents and financial intermediaries) to suffer data breaches, data corruption or lose operational functionality.
| c. | Dividend Strategy Risk |
The Dynamic Dividend Fund and Realty Income & Growth Fund are subject to dividend strategy risk. There is no guarantee that the issuers of the stocks held by the Fund will declare dividends in the future or that, if dividends are declared, they will remain at their current levels or increase over time. The Fund's emphasis on dividend paying stocks could cause the Fund to underperform similar funds that invest without consideration of a company's track record of paying dividends or ability to pay dividends in the future. Dividend-paying stocks may not participate in a broad market advance to the same degree as other stocks, and a sharp rise in interest rates or economic downturn could cause a company to unexpectedly reduce or eliminate its dividend. The Fund may hold securities for short periods of time related to the dividend payment periods and may experience loss during these periods.
| 2022 Semi-Annual Report | 123 |
Notes to Financial Statements (continued)
April 30, 2022 (Unaudited)
| d. | Emerging Markets Risk |
The risks of investing in emerging market countries are a magnification of the risks that apply to foreign investments. These risks are greater for securities of companies in emerging market countries because the countries may have less stable governments, more volatile currencies and less established markets (see "Foreign Securities Risk" below).
| e. | Equity-Linked Notes |
The China A Share Equity Fund may invest in equity-linked notes, which are generally subject to the same risks as the foreign equity securities or the basket of foreign securities they are linked to. If the linked security(ies) declines in value, the note may return a lower amount at maturity. The trading price of an equity-linked note also depends on the value of the linked security(ies).
| f. | Equity Securities Risk |
The stock or other security of a company may not perform as well as expected, and may decrease in value, because of factors related to the company (such as poorer than expected earnings or certain management decisions), to the industry in which the company is engaged (such as a reduction in the demand for products or services in a particular industry), or to the market as a whole (such as periods of market volatility or instability, or general and prolonged periods of economic decline).
| g. | Exchange-Traded Fund Risk |
To the extent that the China A Share Equity Fund invests in ETFs, the Fund may be subject to, among other risks, tracking error risk and passive and, in some cases, active management investment risk. An active secondary market in ETF shares may not develop or be maintained and may be halted or interrupted due to actions by its listing exchange, unusual market conditions or other reasons. There can be no assurance that an ETF's shares will continue to be listed on an active exchange. In addition, Fund shareholders bear both their proportionate share of the Fund's expenses and similar expenses incurred through the Fund's ownership of the ETF.
| h. | Foreign Currency Exposure Risk |
The value of foreign currencies relative to the U.S. Dollar fluctuates in response to market, economic, political, regulatory, geopolitical or other conditions. A decline in the value of a foreign currency versus the U.S. Dollar reduces the value in U.S. Dollars of investments denominated in that foreign currency. This risk may impact a Fund more greatly to the extent the Fund does not hedge its currency risk, or hedging techniques used by the Adviser are unsuccessful.
| i. | Foreign Securities Risk |
Foreign countries in which a Fund may invest may have markets that are less liquid, less regulated and more volatile than U.S. markets. The value of a Fund's investments may decline because of factors such as unfavorable or unsuccessful government actions, reduction of government or central bank support and political or financial instability. To the extent the Fund focuses its investments in a single country or only a few countries in a particular geographic region, economic, political, regulatory or other conditions affecting such country or region may have a greater impact on Fund performance relative to a more geographically diversified fund.
Asian Risk. Parts of the Asian region may be subject to a greater degree of economic, political and social instability than is the case in the United States and Europe. Some Asian countries can be characterized as emerging markets or newly industrialized and may experience more volatile economic cycles than developed countries. The developing nature of securities markets in many countries in the Asian region may lead to a lack of liquidity while some countries have restricted the flow of money in and out of the country. Some countries in Asia have historically experienced political uncertainty, corruption, military intervention and social unrest. To the extent a Fund invests heavily in Asian issuers, the Fund may be more volatile than a fund which is broadly diversified geographically.
China Risk. Concentrating investments in China and Hong Kong subjects the China A Shares Equity Fund to additional risks, and may make it significantly more volatile than geographically diverse mutual funds. Additional risks associated with investments in China and Hong Kong include exposure to currency fluctuations, less liquidity, expropriation, confiscatory taxation, nationalization, exchange control regulations (including currency blockage), trading halts, imposition of tariffs, limitations on repatriation and differing legal standards. Any spread of an infectious illness, public health threat or similar issue could reduce consumer demand or economic output, result in market closures, travel restrictions or quarantines, and generally have a significant impact on the Chinese economy, which in turn could adversely affect the Fund's investments.
China A Shares Risk. Trading in China A Shares through Stock Connect and the QFII Programs involves additional risks. Stock Connect is subject to a daily quota (the "Daily Quota"), which limits the maximum net purchases under Stock Connect each day and, as such, buy orders for China A Shares would be rejected once the Daily Quota is exceeded (although the Fund will be permitted to sell China A Shares regardless of the Daily Quota balance). Further, Stock Connect, which relies on the connectivity of the Shanghai or Shenzhen markets with Hong Kong, is subject to operational risk, regulations that are relatively untested and are subject to change, and extended market closures for holidays or
| 124 | 2022 Semi-Annual Report |
Notes to Financial Statements (continued)
April 30, 2022 (Unaudited)
otherwise. During an extended market closure, the Fund's ability to trade in China A Shares will be impacted which may affect the Fund's performance. The QFII Programs are subject to the risk that the Adviser may have its QFII Programs license revoked or restricted with respect to the Fund or the Fund may be impacted by the rules, restrictions and quota limitations connected to reliance on a QFII Programs license.
Russia/Ukraine Risk. In February 2022, Russia commenced a military attack on Ukraine. The outbreak of hostilities between the two countries and the threat of wider spread hostilities could have a severe adverse effect on the region and global economies, including significant negative impacts on the markets for certain securities and commodities, such as oil and natural gas. In addition, sanctions imposed on Russia by the United States and other countries, and any sanctions imposed in the future, could have a significant adverse impact on the Russian economy and related markets. The price and liquidity of investments may fluctuate widely as a result of the conflict and related events. How long the armed conflict and related events will last cannot be predicted. These tensions and any related events could have a significant impact on Fund performance and the value of the Funds' investments.
| j. | Illiquid Securities Risk |
Illiquid securities are assets that a Fund reasonably expects cannot be sold or disposed of in current market conditions in seven calendar days or less without the sale or disposition significantly changing the market value of the asset. An inability to sell a portfolio position can adversely affect a Fund's value or prevent the Fund from being able to take advantage of other investment opportunities. Illiquid securities and relatively less liquid securities may also be difficult to value.
The Adviser employs procedures and tests using third-party and internal data inputs that seek to assess and manage the liquidity of a Fund's portfolio holdings. These procedures and tests take into account a Fund's investment strategy and liquidity of portfolio investments during both normal and foreseeable stressed conditions, cash-flow projections during both normal and reasonably foreseeable stressed conditions, relevant market, trading and other factors, and monitor whether liquidity should be adjusted based on changed market conditions. These procedures and tests are designed to assist a Fund in determining its ability to meet redemption requests in various market conditions. In light of the dynamic nature of markets, there can be no assurance that these procedures and tests will enable a Fund to ensure that it has sufficient liquidity to meet redemption requests.
| k. | Impact Investing Risk |
In implementing the Global Equity Impact Fund's ESG (Environmental, Social and Governance) investment strategy, the Adviser may select or exclude securities of issuers in certain industries, sectors, regions or countries for reasons other than the issuer's investment performance. For this reason, the Fund's ESG strategy could cause it to perform differently compared to funds that do not have such strategy. ESG investing is qualitative and subjective by nature. In addition, the Fund may be required to sell a security when it might otherwise be disadvantageous for it to do so. In evaluating an issuer, the Adviser utilizes, in part, information and data obtained through voluntary or third-party reporting that may be incomplete, inaccurate or unavailable, which could cause the Adviser to incorrectly assess an issuer's business practices with respect to the environment, social responsibility and corporate governance. Securities of companies with ESG practices may shift into and out of favor depending on market and economic conditions. The definition of "impact investing" will vary according to an investor's beliefs and values. There is no guarantee that the Adviser's definition of impact investing, security selection criteria or investment judgment will reflect the beliefs or values of any particular investor.
| l. | Impact of Large Redemptions and Purchases of Fund Shares |
Occasionally, shareholders may make large redemptions or purchases of Fund shares, which may cause a Fund to have to sell securities or invest additional cash. These transactions may adversely affect the Fund's performance and increase transaction costs. In addition, large redemption requests may exceed the cash balance of a Fund and result in credit line borrowing fees and/or overdraft charges to the Fund until the sales of portfolio securities necessary to cover the redemption request settle.
| m. | Infrastructure-Related Investment Risk |
Because the Global Infrastructure Fund concentrates its investments in infrastructure-related entities, the Fund has greater exposure to the potential adverse economic, regulatory, political and other changes affecting such entities. Infrastructure related entities are subject to a variety of factors that may adversely affect their business or operations, including high interest costs in connection with capital construction programs, costs associated with environmental and other regulations, the effects of economic slowdown and surplus capacity, increased competition from other providers of services, uncertainties concerning the availability of fuel at reasonable prices, the effects of energy conservation policies and other factors. Additionally, infrastructure-related entities may be subject to regulation by various governmental authorities and may also be affected by governmental regulation of rates charged to customers, service interruption due to environmental, operational or other mishaps and the imposition of special tariffs and changes in tax laws, regulatory policies and accounting standards.
| 2022 Semi-Annual Report | 125 |
Notes to Financial Statements (continued)
April 30, 2022 (Unaudited)
| n. | Issuer Risk |
The value of a security may decline for reasons directly related to the issuer, such as management performance, financial leverage and reduced demand for the issuer's goods or services.
| o. | LIBOR Risk |
The Funds are subject to the risk that potential changes related to the use of the London Interbank Offered Rate ("LIBOR") could adversely affect financial instruments that reference LIBOR as a benchmark interest rate. While some instruments may contemplate a scenario when LIBOR is no longer available by providing for an alternative rate setting methodology, not all instruments provide for an alternative rate, and the effectiveness of replacement rates is uncertain. The potential abandonment of LIBOR could affect the value and liquidity of instruments that reference LIBOR, especially those that do not have fallback provisions.
| p. | Management Risk |
Each Fund is subject to the risk that the Adviser or Subadviser (as applicable) may make poor security selections. The Adviser, Subadviser and their portfolio managers apply their own investment techniques and risk analyses in making investment decisions for a Fund and there can be no guarantee that these decisions will achieve the desired results for the Fund. In addition, the Adviser or Subadviser may select securities that underperform the relevant market of other funds with similar investment objectives and strategies.
| q. | Market Risk |
Deteriorating market conditions might cause a general weakness in the market that reduces the prices, or yield, of securities in that market. Developments in a particular class of bonds or the stock market could also adversely affect a Fund by reducing the relative attractiveness of bonds or stocks as an investment. Also, to the extent that a Fund emphasizes bonds or stocks from any given industry, it could be hurt if that industry does not do well. Additionally, a Fund could lose value if the individual stocks in which it maintains long positions and/or the overall stock markets on which the stocks trade decline in price. In addition, a Fund that engages in short sales could lose value if the individual stocks which they sell short increase in price. Stocks and stock markets may experience short-term volatility (price fluctuation) as well as extended periods of price decline or increase. Individual stocks are affected by many factors, including:
| • | corporate earnings; | |
| • | production; | |
| • | management; | |
| • | sales; and | |
| • | market trends, including investor demand for a particular type of stock, such as growth or value stocks, small or large stocks, or stocks within a particular industry. |
Stock markets are affected by numerous factors, including interest rates, the outlook for corporate profits, the health of the national and world economies, the fluctuation of other stock markets around the world, and financial, economic and other global market developments and disruptions, such as those arising from war, terrorism, market manipulation, government interventions, defaults and shutdowns, political changes or diplomatic developments, public health emergencies and natural/environmental disasters. In addition, any spread of an infectious illness, public health threat or similar issue could reduce consumer demand or economic output, result in market closures, travel restrictions or quarantines, and generally have a significant impact on the world economy, which in turn could adversely affect the Fund's investments.
Policy and legislative changes in the United States and in other countries are affecting many aspects of financial regulation, and governmental and quasi-governmental authorities and regulators throughout the world have responded to serious economic disruptions with a variety of significant fiscal and monetary policy changes, including but not limited to, direct capital infusions into companies, new monetary programs and dramatically lower interest rates. The impact of these policies and legislative changes on the markets, and the practical implications for market participants, may not be fully known for some time. A reversal of these policies, or the ineffectiveness of these policies, could increase volatility in securities markets, which could adversely impact the Fund's investments. The current market environment could make identifying investment risks and opportunities especially difficult for the Adviser.
In addition, uncertainties remain relating to certain aspects of the United Kingdom's future economic, trading and legal relationships with the European Union and with other countries.
Whether or not a Fund invests in securities of issuers located in Europe (whether the EU, Eurozone or UK) or with significant exposure to European, EU, Eurozone or UK issuers or countries, the unavoidable uncertainties and events related to Brexit could negatively affect the value and liquidity of a Fund's investments, increase taxes and costs of business and cause volatility in currency exchange rates and interest rates. Brexit could adversely affect the performance of contracts in existence at the date of Brexit and European, UK or worldwide political, regulatory, economic or market conditions and could contribute to instability in political institutions, regulatory agencies and financial markets. Brexit could also lead to legal uncertainty and politically divergent national laws and regulations as a new relationship between the
| 126 | 2022 Semi-Annual Report |
Notes to Financial Statements (continued)
April 30, 2022 (Unaudited)
UK and EU is defined and as the UK determines which EU laws to replace or replicate. Any of these effects of Brexit, and others that cannot be anticipated, could adversely affect a Fund's business, results of operations and financial condition. In addition, the risk that abrdn, the parent of the companies that provide investment advisory, sub-advisory and administration services to the Funds and which is headquartered in the UK, fails to adequately prepare for Brexit could have significant customer, reputation and capital impacts for abrdn and its subsidiaries, including those providing services to the Funds. abrdn has a detailed contingency plan in place to seek to manage the consequences of Brexit on the Funds and to avoid the effect of any disruption on the Funds and to the services its subsidiaries provide. Given the fluidity and complexity of the situation, however, it cannot assured that the Funds will not be adversely impacted by Brexit despite these preparations.
Economies and financial markets throughout the world are becoming increasingly interconnected. As a result, whether or not a Fund invests in securities of issuers located in or with significant exposure to countries experiencing economic and financial difficulties, the value and liquidity of the Fund's investments may be negatively affected by such events. The illness caused by a novel coronavirus (COVID-19) has resulted in a global pandemic and major disruption to economies and markets around the world, including the United States. Financial markets have experienced extreme volatility and severe losses, and trading in many instruments has been disrupted. Liquidity for many instruments has been greatly reduced for periods of time. Some interest rates are very low and in some cases yields are negative. Some sectors of the economy and individual issuers have experienced particularly large losses. These circumstances may continue for an extended period of time, and may continue to affect adversely the value and liquidity of the Funds' investments. The ultimate economic fallout from the pandemic, and the long-term impact on economies, markets, industries and individual issuers, including the Funds, are not known. Governments and central banks, including the Federal Reserve in the U.S., have taken extraordinary and unprecedented actions to support local and global economies and the financial markets. The impact of these measures, and whether they will be effective to mitigate the economic and market disruption, will not be known for some time. In addition, as described above under "Foreign Securities Risk," the ongoing military conflict between Russia and Ukraine may continue to result in significant negative impacts on the markets for certain securities and commodities globally, in addition to fluctuating pricing and liquidity of investments. These factors could have a significant impact on Fund performance and the value of the Funds' investments.
| r. | Mid-Cap Securities Risk |
Securities of medium-sized companies tend to be more volatile and less liquid than securities of larger companies.
| s. | Non-Diversified Fund Risk |
The Realty Income & Growth Fund's performance may be more volatile than a diversified fund because it may invest a greater percentage of its total assets in the securities of a single issuer.
| t. | Non-U.S. Taxation Risk |
Income, proceeds and gains received by a Fund from sources within foreign countries may be subject to withholding and other taxes imposed by such countries, which will reduce the return on those investments. Tax treaties between certain countries and the United States may reduce or eliminate such taxes.
If, at the close of its taxable year, more than 50% of the value of a Fund's total assets consists of securities of foreign corporations, including for this purpose foreign governments, the Fund will be permitted to make an election under the Code that will allow shareholders a deduction or credit for foreign taxes paid by the Fund. In such a case, shareholders will include in gross income from foreign sources their pro rata shares of such taxes. A shareholder's ability to claim an offsetting foreign tax credit or deduction in respect of such foreign taxes is subject to certain limitations imposed by the Code, which may result in the shareholder's not receiving a full credit or deduction (if any) for the amount of such taxes. Shareholders who do not itemize on their U.S. federal income tax returns may claim a credit (but not a deduction) for such foreign taxes. If a Fund does not qualify for or chooses not to make such an election, shareholders will not be entitled separately to claim a credit or deduction for U.S. federal income tax purposes with respect to foreign taxes paid by the Fund; in that case the foreign tax will nonetheless reduce the Fund's taxable income. Even if a Fund elects to pass through to its shareholders foreign tax credits or deductions, tax-exempt shareholders and those who invest in the Fund through tax-advantaged accounts such as IRAs will not benefit from any such tax credit or deduction.
| u. | Portfolio Turnover Risk |
The Dynamic Dividend Fund Funds may engage in active and frequent trading of portfolio securities to achieve its investment objective. High portfolio turnover may result in greater transaction costs which may reduce Fund performance. The sale of Fund portfolio securities may also result in greater realization and/or distribution to shareholders of gains or losses as compared to a Fund with less active trading, which may include short-term gains taxable at ordinary income tax rates.
| 2022 Semi-Annual Report | 127 |
Notes to Financial Statements (continued)
April 30, 2022 (Unaudited)
| v. | Qualified Dividend Income Tax Risk |
With respect to the Dynamic Dividend Fund, no assurance can be given as to what percentage of the distributions paid on shares, if any, will consist of tax-advantaged qualified dividend income or long-term capital gains or what the tax rates on various types of income will be in future years. The favorable U.S. federal tax treatment may be adversely affected, changed or repealed by future changes in tax laws at any time. In addition, it may be difficult to obtain information regarding whether distributions by non-U.S. entities in which a Fund invests should be regarded as qualified dividend income. Furthermore, to receive qualified dividend income treatment, a Fund must meet holding period and other requirements with respect to the dividend paying securities in its portfolio, and the shareholder must meet holding period and other requirements with respect to the common shares of a Fund.
| w. | REIT and Real Estate Risk |
Investment in real estate investment trusts ("REITs") and real estate involves the risks that are associated with direct ownership of real estate and with the real estate industry in general. These risks include: declines in the value of real estate; risks related to local economic conditions, overbuilding and increased competition; increases in property taxes and operating expenses; changes in zoning laws; casualty or condemnation losses; variations in rental income, neighborhood values or the appeal of properties to tenants; changes in interest rates and changes in general economic and market conditions. REITs' share prices may decline because of adverse developments affecting the real estate industry including changes in interest rates. The returns from REITs may trail returns from the overall market. Additionally, there is always a risk that a given REIT will fail to qualify for favorable tax treatment. REITs may be leveraged, which increases risk. Certain REITs charge management fees, which may result in layering the management fee paid by the fund.
| x. | Sector Risk |
To the extent that a Fund has a significant portion of its assets invested in securities of companies conducting business in a broadly related group of industries within an economic sector, the Fund may be more vulnerable to unfavorable developments in that economic sector than funds that invest more broadly.
Industrials Sector Risk. To the extent that the industrial sector represents a significant portion of a Fund's holdings, the Fund will be sensitive to changes in, and its performance may be adversely impacted by issues impacting this sector. The value of securities issued by companies in the industrials sector may be adversely affected by supply and demand related to their specific products or services and industrials sector products in general. The products of manufacturing companies may face obsolescence due to rapid technological developments and frequent new product introduction. Government regulations, world events, economic conditions and exchange rates may adversely affect the performance of companies in the industrials sector. Companies in the industrials sector may be adversely affected by liability for environmental damage and product liability claims. The industrials sector may also be adversely affected by changes or trends in commodity prices, which may be influenced by unpredictable factors. Companies in the industrials sector, particularly aerospace and defense companies, may also be adversely affected by government spending policies because companies involved in this sector rely to a significant extent on government demand for their products and services.
Information Technology Sector Risk. To the extent that the information technology sector represents a significant portion of a Fund, the Fund will be sensitive to changes in, and its performance may depend to a greater extent on, factors impacting this sector. Information technology companies face intense competition, both domestically and internationally, which may have an adverse effect on their profit margins. Like other technology companies, information technology companies may have limited product lines, markets, financial resources or personnel. The products of information technology companies may face obsolescence due to rapid technological developments, frequent new product introduction, unpredictable changes in growth rates and competition for the services of qualified personnel. Companies in the information technology sector are heavily dependent on patent and intellectual property rights. The loss or impairment of these rights may adversely affect the profitability of these companies.
| y. | Small-Cap Securities Risk |
Securities of smaller companies are usually less stable in price and less liquid than those of larger, more established companies. Therefore, they generally involve greater risk.
| z. | Sustainable Investing Risk |
A Fund's "Sustainable Leaders" strategy could cause it to perform differently compared to funds that do not have such strategy. ESG considerations may be linked to long-term rather than short-term returns. The criteria related to a Fund's Sustainable Leaders strategy, including the exclusion of securities of companies that engage in certain business activities, may result in the Fund forgoing opportunities to
| 128 | 2022 Semi-Annual Report |
Notes to Financial Statements (continued)
April 30, 2022 (Unaudited)
buy certain securities when it might otherwise be advantageous to do so, or selling securities for ESG reasons when it might be otherwise disadvantageous for it to do so. In addition, there is a risk that the companies identified as sustainable leaders by the Adviser do not operate as expected when addressing ESG issues. There are significant differences in interpretations of what it means for a company to have positive ESG characteristics. While the Adviser believes its definitions are reasonable, the portfolio decisions it makes may differ with other investors' or advisers' views.
| aa. | Valuation Risk |
The price that a Fund could receive upon the sale of any particular portfolio investment may differ from the Fund's valuation of the investment, particularly for securities that trade in thin or volatile markets or that are valued using a fair valuation methodology or a price provided by an independent pricing service. As a result, the price received upon the sale of an investment may be less than the value ascribed by a Fund, and the Fund could realize a greater than expected loss or lesser than expected gain upon the sale of the investment. A Fund's ability to value its investments may also be impacted by technological issues and/or errors by pricing services or other third-party service providers.
Please read the Funds' prospectus for more detailed information regarding these and other risks.
6. Contingencies
In the normal course of business, the Funds may provide general indemnifications pursuant to certain contracts and organizational documents. The Funds' maximum exposure under these arrangements is dependent on future claims that may be made against the Funds, and therefore, cannot be estimated; however, the Funds expect the risk of loss from such claims to be remote.
7. Tax Information
As of April 30, 2022, the tax cost of securities and the breakdown of unrealized appreciation/(depreciation) for each Fund were as follows:
| Tax Cost of Securities | Unrealized Appreciation | Unrealized Depreciation | Net Unrealized Appreciation/ (Depreciation) | |||||||||||||
| China A Share Equity Fund | $ 69,728,175 | $ 631,454 | $ (18,489,799 | ) | $ (17,858,345 | ) | ||||||||||
| Dynamic Dividend Fund | 98,338,544 | 25,638,135 | (9,530,528 | ) | 16,107,607 | |||||||||||
| Emerging Markets ex-China Fund | 26,078,033 | 834,976 | (2,254,088 | ) | (1,419,112 | ) | ||||||||||
| Emerging Markets Fund | 3,487,463,816 | 496,591,529 | (721,202,980 | ) | (224,611,451 | ) | ||||||||||
| Emerging Markets Sustainable Leaders Fund | 172,220,647 | 4,828,051 | (38,589,337 | ) | (33,761,286 | ) | ||||||||||
| Global Equity Impact Fund | 48,831,327 | 11,901,487 | (4,012,934 | ) | 7,888,553 | |||||||||||
| Global Infrastructure Fund | 46,587,622 | 11,073,813 | (2,926,174 | ) | 8,147,639 | |||||||||||
| International Real Estate Equity Fund | 29,828,088 | 1,485,792 | (14,050,500 | ) | (12,564,708 | ) | ||||||||||
| International Small Cap Fund | 286,737,433 | 21,877,901 | (44,980,201 | ) | (23,102,300 | ) | ||||||||||
| International Sustainable Leaders Fund | 133,055,016 | 6,456,451 | (29,335,209 | ) | (22,878,758 | ) | ||||||||||
| Realty Income & Growth Fund | 37,424,844 | 16,878,837 | (571,248 | ) | 16,307,589 | |||||||||||
| U.S. Small Cap Equity Fund | 981,376,893 | 64,307,582 | (167,904,711 | ) | (103,597,129 | ) | ||||||||||
| U.S. Sustainable Leaders Fund | 395,983,214 | 47,662,032 | (47,984,878 | ) | (322,846 | ) | ||||||||||
| U.S. Sustainable Leaders Smaller Companies Fund | 20,964,530 | 839,716 | (3,420,347 | ) | (2,580,631 | ) | ||||||||||
| 2022 Semi-Annual Report | 129 |
Notes to Financial Statements (continued)
April 30, 2022 (Unaudited)
The tax character of distributions paid during the fiscal year ended October 31, 2021 was as follows (total distributions paid may differ from the Statements of Changes in Net Assets because for tax purposes dividends are recognized when actually paid):
| Distributions Paid From | |||||||||||||||||||||||
| Fund | Ordinary Income* | Net Long Term Capital Gains* | Total Taxable Distributions | Tax Exempt Distributions | Return of Capital | Total Distributions Paid | |||||||||||||||||
| China A Share Equity Fund | $ 53,382 | $ 463,245 | $ 516,627 | $– | $– | $ 516,627 | |||||||||||||||||
| Dynamic Dividend Fund | 6,553,325 | – | 6,553,325 | – | – | 6,553,325 | |||||||||||||||||
| Emerging Markets ex-China Fund | – | – | – | – | – | – | |||||||||||||||||
| Emerging Markets Fund | 8,787,598 | 33,395,606 | 42,183,204 | – | – | 42,183,204 | |||||||||||||||||
| Emerging Markets Sustainable Leaders Fund | 454,746 | – | 454,746 | – | – | 454,746 | |||||||||||||||||
| Global Equity Impact Fund | 354,407 | – | 354,407 | – | – | 354,407 | |||||||||||||||||
| Global Infrastructure Fund | 1,653,806 | 39,441 | 1,693,247 | – | – | 1,693,247 | |||||||||||||||||
| International Real Estate Equity Fund | 772,714 | – | 772,714 | – | – | 772,714 | |||||||||||||||||
| International Small Cap Fund | – | – | – | – | – | – | |||||||||||||||||
| International Sustainable Leaders Fund | 931,262 | – | 931,262 | – | – | 931,262 | |||||||||||||||||
| Realty Income & Growth Fund | 614,019 | 5,677,170 | 6,291,189 | – | – | 6,291,189 | |||||||||||||||||
| U.S. Small Cap Equity Fund | 7,615,912 | 41,783,512 | 49,399,424 | – | – | 49,399,424 | |||||||||||||||||
| U.S. Sustainable Leaders Fund | 11,862,382 | 36,364,159 | 48,226,541 | – | – | 48,226,541 | |||||||||||||||||
| U.S. Sustainable Leaders Smaller Companies Fund | 169,299 | 1,648,863 | 1,818,162 | – | – | 1,818,162 | |||||||||||||||||
As of October 31, 2021, the components of accumulated earnings on a tax basis were as follows:
| Fund | Undistributed Tax Exempt Income | Undistributed Ordinary Income | Undistributed Long-Term Capital Gains | Accumulated Earnings | Distributions Payable | Late Year Ordinary and Post-October Capital Loss Deferrals | Other Temporary Differences | Unrealized Appreciation/ (Depreciation)* | Accumulated Capital and Other Losses** | Total Accumulated Earnings/ (Deficit) | ||||||||||||||||||||||||||||||
| China A Share Equity Fund | $– | $ 42,895 | $ 2,210,773 | $– | $– | $– | $– | $ 57,102 | $ – | $ | 2,310,770 | |||||||||||||||||||||||||||||
| Dynamic Dividend Fund | – | 330,507 | 242,902 | – | – | – | – | 32,948,209 | – | 33,521,618 | ||||||||||||||||||||||||||||||
| Emerging Markets ex-China Fund | – | – | 3,260,750 | – | – | – | – | 10,459,636 | (3,959,123 | ) | 9,761,263 | |||||||||||||||||||||||||||||
| Emerging Markets Fund | – | 72,825,019 | 390,351,786 | – | – | – | – | 1,192,390,821 | – | 1,655,567,626 | ||||||||||||||||||||||||||||||
| Emerging Markets Sustainable Leaders Fund | – | 8,771,688 | 31,005,272 | – | – | – | – | 13,287,645 | – | 53,064,605 | ||||||||||||||||||||||||||||||
| Global Equity Impact Fund | – | – | – | – | – | – | – | 26,808,989 | (17,733,824 | ) | 9,075,165 | |||||||||||||||||||||||||||||
| Global Infrastructure Fund | – | – | 633,034 | – | – | – | – | 11,912,176 | – | 12,545,210 | ||||||||||||||||||||||||||||||
| International Real Estate Equity Fund | – | 797,672 | – | – | – | – | – | (10,600,384 | ) | (73,002,383 | ) | (82,805,095 | ) | |||||||||||||||||||||||||||
| International Small Cap Fund | – | 3,632,353 | 18,234,244 | – | – | – | – | 73,787,213 | – | 95,653,810 | ||||||||||||||||||||||||||||||
| International Sustainable Leaders Fund | – | – | – | – | – | – | – | 17,488,202 | (393,595,289 | ) | (376,107,087 | ) | ||||||||||||||||||||||||||||
| Realty Income & Growth Fund | – | 780,011 | 6,407,926 | – | – | – | – | 20,435,378 | – | 27,623,315 | ||||||||||||||||||||||||||||||
| U.S. Small Cap Equity Fund | – | 92,788,176 | 130,222,045 | – | – | – | – | 223,564,545 | – | 446,574,766 | ||||||||||||||||||||||||||||||
| U.S. Sustainable Leaders Fund | – | 46,901,064 | 79,580,771 | – | – | – | – | 117,032,961 | – | 243,514,796 | ||||||||||||||||||||||||||||||
| U.S. Sustainable Leaders Smaller Companies Fund | – | 2,800,282 | 2,439,921 | – | – | – | – | 3,306,613 | – | 8,546,816 | ||||||||||||||||||||||||||||||
| * | The difference between the book-basis and tax-basis unrealized appreciation/(depreciation) is attributable primarily to passive foreign investment companies and tax deferral of losses on wash sales. |
| ** | As of October 31, 2021, for Federal income tax purposes, these Funds have capital loss carryforwards available to offset capital gains, if any, to the extent provided by the Treasury regulations, with no expiration. |
| 130 | 2022 Semi-Annual Report |
Notes to Financial Statements (continued)
April 30, 2022 (Unaudited)
As of October 31, 2021, for Federal income tax purposes, the following Funds have capital loss carryforwards available to offset capital gains, if any, to the extent provided by the Treasury regulations.
| Fund | Amount | Expires | ||||
| Emerging Markets ex-China Fund | $ 3,959,123 | Unlimited (Long-Term) | ||||
| Global Equity Impact Fund | 17,733,824 | Unlimited (Long-Term) | ||||
| International Real Estate Equity Fund | 6,001,423 | Unlimited (Short-Term) | ||||
| International Real Estate Equity Fund | 67,000,960 | Unlimited (Long-Term) | ||||
| International Sustainable Leaders Fund | 5,911,960 | Unlimited (Short-Term) | ||||
| International Sustainable Leaders Fund | 387,683,329 | Unlimited (Long-Term) | ||||
8. Significant Shareholders
As of April 30, 2022, the Funds had shareholders with the percentage ownership indicated, which are considered significant shareholders (holdings greater than 5.0%) for financial reporting purposes:
| Fund | Record Ownership % | Number of Account Owners | |||||
| China A Share Equity Fund | 54.0% | 3 | |||||
| Dynamic Dividend Fund | 53.8 | 5 | |||||
| Emerging Markets ex-China Fund | 20.1 | 1 | |||||
| Emerging Markets Fund | 67.0 | 5 | |||||
| Emerging Markets Sustainable Leaders Fund | 45.4 | 3 | |||||
| Global Equity Impact Fund | 21.4 | 2 | |||||
| Global Infrastructure Fund | 59.5 | 4 | |||||
| International Real Estate Equity Fund | 62.7 | 4 | |||||
| International Small Cap Fund | 69.2 | 3 | |||||
| International Sustainable Leaders Fund | 51.8 | 2 | |||||
| Realty Income & Growth Fund | 52.8 | 3 | |||||
| U.S. Small Cap Equity Fund | 45.2 | 5 | |||||
| U.S. Sustainable Leaders Fund | 12.0 | 1 | |||||
| U.S. Sustainable Leaders Smaller Companies Fund | 39.6 | 5 | |||||
9. Line of Credit
The Trust, on behalf of each of the funds of the Trust (including the Funds) (the "Borrowers"), has entered into an agreement (the "Agreement") with State Street Bank and Trust Company (the "Bank"), subject to annual renewal. The Agreement provides for a revolving credit facility (the "Credit Facility") in the amount of $150,000,000 to be utilized for temporary or emergency purposes to fund shareholder redemptions or other short-term liquidity purposes.
Principal on each outstanding loan made under the Agreement bears interest at a variable rate per annum equal to the higher of (a) the Federal Funds Rate as in effect on such day or (b) the Overnight Bank Funding Rate on such date, plus, in each case, 10 basis points, plus one and one quarter of one percent (1.25%). In addition, the Borrowers shall pay to the Bank a commitment fee at the rate of 0.25% per annum on the daily unused portion of the Credit Facility, as applicable, which is allocated among the Borrowers in such manner as is determined by the Board to be reasonable. For each Fund that borrowed under the Credit Facility during the six-month period ended April 30, 2022, the following table shows the average outstanding daily balance of the days the Fund utilized the Credit Facility and the average weighted interest rate paid by the Fund during the six-month period ended April 30, 2022.
| 2022 Semi-Annual Report | 131 |
Notes to Financial Statements (continued)
April 30, 2022 (Unaudited)
| Average Outstanding Daily Balance | Average Weighted Interest Rate | Days Utilized | |||||||||
| China A Share Equity Fund | $ 498,132 | 1.65% | 11 | ||||||||
| Dynamic Dividend Fund | 375,000 | 1.68% | 3 | ||||||||
| Emerging Markets ex-China Fund | 2,850,000 | 1.43% | 1 | ||||||||
| Emerging Markets Fund | 30,294,492 | 1.55% | 44 | ||||||||
| Emerging Markets Sustainable Leaders Fund | 2,992,690 | 1.43% | 12 | ||||||||
| Global Equity Impact Fund | 442,156 | 1.43% | 8 | ||||||||
| Global Infrastructure Fund | 200,000 | 1.68% | 3 | ||||||||
| International Real Estate Equity Fund | 203,153 | 1.43% | 29 | ||||||||
| International Sustainable Leaders Fund | 650,000 | 1.68% | 1 | ||||||||
| Realty Income & Growth Fund | 93,341 | 1.43% | 20 | ||||||||
| U.S. Small Cap Fund | 5,105,000 | 1.43% | 5 | ||||||||
| U.S. Sustainable Leaders Fund | 2,450,000 | 1.43% | 4 | ||||||||
10. Recent Rulemaking
In October 2020, the Securities and Exchange Commission ("SEC") adopted new regulations governing the use of derivatives by registered investment companies. Rule 18f-4 will impose limits on the amount of derivatives a fund could enter into, eliminate the asset segregation framework currently used by funds to comply with Section 18 of the 1940 Act, and require funds whose use of derivatives is more than a limited specified exposure to establish and maintain a derivatives risk management program and appoint a derivatives risk manager. While the new rule became effective February 19, 2021, funds will not be required to fully comply with the new rule until August 19, 2022. Management is currently finalizing the implementation of Rule 18f-4 to meet the August 19, 2022 compliance date.
In December 2020, the SEC adopted Rule 2a-5 under the 1940 Act, which establishes requirements for determining fair value in good faith for purposes of the 1940 Act, including related oversight and reporting requirements. The rule also defines when market quotations are "readily available" for purposes of the 1940 Act, the threshold for determining whether a fund must fair value a security. The SEC also adopted new Rule 31a-4 under the 1940 Act, which sets forth the recordkeeping requirements associated with fair value determinations. Finally, the SEC is rescinding certain previously issued guidance on related issues, including the role of a board in determining fair value and the accounting and auditing of fund investments. Rule 2a-5 and Rule 31a-4 became effective on March 8, 2021, with a compliance date of September 8, 2022. Management is currently evaluating this guidance.
11. Subsequent Events
Management has evaluated the need for disclosures and/or adjustments resulting from subsequent events through the date the financial statements were issued. Based on this evaluation, no disclosures and/or adjustments were required to the financial statements as of April 30, 2022.
At the June 15, 2022 Board meeting (the "Meeting"), the Board approved a plan of liquidation for the International Real Estate Equity Fund pursuant to which the Fund will be liquidated on or about August 18, 2022.
At the Meeting, the Board also approved the adoption of a conversion feature for Class C of the U.S. Sustainable Leaders Smaller Companies Fund. Under the relevant conversion feature, effective after the close of business on August 18, 2022, all of the issued and outstanding shares of the Original Share Class will be converted into shares of Class A of the Fund.
| 132 | 2022 Semi-Annual Report |
Notes to Financial Statements (concluded)
April 30, 2022 (Unaudited)
Subsequent to the period ended April 30, 2022, the following payments on tax reclaims were received:
| Amount | Percent of Total Net Assets* | Received | |||||||||
| International Sustainable Leaders Fund | |||||||||||
| Withholding Tax Refunds Received from Country: | |||||||||||
| Sweden | $ 210,656 | 0.21 | % | 6/1/2022 | |||||||
| France | 1,934,979 | 1.95 | % | 6/15/2022 | |||||||
| Global Equity Impact Fund | |||||||||||
| Withholding Tax Refunds Received from Country: | |||||||||||
| Sweden | $ 150,690 | 0.28 | % | 6/1/2022 | |||||||
| France | 1,757,028 | 3.26 | % | 6/15/2022 | |||||||
| * | As of April 30, 2022 |
The estimated tax accrual, as outlined in Footnote 2(i) in the Notes to Financial Statements, increased by 1.6% to 13.4% of total net assets as of April, 30, 2022 for the International Sustainable Leaders Fund and increased by 2.7% to 8.9% for the Global Equity Impact Fund.
| 2022 Semi-Annual Report | 133 |
Board of Trustees' Consideration of New Advisory and Sub-Advisory Agreements
The Board of Trustees (the "Board," the members of which are referred to as "Trustees") of Aberdeen Funds (the "Trust") met on May 3, 2021 and June 16, 2021 (together, the "Meetings") to consider the approval of: (i) the Investment Advisory Agreement between the Trust, on behalf of the Aberdeen International Sustainable Leaders Fund and Aberdeen Global Equity Impact Fund (each a "New Fund" and together the "New Funds") and Aberdeen Standard Investments Inc. ("ASII" or the "Adviser," subsequently renamed abrdn Inc.) (the "New Investment Advisory Agreement"); and (ii) the Sub-Advisory Agreement among the Trust, on behalf of the Funds, ASII and Aberdeen Asset Managers Limited (the "Sub-Adviser") (the "New Sub-Advisory Agreement"). In addition, the Independent Trustees held separate executive sessions with their independent counsel at the Meetings to review the materials provided and the relevant legal considerations. Pursuant to relief granted by the U.S. Securities and Exchange Commission (the "SEC") in light of the COVID-19 pandemic (the "Order") and a determination by the Board that reliance on the Order was appropriate due to circumstances related to the current or potential effects of COVID-19, the Meetings were held via videoconference. In accordance with Section 15(c) of the 1940 Act, the Board requested, reviewed and considered materials furnished by ASII and the Sub-Adviser relevant to the Board's consideration of whether to approve the New Investment Advisory Agreement and the New Sub-Advisory Agreement. These materials included (i) memoranda and materials provided by ASII, describing the personnel and services to be provided to the New Funds by ASII and the Sub-Adviser; (ii) performance information for the Predecessor Funds; (iii) strategies relevant to the consideration of the New Investment Advisory Agreement and the New Sub-Advisory Agreement; (iv) information independently compiled by Morningstar Associates, LLC ("Morningstar") relating to the New Funds' proposed fees and expenses and (v) a discussion of the compliance programs of ASII and the Sub-Adviser. ASII and the Sub-Adviser are referred to collectively herein as the "Adviser," as applicable. The New Investment Advisory Agreement and the New Sub-Advisory Agreement are referred to collectively herein as the "New Advisory Agreement," as applicable and as the context suggests.
At the meeting held on June 16, 2021, the Board, including the Independent Trustees, unanimously approved the New Investment Advisory Agreement between the New Funds and ASII for an initial two-year period and the New Sub-Advisory Agreement among the Trust, ASII and the Sub-Adviser for an initial two-year period. The Board considered all factors it believed to be relevant with respect to the New Funds, including, among other factors: (a) the nature, extent and quality of services to be provided by the Adviser; (b) the investment performance of the Adviser and the Adviser's portfolio management; (c) the advisory fees and the cost of the services and profits to be realized by the Adviser from the relationship with the New Funds; (d) economies of scale; and (e) other factors.
The following is a summary of the Board's discussion and views regarding the factors it considered in evaluating the New Advisory Agreement and New Sub-Advisory Agreement:
The nature, extent and quality of the services to be provided to the New Funds under the Agreements. The Trustees considered the nature, extent and quality of the services to be provided by ASII and the Sub-Adviser, as applicable, to the New Funds and the resources dedicated to the New Funds by the Adviser and its affiliates. The Board considered, among other things, the Adviser's investment experience. The Board also considered the background and experience of the senior management personnel of ASII and the Sub-Adviser, and the qualifications, background and responsibilities of the portfolio managers to be primarily responsible for the day-to-day portfolio management services for the New Funds. The Board also considered the allocation of responsibilities between ASII and the Sub-Adviser. The Trustees considered not only the advisory services to be provided by ASII and the Sub-Adviser to the New Funds, but also the administrative services to be provided by ASII to the New Funds under a separate administration agreement. ASII's role in overseeing the Sub-Adviser in the management of the New Funds and coordinating the activities of the Trust's other service providers was also considered. The Board also considered that it receives information on a regular basis from the Trust's Chief Compliance Officer regarding ASII's compliance policies and procedures, and that it had received information from the Trust's Chief Compliance Officer regarding the Sub-Adviser's compliance policies and procedures. The Board also considered the Adviser's risk management processes. The Board was also mindful of ASII's focus on monitoring the performance of the New Funds and addressing performance matters. The Trustees also considered the benefits to shareholders of investing in a mutual fund that is part of a family of funds that offers shareholders the right to exchange shares of one type of fund for shares of another type of fund, and provides a variety of fund and shareholder services. The Board also took into account its knowledge of management and the quality of the performance of management's duties through Board meetings, discussion and reports during the preceding year.
After reviewing these and related factors, the Board concluded that the nature, extent and quality of the services to be provided supported the approval of the New Investment Advisory Agreement and the New Sub-Advisory Agreement.
Investment Performance and the Adviser's Portfolio Management. Because the New Funds are newly formed, the Board did not consider the investment performance of the New Funds. The Board considered instead the investment performance of the Predecessor Funds, including whether the Predecessor Funds had operated within their investment objectives, as well as their compliance with their investment restrictions. The Board based its review of ASII's and its affiliates' performance primarily on the experience of ASII and its affiliates in managing other registered investment companies and private funds, noting that other funds ASII and its affiliates manage might have investment objectives, policies or restrictions different from those of the New Funds. The Board also considered the experience, resources and strengths of ASII and its affiliates with respect to the investment strategies proposed for the New Funds.
| 134 | 2022 Semi-Annual Report |
Based on these factors, the Trustees determined that the Adviser would be an appropriate investment adviser for the New Funds.
The costs of the services provided and profits to be realized by the Adviser and affiliates from the relationships with the New Funds. The Trustees considered the fees to be charged to the New Funds for advisory services as well as the total expense levels of the New Funds. This information included comparisons (provided both by management and also by an independent third party) of each New Fund's net management fee and total expense level to those of its expense peer group and information about the advisory fees charged by ASII and its affiliates to any separately managed accounts with a similar strategy, as applicable. In considering the fees charged to any comparable accounts, the Trustees considered, among other things, management's discussion of the different objectives, policies or restrictions that may be involved in managing the different types of accounts. In evaluating the New Funds' advisory fees, the Trustees also took into account the demands, complexity and quality of the investment management proposed for the New Funds.
The Trustees also noted that the sub-advisory fees for each of the New Funds would be paid by ASII out of its advisory fee from the respective New Fund, not by the New Fund. The Board also considered that ASII had entered into expense limitation agreements with the New Funds, pursuant to which ASII agreed to waive a portion of its advisory fee and/or reimburse certain expenses as a means of limiting the New Funds' total annual operating expenses for a period of time. The Trustees also noted that ASII had agreed to enter into an expense limitation agreement with respect to each New Fund until at least February 28, 2023 following the reorganization of the Predecessor Funds into the New Funds.
The Trustees also considered the compensation directly or indirectly received by ASII and its affiliates from their relationships with the New Funds. The Trustees reviewed information provided by management as to the profitability of ASII and its affiliates' relationships with the New Funds, such as the engagement of affiliates of ASII to provide administration services to the New Funds. The Trustees also examined the profitability of ASII and its affiliates on a Fund-by-Fund basis. The Trustees considered information about the allocation of expenses used to calculate profitability. When reviewing profitability, the Trustees also considered information about court cases regarding adviser profitability, the performance of the New Funds, the expense levels of the Funds, and ASII's proposed breakpoints and expense limitations with respect to the New Funds. Although the Trustees considered projected profitability to ASII with respect to the New Funds, they did not consider the projected profitability for the Sub-Adviser as they did not consider it to be particularly relevant because ASII would be paying the Sub-Adviser out of its investment advisory fees. The Trustees therefore believed that ASII had an incentive to negotiate the lowest possible sub-advisory fees.
After reviewing these and related factors, including taking into account management's discussion regarding the New Funds' expenses, the Board concluded that the proposed advisory fees were fair and reasonable, and that the costs of these services generally and the related profitability of ASII and its affiliates from their relationships with the New Funds were reasonable and supported the approval of the Agreements.
Economies of Scale. The Adviser provided the Board with information concerning the extent to which economies of scale would be realized as the New Funds grew. ASII presented information to show that the fees were set at a level that is competitive relative to comparable funds of an anticipated size and complexity. The Trustees noted that the New Funds were subject to an expense limitation and that the advisory fees for the New Funds were subject to breakpoints. The Board considered that the funds in the Aberdeen fund complex share some common resources and, as a result, an increase in the overall size of the complex could permit the New Funds to incur lower expenses than they would otherwise as stand-alone entities. The Board also considered ASII's overall operations and its efforts to expand the scale of, and further enhance the quality of, its operations.
Other Factors. The Board also took into account other ancillary or "fall out" benefits that the Adviser or its affiliates may derive from its relationship with the New Funds, both tangible and intangible.
After reviewing these and related factors, the Board concluded that the advisory fee and sub-advisory fee structures were reasonable and reflect economies of scale being shared between the Funds and ASII, and supported approval of the New Advisory Agreement and New Sub-Advisory Agreement with the New Funds.
Based on their evaluation of all factors that they deemed to be material, including those factors described above, and assisted by the advice of independent counsel, the Trustees, including the Independent Trustees, concluded that the New Advisory Agreement and New Sub-Advisory Agreement would be in the best interest of the New Funds and their shareholders. Accordingly, the Board, and the Independent Trustees voting separately, approved each of the New Investment Advisory Agreement and the New Sub-Advisory Agreement for an initial two-year period. Pursuant to the SEC Order, the Board determined that the Trustees, including the Independent Trustees, voting separately, would ratify their approval at the next in-person Board meeting.
| 2022 Semi-Annual Report | 135 |
Shareholder Expense Examples (Unaudited)
As a shareholder of the abrdn Funds, you incur two types of costs: (1) transaction costs, including sales charges (loads) paid on purchase payments and (2) ongoing costs, including investment advisory fees, administration fees, transfer agent out-of-pocket expenses, distribution fees and other Fund expenses. The examples below are intended to help you understand your ongoing costs (in dollars) of investing in the abrdn Funds and to compare these costs with the ongoing costs of investing in other mutual funds.
The examples assume that you had a $1,000 investment in the Class at the beginning of the reporting period, November 1, 2021 and continued to hold your shares at the end of the reporting period, April 30, 2022.
Actual Expenses
The table below provides information about actual account values and actual expenses. You may use the information together with the amount you invested, to estimate the expenses that you paid over the period. Simply divide your account value by $1,000 (for example, an $8,600 account value divided by $1,000 = 8.6), then multiply the result by the number under the heading entitled "Actual Expenses Paid During Period" for the class of a Fund that you own to estimate the expenses you paid on your account during the period.
Hypothetical Example for Comparison Purposes
The table below provides information about hypothetical account values and hypothetical expenses based on the Class' actual expense ratio and an assumed rate of return of 5% per year before expenses, which is not the Class' actual return. The hypothetical account values and expenses may not be used to estimate the actual ending account balance or expenses you paid for the period. You may use this information to compare the ongoing costs of investing in the Class of a Fund and other funds. To do so, compare the 5% hypothetical example with the 5% hypothetical examples that appear in the shareholder reports of the other funds.
Please note that the expenses shown in the table are meant to highlight your ongoing costs only and do not reflect any transaction costs, such as sales charges (loads). Therefore, the information for each Class in the table is useful in comparing ongoing costs only, and will not help you determine the relative total costs of owning different funds. In addition, if these transaction costs were included, your costs would have been higher. The examples also assume all dividends and distributions have been reinvested.
| Beginning Account Value, November 1, 2021 | Actual Ending Account Value, April 30, 2022 | Hypothetical Ending Account Value | Actual Expenses Paid During Period1 | Hypothetical Expenses Paid During Period12 | Annualized Expense Ratio** | |||||||
| China A Share Equity Fund | Class A | $1,000.00 | $ 737.50 | $1,018.20 | $5.73 | $ 6.66 | 1.33% | |||||
| Class C | $1,000.00 | $ 735.20 | $1,014.93 | $8.56 | $ 9.94 | 1.99% | ||||||
| Class R | $1,000.00 | $ 736.50 | $1,016.71 | $7.02 | $ 8.15 | 1.63% | ||||||
| Institutional Service Class | $1,000.00 | $ 738.60 | $1,019.39 | $4.70 | $ 5.46 | 1.09% | ||||||
| Institutional Class | $1,000.00 | $ 739.00 | $1,019.89 | $4.27 | $ 4.96 | 0.99% | ||||||
| Dynamic Dividend Fund | Class A | $1,000.00 | $ 916.30 | $1,017.36 | $7.13 | $ 7.50 | 1.50% | |||||
| Institutional Class | $1,000.00 | $ 917.40 | $1,018.60 | $5.94 | $ 6.26 | 1.25% | ||||||
| Emerging Markets ex-China Fund | Class A | $1,000.00 | $ 836.70 | $1,017.36 | $6.83 | $ 7.50 | 1.50% | |||||
| Class C | $1,000.00 | $ 833.60 | $1,014.08 | $9.82 | $10.79 | 2.16% | ||||||
| Class R | $1,000.00 | $ 835.40 | $1,015.37 | $8.65 | $ 9.49 | 1.90% | ||||||
| Institutional Service Class | $1,000.00 | $ 838.00 | $1,018.55 | $5.74 | $ 6.31 | 1.26% | ||||||
| Institutional Class | $1,000.00 | $ 838.30 | $1,019.04 | $5.29 | $ 5.81 | 1.16% | ||||||
| Emerging Markets Fund | Class A | $1,000.00 | $ 746.60 | $1,016.96 | $6.84 | $ 7.90 | 1.58% | |||||
| Class C | $1,000.00 | $ 744.60 | $1,014.38 | $9.08 | $10.49 | 2.10% | ||||||
| Class R | $1,000.00 | $ 745.70 | $1,016.12 | $7.57 | $ 8.75 | 1.75% | ||||||
| Institutional Service Class | $1,000.00 | $ 747.80 | $1,018.65 | $5.37 | $ 6.21 | 1.24% | ||||||
| Institutional Class | $1,000.00 | $ 748.40 | $1,019.34 | $4.77 | $ 5.51 | 1.10% | ||||||
| Emerging Markets Sustainable Leaders Fund | Class A | $1,000.00 | $ 744.50 | $1,017.41 | $6.44 | $ 7.45 | 1.49% | |||||
| Class C | $1,000.00 | $ 742.20 | $1,014.38 | $9.07 | $10.49 | 2.10% | ||||||
| Class R | $1,000.00 | $ 743.70 | $1,015.97 | $7.70 | $ 8.90 | 1.78% | ||||||
| Institutional Service Class | $1,000.00 | $ 746.00 | $1,018.99 | $5.07 | $ 5.86 | 1.17% | ||||||
| Institutional Class | $1,000.00 | $ 746.20 | $1,019.34 | $4.76 | $ 5.51 | 1.10% | ||||||
| Global Equity Impact Fund | Class A | $1,000.00 | $ 778.50 | $1,018.89 | $5.25 | $ 5.96 | 1.19% | |||||
| Institutional Class | $1,000.00 | $ 779.40 | $1,020.13 | $4.15 | $ 4.71 | 0.94% | ||||||
| Global Infrastructure Fund | Class A | $1,000.00 | $ 985.60 | $1,018.65 | $6.10 | $ 6.21 | 1.24% | |||||
| Institutional Class | $1,000.00 | $ 986.90 | $1,019.89 | $4.88 | $ 4.96 | 0.99% |
| 136 | 2022 Semi-Annual Report |
Shareholder Expense Examples (Unaudited) (concluded)
| Beginning Account Value, November 1, 2021 | Actual Ending Account Value, April 30, 2022 | Hypothetical Ending Account Value | Actual Expenses Paid During Period1 | Hypothetical Expenses Paid During Period12 | Annualized Expense Ratio** | |||||||
| International Real Estate Equity Fund | Class A | $1,000.00 | $ 891.20 | $1,016.76 | $7.60 | $ 8.10 | 1.62% | |||||
| Institutional Class | $1,000.00 | $ 892.60 | $1,018.00 | $6.43 | $ 6.85 | 1.37% | ||||||
| International Small Cap Fund | Class A | $1,000.00 | $ 717.00 | $1,018.10 | $5.75 | $ 6.76 | 1.35% | |||||
| Class C | $1,000.00 | $ 714.80 | $1,014.93 | $8.46 | $ 9.94 | 1.99% | ||||||
| Class R | $1,000.00 | $ 715.90 | $1,016.71 | $6.93 | $ 8.15 | 1.63% | ||||||
| Institutional Class | $1,000.00 | $ 718.40 | $1,019.89 | $4.22 | $ 4.96 | 0.99% | ||||||
| International Sustainable Leaders Fund | Class A | $1,000.00 | $ 723.40 | $1,018.89 | $5.09 | $ 5.96 | 1.19% | |||||
| Institutional Class | $1,000.00 | $ 724.10 | $1,020.13 | $4.02 | $ 4.71 | 0.94% | ||||||
| Realty Income & Growth Fund | Class A | $1,000.00 | $ 982.80 | $1,018.60 | $6.15 | $ 6.26 | 1.25% | |||||
| Institutional Class | $1,000.00 | $ 983.80 | $1,019.84 | $4.92 | $ 5.01 | 1.00% | ||||||
| U.S. Small Cap Equity Fund | Class A | $1,000.00 | $ 780.20 | $1,018.20 | $5.87 | $ 6.66 | 1.33% | |||||
| Class C | $1,000.00 | $ 777.80 | $1,014.93 | $8.77 | $ 9.94 | 1.99% | ||||||
| Class R | $1,000.00 | $ 778.90 | $1,016.71 | $7.19 | $ 8.15 | 1.63% | ||||||
| Institutional Service Class | $1,000.00 | $ 781.00 | $1,019.29 | $4.90 | $ 5.56 | 1.11% | ||||||
| Institutional Class | $1,000.00 | $ 781.50 | $1,019.89 | $4.37 | $ 4.96 | 0.99% | ||||||
| U.S. Sustainable Leaders Fund | Class A | $1,000.00 | $ 816.30 | $1,018.89 | $5.36 | $ 5.96 | 1.19% | |||||
| Class C | $1,000.00 | $ 813.10 | $1,015.37 | $8.54 | $ 9.49 | 1.90% | ||||||
| Institutional Service Class | $1,000.00 | $ 816.90 | $1,019.98 | $4.37 | $ 4.86 | 0.97% | ||||||
| Institutional Class | $1,000.00 | $ 816.50 | $1,020.33 | $4.05 | $ 4.51 | 0.90% | ||||||
| U.S. Sustainable Leaders Smaller Companies Fund | Class A | $1,000.00 | $ 774.50 | $1,018.75 | $5.37 | $ 6.11 | 1.22% | |||||
| Class C | $1,000.00 | $ 768.00 | $1,015.37 | $8.33 | $ 9.49 | 1.90% | ||||||
| Class R | $1,000.00 | $ 773.30 | $1,017.11 | $6.82 | $ 7.75 | 1.55% | ||||||
| Institutional Service Class | $1,000.00 | $ 775.40 | $1,019.74 | $4.49 | $ 5.11 | 1.02% | ||||||
| Institutional Class | $1,000.00 | $ 775.10 | $1,020.33 | $3.96 | $ 4.51 | 0.90% |
| ** | The expense ratio presented represents a six-month, annualized ratio. |
| 1 | Expenses are equal to the Fund's annualized expense ratio multiplied by the average account value over the period multiplied by 181/365 (to reflect the one-half year period). |
| 2 | Represents the hypothetical 5% return before expenses. |
| 2022 Semi-Annual Report | 137 |
Liquidity Risk Management Program (Unaudited)
The Funds have adopted and implemented a liquidity risk management program (the "Liquidity Program") consistent with the requirements of Rule 22e-4 under the 1940 Act (the "Liquidity Rule"). "Liquidity Risk" is defined as the risk that a fund could not meet redemption requests "without significant dilution of remaining investors' interests in the fund." abrdn Inc. (formerly, Aberdeen Standard Investments Inc.), the investment adviser and administrator to the Funds, has been approved and designated by the Board of Trustees (the "Board") as the administrator of the Liquidity Program (the "Administrator") and has retained a third party to perform certain functions, including liquidity analytics and providing market data. The Administrator has formed a Liquidity Risk Management Committee (the "Committee") to help implement and carry out the day-to-day operations of the Liquidity Program.
As required by the Liquidity Rule, at a meeting on March 16, 2022, the Board received a written annual report on the operation and effectiveness of the Liquidity Program for the period from February 1, 2021 to January 31, 2022 (the "Reporting Period"). The annual report provided, among other items, an overview of the Liquidity Program including:
| • | information regarding the Committee and the monthly discussions by the Committee of various items including, but not limited to, the following: |
| º | Review and analysis of appropriate liquidity categories for portfolio investments |
| º | Review of highly liquid investment minimum ("HLIM") and reasonably anticipated trading sizes ("RATS") |
| º | Review of current and upcoming market events, such as market closures, that may impact liquidity |
| º | Review of large shareholder concentrations that may impact liquidity in the event of redemption monthly liquidity reports being provided to portfolio managers |
| • | the monitoring and classification of portfolio holdings in four liquidity categories (including the operation of the HLIM and any breaches) |
The annual report concluded that the Liquidity Program was reasonably designed to assess and manage the Funds' Liquidity Risk pursuant to the Liquidity Rule.
There can be no assurance that the Liquidity Program will achieve its objectives under all circumstances in the future. Please refer to your Fund's Prospectus and Statement of Additional Information for more information regarding the risks of investing in a Fund, including a Fund's exposure to liquidity risk and other risks to which the Funds may be subject.
| 138 | 2022 Semi-Annual Report |
Management Information
| Trustees | Distributor |
| Radhika Ajmera | Aberdeen Fund Distributors LLC |
| Stephen Bird | 1900 Market Street, Suite 200 |
| P. Gerald Malone, Chairman | Philadelphia, PA 19103 |
| Rahn K. Porter | |
| Steven N. Rappaport | Sub-Administrator, Custodian & Fund Accountant |
| Warren C. Smith | State Street Bank and Trust Company |
| 1 Lincoln Street | |
| Investment Adviser | Boston, MA 02111 |
| abrdn Inc. | |
| 1900 Market Street, Suite 200 | Independent Registered Public Accounting Firm |
| Philadelphia, PA 19103 | KPMG LLP |
| 1601 Market Street | |
| Fund Administrator | Philadelphia, PA 19103 |
| abrdn Inc. | |
| 1900 Market Street, Suite 200 | Fund Counsel |
| Philadelphia, PA 19103 | Dechert LLP |
| 1900 K Street N.W. | |
| Transfer Agent | Washington, D.C. 20006 |
| DST Asset Manager Solutions, Inc. | |
| 430 W. 7th Street, Ste. 219534 | |
| Kansas City, MO 64105-1407 |
| abrdn Inc. | |
| 1900 Market Street, Suite 200 | |
| Philadelphia, PA 19103 |
|
| aberdeen-asset.us | |
| AOE-0140-SAR |
abrdn Funds
Fixed Income and Multi-Asset Series
Semi-Annual Report
April 30, 2022
Fixed Income Funds
abrdn Emerging Markets Debt Fund (formerly, Aberdeen Emerging Markets Debt Fund)
Class A – AKFAX n Class C – AKFCX n Class R – AKFRX n Institutional Class – AKFIX n Institutional Service Class – AKFSX
abrdn Global High Income Fund (formerly, Aberdeen Global High Income Fund)
Class A – BJBHX n Institutional Class – JHYIX
abrdn Intermediate Municipal Income Fund (formerly, Aberdeen Intermediate Municipal Income Fund)
Class A – NTFAX n Class C – GTICX n Institutional Class – ABEIX n Institutional Service Class – ABESX
abrdn Short Duration High Yield Municipal Fund (formerly, Aberdeen Short Duration High Yield Municipal Fund)
Class A – AAHMX n Class C – ACHMX n Institutional Class – AHYMX
abrdn Ultra Short Municipal Income Fund (formerly, Aberdeen Ultra Short Municipal Income Fund)
Class A – ATOAX n Class A1 – ATOBX n Institutional Class – ATOIX
Multi-Asset Funds
abrdn Global Absolute Return Strategies Fund (formerly, Aberdeen Global Absolute Return Strategies Fund)
Class A – CUGAX n Class C – CGBCX n Institutional Class – AGCIX n Institutional Service Class – CGFIX

Table of Contents
| Market Review | ||
| abrdn Emerging Markets Debt Fund | Page 1 | |
| abrdn Global Absolute Return Strategies Fund | Page 8 | |
| abrdn Global High Income Fund | Page 18 | |
| abrdn Intermediate Municipal Income Fund | Page 27 | |
| abrdn Short Duration High Yield Municipal Fund | Page 32 | |
| abrdn Ultra Short Municipal Income Fund | Page 44 | |
| Financial Statements | Page 50 | |
| Notes to Financial Statements | Page 73 | |
| Shareholder Expense Examples | Page 97 | |
| Supplemental Information | Page 98 | |
| Liquidity Risk Management Program | Page 100 |
Investors should carefully consider a fund's investment objectives, risks, fees, charges and expenses before investing any money. To obtain this and other fund information, please call 866-667-9231 to request a prospectus, or download a prospectus at https://www.abrdn.com/en-us/investor/fund-centre/fund-literature. Please read it carefully before investing any money.
Investing in mutual funds involves risk, including possible loss of principal.
abrdn Funds is distributed by Aberdeen Fund Distributors LLC, Member FINRA, 1900 Market Street, Suite 200, Philadelphia, PA 19103.
abrdn Inc. has been registered as an investment adviser under the Investment Advisers Act of 1940 since August 23, 1995.
The complete schedule of portfolio holdings for each fund of abrdn Funds (each a "Fund" and collectively, the "Funds") is included in the Funds' semi-annual and annual reports to shareholders. abrdn Funds also files complete schedules of portfolio holdings for each Fund with the Securities and Exchange Commission (the "Commission") for the first and third quarters of each fiscal year as an exhibit to its reports on Form N-PORT. The Funds' Form N-PORT filings are available on the Commission's website at http://www.sec.gov and the Funds make the information on the exhibit to Form N-PORT available to shareholders on upon request without charge by calling 1-866-667-9231.
Statement Regarding Availability of Proxy Voting Record.
Information regarding the policies and procedures that the Funds use to determine how to vote proxies relating to portfolio securities is available without charge, upon request, by calling 1-866-667-9231. The information is also included in the Funds' Statement of Additional Information, which is available on the Funds' website at https://www.abrdn.com/en-us/investor/fund-centre/fund-literature and on the Commission's website at www.sec.gov.
Information relating to how each Fund voted proxies relating to portfolio securities held during the most recent twelve months ended June 30 is available by August 30 of the relevant year: (i) upon request and without charge by calling 1-866-667-9231; and (ii) on the Commission's website at www.sec.gov.
abrdn
abrdn plc, formerly known as Standard Life Aberdeen plc, was renamed on September 27, 2021. In connection with this re-branding, the entities within abrdn plc group, including investment advisory entities, have been or will be renamed in the near future. In addition, the fund names are anticipated to be re-branded over the next year.
abrdn Emerging Markets Debt Fund (Unaudited)
| Average Annual Total Return (For periods ended April 30, 2022) | Six Month† | 1 Yr. | 5 Yr. | Inception1 | ||
| Class A | w/o SC | (14.55%) | (15.76%) | (1.07%) | 0.87% | |
| w/ SC2 | (17.15%) | (18.27%) | (1.67%) | 0.54% | ||
| Class C | w/o SC | (14.72%) | (16.17%) | (1.64%) | 0.23% | |
| w/ SC3 | (15.53%) | (16.96%) | (1.64%) | 0.23% | ||
| Class R4 | w/o SC | (14.70%) | (16.03%) | (1.34%) | 0.62% | |
| Institutional Service Class4 | w/o SC | (14.35%) | (15.46%) | (0.73%) | 1.19% | |
| Institutional Class4 | w/o SC | (14.30%) | (15.35%) | (0.70%) | 1.20% |
All figures showing the effect of a sales charge (SC) reflect the maximum charge possible because it has the most significant effect on performance data. The total returns shown above do not include the impact of financial statement rounding of the net asset value (NAV) per share and/or financial statement adjustments.
† Not annualized
1 The Fund commenced operations on November 1, 2012.
2 A 3.00% front-end sales charge was deducted. Prior to February 28, 2019 the front-end sales charge was 4.25%.
3 A 1.00% contingent deferred sales charge (CDSC) was deducted from the one year return because it is charged when Class C shares are sold within the first year after purchase.
4 Not subject to any sales charges.
Performance of a $1,000,000* Investment (as of April 30, 2022)

* Minimum Initial Investment
Comparative performance of $1,000,000 invested in Institutional Class shares of the abrdn Emerging Markets Debt Fund, the J.P. Morgan Emerging Markets Bond Index (EMBI) Global Diversified Index and the Consumer Price Index (CPI) since inception. Unlike the Fund, the returns for these unmanaged indexes do not reflect any fees, expenses, or sales charges. Investors cannot invest directly in market indexes.
The J.P. Morgan EMBI Global Diversified Index is an alternatively weighted index that assigns a larger weight to less liquid issues from countries with smaller debt stocks and limits the weights of those index countries with larger debt stocks by only including a specified portion of these countries' eligible current face amounts of debt outstanding. The index consists of U.S. dollar-denominated Brady bonds, Eurobonds, and traded loans issued by sovereign and quasi-sovereign entities issued in emerging markets countries.
The CPI is a measure of the average change over time in the prices paid by urban consumers for a market basket of consumer goods and services.
Investment return and principal value will fluctuate, and when redeemed, shares may be worth more or less than original cost. Past performance is no guarantee of future results. The Average Annual Total Return table and Performance graph do not reflect the deduction of taxes that a shareholder would pay on fund distributions or the redemption of fund shares. Investing in mutual funds involves market risk, including loss of principal. Performance returns assume the reinvestment of all distributions. Total returns reflect waivers and reimbursements in effect, without which returns would have been lower.
| 2022 Semi-Annual Report | 1 |
abrdn Emerging Markets Debt Fund (Unaudited)
Portfolio Summary (as a percentage of net assets)
April 30, 2022 (Unaudited)
| Asset Allocation | ||
| Government Bonds | 70.1% | |
| Corporate Bonds | 24.8% | |
| Short-Term Investment | 3.6% | |
| Warrants | –% | |
| Other Assets in Excess of Liabilities | 1.5% | |
| 100.0% | ||
| Top Ten Holdings | ||
| Brazil Notas do Tesouro Nacional, Series B 08/15/2024 | 2.7% | |
| Ecuador Government International Bond, VRN 07/31/2030 | 2.6% | |
| Uruguay Government International Bond 12/15/2028 | 2.0% | |
| Bahrain Government International Bond 01/26/2026 | 1.9% | |
| Saudi Government International Bond 04/17/2049 | 1.9% | |
| Brazil Notas do Tesouro Nacional, Series F 01/01/2023 | 1.9% | |
| Dominican Republic International Bond 01/27/2045 | 1.8% | |
| Brazil Notas do Tesouro Nacional, Series F 01/01/2031 | 1.7% | |
| Qatar Government International Bond 03/14/2049 | 1.5% | |
| Argentine Republic Government International Bond, VRN 07/09/2030 | 1.5% |
Amounts listed as "–" are 0% or round to 0%.
| Countries | |||
| Brazil | 7.6% | ||
| Mexico | 5.4% | ||
| South Africa | 4.9% | ||
| Saudi Arabia | 4.4% | ||
| Qatar | 4.2% | ||
| United Arab Emirates | 3.6% | ||
| Egypt | 3.5% | ||
| Dominican Republic | 3.3% | ||
| Nigeria | 3.2% | ||
| Indonesia | 2.9% | ||
| Pakistan | 2.7% | ||
| Ecuador | 2.6% | ||
| Bahrain | 2.5% | ||
| Argentina | 2.3% | ||
| Chile | 2.3% | ||
| Uzbekistan | 2.1% | ||
| Angola | 2.0% | ||
| Uruguay | 2.0% | ||
| Other, less than 2% each | 33.4% | ||
| Short-Term Investment | 3.6% | ||
| Other Assets in Excess of Liabilities | 1.5% | ||
| 100.0% | |||
| 2 | 2022 Semi-Annual Report |
Statement of Investments
April 30, 2022 (Unaudited)
abrdn Emerging Markets Debt Fund
| Shares or Principal Amount | Value (US$) | ||||
| CORPORATE BONDS (24.8%) | |||||
| CHINA (0.1%) | |||||
| Real Estate (0.1%) | |||||
| Zhenro Properties Group Ltd. (USD), 7.10%, 09/10/2024 (a)(b) | $ 200,000 | $ 18,000 | |||
| COLOMBIA (0.6%) | |||||
| Commercial Banks (0.6%) | |||||
| Bancolombia SA, (fixed rate to 10/18/2022, variable rate thereafter) (USD), 4.88%, 10/18/2027 (c) | 200,000 | 194,502 | |||
| GEORGIA (1.4%) | |||||
| Transportation (1.4%) | |||||
| Georgian Railway JSC (USD), 4.00%, 06/17/2028 (a) | 520,000 | 441,376 | |||
| INDIA (1.4%) | |||||
| Commercial Banks (0.9%) | |||||
| HDFC Bank Ltd. (INR), 8.10%, 03/22/2025 (a) | 20,000,000 | 262,570 | |||
| Transportation (0.5%) | |||||
| Indian Railway Finance Corp. Ltd. (USD), 2.80%, 02/10/2031 (a) | 200,000 | 165,722 | |||
| 428,292 | |||||
| INDONESIA (2.9%) | |||||
| Electric Utilities (1.3%) | |||||
| Perusahaan Perseroan Persero PT Perusahaan Listrik Negara (USD), 6.25%, 01/25/2049 (a) | 387,000 | 386,419 | |||
| Oil, Gas & Consumable Fuels (0.6%) | |||||
| Pertamina Persero PT (USD), 5.63%, 05/20/2043 (a) | 200,000 | 193,904 | |||
| Sovereign Agency (1.0%) | |||||
| Lembaga Pembiayaan Ekspor Indonesia (USD), 3.88%, 04/06/2024 (a) | 290,000 | 289,240 | |||
| 869,563 | |||||
| KAZAKHSTAN (1.2%) | |||||
| Oil, Gas & Consumable Fuels (1.2%) | |||||
| Tengizchevroil Finance Co. International Ltd. (USD), 3.25%, 08/15/2030 (a) | 214,000 | 172,037 | |||
| KazMunayGas National Co. JSC (USD), 5.38%, 04/24/2030 (a) | 200,000 | 192,893 | |||
| 364,930 | |||||
| KUWAIT (0.8%) | |||||
| Chemicals (0.8%) | |||||
| MEGlobal Canada ULC (USD), 5.00%, 05/18/2025 (a) | 250,000 | 254,533 | |||
| MEXICO (5.4%) | |||||
| Chemicals (0.6%) | |||||
| Braskem Idesa SAPI (USD), 7.45%, 11/15/2029 (a) | 200,000 | 187,252 |
| Shares or Principal Amount | Value (US$) | ||||
| Commercial Banks (0.7%) | |||||
| BBVA Bancomer SA., (fixed rate to 09/13/2029, variable rate thereafter) (USD), 5.88%, 09/13/2034 (a)(c) | $ 230,000 | $ 219,075 | |||
| Oil, Gas & Consumable Fuels (3.4%) | |||||
| Petroleos Mexicanos | |||||
| (USD), 6.50%, 06/02/2041 | 330,000 | 245,850 | |||
| (USD), 6.75%, 09/21/2047 | 324,000 | 234,123 | |||
| (USD), 6.35%, 02/12/2048 | 340,000 | 238,476 | |||
| (USD), 6.95%, 01/28/2060 | 420,000 | 304,500 | |||
| 1,022,949 | |||||
| Real Estate Investment Trust (REIT) Funds (0.7%) | |||||
| Trust Fibra Uno (USD), 6.39%, 01/15/2050 (a) | 220,000 | 205,152 | |||
| 1,634,428 | |||||
| MOROCCO (0.6%) | |||||
| Chemicals (0.6%) | |||||
| OCP SA (USD), 6.88%, 04/25/2044 (a) | 200,000 | 192,500 | |||
| NIGERIA (1.3%) | |||||
| Commercial Banks (0.6%) | |||||
| BOI Finance BV (EUR), 7.50%, 02/16/2027 (a) | 194,000 | 200,567 | |||
| Engineering & Construction (0.7%) | |||||
| IHS Netherlands Holdco BV (USD), 8.00%, 09/18/2027 (a) | 200,000 | 200,780 | |||
| 401,347 | |||||
| PANAMA (0.6%) | |||||
| Commercial Banks (0.6%) | |||||
| Global Bank Corp., (fixed rate to 04/16/2028, variable rate thereafter) (USD), 5.25%, 04/16/2029 (a)(c) | 198,000 | 186,615 | |||
| PERU (1.1%) | |||||
| Metals & Mining (0.6%) | |||||
| Nexa Resources SA (USD), 5.38%, 05/04/2027 (a) | 200,000 | 192,000 | |||
| Oil, Gas & Consumable Fuels (0.5%) | |||||
| Petroleos del Peru SA (USD), 5.63%, 06/19/2047 (a) | 200,000 | 145,300 | |||
| 337,300 | |||||
| SAUDI ARABIA (1.6%) | |||||
| Oil, Gas & Consumable Fuels (1.6%) | |||||
| Saudi Arabian Oil Co. | |||||
| (USD), 2.25%, 11/24/2030 (a) | 200,000 | 174,250 | |||
| REGS (USD), 4.38%, 04/16/2049 (a) | 330,000 | 311,915 | |||
| 486,165 | |||||
| SOUTH AFRICA (1.9%) | |||||
| Diversified Telecommunication Services (0.9%) | |||||
| MTN Mauritius Investments Ltd. (USD), 6.50%, 10/13/2026 (a) | 250,000 | 259,128 | |||
See accompanying Notes to Financial Statements.
| 2022 Semi-Annual Report | 3 |
Statement of Investments (continued)
April 30, 2022 (Unaudited)
abrdn Emerging Markets Debt Fund
| Shares or Principal Amount | Value (US$) | ||||
| CORPORATE BONDS (continued) | |||||
| Electric Utilities (1.0%) | |||||
| Eskom Holdings SOC Ltd. (USD), 7.13%, 02/11/2025 (a) | $ 330,000 | $ 314,754 | |||
| 573,882 | |||||
| UKRAINE (0.5%) | |||||
| Agriculture (0.3%) | |||||
| MHP Lux SA (USD), 6.95%, 04/03/2026 (a) | 200,000 | 94,000 | |||
| Electric Utilities (0.2%) | |||||
| NPC Ukrenergo (USD), 6.88%, 11/09/2026 (a) | 200,000 | 66,000 | |||
| 160,000 | |||||
| UNITED ARAB EMIRATES (3.0%) | |||||
| Diversified Financial Services (1.0%) | |||||
| ICD Sukuk Co. Ltd. (USD), 5.00%, 02/01/2027 (a) | 300,000 | 304,500 | |||
| Energy Equipment & Services (1.4%) | |||||
| Abu Dhabi Crude Oil Pipeline LLC (USD), 4.60%, 11/02/2047 (a)(d) | 200,000 | 197,816 | |||
| Galaxy Pipeline Assets Bidco Ltd. (USD), 2.63%, 03/31/2036 (a)(d) | 264,000 | 220,716 | |||
| 418,532 | |||||
| Real Estate (0.6%) | |||||
| MAF Global Securities Ltd., (fixed rate to 09/07/2022, variable rate thereafter) (USD), 5.50%, 09/07/2022 (a)(e) | 200,000 | 198,248 | |||
| 921,280 | |||||
| VENEZUELA (0.4%) | |||||
| Oil, Gas & Consumable Fuels (0.4%) | |||||
| Petroleos de Venezuela SA | |||||
| (USD), 6.00%, 05/16/2024 (a)(b)(d)(f) | 1,140,000 | 73,530 | |||
| (USD), 6.00%, 11/15/2026 (a)(b)(d)(f) | 525,236 | 33,878 | |||
| 107,408 | |||||
| Total Corporate Bonds | 7,572,121 | ||||
| GOVERNMENT BONDS (70.1%) | |||||
| ANGOLA (2.0%) | |||||
| Angolan Government International Bond (USD), 9.38%, 05/08/2048 (a) | 675,000 | 607,905 | |||
| ARGENTINA (2.3%) | |||||
| Argentine Republic Government International Bond | |||||
| (USD), 1.00%, 07/09/2029 (d) | 174,073 | 55,790 | |||
| VRN (USD), 0.50%, 07/09/2030 (d)(g) | 1,490,400 | 468,000 | |||
| VRN (USD), 1.13%, 07/09/2035 (d)(g) | 166,903 | 47,626 | |||
| (USD), 0.00%, 12/15/2035 (b) | 533,627 | 2,268 | |||
| VRN (USD), 2.00%, 01/09/2038 (d)(g) | 320,400 | 115,040 | |||
| 688,724 | |||||
| Shares or Principal Amount | Value (US$) | ||||
| ARMENIA (1.8%) | |||||
| Republic of Armenia International Bond | |||||
| (USD), 7.15%, 03/26/2025 (a) | $ 336,000 | $ 328,440 | |||
| (USD), 3.95%, 09/26/2029 (a) | 260,000 | 206,700 | |||
| 535,140 | |||||
| BAHAMAS (1.2%) | |||||
| Bahamas Government International Bond (USD), 6.00%, 11/21/2028 (a)(d) | 521,000 | 376,236 | |||
| BAHRAIN (2.5%) | |||||
| Bahrain Government International Bond | |||||
| (USD), 7.00%, 01/26/2026 (a) | 557,000 | 593,038 | |||
| (USD), 5.63%, 05/18/2034 (a) | 200,000 | 180,000 | |||
| 773,038 | |||||
| BARBADOS (0.3%) | |||||
| Barbados Government International Bond (USD), 6.50%, 10/01/2029 (a)(d) | 102,700 | 98,184 | |||
| BELARUS (0.3%) | |||||
| Republic of Belarus Ministry of Finance (USD), 5.88%, 02/24/2026 (a)(f) | 650,000 | 78,000 | |||
| BENIN (1.0%) | |||||
| Benin Government International Bond | |||||
| (EUR), 4.88%, 01/19/2032 (a)(d) | 230,000 | 208,070 | |||
| (EUR), 6.88%, 01/19/2052 (a)(d) | 100,000 | 86,604 | |||
| 294,674 | |||||
| BRAZIL (7.6%) | |||||
| Brazil Notas do Tesouro Nacional | |||||
| Series F (BRL), 10.00%, 01/01/2023 | 2,853,000 | 566,216 | |||
| Series B (BRL), 6.00%, 08/15/2024 (h) | 1,030,000 | 827,247 | |||
| Series F (BRL), 10.00%, 01/01/2029 | 899,000 | 164,728 | |||
| Series F (BRL), 10.00%, 01/01/2031 | 2,818,000 | 505,151 | |||
| Brazil Notas do Tesouro Nacional Series F (BRL), 10.00%, 01/01/2027 | 1,320,000 | 248,160 | |||
| 2,311,502 | |||||
| CAMEROON (1.0%) | |||||
| Republic of Cameroon International Bond (EUR), 5.95%, 07/07/2032 (a)(d) | 349,000 | 308,768 | |||
| CHILE (2.3%) | |||||
| Bonos de la Tesoreria de la Republica en pesos | |||||
| (CLP), 4.70%, 09/01/2030 (a) | 380,000,000 | 390,987 | |||
| (CLP), 2.80%, 10/01/2033 (a) | 190,000,000 | 156,660 | |||
| (CLP), 5.00%, 03/01/2035 | 155,000,000 | 158,128 | |||
| 705,775 | |||||
| COLOMBIA (0.8%) | |||||
| Colombia Government International Bond (USD), 4.13%, 05/15/2051 | 370,000 | 247,900 | |||
| CROATIA (0.5%) | |||||
| Croatia Government International Bond (EUR), 1.50%, 06/17/2031 (a) | 179,000 | 165,294 | |||
See accompanying Notes to Financial Statements.
| 4 | 2022 Semi-Annual Report |
Statement of Investments (continued)
April 30, 2022 (Unaudited)
abrdn Emerging Markets Debt Fund
| Shares or Principal Amount | Value (US$) | ||||
| GOVERNMENT BONDS (continued) | |||||
| CZECH REPUBLIC (1.1%) | |||||
| Czech Republic Government Bond (CZK), 1.00%, 06/26/2026 (a) | $ 9,460,000 | $ 347,987 | |||
| DOMINICAN REPUBLIC (3.3%) | |||||
| Dominican Republic International Bond | |||||
| (USD), 5.50%, 02/22/2029 (a) | 200,000 | 186,900 | |||
| (USD), 6.85%, 01/27/2045 (a) | 600,000 | 539,726 | |||
| (USD), 5.88%, 01/30/2060 (a) | 360,000 | 272,840 | |||
| 999,466 | |||||
| ECUADOR (2.6%) | |||||
| Ecuador Government International Bond, VRN (USD), 5.00%, 07/31/2030 (a)(d)(g) | 992,640 | 804,343 | |||
| EGYPT (3.5%) | |||||
| Egypt Government International Bond | |||||
| (EUR), 5.63%, 04/16/2030 (a) | 305,000 | 235,303 | |||
| (USD), 7.90%, 02/21/2048 (a) | 425,000 | 290,360 | |||
| (USD), 8.70%, 03/01/2049 (a) | 400,000 | 292,000 | |||
| (USD), 8.88%, 05/29/2050 (a) | 340,000 | 249,900 | |||
| 1,067,563 | |||||
| EL SALVADOR (0.5%) | |||||
| El Salvador Government International Bond | |||||
| (USD), 5.88%, 01/30/2025 (a) | 249,000 | 118,236 | |||
| (USD), 8.63%, 02/28/2029 (a) | 100,000 | 40,072 | |||
| 158,308 | |||||
| GHANA (1.8%) | |||||
| Ghana Government International Bond | |||||
| (USD), 6.38%, 02/11/2027 (a)(d) | 336,000 | 227,062 | |||
| (USD), 7.75%, 04/07/2029 (a)(d) | 336,000 | 212,520 | |||
| (USD), 8.95%, 03/26/2051 (a)(d) | 200,000 | 114,940 | |||
| 554,522 | |||||
| GUATEMALA (0.9%) | |||||
| Guatemala Government Bond (USD), 6.13%, 06/01/2050 (a)(d) | 270,000 | 257,780 | |||
| IRAQ (1.2%) | |||||
| Iraq International Bond (USD), 6.75%, 03/09/2023 (a) | 360,000 | 359,712 | |||
| IVORY COAST (1.3%) | |||||
| Ivory Coast Government International Bond | |||||
| (EUR), 5.88%, 10/17/2031 (a)(d) | 160,000 | 150,643 | |||
| (EUR), 6.88%, 10/17/2040 (a)(d) | 100,000 | 88,817 | |||
| (EUR), 6.63%, 03/22/2048 (a)(d) | 203,000 | 170,566 | |||
| 410,026 | |||||
| JORDAN (1.4%) | |||||
| Jordan Government International Bond | |||||
| (USD), 4.95%, 07/07/2025 (a) | 210,000 | 201,864 | |||
| (USD), 7.38%, 10/10/2047 (a) | 270,000 | 235,046 | |||
| 436,910 |
| Shares or Principal Amount | Value (US$) | ||||
| KENYA (0.6%) | |||||
| Republic of Kenya Government International Bond (USD), 7.00%, 05/22/2027 (a)(d) | $ 210,000 | $ 186,217 | |||
| MOROCCO (0.6%) | |||||
| Morocco Government International Bond (EUR), 1.50%, 11/27/2031 (a) | 210,000 | 171,206 | |||
| NIGERIA (1.9%) | |||||
| Nigeria Government International Bond | |||||
| (USD), 6.50%, 11/28/2027 (a) | 260,000 | 230,425 | |||
| (USD), 6.13%, 09/28/2028 (a) | 200,000 | 171,000 | |||
| (USD), 8.38%, 03/24/2029 (a) | 200,000 | 186,332 | |||
| 587,757 | |||||
| OMAN (0.7%) | |||||
| Oman Government International Bond (USD), 6.25%, 01/25/2031 (a) | 200,000 | 203,516 | |||
| PAKISTAN (2.7%) | |||||
| Pakistan Government International Bond | |||||
| (USD), 6.88%, 12/05/2027 (a) | 461,000 | 376,228 | |||
| (USD), 7.38%, 04/08/2031 (a) | 587,000 | 449,959 | |||
| 826,187 | |||||
| QATAR (4.2%) | |||||
| Qatar Government International Bond | |||||
| (USD), 5.10%, 04/23/2048 (a) | 400,000 | 444,964 | |||
| (USD), 4.82%, 03/14/2049 (a) | 436,000 | 468,190 | |||
| (USD), 4.40%, 04/16/2050 (a) | 356,000 | 360,501 | |||
| 1,273,655 | |||||
| ROMANIA (1.4%) | |||||
| Romanian Government International Bond | |||||
| (EUR), 2.00%, 01/28/2032 (a) | 160,000 | 128,569 | |||
| (EUR), 2.63%, 12/02/2040 (a) | 178,000 | 124,484 | |||
| (EUR), 2.75%, 04/14/2041 (a) | 160,000 | 112,902 | |||
| (EUR), 3.38%, 01/28/2050 (a) | 76,000 | 54,119 | |||
| 420,074 | |||||
| RWANDA (1.3%) | |||||
| Rwanda International Government Bond (USD), 5.50%, 08/09/2031 (a) | 440,000 | 389,950 | |||
| SAUDI ARABIA (2.8%) | |||||
| Saudi Government International Bond | |||||
| (USD), 5.00%, 04/17/2049 (a) | 570,000 | 591,603 | |||
| (USD), 3.75%, 01/21/2055 (a) | 302,000 | 263,560 | |||
| 855,163 | |||||
| SENEGAL (0.8%) | |||||
| Senegal Government International Bond (USD), 6.25%, 05/23/2033 (a)(d) | 260,000 | 232,245 |
See accompanying Notes to Financial Statements.
| 2022 Semi-Annual Report | 5 |
Statement of Investments (continued)
April 30, 2022 (Unaudited)
abrdn Emerging Markets Debt Fund
| Shares or Principal Amount | Value (US$) | |||||||
| GOVERNMENT BONDS (continued) | ||||||||
| SERBIA (0.9%) | ||||||||
| Serbia International Bond | ||||||||
| (EUR), 3.13%, 05/15/2027 (a) | $ | 210,000 | $ | 198,796 | ||||
| REGS (EUR), 1.50%, 06/26/2029 (a) | 100,000 | 80,704 | ||||||
| 279,500 | ||||||||
| SOUTH AFRICA (3.0%) | ||||||||
| Republic of South Africa Government Bond | ||||||||
| Series 2040 (ZAR), 9.00%, 01/31/2040 | 6,151,100 | 329,240 | ||||||
| (ZAR), 6.50%, 02/28/2041 | 10,179,000 | 415,797 | ||||||
| Republic of South Africa Government International Bond (USD), 6.25%, 03/08/2041 | 200,000 | 181,532 | ||||||
| 926,569 | ||||||||
| TUNISIA (1.5%) | ||||||||
| Banque Centrale de Tunisie International Bond | ||||||||
| (EUR), 6.75%, 10/31/2023 (a) | 100,000 | 76,691 | ||||||
| (EUR), 5.63%, 02/17/2024 (a) | 538,000 | 389,870 | ||||||
| 466,561 | ||||||||
| TURKEY (0.6%) | ||||||||
| Turkey Government International Bond (USD), 7.63%, 04/26/2029 | 201,000 | 191,773 | ||||||
| UKRAINE (0.4%) | ||||||||
| Ukraine Government International Bond (EUR), 6.75%, 06/20/2026 (a)(f) | 340,000 | 115,629 | ||||||
| UNITED ARAB EMIRATES (0.6%) | ||||||||
| Finance Department Government of Sharjah (USD), 4.00%, 07/28/2050 (a) | 233,000 | 173,632 | ||||||
| URUGUAY (2.0%) | ||||||||
| Uruguay Government International Bond (UYU), 4.38%, 12/15/2028 (d)(h) | 20,864,041 | 599,170 | ||||||
| UZBEKISTAN (2.1%) | ||||||||
| Republic of Uzbekistan International Bond | ||||||||
| (USD), 4.75%, 02/20/2024 (a) | 300,000 | 294,617 | ||||||
| (USD), 3.70%, 11/25/2030 (a) | 212,000 | 172,780 | ||||||
| (USD), 3.90%, 10/19/2031 (a) | 220,000 | 179,036 | ||||||
| 646,433 | ||||||||
| VENEZUELA (0.0%) | ||||||||
| Venezuela Government International Bond (USD), 9.25%, 05/07/2028 (a)(b)(f) | 165,000 | 13,282 | ||||||
| ZAMBIA (0.8%) | ||||||||
| Zambia Government International Bond | ||||||||
| (USD), 8.97%, 07/30/2027 (a)(d) | 315,000 | 233,714 | ||||||
| Total Government Bonds | 21,379,990 | |||||||
| WARRANTS (0.0%) | ||||||||
| BRAZIL (0.0%) | ||||||||
| OAS S.A. (f)(i)(j) | 29,232 | — | ||||||
| Shares or Principal Amount | Value (US$) | |||||||
| UNITED STATES (0.0%) | ||||||||
| CANADACO, Series A (f)(i)(j) | $ | 92,840 | $ | — | ||||
| Total Warrants | 0 | |||||||
| SHORT-TERM INVESTMENT (3.6%) | ||||||||
| UNITED STATES (3.6%) | ||||||||
| State Street Institutional U.S. Government Money Market Fund, Premier Class, 0.29% (k) | 1,084,466 | 1,084,466 | ||||||
| Total Short-Term Investment | 1,084,466 | |||||||
| Total Investments (Cost $37,520,086) (l)—98.5% | 30,036,577 | |||||||
| Other Assets in Excess of Liabilities—1.5% | 464,399 | |||||||
| Net Assets—100.0% | $ | 30,500,976 | ||||||
| (a) | Denotes a security issued under Regulation S or Rule 144A. |
| (b) | Security is in default. |
| (c) | Variable Rate Instrument. The rate shown is based on the latest available information as of April 30, 2022. Certain variable rate securities are not based on a published reference rate and spread but are determined by the issuer or agent and are based on current market conditions. These securities do not indicate a reference rate and spread in their description. |
| (d) | Sinkable security. |
| (e) | Perpetual bond. This is a bond that has no maturity date, is redeemable and pays a steady stream of interest indefinitely. The maturity date presented for these instruments represents the next call/put date. |
| (f) | Illiquid security. |
| (g) | Indicates a stepped coupon bond. This bond was issued with a low coupon that gradually increases over the life of the bond. |
| (h) | Inflation linked security. |
| (i) | Level 3 security. See Note 2(a) of the accompanying Notes to Financial Statements. |
| (j) | Non-Income Producing Security. |
| (k) | Registered investment company advised by State Street Global Advisors. The rate shown is the 7 day yield as of April 30, 2022. |
| (l) | See accompanying Notes to Financial Statements for tax unrealized appreciation/depreciation of securities. |
| BRL | Brazilian Real |
| CLP | Chilean Peso |
| CZK | Czech Koruna |
| EUR | Euro Currency |
| INR | Indian Rupee |
| PLC | Public Limited Company |
| RUB | Russian Ruble |
| USD | U.S. Dollar |
| UYU | Uruguayan Peso |
| ZAR | South African Rand |
See accompanying Notes to Financial Statements.
| 6 | 2022 Semi-Annual Report |
Statement of Investments (concluded)
April 30, 2022 (Unaudited)
abrdn Emerging Markets Debt Fund
At April 30, 2022, the Fund's open forward foreign currency exchange contracts were as follows:
| Purchase Contracts Settlement Date* | Counterparty | Amount Purchased | Amount Sold | Fair Value | Unrealized Appreciation/ (Depreciation) | |||||||||||||
| Brazilian Real/United States Dollar | ||||||||||||||||||
| 05/24/2022 | Barclays Bank plc | BRL 1,106,000 | USD230,214 | $ | 222,206 | $ | (8,008 | ) | ||||||||||
| Euro/United States Dollar | ||||||||||||||||||
| 07/14/2022 | JPMorgan Chase Bank N.A. | EUR 82,000 | USD 86,625 | 86,815 | 190 | |||||||||||||
| Indian Rupee/United States Dollar | ||||||||||||||||||
| 05/24/2022 | Barclays Bank plc | INR34,629,000 | USD453,747 | 451,662 | (2,085 | ) | ||||||||||||
| New Russian Ruble/United States Dollar | ||||||||||||||||||
| 05/24/2022 | UBS AG | RUB8,808,000 | USD113,525 | 120,256 | 6,731 | |||||||||||||
| $ | 880,939 | $ | (3,172 | ) | ||||||||||||||
| Sale Contracts Settlement Date* | Counterparty | Amount Purchased | Amount Sold | Fair Value | Unrealized Appreciation/ (Depreciation) | |||||||||||||
| United States Dollar/Brazilian Real | ||||||||||||||||||
| 05/24/2022 | UBS AG | USD2,447,848 | BRL 12,879,000 | $ | 2,587,508 | $ | (139,660 | ) | ||||||||||
| United States Dollar/Chilean Peso | ||||||||||||||||||
| 05/24/2022 | UBS AG | USD 454,536 | CLP374,376,000 | 437,233 | 17,303 | |||||||||||||
| United States Dollar/Euro | ||||||||||||||||||
| 07/14/2022 | Citibank N.A. | USD3,399,686 | EUR 3,089,000 | 3,270,372 | 129,314 | |||||||||||||
| United States Dollar/Indian Rupee | ||||||||||||||||||
| 05/24/2022 | UBS AG | USD 404,784 | INR 31,119,000 | 405,881 | (1,097 | ) | ||||||||||||
| United States Dollar/New Russian Ruble | ||||||||||||||||||
| 05/24/2022 | UBS AG | USD 79,069 | RUB 8,808,000 | 120,256 | (41,187 | ) | ||||||||||||
| United States Dollar/South African Rand | ||||||||||||||||||
| 07/14/2022 | Citibank N.A. | USD 798,086 | ZAR 11,744,000 | 738,031 | 60,055 | |||||||||||||
| $ | 7,559,281 | $ | 24,728 | |||||||||||||||
| Unrealized appreciation on forward foreign currency exchange contracts | $ | 213,593 | ||||||||||||||||
| Unrealized depreciation on forward foreign currency exchange contracts | (192,037 | ) | ||||||||||||||||
* Certain contracts with different trade dates and like characteristics have been shown net.
See accompanying Notes to Financial Statements.
| 2022 Semi-Annual Report | 7 |
abrdn Global Absolute Return Strategies Fund (Unaudited)
| Average Annual Total Return1 (For periods ended April 30, 2022) | Six Month† | 1 Yr. | 5 Yr. | 10 Yr. | |||||||||||||||
| Class A | w/o SC | (5.85 | %) | (8.00 | %) | 0.81 | % | 0.74 | % | ||||||||||
| w/ SC2 | (8.69 | %) | (10.79 | %) | 0.19 | % | 0.44 | % | |||||||||||
| Class C | w/o SC | (6.11 | %) | (8.57 | %) | 0.12 | % | 0.03 | % | ||||||||||
| w/ SC3 | (7.02 | %) | (9.45 | %) | 0.12 | % | 0.03 | % | |||||||||||
| Institutional Service Class4 | w/o SC | (5.71 | %) | (7.76 | %) | 1.03 | % | 0.89 | % | ||||||||||
| Institutional Class4 | w/o SC | (5.54 | %) | (7.57 | %) | 1.12 | % | 1.03 | % | ||||||||||
All figures showing the effect of a sales charge (SC) reflect the maximum charge possible because it has the most significant effect on performance data. The total returns shown above do not include the impact of financial statement rounding of the net asset value (NAV) per share and/or financial statement adjustments.
| † | Not annualized |
| 1 | The Fund changed its investment objective and principal investment strategies, including its 80% investment policy, effective November 15, 2019. The Fund also previously changed its investment objective and strategies effective August 15, 2016. Performance information for periods prior to November 15, 2019 does not reflect the current investment strategy. Please consult the Fund's prospectus for more detail. |
| 2 | A 3.00% front-end sales charge was deducted. Prior to February 28, 2019 the front-end sales charge was 4.25%. |
| 3 | A 1.00% contingent deferred sales charge (CDSC) was deducted from the one year return because it is charged when Class C shares are sold within the first year after purchase. |
| 4 | Not subject to any sales charges. |
Performance of a $1,000,000 Investment* (as of April 30, 2022)

Comparative performance of $1,000,000 invested in Institutional Service Class shares of the abrdn Global Absolute Return Strategies Fund, the ICE BofA Merrill Lynch 3-Month U.S. Treasury Note Index and the Consumer Price Index (CPI) over a 10-year period ended April 30, 2022. Unlike the Fund, the returns for these unmanaged indexes do not reflect any fees, expenses, or sales charges. Investors cannot invest directly in market indexes.
The ICE BofA Merrill Lynch 3-Month U.S. Treasury Note Index is an unmanaged index tracking 3-month U.S. Treasury securities.
The CPI is a measure of the average change over time in the prices paid by urban consumers for a market basket of consumer goods and services.
* Minimum Initial Investment
Investment return and principal value will fluctuate, and when redeemed, shares may be worth more or less than original cost. Past performance is no guarantee of future results. The Average Annual Total Return table and Performance graph do not reflect the deduction of taxes that a shareholder would pay on fund distributions or the redemption of fund shares. Investing in mutual funds involves market risk, including loss of principal. Performance returns assume the reinvestment of all distributions. Total returns reflect waivers and reimbursements in effect, without which returns would have been lower.
| 8 | 2022 Semi-Annual Report |
abrdn Global Absolute Return Strategies Fund (Unaudited)
Portfolio Summary (as a percentage of net assets)
April 30, 2022 (Unaudited)
| Asset Allocation | ||||
| Money Market Funds | 27.1 | % | ||
| Certificates of Deposit | 23.7 | % | ||
| U.S. Treasuries | 18.9 | % | ||
| Government Bonds | 17.8 | % | ||
| Mutual Fund | 4.3 | % | ||
| Common Stocks | 3.2 | % | ||
| Purchased Options | 0.5 | % | ||
| Other Assets in Excess of Liabilities | 4.5 | % | ||
| 100.0 | % |
| Top Ten Holdings | ||||
| Bundesrepublik Deutschland Bundesanleihe 07/04/2022 | 17.8 | % | ||
| iShares USD Asia High Yield Bond ETF | 4.3 | % | ||
| Graphic Packaging Holding Co. | 0.2 | % | ||
| Tyson Foods, Inc., Class A | 0.2 | % | ||
| Mowi ASA | 0.2 | % | ||
| Salmar ASA | 0.2 | % | ||
| McCormick & Co., Inc. | 0.2 | % | ||
| Bunge Ltd. | 0.2 | % | ||
| Packaging Corp. of America | 0.1 | % | ||
| Sanderson Farms, Inc. | 0.1 | % |
| Countries | ||||
| Germany | 17.8 | % | ||
| Singapore | 4.3 | % | ||
| United States | 2.4 | % | ||
| Other, less than 2% each | 1.3 | % | ||
| Short-Term Investment | 69.7 | % | ||
| Other Assets in Excess of Liabilities | 4.5 | % | ||
| 100.0 | % | |||
| 2022 Semi-Annual Report | 9 |
Statement of Investments
April 30, 2022 (Unaudited)
abrdn Global Absolute Return Strategies Fund
| Shares or Principal Amount | Value (US$) | |||||||
| GOVERNMENT BONDS (17.8%) | ||||||||
| GERMANY (17.8%) | ||||||||
| Bundesrepublik Deutschland Bundesanleihe (EUR), 1.75%, 07/04/2022 (a) | $ | 8,860,600 | $ | 9,384,714 | ||||
| Total Government Bonds | 9,384,714 | |||||||
| MUTUAL FUND (4.3%) | ||||||||
| SINGAPORE (4.3%) | ||||||||
| iShares USD Asia High Yield Bond ETF | 304,687 | 2,269,468 | ||||||
| Total Mutual Fund | 2,269,468 | |||||||
| COMMON STOCKS (3.2%) | ||||||||
| CANADA (0.5%) | ||||||||
| Materials (0.5%) | ||||||||
| Canfor Corp. (b) | 4,018 | 76,566 | ||||||
| Nutrien Ltd. | 837 | 82,250 | ||||||
| West Fraser Timber Co. Ltd. | 987 | 86,749 | ||||||
| 245,565 | ||||||||
| NORWAY (0.3%) | ||||||||
| Consumer Staples (0.3%) | ||||||||
| Mowi ASA | 3,138 | 88,639 | ||||||
| Salmar ASA | 1,083 | 88,622 | ||||||
| 177,261 | ||||||||
| UNITED STATES (2.4%) | ||||||||
| Consumer Discretionary (0.1%) | ||||||||
| Tractor Supply Co. | 367 | 73,932 | ||||||
| Consumer Staples (1.3%) | ||||||||
| Archer-Daniels-Midland Co. | 956 | 85,619 | ||||||
| Bunge Ltd. | 778 | 88,007 | ||||||
| Costco Wholesale Corp. | 148 | 78,695 | ||||||
| Kroger Co. | 1,515 | 81,749 | ||||||
| McCormick & Co., Inc. | 878 | 88,301 | ||||||
| Sanderson Farms, Inc. | 462 | 87,489 | ||||||
| Sprouts Farmers Market, Inc. (b) | 2,670 | 79,566 | ||||||
| Tyson Foods, Inc., Class A | 963 | 89,713 | ||||||
| 679,139 | ||||||||
| Industrials (0.3%) | ||||||||
| AGCO Corp. | 588 | 74,911 | ||||||
| Deere & Co. | 205 | 77,398 | ||||||
| 152,309 | ||||||||
| Materials (0.7%) | ||||||||
| CF Industries Holdings, Inc. | 845 | 81,821 | ||||||
| FMC Corp. | 643 | 85,223 | ||||||
| Graphic Packaging Holding Co. | 4,186 | 91,255 | ||||||
| Packaging Corp. of America | 544 | 87,677 | ||||||
| 345,976 | ||||||||
| 1,251,356 | ||||||||
| Total Common Stocks | 1,674,182 | |||||||
| Total Purchased Options (see detail below) | 257,514 | |||||||
| Shares or Principal Amount | Value (US$) | |||||||
| SHORT-TERM INVESTMENT (69.7%) | ||||||||
| CERTIFICATES OF DEPOSIT (23.7%) | ||||||||
| CANADA (4.5%) | ||||||||
| Bank of Montreal (USD), 0.26%, 05/03/2022 | $ | 2,400,219 | $ | 2,400,219 | ||||
| FRANCE (10.1%) | ||||||||
| BNP Paribas SA (USD), 0.28%, 05/03/2022 | 2,485,421 | 2,485,421 | ||||||
| Credit Agricole Corporate & Investment Bank SA (USD), 0.28%, 05/03/2022 | 1,154,896 | 1,154,896 | ||||||
| Societe Generale SA (USD), 0.28%, 05/03/2022 | 1,672,003 | 1,672,003 | ||||||
| 5,312,320 | ||||||||
| NETHERLANDS (9.1%) | ||||||||
| Cooperatieve Rabobank UA (USD), 0.25%, 05/03/2022 | 2,401,106 | 2,401,106 | ||||||
| ING Bank NV (USD), 0.25%, 05/03/2022 | 2,400,458 | 2,400,458 | ||||||
| 4,801,564 | ||||||||
| Total Certificates of Deposit | 12,514,103 | |||||||
| MONEY MARKET FUNDS (27.1%) | ||||||||
| UNITED STATES (27.1%) | ||||||||
| State Street Institutional U.S. Government Money Market Fund, Premier Class, 0.29% (c) | 14,289,681 | 14,289,681 | ||||||
| Total Money Market Funds | 14,289,681 | |||||||
| U.S. TREASURIES (18.9%) | ||||||||
| UNITED STATES (18.9%) | ||||||||
| U.S. Treasury Bill | ||||||||
| (USD), 0.06%, 05/05/2022 (d) | 1,000,000 | 999,992 | ||||||
| (USD), 0.11%, 06/09/2022 (d) | 1,000,000 | 999,541 | ||||||
| (USD), 0.22%, 07/07/2022 (d) | 2,000,000 | 1,997,303 | ||||||
| (USD), 0.58%, 08/18/2022 (d)(e) | 1,500,000 | 1,495,508 | ||||||
| (USD), 0.88%, 09/08/2022 (d)(e) | 1,500,000 | 1,494,296 | ||||||
| (USD), 0.96%, 10/06/2022 (d)(e) | 1,000,000 | 994,887 | ||||||
| (USD), 1.29%, 11/03/2022 (d) | 1,000,000 | 992,835 | ||||||
| (USD), 1.40%, 12/01/2022 (d) | 1,000,000 | 991,676 | ||||||
| 9,966,038 | ||||||||
| Total U.S. Treasuries | 9,966,038 | |||||||
| Total Short-Term Investment | 36,769,822 | |||||||
| Total Investments (Cost $51,537,581) (f)—95.5% | 50,355,700 | |||||||
| Other Assets in Excess of Liabilities—4.5% | 2,346,059 | |||||||
| Net Assets—100.0% | $ | 52,701,759 | ||||||
| (a) | Denotes a security issued under Regulation S or Rule 144A. |
| (b) | Non-income producing security. |
| (c) | Registered investment company advised by State Street Global Advisors. The rate shown is the 7 day yield as of April 30, 2022. |
| (d) | The rate shown is the discount yield at the time of purchase. |
| (e) | All or a portion of the security has been designated as collateral for swap contracts. |
| (f) | See accompanying Notes to Financial Statements for tax unrealized appreciation/(depreciation) of securities. |
| AUD | Australian Dollar |
| BRL | Brazilian Real |
See accompanying Notes to Financial Statements.
| 10 | 2022 Semi-Annual Report |
Statement of Investments (continued)
April 30, 2022 (Unaudited)
abrdn Global Absolute Return Strategies Fund
| CAD | Canadian Dollar |
| CHF | Swiss Franc |
| CNY | Chinese Yuan Renminbi |
| DKK | Danish Krone |
| ETF | Exchange-Traded Fund |
| EUR | Euro Currency |
| GBP | British Pound Sterling |
| HKD | Hong Kong Dollar |
| IDR | Indonesian Rupiah |
| INR | Indian Rupee |
| JPY | Japanese Yen |
| KRW | South Korean Won |
| MXN | Mexican Peso |
| NOK | Norwegian Krone |
| PLC | Public Limited Company |
| SEK | Swedish Krona |
| SGD | Singapore Dollar |
| TWD | New Taiwan Dollar |
| USD | U.S. Dollar |
| ZAR | South African Rand |
At April 30, 2022, the Fund held the following futures contracts:
| Futures Contracts | Number of Contracts Long/(Short) | Expiration Date | Notional Amount | Market Value | Unrealized Appreciation/ (Depreciation) | |||||||||||||
| LONG CONTRACT POSITIONS | ||||||||||||||||||
| FTSE 100 Index | 46 | 06/17/2022 | $ | 4,267,209 | $ | 4,345,724 | $ | 78,515 | ||||||||||
| United States Treasury Note 6%—10 year Ultra | 72 | 06/21/2022 | 9,347,738 | 9,288,000 | (59,738 | ) | ||||||||||||
| $ | 18,777 | |||||||||||||||||
| SHORT CONTRACT POSITIONS | ||||||||||||||||||
| MSCI Emerging Market Index Future | (83 | ) | 06/17/2022 | $ | (4,321,089 | ) | $ | (4,388,211 | ) | $ | (67,122 | ) | ||||||
| S&P 500 (E-Mini) Future | (40 | ) | 06/17/2022 | (8,899,384 | ) | (8,255,000 | ) | 644,384 | ||||||||||
| $ | 577,262 | |||||||||||||||||
| $ | 596,039 | |||||||||||||||||
At April 30, 2022, the Fund's open forward foreign currency exchange contracts were as follows:
| Purchase Contracts Settlement Date* | Counterparty | Amount Purchased | Amount Sold | Fair Value | Unrealized Appreciation/ (Depreciation) | |||||||||||
| Australian Dollar/United States Dollar | ||||||||||||||||
| 05/03/2022 | Goldman Sachs & Co. | AUD | 721,000 | USD 540,996 | $ | 509,423 | $ | (31,573 | ) | |||||||
| 05/03/2022 | HSBC Bank plc | AUD | 1,280,000 | USD 907,904 | 904,384 | (3,520 | ) | |||||||||
| 08/03/2022 | JPMorgan Chase Bank N.A. | AUD | 1,523,000 | USD 1,096,427 | 1,077,734 | (18,693 | ) | |||||||||
| Brazilian Real/United States Dollar | ||||||||||||||||
| 05/03/2022 | Citibank N.A. | BRL | 2,750,000 | USD 507,670 | 556,235 | 48,565 | ||||||||||
| 05/03/2022 | JPMorgan Chase Bank N.A. | BRL | 2,750,000 | USD 559,045 | 556,235 | (2,810 | ) | |||||||||
| 05/10/2022 | Goldman Sachs & Co. | BRL | 1,100,000 | USD 221,701 | 222,023 | 322 | ||||||||||
| British Pound/United States Dollar | ||||||||||||||||
| 05/03/2022 | Barclays Bank plc | GBP | 1,081,000 | USD 1,375,174 | 1,359,304 | (15,870 | ) | |||||||||
| 05/10/2022 | Barclays Bank plc | GBP | 250,000 | USD 330,029 | 314,357 | (15,672 | ) | |||||||||
| 06/07/2022 | Citibank N.A. | GBP | 83,316 | USD 109,016 | 104,762 | (4,254 | ) | |||||||||
| 06/07/2022 | Goldman Sachs & Co. | GBP | 1,088,000 | USD1,433,663 | 1,368,068 | (65,595 | ) | |||||||||
| 07/06/2022 | Citibank N.A. | GBP | 2,187,963 | USD2,820,000 | 2,751,600 | (68,400 | ) | |||||||||
| 08/03/2022 | JPMorgan Chase Bank N.A. | GBP | 1,081,000 | USD1,349,650 | 1,359,794 | 10,144 | ||||||||||
| Canadian Dollar/United States Dollar | ||||||||||||||||
| 05/03/2022 | Citibank N.A. | CAD | 1,150,000 | USD 906,097 | 895,182 | (10,915 | ) | |||||||||
| 05/03/2022 | Royal Bank of Canada | CAD | 690,000 | USD 549,244 | 537,109 | (12,135 | ) | |||||||||
| 05/10/2022 | JPMorgan Chase Bank N.A. | CAD | 320,000 | USD 255,908 | 249,088 | (6,820 | ) | |||||||||
| 08/03/2022 | Barclays Bank plc | CAD | 1,434,000 | USD 1,125,104 | 1,115,853 | (9,251 | ) | |||||||||
See accompanying Notes to Financial Statements.
| 2022 Semi-Annual Report | 11 |
Statement of Investments (continued)
April 30, 2022 (Unaudited)
abrdn Global Absolute Return Strategies Fund
| Purchase Contracts Settlement Date* | Counterparty | Amount Purchased | Amount Sold | Fair Value | Unrealized Appreciation/ (Depreciation) | |||||||||||
| Chinese Renminbi/United States Dollar | ||||||||||||||||
| 05/10/2022 | Citibank N.A. | CNY | 700,000 | USD | 109,562 | $ | 106,060 | $ | (3,502 | ) | ||||||
| 05/10/2022 | HSBC Bank plc | CNY | 17,010,000 | USD | 2,606,760 | 2,577,262 | (29,498 | ) | ||||||||
| 05/10/2022 | JPMorgan Chase Bank N.A. | CNY | 1,400,000 | USD | 213,002 | 212,120 | (882 | ) | ||||||||
| 05/11/2022 | Citibank N.A. | CNY | 749,000 | USD | 117,261 | 113,428 | (3,833 | ) | ||||||||
| 05/11/2022 | Goldman Sachs & Co. | CNY | 9,081,000 | USD | 1,371,915 | 1,375,224 | 3,309 | |||||||||
| Euro/United States Dollar | ||||||||||||||||
| 05/03/2022 | Barclays Bank plc | EUR | 89,900 | USD | 99,763 | 94,840 | (4,923 | ) | ||||||||
| 05/03/2022 | HSBC Bank plc | EUR | 1,297,100 | USD | 1,387,471 | 1,368,376 | (19,095 | ) | ||||||||
| 05/10/2022 | Barclays Bank plc | EUR | 470,000 | USD | 520,120 | 495,949 | (24,171 | ) | ||||||||
| 05/10/2022 | HSBC Bank plc | EUR | 140,000 | USD | 154,314 | 147,730 | (6,584 | ) | ||||||||
| 05/10/2022 | JPMorgan Chase Bank N.A. | EUR | 530,000 | USD | 593,885 | 559,262 | (34,623 | ) | ||||||||
| 05/10/2022 | Royal Bank of Canada | EUR | 150,000 | USD | 164,225 | 158,282 | (5,943 | ) | ||||||||
| 08/03/2022 | Citibank N.A. | EUR | 1,297,100 | USD | 1,370,295 | 1,374,921 | 4,626 | |||||||||
| Hong Kong Dollar/United States Dollar | ||||||||||||||||
| 05/10/2022 | Barclays Bank plc | HKD | 2,200,000 | USD | 280,383 | 280,395 | 12 | |||||||||
| 05/10/2022 | HSBC Bank plc | HKD | 3,000,000 | USD | 382,325 | 382,356 | 31 | |||||||||
| 05/10/2022 | JPMorgan Chase Bank N.A. | HKD | 2,840,000 | USD | 361,965 | 361,964 | (1 | ) | ||||||||
| Indian Rupee/United States Dollar | ||||||||||||||||
| 05/10/2022 | Goldman Sachs & Co. | INR | 12,000,000 | USD | 156,205 | 156,794 | 589 | |||||||||
| 05/10/2022 | HSBC Bank plc | INR | 11,000,000 | USD | 143,118 | 143,728 | 610 | |||||||||
| 05/10/2022 | JPMorgan Chase Bank N.A. | INR | 23,000,000 | USD | 299,733 | 300,523 | 790 | |||||||||
| Indonesian Rupiah/United States Dollar | ||||||||||||||||
| 05/10/2022 | Goldman Sachs & Co. | IDR | 19,789,774,990 | USD | 1,378,791 | 1,365,095 | (13,696 | ) | ||||||||
| 05/10/2022 | HSBC Bank plc | IDR | 19,789,774,990 | USD | 1,366,698 | 1,365,095 | (1,603 | ) | ||||||||
| Japanese Yen/United States Dollar | ||||||||||||||||
| 05/10/2022 | JPMorgan Chase Bank N.A. | JPY | 26,000,000 | USD | 211,776 | 200,372 | (11,404 | ) | ||||||||
| 05/10/2022 | Royal Bank of Canada | JPY | 87,000,000 | USD | 720,381 | 670,476 | (49,905 | ) | ||||||||
| Mexican Peso/United States Dollar | ||||||||||||||||
| 05/10/2022 | Barclays Bank plc | MXN | 10,900,000 | USD | 513,742 | 533,391 | 19,649 | |||||||||
| New Taiwan Dollar/United States Dollar | ||||||||||||||||
| 05/10/2022 | Citibank N.A. | TWD | 10,000,000 | USD | 341,858 | 339,902 | (1,956 | ) | ||||||||
| 05/10/2022 | Goldman Sachs & Co. | TWD | 10,200,000 | USD | 348,336 | 346,700 | (1,636 | ) | ||||||||
| 06/16/2022 | HSBC Bank plc | TWD | 26,895,000 | USD | 921,062 | 916,765 | (4,297 | ) | ||||||||
| 06/23/2022 | HSBC Bank plc | TWD | 1,105,000 | USD | 37,866 | 37,688 | (178 | ) | ||||||||
| 07/07/2022 | HSBC Bank plc | TWD | 40,800,000 | USD | 1,387,283 | 1,393,141 | 5,858 | |||||||||
| Norwegian Krone/United States Dollar | ||||||||||||||||
| 05/03/2022 | Barclays Bank plc | NOK | 8,040,000 | USD | 906,225 | 857,202 | (49,023 | ) | ||||||||
| 05/03/2022 | Citibank N.A. | NOK | 4,620,000 | USD | 532,233 | 492,571 | (39,662 | ) | ||||||||
| 08/03/2022 | JPMorgan Chase Bank N.A. | NOK | 9,850,000 | USD | 1,070,642 | 1,050,782 | (19,860 | ) | ||||||||
| Singapore Dollar/United States Dollar | ||||||||||||||||
| 07/22/2022 | Citibank N.A. | SGD | 1,870,000 | USD | 1,368,463 | 1,352,367 | (16,096 | ) | ||||||||
| South African Rand/United States Dollar | ||||||||||||||||
| 05/10/2022 | Barclays Bank plc | ZAR | 17,472,493 | USD | 1,190,737 | 1,105,692 | (85,045 | ) | ||||||||
| 05/10/2022 | Citibank N.A. | ZAR | 47,052,664 | USD | 3,137,276 | 2,977,580 | (159,696 | ) | ||||||||
| 05/10/2022 | Goldman Sachs & Co. | ZAR | 2,200,000 | USD | 139,267 | 139,220 | (47 | ) | ||||||||
| 05/10/2022 | HSBC Bank plc | ZAR | 20,050,970 | USD | 1,369,489 | 1,268,863 | (100,626 | ) | ||||||||
| 05/10/2022 | JPMorgan Chase Bank N.A. | ZAR | 973,607 | USD | 66,406 | 61,612 | (4,794 | ) | ||||||||
See accompanying Notes to Financial Statements.
| 12 | 2022 Semi-Annual Report |
Statement of Investments (continued)
April 30, 2022 (Unaudited)
abrdn Global Absolute Return Strategies Fund
| Purchase Contracts Settlement Date* | Counterparty | Amount Purchased | Amount Sold | Fair Value | Unrealized Appreciation/ (Depreciation) | ||||||||||
| South Korean Won/United States Dollar | |||||||||||||||
| 05/10/2022 | Barclays Bank plc | KRW | 180,000,000 | USD | 143,611 | $ | 142,529 | $ | (1,082 | ) | |||||
| 05/10/2022 | Citibank N.A. | KRW | 340,000,000 | USD | 271,288 | 269,222 | (2,066 | ) | |||||||
| 05/10/2022 | JPMorgan Chase Bank N.A. | KRW | 170,000,000 | USD | 135,653 | 134,611 | (1,042 | ) | |||||||
| 06/17/2022 | JPMorgan Chase Bank N.A. | KRW | 1,390,000,000 | USD | 1,144,070 | 1,100,912 | (43,158 | ) | |||||||
| Swedish Krona/United States Dollar | |||||||||||||||
| 06/17/2022 | Citibank N.A. | SEK | 10,740,000 | USD | 1,143,184 | 1,095,230 | (47,954 | ) | |||||||
| $ | 43,307,383 | $ | (958,884 | ) | |||||||||||
| Sale Contracts Settlement Date* | Counterparty | Amount Purchased | Amount Sold | Fair Value | Unrealized Appreciation/ (Depreciation) | ||||||||||
| United States Dollar/Australian Dollar | |||||||||||||||
| 05/03/2022 | JPMorgan Chase Bank N.A. | USD | 1,445,464 | AUD | 2,001,000 | $ | 1,413,807 | $ | 31,657 | ||||||
| 08/03/2022 | Citibank N.A. | USD | 1,083,698 | AUD | 1,523,000 | 1,077,734 | 5,964 | ||||||||
| United States Dollar/Brazilian Real | |||||||||||||||
| 05/03/2022 | Citibank N.A. | USD | 559,045 | BRL | 2,750,000 | 556,235 | 2,810 | ||||||||
| 05/03/2022 | JPMorgan Chase Bank N.A. | USD | 533,808 | BRL | 2,750,000 | 556,235 | (22,427 | ) | |||||||
| United States Dollar/British Pound | |||||||||||||||
| 05/03/2022 | Citibank N.A. | USD | 1,034,015 | GBP | 767,000 | 964,464 | 69,551 | ||||||||
| 05/03/2022 | Goldman Sachs & Co. | USD | 413,808 | GBP | 314,000 | 394,839 | 18,969 | ||||||||
| 05/10/2022 | Citibank N.A. | USD | 315,748 | GBP | 236,000 | 296,753 | 18,995 | ||||||||
| 06/07/2022 | Citibank N.A. | USD | 1,480,331 | GBP | 1,088,000 | 1,368,068 | 112,263 | ||||||||
| 07/06/2022 | Citibank N.A. | USD | 2,858,972 | GBP | 2,187,963 | 2,751,600 | 107,372 | ||||||||
| 08/03/2022 | Barclays Bank plc | USD | 1,375,682 | GBP | 1,081,000 | 1,359,794 | 15,888 | ||||||||
| United States Dollar/Canadian Dollar | |||||||||||||||
| 05/03/2022 | Barclays Bank plc | USD | 1,125,565 | CAD | 1,434,000 | 1,116,253 | 9,312 | ||||||||
| 05/03/2022 | JPMorgan Chase Bank N.A. | USD | 320,624 | CAD | 406,000 | 316,038 | 4,586 | ||||||||
| 05/10/2022 | HSBC Bank plc | USD | 253,741 | CAD | 317,047 | 246,790 | 6,951 | ||||||||
| 08/03/2022 | JPMorgan Chase Bank N.A. | USD | 1,115,091 | CAD | 1,434,000 | 1,115,853 | (762 | ) | |||||||
| United States Dollar/Chinese Renminbi | |||||||||||||||
| 05/10/2022 | Goldman Sachs & Co. | USD | 142,151 | CNY | 910,000 | 137,878 | 4,273 | ||||||||
| 05/10/2022 | HSBC Bank plc | USD | 2,642,133 | CNY | 16,800,000 | 2,545,444 | 96,689 | ||||||||
| 05/11/2022 | HSBC Bank plc | USD | 1,087,024 | CNY | 6,970,000 | 1,055,535 | 31,489 | ||||||||
| 05/11/2022 | JPMorgan Chase Bank N.A. | USD | 446,457 | CNY | 2,860,000 | 433,118 | 13,339 | ||||||||
| 05/16/2022 | HSBC Bank plc | USD | 1,512,382 | CNY | 9,652,020 | 1,459,674 | 52,708 | ||||||||
| 05/20/2022 | HSBC Bank plc | USD | 1,535,232 | CNY | 9,800,000 | 1,481,261 | 53,971 | ||||||||
| 05/25/2022 | HSBC Bank plc | USD | 1,519,522 | CNY | 9,702,000 | 1,465,470 | 54,052 | ||||||||
| 06/10/2022 | HSBC Bank plc | USD | 1,572,190 | CNY | 10,045,980 | 1,514,600 | 57,590 | ||||||||
| 06/17/2022 | HSBC Bank plc | USD | 2,343,409 | CNY | 15,141,000 | 2,281,701 | 61,708 | ||||||||
| 06/24/2022 | HSBC Bank plc | USD | 2,437,813 | CNY | 15,759,000 | 2,373,729 | 64,084 | ||||||||
| 07/08/2022 | HSBC Bank plc | USD | 1,484,772 | CNY | 9,843,000 | 1,481,260 | 3,512 | ||||||||
| 07/15/2022 | HSBC Bank plc | USD | 1,425,922 | CNY | 9,457,000 | 1,422,558 | 3,364 | ||||||||
| United States Dollar/Danish Krone | |||||||||||||||
| 05/10/2022 | JPMorgan Chase Bank N.A. | USD | 148,532 | DKK | 1,000,000 | 141,855 | 6,677 | ||||||||
See accompanying Notes to Financial Statements.
| 2022 Semi-Annual Report | 13 |
Statement of Investments (continued)
April 30, 2022 (Unaudited)
abrdn Global Absolute Return Strategies Fund
| Sale Contracts Settlement Date* | Counterparty | Amount Purchased | Amount Sold | Fair Value | Unrealized Appreciation/ (Depreciation) | ||||||||||
| United States Dollar/Euro | |||||||||||||||
| 05/03/2022 | Barclays Bank plc | USD | 1,101,948 | EUR | 977,000 | $ | 1,030,686 | $ | 71,262 | ||||||
| 05/03/2022 | Royal Bank of Canada | USD | 450,564 | EUR | 410,000 | 432,530 | 18,034 | ||||||||
| 05/10/2022 | HSBC Bank plc | USD | 347,481 | EUR | 310,000 | 327,115 | 20,366 | ||||||||
| 05/10/2022 | JPMorgan Chase Bank N.A. | USD | 592,470 | EUR | 520,000 | 548,710 | 43,760 | ||||||||
| 05/10/2022 | Royal Bank of Canada | USD | 10,220,911 | EUR | 9,027,207 | 9,525,611 | 695,300 | ||||||||
| 08/03/2022 | HSBC Bank plc | USD | 1,394,195 | EUR | 1,297,100 | 1,374,921 | 19,274 | ||||||||
| United States Dollar/Indian Rupee | |||||||||||||||
| 07/22/2022 | Citibank N.A. | USD | 1,812,415 | INR | 140,000,000 | 1,814,741 | (2,326 | ) | |||||||
| United States Dollar/Indonesian Rupiah | |||||||||||||||
| 05/10/2022 | Goldman Sachs & Co. | USD | 1,366,698 | IDR | 19,789,774,990 | 1,365,095 | 1,603 | ||||||||
| 05/10/2022 | HSBC Bank plc | USD | 1,366,634 | IDR | 19,789,774,990 | 1,365,095 | 1,539 | ||||||||
| United States Dollar/Japanese Yen | |||||||||||||||
| 05/10/2022 | HSBC Bank plc | USD | 579,461 | JPY | 67,000,000 | 516,344 | 63,117 | ||||||||
| 07/22/2022 | Barclays Bank plc | USD | 1,828,905 | JPY | 234,000,000 | 1,809,002 | 19,903 | ||||||||
| United States Dollar/Mexican Peso | |||||||||||||||
| 05/10/2022 | Barclays Bank plc | USD | 193,031 | MXN | 3,900,000 | 190,846 | 2,185 | ||||||||
| 05/10/2022 | HSBC Bank plc | USD | 335,720 | MXN | 7,000,000 | 342,545 | (6,825 | ) | |||||||
| United States Dollar/New Taiwan Dollar | |||||||||||||||
| 06/16/2022 | HSBC Bank plc | USD | 940,286 | TWD | 26,895,000 | 916,765 | 23,521 | ||||||||
| 06/23/2022 | HSBC Bank plc | USD | 936,982 | TWD | 26,756,450 | 912,568 | 24,414 | ||||||||
| 06/28/2022 | HSBC Bank plc | USD | 976,388 | TWD | 27,848,550 | 950,206 | 26,182 | ||||||||
| 07/07/2022 | HSBC Bank plc | USD | 1,432,131 | TWD | 40,800,000 | 1,393,141 | 38,990 | ||||||||
| United States Dollar/Nowegian Krone | |||||||||||||||
| 05/03/2022 | Citibank N.A. | USD | 317,317 | NOK | 2,810,000 | 299,594 | 17,723 | ||||||||
| 05/03/2022 | JPMorgan Chase Bank N.A. | USD | 1,070,071 | NOK | 9,850,000 | 1,050,179 | 19,892 | ||||||||
| 05/10/2022 | Barclays Bank plc | USD | 32,945 | NOK | 288,214 | 30,729 | 2,216 | ||||||||
| 05/10/2022 | HSBC Bank plc | USD | 138,745 | NOK | 1,217,879 | 129,847 | 8,898 | ||||||||
| 08/03/2022 | Citibank N.A. | USD | 1,045,942 | NOK | 9,850,000 | 1,050,782 | (4,840 | ) | |||||||
| United States Dollar/Singapore Dollar | |||||||||||||||
| 07/22/2022 | JPMorgan Chase Bank N.A. | USD | 1,355,141 | SGD | 1,870,000 | 1,352,367 | 2,774 | ||||||||
| United States Dollar/South African Rand | |||||||||||||||
| 05/10/2022 | JPMorgan Chase Bank N.A. | USD | 5,499,774 | ZAR | 85,549,734 | 5,413,747 | 86,027 | ||||||||
| United States Dollar/South Korean Won | |||||||||||||||
| 06/17/2022 | HSBC Bank plc | USD | 1,090,385 | KRW | 1,390,000,000 | 1,100,912 | (10,527 | ) | |||||||
| United States Dollar/Swedish Krona | |||||||||||||||
| 06/17/2022 | Citibank N.A. | USD | 1,092,462 | SEK | 10,740,000 | 1,095,230 | (2,768 | ) | |||||||
| United States Dollar/Swiss Franc | |||||||||||||||
| 05/10/2022 | JPMorgan Chase Bank N.A. | USD | 336,519 | CHF | 310,000 | 318,780 | 17,739 | ||||||||
| $ | 67,986,634 | $ | 2,082,018 | ||||||||||||
See accompanying Notes to Financial Statements.
| 14 | 2022 Semi-Annual Report |
Statement of Investments (continued)
April 30, 2022 (Unaudited)
abrdn Global Absolute Return Strategies Fund
At April 30, 2022, the Fund's open forward foreign cross currency contracts were as follows:
| Purchase / Sale Settlement Date | Counterparty | Amount Purchased | Amount Sold | Contract Value | Fair Value | Unrealized Appreciation/ (Depreciation) | ||||||||||||
| British Pound / Japanese Yen | ||||||||||||||||||
| 06/07/2022 | Citibank N.A. | GBP | 2,392,762 | JPY | 386,900,000 | $ | 3,128,774 | $ | 3,152,988 | $ | 24,214 | |||||||
| Japanese Yen / British Pound | ||||||||||||||||||
| 06/07/2022 | HSBC Bank plc | JPY | 386,900,000 | GBP | 2,476,077 | 3,364,348 | 3,235,372 | (128,976 | ) | |||||||||
| $ | 6,388,360 | $ | (104,762 | ) | ||||||||||||||
| Unrealized appreciation on forward foreign currency exchange contracts | $ | 2,251,212 | ||||||||||||||||
| Unrealized depreciation on forward foreign currency exchange contracts | (1,232,840 | ) | ||||||||||||||||
* Certain contracts with different trade dates and like characteristics have been shown net.
At April 30, 2022, the Fund held the following centrally cleared credit default swaps:
| Expiration Date | Notional Amount | Credit Index | Fixed Rate | Implied Credit Spread* | Frequency of Payments Made | Premiums Paid (Received) | Value | Unrealized Appreciation/ (Depreciation) | ||||||||||||||
| Buy Protection: | ||||||||||||||||||||||
| 06/20/2027 | 2,851,210 | CDX.NA.HYCDX.NA.HY | Equal to (5.00)% | 4.65% | Quarterly | $ | (110,342 | ) | $ | (57,844 | ) | $ | 52,498 | |||||||||
| 06/20/2027 | 2,030,000 | iTraxx Europe Crossover | Equal to (5.00)% | N/A | Quarterly | (66,961 | ) | (11,897 | ) | 55,064 | ||||||||||||
| 06/20/2027 | 1,912,000 | iTraxx Europe Sub Financials | Equal to (1.00)% | 1.97% | Quarterly | 95,052 | (2,241 | ) | (97,293 | ) | ||||||||||||
| $ | (82,251 | ) | $ | (71,982 | ) | $ | 10,269 | |||||||||||||||
| Sell Protection: | ||||||||||||||||||||||
| 06/20/2027 | 2,851,210 | CDX.NA.HY | Equal to 5.00% | 4.65% | Quarterly | $ | 131,726 | $ | 57,844 | $ | (73,882 | ) | ||||||||||
| 06/20/2027 | 1,912,000 | iTraxx Europe Sub Financials | Equal to 1.00% | 1.97% | Quarterly | (61,264 | ) | (91,046 | ) | (29,782 | ) | |||||||||||
| $ | 70,462 | $ | (33,202 | ) | $ | (103,664 | ) | |||||||||||||||
| * | Implied credit spreads, represented in absolute terms, are utilized in determining the market value of credit default swap agreements on corporate issues or sovereign issues and serve as an indicator of the current status of the payment/performance risk and represent the likelihood or risk of default for the credit derivative. The implied credit spread of a particular referenced entity reflects the cost of buying/selling protection and may include upfront payments required to be made prior to entering into the agreement. For credit default swaps with asset-backed securities or credit indices as the underlying assets, the quoted market prices and resulting market values serve as an indicator of the current status of the payment/performance risk. Wider credit spreads and increasing market values, in absolute terms when compared to the notional amount of the swap, represent a deterioration of the reference entity's credit soundness and a greater likelihood or risk of default or other credit event occurring as defined under the terms of the agreement. |
At April 30, 2022, the Fund held the following centrally cleared interest rate swaps:
| Currency | Notional Amount | Expiration Date | Receive (Pay) Floating Rate | Floating Rate Index | Fixed Rate | Frequency of Payments Made | Premiums Paid (Received) | Value | Unrealized Appreciation/ (Depreciation) | ||||||||||||||
| USD | 35,500 | 09/02/2050 | Receive | 12-month CPI | 2.06% | Annually | $ | — | $ | 9,918 | $ | 9,918 | |||||||||||
| USD | 35,500 | 09/02/2050 | Receive | 12-month CPI | 2.06% | Annually | — | 9,943 | 9,943 | ||||||||||||||
| $ | — | $ | 19,861 | $ | 19,861 | ||||||||||||||||||
| USD | 35,500 | 09/02/2050 | Pay | 12-month CPI | 1.00% | Annually | $ | 991 | $ | (9,918 | ) | $ | (10,909 | ) | |||||||||
| USD | 35,500 | 09/02/2050 | Pay | 12-month CPI | 1.00% | Annually | 955 | (9,943 | ) | (10,898 | ) | ||||||||||||
| $ | 1,946 | $ | (19,861 | ) | $ | (21,807 | ) | ||||||||||||||||
| $ | 1,946 | $ | — | $ | (1,946 | ) | |||||||||||||||||
See accompanying Notes to Financial Statements.
| 2022 Semi-Annual Report | 15 |
Statement of Investments (continued)
April 30, 2022 (Unaudited)
abrdn Global Absolute Return Strategies Fund
At April 30, 2022, the Fund held the following over-the-counter total return swaps:
| Currency | Notional Amount | Expiration Date | Receive (Pay) Total Return of Equity Index | Equity Index | Floating Rate Index | Frequency of Payments Made | Value | Unrealized Appreciation/ (Depreciation) | ||||||||||||
| USD | 1,663,402 | 02/24/2023 | Receive | MSCI World Quality Index | 1-month SOFR | Monthly | $ | (39,462 | ) | $ | (39,462 | ) | ||||||||
| USD | 5,599,644 | 03/31/2023 | Receive | MSCI World Index | 1-month SOFR | Monthly | 1,179 | 1,179 | ||||||||||||
| USD | 3,439,714 | 12/16/2022 | Receive | MSCI World Index | 3-month SOFR | Quarterly | 160,394 | 160,394 | ||||||||||||
| USD | 1,449,193 | 02/24/2023 | Receive | MSCI World Index | 1-month SOFR | Monthly | 40,835 | 40,835 | ||||||||||||
| USD | 3,076,268 | 10/11/2022 | Pay | S&P 500 Low Volatility Net Total Return Index | 1-month SOFR | Monthly | (129,407 | ) | (129,407 | ) | ||||||||||
| USD | 5,470,845 | 03/31/2023 | Pay | MSCI World Quality Index | 1-month SOFR | Monthly | (2,112 | ) | (2,112 | ) | ||||||||||
| USD | 5,717,353 | 10/06/2022 | Pay | S&P 500 Low Volatility Net Total Return Index | 1-month SOFR | Monthly | (248,076 | ) | (248,076 | ) | ||||||||||
| USD | 3,277,210 | 12/16/2022 | Pay | MSCI World Quality Index | 3-month SOFR | Quarterly | (152,298 | ) | (152,298 | ) | ||||||||||
| $ | (368,947 | ) | $ | (368,947 | ) | |||||||||||||||
At April 30, 2022, the Fund held the following purchased options:
| Description | Expiration Date | Exercise Price | Contracts | Notional Amount | Cost | Value | Unrealized Value | ||||||||||
| CALL OPTIONS PURCHASED (0.5%) | |||||||||||||||||
| Index Options (0.5%) | |||||||||||||||||
| CBOE Volatility Index | 05/18/2022 | 28 | 161 | 450,800 | $61,265 | $ | 91,287 | $ | 30,022 | ||||||||
| CBOE Volatility Index | 06/15/2022 | 35 | 219 | 766,500 | 85,357 | 81,030 | (4,327 | ) | |||||||||
| CBOE Volatility Index | 07/20/2022 | 24 | 90 | 216,000 | 47,652 | 73,710 | 26,058 | ||||||||||
| CBOE Volatility Index | 07/20/2022 | 30 | 21 | 63,000 | 7,791 | 11,487 | 3,696 | ||||||||||
| $ | 257,514 | $ | 55,449 | ||||||||||||||
At April 30, 2022, the Fund held the following written options:
| Description | Notional Amount | Cost | Value | Unrealized Value | ||||||||||
| CALL OPTIONS WRITTEN (0.2%) | ||||||||||||||
| Swaption (0.2%) | ||||||||||||||
| 10 year Interest Rate Swap Call, expiring 10/13/2022, Pay 2.1%, Receive SOFR | (26,355,000 | ) | $(134,285 | ) | $ | (94,738 | ) | $ | 39,547 | |||||
| Description | Expiration Date | Exercise Price | Contracts | Notional Amount | Cost | Value | Unrealized Value | |||||||||||||||
| PUT OPTIONS WRITTEN (0.8%) | ||||||||||||||||||||||
| Index Options (0.4%) | ||||||||||||||||||||||
| CAC 40 Index | 05/20/2022 | 6,250 | (8 | ) | (500,000 | ) | $ | (10,203 | ) | $ | (7,375 | ) | $ | 2,828 | ||||||||
| DAX Index | 05/20/2022 | 13,550 | (8 | ) | (542,000 | ) | (10,652 | ) | (7,727 | ) | 2,926 | |||||||||||
| FTSE 100 Index | 05/20/2022 | 7,000 | (6 | ) | (420,000 | ) | (4,129 | ) | (1,962 | ) | 2,167 | |||||||||||
| Nikkei 225 Index | 05/13/2022 | 25,875 | (4 | ) | (103,500,000 | ) | (7,968 | ) | (5,548 | ) | 2,420 | |||||||||||
| S&P 500 Index | 05/20/2022 | 4,250 | (4 | ) | (1,700,000 | ) | (16,756 | ) | (69,172 | ) | (52,416 | ) | ||||||||||
| S&P 500 Index | 05/31/2022 | 3,960 | (6 | ) | (2,376,000 | ) | (60,710 | ) | (47,220 | ) | 13,490 | |||||||||||
| S&P 500 Index | 06/30/2022 | 4,100 | (6 | ) | (2,460,000 | ) | (36,648 | ) | (98,310 | ) | (61,662 | ) | ||||||||||
| S&PASX 200 Index | 05/19/2022 | 6,950 | (17 | ) | (1,181,500 | ) | (4,184 | ) | (2,402 | ) | 1,781 | |||||||||||
| $ | (239,716 | ) | $ | (88,466 | ) | |||||||||||||||||
See accompanying Notes to Financial Statements.
| 16 | 2022 Semi-Annual Report |
Statement of Investments (concluded)
April 30, 2022 (Unaudited)
abrdn Global Absolute Return Strategies Fund
| Description | Notional Amount | Cost | Value | Unrealized Value | ||||||||||
| Swaption (0.4%) | ||||||||||||||
| 10 year Interest Rate Swap Put, expiring 10/13/2022, Pay SOFR, Receive 3.1% | (38,905,000 | ) | $(144,325 | ) | $ | (204,261 | ) | $ | (59,936 | ) | ||||
| $ | (443,977 | ) | $ | (148,402 | ) | |||||||||
See accompanying Notes to Financial Statements.
| 2022 Semi-Annual Report | 17 |
abrdn Global High Income Fund (Unaudited)
| Average Annual Total Return1 (For periods ended April 30, 2022) | Six Month† | 1 Yr. | 5 Yr. | 10 Yr. | |||||||
| Class A | w/o SC | (8.10%) | (7.08%) | 2.77% | 3.50% | ||||||
| w/ SC2 | (10.82%) | (9.90%) | 2.14% | 3.18% | |||||||
| Institutional Class3 | w/o SC | (8.02%) | (6.88%) | 3.02% | 3.75% |
| † | Not annualized |
| 1 | Returns prior to December 3, 2021 reflect the performance of a predecessor fund (the "Predecessor Fund"). Returns of the Predecessor Fund have not been adjusted to reflect the expenses applicable to the respective classes. The Fund and the Predecessor Fund have substantially similar investment objectives and strategies. Please consult the Fund's prospectus for more detail |
| 2 | A 3.00% front-end sales charge was deducted. |
| 3 | Not subject to any sales charges. |
Performance of a $10,000 Investment (as of April 30, 2022)

Comparative performance of $10,000 invested in Class A shares of the abrdn Global High Income Fund, the ICE Bank of America Merrill Lynch Global High Yield Constrained Index (Hedged to USD) and the Consumer Price Index (CPI) over a 10-year period ended April 30, 2022. Unlike the Fund's returns, the returns for these unmanaged indexes do not reflect any fees or expenses. Investors cannot invest directly in market indexes.
The ICE Bank of America (BofA) Merrill Lynch Global High Yield Constrained Index (Hedged to the USD) tracks the performance of USD, CAD, GBP and EUR denominated below investment grade corporate debt publicly issued in the major domestic or eurobond markets but caps issuer exposure at 2%.
The CPI is a measure of the average change over time in the prices paid by urban consumers for a market basket of consumer goods and services.
Investment return and principal value will fluctuate, and when redeemed, shares may be worth more or less than original cost. Past performance is no guarantee of future results. The Average Annual Total Return table and performance graph do not reflect the deduction of taxes that a shareholder would pay on Fund distributions or the redemption of Fund shares. Investing in mutual funds involves market risk, including loss of principal. Performance returns assume the reinvestment of all distributions. Performance returns reflect fee waivers and reimbursements in effect without which returns would have been lower.
| 18 | 2022 Semi-Annual Report |
abrdn Global High Income Fund (Unaudited)
Portfolio Summary (as a percentage of net assets)
April 30, 2022 (Unaudited)
| Asset Allocation | |||
| Corporate Bonds | 92.0 | % | |
| Short-Term Investment | 5.4 | % | |
| Other Assets in Excess of Liabilities | 2.6 | % | |
| 100.0 | % | ||
| Top Holdings | |||
| Ford Motor Co. 04/22/2025 | 1.4 | % | |
| SoftBank Group Corp., (fixed rate to 07/19/2023, variable rate thereafter), VRN 07/19/2023 | 1.4 | % | |
| Six Flags Theme Parks, Inc. 07/01/2025 | 1.3 | % | |
| Ball Corp. 08/15/2030 | 1.2 | % | |
| Affinity Gaming 12/15/2027 | 1.0 | % | |
| SunCoke Energy, Inc. 06/30/2029 | 1.0 | % | |
| Petroleos Mexicanos 02/12/2028 | 1.0 | % | |
| CCO Holdings LLC / CCO Holdings Capital Corp. 02/01/2031 | 1.0 | % | |
| Graphic Packaging International LLC 02/01/2030 | 0.9 | % | |
| Howmet Aerospace, Inc. 02/01/2037 | 0.9 | % | |
| Countries | |||
| United States | 55.6 | % | |
| United Kingdom | 6.1 | % | |
| Germany | 4.2 | % | |
| Luxembourg | 3.9 | % | |
| Mexico | 2.6 | % | |
| Canada | 2.5 | % | |
| Netherlands | 2.3 | % | |
| Other, less than 2% each | 14.8 | % | |
| Short-Term Investment | 5.4 | % | |
| Other Assets in Excess of Liabilities | 2.6 | % | |
| 100.0 | % | ||
| 2022 Semi-Annual Report | 19 |
Statement of Investments
April 30, 2022 (Unaudited)
abrdn Global High Income Fund
| Shares or Principal Amount | Value (US$) | |||||||
| CORPORATE BONDS (92.0%) | ||||||||
| ARGENTINA (0.5%) | ||||||||
| Energy Equipment & Services (0.5%) | ||||||||
| Transportadora de Gas del Sur SA (USD), 6.75%, 05/02/2025 (a) | $ | 575,000 | $ | 540,675 | ||||
| BERMUDA (0.3%) | ||||||||
| Insurance (0.3%) | ||||||||
| Highlands Holdings Bond Issuer Ltd. / Highlands Holdings Bond Co-Issuer, Inc., PIK (USD), 7.63%, 10/15/2025 (a)(b) | 313,140 | 317,837 | ||||||
| BRAZIL (1.7%) | ||||||||
| Chemicals (0.7%) | ||||||||
| Braskem Netherlands Finance BV (USD), 4.50%, 01/10/2028 (a) | 810,000 | 762,866 | ||||||
| Healthcare Providers & Services (0.5%) | ||||||||
| Rede D'or Finance Sarl | ||||||||
| (USD), 4.95%, 01/17/2028 (a) | 380,000 | 356,725 | ||||||
| (USD), 4.50%, 01/22/2030 (a) | 204,000 | 178,276 | ||||||
| 535,001 | ||||||||
| Oil, Gas & Consumable Fuels (0.5%) | ||||||||
| Petrobras Global Finance BV (USD), 5.60%, 01/03/2031 | 536,000 | 526,084 | ||||||
| 1,823,951 | ||||||||
| CANADA (2.5%) | ||||||||
| Chemicals (0.5%) | ||||||||
| NOVA Chemicals Corp. (USD), 4.25%, 05/15/2029 (a) | 638,000 | 551,870 | ||||||
| Diversified Telecommunication Services (0.5%) | ||||||||
| Rogers Communications, Inc., (fixed rate to 3/15/2027, variable rate thereafter), VRN (USD), 5 year CMT + 3.590%, 5.25%, 03/15/2082 (a) | 589,000 | 552,809 | ||||||
| Environmental Control (0.8%) | ||||||||
| GFL Environmental, Inc. | ||||||||
| (USD), 5.13%, 12/15/2026 (a) | 562,000 | 552,390 | ||||||
| (USD), 4.75%, 06/15/2029 (a) | 367,000 | 333,052 | ||||||
| 885,442 | ||||||||
| Machinery-Diversified (0.7%) | ||||||||
| Titan Acquisition Ltd. / Titan Co-Borrower LLC (USD), 7.75%, 04/15/2026 (a) | 720,000 | 694,800 | ||||||
| 2,684,921 | ||||||||
| CHILE (0.4%) | ||||||||
| Media (0.4%) | ||||||||
| VTR Finance NV (USD), 6.38%, 07/15/2028 (a) | 442,000 | 403,329 | ||||||
| CHINA (0.5%) | ||||||||
| Real Estate (0.5%) | ||||||||
| China Evergrande Group (USD), 9.50%, 04/11/2022 (a) | 465,000 | 52,312 | ||||||
| Shares or Principal Amount | Value (US$) | |||||||
| CIFI Holdings Group Co. Ltd. | ||||||||
| (USD), 6.55%, 03/28/2024 (a) | $ | 202,000 | $ | 170,286 | ||||
| (USD), 4.45%, 08/17/2026 (a) | 200,000 | 152,000 | ||||||
| Kaisa Group Holdings Ltd. | ||||||||
| (USD), 9.75%, 09/28/2023 (a) | 230,000 | 46,288 | ||||||
| (USD), 9.38%, 06/30/2024 (a)(c) | 495,000 | 100,361 | ||||||
| Zhenro Properties Group Ltd. | ||||||||
| (USD), 7.88%, 04/14/2024 (a)(c) | 200,000 | 18,000 | ||||||
| (USD), 7.10%, 09/10/2024 (a)(c) | 429,000 | 38,610 | ||||||
| 577,857 | ||||||||
| EL SALVADOR (0.4%) | ||||||||
| Electric Utilities (0.4%) | ||||||||
| AES El Salvador Trust II (USD), 6.75%, 03/28/2023 (a) | 500,000 | 442,290 | ||||||
| FRANCE (1.0%) | ||||||||
| Diversified Telecommunication Services (0.5%) | ||||||||
| Iliad Holding SASU (USD), 6.50%, 10/15/2026 (a) | 532,000 | 511,364 | ||||||
| Electric Utilities (0.5%) | ||||||||
| Electricite de France SA, VRN (EUR), 12 year EUR Swap + 3.794%, 5.38%, 01/29/2025 (a)(d)(e) | 200,000 | 210,772 | ||||||
| Electricite de France SA, (fixed rate to 01/22/2026, variable rate thereafter), VRN (EUR), 12 year EUR Swap + 3.043%, 5.00%, 01/22/2026 (a)(d) | 300,000 | 309,853 | ||||||
| 520,625 | ||||||||
| 1,031,989 | ||||||||
| GERMANY (4.2%) | ||||||||
| Apparel (0.5%) | ||||||||
| CT Investment GmbH (EUR), 5.50%, 04/15/2026 (a) | 490,000 | 482,033 | ||||||
| Auto Parts & Equipment (0.9%) | ||||||||
| Schaeffler AG | ||||||||
| (EUR), 2.88%, 03/26/2027 (a) | 350,000 | 348,002 | ||||||
| (EUR), 3.38%, 10/12/2028 (a) | 200,000 | 192,548 | ||||||
| ZF Europe Finance BV | ||||||||
| (EUR), 2.00%, 02/23/2026 (a) | 200,000 | 189,060 | ||||||
| (EUR), 2.50%, 10/23/2027 (a) | 300,000 | 271,781 | ||||||
| 1,001,391 | ||||||||
| Building Materials (0.4%) | ||||||||
| HT Troplast GmbH (EUR), 9.25%, 07/15/2025 (a) | 400,000 | 416,178 | ||||||
| Commercial Banks (0.3%) | ||||||||
| Deutsche Bank AG, (fixed rate to 04/30/2026, variable rate thereafter), VRN (GBP), 7.13%, 04/30/2026 (a)(d) | 300,000 | 367,257 | ||||||
| Commercial Services & Supplies (0.4%) | ||||||||
| Techem Verwaltungsgesellschaft 674 mbH (EUR), 6.00%, 07/30/2026 (a) | 395,639 | 409,992 | ||||||
See accompanying Notes to Financial Statements.
| 20 | 2022 Semi-Annual Report |
Statement of Investments (continued)
April 30, 2022 (Unaudited)
abrdn Global High Income Fund
| Shares or Principal Amount | Value (US$) | |||||||
| CORPORATE BONDS (continued) | ||||||||
| GERMANY (continued) | ||||||||
| Diversified Financial Services (0.4%) | ||||||||
| Aareal Bank AG, FRN (EUR), 1 year EUR Swap + 7.180%, 7.36%, 04/30/2023 (a)(d)(e) | $ | 400,000 | $ | 417,233 | ||||
| Machinery-Diversified (0.5%) | ||||||||
| TK Elevator Holdco GmbH (EUR), 6.63%, 07/15/2028 (a) | 314,100 | 302,379 | ||||||
| TK Elevator Midco GmbH (EUR), 4.38%, 07/15/2027 (a) | 176,000 | 171,501 | ||||||
| 473,880 | ||||||||
| Pharmaceutical (0.6%) | ||||||||
| Gruenenthal GmbH | ||||||||
| (EUR), 3.63%, 11/15/2026 (a) | 199,000 | 198,632 | ||||||
| (EUR), 4.13%, 05/15/2028 (a) | 230,000 | 224,521 | ||||||
| Nidda Healthcare Holding GmbH (EUR), 3.50%, 09/30/2024 (a) | 223,000 | 217,907 | ||||||
| 641,060 | ||||||||
| Real Estate (0.2%) | ||||||||
| ADLER Group SA (EUR), 3.25%, 08/05/2025 (a) | 200,000 | 155,588 | ||||||
| ADLER Real Estate AG (EUR), 1.88%, 04/27/2023 (a) | 100,000 | 91,306 | ||||||
| 246,894 | ||||||||
| 4,455,918 | ||||||||
| ISRAEL (1.5%) | ||||||||
| Pharmaceutical (1.5%) | ||||||||
| Teva Pharmaceutical Finance Netherlands III BV | ||||||||
| (USD), 7.13%, 01/31/2025 | 573,000 | 580,163 | ||||||
| (USD), 3.15%, 10/01/2026 | 681,000 | 583,971 | ||||||
| (USD), 4.75%, 05/09/2027 | 407,000 | 372,405 | ||||||
| 1,536,539 | ||||||||
| ITALY (1.4%) | ||||||||
| Commercial Banks (0.3%) | ||||||||
| UniCredit SpA, (fixed rate to 06/03/2023, variable rate thereafter) (EUR), 6.63%, 06/03/2023 (a)(d) | 330,000 | 346,828 | ||||||
| Hand/Machine Tools (0.2%) | ||||||||
| IMA Industria Macchine Automatiche SpA (EUR), 3.75%, 01/15/2028 (a) | 231,000 | 215,937 | ||||||
| Healthcare Providers & Services (0.5%) | ||||||||
| Kedrion SpA (EUR), 3.38%, 05/15/2026 (a) | 487,000 | 493,210 | ||||||
| Machinery-Diversified (0.1%) | ||||||||
| IMA Industria Macchine Automatiche SpA, FRN (EUR), 3 mo. Euribor + 4.000%, 4.00%, 01/15/2028 (a)(e) | 100,000 | 102,594 | ||||||
| Retail (0.3%) | ||||||||
| Golden Goose SpA, FRN (EUR), 3 mo. Euribor + 4.875%, 4.88%, 05/14/2027 (a)(e) | 348,000 | 357,622 | ||||||
| 1,516,191 | ||||||||
| Shares or Principal Amount | Value (US$) | |||||||
| JAPAN (1.4%) | ||||||||
| Diversified Telecommunication Services (1.4%) | ||||||||
| SoftBank Group Corp., (fixed rate to 07/19/2023, variable rate thereafter), VRN (USD), 6.00%, 07/19/2023 (a)(d) | $ | 1,620,000 | $ | 1,486,726 | ||||
| LUXEMBOURG (3.9%) | ||||||||
| Biotechnology (0.5%) | ||||||||
| Cidron Aida Finco Sarl (GBP), 6.25%, 04/01/2028 (a) | 253,000 | 284,842 | ||||||
| Cidron Aida Finco Sarl (EUR), 5.00%, 04/01/2028 (a) | 291,000 | 275,874 | ||||||
| 560,716 | ||||||||
| Commercial Services & Supplies (0.7%) | ||||||||
| Albion Financing 1 SARL / Aggreko Holdings, Inc. (EUR), 5.25%, 10/15/2026 (a) | 246,000 | 245,828 | ||||||
| Albion Financing 2SARL (USD), 8.75%, 04/15/2027 (a) | 519,000 | 489,158 | ||||||
| 734,986 | ||||||||
| Diversified Financial Services (0.5%) | ||||||||
| Garfunkelux Holdco 3 SA | ||||||||
| (EUR), 6.75%, 11/01/2025 (a) | 231,000 | 237,906 | ||||||
| (GBP), 7.75%, 11/01/2025 (a) | 240,000 | 294,621 | ||||||
| 532,527 | ||||||||
| Diversified Telecommunication Services (1.2%) | ||||||||
| Altice France Holding SA (EUR), 8.00%, 05/15/2027 (a) | 533,000 | 569,484 | ||||||
| Matterhorn Telecom SA (EUR), 3.13%, 09/15/2026 (a) | 712,000 | 694,865 | ||||||
| 1,264,349 | ||||||||
| Energy-Alternate Sources (0.2%) | ||||||||
| Cullinan Holdco Scsp (EUR), 4.63%, 10/15/2026 (a) | 262,000 | 251,217 | ||||||
| Entertainment (0.3%) | ||||||||
| LHMC Finco 2 Sarl, PIK (EUR), 7.25%, 10/02/2025 (a)(b) | 292,464 | 293,108 | ||||||
| Machinery-Diversified (0.0%) | ||||||||
| Galapagos SA (EUR), 5.38%, 06/15/2021 (a)(c)(f)(g) | 60,500 | — | ||||||
| Media (0.4%) | ||||||||
| Altice Financing SA (USD), 5.75%, 08/15/2029 (a) | 449,000 | 378,287 | ||||||
| Packaging & Containers (0.1%) | ||||||||
| Kleopatra Finco Sarl (EUR), 4.25%, 03/01/2026 (a) | 113,000 | 102,520 | ||||||
| 4,117,710 | ||||||||
| MEXICO (2.6%) | ||||||||
| Chemicals (0.2%) | ||||||||
| Braskem Idesa SAPI (USD), 6.99%, 02/20/2032 (a) | 200,000 | 179,474 | ||||||
See accompanying Notes to Financial Statements.
| 2022 Semi-Annual Report | 21 |
Statement of Investments (continued)
April 30, 2022 (Unaudited)
abrdn Global High Income Fund
| Shares or Principal Amount | Value (US$) | |||||||
| CORPORATE BONDS (continued) | ||||||||
| MEXICO (continued) | ||||||||
| Diversified Telecommunication Services (0.7%) | ||||||||
| Sixsigma Networks Mexico SA de CV (USD), 7.50%, 05/02/2025 (a) | $ | 750,000 | $ | 718,688 | ||||
| Oil, Gas & Consumable Fuels (1.7%) | ||||||||
| Petroleos Mexicanos | ||||||||
| (USD), 6.49%, 01/23/2027 | 300,000 | 287,910 | ||||||
| (USD), 5.35%, 02/12/2028 | 1,164,000 | 1,033,265 | ||||||
| (USD), 6.70%, 02/16/2032 | 610,000 | 525,625 | ||||||
| 1,846,800 | ||||||||
| 2,744,962 | ||||||||
| NETHERLANDS (2.3%) | ||||||||
| Commercial Banks (0.4%) | ||||||||
| Stichting AK Rabobank Certificaten (EUR), 6.50%, 12/29/2049 (a)(d)(h) | 355,750 | 408,516 | ||||||
| Diversified Financial Services (0.2%) | ||||||||
| Leaseplan Corporation NV, (fixed rate to 05/29/2024, variable rate thereafter), VRN (EUR), 7.38%, 05/29/2024 (a)(d) | 250,000 | 272,325 | ||||||
| Home Furnishings (0.3%) | ||||||||
| Nobel Bidco BV (EUR), 3.13%, 06/15/2028 (a) | 340,000 | 297,779 | ||||||
| Internet (0.1%) | ||||||||
| United Group BV (EUR), 5.25%, 02/01/2030 (a) | 123,000 | 113,238 | ||||||
| Media (0.7%) | ||||||||
| Summer BidCo BV, PIK (EUR), 9.00%, 11/15/2025 (a)(b) | 367,063 | 374,557 | ||||||
| Ziggo Bond Co. BV (EUR), 3.38%, 02/28/2030 (a) | 382,000 | 335,816 | ||||||
| 710,373 | ||||||||
| Packaging & Containers (0.6%) | ||||||||
| Trivium Packaging Finance BV (USD), 5.50%, 08/15/2026 (a) | 690,000 | 666,712 | ||||||
| 2,468,943 | ||||||||
| NIGERIA (0.7%) | ||||||||
| Engineering & Construction (0.7%) | ||||||||
| IHS Netherlands Holdco BV (USD), 8.00%, 09/18/2027 (a) | 760,000 | 762,964 | ||||||
| PANAMA (0.4%) | ||||||||
| Diversified Telecommunication Services (0.4%) | ||||||||
| C&W Senior Financing DAC (USD), 6.88%, 09/15/2027 (a) | 436,000 | 423,055 | ||||||
| SOUTH AFRICA (0.5%) | ||||||||
| Diversified Telecommunication Services (0.5%) | ||||||||
| Liquid Telecommunications Financing PLC (USD), 5.50%, 09/04/2026 (a) | 584,000 | 557,720 | ||||||
| Shares or Principal Amount | Value (US$) | |||||||
| SPAIN (0.4%) | ||||||||
| Commercial Banks (0.2%) | ||||||||
| Banco Bilbao Vizcaya Argentaria SA, Series 9 (fixed rate to 03/05/2025, variable rate thereafter) (USD), 6.50%, 03/05/2025 (d) | $ | 200,000 | $ | 193,750 | ||||
| Entertainment (0.2%) | ||||||||
| Cirsa Finance International Sarl (EUR), 3.63%, 09/30/2025 (a)(e) | 208,000 | 208,535 | ||||||
| 402,285 | ||||||||
| SWEDEN (0.5%) | ||||||||
| Commercial Services & Supplies (0.5%) | ||||||||
| Verisure Holding AB (EUR), 3.25%, 02/15/2027 (a) | 333,000 | 315,554 | ||||||
| Verisure Midholding AB (EUR), 5.25%, 02/15/2029 (a) | 275,000 | 254,082 | ||||||
| 569,636 | ||||||||
| SWITZERLAND (0.7%) | ||||||||
| Chemicals (0.4%) | ||||||||
| Consolidated Energy Finance SA (USD), 5.63%, 10/15/2028 (a) | 502,000 | 464,350 | ||||||
| Retail (0.3%) | ||||||||
| Dufry One BV (EUR), 2.50%, 10/15/2024 (a) | 250,000 | 252,858 | ||||||
| 717,208 | ||||||||
| TURKEY (0.8%) | ||||||||
| Commercial Banks (0.4%) | ||||||||
| Turkiye Garanti Bankasi AS (USD), 5.25%, 09/13/2022 (a) | 450,000 | 450,545 | ||||||
| Diversified Telecommunication Services (0.4%) | ||||||||
| Turk Telekomunikasyon AS (USD), 4.88%, 06/19/2024 (a) | 410,000 | 390,582 | ||||||
| 841,127 | ||||||||
| UKRAINE (0.2%) | ||||||||
| Agriculture (0.2%) | ||||||||
| MHP Lux SA (USD), 6.95%, 04/03/2026 (a) | 479,000 | 225,130 | ||||||
| UNITED KINGDOM (6.1%) | ||||||||
| Diversified Financial Services (0.7%) | ||||||||
| Jerrold Finco PLC | ||||||||
| (GBP), 4.88%, 01/15/2026 (a) | 134,000 | 159,989 | ||||||
| (GBP), 5.25%, 01/15/2027 (a) | 306,000 | 365,541 | ||||||
| Motion Finco Sarl (EUR), 7.00%, 05/15/2025 (a) | 200,000 | 217,056 | ||||||
| 742,586 | ||||||||
| Diversified Telecommunication Services (1.1%) | ||||||||
| Arqiva Broadcast Finance PLC (GBP), 6.75%, 09/30/2023 (a) | 500,000 | 625,582 | ||||||
| TalkTalk Telecom Group Ltd. (GBP), 3.88%, 02/20/2025 (a) | 500,000 | 567,424 | ||||||
| 1,193,006 | ||||||||
See accompanying Notes to Financial Statements.
| 22 | 2022 Semi-Annual Report |
Statement of Investments (continued)
April 30, 2022 (Unaudited)
abrdn Global High Income Fund
| Shares or Principal Amount | Value (US$) | |||||||
| CORPORATE BONDS (continued) | ||||||||
| UNITED KINGDOM (continued) | ||||||||
| Entertainment (0.4%) | ||||||||
| Merlin Entertainments Ltd. (USD), 5.75%, 06/15/2026 (a) | $ | 448,000 | $ | 437,920 | ||||
| Food & Staples (1.2%) | ||||||||
| eG Global Finance PLC (EUR), 4.38%, 02/07/2025 (a) | 600,000 | 605,860 | ||||||
| Very Group Funding PLC (The) (GBP), 6.50%, 08/01/2026 (a) | 539,000 | 611,684 | ||||||
| 1,217,544 | ||||||||
| Food Products (0.4%) | ||||||||
| Bellis Acquisition Co. PLC | ||||||||
| (GBP), 3.25%, 02/16/2026 (a) | 278,000 | 306,211 | ||||||
| (GBP), 4.50%, 02/16/2026 (a) | 106,000 | 121,127 | ||||||
| 427,338 | ||||||||
| Media (0.6%) | ||||||||
| Virgin Media Vendor Financing Notes III DAC (GBP), 4.88%, 07/15/2028 (a) | 544,000 | 619,923 | ||||||
| Oil, Gas & Consumable Fuels (0.6%) | ||||||||
| Ithaca Energy North Sea PLC (USD), 9.00%, 07/15/2026 (a) | 581,000 | 592,498 | ||||||
| Pharmaceutical (0.6%) | ||||||||
| 180 Medical, Inc. (USD), 3.88%, 10/15/2029 (a) | 769,000 | 684,410 | ||||||
| Retail (0.2%) | ||||||||
| Constellation Automotive Financing PLC (GBP), 4.88%, 07/15/2027 (a) | 200,000 | 216,282 | ||||||
| Water Utility (0.3%) | ||||||||
| Thames Water Kemble Finance PLC (GBP), 4.63%, 05/19/2026 (a) | 300,000 | 360,672 | ||||||
| 6,492,179 | ||||||||
| UNITED STATES (55.6%) | ||||||||
| Advertising (0.7%) | ||||||||
| Summer BC Bidco B LLC (USD), 5.50%, 10/31/2026 (a) | 721,000 | 692,304 | ||||||
| Aerospace & Defense (2.5%) | ||||||||
| Howmet Aerospace, Inc. | ||||||||
| (USD), 6.88%, 05/01/2025 | 43,000 | 45,472 | ||||||
| (USD), 3.00%, 01/15/2029 | 852,000 | 743,498 | ||||||
| (USD), 5.95%, 02/01/2037 | 932,000 | 941,842 | ||||||
| Spirit AeroSystems, Inc. | ||||||||
| (USD), 7.50%, 04/15/2025 (a) | 611,000 | 618,637 | ||||||
| (USD), 4.60%, 06/15/2028 | 346,000 | 298,885 | ||||||
| 2,648,334 | ||||||||
| Agriculture (0.4%) | ||||||||
| Turning Point Brands, Inc. (USD), 5.63%, 02/15/2026 (a) | 503,000 | 478,655 | ||||||
| Shares or Principal Amount | Value (US$) | |||||||
| Apparel (0.7%) | ||||||||
| Wolverine World Wide, Inc. (USD), 4.00%, 08/15/2029 (a) | $ | 818,000 | $ | 695,169 | ||||
| Auto Manufacturers (2.2%) | ||||||||
| Ford Motor Co. | ||||||||
| (USD), 9.00%, 04/22/2025 | 1,352,000 | 1,506,595 | ||||||
| (USD), 9.63%, 04/22/2030 | 422,000 | 515,895 | ||||||
| Ford Motor Credit Co. LLC (USD), 4.95%, 05/28/2027 | 364,000 | 354,503 | ||||||
| 2,376,993 | ||||||||
| Auto Parts & Equipment (1.6%) | ||||||||
| Adient Global Holdings Ltd. (USD), 4.88%, 08/15/2026 (a) | 398,000 | 354,909 | ||||||
| Goodyear Tire & Rubber Co. | ||||||||
| (USD), 9.50%, 05/31/2025 | 604,000 | 633,360 | ||||||
| (USD), 5.00%, 07/15/2029 | 115,000 | 102,546 | ||||||
| (USD), 5.25%, 07/15/2031 | 127,000 | 109,537 | ||||||
| (USD), 5.63%, 04/30/2033 | 569,000 | 490,091 | ||||||
| 1,690,443 | ||||||||
| Building Materials (0.9%) | ||||||||
| MIWD Holdco II LLC / MIWD Finance Corp. (USD), 5.50%, 02/01/2030 (a) | 396,000 | 342,540 | ||||||
| New Enterprise Stone & Lime Co., Inc. (USD), 5.25%, 07/15/2028 (a) | 672,000 | 614,235 | ||||||
| 956,775 | ||||||||
| Chemicals (0.5%) | ||||||||
| ASP Unifrax Holdings, Inc. | ||||||||
| (USD), 5.25%, 09/30/2028 (a) | 418,000 | 368,442 | ||||||
| (USD), 7.50%, 09/30/2029 (a) | 139,000 | 113,980 | ||||||
| 482,422 | ||||||||
| Coal (1.0%) | ||||||||
| SunCoke Energy, Inc. (USD), 4.88%, 06/30/2029 (a) | 1,153,000 | 1,033,722 | ||||||
| Commercial Services & Supplies (1.6%) | ||||||||
| Avis Budget Car Rental LLC / Avis Budget Finance, Inc. (USD), 5.38%, 03/01/2029 (a) | 653,000 | 612,188 | ||||||
| Cimpress PLC (USD), 7.00%, 06/15/2026 (a) | 779,000 | 726,417 | ||||||
| Nielsen Finance LLC / Nielsen Finance Co. (USD), 5.63%, 10/01/2028 (a) | 367,000 | 355,634 | ||||||
| ZipRecruiter, Inc. (USD), 5.00%, 01/15/2030 (a) | — | — | ||||||
| 1,694,239 | ||||||||
| Computers & Peripherals (1.2%) | ||||||||
| Austin BidCo, Inc. (USD), 7.13%, 12/15/2028 (a) | 517,000 | 465,300 | ||||||
| Banff Merger Sub, Inc. (EUR), 8.38%, 09/01/2026 (a) | 425,000 | 441,987 | ||||||
| Condor Merger Sub, Inc. (USD), 7.38%, 02/15/2030 (a) | 465,000 | 416,036 | ||||||
| 1,323,323 | ||||||||
See accompanying Notes to Financial Statements.
| 2022 Semi-Annual Report | 23 |
Statement of Investments (continued)
April 30, 2022 (Unaudited)
abrdn Global High Income Fund
| Shares or Principal Amount | Value (US$) | |||||||
| CORPORATE BONDS (continued) | ||||||||
| UNITED STATES (continued) | ||||||||
| Diversified Financial Services (0.7%) | ||||||||
| Coinbase Global, Inc. | ||||||||
| (USD), 3.38%, 10/01/2028 (a) | $ | 519,000 | $ | 402,967 | ||||
| (USD), 3.63%, 10/01/2031 (a) | 459,000 | 339,077 | ||||||
| 742,044 | ||||||||
| Diversified Telecommunication Services (2.7%) | ||||||||
| Consolidated Communications, Inc. | ||||||||
| (USD), 5.00%, 10/01/2028 (a) | 79,000 | 64,559 | ||||||
| (USD), 6.50%, 10/01/2028 (a) | 438,000 | 381,648 | ||||||
| Frontier Communications Holdings LLC (USD), 6.00%, 01/15/2030 (a) | 745,000 | 648,217 | ||||||
| LogMeIn, Inc. (USD), 5.50%, 09/01/2027 (a) | 638,000 | 558,250 | ||||||
| Qwest Capital Funding, Inc. | ||||||||
| (USD), 6.88%, 07/15/2028 | 671,000 | 630,129 | ||||||
| (USD), 7.75%, 02/15/2031 | 659,000 | 626,050 | ||||||
| 2,908,853 | ||||||||
| Electric Utilities (1.5%) | ||||||||
| NRG Energy, Inc. | ||||||||
| (USD), 3.38%, 02/15/2029 (a) | 1,035,000 | 877,162 | ||||||
| (USD), 3.63%, 02/15/2031 (a) | 241,000 | 200,633 | ||||||
| Vistra Operations Co. LLC | ||||||||
| (USD), 5.63%, 02/15/2027 (a) | 287,000 | 282,695 | ||||||
| (USD), 4.38%, 05/01/2029 (a) | 221,000 | 200,553 | ||||||
| 1,561,043 | ||||||||
| Energy Equipment & Services (4.0%) | ||||||||
| DT Midstream, Inc. (USD), 4.13%, 06/15/2029 (a) | — | — | ||||||
| Energy Transfer LP, (fixed rate to 05/15/2025, variable rate thereafter), Series F, VRN (USD), 6.75%, 05/15/2025 (d) | 830,000 | 797,837 | ||||||
| Hess Midstream Operations LP | ||||||||
| (USD), 5.63%, 02/15/2026 (a) | 398,000 | 398,000 | ||||||
| (USD), 4.25%, 02/15/2030 (a) | 547,000 | 501,758 | ||||||
| (USD), 5.50%, 10/15/2030 (a) | 102,000 | 100,500 | ||||||
| ITT Holdings LLC (USD), 6.50%, 08/01/2029 (a) | 688,000 | 608,880 | ||||||
| Rattler Midstream LP (USD), 5.63%, 07/15/2025 (a) | 716,000 | 716,931 | ||||||
| Venture Global Calcasieu Pass LLC | ||||||||
| (USD), 3.88%, 08/15/2029 (a) | 255,000 | 232,687 | ||||||
| (USD), 4.13%, 08/15/2031 (a) | 255,000 | 231,413 | ||||||
| (USD), 3.88%, 11/01/2033 (a) | 410,000 | 356,720 | ||||||
| Western Midstream Operating LP (USD), 5.75%, 02/01/2050 | 406,000 | 357,751 | ||||||
| 4,302,477 | ||||||||
| Engineering & Construction (1.2%) | ||||||||
| Great Lakes Dredge & Dock Corp. (USD), 5.25%, 06/01/2029 (a) | 782,000 | 731,170 | ||||||
| VM Consolidated, Inc. (USD), 5.50%, 04/15/2029 (a) | 644,000 | 576,341 | ||||||
| 1,307,511 | ||||||||
| Shares or Principal Amount | Value (US$) | |||||||
| Entertainment (4.2%) | ||||||||
| Affinity Gaming (USD), 6.88%, 12/15/2027 (a) | $ | 1,155,000 | $ | 1,081,819 | ||||
| CCM Merger, Inc. (USD), 6.38%, 05/01/2026 (a) | 511,000 | 509,723 | ||||||
| Cedar Fair LP / Canada's Wonderland Co. / Magnum Management Corp. / Millennium Op (USD), 6.50%, 10/01/2028 | 765,000 | 766,912 | ||||||
| International Game Technology PLC (EUR), 3.50%, 06/15/2026 (a) | 622,000 | 637,445 | ||||||
| Six Flags Theme Parks, Inc. (USD), 7.00%, 07/01/2025 (a) | 1,365,000 | 1,417,894 | ||||||
| 4,413,793 | ||||||||
| Environmental Control (0.5%) | ||||||||
| Clean Harbors, Inc. (USD), 4.88%, 07/15/2027 (a) | 560,000 | 548,800 | ||||||
| Food & Staples (0.4%) | ||||||||
| Michaels Cos Inc.(The) (USD), 5.25%, 05/01/2028 (a) | 491,000 | 421,975 | ||||||
| Food Products (0.9%) | ||||||||
| Post Holdings, Inc. (USD), 5.50%, 12/15/2029 (a) | 1,006,000 | 915,460 | ||||||
| Healthcare Products (0.6%) | ||||||||
| Mozart Debt Merger Sub, Inc. (USD), 3.88%, 04/01/2029 (a) | 689,000 | 602,021 | ||||||
| Healthcare Providers & Services (1.4%) | ||||||||
| Catalent Pharma Solutions, Inc. (USD), 3.50%, 04/01/2030 (a) | 777,000 | 675,842 | ||||||
| HCA, Inc. (USD), 5.88%, 02/15/2026 | 381,000 | 394,526 | ||||||
| Tenet Healthcare Corp. (USD), 6.13%, 10/01/2028 (a) | 458,000 | 439,657 | ||||||
| 1,510,025 | ||||||||
| Home Builders (0.4%) | ||||||||
| Adams Homes, Inc. (USD), 7.50%, 02/15/2025 (a) | 443,000 | 431,610 | ||||||
| Home Furnishings (0.6%) | ||||||||
| Tempur Sealy International, Inc. (USD), 3.88%, 10/15/2031 (a) | 785,000 | 650,435 | ||||||
| Internet (1.1%) | ||||||||
| Millennium Escrow Corp. (USD), 6.63%, 08/01/2026 (a) | 529,000 | 488,796 | ||||||
| Photo Holdings Merger Sub, Inc. (USD), 8.50%, 10/01/2026 (a) | 528,000 | 488,400 | ||||||
| Shutterfly, Inc., 2021 Term Loan (USD), 5.76%, 09/25/2026 (e) | 247,500 | 228,628 | ||||||
| 1,205,824 | ||||||||
| Leisure Time (3.2%) | ||||||||
| Carnival Corp. | ||||||||
| (USD), 10.50%, 02/01/2026 (a) | 701,000 | 771,100 | ||||||
| (USD), 6.00%, 05/01/2029 (a) | 725,000 | 650,687 | ||||||
| MajorDrive Holdings IV LLC (USD), 6.38%, 06/01/2029 (a) | 557,000 | 441,423 | ||||||
| NCL Corp. Ltd. | ||||||||
| (USD), 5.88%, 02/15/2027 (a) | 310,000 | 295,504 | ||||||
| (USD), 7.75%, 02/15/2029 (a) | 117,000 | 113,490 | ||||||
See accompanying Notes to Financial Statements.
| 24 | 2022 Semi-Annual Report |
Statement of Investments (continued)
April 30, 2022 (Unaudited)
abrdn Global High Income Fund
| Shares or Principal Amount | Value (US$) | |||||||
| CORPORATE BONDS (continued) | ||||||||
| UNITED STATES (continued) | ||||||||
| Leisure Time (continued) | ||||||||
| NCL Finance Ltd. (USD), 6.13%, 03/15/2028 (a) | $ | 131,000 | $ | 117,900 | ||||
| Royal Caribbean Cruises Ltd. | ||||||||
| (USD), 11.50%, 06/01/2025 (a) | 209,000 | 227,225 | ||||||
| (USD), 5.50%, 04/01/2028 (a) | 271,000 | 247,288 | ||||||
| Viking Cruises Ltd. (USD), 13.00%, 05/15/2025 (a) | 540,000 | 590,976 | ||||||
| 3,455,593 | ||||||||
| Lodging (0.5%) | ||||||||
| Hilton Grand Vacations Borrower Escrow LLC / Hilton Grand Vacations Borrower Esc (USD), 5.00%, 06/01/2029 (a) | — | — | ||||||
| Travel & Leisure Co. (USD), 4.63%, 03/01/2030 (a) | 590,000 | 525,100 | ||||||
| 525,100 | ||||||||
| Machinery-Diversified (0.7%) | ||||||||
| Welbilt, Inc., 2018 Term Loan B (USD), 3.26%, 10/23/2025 (e) | 800,000 | 795,334 | ||||||
| Media (3.4%) | ||||||||
| CCO Holdings LLC / CCO Holdings Capital Corp. | ||||||||
| (USD), 4.25%, 02/01/2031 (a) | 1,206,000 | 1,016,417 | ||||||
| (USD), 4.75%, 02/01/2032 (a) | 346,000 | 297,328 | ||||||
| (USD), 4.25%, 01/15/2034 (a) | 1,126,000 | 895,170 | ||||||
| CSC Holdings LLC (USD), 5.75%, 01/15/2030 (a) | 1,113,000 | 923,790 | ||||||
| LCPR Senior Secured Financing DAC (USD), 5.13%, 07/15/2029 (a) | 527,000 | 479,731 | ||||||
| 3,612,436 | ||||||||
| Metals & Mining (0.7%) | ||||||||
| Novelis Corp. (USD), 3.25%, 11/15/2026 (a) | 769,000 | 701,674 | ||||||
| Miscellaneous Manufacturing (0.5%) | ||||||||
| FXI Holdings, Inc. | ||||||||
| (USD), 7.88%, 11/01/2024 (a) | 410,000 | 404,129 | ||||||
| (USD), 12.25%, 11/15/2026 (a) | 116,000 | 123,540 | ||||||
| 527,669 | ||||||||
| Oil & Gas Services (1.1%) | ||||||||
| USA Compression Partners LP / USA Compression Finance Corp. (USD), 6.88%, 09/01/2027 | 494,000 | 482,791 | ||||||
| Weatherford International Ltd. (USD), 8.63%, 04/30/2030 (a) | 656,000 | 649,348 | ||||||
| 1,132,139 | ||||||||
| Oil, Gas & Consumable Fuels (3.1%) | ||||||||
| Aethon United BR LP / Aethon United Finance Corp. (USD), 8.25%, 02/15/2026 (a) | 413,000 | 425,609 | ||||||
| Chesapeake Energy Corp. (USD), 6.75%, 04/15/2029 (a) | 490,000 | 493,062 | ||||||
| Hilcorp Energy I LP / Hilcorp Finance Co. | ||||||||
| (USD), 5.75%, 02/01/2029 (a) | 539,000 | 528,220 | ||||||
| (USD), 6.00%, 02/01/2031 (a) | 194,000 | 187,218 | ||||||
| Shares or Principal Amount | Value (US$) | |||||||
| Occidental Petroleum Corp. | ||||||||
| (USD), 6.38%, 09/01/2028 | $ | 780,000 | $ | 819,000 | ||||
| (USD), 6.63%, 09/01/2030 | 298,000 | 322,958 | ||||||
| Southwestern Energy Co. (USD), 4.75%, 02/01/2032 | 583,000 | 551,302 | ||||||
| 3,327,369 | ||||||||
| Packaging & Containers (2.9%) | ||||||||
| Ball Corp. | ||||||||
| (USD), 2.88%, 08/15/2030 | 1,556,000 | 1,308,440 | ||||||
| (USD), 3.13%, 09/15/2031 | 200,000 | 167,358 | ||||||
| Clydesdale Acquisition Holdings, Inc. | ||||||||
| (USD), 6.63%, 04/15/2029 (a) | 85,000 | 84,788 | ||||||
| (USD), 8.75%, 04/15/2030 (a) | 111,000 | 101,447 | ||||||
| Graphic Packaging International LLC | ||||||||
| (USD), 3.50%, 03/01/2029 (a) | 552,000 | 487,140 | ||||||
| (USD), 3.75%, 02/01/2030 (a) | 1,113,000 | 975,801 | ||||||
| 3,124,974 | ||||||||
| Pharmaceutical (1.1%) | ||||||||
| Bausch Health Americas, Inc. (USD), 8.50%, 01/31/2027 (a) | 685,000 | 648,195 | ||||||
| Perrigo Finance Unlimited Co. (USD), 3.90%, 06/15/2030 | 545,000 | 488,816 | ||||||
| 1,137,011 | ||||||||
| Real Estate Investment Trust (REIT) Funds (1.5%) | ||||||||
| Iron Mountain, Inc. (USD), 5.00%, 07/15/2028 (a) | 610,000 | 577,871 | ||||||
| Park Intermediate Holdings LLC/PK Domestic Property LLC/PK Finance Co-Issuer | ||||||||
| (USD), 7.50%, 06/01/2025 (a) | 137,000 | 141,754 | ||||||
| (USD), 4.88%, 05/15/2029 (a) | 491,000 | 449,752 | ||||||
| Starwood Property Trust, Inc. (USD), 3.63%, 07/15/2026 (a) | 471,000 | 429,787 | ||||||
| 1,599,164 | ||||||||
| Retail (1.9%) | ||||||||
| Academy Ltd. (USD), 6.00%, 11/15/2027 (a) | 502,000 | 500,745 | ||||||
| Macy's Retail Holdings LLC | ||||||||
| (USD), 5.88%, 04/01/2029 (a) | 562,000 | 533,124 | ||||||
| (USD), 5.88%, 03/15/2030 (a) | 16,000 | 15,014 | ||||||
| (USD), 6.13%, 03/15/2032 (a) | 49,000 | 45,325 | ||||||
| Staples, Inc. | ||||||||
| (USD), 7.50%, 04/15/2026 (a) | 737,000 | 703,835 | ||||||
| (USD), 10.75%, 04/15/2027 (a) | 215,000 | 190,490 | ||||||
| 1,988,533 | ||||||||
| Software (1.5%) | ||||||||
| Consensus Cloud Solutions, Inc. | ||||||||
| (USD), 6.00%, 10/15/2026 (a) | 215,000 | 204,250 | ||||||
| (USD), 6.50%, 10/15/2028 (a) | 607,000 | 570,580 | ||||||
| Dun & Bradstreet Corp. (The) (USD), 5.00%, 12/15/2029 (a) | 339,000 | 315,270 | ||||||
| Minerva Merger Sub, Inc. (USD), 6.50%, 02/15/2030 (a) | 590,000 | 543,060 | ||||||
| 1,633,160 | ||||||||
| 59,154,406 | ||||||||
See accompanying Notes to Financial Statements.
| 2022 Semi-Annual Report | 25 |
Statement of Investments (concluded)
April 30, 2022 (Unaudited)
abrdn Global High Income Fund
| Shares or Principal Amount | Value (US$) | |||||||
| CORPORATE BONDS (continued) | ||||||||
| ZAMBIA (1.5%) | ||||||||
| Metals & Mining (1.5%) | ||||||||
| First Quantum Minerals Ltd. | ||||||||
| (USD), 7.25%, 04/01/2023 (a) | $ | 200,000 | $ | 199,954 | ||||
| (USD), 6.50%, 03/01/2024 (a) | 900,000 | 901,278 | ||||||
| (USD), 6.88%, 03/01/2026 (a) | 477,000 | 478,193 | ||||||
| 1,579,425 | ||||||||
| Total Corporate Bonds | 97,874,973 | |||||||
| SHORT-TERM INVESTMENT (5.4%) | ||||||||
| UNITED STATES (5.4%) | ||||||||
| State Street Institutional U.S. Government Money Market Fund, Premier Class, 0.29% (i) | 5,712,568 | 5,712,568 | ||||||
| Total Short-Term Investment | 5,712,568 | |||||||
| Total Investments (Cost $113,753,849) (j)—97.4% | 103,587,541 | |||||||
| Other Assets in Excess of Liabilities—2.6% | 2,741,872 | |||||||
| Net Assets—100.0% | $ | 106,329,413 | ||||||
| (a) | Denotes a security issued under Regulation S or Rule 144A. |
| (b) | Payment-in-kind. This is a type of bond that pays interest in additional bonds rather than in cash. |
| (c) | Security is in default. |
| (d) | Perpetual bond. This is a bond that has no maturity date, is redeemable and pays a steady stream of interest indefinitely. The maturity date presented for these instruments represents the next call/put date. |
| (e) | Variable Rate Instrument. The rate shown is based on the latest available information as of April 30, 2022. Certain variable rate securities are not based on a published reference rate and spread but are determined by the issuer or agent and are based on current market conditions. These securities do not indicate a reference rate and spread in their description. |
| (f) | Illiquid security. |
| (g) | Level 3 security. See Note 2(a) of the accompanying Notes to Financial Statements. |
| (h) | Indicates a stepped coupon bond. This bond was issued with a low coupon that gradually increases over the life of the bond. |
| (i) | Registered investment company advised by State Street Global Advisors. The rate shown is the 7 day yield as of April 30, 2022. |
| (j) | See accompanying Notes to Financial Statements for tax unrealized appreciation/(depreciation) of securities. |
| CMT | Constant Maturity Treasury |
| EUR | Euro Currency |
| GBP | British Pound Sterling |
| PIK | Payment In Kind |
| PLC | Public Limited Company |
| USD | U.S. Dollar |
At April 30, 2022, the Fund's open forward foreign currency exchange contracts were as follows:
| Purchase Contracts Settlement Date* | Counterparty | Amount Purchased | Amount Sold | Fair Value | Unrealized Depreciation | ||||||||
| British Pound/United States Dollar | |||||||||||||
| 07/14/2022 | Deutsche Bank AG | GBP | 381,000 | USD | 496,789 | $ 479,206 | $ (17,583 | ) | |||||
| Euro/United States Dollar | |||||||||||||
| 07/14/2022 | Royal Bank of Canada | EUR | 617,000 | USD | 670,939 | 653,265 | (17,674 | ) | |||||
| 07/14/2022 | UBS AG | EUR | 484,000 | USD | 528,411 | 512,448 | (15,963 | ) | |||||
| $1,644,919 | $(51,220 | ) | |||||||||||
| Sale Contracts Settlement Date* | Counterparty | Amount Purchased | Amount Sold | Fair Value | Unrealized Appreciation | ||||||||
| United States Dollar/British Pound | |||||||||||||
| 07/14/2022 | Deutsche Bank AG | USD | 5,868,711 | GBP | 4,465,000 | $ 5,615,887 | $ 252,824 | ||||||
| United States Dollar/Euro | |||||||||||||
| 07/14/2022 | Citibank N.A. | USD | 15,766,885 | EUR | 14,326,000 | 15,168,036 | 598,849 | ||||||
| $20,783,923 | $ 851,673 | ||||||||||||
| Unrealized appreciation on forward foreign currency exchange contracts | $ 851,673 | ||||||||||||
| Unrealized depreciation on forward foreign currency exchange contracts | (51,220 | ) | |||||||||||
| * | Certain contracts with different trade dates and like characteristics have been shown net. |
See accompanying Notes to Financial Statements.
| 26 | 2022 Semi-Annual Report |
abrdn Intermediate Municipal Income Fund (Unaudited)
Average Annual Total Return1 (For periods ended April 30, 2022) | Six Month† | 1 Yr. | 5 Yr. | 10 Yr. | ||||||
| Class A | w/o SC | (7.12%) | (6.72%) | 0.89% | 1.49% | |||||
| w/ SC2 | (9.43%) | (9.02%) | 0.38% | 1.24% | ||||||
| Class C | w/o SC | (7.48%) | (7.43%) | 0.14% | 0.73% | |||||
| w/ SC3 | (8.40%) | (8.34%) | 0.14% | 0.73% | ||||||
| Institutional Service Class4 | w/o SC | (6.99%) | (6.46%) | 1.15% | 1.75% | |||||
| Institutional Class4,5 | w/o SC | (7.10%) | (6.57%) | 1.13% | 1.74% |
All figures showing the effect of a sales charge (SC) reflect the maximum charge possible because it has the most significant effect on performance data. The total returns shown above do not include the impact of financial statement rounding of the net asset value (NAV) per share and/or financial statement adjustments.
| † | Not annualized |
| 1 | The Fund changed its investment strategy effective February 28, 2019. Performance information for periods prior to February 28, 2019 does not reflect such investment policy. Please consult the Fund's prospectus for more detail. |
| 2 | A 2.50% front-end sales charge was deducted. Prior to February 28, 2019 the front-end sales charge was 4.25%. |
| 3 | A 1.00% contingent deferred sales charge (CDSC) was deducted from the one year return because it is charged when Class C shares are sold within the first year after purchase. |
| 4 | Not subject to any sales charge. Returns before the first offering of the Institutional Class and Institutional Service Class shares (February 25, 2013) are based on the previous performance of Class D shares. Returns of each class have not been adjusted to reflect the expenses applicable to the respective classes. Excluding the effect of any fee waivers or reimbursements, this performance is substantially similar to what the Institutional Service Class, and Institutional Class shares would have produced because all classes invest in the same portfolio of securities. Returns for the Institutional Service Class, and Institutional Class shares would only differ to the extent of the differences in expenses of the classes. |
| 5 | Effective February 25, 2013, all Class D shares of the Fund were converted into Institutional Class shares of the Fund. |
Performance of a $10,000 Investment (as of April 30, 2022)

Comparative performance of $10,000 invested in Class A shares of the abrdn Intermediate Municipal Income Fund, the ICE BofA 1-22 Year U.S. Municipal Securities Index and the Consumer Price
Index (CPI) over a 10-year period ended April 30, 2022. Unlike the Fund, the returns for these unmanaged indexes do not reflect any fees, expenses, or sales charges. Investors cannot invest directly in market indexes.
The ICE BofA 1-22 Year U.S. Municipal Securities Index is a subset of the ICE BofA Merrill Lynch U.S. Municipal Securities Index including all securities with a remaining term to final maturity less than 22 years, calculated on a total return basis. The ICE BofA U.S. Municipal Securities Index tracks the performance of U.S. dollar-denominated investment grade tax-exempt debt publicly issued by U.S. states and territories, and their political subdivisions, in the U.S. domestic market.
The CPI is a measure of the average change over time in the prices paid by urban consumers for a market basket of consumer goods and services.
Investment return and principal value will fluctuate, and when redeemed, shares may be worth more or less than original cost. Past performance is no guarantee of future results. The Average Annual Total Return table and Performance graph do not reflect the deduction of taxes that a shareholder would pay on fund distributions or the redemption of fund shares. Investing in mutual funds involves market risk, including loss of principal. Performance returns assume the reinvestment of all distributions. Total returns reflect waivers and reimbursements in effect, without which returns would have been lower.
| 2022 Semi-Annual Report | 27 |
abrdn Intermediate Municipal Income Fund (Unaudited)
Portfolio Summary (as a percentage of net assets)
April 30, 2022 (Unaudited)
| Asset Allocation | ||
| Municipal Bonds | 98.6% | |
| Short-Term Investment | 0.2% | |
| Other Assets in Excess of Liabilities | 1.2% | |
| 100.0% | ||
| Top Ten Holdings | ||
| Harris County Health Facilities Development Corp. Revenue Bonds (SCH Health Care System), Prerefunded/Escrowed to Maturity, Series B 07/01/2027 | 10.0% | |
| New Jersey Transportation Trust Fund Authority Revenue Bonds, Series A 12/15/2034 | 4.2% | |
| Maryland Industrial Development Financing Authority Revenue Bonds (Occidental Petroleum Corp.) 03/01/2030 | 3.9% | |
| Metropolitan Transportation Authority Revenue Bonds, Series C-1 11/15/2027 | 2.4% | |
| State Health & Educational Facilities Authority Revenue Bonds, Series F 07/01/2027 | 2.3% | |
| New York State Dormitory Authority Revenue Bonds (State University Educational Facilities 3rd Generation), Series A 05/15/2023 | 2.3% | |
| Ohio Higher Educational Facility Commission Revenue Bonds 07/01/2030 | 2.2% | |
| Hudson Yards Infrastructure Corp. Revenue Bonds, Series A 02/15/2042 | 2.1% | |
| Texas Municipal Gas Acquisition & Supply Corp. I Revenue Bonds, Series D 12/15/2026 | 2.1% | |
| Nassau County Local Economic Assistance Corp. Revenue Bonds (Catholic Health Services) 07/01/2030 | 2.0% |
| States | ||
| Texas | 19.4% | |
| New York | 15.2% | |
| Florida | 10.3% | |
| New Jersey | 5.3% | |
| Wisconsin | 4.5% | |
| Pennsylvania | 4.3% | |
| Maryland | 3.9% | |
| Michigan | 3.8% | |
| California | 3.7% | |
| Tennessee | 2.8% | |
| Ohio | 2.7% | |
| Connecticut | 2.3% | |
| Kentucky | 2.1% | |
| South Carolina | 2.1% | |
| Louisiana | 2.0% | |
| Other, less than 2% each | 14.2% | |
| Short-Term Investment | 0.2% | |
| Other Assets in Excess of Liabilities | 1.2% | |
| 100.0% |
| 28 | 2022 Semi-Annual Report |
Statement of Investments
April 30, 2022 (Unaudited)
abrdn Intermediate Municipal Income Fund
| Shares or Principal Amount | Value (US$) | |||||||
| MUNICIPAL BONDS (98.6%) | ||||||||
| Alabama (1.9%) | ||||||||
| Black Belt Energy Gas District Revenue Bonds, Series A, 4.00%, 08/01/2047 (a) | $ | 1,000,000 | $ | 1,004,017 | ||||
| California (3.7%) | ||||||||
| Bay Area Toll Authority Revenue Bonds, Series A, 2.95%, 04/01/2047 (a) | 345,000 | 341,004 | ||||||
| Los Angeles Community College District General Obligation Unlimited Bonds, Series I, 4.00%, 08/01/2029 | 400,000 | 418,199 | ||||||
| M-S-R Energy Authority Gas Revenue Bonds | ||||||||
| Series B, 6.13%, 11/01/2029 | 470,000 | 524,233 | ||||||
| Series A, 6.50%, 11/01/2039 | 500,000 | 620,888 | ||||||
| 1,904,324 | ||||||||
| Colorado (0.3%) | ||||||||
| Colorado Educational & Cultural Facilities Authority Revenue Bonds (Aspen View Academy), 4.00%, 05/01/2041 | 170,000 | 155,679 | ||||||
| Connecticut (2.3%) | ||||||||
| State Health & Educational Facilities Authority Revenue Bonds, Series F, 5.00%, 07/01/2027 | 1,135,000 | 1,208,943 | ||||||
| District of Columbia (1.1%) | ||||||||
| Washington Convention & Sports Authority Revenue Bonds, Series A, 5.00%, 10/01/2030 | 500,000 | 550,387 | ||||||
| Florida (10.3%) | ||||||||
| City of Lakeland Revenue Bonds, Series B, AMT, 5.00%, 10/01/2028 | 565,000 | 639,283 | ||||||
| City of Tampa Revenue Bonds (Baycare Health Care System), Series A, 4.00%, 11/15/2033 | 1,000,000 | 1,001,013 | ||||||
| Florida Development Finance Corp. Revenue Bonds (Glenridge On Palmer Ranch), 5.00%, 06/01/2035 | 225,000 | 221,387 | ||||||
| Florida Development Finance Corp. Revenue Bonds (Global Outreach Charter AC), Series A, 4.00%, 06/30/2041 (b) | 765,000 | 700,532 | ||||||
| Florida Development Finance Corp. Revenue Bonds (Imagine School at Broward), 5.00%, 12/15/2039 (b) | 500,000 | 513,994 | ||||||
| Palm Beach County Educational Facilities Authority Revenue Bonds (Palm Beach Atlantic University, Inc.) | ||||||||
| 4.00%, 10/01/2027 | 260,000 | 263,408 | ||||||
| 4.00%, 10/01/2028 | 270,000 | 272,751 | ||||||
| Palm Beach County Revenue Bonds (Provident Group – LU Properties LLC – LYNN University Housing Project), Series A, 5.00%, 06/01/2057 (b) | 600,000 | 615,832 | ||||||
| Polk County Industrial Development Authority Revenue Bonds (Carpenter's Home Estates, Inc. Project), 5.00%, 01/01/2039 | 160,000 | 166,420 | ||||||
| St Johns County Industrial Development Authority Revenue Bonds (Vicar's Landing Project), 4.00%, 12/15/2041 | 750,000 | 666,377 | ||||||
| Shares or Principal Amount | Value (US$) | |||||||
| Volusia County Educational Facility Authority Revenue Bonds, Series B, 5.00%, 10/15/2023 | $ | 250,000 | $ | 259,721 | ||||
| 5,320,718 | ||||||||
| Georgia (0.5%) | ||||||||
| Main Street Natural Gas, Inc. Revenue Bonds, Series A, 5.00%, 05/15/2035 | 250,000 | 273,938 | ||||||
| Hawaii (1.2%) | ||||||||
| City & County Honolulu HI Wastewater System Revenue Bonds, Series A, 5.00%, 07/01/2047 | 560,000 | 612,377 | ||||||
| Illinois (0.4%) | ||||||||
| Illinois Finance Authority Revenue Bonds (Plymouth Place Obligated Group), 5.00%, 05/15/2041 | 200,000 | 201,297 | ||||||
| Indiana (1.5%) | ||||||||
| Indiana Finance Authority Revenue Bonds (Earlham College, Inc.), 5.00%, 10/01/2032 | 750,000 | 769,297 | ||||||
| Kentucky (2.1%) | ||||||||
| County of Meade, Kentucky (Nucor Steel Brandenburg Project) Series 2020A-1 Industrial Building Revenue Bonds, AMT, VRDN, 0.60%, 07/01/2060 (a) | 600,000 | 600,000 | ||||||
| Kentucky Public Energy Authority Revenue Bonds, Series A, 4.00%, 04/01/2048 (a) | 500,000 | 507,089 | ||||||
| 1,107,089 | ||||||||
| Louisiana (2.0%) | ||||||||
| Louisiana Local Government Environmental Facilities & Community Development Authority Revenue Bonds (Glen Retirement System), Series A, 5.00%, 01/01/2023 | 170,000 | 169,759 | ||||||
| Louisiana Public Facilities Authority Revenue Bonds, (Pre-refunded @ $100, 05/15/2026), 3.00%, 05/15/2031 | 10,000 | 10,102 | ||||||
| New Orleans Aviation Board Revenue Bonds (Louis Armstrong International Airport), 5.00%, 01/01/2028 | 500,000 | 553,059 | ||||||
| New Orleans Aviation Board Revenue Bonds (Parking Facilities Corp.), 5.00%, 10/01/2027 | 250,000 | 277,702 | ||||||
| 1,010,622 | ||||||||
| Maryland (3.9%) | ||||||||
| Maryland Industrial Development Financing Authority Revenue Bonds (Occidental Petroleum Corp.), 1.25%, 03/01/2030 (a) | 2,000,000 | 2,000,000 | ||||||
| Massachusetts (1.6%) | ||||||||
| Massachusetts Development Finance Agency Revenue Bonds, Series A, 5.00%, 07/01/2036 | 500,000 | 543,722 | ||||||
| Massachusetts Development Finance Agency Revenue Bonds (Massachusetts Seven Hills Foundation & Affiliates Issue), 5.00%, 09/01/2031 | 270,000 | 296,791 | ||||||
| 840,513 | ||||||||
See accompanying Notes to Financial Statements.
| 2022 Semi-Annual Report | 29 |
Statement of Investments (continued)
April 30, 2022 (Unaudited)
abrdn Intermediate Municipal Income Fund
| Shares or Principal Amount | Value (US$) | |||||||
| MUNICIPAL BONDS (continued) | ||||||||
| Michigan (3.8%) | ||||||||
| Flint Hospital Building Authority Revenue Bonds | ||||||||
| 4.00%, 07/01/2035 | $ | 1,000,000 | $ | 1,003,473 | ||||
| 4.00%, 07/01/2038 | 750,000 | 749,472 | ||||||
| Michigan Finance Authority Revenue Bonds (Cesar Chavez Academy), 3.25%, 02/01/2024 | 195,000 | 192,390 | ||||||
| 1,945,335 | ||||||||
| Missouri (0.4%) | ||||||||
| Plaza at Noah's Ark Community Improvement District Revenue Bonds, 3.00%, 05/01/2022 | 60,000 | 60,000 | ||||||
| State Health & Educational Facilities Authority Revenue Bond (Bethesda Health Group, Inc.), 4.00%, 08/01/2036 | 165,000 | 166,390 | ||||||
| 226,390 | ||||||||
| New Hampshire (1.1%) | ||||||||
| New Hampshire Health & Education Facilities Authority Revenue Bonds (Dartmouth College) | ||||||||
| 5.00%, 08/01/2035 | 250,000 | 277,579 | ||||||
| 5.00%, 08/01/2036 | 245,000 | 272,077 | ||||||
| 549,656 | ||||||||
| New Jersey (5.3%) | ||||||||
| New Jersey Educational Facilities Authority Revenue Bonds (The College of New Jersey) | ||||||||
| Series F, 4.00%, 07/01/2033 | 30,000 | 31,058 | ||||||
| Series F (Pre-refunded @ $100, 07/01/2026), 4.00%, 07/01/2033 | 70,000 | 73,981 | ||||||
| New Jersey Transportation Trust Fund Authority Revenue Bonds, Series A, 5.00%, 12/15/2034 | 2,000,000 | 2,143,040 | ||||||
| Newark Housing Authority Revenue Bonds (Newark Redevelopment Project), 4.00%, 01/01/2037 | 500,000 | 511,910 | ||||||
| 2,759,989 | ||||||||
| New York (15.2%) | ||||||||
| City of Elmira General Obligation Limited Bonds | ||||||||
| 5.00%, 07/01/2025 (b) | 85,000 | 90,283 | ||||||
| 5.00%, 07/01/2033 (b) | 625,000 | 674,422 | ||||||
| City of Poughkeepsie General Obligation Limited Bonds, 5.00%, 06/01/2031 | 145,000 | 153,714 | ||||||
| Hudson Yards Infrastructure Corp. Revenue Bonds, Series A, 5.00%, 02/15/2042 | 1,000,000 | 1,085,929 | ||||||
| Metropolitan Transportation Authority Revenue Bonds | ||||||||
| Series A-1, 5.00%, 11/15/2027 | 695,000 | 741,736 | ||||||
| Series C-1, 5.00%, 11/15/2027 | 1,150,000 | 1,219,910 | ||||||
| Series A-2, VRN, 5.00%, 11/15/2045 (a) | 400,000 | 435,268 | ||||||
| Nassau County Local Economic Assistance Corp. Revenue Bonds (Catholic Health Services), 5.00%, 07/01/2030 | 1,000,000 | 1,046,683 | ||||||
| New York City Water & Sewer System Revenue Bonds, Series EE, 5.00%, 06/15/2037 | 295,000 | 323,576 | ||||||
| New York State Dormitory Authority Revenue Bonds (State University Educational Facilities 3rd Generation), Series A, 5.50%, 05/15/2023 | 1,160,000 | 1,201,568 | ||||||
| Shares or Principal Amount | Value (US$) | |||||||
| New York Transportation Development Corp. Revenue Bonds, AMT, 4.00%, 10/31/2034 | $ | 250,000 | $ | 254,217 | ||||
| Port Authority of New York & New Jersey Revenue Bonds, 5.00%, 10/15/2042 | 560,000 | 605,972 | ||||||
| 7,833,278 | ||||||||
| Ohio (2.7%) | ||||||||
| Buckeye Tobacco Settlement Financing Authority Tobacco Settlement Assets-Backed Revenue Bonds, 5.00%, 06/01/2055 | 110,000 | 106,976 | ||||||
| Ohio Air Quality Development Authority Revenue Bonds (Ohio Valley Electric Corp. Project), Series A, 3.25%, 09/01/2029 | 135,000 | 125,455 | ||||||
| Ohio Higher Educational Facility Commission Revenue Bonds, 4.00%, 07/01/2030 | 1,095,000 | 1,150,695 | ||||||
| 1,383,126 | ||||||||
| Pennsylvania (4.3%) | ||||||||
| Montgomery County Industrial Development Authority Revenue Bonds (Imagine School at Broward), 4.00%, 12/01/2037 | 300,000 | 310,151 | ||||||
| Pennsylvania Turnpike Commission Revenue Bonds, Series A, 5.25%, 07/15/2029 | 850,000 | 992,085 | ||||||
| School Dist. of the City of Erie, General Obligation Limited Bonds, Series A, (AGM ST AID WITHHLDG), 5.00%, 04/01/2034 | 825,000 | 916,114 | ||||||
| 2,218,350 | ||||||||
| Puerto Rico (1.1%) | ||||||||
| Electric Power Authority Revenue Bonds, Series V, 5.25%, 07/01/2026 | 100,000 | 102,879 | ||||||
| Highway & Transportation Authority Revenue Bonds, (AGC), 5.50%, 07/01/2031 | 300,000 | 318,416 | ||||||
| PR Custodial Trust Revenue Bonds (GO PIB 2003A), 5.50%, 07/01/2022 | 126,670 | 126,468 | ||||||
| 547,763 | ||||||||
| Rhode Island (1.5%) | ||||||||
| Tobacco Settlement Financing Corp. Revenue Bonds, Series B, 4.50%, 06/01/2045 | 750,000 | 755,118 | ||||||
| South Carolina (2.1%) | ||||||||
| City of Rock Hill SC Combined Utility System Revenue Bonds | ||||||||
| 5.00%, 01/01/2025 | 500,000 | 530,980 | ||||||
| 5.00%, 01/01/2026 | 500,000 | 541,142 | ||||||
| 1,072,122 | ||||||||
| Tennessee (2.8%) | ||||||||
| Knox County Health Educational & Housing Facilities Board Revenue Bonds (University Health System, Inc.), 5.00%, 09/01/2036 | 500,000 | 535,280 | ||||||
| Metropolitan Government Nashville & Davidson Health & Educational Facilities Revenue Bonds (Trevecca Nazarene University Project), 5.00%, 10/01/2034 | 360,000 | 373,862 | ||||||
See accompanying Notes to Financial Statements.
| 30 | 2022 Semi-Annual Report |
Statement of Investments (concluded)
April 30, 2022 (Unaudited)
abrdn Intermediate Municipal Income Fund
| Shares or Principal Amount | Value (US$) | |||||||
| MUNICIPAL BONDS (continued) | ||||||||
| Tennessee (continued) | ||||||||
| Tennessee Energy Acquisition Corp. Revenue Bonds, Series A, 5.25%, 09/01/2023 | $ | 500,000 | $ | 515,045 | ||||
| 1,424,187 | ||||||||
| Texas (19.4%) | ||||||||
| Arlington Higher Education Finance Corp. Revenue Bonds (Wayside Schools), 4.00%, 08/15/2036 | 100,000 | 90,348 | ||||||
| Harris County Health Facilities Development Corp. Revenue Bonds (SCH Health Care System), Prerefunded/Escrowed to Maturity, Series B, 5.75%, 07/01/2027 | 4,675,000 | 5,155,900 | ||||||
| Matagorda County Navigation District No. 1 Revenue Bonds, Series B-1, 4.00%, 06/01/2030 | 1,000,000 | 1,016,134 | ||||||
| Port of Beaumont Navigation District of Jefferson County Dock & Wharf Facilities Revenue Bonds (Jefferson Railport Terminal II LLC), 4.00%, 01/01/2050 (b) | 1,000,000 | 836,519 | ||||||
| Tarrant County Cultural Education Facilities Finance Corp. Revenue Bonds (Baylor Scott & White Obligated Group), Series A, 5.00%, 11/15/2029 | 800,000 | 869,121 | ||||||
| Tarrant County Cultural Education Facilities Finance Corp. Revenue Bonds (Texas Health Resources Obligated Group), Series A, 4.00%, 02/15/2036 | 1,000,000 | 1,011,385 | ||||||
| Texas Municipal Gas Acquisition & Supply Corp. I Revenue Bonds, Series D, 6.25%, 12/15/2026 | 990,000 | 1,060,245 | ||||||
| 10,039,652 | ||||||||
| Utah (1.3%) | ||||||||
| Salt Lake City Corp. Airport Revenue Bonds, Series B, 5.00%, 07/01/2042 | 100,000 | 107,306 | ||||||
| Utah Charter School Finance Authority Revenue Bonds (Scholar Academy), Series A, 4.50%, 04/15/2048 (a)(b) | 570,000 | 563,778 | ||||||
| 671,084 | ||||||||
| Shares or Principal Amount | Value (US$) | |||||||
| Washington (0.3%) | ||||||||
| State Housing Finance Commission Revenue Bonds (Transforming Age Project), Series A, 5.00%, 01/01/2024 (b) | $ | 180,000 | $ | 182,711 | ||||
| Wisconsin (4.5%) | ||||||||
| Public Finance Authority Revenue Bonds | ||||||||
| 5.00%, 06/15/2029 | 530,000 | 557,613 | ||||||
| 5.00%, 06/15/2034 | 425,000 | 441,747 | ||||||
| Public Finance Authority Revenue Bonds, Series A, 5.00%, 07/01/2038 | 1,000,000 | 1,036,624 | ||||||
| Wisconsin Health & Educational Facilities Authority Revenue Bonds (Froedtert Health, Inc. Obligated Group), Series 2017 A, 5.00%, 04/01/2035 | 250,000 | 268,634 | ||||||
| 2,304,618 | ||||||||
| Total Municipal Bonds | 50,872,580 | |||||||
| SHORT-TERM INVESTMENT (0.2%) | ||||||||
| UNITED STATES (0.2%) | ||||||||
| BlackRock Liquidity Funds MuniCash Portfolio, Institutional Shares | 137,715 | 137,715 | ||||||
| Total Short-Term Investment | 137,715 | |||||||
| Total Investments (Cost $51,439,966) (c)—98.8% | 51,010,295 | |||||||
| Other Assets in Excess of Liabilities—1.2% | 598,276 | |||||||
| Net Assets—100.0% | $ | 51,608,571 | ||||||
| (a) | Variable Rate Instrument. The rate shown is based on the latest available information as of April 30, 2022. Certain variable rate securities are not based on a published reference rate and spread but are determined by the issuer or agent and are based on current market conditions. These securities do not indicate a reference rate and spread in their description. |
| (b) | Denotes a security issued under Regulation S or Rule 144A. |
| (c) | See accompanying Notes to Financial Statements for tax unrealized appreciation/(depreciation) of securities. |
��
See accompanying Notes to Financial Statements.
| 2022 Semi-Annual Report | 31 |
abrdn Short Duration High Yield Municipal Fund (Unaudited)
| Average Annual Total Return1 (For periods ended April 30, 2022) | Six Month† | 1 Yr. | 5 Yr. | Inception2 | ||||||
| Class A | w/o SC | (5.96%) | (4.86%) | 1.36% | 2.33% | |||||
| w/ SC3 | (8.29%) | (7.21%) | 0.85% | 2.03% | ||||||
| Class C4 | w/o SC | (6.40%) | (5.59%) | 1.14% | (2.99%) | |||||
| w/ SC5 | (7.33%) | (6.53%) | 1.14% | (2.99%) | ||||||
| Institutional Class6 | w/o SC | (5.84%) | (4.62%) | 1.59% | 2.58% |
All figures showing the effect of a sales charge (SC) reflect the maximum charge possible because it has the most significant effect on performance data. The total returns shown above do not include the impact of financial statement rounding of the net asset value (NAV) per share and/or financial statement adjustments.
| † | Not annualized |
| 1 | The Fund changed its investment strategy effective February 28, 2019. Performance information for periods prior to February 28, 2019 does not reflect the Fund's current investment strategy. Returns prior to May 7, 2018 reflect the performance of a predecessor fund (the "Predecessor Fund"). Returns of the Predecessor Fund have not been adjusted to reflect the expenses applicable to the respective classes. The Fund and the Predecessor Fund had substantially similar investment objectives and strategies prior to the Fund's adoption of its current investment strategies on February 28, 2019. Please consult the Fund's prospectus for more detail. |
| 2 | Predecessor Fund commenced operations on May 31, 2013. |
| 3 | A 2.50% front-end sales charge was deducted. Prior to February 28, 2019 the front-end sales charge was 4.25%. |
| 4 | Class C returns prior to the commencement of operations of Class C (inception date: 12/18/2020) are based on the previous performance of the Fund's Class A shares (inception date: 5/31/2013). Excluding the effect of any fee waivers or reimbursements, this performance is substantially similar to what each individual class would have produced because all classes invest in the same portfolio of securities. Returns would only differ to the extent of the differences in expenses between the two classes. |
| 5 | A 1.00% contingent deferred sales charge (CDSC) was deducted from the one year return because it is charged when Class C shares are sold within the first year after purchase. |
| 6 | Not subject to any sales charges. |
Performance of a $1,000,000 Investment* (as of April 30, 2022)

| * | Minimum Initial Investment |
Comparative performance of $1,000,000 invested in Institutional Class shares of the abrdn Short Duration High Yield Municipal Fund, The S&P Municipal Bond Short Intermediate Index, a blended benchmark of 30% Bloomberg Barclays 1-10 Year Municipal Bond
Index/70% Bloomberg Barclays 1-10 Year Municipal High Yield Index (the "Blended Index") and the Consumer Price Index (CPI) since inception. Unlike the Fund, the returns for these unmanaged indexes do not reflect any fees, expenses, or sales charges. Investors cannot invest directly in market indexes.
The S&P Municipal Bond Short Intermediate Index consists of bonds in the S&P Municipal Bond Index with a minimum maturity of one year and a maximum maturity of up to, but not including, eight years as measured from the Rebalancing Date.
The Bloomberg Barclays 1-10 Year Municipal Bond Index is an unmanaged index composed of investment-grade municipal bonds with maturity dates of more than one year and less than 10 years.
The Bloomberg Barclays 1-10 Year Municipal High Yield Index is a sub-index of the Bloomberg Barclays Municipal High Yield Bond Index composed of issues with effective maturity dates of 1-10 years and excludes purpose class of Other. The Bloomberg Barclays Municipal High Yield Bond Index is a flagship measure of the non-investment grade and non-rated USD-denominated tax exempt bond market.
The CPI is a measure of the average change over time in the prices paid by urban consumers for a market basket of consumer goods and services.
Investment return and principal value will fluctuate, and when redeemed, shares may be worth more or less than original cost. Past performance is no guarantee of future results. The Average Annual Total Return table and Performance graph do not reflect the deduction of taxes that a shareholder would pay on fund distributions or the redemption of fund shares. Investing in mutual funds involves market risk, including loss of principal. Performance returns assume the reinvestment of all distributions. Total returns reflect waivers and reimbursements in effect, without which returns would have been lower.
| 32 | 2022 Semi-Annual Report |
abrdn Short Duration High Yield Municipal Fund (Unaudited)
Portfolio Summary (as a percentage of net assets)
April 30, 2022 (Unaudited)
| Asset Allocation | ||
| Municipal Bonds | 99.2% | |
| Short-Term Investment | –% | |
| Other Assets in Excess of Liabilities | 0.8% | |
| 100.0% |
| Top Ten Holdings | ||
| Maryland Industrial Development Financing Authority Revenue Bonds (Occidental Petroleum Corp.) 03/01/2030 | 3.5% | |
| Madison Country Capital Resource Corp. Revenue Bonds (Cazenovia College Project), Series A 09/01/2022 | 1.8% | |
| Arizona Industrial Development Authority Revenue Bonds (Legacy Cares, Inc.), Series A 07/01/2030 | 1.8% | |
| Colorado Health Facilities Authority Revenue Bonds (Aberdeen Ridge) 05/15/2030 | 1.8% | |
| Iowa Finance Authority Revenue Bonds, Series B, FRN 05/15/2056 | 1.5% | |
| Mississippi Business Finance Corp. Revenue Bonds (PSL-North America), Series A 11/01/2032 | 1.4% | |
| Washington State Housing Finance Commission Revenue Bonds (Eliseo Project), Series A 01/01/2031 | 1.3% | |
| Shakopee Minnesota Senior Housing Revenue Bonds (Benedictine Living Community of Shakopee LLC Project) 11/01/2058 | 1.3% | |
| Utah Charter School Finance Authority Revenue Bonds (Wasatch Waldorf Charter School, Inc.), Series A 05/15/2048 | 1.2% | |
| Metropolitan Transportation Authority Revenue Bonds 11/15/2035 | 1.2% |
| States | ||
| New York | 13.8% | |
| Florida | 9.1% | |
| Wisconsin | 6.5% | |
| Texas | 6.0% | |
| Arizona | 5.2% | |
| Pennsylvania | 5.0% | |
| Illinois | 5.0% | |
| Maryland | 5.0% | |
| Washington | 4.2% | |
| Ohio | 3.6% | |
| Mississippi | 3.4% | |
| Colorado | 3.3% | |
| California | 3.0% | |
| Utah | 2.6% | |
| Iowa | 2.6% | |
| Puerto Rico | 2.3% | |
| Other, less than 2% each | 18.6% | |
| Short-Term Investment | –% | |
| Other Assets in Excess of Liabilities | 0.8% | |
| 100.0% |
Amounts listed as "-" are 0% or round to 0%.
| 2022 Semi-Annual Report | 33 |
Statement of Investments
April 30, 2022 (Unaudited)
abrdn Short Duration High Yield Municipal Fund
| Shares or Principal Amount | Value (US$) | |||||
| MUNICIPAL BONDS (99.2%) | ||||||
| Alabama (0.1%) | ||||||
Jemison Water & Sewer Revenue Bonds, Series A, 3.50%, 03/01/2026 | $ | 235,000 | $ | 227,984 | ||
| Arizona (5.2%) | ||||||
Arizona Industrial Development Authority Revenue Bonds (Great Lakes Senior Living Communities LLC Project Third Tier), Series C 5.13%, 01/01/2034 (a) | 775,000 | 572,110 | ||||
| 5.13%, 01/01/2035 (a) | 815,000 | 591,430 | ||||
Arizona Industrial Development Authority Revenue Bonds (Kaizen Education Foundation) 5.00%, 07/01/2022 (a) | 385,000 | 386,342 | ||||
| 5.00%, 07/01/2023 (a) | 405,000 | 414,720 | ||||
Arizona Industrial Development Authority Revenue Bonds (KIPP New York City Public Charter Schools – JEROME Facility Project), Series B 5.00%, 07/01/2027 | 160,000 | 166,259 | ||||
| 5.00%, 07/01/2028 | 170,000 | 176,344 | ||||
| 5.00%, 07/01/2029 | 155,000 | 160,406 | ||||
| 5.00%, 07/01/2030 | 185,000 | 191,057 | ||||
| 5.00%, 07/01/2031 | 195,000 | 201,034 | ||||
| 5.00%, 07/01/2032 | 205,000 | 211,115 | ||||
| 5.00%, 07/01/2033 | 210,000 | 216,024 | ||||
| 4.00%, 07/01/2034 | 225,000 | 213,321 | ||||
| 4.00%, 07/01/2035 | 235,000 | 221,645 | ||||
| 4.00%, 07/01/2036 | 210,000 | 197,290 | ||||
Arizona Industrial Development Authority Revenue Bonds (KIPP New York City Public Charter Schools – MACOMBS Facility Project), Series A 5.00%, 07/01/2027 | 55,000 | 57,358 | ||||
| 5.00%, 07/01/2028 | 60,000 | 62,692 | ||||
| 5.00%, 07/01/2029 | 60,000 | 62,830 | ||||
| 5.00%, 07/01/2030 | 65,000 | 68,173 | ||||
| 5.00%, 07/01/2031 | 65,000 | 68,258 | ||||
| 5.00%, 07/01/2032 | 315,000 | 330,087 | ||||
| 5.00%, 07/01/2033 | 315,000 | 329,365 | ||||
| 4.00%, 07/01/2034 | 325,000 | 308,130 | ||||
| 4.00%, 07/01/2035 | 305,000 | 287,667 | ||||
| 4.00%, 07/01/2036 | 310,000 | 291,238 | ||||
Arizona Industrial Development Authority Revenue Bonds (Legacy Cares, Inc.), Series A 6.75%, 07/01/2030 (a) | 6,000,000 | 6,431,930 | ||||
| 5.50%, 07/01/2031 (a) | 100,000 | 98,440 | ||||
| 6.00%, 07/01/2051 (a) | 800,000 | 797,736 | ||||
Arizona Industrial Development Authority Revenue Bonds (Somerset Academy of Las Vegas), 3.00%, 12/15/2031 (a) | 655,000 | 571,010 | ||||
Arizona Industrial Development Authority Revenue Refunding Bonds (Doral Academy of Northern Nevada Project) 4.00%, 07/15/2026 (a) | 125,000 | 125,378 | ||||
| 4.00%, 07/15/2027 (a) | 125,000 | 124,878 | ||||
| 4.00%, 07/15/2028 (a) | 185,000 | 183,587 | ||||
| 4.00%, 07/15/2029 (a) | 200,000 | 196,916 | ||||
| 4.00%, 07/15/2030 (a) | 215,000 | 209,701 | ||||
| Shares or Principal Amount | Value (US$) | |||||
| 4.00%, 07/15/2031 (a) | $ | 215,000 | $ | 207,120 | ||
| 4.00%, 07/15/2032 (a) | 225,000 | 214,801 | ||||
| 4.00%, 07/15/2033 (a) | 185,000 | 175,826 | ||||
| 4.00%, 07/15/2034 (a) | 185,000 | 174,714 | ||||
| 4.00%, 07/15/2035 (a) | 255,000 | 239,492 | ||||
| 4.00%, 07/15/2036 (a) | 250,000 | 233,234 | ||||
| 4.00%, 07/15/2037 (a) | 275,000 | 254,807 | ||||
La Paz County Industrial Development Authority Revenue Bonds (Charter School Solutions), Series A, 5.00%, 02/15/2026 (a) | 410,000 | 422,940 | ||||
Maricopa County Industrial Development Authority Revenue Bonds (Ottawa University), 5.00%, 10/01/2026 (a) | 300,000 | 307,524 | ||||
| 5.13%, 10/01/2030 (a) | 425,000 | 448,284 | ||||
Maricopa County Industrial Development Authority Revenue Bonds (Paragon Management, Inc.), 4.00%, 07/01/2026 (a) | 1,250,000 | 1,270,906 | ||||
| 18,474,119 | ||||||
| Arkansas (1.2%) | ||||||
Arkansas Development Finance Authority Revenue Bonds (Central Arkansas Radiation Therapy Institute, Inc.) 4.00%, 07/01/2023 | 105,000 | 105,853 | ||||
| 4.00%, 07/01/2024 | 100,000 | 100,597 | ||||
| 4.00%, 07/01/2025 | 140,000 | 140,672 | ||||
| 4.00%, 07/01/2026 | 185,000 | 185,766 | ||||
| 4.00%, 07/01/2027 | 220,000 | 220,404 | ||||
| 4.00%, 07/01/2028 | 230,000 | 227,814 | ||||
| 3.00%, 07/01/2032 | 350,000 | 306,776 | ||||
| 3.13%, 07/01/2036 | 360,000 | 304,660 | ||||
County of Baxter Hospital Revenue Bonds (Baxter Regional Medical Center), Series A 5.00%, 09/01/2025 | 1,000,000 | 1,057,228 | ||||
| 5.00%, 09/01/2026 | 1,490,000 | 1,595,084 | ||||
| 4,244,854 | ||||||
| California (3.0%) | ||||||
California Municipal Finance Authority Revenue Bonds (Simpson University), Series A 5.00%, 10/01/2026 | 40,000 | 40,052 | ||||
| 5.13%, 10/01/2030 | 1,020,000 | 1,009,324 | ||||
California Municipal Finance Authority Revenue Bonds (United Airlines, Inc.), 4.00%, 07/15/2029 | 3,000,000 | 2,895,922 | ||||
California Public Finance Authority Revenue Bonds (Kendal at Sonoma Obligated Group) 2.38%, 11/15/2028 (a) | 1,565,000 | 1,470,839 | ||||
| 3.13%, 05/15/2029 (a) | 3,075,000 | 2,882,614 | ||||
| 5.00%, 11/15/2036 (a) | 410,000 | 419,040 | ||||
California Statewide Communities Development Authority Revenue Bonds (Provident Group-Ponoma Properties LLC), Series A, 5.60%, 01/15/2036 (a) | 1,800,000 | 1,819,812 | ||||
| 10,537,603 | ||||||
See accompanying Notes to Financial Statements.
| 34 | 2022 Semi-Annual Report |
Statement of Investments (continued)
April 30, 2022 (Unaudited)
abrdn Short Duration High Yield Municipal Fund
Shares or Principal Amount | Value (US$) | |||||
| MUNICIPAL BONDS (continued) | ||||||
| Colorado (3.3%) | ||||||
Colorado Educational & Cultural Facilities Authority Revenue Bonds (Aspen View Academy, Inc.) 4.00%, 05/01/2024 | $ | 150,000 | $ | 152,022 | ||
| 4.00%, 05/01/2027 | 65,000 | 64,954 | ||||
| 4.00%, 05/01/2029 | 145,000 | 142,660 | ||||
| 4.00%, 05/01/2030 | 120,000 | 116,829 | ||||
| 4.00%, 05/01/2036 | 175,000 | 165,948 | ||||
Colorado Health Facilities Authority Revenue Bonds, Series B 5.00%, 05/15/2028 | 100,000 | 102,838 | ||||
| 5.00%, 05/15/2028 | 400,000 | 411,352 | ||||
Colorado Health Facilities Authority Revenue Bonds (Aberdeen Ridge) 2.13%, 05/15/2028 | 1,750,000 | 1,631,936 | ||||
| 2.63%, 05/15/2029 | 2,000,000 | 1,842,115 | ||||
Colorado Health Facilities Authority Revenue Bonds (Aberdeen Ridge), 3.50%, 05/15/2030 | 6,950,000 | 6,353,500 | ||||
Colorado Health Facilities Authority Revenue Bonds (Frasier Meadows Manor, Inc.) 5.00%, 05/15/2025 | 320,000 | 329,082 | ||||
| Series B, 5.00%, 05/15/2029 | 585,000 | 601,603 | ||||
| 11,914,839 | ||||||
| Connecticut (1.6%) | ||||||
City of West Haven General Obligation Unlimited Bonds Series A, 5.00%, 11/01/2025 | 325,000 | 349,543 | ||||
| Series B, 5.00%, 11/01/2025 | 240,000 | 258,124 | ||||
| Series A, 5.00%, 11/01/2026 | 325,000 | 354,448 | ||||
| Series B, 5.00%, 11/01/2026 | 200,000 | 218,122 | ||||
| Series A, 5.00%, 11/01/2027 | 635,000 | 700,024 | ||||
| Series B, 5.00%, 11/01/2027 | 200,000 | 220,480 | ||||
State Health & Educational Facilities Authority Revenue Bond (McLean Affiliates Obligated Group) Series B-2, 2.75%, 01/01/2026 (a) | 650,000 | 634,678 | ||||
| Series B-1, 3.25%, 01/01/2027 (a) | 750,000 | 738,488 | ||||
| Series A, 5.00%, 01/01/2030 (a) | 500,000 | 525,845 | ||||
State Health & Educational Facilities Authority Revenue Bond (University of Hartford) 5.00%, 07/01/2025 | 400,000 | 417,474 | ||||
| 5.00%, 07/01/2026 | 575,000 | 604,686 | ||||
| 5.00%, 07/01/2027 | 430,000 | 455,415 | ||||
| 5.00%, 07/01/2029 | 300,000 | 320,650 | ||||
| 5,797,977 | ||||||
| Florida (9.1%) | ||||||
Alachua County Health Facilities Authority Revenue Bonds (Oak Hammock at The University Of Florida, Inc.) 4.00%, 10/01/2022 | 85,000 | 85,439 | ||||
| 4.00%, 10/01/2023 | 85,000 | 86,376 | ||||
| 4.00%, 10/01/2024 | 110,000 | 112,486 | ||||
| 4.00%, 10/01/2025 | 100,000 | 102,498 | ||||
| 4.00%, 10/01/2026 | 105,000 | 107,515 | ||||
Shares or Principal Amount | Value (US$) | |||||
| 4.00%, 10/01/2027 | $ | 145,000 | $ | 148,111 | ||
| 4.00%, 10/01/2028 | 155,000 | 157,540 | ||||
| 4.00%, 10/01/2029 | 265,000 | 267,024 | ||||
| 4.00%, 10/01/2030 | 100,000 | 100,068 | ||||
| 4.00%, 10/01/2031 | 140,000 | 138,912 | ||||
Capital Trust Agency, Inc., Zero Coupon%, 01/01/2024 (b)(d)(f) | 248,055 | — | ||||
Capital Trust Agency, Inc. Revenue Bonds (Educational Growth Fund LLC), Series A-1, 3.38%, 07/01/2031 (a) | 1,745,000 | 1,617,502 | ||||
Capital Trust Agency, Inc. Revenue Bonds (Wonderful Foundations Charter School Holdings LLC), 4.50%, 01/01/2035 (a) | 300,000 | 277,526 | ||||
Celebration Pointe Community Development District No.1 Special Assessment Revenue Bonds, 4.75%, 05/01/2024 | 40,000 | 40,892 | ||||
City of Lakeland Revenue Bonds, Series B 4.00%, 10/01/2033 | 1,095,000 | 1,142,608 | ||||
| 4.00%, 10/01/2034 | 1,140,000 | 1,187,648 | ||||
County Of Lake Florida Retirement Facility Revenue Bonds (Waterman Communities, Inc.) Series B-3, 3.38%, 08/15/2026 | 1,000,000 | 982,530 | ||||
| Series B-2, 3.75%, 08/15/2027 | 1,500,000 | 1,468,242 | ||||
Florida Development Finance Corp. Educational Facilities Revenue Bonds (Imagine School At Broward Project), Series A 4.00%, 12/15/2029 (a) | 530,000 | 525,367 | ||||
| 5.00%, 12/15/2034 (a) | 530,000 | 547,275 | ||||
Florida Development Finance Corp. Educational Facilities Revenue Bonds (Miami Arts Charter School Project), Series A, 5.00%, 06/15/2024 (a) | 100,000 | 97,262 | ||||
Florida Development Finance Corp. Revenue Bonds (Brightline Trains Florida LLC), Series B, 7.38%, 01/01/2049 (a) | 2,000,000 | 2,044,782 | ||||
Florida Development Finance Corp. Revenue Bonds (Glenridge on Palmer Ranch Obligated Group) 3.00%, 06/01/2022 | 115,000 | 114,930 | ||||
| 3.00%, 06/01/2023 | 115,000 | 114,023 | ||||
| 4.00%, 06/01/2024 | 105,000 | 105,080 | ||||
| 4.00%, 06/01/2025 | 110,000 | 109,588 | ||||
| 4.00%, 06/01/2026 | 110,000 | 108,775 | ||||
| 5.00%, 06/01/2031 | 300,000 | 299,555 | ||||
Florida Development Finance Corp. Revenue Bonds (Global Outreach Charter Academy Obligated Group), Series A 4.00%, 06/30/2027 (a) | 150,000 | 151,177 | ||||
| 4.00%, 06/30/2028 (a) | 195,000 | 195,520 | ||||
| 4.00%, 06/30/2029 (a) | 205,000 | 203,856 | ||||
| 4.00%, 06/30/2030 (a) | 215,000 | 211,900 | ||||
| 4.00%, 06/30/2031 (a) | 225,000 | 220,425 | ||||
| 4.00%, 06/30/2036 (a) | 625,000 | 599,470 | ||||
Florida Development Finance Corp. Revenue Bonds (Mayflower Retirement Center, Inc. Obligated Group) Series A, 4.00%, 06/01/2022 (a) | 220,000 | 220,072 | ||||
| Series A, 4.00%, 06/01/2023 (a) | 225,000 | 225,890 | ||||
See accompanying Notes to Financial Statements.
| 2022 Semi-Annual Report | 35 |
Statement of Investments (continued)
April 30, 2022 (Unaudited)
abrdn Short Duration High Yield Municipal Fund
Shares or Principal Amount | Value (US$) | |||||
| MUNICIPAL BONDS (continued) | ||||||
| Florida (continued) | ||||||
| Series A, 4.00%, 06/01/2024 (a) | $ | 475,000 | $ | 476,680 | ||
| Series A, 4.00%, 06/01/2025 (a) | 495,000 | 494,703 | ||||
| 1.75%, 06/01/2026 (a) | 1,020,000 | 949,014 | ||||
| 2.38%, 06/01/2027 (a) | 835,000 | 772,099 | ||||
Florida Development Finance Corp. Solid Waste Revenue Bonds (Waste Pro USA, Inc.) 5.00%, 05/01/2029 (a) | 2,000,000 | 2,057,792 | ||||
| 5.00%, 08/01/2029 (a)(c) | 2,000,000 | 2,007,251 | ||||
Lee County Industrial Development Authority Refunding Revenue Bonds (Shell Point Obligated Group) 4.00%, 11/15/2022 | 155,000 | 156,231 | ||||
| 4.00%, 11/15/2023 | 170,000 | 173,521 | ||||
| 4.00%, 11/15/2024 | 190,000 | 195,785 | ||||
| 4.00%, 11/15/2025 | 210,000 | 218,199 | ||||
| 4.00%, 11/15/2026 | 185,000 | 193,105 | ||||
| 4.00%, 11/15/2027 | 245,000 | 256,004 | ||||
| 4.00%, 11/15/2028 | 300,000 | 313,325 | ||||
| 4.00%, 11/15/2029 | 365,000 | 378,597 | ||||
| 4.00%, 11/15/2030 | 465,000 | 479,292 | ||||
| 4.00%, 11/15/2031 | 555,000 | 569,117 | ||||
| 4.00%, 11/15/2032 | 375,000 | 383,002 | ||||
Palm Beach County Educational Facilities Authority Revenue Bonds (Palm Beach Atlantic University, Inc.) 4.00%, 10/01/2022 | 205,000 | 206,268 | ||||
| 4.00%, 10/01/2023 | 220,000 | 222,569 | ||||
| 4.00%, 10/01/2024 | 230,000 | 233,129 | ||||
| 4.00%, 10/01/2025 | 240,000 | 243,617 | ||||
| 4.00%, 10/01/2026 | 245,000 | 248,620 | ||||
Palm Beach County Revenue Bonds (Provident Group – LU Properties LLC – LYNN University Housing Project), Series A 4.25%, 06/01/2031 (a) | 1,200,000 | 1,172,561 | ||||
| 5.00%, 06/01/2057 (a) | 400,000 | 410,555 | ||||
Palm Beach County Revenue Bonds (Provident Group – PBAU Properties LLC – Palm Beach Atlantic University Housing Project), Series A, 5.00%, 04/01/2029 (a) | 1,440,000 | 1,476,253 | ||||
Polk County Industrial Development Authority Revenue Bonds (Carpenter's Home Estates, Inc. Project) Series A, 5.00%, 01/01/2029 | 360,000 | 383,228 | ||||
| 5.00%, 01/01/2039 | 240,000 | 249,630 | ||||
Saint Johns County Industrial Development Authority Revenue Bonds (Life Care Ponte Vedra Obligated Group) 4.00%, 12/15/2022 | 110,000 | 110,436 | ||||
| 4.00%, 12/15/2023 | 115,000 | 115,911 | ||||
| 4.00%, 12/15/2024 | 140,000 | 141,243 | ||||
| 4.00%, 12/15/2025 | 180,000 | 180,958 | ||||
| 4.00%, 12/15/2026 | 190,000 | 190,152 | ||||
| 4.00%, 12/15/2027 | 215,000 | 213,604 | ||||
| 4.00%, 12/15/2028 | 205,000 | 201,715 | ||||
| 4.00%, 12/15/2029 | 225,000 | 219,220 | ||||
| 4.00%, 12/15/2030 | 200,000 | 193,887 | ||||
| 4.00%, 12/15/2031 | 210,000 | 202,027 | ||||
Shares or Principal Amount | Value (US$) | |||||
Seminole County Industrial Development Authority Revenue Bonds (Galileo School Foundation, Inc.), Series A 4.00%, 06/15/2024 (a) | $ | 130,000 | $ | 130,100 | ||
| 4.00%, 06/15/2025 (a) | 105,000 | 104,753 | ||||
| 4.00%, 06/15/2026 (a) | 155,000 | 153,949 | ||||
| 4.00%, 06/15/2027 (a) | 235,000 | 232,208 | ||||
| 4.00%, 06/15/2028 (a) | 250,000 | 245,204 | ||||
| 4.00%, 06/15/2029 (a) | 255,000 | 248,056 | ||||
| 4.00%, 06/15/2031 (a) | 275,000 | 262,617 | ||||
| 4.00%, 06/15/2036 (a) | 315,000 | 291,807 | ||||
| 32,475,858 | ||||||
| Georgia (0.7%) | ||||||
Main Street Natural Gas, Inc. Revenue Bonds, Series A 5.00%, 05/15/2030 | 200,000 | 214,974 | ||||
| 5.00%, 05/15/2036 | 1,970,000 | 2,163,732 | ||||
| 2,378,706 | ||||||
| Idaho (0.2%) | ||||||
Idaho Housing & Finance Association Revenue Bonds (Idaho Arts Charter School, Inc.), Series A, 4.00%, 12/01/2026 | 700,000 | 700,620 | ||||
Idaho Housing & Finance Association Revenue Bonds (Victory Charter School), Series A, 4.00%, 07/01/2026 | 80,000 | 80,182 | ||||
| 780,802 | ||||||
| Illinois (5.0%) | ||||||
Chicago Board of Education General Obligation Unlimited Bonds Series C, 5.00%, 12/01/2022 | 600,000 | 609,965 | ||||
| Series A, 5.00%, 12/01/2028 | 200,000 | 221,728 | ||||
Cook County School District No. 144 Prairie Hills General Obligation Unlimited Bonds, Series A, 4.00%, 12/01/2033 | 600,000 | 620,162 | ||||
Governors State University Certificates of Participation (Capital Improvement Project), 5.00%, 07/01/2026 | 400,000 | 434,322 | ||||
Illinois Finance Authority Educational Facility Revenue Bonds (Rogers Park Montessori School), 5.00%, 02/01/2024 | 110,000 | 111,314 | ||||
Illinois Finance Authority Revenue Bonds (Acero Charter Schools, Inc. Obligated Group) 4.00%, 10/01/2027 (a) | 405,000 | 399,177 | ||||
| 4.00%, 10/01/2028 (a) | 580,000 | 568,095 | ||||
| 4.00%, 10/01/2029 (a) | 910,000 | 883,240 | ||||
| 4.00%, 10/01/2030 (a) | 630,000 | 605,987 | ||||
| 4.00%, 10/01/2032 (a) | 685,000 | 649,102 | ||||
| 4.00%, 10/01/2033 (a) | 1,060,000 | 1,000,383 | ||||
| 4.00%, 10/01/2034 (a) | 445,000 | 417,541 | ||||
Illinois Finance Authority Revenue Bonds (Benedictine University) 5.00%, 10/01/2025 | 1,035,000 | 1,081,212 | ||||
| 5.00%, 10/01/2028 | 120,000 | 127,568 | ||||
| 5.00%, 10/01/2029 | 200,000 | 213,600 | ||||
| 5.00%, 10/01/2030 | 100,000 | 106,810 | ||||
See accompanying Notes to Financial Statements.
| 36 | 2022 Semi-Annual Report |
Statement of Investments (continued)
April 30, 2022 (Unaudited)
abrdn Short Duration High Yield Municipal Fund
Shares or Principal Amount | Value (US$) | |||||
| MUNICIPAL BONDS (continued) | ||||||
| Illinois (continued) | ||||||
Illinois Finance Authority Revenue Bonds (CHF-Chicago LLC), Series A 5.00%, 02/15/2027 | $ | 420,000 | $ | 437,168 | ||
| 5.00%, 02/15/2028 | 400,000 | 415,957 | ||||
| 5.00%, 02/15/2029 | 520,000 | 538,000 | ||||
| 5.00%, 02/15/2030 | 335,000 | 344,998 | ||||
| 5.00%, 02/15/2031 | 370,000 | 380,340 | ||||
| 5.00%, 02/15/2032 | 225,000 | 230,542 | ||||
Illinois Finance Authority Revenue Bonds (Chicago Charter School Foundation) 5.00%, 12/01/2028 | 250,000 | 263,690 | ||||
| 5.00%, 12/01/2029 | 315,000 | 331,530 | ||||
Illinois Finance Authority Revenue Bonds (Plymouth Place Obligated Group) 5.00%, 05/15/2032 | 275,000 | 287,812 | ||||
| 5.00%, 05/15/2033 | 290,000 | 301,316 | ||||
| 5.00%, 05/15/2034 | 300,000 | 309,904 | ||||
| 5.00%, 05/15/2035 | 315,000 | 323,519 | ||||
| 5.00%, 05/15/2036 | 330,000 | 336,969 | ||||
Metropolitan Pier & Exposition Authority Revenue Bonds 5.00%, 12/15/2025 | 295,000 | 312,912 | ||||
| 5.00%, 12/15/2027 | 100,000 | 107,703 | ||||
State of Illinois General Obligation Unlimited Bonds 5.00%, 08/01/2024 | 2,000,000 | 2,018,292 | ||||
| 4.00%, 02/01/2030 | 745,000 | 758,835 | ||||
Village of Matteson Revenue Bonds 5.00%, 12/01/2026 | 150,000 | 164,266 | ||||
| 5.00%, 12/01/2027 | 150,000 | 166,574 | ||||
| 5.00%, 12/01/2028 | 350,000 | 388,465 | ||||
Village of Matteson Tax Allocation Bonds, 6.50%, 12/01/2035 | 1,220,000 | 1,260,565 | ||||
| 17,729,563 | ||||||
| Indiana (0.9%) | ||||||
City of Valparaiso Exempt Facilities Revenue Bonds (Pratt Paper LLC), 5.88%, 01/01/2024 | 100,000 | 102,572 | ||||
Hammond Local Public Improvement Bond Bank Revenue Bonds, Series B, 4.63%, 07/15/2023 (a) | 660,000 | 662,440 | ||||
Indiana Finance Authority Revenue Bonds (Earlham College, Inc.), 5.00%, 10/01/2032 | 2,250,000 | 2,307,890 | ||||
| 3,072,902 | ||||||
| Iowa (2.6%) | ||||||
Iowa Finance Authority Revenue Bonds Series A, 4.00%, 05/15/2029 | 2,490,000 | 2,465,889 | ||||
| Series A, 4.00%, 05/15/2030 | 1,260,000 | 1,235,374 | ||||
| Series B, FRN, 0.75%, 05/15/2056 (c) | 5,500,000 | 5,425,836 | ||||
| 9,127,099 |
Shares or Principal Amount | Value (US$) | |||||
| Kansas (0.5%) | ||||||
City of Manhattan Revenue Bonds (Meadowlark Hills Retirement Community Obligated Group) Series A, 4.00%, 06/01/2025 | $ | 205,000 | $ | 207,304 | ||
| Series A, 4.00%, 06/01/2026 | 315,000 | 318,063 | ||||
| 2.38%, 06/01/2027 | 430,000 | 407,283 | ||||
| Series A, 4.00%, 06/01/2027 | 330,000 | 331,197 | ||||
| 2.88%, 06/01/2028 | 375,000 | 352,043 | ||||
| Series A, 4.00%, 06/01/2028 | 300,000 | 299,031 | ||||
| 1,914,921 | ||||||
| Kentucky (0.9%) | ||||||
County of Meade, Kentucky (Nucor Steel Brandenburg Project) Series 2021A-1 Industrial Building Revenue Bonds, Series A-1, AMT, VRDN, 0.59%, 08/01/2061 (c) | 2,155,000 | 2,155,000 | ||||
Kentucky Economic Development Finance Authority Revenue Bonds (Christian Care Communities Obligated Group), 4.25%, 07/01/2031 | 1,315,000 | 1,206,689 | ||||
| 3,361,689 | ||||||
| Louisiana (1.4%) | ||||||
Louisiana Local Government Environmental Facilities & Community Development Authority Revenue Bonds (Provident Group – ULM Properties LLC – University Of Louisiana At Manroe Project), Series A, 5.00%, 07/01/2029 (a) | 1,000,000 | 967,213 | ||||
Louisiana Local Government Environmental Facilities & Community Development Authority Revenue Bonds (St. James Place of Baton Rouge), Series A, 5.50%, 11/15/2025 | 250,000 | 254,332 | ||||
Louisiana Local Government Environmental Facilities & Community Development Authority Revenue Bonds (The Glen System Retirement Project), Series A 5.00%, 01/01/2024 | 180,000 | 178,970 | ||||
| 5.00%, 01/01/2025 | 370,000 | 365,361 | ||||
| 5.00%, 01/01/2026 | 390,000 | 381,691 | ||||
| 5.00%, 01/01/2027 | 410,000 | 396,738 | ||||
| 5.00%, 01/01/2028 | 430,000 | 411,568 | ||||
| 5.00%, 01/01/2029 | 450,000 | 425,551 | ||||
Louisiana Local Government Environmental Facilities & Community Development Authority Student Housing Revenue Bonds (Provident Group – ULM Properties LLC – University Of Louisiana At Manroe Project), Series A, 5.00%, 07/01/2039 (a) | 1,000,000 | 895,657 | ||||
Louisiana Public Facilities Authority Revenue Bonds (Young Audiences Charter School Project), Series A, 5.00%, 04/01/2030 (a) | 400,000 | 394,846 | ||||
Parish of St. Charles Gulf Opportunity Zone Revenue Bonds (Valero Project), 4.00%, 12/01/2040 (c) | 315,000 | 315,489 | ||||
| 4,987,416 | ||||||
See accompanying Notes to Financial Statements.
| 2022 Semi-Annual Report | 37 |
Statement of Investments (continued)
April 30, 2022 (Unaudited)
abrdn Short Duration High Yield Municipal Fund
Shares or Principal Amount | Value (US$) | |||||
| MUNICIPAL BONDS (continued) | ||||||
| Maryland (5.0%) | ||||||
Anne Arundel County Consolidated Special Taxing District Bonds (Villages at Two Rivers Project), 4.20%, 07/01/2024 | $ | 70,000 | $ | 70,703 | ||
Frederick County Educational Facilities Revenue Bonds (Mount St. Marys University), Series A 5.00%, 09/01/2027 (a) | 1,495,000 | 1,542,400 | ||||
| 5.00%, 09/01/2032 (a) | 740,000 | 761,193 | ||||
Maryland Economic Development Corp. Revenue Bonds (CONSOL Marine Terminal, Inc.), 5.75%, 09/01/2025 | 1,445,000 | 1,448,150 | ||||
Maryland Industrial Development Financing Authority Revenue Bonds (Occidental Petroleum Corp.), 1.25%, 03/01/2030 (c) | 12,510,000 | 12,510,000 | ||||
The Mayor and Council of Rockville Economic Development Revenue Bonds (King Farm Presbyterian Retirement Community, Inc.) Series A-2, 5.00%, 11/01/2025 | 705,000 | 729,871 | ||||
| 5.00%, 11/01/2027 | 600,000 | 623,035 | ||||
| 17,685,352 | ||||||
| Massachusetts (1.8%) | ||||||
Lynn Housing Authority & Neighborhood Development Revenue Bonds, 4.00%, 10/01/2022 | 115,000 | 115,485 | ||||
Massachusetts Development Finance Agency Revenue Bonds (Linden Ponds, Inc.), 4.00%, 11/15/2023 (a) | 430,000 | 436,115 | ||||
Massachusetts Development Finance Agency Revenue Bonds (NewBridge on The Charles, Inc.) 4.00%, 10/01/2025 (a) | 500,000 | 527,556 | ||||
| 4.00%, 10/01/2026 (a) | 500,000 | 528,017 | ||||
| 4.00%, 10/01/2027 (a) | 450,000 | 474,963 | ||||
Massachusetts Development Finance Agency Revenue Bonds (Provident Commonwealth Education Resource, Inc.), 5.00%, 10/01/2024 | 1,500,000 | 1,549,789 | ||||
Massachusetts Development Finance Agency Revenue Bonds (Wellforce Issue), Series A 5.00%, 07/01/2033 | 500,000 | 546,081 | ||||
| 5.00%, 07/01/2034 | 300,000 | 327,257 | ||||
Massachusetts Development Finance Agency, Massachusetts Seven Hills Foundation And Affiliates Issue 5.00%, 09/01/2022 | 170,000 | 171,523 | ||||
| 5.00%, 09/01/2023 | 135,000 | 139,286 | ||||
| 5.00%, 09/01/2024 | 225,000 | 236,443 | ||||
| 5.00%, 09/01/2025 | 255,000 | 272,446 | ||||
| 5.00%, 09/01/2026 | 185,000 | 199,671 | ||||
| 5.00%, 09/01/2027 | 200,000 | 217,191 | ||||
| 5.00%, 09/01/2028 | 220,000 | 239,487 | ||||
| 5.00%, 09/01/2029 | 240,000 | 261,784 | ||||
| 5.00%, 09/01/2030 | 255,000 | 278,942 | ||||
| 6,522,036 | ||||||
Shares or Principal Amount | Value (US$) | |||||
| Michigan (1.3%) | ||||||
Calhoun County Hospital Finance Authority Revenue Bonds (Ella E.M. Brown Charitable Circle), 5.00%, 02/15/2024 | $ | 500,000 | $ | 516,485 | ||
Charyl Stockwell Academy Revenue Bonds, 4.88%, 10/01/2023 | 40,000 | 39,856 | ||||
Kalamazoo Economic Development Corp. Revenue Bonds (Heritage Community of Kalamazoo Obligated Group) 2.63%, 05/15/2025 | 1,130,000 | 1,099,866 | ||||
| 5.00%, 05/15/2032 | 1,795,000 | 1,862,814 | ||||
Michigan Finance Authority Public School Academy Limited Revenue Bond (Cesar Chavez Academy Project), 4.00%, 02/01/2029 | 700,000 | 680,191 | ||||
Michigan Strategic Fund Revenue Bonds (Graphic Packaging International, LLC Coated Recycled Board Machine), AMT, VRN, 4.00%, 10/01/2061 (c) | 500,000 | 510,535 | ||||
| 4,709,747 | ||||||
| Minnesota (1.5%) | ||||||
Rice County Educational Facility Revenue Bonds (Shattuck-St Mary's School), Series A, 5.00%, 08/01/2022 (a) | 950,000 | 958,525 | ||||
Shakopee Minnesota Senior Housing Revenue Bonds (Benedictine Living Community of Shakopee LLC Project), 5.85%, 11/01/2058 (a)(c) | 4,500,000 | 4,550,335 | ||||
| 5,508,860 | ||||||
| Mississippi (3.4%) | ||||||
Mississippi Business Finance Corp. Revenue Bonds (Huntington Ingalls Industries, Inc.), 4.55%, 12/01/2028 | 980,000 | 951,226 | ||||
Mississippi Business Finance Corp. Revenue Bonds (PSL-North America), Series A, 1.98%, 11/01/2032 (c) | 5,000,000 | 5,000,000 | ||||
Mississippi Business Finance Corp. Revenue Bonds (Waste Pro USA, Inc.), AMT, VRN, 5.00%, 02/01/2036 (a)(c) | 1,500,000 | 1,505,439 | ||||
Mississippi Development Bank Obligation Bonds (Mangolia Regional Health Centre) 5.00%, 10/01/2022 (a) | 400,000 | 403,934 | ||||
| 5.00%, 10/01/2023 (a) | 415,000 | 424,085 | ||||
| 5.00%, 10/01/2024 (a) | 440,000 | 456,602 | ||||
| 5.00%, 10/01/2025 (a) | 660,000 | 693,148 | ||||
Mississippi Development Bank Revenue Bonds (Hancock County Gomesa Project), 4.55%, 11/01/2039 (a) | 2,000,000 | 1,941,258 | ||||
Mississippi Pearl General Obligation Unlimited Bonds, 3.00%, 07/15/2022 | 630,000 | 628,441 | ||||
| 12,004,133 | ||||||
| Missouri (0.9%) | ||||||
Platte County Industrial Development Authority Transportation Revenue Bonds, 5.00%, 12/01/2025 (d)(f) | 675,000 | 324,000 | ||||
See accompanying Notes to Financial Statements.
| 38 | 2022 Semi-Annual Report |
Statement of Investments (continued)
April 30, 2022 (Unaudited)
abrdn Short Duration High Yield Municipal Fund
Shares or Principal Amount | Value (US$) | |||||
| MUNICIPAL BONDS (continued) | ||||||
| Missouri (continued) | ||||||
Plaza at Noah's Ark Community Improvement District Revenue Bonds 3.00%, 05/01/2022 | $ | 65,000 | $ | 65,000 | ||
| 3.00%, 05/01/2023 | 100,000 | 99,361 | ||||
| 3.00%, 05/01/2024 | 100,000 | 98,477 | ||||
| 3.00%, 05/01/2025 | 100,000 | 97,516 | ||||
| 3.00%, 05/01/2026 | 100,000 | 96,521 | ||||
Saint Louis County Missouri Industrial Development Authority Revenue Bonds (Ranken-Jordan Pediatric Specialty Hospital), 5.00%, 11/15/2022 | 625,000 | 630,564 | ||||
State Health & Educational Facilities Authority Revenue Bond (Bethesda Health Group, Inc.) 3.00%, 08/01/2023 | 140,000 | 140,686 | ||||
| 4.00%, 08/01/2025 | 150,000 | 155,177 | ||||
| 4.00%, 08/01/2027 | 440,000 | 459,232 | ||||
| 4.00%, 08/01/2029 | 385,000 | 399,456 | ||||
| 4.00%, 08/01/2031 | 310,000 | 318,190 | ||||
| 4.00%, 08/01/2036 | 275,000 | 277,317 | ||||
| 3,161,497 | ||||||
| Nevada (0.4%) | ||||||
City of Carson Hospital Revenue Bonds (Carson Tahoe Regional Healthcare) 5.00%, 09/01/2027 | 605,000 | 664,678 | ||||
| 5.00%, 09/01/2029 | 620,000 | 672,567 | ||||
Nevada Department of Business & Industry Revenue Bonds (Doral Academy of Nevada), Series A, 3.13%, 07/15/2022 (a)(e) | 145,000 | 145,010 | ||||
| 1,482,255 | ||||||
| New Jersey (0.4%) | ||||||
New Jersey Economic Development Authority Revenue Bonds (Greater Brunswick Charter School Project), Series A, 4.75%, 08/01/2024 (a) | 70,000 | 70,380 | ||||
New Jersey Economic Development Authority Revenue Bonds (United Airlines, Inc.) 5.50%, 04/01/2028 | 55,000 | 55,023 | ||||
| Series B, AMT, 5.63%, 11/15/2030 | 455,000 | 476,438 | ||||
South Jersey Port Corp. Revenue Bonds, Series B 5.00%, 01/01/2026 | 300,000 | 317,088 | ||||
| 5.00%, 01/01/2027 | 250,000 | 266,503 | ||||
| 5.00%, 01/01/2028 | 255,000 | 273,358 | ||||
| 1,458,790 | ||||||
| New York (13.8%) | ||||||
Albany Capital Resource Corp. Revenue Bonds (The College Of Saint Rose) 4.00%, 07/01/2025 | 1,025,000 | 1,012,082 | ||||
| 4.00%, 07/01/2026 | 1,065,000 | 1,042,969 | ||||
| 4.00%, 07/01/2027 | 1,105,000 | 1,071,829 | ||||
| 4.00%, 07/01/2028 | 1,150,000 | 1,104,930 | ||||
| 4.00%, 07/01/2029 | 1,195,000 | 1,134,795 | ||||
| 4.00%, 07/01/2030 | 1,245,000 | 1,168,704 | ||||
| 4.00%, 07/01/2031 | 1,295,000 | 1,202,480 | ||||
Shares or Principal Amount | Value (US$) | |||||
Amherst Development Corp. Revenue Bonds (Daemen College) 5.00%, 10/01/2025 | $ | 600,000 | $ | 624,957 | ||
| 5.00%, 10/01/2026 | 630,000 | 659,634 | ||||
| 4.00%, 10/01/2037 | 500,000 | 453,212 | ||||
Brookhaven Local Development Corp. Revenue Bonds (Active Retirement Community, Inc.), 5.00%, 11/01/2022 | 250,000 | 253,089 | ||||
Buffalo & Erie County Industrial Land Development Corp. Revenue Bonds (Charter School for Applied Technologies Project), 4.00%, 06/01/2022 | 455,000 | 455,662 | ||||
Build NYC Resource Corp. Revenue Bonds (Metropolitan Lighthouse Charter School Project), Series A 4.00%, 06/01/2022 (a) | 190,000 | 190,141 | ||||
| 5.00%, 06/01/2023 (a) | 370,000 | 377,386 | ||||
| 5.00%, 06/01/2024 (a) | 390,000 | 402,960 | ||||
| 5.00%, 06/01/2025 (a) | 410,000 | 428,151 | ||||
| 5.00%, 06/01/2026 (a) | 430,000 | 452,964 | ||||
| 5.00%, 06/01/2027 (a) | 450,000 | 475,573 | ||||
| 5.00%, 06/01/2032 (a) | 500,000 | 521,355 | ||||
Build NYC Resource Corp. Revenue Bonds (Richmond Preparatory Charter School Project), Series A, 4.00%, 06/01/2031 (a) | 650,000 | 617,593 | ||||
City of Elmira General Obligation Limited Bonds 5.00%, 07/01/2025 (a) | 1,125,000 | 1,194,920 | ||||
| 5.00%, 07/01/2033 (a) | 2,635,000 | 2,843,364 | ||||
City of New York General Obligation Limited Bonds, VRDN, 0.64%, 04/01/2042 (c) | 500,000 | 500,000 | ||||
City of Poughkeepsie General Obligation Limited Bonds, 5.00%, 06/01/2031 | 455,000 | 482,344 | ||||
Madison Country Capital Resource Corp. Revenue Bonds (Cazenovia College Project), Series A, 5.50%, 09/01/2022 | 6,500,000 | 6,473,659 | ||||
Metropolitan Transportation Authority Revenue Bonds 5.00%, 09/01/2022 | 2,000,000 | 2,020,574 | ||||
| Series F, 5.00%, 11/15/2022 | 1,050,000 | 1,066,013 | ||||
| 5.00%, 11/15/2035 | 4,000,000 | 4,212,896 | ||||
Nassau County Tobacco Settlement Corp. Revenue Bonds, Series A-2, 5.25%, 06/01/2026 (e) | 1,150,000 | 1,178,199 | ||||
New York City Industrial Development Agency Revenue Bonds (Yankee Stadium LLC), (AGM), 2.50%, 03/01/2037 | 3,000,000 | 2,428,794 | ||||
New York State Dormitory Authority Revenue Bonds (Touro College And University System Obligated Group), Series A, 4.00%, 01/01/2023 | 445,000 | 447,615 | ||||
New York State Dormitory Authority Revenue Bonds (Yeshiva University) 5.00%, 09/01/2022 | 1,640,000 | 1,641,636 | ||||
| 5.00%, 09/01/2038 | 730,000 | 714,799 | ||||
New York State Environmental Facilities Corp. Revenue Bonds (Casella Waste Systems, Inc.), 2.75%, 09/01/2050 (c) | 1,000,000 | 981,214 | ||||
See accompanying Notes to Financial Statements.
| 2022 Semi-Annual Report | 39 |
Statement of Investments (continued)
April 30, 2022 (Unaudited)
abrdn Short Duration High Yield Municipal Fund
Shares or Principal Amount | Value (US$) | |||||
| MUNICIPAL BONDS (continued) | ||||||
| New York (continued) | ||||||
New York Transportation Development Corp. Revenue Bonds (American Airlines, Inc.), 2.25%, 08/01/2026 | $ | 670,000 | $ | 625,994 | ||
| 3.00%, 08/01/2031 | 530,000 | 490,552 | ||||
Suffolk County Economic Development Corp. Revenue Bonds (St Johnland Assisted Living, Inc.), 4.63%, 11/01/2031 (a) | 1,020,000 | 918,909 | ||||
Village of Johnson City General Obligation Limited Bonds, 5.00%, 10/01/2022 | 115,000 | 115,640 | ||||
Westchester County Local Development Corp. 2.88%, 07/01/2026 (a) | 1,000,000 | 957,437 | ||||
| 3.20%, 07/01/2028 (a) | 1,675,000 | 1,573,980 | ||||
| 3.60%, 07/01/2029 | 2,000,000 | 1,876,199 | ||||
Western Regional Off-Track Betting Corp. Revenue Bonds 3.00%, 12/01/2026 (a) | 1,285,000 | 1,197,438 | ||||
| 4.13%, 12/01/2041 (a) | 1,900,000 | 1,573,170 | ||||
| 49,165,812 | ||||||
| North Carolina (0.2%) | ||||||
North Carolina Capital Facilities Finance Agency Revenue Bonds (Johnson & Wales University), Series A, 5.00%, 04/01/2028 | 795,000 | 809,954 | ||||
| Ohio (3.6%) | ||||||
Buckeye Tobacco Settlement Financing Authority Tobacco Settlement Assets-Backed Revenue Bonds, 5.00%, 06/01/2055 | 2,115,000 | 2,056,847 | ||||
Cleveland-Cuyahoga County Port Authority Revenue Bonds, 5.00%, 12/01/2028 | 205,000 | 214,163 | ||||
Ohio Air Quality Development Authority Revenue Bonds (Ohio Valley Electric Corp. Project) Series B, VRN, 1.38%, 02/01/2026 (c) | 1,000,000 | 946,167 | ||||
| Series C, VRN, 1.50%, 02/01/2026 (c) | 1,000,000 | 927,084 | ||||
| Series A, 2.88%, 02/01/2026 | 1,000,000 | 961,860 | ||||
| Series A, 3.25%, 09/01/2029 | 140,000 | 130,102 | ||||
Ohio Higher Educational Facility Commission Revenue Bonds 4.00%, 07/01/2022 | 845,000 | 848,297 | ||||
| 4.00%, 07/01/2023 | 835,000 | 850,014 | ||||
| 4.00%, 07/01/2024 | 865,000 | 888,828 | ||||
| 4.00%, 07/01/2025 | 900,000 | 933,372 | ||||
| 4.00%, 07/01/2026 | 935,000 | 976,130 | ||||
| 4.00%, 07/01/2027 | 975,000 | 1,019,871 | ||||
| 4.00%, 07/01/2028 | 1,015,000 | 1,061,448 | ||||
| 4.00%, 07/01/2029 | 1,055,000 | 1,106,620 | ||||
| 12,920,803 | ||||||
| Oregon (1.2%) | ||||||
Hospital Facilities Authority of Multnomah County Oregon Revenue Bonds Series B-2, 0.95%, 06/01/2027 | 1,000,000 | 878,870 | ||||
| Series B, 1.20%, 06/01/2028 | 1,800,000 | 1,545,456 | ||||
Shares or Principal Amount | Value (US$) | |||||
Yamhill County Hospital Authority Revenue Bonds (Friendsview Manor Obligated Group) 2.13%, 11/15/2027 | $ | 500,000 | $ | 467,124 | ||
| 2.50%, 11/15/2028 | 500,000 | 463,526 | ||||
| 5.00%, 11/15/2036 | 875,000 | 859,037 | ||||
| 4,214,013 | ||||||
| Pennsylvania (5.0%) | ||||||
Allentown Neighborhood Improvement Zone Development Authority Tax Revenue Bonds, 5.00%, 05/01/2022 (a) | 345,000 | 345,000 | ||||
Chester County Health And Education Facilities Authority Revenue Bonds (Simpson Senior Services Project) 4.00%, 12/01/2022 | 575,000 | 575,898 | ||||
| 4.00%, 12/01/2023 | 660,000 | 661,485 | ||||
| 4.00%, 12/01/2024 | 690,000 | 690,485 | ||||
| 4.00%, 12/01/2025 | 360,000 | 358,212 | ||||
| 4.00%, 12/01/2026 | 375,000 | 369,747 | ||||
| 4.00%, 12/01/2027 | 395,000 | 384,581 | ||||
| 4.00%, 12/01/2028 | 415,000 | 398,940 | ||||
| 4.00%, 12/01/2029 | 435,000 | 411,507 | ||||
| 4.00%, 12/01/2030 | 450,000 | 420,399 | ||||
Dauphin County General Authority Revenue Bonds (Harrisburg University of Science and Technology Project) 4.00%, 10/15/2022 (a) | 240,000 | 240,353 | ||||
| 4.25%, 10/15/2026 (a) | 1,250,000 | 1,251,190 | ||||
| 5.00%, 10/15/2027 (a) | 1,650,000 | 1,696,217 | ||||
| 5.00%, 10/15/2030 (a) | 3,000,000 | 3,088,173 | ||||
Delaware County Industrial Development Authority Revenue Bonds (CCSA Foundation), Series A, 4.38%, 06/01/2026 (a) | 2,185,000 | 2,206,862 | ||||
Indiana County Hospital Authority Revenue Bonds (Indiana Regional Medical Center), Series A, 5.00%, 06/01/2023 | 100,000 | 101,845 | ||||
Lehigh County Industrial Development Authority Revenue Bonds (Seven Generations Charter School), 4.00%, 05/01/2031 | 680,000 | 647,809 | ||||
Montgomery County Industrial Development Authority Revenue Bonds (Waverly Heights, Ltd. Project) 4.00%, 12/01/2027 | 180,000 | 189,147 | ||||
| 4.00%, 12/01/2028 | 200,000 | 211,151 | ||||
| 4.00%, 12/01/2029 | 100,000 | 105,364 | ||||
| 4.00%, 12/01/2035 | 300,000 | 311,139 | ||||
| 4.00%, 12/01/2036 | 100,000 | 103,549 | ||||
| 4.00%, 12/01/2038 | 300,000 | 309,887 | ||||
Philadelphia School District General Obligation Limited Bonds, Series F, 5.00%, 09/01/2024 | 2,000,000 | 2,099,780 | ||||
Pottsville Hospital Facilities Authority Health Center Revenue Bonds (Lehigh Valley Health Network Obligated Group), 5.75%, 07/01/2022 (a) | 55,000 | 55,394 | ||||
Scranton School District General Obligation Limited Bonds Series B, 5.00%, 06/01/2023 | 100,000 | 102,973 | ||||
| Series B, 5.00%, 06/01/2024 | 100,000 | 104,776 | ||||
See accompanying Notes to Financial Statements.
| 40 | 2022 Semi-Annual Report |
Statement of Investments (continued)
April 30, 2022 (Unaudited)
abrdn Short Duration High Yield Municipal Fund
| Shares or Principal Amount | Value (US$) | |||||||
| MUNICIPAL BONDS (continued) | ||||||||
| Pennsylvania (continued) | ||||||||
| Series B, 5.00%, 06/01/2025 | $ | 100,000 | $ | 106,770 | ||||
| Series D, 5.00%, 06/01/2027 | 345,000 | 369,730 | ||||||
| 17,918,363 | ||||||||
| Puerto Rico (2.3%) | ||||||||
| Electric Power Authority Revenue Bonds, Series V, 5.25%, 07/01/2026 | 1,290,000 | 1,327,134 | ||||||
| PR Custodial Trust Revenue Bonds (GO PIB 2003A), 5.50%, 07/01/2022 | 800,552 | 799,277 | ||||||
| Puerto Rico Electric Power Authority Revenue Bonds Series SS, 5.00%, 07/01/2022 | 260,000 | 265,393 | ||||||
| Series PP, 5.00%, 07/01/2023 | 205,000 | 209,252 | ||||||
| Series SS, 5.25%, 07/01/2023 (e) | 2,340,000 | 2,363,531 | ||||||
| Series PP, 5.00%, 07/01/2024 | 835,000 | 852,318 | ||||||
| Series UU, 5.00%, 07/01/2024 | 300,000 | 305,355 | ||||||
| Puerto Rico Highway & Transportation Authority Revenue Bonds Series BB, 5.25%, 07/01/2022 | 100,000 | 100,284 | ||||||
| Series L, 5.25%, 07/01/2023 | 520,000 | 525,229 | ||||||
| Series E, 5.50%, 07/01/2023 | 200,000 | 206,181 | ||||||
| Series D, 5.00%, 07/01/2027 | 145,000 | 146,007 | ||||||
| (AGM-CR), 5.50%, 07/01/2030 | 1,000,000 | 1,061,263 | ||||||
| 8,161,224 | ||||||||
| Rhode Island (0.3%) | ||||||||
| Rhode Island Health & Educational Building Corp. Revenue Bonds (Care New England Health System Obligated Group), Series B 5.00%, 09/01/2022 | 680,000 | 685,847 | ||||||
| 5.00%, 09/01/2023 | 500,000 | 512,442 | ||||||
| 1,198,289 | ||||||||
| South Carolina (1.3%) | ||||||||
| South Carolina Jobs-Economic Development Authority Revenue Bonds (Last Step Recycling LLC), 6.00%, 06/01/2031 (a) | 2,915,000 | 2,630,598 | ||||||
| 6.25%, 06/01/2040 (a) | 2,000,000 | 1,710,663 | ||||||
| South Carolina Jobs-Economic Development Authority Revenue Bonds (RePower South Berkeley LLC), 5.25%, 02/01/2027 (a)(d)(f) | 1,060,000 | 424,000 | ||||||
| 4,765,261 | ||||||||
| Tennessee (0.6%) | ||||||||
| Metropolitan Government Nashville & Davidson Health & Educational Facilities Revenue Bonds (Trevecca Nazarene University Project) 4.00%, 10/01/2023 | 135,000 | 136,204 | ||||||
| 4.00%, 10/01/2024 | 170,000 | 170,980 | ||||||
| 4.00%, 10/01/2025 | 175,000 | 175,791 | ||||||
| 4.00%, 10/01/2026 | 150,000 | 150,214 | ||||||
| 4.00%, 10/01/2027 | 195,000 | 194,153 | ||||||
| 4.00%, 10/01/2028 | 200,000 | 197,669 | ||||||
| 4.00%, 10/01/2029 | 200,000 | 196,435 | ||||||
| Shares or Principal Amount | Value (US$) | |||||||
| 5.00%, 10/01/2029 | $ | 300,000 | $ | 311,502 | ||||
| 4.00%, 10/01/2030 | 210,000 | 204,623 | ||||||
| 4.00%, 10/01/2031 | 215,000 | 207,336 | ||||||
| 5.00%, 10/01/2034 | 90,000 | 93,465 | ||||||
| 2,038,372 | ||||||||
| Texas (6.0%) | ||||||||
| Arlington Higher Education Finance Corp. Revenue Bonds (Wayside Schools), 5.00%, 08/15/2022 | 55,000 | 55,193 | ||||||
| 5.00%, 08/15/2023 | 155,000 | 157,183 | ||||||
| 5.00%, 08/15/2024 | 195,000 | 198,734 | ||||||
| 5.00%, 08/15/2025 | 205,000 | 209,716 | ||||||
| 5.00%, 08/15/2026 | 190,000 | 194,617 | ||||||
| 5.00%, 08/15/2027 | 200,000 | 204,926 | ||||||
| 5.00%, 08/15/2028 | 80,000 | 81,943 | ||||||
| 4.00%, 08/15/2029 | 75,000 | 72,103 | ||||||
| 4.00%, 08/15/2030 | 80,000 | 76,137 | ||||||
| 4.00%, 08/15/2031 | 90,000 | 84,846 | ||||||
| 4.00%, 08/15/2036 | 230,000 | 207,799 | ||||||
| Bexar County Health Facilities Development Corp. Revenue Bonds (Army Retirement Residence Obligation Group) 5.00%, 07/15/2023 | 300,000 | 306,436 | ||||||
| 5.00%, 07/15/2024 | 150,000 | 155,652 | ||||||
| Calhoun County Navigation Industrial Development Authority Revenue Bonds (Max Midstream Texas LLC), Series A, 3.63%, 07/01/2026 (a) | 4,000,000 | 3,892,013 | ||||||
| Decatur Hospital Authority Revenue Bonds, Series A, 5.00%, 09/01/2022 | 150,000 | 151,593 | ||||||
| Decatur Hospital Authority Revenue Bonds (Wise Regional Health System), Series A, 5.00%, 09/01/2023 | 275,000 | 283,915 | ||||||
| Harris County Cultural Education Facilities Finance Corp. Revenue Bonds (Brazos Presbyterian Homes, Inc.), 5.00%, 01/01/2027 | 895,000 | 931,361 | ||||||
| New Hope Cultural Education Facilities Finance Corp. Revenue Bonds (Cardinal Bay, Inc.) Series C, 5.00%, 07/01/2023 | 300,000 | 150,000 | ||||||
| Series D, 6.00%, 07/01/2026 | 95,000 | 42,750 | ||||||
| New Hope Cultural Education Facilities Finance Corp. Revenue Bonds (Sanctuary LTC Project), Series A-1, 5.00%, 01/01/2032 | 4,000,000 | 3,808,146 | ||||||
| New Hope Cultural Education Facilities Finance Corporation Education Revenue And Refunding Bonds (Jubilee Academic Center) 4.00%, 08/15/2022 (a) | 170,000 | 170,195 | ||||||
| 4.00%, 08/15/2023 (a) | 360,000 | 360,922 | ||||||
| 4.00%, 08/15/2024 (a) | 370,000 | 370,142 | ||||||
| 4.00%, 08/15/2029 (a) | 445,000 | 432,904 | ||||||
| 4.00%, 08/15/2030 (a) | 465,000 | 448,110 | ||||||
| 4.00%, 08/15/2031 (a) | 485,000 | 463,894 | ||||||
| Port Beaumont Navigation District Revenue Bonds (Jefferson Railport Terminal II LLC), Series A, 3.63%, 01/01/2035 (a) | 1,500,000 | 1,358,066 | ||||||
See accompanying Notes to Financial Statements.
| 2022 Semi-Annual Report | 41 |
Statement of Investments (continued)
April 30, 2022 (Unaudited)
abrdn Short Duration High Yield Municipal Fund
| Shares or Principal Amount | Value (US$) | |||||||
| MUNICIPAL BONDS (continued) | ||||||||
| Texas (continued) | ||||||||
| Port of Beaumont Navigation District of Jefferson County Dock & Wharf Facilities Revenue Bonds (Jefferson Gulf Coast Energy Project), AMT 1.88%, 01/01/2026 (a) | $ | 500,000 | $ | 467,381 | ||||
| 2.00%, 01/01/2027 (a) | 200,000 | 183,540 | ||||||
| 2.13%, 01/01/2028 (a) | 200,000 | 180,219 | ||||||
| 2.25%, 01/01/2029 (a) | 500,000 | 441,965 | ||||||
| 2.50%, 01/01/2030 (a) | 350,000 | 307,346 | ||||||
| 2.63%, 01/01/2031 (a) | 400,000 | 347,992 | ||||||
| 2.75%, 01/01/2036 (a) | 750,000 | 603,762 | ||||||
| SA Energy Acquisition Public Facility Corp. Revenue Bonds 5.50%, 08/01/2022 | 80,000 | 80,709 | ||||||
| 5.50%, 08/01/2023 | 50,000 | 51,741 | ||||||
| Texas Municipal Gas Acquisition & Supply Corp. I Revenue Bonds Series C, 2.00%, 12/15/2026 (c)(e) | 1,500,000 | 1,476,574 | ||||||
| Series D, 6.25%, 12/15/2026 | 1,785,000 | 1,911,654 | ||||||
| Texas Municipal Gas Acquisition & Supply Corp. III Revenue Bonds 5.00%, 12/15/2029 | 250,000 | 268,567 | ||||||
| 5.00%, 12/15/2030 | 375,000 | 404,158 | ||||||
| 21,594,904 | ||||||||
| U. S. Virgin Islands (0.9%) | ||||||||
| Matching Fund Special Purpose Securitization Corp. Revenue Bonds, Series A 5.00%, 10/01/2025 | 1,000,000 | 1,028,907 | ||||||
| 5.00%, 10/01/2026 | 1,000,000 | 1,034,516 | ||||||
| Virgin Islands Public Finance Authority Revenue Bonds, Series A, 5.00%, 10/01/2032 | 1,210,000 | 1,219,676 | ||||||
| 3,283,099 | ||||||||
| Utah (2.6%) | ||||||||
| Utah Charter School Finance Authority Revenue Bonds (Esperanza Elementary School), Series A 4.50%, 10/15/2028 (a) | 500,000 | 497,225 | ||||||
| 4.63%, 10/15/2048 (a)(c) | 1,000,000 | 988,167 | ||||||
| Utah Charter School Finance Authority Revenue Bonds (Freedom Academy Foundation), 3.25%, 06/15/2031 (a) | 535,000 | 480,209 | ||||||
| Utah Charter School Finance Authority Revenue Bonds (Scholar Academy), Series A, 4.50%, 04/15/2048 (a)(c) | 3,000,000 | 2,967,255 | ||||||
| Utah Charter School Finance Authority Revenue Bonds (Wasatch Waldorf Charter School, Inc.), Series A, 4.75%, 05/15/2048 (a)(c) | 4,310,000 | 4,281,696 | ||||||
| 9,214,552 | ||||||||
| Washington (4.2%) | ||||||||
| State Housing Finance Commission Revenue Bonds (Transforming Age Project), Series A 5.00%, 01/01/2024 (a) | 180,000 | 182,711 | ||||||
| 5.00%, 01/01/2028 (a) | 440,000 | 450,861 | ||||||
| 5.00%, 01/01/2029 (a) | 465,000 | 475,004 | ||||||
| 5.00%, 01/01/2034 (a) | 745,000 | 745,394 | ||||||
| Shares or Principal Amount | Value (US$) | |||||||
| Washington State Housing Finance Commission Revenue Bonds (Mirabella), 6.00%, 10/01/2022 (a) | $ | 260,000 | $ | 264,782 | ||||
| Washington State Housing Finance Commission Revenue Bonds (Spokane International Academy), Series A 4.00%, 07/01/2025 (a) | 355,000 | 355,507 | ||||||
| 4.00%, 07/01/2026 (a) | 285,000 | 283,907 | ||||||
| 4.00%, 07/01/2027 (a) | 295,000 | 292,140 | ||||||
| 4.00%, 07/01/2028 (a) | 305,000 | 299,755 | ||||||
| 4.00%, 07/01/2029 (a) | 320,000 | 311,811 | ||||||
| Washington State Housing Finance Commission Revenue Bonds (Eliseo Project) Series B-2, 2.13%, 07/01/2027 (a) | 2,750,000 | 2,506,805 | ||||||
| Series B-1, 2.50%, 07/01/2028 (a) | 4,375,000 | 3,948,162 | ||||||
| Series A, 4.00%, 01/01/2031 (a) | 5,035,000 | 4,745,201 | ||||||
| 14,862,040 | ||||||||
| West Virginia (0.3%) | ||||||||
| Glenville State College Board of Governors Revenue Bonds 3.25%, 06/01/2022 | 170,000 | 169,784 | ||||||
| 4.00%, 06/01/2027 | 250,000 | 235,156 | ||||||
| Ohio County Development Authority Revenue Bonds (Ohio County Sport Complex Project), 4.00%, 09/01/2023 | 840,000 | 828,234 | ||||||
| 1,233,174 | ||||||||
| Wisconsin (6.5%) | ||||||||
| Public Finance Authority Educational Facilities Revenue Refunding Bonds (The Methodist University) 4.00%, 03/01/2023 | 480,000 | 481,338 | ||||||
| 4.00%, 03/01/2024 | 505,000 | 506,657 | ||||||
| 4.00%, 03/01/2025 | 540,000 | 540,405 | ||||||
| 4.00%, 03/01/2026 | 755,000 | 750,995 | ||||||
| 4.00%, 03/01/2027 | 795,000 | 785,345 | ||||||
| 4.00%, 03/01/2028 | 840,000 | 819,898 | ||||||
| 4.00%, 03/01/2029 | 890,000 | 860,486 | ||||||
| 4.00%, 03/01/2030 | 950,000 | 907,415 | ||||||
| Public Finance Authority Revenue Bonds Series A, 5.00%, 10/01/2024 (a) | 2,100,000 | 2,162,841 | ||||||
| 6.00%, 01/01/2027 | 4,100,000 | 3,928,275 | ||||||
| Series A, 5.00%, 10/01/2029 (a) | 500,000 | 527,838 | ||||||
| Public Finance Authority Revenue Bonds (Masonic & Eastern Star Home of NC, Inc.) Series B-2, 3.00%, 03/01/2026 (a) | 790,000 | 759,205 | ||||||
| 3.50%, 03/01/2027 (a) | 4,000,000 | 3,868,434 | ||||||
| Public Finance Authority Revenue Bonds (Washoe Barton Medical Clinic), Series A 3.00%, 12/01/2026 | 250,000 | 243,109 | ||||||
| 4.00%, 12/01/2031 | 700,000 | 699,297 | ||||||
| Public Finance Authority Revenue Bonds (Wonderful Foundations Charter School Holdings LLC), Series A-1, 4.50%, 01/01/2035 (a) | 1,000,000 | 925,086 | ||||||
See accompanying Notes to Financial Statements.
| 42 | 2022 Semi-Annual Report |
Statement of Investments (concluded)
April 30, 2022 (Unaudited)
abrdn Short Duration High Yield Municipal Fund
| Shares or Principal Amount | Value (US$) | |||||||
| MUNICIPAL BONDS (continued) | ||||||||
| Wisconsin (continued) | ||||||||
| Wisconsin Health & Educational Facilities Authority Revenue Bond 5.00%, 11/01/2022 | $ | 120,000 | $ | 120,681 | ||||
| 5.00%, 11/01/2023 | 360,000 | 365,694 | ||||||
| Wisconsin Public Finance Authority Educational Facilities Revenue Bonds (Barton College), Series A 5.00%, 03/01/2023 | 435,000 | 437,671 | ||||||
| 5.00%, 03/01/2028 | 1,190,000 | 1,206,033 | ||||||
| Wisconsin Public Finance Authority Educational Facilities Revenue Bonds (Guilford College) 5.00%, 01/01/2026 | 685,000 | 706,429 | ||||||
| 5.00%, 01/01/2027 | 830,000 | 856,662 | ||||||
| Wisconsin Public Finance Authority Educational Facilities Revenue Bonds (Piedmont Community Charter School) 5.00%, 06/15/2022 | 185,000 | 185,630 | ||||||
| 5.00%, 06/15/2024 | 210,000 | 215,263 | ||||||
| 5.00%, 06/15/2026 | 230,000 | 239,191 | ||||||
| 5.00%, 06/15/2027 | 160,000 | 167,361 | ||||||
| 23,267,239 | ||||||||
| Total Municipal Bonds | 354,206,101 | |||||||
| SHORT-TERM INVESTMENT (0.0%) | ||||||||
| UNITED STATES (0.0%) | ||||||||
| BlackRock Liquidity Funds MuniCash Portfolio, Institutional Shares | 55,598 | 55,598 | ||||||
| Total Short-Term Investment | 55,598 | |||||||
| Total Investments (Cost $374,852,848) (g)—99.2% | 354,261,699 | |||||||
| Other Assets in Excess of Liabilities—0.8% | 2,926,506 | |||||||
| Net Assets—100.0% | $ | 357,188,205 | ||||||
| (a) | Denotes a security issued under Regulation S or Rule 144A. |
| (b) | Level 3 security. See Note 2(a) of the accompanying Notes to Financial Statements. |
| (c) | Variable Rate Instrument. The rate shown is based on the latest available information as of April 30, 2022. Certain variable rate securities are not based on a published reference rate and spread but are determined by the issuer or agent and are based on current market conditions. These securities do not indicate a reference rate and spread in their description. |
| (d) | Security is in default. |
| (e) | All or a portion of the security has been designated as collateral for when issued trading. When-issued trading is trading in securities that have been authorized but not yet been issued. |
| (f) | Illiquid security. |
| (g) | See accompanying Notes to Financial Statements for tax unrealized appreciation/(depreciation) of securities. |
| FRN | Floating Rate Note |
See accompanying Notes to Financial Statements.
| 2022 Semi-Annual Report | 43 |
abrdn Ultra Short Municipal Income Fund (Unaudited)
| Average Annual Total Return1 (For periods ended April 30, 2022) | Six Month† | 1 Yr. | 5 Yr. | 10 Yr. | ||||||
| Class A | w/o SC | (0.27%) | (0.36%) | 0.64% | 0.48% | |||||
| Class A12 | w/o SC | (0.27%) | (0.36%) | 0.66% | 0.50% | |||||
| w/ SC3 | (0.77%) | (0.85%) | 0.56% | 0.45% | ||||||
| Institutional Class4 | w/o SC | (0.33%) | (0.31%) | 0.82% | 0.70% |
All figures showing the effect of a sales charge (SC) reflect the maximum charge possible because it has the most significant effect on performance data. The total returns shown above do not include the impact of financial statement rounding of the net asset value (NAV) per share and/or financial statement adjustments.
| † | Not annualized | |
| 1 | Returns prior to May 7, 2018 reflect the performance of a predecessor fund (the "Predecessor Fund"). Returns of the Predecessor Fund have not been adjusted to reflect the expenses applicable to the respective classes. The Fund and the Predecessor Fund have substantially similar investment objectives and strategies. Please consult the Fund's prospectus for more detail. | |
| 2 | Returns before the first offering of Class A1 (February 28, 2019) are based on the previous performance of Class A. Returns of the class have not been adjusted to reflect the expenses applicable to the respective classes. Excluding the effect of any fee waivers or reimbursements, this performance is substantially similar to what Class A would have produced because all classes invest in the same portfolio of securities. Returns for Class A shares would only differ to the extent of the difference in expenses of the classes. | |
| 3 | A 0.50% front-end sales charge was deducted. | |
| 4 | Not subject to any sales charges. |
Performance of a $1,000,000 Investment* (as of April 30, 2022)

Comparative performance of $1,000,000 invested in Institutional Class shares of the abrdn Ultra Short Municipal Income Fund, the Bloomberg Barclays Municipal Bond: 1 Year (1-2) Index and the Consumer Price Index (CPI) over a 10-year period ended April 30, 2022. Unlike the Fund, the returns for these unmanaged indexes do not reflect any fees, expenses, or sales charges. Investors cannot invest directly in market indexes.
The Bloomberg Barclays Municipal Bond: 1 Year (1-2) Index is a total return benchmark of BAA3 ratings or better designed to measure returns for tax exempt assets.
The CPI is a measure of the average change over time in the prices paid by urban consumers for a market basket of consumer goods and services.
| * | Minimum Initial Investment |
Investment return and principal value will fluctuate, and when redeemed, shares may be worth more or less than original cost. Past performance is no guarantee of future results. The Average Annual Total Return table and Performance graph do not reflect the deduction of taxes that a shareholder would pay on fund distributions or the redemption of fund shares. Investing in mutual funds involves market risk, including loss of principal. Performance returns assume the reinvestment of all distributions. Total returns reflect waivers and reimbursements in effect, without which returns would have been lower.
| 44 | 2022 Semi-Annual Report |
abrdn Ultra Short Municipal Income Fund (Unaudited)
Portfolio Summary (as a percentage of net assets)
April 30, 2022 (Unaudited)
| Asset Allocation | ||
| Municipal Bonds | 103.8% | |
| Short-Term Investment | 2.3% | |
| Liabilities in Excess of Other Assets | (6.1%) | |
| 100.0% | ||
| Top Ten Holdings | ||
| Mississippi Business Finance Corp. Revenue Bonds (PSL-North America), Series A 11/01/2032 | 7.1% | |
| California Pollution Control Financing Authority Revenue Bonds (Republic Services, Inc.), Series A 08/01/2023 | 5.5% | |
| Maryland Industrial Development Financing Authority Revenue Bonds (Occidental Petroleum Corp.) 03/01/2030 | 4.8% | |
| Pennsylvania Economic Development Financing Authority Solid Waste Disposal Revenue Bonds (Waste Management PA Obligated Group) 08/01/2045 | 4.5% | |
| Michigan State Housing Development Authority Revenue Bonds, AMT, VRDN 06/01/2038 | 3.4% | |
| Wisconsin Health & Educational Facilities Authority Revenue Bonds 02/15/2053 | 3.0% | |
| Metropolitan Transportation Authority Revenue Bonds, Series B-1 05/15/2022 | 2.7% | |
| Hertford County Industrial Facilities & Pollution Control Financing Authority Revenue Bonds (Nucor Corp.), Series A 11/01/2033 | 2.6% | |
| Rondout Valley Central School District Accord Ulster County, NJ General Obligation Anticipation Notes, (State Aid Withholding) 06/29/2022 | 2.5% | |
| Black Belt Energy Gas District Revenue Bonds, FRN 12/01/2048 | 2.3% | |
| States | ||
| New York | 23.7% | |
| Mississippi | 9.2% | |
| Texas | 8.8% | |
| California | 8.7% | |
| Pennsylvania | 7.0% | |
| Alabama | 6.1% | |
| Maryland | 5.5% | |
| Michigan | 4.6% | |
| Wisconsin | 4.6% | |
| New Jersey | 4.3% | |
| Virginia | 2.8% | |
| North Carolina | 2.7% | |
| Kentucky | 2.6% | |
| Minnesota | 2.0% | |
| South Carolina | 2.0% | |
| Other, less than 2% each | 9.2% | |
| Short-Term Investment | 2.3% | |
| Liabilities in Excess of Other Assets | (6.1%) | |
| 100.0% | ||
| 2022 Semi-Annual Report | 45 |
Statement of Investments
April 30, 2022 (Unaudited)
abrdn Ultra Short Municipal Income Fund
| Shares or Principal Amount | Value (US$) | |||||||
| MUNICIPAL BONDS (103.8%) | ||||||||
| Alabama (6.1%) | ||||||||
| Alabama Housing Finance Authority Revenue Bonds (The Villas At Titusville II PR), VRN, (HUD SECT 8), 1.50%, 11/01/2022 (a) | $ | 3,000,000 | $ | 3,000,000 | ||||
| Black Belt Energy Gas District Revenue Bonds, FRN, 1.21%, 12/01/2048 (a) | 20,000,000 | 19,889,322 | ||||||
| Health Care Authority for Baptist Health Revenue Bonds, Series B 0.69%, 11/15/2037 (a) | 5,625,000 | 5,625,000 | ||||||
| 0.74%, 11/01/2042 (a) | 19,100,000 | 19,100,000 | ||||||
| Lower Alabama Gas District Revenue Bonds, VRN, 4.00%, 12/01/2050 (a) | 5,895,000 | 6,007,946 | ||||||
| 53,622,268 | ||||||||
| Arizona (0.7%) | ||||||||
| Cochise County Pollution Control Corp. Revenue Bonds (Arizona Electric Power Cooperative, Inc.), 1.20%, 09/01/2024 (a) | 6,100,000 | 6,085,685 | ||||||
| California (8.7%) | ||||||||
| California Health Facilities Financing Authority Revenue Bonds (Stanford Hospital Clinics), Series A (Pre-refunded @ $100.000000, 08/15/2022), 5.00%, 08/15/2051 | 5,000,000 | 5,051,438 | ||||||
| California Pollution Control Financing Authority Revenue Bonds (Republic Services, Inc.) Series A, 0.45%, 08/01/2023 (a)(b) | 48,000,000 | 47,999,885 | ||||||
| Series 2017-A1, 2.00%, 11/01/2042 (a)(b) | 3,000,000 | 3,000,471 | ||||||
| California Statewide Communities Development Authority Revenue Bonds (CommonSpirit Health Obligated Group), Series F, 0.80%, 07/01/2040 (a) | 1,575,000 | 1,575,000 | ||||||
| California Statewide Communities Development Authority Revenue Bonds (Dignity Health Obligated Group), Series D, 0.86%, 07/01/2041 (a) | 275,000 | 275,000 | ||||||
| Palomar Pomerado Health Care Certificates of Participation Series A, 1.20%, 11/01/2036 (a) | 4,500,000 | 4,500,000 | ||||||
| Series B, 1.20%, 11/01/2036 (a) | 2,125,000 | 2,125,000 | ||||||
| Series C, 1.20%, 11/01/2036 (a) | 12,075,000 | 12,075,000 | ||||||
| 76,601,794 | ||||||||
| Colorado (0.2%) | ||||||||
| E-470 Public Highway Authority Revenue Bonds, Series B, FRN, 0.54%, 09/01/2039 (a) | 1,500,000 | 1,469,827 | ||||||
| Connecticut (0.5%) | ||||||||
| City of West Haven General Obligation Unlimited Bonds 4.00%, 09/15/2022 | 200,000 | 201,741 | ||||||
| 2.00%, 09/29/2022 | 1,750,000 | 1,752,273 | ||||||
| East Hartford Conn Housing Authority Multi Family Housing Revenue Bonds (Veterans Terrace Project), 0.25%, 06/01/2023 (a) | 2,100,000 | 2,088,050 | ||||||
| 4,042,064 | ||||||||
| Shares or Principal Amount | Value (US$) | |||||||
| Florida (0.7%) | ||||||||
| Florida Development Finance Corporation Revenue Bonds (Brightline Florida Passenger Rail Expansion Project), Series A, AMT, VRN, 0.30%, 12/01/2056 (a) | $ | 1,290,000 | $ | 1,286,638 | ||||
| Miami-Dade County Industrial Development Authority Revenue Bonds (Waste Management, Inc.), AMT, FRN 0.82%, 11/01/2033 (a) | 3,000,000 | 2,984,950 | ||||||
| 0.82%, 11/01/2048 (a) | 2,000,000 | 1,989,969 | ||||||
| 6,261,557 | ||||||||
| Georgia (0.7%) | ||||||||
| Appling County Georgia Development Authority Pollution Control Revenue Bonds, VRDN, 0.60%, 09/01/2029 (a) | 900,000 | 900,000 | ||||||
| Development Authority of Burke County Revenue Bonds (Georgia Power Co. Plant Voglte Project), VRDN, 0.60%, 11/01/2048 (a) | 5,500,000 | 5,500,000 | ||||||
| 6,400,000 | ||||||||
| Idaho (0.1%) | ||||||||
| Idaho Health Facilities Authority Revenue Bonds (Che Trinity Hlth Credit GR), VRN, 0.23%, 12/01/2048 (a) | 500,000 | 499,975 | ||||||
| Illinois (0.1%) | ||||||||
| State of Illinois General Obligation Unlimited Bonds, Series A, 5.00%, 10/01/2023 | 1,030,000 | 1,062,632 | ||||||
| Kansas (0.2%) | ||||||||
| City of Dodge City Industrial Development Revenue Bonds (National Beef Packing Co. LLC), 0.72%, 03/01/2027 (a) | 1,000,000 | 1,000,000 | ||||||
| City of Liberal Industrial Development Revenue Bonds (National Beef Packing Co. LLC), 0.72%, 02/01/2029 (a) | 1,000,000 | 1,000,000 | ||||||
| 2,000,000 | ||||||||
| Kentucky (2.6%) | ||||||||
| County of Meade, Kentucky (Nucor Steel Brandenburg Project) Series 2020A-1 Industrial Building Revenue Bonds, AMT, VRDN, 0.59%, 07/01/2060 (a) | 4,160,000 | 4,160,000 | ||||||
| County of Meade, Kentucky (Nucor Steel Brandenburg Project) Series 2020B-1 Industrial Building Revenue Bonds, AMT, VRDN, 0.59%, 07/01/2060 (a) | 2,400,000 | 2,400,000 | ||||||
| County of Meade, Kentucky (Nucor Steel Brandenburg Project) Series 2021A-1 Industrial Building Revenue Bonds, Series A-1, AMT, VRDN, 0.59%, 08/01/2061 (a) | 13,140,000 | 13,140,000 | ||||||
| Kentucky Economic Development Finance Authority Revenue Bonds (Republic Services, Inc.), Series A, AMT, FRN, 1.05%, 04/01/2031 (a) | 1,720,000 | 1,718,940 | ||||||
See accompanying Notes to Financial Statements.
| 46 | 2022 Semi-Annual Report |
Statement of Investments (continued)
April 30, 2022 (Unaudited)
abrdn Ultra Short Municipal Income Fund
| Shares or Principal Amount | Value (US$) | |||||||
| MUNICIPAL BONDS (continued) | ||||||||
| Kentucky (continued) | ||||||||
| Pulaski County Solid Waste Disposal Revenue Bonds (East Kentucky Power Cooperative, Inc.), Series B, 1.00%, 08/15/2023 (a) | $ | 1,400,000 | $ | 1,381,878 | ||||
| 22,800,818 | ||||||||
| Louisiana (1.0%) | ||||||||
| Louisiana Local Government Environmental Facilities And Community Development Authority Revenue Bonds (American Biocarbon, Ct, LlC Project), AMT, VRN, 0.25%, 12/01/2046 (a) | 4,000,000 | 3,994,061 | ||||||
| Parish of St. James Revenue Bonds (Nucor Steel LA), VRDN, 0.64%, 11/01/2040 (a) | 5,000,000 | 5,000,000 | ||||||
| 8,994,061 | ||||||||
| Maryland (5.5%) | ||||||||
| Maryland Economic Development Corp. Revenue Bonds (Linemark Printing/501 Prince George's Boulevard Obligated Group), 0.66%, 12/01/2033 (a) | 5,115,000 | 5,115,000 | ||||||
| Maryland Industrial Development Financing Authority Revenue Bonds (Occidental Petroleum Corp.), 1.25%, 03/01/2030 (a) | 42,405,000 | 42,405,000 | ||||||
| Washington County Revenue Bonds (Conservit, Inc.), 0.77%, 02/01/2023 (a) | 425,000 | 425,000 | ||||||
| 47,945,000 | ||||||||
| Michigan (4.6%) | ||||||||
| Michigan State Housing Development Authority Revenue Bonds VRDN, 1.30%, 06/01/2030 (a) | 10,000,000 | 10,000,000 | ||||||
| AMT, VRDN, 1.45%, 06/01/2038 (a) | 30,000,000 | 30,000,000 | ||||||
| Michigan Strategic Fund Tax-Exempt Adjustable Mode Exempt Facilities Revenue Bonds (Waste Management, Inc.), AMT, VRN, 0.58%, 08/01/2027 (a) | 500,000 | 470,807 | ||||||
| 40,470,807 | ||||||||
| Minnesota (2.0%) | ||||||||
| JPMorgan Chase Putters/Drivers Trust Revenue Bonds (Putters-5028), AMT, VRDN, 0.59%, 12/01/2024 (a)(b) | 17,500,000 | 17,500,000 | ||||||
| Mississippi (9.2%) | ||||||||
| Mississippi Business Finance Corp. Gulf Opportunity Zone Revenue Bonds, Series C, 0.25%, 05/01/2037 (a) | 18,760,000 | 18,760,000 | ||||||
| Mississippi Business Finance Corp. Revenue Bonds (PSL-North America), Series A, 1.98%, 11/01/2032 (a) | 62,000,000 | 62,000,000 | ||||||
| 80,760,000 | ||||||||
| Shares or Principal Amount | Value (US$) | |||||||
| Montana (0.6%) | ||||||||
| Mizuho Floater/Residual Trust Revenue Bonds, VRDN 0.69%, 06/01/2034 (a)(b) | $ | 4,510,000 | $ | 4,510,000 | ||||
| 0.69%, 06/01/2034 (a)(b) | 1,110,000 | 1,110,000 | ||||||
| 5,620,000 | ||||||||
| Nevada (0.8%) | ||||||||
| Director Of The State Of Nevada Department Of Business And Industry Revenue Bonds Brightline West Passenger Rail Project, Series A, VRN, 0.85%, 01/01/2050 (a)(b) | 7,500,000 | 7,432,197 | ||||||
| New Jersey (4.3%) | ||||||||
| City of East Orange NJ General Obligation Anticipation Notes, 1.00%, 10/25/2022 | 14,549,572 | 14,496,645 | ||||||
| City of Newark NJ General Obligation Notes, Series E, 1.25%, 10/03/2022 | 7,044,550 | 7,034,568 | ||||||
| City of Newark NJ General Obligation Unlimited Notes, Series C, 1.25%, 07/25/2022 | 4,582,031 | 4,573,608 | ||||||
| New Jersey Educational Facilities Authority Revenue Bonds, 5.00%, 06/01/2022 | 1,920,000 | 1,925,342 | ||||||
| Township of Irvington NJ General Obligation Unlimited Notes, 2.00%, 05/19/2022 | 9,720,952 | 9,722,158 | ||||||
| 37,752,321 | ||||||||
| New York (23.7%) | ||||||||
| City of Dunkirk School District New York Revenue Anticipation Notes, 1.00%, 06/29/2022 | 2,400,000 | 2,398,368 | ||||||
| City of Elmira General Obligation Limited Bonds 4.00%, 05/01/2022 | 845,000 | 845,000 | ||||||
| 2.00%, 05/01/2023 | 455,000 | 452,755 | ||||||
| 4.00%, 05/01/2024 | 675,000 | 691,847 | ||||||
| City of New York General Obligation Limited Bonds, VRDN 0.63%, 04/01/2042 (a) | 7,805,000 | 7,805,000 | ||||||
| 0.64%, 04/01/2042 (a) | 18,275,000 | 18,275,000 | ||||||
| City of Newburgh General Obligation limited Notes, Series A, 1.00%, 07/29/2022 | 4,670,000 | 4,664,276 | ||||||
| City of Schenectady General Obligation Limited Notes, 1.00%, 05/06/2022 | 7,447,551 | 7,446,914 | ||||||
| County of Lawrence Norwood-Norfolk central School District New York Revenue Anticipation Notes, 1.00%, 07/27/2022 | 6,962,040 | 6,953,790 | ||||||
| County of Monroe Henriette Fire District New York Revenue Anticipation Notes, 1.00%, 08/10/2022 | 4,800,000 | 4,792,935 | ||||||
| County of Ulster central School District New York Revenue Anticipation Notes, 1.00%, 06/28/2022 | 5,000,000 | 4,996,584 | ||||||
| East Ramapo central School District New York Revenue Anticipation Notes Series B, (State Aid Withholding), 1.00%, 05/05/2022 | 7,250,000 | 7,249,590 | ||||||
| 1.25%, 05/05/2022 | 2,000,000 | 1,999,936 | ||||||
| East Ramapo central School District New York Revenue Budget Notes, 1.25%, 05/05/2022 | 1,100,000 | 1,099,965 | ||||||
See accompanying Notes to Financial Statements.
| 2022 Semi-Annual Report | 47 |
Statement of Investments (continued)
April 30, 2022 (Unaudited)
abrdn Ultra Short Municipal Income Fund
| Shares or Principal Amount | Value (US$) | ||||
| MUNICIPAL BONDS (continued) | |||||
| New York (continued) | |||||
| Hempstead Union Free School District General Obligation Unlimited Notes, Series B, 1.00%, 07/13/2022 | $ | 4,000,000 | $ | 3,996,334 | |
| Jasper-Troupsberg Central School District, New York Revenue Anticipation Notes, (State Aid Withholding), 1.00%, 09/23/2022 | 6,390,000 | 6,374,568 | |||
| Metropolitan Transportation Authority Revenue Bonds Series B-1, 5.00%, 05/15/2022 | 23,900,000 | 23,927,007 | |||
| 5.00%, 09/01/2022 | 11,010,000 | 11,123,262 | |||
| Series F, 5.00%, 11/15/2022 | 1,530,000 | 1,553,799 | |||
| Series F, 5.00%, 11/15/2022 | 1,125,000 | 1,142,156 | |||
| FRN, 0.52%, 11/01/2035 (a) | 4,750,000 | 4,713,098 | |||
| Metropolitan Transportation Authority Transportation Revenue Refunding Green Bonds, Series B, 5.00%, 11/15/2022 | 600,000 | 609,330 | |||
| New York City General Obligation Unlimited Bonds Series C-4, 0.75%, 10/01/2027 (a) | 1,400,000 | 1,400,000 | |||
| Series J-2, 0.68%, 06/01/2036 (a) | 4,600,000 | 4,600,000 | |||
| Series J-3, 0.85%, 06/01/2036 (a) | 7,375,000 | 7,375,000 | |||
| New York City Municipal Water Finance Authority Revenue Bonds (2nd Generation Resolution-Fiscal 2019), VRDN, 0.44%, 06/15/2051 (a) | 19,800,000 | 19,800,000 | |||
| New York Transportation Development Corp. Revenue Bonds (Delta Air Lines, Inc.), AMT, 5.00%, 01/01/2024 | 1,500,000 | 1,532,522 | |||
| Oneida County Industrial Development Agency Revenue Bonds (Champion Home Builders Co. Facility), 0.63%, 06/01/2029 (a) | 6,820,000 | 6,820,000 | |||
| Rondout Valley Central School District Accord Ulster County, NJ General Obligation Anticipation Notes, (State Aid Withholding), 1.25%, 06/29/2022 | 22,340,000 | 22,336,421 | |||
| Sidney Central School District General Obligation Limited Bonds, (State Aid Withholding), 1.00%, 08/05/2022 | 4,126,600 | 4,120,986 | |||
| Triborough Bridge & Tunnel Authority Revenue Bonds, Series B4A, 0.57%, 01/01/2032 (a) | 3,955,000 | 3,946,486 | |||
| Village of Johnson City General Obligation Limited Bonds, Series B, 2.00%, 09/30/2022 | 13,263,294 | 13,279,935 | |||
| 208,322,864 | |||||
| North Carolina (2.7%) | |||||
| Fayetteville State University Revenue Bonds, (AGM) 5.00%, 04/01/2023 (b) | 405,000 | 415,616 | |||
| 5.00%, 04/01/2024 (b) | 425,000 | 443,633 | |||
| 5.00%, 04/01/2026 (b) | 470,000 | 506,822 | |||
| Hertford County Industrial Facilities & Pollution Control Financing Authority Revenue Bonds (Nucor Corp.), Series A, 0.64%, 11/01/2033 (a) | 22,500,000 | 22,500,000 | |||
| 23,866,071 | |||||
| Shares or Principal Amount | Value (US$) | ||||
| Ohio (1.0%) | |||||
| State of Ohio Hospital Revenue Bonds (University Hospitals Health System, Inc.), Series C, VRDN, 0.63%, 01/15/2051 (a) | $ | 8,500,000 | $ | 8,500,000 | |
| Oklahoma (1.5%) | |||||
| Oklahoma Development Finance Authority Revenue Bonds (Gilcrease Developers LLC), AMT, 1.63%, 07/06/2023 | 2,000,000 | 1,966,349 | |||
| Oklahoma Development Finance Authority Revenue Bonds (INTEGRIS Health Obligated Group), VRDN, 0.71%, 08/15/2031 (a) | 11,600,000 | 11,600,000 | |||
| 13,566,349 | |||||
| Pennsylvania (7.0%) | |||||
| Central Bradford Progress Authority Revenue Bonds (The Guthrie Clinic Issue), Series D, VRDN, 0.71%, 12/01/2041 (a) | 7,065,000 | 7,065,000 | |||
| Montgomery County Higher Education and Health Authority Thomas Jefferson University Variable Rate Revenue Bonds, VRDN, 0.69%, 09/01/2050 (a)(c) | 3,030,000 | 3,030,000 | |||
| Pennsylvania Economic Development Financing Authority Solid Waste Disposal Revenue Bonds (Republic Services, Inc. Project), Series B, AMT, VRN, 0.30%, 04/01/2049 (a) | 4,500,000 | 4,485,345 | |||
| Pennsylvania Economic Development Financing Authority Solid Waste Disposal Revenue Bonds (Waste Management PA Obligated Group), 0.45%, 08/01/2045 (a) | 39,500,000 | 39,499,905 | |||
| Tender Option Bond Trust Receipts/Certificates Revenue Bonds, AMT, VRDN, 0.64%, 01/01/2051 (a)(b) | 7,500,000 | 7,500,000 | |||
| 61,580,250 | |||||
| South Carolina (2.0%) | |||||
| South Carolina Jobs-Economic Development Authority Revenue Bonds (Prisma Health Obligated Group), Series C, VRDN, 0.71%, 05/01/2048 (a) | 17,725,000 | 17,725,000 | |||
| Tennessee (0.1%) | |||||
| Nashville & Davidson Industrial Development Board Revenue Bonds (Waste Management Inc of Tennessee), 0.58%, 08/01/2031 (a) | 350,000 | 329,565 | |||
| Wilson County Industrial Development Board Revenue Bonds (Kenwal Steel Tennessee LLC), 0.77%, 06/01/2037 (a) | 830,000 | 830,000 | |||
| 1,159,565 | |||||
| Texas (8.8%) | |||||
| Angelina & Neches River Authority Revenue Bonds (Jefferson Enterprise Energy LLC), AMT, VRN, 0.45%, 12/01/2045 (a) | 8,000,000 | 7,985,692 | |||
See accompanying Notes to Financial Statements.
| 48 | 2022 Semi-Annual Report |
Statement of Investments (concluded)
April 30, 2022 (Unaudited)
abrdn Ultra Short Municipal Income Fund
| Shares or Principal Amount | Value (US$) | ||||
| MUNICIPAL BONDS (continued) | |||||
| Texas (continued) | |||||
| City of Houston TX Hotel Occupancy Tax & Revenue Bonds 4.00%, 09/01/2022 | $ | 180,000 | $ | 181,458 | |
| 4.00%, 09/01/2023 | 180,000 | 184,141 | |||
| 4.00%, 09/01/2025 | 425,000 | 441,594 | |||
| Mission Economic Development Corp. Revenue Bonds (Waste Management, Inc.), Series B, 1.00%, 07/01/2040 (a) | 16,800,000 | 16,789,258 | |||
| Mission Economic Development Corp. Solid Waste Disposal Revenue Bonds (Republic Services, Inc.), AMT, FRN, 0.45%, 05/01/2050 (a) | 18,000,000 | 17,999,957 | |||
| Port of Port Arthur Navigation District Revenue Bonds, 0.60%, 04/01/2040 (a) | 15,400,000 | 15,400,000 | |||
| Port of Port Arthur Navigation District Revenue Bonds (Motiva Enterprises Class C), VRDN, 0.62%, 04/01/2040 (a) | 1,600,000 | 1,600,000 | |||
| Tender Opt Bd Tr Rcpts / Ctfs Var Sts Ctfs, VRDN, 0.64%, 06/15/2056 (a)(b) | 11,000,000 | 11,000,000 | |||
| Texas Municipal Gas Acquisition & Supply Corp III Revenue Bonds 5.00%, 12/15/2022 | 1,150,000 | 1,167,363 | |||
| 5.00%, 12/15/2025 | 4,600,000 | 4,825,124 | |||
| 77,574,587 | |||||
| Virginia (2.8%) | |||||
| Virginia Small Business Financing Authority Revenue Bonds (Senior Lien-Elizabeth River CR), AMT 5.25%, 01/01/2032 | 5,670,000 | 5,702,803 | |||
| 5.50%, 01/01/2042 | 18,340,000 | 18,453,431 | |||
| 24,156,234 | |||||
| West Virginia (1.0%) | |||||
| West Virginia Economic Development Authority Revenue Bonds (Appalachian Power Co., SE), VRN, 2.63%, 12/01/2042 (a) | 6,460,000 | 6,461,758 | |||
| West Virginia Hospital Finance Authority Revenue Bonds (West Virginia United Health System Obligated Group), Series E, 0.70%, 06/01/2033 (a) | 2,310,000 | 2,310,000 | |||
| 8,771,758 | |||||
| Wisconsin (4.6%) | |||||
| Tender Option Bond Trust Receipts Revenue Bonds, VRDN, 0.64%, 12/15/2040 (a)(b) | 2,645,000 | 2,645,000 | |||
| Wisconsin Health & Educational Facilities Authority Revenue Bonds, 0.71%, 02/15/2053 (a) | 26,810,000 | 26,810,000 | |||
| Wisconsin Health & Educational Facilities Authority Revenue Bonds (Marshfield Clinic Health System), VRDN, 0.71%, 02/15/2053 (a) | 11,000,000 | 11,000,000 | |||
| 40,455,000 | |||||
| Total Municipal Bonds | 912,998,684 | ||||
| Shares or Principal Amount | Value (US$) | ||||
| SHORT-TERM INVESTMENT (2.3%) | |||||
| UNITED STATES (2.3%) | |||||
| Mercer County Pollution Control Revenue Commercial Paper Notes, 0.80%, 05/10/2022 | $ | 20,000,000 | $ | 20,000,032 | |
| Total Short-Term Investment | 20,000,032 | ||||
| Total Investments (Cost $935,295,058) (d)—106.1% | 932,998,716 | ||||
| Liabilities in Excess of Other Assets—(6.1)% | (53,504,954 | ) | |||
| Net Assets—100.0% | $ | 879,493,762 | |||
| (a) | Variable Rate Instrument. The rate shown is based on the latest available information as of April 30, 2022. Certain variable rate securities are not based on a published reference rate and spread but are determined by the issuer or agent and are based on current market conditions. These securities do not indicate a reference rate and spread in their description. |
| (b) | Denotes a security issued under Regulation S or Rule 144A. |
| (c) | Illiquid security. |
| (d) | See accompanying Notes to Financial Statements for tax unrealized appreciation/(depreciation) of securities. |
FRN Floating Rate Note
See accompanying Notes to Financial Statements.
| 2022 Semi-Annual Report | 49 |
Statements of Assets and Liabilities (Unaudited)
April 30, 2022
abrdn Emerging Markets Debt Fund | abrdn Global Absolute Return Strategies Fund | abrdn Global High Income Fund | abrdn Intermediate Municipal Income Fund | abrdn Short Duration High Yield Municipal Fund | |||||||||||
| Assets: | |||||||||||||||
| Investments, at value | $ 30,036,577 | $ 50,355,700 | $ 103,587,541 | $ 51,010,295 | $ 354,261,699 | ||||||||||
| Cash collateral pledged for futures | – | 1,223,444 | – | – | – | ||||||||||
| Foreign currency, at value | 55 | 346,103 | 1,952 | – | – | ||||||||||
| Cash at broker for forward foreign currency contracts | 140,000 | – | – | – | – | ||||||||||
| Cash at broker for options | – | 1,931,805 | – | – | – | ||||||||||
| Receivable for interest rate swaps closed | – | 67,229,217 | – | – | – | ||||||||||
| Interest and dividends receivable | 532,914 | 200,392 | 1,594,567 | 722,224 | 4,506,569 | ||||||||||
| Unrealized appreciation on forward foreign currency exchange contracts | 213,593 | 2,251,212 | 851,673 | – | – | ||||||||||
| Receivable for investments sold | – | 219,707 | 1,034,214 | – | 1,452,150 | ||||||||||
| Variation margin receivable for futures contracts | – | 297,880 | – | – | – | ||||||||||
| Unrealized appreciation on swap contracts | – | 202,408 | – | – | – | ||||||||||
| Receivable from Adviser (Note 3) | 16,045 | 62,797 | 42,111 | 15,881 | 75,372 | ||||||||||
| Receivable for capital shares issued | – | 20,983 | 16,110 | 1,000 | 29,606 | ||||||||||
| Tax reclaim receivable | – | 512 | – | – | – | ||||||||||
| Variation margin receivable for centrally cleared swaps | – | 13,453 | – | – | – | ||||||||||
| Prepaid expenses | 28,752 | 30,124 | – | 35,262 | 43,235 | ||||||||||
| Total assets | 30,967,936 | 124,385,737 | 107,128,168 | 51,784,662 | 360,368,631 | ||||||||||
| Liabilities: | |||||||||||||||
| Due to custodian | – | 1,376,137 | – | – | – | ||||||||||
| Payable for investments purchased | 168,251 | 219,707 | 544,811 | – | – | ||||||||||
| Unrealized depreciation on forward foreign currency exchange contracts | 192,037 | 1,232,840 | 51,220 | – | – | ||||||||||
| Unrealized depreciation on swap contracts | – | 571,355 | – | – | – | ||||||||||
| Distributions payable | – | – | – | 8,459 | 52,134 | ||||||||||
| Payable for capital shares redeemed | 413 | 58,722 | 18,117 | 80,560 | 2,777,763 | ||||||||||
| Payable for interest rate swaps closed | – | 67,263,815 | – | – | – | ||||||||||
| Written options outstanding, at value | – | 538,715 | – | – | – | ||||||||||
| Accrued expenses and other payables: | |||||||||||||||
| Custodian fees | 34,639 | 286,225 | 70,296 | 14,744 | 17,950 | ||||||||||
| Investment advisory fees | 15,493 | 26,829 | – | 18,661 | 191,613 | ||||||||||
| Audit fees | 25,397 | 35,086 | 29,841 | 23,602 | 25,023 | ||||||||||
| Interest expense payable | – | – | 5,335 | – | – | ||||||||||
| Administration fees | 2,066 | 3,577 | 7,466 | 3,513 | 28,227 | ||||||||||
| Sub-transfer agent and administrative services fees | 2,280 | 10,706 | 14,163 | 630 | 16,759 | ||||||||||
| Transfer agent fees | 1,327 | 6,225 | 17,968 | 3,119 | 1,672 | ||||||||||
| Distribution fees | 1,247 | 3,596 | 14,572 | 1,289 | 6,114 | ||||||||||
| Fund accounting fees | 1,860 | 2,134 | – | 2,845 | 18,390 | ||||||||||
| Legal fees | 181 | 654 | 5,257 | 245 | 7,073 | ||||||||||
| Printing fees | 847 | 5,323 | – | 193 | – | ||||||||||
| Other accrued expenses | 20,922 | 42,332 | 19,709 | 18,231 | 37,708 | ||||||||||
| Total liabilities | 466,960 | 71,683,978 | 798,755 | 176,091 | 3,180,426 | ||||||||||
| Net Assets | $ 30,500,976 | $ 52,701,759 | $ 106,329,413 | $ 51,608,571 | $ 357,188,205 | ||||||||||
| Cost: | |||||||||||||||
| Investments | $37,520,086 | $ 51,537,581 | $ 113,753,849 | $ 51,439,966 | $ 374,852,848 | ||||||||||
| Foreign currency | – | 364,475 | 2,151 | – | – | ||||||||||
| Premiums on written options: | – | 429,860 | – | – | – | ||||||||||
| Represented by: | |||||||||||||||
| Capital | $ 43,662,423 | $ 57,733,749 | $ 352,257,975 | $ 52,625,434 | $ 388,375,233 | ||||||||||
| Distributable accumulated loss | (13,161,447 | ) | (5,031,990 | ) | (245,928,562 | ) | (1,016,863 | ) | (31,187,028 | ) | |||||
| Net Assets | $ 30,500,976 | $ 52,701,759 | $ 106,329,413 | $ 51,608,571 | $ 357,188,205 | ||||||||||
Amounts listed as "–" are $0 or round to $0.
See accompanying Notes to Financial Statements.
| 50 | 2022 Semi-Annual Report |
Statements of Assets and Liabilities (Unaudited) (concluded)
April 30, 2022
abrdn Emerging Markets Debt Fund | abrdn Global Absolute Return Strategies Fund | abrdn Global High Income Fund | abrdn Intermediate Municipal Income Fund | abrdn Short Duration High Yield Municipal Fund | ||||||||||||||||
| Net Assets: | ||||||||||||||||||||
| Class A Shares | $ | 105,262 | $ | 15,483,305 | $ | 69,414,641 | $ | 5,282,925 | $ | 17,716,459 | ||||||||||
| Class C Shares | 22,313 | 448,984 | – | 228,304 | 25,478 | |||||||||||||||
| Class R Shares | 2,824,121 | – | – | – | – | |||||||||||||||
| Institutional Service Class Shares | 70,769 | 5,648,383 | – | 18,827 | – | |||||||||||||||
| Institutional Class Shares | 27,478,511 | 31,121,087 | 36,914,772 | 46,078,515 | 339,446,268 | |||||||||||||||
| Total | $ | 30,500,976 | $ | 52,701,759 | $ | 106,329,413 | $ | 51,608,571 | $ | 357,188,205 | ||||||||||
| Shares Outstanding (unlimited number of shares authorized): | ||||||||||||||||||||
| Class A Shares | 14,041 | 1,661,810 | 8,787,616 | 585,889 | 1,855,606 | |||||||||||||||
| Class C Shares | 2,973 | 49,459 | – | 25,363 | 2,667 | |||||||||||||||
| Class R Shares | 379,000 | – | – | – | – | |||||||||||||||
| Institutional Service Class Shares | 9,417 | 600,475 | – | 2,086 | – | |||||||||||||||
| Institutional Class Shares | 3,651,447 | 3,282,492 | 5,096,213 | 5,105,921 | 35,550,126 | |||||||||||||||
| Total | 4,056,878 | 5,594,236 | 13,883,829 | 5,719,259 | 37,408,399 | |||||||||||||||
| Net asset value and redemption price per share (Net assets by class divided by shares outstanding by class, respectively): | ||||||||||||||||||||
| Class A Shares | $ | 7.50 | $ | 9.32 | $ | 7.90 | $ | 9.02 | $ | 9.55 | ||||||||||
| Class C Shares (a) | $ | 7.51 | $ | 9.08 | $ | – | $ | 9.00 | $ | 9.55 | ||||||||||
| Class R Shares | $ | 7.45 | $ | – | $ | – | $ | – | $ | – | ||||||||||
| Institutional Service Class Shares | $ | 7.52 | $ | 9.41 | $ | – | $ | 9.03 | $ | – | ||||||||||
| Institutional Class Shares | $ | 7.53 | $ | 9.48 | $ | 7.24 | $ | 9.02 | $ | 9.55 | ||||||||||
| Maximum offering price per share (100%/(100% – maximum sales charge) of net asset value adjusted to the nearest cent): | ||||||||||||||||||||
| Class A Shares | $ | 7.73 | $ | 9.61 | $ | 8.14 | $ | 9.25 | $ | 9.79 | ||||||||||
| Maximum Sales Charge: | ||||||||||||||||||||
| Class A Shares | 3.00 | (b)% | 3.00 | (b)% | 3.00 | % | 2.50 | (c)% | 2.50 | (c)% | ||||||||||
| (a) | For Class C Shares, the redemption price per share is reduced by 1.00% for shares held less than one year due to contingent deferred sales charge. |
| (b) | Unless you are otherwise eligible to purchase Class A shares without a sales charge, a contingent deferred sales charge (CDSC) of up to 1.00% will be charged on Class A shares redeemed within 18 months of purchase if you paid no sales charge on the original purchase and a finder's fee was paid. |
| (c) | Unless you are otherwise eligible to purchase Class A shares without a sales charge, a contingent deferred sales charge (CDSC) of up to 0.75% will be charged on Class A shares redeemed within 12 months of purchase if you paid no sales charge on the original purchase and a finder's fee was paid. |
Amounts listed as "–" are $0 or round to $0.
See accompanying Notes to Financial Statements.
| 2022 Semi-Annual Report | 51 |
Statements of Assets and Liabilities (Unaudited)
April 30, 2022
abrdn Ultra Short Municipal Income Fund | ||||
| Assets: | ||||
| Investments, at value | $ | 932,998,716 | ||
| Cash | 345,067 | |||
| Receivable for investments sold | 17,000,000 | |||
| Interest and dividends receivable | 3,622,918 | |||
| Receivable for capital shares issued | 1,451,246 | |||
| Receivable from Adviser | 189,767 | |||
| Prepaid expenses | 22,803 | |||
| Total assets | 955,630,517 | |||
| Liabilities: | ||||
| Payable for investments purchased | 65,500,000 | |||
| Distributions payable | 18,848 | |||
| Payable for capital shares redeemed | 10,034,616 | |||
| Accrued expenses and other payables: | ||||
| Investment advisory fees | 234,451 | |||
| Sub-transfer agent and administrative services fees | 69,123 | |||
| Administration fees | 55,382 | |||
| Fund accounting fees | 46,250 | |||
| Custodian fees | 38,871 | |||
| Audit fees | 28,375 | |||
| Transfer agent fees | 7,560 | |||
| Distribution fees | 6,169 | |||
| Legal fees | 3,028 | |||
| Other accrued expenses | 94,082 | |||
| Total liabilities | 76,136,755 | |||
| Net Assets | $ | 879,493,762 | ||
| Cost: | ||||
| Investments | $ | 935,295,058 | ||
| Represented by: | ||||
| Capital | $ | 882,577,127 | ||
| Distributable accumulated loss | (3,083,365 | ) | ||
| Net Assets | $ | 879,493,762 | ||
| Net Assets: | ||||
| Class A Shares | $ | 137,678,631 | ||
| Class A1 Shares | 508,908 | |||
| Institutional Class Shares | 741,306,223 | |||
| Total | $ | 879,493,762 | ||
| Shares Outstanding (unlimited number of shares authorized): | ||||
| Class A Shares | 13,683,415 | |||
| Class A1 Shares | 50,546 | |||
| Institutional Class Shares | 74,098,967 | |||
| Total | 87,832,928 | |||
| Net asset value and redemption price per share (Net assets by class divided by shares outstanding by class, respectively): | ||||
| Class A Shares | $ | 10.06 | ||
| Class A1 Shares (d) | $ | 10.07 | ||
| Institutional Class Shares | $ | 10.00 | ||
| Maximum offering price per share (100%/(100% – maximum sales charge) of net asset value adjusted to the nearest cent): | ||||
| Class A1 Shares | $ | 10.12 | ||
| Maximum Sales Charge: | ||||
| Class A1 Shares | 0.50 | % | ||
| (d) | Unless you are otherwise eligible to purchase Class A1 shares without a sales charge, a contingent deferred sales charge (CDSC) of up to 0.25% will be charged on Class A1 shares redeemed within 12 months of purchase if you paid no sales charge on the original purchase and a finder's fee was paid. |
Amounts listed as "–" are $0 or round to $0.
See accompanying Notes to Financial Statements.
| 52 | 2022 Semi-Annual Report |
Statements of Operations (Unaudited)
For the Six-Month Period Ended April 30, 2022
| abrdn Emerging Markets Debt Fund | abrdn Global Absolute Return Strategies Fund | abrdn Global High Income Fund | abrdn Intermediate Municipal Income Fund | abrdn Short Duration High Yield Municipal Fund | ||||||||||||||||
| INVESTMENT INCOME: | ||||||||||||||||||||
| Dividend income | $ | – | $ | 40,304 | $ | 44,335 | $ | 50 | $ | 113 | ||||||||||
| Interest income | 1,564,587 | 165,267 | 3,325,494 | 919,244 | 6,150,472 | |||||||||||||||
| Foreign tax withholding | (860 | ) | (112 | ) | – | – | – | |||||||||||||
| Total Income | 1,563,727 | 205,459 | 3,369,829 | 919,294 | 6,150,585 | |||||||||||||||
| EXPENSES: | ||||||||||||||||||||
| Investment advisory fees | 104,334 | 202,232 | 399,906 | 122,870 | 1,318,319 | |||||||||||||||
| Trustee fees | 1,426 | 3,347 | 24,742 | 2,298 | 17,094 | |||||||||||||||
| Administration fees | 13,911 | 26,964 | 39,600 | 23,128 | 167,511 | |||||||||||||||
| Legal fees | 1,684 | 3,427 | 99 | 2,677 | 31,751 | |||||||||||||||
| Audit fees | 22,105 | 31,794 | 25,861 | 20,310 | 21,575 | |||||||||||||||
| Printing fees | 1,657 | 10,423 | 44,723 | 2,253 | 2,232 | |||||||||||||||
| Custodian fees | 13,139 | 124,598 | 81,712 | 5,829 | 7,365 | |||||||||||||||
| Transfer agent fees | 5,142 | 21,736 | 56,775 | 23,615 | 21,051 | |||||||||||||||
| Distribution fees Class A | 154 | 22,470 | 95,364 | 7,016 | 25,497 | |||||||||||||||
| Distribution fees Class C | 124 | 2,328 | – | 1,411 | 133 | |||||||||||||||
| Distribution fees Class R | 8,003 | – | – | – | – | |||||||||||||||
| Sub-transfer agent and administrative service fees Institutional Class | 2,983 | 27,183 | 16,909 | 2,595 | 105,519 | |||||||||||||||
| Sub-transfer agent and administrative service fees Class A | 89 | 14,924 | 47,998 | 323 | 6,564 | |||||||||||||||
| Sub-transfer agent and administrative service fees Class C | 29 | 292 | – | 61 | 2 | |||||||||||||||
| Sub-transfer agent and administrative service fees Class R | 2,668 | – | – | – | – | |||||||||||||||
| Sub-transfer agent and administrative service fees Institutional Service Class | 43 | 4,155 | – | – | – | |||||||||||||||
| Fund accounting fees | 696 | 1,348 | – | 1,156 | 8,375 | |||||||||||||||
| Registration and filing fees | 31,979 | 26,712 | 10,955 | 25,788 | 38,145 | |||||||||||||||
| Other | 17,013 | 17,733 | 28,903 | 15,734 | 35,434 | |||||||||||||||
| Total expenses before reimbursed/waived expenses | 227,179 | 541,666 | 873,547 | 257,064 | 1,806,567 | |||||||||||||||
| Interest Expense (a) | 206 | – | 542 | 28 | – | |||||||||||||||
| Total operating expenses before reimbursed/waived expenses | 227,385 | 541,666 | 874,089 | 257,092 | 1,806,567 | |||||||||||||||
| Expenses reimbursed | (103,063 | ) | (278,704 | ) | (316,146 | ) | (103,760 | ) | (419,911 | ) | ||||||||||
| Expenses waived by investment adviser | – | – | (601 | ) | – | – | ||||||||||||||
| Net expenses | 124,322 | 262,962 | 557,342 | 153,332 | 1,386,656 | |||||||||||||||
| Net Investment Income/(Loss) | 1,439,405 | (57,503 | ) | 2,812,487 | 765,962 | 4,763,929 | ||||||||||||||
| REALIZED/UNREALIZED GAIN/(LOSS) FROM INVESTMENTS: | ||||||||||||||||||||
| Realized loss on investment transactions | (2,176,716 | ) | (1,362,238 | ) | (2,725,612 | ) | (283,220 | ) | (2,103,359 | ) | ||||||||||
| Realized gain/(loss) on futures contracts | – | 241,906 | – | – | – | |||||||||||||||
| Realized gain/(loss) on written options | – | 797,127 | – | – | – | |||||||||||||||
| Realized gain/(loss) on swap contracts | – | (3,556,990 | ) | – | – | – | ||||||||||||||
| Realized gain/(loss) on forward foreign currency exchange contracts | 139,152 | (131,342 | ) | 1,174,036 | – | – | ||||||||||||||
| Realized gain/(loss) on foreign currency transactions | (17,294 | ) | 101,785 | (9,431 | ) | – | – | |||||||||||||
| Net realized loss from investments, futures contracts, swap contracts, forward foreign currency contracts and foreign currency transactions | (2,054,858 | ) | (3,909,752 | ) | (1,561,007 | ) | (283,220 | ) | (2,103,359 | ) | ||||||||||
| Net change in unrealized appreciation/(depreciation) on investment transactions | (4,626,955 | ) | (902,599 | ) | (12,188,964 | ) | (4,595,652 | ) | (26,846,997 | ) | ||||||||||
| Net change in unrealized appreciation/(depreciation) on swap contracts | – | 845,964 | – | – | – | |||||||||||||||
| Net change in unrealized appreciation/(depreciation) on futures contracts | – | (7,371 | ) | – | – | – | ||||||||||||||
| Net change in unrealized appreciation/(depreciation) on written options | – | (149,142 | ) | – | – | – | ||||||||||||||
| Net change in unrealized appreciation/(depreciation) on forward foreign currency exchange rate contracts | (90,155 | ) | 882,981 | 881,264 | – | – | ||||||||||||||
| Net change in unrealized appreciation/(depreciation) on translation of assets and liabilities denominated in foreign currencies | 1,505 | (16,780 | ) | (13,381 | ) | – | – | |||||||||||||
| Net change in unrealized appreciation/(depreciation) from investments, futures contracts, swap contracts, forward foreign currency contracts and translation of assets and liabilities denominated in foreign currencies | (4,715,605 | ) | 653,053 | (11,321,081 | ) | (4,595,652 | ) | (26,846,997 | ) | |||||||||||
| Net realized/unrealized (loss) from investments, futures contracts, swaps and foreign currency transactions | (6,770,463 | ) | (3,256,699 | ) | (12,882,088 | ) | (4,878,872 | ) | (28,950,356 | ) | ||||||||||
| CHANGE IN NET ASSETS RESULTING FROM OPERATIONS | $ | (5,331,058 | ) | $ | (3,314,202 | ) | $ | (10,069,601 | ) | $ | (4,112,910 | ) | $ | (24,186,427 | ) | |||||
(a) See Note 9 for additional information.
Amounts listed as "–" are $0 or round to $0.
See accompanying Notes to Financial Statements.
| 2022 Semi-Annual Report | 53 |
Statements of Operations (Unaudited) (concluded)
For the Six-Month Period Ended April 30, 2022
abrdn Ultra Short Municipal Income Fund | ||||
| INVESTMENT INCOME: | ||||
| Dividend income | $ | 654 | ||
| Interest income | 2,505,575 | |||
| Total Income | 2,506,229 | |||
| EXPENSES: | ||||
| Investment advisory fees | 2,161,367 | |||
| Trustee fees | 34,263 | |||
| Administration fees | 345,819 | |||
| Legal fees | 40,434 | |||
| Audit fees | 25,027 | |||
| Printing fees | 2,966 | |||
| Custodian fees | 16,767 | |||
| Transfer agent fees | 23,208 | |||
| Distribution fees Class A | 188,598 | |||
| Distribution fees Class A1 | 632 | |||
| Sub-transfer agent and administrative service fees Institutional Class | 270,768 | |||
| Sub-transfer agent and administrative service fees Class A | 52,807 | |||
| Sub-transfer agent and administrative service fees Class A1 | 11 | |||
| Fund accounting fees | 17,291 | |||
| Registration and filing fees | 38,583 | |||
| Other | 70,976 | |||
| Total operating expenses before reimbursed/waived expenses | 3,289,517 | |||
| Expenses reimbursed | (1,288,995 | ) | ||
| Net expenses | 2,000,522 | |||
| Net Investment Income | 505,707 | |||
| REALIZED/UNREALIZED GAIN/(LOSS) FROM INVESTMENTS: | ||||
| Realized loss on investment transactions | (229,404 | ) | ||
| Net realized loss from investments, futures contracts, swap contracts, forward foreign currency contracts and foreign currency transactions | (229,404 | ) | ||
| Net change in unrealized appreciation/(depreciation) on investment transactions | (2,452,638 | ) | ||
| Net change in unrealized appreciation/(depreciation) from investments, futures contracts, swap contracts, forward foreign currency contracts and translation of assets and liabilities denominated in foreign currencies | (2,452,638 | ) | ||
| Net realized/unrealized (loss) from investments, futures contracts, swaps and foreign currency transactions | (2,682,042 | ) | ||
| CHANGE IN NET ASSETS RESULTING FROM OPERATIONS | $ | (2,176,335 | ) | |
Amounts listed as "–" are $0 or round to $0.
See accompanying Notes to Financial Statements.
54 | 2022 Semi-Annual Report |
Statements of Changes in Net Assets
| abrdn Emerging Markets Debt Fund | abrdn Global Absolute Return Strategies Fund | abrdn Global High Income Fund | ||||||||||||||||||||||
| Six-Month Period Ended April 30, 2022 (Unaudited) | Year Ended October 31, 2021 | Six-Month Period Ended April 30, 2022 (Unaudited) | Year Ended October 31, 2021 | Six-Month Period Ended April 30, 2022 (Unaudited) | Year Ended October 31, 2021 | |||||||||||||||||||
| FROM INVESTMENT ACTIVITIES: | ||||||||||||||||||||||||
| Operations: | ||||||||||||||||||||||||
| Net investment income/(loss) | $ | 1,439,405 | $ | 2,603,837 | $ | (57,503 | ) | $ | (36,994 | ) | $ | 2,812,487 | $ | 6,840,306 | ||||||||||
| Net realized gain/(loss) from investments, futures contracts, swap contracts, forward foreign currency contracts and foreign currency transactions | (2,054,858 | ) | 529,611 | (3,909,752 | ) | 2,155,545 | (1,561,007 | ) | 4,386,995 | |||||||||||||||
| Net change in unrealized appreciation/ (depreciation) on investments, futures contracts, swap contracts, forward foreign currency contracts and translation of assets and liabilities denominated in foreign currencies | (4,715,605 | ) | (710,792 | ) | 653,053 | (2,313,338 | ) | (11,321,081 | ) | 2,796,725 | ||||||||||||||
| Changes in net assets resulting from operations | (5,331,058 | ) | 2,422,656 | (3,314,202 | ) | (194,787 | ) | (10,069,601 | ) | 14,024,026 | ||||||||||||||
| Distributions to Shareholders From: | ||||||||||||||||||||||||
| Distributable earnings: | ||||||||||||||||||||||||
| Class A | (6,567 | ) | (11,387 | ) | (754,555 | ) | (2,060 | ) | (2,154,913 | ) | (3,908,060 | ) | ||||||||||||
| Class C | (1,272 | ) | (3,466 | ) | (17,763 | ) | (401 | ) | – | – | ||||||||||||||
| Class R | (166,940 | ) | (139,135 | ) | – | – | – | – | ||||||||||||||||
| Institutional Service Class | (4,156 | ) | (3,507 | ) | (253,944 | ) | (17,552 | ) | – | – | ||||||||||||||
| Institutional Class | (1,738,682 | ) | (1,744,572 | ) | (1,692,167 | ) | (47,938 | ) | (1,487,312 | ) | (3,324,472 | ) | ||||||||||||
| Change in net assets from shareholder distributions | (1,917,617 | ) | (1,902,067 | ) | (2,718,429 | ) | (67,951 | ) | (3,642,225 | ) | (7,232,532 | ) | ||||||||||||
| Change in net assets from capital transactions | (2,933,936 | ) | (12,242,793 | ) | (33,202,632 | ) | 70,424,619 | (17,274,014 | ) | (15,070,803 | ) | |||||||||||||
| Change in net assets | (10,182,611 | ) | (11,722,204 | ) | (39,235,263 | ) | 70,161,881 | (30,985,840 | ) | (8,279,309 | ) | |||||||||||||
| Net Assets: | ||||||||||||||||||||||||
| Beginning of period | 40,683,587 | 52,405,791 | 91,937,022 | 21,775,141 | 137,315,253 | 145,594,562 | ||||||||||||||||||
| End of period | $ | 30,500,976 | $ | 40,683,587 | $ | 52,701,759 | $ | 91,937,022 | $ | 106,329,413 | $ | 137,315,253 | ||||||||||||
Amounts listed as "–" are $0 or round to $0.
See accompanying Notes to Financial Statements.
| 2022 Semi-Annual Report | 55 |
Statements of Changes in Net Assets (continued)
| abrdn Emerging Markets Debt Fund | abrdn Global Absolute Return Strategies Fund | abrdn Global High Income Fund | ||||||||||||||||||||||
| Six-Month Period Ended April 30, 2022 (Unaudited) | Year Ended October 31, 2021 | Six-Month Period Ended April 30, 2022 (Unaudited) | Year Ended October 31, 2021 | Six-Month Period Ended April 30, 2022 (Unaudited) | Year Ended October 31, 2021 | |||||||||||||||||||
| CAPITAL TRANSACTIONS: | ||||||||||||||||||||||||
| Class A Shares | ||||||||||||||||||||||||
| Proceeds from shares issued | $ | 4,488 | $ | 102,231 | $ | 313,478 | $ | 1,202,597 | $ | 9,935,262 | $ | 7,208,240 | ||||||||||||
| Proceeds of shares issued in connection with fund merger | – | – | – | 22,272,666 | – | – | ||||||||||||||||||
| Dividends reinvested | 6,204 | 8,606 | 663,592 | 1,986 | 1,940,801 | 3,748,272 | ||||||||||||||||||
| Cost of shares redeemed | (108,104 | ) | (188,170 | ) | (6,276,335 | ) | (1,936,020 | ) | (16,022,454 | ) | (20,448,290 | ) | ||||||||||||
| Total Class A | (97,412 | ) | (77,333 | ) | (5,299,265 | ) | 21,541,229 | (4,146,391 | ) | (9,491,778 | ) | |||||||||||||
| Class C Shares | ||||||||||||||||||||||||
| Proceeds from shares issued | – | 10,000 | – | 150,000 | – | – | ||||||||||||||||||
| Dividends reinvested | 1,272 | 3,466 | 17,763 | 401 | – | – | ||||||||||||||||||
| Cost of shares redeemed | (664 | ) | (128,689 | ) | (73 | ) | (338,551 | ) | – | – | ||||||||||||||
| Total Class C | 608 | (115,223 | ) | 17,690 | (188,150 | ) | – | – | ||||||||||||||||
| Class R Shares | ||||||||||||||||||||||||
| Proceeds from shares issued | 160,498 | 925,269 | – | – | – | – | ||||||||||||||||||
| Dividends reinvested | 166,940 | 139,135 | – | – | – | – | ||||||||||||||||||
| Cost of shares redeemed (a) | (501,406 | ) | (963,082 | ) | – | – | – | – | ||||||||||||||||
| Total Class R | (173,968 | ) | 101,322 | – | – | – | – | |||||||||||||||||
| Institutional Service Class Shares | ||||||||||||||||||||||||
| Proceeds from shares issued | – | 417 | 72,416 | 437,987 | – | – | ||||||||||||||||||
| Dividends reinvested | 4,156 | 3,507 | 250,598 | 17,235 | – | – | ||||||||||||||||||
| Cost of shares redeemed | (71 | ) | (179 | ) | (978,968 | ) | (1,699,571 | ) | – | – | ||||||||||||||
| Total Institutional Service Class | 4,085 | 3,745 | (655,954 | ) | (1,244,349 | ) | – | – | ||||||||||||||||
| Institutional Class Shares | ||||||||||||||||||||||||
| Proceeds from shares issued | 1,191,278 | 5,782,692 | 671,628 | 1,954,089 | 29,854,940 | 44,607,948 | ||||||||||||||||||
| Proceeds of shares issued in connection with fund merger | – | – | – | 56,538,906 | – | – | ||||||||||||||||||
| Dividends reinvested | 1,715,399 | 1,728,471 | 1,658,375 | 47,855 | 1,455,548 | 3,165,788 | ||||||||||||||||||
| Cost of shares redeemed | (5,573,926 | ) | (19,666,467 | ) | (29,595,106 | ) | (8,224,961 | ) | (44,438,111 | ) | (53,352,761 | ) | ||||||||||||
| Total Institutional Class | (2,667,249 | ) | (12,155,304 | ) | (27,265,103 | ) | 50,315,889 | (13,127,623 | ) | (5,579,025 | ) | |||||||||||||
| Change in net assets from capital transactions: | $ | (2,933,936 | ) | $ | (12,242,793 | ) | $ | (33,202,632 | ) | $ | 70,424,619 | $ | (17,274,014 | ) | $ | (15,070,803 | ) | |||||||
| (a) | Includes redemption fees, if any. |
Amounts listed as "–" are $0 or round to $0.
See accompanying Notes to Financial Statements.
| 56 | 2022 Semi-Annual Report |
Statements of Changes in Net Assets (concluded)
| abrdn Emerging Markets Debt Fund | abrdn Global Absolute Return Strategies Fund | abrdn Global High Income Fund | ||||||||||||||||||||||
| Six-Month Period Ended April 30, 2022 (Unaudited) | Year Ended October 31, 2021 | Six-Month Period Ended April 30, 2022 (Unaudited) | Year Ended October 31, 2021 | Six-Month Period Ended April 30, 2022 (Unaudited) | Year Ended October 31, 2021 | |||||||||||||||||||
| SHARE TRANSACTIONS: | ||||||||||||||||||||||||
| Class A Shares | ||||||||||||||||||||||||
| Issued | 536 | 10,842 | 32,313 | 114,890 | 1,169,908 | 811,602 | ||||||||||||||||||
| Issued in connection with fund merger | – | – | – | 2,156,386 | – | – | ||||||||||||||||||
| Reinvested | 717 | 895 | 66,293 | 188 | 229,069 | 420,325 | ||||||||||||||||||
| Redeemed | (11,741 | ) | (19,884 | ) | (626,150 | ) | (186,840 | ) | (1,884,675 | ) | (2,293,954 | ) | ||||||||||||
| Total Class A Shares | (10,488 | ) | (8,147 | ) | (527,544 | ) | 2,084,624 | (485,698 | ) | (1,062,027 | ) | |||||||||||||
| Class C Shares | ||||||||||||||||||||||||
| Issued | – | 1,072 | – | 14,515 | – | – | ||||||||||||||||||
| Reinvested | 147 | 361 | 1,818 | 39 | – | – | ||||||||||||||||||
| Redeemed | (80 | ) | (13,912 | ) | (7 | ) | (32,701 | ) | – | – | ||||||||||||||
| Total Class C Shares | 67 | (12,479 | ) | 1,811 | (18,147 | ) | – | – | ||||||||||||||||
| Class R Shares | ||||||||||||||||||||||||
| Issued | 19,139 | 98,091 | – | – | – | – | ||||||||||||||||||
| Reinvested | 19,389 | 14,545 | – | – | – | – | ||||||||||||||||||
| Redeemed | (58,188 | ) | (102,497 | ) | – | – | – | – | ||||||||||||||||
| Total Class R Shares | (19,660 | ) | 10,139 | – | – | – | – | |||||||||||||||||
| Institutional Service Class Shares | ||||||||||||||||||||||||
| Issued | – | 44 | 7,195 | 40,843 | – | – | ||||||||||||||||||
| Reinvested | 479 | 364 | 24,836 | 1,623 | – | – | ||||||||||||||||||
| Redeemed | (8 | ) | (19 | ) | (100,669 | ) | (160,987 | ) | – | – | ||||||||||||||
| Total Institutional Service Class Shares | 471 | 389 | (68,638 | ) | (118,521 | ) | – | – | ||||||||||||||||
| Institutional Class Shares | ||||||||||||||||||||||||
| Issued | 132,831 | 599,695 | 67,936 | 183,879 | 3,778,865 | 5,454,864 | ||||||||||||||||||
| Issued in connection with fund merger | – | – | – | 5,393,904 | – | – | ||||||||||||||||||
| Reinvested | 197,855 | 179,454 | 163,065 | 4,472 | 186,944 | 385,270 | ||||||||||||||||||
| Redeemed | (640,136 | ) | (2,035,218 | ) | (2,886,893 | ) | (783,300 | ) | (5,676,093 | ) | (6,488,189 | ) | ||||||||||||
| Total Institutional Class Shares | (309,450 | ) | (1,256,069 | ) | (2,655,892 | ) | 4,798,955 | (1,710,284 | ) | (648,055 | ) | |||||||||||||
| Total change in shares: | (339,060 | ) | (1,266,167 | ) | (3,250,263 | ) | 6,746,911 | (2,195,982 | ) | (1,710,082 | ) | |||||||||||||
Amounts listed as "–" are 0 or round to 0.
See accompanying Notes to Financial Statements.
| 2022 Semi-Annual Report | 57 |
Statements of Changes in Net Assets
| abrdn Intermediate Municipal Income Fund | abrdn Short Duration High Yield Municipal Fund | abrdn Ultra Short Municipal Income Fund | ||||||||||||||||||||||
| Six-Month Period Ended April 30, 2022 (Unaudited) | Year Ended October 31, 2021 | Six-Month Period Ended April 30, 2022 (Unaudited) | Year Ended October 31, 2021 | Six-Month Period Ended April 30, 2022 (Unaudited) | Year Ended October 31, 2021 | |||||||||||||||||||
| FROM INVESTMENT ACTIVITIES: | ||||||||||||||||||||||||
| Operations: | ||||||||||||||||||||||||
| Net investment income | $ | 765,962 | $ | 1,667,110 | $ | 4,763,929 | $ | 8,317,891 | $ | 505,707 | $ | 986,158 | ||||||||||||
| Net realized loss from investments, futures contracts, swap contracts, forward foreign currency contracts and foreign currency transactions | (283,220 | ) | (298,789 | ) | (2,103,359 | ) | (1,101,812 | ) | (229,404 | ) | (195,697 | ) | ||||||||||||
| Net change in unrealized appreciation/(depreciation) on investments, futures contracts, swap contracts, forward foreign currency contracts and translation of assets and liabilities denominated in foreign currencies | (4,595,652 | ) | 1,114,396 | (26,846,997 | ) | 8,143,949 | (2,452,638 | ) | 700,888 | |||||||||||||||
| Changes in net assets resulting from operations | (4,112,910 | ) | 2,482,717 | (24,186,427 | ) | 15,360,028 | (2,176,335 | ) | 1,491,349 | |||||||||||||||
| Distributions to Shareholders From: | ||||||||||||||||||||||||
| Distributable earnings: | ||||||||||||||||||||||||
| Class A | (67,923 | ) | (165,909 | ) | (207,801 | ) | (464,084 | ) | (32,624 | ) | (47,583 | ) | ||||||||||||
| Class A1 | – | – | – | – | (115 | ) | (123 | ) | ||||||||||||||||
| Class C | (2,371 | ) | (4,873 | ) | (173 | ) | (118 | ) | – | – | ||||||||||||||
| Institutional Service Class | (266 | ) | (564 | ) | – | – | – | – | ||||||||||||||||
| Institutional Class | (695,412 | ) | (1,602,524 | ) | (4,557,847 | ) | (7,826,608 | ) | (477,378 | ) | (945,195 | ) | ||||||||||||
| Change in net assets from shareholder distributions | (765,972 | ) | (1,773,870 | ) | (4,765,821 | ) | (8,290,810 | ) | (510,117 | ) | (992,901 | ) | ||||||||||||
| Change in net assets from capital transactions | (4,582,047 | ) | (4,613,579 | ) | (60,482,359 | ) | 146,984,308 | (72,955,753 | ) | (237,411,963 | ) | |||||||||||||
| Change in net assets | (9,460,929 | ) | (3,904,732 | ) | (89,434,607 | ) | 154,053,526 | (75,642,205 | ) | (236,913,515 | ) | |||||||||||||
| Net Assets: | ||||||||||||||||||||||||
| Beginning of period | 61,069,500 | 64,974,232 | 446,622,812 | 292,569,286 | 955,135,967 | 1,192,049,482 | ||||||||||||||||||
| End of period | $ | 51,608,571 | $ | 61,069,500 | $ | 357,188,205 | $ | 446,622,812 | $ | 879,493,762 | $ | 955,135,967 | ||||||||||||
Amounts listed as "–" are $0 or round to $0.
See accompanying Notes to Financial Statements.
| 58 | 2022 Semi-Annual Report |
Statements of Changes in Net Assets (continued)
| abrdn Intermediate Municipal Income Fund | abrdn Short Duration High Yield Municipal Fund | abrdn Ultra Short Municipal Income Fund | ||||||||||||||||||||||
| Six-Month Period Ended April 30, 2022 (Unaudited) | Year Ended October 31, 2021 | Six-Month Period Ended April 30, 2022 (Unaudited) | Year Ended October 31, 2021 | Six-Month Period Ended April 30, 2022 (Unaudited) | Year Ended October 31, 2021 | |||||||||||||||||||
| CAPITAL TRANSACTIONS: | ||||||||||||||||||||||||
| Class A Shares | ||||||||||||||||||||||||
| Proceeds from shares issued | $ | 4,665 | $ | 110,423 | $ | 1,007,595 | $ | 7,657,773 | $ | 7,554,019 | $ | 50,785,379 | ||||||||||||
| Dividends reinvested | 46,646 | 118,556 | 201,760 | 447,869 | 30,877 | 47,225 | ||||||||||||||||||
| Cost of shares redeemed | (321,111 | ) | (946,959 | ) | (4,013,962 | ) | (9,184,933 | ) | (30,795,224 | ) | (152,699,342 | ) | ||||||||||||
| Total Class A | (269,800 | ) | (717,980 | ) | (2,804,607 | ) | (1,079,291 | ) | (23,210,328 | ) | (101,866,738 | ) | ||||||||||||
| Class A1 Shares | ||||||||||||||||||||||||
| Dividends reinvested | – | – | – | – | 111 | 124 | ||||||||||||||||||
| Cost of shares redeemed | – | – | – | – | – | (47,641 | ) | |||||||||||||||||
| Total Class A1 | – | – | – | – | 111 | (47,517 | ) | |||||||||||||||||
| Class C Shares | ||||||||||||||||||||||||
| Proceeds from shares issued | 2,528 | 67,854 | – | 26,994 | – | – | ||||||||||||||||||
| Dividends reinvested | 2,371 | 4,858 | 172 | 109 | – | – | ||||||||||||||||||
| Cost of shares redeemed | (67,600 | ) | (31,260 | ) | – | – | – | – | ||||||||||||||||
| Total Class C | (62,701 | ) | 41,452 | 172 | 27,103 | – | – | |||||||||||||||||
| Class R Shares | ||||||||||||||||||||||||
| Institutional Service Class Shares | ||||||||||||||||||||||||
| Dividends reinvested | 266 | 563 | – | – | – | – | ||||||||||||||||||
| Cost of shares redeemed | (15 | ) | (15 | ) | – | – | – | – | ||||||||||||||||
| Total Institutional Service Class | 251 | 548 | – | – | – | – | ||||||||||||||||||
| Institutional Class Shares | ||||||||||||||||||||||||
| Proceeds from shares issued | 175,596 | 884,579 | 74,273,420 | 268,144,226 | 247,521,458 | 657,065,229 | ||||||||||||||||||
| Dividends reinvested | 574,348 | 1,288,406 | 3,154,268 | 5,859,757 | 361,472 | 811,146 | ||||||||||||||||||
| Cost of shares redeemed | (4,999,741 | ) | (6,110,584 | ) | (135,105,612 | ) | (125,967,487 | ) | (297,628,466 | ) | (793,374,083 | ) | ||||||||||||
| Total Institutional Class | (4,249,797 | ) | (3,937,599 | ) | (57,677,924 | ) | 148,036,496 | (49,745,536 | ) | (135,497,708 | ) | |||||||||||||
| Change in net assets from capital transactions: | $ | (4,582,047 | ) | $ | (4,613,579 | ) | $ | (60,482,359 | ) | $ | 146,984,308 | $ | (72,955,753 | ) | $ | (237,411,963 | ) | |||||||
Amounts listed as "–" are $0 or round to $0.
See accompanying Notes to Financial Statements.
| 2022 Semi-Annual Report | 59 |
Statements of Changes in Net Assets (concluded)
| abrdn Intermediate Municipal Income Fund | abrdn Short Duration High Yield Municipal Fund | abrdn Ultra Short Municipal Income Fund | ||||||||||||||||
| Six-Month Period Ended April 30, 2022 (Unaudited) | Year Ended October 31, 2021 | Six-Month Period Ended April 30, 2022 (Unaudited) | Year Ended October 31, 2021 | Six-Month Period Ended April 30, 2022 (Unaudited) | Year Ended October 31, 2021 | |||||||||||||
| SHARE TRANSACTIONS: | ||||||||||||||||||
| Class A Shares | ||||||||||||||||||
| Issued | 499 | 11,090 | 98,725 | 747,277 | 748,966 | 5,029,554 | ||||||||||||
| Reinvested | 4,898 | 11,975 | 20,158 | 43,706 | 3,067 | 4,677 | ||||||||||||
| Redeemed | (32,656 | ) | (95,424 | ) | (398,591 | ) | (898,694 | ) | (3,055,547 | ) | (15,121,758 | ) | ||||||
| Total Class A Shares | (27,259 | ) | (72,359 | ) | (279,708 | ) | (107,711 | ) | (2,303,514 | ) | (10,087,527 | ) | ||||||
| Class A1 Shares | ||||||||||||||||||
| Reinvested | – | – | – | – | 11 | 12 | ||||||||||||
| Redeemed | – | – | – | – | – | (4,717 | ) | |||||||||||
| Total Class A1 Shares | – | – | – | – | 11 | (4,705 | ) | |||||||||||
| Class C Shares | ||||||||||||||||||
| Issued | 257 | 6,862 | – | 2,638 | – | – | ||||||||||||
| Reinvested | 249 | 492 | 18 | 11 | – | – | ||||||||||||
| Redeemed | (7,104 | ) | (3,155 | ) | – | – | – | – | ||||||||||
| Total Class C Shares | (6,598 | ) | 4,199 | 18 | 2,649 | – | – | |||||||||||
| Institutional Service Class Shares | ||||||||||||||||||
| Reinvested | 28 | 57 | – | – | – | – | ||||||||||||
| Redeemed | (1 | ) | (2 | ) | – | – | – | – | ||||||||||
| Total Institutional Service Class Shares | 27 | 55 | – | – | – | – | ||||||||||||
| Institutional Class Shares | ||||||||||||||||||
| Issued | 18,203 | 89,355 | 7,353,639 | 26,088,301 | 24,714,765 | 65,442,952 | ||||||||||||
| Reinvested | 60,230 | 130,040 | 314,896 | 571,244 | 36,117 | 80,792 | ||||||||||||
| Redeemed | (532,602 | ) | (616,659 | ) | (13,510,018 | ) | (12,297,198 | ) | (29,695,004 | ) | (79,028,435 | ) | ||||||
| Total Institutional Class Shares | (454,169 | ) | (397,264 | ) | (5,841,483 | ) | 14,362,347 | (4,944,122 | ) | (13,504,691 | ) | |||||||
| Total change in shares: | (487,999 | ) | (465,369 | ) | (6,121,173 | ) | 14,257,285 | (7,247,625 | ) | (23,596,923 | ) | |||||||
Amounts listed as "–" are 0 or round to 0.
See accompanying Notes to Financial Statements.
| 60 | 2022 Semi-Annual Report |
Financial Highlights
Selected Data for Each Share of Capital Outstanding Throughout the Periods Indicated
abrdn Emerging Markets Debt Fund
| Investment Activities | Distributions | ||||||||||||||||||||
| Net Asset Value, Beginning of Period | Net Investment Income (a) | Net Realized and Unrealized Gains (Losses) on Investments | Total from Investment Activities | Net Investment Income | Total Distributions | Net Asset Value, End of Period | |||||||||||||||
| Class A Shares | |||||||||||||||||||||
| Six Months Ended April 30, 2022* | $ 9.24 | $0.33 | $ (1.61 | ) | $ (1.28 | ) | $(0.46 | ) | $(0.46 | ) | $ 7.50 | ||||||||||
| Year Ended October 31, 2021 | 9.24 | 0.51 | (0.13 | ) | 0.38 | (0.38 | ) | (0.38 | ) | 9.24 | |||||||||||
| Year Ended October 31, 2020 | 9.72 | 0.43 | (0.58 | ) | (0.15 | ) | (0.33 | ) | (0.33 | ) | 9.24 | ||||||||||
| Year Ended October 31, 2019 | 8.97 | 0.50 | 0.62 | 1.12 | (0.37 | ) | (0.37 | ) | 9.72 | ||||||||||||
| Year Ended October 31, 2018 | 10.27 | 0.47 | (1.26 | ) | (0.79 | ) | (0.51 | ) | (0.51 | ) | 8.97 | ||||||||||
| Year Ended October 31, 2017 | 9.73 | 0.49 | 0.30 | 0.79 | (0.25 | ) | (0.25 | ) | 10.27 | ||||||||||||
| Class C Shares | |||||||||||||||||||||
| Six Months Ended April 30, 2022* | 9.25 | 0.30 | (1.60 | ) | (1.30 | ) | (0.44 | ) | (0.44 | ) | 7.51 | ||||||||||
| Year Ended October 31, 2021 | 9.19 | 0.42 | (0.08 | ) | 0.34 | (0.28 | ) | (0.28 | ) | 9.25 | |||||||||||
| Year Ended October 31, 2020 | 9.69 | 0.36 | (0.58 | ) | (0.22 | ) | (0.28 | ) | (0.28 | ) | 9.19 | ||||||||||
| Year Ended October 31, 2019 | 8.90 | 0.44 | 0.64 | 1.08 | (0.29 | ) | (0.29 | ) | 9.69 | ||||||||||||
| Year Ended October 31, 2018 | 10.22 | 0.43 | (1.28 | ) | (0.85 | ) | (0.47 | ) | (0.47 | ) | 8.90 | ||||||||||
| Year Ended October 31, 2017 | 9.68 | 0.44 | 0.29 | 0.73 | (0.19 | ) | (0.19 | ) | 10.22 | ||||||||||||
| Class R Shares | |||||||||||||||||||||
| Six Months Ended April 30, 2022* | 9.19 | 0.32 | (1.61 | ) | (1.29 | ) | (0.45 | ) | (0.45 | ) | 7.45 | ||||||||||
| Year Ended October 31, 2021 | 9.19 | 0.49 | (0.13 | ) | 0.36 | (0.36 | ) | (0.36 | ) | 9.19 | |||||||||||
| Year Ended October 31, 2020 | 9.69 | 0.39 | (0.57 | ) | (0.18 | ) | (0.32 | ) | (0.32 | ) | 9.19 | ||||||||||
| Year Ended October 31, 2019 | 8.93 | 0.47 | 0.64 | 1.11 | (0.35 | ) | (0.35 | ) | 9.69 | ||||||||||||
| Year Ended October 31, 2018 | 10.25 | 0.46 | (1.28 | ) | (0.82 | ) | (0.50 | ) | (0.50 | ) | 8.93 | ||||||||||
| Year Ended October 31, 2017 | 9.72 | 0.47 | 0.30 | 0.77 | (0.24 | ) | (0.24 | ) | 10.25 | ||||||||||||
| Institutional Service Class Shares | |||||||||||||||||||||
| Six Months Ended April 30, 2022* | 9.25 | 0.34 | (1.61 | ) | (1.27 | ) | (0.46 | ) | (0.46 | ) | 7.52 | ||||||||||
| Year Ended October 31, 2021 | 9.25 | 0.55 | (0.14 | ) | 0.41 | (0.41 | ) | (0.41 | ) | 9.25 | |||||||||||
| Year Ended October 31, 2020 | 9.76 | 0.46 | (0.59 | ) | (0.13 | ) | (0.38 | ) | (0.38 | ) | 9.25 | ||||||||||
| Year Ended October 31, 2019 | 8.99 | 0.53 | 0.65 | 1.18 | (0.41 | ) | (0.41 | ) | 9.76 | ||||||||||||
| Year Ended October 31, 2018 | 10.30 | 0.52 | (1.28 | ) | (0.76 | ) | (0.55 | ) | (0.55 | ) | 8.99 | ||||||||||
| Year Ended October 31, 2017 | 9.75 | 0.54 | 0.30 | 0.84 | (0.29 | ) | (0.29 | ) | 10.30 | ||||||||||||
| Institutional Class Shares | |||||||||||||||||||||
| Six Months Ended April 30, 2022* | 9.26 | 0.35 | (1.61 | ) | (1.26 | ) | (0.47 | ) | (0.47 | ) | 7.53 | ||||||||||
| Year Ended October 31, 2021 | 9.26 | 0.55 | (0.14 | ) | 0.41 | (0.41 | ) | (0.41 | ) | 9.26 | |||||||||||
| Year Ended October 31, 2020 | 9.76 | 0.46 | (0.58 | ) | (0.12 | ) | (0.38 | ) | (0.38 | ) | 9.26 | ||||||||||
| Year Ended October 31, 2019 | 8.99 | 0.51 | 0.67 | 1.18 | (0.41 | ) | (0.41 | ) | 9.76 | ||||||||||||
| Year Ended October 31, 2018 | 10.29 | 0.52 | (1.28 | ) | (0.76 | ) | (0.54 | ) | (0.54 | ) | 8.99 | ||||||||||
| Year Ended October 31, 2017 | 9.74 | 0.54 | 0.29 | 0.83 | (0.28 | ) | (0.28 | ) | 10.29 | ||||||||||||
| * | Unaudited |
| (a) | Net investment income/(loss) is based on average shares outstanding during the period. |
| (b) | Excludes sales charge. |
| (c) | Not annualized for periods less than one year. |
Amounts listed as "–" are $0 or round to $0.
See accompanying Notes to Financial Statements.
| 2022 Semi-Annual Report | 61 |
Financial Highlights (continued)
Selected Data for Each Share of Capital Outstanding Throughout the Periods Indicated
abrdn Emerging Markets Debt Fund (concluded)
| Ratios/Supplemental Data | |||||||||||||||||
| Total Return (b)(c) | Net Assets at End of Period (000's) | Ratio of Expenses (Net of Reimbursements/ Waivers) to Average Net Assets (d) | Ratio of Expenses (Prior to Reimbursements) to Average Net Assets (d)(e) | Ratio of Net Investment Income to Average Net Assets (d) | Portfolio Turnover (c)(f) | ||||||||||||
| (14.55 | %) | $ 105 | 1.05 | %(g) | 1.63 | %(g) | 7.79 | % | 22.36 | % | |||||||
| 3.96 | % | 227 | 1.02 | %(g) | 1.51 | %(g) | 5.34 | % | 71.56 | % | |||||||
| (1.53 | %) | 302 | 1.02 | %(g) | 1.44 | %(g) | 4.57 | % | 63.45 | % | |||||||
| 12.81 | % | 852 | 1.07 | % | 1.61 | % | 5.37 | % | 71.06 | % | |||||||
| (7.91 | %) | 1,050 | 1.31 | % | 1.93 | % | 4.78 | % | 56.02 | % | |||||||
| 8.21 | % | 1,987 | 1.37 | % | 2.15 | % | 4.85 | % | 64.37 | % | |||||||
| (14.72 | %) | 22 | 1.65 | %(g) | 2.46 | %(g) | 7.30 | % | 22.36 | % | |||||||
| 3.54 | % | 27 | 1.65 | %(g) | 2.25 | %(g) | 4.39 | % | 71.56 | % | |||||||
| (2.34 | %) | 141 | 1.65 | %(g) | 2.16 | %(g) | 3.90 | % | 63.45 | % | |||||||
| 12.36 | % | 110 | 1.70 | % | 2.31 | % | 4.75 | % | 71.06 | % | |||||||
| (8.58 | %) | 304 | 1.90 | % | 2.58 | % | 4.52 | % | 56.02 | % | |||||||
| 7.57 | % | 261 | 1.90 | % | 2.75 | % | 4.46 | % | 64.37 | % | |||||||
| (14.70 | %) | 2,824 | 1.32 | %(g) | 1.90 | %(g) | 7.62 | % | 22.36 | % | |||||||
| 3.74 | % | 3,662 | 1.30 | %(g) | 1.79 | %(g) | 5.22 | % | 71.56 | % | |||||||
| (1.94 | %) | 3,572 | 1.30 | %(g) | 1.72 | %(g) | 4.28 | % | 63.45 | % | |||||||
| 12.69 | % | 4,318 | 1.31 | % | 1.85 | % | 5.05 | % | 71.06 | % | |||||||
| (8.25 | %) | 3,826 | 1.55 | % | 2.17 | % | 4.79 | % | 56.02 | % | |||||||
| 7.96 | % | 2,934 | 1.56 | % | 2.34 | % | 4.72 | % | 64.37 | % | |||||||
| (14.35 | %) | 71 | 0.76 | %(g) | 1.34 | %(g) | 8.21 | % | 22.36 | % | |||||||
| 4.25 | % | 83 | 0.77 | %(g) | 1.26 | %(g) | 5.75 | % | 71.56 | % | |||||||
| (1.36 | %) | 79 | 0.65 | % | 1.07 | % | 4.96 | % | 63.45 | % | |||||||
| 13.43 | % | 24 | 0.68 | % | 1.22 | % | 5.66 | % | 71.06 | % | |||||||
| (7.63 | %) | 20 | 0.89 | % | 1.52 | % | 5.38 | % | 56.02 | % | |||||||
| 8.67 | % | 22 | 0.90 | % | 1.68 | % | 5.43 | % | 64.37 | % | |||||||
| (14.30 | %) | 27,479 | 0.65 | %(g) | 1.24 | %(g) | 8.35 | % | 22.36 | % | |||||||
| 4.32 | % | 36,685 | 0.65 | %(g) | 1.17 | %(g) | 5.77 | % | 71.56 | % | |||||||
| (1.29 | %) | 48,312 | 0.65 | %(g) | 1.10 | %(g) | 4.95 | % | 63.45 | % | |||||||
| 13.40 | % | 46,573 | 0.67 | % | 1.25 | % | 5.43 | % | 71.06 | % | |||||||
| (7.58 | %) | 18,720 | 0.90 | % | 1.58 | % | 5.41 | % | 56.02 | % | |||||||
| 8.62 | % | 18,365 | 0.90 | % | 1.76 | % | 5.42 | % | 64.37 | % | |||||||
| (d) | Annualized for periods less than one year. |
| (e) | During the period, certain fees were waived and/or reimbursed. If such waivers/reimbursements had not occurred, the ratios would have been as indicated. |
| (f) | Portfolio turnover is calculated on the basis of the Fund as a whole without distinguishing among the classes of shares. |
| (g) | Includes interest expense that amounts to less than 0.01%. |
| 62 | 2022 Semi-Annual Report |
Financial Highlights (continued)
Selected Data for Each Share of Capital Outstanding Throughout the Periods Indicated
abrdn Global Absolute Return Strategies Fund
| Investment Activities | Distributions | |||||||||||||||||||||||
| Net Asset Value, Beginning of Period | Net Investment Income (Loss) (a) | Net Realized and Unrealized Gains (Losses) on Investments | Total from Investment Activities | Net Investment Income | Net Realized Gains | Total Distributions | Net Asset Value, End of Period | |||||||||||||||||
| Class A Shares | ||||||||||||||||||||||||
| Six Months Ended April 30, 2022* | $10.29 | $(0.02 | ) | $(0.56 | ) | $(0.58 | ) | $(0.02 | ) | $(0.37 | ) | $(0.39 | ) | $ 9.32 | ||||||||||
| Year Ended October 31, 2021 | 10.29 | (0.03 | ) | 0.05 | 0.02 | (0.02 | ) | – | (0.02 | ) | 10.29 | |||||||||||||
| Year Ended October 31, 2020 | 10.13 | 0.04 | 0.29 | 0.33 | (0.17 | ) | – | (0.17 | ) | 10.29 | ||||||||||||||
| Year Ended October 31, 2019 | 10.41 | 0.17 | 0.25 | 0.42 | (0.60 | ) | (0.10 | ) | (0.70 | ) | 10.13 | |||||||||||||
| Year Ended October 31, 2018 | 10.22 | 0.17 | 0.05 | 0.22 | – | (0.03 | ) | (0.03 | ) | 10.41 | ||||||||||||||
| Year Ended October 31, 2017 | 10.18 | 0.13 | 0.02 | 0.15 | – | (0.11 | ) | (0.11 | ) | 10.22 | ||||||||||||||
| Class C Shares | ||||||||||||||||||||||||
| Six Months Ended April 30, 2022* | 10.04 | (0.05 | ) | (0.54 | ) | (0.59 | ) | – | (0.37 | ) | (0.37 | ) | 9.08 | |||||||||||
| Year Ended October 31, 2021 | 10.10 | (0.11 | ) | 0.06 | (0.05 | ) | (0.01 | ) | – | (0.01 | ) | 10.04 | ||||||||||||
| Year Ended October 31, 2020 | 9.87 | (0.07 | ) | 0.32 | 0.25 | (0.02 | ) | – | (0.02 | ) | 10.10 | |||||||||||||
| Year Ended October 31, 2019 | 10.09 | 0.10 | 0.24 | 0.34 | (0.46 | ) | (0.10 | ) | (0.56 | ) | 9.87 | |||||||||||||
| Year Ended October 31, 2018 | 9.97 | 0.09 | 0.06 | 0.15 | – | (0.03 | ) | (0.03 | ) | 10.09 | ||||||||||||||
| Year Ended October 31, 2017 | 10.01 | 0.06 | 0.01 | 0.07 | – | (0.11 | ) | (0.11 | ) | 9.97 | ||||||||||||||
| Institutional Service Class Shares | ||||||||||||||||||||||||
| Six Months Ended April 30, 2022* | 10.36 | (0.01 | ) | (0.56 | ) | (0.57 | ) | (0.01 | ) | (0.37 | ) | (0.38 | ) | 9.41 | ||||||||||
| Year Ended October 31, 2021 | 10.35 | (0.02 | ) | 0.06 | 0.04 | (0.03 | ) | – | (0.03 | ) | 10.36 | |||||||||||||
| Year Ended October 31, 2020 | 10.20 | 0.06 | 0.29 | 0.35 | (0.20 | ) | – | (0.20 | ) | 10.35 | ||||||||||||||
| Year Ended October 31, 2019 | 10.47 | 0.19 | 0.27 | 0.46 | (0.63 | ) | (0.10 | ) | (0.73 | ) | 10.20 | |||||||||||||
| Year Ended October 31, 2018 | 10.26 | 0.18 | 0.06 | 0.24 | – | (0.03 | ) | (0.03 | ) | 10.47 | ||||||||||||||
| Year Ended October 31, 2017 | 10.21 | 0.15 | 0.01 | 0.16 | – | (0.11 | ) | (0.11 | ) | 10.26 | ||||||||||||||
| Institutional Class Shares | ||||||||||||||||||||||||
| Six Months Ended April 30, 2022* | 10.44 | – | (i) | (0.56 | ) | (0.56 | ) | (0.03 | ) | (0.37 | ) | (0.40 | ) | 9.48 | ||||||||||
| Year Ended October 31, 2021 | 10.43 | – | (i) | 0.05 | 0.05 | (0.04 | ) | – | (0.04 | ) | 10.44 | |||||||||||||
| Year Ended October 31, 2020 | 10.30 | 0.08 | 0.26 | 0.34 | (0.21 | ) | – | (0.21 | ) | 10.43 | ||||||||||||||
| Year Ended October 31, 2019 | 10.55 | 0.20 | 0.27 | 0.47 | (0.62 | ) | (0.10 | ) | (0.72 | ) | 10.30 | |||||||||||||
| Year Ended October 31, 2018 | 10.33 | 0.20 | 0.05 | 0.25 | – | (0.03 | ) | (0.03 | ) | 10.55 | ||||||||||||||
| Year Ended October 31, 2017 | 10.26 | 0.16 | 0.02 | 0.18 | – | (0.11 | ) | (0.11 | ) | 10.33 | ||||||||||||||
| * | Unaudited |
| (a) | Net investment income/(loss) is based on average shares outstanding during the period. |
| (b) | Excludes sales charge. |
| (c) | Not annualized for periods less than one year. |
| (d) | Annualized for periods less than one year. |
Amounts listed as "–" are $0 or round to $0.
See accompanying Notes to Financial Statements.
| 2022 Semi-Annual Report | 63 |
Financial Highlights (continued)
Selected Data for Each Share of Capital Outstanding Throughout the Periods Indicated
abrdn Global Absolute Return Strategies Fund (concluded)
| Ratios/Supplemental Data | |||||||||||||||||
| Total Return (b)(c) | Net Assets at End of Period (000's) | Ratio of Expenses (Net of Reimbursements/ Waivers) to Average Net Assets (d) | Ratio of Expenses (Prior to Reimbursements) to Average Net Assets (d)(e) | Ratio of Net Investment Income (Loss) to Average Net Assets (d) | Portfolio Turnover (c)(f) | ||||||||||||
| (5.85 | %) | $15,483 | 1.07 | % | 1.82 | % | (0.44 | %) | 123.11 | % | |||||||
| 0.18 | % | 22,522 | 0.96 | % | 2.93 | % | (0.31 | %) | 424.59 | % | |||||||
| 3.26 | % | 1,078 | 0.97 | %(g) | 2.52 | %(g) | 0.35 | % | 238.35 | % | |||||||
| 4.41 | % | 802 | 1.18 | %(g) | 3.04 | %(g) | 1.69 | % | 53.05 | % | |||||||
| 2.10 | % | 1,119 | 1.12 | %(g) | 2.79 | %(g) | 1.60 | % | 62.39 | % | |||||||
| 1.53 | % | 806 | 1.17 | %(g) | 2.74 | %(g) | 1.29 | % | 91.26 | % | |||||||
| (6.11 | %) | 449 | 1.65 | % | 2.52 | % | (1.01 | %) | 123.11 | % | |||||||
| (0.54 | %) | 478 | 1.65 | % | 3.73 | % | (1.07 | %) | 424.59 | % | |||||||
| 2.54 | % | 664 | 1.66 | %(g) | 3.30 | %(g) | (0.69 | %) | 238.35 | % | |||||||
| 3.68 | % | 141 | 1.86 | %(g) | 3.83 | %(g) | 1.02 | % | 53.05 | % | |||||||
| 1.45 | % | 277 | 1.85 | %(g) | 3.65 | %(g) | 0.86 | % | 62.39 | % | |||||||
| 0.75 | %(h) | 247 | 1.85 | %(g) | 3.53 | %(g) | 0.62 | % | 91.26 | % | |||||||
| (5.71 | %) | 5,648 | 0.78 | % | 1.53 | % | (0.14 | %) | 123.11 | % | |||||||
| 0.33 | %(h) | 6,929 | 0.78 | % | 2.75 | % | (0.20 | %) | 424.59 | % | |||||||
| 3.45 | %(h) | 8,148 | 0.80 | %(g) | 2.35 | %(g) | 0.62 | % | 238.35 | % | |||||||
| 4.72 | % | 8,934 | 1.00 | %(g) | 2.86 | %(g) | 1.86 | % | 53.05 | % | |||||||
| 2.29 | % | 9,768 | 0.96 | %(g) | 2.63 | %(g) | 1.75 | % | 62.39 | % | |||||||
| 1.62 | % | 10,553 | 1.02 | %(g) | 2.59 | %(g) | 1.47 | % | 91.26 | % | |||||||
| (5.64 | %)(h) | 31,121 | 0.65 | % | 1.52 | % | (0.05 | %) | 123.11 | % | |||||||
| 0.46 | % | 62,007 | 0.65 | % | 2.65 | % | (0.04 | %) | 424.59 | % | |||||||
| 3.34 | %(h) | 11,885 | 0.66 | %(g) | 2.24 | %(g) | 0.74 | % | 238.35 | % | |||||||
| 4.82 | %(h) | 2,876 | 0.86 | %(g) | 2.84 | %(g) | 1.98 | % | 53.05 | % | |||||||
| 2.47 | % | 5,521 | 0.85 | %(g) | 2.70 | %(g) | 1.94 | % | 62.39 | % | |||||||
| 1.81 | % | 1,685 | 0.85 | %(g) | 2.56 | %(g) | 1.60 | % | 91.26 | % | |||||||
| (e) | During the period, certain fees were waived and/or reimbursed. If such waivers/reimbursements had not occurred, the ratios would have been as indicated. |
| (f) | Portfolio turnover is calculated on the basis of the Fund as a whole without distinguishing among the classes of shares. |
| (g) | Interest expense is less than 0.001%. |
| (h) | The total return shown above includes the impact of financial statement rounding of the NAV per share and/or financial statement adjustments. |
| (i) | Less than $0.005 per share. |
| 64 | 2022 Semi-Annual Report |
Financial Highlights (continued)
Selected Data for Each Share of Capital Outstanding Throughout the Periods Indicated
abrdn Global High Income Fund
| Investment Activities | Distributions | |||||||||||||||||||||||
| Net Asset Value, Beginning of Period | Net Investment Income (a) | Net Realized and Unrealized Gains (Losses) on Investments | Total from Investment Activities | Net Investment Income | Tax Return of Capital | Total Distributions | Net Asset Value, End of Period | |||||||||||||||||
| Class A Shares | ||||||||||||||||||||||||
| Six Months Ended April 30, 2022* | $8.84 | $0.19 | $(0.89 | ) | $(0.70 | ) | $(0.24 | ) | $ – | $(0.24 | ) | $7.90 | ||||||||||||
| Year Ended October 31, 2021 | 8.45 | 0.39 | 0.40 | 0.79 | (0.40 | ) | – | (0.40 | ) | 8.84 | ||||||||||||||
| Year Ended October 31, 2020 | 8.71 | 0.40 | (0.28 | ) | 0.12 | (0.38 | ) | – | (0.38 | ) | 8.45 | |||||||||||||
| Year Ended October 31, 2019 | 8.74 | 0.44 | 0.19 | 0.63 | (0.58 | ) | (0.08 | ) | (0.66 | ) | 8.71 | |||||||||||||
| Year Ended October 31, 2018 | 9.23 | 0.50 | (0.56 | ) | (0.06 | ) | (0.43 | ) | – | (0.43 | ) | 8.74 | ||||||||||||
| Year Ended October 31, 2017 | 8.80 | 0.52 | 0.38 | 0.90 | (0.43 | ) | (0.04 | ) | (0.47 | ) | 9.23 | |||||||||||||
| Institutional Class Shares | ||||||||||||||||||||||||
| Six Months Ended April 30, 2022* | 8.13 | 0.18 | (0.82 | ) | (0.64 | ) | (0.25 | ) | – | (0.25 | ) | 7.24 | ||||||||||||
| Year Ended October 31, 2021 | 7.81 | 0.38 | 0.37 | 0.75 | (0.43 | ) | – | (0.43 | ) | 8.13 | ||||||||||||||
| Year Ended October 31, 2020 | 8.08 | 0.39 | (0.25 | ) | 0.14 | (0.41 | ) | – | (0.41 | ) | 7.81 | |||||||||||||
| Year Ended October 31, 2019 | 8.16 | 0.43 | 0.17 | 0.60 | (0.61 | ) | (0.07 | ) | (0.68 | ) | 8.08 | |||||||||||||
| Year Ended October 31, 2018 | 8.65 | 0.49 | (0.53 | ) | (0.04 | ) | (0.45 | ) | – | (0.45 | ) | 8.16 | ||||||||||||
| Year Ended October 31, 2017 | 8.28 | 0.51 | 0.35 | 0.86 | (0.45 | ) | (0.04 | ) | (0.49 | ) | 8.65 | |||||||||||||
| * | Unaudited |
| (a) | Net investment income/(loss) is based on average shares outstanding during the period. |
| (b) | Not annualized for periods less than one year. |
| (c) | Annualized for periods less than one year. |
Amounts listed as "–" are $0 or round to $0.
See accompanying Notes to Financial Statements.
| 2022 Semi-Annual Report | 65 |
Financial Highlights (continued)
Selected Data for Each Share of Capital Outstanding Throughout the Periods Indicated
abrdn Global High Income Fund (concluded)
| Ratios/Supplemental Data | |||||||||||||||||
| Total Return (b) | Net Assets at End of Period (000's) | Ratio of Expenses (Net of Reimbursements/ Waivers) to Average Net Assets (c)(d) | Ratio of Expenses (Prior to Reimbursements) to Average Net Assets (d)(c) | Ratio of Net Investment Income to Average Net Assets (c) | Portfolio Turnover (b)(e) | ||||||||||||
| (8.10 | %) | $ 69,415 | 1.00 | %(f) | 1.53 | %(f) | 4.49 | % | 42.19 | % | |||||||
| 9.46 | % | 81,980 | 1.00 | % | 1.40 | % | 4.41 | % | 98.16 | % | |||||||
| 1.55 | % | 87,358 | 1.00 | %(f) | 1.45 | %(f) | 4.76 | % | 99.46 | % | |||||||
| 7.65 | % | 116,126 | 1.00 | %(f) | 1.33 | %(f) | 5.14 | % | 98.17 | % | |||||||
| (0.66 | %) | 131,219 | 1.00 | %(f) | 1.22 | %(f) | 5.56 | % | 36.77 | % | |||||||
| 10.50 | % | 185,613 | 1.00 | %(f) | 1.14 | %(f) | 5.79 | % | 51.17 | % | |||||||
| (8.02 | %) | 36,915 | 0.75 | %(f) | 1.23 | %(f) | 4.71 | % | 42.19 | % | |||||||
| 9.73 | % | 55,335 | 0.75 | % | 1.09 | % | 4.65 | % | 98.16 | % | |||||||
| 1.86 | % | 58,237 | 0.75 | %(f) | 1.10 | %(f) | 5.01 | % | 99.46 | % | |||||||
| 7.91 | % | 101,888 | 0.75 | %(f) | 1.05 | %(f) | 5.39 | % | 98.17 | % | |||||||
| (0.43 | %) | 89,839 | 0.75 | %(f) | 0.95 | %(f) | 5.80 | % | 36.77 | % | |||||||
| 10.76 | % | 203,575 | 0.75 | %(f) | 0.87 | %(f) | 6.01 | % | 51.17 | % | |||||||
| (d) | During the period, certain fees were waived and/or reimbursed. If such waivers/reimbursements had not occurred, the ratios would have been as indicated. |
| (e) | Portfolio turnover is calculated on the basis of the Fund as a whole without distinguishing among the classes of shares. |
| (f) | Includes interest expense that amounts to less than 0.01%. |
| 66 | 2022 Semi-Annual Report |
Financial Highlights (continued)
Selected Data for Each Share of Capital Outstanding Throughout the Periods Indicated
abrdn Intermediate Municipal Income Fund
| Investment Activities | Distributions | |||||||||||||||||||||||
| Net Asset Value, Beginning of Period | Net Investment Income (a) | Net Realized and Unrealized Gains (Losses) on Investments | Total from Investment Activities | Net Investment Income | Net Realized Gains | Total Distributions | Net Asset Value, End of Period | |||||||||||||||||
| Class A Shares | ||||||||||||||||||||||||
| Six Months Ended April 30, 2022* | $ 9.83 | $ 0.12 | $(0.81 | ) | $(0.69 | ) | $(0.12 | ) | $ – | $(0.12 | ) | $9.02 | ||||||||||||
| Year Ended October 31, 2021 | 9.73 | 0.24 | 0.12 | 0.36 | (0.24 | ) | (0.02 | ) | (0.26 | ) | 9.83 | |||||||||||||
| Year Ended October 31, 2020 | 9.92 | 0.26 | (0.18 | ) | 0.08 | (0.26 | ) | (0.01 | ) | (0.27 | ) | 9.73 | ||||||||||||
| Year Ended October 31, 2019 | 9.54 | 0.28 | 0.38 | 0.66 | (0.28 | ) | – | (h) | (0.28 | ) | 9.92 | |||||||||||||
| Year Ended October 31, 2018 | 9.89 | 0.29 | (0.35 | ) | (0.06 | ) | (0.29 | ) | – | (0.29 | ) | 9.54 | ||||||||||||
| Year Ended October 31, 2017 | 10.11 | 0.29 | (0.22 | ) | 0.07 | (0.29 | ) | – | (0.29 | ) | 9.89 | |||||||||||||
| Class C Shares | ||||||||||||||||||||||||
| Six Months Ended April 30, 2022* | 9.81 | 0.08 | (0.81 | ) | (0.73 | ) | (0.08 | ) | – | (0.08 | ) | 9.00 | ||||||||||||
| Year Ended October 31, 2021 | 9.71 | 0.16 | 0.12 | 0.28 | (0.16 | ) | (0.02 | ) | (0.18 | ) | 9.81 | |||||||||||||
| Year Ended October 31, 2020 | 9.91 | 0.18 | (0.19 | ) | (0.01 | ) | (0.18 | ) | (0.01 | ) | (0.19 | ) | 9.71 | |||||||||||
| Year Ended October 31, 2019 | 9.52 | 0.21 | 0.39 | 0.60 | (0.21 | ) | – | (h) | (0.21 | ) | 9.91 | |||||||||||||
| Year Ended October 31, 2018 | 9.87 | 0.21 | (0.35 | ) | (0.14 | ) | (0.21 | ) | – | (0.21 | ) | 9.52 | ||||||||||||
| Year Ended October 31, 2017 | 10.09 | 0.22 | (0.22 | ) | – | (0.22 | ) | – | (0.22 | ) | 9.87 | |||||||||||||
| Institutional Service Class Shares | ||||||||||||||||||||||||
| Six Months Ended April 30, 2022* | 9.84 | 0.13 | (0.81 | ) | (0.68 | ) | (0.13 | ) | – | (0.13 | ) | 9.03 | ||||||||||||
| Year Ended October 31, 2021 | 9.74 | 0.26 | 0.12 | 0.38 | (0.26 | ) | (0.02 | ) | (0.28 | ) | 9.84 | |||||||||||||
| Year Ended October 31, 2020 | 9.93 | 0.28 | (0.18 | ) | 0.10 | (0.28 | ) | (0.01 | ) | (0.29 | ) | 9.74 | ||||||||||||
| Year Ended October 31, 2019 | 9.54 | 0.30 | 0.40 | 0.70 | (0.31 | ) | – | (h) | (0.31 | ) | 9.93 | |||||||||||||
| Year Ended October 31, 2018 | 9.89 | 0.31 | (0.35 | ) | (0.04 | ) | (0.31 | ) | – | (0.31 | ) | 9.54 | ||||||||||||
| Year Ended October 31, 2017 | 10.12 | 0.31 | (0.23 | ) | 0.08 | (0.31 | ) | – | (0.31 | ) | 9.89 | |||||||||||||
| Institutional Class Shares | ||||||||||||||||||||||||
| Six Months Ended April 30, 2022* | 9.84 | 0.13 | (0.82 | ) | (0.69 | ) | (0.13 | ) | – | (0.13 | ) | 9.02 | ||||||||||||
| Year Ended October 31, 2021 | 9.74 | 0.26 | 0.12 | 0.38 | (0.26 | ) | (0.02 | ) | (0.28 | ) | 9.84 | |||||||||||||
| Year Ended October 31, 2020 | 9.93 | 0.28 | (0.18 | ) | 0.10 | (0.28 | ) | (0.01 | ) | (0.29 | ) | 9.74 | ||||||||||||
| Year Ended October 31, 2019 | 9.55 | 0.30 | 0.39 | 0.69 | (0.31 | ) | – | (h) | (0.31 | ) | 9.93 | |||||||||||||
| Year Ended October 31, 2018 | 9.90 | 0.31 | (0.35 | ) | (0.04 | ) | (0.31 | ) | – | (0.31 | ) | 9.55 | ||||||||||||
| Year Ended October 31, 2017 | 10.12 | 0.32 | (0.23 | ) | 0.09 | (0.31 | ) | – | (0.31 | ) | 9.90 | |||||||||||||
| * | Unaudited |
| (a) | Net investment income/(loss) is based on average shares outstanding during the period. |
| (b) | Excludes sales charge. |
| (c) | Not annualized for periods less than one year. |
Amounts listed as "–" are $0 or round to $0.
See accompanying Notes to Financial Statements.
| 2022 Semi-Annual Report | 67 |
Financial Highlights (continued)
Selected Data for Each Share of Capital Outstanding Throughout the Periods Indicated
abrdn Intermediate Municipal Income Fund (concluded)
| Ratios/Supplemental Data | |||||||||||||||||
| Total Return (b)(c) | Net Assets at End of Period (000's) | Ratio of Expenses (Net of Reimbursements/ Waivers) to Average Net Assets (d) | Ratio of Expenses (Prior to Reimbursements) to Average Net Assets (e)(d) | Ratio of Net Investment Income to Average Net Assets (d) | Portfolio Turnover (c)(f) | ||||||||||||
| (7.12 | %) | $ 5,283 | 0.76 | %(g) | 1.11 | %(g) | 2.42 | % | 18.80 | % | |||||||
| 3.62 | % | 6,028 | 0.76 | % | 1.12 | % | 2.38 | % | 53.74 | % | |||||||
| 0.83 | % | 6,670 | 0.76 | %(g) | 1.09 | %(g) | 2.63 | % | 55.63 | % | |||||||
| 7.05 | % | 7,526 | 0.76 | %(g) | 1.16 | %(g) | 2.84 | % | 58.33 | % | |||||||
| (0.65 | %) | 7,141 | 0.80 | % | 1.08 | % | 2.95 | % | 14.38 | % | |||||||
| 0.72 | % | 9,084 | 0.88 | %(g) | 1.05 | %(g) | 2.92 | % | 16.25 | % | |||||||
| (7.48 | %) | 228 | 1.50 | %(g) | 1.89 | %(g) | 1.67 | % | 18.80 | % | |||||||
| 2.87 | % | 314 | 1.50 | % | 1.88 | % | 1.64 | % | 53.74 | % | |||||||
| (0.01 | %) | 270 | 1.50 | %(g) | 1.87 | %(g) | 1.89 | % | 55.63 | % | |||||||
| 6.39 | % | 252 | 1.50 | %(g) | 1.93 | %(g) | 2.12 | % | 58.33 | % | |||||||
| (1.39 | %) | 279 | 1.55 | % | 1.87 | % | 2.20 | % | 14.38 | % | |||||||
| (0.02 | %) | 542 | 1.62 | %(g) | 1.83 | %(g) | 2.21 | % | 16.25 | % | |||||||
| (6.99 | %) | 19 | 0.50 | %(g) | 0.85 | %(g) | 2.70 | % | 18.80 | % | |||||||
| 3.90 | % | 20 | 0.50 | % | 0.86 | % | 2.64 | % | 53.74 | % | |||||||
| 1.09 | % | 20 | 0.50 | %(g) | 0.83 | %(g) | 2.87 | % | 55.63 | % | |||||||
| 7.43 | % | 19 | 0.50 | %(g) | 0.90 | %(g) | 3.10 | % | 58.33 | % | |||||||
| (0.40 | %) | 18 | 0.54 | % | 0.82 | % | 3.21 | % | 14.38 | % | |||||||
| 0.79 | % | 18 | 0.69 | %(g) | 0.86 | %(g) | 3.10 | % | 16.25 | % | |||||||
| (7.10 | %) | 46,079 | 0.50 | %(g) | 0.86 | %(g) | 2.68 | % | 18.80 | % | |||||||
| 3.90 | % | 54,707 | 0.50 | % | 0.87 | % | 2.64 | % | 53.74 | % | |||||||
| 1.10 | % | 58,015 | 0.50 | %(g) | 0.84 | %(g) | 2.89 | % | 55.63 | % | |||||||
| 7.32 | % | 63,256 | 0.50 | %(g) | 0.90 | %(g) | 3.11 | % | 58.33 | % | |||||||
| (0.39 | %) | 65,428 | 0.54 | % | 0.83 | % | 3.21 | % | 14.38 | % | |||||||
| 0.98 | % | 71,362 | 0.62 | %(g) | 0.79 | %(g) | 3.18 | % | 16.25 | % | |||||||
| (d) | Annualized for periods less than one year. |
| (e) | During the period, certain fees were waived and/or reimbursed. If such waivers/reimbursements had not occurred, the ratios would have been as indicated. |
| (f) | Portfolio turnover is calculated on the basis of the Fund as a whole without distinguishing among the classes of shares. |
| (g) | Interest expense is less than 0.001%. |
| (h) | Less than $0.005 per share. |
| 68 | 2022 Semi-Annual Report |
Financial Highlights (continued)
Selected Data for Each Share of Capital Outstanding Throughout the Periods Indicated
abrdn Short Duration High Yield Municipal Fund
| Investment Activities | Distributions | ||||||||||||||||||||
| Net | |||||||||||||||||||||
| Realized | |||||||||||||||||||||
| Net | and | Net | |||||||||||||||||||
| Asset | Unrealized | Total | Tax | Asset | |||||||||||||||||
| Value, | Net | Gains | from | Net | Return | Value, | |||||||||||||||
| Beginning | Investment | (Losses) on | Investment | Investment | of | Total | Redemption | End of | |||||||||||||
| of Period | Income | Investments | Activities | Income | Capital | Distributions | Fees | Period | |||||||||||||
| Class A Shares | |||||||||||||||||||||
| Six Months Ended April 30, 2022* | $10.26 | $ 0.10(f) | $ (0.71) | $ (0.61) | $ (0.10) | $ – | $ (0.10) | $ – | $ 9.55 | ||||||||||||
| Year Ended October 31, 2021 | 9.99 | 0.22(f) | 0.27 | 0.49 | (0.22) | – | (0.22) | – | 10.26 | ||||||||||||
| Year Ended October 31, 2020 | 10.25 | 0.29(f) | (0.27) | 0.02 | (0.28) | – | (0.28) | – | 9.99 | ||||||||||||
| Year Ended October 31, 2019 | 10.07 | 0.30(f) | 0.18 | 0.48 | (0.30) | – | (0.30) | – | 10.25 | ||||||||||||
| Year Ended October 31, 2018(h) | 10.24 | 0.31(f) | (0.17) | 0.14 | (0.31) | 0.00(i) | (0.31) | 0.00(i) | 10.07 | ||||||||||||
| Year Ended October 31, 2017 | 10.34 | 0.28 | (0.10) | 0.18 | (0.28) | – | (0.28) | 0.00(i) | 10.24 | ||||||||||||
| Class C Shares | |||||||||||||||||||||
| Six Months Ended April 30, 2022* | 10.27 | 0.07(f) | (0.73) | (0.66) | (0.06) | – | (0.06) | – | 9.55 | ||||||||||||
| Year Ended October 31, 2021(j) | 10.13 | 0.12(f) | 0.14 | 0.26 | (0.12) | – | (0.12) | – | 10.27 | ||||||||||||
| Institutional Class Shares | |||||||||||||||||||||
| Six Months Ended April 30, 2022* | 10.26 | 0.11(f) | (0.71) | (0.60) | (0.11) | – | (0.11) | – | 9.55 | ||||||||||||
| Year Ended October 31, 2021 | 9.99 | 0.24(f) | 0.27 | 0.51 | (0.24) | – | (0.24) | – | 10.26 | ||||||||||||
| Year Ended October 31, 2020 | 10.25 | 0.31(f) | (0.26) | 0.05 | (0.31) | – | (0.31) | – | 9.99 | ||||||||||||
| Year Ended October 31, 2019 | 10.07 | 0.32(f) | 0.18 | 0.50 | (0.32) | – | (0.32) | – | 10.25 | ||||||||||||
| Year Ended October 31, 2018(h) | 10.24 | 0.33(f) | (0.16) | 0.17 | (0.34) | 0.00(i) | (0.34) | 0.00(i) | 10.07 | ||||||||||||
| Year Ended October 31, 2017 | 10.34 | 0.31 | (0.10) | 0.21 | (0.31) | – | (0.31) | 0.00(i) | 10.24 | ||||||||||||
| * | Unaudited |
| (a) | Excludes sales charge. |
| (b) | Not annualized for periods less than one year. |
| (c) | Annualized for periods less than one year. |
| (d) | During the period, certain fees were waived and/or reimbursed. If such waivers/reimbursements had not occurred, the ratios would have been as indicated. |
| (e) | Portfolio turnover is calculated on the basis of the Fund as a whole without distinguishing among the classes of shares. |
Amounts listed as "–" are $0 or round to $0.
See accompanying Notes to Financial Statements.
| 2022 Semi-Annual Report | 69 |
Financial Highlights (continued)
Selected Data for Each Share of Capital Outstanding Throughout the Periods Indicated
abrdn Short Duration High Yield Municipal Fund (concluded)
| Ratios/Supplemental Data | |||||||||||
| Ratio of Expenses | |||||||||||
| (Net of Reimbursements/ | Ratio of Expenses | Ratio of Net | |||||||||
| Net Assets | Waivers) | (Prior to Reimbursements) | Investment Income | ||||||||
| Total Return | at End of Period | to Average Net Assets | to Average Net Assets | to Average Net Assets | Portfolio Turnover | ||||||
| (a)(b) | (000’s) | (c) | (c)(d) | (c) | (b)(e) | ||||||
| (5.96%) | $ 17,716 | 0.90% | 1.11% | 2.04% | 37.51% | ||||||
| 4.92% | 21,907 | 0.90% | 1.14% | 2.14% | 95.56% | ||||||
| 0.25% | 22,417 | 0.90%(g) | 1.12%(g) | 2.84% | 149.01% | ||||||
| 4.78% | 27,577 | 0.90% | 1.13% | 2.96% | 104.52% | ||||||
| 1.42% | 29,433 | 0.91%(g) | 1.11%(g) | 3.03% | 86.19% | ||||||
| 1.82% | 50,906 | 0.90%(g) | 1.09%(g) | 2.78% | 151.00% | ||||||
| (6.40%) | 25 | 1.65% | 1.81% | 1.30% | 37.51% | ||||||
| 2.52% | 27 | 1.65% | 1.86% | 1.33% | 95.56% | ||||||
| (5.84%) | 339,446 | 0.65% | 0.85% | 2.29% | 37.51% | ||||||
| 5.18% | 424,689 | 0.65% | 0.88% | 2.37% | 95.56% | ||||||
| 0.51% | 270,153 | 0.65%(g) | 0.87%(g) | 3.07% | 149.01% | ||||||
| 5.05% | 229,716 | 0.65% | 0.90% | 3.19% | 104.52% | ||||||
| 1.67% | 177,810 | 0.66%(g) | 0.87%(g) | 3.27% | 86.19% | ||||||
| 2.08% | 207,427 | 0.65%(g) | 0.84%(g) | 3.04% | 151.00% |
| (f) | Net investment income/(loss) is based on average shares outstanding during the period. |
| (g) | Includes interest expense that amounts to less than 0.01% for the years ended October 31, 2020 and October 31, 2017. Includes interest expense that amounts to 0.01% for the year ended October 31, 2018. |
| (h) | Beginning with the year ended October 31, 2018, the Fund was audited by KPMG LLP. Previous years were audited by a different independent registered public accounting firm. |
| (i) | Less than $0.005 per share. |
| (j) | For the period from December 21, 2020 (commencement of operations) through October 31, 2021. |
| 70 | 2022 Semi-Annual Report |
Financial Highlights (continued)
Selected Data for Each Share of Capital Outstanding Throughout the Periods Indicated
abrdn Ultra Short Municipal Income Fund
| Investment Activities | Distributions | ||||||||||||||||||
| Net | |||||||||||||||||||
| Realized | |||||||||||||||||||
| Net | and | Net | |||||||||||||||||
| Asset | Unrealized | Total | Asset | ||||||||||||||||
| Value, | Net | Gains | from | Net | Value, | ||||||||||||||
| Beginning | Investment | (Losses) on | Investment | Investment | Total | Redemption | End of | ||||||||||||
| of Period | Income | Investments | Activities | Income | Distributions | Fees | Period | ||||||||||||
| Class A Shares | |||||||||||||||||||
| Six Months Ended April 30, 2022* | $10.09 | $ –(f) | (g) | $(0.03 | ) | $(0.03 | ) | $ –(g) | $ –(g) | $ – | $10.06 | ||||||||
| Year Ended October 31, 2021 | 10.09 | –(f) | (g) | – | (g) | – | (g) | –(g) | –(g) | – | 10.09 | ||||||||
| Year Ended October 31, 2020 | 10.10 | 0.07(f) | – | (g) | 0.07 | (0.08) | (0.08) | – | 10.09 | ||||||||||
| Year Ended October 31, 2019 | 10.09 | 0.13(f) | 0.01 | 0.14 | (0.13) | (0.13) | – | 10.10 | |||||||||||
| Year Ended October 31, 2018(i) | 10.09 | 0.11(f) | 0.00 | 0.11 | (0.11) | (0.11) | 0.00 | (g) | 10.09 | ||||||||||
| Year Ended October 31, 2017 | 10.09 | 0.06 | (0.00 | )(g) | 0.06 | (0.06) | (0.06) | 0.00 | (g) | 10.09 | |||||||||
| Class A1 Shares | |||||||||||||||||||
| Six Months Ended April 30, 2022* | 10.10 | –(f) | (g) | (0.03 | ) | (0.03 | ) | –(g) | –(g) | – | 10.07 | ||||||||
| Year Ended October 31, 2021 | 10.10 | –(f) | (g) | – | (g) | – | (g) | –(g) | –(g) | – | 10.10 | ||||||||
| Year Ended October 31, 2020 | 10.10 | 0.03(f) | 0.05 | 0.08 | (0.08) | (0.08) | – | 10.10 | |||||||||||
| Year Ended October 31, 2019(j) | 10.10 | 0.08 | – | (g) | 0.08 | (0.08) | (0.08) | – | 10.10 | ||||||||||
| Institutional Class Shares | |||||||||||||||||||
| Six Months Ended April 30, 2022* | 10.04 | 0.01(f) | (0.04 | ) | (0.03 | ) | (0.01) | (0.01) | – | 10.00 | |||||||||
| Year Ended October 31, 2021 | 10.03 | 0.01(f) | 0.01 | 0.02 | (0.01) | (0.01) | – | 10.04 | |||||||||||
| Year Ended October 31, 2020 | 10.04 | 0.10(f) | (0.01 | ) | 0.09 | (0.10) | (0.10) | – | 10.03 | ||||||||||
| Year Ended October 31, 2019 | 10.04 | 0.15(f) | – | 0.15 | (0.15) | (0.15) | – | 10.04 | |||||||||||
| Year Ended October 31, 2018(i) | 10.04 | 0.13(f) | 0.00 | 0.13 | (0.13) | (0.13) | 0.00 | (g) | 10.04 | ||||||||||
| Year Ended October 31, 2017 | 10.04 | 0.09 | (0.00 | )(g) | 0.09 | (0.09) | (0.09) | 0.00 | (g) | 10.04 | |||||||||
| * | Unaudited |
| (a) | Excludes sales charge. |
| (b) | Not annualized for periods less than one year. |
| (c) | Annualized for periods less than one year. |
| (d) | During the period, certain fees were waived and/or reimbursed. If such waivers/reimbursements had not occurred, the ratios would have been as indicated. |
| (e) | Portfolio turnover is calculated on the basis of the Fund as a whole without distinguishing among the classes of shares. |
Amounts listed as "–" are $0 or round to $0.
See accompanying Notes to Financial Statements.
| 2022 Semi-Annual Report | 71 |
Financial Highlights (concluded)
Selected Data for Each Share of Capital Outstanding Throughout the Periods Indicated
abrdn Ultra Short Municipal Income Fund (concluded)
| Ratios/Supplemental Data | |||||||||||
| Ratio of Expenses | |||||||||||
| (Net of Reimbursements/ | Ratio of Expenses | Ratio of Net | |||||||||
| Net Assets | Waivers) | (Prior to Reimbursements) | Investment Income | ||||||||
| Total Return | at End of Period | to Average Net Assets | to Average Net Assets | to Average Net Assets | Portfolio Turnover | ||||||
| (a)(b) | (000’s) | (c) | (c)(d) | (c) | (b)(e) | ||||||
| (0.27%) | $ 137,679 | 0.54% | 0.96% | 0.04% | 148.86% | ||||||
| 0.02% | 161,362 | 0.54%(h) | 0.96%(h) | 0.02% | 261.23% | ||||||
| 0.69% | 263,068 | 0.70%(h) | 0.94%(h) | 0.72% | 299.40% | ||||||
| 1.36% | 204,501 | 0.70% | 0.95% | 1.25% | 231.49% | ||||||
| 1.09% | 223,255 | 0.70% | 0.92% | 1.08% | 177.63% | ||||||
| 0.62% | 211,265 | 0.69% | 0.90% | 0.62% | 214.00% | ||||||
| (0.27%) | 509 | 0.54% | 0.90% | 0.04% | 148.86% | ||||||
| 0.02% | 510 | 0.54%(h) | 0.89%(h) | 0.02% | 261.23% | ||||||
| 0.79% | 558 | 0.70%(h) | 0.90%(h) | 0.34% | 299.40% | ||||||
| 0.81% | 35 | 0.70% | 0.94% | 1.13% | 231.49% | ||||||
| (0.33%) | 741,306 | 0.45% | 0.72% | 0.13% | 148.86% | ||||||
| 0.21% | 793,264 | 0.45%(h) | 0.71%(h) | 0.11% | 261.23% | ||||||
| 0.94% | 928,424 | 0.45%(h) | 0.71%(h) | 0.98% | 299.40% | ||||||
| 1.51% | 680,881 | 0.45% | 0.72% | 1.50% | 231.49% | ||||||
| 1.34% | 802,312 | 0.45% | 0.67% | 1.32% | 177.63% | ||||||
| 0.87% | 896,624 | 0.44% | 0.65% | 0.86% | 214.00% |
| (f) | Net investment income/(loss) is based on average shares outstanding during the period. |
| (g) | Less than $0.005 per share. |
| (h) | Includes interest expense that amounts to less than 0.01%. |
| (i) | Beginning with the year ended October 31, 2018, the Fund was audited by KPMG LLP. Previous years were audited by a different independent registered public accounting firm. |
| (j) | For the period from February 28, 2019 (commencement of operations) through October 31, 2019. |
| 72 | 2022 Semi-Annual Report |
Notes to Financial Statements
April 30, 2022 (Unaudited)
1. Organization
abrdn Funds (formerly, Aberdeen Funds) (the "Trust") was organized as a statutory trust under the laws of the state of Delaware by a Certificate of Trust filed on September 27, 2007 and is registered under the Investment Company Act of 1940, as amended (the "1940 Act"), as an open-end management investment company. As of April 30, 2022, the Trust had authorized an unlimited number of shares of beneficial interest ("shares") without par value. As of April 30, 2022, the Trust operated twenty (20) separate series, or mutual funds, each with its own investment objective(s) and strategies. This report contains the financial statements and financial highlights of the six (6) funds listed below (each a "Fund"; collectively, the "Funds"):
| – | abrdn Emerging Markets Debt Fund (formerly, Aberdeen Emerging Markets Debt Fund) ("Emerging Markets Debt Fund") | |
| – | abrdn Global Absolute Return Strategies Fund (formerly, Aberdeen Global Absolute Return Strategies Fund) ("Global Absolute Return Strategies Fund") | |
| – | abrdn Global High Income Fund (formerly, Aberdeen Global High Income Fund) ("Global High Income Fund") | |
| – | abrdn Intermediate Municipal Income Fund (formerly, Aberdeen Intermediate Municipal Income Fund) ("Intermediate Municipal Income Fund") | |
| – | abrdn Short Duration High Yield Municipal Fund (formerly, Aberdeen Short Duration High Yield Municipal Fund) ("Short Duration High Yield Municipal Fund") | |
| – | abrdn Ultra Short Municipal Income Fund (formerly, Aberdeen Ultra Short Municipal Income Fund) ("Ultra Short Municipal Income Fund") |
2. Summary of Significant Accounting Policies
The Trust is an investment company and accordingly follows the investment company accounting and reporting guidance of the Financial Accounting Standards Board ("FASB") Accounting Standard Codification Topic 946 Financial Services-Investment Companies. The following is a summary of significant accounting policies followed by the Funds in the preparation of their financial statements. The policies conform to generally accepted accounting principles in the United States of America ("GAAP"). The preparation of financial statements requires management to make estimates and assumptions that affect the reported amounts of assets and liabilities, disclosure of contingent assets and liabilities at the date of the financial statements, and the reported amounts of income and expenses for the period. Actual results could differ from those estimates. The accounting records of the Funds are maintained in U.S. Dollars.
| a. | Security Valuation |
The Funds value their securities at current market value or fair value, consistent with regulatory requirements. "Fair value" is defined in the Funds' Valuation and Liquidity Procedures as the price that could be received to sell an asset or paid to transfer a liability in an orderly transaction between willing market participants without a compulsion to transact at the measurement date.
Equity securities that are traded on an exchange are valued at the last quoted sale price on the principal exchange on which the security is traded at the "Valuation Time" subject to application, when appropriate, of the valuation factors described in the paragraph below. Under normal circumstances, the Valuation Time is as of the close of regular trading on the New York Stock Exchange (usually 4:00 p.m. Eastern Time). In the absence of a sale price, the security is valued at the mean of the bid/ask price quoted at the close on the principal exchange on which the security is traded. Securities traded on NASDAQ are valued at the NASDAQ official closing price.
In accordance with the authoritative guidance on fair value measurements and disclosures under U.S. GAAP, the Funds disclose the fair value of their investments using a three-level hierarchy that classifies the inputs to valuation techniques used to measure the fair value. The hierarchy assigns Level 1, the highest level, measurements to valuations based upon unadjusted quoted prices in active markets for identical assets, Level 2 measurements to valuations based upon other significant observable inputs, including adjusted quoted prices in active markets for similar assets, and Level 3, the lowest level, measurements to valuations based upon unobservable inputs that are significant to the valuation. Inputs refer broadly to the assumptions that market participants would use in pricing the asset or liability, including assumptions about risk, for example, the risk inherent in a particular valuation technique used to measure fair value including a pricing model and/or the risk inherent in the inputs to the valuation technique. Inputs may be observable or unobservable. Observable inputs are inputs that reflect the assumptions market participants would use in pricing the asset or liability, which are based on market data obtained from sources independent of the reporting entity. Unobservable inputs are inputs that reflect the reporting entity's own assumptions about the assumptions market participants would use in pricing the asset or liability developed based on the best information available in the circumstances. A financial instrument's level within the fair value hierarchy is based upon the lowest level of any input that is significant to the fair value measurement.
Foreign equity securities that are traded on foreign exchanges that close prior to the Valuation Time are valued by applying valuation factors to the last sale price or the mean price as noted above. Valuation factors are provided by an independent pricing service provider approved by the Board. These valuation factors are used when pricing a Fund's portfolio holdings to estimate market movements between the time foreign markets close and the time a Fund values such foreign securities. These valuation factors are based on inputs such as depositary receipts, indices, futures, sector indices/ETFs, exchange rates, and local exchange opening and closing prices of each security. When prices with the application of
| 2022 Semi-Annual Report | 73 |
Notes to Financial Statements (continued)
April 30, 2022 (Unaudited)
valuation factors are utilized, the value assigned to the foreign securities may not be the same as quoted or published prices of the securities on their primary markets. A security that applies a valuation factor is determined to be a Level 2 investment because the exchange-traded price has been adjusted. Valuation factors are not utilized if the independent pricing service provider is unable to provide a valuation factor or if the valuation factor falls below a predetermined threshold; in such case, the security is determined to be a Level 1 investment.
Long-term debt and other fixed income securities are valued at the last quoted or evaluated bid price on the valuation date provided by an independent pricing service provider approved by the Board of Trustees of the Trust (the "Board"). If there are no current day bids, the security is valued at the previously applied bid. Pricing services generally price debt securities assuming orderly transactions of an institutional "round lot" size, and the strategies employed by abrdn Inc. ("abrdn" or the "Adviser") generally trade in round lot sizes. In certain circumstances, fixed income securities may be held or transactions may be conducted in smaller, "odd lot" sizes. Odd lots may trade at lower or occasionally higher prices than institutional round lot trades. Short-term debt securities (such as commercial paper and U.S. treasury bills) having a remaining maturity of 60 days or less are valued at the last quoted or evaluated bid price on the valuation date provided by an independent pricing service, or on the basis of amortized cost if it represents the best approximation for fair value. Debt and other fixed-income securities are generally determined to be Level 2 investments.
Short-term investments are comprised of cash and cash equivalents invested in short-term investment funds which are redeemable daily. Each Fund sweeps available cash into the State Street Institutional U.S. Government Money Market Fund, which has elected to qualify as a "government money market fund" pursuant to Rule 2a-7 under the 1940 Act, and has an objective, which is not guaranteed, to maintain a $1.00 per share net asset value ("NAV"). Generally, these investment types are categorized as Level 1 investments.
Derivative instruments are generally valued according to the following procedures. Exchange traded derivatives are generally Level 1 investments and over-the-counter and centrally cleared derivatives are generally Level 2 investments. Forward currency exchange contracts are generally valued based on the current spot exchange rates and the forward exchange rate points (ex. 1-month, 3-month) that are obtained from an approved pricing agent. Based on the actual settlement dates of the forward contracts held, an interpolated value of the forward points is combined with the spot exchange rate to derive the valuation. Futures contracts are generally valued at the most recent settlement price as of NAV determination. Swap agreements are generally valued by an approved pricing agent based on the terms of the swap agreement (including future cash flows). Exchange-traded options are valued at the last quoted sales price. In the absence of a sales price, options are valued at the mean of the bid/ask price quoted at the close on the exchange on which the options trade. When market quotations or exchange rates are not readily available, or if the Adviser concludes that such market quotations do not accurately reflect fair value, the fair value of a Fund's assets are determined in good faith in accordance with the Valuation Procedures.
In the event that a security's market quotations are not readily available or are deemed unreliable (for reasons other than because the foreign exchange on which it trades closed before the Valuation Time), the security is valued at fair value as determined by the Funds' Pricing Committee (the "Pricing Committee"), taking into account the relevant factors and surrounding circumstances using Valuation and Liquidity Procedures approved by the Board. A security that has been fair valued by the Pricing Committee may be classified as Level 2 or Level 3 depending on the nature of the inputs.
The three-level hierarchy of inputs is summarized below:
| • | Level 1 – quoted prices in active markets for identical investments; | |
| • | Level 2 – other significant observable inputs (including quoted prices for similar securities, interest rates, prepayment speeds, and credit risk); or | |
| • | Level 3 – significant unobservable inputs (including a Fund's own assumptions in determining the fair value of investments). |
A summary of standard inputs is listed below:
| Security Type | Standard Inputs |
| Debt and other fixed-income securities | Reported trade data, broker-dealer price quotations, benchmark yields, issuer spreads on comparable securities, credit quality, yield, and maturity. |
| Foreign equities utilizing a fair value factor | Depositary receipts, indices, futures, sector indices/ETFs, exchange rates, and local exchange opening and closing prices of each security. |
| Forward foreign currency contracts | Forward exchange rate quotations. |
| Swap agreements | Market information pertaining to the underlying reference assets, i.e., credit spreads, credit event probabilities, fair values, forward rates, and volatility measures. |
| 74 | 2022 Semi-Annual Report |
Notes to Financial Statements (continued)
April 30, 2022 (Unaudited)
The following is a summary of the inputs used as of April 30, 2022 in valuing the Funds' investments at fair value. The inputs or methodologies used for valuing securities are not necessarily an indication of the risk associated with investing in those securities.
Please refer to the Statements of Investments for a detailed breakout of the security types:
| Investments, at Value | LEVEL 1 – Quoted Prices ($) | LEVEL 2 – Other Significant Observable Inputs ($) | LEVEL 3 – Significant Unobservable Inputs ($) | Total ($) | ||||||||||
| Emerging Markets Debt Fund | ||||||||||||||
| Investments in Securities | ||||||||||||||
| Corporate Bonds | – | 7,572,121 | – | 7,572,121 | ||||||||||
| Government Bonds | – | 21,379,990 | – | 21,379,990 | ||||||||||
| Warrants | – | – | – | – | ||||||||||
| Short-Term Investment | 1,084,466 | – | – | 1,084,466 | ||||||||||
| Other Financial Instruments | ||||||||||||||
| Assets | ||||||||||||||
| Forward Foreign Currency Exchange Contracts | – | 213,593 | – | 213,593 | ||||||||||
| Liabilities | ||||||||||||||
| Forward Foreign Currency Exchange Contracts | – | (192,037 | ) | – | (192,037 | ) | ||||||||
| 1,084,466 | 28,973,667 | – | 30,058,133 | |||||||||||
| Global Absolute Return Strategies Fund | ||||||||||||||
| Investments in Securities | ||||||||||||||
| Government Bonds | – | 9,384,714 | – | 9,384,714 | ||||||||||
| Mutual Fund | – | 2,269,468 | – | 2,269,468 | ||||||||||
| Common Stocks | 1,496,921 | 177,261 | – | 1,674,182 | ||||||||||
| Certificates of Deposit | – | 12,514,103 | – | 12,514,103 | ||||||||||
| Money Market Funds | 14,289,681 | – | – | 14,289,681 | ||||||||||
| U.S. Treasuries | – | 9,966,038 | – | 9,966,038 | ||||||||||
| Purchased Options | 257,514 | – | – | 257,514 | ||||||||||
| Other Financial Instruments | ||||||||||||||
| Assets | ||||||||||||||
| Futures Contracts | 722,899 | – | – | 722,899 | ||||||||||
| Forward Foreign Currency Exchange Contracts | – | 2,251,212 | – | 2,251,212 | ||||||||||
| Credit Default Swap Contracts | – | 107,562 | – | 107,562 | ||||||||||
| Centrally Cleared Interest Rate Swap Agreements | – | 19,861 | – | 19,861 | ||||||||||
| Total Return Swaps | – | 202,408 | – | 202,408 | ||||||||||
| Written Options | 65,159 | – | – | 65,159 | ||||||||||
| Liabilities | ||||||||||||||
| Futures Contracts | (126,860 | ) | – | – | (126,860 | ) | ||||||||
| Forward Foreign Currency Exchange Contracts | – | (1,232,840 | ) | – | (1,232,840 | ) | ||||||||
| Credit Default Swap Contracts | – | (200,957 | ) | – | (200,957 | ) | ||||||||
| Centrally Cleared Interest Rate Swap Agreements | – | (21,807 | ) | – | (21,807 | ) | ||||||||
| Total Return Swaps | – | (571,355 | ) | – | (571,355 | ) | ||||||||
| Written Options | (174,014 | ) | – | – | (174,014 | ) | ||||||||
| 16,531,300 | 34,865,668 | – | 51,396,968 | |||||||||||
| 2022 Semi-Annual Report | 75 |
Notes to Financial Statements (continued)
April 30, 2022 (Unaudited)
| Investments, at Value | LEVEL 1 – Quoted Prices ($) | LEVEL 2 – Other Significant Observable Inputs ($) | LEVEL 3 – Significant Unobservable Inputs ($) | Total ($) | ||||||||||||||
| Global High Income Fund | ||||||||||||||||||
| Investments in Securities | ||||||||||||||||||
| Corporate Bonds | – | 97,874,973 | – | 97,874,973 | ||||||||||||||
| Short-Term Investment | 5,712,568 | – | – | 5,712,568 | ||||||||||||||
| Other Financial Instruments | ||||||||||||||||||
| Assets | ||||||||||||||||||
| Forward Foreign Currency Exchange Contracts | – | 851,673 | – | 851,673 | ||||||||||||||
| Liabilities | ||||||||||||||||||
| Forward Foreign Currency Exchange Contracts | – | (51,220 | ) | – | (51,220 | ) | ||||||||||||
| 5,712,568 | 98,675,426 | – | 104,387,994 | |||||||||||||||
| Intermediate Municipal Income Fund | ||||||||||||||||||
| Investments in Securities | ||||||||||||||||||
| Municipal Bonds | – | 50,872,580 | – | 50,872,580 | ||||||||||||||
| Short-Term Investment | 137,715 | – | – | 137,715 | ||||||||||||||
| 137,715 | 50,872,580 | – | 51,010,295 | |||||||||||||||
| Short Duration High Yield Municipal Fund | ||||||||||||||||||
| Investments in Securities | ||||||||||||||||||
| Municipal Bonds | – | 354,206,101 | – | 354,206,101 | ||||||||||||||
| Short-Term Investment | 55,598 | – | – | 55,598 | ||||||||||||||
| 55,598 | 354,206,101 | – | 354,261,699 | |||||||||||||||
| Ultra Short Municipal Income Fund | ||||||||||||||||||
| Investments in Securities | ||||||||||||||||||
| Municipal Bonds | – | 912,998,684 | – | 912,998,684 | ||||||||||||||
| Short-Term Investment | – | 20,000,032 | – | 20,000,032 | ||||||||||||||
| – | 932,998,716 | – | 932,998,716 | |||||||||||||||
For the six-month period ended April 30, 2022, there were no significant changes to the fair valuation methodologies. Level 3 investments held by each of the Emerging Markets Debt Fund, Global High Income Fund and Short Duration High Yield Municipal Fund at the beginning, during and at the end of the six-month period in relation to net assets were not significant (0.00% of total net assets) and accordingly, a reconciliation of Level 3 assets for the six-month period ended April 30, 2022 is not presented.
| b. | Restricted Securities |
Restricted securities are privately-placed securities whose resale is restricted under U.S. securities laws. The Funds may invest in restricted securities, including unregistered securities eligible for resale without registration pursuant to Rule 144A and privately-placed securities of U.S. and non-U.S. issuers offered outside the U.S. without registration pursuant to Regulation S under the Securities Act of 1933, as amended. Rule 144A securities may be freely traded among certain qualified institutional investors, such as the Funds, but resale of such securities in the U.S. is permitted only in limited circumstances.
| c. | Foreign Currency Translation |
Foreign securities, currencies, and other assets and liabilities denominated in foreign currencies are translated into U.S. Dollars at the exchange rate of said currencies against the U.S. Dollar, as of the Valuation Time, as provided by an independent pricing service. Purchases and sales of securities, and income and expenses are translated at the prevailing rate of exchange on the respective date of these transactions. The Funds do not isolate that portion of the results of operations resulting from changes in foreign exchange rates on investments from
| 76 | 2022 Semi-Annual Report |
Notes to Financial Statements (continued)
April 30, 2022 (Unaudited)
fluctuations arising from changes in market prices of securities held. These fluctuations are included with the net realized and unrealized gain or loss from investments within the Statements of Operations.
| d. | Derivative Financial Instruments |
Certain Funds are authorized to use derivatives to manage currency risk, credit risk, and interest rate risk and to replicate, or use as a substitute for, physical securities. Losses may arise due to changes in the value of the contract or if the counterparty does not perform under the contract. The use of derivative instruments involves, to varying degrees, elements of market risk in excess of the amount recognized in the Statements of Assets and Liabilities. See Note 10, which discusses Rule 18f-4 and its impact on derivatives.
Forward Foreign Currency Exchange Contracts
A forward foreign currency exchange contract ("forward contract") involves an obligation to purchase and sell a specific currency at a future date, which may be any fixed number of days from the date of the contract agreed upon by the parties, at a price set at the time of the contract. Forward contracts are used to manage a Fund's currency exposure in an efficient manner. They are used to sell unwanted currency exposure that comes with holding securities in a market, or to buy currency exposure where the exposure from holding securities is insufficient to give the desired currency exposure either in absolute terms or relative to the benchmark. The use of forward contracts allows the separation of decision-making between markets and their currencies. The forward contract is marked-to market daily and the change in market value is recorded by a Fund as unrealized appreciation/(depreciation). Forward contracts' prices are received daily from an independent pricing provider. When the forward contract is closed, a Fund records a realized gain or loss equal to the difference between the value at the time it was opened and the value at the time it was closed. These realized and unrealized gains and losses are reported on the Statements of Operations. During the period, the Funds used forward contracts for the purposes of efficient portfolio management and managing active currency risk relative to the benchmark, the latter of which involves both hedging currency risk and adding currency risk in excess of underlying bond positions.
While a Fund may enter into forward contracts to seek to reduce currency exchange rate risks, transactions in such contracts involve certain risks. A Fund could be exposed to risks if the counterparties to the contracts are unable to meet the terms of their contracts and from unanticipated movements in exchange rates. Thus, while a Fund may benefit from such transactions, unanticipated changes in currency prices may result in a poorer overall performance for a Fund than if it had not engaged in any such transactions. Moreover, there may be an imperfect correlation between a Fund's portfolio holdings or securities quoted or denominated in a particular currency and forward contracts entered into by the Fund. Such imperfect correlation may prevent a Fund from achieving a complete hedge, which will expose the Fund to the risk of foreign exchange loss.
Forward contracts are subject to the risk that the counterparties to such contracts may default on their obligations. Since a forward foreign currency exchange contract is not guaranteed by an exchange or clearing house, a default on the contract would deprive a Fund of unrealized profits, transaction costs or the benefits of a currency hedge or force a Fund to cover its purchase or sale commitments, if any, at the market price at the time of the default.
Futures Contracts
Certain Funds may invest in financial futures contracts ("futures contracts") for the purpose of hedging their existing portfolio securities, or securities that a Fund intends to purchase, against fluctuations in value caused by changes in prevailing market interest rates or prices. Futures contracts may also be entered into for non-hedging purposes; however, in those instances, the aggregate initial margin and premiums required to establish a Fund's positions may not exceed 5% of a Fund's NAV after taking into account unrealized profits and unrealized losses on any such contract into which it has entered.
Upon entering into a futures contract, a Fund is required to pledge to the broker an amount of cash and/or other assets equal to a certain percentage of the contract amount. This payment is known as "initial margin". Subsequent payments, known as "variation margin," are calculated each day, depending on the daily fluctuations in the fair value/market value of the underlying assets. An unrealized gain/(loss) equal to the variation margin is recognized on a daily basis. When the contract expires or is closed, the gain/(loss) is realized and is presented in the Statements of Operations as a net realized gain/(loss) on futures contracts. Futures contracts are valued daily at their last quoted sale price on the exchange on which they are traded.
A "sale" of a futures contract means a contractual obligation to deliver the securities or foreign currency called for by the contract at a fixed price at a specified time in the future. A "purchase" of a futures contract means a contractual obligation to acquire the securities or foreign currency at a fixed price at a specified time in the future.
There are significant risks associated with a Fund's use of futures contracts, including the following: (1) the success of a hedging strategy may depend on the ability of a Fund's investment adviser and/or sub-adviser to predict movements in the prices of individual securities, fluctuations in markets and movements in interest rates; (2) there may be an imperfect or no correlation between the movement in the price of futures contracts, interest rates and the value/market value of the securities held by a Fund; (3) there may not be a liquid secondary market for a futures contract; (4) trading restrictions or limitations may be imposed by an exchange; and (5) government regulations may restrict
| 2022 Semi-Annual Report | 77 |
Notes to Financial Statements (continued)
April 30, 2022 (Unaudited)
trading in futures contracts. In addition, should market conditions change unexpectedly, a Fund may not achieve the anticipated benefits of the futures contracts and may realize a loss.
For the six-month period ended April 30, 2022, the Global Absolute Return Strategies Fund invested in futures for both investment and hedging purposes.
Options
Options are instruments that provide a right to buy (call) or sell (put) a particular security or an index of securities at a fixed price within a certain time period. Options differ from forward and futures contracts in that the buyer of the option has no obligation to perform under the contract. An option is out-of-the money if the exercise price of the option is above, in the case of a call option, or below, in the case of a put option, the current price (or interest rate or yield for certain options) of the referenced security or instrument. Use of put and call options may result in losses to a Fund, force the sale or purchase of portfolio securities at inopportune times or for prices higher than (in the case of put options) or lower than (in the case of call options) current market values, limit the amount of appreciation a Fund can realize on its investments or cause a Fund to hold a security it might otherwise sell.
For the six-month period ended April 30, 2022, the Global Absolute Return Strategies Fund invested in options for both investment and hedging purposes.
Swaps
A swap is an agreement that obligates two parties to exchange a series of cash flows and/or meet certain obligations at specified intervals based upon or calculated by reference to changes in specified prices or rates (interest rates in the case of interest rate swaps, currency exchange rates in the case of currency swaps) or the occurrence of a credit event with respect to an underlying reference obligation (in the case of a credit default swap) for a specified amount of an underlying asset or notional principal amount. A Fund will enter into swaps only on a net basis, which means that the two payment streams are netted out, with a Fund receiving or paying, as the case may be, only the amount of the difference between the two payments. Except for currency swaps and credit default swaps, the notional principal amount is used solely to calculate the payment streams but is not exchanged. With respect to currency swaps, actual principal amounts of currencies may be exchanged by the counterparties at the initiation, and again upon the termination of the transaction.
Traditionally, swaps were customized, privately negotiated agreements executed between two parties ("OTC Swaps") but since 2013, certain swaps are required to be cleared pursuant to rules and regulations related to the Dodd – Frank Wall Street Reform and Consumer Protection Act ("Dodd Frank") and/or Regulation (EU) No 648/2012 on OTC Derivatives, Central Counterparties and Trade Repositories ("EMIR") ("Cleared Swaps"). Like OTC Swaps, Cleared Swaps are negotiated bilaterally. Unlike OTC Swaps, the act of clearing results in two swaps executed between each of the parties and a central counterparty ("CCP"), and thus the counterparty credit exposure of the parties is to the CCP rather than to one another. Upon entering into a Cleared Swap, a Fund is required to pledge an amount of cash and/or other assets equal to a certain percentage of the contract amount. This payment is known as "initial margin". Subsequent payments, known as "variation margin," are calculated each day, depending on the daily fluctuations in the fair value/market value of the underlying assets. An unrealized gain/(loss) equal to the variation margin is recognized on a daily basis. When the contract matures or is terminated, the gain or loss is realized and is presented in the Statements of Operations as a net realized gain or loss on swap contracts. As of March 2017, a Fund may be required to provide variation and/or initial margin for OTC Swaps pursuant to further rules and regulations related to Dodd Frank and EMIR. The margin requirements associated with OTC Swaps and Cleared Swaps may not be the same.
Entering into swap agreements involves, to varying degrees, elements of credit, market and interest rate risk in excess of the amounts reported on the Statement of Assets and Liabilities. Such risks involve the possibility that there will be no liquid market for these agreements, that the counterparty to the agreements may default on its obligation to perform and that there may be unfavorable changes in the value of the index or securities underlying the agreement. The Funds' maximum risk of loss from counterparty risk related to swaps is the fair value of the contract. This risk is mitigated by the posting of collateral by the counterparties to the Funds to cover the Funds' exposure to the counterparty.
Credit Default Swaps
A credit default swap is an agreement whereby one party, the buyer, is obligated to pay the other party, the seller, a periodic stream of payments over the term of the contract in return for a contingent payment upon the occurrence of a credit event with respect to an underlying reference obligation. A Fund might use credit default swap contracts to limit or to reduce risk exposure of the Fund to defaults of corporate and sovereign issues (i.e., to reduce risk when the Fund owns or has exposure to such issuers). A Fund also might use credit default swap contracts to create direct or synthetic short or long exposure to domestic or foreign corporate debt securities or certain sovereign debt securities to which the Fund is not otherwise exposed.
During the six-month period ended April 30, 2022, the Global Absolute Return Strategies Fund held credit default swaps to implement investment views and hedge the Fund's exposure to the credit market.
| 78 | 2022 Semi-Annual Report |
Notes to Financial Statements (continued)
April 30, 2022 (Unaudited)
Interest Rate Swaps
A Fund uses interest rate swap contracts to manage its exposure to interest rates. Interest rate swap contracts typically represent the exchange between a Fund and a counterparty of respective commitments to make variable rate and fixed rate payments with respect to a notional amount of principal. Interest rate swap contracts may have a term that is greater than one year, but typically require periodic interim settlement in cash, at which time the specified value of the variable interest rate is reset for the next settlement period. Net payments of interest are recorded as realized gains or losses. During the period that the swap contract is open, the contract is marked-to-market as the net amount due to or from a Fund and changes in the value of swap contracts are recorded as unrealized gains or losses.
During the six-month period ended April 30, 2022, the Global Absolute Return Strategies Fund held interest rate swaps to implement investment views and hedge interest rate risk.
Summary of Derivative Instruments
Certain Funds may use derivatives for various purposes as noted above. The following is a summary of the location of fair value amounts of derivatives, not accounted for as hedging instruments, as of April 30, 2022:
| Location on the Statement of Assets and Liabilities | ||||
| Derivative Instrument Risk Type | Asset Derivatives | Liability Derivatives | ||
| Equity Risk | Investments, at value Unrealized appreciation on swap contracts | Written options, outstanding at value Unrealized depreciation on swap contracts | ||
| Interest Rate Risk | Variation margin receivable for centrally cleared swap contracts Variation margin receivable for futures contracts | Variation margin payable for centrally cleared swap contracts Variation margin payable for futures contracts | ||
| Credit Risk | Variation margin receivable for centrally cleared swap contracts | Variation margin payable for centrally cleared swap contracts | ||
| Foreign Exchange Risk | Unrealized appreciation on forward foreign currency exchange contracts | Unrealized depreciation on forward foreign currency exchange contracts | ||
The following is a summary of the fair value of derivative instruments, not accounted for as hedging instruments, as of April 30, 2022:
| Asset Derivatives | ||||||||||||||||||||||
| Funds | Total Value at April 30, 2022 | Investments at value (Equity Risk)* | Written Options, at value (Equity Risk) | Over-the Counter Total Return Swaps (Equity Risk)** | Centrally Cleared Credit Default Swaps (Credit Risk)** | Centrally Cleared Interest Rate Swaps (Interest Rate Risk)** | Forward Foreign Exchange Contracts (Foreign Exchange Risk) | Futures Contracts (Interest Rate Risk)** | ||||||||||||||
| Emerging Markets Debt Fund | $ 213,593 | $ – | $ | – | $ – | $ – | $ – | $ | 213,593 | $ – | ||||||||||||
| Global Absolute Return Strategies Fund | 3,558,456 | 257,514 | – | 202,408 | 107,562 | 19,861 | 2,251,212 | 722,899 | ||||||||||||||
| Global High Income Fund | 851,673 | – | – | – | – | – | 851,673 | – | ||||||||||||||
| 2022 Semi-Annual Report | 79 |
Notes to Financial Statements (continued)
April 30, 2022 (Unaudited)
| Liabilities Derivatives | ||||||||||||||||||||||
| Funds | Total Value at April 30, 2022 | Investments at value (Equity Risk)* | Written Options, at value (Equity Risk) | Over-the Counter Total Return Swaps (Equity Risk)** | Centrally Cleared Credit Default Swaps (Credit Risk)** | Centrally Cleared Interest Rate Swaps (Interest Rate Risk)** | Forward Foreign Exchange Contracts (Foreign Exchange Risk) | Futures Contracts (Interest Rate Risk)** | ||||||||||||||
| Emerging Markets Debt Fund | $ 192,037 | $ | – | $ – | $ – | $ – | $ – | $ | 192,037 | $ – | ||||||||||||
| Global Absolute Return Strategies Fund | 2,692,534 | – | 538,715 | 571,355 | 200,957 | 21,807 | 1,232,840 | 126,860 | ||||||||||||||
| Global High Income Fund | 51,220 | – | – | – | – | – | 51,220 | – | ||||||||||||||
* Represents purchased options, at value
** The values shown reflect unrealized appreciation/(depreciation) and the values shown in the Statement of Assets and Liabilities reflect variation margin.
Amounts listed as "–" are $0 or round to $0.
Certain funds have transactions that may be subject to enforceable master netting arrangements. A reconciliation of the gross amounts on the Statements of Assets and Liabilities as of April 30, 2022 to the net amounts by broker and derivative type, including any collateral received or pledged, is included in the following tables:
| Gross Amounts Not Offset in Statement of Assets & Liabilities | Gross Amounts Not Offset in Statement of Assets and Liabilities | |||||||||||||||||
| Gross Amounts of Assets Presented in Statement of Assets and Liabilities | Financial Instruments | Collateral Received(1) | Net Amount(3) | Gross Amounts of Liabilities Presented in Statement of Assets and Liabilities | Financial Instruments | Collateral Pledged(1) | Net Amount(3) | |||||||||||
| Description | Assets | Liabilities | ||||||||||||||||
| Emerging Markets Debt Fund | ||||||||||||||||||
| Forward foreign currency(2) | ||||||||||||||||||
| Barclays Bank plc | $ – | $ – | $ – | $ – | $ 10,093 | $ – | $ (10,093 | ) | $ – | |||||||||
| Citibank N.A. | 189,369 | – | – | 189,369 | – | – | – | – | ||||||||||
| JPMorgan Chase Bank N.A. | 190 | – | – | 190 | – | – | – | – | ||||||||||
| UBS AG | 24,034 | (24,034 | ) | – | – | 181,944 | (24,034 | ) | (120,000 | ) | 37,910 | |||||||
| Gross Amounts Not Offset in Statement of Assets & Liabilities | Gross Amounts Not Offset in Statement of Assets and Liabilities | |||||||||||||||||||
| Gross Amounts of Assets Presented in Statement of Assets and Liabilities | Financial Instruments | Collateral Received(1) | Net Amount(3) | Gross Amounts of Liabilities Presented in Statement of Assets and Liabilities | Financial Instruments | Collateral Pledged(1) | Net Amount(3) | |||||||||||||
| Description | Assets | Liabilities | ||||||||||||||||||
| Global Absolute Return Strategies Fund | ||||||||||||||||||||
| Forward foreign currency(2) | ||||||||||||||||||||
| Barclays Bank plc | $140,427 | $(140,427 | ) | $– | $ – | $205,037 | $(140,427 | ) | $– | $ 64,610 | ||||||||||
| Citibank N.A. | 412,083 | (368,268 | ) | – | 43,815 | 368,268 | (368,268 | ) | – | – | ||||||||||
| Goldman Sachs & Co. | 29,065 | (29,065 | ) | – | – | 112,547 | (29,065 | ) | – | 83,482 | ||||||||||
| HSBC Bank plc | 718,918 | (311,729 | ) | – | 407,189 | 311,729 | (311,729 | ) | – | – | ||||||||||
| JPMorgan Chase Bank N.A. | 237,385 | (167,276 | ) | – | 70,109 | 167,276 | (167,276 | ) | – | – | ||||||||||
| Royal Bank of Canada | 713,334 | (67,983 | ) | – | 645,351 | 67,983 | (67,983 | ) | – | – | ||||||||||
| 80 | 2022 Semi-Annual Report |
Notes to Financial Statements (continued)
April 30, 2022 (Unaudited)
| Gross Amounts Not Offset in Statement of Assets & Liabilities | Gross Amounts Not Offset in Statement of Assets and Liabilities | ||||||||||||||||||||||||
| Gross Amounts of Assets Presented in Statement of Assets and Liabilities | Financial Instruments | Collateral Received(1) | Net Amount(3) | Gross Amounts of Liabilities Presented in Statement of Assets and Liabilities | Financial Instruments | Collateral Pledged(1) | Net Amount(3) | ||||||||||||||||||
| Description | Assets | Liabilities | |||||||||||||||||||||||
| Global Absolute Return Strategies Fund | |||||||||||||||||||||||||
| Total return swaps(2) | |||||||||||||||||||||||||
| Barclays Bank plc | $ – | $ – | $– | $ – | $ 129,407 | $ – | $ – | $129,407 | |||||||||||||||||
| Citibank N.A. | 1,179 | (1,179 | ) | – | – | 41,574 | (1,179 | ) | – | 40,395 | |||||||||||||||
| Goldman Sachs & Co. | – | – | – | – | 248,076 | – | – | 248,076 | |||||||||||||||||
| JPMorgan Chase Bank N.A. | 201,229 | (152,298 | ) | – | 48,931 | 152,298 | (152,298 | ) | – | – | |||||||||||||||
| 1. | In some instances, the actual collateral received and/or pledged may be more than the amount shown here due to overcollateralization. |
| 2. | Includes financial instruments which are not subject to a master netting arrangement across funds, or another similar arrangement. |
| 3. | Net amounts represent the net receivables/(payable) that would be due from/to the counterparty in the event of default. Exposure from financial derivative instruments can only be netted across transactions governed under the same master netting agreement with the same legal entity. |
| Gross Amounts Not Offset in Statement of Assets & Liabilities | Gross Amounts Not Offset in Statement of Assets and Liabilities | ||||||||||||||||||||||||
| Gross Amounts of Assets Presented in Statement of Assets and Liabilities | Financial Instruments | Collateral Received(1) | Net Amount(3) | Gross Amounts of Liabilities Presented in Statement of Assets and Liabilities | Financial Instruments | Collateral Pledged(1) | Net Amount(3) | ||||||||||||||||||
| Description | Assets | Liabilities | |||||||||||||||||||||||
| Global High Income Fund | |||||||||||||||||||||||||
| Forward foreign currency(2) | |||||||||||||||||||||||||
| Citibank N.A. | $598,849 | $ – | $– | $ 598,849 | $ – | $ – | $– | $ – | |||||||||||||||||
| Deutsche Bank AG | 252,824 | (17,583 | ) | – | 235,241 | 17,583 | (17,583 | ) | – | – | |||||||||||||||
| Royal Bank of Canada | – | – | – | – | 17,674 | – | – | 17,674 | |||||||||||||||||
| UBS AG | – | – | – | – | 15,963 | – | – | 15,963 | |||||||||||||||||
| 1. | In some instances, the actual collateral received and/or pledged may be more than the amount shown here due to overcollateralization. |
| 2. | Includes financial instruments which are not subject to a master netting arrangement across funds, or another similar arrangement. |
| 3. | Net amounts represent the net receivables/(payable) that would be due from/to the counterparty in the event of default. Exposure from financial derivative instruments can only be netted across transactions governed under the same master netting agreement with the same legal entity. |
The following is a summary of the location of realized gain/(loss) and net change in unrealized appreciation/(depreciation) on derivatives in the Statement of Operations for the six-month period ended April 30, 2022:
| Derivative Instrument Risk Type | Location on the Statement of Operations | |
| Equity Risk | Realized gain/(loss) on investment transactions Realized gain/(loss) on written options Realized gain/(loss) on swap contracts | |
| Credit Risk | Realized gain/(loss) on swap contracts Net change in unrealized appreciation/(depreciation) on swap contracts | |
| Interest Rate Risk | Realized gain/(loss) on future contracts transactions Net change in unrealized appreciation/(depreciation) on futures contracts Realized gain/(loss) on swap contracts Net change in unrealized appreciation/(depreciation) on swap contracts | |
| Foreign Exchange Risk | Realized gain/(loss) on forward foreign currency exchange contracts Net change in unrealized appreciation/(depreciation) on forward foreign currency exchange contracts |
| 2022 Semi-Annual Report | 81 |
Notes to Financial Statements (continued)
April 30, 2022 (Unaudited)
The following is a summary of the effect of derivative instruments on the Statement of Operations for the six-month period ended April 30, 2022:
| Realized Gain or (Loss) on Derivatives Recognized in the Statement of Operations | |||||||||||||||||||||||||
| Funds | Total | Investments transactions (Equity Risk)* | Written Options, at value (Equity Risk) | Total Return Equity Swaps (Equity Risk) | Credit Default Swaps (Credit Risk) | Interest Rate Swaps (Interest Rate Risk) | Forward Foreign Exchange Contracts (Foreign Exchange Risk) | Futures Contracts (Interest Rate Risk) | |||||||||||||||||
| Emerging Markets Debt Fund | $ 139,152 | $ – | $ – | $ – | $ – | $ – | $ 139,152 | $ – | |||||||||||||||||
| Global Absolute Return Strategies Fund | (3,920,902 | ) | (1,271,603 | ) | 797,127 | (962,804 | ) | (433,277 | ) | (2,160,909 | ) | (131,342 | ) | 241,906 | |||||||||||
| Global High Income Fund | 1,174,036 | – | – | – | – | – | 1,174,036 | – | |||||||||||||||||
| Change in Unrealized Appreciation/(Depreciation) on Derivatives Recognized in the Statement of Operations | |||||||||||||||||||||||||
| Funds | Total | Investments transactions (Equity Risk)* | Written Options, at value (Equity Risk) | Total Return Equity Swaps (Equity Risk) | Credit Default Swaps (Credit Risk) | Interest Rate Swaps (Interest Rate Risk) | Forward Foreign Exchange Contracts (Foreign Exchange Risk) | Futures Contracts (Interest Rate Risk) | |||||||||||||||||
| Emerging Markets Debt Fund | $ (90,155 | ) | $ – | $ – | $ – | $ – | $ – | $(90,155 | ) | $ – | |||||||||||||||
| Global Absolute Return Strategies Fund | 1,648,501 | 76,069 | (149,142 | ) | (337,285 | ) | (229,257 | ) | 1,412,506 | 882,981 | (7,371) | ||||||||||||||
| Global High Income Fund | 881,264 | – | – | – | – | – | 881,264 | – | |||||||||||||||||
* Represents realized gain and change in unrealized appreciation for purchased options during the period.
Amounts listed as "–" are 0% or round to 0%.
Information about derivatives reflected as of the date of this report is generally indicative of the type of, activity for the six-month period ended April 30, 2022. The table below summarizes the weighted average values of derivatives holdings by the Funds during the six-month period ended April 30, 2022.
| Fund | Purchase Forward Foreign Currency Contracts (Average Notional Value) | Sale Forward Foreign Currency Contracts (Average Notional Value) | Forward Foreign Cross Currency Contracts (Average Notional Value) | Long Future Contracts (Average Notional Value) | Short Future Contracts (Average Notional Value) | Buy Protection Credit Default Swap (Average Notional Value) | |||||||||||||||||||
| Emerging Markets Debt Fund | $ 2,349,980 | $ | 8,285,205 | $ – | $ – | $ – | $ – | ||||||||||||||||||
| Global Absolute Return Strategies Fund | 51,790,907 | 76,642,060 | 14,765,434 | 12,903,255 | 12,336,660 | 45,445,131 | |||||||||||||||||||
| Global High Income Fund | 2,449,555 | 25,177,578 | – | – | – | – | |||||||||||||||||||
| Fund | Sell Protection Credit Default Swap (Average Notional Value) | Interest Rate Swap Contracts (Average Notional Value) | Total Return Equity Swaps (Average Notional Value) | Call Purchased Options (Average Notional Value) | Put Purchased Options (Average Notional Value) | Call Written Options (Average Notional Value) | |||||||||||||||||||
| Emerging Markets Debt Fund | $ – | $ | – | $ – | $ – | $ – | $– | ||||||||||||||||||
| Global Absolute Return Strategies Fund | 44,516,275 | 83,906,527 | 13,296,268 | 202,574 | 73,301 | – | |||||||||||||||||||
| Global High Income Fund | – | – | – | – | – | – |
| 82 | 2022 Semi-Annual Report |
Notes to Financial Statements (continued)
April 30, 2022 (Unaudited)
| Fund | Put Written Options (Average Notional Value) | Call Purchased Swaptions (Average Notional Value) | Put Purchased Swaptions (Average Notional Value) | Call Written Swaptions (Average Notional Value) | Put Written Swaptions (Average Notional Value) | |||||||||||||||
| Emerging Markets Debt Fund | $ | – | $– | $– | $ | – | $ | – | ||||||||||||
| Global Absolute Return Strategies Fund | 261,233 | – | – | 92,784 | 114,413 | |||||||||||||||
| Global High Income Fund | – | – | – | – | – | |||||||||||||||
| e. | Security Transactions, Investment Income and Expenses |
Security transactions are recorded on the trade date. Realized and unrealized gains/(losses) from security and currency transactions are calculated on the identified cost basis. Dividend income and corporate actions are recorded generally on the ex-date, except for certain dividends and corporate actions which may be recorded after the ex-date, as soon as a Fund acquires information regarding such dividends or corporate actions.
Interest income and expenses are recorded on an accrual basis. Expenses directly attributable to a Fund are charged to that Fund. Expenses not directly attributable to a Fund are allocated proportionately among the relevant Funds based on net assets of each Fund as of the month end. For each of the Funds, the method for allocating income, fund level expenses, and realized and unrealized gains or losses to a class is based on the total net asset value of that class's shares in proportion to the total net assets of the relevant Fund. Expenses specific to a class (such as Rule 12b-1 and administrative services fees) are charged to that class.
| f. | Distributions |
Distributions from net investment income, if any, are declared and paid quarterly for the Emerging Markets Debt Fund. Distributions from net investment income, if any, are declared daily and paid monthly for the Short Duration High Yield Municipal Fund, the Intermediate Municipal Income Fund and the Ultra Short Municipal Income Fund. Distributions from net investment income, if any, are declared and paid quarterly for the Global High Income Fund and annually for the Global Absolute Return Strategies Fund. The Funds will also declare and pay distributions at least annually from net realized gains on investment transactions and net realized foreign exchange gains, if any. Dividends and distributions to shareholders are recorded on the ex-dividend date.
Dividends and distributions to shareholders are determined in accordance with federal income tax regulations, which may differ from GAAP. These differences are primarily due to differing treatments for foreign currencies and loss deferrals.
| g. | Federal Income Taxes |
Each Fund intends to continue to qualify as a "regulated investment company" by complying with the provisions available to certain investment companies, as defined in Subchapter M of the Internal Revenue Code of 1986, as amended, and to make distributions of net investment income and net realized capital gains sufficient to relieve the Funds from all federal income taxes. Therefore, no federal income tax provision is required. Management of the Funds has concluded that there are no significant uncertain tax positions that would require recognition in the financial statements.
Since tax authorities can examine previously filed tax returns, the Funds' U.S. federal and state tax returns for each of the most recent four fiscal years up to the most recent fiscal year ended October 31, 2021 are subject to such review.
| h. | Foreign Withholding Tax |
Interest income from non-U.S. sources received by the Funds are generally subject to non-U.S. withholding taxes and are recorded on the Statement of Operations. The Funds file for tax reclaims for the refund of such withholdings taxes according to tax treaties. Tax reclaims that are deemed collectible are booked as tax reclaim receivable on the Statement of Assets and Liabilities. Foreign tax authorities can examine previously filed withholding tax reclaims for various periods of time, depending on the statute of limitations in each foreign jurisdiction. In some cases, amounts that have been refunded by foreign tax authorities and received by the Funds are still subject to such review.
In addition, the Funds may be subject to capital gains tax in certain countries in which it invests. The above taxes may be reduced or eliminated under the terms of applicable U.S. income tax treaties with some of these countries. The Funds accrue such taxes when the related income is earned.
In addition, when the Funds sell securities within certain countries in which it invests, the capital gains realized may be subject to tax. Based on these market requirements and as required under GAAP, the Funds accrue deferred capital gains tax on securities currently held that have unrealized appreciation within these countries. The amount of deferred capital gains tax accrued is reported on the Statement of Operations as part of the Net Change in Unrealized Appreciation/Depreciation on Investments.
| 2022 Semi-Annual Report | 83 |
Notes to Financial Statements (continued)
April 30, 2022 (Unaudited)
| i. | Securities Lending |
Through an agreement with Securities Finance Trust Company as the Lending Agent and State Street Bank and Trust Company (the Funds' custodian), the Funds may lend their portfolio securities to brokers, dealers and other financial institutions that pay a negotiated fee in order to generate additional income. The Funds receive non-cash collateral in the form of U.S. Government Securities, with respect to each loan of U.S. securities, typically equal to at least 102% of the value of the portfolio securities loaned, and, with respect to each loan of non-U.S. securities, typically equal to at least 105% of the value of the portfolio securities loaned, and at all times thereafter require the borrower to mark to market such collateral on a daily basis so that the market value of such collateral does not fall below 100% of the market value of the portfolio securities so loaned.
Income generated from securities lending includes the difference between (i) the sum of income received from the investment of collateral received from the borrowers that are counterparties to loans, loan fees received from loans, and fees paid by borrower on loans collateralized with collateral other than cash collateral; and ii) any rebate paid to a borrower, and any other allocable fees and expenses in connection with loans of securities. All income is accrued daily and is apportioned 90% to the Funds and 10% to the Lending Agent.
The Funds continue to own the loaned securities and continue to recognize unrealized gains and losses on the securities on loan. However, securities lending involves certain risks, including the event of default or insolvency of the borrower, which could delay or restrict a Fund's ability to recover the loaned securities or dispose of the collateral for the loan. Securities on loan are noted within the Statement of Investments. Non-cash securities lending collateral held by the Lending Agent on behalf of the Funds cannot be sold or repledged by the Funds and therefore, this amount is not presented on the Funds' Statements of Investments.
At April 30, 2022, the Funds did not have any securities on loan.
3. Agreements and Transactions with Affiliates
| a. | Investment Adviser |
Under the Investment Advisory Agreement with the Trust, the Adviser manages the Funds in accordance with the policies and procedures established by the Board.
For services provided under the terms of the current Investment Advisory Agreement, each Fund pays the Adviser an annual management fee (as a percentage of its average daily net assets) paid monthly according to the following schedule:
| Fund | Fee Schedule | |||
| Emerging Markets Debt Fund | Up to $500 million | 0.600 | % | |
| On $500 million and more | 0.550 | % | ||
| Global Absolute Return Strategies Fund | Up to $500 million | 0.600 | % | |
| $500 million up to $1 billion | 0.550 | % | ||
| On $1 billion and more | 0.500 | % | ||
| Global High Income Fund | Of the first $5 billion | 0.650 | % | |
| On the next $2.5 billion | 0.630 | % | ||
| On the next $2.5 billion | 0.600 | % | ||
| Over $10 billion | 0.590 | % | ||
| Intermediate Municipal Income Fund | Up to $250 million | 0.425 | % | |
| $250 million up to $1 billion | 0.375 | % | ||
| On $1 billion and more | 0.355 | % | ||
| Short Duration High Yield Municipal Fund | Up to $250 million | 0.650 | % | |
| On $250 million and more | 0.600 | % | ||
| Ultra Short Municipal Income Fund | Up to $2.5 billion | 0.500 | % | |
| On $2.5 billion and more | 0.450 | % |
The Adviser has engaged the services of affiliate abrdn Asset Managers Limited (on behalf of Emerging Markets Debt Fund and Global Absolute Return Strategies Fund) as subadviser (the "Subadviser") pursuant to subadvisory agreements. The Subadviser manages a portion of the applicable Fund's investments and have the responsibility for making all investment decisions for the portion of such Fund's assets they manage. Pursuant to the subadvisory agreement, the Adviser pays fees to the Subadviser, if any.
The Trust and abrdn have entered into written contracts ("Expense Limitation Agreements") limiting operating expenses for all classes of the Funds from exceeding the amounts listed in the tables below. For each Fund this contractual limitation may not be terminated before February 28, 2023 without the approval of the Trustees who are not "interested persons" of the Trust, as such term is defined by the 1940 Act (the "Independent Trustees"). For each Fund except the Global High Income Fund, Short Duration High Yield Municipal Fund and Ultra Short Municipal Income Fund, this limit excludes certain expenses, including any taxes, interest, brokerage fees, short-sale dividend expenses, acquired fund fees and expenses, Rule 12b-1 fees, administrative services fees, transfer agent out-of-pocket expenses for Class A shares,
| 84 | 2022 Semi-Annual Report |
Notes to Financial Statements (continued)
April 30, 2022 (Unaudited)
Class R shares and Institutional Service Class shares and extraordinary expenses. The Expense Limitation Agreement with respect to the Global High Income Fund excludes certain expenses, including any taxes, interest, brokerage fees, short-sale dividend expenses, acquired fund fees and expenses and Rule 12b-1 fees for Class A shares and extraordinary expenses. The Expense Limitation Agreements with respect to the Short Duration High Yield Municipal Fund and Ultra Short Municipal Income Fund exclude certain expenses, including any interest, brokerage commissions, acquired fund fees and expenses, and extraordinary expenses.
| Fund | Limit | |||
| Emerging Markets Debt Fund | 0.65% | |||
| Global Absolute Return Strategies Fund | 0.65% | |||
| Intermediate Municipal Income Fund | 0.50% | |||
| Fund | Class A Limit | Class A1 Limit | Class C Limit | Institutional Class Limit | ||||||||||||
| Global High Income Fund | 1.00% | – | – | 0.75% | ||||||||||||
| Short Duration High Yield Municipal Fund | 0.90% | – | 1.65% | 0.65% | ||||||||||||
| Ultra Short Municipal Income Fund | 0.70% | 0.70% | – | 0.45% | ||||||||||||
abrdn may request and receive reimbursement from a Fund of the advisory fees waived and other expenses reimbursed pursuant to the Expense Limitation Agreement as of a date not more than three years after the date when the Adviser limited the fees or reimbursed the expenses; provided that the following requirements are met: the reimbursements do not cause a class to exceed the lesser of the applicable expense limitation in the contract at the time the fees were limited or expenses are paid or the applicable expense limitation in effect at the time the expenses are being recouped by the Adviser, and the payment of such reimbursement is approved by the Board on a quarterly basis (the "Reimbursement Requirements"). Except as provided for in the Expense Limitation Agreement, reimbursement of amounts previously waived or assumed by abrdn is not permitted.
As of April 30, 2022, to the extent the Reimbursement Requirements are met, the cumulative potential reimbursements for each Fund, based on expenses reimbursed by abrdn would be:
| Fund | Amount Fiscal Year 2019 (Expires 10/31/22) | Amount Fiscal Year 2020 (Expires 10/31/23) | Amount Fiscal Year 2021 (Expires 10/31/24) | Amount Six Months Ended April 30, 2022 (Expires 4/30/25) | Total* | |||||||||||||||
| Emerging Markets Debt Fund | $ | 110,409 | $ | 229,330 | $ | 233,540 | $ | 103,063 | $ | 676,342 | ||||||||||
| Global Absolute Return Strategies Fund | 130,436 | 347,710 | 540,814 | 278,704 | 1,297,664 | |||||||||||||||
| Global High Income Fund | 351,006 | 698,958 | 562,810 | 316,146 | 1,928,920 | |||||||||||||||
| Intermediate Municipal Income Fund | 156,436 | 233,940 | 233,143 | 103,760 | 727,279 | |||||||||||||||
| Short Duration High Yield Municipal Fund | 302,652 | 582,868 | 812,551 | 419,911 | 2,117,982 | |||||||||||||||
| Ultra Short Municipal Income Fund | 1,183,020 | 2,517,221 | 2,920,672 | 1,155,056 | 7,775,969 | |||||||||||||||
* Amounts reported are due to expire throughout the respective 3-year expiration period presented above.
In accordance with the Funds' Expense Limitation Agreements and criteria, as described above, the Adviser did not recapture any expenses for which it previously reimbursed the Funds. Accordingly, at April 30, 2022, the Funds did not have liabilities payable to the Adviser for recapture of previously reimbursed expenses.
In addition, the Trust and abrdn have entered into a Voluntary Expense Limitation and Reimbursement Agreement ("Voluntary Expense Limitation") pursuant to which abrdn has agreed to pay, waive or absorb the ordinary operating expenses of any class of the Ultra Short Municipal Income Fund (including 12b-1 fees, administrative services fees and other class-specific expenses, but excluding advisory fees, custody fees, interest, brokerage commissions, acquired fund fees and expenses, extraordinary expenses and all other fund-level expenses), on each day for which a distribution is to be declared to the extent possible and necessary to ensure that the amount declared and ultimately distributed is not less than an annualized rate of 2 basis points, calculated on a daily basis for that class on that day. This Voluntary Expense Limitation may be terminated at any time upon notice by abrdn. The Voluntary Expense Limitation is not subject to recoupment and the Ultra Short Municipal Income Fund shall not reimburse any fees waived under the Voluntary Expense Limitation.
| 2022 Semi-Annual Report | 85 |
Notes to Financial Statements (continued)
April 30, 2022 (Unaudited)
| b. | Fund Administration |
Under the terms of the Fund Administration Agreement, abrdn provides various administrative and accounting services, including daily valuation of the Funds' shares, preparation of financial statements, tax returns, regulatory reports, and presentation of quarterly reports to the Board. For services provided pursuant to the Fund Administration Agreement, the Trust pays abrdn an annual fee of 0.08% based on the Trust's average daily net assets. The fee is then allocated proportionately among all funds within the Trust (including the Funds) in relation to the average daily net assets of each fund. This asset-based fee is subject to an annual minimum fee based on the number of funds served. Pursuant to a sub-administration agreement with abrdn, State Street Bank and Trust Company ("State Street") provides sub-administration services with respect to the Funds. abrdn pays State Street for providing such services.
| c. | Distributor and Shareholder Servicing |
The Trust and Aberdeen Fund Distributors, LLC (the "Distributor") are parties to the current Underwriting Agreement (the "Underwriting Agreement") whereby the Distributor acts as principal underwriter for the Trust's shares.
The Trust has adopted a Distribution Plan (the "Plan") pursuant to Rule 12b-1 under the 1940 Act with respect to certain classes of shares. The Plan permits the Funds to compensate the Distributor, for expenses associated with the distribution-related and/or shareholder services provided by such entities. These fees are paid to the Distributor and are either kept or paid to shareholders' financial advisors or other intermediaries for distribution and shareholder services. Although actual distribution expenses may be more or less, under the Plan, the Funds pay the Distributor an annual fee of the following amounts, based on the total net assets of each, respective class:
| Fund | Class A Shares | Class A1 Shares | Class C Shares (a) | Class R Shares (a) | ||||||||||||
| Emerging Markets Debt Fund | 0.25% | – | 1.00% | 0.50% | ||||||||||||
| Global Absolute Return Strategies Fund | 0.25% | – | 1.00% | – | ||||||||||||
| Global High Income Fund | 0.25% | – | – | – | ||||||||||||
| Intermediate Municipal Income Fund | 0.25% | – | 1.00% | – | ||||||||||||
| Short Duration High Yield Municipal Fund | 0.25% | – | 1.00% | – | ||||||||||||
| Ultra Short Municipal Income Fund | 0.25% | 0.25% | – | – | ||||||||||||
(a) 0.25% of which is service fees.
The Adviser or an affiliate of the Adviser may pay additional amounts from its own resources to dealers or other financial intermediaries, for aid in distribution or for aid in providing administrative services to shareholders.
Pursuant to the current Underwriting Agreement, the Distributor will also receive the proceeds of contingent deferred sales charges ("CDSCs") of 1.00% imposed on certain redemptions of Class C (and up to 1.00% for certain Class A) shares.
The Distributor re-allows to dealer 2.50% of sales charges on Class A shares of the Emerging Markets Debt Fund and Global Absolute Return Strategies Fund; 3.00% of sales charges on Class A shares of the Global High Income Fund; 2.00% of sales charges on Class A shares of the Intermediate Municipal Income Fund and Short Duration High Yield Municipal Fund; and 0.50% of sales charges on Class A1 of the Ultra Short Municipal Income Fund. In addition, the Distributor or Adviser may compensate broker dealers or financial intermediaries for sales of Class C shares from its own resources at the rate of 1.00% on sales of Class C shares, which have a maximum CDSC of 1.00% (the CDSC assessed on sales within one year of purchase). The amount the Distributor retained for commissions from front-end sales charges and CDSC fees for the six-month period ended April 30, 2022 was as follows:
| Fund | Commissions Retained from Front-End Sales Charges of Class A and Class A1 Shares | Commissions Retained from CDSC Fees of Class C (Certain Class A and Class A1) Shares | ||||
| Emerging Markets Debt Fund | $ – | $ – | ||||
| Global Absolute Return Strategies Fund | 92 | – | ||||
| Global High Income Fund | 21,872 | – | ||||
| Intermediate Municipal Income Fund | 17 | 261 | ||||
| Short Duration High Yield Municipal Fund | – | 10,601 | ||||
| Ultra Short Municipal Income Fund | – | – | ||||
| Total Retained | $21,981 | $10,862 |
| 86 | 2022 Semi-Annual Report |
Notes to Financial Statements (continued)
April 30, 2022 (Unaudited)
| d. | Administrative Services Fees/Transfer Agent Out-of-Pocket Expenses |
The Funds may pay and/or reimburse administrative services fees/sub-transfer agent expenses to certain broker-dealers and financial intermediaries who provide administrative support services to beneficial shareholders on behalf of the Funds (sometimes referred to as "sub-transfer agency fees"), subject to certain limitations approved by the Board. These fees may be in addition to Rule 12b-1 fees. Sub-transfer agency fees generally include, but are not limited to, costs associated with recordkeeping, networking, sub-transfer agency or other administrative or shareholder services.
Class A, Class A1, Class R and Institutional Service Class shares of the Funds pay for such services pursuant to an Administrative Services Plan adopted by the Board. Under the Administrative Services Plan, a Fund may pay a broker-dealer or other intermediary a maximum annual sub-transfer agent and administrative services fee of 0.25% for Class A, Class A1, Class R and Institutional Service Class shares. Under an amendment to the Administrative Services Plan that is in effect until at least February 28, 2023, the administrative service fee is limited to a maximum of 0.15% for contracts with fees that are calculated as a percentage of Fund assets and a maximum of $16 per account for contracts with fees that are calculated on a dollar per account basis; however, many intermediaries do not charge the maximum permitted fee or even a portion thereof. Class C and Institutional Class shares may also pay for the services described above directly and not pursuant to an Administrative Services Plan.
The aggregate amount of sub-transfer agent and administrative service fees paid during the six-month period ended April 30, 2022 was as follows:
| Fund | Class A | Class A1 | Class C | Class R | Institutional Service | Institutional | ||||||||||||||||||
| Emerging Markets Debt Fund | $ 89 | $ – | $ | 29 | $2,668 | $ 43 | $ 2,983 | |||||||||||||||||
| Global Absolute Return Strategies Fund | 14,924 | – | 292 | – | 4,155 | 27,183 | ||||||||||||||||||
| Global High Income Fund | 47,998 | – | – | – | – | 16,909 | ||||||||||||||||||
| Intermediate Municipal Income Fund | 323 | – | 61 | – | 2,595 | 1,156 | ||||||||||||||||||
| Short Duration High Yield Municipal fund | 6,564 | – | 2 | – | – | 105,519 | ||||||||||||||||||
| Ultra Short Municipal Income Fund | 52,807 | 11 | – | – | – | 270,768 | ||||||||||||||||||
Amounts listed as "–" are $0 or round to $0.
| e. | Purchase/Sale Transactions Between Affiliates |
The Funds are permitted to buy or sell securities with funds that have a common investment adviser (or investment advisers which are affiliates) under specific procedures which have been approved by the Board. The procedures are designed to satisfy the requirements of Rule 17a-7 of the Investment Company Act of 1940 ("Rule 17a-7"). During the six-month period ended April 30, 2022, the Funds did not engage in any of these trades.
4. Investment Transactions
Purchases and sales of securities (excluding short-term securities) for the six-month period ended April 30, 2022, were as follows:
| Fund | Purchases | Sales | ||||||
| Emerging Markets Debt Fund | $ | 7,433,089 | $ | 11,413,340 | ||||
| Global Absolute Return Strategies Fund | 7,063,878 | 7,165,864 | ||||||
| Global High Income Fund | 50,034,958 | 69,626,530 | ||||||
| Intermediate Municipal Income Fund | 10,787,441 | 14,293,851 | ||||||
| Short Duration High Yield Municipal Fund | 155,036,541 | 220,239,255 | ||||||
| Ultra Short Municipal Income Fund | 1,174,000,734 | 1,166,269,513 | ||||||
5. Portfolio Investment Risks
| a. | Absolute Return Strategy Risk |
The Global Absolute Return Strategies Fund is subject to risks related to its absolute return strategy. Absolute return funds employ certain techniques that are intended to reduce risk and volatility in the portfolio and provide protection against a decline in the fund's assets. They are not designed to outperform stocks and bonds in strong markets and there is no guarantee of positive returns or that the Fund's objective will be achieved.
| 2022 Semi-Annual Report | 87 |
Notes to Financial Statements (continued)
April 30, 2022 (Unaudited)
| b. | Asset-Backed Securities Risk |
The Global High Income Fund may buy or sell asset-backed securities. Like traditional fixed income securities, the value of asset-backed securities typically increases when interest rates fall and decreases when interest rates rise. Certain asset-backed securities may also be subject to the risk of prepayment.
| c. | Bank Loan Risk |
The Global High Income Fund may buy or sell bank loans. There are a number of risks associated with an investment in bank loans including credit risk, interest rate risk, illiquid securities risk, and prepayment risk. There is also the possibility that the collateral securing a loan, if any, may be difficult to liquidate or be insufficient to cover the amount owed under the loan. Bank loans have significantly longer settlement periods (e.g., longer than seven days) than more traditional investments resulting in the proceeds from the sale of such loans not being readily available to make additional investments or to meet a Fund's redemption obligations. In addition, loans are not registered under the federal securities laws like stocks and bonds, so investors in loans have less protection against improper practices than investors in registered securities. These risks could cause the Fund to lose income or principal on a particular investment, which in turn could affect the Fund's returns.
| d. | Credit Default Swap Risk |
The Global Absolute Return Strategies Fund and Global High Income Fund may buy or sell credit default swaps. Credit default swap contracts, a type of derivative instrument, particularly selling credit default swaps, involve special risks and may result in losses to the Funds.
| e. | Cybersecurity Risk |
Cybersecurity incidents may allow an unauthorized party to gain access to Fund assets, customer data (including private shareholder information), or proprietary information, or cause each Fund, the Adviser and/or their service providers (including, but not limited to, Fund accountants, custodians, sub-custodians, transfer agents and financial intermediaries) to suffer data breaches, data corruption or lose operational functionality.
| f. | Derivatives Risk (including Options, Futures and Swaps) |
Certain Funds are subject to Derivatives Risk. Derivatives are speculative and may hurt the Fund's performance. The potential benefits to be derived from the Fund's options, futures and derivatives strategy are dependent upon the portfolio managers' ability to discern pricing inefficiencies and predict trends in these markets, which decisions could prove to be inaccurate.
Speculative Exposure Risk. To the extent that a derivative or practice is not used as a hedge, the Fund is directly exposed to its risks. Gains or losses from speculative positions in a derivative may be much greater than the derivative's original cost. For example, potential losses from writing uncovered call options and from speculative short sales are unlimited.
Hedged Exposure Risk. Losses generated by a derivative or practice used by the Fund for hedging purposes should be substantially offset by gains on the hedged investment. However, while hedging can reduce or eliminate losses, it can also reduce or eliminate gains.
Correlation Risk. The Fund is exposed to the risk that changes in the value of a hedging instrument will not match those of the investment being hedged.
Counterparty Risk. Derivative transactions depend on the creditworthiness of the counterparty and the counterparty's ability to fulfill its contractual obligations.
Other Derivatives Risks. Fixed income derivatives are subject to interest rate risk. In addition, certain derivatives may be subject to illiquid securities risk, mispricing or valuation complexity, market risk and management risk. The Fund may need to sell portfolio securities at inopportune times to satisfy margin or payment obligations under derivatives investments. Changes in regulation relating to the Fund's use of derivatives and related instruments could potentially limit or impact the Fund's ability to invest in derivatives, limit the Fund's ability to employ certain strategies that use derivatives and/or adversely affect the value of derivatives and the Fund's performance.
| g. | Emerging Markets Risk |
The risks of investing in emerging market countries are a magnification of the risks that apply to foreign investments. These risks are greater for securities of companies in emerging markets countries because the countries may have less stable governments, more volatile currencies and less established markets (see "Foreign Securities Risk" below).
| h. | Equity Securities Risk |
The Global Absolute Return Strategies Fund and Global High Income Fund may invest in equity securities. The stock or other security of a company may not perform as well as expected, and may decrease in value, because of factors related to the company (such as poorer than
| 88 | 2022 Semi-Annual Report |
Notes to Financial Statements (continued)
April 30, 2022 (Unaudited)
expected earnings or certain management decisions), to the industry in which the company is engaged (such as a reduction in the demand for products or services in a particular industry), or to the market as a whole (such as periods of market volatility or instability, or general and prolonged periods of economic decline).
| i. | Fixed Income Securities Risk |
Fixed income securities are subject to, among other risks, credit risk, extension risk, issuer risk, interest rate risk, market risk and prepayment risk.
| j. | Foreign Currency Exposure Risk |
The value of foreign currencies relative to the U.S. Dollar fluctuates in response to market, economic, political, regulatory, geopolitical or other conditions. A decline in the value of a foreign currency versus the U.S. Dollar reduces the value in U.S. Dollars of investments denominated in that foreign currency. This risk may impact a Fund more greatly to the extent the Fund does not hedge its currency risk, or hedging techniques used by the Adviser are unsuccessful.
| k. | Foreign Securities Risk |
Foreign countries in which a Fund may invest may have markets that are less liquid, less regulated and more volatile than U.S. markets. The value of a Fund's investments may decline because of factors such as unfavorable or unsuccessful government actions, reduction of government or central bank support and political or financial instability. To the extent the Fund focuses its investments in a single country or only a few countries in a particular geographic region, economic, political, regulatory or other conditions affecting such country or region may have a greater impact on Fund performance relative to a more geographically diversified fund.
Russia/Ukraine Risk. In February 2022, Russia commenced a military attack on Ukraine. The outbreak of hostilities between the two countries and the threat of wider spread hostilities could have a severe adverse effect on the region and global economies, including significant negative impacts on the markets for certain securities and commodities, such as oil and natural gas. In addition, sanctions imposed on Russia by the United States and other countries, and any sanctions imposed in the future, could have a significant adverse impact on the Russian economy and related markets. The price and liquidity of investments may fluctuate widely as a result of the conflict and related events. How long the armed conflict and related events will last cannot be predicted. These tensions and any related events could have a significant impact on Fund performance and the value of Fund investments.
| l. | High-Yield Bonds and Other Lower-Rated Securities Risk |
A Fund's investments in high-yield bonds (commonly referred to as "junk bonds") and other lower-rated securities will subject the Fund to substantial risk of loss. Investments in high-yield bonds are speculative and issuers of these securities are generally considered to be less financially secure and less able to repay interest and principal than issuers of investment-grade securities. Prices of high-yield bonds tend to be very volatile. These securities are less liquid than investment-grade debt securities and may be difficult to price or sell, particularly in times of negative sentiment toward high-yield securities.
| m. | Illiquid Securities Risk |
Illiquid securities are assets that a Fund reasonably expects cannot be sold or disposed of in current market conditions in seven calendar days or less without the sale or disposition significantly changing the market value of the asset. An inability to sell a portfolio position can adversely affect a Fund's value or prevent the Fund from being able to take advantage of other investment opportunities. Illiquid securities and relatively less liquid securities may also be difficult to value.
The Adviser employs procedures and tests using third-party and internal data inputs that seek to assess and manage the liquidity of a Fund's portfolio holdings. These procedures and tests take into account a Fund's investment strategy and liquidity of portfolio investments during both normal and foreseeable stressed conditions, cash-flow projections during both normal and reasonably foreseeable stressed conditions, relevant market, trading and other factors, and monitor whether liquidity should be adjusted based on changed market conditions. These procedures and tests are designed to assist a Fund in determining its ability to meet redemption requests in various market conditions. In light of the dynamic nature of markets, there can be no assurance that these procedures and tests will enable a Fund to ensure that it has sufficient liquidity to meet redemption requests.
| n. | Impact of Large Redemptions and Purchases of Fund Shares |
Occasionally, shareholders may make large redemptions or purchases of Fund shares, which may cause a Fund to have to sell securities or invest additional cash. These transactions may adversely affect the Fund's performance and increase transaction costs. In addition, large redemption requests may exceed the cash balance of the Fund and result in credit line borrowing fees and/or overdraft charges to a Fund until the sales of portfolio securities necessary to cover the redemption request settle.
| 2022 Semi-Annual Report | 89 |
Notes to Financial Statements (continued)
April 30, 2022 (Unaudited)
| o. | Interest Rate Risk |
| Each Fund's fixed income investments are subject to interest rate risk, which generally causes the value of a fixed income portfolio to decrease when interest rates rise resulting in a decrease in each Fund's net assets. Each Fund may be subject to a greater risk of rising interest rates due to the recent period of historically low rates and the effect of potential government fiscal policy initiatives and resulting market reaction to those initiatives. Interest rate fluctuations tend to have a greater impact on fixed income-securities with a greater time to maturity and/or lower coupon. A fund with a longer average portfolio duration will be more sensitive to changes in interest rates than a fund with a shorter average portfolio duration. In periods of market volatility, the market values of fixed income securities may be more sensitive to changes in interest rates. |
| p. | Issuer Risk |
| The value of a security may decline for reasons directly related to the issuer, such as management performance, financial leverage and reduced demand for the issuer's goods or services. |
| q. | LIBOR Risk |
| The risk that potential changes related to the use of the London Interbank Offered Rate ("LIBOR") could adversely affect financial instruments that reference LIBOR as a benchmark interest rate. While some instruments may contemplate a scenario when LIBOR is no longer available by providing for an alternative rate setting methodology, not all instruments provide for an alternative rate, and the effectiveness of replacement rates is uncertain. The potential abandonment of LIBOR could affect the value and liquidity of instruments that reference LIBOR, especially those that do not have fallback provisions. |
| r. | Management Risk |
| Each Fund is subject to the risk that the Adviser or Subadviser (as applicable) may make poor security selections. The Adviser, Subadviser and their portfolio managers apply their own investment techniques and risk analyses in making investment decisions for the Fund and there can be no guarantee that these decisions will achieve the desired results for a Fund. In addition, the Adviser or Subadviser may select securities that underperform the relevant market or other funds with similar investment objectives and strategies. |
| s. | Market Risk |
| Deteriorating market conditions might cause a general weakness in the market that reduces the prices, or yield, of securities in that market. Developments in a particular class of bonds or the stock market could also adversely affect a Fund by reducing the relative attractiveness of bonds or stocks as an investment. Also, to the extent that a Fund emphasizes bonds or stocks from any given industry, it could be hurt if that industry does not do well. Additionally, a Fund could lose value if the individual stocks in which it maintains long positions and/or the overall stock markets on which the stocks trade decline in price. In addition, a Fund that engages in short sales could lose value if the individual stocks which they sell short increase in price. Stocks and stock markets may experience short-term volatility (price fluctuation) as well as extended periods of price decline or increase. Individual stocks are affected by many factors, including: |
| • | corporate earnings; |
| • | production; |
| • | management; |
| • | sales; and |
| • | market trends, including investor demand for a particular type of stock, such as growth or value stocks, small or large stocks, or stocks within a particular industry. |
| Stock markets are affected by numerous factors, including interest rates, the outlook for corporate profits, the health of the national and world economies, the fluctuation of other stock markets around the world, and financial, economic and other global market developments and disruptions, such as those arising from war, terrorism, market manipulation, government interventions, defaults and shutdowns, political changes or diplomatic developments, public health emergencies and natural/environmental disasters. In addition, any spread of an infectious illness, public health threat or similar issue could reduce consumer demand or economic output, result in market closures, travel restrictions or quarantines, and generally have a significant impact on the world economy, which in turn could adversely affect the Fund's investments. |
| Policy and legislative changes in the United States and in other countries are affecting many aspects of financial regulation, and governmental and quasi-governmental authorities and regulators throughout the world have responded to serious economic disruptions with a variety of significant fiscal and monetary policy changes, including but not limited to, direct capital infusions into companies, new monetary programs and dramatically lower interest rates. The impact of these policies and legislative changes on the markets, and the practical implications for market participants, may not be fully known for some time. A reversal of these policies, or the ineffectiveness of these policies, could increase volatility in securities markets, which could adversely impact the Fund's investments. The current market environment could make identifying investment risks and opportunities especially difficult for the Adviser. |
| 90 | 2022 Semi-Annual Report |
Notes to Financial Statements (continued)
April 30, 2022 (Unaudited)
| In addition, as noted above, uncertainties remain relating to certain aspects of the United Kingdom's future economic, trading and legal relationships with the European Union and with other countries. |
| Whether or not a Fund invests in securities of issuers located in Europe (whether the EU, Eurozone or UK) or with significant exposure to European, EU, Eurozone or UK issuers or countries, the unavoidable uncertainties and events related to Brexit could negatively affect the value and liquidity of a Fund's investments, increase taxes and costs of business and cause volatility in currency exchange rates and interest rates. Brexit could adversely affect the performance of contracts in existence at the date of Brexit and European, UK or worldwide political, regulatory, economic or market conditions and could contribute to instability in political institutions, regulatory agencies and financial markets. Brexit could also lead to legal uncertainty and politically divergent national laws and regulations as a new relationship between the UK and EU is defined and as the UK determines which EU laws to replace or replicate. Any of these effects of Brexit, and others that cannot be anticipated, could adversely affect a Fund's business, results of operations and financial condition. In addition, the risk that abrdn, the parent of the companies that provide investment advisory, sub-advisory and administration services to the Funds and which is headquartered in the UK, fails to adequately prepare for Brexit could have significant customer, reputation and capital impacts for abrdn and its subsidiaries, including those providing services to the Funds. abrdn has detailed contingency plan in place to seek to manage the consequences of Brexit on the Funds and to avoid the effect of any disruption on the Funds and to the services its subsidiaries provide. Given the fluidity and complexity of the situation, however, it cannot assured that the Funds will not be adversely impacted by Brexit despite these preparations. |
| Economies and financial markets throughout the world are becoming increasingly interconnected. As a result, whether or not a Fund invests in securities of issuers located in or with significant exposure to countries experiencing economic and financial difficulties, the value and liquidity of the Fund's investments may be negatively affected by such events. |
| The illness caused by a novel coronavirus (COVID-19) has resulted in a global pandemic and major disruption to economies and markets around the world, including the United States. Financial markets have experienced extreme volatility and severe losses, and trading in many instruments has been disrupted. Liquidity for many instruments has been greatly reduced for periods of time. Some interest rates are very low and in some cases yields are negative. Some sectors of the economy and individual issuers have experienced particularly large losses. These circumstances may continue for an extended period of time, and may continue to affect adversely the value and liquidity of the fund's investments. The ultimate economic fallout from the pandemic, and the long-term impact on economies, markets, industries and individual issuers, including the Funds, are not known. Governments and central banks, including the Federal Reserve in the U.S., have taken extraordinary and unprecedented actions to support local and global economies and the financial markets. In addition, as described above under "Foreign Securities Risk," the ongoing military conflict between Russia and Ukraine may continue to result in significant negative impacts on the markets for certain securities and commodities globally, in addition to fluctuating pricing and liquidity of investments. These factors could have a significant impact on Fund performance and the value of the Funds' investments. The impact of these measures, and whether they will be effective to mitigate the economic and market disruption, will not be known for some time. |
| t. | Municipal Securities Risk |
| The Intermediate Municipal Income Fund, Short Duration High Yield Municipal Fund and Ultra Short Municipal Income Fund (the "Municipal Funds") are subject to municipal securities risk. Municipal bonds can be significantly affected by political and economic changes, including inflation, as well as uncertainties in the municipal market related to taxation, legislative changes, or the rights of municipal security holders. Municipal bonds have varying levels of sensitivity to changes in interest rates. Interest rate risk is generally lower for shorter-term municipal bonds and higher for long term municipal bonds. |
| Municipal Bond Tax Risk. A municipal bond that is issued as tax-exempt may later be declared to be taxable. In addition, if the federal income tax rate is reduced, the value of the tax exemption may be less valuable, causing the value of a municipal bond to decline. |
| Municipal Market Volatility and Illiquidity Risk. The municipal bond market can be susceptible to unusual volatility, particularly for lower-rated and unrated securities. Liquidity can be reduced unpredictably in response to overall economic conditions or credit tightening. During times of reduced market liquidity, a Fund may not be able to readily sell bonds without the sale significantly changing the market value of the bond. If the Fund needed to sell large blocks of bonds to meet shareholder redemption requests or to raise cash, those sales could further reduce the bonds' prices. |
| Municipal Sector Risk. From time to time a Fund may invest a substantial amount of its assets in municipal securities whose interest is paid solely from revenues of similar projects. If the Fund concentrates its investments in this manner, it assumes the economic risks relating to such projects and this may have a significant impact on the Fund's investment performance. |
| New York State-Specific Risk. To the extent the Short Duration High Yield Municipal Fund invests a substantial amount of its assets in New York municipal securities, the Fund may be affected by economic, regulatory or political developments affecting the ability of New York issuers to pay interest or repay principal. |
| 2022 Semi-Annual Report | 91 |
Notes to Financial Statements (continued)
April 30, 2022 (Unaudited)
| u. | Non-Diversified Fund Risk |
| The Emerging Market Debt Fund's performance may be more volatile than a diversified fund because it may invest a greater percentage of its total assets in the securities of a single issuer. |
| v. | Non-Hedging Foreign Currency Trading Risk |
| Foreign exchange rates can be extremely volatile and a variance in the degree of volatility of the market or in the direction of the market from the Adviser's expectations may produce significant losses to certain Funds. |
| w. | Portfolio Turnover Risk |
| Certain Funds may engage in active and frequent trading of portfolio securities to achieve its investment objective. High portfolio turnover may result in greater transaction costs which may reduce Fund performance. The sale of Fund portfolio securities may also result in greater realization and/or distribution to shareholders of gains or losses as compared to a fund with less active trading, which may include short-term gains taxable at ordinary income tax rates. |
| x. | Private Placements and Other Restricted Securities Risk |
| The Emerging Markets Debt Fund, Global High Income Fund and Short Duration High Yield Municipal Fund are subject to Private Placements Risk. Investments in private placements and other restricted securities, including Regulation S Securities and Rule 144A Securities, could have the effect of increasing the Fund's level of illiquidity. Private placements and restricted securities may be less liquid than other investments because such securities may not always be readily sold in broad public markets and the Fund might be unable to dispose of such securities promptly or at prices reflecting their true value. |
| y. | Puerto Rico and U.S. Territories Risk |
| The Short Duration High Yield Municipal Fund is subject to Puerto Rico and U.S. territories risk to the extent that it invests in municipal obligations of such territories. Certain municipal issuers in Puerto Rico have experienced financial difficulties over recent years, leading certain issuers, including the Commonwealth, to default on debt obligations. These financial difficulties have been exacerbated by the impact of geological and severe weather events, as well as public health emergencies. Puerto Rico's ongoing financial difficulties could potentially lead to worsening liquidity for its bonds and wider spreads, and consequently may affect the Fund's performance to the extent it invests in Puerto Rican municipal securities. As with Puerto Rican municipal securities, events in any of the other territories where the Fund is invested may affect the Fund's investments and its performance. |
| z. | Sector Risk |
| To the extent that a Fund has a significant portion of its assets invested in securities of companies conducting business in a broadly related group of industries within an economic sector, the Fund may be more vulnerable to unfavorable developments in that economic sector than funds that invest more broadly. |
| Financials Sector Risk. To the extent that the financials sector represents a significant portion of a Fund's portfolio, the Fund will be sensitive to changes in, and its performance may depend to a greater extent on, factors impacting this sector. Performance of companies in the financials sector may be adversely impacted by many factors, including, among others, government regulations, economic conditions, credit rating downgrades, changes in interest rates, and decreased liquidity in credit markets as well as cyber-attacks. |
| aa. | Sovereign Debt Risk |
| The Emerging Markets Debt Fund, Global Absolute Return Strategies Fund and Global High Income Fund are subject to Sovereign Debt Risk. Periods of economic and political uncertainty may result in the illiquidity and increased price volatility of a foreign government's debt securities held by the Fund and impact an issuer's ability and willingness to pay interest or repay principal when due. The Fund may have limited recourse to compel payment in the event of a default. A foreign government's default on its debt securities may cause the value of securities held by the Fund to decline significantly. |
| bb. | Tender Option Bonds Risk |
| The Municipal Funds are subject to Tender Option Bonds Risk. Tender option bonds are synthetic floating-rate or variable-rate securities issued when long-term bonds are purchased in the primary or secondary market and then deposited into a trust. Tender option bonds may be considered derivatives, and may expose the Fund to the same risks as investments in derivatives, as well as risks associated with leverage, especially the risk of increased volatility. |
| 92 | 2022 Semi-Annual Report |
Notes to Financial Statements (continued)
April 30, 2022 (Unaudited)
| cc. | Tobacco Related Bonds Risk |
| The Short Duration High Yield Municipal Fund is subject to Tobacco Related Bonds Risk. In 1998, the largest U.S. tobacco manufacturers reached an out of court agreement, the MSA, to settle claims against them by 46 states and six other U.S. jurisdictions. The tobacco manufacturers agreed to make annual payments to the government entities in exchange for the release of all litigation claims. A number of the states have sold bonds that are backed by those future payments. The Funds may invest in two types of those bonds: (i) bonds that make payments only from a state's interest in the MSA and (ii) bonds that make payments from both the MSA revenue and from an "appropriation pledge" by the state. An "appropriation pledge" requires the state to pass a specific periodic appropriation to make the payments and is generally not an unconditional guarantee of payment by a state. The settlement payments are based on factors, including, but not limited to, annual domestic cigarette shipments, cigarette consumption, inflation and the financial capability of participating tobacco companies. Payments could be reduced if consumption decreases, if market share is lost to non-MSA manufacturers, or if there is a negative outcome in litigation regarding the MSA. |
| dd. | U.S. Government Securities Risk |
| Securities issued by U.S. Government agencies or government sponsored entities may not be guaranteed by the U.S. Treasury. The U.S. Government does not guarantee the net asset value of a Fund's shares. |
| ee. | Valuation Risk |
| The price that a Fund could receive upon the sale of any particular portfolio investment may differ from the Fund's valuation of the investment, particularly for securities that trade in thin or volatile markets or that are valued using a fair valuation methodology or a price provided by an independent pricing service. As a result, the price received upon the sale of an investment may be less than the value ascribed by a Fund, and the Fund could realize a greater than expected loss or lesser than expected gain upon the sale of the investment. A Fund's ability to value its investments may also be impacted by technological issues and/or errors by pricing services or other third-party service providers. |
| ff. | Variable and Floating Rate Securities Risk |
| Certain Funds are subject to Variable and Floating Rate Securities Risk. For floating and variable rate obligations, there may be a lag between an actual change in the underlying interest rate benchmark and the reset time for an interest payment of such an obligation, which could harm or benefit the Fund, depending on the interest rate environment or other circumstances. Variable rate demand obligations ("VRDOs") are floating rate securities that combine an interest in a long term municipal bond with a right to demand payment before maturity from a bank or other financial institution. If the bank or financial institution is unable to pay, the Fund may lose money. |
| gg. | Yield Risk |
| The Ultra Short Municipal Income Fund is subject to Yield Risk. The amount of income received by the Fund will go up or down depending on day-to-day variations in short-term interest rates, and when interest rates are very low the Fund's expenses could absorb all or a significant portion of the Fund's income. If interest rates increase, the Fund's yield may not increase proportionately. For example, the Adviser may discontinue any temporary voluntary fee limitation or recoup amounts previously waived and/or reimbursed. |
| Please read the Funds' prospectus for more detailed information regarding these and other risks. |
6. Contingencies
In the normal course of business, the Funds may provide general indemnifications pursuant to certain contracts and organizational documents. The Funds' maximum exposure under these arrangements is dependent on future claims that may be made against the Funds, and therefore, cannot be estimated; however, the Funds expect the risk of loss from such claims to be remote.
| 2022 Semi-Annual Report | 93 |
Notes to Financial Statements (continued)
April 30, 2022 (Unaudited)
7. Tax Information
As of April 30, 2022, the tax cost of securities and the breakdown of unrealized appreciation/(depreciation) for each Fund were as follows:
| Tax Cost of Securities | Unrealized Appreciation | Unrealized Depreciation | Net Unrealized Appreciation/ (Depreciation) | |||||||||||||
| Emerging Markets Debt Fund | $ | 38,210,983 | $ | 291,453 | $ | (8,465,859 | ) | $ | (8,174,406 | ) | ||||||
| Global Absolute Return Strategies Fund | 51,388,054 | 3,495,963 | (4,528,317 | ) | (1,032,354 | ) | ||||||||||
| Global High Income Fund | 113,031,785 | 1,357,204 | (10,801,448 | ) | (9,444,244 | ) | ||||||||||
| Intermediate Municipal Income Fund | 51,439,983 | 1,034,866 | (1,464,554 | ) | (429,688 | ) | ||||||||||
| Short Duration High Yield Municipal Fund | 374,942,635 | 1,211,268 | (21,892,204 | ) | (20,680,936 | ) | ||||||||||
| Ultra Short Municipal Income Fund | 935,309,470 | 35,796 | (2,346,550 | ) | (2,310,754 | ) | ||||||||||
The tax character of distributions paid during the fiscal year ended October 31, 2021 was as follows (total distributions paid may differ from the Statements of Changes in Net Assets because for tax purposes dividends are recognized when actually paid):
| Distributions paid from | ||||||||||||||||||||||
| Fund | Ordinary Income* | Net Long Term Capital Gains* | Total Taxable Distributions | Tax Exempt Distributions | Return of Capital | Total Distributions Paid | ||||||||||||||||
| Emerging Markets Debt Fund | $ | 1,902,067 | $ – | $ | 1,902,067 | $ | – | $– | $1,902,067 | |||||||||||||
| Global Absolute Return Strategies Fund | 67,951 | – | 67,951 | – | – | 67,951 | ||||||||||||||||
| Global High Income Fund | 7,232,532 | – | 7,232,532 | – | – | 7,232,532 | ||||||||||||||||
| Intermediate Municipal Income Fund | 5,646 | 111,156 | 116,802 | 1,657,068 | – | 1,773,870 | ||||||||||||||||
| Short Duration High Yield Municipal Fund | 45,798 | – | 45,798 | 8,245,012 | – | 8,290,810 | ||||||||||||||||
| Ultra Short Municipal Income Fund | 3,774 | – | 3,774 | 989,127 | – | 992,901 | ||||||||||||||||
As of October 31, 2021, the components of accumulated earnings/(deficit) on a tax basis were as follows:
| Fund | Undistributed Tax Exempt Income | Undistributed Ordinary Income | Undistributed Long-Term Capital Gains | Accumulated Earnings | Distributions Payable | Late Year Ordinary and Post-October Capital Loss Deferrals | Other Temporary Differences | Unrealized Appreciation/ (Depreciation)* | Accumulated Capital and Other Losses** | Total Accumulated Earnings/ (Deficit) | ||||||||||||||
| Emerging Markets Debt Fund | $ – | $ 1,745,878 | $ – | $– | $– | $– | $ – | $(3,467,562 | ) | $ (4,191,088 | ) | $ (5,912,772 | ) | |||||||||||
| Global Absolute Return Strategies Fund | – | 2,028,305 | 690,096 | – | – | – | – | (1,717,760 | ) | – | 1,000,641 | |||||||||||||
| Global High Income Fund | – | 721,019 | – | – | – | – | 3 | 1,825,407 | (234,763,165 | ) | (232,216,736 | ) | ||||||||||||
| Intermediate Municipal Income Fund | 7,325 | – | – | – | – | – | (12,442 | ) | 4,165,942 | (298,806 | ) | 3,862,019 | ||||||||||||
| Short Duration High Yield Municipal Fund | 272,950 | – | – | – | – | – | (70,726 | ) | 6,169,652 | (8,606,656 | ) | (2,234,780 | ) | |||||||||||
| Ultra Short Municipal Income Fund | – | – | – | – | – | – | (1,593 | ) | 145,845 | (541,165 | ) | (396,913 | ) |
| * | The difference between the book-basis and tax-basis unrealized appreciation/(depreciation) is attributable primarily to tax deferral of losses on wash sales. |
| ** | As of October 31, 2021, for Federal income tax purposes, these Funds have capital loss carryforwards available to offset capital gains, if any, to the extent provided by the Treasury regulations, with no expiration. |
Amounts listed as "–" are $0 or round to $0.
| 94 | 2022 Semi-Annual Report |
Notes to Financial Statements (continued)
April 30, 2022 (Unaudited)
As of October 31, 2021, for federal income tax purposes, the following Funds have capital loss carryforwards available to offset capital gains, if any, to the extent provided by the Treasury regulations.
| Fund | Amount | Expires | ||||||
| Emerging Markets Debt Fund | $ | 1,073,585 | Unlimited (Short-Term | ) | ||||
| Emerging Markets Debt Fund | 3,117,503 | Unlimited (Long-Term | ) | |||||
| Global High Income Fund | 52,364,044 | Unlimited (Short-Term | ) | |||||
| Global High Income Fund | 182,399,121 | Unlimited (Long-Term | ) | |||||
| Intermediate Municipal Income Fund | 2,841 | Unlimited (Short-Term | ) | |||||
| Intermediate Municipal Income Fund | 295,965 | Unlimited (Long-Term | ) | |||||
| Short Duration High Yield Municipal Fund | 3,485,952 | Unlimited (Short-Term | ) | |||||
| Short Duration High Yield Municipal Fund | 5,120,704 | Unlimited (Long-Term | ) | |||||
| Ultra Short Municipal Income Fund | 539,995 | Unlimited (Short-Term | ) | |||||
| Ultra Short Municipal Income Fund | 1,170 | Unlimited (Long-Term | ) | |||||
8. Significant Shareholders
As of April 30, 2022, the Funds had shareholders with the percentage ownership indicated, which are considered significant shareholders (holdings greater than 5.0%) for financial reporting purposes:
| Fund | Record Ownership % | Number of Account Owners | ||||||
| Emerging Markets Debt Fund | 93.5 | % | 3 | |||||
| Global Absolute Return Strategies Fund | 44.4 | 5 | ||||||
| Global High Income Fund | 36.9 | 3 | ||||||
| Intermediate Municipal Income Fund | – | – | ||||||
| Short Duration High Yield Municipal Fund | 53.5 | 4 | ||||||
| Ultra Short Municipal Income Fund | 78.6 | 6 | ||||||
Amounts listed as "–" are $0 or round to $0.
9. Line of Credit
The Trust, on behalf of each of the funds of the Trust (including the Funds) (the "Borrowers"), has entered into an agreement (the "Agreement") with State Street (the "Bank"), subject to annual renewal. The Agreement provides for a revolving credit facility (the "Credit Facility") in the amount of $150,000,000 to be utilized for temporary or emergency purposes to fund shareholder redemptions or other short-term liquidity purposes.
Principal on each outstanding loan made under the Agreement bears interest at a variable rate per annum equal to the higher of (a) the Federal Funds Rate as in effect on such day or (b) the Overnight Banking Fund Rate on such date, plus, in each case, 10 basis points plus 1.25%. In addition, the Borrowers shall pay to the Bank a commitment fee at the rate of 0.25% per annum on the daily unused portion of the Credit Facility, as applicable, which is allocated among the Borrowers in such manner as is determined by the Board to be reasonable. For each Fund that borrowed under the Credit Facility during the six-month period ended April 30, 2022, the following table shows the average outstanding daily balance of the days the Fund utilized the Credit Facility and the average weighted interest rate paid by the Fund during the six-month period ended April 30, 2022.
| Average Outstanding Daily Balance | Average Weighted Interest Rate | Days Utilized | ||||||||||
| Emerging Markets Debt Fund | $ 385,438 | 1.58% | 67 | |||||||||
| Global High Income Fund | 1,858,064 | 1.43% | 7 | |||||||||
| Intermediate Municipal Income Fund | 225,000 | 1.43% | 3 | |||||||||
| 2022 Semi-Annual Report | 95 |
Notes to Financial Statements (concluded)
April 30, 2022 (Unaudited)
10. Recent Rulemaking
In October 2020, the Securities and Exchange Commission ("SEC") adopted new regulations governing the use of derivatives by registered investment companies. Rule 18f-4 will impose limits on the amount of derivatives a fund could enter into, eliminate the asset segregation framework currently used by funds to comply with Section 18 of the 1940 Act, and require funds whose use of derivatives is more than a limited specified exposure to establish and maintain a derivatives risk management program and appoint a derivatives risk manager. While the new rule became effective February 19, 2021, funds will not be required to fully comply with the new rule until August 19, 2022. Management is currently finalizing the implementation of Rule 18f-4 to meet the August 19, 2022 compliance date.
In December 2020, the SEC adopted Rule 2a-5 under the 1940 Act, which establishes requirements for determining fair value in good faith for purposes of the 1940 Act, including related oversight and reporting requirements. The rule also defines when market quotations are "readily available" for purposes of the 1940 Act, the threshold for determining whether a fund must fair value a security. The SEC also adopted new Rule 31a-4 under the 1940 Act, which sets forth the recordkeeping requirements associated with fair value determinations. Finally, the SEC is rescinding certain previously issued guidance on related issues, including the role of a board in determining fair value and the accounting and auditing of fund investments. Rule 2a-5 and Rule 31a-4 became effective on March 8, 2021, with a compliance date of September 8, 2022. Management is currently evaluating this guidance.
11. Subsequent Events
Management has evaluated the need for disclosures and/or adjustments resulting from subsequent events through the date the financial statements were issued. Based on this evaluation, no disclosures and/or adjustments were required to the financial statements as of April 30, 2022.
| 96 | 2022 Semi-Annual Report |
Shareholder Expense Examples (Unaudited)
As a shareholder of the abrdn Funds, you incur two types of costs: (1) transaction costs, including sales charges (loads) paid on purchase payments and (2) ongoing costs, including investment advisory fees, administration fees, transfer agent out-of-pocket expenses, distribution fees and other Fund expenses. The examples below are intended to help you understand your ongoing costs (in dollars) of investing in the abrdn Funds and to compare these costs with the ongoing costs of investing in other mutual funds.
The examples assume that you had a $1,000 investment in the Class at the beginning of the reporting period, November 1, 2021 and continued to hold your shares at the end of the reporting period, April 30, 2022.
Actual Expenses
The table below provides information about actual account values and actual expenses. You may use the information together with the amount you invested, to estimate the expenses that you paid over the period. Simply divide your account value by $1,000 (for example, an $8,600 account value divided by $1,000 = 8.6), then multiply the result by the number under the heading entitled "Actual Expenses Paid During Period" for the class of a Fund that you own to estimate the expenses you paid on your account during the period.
Hypothetical Example for Comparison Purposes
The table below provides information about hypothetical account values and hypothetical expenses based on the Class' actual expense ratio and an assumed rate of return of 5% per year before expenses, which is not the Class' actual return. The hypothetical account values and expenses may not be used to estimate the actual ending account balance or expenses you paid for the period. You may use this information to compare the ongoing costs of investing in the Class of a Fund and other funds. To do so, compare the 5% hypothetical example with the 5% hypothetical examples that appear in the shareholder reports of the other funds.
Please note that the expenses shown in the table are meant to highlight your ongoing costs only and do not reflect any transaction costs, such as sales charges (loads). Therefore, the information for each Class in the table is useful in comparing ongoing costs only, and will not help you determine the relative total costs of owning different funds. In addition, if these transaction costs were included, your costs would have been higher. The examples also assume all dividends and distributions have been reinvested.
| Beginning Account Value, November 1, 2021 | Actual Ending Account Value, April 30, 2022 | Hypothetical Ending Account Value | Actual Expenses Paid During Period1 | Hypothetical Expenses Paid During Period12 | Annualized Expense Ratio** | ||
| Emerging Markets Debt Fund | Class A | $1,000.00 | $854.50 | $1,019.59 | $4.83 | $5.26 | 1.05% |
| Class C | $1,000.00 | $852.80 | $1,016.61 | $7.58 | $8.25 | 1.65% | |
| Class R | $1,000.00 | $853.00 | $1,018.25 | $6.06 | $6.61 | 1.32% | |
| Institutional Service Class | $1,000.00 | $856.50 | $1,021.03 | $3.50 | $3.81 | 0.76% | |
| Institutional Class | $1,000.00 | $857.00 | $1,021.57 | $2.99 | $3.26 | 0.65% | |
| Global Absolute Return Strategies Fund | Class A | $1,000.00 | $941.50 | $1,019.49 | $5.15 | $5.36 | 1.07% |
| Class C | $1,000.00 | $938.90 | $1,016.61 | $7.93 | $8.25 | 1.65% | |
| Institutional Service Class | $1,000.00 | $942.90 | $1,020.93 | $3.76 | $3.91 | 0.78% | |
| Institutional Class | $1,000.00 | $944.60 | $1,021.57 | $3.13 | $3.26 | 0.65% | |
| Global High Income Fund | Class A | $1,000.00 | $919.00 | $1,019.84 | $4.76 | $5.01 | 1.00% |
| Institutional Class | $1,000.00 | $919.80 | $1,021.08 | $3.57 | $3.76 | 0.75% | |
| Intermediate Municipal Income Fund | Class A | $1,000.00 | $928.80 | $1,021.03 | $3.63 | $3.81 | 0.76% |
| Class C | $1,000.00 | $925.20 | $1,017.36 | $7.16 | $7.50 | 1.50% | |
| Institutional Service Class | $1,000.00 | $930.10 | $1,022.32 | $2.39 | $2.51 | 0.50% | |
| Institutional Class | $1,000.00 | $929.00 | $1,022.32 | $2.39 | $2.51 | 0.50% | |
| Short Duration High Yield Municipal Fund | Class A | $1,000.00 | $940.40 | $1,020.33 | $4.33 | $4.51 | 0.90% |
| Class C | $1,000.00 | $936.00 | $1,016.61 | $7.92 | $8.25 | 1.65% | |
| Institutional Class | $1,000.00 | $941.60 | $1,021.57 | $3.13 | $3.26 | 0.65% | |
| Ultra Short Municipal Income Fund | Class A | $1,000.00 | $997.30 | $1,022.12 | $2.67 | $2.71 | 0.54% |
| Class A1 | $1,000.00 | $997.30 | $1,022.12 | $2.67 | $2.71 | 0.54% | |
| Institutional Class | $1,000.00 | $996.70 | $1,022.56 | $2.23 | $2.26 | 0.45% |
| ** | The expense ratio presented represents a six-month, annualized ratio. |
| 1 | Expenses are equal to the Fund's annualized expense ratio multiplied by the average account value over the period multiplied by 181/365 (to reflect the one-half year period). |
| 2 | Represents the hypothetical 5% return before expenses. |
| 2022 Semi-Annual Report | 97 |
Supplemental Information (Unaudited)
Board of Trustees' Consideration of New Advisory Agreement
The Board of Trustees (the "Board," the members of which are referred to as "Trustees") of abrdn Funds (the "Trust") met on May 3, 2021 and June 16, 2021 (together, the "Meetings") to consider the approval of: (i) the Investment Advisory Agreement between the Trust, on behalf of abrdn Global High Income Fund (the "New Fund") and abrdn Inc. ("abrdn" or the "Adviser," subsequently renamed abrdn Inc.) (the "New Investment Advisory Agreement"). In addition, the Independent Trustees held separate executive sessions with their independent counsel at the Meetings to review the materials provided and the relevant legal considerations. Pursuant to relief granted by the U.S. Securities and Exchange Commission (the "SEC") in light of the COVID-19 pandemic (the "Order") and a determination by the Board that reliance on the Order was appropriate due to circumstances related to the current or potential effects of COVID-19, the Meetings were held via videoconference. In accordance with Section 15(c) of the 1940 Act, the Board requested, reviewed and considered materials furnished by relevant to the Board's consideration of whether to approve the New Investment Advisory Agreement. These materials included (i) memoranda and materials provided by abrdn, describing the personnel and services to be provided to the New Fund; (ii) performance information for the Predecessor Fund; (iii) strategies relevant to the consideration of the New Investment Advisory Agreement; (iv) information independently compiled by Morningstar Associates, LLC ("Morningstar") relating to the New Fund's proposed fees and expenses and (v) a discussion of the compliance programs of abrdn.
At the meeting held on June 16, 2021, the Board, including the Independent Trustees, unanimously approved the New Investment Advisory Agreement between the New Fund and for an initial two-year period. The Board considered all factors it believed to be relevant with respect to the New Fund, including, among other factors: (a) the nature, extent and quality of services to be provided by the Adviser; (b) the investment performance of the Adviser and the Adviser's portfolio management; (c) the advisory fees and the cost of the services and profits to be realized by the Adviser from the relationship with the New Fund; (d) economies of scale; and (e) other factors.
The following is a summary of the Board's discussion and views regarding the factors it considered in evaluating the New Advisory Agreement:
The nature, extent and quality of the services to be provided to the New Fund under the Agreement. The Trustees considered the nature, extent and quality of the services to be provided by abrdn to the New Fund and the resources dedicated to the New Fund by the Adviser and its affiliates. The Board considered, among other things, the Adviser's investment experience. The Board also considered the background and experience of the senior management personnel of abrdn, and the qualifications, background and responsibilities of the portfolio managers to be primarily responsible for the day-to-day portfolio management services for the New Fund. The Trustees considered not only the advisory services to be provided by abrdn to the New Fund, but also the administrative services to be provided by abrdn to the New Fund under a separate administration agreement. The Board also considered that it receives information on a regular basis from the Trust's Chief Compliance Officer regarding abrdn's compliance policies and procedures. The Board also considered the Adviser's risk management processes. The Board was also mindful of ASII's focus on monitoring the performance of the New Fund and addressing performance matters. The Trustees also considered the benefits to shareholders of investing in a mutual fund that is part of a family of funds that offers shareholders the right to exchange shares of one type of fund for shares of another type of fund, and provides a variety of fund and shareholder services. The Board also took into account its knowledge of management and the quality of the performance of management's duties through Board meetings, discussion and reports during the preceding year.
After reviewing these and related factors, the Board concluded that the nature, extent and quality of the services to be provided supported the approval of the New Investment Advisory Agreement.
Investment Performance and the Adviser's Portfolio Management. Because the New Fund is newly formed, the Board did not consider the investment performance of the New Fund. The Board considered instead the investment performance of the Predecessor Fund, including whether the Predecessor Fund had operated within its investment objectives, as well as its compliance with its investment restrictions. The Board based its review of abrdn's and its affiliates' performance primarily on the experience of abrdn and its affiliates in managing other registered investment companies and private funds, noting that other funds abrdn and its affiliates manage might have investment objectives, policies or restrictions different from those of the New Fund. The Board also considered the experience, resources and strengths of abrdn and its affiliates with respect to the investment strategies proposed for the New Fund.
Based on these factors, the Trustees determined that the Adviser would be an appropriate investment adviser for the New Fund.
The costs of the services provided and profits to be realized by the Adviser and affiliates from the relationships with the New Fund. The Trustees considered the fees to be charged to the New Fund for advisory services as well as the total expense levels of the New Fund. This information included comparisons (provided both by management and also by an independent third party) of the New Fund's net management fee and total expense level to those of its expense peer group and information about the advisory fees charged by abrdn and its affiliates to any separately managed accounts with a similar strategy, as applicable. In considering the fees charged to any comparable accounts, the Trustees considered, among other things, management's discussion of the different objectives, policies or restrictions that may be involved in managing the different types of accounts. In evaluating the New Fund's advisory fees, the Trustees also took into account the demands, complexity and quality of the investment management proposed for the New Fund.
| 98 | 2022 Semi-Annual Report |
Supplemental Information (Unaudited) (continued)
The Board also considered that abrdn had entered into an expense limitation agreement with the New Fund, pursuant to which abrdn agreed to waive a portion of its advisory fee and/or reimburse certain expenses as a means of limiting the New Fund's total annual operating expenses for a period of time. The Trustees also noted that abrdn had agreed to enter into an expense limitation agreement with the New Fund until at least February 28, 2023 following the reorganization of the Predecessor Fund into the New Fund.
The Trustees also considered the compensation directly or indirectly received by abrdn and its affiliates from their relationships with the New Fund. The Trustees reviewed information provided by management as to the profitability of abrdn and its affiliates' relationships with the New Fund, such as the engagement of affiliates of abrdn to provide administration services to the New Fund. The Trustees also examined the profitability of abrdn and its affiliates in relation to the New Fund. The Trustees considered information about the allocation of expenses used to calculate profitability. When reviewing profitability, the Trustees also considered information about court cases regarding adviser profitability, the performance of the New Fund, the expense levels of the New Fund, and abrdn's proposed breakpoints and expense limitations with respect to the New Fund.
After reviewing these and related factors, including taking into account management's discussion regarding the New Fund's expenses, the Board concluded that the proposed advisory fees were fair and reasonable, and that the costs of these services generally and the related profitability of abrdn and its affiliates from their relationships with the New Fund were reasonable and supported the approval of the Agreement.
Economies of Scale. The Adviser provided the Board with information concerning the extent to which economies of scale would be realized as the New Fund grows. abrdn presented information to show that the fees were set at a level that is competitive relative to comparable funds of an anticipated size and complexity. The Trustees noted that the New Fund was subject to an expense limitation and that the advisory fees for the New Fund was subject to breakpoints. The Board considered that the funds in the abrdn fund complex share some common resources and, as a result, an increase in the overall size of the complex could permit the New Fund to incur lower expenses than they would otherwise as a stand-alone entity. The Board also considered abrdn's overall operations and its efforts to expand the scale of, and further enhance the quality of, its operations.
Other Factors. The Board also took into account other ancillary or "fall out" benefits that the Adviser or its affiliates may derive from its relationship with the New Fund, both tangible and intangible.
After reviewing these and related factors, the Board concluded that the advisory fee structures were reasonable and reflect economies of scale being shared between the New Fund and abrdn, and supported approval of the New Advisory Agreement with respect to the New Fund.
Based on their evaluation of all factors that they deemed to be material, including those factors described above, and assisted by the advice of independent counsel, the Trustees, including the Independent Trustees, concluded that the New Advisory Agreement would be in the best interest of the New Fund and its shareholders. Accordingly, the Board, and the Independent Trustees voting separately and approved the New Investment Advisory Agreement for an initial two-year period. Pursuant to the SEC Order, the Board determined that the Trustees, including the Independent Trustees, voting separately, would ratify their approval at the next in-person Board meeting.
| 2022 Semi-Annual Report | 99 |
Liquidity Risk Management Program (Unaudited)
The Funds have adopted and implemented a liquidity risk management program (the "Liquidity Program") consistent with the requirements of Rule 22e-4 under the 1940 Act (the "Liquidity Rule"). "Liquidity Risk" is defined as the risk that a fund could not meet redemption requests "without significant dilution of remaining investors' interests in the fund." abrdn Inc., the investment adviser and administrator to the Funds, has been approved and designated by the Board of Trustees (the "Board") as the administrator of the Liquidity Program (the "Administrator") and has retained a third party to perform certain functions, including liquidity analytics and providing market data. The Administrator has formed a Liquidity Risk Management Committee (the "Committee") to help implement and carry out the day-to-day operations of the Liquidity Program.
As required by the Liquidity Rule, at a meeting on March 16, 2022, the Board received a written annual report on the operation and effectiveness of the Liquidity Program for the period from February 1, 2021 to January 31, 2022 (the "Reporting Period"). The annual report provided, among other items, an overview of the Liquidity Program including:
| • | information regarding the Committee and the monthly discussions by the Committee of various items including, but not limited to, the following: | |
| º | Review and analysis of appropriate liquidity categories for portfolio investments | |
| º | Review of highly liquid investment minimum ("HLIM") and reasonably anticipated trading sizes ("RATS") | |
| º | Review of current and upcoming market events, such as market closures, that may impact liquidity | |
| º | Review of large shareholder concentrations that may impact liquidity in the event of redemption monthly liquidity reports being provided to portfolio managers | |
| • | the monitoring and classification of portfolio holdings in four liquidity categories (including the operation of the HLIM and any breaches) |
The annual report concluded that the Liquidity Program was reasonably designed to assess and manage the Funds' Liquidity Risk pursuant to the Liquidity Rule.
There can be no assurance that the Liquidity Program will achieve its objectives under all circumstances in the future. Please refer to your Fund's Prospectus and Statement of Additional Information for more information regarding the risks of investing in a Fund, including a Fund's exposure to liquidity risk and other risks to which the Funds may be subject.
| 100 | 2022 Semi-Annual Report |
Management Information
Trustees
Radhika Ajmera
Stephen Bird
P. Gerald Malone, Chairman
Rahn K. Porter
Steven N. Rappaport
Warren C. Smith
Investment Adviser
abrdn Inc.
1900 Market Street, Suite 200
Philadelphia, PA 19103
Fund Administrator
abrdn Inc.
1900 Market Street, Suite 200
Philadelphia, PA 19103
Transfer Agent
DST Asset Manager Solutions, Inc.
430 W. 7th Street, Ste. 219534
Kansas City, MO 64105-1407
Distributor
Aberdeen Fund Distributors LLC
1900 Market Street, Suite 200
Philadelphia, PA 19103
Sub-Administrator, Custodian & Fund Accountant
State Street Bank and Trust Company
1 Lincoln Street
Boston, MA 02111
Independent Registered Public Accounting Firm
KPMG LLP
1601 Market Street
Philadelphia, PA 19103
Fund Counsel
Dechert LLP
1900 K Street N.W.
Washington, DC 20006
abrdn Inc. 1900 Market Street, Suite 200 Philadelphia, PA 19103 abrdn.com/us
AOE-0143-AR ( ) |  |
Item 2. Code of Ethics.
Not applicable – for annual reports only.
Item 3. Audit Committee Financial Expert.
Not applicable – for annual reports only.
Item 4. Principal Accountant Fees and Services.
Not applicable – for annual reports only.
Item 5. Audit Committee of Listed Registrants.
Not applicable – for annual reports only.
Item 6. Investments.
(a) Included as part of the Reports to Shareholders filed under Item 1 of this Form N-CSR.
(b) Not applicable.
Item 7. Disclosure of Proxy Voting Policies and Procedures for Closed-End Management Investment Companies.
Not applicable.
Item 8. Portfolio Managers of Closed-End Management Investment Companies.
Not applicable.
Item 9. Purchases of Equity Securities by Closed-End Management Investment Company and Affiliated Purchasers.
Not applicable.
Item 10. Submission of Matters to a Vote of Security Holders.
During the period ended April 30, 2022, there were no material changes to the procedures by which shareholders may recommend nominees to the Registrant’s Board of Trustees.
Item 11. Controls and Procedures.
(a) The Registrant’s principal executive and principal financial officers, or persons performing similar functions, have concluded that the Registrant’s disclosure controls and procedures (as defined in Rule 30a-3(c) under the Investment Company Act of 1940 (the “Act”) (17 CFR 270.30a-3(c))) are effective, as of a date within 90 days of the filing date of the report that includes the disclosure required by this paragraph, based on the evaluation of these controls and procedures required by Rule 30a-3(b) under the Act (17 CFR 270.30a3(b)) and Rule 13a-15(b) or 15d-15(b) under the Securities Exchange Act of 1934 (17 CFR 240.13a-15(b) or 240.15d15(b)).
(b) There were no changes in the Registrant’s internal control over financial reporting (as defined in Rule 30a-3(d) under the Act (17 CFR 270.30a-3(d)) that occurred during the second fiscal quarter of the period covered by this report that have materially affected, or is reasonably likely to materially affect, the Registrant’s internal control over financial reporting.
Item 12. Disclosure of Securities Lending Activities for Closed-End Management Investment Companies.
Not applicable.
Item 13. Exhibits.
(a)(1) Not applicable.
(a)(3) Not applicable.
(a)(4) Not applicable.
SIGNATURES
Pursuant to the requirements of the Securities Exchange Act of 1934 and the Investment Company Act of 1940, the registrant has duly caused this report to be signed on its behalf by the undersigned, thereunto duly authorized.
abrdn Funds
| By: | /s/ Alan Goodson | |
| Alan Goodson | ||
| Principal Executive Officer of abrdn Funds | ||
Date: July 11, 2022
Pursuant to the requirements of the Securities Exchange Act of 1934 and the Investment Company Act of 1940, this report has been signed below by the following persons on behalf of the registrant and in the capacities and on the dates indicated.
| By: | /s/ Alan Goodson | |
| Alan Goodson | ||
| Principal Executive Officer of abrdn Funds | ||
Date: July 11, 2022
| By: | /s/ Andrea Melia | |
| Andrea Melia | ||
| Principal Financial Officer of abrdn Funds | ||
Date: July 11, 2022