UNITED STATES
SECURITIES AND EXCHANGE COMMISSION
Washington, D.C. 20549
FORM N-CSR
CERTIFIED SHAREHOLDER REPORT OF REGISTERED
MANAGEMENT INVESTMENT COMPANIES
Investment Company Act file number:
811-22175
ALPS ETF TRUST
(Exact name of registrant as specified in charter)
1290 Broadway, Suite 1000, Denver, Colorado 80203
(Address of principal executive offices) (Zip code)
Brendan Hamill, Esq., Secretary
ALPS ETF Trust
1290 Broadway, Suite 1000
Denver, Colorado 80203
(Name and address of agent for service)
Registrant’s Telephone Number, including Area Code: 877-398-8461
Date of fiscal year end: November 30
Date of reporting period: December 1, 2021 – May 31, 2022
| Item 1. | Report to Stockholders. |
| (a) |

Table of Contents
| Performance Overview | |
| Alerian MLP ETF | 1 |
| Alerian Energy Infrastructure ETF | 4 |
| Disclosure of Fund Expenses | 7 |
| Financial Statements | |
| Alerian MLP ETF | |
| Schedule of Investments | 8 |
| Statement of Assets and Liabilities | 9 |
| Statement of Operations | 10 |
| Statements of Changes in Net Assets | 11 |
| Financial Highlights | 12 |
| Alerian Energy Infrastructure ETF | |
| Schedule of Investments | 13 |
| Statement of Assets and Liabilities | 15 |
| Statement of Operations | 16 |
| Statements of Changes in Net Assets | 17 |
| Financial Highlights | 18 |
| Notes to Financial Statements | 19 |
| Additional Information | 30 |
| Liquidity Risk Management Program | 32 |
alpsfunds.com
Alerian MLP ETF
| Performance Overview | May 31, 2022 (Unaudited) |
INVESTMENT OBJECTIVE
The Alerian MLP ETF (the “Fund” or “AMLP”) seeks investment results that correspond (before fees and expenses) generally to the price and yield performance of its underlying index, the Alerian MLP Infrastructure Total Return Index (the “Underlying Index” or “AMZI”). The shares of the Fund are listed and trade on the NYSE Arca, Inc. (“NYSE”) under the ticker symbol AMLP. The Fund will normally invest at least 90% of its total assets in securities that comprise the Underlying Index.
The Underlying Index is a rules based, modified capitalization weighted, float-adjusted index intended to give investors a means of tracking the overall performance of the United States energy infrastructure Master Limited Partnership (“MLP”) asset class. The Underlying Index is comprised of energy infrastructure MLPs that earn a majority of their cash flow from the transportation, storage, and processing of energy commodities.
PERFORMANCE OVERVIEW
During the six-month period from December 1, 2021, to May 31, 2022, the Fund delivered a total return of 32.49% (32.25% NAV). This compares to the Fund’s Underlying Index which increased 27.99% on a price-return basis and 32.73% on a total-return basis.
During the period, Hess Midstream LP (HESM) was added to the Underlying Index during a quarterly rebalancing. Enable Midstream Partners (ENBL) and Phillips 66 Partners (PSXP) were removed from the Underlying Index in relation to their acquisition by another entity. There were no changes to the Underlying Index methodology during the period.
Distribution trends for AMZI constituents remain positive with many MLPs raising their payouts as they return excess cash flow to investors. Comparing the first quarter of 2022 with the first quarter of 2021, approximately 80% of the Underlying Index by weighting grew their distributions based on weightings as of May 6, 2022. Approximately 16% of the Underlying Index maintained their payouts. The first quarter of 2022 marked the third straight quarter of no distribution cuts among AMZI constituents.
Strong performance has complemented positive distribution trends in the space. Energy has been a bright spot in a challenging equity market as oil and natural gas prices have reached multi-year highs. The global reaction to Russia’s invasion of Ukraine has further tightened the oil market, with benchmark oil prices in the US up 73.27% from November 30, 2021 to May 31, 2022. US natural gas prices are also up 78.34% over that same period. The fee-based nature of energy infrastructure businesses limits the direct upside from higher commodity prices, but the positive shift in energy sentiment has benefitted the space. Additionally, higher prices incentivize growing oil and natural gas production from the US, which also benefits AMZI constituents as it creates more volumes to transport and process.
In addition to the macro tailwinds from a stronger energy environment, MLPs are also benefitting from company-level improvements. Namely, AMZI constituents are generating significant free cash flow. This excess cash flow is supporting distribution increases and equity repurchases. As of May 13, 2022, over 73% of the AMZI by weighting had a buyback program in place. Combined, AMZI constituents spent over $200 million on equity repurchases in the first quarter of 2022.
Looking ahead, energy infrastructure MLPs may benefit from continued strength in energy markets and may provide more defensive exposure should a pullback occur due to broader headwinds for the global economy. AMZI constituents remain well-positioned for today’s inflationary environment given their real asset exposure and contracts that typically include annual adjustments for inflation.
1 | May 31, 2022
Alerian MLP ETF
| Performance Overview | May 31, 2022 (Unaudited) |
Performance (as of May 31, 2022)
| 6 Months | 1 Year | 5 Year | 10 Year | Since Inception^ | |
| Alerian MLP ETF – NAV | 32.25% | 27.51% | 0.86% | 1.26% | 2.41% |
| Alerian MLP ETF – Market Price* | 32.49% | 27.48% | 0.87% | 1.27% | 2.43% |
| Alerian MLP Infrastructure Total Return Index | 32.73% | 28.55% | 1.67% | 2.59% | 4.43% |
| Alerian MLP Total Return Index | 32.43% | 27.52% | 2.62% | 2.60% | 4.26% |
Total Expense Ratio (per the current prospectus) is 0.87%.
Performance data quoted represents past performance. Past performance does not guarantee future results. Total return figures assume reinvestment of dividends, if any. The table does not reflect the deduction of taxes that a shareholder would pay on Fund distributions or the redemption of Fund shares. Investment return and principal value of an investment will fluctuate so that an investor’s shares, when sold or redeemed, may be worth more or less than the original cost. Current performance data may be higher or lower than actual data quoted. For the most current month-end performance data please visit www.alpsfunds.com or call 1.866.759.5679. The Fund accrues deferred income taxes for future tax liabilities associated with the portion of MLP distributions considered to be a tax-deferred return of capital and for any net operating gains as well as capital appreciation of its investment. This deferred tax liability is reflected in the daily NAV and as a result the fund's after-tax performance could differ significantly from the underlying assets even if the pre-tax performance is closely tracked.
NAV is an exchange-traded fund’s per-share value. The per-share dollar amount of the Fund is derived by dividing the total value of all the securities in its portfolio, less any liabilities, by the number of Fund shares outstanding. Market Price is the price at which a share can currently be traded in the market. Information detailing the number of days the Market Price of the Fund was greater than the Fund’s NAV and the number of days it was less than the Fund’s NAV can be obtained at www.alpsfunds.com.
| ^ | The Fund commenced Investment Operations on August 24, 2010 with an Inception Date, the first day of trading on the NYSE ARCA, of August 25, 2010. |
| * | Market Price means the official closing price of a share or, if it more accurately reflects the market value of a share at the time as of which the Fund calculates current net asset value per share, the price that is the midpoint of the bid-ask spread as of that time. It does not represent the returns an investor would receive if shares were traded at other times. |
The Alerian MLP Infrastructure Total Return Index is comprised of 15 midstream energy Master Limited Partnerships and provides investors with an unbiased benchmark for the infrastructure component of this emerging asset class. Total return assumes reinvestment of any dividends and distributions realized during a given time period.
The Alerian MLP Total Return Index is recognized as a leading gauge of energy infrastructure Master Limited Partnerships (MLPs). The capped, float-adjusted, capitalization-weighted index, whose constituents earn the majority of their cash flow from midstream activities involving energy commodities, is reported on a total-return basis (AMZX), which assumes reinvestment of any dividends and distributions realized during a given period.
The index is not actively managed and does not reflect any deductions for fees, expenses or taxes. One cannot invest directly in an index. Index performance does not reflect fund performance.
The Fund’s shares are not individually redeemable. Investors buy and sell shares of the Fund on a secondary market. Only market makers or “authorized participants” may trade directly with the Fund, typically in blocks of 25,000 shares.
The Alerian MLP ETF is not suitable for all investors. Investments in the Fund are subject to investment risks, including possible loss of the principal amount invested.
ALPS Portfolio Solutions Distributor, Inc., a FINRA member, is the distributor for the Fund.
2 | May 31, 2022
Alerian MLP ETF
| Performance Overview | May 31, 2022 (Unaudited) |
Top 10 Holdings* (as of May 31, 2022)
| Energy Transfer LP | 10.84% |
| Western Midstream Partners LP | 10.50% |
| Enterprise Products Partners LP | 10.29% |
| Magellan Midstream Partners LP | 9.93% |
| Plains All American Pipeline LP | 9.74% |
| MPLX LP | 9.29% |
| EnLink Midstream LLC | 8.16% |
| DCP Midstream LP | 7.20% |
| Cheniere Energy Partners LP | 4.81% |
| Crestwood Equity Partners LP | 4.62% |
| Total % of Top 10 Holdings | 85.38% |
| * | % of Total Investments |
Future holdings are subject to change.
Growth of $10,000 (as of May 31, 2022)
Comparison of change in value of a $10,000 investment in the Fund and the Indexes
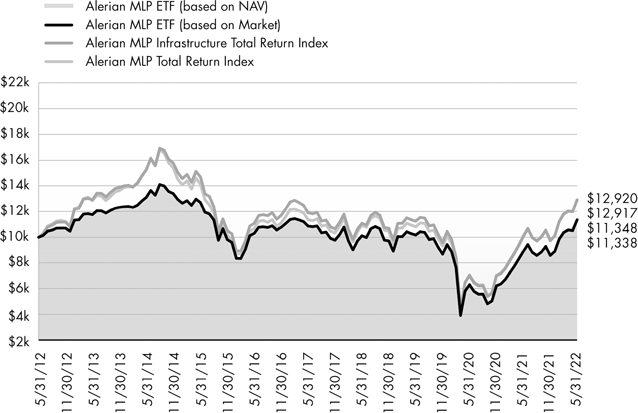
The chart above compares historical performance of a hypothetical investment of $10,000 in the Fund over the past ten years with the performance of the Fund’s benchmark index. Results include the reinvestment of all dividends and capital gains distributions. Past performance does not guarantee future results. The chart does not reflect the deduction of taxes that a shareholder would pay on Fund distributions or the redemption of Fund shares.
3 | May 31, 2022
Alerian Energy Infrastructure ETF
| Performance Overview | May 31, 2022 (Unaudited) |
INVESTMENT OBJECTIVE
The Alerian Energy Infrastructure ETF (the “Fund” or “ENFR”) seeks investment results that correspond (before fees and expenses) generally to the price and yield performance of its underlying index, the Alerian Midstream Energy Select Total Return Index (the “Underlying Index” or “AMEI”). As a secondary objective, the Fund seeks to provide total return through income and capital appreciation. The Shares of the Fund are listed and trade on the NYSE Arca, Inc. (“NYSE”) under the ticker symbol ENFR. The Fund will normally invest at least 90% of its total assets in securities that comprise the Underlying Index.
The Underlying Index is a composite of North American energy infrastructure companies engaged in midstream activities involving energy commodities, including gathering and processing, liquefaction, pipeline transportation, rail terminaling, and storage (also known as “midstream energy businesses”). Midstream energy companies include midstream MLPs and midstream corporations, either based in the United States or Canada. The Underlying Index has a 25% limit for companies taxed as pass-through entities.
PERFORMANCE OVERVIEW
During the six-month period from December 1, 2021, to May 31, 2022, the Fund delivered a total return of 28.37% (28.33% NAV). This compares to the Fund’s Underlying Index which increased 25.03% on a price-return basis and 28.79% on a total-return basis.
During the period, DT Midstream (DTM) was added to the Underlying Index and PBF Logistics LP (PBFX) was removed from the Underlying Index during quarterly rebalancings. BP Midstream Partners LP (BPMP), Enable Midstream Partners (ENBL), Oasis Midstream Partners (OMP), and Phillips 66 Partners (PSXP) were also removed from the Underlying Index in relation to their acquisition by another entity. There were no changes to the Underlying Index methodology during the period.
Dividend trends for AMEI constituents remain positive with many companies raising their payouts as they return excess cash flow to investors. Comparing the first quarter of 2022 with the first quarter of 2021, approximately 77% of the Underlying Index by weighting grew their dividends based on weightings from the end of April 2022. Approximately 21% of the Underlying Index maintained their payouts (2% of the Underlying Index does not pay a dividend and the one constituent that cut had a weight of 0.5%). The first quarter of 2022 marked the third straight quarter of no dividend cuts among AMEI constituents.
Strong performance has complemented positive dividend trends in the space. Energy has been a bright spot in a challenging equity market as oil and natural gas prices have reached multi-year highs. The global reaction to Russia’s invasion of Ukraine has further tightened the oil market, with benchmark oil prices in the US up 73.27% from November 30, 2021 to May 31, 2022. US natural gas prices are also up 78.34% over that same period. The fee-based nature of energy infrastructure businesses limits the direct upside from higher commodity prices, but the positive shift in energy sentiment has benefitted the space. Additionally, higher prices incentivize growing oil and natural gas production from the US and Canada, which also benefits AMEI constituents as it creates more volumes to transport and process.
In addition to the macro tailwinds from a stronger energy environment, energy infrastructure companies are also benefitting from company-level improvements. Namely, AMEI constituents are generating significant free cash flow. This excess cash flow is supporting dividend increases and buyback activity. As of May 13, 2022, 72% of the AMEI by weighting had a buyback program in place. Combined, AMEI constituents spent $370 million on buybacks in the first quarter of 2022.
Looking ahead, energy infrastructure may benefit from continued strength in energy markets and may provide more defensive exposure should a pullback occur due to broader headwinds for the global economy. AMEI constituents remain well-positioned for today’s inflationary environment given their real asset exposure and contracts that typically include annual adjustments for inflation.
4 | May 31, 2022
Alerian Energy Infrastructure ETF
| Performance Overview | May 31, 2022 (Unaudited) |
Performance (as of May 31, 2022)
| 6 Months | 1 Year | 5 Year | Since Inception^ | |
| Alerian Energy Infrastructure ETF - NAV | 28.33% | 29.74% | 6.33% | 3.74% |
| Alerian Energy Infrastructure ETF - Market Price* | 28.37% | 29.79% | 6.33% | 3.76% |
| Alerian Midstream Energy Select Total Return Index | 28.79% | 30.80% | 7.28% | 4.65% |
| Alerian MLP Total Return Index | 32.43% | 27.52% | 2.62% | -0.53% |
Total Expense Ratio (per the current prospectus) is 0.35%.
Performance data quoted represents past performance. Past performance does not guarantee future results. Total return figures assume reinvestment of dividends and capital gains distributions, if any. The table does not reflect the deduction of taxes that a shareholder would pay on Fund distributions or the redemption of Fund shares. Investment return and principal value of an investment will fluctuate so that an investor’s shares, when sold or redeemed, may be worth more or less than the original cost. Current performance data may be higher or lower than actual data quoted. For most current month-end performance data please visit www.alpsfunds.com or call 1.866.759.5679.
NAV is an exchange-traded fund’s per-share value. The per-share dollar amount of the Fund is derived by dividing the total value of all the securities in its portfolio, less any liabilities, by the number of Fund shares outstanding. Market Price is the price at which a share can currently be traded in the market. Information detailing the number of days the Market Price of the Fund was greater than the Fund’s NAV and the number of days it was less than the Fund’s NAV can be obtained at www.alpsfunds.com.
| ^ | The Fund commenced Investment Operations on November 1, 2013. |
| * | Market Price means the official closing price of a share or, if it more accurately reflects the market value of a share at the time as of which the Fund calculates current net asset value per share, the price that is the midpoint of the bid-ask spread as of that time. It does not represent the returns an investor would receive if shares were traded at other times. |
The Alerian Midstream Energy Select Total Return Index is comprised of 30 equity securities of issuers headquartered or incorporated in the United States and Canada that engage in the transportation, storage, and processing of energy commodities. Total return assumes reinvestment of any dividends and distributions realized during a given time period.
The Alerian MLP Total Return Index is recognized as a leading gauge of energy infrastructure Master Limited Partnerships (MLPs). The capped, float-adjusted, capitalization-weighted index, whose constituents earn the majority of their cash flow from midstream activities involving energy commodities, is reported on a total-return basis (AMZX), which assumes reinvestment of any dividends and distributions realized during a given period.
The index is not actively managed and does not reflect any deductions for fees, expenses or taxes. One cannot invest directly in an index. Index performance does not reflect fund performance.
The Fund’s shares are not individually redeemable. Investors buy and sell shares of the Fund on a secondary market. Only market makers or “authorized participants” may trade directly with the Fund, typically in blocks of 25,000 shares.
The Alerian Energy Infrastructure ETF is not suitable for all investors. Investments in the Fund are subject to investment risks, including possible loss of the principal amount invested.
ALPS Portfolio Solutions Distributor, Inc., a FINRA member, is the distributor for the Fund.
5 | May 31, 2022
Alerian Energy Infrastructure ETF
| Performance Overview | May 31, 2022 (Unaudited) |
Top 10 Holdings* (as of May 31, 2022)
| Enbridge, Inc. | 9.84% |
| Enterprise Products Partners LP | 8.28% |
| TC Energy Corp. | 7.11% |
| Energy Transfer LP | 6.42% |
| The Williams Cos., Inc. | 5.63% |
| Pembina Pipeline Corp. | 5.19% |
| Kinder Morgan, Inc. | 4.92% |
| Cheniere Energy, Inc. | 4.89% |
| Targa Resources Corp. | 4.85% |
| Plains GP Holdings LP, Class A | 4.73% |
| Total % of Top 10 Holdings | 61.86% |
| * | % of Total Investments |
Future holdings are subject to change.
Growth of $10,000 (as of May 31, 2022)
Comparison of change in value of a $10,000 investment in the Fund and the Indexes
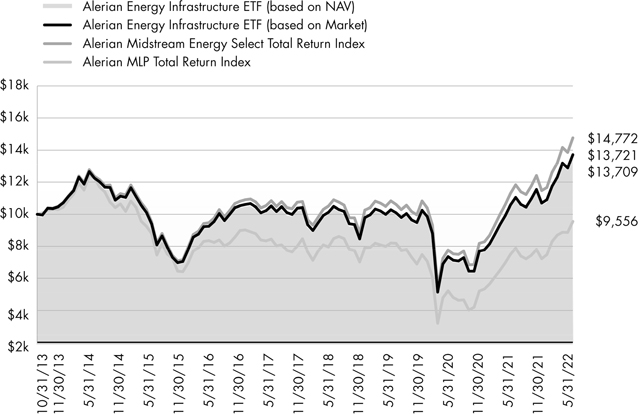
The chart above compares historical performance of a hypothetical investment of $10,000 in the Fund since inception with the performance of the Fund’s benchmark index. Results include the reinvestment of all dividends and capital gains distributions. Past performance does not guarantee future results. The chart does not reflect the deduction of taxes that a shareholder would pay on Fund distributions or the redemption of Fund shares.
6 | May 31, 2022
Alerian Exchange Traded Funds
| Disclosure of Fund Expenses | May 31, 2022 (Unaudited) |
Shareholder Expense Example: As a shareholder of a Fund, you incur certain ongoing costs, including management fees and other Fund expenses. These examples are intended to help you understand your ongoing costs (in dollars) of investing in the Fund and to compare these costs with the ongoing costs of investing in other funds. It is based on an investment of $1,000 invested at the beginning of the six month period and held through May 31, 2022.
Actual Return: The first line of the table provides information about actual account values and actual expenses. You may use the information in this line, together with the amount you invested, to estimate the expenses that you incurred over the period. Simply divide your account value by $1,000 (for example, an $8,600 account value divided by $1,000 = 8.6), then multiply the result by the number in the first line under the heading entitled “Expenses Paid During Period” to estimate the expenses attributable to your investment during this period.
Hypothetical 5% Return: The second line of the table provides information about hypothetical account values and hypothetical expenses based on the Fund’s actual expense ratio and an assumed rate of return of 5% per year before expenses, which is not the Fund’s actual return. The hypothetical account values and expenses may not be used to estimate the actual ending account balance or expenses you paid for the period. You may use this information to compare ongoing costs of investing in the Fund and other funds. To do so, compare this 5% hypothetical example with the 5% hypothetical examples that appear in the shareholder reports of other funds.
The expenses shown in the table are meant to highlight ongoing Fund costs only and do not reflect any transaction costs, such as brokerage commissions and other fees to financial intermediaries. Therefore, the second line is useful in comparing ongoing costs only, and will not help you determine the relative total costs of owning different funds. In addition, if these costs were included, your costs would have been higher.
| Beginning Account Value | Ending Account Value | Expense | Expenses Paid During Period | |
| 12/1/21 | 5/31/22 | Ratio(a) | 12/1/21 - 5/31/22(b) | |
| Alerian MLP ETF | ||||
| Actual | $1,000.00 | $1,322.50 | 0.85% | $4.92 |
| Hypothetical (5% return before expenses) | $1,000.00 | $1,020.69 | 0.85% | $4.28 |
| Alerian Energy Infrastructure ETF | ||||
| Actual | $1,000.00 | $1,283.30 | 0.35% | $1.99 |
| Hypothetical (5% return before expenses) | $1,000.00 | $1,023.19 | 0.35% | $1.77 |
| (a) | Annualized, based on the Fund's most recent fiscal half-year expenses. |
| (b) | Expenses are equal to the Fund's annualized expense ratio multiplied by the average account value over the period, multiplied by the number of days in the most recent fiscal half year (182), divided by 365. |
See Notes to Financial Statements.
7 | May 31, 2022
Alerian MLP ETF
| Schedule of Investments | May 31, 2022 (Unaudited) |
| Security Description | Shares | Value | ||||||
| MASTER LIMITED PARTNERSHIPS (100.03%) | ||||||||
| Gathering + Processing (32.84%) | ||||||||
| Crestwood Equity Partners LP(a) | 10,929,214 | $ | 318,477,296 | |||||
| DCP Midstream LP(a) | 13,821,844 | 496,342,418 | ||||||
| EnLink Midstream LLC(a) | 49,363,360 | 562,742,304 | ||||||
| Hess Midstream LP | 4,974,410 | 162,116,022 | ||||||
| Western Midstream Partners LP(a) | 26,193,606 | 724,253,206 | ||||||
| Total Gathering + Processing | 2,263,931,246 | |||||||
| Liquefaction (4.81%) | ||||||||
| Cheniere Energy Partners LP | 6,166,638 | 331,580,125 | ||||||
| Pipeline Transportation | Natural Gas (21.13%) | ||||||||
| Energy Transfer LP | 64,099,296 | 747,397,791 | ||||||
| Enterprise Products Partners LP | 25,875,657 | 709,510,515 | ||||||
| Total Pipeline Transportation | Natural Gas | 1,456,908,306 | |||||||
| Pipeline Transportation | Petroleum (41.25%) | ||||||||
| Genesis Energy LP(a) | 16,621,970 | 203,452,913 | ||||||
| Holly Energy Partners LP(a) | 6,971,450 | 132,457,550 | ||||||
| Magellan Midstream Partners LP(a) | 13,243,776 | 684,703,219 | ||||||
| MPLX LP | 19,437,222 | 640,456,465 | ||||||
| NuStar Energy LP(a) | 15,179,220 | 243,626,481 | ||||||
| Plains All American Pipeline LP(a) | 59,005,821 | 672,076,301 | ||||||
| Shell Midstream Partners LP | 18,915,818 | 267,469,667 | ||||||
| Total Pipeline Transportation | Petroleum | 2,844,242,596 | |||||||
| TOTAL MASTER LIMITED PARTNERSHIPS | ||||||||
| (Cost $3,939,942,985) | 6,896,662,273 | |||||||
| 7 Day Yield | Shares | Value | ||||||||||
| SHORT TERM INVESTMENTS (0.01%) | ||||||||||||
State Street Institutional | 0.75 | % | 490,936 | 490,936 | ||||||||
| TOTAL SHORT TERM INVESTMENTS | ||||||||||||
| (Cost $490,936) | 490,936 | |||||||||||
| TOTAL INVESTMENTS (100.04%) | ||||||||||||
| (Cost $3,940,433,921) | $ | 6,897,153,209 | ||||||||||
| LIABILITIES IN EXCESS OF OTHER ASSETS (-0.04%) | (3,087,962 | ) | ||||||||||
| NET ASSETS - 100.00% | $ | 6,894,065,247 | ||||||||||
| (a) | Affiliated Company. See Note 8 in Notes to Financial Statement. |
See Notes to Financial Statements.
8 | May 31, 2022
Alerian MLP ETF
| Statement of Assets and Liabilities | May 31, 2022 (Unaudited) |
| ASSETS: | ||||
| Investments, at value | $ | 2,859,021,521 | ||
| Investments in affiliates, at value | 4,038,131,688 | |||
| Receivable for investments sold | 1,448 | |||
| Receivable for shares sold | 50,396,258 | |||
| Deferred tax asset (Note 2) | – | (a) | ||
| Income tax receivable | 1,229,058 | |||
| Franchise tax receivable | 394,417 | |||
| Total Assets | 6,949,174,390 | |||
| LIABILITIES: | ||||
| Payable for investments purchased | 50,398,882 | |||
| Payable to adviser | 4,710,261 | |||
| Total Liabilities | 55,109,143 | |||
| NET ASSETS | $ | 6,894,065,247 | ||
| NET ASSETS CONSIST OF: | ||||
| Paid-in capital | $ | 8,559,589,927 | ||
| Distributable earnings | (1,665,524,680 | ) | ||
| NET ASSETS | $ | 6,894,065,247 | ||
| INVESTMENTS, AT COST | $ | 1,639,717,256 | ||
| INVESTMENTS IN AFFILIATES, AT COST | 2,300,716,665 | |||
| PRICING OF SHARES | ||||
| Net Assets | $ | 6,894,065,247 | ||
| Shares of beneficial interest outstanding (Unlimited number of shares authorized, par value $0.01 per share) | 171,232,420 | |||
| Net Asset Value, offering and redemption price per share | $ | 40.26 | ||
| (a) | Net Deferred Tax Asset of $104,186,106 is offset 100% by Valuation Allowance. |
See Notes to Financial Statements.
9 | May 31, 2022
Alerian MLP ETF
| Statement of Operations | For the Six Months Ended May 31, 2022 (Unaudited) |
| INVESTMENT INCOME: | ||||
| Distributions from master limited partnerships | $ | 227,228,768 | ||
| Less return of capital distributions | (227,228,768 | ) | ||
| Total Investment Income | – | |||
| EXPENSES: | ||||
| Investment adviser fee | 25,489,241 | |||
| Total Expenses | 25,489,241 | |||
| NET INVESTMENT LOSS, BEFORE INCOME TAXES | (25,489,241 | ) | ||
| Current income tax benefit/(expense) | – | |||
| NET INVESTMENT LOSS | (25,489,241 | ) | ||
| REALIZED AND UNREALIZED GAIN/(LOSS): | ||||
| Net realized gain on investments, before income taxes | 80,609,405 | |||
| Net realized loss on affiliated investments, before income taxes | (93,531,033 | ) | ||
| Current income tax benefit/(expense) | – | |||
| Net realized loss | (12,921,628 | ) | ||
| Net change in unrealized appreciation on investments, before income taxes | 617,472,714 | |||
| Net change in unrealized appreciation on affiliated investments, before income taxes | 1,029,035,909 | |||
| Current income tax benefit/(expense) | – | |||
| Net change in unrealized appreciation | 1,646,508,623 | |||
| NET REALIZED AND UNREALIZED GAIN ON INVESTMENTS | 1,633,586,995 | |||
| NET INCREASE IN NET ASSETS RESULTING FROM OPERATIONS | $ | 1,608,097,754 | ||
See Notes to Financial Statements.
10 | May 31, 2022
Alerian MLP ETF
| Statements of Changes in Net Assets |
| | | For the Six Months Ended May 31, 2022 (Unaudited) | | | For the Year Ended November 30, 2021 | | ||
| OPERATIONS: | ||||||||
| Net investment loss | $ | (25,489,241 | ) | $ | (43,507,191 | ) | ||
| Net realized loss | (12,921,628 | ) | (451,685,458 | ) | ||||
| Net change in unrealized appreciation | 1,646,508,623 | 1,975,726,648 | ||||||
| Net increase in net assets resulting from operations | 1,608,097,754 | 1,480,533,999 | ||||||
| DISTRIBUTIONS TO SHAREHOLDERS: | ||||||||
| From tax return of capital | (243,051,185 | ) | (444,037,776 | ) | ||||
| Total distributions | (243,051,185 | ) | (444,037,776 | ) | ||||
| CAPITAL SHARE TRANSACTIONS: | ||||||||
| Proceeds from sale of shares | 1,510,267,631 | 1,051,399,959 | ||||||
| Cost of shares redeemed | (961,424,243 | ) | (987,858,170 | ) | ||||
| Net increase from share transactions | 548,843,388 | 63,541,789 | ||||||
| Net increase in net assets | 1,913,889,957 | 1,100,038,012 | ||||||
| NET ASSETS: | ||||||||
| Beginning of period | 4,980,175,290 | 3,880,137,278 | ||||||
| End of period | $ | 6,894,065,247 | $ | 4,980,175,290 | ||||
| OTHER INFORMATION: | ||||||||
| SHARE TRANSACTIONS: | ||||||||
| Beginning shares | 157,457,420 | 155,057,420 | ||||||
| Shares sold | 40,425,000 | 33,250,000 | ||||||
| Shares redeemed | (26,650,000 | ) | (30,850,000 | ) | ||||
| Shares outstanding, end of year | 171,232,420 | 157,457,420 | ||||||
See Notes to Financial Statements.
11 | May 31, 2022
Alerian MLP ETF
| Financial Highlights | For a Share Outstanding Throughout the Periods Presented |
| For the Six Months Ended May 31, 2022 (Unaudited) | For the Year Ended November 30, 2021 | For the Year Ended November 30, 2020 (a) | For the Year Ended November 30, 2019 (a) | For the Year Ended November 30, 2018 (a) | For the Year Ended November 30, 2017 (a) | |||||||||||||||||||
| NET ASSET VALUE, BEGINNING OF PERIOD | $ | 31.63 | $ | 25.02 | $ | 39.15 | $ | 47.75 | $ | 51.85 | $ | 61.55 | ||||||||||||
| INCOME/(LOSS) FROM OPERATIONS: | ||||||||||||||||||||||||
| Net investment loss(b) | (0.15 | ) | (0.27 | ) | (0.24 | ) | (0.35 | ) | (0.45 | ) | (1.10 | ) | ||||||||||||
| Net realized and unrealized gain/(loss) on investments | 10.22 | 9.68 | (10.73 | ) | (4.35 | ) | 0.40 | (4.30 | ) | |||||||||||||||
| Total from investment operations | 10.07 | 9.41 | (10.97 | ) | (4.70 | ) | (0.05 | ) | (5.40 | ) | ||||||||||||||
| DISTRIBUTIONS: | ||||||||||||||||||||||||
| From net realized gains | – | – | – | – | (4.05 | ) | – | |||||||||||||||||
| From tax return of capital | (1.44 | ) | (2.80 | ) | (3.16 | ) | (3.90 | ) | – | (4.30 | ) | |||||||||||||
| Total distributions | (1.44 | ) | (2.80 | ) | (3.16 | ) | (3.90 | ) | (4.05 | ) | (4.30 | ) | ||||||||||||
| NET INCREASE/(DECREASE) IN NET ASSET VALUE | 8.63 | 6.61 | (14.13 | ) | (8.60 | ) | (4.10 | ) | (9.70 | ) | ||||||||||||||
| NET ASSET VALUE, END OF PERIOD | $ | 40.26 | $ | 31.63 | $ | 25.02 | $ | 39.15 | $ | 47.75 | $ | 51.85 | ||||||||||||
| TOTAL RETURN(c) | 32.25 | % | 37.97 | % | (28.36 | )% | (10.79 | )% | (0.55 | )% | (9.27 | )% | ||||||||||||
| RATIOS/SUPPLEMENTAL DATA: | ||||||||||||||||||||||||
| Net assets, end of period (000s) | $ | 6,894,065 | $ | 4,980,175 | $ | 3,880,137 | $ | 7,249,005 | $ | 8,699,748 | $ | 9,405,284 | ||||||||||||
| RATIO TO AVERAGE NET ASSETS: | ||||||||||||||||||||||||
| Expenses (excluding net current and deferred tax expenses/benefits and franchise tax expense) | 0.85 | %(d) | 0.85 | % | 0.85 | % | 0.85 | % | 0.85 | % | 0.85 | % | ||||||||||||
| Expenses (including net current and deferred tax expenses/benefits)(e) | 0.85 | %(d) | 0.87 | % | 0.90 | % | 0.87 | % | 0.85 | % | 0.41 | % | ||||||||||||
| Expenses (including current and deferred tax expenses/benefits)(f) | 0.85 | %(d) | 0.85 | % | 0.85 | % | 0.85 | % | 0.85 | % | 1.81 | % | ||||||||||||
| Net investment loss (excluding deferred tax expenses/benefits and franchise tax expense) | (0.85 | )%(d) | (0.85 | )% | (0.85 | )% | (0.77 | )% | (0.85 | )% | (0.85 | )% | ||||||||||||
| Net investment income/(loss)(including deferred tax expenses/benefits)(f) | (0.85 | )%(d) | (0.85 | )% | (0.85 | )% | (0.77 | )% | (0.85 | )% | (1.81 | )% | ||||||||||||
| PORTFOLIO TURNOVER RATE(g) | 17 | % | 20 | % | 23 | % | 34 | % | 26 | % | 23 | % | ||||||||||||
| (a) | On May 18, 2020, the Alerian MLP ETF underwent a one for five reverse stock split. The capital share activity presented here has been retroactively adjusted to reflect this reverse split. |
| (b) | Based on average shares outstanding during the period. |
| (c) | Total return is calculated assuming an initial investment made at the net assets value at the beginning of the period and redemption at the net asset value on the last day of the period and assuming all distributions are reinvested at actual reinvestment prices. Total return calculated for a period of less than one year is not annualized. |
| (d) | Annualized. |
| (e) | Includes amount of current and deferred taxes/benefits for all components of the Statement of Operations. |
| (f) | Includes amount of current and deferred tax benefit associated with net investment income/(loss). |
| (g) | Portfolio turnover for periods less than one year is not annualized and does not include securities received or delivered from processing creations or redemptions in-kind. |
See Notes to Financial Statements.
12 | May 31, 2022
Alerian Energy Infrastructure ETF
| Schedule of Investments | May 31, 2022 (Unaudited) |
| Security Description | Shares | Value | ||||||
| CANADIAN ENERGY INFRASTRUCTURE COMPANIES (28.99%) | ||||||||
| Gathering + Processing (4.51%) | ||||||||
| Keyera Corp. | 194,833 | $ | 5,192,569 | |||||
| Pipeline Transportation | Natural Gas | ||||||||
| (7.10%) | ||||||||
| TC Energy Corp. | 141,077 | 8,165,591 | ||||||
| Pipeline Transportation | Petroleum | ||||||||
| (15.00%) | ||||||||
| Enbridge, Inc. | 244,737 | 11,305,675 | ||||||
| Pembina Pipeline Corp. | 147,748 | 5,957,345 | ||||||
| Total Pipeline Transportation | Petroleum | 17,263,020 | |||||||
| Storage (2.38%) | ||||||||
| Gibson Energy, Inc. | 129,092 | 2,734,217 | ||||||
| TOTAL CANADIAN ENERGY INFRASTRUCTURE COMPANIES | ||||||||
| (Cost $26,714,424) | 33,355,397 |
| Security Description | Shares | Value | ||||||
| EXCHANGE TRADED FUND (0.29%) | ||||||||
| Exchange Traded Fund (0.29%) | ||||||||
| Energy Select Sector SPDR | ||||||||
| Fund | 3,800 | 331,360 | ||||||
| TOTAL EXCHANGE TRADED FUND | ||||||||
| (Cost $331,388) | 331,360 |
| Security Description | Shares | Value | ||||||
| U.S. ENERGY INFRASTRUCTURE COMPANIES (28.76%) | ||||||||
| Gathering + Processing (10.21%) | ||||||||
| Kinetik Holdings, Inc. | 10,362 | 870,823 | ||||||
| ONEOK, Inc. | 80,518 | 5,302,110 | ||||||
| Targa Resources Corp. | 77,405 | 5,574,708 | ||||||
| Total Gathering + Processing | 11,747,641 | |||||||
| Liquefaction (6.43%) | ||||||||
| Cheniere Energy, Inc. | 41,040 | 5,613,041 | ||||||
| Tellurian, Inc.(a) | 374,559 | 1,786,646 | ||||||
| Total Liquefaction | 7,399,687 | |||||||
| Pipeline Transportation | Natural Gas | ||||||||
| (11.90%) | ||||||||
| DT Midstream, Inc. | 85,648 | 4,976,149 | ||||||
| Equitrans Midstream Corp. | 388,980 | 3,061,272 | ||||||
| Kinder Morgan, Inc. | 287,236 | 5,655,677 | ||||||
| Total Pipeline Transportation | Natural | ||||||||
| Gas | 13,693,098 |
| Security Description | Shares | Value | ||||||
| Storage (0.22%) | ||||||||
| Macquarie Infrastructure | ||||||||
| Holdings LLC | 65,220 | $ | 249,141 | |||||
| TOTAL U.S. ENERGY INFRASTRUCTURE COMPANIES | ||||||||
| (Cost $27,062,215) | 33,089,567 | |||||||
| Security Description | Shares | Value | ||||||
| U.S. ENERGY INFRASTRUCTURE MLPS (25.95%) | ||||||||
| Gathering + Processing (6.72%) | ||||||||
| Crestwood Equity Partners LP | 22,786 | 663,984 | ||||||
| Hess Midstream LP, Class A | 28,806 | 938,787 | ||||||
| MPLX LP | 114,143 | 3,761,012 | ||||||
| Rattler Midstream LP | 33,354 | 570,020 | ||||||
| Western Midstream Partners LP | | | 64,768 | | | | 1,790,835 | |
| Total Gathering + Processing | 7,724,638 | |||||||
| Pipeline Transportation | Natural Gas | ||||||||
| (14.68%) | ||||||||
| Energy Transfer LP | 632,767 | 7,378,063 | ||||||
| Enterprise Products Partners LP | | | 346,844 | | | | 9,510,463 | |
| Total Pipeline Transportation | Natural | ||||||||
| Gas | 16,888,526 | |||||||
| Pipeline Transportation | Petroleum | ||||||||
| (4.55%) | ||||||||
| Genesis Energy LP | 34,704 | 424,777 | ||||||
| Holly Energy Partners LP | 14,411 | 273,809 | ||||||
| Magellan Midstream Partners LP | | | 65,727 | | | | 3,398,086 | |
| NGL Energy Partners LP(a) | 39,592 | 74,037 | ||||||
| NuStar Energy LP | 31,688 | 508,592 | ||||||
| Shell Midstream Partners LP | 39,513 | 558,714 | ||||||
| Total Pipeline Transportation | | ||||||||
| Petroleum | 5,238,015 | |||||||
| TOTAL U.S. ENERGY INFRASTRUCTURE MLPS | ||||||||
| (Cost $27,431,911) | 29,851,179 | |||||||
| Security Description | Shares | Value | ||||||
| U.S. GENERAL PARTNERS (15.86%) | ||||||||
| Gathering + Processing (11.14%) | ||||||||
| Antero Midstream Corp. | 283,733 | 3,081,340 | ||||||
| EnLink Midstream LLC | 285,939 | 3,259,705 | ||||||
| The Williams Cos., Inc. | 174,651 | 6,472,566 | ||||||
| Total Gathering + Processing | 12,813,611 | |||||||
| Pipeline Transportation | Petroleum | ||||||||
| (4.72%) | ||||||||
| Plains GP Holdings LP, Class A | 454,042 | 5,430,342 | ||||||
| TOTAL U.S. GENERAL PARTNERS | ||||||||
| (Cost $14,488,222) | 18,243,953 | |||||||
See Notes to Financial Statements.
13 | May 31, 2022
| Alerian Energy Infrastructure ETF | |
| Schedule of Investments | May 31, 2022 (Unaudited) |
| 7 Day Yield | Shares | Value | ||||||||||
| SHORT TERM INVESTMENTS (0.01%) | ||||||||||||
| Money Market Fund | ||||||||||||
| State Street Institutional Treasury Plus Money Market Fund | 0.75 | % | 11,090 | $ | 11,090 | |||||||
| TOTAL SHORT TERM INVESTMENTS | ||||||||||||
| (Cost $11,090) | 11,090 | |||||||||||
| TOTAL INVESTMENTS (99.86%) | ||||||||||||
| (Cost $96,039,250) | $ | 114,882,546 | ||||||||||
| OTHER ASSETS IN EXCESS OF LIABILITIES (0.14%) | 158,442 | |||||||||||
| NET ASSETS - 100.00% | $ | 115,040,988 | ||||||||||
| (a) | Non-income producing security. |
See Notes to Financial Statements.
14 | May 31, 2022
| Alerian Energy Infrastructure ETF | |
| Statement of Assets and Liabilities | May 31, 2022 (Unaudited) |
| ASSETS: | ||||
| Investments, at value | $114,882,546 | |||
| Receivable for investments sold | 853,174 | |||
| Receivable for shares sold | 1,743,047 | |||
| Dividends receivable | 173,525 | |||
| Total Assets | 117,652,292 | |||
| LIABILITIES: | ||||
| Payable for investments purchased | 2,580,223 | |||
| Payable to adviser | 31,081 | |||
| Total Liabilities | 2,611,304 | |||
| NET ASSETS | $ | 115,040,988 | ||
| NET ASSETS CONSIST OF: | ||||
| Paid-in capital | $ | 105,025,867 | ||
| Distributable earnings | 10,015,121 | |||
| NET ASSETS | $ | 115,040,988 | ||
| INVESTMENTS, AT COST | $ | 96,039,250 | ||
| PRICING OF SHARES | ||||
| Net Assets | $ | 115,040,988 | ||
| Shares of beneficial interest outstanding (Unlimited number of shares authorized, par value $0.01 per share) | 4,950,000 | |||
| Net Asset Value, offering and redemption price per share | $ | 23.24 | ||
See Notes to Financial Statements.
15 | May 31, 2022
| Alerian Energy Infrastructure ETF | |
| Statement of Operations | For the Six Months Ended May 31, 2022 (Unaudited) |
| INVESTMENT INCOME: | ||||
| Dividends* | $ | 2,426,458 | ||
| Securities lending income | 717 | |||
| Total Investment Income | 2,427,175 | |||
| EXPENSES: | ||||
| Investment adviser fees | 146,283 | |||
| Total Expenses | 146,283 | |||
| NET INVESTMENT INCOME | 2,280,892 | |||
| REALIZED AND UNREALIZED GAIN/(LOSS): | ||||
| Net realized loss on investments(a) | (2,808,640 | ) | ||
| Net realized loss on foreign currency transactions | (8,560 | ) | ||
| Net realized loss | (2,817,200 | ) | ||
| Net change in unrealized appreciation on investments | 21,082,116 | |||
| Net change in unrealized appreciation on translation of assets and liabilities denominated in foreign currencies | 6,482 | |||
| Net change in unrealized appreciation | 21,088,598 | |||
| NET REALIZED AND UNREALIZED GAIN ON INVESTMENTS AND FOREIGN CURRENCIES | 18,271,398 | |||
| NET INCREASE IN NET ASSETS RESULTING FROM OPERATIONS | $ | 20,552,290 | ||
| * Net of foreign tax withholding. | $ | 110,323 | ||
| (a) | Includes realized gain or loss as a result of in-kind transactions (See Note 4 in Notes to Financial Statements). |
See Notes to Financial Statements.
16 | May 31, 2022
Alerian Energy Infrastructure ETF |
| Statements of Changes in Net Assets |
| For the Six Months Ended May 31, 2022 (Unaudited) | For the Year Ended November 30, 2021 | |||||||
| OPERATIONS: | ||||||||
| Net investment income | $ | 2,280,892 | $ | 3,334,283 | ||||
| Net realized loss | (2,817,200 | ) | (5,679,007 | ) | ||||
| Net change in unrealized appreciation | 21,088,598 | 18,196,470 | ||||||
| Net increase in net assets resulting from operations | 20,552,290 | 15,851,746 | ||||||
| DISTRIBUTIONS: | ||||||||
| From distributable earnings | (2,389,869 | ) | (2,301,342 | ) | ||||
| From tax return of capital | – | (2,346,411 | ) | |||||
| Total distributions | (2,389,869 | ) | (4,647,753 | ) | ||||
| CAPITAL SHARE TRANSACTIONS: | ||||||||
| Proceeds from sale of shares | 37,391,721 | 22,119,720 | ||||||
| Cost of shares redeemed | – | (10,825,316 | ) | |||||
| Net increase from share transactions | 37,391,721 | 11,294,404 | ||||||
| Net increase in net assets | 55,554,142 | 22,498,397 | ||||||
| NET ASSETS: | ||||||||
| Beginning of year | 59,486,846 | 36,988,449 | ||||||
| End of year | $ | 115,040,988 | $ | 59,486,846 | ||||
| OTHER INFORMATION: | ||||||||
| CAPITAL SHARE TRANSACTIONS: | ||||||||
| Beginning shares | 3,200,000 | 2,550,000 | ||||||
| Shares sold | 1,750,000 | 1,250,000 | ||||||
| Shares redeemed | – | (600,000 | ) | |||||
| Shares outstanding, end of year | 4,950,000 | 3,200,000 | ||||||
See Notes to Financial Statements.
17 | May 31, 2022
| Alerian Energy Infrastructure ETF | |
| Financial Highlights | For a Share Outstanding Throughout the Periods Presented |
| For the Six Months Ended May 31, 2022 (Unaudited) | For the Year Ended November 30, 2021 | For the Year Ended November 30, 2020 | For the Year Ended November 30, 2019 | For the Year Ended November 30, 2018 | For the Year Ended November 30, 2017 | |||||||||||||||||||
| NET ASSET VALUE, BEGINNING OF PERIOD | $ | 18.59 | $ | 14.51 | $ | 19.19 | $ | 20.34 | $ | 22.30 | $ | 22.95 | ||||||||||||
| INCOME/(LOSS) FROM INVESTMENT OPERATIONS: | ||||||||||||||||||||||||
| Net investment income(a) | 0.58 | 1.08 | 0.90 | 0.88 | 0.85 | 0.79 | ||||||||||||||||||
| Net realized and unrealized gain/(loss) on investments | 4.63 | 4.49 | (4.50 | ) | (0.64 | ) | (2.23 | ) | (0.72 | ) | ||||||||||||||
| Total from investment operations | 5.21 | 5.57 | (3.60 | ) | 0.24 | (1.38 | ) | 0.07 | ||||||||||||||||
| DISTRIBUTIONS: | ||||||||||||||||||||||||
| From net investment income | (0.56 | ) | (0.74 | ) | (0.45 | ) | (0.50 | ) | (0.47 | ) | (0.47 | ) | ||||||||||||
| Tax return of capital | – | (0.75 | ) | (0.63 | ) | (0.89 | ) | (0.11 | ) | (0.25 | ) | |||||||||||||
| Total distributions | (0.56 | ) | (1.49 | ) | (1.08 | ) | (1.39 | ) | (0.58 | ) | (0.72 | ) | ||||||||||||
| NET INCREASE/(DECREASE) IN NET | ||||||||||||||||||||||||
| ASSET VALUE | 4.65 | 4.08 | (4.68 | ) | (1.15 | ) | (1.96 | ) | (0.65 | ) | ||||||||||||||
| NET ASSET VALUE, END OF PERIOD | $ | 23.24 | $ | 18.59 | $ | 14.51 | $ | 19.19 | $ | 20.34 | $ | 22.30 | ||||||||||||
| TOTAL RETURN(b) | 28.33 | % | 38.93 | % | (18.82 | )% | 1.09 | % | (6.27 | )% | 0.21 | % | ||||||||||||
| RATIOS/SUPPLEMENTAL DATA: | ||||||||||||||||||||||||
| Net assets, end of period (000s) | $ | 115,041 | $ | 59,487 | $ | 36,988 | $ | 51,809 | $ | 41,699 | $ | 42,370 | ||||||||||||
| Ratio of expenses to average net assets | 0.35 | %(c) | 0.51 | %(d) | 0.65 | % | 0.65 | % | 0.65 | % | 0.65 | % | ||||||||||||
| Ratio of net investment income to average net assets | 5.46 | %(c) | 5.84 | % | 5.91 | % | 4.23 | % | 3.86 | % | 3.39 | % | ||||||||||||
| PORTFOLIO TURNOVER RATE(e) | 17 | % | 34 | % | 34 | % | 26 | % | 73 | % | 37 | % | ||||||||||||
| (a) | Based on average shares outstanding during the period. |
| (b) | Total return is calculated assuming an initial investment made at the net assets value at the beginning of the period and redemption at the net asset value on the last day of the period and assuming all distributions are reinvested at actual reinvestment prices. Total return calculated for a period of less than one year is not annualized. |
| (c) | Annualized. |
| (d) | Effective July 1, 2021, the Fund's Advisory Fee changed from 0.65% to 0.35%. |
| (e) | Portfolio turnover for periods less than one year is not annualized and does not include securities received or delivered from processing creations or redemptions in-kind. |
See Notes to Financial Statements.
18 | May 31, 2022
| Alerian Exchange Traded Funds | |
| Notes to Financial Statements | May 31, 2022 (Unaudited) |
1. ORGANIZATION
ALPS ETF Trust (the “Trust”), a Delaware statutory trust, is an open-end management investment company registered under the Investment Company Act of 1940, as amended (the “1940 Act”). As of May 31, 2022, the Trust consisted of nineteen separate portfolios. Each portfolio represents a separate series of the Trust. This report pertains to the Alerian MLP ETF and the Alerian Energy Infrastructure ETF (each a “Fund” and collectively, the “Funds”).
The investment objective of the Alerian MLP ETF is to seek investment results that correspond (before fees and expenses) generally to the price and yield performance of its underlying index, the Alerian MLP Infrastructure Total Return Index. The investment objective of the Alerian Energy Infrastructure ETF is to seek investment results that correspond (before fees and expenses) generally to the price and yield performance of its underlying index, the Alerian Midstream Energy Select Total Return Index. The investment advisor uses a “passive management” or indexing investment approach to try to achieve each Fund’s investment objective. Each Fund is considered non-diversified and may invest a greater portion of assets in securities of individual issuers than a diversified fund. As a result, changes in the market value of a single investment could cause greater fluctuations in share price than would occur in a diversified fund.
Each Fund’s Shares (“Shares”) are listed on the NYSE Arca, Inc. (“the NYSE Arca”). Each Fund issues and redeems Shares at net asset value (“NAV”), in blocks of 25,000 Shares, each of which is called a “Creation Unit”. Creation Units are issued and redeemed principally in-kind for securities included in the Underlying Index. Except when aggregated in Creation Units, Shares are not redeemable securities of the Fund. On October, 1, 2021, Alerian Energy Infrastructure ETF reduced its Creation Unit size from 50,000 to 25,000 shares.
Pursuant to the Trust’s organizational documents, its Officers and Trustees are indemnified against certain liability arising out of the performance of their duties to the Trust. Additionally, in the normal course of business, the Trust enters into contracts with service providers that contain general indemnification clauses. The Trust’s maximum exposure under these arrangements is unknown, as this would involve future claims that may be made against the Trust that have not yet occurred.
2. SIGNIFICANT ACCOUNTING POLICIES
The following is a summary of significant accounting policies consistently followed by the Funds in the preparation of the financial statements. The accompanying financial statements were prepared in accordance with accounting principles generally accepted in the United States of America (“U.S. GAAP”). The preparation of financial statements in conformity with U.S. GAAP requires management to make certain estimates and assumptions that affect the reported amounts of assets and liabilities and disclosures of contingent assets and liabilities at the date of the financial statements and the reported amounts of revenue and expenses during the period. Actual results could differ from those estimates. Each Fund is considered an investment company under U.S. GAAP and follows the accounting and reporting guidance applicable to investment companies in the Financial Accounting Standards Board (“FASB”) Accounting Standards Codification Topic 946.
A. Portfolio Valuation
Each Fund’s NAV is determined daily, as of the close of regular trading on the New York Stock Exchange (“NYSE”), normally 4:00 p.m. Eastern Time, on each day the NYSE is open for trading. The NAV is computed by dividing the value of all assets of the Fund (including accrued interest and dividends), less all liabilities (including accrued expenses and dividends declared but unpaid), by the total number of shares outstanding.
Portfolio securities listed on any exchange other than the NASDAQ Stock Market LLC (“NASDAQ”) are valued at the last sale price on the business day as of which such value is being determined. If there has been no sale on such day, the securities are valued at the mean of the most recent bid and ask prices on such day. Securities traded on the NASDAQ are valued at the NASDAQ Official Closing Price as determined by NASDAQ. Portfolio securities traded on more than one securities exchange are valued at the last sale price on the business day as of which such value is being determined at the close of the exchange representing the principal market for such securities. Portfolio securities traded in the over-the-counter market, but excluding securities traded on the NASDAQ, are valued at the latest quoted sale price in such market.
19 | May 31, 2022
| Alerian Exchange Traded Funds | |
| Notes to Financial Statements | May 31, 2022 (Unaudited) |
The Funds’ investments are valued at market value or, in the absence of market value with respect to any portfolio securities, at fair value according to procedures adopted by the Trust’s Board of Trustees (the “Board”). When market quotations are not readily available or when events occur that make established valuation methods unreliable, securities of the Funds may be valued in good faith by or under the direction of the Board. These securities generally include, but are not limited to, restricted securities (securities which may not be publicly sold without registration under the Securities Act of 1933) for which a pricing service is unable to provide a market price; securities whose trading has been formally suspended; a security whose market price is not available from a pre-established primary pricing source or the pricing source is not willing to provide a price; a security with respect to which an event has occurred that is most likely to materially affect the value of the security after the market has closed but before the calculation of the Funds’ NAV or make it difficult or impossible to obtain a reliable market quotation; or a security whose price, as provided by the pricing service, does not reflect the security’s “fair value” due to the security being de-listed from a national exchange or the security’s primary trading market is temporarily closed at a time when, under normal conditions, it would be open. As a general principle, the current “fair value” of a security would be the amount which the owner might reasonably expect to receive from the sale on the applicable exchange or principal market. A variety of factors may be considered in determining the fair value of such securities.
B. Fair Value Measurements
Each Fund discloses the classification of its fair value measurements following a three-tier hierarchy based on the inputs used to measure fair value. Inputs refer broadly to the assumptions that market participants would use in pricing the asset or liability, including assumptions about risk. Inputs may be observable or unobservable. Observable inputs reflect the assumptions market participants would use in pricing the asset or liability that are developed based on market data obtained from sources independent of the reporting entity. Unobservable inputs reflect the reporting entity’s own assumptions about the assumptions market participants would use in pricing the asset or liability that are developed based on the best information available.
Valuation techniques used to value the Funds’ investments by major category are as follows:
Equity securities, including restricted securities, and Limited Partnerships for which market quotations are readily available, are valued at the last reported sale price or official closing price as reported by a third party pricing vendor on the primary market or exchange on which they are traded and are categorized as Level 1 in the hierarchy. In the event there were no sales during the day or closing prices are not available, securities are valued at the mean of the most recent quoted bid and ask prices on such day and are generally categorized as Level 2 in the hierarchy. Investments in open-end mutual funds are valued at their closing NAV each business day and are categorized as Level 1 in the hierarchy.
Changes in valuation techniques may result in transfers in or out of an assigned level within the disclosure hierarchy.
Various inputs are used in determining the value of the Funds’ investments as of the end of the reporting period. When inputs used fall into different levels of the fair value hierarchy, the level in the hierarchy within which the fair value measurement falls is determined based on the lowest level input that is significant to the fair value measurement in its entirety. The designated input levels are not necessarily an indication of the risk or liquidity associated with these investments.
These inputs are categorized in the following hierarchy under applicable financial accounting standards:
| Level 1 | – | Unadjusted quoted prices in active markets for identical investments, unrestricted assets or liabilities that a Fund has the ability to access at the measurement date; |
| Level 2 | – | Quoted prices which are not active, quoted prices for similar assets or liabilities in active markets or inputs other than quoted prices that are observable (either directly or indirectly) for substantially the full term of the asset or liability; and |
| Level 3 | – | Significant unobservable prices or inputs (including the Fund’s own assumptions in determining the fair value of investments) where there is little or no market activity for the asset or liability at the measurement date. |
20 | May 31, 2022
| Alerian Exchange Traded Funds | |
| Notes to Financial Statements | May 31, 2022 (Unaudited) |
The following is a summary of the inputs used to value each Fund’s investments as of May 31, 2022:
Alerian MLP ETF
| Investments in Securities at Value | | Level 1 - Quoted and Unadjusted Prices | | | Level 2 - Other Significant Observable Inputs | | | Level 3 - Significant Unobservable Inputs | | | Total | | ||||
| Master Limited Partnerships* | $ | 6,896,662,273 | $ | – | $ | – | $ | 6,896,662,273 | ||||||||
| Short Term Investments | 490,936 | – | – | 490,936 | ||||||||||||
| Total | $ | 6,897,153,209 | $ | – | $ | – | $ | 6,897,153,209 | ||||||||
Alerian Energy Infrastructure ETF
| Investments in Securities at Value | Level 1 - Quoted and Unadjusted Prices | Level 2 - Other Significant Observable Inputs | Level 3 - Significant Unobservable Inputs | Total | ||||||||||||
| Canadian Energy Infrastructure Companies* | $ | 33,355,397 | $ | – | $ | – | $ | 33,355,397 | ||||||||
| Exchange Traded Fund | 331,360 | – | – | 331,360 | ||||||||||||
| U.S. Energy Infrastructure Companies* | 33,089,567 | – | – | 33,089,567 | ||||||||||||
| U.S. Energy Infrastructure MLPs* | 29,851,179 | – | – | 29,851,179 | ||||||||||||
| U.S. General Partners* | 18,243,953 | – | – | 18,243,953 | ||||||||||||
| Short Term Investments | 11,090 | – | – | 11,090 | ||||||||||||
| Total | $ | 114,882,546 | $ | – | $ | – | $ | 114,882,546 | ||||||||
| * | For a detailed breakdown of sectors, see the accompanying Schedule of Investments. |
The Funds did not have any securities that used significant unobservable inputs (Level 3) in determining fair value and there were no transfers into or out of Level 3 during the six months ended May 31, 2022.
C. Foreign Currency Translation
The books and records of the Funds are maintained in U.S. dollars. Investment valuations and other assets and liabilities initially expressed in foreign currencies are converted each business day into U.S. dollars based upon current exchange rates. The portion of realized and unrealized gains or losses on investments due to fluctuations in foreign currency exchange rates is not separately disclosed and is included in realized and unrealized gains or losses on investments, when applicable.
D. Securities Transactions and Investment Income
Securities transactions are recorded as of the trade date. Realized gains and losses from securities transactions are recorded on the specific identification in accordance with GAAP. Dividend income and capital gains distributions, if any, are recorded on the ex-dividend date, net of any foreign taxes withheld. Interest income, if any, is recorded on the accrual basis, including amortization of premiums and accretion of discounts.
E. Dividends and Distributions to Shareholders
Each Fund intends to declare and make quarterly distributions, or as the Board may determine from time to time. Distributions of net realized capital gains earned by the Alerian Energy Infrastructure ETF, if any, are distributed at least annually. Distributions from net investment income and capital gains are determined in accordance with income tax regulations, which may differ from U.S. GAAP. These differences are primarily due to differing treatments of income and gains on various investment securities held by the Funds, timing differences and differing characterization of distributions made by the Funds.
Distributions received from each Fund’s investments in Master Limited Partnerships (“MLPs”) may be comprised of both income and return of capital. Each Fund records investment income and return of capital based on estimates made at the time such distributions are received. Such estimates are based on historical information available from each MLP and other industry sources. These estimates may subsequently be revised based on information received from MLPs after their tax reporting periods are concluded.
The Funds each expect a portion of its distributions to shareholders might be comprised of tax deferred return of capital. Return of capital distributions are not taxable income to the shareholder, but reduce the investor’s tax basis in the investor’s Fund Shares. Such a reduction in tax basis will result in larger taxable gains and/or lower tax losses on a subsequent sale of Fund Shares. Shareholders who periodically receive the payment of dividends or other distributions consisting of a return of capital may be under the impression that they are receiving net profits from the Funds when, in fact, they are not. Shareholders should not assume that the source of the distributions is from the net profits of the Funds.
21 | May 31, 2022
| Alerian Exchange Traded Funds | |
| Notes to Financial Statements | May 31, 2022 (Unaudited) |
F. Federal Income Taxation and Tax Basis Information
Alerian MLP ETF
The Fund is taxed as a regular C-corporation for federal income tax purposes and as such is obligated to pay federal and state income tax. This treatment differs from most investment companies, which elect to be treated as “regulated investment companies” under the Internal Revenue Code of 1986, as amended (the “Code”) in order to avoid paying entity level income taxes. Under current law, the Fund is not eligible to elect treatment as a regulated investment company due to its investments primarily in MLPs invested in energy assets. The Fund expects that substantially all of the distributions it receives from MLPs may be treated as a tax-deferred return of capital, thus reducing the Fund’s current tax liability. However, the amount of taxes paid by the Fund will vary depending on the amount of income and gains derived from investments and/or sales of MLP interests and such taxes will reduce your return from an investment in the Fund.
Since the Fund will be subject to taxation on its taxable income, the NAV of the Fund shares will also be reduced by the accrual of any deferred tax liabilities. The Underlying Index however is calculated without any deductions for taxes. As a result, the Fund's after tax performance could differ significantly from the Underlying Index even if the pretax performance of the Fund and the performance of Underlying Index are closely related.
Cash distributions from MLPs to the Fund that exceed the Fund’s allocable share of such MLP’s net taxable income are considered a tax deferred return of capital that will reduce the Fund’s adjusted tax basis in the equity securities of the MLP. These reductions in the Fund’s adjusted tax basis in the MLP equity securities will increase the amount of any taxable gain (or decrease the amount of any tax loss) recognized by the Fund on a subsequent sale of the securities. The Fund will accrue deferred income taxes for any future tax liability associated with (i) that portion of MLP distributions considered to be a tax-deferred return of capital as well as (ii) capital appreciation of its investments. Upon the sale of an MLP security, the Fund may be liable for previously deferred taxes. The Fund will rely to some extent on information provided by the MLPs, which is not necessarily timely, to estimate the deferred tax liability for purposes of financial statement reporting and determining the Fund’s NAV. From time to time, the Adviser will modify the estimates or assumptions related to the Fund’s deferred tax liability as new information becomes available. The Fund will generally compute deferred income taxes based on the federal income tax rate applicable to corporations and an assumed rate attributable to state taxes.
The Fund’s income tax expense/(benefit) consists of the following:
| Alerian MLP ETF | Period ended May 31, 2022 | |||||||||||
| Current | Deferred | Total | ||||||||||
| Federal | $ | – | $ | 336,931,898 | $ | 336,931,898 | ||||||
| State | – | 26,739,479 | 26,739,479 | |||||||||
| Valuation Allowance | – | (363,671,377 | ) | (363,671,377 | ) | |||||||
| Total tax expense/(benefit) | $ | – | $ | – | $ | – | ||||||
Deferred income taxes reflect the net tax effect of temporary differences between the carrying amount of assets and liabilities for financial reporting and tax purposes.
Components of the Fund’s deferred tax assets and liabilities are as follows:
| Alerian MLP ETF | As of May 31, 2022 | As of November 30, 2021 | ||||||
| Deferred tax assets: | ||||||||
| Capital loss carryforward | $ | 645,273,175 | $ | 555,109,326 | ||||
| Net operating loss carryforward | 90,316,699 | 145,850,354 | ||||||
| Income recognized from MLP investments | 1,534,568,898 | 1,474,568,495 | ||||||
| Other deferred tax assets | 7,564,837 | 9,517,179 | ||||||
| Valuation allowance | (104,186,106 | ) | (467,857,482 | ) | ||||
| Less Deferred tax liabilities: | ||||||||
| Net unrealized gain on investment securities | (2,173,537,503 | ) | (1,717,187,872 | ) | ||||
| Net Deferred Tax Asset/(Liability) | $ | – | $ | – | ||||
22 | May 31, 2022
| Alerian Exchange Traded Funds | |
| Notes to Financial Statements | May 31, 2022 (Unaudited) |
Due to the activities of the MLPs that the fund is invested in, the Fund is required to pay franchise tax in certain states. Generally speaking, franchise tax expense is a tax on equity of a corporation, or base minimum fees, imposed by various jurisdictions. The amounts of the tax are estimated throughout the year based upon the Fund's estimate of underlying activities conducted in the states and reconciled to actual amounts paid upon the filing of the tax returns for the states. These taxes are paid as either estimated tax payments, extension payments, or with the tax return filings of the various states.
The capital loss carryforward is available to offset future taxable income. The capital loss can be carried forward for 5 years and, accordingly, would begin to expire as of November 30, 2022. The Fund has net capital loss carryforwards for federal income tax purposes as follows:
| Alerian MLP ETF | Period-Ended | Amount | Expiration | |||||||||
| Federal | 11/30/2018 | $ | 20,624,857 | 11/30/2022 | ||||||||
| Federal | 11/30/2019 | 757,980,977 | 11/30/2024 | |||||||||
| Federal | 11/30/2020 | 1,033,570,048 | 11/30/2025 | |||||||||
| Federal | 11/30/2021 | 694,189,757 | 11/30/2026 | |||||||||
| Federal | 11/30/2022 | 334,991,513 | 11/30/2027 | |||||||||
| Total | $ | 2,841,357,152 | ||||||||||
The net operating loss carryforward is available to offset future taxable income. The Fund has net operating loss carryforwards for federal income tax purposes as follows:
| Alerian MLP ETF | Period-Ended | Amount | Expiration | |||||||||
| Federal | 11/30/2017 | $ | 206,248,369 | 11/30/2037 | ||||||||
| Federal | 11/30/2021 | 110,440,700 | Indefinite | |||||||||
| Total | $ | 316,689,069 | ||||||||||
The Fund also has state tax net operating loss carryforwards of various amounts per state. The Deferred Tax Assets associated with these state tax net operating losses are as follows:
| Alerian MLP ETF | Period-Ended | Amount | Expiration | |||||||
| State | 11/30/2016 | $ | 376,110 | Varies by State | ||||||
| State | 11/30/2017 | 7,472,303 | Varies by State | |||||||
| State | 11/30/2018 | 2,553,292 | Varies by State | |||||||
| State | 11/30/2019 | 2,244,759 | Varies by State | |||||||
| State | 11/30/2020 | 8,558,965 | Varies by State | |||||||
| State | 11/30/2021 | 2,606,566 | Varies by State | |||||||
| Total | $ | 23,811,995 | ||||||||
The Tax Cuts and Jobs Act (“TCJA”) was signed into law on December 22, 2017. The TCJA made modifications to the net operating loss (“NOL”) deduction. The TCJA eliminated the NOL carryback ability and replaced the 20 year carryforward period with an indefinite carryforward period for any NOLs arising in tax years beginning after December 31, 2017. The TCJA also established a limitation for any NOLs generated in tax years beginning after December 31, 2020 to the lesser of the aggregate of available NOLs or 80% of taxable income before any NOL utilization.
The Fund reviews the recoverability of its deferred tax assets based upon the weight of available evidence. When assessing the recoverability of its deferred tax assets, significant weight was given to the effects of potential future realized and unrealized gains on investments and the period over which these deferred tax assets can be realized. Currently, any capital losses that may be generated by the Fund are eligible to be carried back up to three years and can be carried forward for five years to offset capital gains recognized by the Fund in those years.
Based upon the Fund’s assessment, it has determined that it is “more-likely-than-not” that a portion of its deferred tax assets will not be realized through future taxable income of the appropriate character. Accordingly, a valuation allowance has been established for the Fund’s deferred tax assets. The Fund will continue to assess the need for a valuation allowance in the future. Significant increases in the fair value of its portfolio of investments may change the Fund’s assessment of the recoverability of these assets and may result in the removal of the valuation allowance against all or a portion of the Fund’s gross deferred tax assets.
23 | May 31, 2022
| Alerian Exchange Traded Funds | |
| Notes to Financial Statements | May 31, 2022 (Unaudited) |
Total income tax expense/(benefit) (current and deferred) differs from the amount computed by applying the federal statutory income tax rate of 21% to net investment income and realized and unrealized gain/(losses) on investment before taxes as follows:
| Alerian MLP ETF | As of May 31, 2022 | |||
| Income tax expense at statutory rate | $ | 337,700,528 | ||
| State income taxes (net of federal benefit) | 27,499,018 | |||
| Permanent differences, net | (1,528,170 | ) | ||
| Valuation allowance | (363,671,376 | ) | ||
| Net income tax expense | $ | – | ||
The Fund recognizes interest accrued related to unrecognized tax benefits and penalties as income tax expense. For the six months ended May 31, 2022, the Fund had no penalties or interest.
The Fund recognizes the tax benefits of uncertain tax positions only where the position is “more-likely-than-not” to be sustained assuming examination by tax authorities. Management has analyzed the Fund’s tax positions, and has concluded that no liability for unrecognized tax benefits should be recorded related to uncertain tax positions taken on U.S. tax returns and state tax returns filed since inception of the Fund. Tax periods ended November 30, 2019 through November 30, 2021 remain subject to examination by tax authorities in the United States. Due to the nature of the Fund’s investments, the Fund may be required to file income tax returns in several states. The Fund is not aware of any tax positions for which it is reasonably possible that the total amounts of unrecognized tax benefits will change materially in the next 12 months.
Alerian Energy Infrastructure ETF
The timing and character of income and capital gain distributions are determined in accordance with income tax regulations, which may differ from U.S. GAAP. Reclassifications are made to the Fund’s capital accounts for permanent tax differences to reflect income and gains available for distribution (or available capital loss carryforwards) under income tax regulations. The amounts and characteristics of tax basis distributions and composition of distributable earnings/(accumulated losses) are finalized at fiscal year-end; accordingly, tax basis balances have not been determined as of May 31, 2022.
No provision for income taxes is included in the accompanying financial statements, as the Alerian Energy Infrastructure ETF intends to distribute to shareholders all taxable investment income and realized gains and otherwise comply with Subchapter M of the Internal Revenue Code of 1986, as amended, applicable to regulated investment companies. The Alerian Energy Infrastructure ETF evaluates tax positions taken (or expected to be taken) in the course of preparing the Fund’s tax returns to determine whether these positions meet a “more-likely-than-not” standard that, based on the technical merits, have a more than fifty percent likelihood of being sustained by a taxing authority upon examination. A tax position that meets the “more-likely-than-not” recognition threshold is measured to determine the amount of benefit to recognize in the financial statements.
As of and during the six months ended May 31, 2022, the Alerian Energy Infrastructure ETF did not have a liability for any unrecognized tax benefits. The Alerian Energy Infrastructure ETF files U.S. federal, state, and local tax returns as required. The Fund’s tax returns are subject to examination by the relevant tax authorities until expiration of the applicable statute of limitations, which is generally three years after the filing of the tax return, but may extend to four years in certain jurisdictions. Tax returns for open years have incorporated no uncertain tax positions that require a provision for income taxes.
The tax character of the distributions paid during the fiscal year ended November 30, 2021 was as follows:
| Ordinary Income | Long-Term Capital Gain | Return of Capital | ||||||||||
| November 30, 2021 | ||||||||||||
| Alerian Energy Infrastructure ETF | $ | 2,301,342 | $ | – | $ | 2,346,411 | ||||||
Under current law, capital losses maintain their character as short-term or long-term and are carried forward to the next tax year without expiration. As of November 30, 2021, the following amounts are available as carry forwards to the next tax year:
| Short-Term | Long-Term | |||||||
| Alerian Energy Infrastructure ETF | $ | 309,653 | $ | 3,183,203 | ||||
24 | May 31, 2022
Alerian Exchange Traded Funds
| Notes to Financial Statements | May 31, 2022 (Unaudited) |
As of May 31, 2022, the costs of investments for federal income tax purposes and accumulated net unrealized appreciation/(depreciation) on investments were as follows:
| Alerian MLP ETF | Alerian Energy Infrastructure ETF | |||||
| Cost of investments for income tax purposes | $ | 3,976,138,949 | $ | 95,031,836 | ||
| Gross appreciation (excess of value over tax cost) | $ | 3,811,261,451 | $ | 23,175,542 | ||
| Gross depreciation (excess of tax cost over value) | (890,247,191 | ) | (3,324,832 | ) | ||
| Net unrealized appreciation/(depreciation) | $ | 2,921,014,260 | $ | 19,850,710 | ||
The difference between cost amounts for financial statement purposes is due primarily to the recognition of pass-through income from a Fund’s investments in master limited partnerships and wash sales. In addition, certain tax cost basis adjustments are finalized at fiscal year-end and therefore have not been determined as of May 31, 2022.
G. Lending of Portfolio Securities
The Alerian Energy Infrastructure ETF has entered into a securities lending agreement with State Street Bank & Trust Co. (“SSB”), the Fund’s lending agent. The Fund may lend its portfolio securities only to borrowers that are approved by SSB. The Fund will limit such lending to not more than 33 1/3% of the value of its total assets. The Fund’s securities held at SSB as custodian shall be available to be lent except those securities the Fund or ALPS Advisors, Inc. specifically identifies in writing as not being available for lending. The borrower pledges and maintains with the Fund collateral consisting of cash (U.S. Dollars only), securities issued or guaranteed by the U.S. government or its agencies or instrumentalities, and cash equivalents (including irrevocable bank letters of credit) issued by a person other than the borrower or an affiliate of the borrower. The initial collateral received by the Fund is required to have a value of no less than 102% of the market value of the loaned securities for U.S equity securities and a value of no less than 105% of the market value for non-U.S. equity securities. The collateral is maintained thereafter, at a market value equal to not less than 102% of the current value of the U.S. equity securities on loan and not less than 105% of the current value of the non-U.S. equity securities on loan. The market value of the loaned securities is determined at the close of each business day and any additional required collateral is delivered to the Fund on the next business day. During the term of the loan, the Fund is entitled to all distributions made on or in respect of the loaned securities. Loans of securities are terminable at any time and the borrower, after notice, is required to return borrowed securities within the customary time period for settlement of securities transactions.
As of May 31, 2022, the Alerian Energy Infrastructure ETF did not have any securities on loan. Income earned for lending on portfolio securities during the period totaled $717.
3. INVESTMENT ADVISORY FEE AND OTHER AFFILIATED TRANSACTIONS
ALPS Advisors, Inc. (the “Adviser”) serves as the Funds’ investment adviser pursuant to an Investment Advisory Agreement with the Trust on behalf of each Fund (the “Advisory Agreement”). Pursuant to the Advisory Agreement, each Fund pays the Adviser an annual management fee for the services and facilities it provides, payable on a monthly basis as a percentage of the relevant Fund’s average daily net assets as set out below.
| Fund | Advisory Fee | |
| Alerian MLP ETF | 0.85% | up to and including $10 billion |
| 0.80% | greater than $10 billion up to and including $15 billion | |
| 0.70% | greater than $15 billion up to and including $20 billion | |
| 0.55% | greater than $20 billion up to and including $25 billion | |
| 0.40% | greater than $25 billion |
| Fund | Advisory Fee | |
| Alerian Energy Infrastructure ETF | 0.35% |
Out of the unitary management fees, the Adviser pays substantially all expenses of each Fund, including the cost of transfer agency, custody, fund administration, legal, audit, trustees and other services, except for interest expenses, distribution fees or expenses, brokerage expenses, taxes and extraordinary expenses not incurred in the ordinary course of each Fund's business. The Adviser’s unitary management fee is designed to pay substantially all of each Fund’s expenses and to compensate the Adviser for providing services for each Fund.
ALPS Fund Services, Inc., an affiliate of the Adviser, is the administrator of the Funds.
25 | May 31, 2022
Alerian Exchange Traded Funds
| Notes to Financial Statements | May 31, 2022 (Unaudited) |
Prior to February 16, 2022, each Trustee received (1) a quarterly retainer of $10,000, (2) a per meeting fee of $5,000, (3) $1,500 for any special meeting held outside of a regularly scheduled board meeting, and (4) reimbursement for all reasonable out-of-pocket expenses relating to attendance at meetings. In addition, the Chairman of the Board and Chairman of the Audit Committee each received a quarterly retainer of $2,000, in connection with their respective roles. Effective February 16, 2022, each Trustee receives (1) a quarterly retainer of $20,000, (2) a per meeting fee of $10,000, (3) $2,500 for any special meeting held outside of a regularly scheduled board meeting, and (4) reimbursement for all reasonable out-of-pocket expenses relating to attendance at meetings. In addition, the Chairman of the Board receives a quarterly retainer of $5,000, the Chairman of the Audit Committee receives a quarterly retainer of $3,000, and the Chairman of the Nominating & Governance Committee receives a quarterly retainer of $2,000, each in connection with their respective roles.
4. PURCHASES AND SALES OF SECURITIES
For the six months ended May 31, 2022, the cost of purchases and proceeds from sales of investment securities, excluding short-term investments and in-kind transactions, were as follows:
| Fund | Purchases | Sales | ||||
| Alerian MLP ETF | $ | 1,001,029,318 | $ | 2,001,681,582 | ||
| Alerian Energy Infrastructure ETF | 14,216,872 | 14,403,966 | ||||
For the six months ended May 31, 2022, the cost of in-kind purchases and proceeds from in-kind sales were as follows:
| Fund | Purchases | Sales | ||||
| Alerian MLP ETF | $ | 1,509,167,090 | $ | – | ||
| Alerian Energy Infrastructure ETF | 37,387,709 | – | ||||
For the six months ended May 31, 2022, the Alerian Energy Infrastructure ETF had no in-kind net realized gain or loss.
Gains on in-kind transactions are not considered taxable for federal income tax purposes and losses on in-kind transactions are also not deductible for tax purposes.
5. MASTER LIMITED PARTNERSHIPS
MLPs are publicly traded partnerships engaged in, among other things, the transportation, storage and processing of minerals and natural resources, and are treated as partnerships for U.S. federal income tax purposes. By confining their operations to these specific activities, their interests, or units, are able to trade on public securities exchanges exactly like the shares of a corporation, without entity level taxation. To qualify as a MLP and to not be taxed as a corporation, a partnership must receive at least 90% of its income from qualifying sources as set forth in Section 7704(d) of the Code. These qualifying sources include, among other things, natural resource-based activities such as the processing, transportation and storage of mineral or natural resources. MLPs generally have two classes of owners, the general partner and limited partners. The general partner of an MLP is typically owned by a major energy company, an investment fund, the direct management of the MLP, or is an entity owned by one or more of such parties. The general partner may be structured as a private or publicly traded corporation or other entity. The general partner typically controls the operations and management of the MLP through an up to 2% equity interest in the MLP plus, in many cases, ownership of common units and subordinated units. Limited partners typically own the remainder of the partnership, through ownership of common units, and have a limited role in the partnership’s operations and management.
MLPs are typically structured such that common units and general partner interests have first priority to receive quarterly cash distributions up to an established minimum amount (“minimum quarterly distributions” or “MQD”). Common and general partner interests also accrue arrearages in distributions to the extent the MQD is not paid. Once common and general partner interests have been paid, subordinated units receive distributions of up to the MQD; however, subordinated units do not accrue arrearages. Distributable cash in excess of the MQD is distributed to both common and subordinated units and generally on a pro rata basis. The general partner is also eligible to receive incentive distributions if the general partner operates the business in a manner which results in distributions paid per common unit surpassing specified target levels. As the general partner increases cash distributions to the limited partners, the general partner receives an increasingly higher percentage of the incremental cash distributions.
26 | May 31, 2022
Alerian Exchange Traded Funds
| Notes to Financial Statements | May 31, 2022 (Unaudited) |
6. CAPITAL SHARE TRANSACTIONS
Shares are created and redeemed by each Fund only in Creation Unit size aggregations of 25,000 Shares. On October 1, 2021, Alerian Energy Infrastructure ETF reduced its Creation Unit size from 50,000 to 25,000 Shares. Only broker-dealers or large institutional investors with creation and redemption agreements called Authorized Participants (“AP”) are permitted to purchase or redeem Creation Units from the Funds. Such transactions are generally permitted on an in-kind basis, with a balancing cash component to equate the transaction to the NAV per unit of each Fund on the transaction date. Cash may be substituted equivalent to the value of certain securities generally when they are not available in sufficient quantity for delivery, not eligible for trading by the AP or as a result of other market circumstances.
7. RELATED PARTY TRANSACTIONS
The Funds engaged in cross trades between other funds in the Trust during the six months ended May 31, 2022 pursuant to Rule 17a-7 under the 1940 Act. Cross trading is the buying or selling of portfolio securities between funds to which the Adviser serves as the investment adviser. The Board previously adopted procedures that apply to transactions between the Funds of the Trust pursuant to Rule 17a-7. These transactions related to cross trades during the period complied with the requirements set forth by Rule 17a-7 and the Trust’s procedures.
Transactions related to cross trades during the six months ended May 31, 2022, were as follows:
| Fund | Purchase cost paid | Sale proceeds received | Realized gain/(loss) on sales | ||||||
| Alerian MLP ETF | $ | 172,271 | $ | 1,586,203 | $ | (131,624 | ) | ||
| Alerian Energy Infrastructure ETF | 540,408 | 687,965 | (66,363 | ) | |||||
8. AFFILIATED COMPANIES
As defined by the Investment Company Act of 1940, an affiliated person, including an affiliated company, is one in which a Fund owns 5% or more of the outstanding voting securities, or a company which is under common ownership or control with the Fund.
For the six months ended May 31, 2022, the Alerian MLP ETF held shares in the following affiliates, as defined by the Investment Company Act of 1940.
| Security Name | Share Balance as of May 31, 2022 | Market Value as of November 30, 2021 | Purchases | Purchases In-Kind | Sales | Market Value as of May 31, 2022 | Dividends* | Change in Unrealized Gain/(Loss) | Realized Gain/(Loss) | |||||||||||||||||||||||||||
| Crestwood Equity Partners LP | 10,929,214 | $ | 191,619,639 | $ | 82,786,218 | $ | 63,432,622 | $ | (43,135,455 | ) | $ | 318,477,296 | $ | – | $ | 38,067,099 | $ | (2,244,248 | ) | |||||||||||||||||
| DCP Midstream LP | 13,821,844 | 305,805,520 | 39,534,116 | 99,299,018 | (66,061,775 | ) | 496,342,418 | – | 131,931,057 | (4,072,097 | ) | |||||||||||||||||||||||||
| EnLink Midstream LLC | 49,363,360 | 279,392,241 | 36,782,859 | 101,710,250 | (80,241,684 | ) | 562,742,304 | – | 238,875,846 | (3,311,030 | ) | |||||||||||||||||||||||||
| Genesis Energy LP | 16,621,970 | 142,731,294 | 16,796,620 | 44,883,823 | (30,936,797 | ) | 203,452,913 | – | 48,956,008 | (14,324,485 | ) | |||||||||||||||||||||||||
| Holly Energy Partners LP | 6,971,450 | 99,394,845 | 10,321,832 | 28,635,489 | (19,919,549 | ) | 132,457,550 | – | 19,777,636 | (1,192,393 | ) | |||||||||||||||||||||||||
| Magellan Midstream Partners LP | 13,243,776 | 495,004,139 | 78,673,735 | 145,072,807 | (98,689,914 | ) | 684,703,219 | – | 92,240,610 | (2,093,774 | ) | |||||||||||||||||||||||||
| NuStar Energy LP | 15,179,220 | 179,635,876 | 21,169,493 | 55,820,025 | (36,899,935 | ) | 243,626,481 | – | 46,948,362 | (11,545,293 | ) | |||||||||||||||||||||||||
| Plains All American Pipeline LP | 59,005,821 | 497,343,940 | 49,234,566 | 151,820,469 | (133,897,653 | ) | 672,076,301 | – | 175,671,667 | (45,657,227 | ) | |||||||||||||||||||||||||
Western Midstream Partners LP | 26,193,606 | 489,748,659 | 47,715,285 | 158,315,176 | (177,901,235 | ) | 724,253,206 | – | 236,567,624 | (9,090,486 | ) | |||||||||||||||||||||||||
| $ | 4,038,131,688 | $ | – | $ | 1,029,035,909 | $ | (93,531,033 | ) | ||||||||||||||||||||||||||||
| * | 100% of the income received was estimated as Return of Capital. |
27 | May 31, 2022
Alerian Exchange Traded Funds
| Notes to Financial Statements | May 31, 2022 (Unaudited) |
9. MARKET RISK
The Funds are subject to investment and operational risks associated with financial, economic and other global market developments and disruptions, including the recent spread of an infectious respiratory illness caused by a novel strain of coronavirus (known as COVID-19), which can negatively impact the securities markets and cause each Fund to lose value. Securities in each Fund’s portfolio may underperform in comparison to securities in general financial markets, a particular financial market or other asset classes due to a number of factors, including inflation (or expectations for inflation), deflation (or expectations for deflation), interest rates, global demand for particular products or resources, market instability, debt crises and downgrades, embargoes, tariffs, sanctions and other trade barriers, regulatory events, other governmental trade or market control programs and related geopolitical events. In addition, the value of the Fund’s investments may be negatively affected by the occurrence of global events such as war, terrorism, environmental disasters, natural disasters or events, country instability, and infectious disease epidemics or pandemics.
The spread of COVID-19 has caused volatility, severe market dislocations and liquidity constraints in many markets, including markets for the securities each Fund holds, and may adversely affect each Fund’s investments and operations. The transmission of COVID-19 and efforts to contain its spread have resulted in travel restrictions and disruptions, closed international borders, enhanced health screenings at ports of entry and elsewhere, disruption of and delays in healthcare service preparation and delivery, quarantines, event and service cancellations or interruptions, disruptions to business operations and supply chains, and a reduction in consumer and business spending, as well as general concern and uncertainty that has negatively affected the economy. These disruptions have led to instability in the market place and the jobs market. The impact of COVID-19 could adversely affect the economies of many nations or the entire global economy, the financial well-being and performance of individual issuers, borrowers and sectors and the health of the markets generally in potentially significant and unforeseen ways.
The foregoing could lead to a significant economic downturn or recession, increased market volatility, a greater number of market closures, higher default rates and adverse effects on the values and liquidity of each Fund’s securities or other assets. Such impacts may adversely affect the performance of the Funds.
28 | May 31, 2022
Alerian Exchange Traded Funds
| Notes to Financial Statements | May 31, 2022 (Unaudited) |
10. SUBSEQUENT EVENTS
Effective as of the close of business on March 31, 2022, Deloitte & Touche LLP (“Deloitte”) resigned as the independent registered public accounting firm for the Funds. The report of Deloitte on the Funds’ financial statements as of and for the fiscal years or periods ended November 30, 2021 and November 30, 2020 did not contain an adverse opinion or a disclaimer of opinion, and was not qualified or modified as to uncertainties, audit scope or accounting principles. During the Funds’ fiscal year or period ended November 30, 2021 and November 30, 2020, and through March 31, 2022, there were no disagreements between the Funds and Deloitte on any matter of accounting principles or practices, financial statement disclosure or auditing scope or procedure, which disagreements, if not resolved to the satisfaction of Deloitte, would have caused it to make reference to the subject matter of the disagreements in its report on the financial statements of the Funds for such year or period. During the Funds’ fiscal years or periods ended November 30, 2021 and November 30, 2020, there were no “reportable events” (as defined in Item 304(a)(1)(v) of Regulation S-K under the Securities Exchange Act of 1934, as amended (the “Exchange Act”)).
During each Fund’s fiscal year or period ended November 30, 2021 and November 30, 2020, and during the subsequent interim period through March 31, 2022, neither the Funds, nor anyone on their behalf, consulted with Deloitte, on behalf of the Funds, regarding any matter that was either the subject of a “disagreement,” as defined in Item 304(a)(1)(iv) of Regulation S-K under the Securities Exchange Act of 1934, as amended (the “Exchange Act”), and the instructions thereto, or a “reportable event,” as defined in Item 304(a)(1)(v) of Regulation S-K under the Exchange Act.
On June 21, 2022, upon the recommendation of the Funds’ Audit Committee, the Board of Trustees of the Funds approved the engagement of BBD, LLP (“BBD”) as the independent registered public accounting firm for each Fund for the fiscal year ending November 30, 2022. The Board and its Audit Committee considered the engagement of BBD in connection with the resignation of the Funds’ former independent registered accounting firm on March 31, 2022.
Effective July 1, 2022, the unitary fee of the Alerian MLP ETF will be subject to the following breakpoints:
| Fund | Advisory Fee | |
| Alerian MLP ETF | Average net assets up to and including $7 billion | 0.85% |
| Average net assets greater than $7 billion up to and including $8.5 billion | 0.825% | |
| Average net assets greater than $8.5 billion up to and including $10.5 billion | 0.80% | |
| Average net assets greater than $10.5 billion up to and including $12.5 billion | 0.75% | |
| Average net assets greater than $12.5 billion up to and including $14.5 billion | 0.70% | |
| Average net assets greater than $14.5 billion up to and including $16.5 billion | 0.65% | |
| Average net assets greater than $16.5 billion up to and including $18.5 billion | 0.60% | |
| Average net assets greater than $18.5 billion up to and including $20.5 billion | 0.55% | |
| Average net assets greater than $20.5 billion up to and including $22.5 billion | 0.50% | |
| Average net assets greater than $22.5 billion up to and including $25 billion | 0.45% | |
| Average net assets greater than $25 billion | 0.40% |
29 | May 31, 2022
Alerian Exchange Traded Funds
| Additional Information | May 31, 2022 (Unaudited) |
PROXY VOTING RECORDS, POLICIES AND PROCEDURES
Information regarding how each Fund voted proxies relating to portfolio securities during the most recent 12-month period ended June 30 and a description of the Funds’ proxy voting policies and procedures used in determining how to vote for proxies are available without charge on the SEC’s website at www.sec.gov and upon request, by calling (toll-free) 1-866-759-5679.
PORTFOLIO HOLDINGS
The Fund files a complete schedule of portfolio holdings with the U.S. Securities and Exchange Commission (“SEC”) for the first and third quarters of each fiscal year on Form N-PORT within 60 days after the end of the period. Copies of the Fund’s Form N-PORT are available without a charge, upon request, by contacting the Fund at 1-866-759-5679 and on the SEC’s website at https://www.sec.gov.
TAX INFORMATION
In early 2022, if applicable, shareholders of record received this information for the distributions paid to them by the Funds during the calendar year 2021 via Form 1099. The Funds will notify shareholders in early 2023 of amounts paid to them by the Funds, if any, during the calendar year 2022.
The Alerian Energy Infrastructure ETF designates the following as a percentage of taxable ordinary income distributions, or up to the maximum amount allowable, for the calendar year ended December 31, 2021:
| Qualified Dividend Income | Dividend Received Deduction | |
| Alerian Energy Infrastructure ETF | 100.00% | 15.44% |
LICENSING AGREEMENTS
Alerian (the “Licensor”) has entered into an index licensing agreement with ALPS Advisors Inc. (the “Adviser”) with respect to each of the Alerian MLP ETF and the Alerian Energy Infrastructure ETF, to allow the Adviser’s use of AMZI and AMEI. The following disclosure relates to the Licensor:
Alerian is the designer of the construction and methodology for the underlying index (each an “Underlying Index”) for each of the Alerian MLP ETF and the Alerian Energy Infrastructure ETF (each a “Fund” and collectively, the “Funds”). “Alerian,” “Alerian MLP Infrastructure Index,” “Alerian Energy Infrastructure Index,” “Alerian Index Series” and “AMZI” are service marks or trademarks of Alerian. Alerian acts as brand licensor for each Underlying Index. Alerian is not responsible for the descriptions of either Underlying Index or the Funds that appear herein. Alerian is not affiliated with the Trust, the Adviser or the Distributor.
Neither Fund is issued, sponsored, endorsed, sold or promoted by Alerian (“Licensor”) or its affiliates. Licensor makes no representation or warranty, express or implied, to the owners of the Fund or any member of the public regarding the advisability of investing in securities generally or in the Fund particularly or the ability of the Alerian MLP Infrastructure Index (“Index”) to track general market performance. Licensor’s only relationship to the Licensee is the licensing of the Index which is determined, composed and calculated by Licensor without regard to the Licensee or the Fund. Licensor has no obligation to take the needs of the Licensee or the owners of the Fund into consideration in determining, composing or calculating the Index. Licensor is not responsible for and has not participated in the determination of the timing of, prices at, or quantities of the Fund to be issued or in the determination or calculation of the equation by which the Fund is to be converted into cash. Licensor has no obligation or liability in connection with the issuance, administration, marketing or trading of either Fund and is not responsible for and has not participated in the determination of pricing or the timing of the issuance or sale of the Shares of either Fund or in the determination or calculation of the NAV of the relevant Fund. Alerian MLP Infrastructure Index, Alerian MLP Infrastructure Total Return Index, AMZI and AMZIX are trademarks of GKD Index Partners, LLC and their general use is granted under a license from GKD Index Partners, LLC.
LICENSOR DOES NOT GUARANTEE THE QUALITY, ACCURACY AND/OR THE COMPLETENESS OF THE INDEX OR ANY DATA INCLUDED THEREIN AND SHALL HAVE NO LIABILITY FOR ERRORS OR OMISSIONS OF ANY KIND RELATED TO THE INDEX OR DATA. LICENSOR MAKES NO WARRANTY, EXPRESS OR IMPLIED, AS TO RESULTS TO BE OBTAINED BY LICENSEE, OWNERS OF THE FUND, OR ANY OTHER PERSON OR ENTITY FROM THE USE OF THE INDEX OR ANY DATA INCLUDED THEREIN IN CONNECTION WITH THE RIGHTS LICENSED TO LICENSEE OR FOR ANY OTHER USE. LICENSOR MAKES NO EXPRESS OR IMPLIED WARRANTIES, AND HEREBY EXPRESSLY DISCLAIMS ALL WARRANTIES OF MERCHANTABILITY OR FITNESS FOR A PARTICULAR PURPOSE OR USE WITH RESPECT TO THE INDEX OR ANY DATA INCLUDED THEREIN. WITHOUT LIMITING ANY OF THE FOREGOING, IN NO EVENT SHALL LICENSOR HAVE ANY LIABILITY FOR ANY SPECIAL, PUNITIVE, INDIRECT, OR CONSEQUENTIAL DAMAGES (INCLUDING LOST PROFITS), EVEN IF NOTIFIED OF THE POSSIBILITY OF SUCH DAMAGES.
30 | May 31, 2022
Alerian Exchange Traded Funds
| Additional Information | May 31, 2022 (Unaudited) |
The Adviser does not guarantee the accuracy and/or the completeness of either Underlying Index or any data included therein, and the Adviser shall have no liability for any errors, omissions or interruptions therein. The Adviser makes no warranty, express or implied, as to results to be obtained by either Fund, owners of the Shares of the relevant Fund or any other person or entity from the use of either Underlying Index or any data included therein. The Adviser makes no express or implied warranties, and expressly disclaims all warranties of merchantability or fitness for a particular purpose or use with respect to either Underlying Index or any data included therein. Without limiting any of the foregoing, in no event shall the Adviser have any liability for any special, punitive, direct, indirect, or consequential damages (including lost profits) arising out of matters relating to the use of either Underlying Index, even if notified of the possibility of such damages.
(Applicable to the Alerian Energy Infrastructure ETF only)
The Underlying Index is the exclusive property of GKD Index Partners LLC d/b/a Alerian, which has contracted with S&P Opco, LLC (a subsidiary of S&P Dow Jones Indices LLC) (“S&P Dow Jones Indices”) to calculate and maintain the Underlying Index. S&P® is a registered trademark of Standard & Poor’s Financial Services LLC (“SPFS”); Dow Jones® is a registered trademark of Dow Jones Trademark Holdings LLC (“Dow Jones”); and these trademarks have been licensed to S&P Dow Jones Indices. “Calculated by S&P Dow Jones Indices” and its related stylized mark(s) have been licensed for use by Alerian.
The Fund is not sponsored, endorsed, sold or promoted by S&P Dow Jones Indices, SPFS, Dow Jones or any of their affiliates (collectively, “S&P Dow Jones Indices Entities”). S&P Dow Jones Indices Entities do not make any representation or warranty, express or implied, to the owners of the Fund or any member of the public regarding the advisability of investing in securities generally or in the Fund particularly or the ability of the Underlying Index to track general market performance. S&P Dow Jones Indices Entities only relationship to Alerian with respect to the Underlying Index is the licensing of certain trademarks, service marks and trade names of S&P Dow Jones Indices Entities and for the providing of calculation and maintenance services related to the Underlying Index. S&P Dow Jones Indices Entities are not responsible for and have not participated in the determination of the prices and amount of the Fund or the timing of the issuance or sale of the Fund or in the determination or calculation of the equation by which the Fund is to be converted into cash. S&P Dow Jones Indices Entities have no obligation or liability in connection with the administration, marketing or trading of the Fund. S&P Dow Jones Indices LLC is not an investment advisor. Inclusion of a security within the Underlying Index is not a recommendation by S&P Dow Jones Indices Entities to buy, sell, or hold such security, nor is it considered to be investment advice.
S&P DOW JONES INDICES ENTITIES DO NOT GUARANTEE THE ADEQUACY, ACCURACY, TIMELINESS AND/OR THE COMPLETENESS OF THE UNDERLYING INDEX OR ANY DATA RELATED THERETO OR ANY COMMUNICATION, INCLUDING BUT NOT LIMITED TO, ORAL OR WRITTEN COMMUNICATION (INCLUDING ELECTRONIC COMMUNICATIONS) WITH RESPECT THERETO. S&P DOW JONES INDICES ENTITIES SHALL NOT BE SUBJECT TO ANY DAMAGES OR LIABILITY FOR ANY ERRORS, OMISSIONS, OR DELAYS THEREIN. S&P DOW JONES INDICES ENTITIES MAKE NO EXPRESS OR IMPLIED WARRANTIES, AND EXPRESSLY DISCLAIMS ALL WARRANTIES, OF MERCHANTABILITY OR FITNESS FOR A PARTICULAR PURPOSE OR USE OR AS TO RESULTS TO BE OBTAINED BY ALERIAN, OWNERS OF THE FUND, OR ANY OTHER PERSON OR ENTITY FROM THE USE OF THE UNDERLYING INDEX OR WITH RESPECT TO ANY DATA RELATED THERETO. WITHOUT LIMITING ANY OF THE FOREGOING, IN NO EVENT WHATSOEVER SHALL S&P DOW JONES INDICES ENTITIES BE LIABLE FOR ANY INDIRECT, SPECIAL, INCIDENTAL, PUNITIVE, OR CONSEQUENTIAL DAMAGES INCLUDING BUT NOT LIMITED TO, LOSS OF PROFITS, TRADING LOSSES, LOST TIME OR GOODWILL, EVEN IF THEY HAVE BEEN ADVISED OF THE POSSIBILITY OF SUCH DAMAGES, WHETHER IN CONTRACT, TORT, STRICT LIABILITY, OR OTHERWISE.
31 | May 31, 2022
Alerian Exchange Traded Funds
| Liquidity Risk Management Program | May 31, 2022 (Unaudited) |
In compliance with the Securities and Exchange Commission’s liquidity risk management rule (the “Liquidity Rule”), the ALPS ETF Trust (the “Trust”) has established a liquidity risk management program (the “Program”) to govern the Trust’s approach to managing liquidity risk for each series of the Trust (each a “Fund”). The Program is overseen by the Liquidity Committee (the “Committee”), a committee comprised of representatives of the Trust’s investment adviser, ALPS Advisors, Inc. The Trust’s Board of Trustees (the “Board”) has approved the designation of the Committee to oversee the Program.
The Program’s principal objectives include supporting each Fund’s compliance with limits on investments in illiquid assets and assessing and managing the risk that a Fund will be unable to meet its redemption obligations without significant dilution of remaining investors’ interests in the Fund. The Program includes a number of elements that support the management and assessment of liquidity risk, including an annual assessment of factors that influence a Fund’s liquidity and, for Funds that are not “In-Kind ETFs,” the periodic classification and re-classification of such Fund’s investments into groupings that reflect the Committee’s assessment of their liquidity under current market conditions.
At a meeting of the Board held on March 7, 2022, the Trustees received a report from the Committee regarding the design and operational effectiveness of the Program for the period January 1, 2021 through December 31, 2021 (the “Period”). The Committee determined, and reported to the Board, that the Program has been operating effectively to assess and manage each Fund’s liquidity risk and has been and continues to be adequately and effectively implemented to monitor and (as applicable) respond to the Funds’ liquidity developments.
The Committee reported that during the period covered by the report, there were no liquidity events that impacted the Funds or their ability to timely meet redemptions without dilution to existing shareholders. The report also discussed notable events affecting liquidity over the Period, including extended market holidays and closures in certain countries. Among other things, the Committee’s report noted that no Fund is required to have a highly liquid investment minimum based either on its status as an In-Kind ETF or on its ability to rely on another exemption under the Liquidity Rule. The Committee’s report further noted that no material changes have been made to the Program since its implementation.
32 | May 31, 2022


Table of Contents
| Performance Overview | 1 |
| Disclosure of Fund Expenses | 3 |
| Financial Statements | |
| Schedule of Investments | 4 |
| Statement of Assets and Liabilities | 5 |
| Statement of Operations | 6 |
| Statements of Changes in Net Assets | 7 |
| Financial Highlights | 8 |
| Notes to Financial Statements | 9 |
| Additional Information | 15 |
| Liquidity Risk Management Program | 16 |
alpsfunds.com
ALPS Active REIT ETF
| Performance Overview | May 31, 2022 (Unaudited) |
Investment Objective
The ALPS Active REIT ETF (the "Fund") seeks total return through dividends and capital appreciation. The Fund will, under normal circumstances, seek to achieve its investment objective by investing at least 80% of its net assets in publicly traded equity securities of real estate investment trusts (“REITs”).
Fund Performance (as of May 31, 2022)
| 6 Months | 1 Year | Since Inception^ | |
| ALPS Active REIT ETF - NAV | -4.02% | 4.16% | 13.35% |
| ALPS Active REIT ETF - Market Price* | -2.75% | 5.72% | 14.66% |
| S&P United States REIT Index | -6.33% | 3.91% | 13.02% |
Total Expense Ratio (per the current prospectus) is 0.68%.
Performance data quoted represents past performance. Past performance does not guarantee future results. Total return figures assume reinvestment of dividends and capital gains distributions, if any. The table does not reflect the deduction of taxes that a shareholder would pay on Fund distributions or the redemption of Fund shares. Investment return and principal value of an investment will fluctuate so that an investor’s shares, when sold or redeemed, may be worth more or less than the original cost. Current performance data may be higher or lower than actual data quoted. For the most current month-end performance data please visit www.alpsfunds.com or call 1.866.759.5679.
NAV is an exchange-traded fund’s per-share value. The per-share dollar amount of the fund is derived by dividing the total value of all the securities in its portfolio, less any liabilities, by the number of fund shares outstanding. Market Price is the price at which a share can currently be traded in the market. Information detailing the number of days the Market Price of the Fund was greater than the Fund’s NAV and the number of days it was less than the Fund’s NAV can be obtained at www.alpsfunds.com.
| ^ | The Fund commenced operations on February 25, 2021, with the first day of trading on the exchange of February 26, 2021. |
| * | Market Price means the official closing price of a share or, if it more accurately reflects the market value of a share at the time as of which the Fund calculates current net asset value per share, the price that is the midpoint of the bid-ask spread as of that time. It does not represent the returns an investor would receive if shares were traded at other times. |
The Fund is new with limited operating history.
The S&P United States REIT Index defines and measures the investable universe of publicly traded real estate investment trusts domiciled in the United States.
One cannot invest directly in an index. Index performance does not reflect fund performance.
The Fund’s shares are not individually redeemable. Investors buy and sell shares of the Fund on a secondary market. Only market makers or “authorized participants” may trade directly with the Fund, typically in blocks of 5,000 shares.
The ALPS Active REIT ETF is not suitable for all investors. Investments in the Fund are subject to investment risks, including possible loss of the principal amount invested.
ALPS Portfolio Solutions Distributor, Inc., a FINRA member, is the Distributor for the ALPS Active REIT ETF.
1 | May 31, 2022
ALPS Active REIT ETF
| Performance Overview | May 31, 2022 (Unaudited) |
Top Ten Holdings* (as of May 31, 2022)
| Equity Residential | 7.13% |
| Realty Income Corp. | 5.29% |
| Ventas, Inc. | 5.20% |
| Public Storage | 5.17% |
| AvalonBay Communities, Inc. | 4.96% |
| Duke Realty Corp. | 4.56% |
| VICI Properties, Inc. | 4.16% |
| Simon Property Group, Inc. | 3.93% |
| Invitation Homes, Inc. | 3.93% |
| Welltower, Inc. | 3.69% |
| Total % of Top 10 Holdings | 48.02% |
Sector Allocation* (as of May 31, 2022)
| Specialized REITs | 22.09% |
| Residential REITs | 20.76% |
| Retail REITs | 15.67% |
| Industrial REITs | 15.10% |
| Health Care REITs | 11.11% |
| Office REITs | 6.36% |
| Hotel & Resort REITs | 4.23% |
| Diversified REITs | 1.90% |
| Money Market Fund | 2.78% |
| Total | 100.00% |
| * | % of Total Investments |
Future holdings are subject to change.
Growth of $10,000 (as of May 31, 2022)
Comparison of change in value of a $10,000 investment in the Fund and the Index
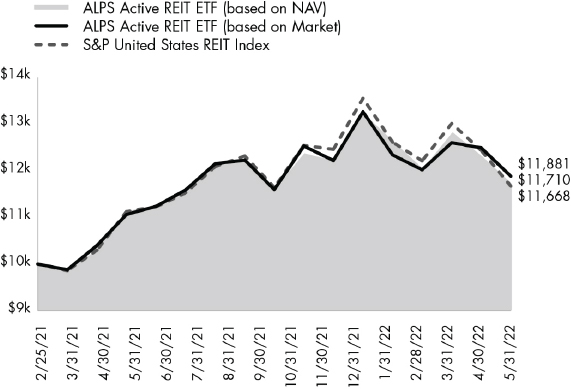
The chart above compares historical performance of a hypothetical investment of $10,000 in the Fund since inception with the performance of the Fund’s benchmark index. Results include the reinvestment of all dividends and capital gains distributions. Past performance does not guarantee future results. The chart does not reflect the deduction of taxes that a shareholder would pay on Fund distributions or the redemption of Fund shares.
2 | May 31, 2022
ALPS Active REIT ETF
| Disclosure of Fund Expenses | May 31, 2022 (Unaudited) |
Shareholder Expense Example: As a shareholder of a Fund, you incur certain ongoing costs, including management fees and other Fund expenses. These examples are intended to help you understand your ongoing costs (in dollars) of investing in the Fund and to compare these costs with the ongoing costs of investing in other funds. The example is based on an investment of $1,000 invested at the beginning of the six month period and held through May 31, 2022.
Actual Return: The first line of the table provides information about actual account values and actual expenses. You may use the information in this line, together with the amount you invested, to estimate the expenses that you incurred over the period. Simply divide your account value by $1,000 (for example, an $8,600 account value divided by $1,000 = 8.6), then multiply the result by the number in the first line under the heading entitled “Expenses Paid During Period” to estimate the expenses attributable to your investment during this period.
Hypothetical 5% Return: The second line of the table provides information about hypothetical account values and hypothetical expenses based on the Fund’s actual expense ratio and an assumed rate of return of 5% per year before expenses, which is not the Fund’s actual return. The hypothetical account values and expenses may not be used to estimate the actual ending account balance or expenses you paid for the period. You may use this information to compare ongoing costs of investing in the Fund and other funds. To do so, compare this 5% hypothetical example with the 5% hypothetical examples that appear in the shareholder reports of other funds.
The expenses shown in the table are meant to highlight ongoing Fund costs only and do not reflect any transaction costs, such as brokerage commissions and other fees to financial intermediaries. Therefore, the second line of the table is useful in comparing ongoing costs only, and will not help you determine the relative total costs of owning different funds. In addition, if these costs were included, your costs would have been higher.
| Beginning Account Value 12/1/21 | Ending Account Value 5/31/22 | Expense Ratio(a) | Expenses Paid During Period 12/1/21 - 5/31/22(b) | |
| ALPS Active REIT ETF | ||||
| Actual | $1,000.00 | $959.80 | 0.68% | $3.32 |
| Hypothetical (5% return before expenses) | $1,000.00 | $1,021.54 | 0.68% | $3.43 |
| (a) | Annualized, based on the Fund's most recent fiscal half year expenses. |
| (b) | Expenses are equal to the Fund's annualized expense ratio multiplied by the average account value over the period, multiplied by the number of days in the most recent fiscal half year (182), divided by 365. |
3 | May 31, 2022
ALPS Active REIT ETF
| Schedule of Investments | May 31, 2022 (Unaudited) |
| Security Description | Shares | Value | ||||||
| COMMON STOCKS (97.21%) | ||||||||
| Diversified REITs (1.90%) | ||||||||
| WP Carey, Inc. | 4,412 | $ | 371,226 | |||||
| Health Care REITs (11.10%) | ||||||||
| Omega Healthcare Investors, Inc. | 14,546 | 433,034 | ||||||
| Ventas, Inc. | 17,956 | 1,018,823 | ||||||
| Welltower, Inc. | 8,117 | 723,144 | ||||||
| Total Health Care REITs | 2,175,001 | |||||||
| Hotel & Resort REITs (4.23%) | ||||||||
| RLJ Lodging Trust | 27,680 | 371,742 | ||||||
| Sunstone Hotel Investors, Inc.(a) | 38,200 | 457,254 | ||||||
| Total Hotel & Resort REITs | 828,996 | |||||||
| Industrial REITs (15.11%) | ||||||||
| Duke Realty Corp. | 16,895 | 892,563 | ||||||
| First Industrial Realty Trust, Inc. | 7,395 | 393,044 | ||||||
| Prologis, Inc. | 4,153 | 529,424 | ||||||
| Rexford Industrial Realty, Inc. | 11,261 | 719,240 | ||||||
| Terreno Realty Corp. | 6,986 | 424,120 | ||||||
| Total Industrial REITs | 2,958,391 | |||||||
| Office REITs (6.36%) | ||||||||
| Cousins Properties, Inc. | 9,694 | 334,928 | ||||||
| Highwoods Properties, Inc. | 7,221 | 283,713 | ||||||
| Kilroy Realty Corp. | 6,798 | 412,639 | ||||||
| Piedmont Office Realty Trust, Inc., Class A | 14,508 | 213,848 | ||||||
| Total Office REITs | 1,245,128 | |||||||
| Residential REITs (20.76%) | ||||||||
| AvalonBay Communities, Inc. | 4,672 | 971,589 | ||||||
| Equity LifeStyle Properties, Inc. | 7,654 | 579,408 | ||||||
| Equity Residential | 18,179 | 1,396,692 | ||||||
| Invitation Homes, Inc. | 20,383 | 768,847 | ||||||
| Sun Communities, Inc. | 2,135 | 350,418 | ||||||
| Total Residential REITs | 4,066,954 | |||||||
| Retail REITs (15.67%) | ||||||||
| National Retail Properties, Inc. | 5,572 | 246,840 | ||||||
| Realty Income Corp. | 15,159 | 1,034,146 | ||||||
| Regency Centers Corp. | 8,999 | 613,822 | ||||||
| Retail Opportunity Investments Corp. | 22,395 | 404,678 | ||||||
| Security Description | Shares | Value | ||||||
| Retail REITs (continued) | ||||||||
| Simon Property Group, Inc. | 6,709 | $ | 769,187 | |||||
| Total Retail REITs | 3,068,673 | |||||||
| Specialized REITs (22.08%) | ||||||||
| Crown Castle International Corp. | 2,649 | 502,383 | ||||||
| Digital Realty Trust, Inc. | 4,970 | 693,762 | ||||||
| Equinix, Inc. | 878 | 603,265 | ||||||
| National Storage Affiliates Trust | 13,364 | 700,942 | ||||||
| Public Storage | 3,064 | 1,013,081 | ||||||
| VICI Properties, Inc. | 26,381 | 813,854 | ||||||
| Total Specialized REITs | 4,327,287 | |||||||
| TOTAL COMMON STOCKS | ||||||||
| (Cost $18,612,798) | 19,041,656 | |||||||
| 7 Day Yield | Shares | Value | ||||||||||
| SHORT TERM INVESTMENTS (2.78%) | ||||||||||||
| Money Market Fund | ||||||||||||
| State Street Institutional Treasury Plus Money Market Fund | 0.75 | % | 543,902 | 543,902 | ||||||||
| TOTAL SHORT TERM INVESTMENTS | ||||||||||||
| (Cost $543,902) | 543,902 | |||||||||||
| TOTAL INVESTMENTS (99.99%) | ||||||||||||
| (Cost $19,156,700) | $ | 19,585,558 | ||||||||||
| OTHER ASSETS IN EXCESS OF LIABILITIES (0.01%) | 2,407 | |||||||||||
| NET ASSETS - 100.00% | $ | 19,587,965 | ||||||||||
| (a) | Non-income producing security. |
See Notes to Financial Statements.
4 | May 31, 2022
ALPS Active REIT ETF
| Statement of Assets and Liabilities | May 31, 2022 (Unaudited) |
| ASSETS: | ||||
| Investments, at value | $ | 19,585,558 | ||
| Dividends receivable | 13,147 | |||
| Total Assets | 19,598,705 | |||
| LIABILITIES: | ||||
| Payable to adviser | 10,740 | |||
| Total Liabilities | 10,740 | |||
| NET ASSETS | $ | 19,587,965 | ||
| NET ASSETS CONSIST OF: | ||||
| Paid-in capital | $ | 18,454,027 | ||
| Total distributable earnings | 1,133,938 | |||
| NET ASSETS | $ | 19,587,965 | ||
| INVESTMENTS, AT COST | $ | 19,156,700 | ||
| PRICING OF SHARES | ||||
| Net Assets | $ | 19,587,965 | ||
| Shares of beneficial interest outstanding (Unlimited number of shares authorized, par value $0.01 per share) | 715,002 | |||
| Net Asset Value, offering and redemption price per share | $ | 27.40 | ||
See Notes to Financial Statements.
5 | May 31, 2022
ALPS Active REIT ETF
| Statement of Operations | For the Six Months Ended May 31, 2022 (Unaudited) |
| INVESTMENT INCOME: | ||||
| Dividends | $ | 302,491 | ||
| Securities Lending Income | 30 | |||
| Total Investment Income | 302,521 | |||
| EXPENSES: | ||||
| Investment adviser fees | 72,799 | |||
| Total Expenses | 72,799 | |||
| NET INVESTMENT INCOME | 229,722 | |||
| REALIZED AND UNREALIZED GAIN/(LOSS): | ||||
| Net realized gain on investments(a) | 700,360 | |||
| Net change in unrealized depreciation on investments | (1,663,893 | ) | ||
| NET REALIZED AND UNREALIZED LOSS ON INVESTMENTS | (963,533 | ) | ||
| NET DECREASE IN NET ASSETS RESULTING FROM OPERATIONS | $ | (733,811 | ) | |
| (a) | Includes realized gain or loss as a result of in-kind transactions (See Note 4 in Notes to Financial Statements). |
See Notes to Financial Statements.
6 | May 31, 2022
ALPS Active REIT ETF
Statements of Changes in Net Assets
| For the Six Months Ended May 31, 2022 (Unaudited) | For the Period February 25, 2021 (Commencement of Operations) to November 30, 2021 | |||||||
| OPERATIONS: | ||||||||
| Net investment income | $ | 229,722 | $ | 238,110 | ||||
| Net realized gain | 700,360 | 718,062 | ||||||
| Net change in unrealized appreciation/depreciation | (1,663,893 | ) | 2,092,751 | |||||
| Net increase/(decrease) in net assets resulting from operations | (733,811 | ) | 3,048,923 | |||||
| DISTRIBUTIONS TO SHAREHOLDERS: | ||||||||
| From distributable earnings | (908,637 | ) | (277,240 | ) | ||||
| Total distributions | (908,637 | ) | (277,240 | ) | ||||
| CAPITAL SHARE TRANSACTIONS: | ||||||||
| Proceeds from sale of shares | 4,216,102 | 21,611,468 | ||||||
| Cost of shares redeemed | (7,223,560 | ) | (145,280 | ) | ||||
| Net increase/(decrease) from capital share transactions | (3,007,458 | ) | 21,466,188 | |||||
| Net increase/(decrease) in net assets | (4,649,906 | ) | 24,237,871 | |||||
| NET ASSETS: | ||||||||
| Beginning of period | 24,237,871 | – | ||||||
| End of period | $ | 19,587,965 | $ | 24,237,871 | ||||
| OTHER INFORMATION: | ||||||||
| CAPITAL SHARE TRANSACTIONS: | ||||||||
| Beginning shares | 820,002 | – | ||||||
| Shares sold | 145,000 | 825,002 | ||||||
| Shares redeemed | (250,000 | ) | (5,000 | ) | ||||
| Shares outstanding, end of period | 715,002 | 820,002 | ||||||
See Notes to Financial Statements.
7 | May 31, 2022
ALPS Active REIT ETF
| Financial Highlights | For a Share Outstanding Throughout the Periods Presented |
| For the Six Months Ended May 31, 2022 (Unaudited) | For the Period February 25, 2021 (Commencement of Operations) to November 30, 2021 | |||||||
| NET ASSET VALUE, BEGINNING OF PERIOD | $ | 29.56 | $ | 24.62 | ||||
| INCOME FROM OPERATIONS: | ||||||||
| Net investment income(a) | 0.31 | 0.37 | ||||||
| Net realized and unrealized gain/(loss) | (1.38 | ) | 5.01 | |||||
| Total from investment operations | (1.07 | ) | 5.38 | |||||
| DISTRIBUTIONS: | ||||||||
| From net investment income | (0.26 | ) | (0.38 | ) | ||||
| From net realized gains | (0.83 | ) | (0.06 | ) | ||||
| Total distributions | (1.09 | ) | (0.44 | ) | ||||
| NET INCREASE/(DECREASE) IN NET ASSET VALUE | (2.16 | ) | 4.94 | |||||
| NET ASSET VALUE, END OF PERIOD | $ | 27.40 | $ | 29.56 | ||||
| TOTAL RETURN(b) | (4.02 | )% | 22.01 | % | ||||
| RATIOS/SUPPLEMENTAL DATA: | ||||||||
| Net assets, end of period (in 000s) | $ | 19,588 | $ | 24,238 | ||||
| RATIOS TO AVERAGE NET ASSETS | ||||||||
| Ratio of expenses to average net assets | 0.68 | %(c) | 0.68 | %(c) | ||||
| Ratio of net investment income to average net assets | 2.15 | %(c) | 1.69 | %(c) | ||||
| Portfolio turnover rate(d) | 62 | % | 92 | % | ||||
| (a) | Based on average shares outstanding during the period. |
| (b) | Total return is calculated assuming an initial investment made at the net asset value at the beginning of the period and redemption at the net asset value on the last day of the period and assuming all distributions are reinvested at the reinvestment prices. Total return calculated for a period of less than one year is not annualized. |
| (c) | Annualized. |
| (d) | Portfolio turnover for periods less than one year are not annualized and does not include securities received or delivered from processing creations or redemptions in-kind. |
See Notes to Financial Statements.
8 | May 31, 2022
ALPS Active REIT ETF
| Notes to Financial Statements | May 31, 2022 (Unaudited) |
1. ORGANIZATION
ALPS ETF Trust (the “Trust”), a Delaware statutory trust, is an open-end management investment company registered under the Investment Company Act of 1940, as amended (the “1940 Act”). As of May 31, 2022, the Trust consists of nineteen separate portfolios. Each portfolio represents a separate series of the Trust. This report pertains solely to the ALPS Active REIT ETF (the “Fund”). The investment objective of the Fund is to seek total return through dividends and capital appreciation. The Fund is considered non-diversified and may invest a greater portion of assets in securities of individual issuers than a diversified fund. As a result, changes in the market value of a single investment could cause greater fluctuations in share price than would occur in a diversified fund.
The Fund’s Shares (“Shares”) are listed on the Nasdaq Stock Market LLC (“Nasdaq Exchange”). The Fund issues and redeems Shares at net asset value (“NAV”) in blocks of 5,000 Shares, each of which is called a “Creation Unit”. Creation Units are issued and redeemed principally in-kind for securities. Except when aggregated in Creation Units, Shares are not redeemable securities of the Fund.
Pursuant to the Trust’s organizational documents, its Officers and Trustees are indemnified against certain liability arising out of the performance of their duties to the Trust. Additionally, in the normal course of business, the Trust enters into contracts with service providers that contain general indemnification clauses. The Trust’s maximum exposure under these arrangements is unknown, as this would involve future claims that may be made against the Trust that have not yet occurred.
2. SIGNIFICANT ACCOUNTING POLICIES
The following is a summary of significant accounting policies consistently followed by the Fund in the preparation of the financial statements. The accompanying financial statements were prepared in accordance with accounting principles generally accepted in the United States of America (“U.S. GAAP”). The preparation of financial statements in conformity with U.S. GAAP requires management to make certain estimates and assumptions that affect the reported amounts of assets and liabilities and disclosures of contingent assets and liabilities at the date of the financial statements and the reported amounts of revenue and expenses during the period. Actual results could differ from those estimates. The Fund is considered an investment company under U.S. GAAP and follows the accounting and reporting guidance applicable to investment companies in the Financial Accounting Standards Board (“FASB”) Accounting Standards Codification Topic 946.
A. Portfolio Valuation
The Fund’s NAV is determined daily, as of the close of regular trading on the New York Stock Exchange ("NYSE"), normally 4:00 p.m. Eastern Time, on each day the NYSE is open for trading. The NAV is computed by dividing the value of all assets of the Fund (including accrued interest and dividends), less all liabilities (including accrued expenses and dividends declared but unpaid), by the total number of shares outstanding.
Portfolio securities listed on any exchange other than the NASDAQ Stock Market LLC (“NASDAQ”) are valued at the last sale price on the business day as of which such value is being determined. If there has been no sale on such day, the securities are valued at the mean of the most recent bid and ask prices on such day. Securities traded on the NASDAQ are valued at the NASDAQ Official Closing Price as determined by NASDAQ. Portfolio securities traded on more than one securities exchange are valued at the last sale price on the business day as of which such value is being determined at the close of the exchange representing the principal market for such securities. Portfolio securities traded in the over-the-counter market, but excluding securities traded on the NASDAQ, are valued at the last quoted sale price in such market.
The Fund’s investments are valued at market value or, in the absence of market value with respect to any portfolio securities, at fair value according to procedures adopted by the Trust’s Board of Trustees (the “Board”). When market quotations are not readily available or when events occur that make established valuation methods unreliable, securities of the Fund may be valued in good faith by or under the direction of the Board. These securities generally include, but are not limited to, restricted securities (securities which may not be publicly sold without registration under the Securities Act of 1933) for which a pricing service is unable to provide a market price; securities whose trading has been formally suspended; a security whose market price is not available from a pre-established primary pricing source or the pricing source is not willing to provide a price; a security with respect to which an event has occurred that is most likely to materially affect the value of the security after the market has closed but before the calculation of the Fund’s NAV or make it difficult or impossible to obtain a reliable market quotation; or a security whose price, as provided by the pricing service, does not reflect the security’s “fair value” due to the security being de-listed from a national exchange or the security’s primary trading market is temporarily closed at a time when, under normal conditions, it would be open. As a general principle, the current “fair value” of a security would be the amount which the owner might reasonably expect to receive from the sale on the applicable exchange or principal market. A variety of factors may be considered in determining the fair value of such securities.
9 | May 31, 2022
ALPS Active REIT ETF
| Notes to Financial Statements | May 31, 2022 (Unaudited) |
B. Fair Value Measurements
The Fund discloses the classification of its fair value measurements following a three-tier hierarchy based on the inputs used to measure fair value. Inputs refer broadly to the assumptions that market participants would use in pricing the asset or liability, including assumptions about risk. Inputs may be observable or unobservable. Observable inputs reflect the assumptions market participants would use in pricing the asset or liability that are developed based on market data obtained from sources independent of the reporting entity. Unobservable inputs reflect the reporting entity’s own assumptions about the assumptions market participants would use in pricing the asset or liability that are developed based on the best information available.
Valuation techniques used to value the Fund’s investments by major category are as follows:
Equity securities, including restricted securities, for which market quotations are readily available, are valued at the last reported sale price or official closing price as reported by a third party pricing vendor on the primary market or exchange on which they are traded and are categorized as Level 1 in the hierarchy. In the event there were no sales during the day or closing prices are not available, securities are valued at the mean of the most recent quoted bid and ask prices on such day and are generally categorized as Level 2 in the hierarchy. Investments in open-end mutual funds are valued at their closing NAV each business day and are categorized as Level 1 in the hierarchy.
Changes in valuation techniques may result in transfers in or out of an assigned level within the disclosure hierarchy.
Various inputs are used in determining the value of the Fund’s investments as of the end of the reporting period. When inputs used fall into different levels of the fair value hierarchy, the level in the hierarchy within which the fair value measurement falls is determined based on the lowest level input that is significant to the fair value measurement in its entirety. The designated input levels are not necessarily an indication of the risk or liquidity associated with these investments.
These inputs are categorized in the following hierarchy under applicable financial accounting standards:
| Level 1 – | Unadjusted quoted prices in active markets for identical investments, unrestricted assets or liabilities that a Fund has the ability to access at the measurement date; |
| Level 2 – | Quoted prices which are not active, quoted prices for similar assets or liabilities in active markets or inputs other than quoted prices that are observable (either directly or indirectly) for substantially the full term of the asset or liability; and |
| Level 3 – | Significant unobservable prices or inputs (including the Fund’s own assumptions in determining the fair value of investments) where there is little or no market activity for the asset or liability at the measurement date. |
The following is a summary of inputs used to value the Fund’s investments as of May 31, 2022:
ALPS Active REIT ETF
| Investments in Securities at Value | Level 1 - Quoted and Unadjusted Prices | Level 2 - Other Significant Observable Inputs | Level 3 - Significant Unobservable Inputs | Total | ||||||||||||
| Common Stocks* | $ | 19,041,656 | $ | – | $ | – | $ | 19,041,656 | ||||||||
| Short Term Investments | 543,902 | – | – | 543,902 | ||||||||||||
| Total | $ | 19,585,558 | $ | – | $ | – | $ | 19,585,558 | ||||||||
| * | For a detailed breakdown of sectors, see the accompanying Schedule of Investments. |
The Fund did not have any securities that used significant unobservable inputs (Level 3) in determining fair value and there were no transfers into or out of Level 3 during the six months ended May 31, 2022.
C. Securities Transactions and Investment Income
Securities transactions are recorded as of the trade date. Realized gains and losses from securities transactions are recorded on the specific identification in accordance with GAAP. Dividend income and capital gains distributions, if any, are recorded on the ex-dividend date. Interest income, if any, is recorded on the accrual basis.
D. Dividends and Distributions to Shareholders
Dividends from net investment income of the Fund, if any, are declared and paid quarterly or as the Board may determine from time to time. Distributions of net realized capital gains earned by the Fund, if any, are distributed at least annually.
10 | May 31, 2022
ALPS Active REIT ETF
| Notes to Financial Statements | May 31, 2022 (Unaudited) |
E. Federal Tax and Tax Basis Information
The timing and character of income and capital gain distributions are determined in accordance with income tax regulations, which may differ from U.S. GAAP. Reclassifications are made to the Fund’s capital accounts for permanent tax differences to reflect income and gains available for distribution (or available capital loss carryforwards) under income tax regulations. The amounts and characteristics of tax basis distributions and composition of distributable earnings/(accumulated losses) are finalized at fiscal year-end; accordingly, tax basis balances have not been determined as of May 31, 2022.
The tax character of the distributions paid during the period starting with the commencement of operations and ending November 30, 2021 was as follows:
| Ordinary Income | Long-Term Capital Gain | Return of Capital | ||||||||||
| November 30, 2021 | ||||||||||||
| ALPS Active REIT ETF | $ | 277,240 | $ | – | $ | – | ||||||
As of May 31, 2022, the cost of investments for federal income tax purposes and accumulated net unrealized appreciation/(depreciation) on investments were as follows:
| ALPS Active REIT ETF | ||||
| Gross appreciation (excess of value over tax cost) | $ | 1,188,187 | ||
| Gross depreciation (excess of tax cost over value) | (780,997 | ) | ||
| Net unrealized appreciation (depreciation) | $ | 407,190 | ||
| Cost of investments for income tax purposes | $ | 19,178,368 | ||
The differences between book-basis and tax-basis are primarily due to the deferral of losses from wash sales. In addition, certain tax cost basis adjustments are finalized at fiscal year-end and therefore have not been determined as of May 31, 2022.
F. Real Estate Investment Trusts (“REITs”)
As part of its investments in real estate related securities, the Fund will invest in REITs and is subject to certain risks associated with direct investment in REITs. REITs possess certain risks which differ from an investment in common stocks. REITs are financial vehicles that pool investors’ capital to acquire, develop and/or finance real estate and provide services to their tenants. REITs may concentrate their investments in specific geographic areas or in specific property types, e.g., regional malls, shopping centers, office buildings, apartment buildings and industrial warehouses. REITs may be affected by changes in the value of their underlying properties and by defaults by borrowers or tenants. REITs depend generally on their ability to generate cash flow to make distributions to shareowners, and certain REITs have self-liquidation provisions by which mortgages held may be paid in full and distributions of capital returns may be made at any time.
As REITs generally pay a higher rate of dividends than most other operating companies, to the extent application of the Fund's investment strategy results in the Fund investing in REIT shares, the percentage of the Fund's dividend income received from REIT shares will likely exceed the percentage of the Fund's portfolio that is comprised of REIT shares. Distributions received by the Fund from REITs may consist of dividends, capital gains and/or return of capital.
Dividend income from REITs is recognized on the ex-dividend date. The calendar year-end amounts of ordinary income, capital gains, and return of capital included in distributions received from the Fund's investments in REITs are reported to the Fund after the end of the calendar year; accordingly, the Fund estimates these amounts for accounting purposes until the characterization of REIT distributions is reported to the Fund after the end of the calendar year. Estimates are based on the most recent REIT distribution information available.
The performance of a REIT may be affected by its failure to qualify for tax-free pass-through of income under the Internal Revenue Code of 1986, as amended (the “Code”), or its failure to maintain exemption from registration under the 1940 Act. Due to the Fund's investments in REITs, the Fund may also make distributions in excess of the Fund's earnings and capital gains. Distributions, if any, in excess of the Fund's earnings and profits will first reduce the adjusted tax basis of a holder’ shares and, after that basis has been reduced to zero, will constitute capital gains to the shareholder.
G. Income Taxes
No provision for income taxes is included in the accompanying financial statements, as the Fund intends to distribute to shareholders all taxable investment income and realized gains and otherwise comply with Subchapter M of the Code applicable to regulated investment companies. The Fund evaluates tax positions taken (or expected to be taken) in the course of preparing the Fund’s tax returns to determine whether these positions meet a “more-likely-than-not” standard that, based on the technical merits, have a more than fifty percent likelihood of being sustained by a taxing authority upon examination. A tax position that meets the “more-likely-than-not” recognition threshold is measured to determine the amount of benefit to recognize in the financial statements.
11 | May 31, 2022
ALPS Active REIT ETF
| Notes to Financial Statements | May 31, 2022 (Unaudited) |
As of and during the period ended May 31, 2022, the Fund did not have a liability for any unrecognized tax benefits. The Fund files U.S. federal, state, and local tax returns as required. The Fund’s tax returns are subject to examination by the relevant tax authorities until expiration of the applicable statute of limitations, which is generally three years after the filing of the tax return, but may extend to four years in certain jurisdictions. Tax returns for open years have incorporated no uncertain tax positions that require a provision for income taxes.
H. Lending of Portfolio Securities
The Fund has entered into a securities lending agreement with State Street Bank & Trust Co. (“SSB”), the Fund’s lending agent. The Fund may lend its portfolio securities only to borrowers that are approved by SSB. The Fund will limit such lending to not more than 33 1/3% of the value of its total assets. The Fund’s securities held at SSB as custodian shall be available to be lent except those securities the Fund or ALPS Advisors, Inc. specifically identifies in writing as not being available for lending. The borrower pledges and maintains with the Fund collateral consisting of cash (U.S. Dollars only), securities issued or guaranteed by the U.S. government or its agencies or instrumentalities, and cash equivalents (including irrevocable bank letters of credit) issued by a person other than the borrower or an affiliate of the borrower. The initial collateral received by the Fund is required to have a value of no less than 102% of the market value of the loaned securities for U.S equity securities and a value of no less than 105% of the market value for non-U.S. equity securities. The collateral is maintained thereafter, at a market value equal to not less than 102% of the current value of the U.S. equity securities on loan and not less than 105% of the current value of the non-U.S. equity securities on loan. The market value of the loaned securities is determined at the close of each business day and any additional required collateral is delivered to the Fund on the next business day. During the term of the loan, the Fund is entitled to all distributions made on or in respect of the loaned securities. Loans of securities are terminable at any time and the borrower, after notice, is required to return borrowed securities within the customary time period for settlement of securities transactions.
Any cash collateral received is reinvested in a money market fund managed by SSB as disclosed in the Fund’s Schedule of Investments and is reflected in the Statements of Assets and Liabilities as a payable for collateral upon return of securities loaned. Non-cash collateral, in the form of securities issued or guaranteed by the U.S. government or its agencies or instrumentalities, is not disclosed in the Fund’s Statements of Assets and Liabilities as it is held by the lending agent on behalf of the Fund, and the Fund does not have the ability to re-hypothecate these securities. As of May 31, 2022, the Fund did not have any securities on loan.
3. INVESTMENT ADVISORY FEE AND OTHER AFFILIATED TRANSACTIONS
ALPS Advisors, Inc. (the “Adviser”) serves as the Fund’s investment adviser pursuant to an Investment Advisory Agreement with the Trust on behalf of the Fund (the “Advisory Agreement”). Pursuant to the Advisory Agreement, the Fund pays the Adviser an annual management fee for the services and facilities it provides, payable on a monthly basis at the annual rate of 0.68% of the Fund’s average daily net assets.
Out of the unitary management fee, the Adviser pays substantially all expenses of the Fund, including the cost of sub-advisory, transfer agency, custody, fund administration, legal, audit, trustees and other services, except for acquired fund fees and expenses, interest expenses, distribution fees or expenses, brokerage expenses, taxes and extraordinary expenses not incurred in the ordinary course of the Fund's business. The Adviser’s unitary management fee is designed to pay substantially all of the Fund’s expenses and to compensate the Adviser for providing services to the Fund.
GSI Capital Advisors LLC (the “Sub-Adviser”) serves as the Fund's sub-adviser pursuant to a sub-advisory agreement with the Trust (the ‘‘Sub-Advisory Agreement’’). Pursuant to the Sub-Advisory Agreement, the Adviser pays the Sub-Adviser a sub-advisory fee out of the Adviser’s advisory fee for the services it provides. The fee is payable on a monthly basis at the annual rate of 0.35% of the Fund's average daily net assets.
ALPS Fund Services, Inc., an affiliate of the Adviser, is the administrator of the Fund.
Prior to February 16, 2022, each Trustee received (1) a quarterly retainer of $10,000, (2) a per meeting fee of $5,000, (3) $1,500 for any special meeting held outside of a regularly scheduled board meeting, and (4) reimbursement for all reasonable out-of-pocket expenses relating to attendance at meetings. In addition, the Chairman of the Board and Chairman of the Audit Committee each received a quarterly retainer of $2,000, in connection with their respective roles. Effective February 16, 2022, each Trustee receives (1) a quarterly retainer of $20,000, (2) a per meeting fee of $10,000, (3) $2,500 for any special meeting held outside of a regularly scheduled board meeting, and (4) reimbursement for all reasonable out-of-pocket expenses relating to attendance at meetings. In addition, the Chairman of the Board receives a quarterly retainer of $5,000, the Chairman of the Audit Committee receives a quarterly retainer of $3,000, and the Chairman of the Nominating & Governance Committee receives a quarterly retainer of $2,000, each in connection with their respective roles.
12 | May 31, 2022
ALPS Active REIT ETF
| Notes to Financial Statements | May 31, 2022 (Unaudited) |
4. PURCHASES AND SALES OF SECURITIES
For the six months ended May 31, 2022, the cost of purchases and proceeds from sales of investment securities, excluding short-term investments and in-kind transactions, were as follows:
| Fund | Purchases | Sales | ||||||
| ALPS Active REIT ETF | $ | 13,065,028 | $ | 13,749,604 |
For the six months ended May 31, 2022, the cost of in-kind purchases and proceeds from in-kind sales were as follows:
| Fund | Purchases | Sales | ||||||
| ALPS Active REIT ETF | $ | 4,067,735 | $ | 7,055,867 |
For the six months ended May 31, 2022, the ALPS Active REIT ETF had in-kind net realized gain of $68,703.
Gains on in-kind transactions are not considered taxable for federal income tax purposes and losses on in-kind transactions are also not deductible for tax purposes.
5. CAPITAL SHARE TRANSACTIONS
Shares are created and redeemed by the Fund only in Creation Unit size aggregations of 5,000 Shares. Only broker-dealers or large institutional investors with creation and redemption agreements called Authorized Participants (“AP”) are permitted to purchase or redeem Creation Units from the Fund. Such transactions are generally permitted on an in-kind basis, with a balancing cash component to equate the transaction to the NAV per unit of the Fund on the transaction date. Cash may be substituted equivalent to the value of certain securities generally when they are not available in sufficient quantity for delivery, not eligible for trading by the AP or as a result of other market circumstances.
6. MARKET RISK
The Fund is subject to investment and operational risks associated with financial, economic and other global market developments and disruptions, including the recent spread of an infectious respiratory illness caused by a novel strain of coronavirus (known as COVID-19), which can negatively impact the securities markets and cause the Fund to lose value. Securities in the Fund’s portfolio may underperform in comparison to securities in general financial markets, a particular financial market or other asset classes due to a number of factors, including inflation (or expectations for inflation), deflation (or expectations for deflation), interest rates, global demand for particular products or resources, market instability, debt crises and downgrades, embargoes, tariffs, sanctions and other trade barriers, regulatory events, other governmental trade or market control programs and related geopolitical events. In addition, the value of the Fund’s investments may be negatively affected by the occurrence of global events such as war, terrorism, environmental disasters, natural disasters or events, country instability, and infectious disease epidemics or pandemics.
The spread of COVID-19 has caused volatility, severe market dislocations and liquidity constraints in many markets, including markets for the securities the Fund holds, and may adversely affect the Fund’s investments and operations. The transmission of COVID-19 and efforts to contain its spread have resulted in travel restrictions and disruptions, closed international borders, enhanced health screenings at ports of entry and elsewhere, disruption of and delays in healthcare service preparation and delivery, quarantines, event and service cancellations or interruptions, disruptions to business operations and supply chains, and a reduction in consumer and business spending, as well as general concern and uncertainty that has negatively affected the economy. These disruptions have led to instability in the market place and the jobs market. The impact of COVID-19 could adversely affect the economies of many nations or the entire global economy, the financial well-being and performance of individual issuers, borrowers and sectors and the health of the markets generally in potentially significant and unforeseen ways.
The foregoing could lead to a significant economic downturn or recession, increased market volatility, a greater number of market closures, higher default rates and adverse effects on the values and liquidity of the Fund’s securities or other assets. Such impacts may adversely affect the performance of the Fund.
13 | May 31, 2022
ALPS Active REIT ETF
| Notes to Financial Statements | May 31, 2022 (Unaudited) |
7. SUBSEQUENT EVENTS
Effective as of the close of business on March 31, 2022, Deloitte & Touche LLP (“Deloitte”) resigned as the independent registered public accounting firm for the Fund. The report of Deloitte on the Fund’s financial statements as of and for the period ended November 30, 2021 did not contain an adverse opinion or a disclaimer of opinion, and was not qualified or modified as to uncertainties, audit scope or accounting principles. During the Fund’s period ended November 30, 2021 and through March 31, 2022, there were no disagreements between the Fund and Deloitte on any matter of accounting principles or practices, financial statement disclosure or auditing scope or procedure, which disagreements, if not resolved to the satisfaction of Deloitte, would have caused it to make reference to the subject matter of the disagreements in its report on the financial statements of the Fund for such period. During the Fund’s fiscal period ended November 30, 2021 there were no “reportable events” (as defined in Item 304(a)(1)(v) of Regulation S-K under the Securities Exchange Act of 1934, as amended (the “Exchange Act”).
During the Fund’s fiscal period ended November 30, 2021 and during the subsequent interim period through March 31, 2022, neither the Fund, nor anyone on their behalf, consulted with Deloitte, on behalf of the Fund, regarding any matter that was either the subject of a “disagreement,” as defined in Item 304(a)(1)(iv) of Regulation S-K under the Securities Exchange Act of 1934, as amended (the “Exchange Act”), and the instructions thereto, or a “reportable event,” as defined in Item 304(a)(1)(v) of Regulation S-K under the Exchange Act.
On June 21, 2022, upon the recommendation of the Fund’s Audit Committee, the Board of Trustees of the Fund approved the engagement of BBD, LLP (“BBD”) as the independent registered public accounting firm for the Fund for the fiscal year ending November 30, 2022. The Board and its Audit Committee considered the engagement of BBD in connection with the resignation of the Fund’s former independent registered accounting firm on March 31, 2022.
14 | May 31, 2022
ALPS Active REIT ETF
| Additional Information | May 31, 2022 (Unaudited) |
PROXY VOTING RECORDS, POLICIES AND PROCEDURES
Information regarding how the Fund voted proxies relating to portfolio securities during the most recent 12-month period ended June 30 and a description of the Fund’s proxy voting policies and procedures used in determining how to vote for proxies are available without charge on the SEC’s website at www.sec.gov and upon request, by calling (toll-free) 1-866-759-5679.
PORTFOLIO HOLDINGS
The Fund files a complete schedule of portfolio holdings with the U.S. Securities and Exchange Commission (“SEC”) for the first and third quarters of each fiscal year on Form N-PORT within 60 days after the end of the period. Copies of the Fund’s Form N-PORT are available without a charge, upon request, by contacting the Fund at 1-866-759-5679 and on the SEC’s website at https://www.sec.gov.
TAX INFORMATION
The ALPS Active REIT ETF designates the following as a percentage of taxable ordinary income distributions, or up to the maximum amount allowable, for the calendar year ended December 31, 2021:
| Qualified Dividend Income | Dividend Received Deduction | 199A | |
| ALPS Active REIT ETF | 0.00% | 0.00% | 20.33% |
In early 2022, if applicable, shareholders of record received this information for the distributions paid to them by the Fund during the calendar year 2021 via Form 1099. The Fund will notify shareholders in early 2023 of amounts paid to them by the Fund, if any, during the calendar year 2022.
15 | May 31, 2022
ALPS Active REIT ETF
| Liquidity Risk Management Program | May 31, 2022 (Unaudited) |
In compliance with the Securities and Exchange Commission’s liquidity risk management rule (the “Liquidity Rule”), the ALPS ETF Trust (the “Trust”) has established a liquidity risk management program (the “Program”) to govern the Trust’s approach to managing liquidity risk for each series of the Trust (each a “Fund”). The Program is overseen by the Liquidity Committee (the “Committee”), a committee comprised of representatives of the Trust’s investment adviser, ALPS Advisors, Inc. The Trust’s Board of Trustees (the “Board”) has approved the designation of the Committee to oversee the Program.
The Program’s principal objectives include supporting each Fund’s compliance with limits on investments in illiquid assets and assessing and managing the risk that a Fund will be unable to meet its redemption obligations without significant dilution of remaining investors’ interests in the Fund. The Program includes a number of elements that support the management and assessment of liquidity risk, including an annual assessment of factors that influence a Fund’s liquidity and, for Funds that are not “In-Kind ETFs,” the periodic classification and re-classification of such Fund’s investments into groupings that reflect the Committee’s assessment of their liquidity under current market conditions.
At a meeting of the Board held on March 7, 2022, the Trustees received a report from the Committee regarding the design and operational effectiveness of the Program for the period January 1, 2021 through December 31, 2021 (the “Period”). The Committee determined, and reported to the Board, that the Program has been operating effectively to assess and manage each Fund’s liquidity risk and has been and continues to be adequately and effectively implemented to monitor and (as applicable) respond to the Funds’ liquidity developments.
The Committee reported that during the period covered by the report, there were no liquidity events that impacted the Funds or their ability to timely meet redemptions without dilution to existing shareholders. The report also discussed notable events affecting liquidity over the Period, including extended market holidays and closures in certain countries. Among other things, the Committee’s report noted that no Fund is required to have a highly liquid investment minimum based either on its status as an In-Kind ETF or on its ability to rely on another exemption under the Liquidity Rule. The Committee’s report further noted that no material changes have been made to the Program since its implementation.
16 | May 31, 2022


Table of Contents
| Performance Overview | 1 |
| Disclosure of Fund Expenses | 3 |
| Financial Statements | |
| Schedule of Investments | 4 |
| Statement of Assets and Liabilities | 5 |
| Statement of Operations | 6 |
| Statements of Changes in Net Assets | 7 |
| Financial Highlights | 8 |
| Notes to Financial Statements | 9 |
| Additional Information | 15 |
| Liquidity Risk Management Program | 16 |
alpsfunds.com
| ALPS Equal Sector Weight ETF | |
| Performance Overview | May 31, 2022 (Unaudited) |
Investment Objective
The ALPS Equal Sector Weight ETF (the “Fund”) seeks investment results that replicate as closely as possible, before fees and expenses, the performance of the NYSE Equal Sector Weight IndexSM (the “Underlying Index”).
The Underlying Index is an index of ETFs comprised of all active Select Sector SPDR® ETFs in an equal weighted portfolio. These are the Communication Services Select Sector SPDR® Fund, Consumer Discretionary Select Sector SPDR® Fund, Consumer Staples Select Sector SPDR® Fund, Materials Select Sector SPDR® Fund, Energy Select Sector SPDR® Fund, Technology Select Sector SPDR® Fund, Utilities Select Sector SPDR® Fund, Financial Select Sector SPDR® Fund, Industrial Select Sector SPDR® Fund, Health Care Select Sector SPDR® Fund and Real Estate Select Sector SPDR® Fund (each, an “Underlying Sector ETF” and collectively, the “Underlying Sector ETFs”). In order to track the Underlying Index, the Fund will use a “fund of funds” approach, and seek to achieve its investment objective by investing at least 90% of its total assets in the shares of the Underlying Sector ETFs.
The Underlying Index is designed to track performance of the equally weighted Underlying Sector ETFs. Accordingly, the Underlying Index is rebalanced to an equal weighting quarterly during the months of March, June, September, and December.
Each Underlying Sector ETF is an “index fund” that invests in the equity securities of companies in a particular sector or group of industries. The objective of each Underlying Sector ETF is to track its respective underlying sector index by replicating the securities in the underlying sector index. Together, the eleven Underlying Sector ETFs represent the Underlying Index as a whole.
Performance (as of May 31, 2022)
| 6 Months | 1 Year | 5 Year | 10 Year | Since Inception^ | |
| ALPS Equal Sector Weight ETF - NAV | -0.03% | 5.19% | 12.42% | 13.22% | 13.91% |
| ALPS Equal Sector Weight ETF - Market Price* | -0.05% | 5.22% | 12.42% | 13.22% | 13.92% |
| NYSE® Equal Sector Weight Total Return Index | 0.04% | 5.32% | 12.59% | 13.45% | 14.18% |
| S&P 500® Total Return Index | -8.85% | -0.30% | 13.38% | 14.40% | 14.82% |
Total Expense Ratio (per the current Prospectus) is 0.48%. Net Expense Ratio (per the current Prospectus) is 0.27%. Net expense ratio reflects the reimbursement of distribution fees for underlying sector ETFs. In addition, the Adviser has contractually agreed, through March 31, 2023, to reduce its advisory fee by 0.19%. This fee waiver may only be terminated by the Fund’s Board of Trustees (and not by the Adviser) prior to such date. Please see the prospectus for additional information.
Performance data quoted represents past performance. Past performance does not guarantee future results. Total return figures assume reinvestment of dividends and capital gains distributions, if any. The table does not reflect the deduction of taxes that a shareholder would pay on Fund distributions or the redemption of Fund shares. Investment return and principal value of an investment will fluctuate so that an investor’s shares, when sold or redeemed, may be worth more or less than the original cost. Current performance data may be higher or lower than actual data quoted. For the most current month-end performance data please visit www.alpsfunds.com or call 1.866.675.2639.
NAV is an exchange-traded fund’s per-share value. The per-share dollar amount of the Fund is derived by dividing the total value of all the securities in its portfolio, less any liabilities, by the number of Fund shares outstanding. Market Price is the price at which a share can currently be traded in the market. Information detailing the number of days the Market Price of the Fund was greater than the Fund’s NAV and the number of days it was less than the Fund’s NAV can be obtained at www.alpsfunds.com.
| ^ | The Fund commenced Investment Operations on July 6, 2009 with an Inception Date, the first day of trading on the Exchange, of July 7, 2009. |
| * | Market Price means the official closing price of a share or, if it more accurately reflects the market value of a share at the time as of which the Fund calculates current net asset value per share, the price that is the midpoint of the bid-ask spread as of that time. It does not represent the returns an investor would receive if shares were traded at other times. |
The NYSE® Equal Sector Weight Total Return Index consists of a strategy that holds all active Select Sector SPDR® ETFs in an equal-weighted portfolio. Total return assumes reinvestment of any dividends and distributions realized during a given time period.
S&P 500® Total Return Index: the Standard & Poor’s composite index of 500 stocks, a widely recognized, unmanaged index of common stock prices. Total return assumes reinvestment of any dividends and distributions realized during a given time period.
The indexes are not actively managed and do not reflect any deductions for fees, expenses or taxes. The indexes are reported on a total return basis, which assumes reinvestment of any dividends and distributions realized during a given time period. One cannot invest directly in an index. Index performance does not reflect fund performance.
The Fund’s shares are not individually redeemable. Investors buy and sell shares of the Fund on a secondary market. Only market makers or “authorized participants” may trade directly with the Fund, typically in blocks of 25,000 shares.
The ALPS Equal Sector Weight ETF is not suitable for all investors. Investments in the Fund are subject to investment risks, including possible loss of the principal amount invested.
ALPS Portfolio Solutions Distributor, Inc., a FINRA member, is the distributor for the Fund.
1 | May 31, 2022
| ALPS Equal Sector Weight ETF | |
| Performance Overview | May 31, 2022 (Unaudited) |
The following table shows the sector weights of both the Fund and the S&P 500® Total Return Index as of May 31, 2022:
Sector Weighting Comparison (as of May 31, 2022)
| EQL* | S&P 500® | +/- | |
| Energy | 11.1% | 4.8% | 6.3% |
| Utilities | 9.9% | 3.0% | 6.9% |
| Consumer Staples | 9.5% | 6.5% | 3.0% |
| Materials | 9.4% | 2.8% | 6.6% |
| Healthcare | 9.1% | 14.4% | -5.3% |
| Real Estate | 8.8% | 2.8% | 6.0% |
| Industrials | 8.7% | 7.8% | 0.9% |
| Financials | 8.6% | 11.2% | -2.6% |
| Technology | 8.6% | 27.0% | -18.5% |
| Communication Services | 8.3% | 8.8% | -0.5% |
| Consumer Discretionary | 8.0% | 10.9% | -2.9% |
| Total | 100.0% | 100.0% |
Source: S&P 500®
| * | % of Total Investments (excluding investments purchased with collateral from securities loaned). |
Future holdings are subject to change.
Growth of $10,000 (as of May 31, 2022)
Comparison of Change in Value of $10,000 Investment in the Fund and the Indexes
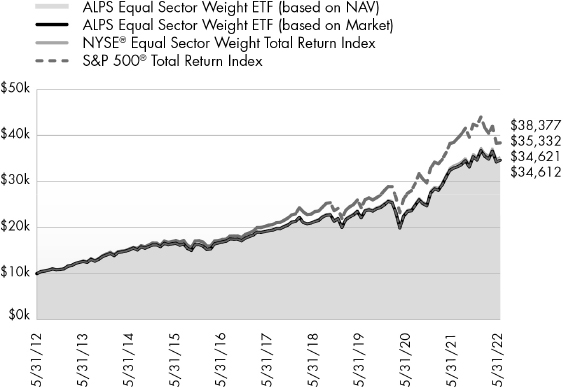
The chart above compares historical performance of a hypothetical investment of $10,000 in the Fund over the past ten years including dividend reinvestment with the performance of the Fund’s benchmark index. Results include the reinvestment of all dividends and capital gain distributions. Past performance does not guarantee future results. The chart does not reflect the deduction of taxes that a shareholder would pay on Fund distributions or the redemption of Fund shares.
2 | May 31, 2022
| ALPS Equal Sector Weight ETF | |
| Disclosure of Fund Expenses | May 31, 2022 (Unaudited) |
Shareholder Expense Example: As a shareholder of the Fund, you incur certain ongoing costs, including management fees and other Fund expenses. These examples are intended to help you understand your ongoing costs (in dollars) of investing in the Fund and to compare these costs with the ongoing costs of investing in other funds. The example is based on an investment of $1,000 invested at the beginning of the six month period and held through May 31, 2022.
Actual Return: The first line of the table provides information about actual account values and actual expenses. You may use the information in this line, together with the amount you invested, to estimate the expenses that you incurred over the period. Simply divide your account value by $1,000 (for example, an $8,600 account value divided by $1,000 = 8.6), then multiply the result by the number in the first line under the heading entitled “Expenses Paid During Period” to estimate the expenses attributable to your investment during this period.
Hypothetical 5% Return: The second line of the table provides information about hypothetical account values and hypothetical expenses based on the Fund’s actual expense ratio and an assumed rate of return of 5% per year before expenses, which is not the Fund’s actual return. The hypothetical account values and expenses may not be used to estimate the actual ending account balance or expenses you paid for the period. You may use this information to compare ongoing costs of investing in the Fund and other funds. To do so, compare this 5% hypothetical example with the 5% hypothetical examples that appear in the shareholder reports of other funds.
The expenses shown in the table are meant to highlight ongoing Fund costs only and do not reflect any transaction costs, such as brokerage commissions and other fees to financial intermediaries. Therefore, the second line of the table is useful in comparing ongoing costs only, and will not help you determine the relative total costs of owning different funds. In addition, if these costs were included, your costs would have been higher.
| Beginning Account Value 12/1/21 | Ending Account Value 5/31/22 | Expense Ratio(a) | Expenses Paid During Period 12/1/21 - 5/31/22(b) | |||||||||||||
| ALPS Equal Sector Weight ETF | ||||||||||||||||
| Actual | $ | 1,000.00 | $ | 999.70 | 0.15 | % | $ | 0.75 | ||||||||
| Hypothetical (5% return before expenses) | $ | 1,000.00 | $ | 1,024.18 | 0.15 | % | $ | 0.76 | ||||||||
| (a) | Annualized, based on the Fund's most recent fiscal half year expenses. |
| (b) | Expenses are equal to the Fund's annualized expense ratio multiplied by the average account value over the period, multiplied by the number of days in the most recent fiscal half year (182), divided by 365. |
3 | May 31, 2022
| ALPS Equal Sector Weight ETF | |
| Schedule of Investments | May 31, 2022 (Unaudited) |
| Security Description | Shares | Value | ||||||
| EXCHANGE TRADED FUNDS (100.02%) | ||||||||
| Communication Services (8.32%) | ||||||||
| Communication Services Select | ||||||||
| Sector SPDR Fund | 323,914 | $ | 19,493,144 | |||||
| Consumer Discretionary (8.01%) | ||||||||
| Consumer Discretionary Select | ||||||||
| Sector SPDR Fund(a) | 121,477 | 18,773,056 | ||||||
| Consumer Staples (9.47%) | ||||||||
| Consumer Staples Select | ||||||||
| Sector SPDR Fund(a) | 297,896 | 22,184,315 | ||||||
| Energy (11.14%) | ||||||||
| Energy Select Sector SPDR | ||||||||
| Fund | 299,145 | 26,085,444 | ||||||
| Financials (8.58%) | ||||||||
| Financial Select Sector SPDR | ||||||||
| Fund | 566,703 | 20,100,955 | ||||||
| Healthcare (9.10%) | ||||||||
| Health Care Select Sector SPDR | ||||||||
| Fund(a) | 161,287 | 21,326,980 | ||||||
| Industrials (8.69%) | ||||||||
| Industrial Select Sector SPDR | ||||||||
| Fund | 214,931 | 20,353,966 | ||||||
| Materials (9.43%) | ||||||||
| Materials Select Sector SPDR | ||||||||
| Fund(a) | 256,701 | 22,083,987 | ||||||
| Real Estate (8.83%) | ||||||||
| Real Estate Select Sector SPDR | ||||||||
| Fund(a) | 467,887 | 20,689,963 | ||||||
| Technology (8.54%) | ||||||||
| Technology Select Sector SPDR | ||||||||
| Fund | 142,479 | 20,011,176 | ||||||
| Utilities (9.90%) | ||||||||
| Utilities Select Sector SPDR | ||||||||
| Fund(a) | 312,113 | 23,199,359 | ||||||
| TOTAL EXCHANGE TRADED FUNDS | ||||||||
| (Cost $168,944,054) | 234,302,345 | |||||||
| Shares | Value | |||||||
| SHORT TERM INVESTMENTS (11.88%) | ||||||||
| Investments Purchased with Collateral | ||||||||
| from Securities Loaned (11.88%) | ||||||||
| State Street Navigator Securities Lending Government Money Market Portfolio, 0.80% | ||||||||
| (Cost $27,818,903) | 27,818,903 | 27,818,903 | ||||||
| TOTAL SHORT TERM INVESTMENTS | ||||||||
| (Cost $27,818,903) | 27,818,903 | |||||||
| TOTAL INVESTMENTS (111.90%) | ||||||||
| (Cost $196,762,957) | $ | 262,121,248 | ||||||
| LIABILITIES IN EXCESS OF OTHER ASSETS (-11.90%) | (27,858,732 | ) | ||||||
| NET ASSETS - 100.00% | $ | 234,262,516 | ||||||
| (a) | Security, or a portion of the security position is currently on loan. |
The total market value of securities on loan is $53,519,462.
Common Abbreviations:
SPDR® - Standard & Poor's Depositary Receipts
See Notes to Financial Statements.
4 | May 31, 2022
| ALPS Equal Sector Weight ETF | |
| Statement of Assets and Liabilities | May 31, 2022 (Unaudited) |
| ASSETS: | ||||
| Investments, at value | $ | 262,121,248 | ||
| Dividends receivable | 8,606 | |||
| Total Assets | 262,129,854 | |||
| LIABILITIES: | ||||
| Payable to adviser | 30,788 | |||
| Payable for collateral upon return of securities loaned | 27,818,903 | |||
| Payable to custodian for overdraft | 17,647 | |||
| Total Liabilities | 27,849,691 | |||
| NET ASSETS | $ | 234,280,163 | ||
| NET ASSETS CONSIST OF: | ||||
| Paid-in capital | $ | 168,095,922 | ||
| Total distributable earnings | 66,166,594 | |||
| NET ASSETS | $ | 234,262,516 | ||
| INVESTMENTS, AT COST | $ | 196,762,957 | ||
| PRICING OF SHARES | ||||
| Net Assets | $ | 234,262,516 | ||
| Shares of beneficial interest outstanding (Unlimited number of shares authorized, par value $0.01 per share) | 2,275,000 | |||
| Net Asset Value, offering and redemption price per share | $ | 102.97 | ||
See Notes to Financial Statements.
5 | May 31, 2022
| ALPS Equal Sector Weight ETF | |
| Statement of Operations | For the Six Months Ended May 31, 2022 (Unaudited) |
| INVESTMENT INCOME: | ||||
| Dividends | $ | 2,105,981 | ||
| Securities Lending Income | 43,451 | |||
| Total Investment Income | 2,149,432 | |||
| EXPENSES: | ||||
| Investment adviser fees | 410,509 | |||
| Total Expenses before waiver/reimbursement | 410,509 | |||
| Less fee waiver/reimbursement by investment adviser | (240,222 | ) | ||
| Net Expenses | 170,287 | |||
| NET INVESTMENT INCOME | 1,979,145 | |||
| REALIZED AND UNREALIZED GAIN/(LOSS): | ||||
| Net realized gain on investments(a) | 4,473,519 | |||
| Net change in unrealized appreciation/(depreciation) on investments | (6,614,699 | ) | ||
| NET REALIZED AND UNREALIZED LOSS ON INVESTMENTS | (2,141,180 | ) | ||
| NET DECREASE IN NET ASSETS RESULTING FROM OPERATIONS | $ | (162,035 | ) | |
| (a) | Includes realized gain or loss as a result of in-kind transactions (See Note 4 in Notes to Financial Statements). |
See Notes to Financial Statements.
6 | May 31, 2022
| ALPS Equal Sector Weight ETF |
| Statements of Changes in Net Assets |
| For the Six Months Ended May 31, 2022 (Unaudited) | For the Year Ended November 30, 2021 | |||||||
| OPERATIONS: | ||||||||
| Net investment income | $ | 1,979,145 | $ | 3,568,055 | ||||
| Net realized gain | 4,473,519 | 7,438,861 | ||||||
| Net change in unrealized appreciation/depreciation | (6,614,699 | ) | 32,612,619 | |||||
| Net increase/(decrease) in net assets resulting from operations | (162,035 | ) | 43,619,535 | |||||
| DISTRIBUTIONS TO SHAREHOLDERS: | ||||||||
| From distributable earnings | (2,073,340 | ) | (3,568,055 | ) | ||||
| From tax return of capital | - | (37,609 | ) | |||||
| Total distributions | (2,073,340 | ) | (3,605,664 | ) | ||||
| CAPITAL SHARE TRANSACTIONS: | ||||||||
| Proceeds from sale of shares | 36,677,467 | 27,797,544 | ||||||
| Cost of shares redeemed | (8,076,000 | ) | (24,055,755 | ) | ||||
| Net increase from capital share transactions | 28,601,467 | 3,741,789 | ||||||
| Net increase in net assets | 26,366,092 | 43,755,660 | ||||||
| NET ASSETS: | ||||||||
| Beginning of period | 207,896,424 | 164,140,764 | ||||||
| End of period | $ | 234,262,516 | $ | 207,896,424 | ||||
| OTHER INFORMATION: | ||||||||
| CAPITAL SHARE TRANSACTIONS: | ||||||||
| Beginning shares | 2,000,000 | 1,950,000 | ||||||
| Shares sold | 350,000 | 250,000 | ||||||
| Shares redeemed | (75,000 | ) | (200,000 | ) | ||||
| Shares outstanding, end of period | 2,275,000 | 2,000,000 | ||||||
See Notes to Financial Statements.
7 | May 31, 2022
| ALPS Equal Sector Weight ETF | |
| Financial Highlights | For a Share Outstanding Throughout the Periods Presented |
| For the Six Months Ended May 31, 2022 (Unaudited) | For the Year Ended November 30, 2021 | For the Year Ended November 30, 2020 | For the Year Ended November 30, 2019 | For the Year Ended November 30, 2018 | For the Year Ended November 30, 2017 | |||||||||||||||||||
| NET ASSET VALUE, BEGINNING OF PERIOD | $ | 103.95 | $ | 84.17 | $ | 78.33 | $ | 70.34 | $ | 69.28 | $ | 59.74 | ||||||||||||
| INCOME FROM OPERATIONS: | ||||||||||||||||||||||||
| Net investment income(a) | 0.94 | 1.76 | 1.91 | 1.53 | 1.50 | 1.37 | ||||||||||||||||||
| Net realized and unrealized gain/(loss) | (0.92 | ) | 19.82 | 5.84 | 8.03 | 1.02 | 10.03 | |||||||||||||||||
| Total from investment operations | 0.02 | 21.58 | 7.75 | 9.56 | 2.52 | 11.40 | ||||||||||||||||||
| DISTRIBUTIONS: | ||||||||||||||||||||||||
| From net investment income | (1.00 | ) | (1.78 | ) | (1.90 | ) | (1.57 | ) | (1.46 | ) | (1.86 | ) | ||||||||||||
| From tax return of capital | - | (0.02 | ) | (0.01 | ) | - | - | - | ||||||||||||||||
| Total distributions | (1.00 | ) | (1.80 | ) | (1.91 | ) | (1.57 | ) | (1.46 | ) | (1.86 | ) | ||||||||||||
| NET INCREASE/(DECREASE) IN NET ASSET VALUE | (0.98 | ) | 19.78 | 5.84 | 7.99 | 1.06 | 9.54 | |||||||||||||||||
| NET ASSET VALUE, END OF PERIOD | $ | 102.97 | $ | 103.95 | $ | 84.17 | $ | 78.33 | $ | 70.34 | $ | 69.28 | ||||||||||||
| TOTAL RETURN(b) | (0.03 | )% | 25.89 | % | 10.37 | % | 13.86 | % | 3.66 | % | 19.46 | % | ||||||||||||
| RATIOS/SUPPLEMENTAL DATA: | ||||||||||||||||||||||||
| Net assets, end of period (in 000s) | $ | 234,263 | $ | 207,896 | $ | 164,141 | $ | 168,407 | $ | 154,742 | $ | 166,284 | ||||||||||||
| RATIOS TO AVERAGE NET ASSETS | ||||||||||||||||||||||||
| Ratio of expenses excluding waiver/reimbursement to average net assets | 0.37 | %(c) | 0.37 | % | 0.37 | % | 0.37 | % | 0.37 | % | 0.37 | % | ||||||||||||
| Ratio of expenses including waiver/reimbursement to average net assets | 0.15 | %(c) | 0.15 | % | 0.15 | % | 0.15 | % | 0.15 | % | 0.15 | % | ||||||||||||
| Ratio of net investment income excluding waiver/reimbursement to average net assets | 1.57 | %(c) | 1.59 | % | 2.31 | % | 1.89 | % | 1.92 | % | 1.92 | % | ||||||||||||
| Ratio of net investment income including waiver/reimbursement to average net assets | 1.78 | %(c) | 1.81 | % | 2.53 | % | 2.11 | % | 2.14 | % | 2.14 | % | ||||||||||||
| Portfolio turnover rate(d) | 11 | % | 8 | % | 11 | % | 4 | % | 14 | % | 5 | % | ||||||||||||
| (a) | Based on average shares outstanding during the period. |
| (b) | Total return is calculated assuming an initial investment made at the net asset value at the beginning of the period and redemption at the net asset value on the last day of the period and assuming all distributions are reinvested at the reinvestment prices. Total return calculated for a period of less than one year is not annualized. |
| (c) | Annualized. |
| (d) | Portfolio turnover for periods less than one year are not annualized and does not include securities received or delivered from processing creations or redemptions in-kind. |
See Notes to Financial Statements.
8 | May 31, 2022
| ALPS Equal Sector Weight ETF | |
| Notes to Financial Statements | May 31, 2022 (Unaudited) |
1. ORGANIZATION
ALPS ETF Trust (the “Trust”), a Delaware statutory trust, is an open-end management investment company registered under the Investment Company Act of 1940, as amended (the “1940 Act”). As of May 31, 2022, the Trust consists of nineteen separate portfolios. Each portfolio represents a separate series of the Trust. This report pertains solely to the ALPS Equal Sector Weight ETF (the “Fund”). The investment objective of the Fund is to seek investment results that replicate as closely as possible, before fees and expenses, the performance of the NYSE® Equal Sector Weight Index (the “Underlying Index”). The Fund is considered non-diversified and may invest a greater portion of assets in securities of individual issuers than a diversified fund. As a result, changes in the market value of a single investment could cause greater fluctuations in share price than would occur in a diversified fund.
The Fund’s Shares (“Shares”) are listed on the NYSE Arca, Inc. The Fund issues and redeems Shares at net asset value (“NAV”) in blocks of 25,000 Shares each of which is called a “Creation Unit”. Creation Units are issued and redeemed principally in-kind for securities included in the Underlying Index. Except when aggregated in Creation Units, Shares are not redeemable securities of the Fund. On October 1, 2021, the Fund reduced its Creation Unit size from 50,000 to 25,000 shares.
Pursuant to the Trust’s organizational documents, its Officers and Trustees are indemnified against certain liability arising out of the performance of their duties to the Trust. Additionally, in the normal course of business, the Trust enters into contracts with service providers that contain general indemnification clauses. The Trust’s maximum exposure under these arrangements is unknown, as this would involve future claims that may be made against the Trust that have not yet occurred.
2. SIGNIFICANT ACCOUNTING POLICIES
The following is a summary of significant accounting policies consistently followed by the Fund in the preparation of the financial statements. The accompanying financial statements were prepared in accordance with accounting principles generally accepted in the United States of America (“U.S. GAAP”). The preparation of financial statements in conformity with U.S. GAAP requires management to make certain estimates and assumptions that affect the reported amounts of assets and liabilities and disclosures of contingent assets and liabilities at the date of the financial statements and the reported amounts of revenue and expenses during the period. Actual results could differ from those estimates. The Fund is considered an investment company under U.S. GAAP and follows the accounting and reporting guidance applicable to investment companies in the Financial Accounting Standards Board (“FASB”) Accounting Standards Codification Topic 946.
A. Portfolio Valuation
The Fund’s NAV is determined daily, as of the close of regular trading on the New York Stock Exchange (the “NYSE”), normally 4:00 p.m. Eastern Time, on each day the NYSE is open for trading. The NAV is computed by dividing the value of all assets of the Fund (including accrued interest and dividends), less all liabilities (including accrued expenses and dividends declared but unpaid), by the total number of shares outstanding.
Portfolio securities listed on any exchange other than the NASDAQ Stock Market LLC (“NASDAQ”) are valued at the last sale price on the business day as of which such value is being determined. If there has been no sale on such day, the securities are valued at the mean of the most recent bid and ask prices on such day. Securities traded on the NASDAQ are valued at the NASDAQ Official Closing Price as determined by NASDAQ. Portfolio securities traded on more than one securities exchange are valued at the last sale price on the business day as of which such value is being determined at the close of the exchange representing the principal market for such securities. Portfolio securities traded in the over-the-counter market, but excluding securities traded on the NASDAQ, are valued at the last quoted sale price in such market.
The Fund’s investments are valued at market value or, in the absence of market value with respect to any portfolio securities, at fair value according to procedures adopted by the Trust’s Board of Trustees (the “Board”). When market quotations are not readily available or when events occur that make established valuation methods unreliable, securities of the Fund may be valued in good faith by or under the direction of the Board. These securities generally include, but are not limited to, restricted securities (securities which may not be publicly sold without registration under the Securities Act of 1933) for which a pricing service is unable to provide a market price; securities whose trading has been formally suspended; a security whose market price is not available from a pre-established primary pricing source or the pricing source is not willing to provide a price; a security with respect to which an event has occurred that is most likely to materially affect the value of the security after the market has closed but before the calculation of the Fund’s NAV or make it difficult or impossible to obtain a reliable market quotation; or a security whose price, as provided by the pricing service, does not reflect the security’s “fair value” due to the security being de-listed from a national exchange or the security’s primary trading market is temporarily closed at a time when, under normal conditions, it would be open. As a general principle, the current “fair value” of a security would be the amount which the owner might reasonably expect to receive from the sale on the applicable exchange or principal market. A variety of factors may be considered in determining the fair value of such securities.
9 | May 31, 2022
| ALPS Equal Sector Weight ETF | |
| Notes to Financial Statements | May 31, 2022 (Unaudited) |
B. Fair Value Measurements
The Fund discloses the classification of its fair value measurements following a three-tier hierarchy based on the inputs used to measure fair value. Inputs refer broadly to the assumptions that market participants would use in pricing the asset or liability, including assumptions about risk. Inputs may be observable or unobservable. Observable inputs reflect the assumptions market participants would use in pricing the asset or liability that are developed based on market data obtained from sources independent of the reporting entity. Unobservable inputs reflect the reporting entity’s own assumptions about the assumptions market participants would use in pricing the asset or liability that are developed based on the best information available.
Valuation techniques used to value the Fund’s investments by major category are as follows:
Exchange Traded Funds, for which market quotations are readily available, are valued at the last reported sale price or official closing price as reported by a third party pricing vendor on the primary market or exchange on which they are traded and are categorized as Level 1 in the hierarchy. In the event there were no sales during the day or closing prices are not available, securities are valued at the mean of the most recent quoted bid and ask prices on such day and are generally categorized as Level 2 in the hierarchy. Investments in open-end mutual funds are valued at their closing NAV each business day and are categorized as Level 1 in the hierarchy.
Changes in valuation techniques may result in transfers in or out of an assigned level within the disclosure hierarchy.
Various inputs are used in determining the value of the Fund’s investments as of the end of the reporting period. When inputs used fall into different levels of the fair value hierarchy, the level in the hierarchy within which the fair value measurement falls is determined based on the lowest level input that is significant to the fair value measurement in its entirety. The designated input levels are not necessarily an indication of the risk or liquidity associated with these investments.
These inputs are categorized in the following hierarchy under applicable financial accounting standards:
| Level 1 | - | Unadjusted quoted prices in active markets for identical investments, unrestricted assets or liabilities that the Fund has the ability to access at the measurement date; |
| Level 2 | - | Quoted prices which are not active, quoted prices for similar assets or liabilities in active markets or inputs other than quoted prices that are observable (either directly or indirectly) for substantially the full term of the asset or liability; and |
| Level 3 | - | Significant unobservable prices or inputs (including the Fund’s own assumptions in determining the fair value of investments) where there is little or no market activity for the asset or liability at the measurement date. |
The following is a summary of inputs used to value the Fund’s investments as of May 31, 2022:
ALPS Equal Sector Weight ETF
| Investments in Securities at Value | Level 1 - Quoted and Unadjusted Prices | Level 2 - Other Significant Observable Inputs | Level 3 - Significant Unobservable Inputs | Total | ||||||||||||
| Exchange Traded Funds* | $ | 234,302,345 | $ | - | $ | - | $ | 234,302,345 | ||||||||
| Short Term Investments | 27,818,903 | - | - | 27,818,903 | ||||||||||||
| Total | $ | 262,121,248 | $ | - | $ | - | $ | 262,121,248 | ||||||||
| * | For a detailed breakdown of sectors, see the accompanying Schedule of Investments. |
The Fund did not have any securities that used significant unobservable inputs (Level 3) in determining fair value and there were no transfers into or out of Level 3 during the six months ended May 31, 2022.
C. Securities Transactions and Investment Income
Securities transactions are recorded as of the trade date. Realized gains and losses from securities transactions are recorded on the specific identification in accordance with GAAP. Dividend income and capital gains distributions, if any, are recorded on the ex-dividend date. Interest income, if any, is recorded on the accrual basis.
D. Dividends and Distributions to Shareholders
Dividends from net investment income of the Fund, if any, are declared and paid quarterly or as the Board may determine from time to time. Distributions of net realized capital gains earned by the Fund, if any, are distributed at least annually.
10 | May 31, 2022
| ALPS Equal Sector Weight ETF | |
| Notes to Financial Statements | May 31, 2022 (Unaudited) |
E. Federal Tax and Tax Basis Information
The timing and character of income and capital gain distributions are determined in accordance with income tax regulations, which may differ from U.S. GAAP. Reclassifications are made to the Fund’s capital accounts for permanent tax differences to reflect income and gains available for distribution (or available capital loss carryforwards) under income tax regulations. The amounts and characteristics of tax basis distributions and composition of distributable earnings/(accumulated losses) are finalized at fiscal year-end; accordingly, tax basis balances have not been determined as of May 31, 2022.
The tax character of the distributions paid during the fiscal year ended November 30, 2021 was as follows:
| Ordinary Income | Long-Term Capital Gain | Return of Capital | ||||||||||
| November 30, 2021 | ||||||||||||
| ALPS Equal Sector Weight ETF | $ | 3,568,055 | $ | - | $ | 37,609 | ||||||
The character of distributions made during the year may differ from its ultimate characterization for federal income tax purposes.
Under current law, capital losses maintain their character as short-term or long-term and are carried forward to the next tax year without expiration. As of November 30, 2021, the following amounts are available as carry forwards to the next tax year:
| Fund | Short-Term | Long-Term | ||||||
| ALPS Equal Sector Weight ETF | $ | - | $ | 3,424,546 | ||||
As of May 31, 2022, the cost of investments for federal income tax purposes and accumulated net unrealized appreciation/(depreciation) on investments were as follows:
| ALPS Equal Sector Weight ETF | ||||
| Gross appreciation (excess of value over tax cost) | $ | 68,546,742 | ||
| Gross depreciation (excess of tax cost over value) | (3,384,653 | ) | ||
| Net unrealized appreciation (depreciation) | $ | 65,162,089 | ||
| Cost of investments for income tax purposes | $ | 196,959,159 | ||
The differences between book-basis and tax-basis are primarily due to the deferral of losses from wash sales. In addition, certain tax cost basis adjustments are finalized at fiscal year-end and therefore have not been determined as of May 31, 2022.
F. Income Taxes
No provision for income taxes is included in the accompanying financial statements, as the Fund intends to distribute to shareholders all taxable investment income and realized gains and otherwise comply with Subchapter M of the Internal Revenue Code of 1986, as amended, applicable to regulated investment companies. The Fund evaluates tax positions taken (or expected to be taken) in the course of preparing the Fund’s tax returns to determine whether these positions meet a “more-likely-than-not” standard that, based on the technical merits, have a more than fifty percent likelihood of being sustained by a taxing authority upon examination. A tax position that meets the “more-likely-than-not” recognition threshold is measured to determine the amount of benefit to recognize in the financial statements.
As of and during the six months ended May 31, 2022, the Fund did not have a liability for any unrecognized tax benefits. The Fund files U.S. federal, state, and local tax returns as required. The Fund’s tax returns are subject to examination by the relevant tax authorities until expiration of the applicable statute of limitations, which is generally three years after the filing of the tax return, but may extend to four years in certain jurisdictions. Tax returns for open years have incorporated no uncertain tax positions that require a provision for income taxes.
G. Lending of Portfolio Securities
The Fund has entered into a securities lending agreement with State Street Bank & Trust Co. (“SSB”), the Fund’s lending agent. The Fund may lend its portfolio securities only to borrowers that are approved by SSB. The Fund will limit such lending to not more than 33 1/3% of the value of its total assets. The Fund’s securities held at SSB as custodian shall be available to be lent except those securities the Fund or ALPS Advisors, Inc. specifically identifies in writing as not being available for lending. The borrower pledges and maintains with the Fund collateral consisting of cash (U.S. Dollars only), securities issued or guaranteed by the U.S. government or its agencies or instrumentalities, and cash equivalents (including irrevocable bank letters of credit) issued by a person other than the borrower or an affiliate of the borrower. The initial collateral received by the Fund is required to have a value of no less than 102% of the market value of the loaned securities for U.S equity securities and a value of no less than 105% of the market value for non-U.S. equity securities. The collateral is maintained thereafter, at a market value equal to not less than 102% of the current value of the U.S. equity securities on loan and not less than 105% of the current value of the non-U.S. equity securities on loan. The market value of the loaned securities is determined at the close of each business day and any additional required collateral is delivered to the Fund on the next business day. During the term of the loan, the Fund is entitled to all distributions made on or in respect of the loaned securities. Loans of securities are terminable at any time and the borrower, after notice, is required to return borrowed securities within the customary time period for settlement of securities transactions.
11 | May 31, 2022
| ALPS Equal Sector Weight ETF | |
| Notes to Financial Statements | May 31, 2022 (Unaudited) |
Any cash collateral received is reinvested in a money market fund managed by SSB as disclosed in the Fund’s Schedule of Investments and is reflected in the Statements of Assets and Liabilities as a payable for collateral upon return of securities loaned. Non-cash collateral, in the form of securities issued or guaranteed by the U.S. government or its agencies or instrumentalities, is not disclosed in the Fund’s Statements of Assets and Liabilities as it is held by the lending agent on behalf of the Fund, and the Fund does not have the ability to re-hypothecate these securities. Income earned by the Fund from securities lending activity is disclosed in the Statement of Operations.
The following is a summary of the Fund's securities lending agreement and related cash and non-cash collateral received as of May 31, 2022:
| Market Value of Securities on Loan | Cash Collateral Received | Non-Cash Collateral Received | Total Collateral Received | |||||||||||||
| ALPS Equal Sector Weight ETF | $ | 53,519,462 | $ | 27,818,903 | $ | 28,244,398 | $ | 56,063,301 | ||||||||
The risks of securities lending include the risk that the borrower may not provide additional collateral when required or may not return the securities when due. To mitigate these risks, the Fund benefits from a borrower default indemnity provided by SSB. SSB’s indemnity allows for full replacement of securities lent wherein SSB will purchase the unreturned loaned securities on the open market by applying the proceeds of the collateral, or to the extent such proceeds are insufficient or the collateral is unavailable, SSB will purchase the unreturned loan securities at SSB’s expense. However, the Fund could suffer a loss if the value of the investments purchased with cash collateral falls below the value of the cash collateral received.
The following table reflects a breakdown of transactions accounted for as secured borrowings, the gross obligation by the type of collateral pledged or securities loaned, and the remaining contractual maturity of those transactions as of May 31, 2022:
ALPS Equal Sector Weight ETF Remaining contractual maturity of the agreements
| Securities Lending Transactions | Overnight & Continuous | Up to 30 days | 30-90 days | Greater than 90 days | Total | |||||||||||||||
| Common Stocks | $ | 27,818,903 | $ | - | $ | - | $ | - | $ | 27,818,903 | ||||||||||
| Total Borrowings | 27,818,903 | |||||||||||||||||||
| Gross amount of recognized liabilities for securities lending (collateral received) | $ | 27,818,903 | ||||||||||||||||||
3. INVESTMENT ADVISORY FEE AND OTHER AFFILIATED TRANSACTIONS
ALPS Advisors, Inc. (the “Adviser”) serves as the Fund’s investment adviser pursuant to an Investment Advisory Agreement with the Trust on behalf of the Fund (the “Advisory Agreement”). Pursuant to the Advisory Agreement, the Fund pays the Adviser an annual management fee for the services and facilities it provides, payable on a monthly basis at the annual rate of 0.37% of the Fund’s average daily net assets.
The Adviser has contractually agreed to waive 0.19% of its annual unitary fee payable by the Fund until at least March 31, 2023. The waiver may only be terminated by the Fund's Board of Trustees prior to such date.
ALPS Portfolio Solutions Distributor, Inc. (“APSD”) is both the distributor for the Fund as well as the Select Sector SPDR exchange traded funds (“Underlying Sector ETFs”) that the Fund invests in. As required by exemptive relief obtained by the Underlying Sector ETFs, the Adviser will reimburse the Fund an amount equal to the distribution fee received by APSD from the Underlying Sector ETFs attributable to the Fund’s investment in the Underlying Sector ETFs, for so long as APSD acts as the distributor to the Fund and the Underlying Sector ETFs. Such reimbursement is generally expected to be approximately 0.02% - 0.03% annually.
Out of the unitary management fees, the Adviser pays substantially all expenses of the Fund, including licensing fees to the Underlying Index provider, the cost of transfer agency, custody, fund administration, legal, audit, trustees and other services, except for acquired fund fees and expenses, interest expenses, distribution fees or expenses, brokerage expenses, taxes and extraordinary expenses not incurred in the ordinary course of the Fund's business. The Adviser’s unitary management fee is designed to pay substantially all of the Fund’s expenses and to compensate the Adviser for providing services to the Fund.
12 | May 31, 2022
| ALPS Equal Sector Weight ETF | |
| Notes to Financial Statements | May 31, 2022 (Unaudited) |
ALPS Fund Services, Inc., an affiliate of the Adviser, is the administrator of the Fund.
Prior to February 16, 2022, each Trustee received (1) a quarterly retainer of $10,000, (2) a per meeting fee of $5,000, (3) $1,500 for any special meeting held outside of a regularly scheduled board meeting, and (4) reimbursement for all reasonable out-of-pocket expenses relating to attendance at meetings. In addition, the Chairman of the Board and Chairman of the Audit Committee each received a quarterly retainer of $2,000, in connection with their respective roles. Effective February 16, 2022, each Trustee receives (1) a quarterly retainer of $20,000, (2) a per meeting fee of $10,000, (3) $2,500 for any special meeting held outside of a regularly scheduled board meeting, and (4) reimbursement for all reasonable out-of-pocket expenses relating to attendance at meetings. In addition, the Chairman of the Board receives a quarterly retainer of $5,000, the Chairman of the Audit Committee receives a quarterly retainer of $3,000, and the Chairman of the Nominating & Governance Committee receives a quarterly retainer of $2,000, each in connection with their respective roles.
4. PURCHASES AND SALES OF SECURITIES
For the six months ended May 31, 2022 the cost of purchases and proceeds from sales of investment securities, excluding short-term investments and in-kind transactions, were as follows:
| Fund | Purchases | Sales | ||||||
| ALPS Equal Sector Weight ETF | $ | 12,971,348 | $ | 13,015,875 | ||||
For the six months ended May 31, 2022, the cost of in-kind purchases and proceeds from in-kind sales were as follows:
| Fund | Purchases | Sales | ||||||
| ALPS Equal Sector Weight ETF | $ | 36,677,282 | $ | 8,076,035 | ||||
For the six months ended May 31, 2022, the ALPS Equal Sector Weight ETF had in-kind net realized gain of $4,006,444.
Gains on in-kind transactions are not considered taxable for federal income tax purposes and losses on in-kind transactions are also not deductible for tax purposes.
5. CAPITAL SHARE TRANSACTIONS
Shares are created and redeemed by the Fund only in Creation Unit size aggregations of 25,000 Shares. Only broker-dealers or large institutional investors with creation and redemption agreements called Authorized Participants (“AP”) are permitted to purchase or redeem Creation Units from the Fund. Such transactions are generally permitted on an in-kind basis, with a balancing cash component to equate the transaction to the NAV per unit of the Fund on the transaction date. Cash may be substituted equivalent to the value of certain securities generally when they are not available in sufficient quantity for delivery, not eligible for trading by the AP or as a result of other market circumstances.
6. MARKET RISK
The Fund is subject to investment and operational risks associated with financial, economic and other global market developments and disruptions, including the recent spread of an infectious respiratory illness caused by a novel strain of coronavirus (known as COVID-19), which can negatively impact the securities markets and cause the Fund to lose value. Securities in the Fund’s portfolio may underperform in comparison to securities in general financial markets, a particular financial market or other asset classes due to a number of factors, including inflation (or expectations for inflation), deflation (or expectations for deflation), interest rates, global demand for particular products or resources, market instability, debt crises and downgrades, embargoes, tariffs, sanctions and other trade barriers, regulatory events, other governmental trade or market control programs and related geopolitical events. In addition, the value of the Fund’s investments may be negatively affected by the occurrence of global events such as war, terrorism, environmental disasters, natural disasters or events, country instability, and infectious disease epidemics or pandemics.
The spread of COVID-19 has caused volatility, severe market dislocations and liquidity constraints in many markets, including markets for the securities the Fund holds, and may adversely affect the Fund’s investments and operations. The transmission of COVID-19 and efforts to contain its spread have resulted in travel restrictions and disruptions, closed international borders, enhanced health screenings at ports of entry and elsewhere, disruption of and delays in healthcare service preparation and delivery, quarantines, event and service cancellations or interruptions, disruptions to business operations and supply chains, and a reduction in consumer and business spending, as well as general concern and uncertainty that has negatively affected the economy. These disruptions have led to instability in the market place and the jobs market. The impact of COVID-19 could adversely affect the economies of many nations or the entire global economy, the financial well-being and performance of individual issuers, borrowers and sectors and the health of the markets generally in potentially significant and unforeseen ways.
13 | May 31, 2022
| ALPS Equal Sector Weight ETF | |
| Notes to Financial Statements | May 31, 2022 (Unaudited) |
The foregoing could lead to a significant economic downturn or recession, increased market volatility, a greater number of market closures, higher default rates and adverse effects on the values and liquidity of the Fund’s securities or other assets. Such impacts may adversely affect the performance of the Fund.
7. SUBSEQUENT EVENTS
Effective as of the close of business on March 31, 2022, Deloitte & Touche LLP (“Deloitte”) resigned as the independent registered public accounting firm for the Fund. The report of Deloitte on the Fund’s financial statements as of and for the fiscal years or periods ended November 30, 2021 and November 30, 2020 did not contain an adverse opinion or a disclaimer of opinion, and was not qualified or modified as to uncertainties, audit scope or accounting principles. During the Fund’s fiscal year or period ended November 30, 2021 and November 30, 2020, and through March 31, 2022, there were no disagreements between the Fund and Deloitte on any matter of accounting principles or practices, financial statement disclosure or auditing scope or procedure, which disagreements, if not resolved to the satisfaction of Deloitte, would have caused it to make reference to the subject matter of the disagreements in its report on the financial statements of the Fund for such year or period. During the Fund’s fiscal years or periods ended November 30, 2021 and November 30, 2020, there were no “reportable events” (as defined in Item 304(a)(1)(v) of Regulation S-K under the Securities Exchange Act of 1934, as amended (the “Exchange Act”)).
During the Fund’s fiscal year or period ended November 30, 2021 and November 30, 2020, and during the subsequent interim period through March 31, 2022, neither the Fund, nor anyone on their behalf, consulted with Deloitte, on behalf of the Fund, regarding any matter that was either the subject of a “disagreement,” as defined in Item 304(a)(1)(iv) of Regulation S-K under the Securities Exchange Act of 1934, as amended (the “Exchange Act”), and the instructions thereto, or a “reportable event,” as defined in Item 304(a)(1)(v) of Regulation S-K under the Exchange Act.
On June 21, 2022, upon the recommendation of the Fund’s Audit Committee, the Board of Trustees of the Fund approved the engagement of BBD, LLP (“BBD”) as the independent registered public accounting firm for the Fund for the fiscal year ending November 30, 2022. The Board and its Audit Committee considered the engagement of BBD in connection with the resignation of the Fund’s former independent registered accounting firm on March 31, 2022.
14 | May 31, 2022
| ALPS Equal Sector Weight ETF | |
| Additional Information | May 31, 2022 (Unaudited) |
PROXY VOTING RECORDS, POLICIES AND PROCEDURES
Information regarding how the Fund voted proxies relating to portfolio securities during the most recent 12-month period ended June 30 and a description of the Fund’s proxy voting policies and procedures used in determining how to vote for proxies are available without charge on the SEC’s website at www.sec.gov and upon request, by calling (toll-free) 1-866-759-5679.
PORTFOLIO HOLDINGS
The Fund files a complete schedule of portfolio holdings with the U.S. Securities and Exchange Commission (“SEC”) for the first and third quarters of each fiscal year on Form N-PORT within 60 days after the end of the period. Copies of the Fund’s Form N-PORT are available without a charge, upon request, by contacting the Fund at 1-866-759-5679 and on the SEC’s website at https://www.sec.gov.
TAX INFORMATION
The ALPS Equal Sector Weight ETF designates the following as a percentage of taxable ordinary income distributions, or up to the maximum amount allowable, for the calendar year ended December 31, 2021:
| Qualified Dividend Income | Dividend Received Deduction | |
| ALPS Equal Sector Weight ETF | 88.31% | 85.80% |
In early 2022, if applicable, shareholders of record received this information for the distribution paid to them by the Fund during the calendar year 2021 via Form 1099. The Fund will notify shareholders in early 2023 of amounts paid to them by the Fund, if any, during the calendar year 2022.
LICENSING AGREEMENT
ICE Data Indices, LLC (the “Index Provider”) is not affiliated with the ALPS Equal Sector Weight ETF (the “Fund”) or ALPS Advisors, Inc. (the “Adviser”). The Fund is entitled to use the Underlying Index pursuant to a licensing agreement with the Index Provider and the Adviser. The Adviser pays a licensing fee to the Index Provider out of the management fee.
The only relationship that the Index Provider has with the Fund, the Adviser or Distributor of the Fund in connection with the Fund is that the Index Provider has licensed certain of its intellectual property, including the determination of the component stocks of the Underlying Index and the name of the Underlying Index. The Underlying Index is selected and calculated without regard to the Adviser, Distributor or owners of the Fund. The Index Provider has no obligation to take the specific needs of the Adviser, Distributor or owners of the Fund into consideration in the determination and calculation of the Underlying Index. The Index Provider is not responsible for and has not participated in the determination of pricing or the timing of the issuance or sale of the Shares of the Fund or in the determination or calculation of the net asset value of the Fund. The Index Provider has no obligation or liability in connection with the administration or trading of the Fund.
NYSE® Equal Sector Weight Index is a service mark of ICE Data Indices, LLC or its affiliates (“ICE Data”) and has been licensed for use by the Adviser in connection with the Fund. Neither the Trust nor the Fund is sponsored, endorsed, sold or promoted by ICE Data. ICE Data makes no representations or warranties regarding the Adviser or the Fund or the ability of the NYSE® Equal Sector Weight Index to track general stock market performance.
ICE DATA MAKES NO EXPRESS OR IMPLIED WARRANTIES, AND HEREBY EXPRESSLY DISCLAIMS ALL WARRANTIES OF MERCHANTABILITY OR FITNESS FOR A PARTICULAR PURPOSE WITH RESPECT TO THE NYSE® EQUAL SECTOR WEIGHT INDEX OR ANY DATA INCLUDED THEREIN. IN NO EVENT SHALL ICE DATA HAVE ANY LIABILITY FOR ANY SPECIAL, PUNITIVE, INDIRECT, OR CONSEQUENTIAL DAMAGES (INCLUDING LOST PROFITS), EVEN IF NOTIFIED OF THE POSSIBILITY OF SUCH DAMAGES.
The Adviser does not guarantee the accuracy and/or the completeness of the Underlying Index or any data included therein, and the Adviser shall have no liability for any errors, omissions or interruptions therein. The Adviser makes no warranty, express or implied, as to results to be obtained by the Fund, owners of the Shares of the Fund or any other person or entity from the use of the Underlying Index or any data included therein. The Adviser makes no express or implied warranties, and expressly disclaims all warranties of merchantability or fitness for a particular purpose or use with respect to the Underlying Index or any data included therein. Without limiting any of the foregoing, in no event shall the Adviser have any liability for any special, punitive, direct, indirect or consequential damages (including lost profits) arising out of matters relating to the use of the Underlying Index even if notified of the possibility of such damages.
15 | May 31, 2022
| ALPS Equal Sector Weight ETF | |
| Liquidity Risk Management Program | May 31, 2022 (Unaudited) |
In compliance with the Securities and Exchange Commission’s liquidity risk management rule (the “Liquidity Rule”), the ALPS ETF Trust (the “Trust”) has established a liquidity risk management program (the “Program”) to govern the Trust’s approach to managing liquidity risk for each series of the Trust (each a “Fund”). The Program is overseen by the Liquidity Committee (the “Committee”), a committee comprised of representatives of the Trust’s investment adviser, ALPS Advisors, Inc. The Trust’s Board of Trustees (the “Board”) has approved the designation of the Committee to oversee the Program.
The Program’s principal objectives include supporting each Fund’s compliance with limits on investments in illiquid assets and assessing and managing the risk that a Fund will be unable to meet its redemption obligations without significant dilution of remaining investors’ interests in the Fund. The Program includes a number of elements that support the management and assessment of liquidity risk, including an annual assessment of factors that influence a Fund’s liquidity and, for Funds that are not “In-Kind ETFs,” the periodic classification and re-classification of such Fund’s investments into groupings that reflect the Committee’s assessment of their liquidity under current market conditions.
At a meeting of the Board held on March 7, 2022, the Trustees received a report from the Committee regarding the design and operational effectiveness of the Program for the period January 1, 2021 through December 31, 2021 (the “Period”). The Committee determined, and reported to the Board, that the Program has been operating effectively to assess and manage each Fund’s liquidity risk and has been and continues to be adequately and effectively implemented to monitor and (as applicable) respond to the Funds’ liquidity developments.
The Committee reported that during the period covered by the report, there were no liquidity events that impacted the Funds or their ability to timely meet redemptions without dilution to existing shareholders. The report also discussed notable events affecting liquidity over the Period, including extended market holidays and closures in certain countries. Among other things, the Committee’s report noted that no Fund is required to have a highly liquid investment minimum based either on its status as an In-Kind ETF or on its ability to rely on another exemption under the Liquidity Rule. The Committee’s report further noted that no material changes have been made to the Program since its implementation.
16 | May 31, 2022


Table of Contents
| Performance Overview | 1 |
| Disclosure of Fund Expenses | 3 |
| Financial Statements | |
| Schedule of Investments | 4 |
| Statement of Assets and Liabilities | 5 |
| Statement of Operations | 6 |
| Statements of Changes in Net Assets | 7 |
| Financial Highlights | 8 |
| Notes to Financial Statements | 9 |
| Additional Information | 14 |
| Liquidity Risk Management Program | 15 |
alpsfunds.com
| ALPS Hillman Active Value ETF | |
| Performance Overview | May 31, 2022 (Unaudited) |
Investment Objective
The ALPS Hillman Active Value ETF (the "Fund") seeks long-term total return from a combination of income and capital gains. The Fund seeks to achieve its investment objective by investing in U.S. companies that Hillman Capital Management, Inc., the Fund's sub-adviser believes have competitive advantages and have temporarily fallen out of favor for reasons that are considered non-recurring or short-term; whose value is not currently well known; or whose value is not fully recognized by the public.
Performance (as of May 31, 2022)
| 6 Months | Since Inception^ | |
| ALPS Hillman Active Value ETF - NAV | -1.28% | -4.86% |
| ALPS Hillman Active Value ETF – Market Price* | -1.32% | -4.82% |
| Russell 1000® Value Total Return Index | 1.51% | 2.10% |
Total Expense Ratio (per the current prospectus) is 0.55%.
Performance data quoted represents past performance. Past performance does not guarantee future results. Total return figures assume reinvestment of dividends and capital gains distributions, if any. The table does not reflect the deduction of taxes that a shareholder would pay on Fund distributions or the redemption of Fund shares. Investment return and principal value of an investment will fluctuate so that an investor’s shares, when sold or redeemed, may be worth more or less than the original cost. Current performance data may be higher or lower than actual data quoted. For the most current month-end performance data please visit www.alpsfunds.com or call 1.866.759.5679.
NAV is an exchange-traded fund’s per-share value. The per-share dollar amount of the Fund is derived by dividing the total value of all the securities in its portfolio, less any liabilities, by the number of Fund shares outstanding. Market Price is the price at which a share can currently be traded in the market. Information detailing the number of days the Market Price of the Fund was greater than the Fund’s NAV and the number of days it was less than the Fund’s NAV can be obtained at www.alpsfunds.com.
| ^ | The Fund commenced operations on July 15, 2021, with the first day of trading on the exchange of July 16, 2021. |
| * | Market Price means the official closing price of a share or, if it more accurately reflects the market value of a share at the time as of which the Fund calculates current net asset value per share, the price that is the midpoint of the bid-ask spread as of that time. It does not represent the returns an investor would receive if shares were traded at other times. |
The Fund is new with limited operating history.
Russell 1000® Value Total Return is a broad-based benchmark that measures the performance of the large cap value segment of the US equity universe. It includes those Russell 1000® companies with lower price-to-book ratios and lower expected growth values. The index is not actively managed and does not reflect any deductions for fees, expenses or taxes. The index is reported on a total return basis, which assumes reinvestment of any dividends and distributions realized during a given time period. One cannot invest directly in an index. Index performance does not reflect fund performance.
The Fund’s shares are not individually redeemable. Investors buy and sell shares of the Fund on a secondary market. Only market makers or “authorized participants” may trade directly with the Fund, typically in blocks of 25,000 shares.
The ALPS Hillman Active Value ETF is not suitable for all investors. Investments in the Fund are subject to investment risks, including possible loss of the principal amount invested.
ALPS Portfolio Solutions Distributor, Inc., a FINRA member, is the distributor for the Fund.
1 | May 31, 2022
| ALPS Hillman Active Value ETF | |
| Performance Overview | May 31, 2022 (Unaudited) |
Top 10 Holdings* (as of May 31, 2022)
| Enterprise Products Partners LP | 2.70% |
| Raytheon Technologies Corp. | 2.67% |
| Kellogg Co. | 2.62% |
| Constellation Brands, Inc., Class A | 2.59% |
| GSK PLC, ADR | 2.58% |
| Plains All American Pipeline LP | 2.57% |
| AT&T, Inc. | 2.56% |
| Lam Research Corp. | 2.54% |
| CarMax, Inc. | 2.51% |
| Becton Dickinson and Co. | 2.47% |
| Total % of Top 10 Holdings | 25.81% |
Sector Allocation* (as of May 31, 2022)
| Information Technology | 16.94% |
| Health Care | 14.97% |
| Communication Services | 12.64% |
| Consumer Staples | 11.77% |
| Financials | 10.77% |
| Industrials | 10.51% |
| Consumer Discretionary | 7.24% |
| Materials | 5.85% |
| Energy | 5.27% |
| Real Estate | 2.14% |
| Money Market Fund | 1.90% |
| Total Investments | 100.00% |
| * | % of Total Investments |
Future holdings are subject to change.
Growth of $10,000 (as of May 31, 2022)
Comparison of Change in Value of $10,000 Investment in the Fund and the Fund's benchmark
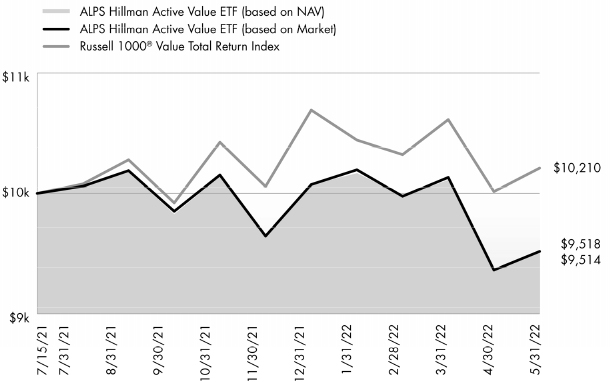
The chart above compares historical performance of a hypothetical investment of $10,000 in the Fund since inception with the performance of the Fund’s benchmark index. Past performance does not guarantee future results. The chart does not reflect the deduction of taxes that a shareholder would pay on Fund distributions or the redemption of Fund shares.
2 | May 31, 2022
| ALPS Hillman Active Value ETF | |
| Disclosure of Fund Expenses | May 31, 2022 (Unaudited) |
Shareholder Expense Example: As a shareholder of a Fund, you incur certain ongoing costs, including management fees and other Fund expenses. These examples are intended to help you understand your ongoing costs (in dollars) of investing in the Fund and to compare these costs with the ongoing costs of investing in other funds. It is based on an investment of $1,000 invested at the beginning of the six month period and held through May 31, 2022.
Actual Return: The first line of the table provides information about actual account values and actual expenses. You may use the information in this line, together with the amount you invested, to estimate the expenses that you incurred over the period. Simply divide your account value by $1,000 (for example, an $8,600 account value divided by $1,000 = 8.6), then multiply the result by the number in the first line under the heading entitled “Expenses Paid During Period” to estimate the expenses attributable to your investment during this period.
Hypothetical 5% Return: The second line of the table provides information about hypothetical account values and hypothetical expenses based on the Fund’s actual expense ratio and an assumed rate of return of 5% per year before expenses, which is not the Fund’s actual return. The hypothetical account values and expenses may not be used to estimate the actual ending account balance or expenses you paid for the period. You may use this information to compare ongoing costs of investing in the Fund and other funds. To do so, compare this 5% hypothetical example with the 5% hypothetical examples that appear in the shareholder reports of other funds.
The expenses shown in the table are meant to highlight ongoing Fund costs only and do not reflect any transaction costs, such as brokerage commissions and other fees to financial intermediaries. Therefore, the second line is useful in comparing ongoing costs only, and will not help you determine the relative total costs of owning different funds. In addition, if these costs were included, your costs would have been higher.
| Beginning Account Value 12/1/21 | Ending Account Value 5/31/22 | Expense Ratio(a) | Expenses Paid During Period 12/1/21 - 5/31/22(b) | |||||||||||||
| ALPS Hillman Active Value ETF | ||||||||||||||||
| Actual | $ | 1,000.00 | $ | 987.20 | 0.55 | % | $ | 2.72 | ||||||||
| Hypothetical (5% return before expenses) | $ | 1,000.00 | $ | 1,022.19 | 0.55 | % | $ | 2.77 | ||||||||
| (a) | Annualized, based on the Fund's most recent fiscal half year expenses. |
| (b) | Expenses are equal to the Fund's annualized expense ratio multiplied by the average account value over the period, multiplied by the number of days in the most recent fiscal half year (182), divided by 365. |
3 | May 31, 2022
| ALPS Hillman Active Value ETF | |
| Schedule of Investments | May 31, 2022 (Unaudited) |
| Security Description | Shares | Value | ||||||
| COMMON STOCKS (92.66%) | ||||||||
| Communication Services (12.61%) | ||||||||
| Alphabet, Inc., Class A(a) | 68 | $ | 154,716 | |||||
| AT&T, Inc. | 8,358 | 177,942 | ||||||
| Comcast Corp., Class A | 2,866 | 126,906 | ||||||
| Meta Platforms, Inc., Class A(a) | 704 | 136,323 | ||||||
| Verizon Communications, Inc. | 2,943 | 150,946 | ||||||
| Warner Bros Discovery, Inc.(a) | 7,179 | 132,453 | ||||||
| Total Communication Services | 879,286 | |||||||
| Consumer Discretionary (7.23%) | ||||||||
| Amazon.com, Inc.(a) | 70 | 168,293 | ||||||
| CarMax, Inc.(a) | 1,760 | 174,715 | ||||||
| Nordstrom, Inc. | 6,095 | 161,091 | ||||||
| Total Consumer Discretionary | 504,099 | |||||||
| Consumer Staples (11.75%) | ||||||||
| Anheuser-Busch InBev SA, ADR | 2,385 | 135,230 | ||||||
| Conagra Brands, Inc. | 4,887 | 160,733 | ||||||
| Constellation Brands, Inc., | ||||||||
| Class A | 733 | 179,929 | ||||||
| Kellogg Co. | 2,618 | 182,579 | ||||||
| Kraft Heinz Co. | 4,250 | 160,778 | ||||||
| Total Consumer Staples | 819,249 | |||||||
| Financials (10.75%) | ||||||||
| Bank of New York Mellon Corp. | 3,359 | 156,563 | ||||||
| BlackRock, Inc. | 217 | 145,190 | ||||||
| T Rowe Price Group, Inc. | 1,077 | 136,876 | ||||||
| Wells Fargo & Co. | 3,684 | 168,617 | ||||||
| Western Union Co. | 7,826 | 141,964 | ||||||
| Total Financials | 749,210 | |||||||
| Health Care (14.94%) | ||||||||
| Becton Dickinson and Co. | 673 | 172,153 | ||||||
| Biogen, Inc.(a) | 670 | 134,000 | ||||||
| CVS Health Corp. | 1,487 | 143,867 | ||||||
| GSK PLC, ADR | 4,093 | 179,683 | ||||||
| Medtronic PLC | 1,299 | 130,095 | ||||||
| Merck & Co., Inc. | 1,567 | 144,211 | ||||||
| Zimmer Biomet Holdings, Inc. | 1,143 | 137,400 | ||||||
| Total Health Care | 1,041,409 | |||||||
| Industrials (10.50%) | ||||||||
| 3M Co. | 818 | 122,119 | ||||||
| Boeing Co.(a) | 1,121 | 147,299 | ||||||
| Emerson Electric Co. | 1,692 | 150,013 | ||||||
| General Electric Co. | 1,616 | 126,517 | ||||||
| Raytheon Technologies Corp. | 1,952 | 185,674 | ||||||
| Total Industrials | 731,622 | |||||||
| Information Technology (16.90%) | ||||||||
| Adobe, Inc.(a) | 327 | 136,189 | ||||||
| ASML Holding NV | 242 | 139,462 | ||||||
| Equifax, Inc. | 740 | 149,909 | ||||||
| Intel Corp. | 2,931 | 130,195 | ||||||
| Lam Research Corp. | 340 | 176,810 | ||||||
| Security Description | Shares | Value | ||||||
| Information Technology (continued) | ||||||||
| Microsoft Corp. | 589 | $ | 160,132 | |||||
| Salesforce, Inc.(a) | 915 | 146,620 | ||||||
| ServiceNow, Inc.(a) | 297 | 138,839 | ||||||
| Total Information Technology | 1,178,156 | |||||||
| Materials (5.84%) | ||||||||
| Air Products and Chemicals, Inc. | 637 | 156,804 | ||||||
| Compass Minerals | ||||||||
| International, Inc. | 2,421 | 108,776 | ||||||
| DuPont de Nemours, Inc. | 2,084 | 141,399 | ||||||
| Total Materials | 406,979 | |||||||
| Real Estate (2.14%) | ||||||||
| Simon Property Group, Inc. | 1,299 | 148,930 | ||||||
| TOTAL COMMON STOCKS | ||||||||
| (Cost $7,118,195) | 6,458,940 | |||||||
| Security Description | Shares | Value | ||||||
| MASTER LIMITED PARTNERSHIPS (5.27%) | ||||||||
| Energy (5.27%) | ||||||||
| Enterprise Products Partners LP | 6,852 | 187,882 | ||||||
| Plains All American Pipeline LP | 15,728 | 179,142 | ||||||
| Total Energy | 367,024 | |||||||
| TOTAL MASTER LIMITED PARTNERSHIPS | ||||||||
| (Cost $330,986) | 367,024 | |||||||
| 7 Day Yield | Shares | Value | ||||||||||
| SHORT TERM INVESTMENTS (1.90%) | ||||||||||||
| Money Market Fund | ||||||||||||
State Street Institutional Treasury Plus Money Market Fund | 0.75 | % | 132,463 | 132,463 | ||||||||
| TOTAL SHORT TERM INVESTMENTS | ||||||||||||
| (Cost $132,463) | 132,463 | |||||||||||
| TOTAL INVESTMENTS (99.83%) | ||||||||||||
| (Cost $7,581,644) | $ | 6,958,427 | ||||||||||
| OTHER ASSETS IN EXCESS OF LIABILITIES (0.17%) | 11,812 | |||||||||||
| NET ASSETS - 100.00% | $ | 6,970,239 | ||||||||||
| (a) | Non - income producing security. |
See Notes to Financial Statements.
4 | May 31, 2022
| ALPS Hillman Active Value ETF | |
| Statement of Assets and Liabilities | May 31, 2022 (Unaudited) |
| ASSETS: | ||||
| Investments, at value | $ | 6,958,427 | ||
| Foreign tax reclaims | 194 | |||
| Dividends receivable | 14,803 | |||
| Total Assets | 6,973,424 | |||
| LIABILITIES: | ||||
| Payable to adviser | 3,185 | |||
| Total Liabilities | 3,185 | |||
| NET ASSETS | $ | 6,970,239 | ||
| NET ASSETS CONSIST OF: | ||||
| Paid-in capital | $ | 7,407,542 | ||
| Total distributable earnings | (437,303 | ) | ||
| NET ASSETS | $ | 6,970,239 | ||
| INVESTMENTS, AT COST | $ | 7,581,644 | ||
| PRICING OF SHARES | ||||
| Net Assets | $ | 6,970,239 | ||
| Shares of beneficial interest outstanding (Unlimited number of shares authorized, par value $0.01 per share) | 300,002 | |||
| Net Asset Value, offering and redemption price per share | $ | 23.23 | ||
See Notes to Financial Statements.
5 | May 31, 2022
| ALPS Hillman Active Value ETF | |
| Statement of Operations | For the Six Months Ended May 31, 2022 (Unaudited) |
| INVESTMENT INCOME: | ||||
| Dividends* | $ | 75,855 | ||
| Securities Lending Income | 34 | |||
| Total Investment Income | 75,889 | |||
| EXPENSES: | ||||
| Investment adviser fees | 16,953 | |||
| Net Expenses | 16,953 | |||
| NET INVESTMENT INCOME | 58,936 | |||
| REALIZED AND UNREALIZED GAIN/(LOSS): | ||||
| Net realized gain on investments(a) | 140,322 | |||
| Net change in unrealized depreciation on investments | (312,279 | ) | ||
| NET REALIZED AND UNREALIZED LOSS ON INVESTMENTS | (171,957 | ) | ||
| NET DECREASE IN NET ASSETS RESULTING FROM OPERATIONS | $ | (113,021 | ) | |
| *Net of foreign tax withholding. | $ | 346 | ||
| (a) | Includes realized gain or loss as a result of in-kind transactions (See Note 4 in Notes to Financial Statements). |
See Notes to Financial Statements.
6 | May 31, 2022
| ALPS Hillman Active Value ETF |
| Statements of Changes in Net Assets |
| For the Six Months Ended May 31, 2022 (Unaudited) | For the Period July 15, 2021 (Commencement of Operations) to November 30, 2021 | |||||||
| OPERATIONS: | ||||||||
| Net investment income | $ | 58,936 | $ | 50,743 | ||||
| Net realized gain | 140,322 | 60,733 | ||||||
| Net change in unrealized depreciation | (312,279 | ) | (310,938 | ) | ||||
| Net decrease in net assets resulting from operations | (113,021 | ) | (199,462 | ) | ||||
| DISTRIBUTIONS TO SHAREHOLDERS: | ||||||||
| From distributable earnings | (93,741 | ) | (17,283 | ) | ||||
| Total distributions | (93,741 | ) | (17,283 | ) | ||||
| CAPITAL SHARE TRANSACTIONS: | ||||||||
| Proceeds from sale of shares | 2,412,118 | 6,232,629 | ||||||
| Cost of shares redeemed | (614,779 | ) | (636,222 | ) | ||||
| Net increase from capital share transactions | 1,797,339 | 5,596,407 | ||||||
| Net increase in net assets | 1,590,577 | 5,379,662 | ||||||
| NET ASSETS: | ||||||||
| Beginning of period | 5,379,662 | – | ||||||
| End of period | $ | 6,970,239 | $ | 5,379,662 | ||||
| OTHER INFORMATION: | ||||||||
| CAPITAL SHARE TRANSACTIONS: | ||||||||
| Beginning shares | 225,002 | – | ||||||
| Shares sold | 100,000 | 250,002 | ||||||
| Shares redeemed | (25,000 | ) | (25,000 | ) | ||||
| Shares outstanding, end of period | 300,002 | 225,002 | ||||||
See Notes to Financial Statements.
7 | May 31, 2022
| ALPS Hillman Active Value ETF | |
| Financial Highlights | For a Share Outstanding Throughout the Periods Presented |
| For the Six Months Ended May 31, 2022 (Unaudited) | For the Period July 15, 2021 (Commencement of Operations) to November 30, 2021 | |||||||
| NET ASSET VALUE, BEGINNING OF PERIOD | $ | 23.91 | $ | 24.88 | ||||
| INCOME FROM OPERATIONS: | ||||||||
| Net investment income(a) | 0.23 | 0.22 | ||||||
| Net realized and unrealized loss | (0.51 | ) | (1.12 | ) | ||||
| Total from investment operations | (0.28 | ) | (0.90 | ) | ||||
| DISTRIBUTIONS: | ||||||||
| From net investment income | (0.19 | ) | (0.07 | ) | ||||
| From net realized gains | (0.21 | ) | – | |||||
| Total distributions | (0.40 | ) | (0.07 | ) | ||||
| NET (DECREASE) IN NET ASSET VALUE | (0.68 | ) | (0.97 | ) | ||||
| NET ASSET VALUE, END OF PERIOD | $ | 23.23 | $ | 23.91 | ||||
| TOTAL RETURN(b) | (1.28 | )% | (3.63 | )% | ||||
| RATIOS/SUPPLEMENTAL DATA: | ||||||||
| Net assets, end of period (in 000s) | $ | 6,970 | $ | 5,380 | ||||
| RATIOS TO AVERAGE NET ASSETS | ||||||||
| Ratio of expenses to average net assets | 0.55 | %(c) | 0.55 | %(c) | ||||
| Ratio of net investment income to average net assets | 1.91 | %(c) | 2.28 | %(c) | ||||
| Portfolio turnover rate(d) | 23 | % | 10 | % | ||||
| (a) | Based on average shares outstanding during the period. |
| (b) | Total return is calculated assuming an initial investment made at the net asset value at the beginning of the period and redemption at the net asset value on the last day of the period and assuming all distributions are reinvested at the reinvestment prices. Total return calculated for a period of less than one year is not annualized. |
| (c) | Annualized. |
| (d) | Portfolio turnover for periods less than one year are not annualized and does not include securities received or delivered from processing creations or redemptions in-kind. |
See Notes to Financial Statements.
8 | May 31, 2022
| ALPS Hillman Active Value ETF | |
| Notes to Financial Statements | May 31, 2022 (Unaudited) |
1. ORGANIZATION
ALPS ETF Trust (the “Trust”), a Delaware statutory trust, is an open-end management investment company registered under the Investment Company Act of 1940, as amended (the “1940 Act”). As of May 31, 2022, the Trust consisted of nineteen separate portfolios. Each portfolio represents a separate series of the Trust. This report pertains solely to the ALPS Hillman Active Value ETF (the “Fund”). The Fund seeks long-term total return from a combination of income and capital gains. The Fund has elected to qualify as a diversified series of the Trust under the 1940 Act.
The Fund’s Shares (“Shares”) are listed on the NYSE Arca, Inc. (the “NYSE Arca”). The Fund issues and redeems Shares at net asset value (“NAV”) in blocks of 25,000 Shares (prior to October 1, 2021 in blocks of 50,000 Shares), each of which is called a “Creation Unit”. Creation Units are issued and redeemed principally in-kind for securities. Except when aggregated in Creation Units, Shares are not redeemable securities of the Fund.
Pursuant to the Trust’s organizational documents, its Officers and Trustees are indemnified against certain liability arising out of the performance of their duties to the Trust. Additionally, in the normal course of business, the Trust enters into contracts with service providers that contain general indemnification clauses. The Trust’s maximum exposure under these arrangements is unknown, as this would involve future claims that may be made against the Trust that have not yet occurred.
2. SIGNIFICANT ACCOUNTING POLICIES
The following is a summary of significant accounting policies consistently followed by the Fund in the preparation of the financial statements. The accompanying financial statements were prepared in accordance with accounting principles generally accepted in the United States of America (“U.S. GAAP”). The preparation of financial statements in conformity with U.S. GAAP requires management to make certain estimates and assumptions that affect the reported amounts of assets and liabilities and disclosures of contingent assets and liabilities at the date of the financial statements and the reported amounts of revenue and expenses during the period. Actual results could differ from those estimates. The Fund is considered an investment company under U.S. GAAP and follows the accounting and reporting guidance applicable to investment companies in the Financial Accounting Standards Board (“FASB”) Accounting Standards Codification Topic 946.
A. Portfolio Valuation
The Fund’s NAV is determined daily, as of the close of regular trading on the New York Stock Exchange (the “NYSE”), normally 4:00 p.m. Eastern time, on each day the NYSE is open for trading. The NAV is computed by dividing the value of all assets of the Fund (including accrued interest and dividends), less all liabilities (including accrued expenses and dividends declared but unpaid), by the total number of shares outstanding.
Portfolio securities listed on any exchange other than the NASDAQ Stock Market LLC (“NASDAQ”) are valued at the last sale price on the business day as of which such value is being determined. If there has been no sale on such day, the securities are valued at the mean of the most recent bid and ask prices on such day. Securities traded on the NASDAQ are valued at the NASDAQ Official Closing Price as determined by NASDAQ. Portfolio securities traded on more than one securities exchange are valued at the last sale price on the business day as of which such value is being determined at the close of the exchange representing the principal market for such securities. Portfolio securities traded in the over-the-counter market, but excluding securities traded on the NASDAQ, are valued at the latest quoted sale price in such market.
The Fund’s investments are valued at market value or, in the absence of market value with respect to any portfolio securities, at fair value according to procedures adopted by the Trust’s Board of Trustees (the “Board”). When market quotations are not readily available or when events occur that make established valuation methods unreliable, securities of the Fund may be valued in good faith by or under the direction of the Board. These securities generally include, but are not limited to, restricted securities (securities which may not be publicly sold without registration under the Securities Act of 1933) for which a pricing service is unable to provide a market price; securities whose trading has been formally suspended; a security whose market price is not available from a pre-established primary pricing source or the pricing source is not willing to provide a price; a security with respect to which an event has occurred that is most likely to materially affect the value of the security after the market has closed but before the calculation of the Fund’s NAV or make it difficult or impossible to obtain a reliable market quotation; or a security whose price, as provided by the pricing service, does not reflect the security’s “fair value” due to the security being de-listed from a national exchange or the security’s primary trading market is temporarily closed at a time when, under normal conditions, it would be open. As a general principle, the current “fair value” of a security would be the amount which the owner might reasonably expect to receive from the sale on the applicable exchange or principal market. A variety of factors may be considered in determining the fair value of such securities.
9 | May 31, 2022
| ALPS Hillman Active Value ETF | |
| Notes to Financial Statements | May 31, 2022 (Unaudited) |
B. Fair Value Measurements
The Fund discloses the classification of its fair value measurements following a three-tier hierarchy based on the inputs used to measure fair value. Inputs refer broadly to the assumptions that market participants would use in pricing the asset or liability; including assumptions about risk. Inputs may be observable or unobservable. Observable inputs reflect the assumptions market participants would use in pricing the asset or liability that are developed based on market data obtained from sources independent of the reporting entity. Unobservable inputs reflect the reporting entity’s own assumptions about the assumptions market participants would use in pricing the asset or liability that are developed based on the best information available.
Valuation techniques used to value the Fund's investments by major category are as follows:
Equity securities and Limited Partnerships, including restricted securities, for which market quotations are readily available, are valued at the last reported sale price or official closing price as reported by a third party pricing vendor on the primary market or exchange on which they are traded and are categorized as Level 1 in the hierarchy. In the event there were no sales during the day or closing prices are not available, securities are valued at the mean of the most recent quoted bid and ask prices on such day and are generally categorized as Level 2 in the hierarchy. Investments in open-end mutual funds are valued at their closing NAV each business day and are categorized as Level 1 in the hierarchy.
Changes in valuation techniques may result in transfers in or out of an assigned level within the disclosure hierarchy.
Various inputs are used in determining the value of the Fund’s investments as of the end of the reporting period. When inputs used fall into different levels of the fair value hierarchy, the level in the hierarchy within which the fair value measurement falls is determined based on the lowest level input that is significant to the fair value measurement in its entirety. The designated input levels are not necessarily an indication of the risk or liquidity associated with these investments.
These inputs are categorized in the following hierarchy under applicable financial accounting standards:
| Level 1 | - | Unadjusted quoted prices in active markets for identical investments, unrestricted assets or liabilities that a Fund has the ability to access at the measurement date; |
| Level 2 | - | Quoted prices which are not active, quoted prices for similar assets or liabilities in active markets or inputs other than quoted prices that are observable (either directly or indirectly) for substantially the full term of the asset or liability; and |
| Level 3 | - | Significant unobservable prices or inputs (including the Fund’s own assumptions in determining the fair value of investments) where there is little or no market activity for the asset or liability at the measurement date. |
The following is a summary of the inputs used to value the Fund’s investments as of May 31, 2022:
ALPS Hillman Active Value ETF
| Investments in Securities at Value | Level 1 - Quoted and Unadjusted Prices | Level 2 - Other Significant Observable Inputs | Level 3 - Significant Unobservable Inputs | Total | ||||||||||||
| Common Stocks* | $ | 6,458,940 | $ | – | $ | – | $ | 6,458,940 | ||||||||
| Master Limited Partnerships* | 367,024 | – | – | 367,024 | ||||||||||||
| Short Term Investments | 132,463 | – | – | 132,463 | ||||||||||||
| Total | $ | 6,958,427 | $ | – | $ | – | $ | 6,958,427 | ||||||||
| * | For a detailed sector breakdown, see the accompanying Schedule of Investments. |
The Fund did not have any securities that used significant unobservable inputs (Level 3) in determining fair value and there were no transfers into or out of Level 3 during the six months ended May 31, 2022.
C. Securities Transactions and Investment Income
Securities transactions are recorded as of the trade date. Realized gains and losses from securities transactions are recorded on the specific identification in accordance with GAAP. Dividend income and capital gains distributions, if any, are recorded on the ex-dividend date. Interest income, if any, is recorded on the accrual basis.
D. Dividends and Distributions to Shareholders
Dividends from net investment income of the Fund, if any, are declared and paid quarterly or as the Board may determine from time to time. Distributions of net realized capital gains earned by the Fund, if any, are declared and distributed at least annually.
10 | May 31, 2022
| ALPS Hillman Active Value ETF | |
| Notes to Financial Statements | May 31, 2022 (Unaudited) |
E. Federal Tax and Tax Basis Information
The timing and character of income and capital gain distributions are determined in accordance with income tax regulations, which may differ from U.S. GAAP. Reclassifications are made to the Fund’s capital accounts for permanent tax differences to reflect income and gains available for distribution (or available capital loss carryforwards) under income tax regulations. The amounts and characteristics of tax basis distributions and composition of distributable earnings/(accumulated losses) are finalized at fiscal year-end; accordingly, tax basis balances have not been determined as of May 31, 2022.
The tax character of the distributions paid during the fiscal period ended November 30, 2021 was as follows:
| Ordinary Income | Long-Term Capital Gain | Return of Capital | ||||||||||
| November 30, 2021 | ||||||||||||
| ALPS Hillman Active Value ETF | $ | 17,283 | $ | – | $ | – | ||||||
The character of distributions made during the year may differ from its ultimate characterization for federal income tax purposes.
As of May 31, 2022, the cost of investments for federal income tax purposes and accumulated net unrealized appreciation/(depreciation) on investments were as follows:
| ALPS Hillman Active Value ETF | ||||
| Gross appreciation (excess of value over tax cost) | $ | 224,383 | ||
| Gross depreciation (excess of tax cost over value) | (829,139 | ) | ||
| Net unrealized appreciation (depreciation) | $ | (604,756 | ) | |
| Cost of investments for income tax purposes | $ | 7,563,183 | ||
The differences between book-basis and tax-basis are primarily due to the deferral of losses from investments in partnerships. In addition, certain tax cost basis adjustments are finalized at fiscal year-end and therefore have not been determined as of May 31, 2022.
F. Income Taxes
No provision for income taxes is included in the accompanying financial statements, as the Fund intends to distribute to shareholders all taxable investment income and realized gains and otherwise comply with Subchapter M of the Internal Revenue Code of 1986, as amended, applicable to regulated investment companies. The Fund evaluates tax positions taken (or expected to be taken) in the course of preparing the Fund’s tax returns to determine whether these positions meet a “more-likely-than-not” standard that, based on the technical merits, have a more than fifty percent likelihood of being sustained by a taxing authority upon examination. A tax position that meets the “more-likely-than-not” recognition threshold is measured to determine the amount of benefit to recognize in the financial statements.
As of and during the six months ended May 31, 2022, the Fund did not have a liability for any unrecognized tax benefits. The Fund files U.S. federal, state, and local tax returns as required. The Fund’s tax returns are subject to examination by the relevant tax authorities until expiration of the applicable statute of limitations, which is generally three years after the filing of the tax return, but may extend to four years in certain jurisdictions. Tax returns for open years have incorporated no uncertain tax positions that require a provision for income taxes.
G. Lending of Portfolio Securities
The Fund has entered into a securities lending agreement with State Street Bank & Trust Co. (“SSB”), the Fund’s lending agent. The Fund may lend its portfolio securities only to borrowers that are approved by SSB. The Fund will limit such lending to not more than 33 1/3% of the value of its total assets. The Fund’s securities held at SSB as custodian shall be available to be lent except those securities the Fund or ALPS Advisors, Inc. specifically identifies in writing as not being available for lending. The borrower pledges and maintains with the Fund collateral consisting of cash (U.S. Dollars only), securities issued or guaranteed by the U.S. government or its agencies or instrumentalities, and cash equivalents (including irrevocable bank letters of credit) issued by a person other than the borrower or an affiliate of the borrower. The initial collateral received by the Fund is required to have a value of no less than 102% of the market value of the loaned securities for U.S equity securities and a value of no less than 105% of the market value for non-U.S. equity securities. The collateral is maintained thereafter, at a market value equal to not less than 102% of the current value of the U.S. equity securities on loan and not less than 105% of the current value of the non-U.S. equity securities on loan. The market value of the loaned securities is determined at the close of each business day and any additional required collateral is delivered to the Fund on the next business day. During the term of the loan, the Fund is entitled to all distributions made on or in respect of the loaned securities. Loans of securities are terminable at any time and the borrower, after notice, is required to return borrowed securities within the customary time period for settlement of securities transactions.
11 | May 31, 2022
| ALPS Hillman Active Value ETF | |
| Notes to Financial Statements | May 31, 2022 (Unaudited) |
Any cash collateral received is reinvested in a money market fund managed by SSB as disclosed in the Fund’s Schedule of Investments and is reflected in the Statements of Assets and Liabilities as a payable for collateral upon return of securities loaned. Non-cash collateral, in the form of securities issued or guaranteed by the U.S. government or its agencies or instrumentalities, is not disclosed in the Fund’s Statements of Assets and Liabilities as it is held by the lending agent on behalf of the Fund, and the Fund does not have the ability to re-hypothecate these securities. Income earned by the Fund from securities lending activity is disclosed in the Statement of Operations. As of May 31, 2022, the Fund did not have any securities on loan.
3. INVESTMENT ADVISORY FEE AND OTHER AFFILIATED TRANSACTIONS
ALPS Advisors, Inc. (the “Adviser”) serves as the Fund’s investment adviser pursuant to an Investment Advisory Agreement with the Trust on behalf of the Fund (the “Advisory Agreement”). Pursuant to the Advisory Agreement, the Fund pays the Adviser an annual management fee for the services and facilities it provides, payable on a monthly basis at a rate of 0.55% as a percentage of the Fund’s average daily net assets.
Out of the unitary management fees, the Adviser pays substantially all expenses of the Fund, including the cost of sub-advisory, transfer agency, custody, fund administration, legal, audit, trustees and other services, except for interest expenses, distribution fees or expenses, brokerage expenses, taxes and extraordinary expenses not incurred in the ordinary course of the Fund's business. The Adviser’s unitary management fee is designed to pay substantially all of the Fund’s expenses and to compensate the Adviser for providing services to the Fund.
Hillman Capital Management, Inc. (the “Sub-Adviser”) serves as the Fund’s sub-adviser pursuant to a sub-advisory agreement with the Trust (the ‘‘Sub-Advisory Agreement’’). Pursuant to the Sub-Advisory Agreement, the Adviser pays the Sub-Adviser a sub-advisory fee out of the Adviser’s advisory fee for the services it provides. The fee is payable on a monthly basis at the annual rate of 0.25% of the Fund's average daily net assets.
Prior to February 16, 2022, each Trustee received (1) a quarterly retainer of $10,000, (2) a per meeting fee of $5,000, (3) $1,500 for any special meeting held outside of a regularly scheduled board meeting, and (4) reimbursement for all reasonable out-of-pocket expenses relating to attendance at meetings. In addition, the Chairman of the Board and Chairman of the Audit Committee each received a quarterly retainer of $2,000, in connection with their respective roles. Effective February 16, 2022, each Trustee receives (1) a quarterly retainer of $20,000, (2) a per meeting fee of $10,000, (3) $2,500 for any special meeting held outside of a regularly scheduled board meeting, and (4) reimbursement for all reasonable out-of-pocket expenses relating to attendance at meetings. In addition, the Chairman of the Board receives a quarterly retainer of $5,000, the Chairman of the Audit Committee receives a quarterly retainer of $3,000, and the Chairman of the Nominating & Governance Committee receives a quarterly retainer of $2,000, each in connection with their respective roles.
4. PURCHASES AND SALES OF SECURITIES
For the six months ended May 31, 2022, the cost of purchases and proceeds from sales of investment securities, excluding in-kind transactions and short-term investments, were as follows:
| Fund | Purchases | Sales | ||||||
| ALPS Hillman Active Value ETF | $ | 1,364,530 | $ | 1,385,877 | ||||
For the year ended May 31, 2022, the cost of in-kind purchases and proceeds from in-kind sales were as follows:
| Fund | Purchases | Sales | ||||||
| ALPS Hillman Active Value ETF | $ | 2,367,523 | $ | 610,899 | ||||
For the six months ended May 31, 2022, Fund had in-kind net realized gains of $87,413.
Gains on in-kind transactions are not considered taxable for federal income tax purposes and losses on in-kind transactions are also not deductible for tax purposes.
5. CAPITAL SHARE TRANSACTIONS
Shares are created and redeemed by the Fund only in Creation Unit size aggregations of 25,000 Shares (prior to October 1, 2021, the Creation Unit size was 50,000 Shares). Only broker-dealers or large institutional investors with creation and redemption agreements called Authorized Participants (“AP”) are permitted to purchase or redeem Creation Units from the Fund. Such transactions are generally permitted on an in-kind basis, with a balancing cash component to equate the transaction to the NAV per unit of the Fund on the transaction date. Cash may be substituted equivalent to the value of certain securities generally when they are not available in sufficient quantity for delivery, not eligible for trading by the AP or as a result of other market circumstances.
12 | May 31, 2022
| ALPS Hillman Active Value ETF | |
| Notes to Financial Statements | May 31, 2022 (Unaudited) |
6. MARKET RISK
The Fund is subject to investment and operational risks associated with financial, economic and other global market developments and disruptions, including the recent spread of an infectious respiratory illness caused by a novel strain of coronavirus (known as COVID-19), which can negatively impact the securities markets and cause the Fund to lose value. Securities in the Fund's portfolio may underperform in comparison to securities in general financial markets, a particular financial market or other asset classes due to a number of factors, including inflation (or expectations for inflation), deflation (or expectations for deflation), interest rates, global demand for particular products or resources, market instability, debt crises and downgrades, embargoes, tariffs, sanctions and other trade barriers, regulatory events, other governmental trade or market control programs and related geopolitical events. In addition, the value of the Fund's investments may be negatively affected by the occurrence of global events such as war, terrorism, environmental disasters, natural disasters or events, country instability, and infectious disease epidemics or pandemics.
The spread of COVID-19 has caused volatility, severe market dislocations and liquidity constraints in many markets, including markets for the securities the Fund holds, and may adversely affect the Fund’s investments and operations. The transmission of COVID-19 and efforts to contain its spread have resulted in travel restrictions and disruptions, closed international borders, enhanced health screenings at ports of entry and elsewhere, disruption of and delays in healthcare service preparation and delivery, quarantines, event and service cancellations or interruptions, disruptions to business operations and supply chains, and a reduction in consumer and business spending, as well as general concern and uncertainty that has negatively affected the economy. These disruptions have led to instability in the market place and the jobs market. The impact of COVID-19 could adversely affect the economies of many nations or the entire global economy, the financial well-being and performance of individual issuers, borrowers and sectors and the health of the markets generally in potentially significant and unforeseen ways.
The foregoing could lead to a significant economic downturn or recession, increased market volatility, a greater number of market closures, higher default rates and adverse effects on the values and liquidity of the Fund’s securities or other assets. Such impacts may adversely affect the performance of the Fund.
7. SUBSEQUENT EVENTS
Effective as of the close of business on March 31, 2022, Deloitte & Touche LLP (“Deloitte”) resigned as the independent registered public accounting firm for the Fund. The report of Deloitte on the Fund’s financial statements as of and for the fiscal period ended November 30, 2021 did not contain an adverse opinion or a disclaimer of opinion, and was not qualified or modified as to uncertainties, audit scope or accounting principles. During the Fund’s fiscal year ended November 30, 2021, and through March 31, 2022, there were no disagreements between the Fund and Deloitte on any matter of accounting principles or practices, financial statement disclosure or auditing scope or procedure, which disagreements, if not resolved to the satisfaction of Deloitte, would have caused it to make reference to the subject matter of the disagreements in its report on the financial statements of the Fund for such period. During the Fund’s fiscal period ended November 30, 2021, there were no “reportable events” (as defined in Item 304(a)(1)(v) of Regulation S-K under the Securities Exchange Act of 1934, as amended (the “Exchange Act”)).
During the Fund’s fiscal period ended November 30, 2021, and during the subsequent interim period through March 31, 2022, neither the Fund, nor anyone on their behalf, consulted with Deloitte, on behalf of the Fund, regarding any matter that was either the subject of a “disagreement,” as defined in Item 304(a)(1)(iv) of Regulation S-K under the Securities Exchange Act of 1934, as amended (the “Exchange Act”), and the instructions thereto, or a “reportable event,” as defined in Item 304(a)(1)(v) of Regulation S-K under the Exchange Act.
On June 21, 2022, upon the recommendation of the Fund’s Audit Committee, the Board of Trustees of the Fund approved the engagement of BBD, LLP (“BBD”) as the independent registered public accounting firm for the Fund for the fiscal year ending November 30, 2022. The Board and its Audit Committee considered the engagement of BBD in connection with the resignation of the Fund’s former independent registered accounting firm on March 31, 2022.
13 | May 31, 2022
| ALPS Hillman Active Value ETF | |
| Additional Information | May 31, 2022 (Unaudited) |
PROXY VOTING RECORDS, POLICIES AND PROCEDURES
Information regarding how the Fund voted proxies relating to portfolio securities during the most recent 12-month period ended June 30 and a description of the Fund’s proxy voting policies and procedures used in determining how to vote for proxies are available without charge on the SEC’s website at www.sec.gov and upon request, by calling (toll-free) 1-866-759-5679.
PORTFOLIO HOLDINGS
The Fund files a complete schedule of portfolio holdings with the U.S. Securities and Exchange Commission (“SEC”) for the first and third quarters of each fiscal year on Form N-PORT within 60 days after the end of the period. Copies of the Fund’s Form N-PORT are available without a charge, upon request, by contacting the Fund at 1-866-759-5679 and on the SEC’s website at https://www.sec.gov.
TAX INFORMATION
The ALPS Hillman Active Value ETF designates the following as a percentage of taxable ordinary income distributions, or up to the maximum amount allowable, for the calendar year ended December 31, 2021:
| Qualified Dividend Income | Dividend Received Deduction | |
| ALPS Hillman Active Value ETF | 57.96% | 52.67% |
In early 2022, if applicable, shareholders of record received this information for the distributions paid to them by the Fund during the calendar year 2021 via Form 1099. The Fund will notify shareholders in early 2023 of amounts paid to them by the Fund, if any, during the calendar year 2022.
14 | May 31, 2022
| ALPS Hillman Active Value ETF | |
| Liquidity Risk Management Program | May 31, 2022 (Unaudited) |
In compliance with the Securities and Exchange Commission’s liquidity risk management rule (the “Liquidity Rule”), the ALPS ETF Trust (the “Trust”) has established a liquidity risk management program (the “Program”) to govern the Trust’s approach to managing liquidity risk for each series of the Trust (each a “Fund”). The Program is overseen by the Liquidity Committee (the “Committee”), a committee comprised of representatives of the Trust’s investment adviser, ALPS Advisors, Inc. The Trust’s Board of Trustees (the “Board”) has approved the designation of the Committee to oversee the Program.
The Program’s principal objectives include supporting each Fund’s compliance with limits on investments in illiquid assets and assessing and managing the risk that a Fund will be unable to meet its redemption obligations without significant dilution of remaining investors’ interests in the Fund. The Program includes a number of elements that support the management and assessment of liquidity risk, including an annual assessment of factors that influence a Fund’s liquidity and, for Funds that are not “In-Kind ETFs,” the periodic classification and re-classification of such Fund’s investments into groupings that reflect the Committee’s assessment of their liquidity under current market conditions.
At a meeting of the Board held on March 7, 2022, the Trustees received a report from the Committee regarding the design and operational effectiveness of the Program for the period January 1, 2021 through December 31, 2021 (the “Period”). The Committee determined, and reported to the Board, that the Program has been operating effectively to assess and manage each Fund’s liquidity risk and has been and continues to be adequately and effectively implemented to monitor and (as applicable) respond to the Funds’ liquidity developments.
The Committee reported that during the period covered by the report, there were no liquidity events that impacted the Funds or their ability to timely meet redemptions without dilution to existing shareholders. The report also discussed notable events affecting liquidity over the Period, including extended market holidays and closures in certain countries. Among other things, the Committee’s report noted that no Fund is required to have a highly liquid investment minimum based either on its status as an In-Kind ETF or on its ability to rely on another exemption under the Liquidity Rule. The Committee’s report further noted that no material changes have been made to the Program since its implementation.
15 | May 31, 2022

Table of Contents
| Performance Overview | 1 |
| Disclosure of Fund Expenses | 3 |
| Financial Statements | |
| Schedule of Investments | 4 |
| Statement of Assets and Liabilities | 6 |
| Statement of Operations | 7 |
| Statement of Changes in Net Assets | 8 |
| Financial Highlights | 9 |
| Notes to Financial Statements | 10 |
| Additional Information | 15 |
| Board Considerations Regarding Approval of Investment Advisory Agreements | 16 |
alpsfunds.com
ALPS Intermediate Municipal Bond ETF
| Performance Overview | May 31, 2022 (Unaudited) |
Investment Objective
ALPS Intermediate Municipal Bond ETF (the “Fund") seeks to protect investor's capital and generate attractive risk-adjusted returns. The Fund seeks to actively achieve its investment objective by applying bottom-up fundamental analysis and investing in a long-term, tax-aware manner. Under normal circumstances, the Fund will invest at least 80% of its net assets in municipal bonds that pay interest that is generally excludable from gross income for federal income tax purposes (except that the interest paid by certain municipal securities may be includable in taxable income for purposes of the federal alternative minimum tax).
Fund Performance (as of May 31, 2022)
| Since Inception^ | |
| ALPS Intermediate Municipal Bond ETF - NAV | 2.92% |
| ALPS Intermediate Municipal Bond ETF - Market* | 3.20% |
| Bloomberg Municipal Bond 1-15 Year Blend Index | 2.44% |
Total Expense Ratio (per the current prospectus) is 0.50%.
Performance data quoted represents past performance. Past performance does not guarantee future results. Total return figures assume reinvestment of dividends and capital gains distributions, if any. The table does not reflect the deduction of taxes that a shareholder would pay on Fund distributions or the redemption of Fund shares. Investment return and principal value of an investment will fluctuate so that an investor’s shares, when sold or redeemed, may be worth more or less than the original cost. Current performance data may be higher or lower than actual data quoted. For the most current month-end performance data please visit www.alpsfunds.com or call 1.866.675.2639.
NAV is an exchange-traded fund’s per-share value. The per-share dollar amount of the Fund is derived by dividing the total value of all the securities in its portfolio, less any liabilities, by the number of Fund shares outstanding. Market Price is the price at which a share can currently be traded in the market. Information detailing the number of days the Market Price of the Fund was greater than the Fund’s NAV and the number of days it was less than the Fund’s NAV can be obtained at www.alpsfunds.com.
| ^ | The Fund commenced operations on May 19, 2022, with the first day of trading on the exchange of May 20, 2022. |
| * | Market Price means the official closing price of a share or, if it more accurately reflects the market value of a share at the time as of which the Fund calculates current net asset value per share, the price that is the midpoint of the bid-ask spread as of that time. It does not represent the returns an investor would receive if shares were traded at other times. |
Bloomberg Municipal Bond 1-15 Year Blend Index is an unmanaged index comprised of fixed-rate, investment-grade tax-exempt bonds with remaining maturities between 1 and 17 years. One cannot invest directly in an index. Index performance does not reflect fund performance.
The Fund is new with limited operating history.
ALPS Intermediate Municipal Bond ETF's shares are not individually redeemable. Investors buy and sell shares of the Fund on a secondary market. Only market makers or “authorized participants” may trade directly with the Fund, typically in blocks of 25,000 shares.
ALPS Intermediate Municipal Bond ETF is not suitable for all investors. Investments in the Fund are subject to investment risks, including possible loss of the principal amount invested.
ALPS Portfolio Solutions Distributor, Inc., a FINRA member, is the distributor for the Fund.
1 | May 31, 2022
ALPS Intermediate Municipal Bond ETF
| Performance Overview | May 31, 2022 (Unaudited) |
Top Ten Holdings* (as of May 31, 2022)
| Port Authority of New York & New Jersey | 3.81 | % | ||
| New York State Dormitory Authority | 3.69 | % | ||
| City of San Antonio TX Electric & Gas Systems Revenue | 3.67 | % | ||
| Illinois State Toll Highway Authority | 3.57 | % | ||
| State of Ohio | 3.51 | % | ||
| City of Houston TX Airport System Revenue | 3.45 | % | ||
| Brazosport Independent School District | 3.43 | % | ||
| Virginia College Building Authority | 3.43 | % | ||
| Ohio Housing Finance Agency | 3.35 | % | ||
| South Dakota Housing Development Authority | 3.35 | % | ||
| Total % of Top 10 Holdings | 35.26 | % |
Sector Allocation* (as of May 31, 2022)
| Revenue Bonds | 64.48 | % | ||
| General Obligation Bonds | 21.13 | % | ||
| Money Market Fund | 14.39 | % | ||
| Total | 100.00 | % |
| * | % of Total Investments |
Future holdings are subject to change.
Growth of $10,000 (as of May 31, 2022)
Comparison of Change in Value of $10,000 Investment in the Fund and the Indexes
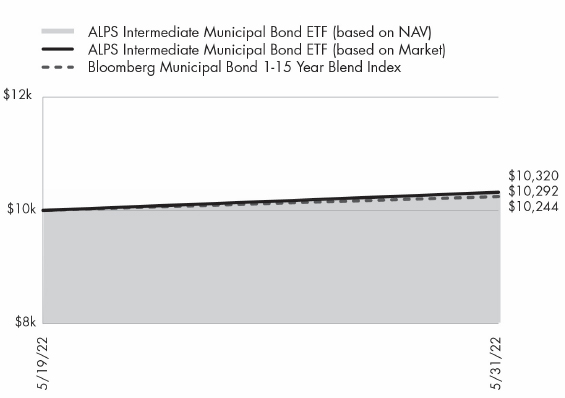
The chart above compares historical performance of a hypothetical investment of $10,000 in the Fund since inception with the performance of the Fund’s benchmark index. Results include the reinvestment of all dividends and capital gains distributions. Past performance does not guarantee future results. The graph does not reflect the deduction of taxes that a shareholder would pay on Fund distributions or the redemption of Fund shares.
2 | May 31, 2022
ALPS Intermediate Municipal Bond ETF
| Disclosure of Fund Expenses | May 31, 2022 (Unaudited) |
Shareholder Expense Example: As a shareholder of the Fund, you incur certain ongoing costs, including management fees and other Fund expenses. These examples are intended to help you understand your ongoing costs (in dollars) of investing in the Fund and to compare these costs with the ongoing costs of investing in other funds. The example is based on an investment of $1,000 invested at the beginning of the six month period and held through May 31, 2022.
Actual Return: The first line of the table provides information about actual account values and actual expenses. You may use the information in this line, together with the amount you invested, to estimate the expenses that you incurred over the period. Simply divide your account value by $1,000 (for example, an $8,600 account value divided by $1,000 = 8.6), then multiply the result by the number in the first line under the heading entitled “Expenses Paid During Period” to estimate the expenses attributable to your investment during this period.
Hypothetical 5% Return: The second line of the table provides information about hypothetical account values and hypothetical expenses based on the Fund’s actual expense ratio and an assumed rate of return of 5% per year before expenses, which is not the Fund’s actual return. The hypothetical account values and expenses may not be used to estimate the actual ending account balance or expenses you paid for the period. You may use this information to compare ongoing costs of investing in the Fund and other funds. To do so, compare this 5% hypothetical example with the 5% hypothetical examples that appear in the shareholder reports of other funds.
The expenses shown in the table are meant to highlight ongoing Fund costs only and do not reflect any transaction costs, such as brokerage commissions and other fees to financial intermediaries. Therefore, the second line of the table is useful in comparing ongoing costs only, and will not help you determine the relative total costs of owning different funds. In addition, if these costs were included, your costs would have been higher.
| Beginning Account Value 12/1/21 | Ending Account Value 5/31/22 | Expense Ratio(a) | Expenses Paid During Period 12/1/21 - 5/31/22(b) | |||||||||||||
| ALPS Intermediate Municipal Bond ETF | ||||||||||||||||
| Actual(c) | $ | 1,000.00 | $ | 1,029.20 | 0.50 | % | $ | 0.18 | ||||||||
| Hypothetical (5% return before expenses) | $ | 1,000.00 | $ | 1,022.44 | 0.50 | % | $ | 2.52 | ||||||||
| (a) | Annualized, based on the Fund's most recent fiscal half year expenses. |
| (b) | Expenses are equal to the Fund's annualized expense ratio multiplied by the average account value over the period, multiplied by the number of days in the most recent fiscal half year (182), divided by 365. |
| (c) | ALPS Intermediate Municipal Bond ETF commenced operations on May 19, 2022. Actual expenses on this Fund are equal to the Fund's annualized expense ratio multiplied by the average account value of the period, multiplied by the number of days since the Fund launched (13) divided by 365. |
3 | May 31, 2022
ALPS Intermediate Municipal Bond ETF
| Schedule of Investments | May 31, 2022 (Unaudited) |
| Security Description | Principal Amount | Value | ||||||
| MUNICIPAL BONDS (101.85%) | ||||||||
| General Obligation Bonds (25.15%) | ||||||||
| Brazosport Independent School | ||||||||
| District | ||||||||
| 5.00%, 02/15/2026 | $ | 1,000,000 | $ | 1,101,980 | ||||
| Chino Valley Unified School | ||||||||
| District | ||||||||
| 0.00%, 08/01/2035(a) | 95,000 | 57,000 | ||||||
| County of King WA | ||||||||
| 5.00%, 01/01/2034 | 500,000 | 570,235 | ||||||
| County of Montgomery MD | ||||||||
| 0.62%, 11/01/2037(b) | 1,000,000 | 1,000,000 | ||||||
| Deschutes & Jefferson Counties | ||||||||
| School District No 2J Redmond | ||||||||
| 0.00%, 06/15/2028(a) | 1,250,000 | 1,056,350 | ||||||
| Harlandale Independent School | ||||||||
| District | ||||||||
| 5.00%, 02/15/2027 | 660,000 | 740,441 | ||||||
| Long Beach Community College | ||||||||
| District | ||||||||
| 0.00%, 06/01/2030(a) | 1,000,000 | 778,210 | ||||||
| Northside Independent School | ||||||||
| District | ||||||||
| 2.00%, 06/01/2052(b) | 140,000 | 136,237 | ||||||
| Rowland Unified School District | ||||||||
| 0.00%, 08/01/2033(a) | 1,000,000 | 607,480 | ||||||
| San Diego Unified School District | ||||||||
| 0.00%, 07/01/2034(a) | 100,000 | 63,250 | ||||||
| San Mateo County Community | ||||||||
| College District | ||||||||
| 0.00%, 09/01/2035(a) | 110,000 | 71,898 | ||||||
| State of Connecticut | ||||||||
| 5.00%, 04/15/2029 | 530,000 | 610,809 | ||||||
| Total General Obligation Bonds | 6,793,890 | |||||||
| Revenue Bonds (76.70%) | ||||||||
| Anaheim Public Financing | ||||||||
| Authority | ||||||||
| 0.00%, 09/01/2030(a) | 250,000 | 194,235 | ||||||
| Charlotte-Mecklenburg Hospital | ||||||||
| Authority | ||||||||
| 4.00%, 01/15/2037 | 500,000 | 509,075 | ||||||
| 0.62%, 01/15/2038(b) | 900,000 | 900,000 | ||||||
| City of Houston TX Airport System | ||||||||
| Revenue | ||||||||
| 5.00%, 07/01/2028 | 1,000,000 | 1,109,740 | ||||||
| City of San Antonio TX Electric & | ||||||||
| Gas Systems Revenue | ||||||||
| 5.00%, 02/01/2031 | 1,000,000 | 1,178,580 | ||||||
| Development Authority of Burke | ||||||||
| County | ||||||||
| 1.50%, 01/01/2040(b) | 175,000 | 170,665 | ||||||
| 1.70%, 12/01/2049(b) | 650,000 | 629,597 | ||||||
| E-470 Public Highway Authority | ||||||||
| 0.00%, 09/01/2024(a) | 1,000,000 | 949,570 | ||||||
| Security Description | Principal Amount | Value | ||||||
| Revenue Bonds (continued) | ||||||||
| Illinois Finance Authority | ||||||||
| 5.00%, 08/15/2035 | $ | 210,000 | $ | 238,287 | ||||
| 0.60%, 08/15/2049(b) | 1,000,000 | 1,000,000 | ||||||
| Illinois State Toll Highway | ||||||||
| Authority | ||||||||
| 5.00%, 01/01/2029 | 1,000,000 | 1,148,530 | ||||||
| Kentucky Public Energy Authority | ||||||||
| 4.00%, 12/01/2049(b) | 110,000 | 113,010 | ||||||
| Massachusetts Housing Finance | ||||||||
| Agency | ||||||||
| 4.15%, 12/01/2037(c) | 250,000 | 255,158 | ||||||
| Metropolitan Washington | ||||||||
| Airports Authority Aviation | ||||||||
| Revenue | ||||||||
| 5.00%, 10/01/2028(c) | 500,000 | 557,110 | ||||||
| New Jersey Transportation Trust | ||||||||
| Fund Authority | ||||||||
| 0.00%, 12/15/2031(a) | 1,375,000 | 998,553 | ||||||
| New York State Dormitory | ||||||||
| Authority | ||||||||
| 5.00%, 03/15/2031 | 1,000,000 | 1,186,269 | ||||||
| North Dakota Housing Finance | ||||||||
| Agency | ||||||||
| 4.25%, 01/01/2049 | 500,000 | 514,305 | ||||||
| 3.00%, 01/01/2052 | 1,000,000 | 991,490 | ||||||
| Ohio Air Quality Development | ||||||||
| Authority | ||||||||
| 4.25%, 11/01/2039(b) | 500,000 | 520,735 | ||||||
| Ohio Housing Finance Agency | ||||||||
| 5.00%, 03/01/2052(c) | 1,000,000 | 1,076,880 | ||||||
| Port Authority of New York & | ||||||||
| New Jersey | ||||||||
| 5.00%, 11/01/2030 | 1,100,000 | 1,224,905 | ||||||
| Railsplitter Tobacco Settlement | ||||||||
| Authority | ||||||||
| 5.00%, 06/01/2026 | 65,000 | 70,328 | ||||||
| Salt Verde Financial Corp. | ||||||||
| 5.00%, 12/01/2032 | 675,000 | 754,198 | ||||||
| South Dakota Housing | ||||||||
| Development Authority | ||||||||
| 5.00%, 05/01/2053(c) | 1,000,000 | 1,075,890 | ||||||
| State of Ohio | ||||||||
| 5.00%, 01/01/2028 | 1,000,000 | 1,127,320 | ||||||
| Tennessee Housing Development | ||||||||
| Agency | ||||||||
| 5.00%, 01/01/2053(c) | 1,000,000 | 1,074,960 | ||||||
| Texas Municipal Gas Acquisition and Supply Corp. I | ||||||||
| 6.25%, 12/15/2026 | 50,000 | 53,844 | ||||||
| Virginia College Building Authority | ||||||||
| 5.00%, 02/01/2026 | 1,000,000 | 1,101,049 | ||||||
| Total Revenue Bonds | 20,724,283 | |||||||
| TOTAL MUNICIPAL BONDS | ||||||||
| (Cost $26,895,099) | 27,518,173 | |||||||
4 | May 31, 2022
ALPS Intermediate Municipal Bond ETF
| Schedule of Investments | May 31, 2022 (Unaudited) |
| 7 Day Yield | Shares | Value | ||||||||||
| SHORT TERM INVESTMENTS (17.13%) | ||||||||||||
| Money Market Fund | ||||||||||||
| State Street Institutional US | ||||||||||||
| Government Money Market Fund | 0.75 | % | 4,626,811 | $ | 4,626,811 | |||||||
| TOTAL SHORT TERM INVESTMENTS | ||||||||||||
| (Cost $4,626,811) | 4,626,811 | |||||||||||
| TOTAL INVESTMENTS (118.98%) | ||||||||||||
| (Cost $31,521,910) | $ | 32,144,984 | ||||||||||
| LIABILITIES IN EXCESS OF OTHER ASSETS (-18.98%) | (5,127,360 | ) | ||||||||||
| NET ASSETS - 100.00% | $ | 27,017,624 | ||||||||||
| (a) | Zero coupon bond. |
| (b) | Floating or variable rate security. Interest rate resets periodically on specific dates. The rate shown represents the coupon or interest rate as of May 31, 2022. Security description includes the reference rate and spread if published and available. |
| (c) | Represents a security purchased on a when-issued basis. |
See Notes to Financial Statements.
5 | May 31, 2022
ALPS Intermediate Municipal Bond ETF
| Statement of Assets and Liabilities | May 31, 2022 (Unaudited) |
| ASSETS: | ||||
| Investments, at value | $ | 32,144,984 | ||
| Receivable for investments sold | 578,597 | |||
| Interest receivable | 194,706 | |||
| Total Assets | 32,918,287 | |||
| LIABILITIES: | ||||
| Payable for investments purchased | 5,896,794 | |||
| Payable to adviser | 3,869 | |||
| Total Liabilities | 5,900,663 | |||
| NET ASSETS | $ | 27,017,624 | ||
| NET ASSETS CONSIST OF: | ||||
| Paid-in capital | $ | 26,368,582 | ||
| Total distributable earnings | 649,042 | |||
| NET ASSETS | $ | 27,017,624 | ||
| INVESTMENTS, AT COST | $ | 31,521,910 | ||
| PRICING OF SHARES | ||||
| Net Assets | $ | 27,017,624 | ||
| Shares of beneficial interest outstanding (Unlimited number of shares authorized, par value $0.01 per share) | 1,050,002 | |||
| Net Asset Value, offering and redemption price per share | $ | 25.73 | ||
See Notes to Financial Statements.
6 | May 31, 2022
ALPS Intermediate Municipal Bond ETF
| Statement of Operations | For the Period Ended May 31, 2022 (Unaudited)(a) |
| INVESTMENT INCOME: | ||||
| Interest | $ | 14,842 | ||
| Total Investment Income | 14,842 | |||
| EXPENSES: | ||||
| Investment adviser fees | 3,869 | |||
| Net Expenses | 3,869 | |||
| NET INVESTMENT INCOME | 10,973 | |||
| REALIZED AND UNREALIZED GAIN/(LOSS): | ||||
| Net realized gain on investments | 14,995 | |||
| Net change in unrealized appreciation on investments | 623,074 | |||
| Total net change in unrealized appreciation | 623,074 | |||
| NET REALIZED AND UNREALIZED GAIN ON INVESTMENTS | 638,069 | |||
| NET INCREASE IN NET ASSETS RESULTING FROM OPERATIONS | $ | 649,042 | ||
| (a) | The ALPS Intermediate Municipal Bond ETF commenced operations on May 19, 2022. |
See Notes to Financial Statements.
7 | May 31, 2022
ALPS Intermediate Municipal Bond ETF
Statement of Changes in Net Assets
| For the Period May 19, 2022 (Commencement of Operations) to May 31, 2022 (Unaudited) | ||||
| OPERATIONS: | ||||
| Net investment income | $ | 10,973 | ||
| Net realized gain | 14,995 | |||
| Net change in unrealized appreciation | 623,074 | |||
| Net increase in net assets resulting from operations | 649,042 | |||
| CAPITAL SHARE TRANSACTIONS: | ||||
| Proceeds from sale of shares | 26,368,582 | |||
| Net increase from capital share transactions | 26,368,582 | |||
| Net increase in net assets | 27,017,624 | |||
| NET ASSETS: | ||||
| Beginning of period | – | |||
| End of period | $ | 27,017,624 | ||
| OTHER INFORMATION: | ||||
| CAPITAL SHARE TRANSACTIONS: | ||||
| Beginning shares | – | |||
| Shares sold | 1,050,002 | |||
| Shares outstanding, end of period | 1,050,002 | |||
See Notes to Financial Statements.
8 | May 31, 2022
ALPS Intermediate Municipal Bond ETF
| Financial Highlights | For a Share Outstanding Throughout the Periods Presented |
| For the Period May 19, 2022 (Commencement of Operations) to May 31, 2022 (Unaudited) | ||||
| NET ASSET VALUE, BEGINNING OF PERIOD | $ | 25.00 | ||
| INCOME FROM OPERATIONS: | ||||
| Net investment income(a) | 0.01 | |||
| Net realized and unrealized gain | 0.72 | |||
| Total from investment operations | 0.73 | |||
| NET INCREASE IN NET ASSET VALUE | 0.73 | |||
| NET ASSET VALUE, END OF PERIOD | $ | 25.73 | ||
| TOTAL RETURN(b) | 2.92 | % | ||
| RATIOS/SUPPLEMENTAL DATA: | ||||
| Net assets, end of period (in 000s) | $ | 27,018 | ||
| RATIOS TO AVERAGE NET ASSETS | ||||
| Ratio of expenses to average net assets | 0.50 | %(c) | ||
| Ratio of net investment income to average net assets | 1.41 | %(c) | ||
| Portfolio turnover rate(d) | 13 | % | ||
| (a) | Based on average shares outstanding during the period. |
| (b) | Total return is calculated assuming an initial investment made at the net asset value at the beginning of the period and redemption at the net asset value on the last day of the period and assuming all distributions are reinvested at the reinvestment prices. Total return calculated for a period of less than one year is not annualized. |
| (c) | Annualized. |
| (d) | Portfolio turnover for periods less than one year are not annualized and does not include securities received or delivered from processing creations or redemptions in-kind. |
See Notes to Financial Statements.
9 | May 31, 2022
ALPS Intermediate Municipal Bond ETF
| Notes to Financial Statements | May 31, 2022 (Unaudited) |
1. ORGANIZATION
ALPS ETF Trust (the “Trust”), a Delaware statutory trust, is an open-end management investment company registered under the Investment Company Act of 1940, as amended (the “1940 Act”). As of May 31, 2022, the Trust consists of nineteen separate portfolios. Each portfolio represents a separate series of the Trust. This report pertains solely to the ALPS Intermediate Municipal Bond ETF (the “Fund”). The investment objective of the Fund is to protect investor’s capital and generate attractive risk-adjusted returns. The Fund has elected to qualify as a diversified series of the Trust under the 1940 Act.
The Fund’s Shares (“Shares”) are listed on the NYSE Arca, Inc. (the “NYSE Arca”). The Fund issues and redeems Shares at net asset value (“NAV”) in blocks of 25,000 Shares, each of which is called a “Creation Unit”. Creation Units are issued and redeemed principally in-kind for securities. Except when aggregated in Creation Units, Shares are not redeemable securities of the Fund.
Pursuant to the Trust’s organizational documents, its Officers and Trustees are indemnified against certain liability arising out of the performance of their duties to the Trust. Additionally, in the normal course of business, the Trust enters into contracts with service providers that contain general indemnification clauses. The Trust’s maximum exposure under these arrangements is unknown, as this would involve future claims that may be made against the Trust that have not yet occurred.
2. SIGNIFICANT ACCOUNTING POLICIES
The following is a summary of significant accounting policies consistently followed by the Fund in the preparation of the financial statements. The accompanying financial statements were prepared in accordance with accounting principles generally accepted in the United States of America (“U.S. GAAP”). The preparation of financial statements in conformity with U.S. GAAP requires management to make certain estimates and assumptions that affect the reported amounts of assets and liabilities and disclosures of contingent assets and liabilities at the date of the financial statements and the reported amounts of revenue and expenses during the period. Actual results could differ from those estimates. The Fund is considered an investment company under U.S. GAAP and follows the accounting and reporting guidance applicable to investment companies in the Financial Accounting Standards Board (“FASB”) Accounting Standards Codification Topic 946.
A. Portfolio Valuation
The Fund’s NAV is determined daily, as of the close of regular trading on the New York Stock Exchange (the "NYSE"), normally 4:00 p.m. Eastern Time, on each day the NYSE is open for trading. The NAV is computed by dividing the value of all assets of the Fund (including accrued interest and dividends), less all liabilities (including accrued expenses and dividends declared but unpaid), by the total number of shares outstanding.
Portfolio securities listed on any exchange other than the NASDAQ Stock Market LLC (“NASDAQ”) are valued at the last sale price on the business day as of which such value is being determined. If there has been no sale on such day, the securities are valued at the mean of the most recent bid and ask prices on such day. Securities traded on the NASDAQ are valued at the NASDAQ Official Closing Price as determined by NASDAQ. Portfolio securities traded on more than one securities exchange are valued at the last sale price on the business day as of which such value is being determined at the close of the exchange representing the principal market for such securities. Portfolio securities traded in the over-the-counter market, but excluding securities traded on the NASDAQ, are valued at the latest quoted sale price in such market.
The market price for debt securities is generally the evaluated price supplied by an independent third-party pricing service approved by the Board, which references a combination of transactions and quotations for the same or other securities believed to be comparable in quality, coupon, maturity, type of issue, call provisions, trading characteristics and other features deemed to be relevant. To the extent the Fund’s debt securities are valued based on price quotations or other equivalent indications of value provided by a third-party pricing service, any such third-party pricing service may use a variety of methodologies to value some or all of the Fund’s debt securities to determine the market price.
The Fund’s investments are valued at market value or, in the absence of market value with respect to any portfolio securities, at fair value according to procedures adopted by the Trust’s Board of Trustees (the “Board”). When market quotations are not readily available or when events occur that make established valuation methods unreliable, securities of the Fund may be valued in good faith by or under the direction of the Board. These securities generally include, but are not limited to, restricted securities (securities which may not be publicly sold without registration under the Securities Act of 1933) for which a pricing service is unable to provide a market price; securities whose trading has been formally suspended; a security whose market price is not available from a pre-established primary pricing source or the pricing source is not willing to provide a price; a security with respect to which an event has occurred that is most likely to materially affect the value of the security after the market has closed but before the calculation of the Fund’s NAV or make it difficult or impossible to obtain a reliable market quotation; or a security whose price, as provided by the pricing service, does not reflect the security’s “fair value” due to the security being de-listed from a national exchange or the security’s primary trading market is temporarily closed at a time when, under normal conditions, it would be open. As a general principle, the current “fair value” of a security would be the amount which the owner might reasonably expect to receive from the sale on the applicable exchange or principal market. A variety of factors may be considered in determining the fair value of such securities.
10 | May 31, 2022
ALPS Intermediate Municipal Bond ETF
| Notes to Financial Statements | May 31, 2022 (Unaudited) |
B. Fair Value Measurements
The Fund discloses the classification of its fair value measurements following a three-tier hierarchy based on the inputs used to measure fair value. Inputs refer broadly to the assumptions that market participants would use in pricing the asset or liability, including assumptions about risk. Inputs may be observable or unobservable. Observable inputs reflect the assumptions market participants would use in pricing the asset or liability that are developed based on market data obtained from sources independent of the reporting entity. Unobservable inputs reflect the reporting entity’s own assumptions about the assumptions market participants would use in pricing the asset or liability that are developed based on the best information available.
Valuation techniques used to value the Fund’s investments by major category are as follows:
Equity securities, including restricted securities, for which market quotations are readily available, are valued at the last reported sale price or official closing price as reported by a third party pricing vendor on the primary market or exchange on which they are traded and are categorized as Level 1 in the hierarchy. In the event there were no sales during the day or closing prices are not available, securities are valued at the mean of the most recent quoted bid and ask prices on such day and are generally categorized as Level 2 in the hierarchy. Investments in open-end mutual funds are valued at their closing NAV each business day and are categorized as Level 1 in the hierarchy.
Debt securities, including restricted securities, are valued based on evaluated prices received from third party pricing vendors or from brokers who make markets in such securities. For municipal bonds, pricing vendors utilize matrix pricing which considers yield or price of bonds of comparable quality, coupon, maturity and type as well as broker-supplied prices. When independent prices are unavailable or unreliable, debt securities may be valued utilizing pricing methodologies which consider similar factors that would be used by third party pricing vendors. Debt securities are generally categorized as Level 2 in the hierarchy but may be Level 3 depending on the circumstances.
Changes in valuation techniques may result in transfers in or out of an assigned level within the disclosure hierarchy.
Various inputs are used in determining the value of the Fund’s investments as of the end of the reporting period. When inputs used fall into different levels of the fair value hierarchy, the level in the hierarchy within which the fair value measurement falls is determined based on the lowest level input that is significant to the fair value measurement in its entirety. The designated input levels are not necessarily an indication of the risk or liquidity associated with these investments.
These inputs are categorized in the following hierarchy under applicable financial accounting standards:
| Level 1 – | Unadjusted quoted prices in active markets for identical investments, unrestricted assets or liabilities that a Fund has the ability to access at the measurement date;
|
| Level 2 – | Quoted prices which are not active, quoted prices for similar assets or liabilities in active markets or inputs other than quoted prices that are observable (either directly or indirectly) for substantially the full term of the asset or liability; and
|
| Level 3 – | Significant unobservable prices or inputs (including the Fund’s own assumptions in determining the fair value of investments) where there is little or no market activity for the asset or liability at the measurement date. |
The following is a summary of inputs used to value the Fund’s investments as of May 31, 2022:
ALPS Intermediate Municipal Bond ETF
| Investments in Securities at Value | Level 1 - Quoted and Unadjusted Prices | Level 2 - Other Significant Observable Inputs | Level 3 - Significant Unobservable Inputs | Total | ||||||||||||
| Municipal Bonds* | $ | – | $ | 27,518,173 | $ | – | $ | 27,518,173 | ||||||||
| Short Term Investments | 4,626,811 | – | – | 4,626,811 | ||||||||||||
| Total | $ | 4,626,811 | $ | 27,518,173 | $ | – | $ | 32,144,984 | ||||||||
| * | For a detailed breakdown of sectors, see the accompanying Schedule of Investments. |
The Fund did not have any securities that used significant unobservable inputs (Level 3) in determining fair value and there were no transfers into or out of Level 3 during the period ended May 31, 2022.
11 | May 31, 2022
ALPS Intermediate Municipal Bond ETF
| Notes to Financial Statements | May 31, 2022 (Unaudited) |
C. Securities Transactions and Investment Income
Securities transactions are recorded as of the trade date. Realized gains and losses from securities transactions are recorded on the specific identification basis in accordance with GAAP. Dividend income and capital gains distributions, if any, are recorded on the ex-dividend date. Interest income, if any, is recorded on the accrual basis, including amortization of premiums and accretion of discounts.
D. Dividends and Distributions to Shareholders
Dividends from net investment income of the Fund, if any, are declared and paid monthly or as the Board may determine from time to time. Distributions of net realized capital gains earned by the Fund, if any, are distributed at least annually.
E. Federal Tax and Tax Basis Information
The timing and character of income and capital gain distributions are determined in accordance with income tax regulations, which may differ from U.S. GAAP. Reclassifications are made to the Fund’s capital accounts for permanent tax differences to reflect income and gains available for distribution (or available capital loss carryforwards) under income tax regulations. The amounts and characteristics of tax basis distributions and composition of distributable earnings/(accumulated losses) are finalized at fiscal year-end; accordingly, tax basis balances have not been determined as of May 31, 2022.
As of May 31, 2022, the cost of investments for federal income tax purposes and accumulated net unrealized appreciation/(depreciation) on investments were as follows:
| ALPS Intermediate Municipal Bond ETF | ||||
| Gross appreciation (excess of value over tax cost) | $ | 623,074 | ||
| Gross depreciation (excess of tax cost over value) | – | |||
| Net unrealized appreciation (depreciation) | $ | 623,074 | ||
| Cost of investments for income tax purposes | $ | 31,521,910 | ||
Certain tax cost basis adjustments are finalized at fiscal year-end and therefore have not been determined as of May 31, 2022.
G. Income Taxes
No provision for income taxes is included in the accompanying financial statements, as the Fund intends to distribute to shareholders all taxable investment income and realized gains and otherwise comply with Subchapter M of the Internal Revenue Code of 1986, as amended, applicable to regulated investment companies. The Fund evaluates tax positions taken (or expected to be taken) in the course of preparing the Fund’s tax returns to determine whether these positions meet a “more-likely-than-not” standard that, based on the technical merits, have a more than fifty percent likelihood of being sustained by a taxing authority upon examination. A tax position that meets the “more-likely-than-not” recognition threshold is measured to determine the amount of benefit to recognize in the financial statements.
As of and during the period ended May 31, 2022, the Fund did not have a liability for any unrecognized tax benefits. The Fund files U.S. federal, state, and local tax returns as required. The Fund’s tax returns are subject to examination by the relevant tax authorities until expiration of the applicable statute of limitations, which is generally three years after the filing of the tax return, but may extend to four years in certain jurisdictions. Tax returns for open years have incorporated no uncertain tax positions that require a provision for income taxes.
3. INVESTMENT ADVISORY FEE AND OTHER AFFILIATED TRANSACTIONS
ALPS Advisors, Inc. (the “Adviser”) serves as the Fund’s investment adviser pursuant to an Investment Advisory Agreement with the Trust on behalf of the Fund (the “Advisory Agreement”). Pursuant to the Advisory Agreement, the Fund pays the Adviser an annual management fee for the services and facilities it provides, payable on a monthly basis at the annual rate of 0.50% of the Fund’s average daily net assets.
Out of the unitary management fee, the Adviser pays substantially all expenses of the Fund, including the cost of sub-advisory, transfer agency, custody, fund administration, legal, audit, trustees and other services, except for acquired fund fees and expenses, interest expenses, distribution fees or expenses, brokerage expenses, taxes and extraordinary expenses not incurred in the ordinary course of the Fund's business. The Adviser’s unitary management fee is designed to pay substantially all of the Fund’s expenses and to compensate the Adviser for providing services to the Fund.
12 | May 31, 2022
ALPS Intermediate Municipal Bond ETF
| Notes to Financial Statements | May 31, 2022 (Unaudited) |
Brown Brothers Harriman & Co. (the “Sub-Adviser”) serves as the Fund's sub-adviser pursuant to a sub-advisory agreement with the Trust (the ‘‘Sub-Advisory Agreement’’). Pursuant to the Sub-Advisory Agreement, the Adviser pays the Sub-Adviser a sub-advisory fee out of the Adviser's advisory fee for the services it provides. The fee is payable on a monthly basis at the annual rate of 0.25% of the Fund's average daily net assets.
ALPS Fund Services, Inc., an affiliate of the Adviser, is the administrator of the Fund.
Each Trustee receives (1) a quarterly retainer of $20,000, (2) a per meeting fee of $10,000, (3) $2,500 for any special meeting held outside of a regularly scheduled board meeting, and (4) reimbursement for all reasonable out-of-pocket expenses relating to attendance at meetings. In addition, the Chairman of the Board receives a quarterly retainer of $5,000, the Chairman of the Audit Committee receives a quarterly retainer of $3,000, and the Chairman of the Nominating & Givernance Committee receives a quarterly retainer of $2,000, each in connection with their respective roles.
4. PURCHASES AND SALES OF SECURITIES
For the period starting with the commencement of operations and ending May 31, 2022, the cost of purchases and proceeds from sales of investment securities, excluding short-term investments and in-kind transactions, were as follows:
| Fund | Purchases | Sales | ||||||
| ALPS Intermediate Municipal Bond ETF | $ | 8,663,897 | $ | 3,569,545 | ||||
For the period starting with the commencement of operations and ending May 31, 2022, there were no in-kind transactions or realized gain/(losses) on in-kind transactions.
5. CAPITAL SHARE TRANSACTIONS
Shares are created and redeemed by the Fund only in Creation Unit size aggregations of 25,000 Shares. Only broker-dealers or large institutional investors with creation and redemption agreements called Authorized Participants (“AP”) are permitted to purchase or redeem Creation Units from the Fund. Such transactions are generally permitted on an in-kind basis, with a balancing cash component to equate the transaction to the NAV per unit of the Fund on the transaction date. Cash may be substituted equivalent to the value of certain securities generally when they are not available in sufficient quantity for delivery, not eligible for trading by the AP or as a result of other market circumstances.
6. MARKET RISK
The Fund is subject to investment and operational risks associated with financial, economic and other global market developments and disruptions, including the recent spread of an infectious respiratory illness caused by a novel strain of coronavirus (known as COVID-19), which can negatively impact the securities markets and cause the Fund to lose value. Securities in the Fund's portfolio may underperform in comparison to securities in general financial markets, a particular financial market or other asset classes due to a number of factors, including inflation (or expectations for inflation), deflation (or expectations for deflation), interest rates, global demand for particular products or resources, market instability, debt crises and downgrades, embargoes, tariffs, sanctions and other trade barriers, regulatory events, other governmental trade or market control programs and related geopolitical events. In addition, the value of the Fund's investments may be negatively affected by the occurrence of global events such as war, terrorism, environmental disasters, natural disasters or events, country instability, and infectious disease epidemics or pandemics.
The spread of COVID-19 has caused volatility, severe market dislocations and liquidity constraints in many markets, including markets for the securities the Fund holds, and may adversely affect the Fund’s investments and operations. The transmission of COVID-19 and efforts to contain its spread have resulted in travel restrictions and disruptions, closed international borders, enhanced health screenings at ports of entry and elsewhere, disruption of and delays in healthcare service preparation and delivery, quarantines, event and service cancellations or interruptions, disruptions to business operations and supply chains, and a reduction in consumer and business spending, as well as general concern and uncertainty that has negatively affected the economy. These disruptions have led to instability in the market place and the jobs market. The impact of COVID-19 could adversely affect the economies of many nations or the entire global economy, the financial well-being and performance of individual issuers, borrowers and sectors and the health of the markets generally in potentially significant and unforeseen ways.
The foregoing could lead to a significant economic downturn or recession, increased market volatility, a greater number of market closures, higher default rates and adverse effects on the values and liquidity of the Fund’s securities or other assets. Such impacts may adversely affect the performance of the Fund.
13 | May 31, 2022
ALPS Intermediate Municipal Bond ETF
| Notes to Financial Statements | May 31, 2022 (Unaudited) |
7. SUBSEQUENT EVENTS
On June 21, 2022, upon the recommendation of the Fund’s Audit Committee, the Board of Trustees of the Fund approved the engagement of BBD, LLP as the independent registered public accounting firm for the Fund for the fiscal year ending November 30, 2022.
14 | May 31, 2022
ALPS Intermediate Municipal Bond ETF
| Additional Information | May 31, 2022 (Unaudited) |
PROXY VOTING RECORDS, POLICIES AND PROCEDURES
Information regarding how the Fund voted proxies relating to portfolio securities during the most recent 12-month period ended June 30 and a description of the Fund’s proxy voting policies and procedures used in determining how to vote for proxies are available without charge on the SEC’s website at www.sec.gov and upon request, by calling (toll-free) 1-866-759-5679.
PORTFOLIO HOLDINGS
The Fund files a complete schedule of portfolio holdings with the U.S. Securities and Exchange Commission (“SEC”) for the first and third quarters of each fiscal year on Form N-PORT within 60 days after the end of the period. Copies of the Fund’s Form N-PORT are available without a charge, upon request, by contacting the Fund at 1-866-759-5679 and on the SEC’s website at https://www.sec.gov.
15 | May 31, 2022
ALPS Intermediate Municipal Bond ETF
| Board Considerations Regarding Approval of Investment Advisory Agreements | May 31, 2022 (Unaudited) |
On September 13, 2021, the Board of Trustees of the Trust (the "Board" or the "Trustees") met via video conference to discuss, among other things, the approval of the Investment Advisory Agreement between ALPS ETF Trust (the “Trust”), with respect to the ALPS Intermediate Municipal Bond ETF (the “New Fund”) and ALPS Advisors, Inc. (the "Adviser" or “AAI”) and the Sub-Advisory Agreement among the Trust, with respect to the New Fund, Brown Brothers Harriman & Co. (“BBH”), and AAI, in accordance with Section 15(c) of the 1940 Act. On February 16, 2022, the Trustees met via video conference to discuss, among other things, the approval of certain revisions to the Sub-Advisory Agreement for the New Fund. In approving the Investment Advisory Agreement and the Investment Sub-Advisory Agreement, the Trustees, including the Independent Trustees, considered the following factors with respect to the New Fund:
In evaluating the New Fund’s Advisory Agreement, the Board, including the Independent Trustees, considered various factors, including (i) the nature, extent and quality of the services expected to be provided by the Adviser to New Fund under the New Fund’s Advisory Agreement; (ii) the advisory fees and other expenses proposed to be paid by New Fund compared to those of similar funds managed by other investment advisers; (iii) the expected costs of the services to be provided to New Fund and the projected profitability to be realized by the Adviser and its affiliates from the Adviser’s relationship with New Fund; (iv) the extent to which economies of scale would be realized if and as New Fund’s assets increase and whether the fee level in the New Fund’s Advisory Agreement reflects these economies of scale for the benefit of shareholders; and (v) any additional benefits and other considerations.
With respect to the nature, extent and quality of the services to be provided by the Adviser under the New Fund’s Advisory Agreement, the Board, including the Independent Trustees, considered and reviewed information concerning the services proposed to be provided under the New Fund’s Advisory Agreement, the proposed investment strategy, financial information regarding the Adviser and its parent company, information describing the Adviser’s current organization and the background and experience of the persons who would be responsible for the day-to-day management of New Fund, the anticipated financial support of New Fund, and the nature and quality of services provided to other ETFs, open-end and closed-end funds sponsored by the Adviser. Based upon their review, the Board, including the Independent Trustees, concluded that the Adviser was qualified to oversee the services to be provided by other service providers and that the services to be provided by the Adviser to New Fund are expected to be satisfactory.
With respect to the costs of services to be provided and profits to be realized by the Adviser, the Board, including the Independent Trustees, considered the resources involved in managing New Fund as well as the fact that the Adviser agreed to pay all of New Fund’s expenses (except for interest expenses, distribution fees or expenses, brokerage expenses, taxes and extraordinary expenses such as litigation and other expenses not incurred in the ordinary course of New Fund’s business) out of the unitary advisory fee. Based on their review, the Board, including the Independent Trustees, concluded that the expected profitability of New Fund to the Adviser was not unreasonable.
The Board, including the Independent Trustees, also reviewed comparative fee and expense data provided by FUSE regarding New Fund. The Trustees noted the proposed advisory fee for services to be provided to New Fund by the Adviser was 0.50% of New Fund’s average daily net assets. The Trustees also considered that the advisory fee with respect to New Fund was a unitary one and that, as set forth above, the Adviser had agreed to pay all of New Fund’s expenses (except for interest expenses, marketing fees, distribution fees or expenses, brokerage expenses, taxes and extraordinary expenses such as litigation and other expenses not incurred in the ordinary course of New Fund’s business) out of the unitary fee. The Board, including the Independent Trustees, considered that, taking into account the impact of New Fund’s unitary advisory fee, New Fund’s expense ratio was above the median of both of its FUSE gross advisory fees peer group and total net expenses peer group. The Board took into account, among other things, the Adviser’s representations that (i) most funds in the FUSE peer group are relatively new, with only three of the seven funds in the peer group displaying track records longer than one year, and (ii) BBH’s strategy has strong long-term performance. Based on the foregoing and the other information available to them, the Board, including the Independent Trustees, concluded that the advisory fees for New Fund were reasonable under the circumstances and in light of the quality of services to be provided.
The Board, including the Independent Trustees, also considered other benefits that may be realized by the Adviser from its relationship with New Fund and concluded that the advisory fees were reasonable taking into account such benefits.
The Board, including the Independent Trustees, considered the extent to which economies of scale would be realized as New Fund grows and whether fee levels reflect a reasonable sharing of such economies of scale for the benefit of New Fund investors. Because New Fund is newly organized, the Trustees reviewed New Fund’s proposed unitary advisory fee and anticipated expenses and determined to review economies of scale in the future when New Fund had attracted assets.
In voting to approve the New Fund’s Advisory Agreement, the Board, including the Independent Trustees, concluded that the terms of the New Fund Advisory Agreement are reasonable and fair in light of the services to be performed, the fees paid by certain other funds, expenses to be incurred and such other matters as the Board, including the Independent Trustees, considered relevant in the exercise of their reasonable business judgment. The Board, including the Independent Trustees, did not identify any single factor or group of factors as all important or controlling and considered all factors together.
16 | May 31, 2022
ALPS Intermediate Municipal Bond ETF
| Board Considerations Regarding Approval of Investment Advisory Agreements | May 31, 2022 (Unaudited) |
BBH Sub-Advisory Agreement
In evaluating the New Fund’s Sub-Advisory Agreement, the Board, including the Independent Trustees considered various factors, including (i) the nature, extent and quality of the services expected to be provided by BBH with respect to New Fund under the New Fund’s Sub-Advisory Agreement; (ii) the advisory fees and other expenses proposed to be paid by New Fund compared to those of similar funds managed by other investment advisers; (iii) the projected profitability to BBH of its proposed sub-advisory relationship with New Fund and the reasonableness of compensation to BBH (iv) the extent to which economies of scale would be realized if, and as, New Fund’s assets increase, and whether the fee level in the New Fund’s Sub-Advisory Agreement reflects these economies of scale; and (v) any additional benefits and other considerations.
With respect to the nature, extent and quality of the services to be provided by BBH under the New Fund’s Sub-Advisory Agreement, the Board, including the Independent Trustees considered and reviewed information concerning the services to be provided under the New Fund’s Sub-Advisory Agreement, the proposed investment strategy, financial information regarding BBH, information describing BBH’s current organization and the background and experience of the persons who would be responsible for the day-to-day management of New Fund. Based upon their review, the Board, including the Independent Trustees concluded that BBH was qualified to oversee the portfolio management of New Fund. The Board, including the Independent Trustees considered that the contractual sub-advisory fee to be paid to BBH is 0.25% of New Fund’s average daily net assets out of a total management fee of 0.50% with respect to New Fund. Based on the consideration of all factors deemed relevant by them, the Board, including the Independent Trustees concluded that the sub-advisory fees to be received by BBH under the New Fund’s Sub-Advisory Agreement are reasonable under the circumstances and in light of the quality of services provided.
With respect to the costs of services provided and profits realized by BBH, the Board, including the Independent Trustees considered the resources involved in managing New Fund. Based on their review of the projected profitability of New Fund to BBH, the Board, including the Independent Trustees, concluded that the projected profitability of New Fund to BBH was not unreasonable.
The Board, including the Independent Trustees also considered other benefits that have been and may be realized by BBH from its relationships with New Fund and concluded that the sub-advisory fees with respect to New Fund were reasonable taking into account such benefits.
In voting to approve the New Fund’s Sub-Advisory Agreement, the Board, including the Independent Trustees concluded that the terms of the New Fund’s Sub-Advisory Agreement are reasonable and fair in light of the services to be performed, expenses to be incurred and such other matters as the Board, including the Independent Trustees considered relevant in the exercise of their reasonable business judgment. The Board, including the Independent Trustees did not identify any single factor or group of factors as all important or controlling and considered all factors together.
17 | May 31, 2022

Table of Contents
| Performance Overview | |
| ALPS Clean Energy ETF | 1 |
| ALPS Disruptive Technologies ETF | 4 |
| ALPS Global Travel Beneficiaries ETF | 7 |
| ALPS Medical Breakthroughs ETF | 10 |
| Disclosure of Fund Expenses | 13 |
| Financial Statements | |
| Schedule of Investments | |
| ALPS Clean Energy ETF | 14 |
| ALPS Disruptive Technologies ETF | 16 |
| ALPS Global Travel Beneficiaries ETF | 18 |
| ALPS Medical Breakthroughs ETF | 20 |
| Statements of Assets and Liabilities | 22 |
| Statements of Operations | 23 |
| Statements of Changes in Net Assets | |
| ALPS Clean Energy ETF | 24 |
| ALPS Disruptive Technologies ETF | 25 |
| ALPS Global Travel Beneficiaries ETF | 26 |
| ALPS Medical Breakthroughs ETF | 27 |
| Financial Highlights | 28 |
| Notes to Financial Statements | 32 |
| Additional Information | 40 |
| Liquidity Risk Management Program | 44 |
alpsfunds.com
ALPS Clean Energy ETF
| Performance Overview | May 31, 2022 (Unaudited) |
Investment Objective
The ALPS Clean Energy ETF (the “Fund” or “ACES”) seeks investment results that correspond (before fees and expenses) generally to the performance of its underlying index, the CIBC Atlas Clean Energy Total Return Index (ticker symbol NACEX) (the “Underlying Index”). The Underlying Index utilizes a rules-based methodology developed by CIBC National Trust Company, which is designed to provide exposure to a diverse set of U.S. and Canadian companies involved in the clean energy sector including renewables and clean technology.
The Fund employs a “passive management” – or indexing – investment approach designed to track the performance of the Underlying Index. The Underlying Index utilizes a rules-based methodology developed by CIBC National Trust Company (the “Index Provider”), which is designed to provide exposure to a diverse set of U.S. and Canadian companies involved in the clean energy sector including renewables and clean technology. The clean energy sector is comprised of companies that provide the products and services that enable the evolution of a more sustainable energy sector. Clean energy business segments include, but are not limited to, the following activities: (i) renewable energy sources, including solar power, wind power, hydroelectricity, geothermal energy, biomass, biofuels, and tidal/wave energy, (ii) clean technologies, including electric vehicles, energy storage, lithium, fuel cell, smart grid, and energy efficiency technologies and (iii) other emerging clean energy activities and technologies. The Underlying Index is compiled by the Index Provider and may be comprised of U.S. or Canadian companies. In order to be eligible for inclusion in the Underlying Index, a company’s stock must be traded on one or more major U.S. or Canadian securities exchanges, be based in the U.S. or in Canada, have a minimum float-adjusted market capitalization and minimum average daily trading value thresholds established by the index rulebook of at least $300 million, and have a minimum median average daily trading liquidity of greater than $3 million over the last 60 trading days prior to the selection date, and the company must derive a majority of its value from clean energy business segments (as defined above). Such eligible companies shall be defined as the “Index Universe.” All equity securities meeting the above criteria are selected for inclusion in the Index Universe. The Underlying Index is reconstituted and rebalanced quarterly on the third Friday in March, June, September and December.
Fund Performance (as of May 31, 2022)
| 6 Months | 1 Year | 3 Year | Since Inception^ | |
| ALPS Clean Energy ETF - NAV | -27.87% | -22.57% | 26.84% | 22.59% |
| ALPS Clean Energy ETF - Market Price* | -27.94% | -22.63% | 26.87% | 22.55% |
| S&P 1000® Total Return Index | -6.73% | -7.20% | 13.27% | 7.79% |
| CIBC Atlas Clean Energy Total Return Index | -27.81% | -22.41% | 27.28% | 23.26% |
Total Expense Ratio (per the current prospectus) is 0.55%.
Performance data quoted represents past performance. Past performance does not guarantee future results. Total return figures assume reinvestment of dividends and capital gains distributions, if any. The table does not reflect the deduction of taxes that a shareholder would pay on Fund distributions or the redemption of Fund shares. Investment return and principal value of an investment will fluctuate so that an investor’s shares, when sold or redeemed, may be worth more or less than the original cost. Current performance data may be higher or lower than actual data quoted. For the most current month-end performance data please visit www.alpsfunds.com or call 1.866.759.5679.
NAV is an exchange-traded fund’s per-share value. The per-share dollar amount of the fund is derived by dividing the total value of all the securities in its portfolio, less any liabilities, by the number of fund shares outstanding. Market Price is the price at which a share can currently be traded in the market. Information detailing the number of days the Market Price of the Fund was greater than the Fund’s NAV and the number of days it was less than the Fund’s NAV can be obtained at www.alpsfunds.com.
| ^ | The Fund commenced operations on June 28, 2018, with the first day of trading on the exchange of June 29, 2018. |
| * | Market Price means the official closing price of a share or, if it more accurately reflects the market value of a share at the time as of which the Fund calculates current net asset value per share, the price that is the midpoint of the bid-ask spread as of that time. It does not represent the returns an investor would receive if shares were traded at other times. |
CIBC Atlas Clean Energy Total Return Index is an adjusted market cap weighted index designed to provide exposure to a diverse set of U.S. or Canadian based companies involved in the clean energy sector including renewables and clean technology. The clean energy sector is comprised of companies that provide the products and services which enable the evolution of a more sustainable energy sector. Clean energy business segments include but are not limited to: solar, wind, hydro, geothermal, electric vehicles, LED, biomass, smart grid, energy efficiency and storage. Total return assumes reinvestment of any dividends and distributions realized during a given time period.
The S&P 1000® Total Return Index combines the S&P MidCap 400® and the S&P SmallCap 600® to form an investable benchmark for the mid- to small-cap segment of the U.S. equity market. Total return assumes reinvestment of any dividends and distributions realized during a given time period.
1 | May 31, 2022
ALPS Clean Energy ETF
| Performance Overview | May 31, 2022 (Unaudited) |
One cannot invest directly in an index. Index performance does not reflect fund performance.
The Fund’s shares are not individually redeemable. Investors buy and sell shares of the Fund on a secondary market. Only market makers or “authorized participants” may trade directly with the Fund, typically in blocks of 25,000 shares.
The ALPS Clean Energy ETF is not suitable for all investors. Investments in the Fund are subject to investment risks, including possible loss of the principal amount invested.
ALPS Portfolio Solutions Distributor, Inc., a FINRA member, is the Distributor for the ALPS Clean Energy ETF.
2 | May 31, 2022
ALPS Clean Energy ETF
| Performance Overview | May 31, 2022 (Unaudited) |
Top Ten Holdings* (as of May 31, 2022)
| Enphase Energy, Inc. | 6.10% |
| Sunrun, Inc. | 5.16% |
| First Solar, Inc. | 5.08% |
| Livent Corp. | 4.98% |
| Brookfield Renewable Partners LP | 4.97% |
| Northland Power, Inc. | 4.90% |
| Tesla, Inc. | 4.68% |
| NextEra Energy Partners LP | 4.63% |
| Lucid Group, Inc. | 4.62% |
| Plug Power, Inc. | 4.15% |
| Total % of Top 10 Holdings | 49.26% |
| * | % of Total Investments (excluding investments purchased with collateral from securities loaned) |
Future holdings are subject to change.
Clean Energy Segment Allocation* (as of May 31, 2022)

Growth of $10,000 (as of May 31, 2022)
Comparison of change in value of a $10,000 investment in the Fund and the Index

The chart above compares historical performance of a hypothetical investment of $10,000 in the Fund since inception with the performance of the Fund’s benchmark indices. Results include the reinvestment of all dividends and capital gains distributions. Past performance does not guarantee future results. The chart does not reflect the deduction of taxes that a shareholder would pay on Fund distributions or the redemption of Fund shares.
3 | May 31, 2022
ALPS Disruptive Technologies ETF
| Performance Overview | May 31, 2022 (Unaudited) |
Investment Objective
ALPS Disruptive Technologies ETF (the “Fund” or “DTEC”) seeks investment results that correspond (before fees and expenses) generally to the performance of the Indxx Disruptive Technologies Net Total Return Index (ticker symbol IDTEC) (the “Underlying Index”). The Fund will invest at least 80% of its net assets in securities that comprise the Underlying Index.
The Fund employs a “passive management” – or indexing – investment approach designed to track the performance of the Underlying Index. The Underlying Index utilizes a rules-based methodology developed by Indxx, LLC (the “Index Provider”), which is designed to identify the companies using disruptive technologies in each of ten thematic areas: Healthcare Innovation, Internet of Things, Clean Energy and Smart Grid, Cloud Computing, Data and Analytics, FinTech, Robotics and Artificial Intelligence, Cybersecurity, 3D Printing, and Mobile Payments (each a “Theme” and together, the “Themes”). Companies using disruptive technologies are those that are entering traditional markets with new digital forms of production and distribution, seek to disrupt an existing market and value network, displace established market-leading firms, products and alliances and increasingly gain market share. The Underlying Index is compiled by the Index Provider and may be comprised of U.S. and non-U.S. companies, including foreign and emerging markets companies. In order to be eligible for inclusion in the Underlying Index’s Index Universe, a company’s stock must be traded on one or more major global securities exchanges, have a minimum market capitalization of at least $500 million, and have a six month minimum average daily trading volume of $2 million, and the company must derive a minimum of 50% of its revenue from a single Theme. All equity securities meeting the above criteria are selected for inclusion in the Index Universe. From the Index Universe, the Underlying Index methodology selects ten stocks in each Theme according to proprietary quantitative and qualitative factors. The eligible stocks that are selected for inclusion in the Underlying Index’s portfolio are equally weighted. The Underlying Index is reconstituted annually on the third Friday of September and rebalanced quarterly.
Fund Performance (as of May 31, 2022)
| 6 Months | 1 Year | 3 Year | Since Inception^ | |
| ALPS Disruptive Technologies ETF - NAV | -24.11% | -20.77% | 9.14% | 9.20% |
| ALPS Disruptive Technologies ETF - Market Price* | -24.19% | -20.79% | 9.14% | 9.20% |
| Indxx Disruptive Technologies Net Total Return Index | -23.91% | -20.48% | 9.52% | 9.51% |
| Morningstar® Global Markets Net Return Index | -9.38% | -7.56% | 11.31% | 7.11% |
Total Expense Ratio (per the current prospectus) is 0.50%.
Performance data quoted represents past performance. Past performance does not guarantee future results. Total return figures assume reinvestment of dividends and capital gains distributions, if any. The table does not reflect the deduction of taxes that a shareholder would pay on Fund distributions or the redemption of Fund shares. Investment return and principal value of an investment will fluctuate so that an investor’s shares, when sold or redeemed, may be worth more or less than the original cost. Current performance data may be higher or lower than actual data quoted. For the most current month-end performance data please visit www. alpsfunds.com or call 1.866.759.5679.
NAV is an exchange-traded fund’s per-share value. The per-share dollar amount of the fund is derived by dividing the total value of all the securities in its portfolio, less any liabilities, by the number of fund shares outstanding. Market Price is the price at which a share can currently be traded in the market. Information detailing the number of days the Market Price of the Fund was greater than the Fund’s NAV and the number of days it was less than the Fund’s NAV can be obtained at www.alpsfunds.com.
| ^ | The Fund commenced operations on December 28, 2017, with the first day of trading on the exchange of December 29, 2017. |
| * | Market Price means the official closing price of a share or, if it more accurately reflects the market value of a share at the time as of which the Fund calculates current net asset value per share, the price that is the midpoint of the bid-ask spread as of that time. It does not represent the returns an investor would receive if shares were traded at other times. |
Indxx Disruptive Technologies Net Total Return Index (Ticker: IDTEC) is based around companies that enter traditional markets with new digital forms of production and distribution, are likely to disrupt an existing market and value network, displace established market leading firms, products and alliances and increasingly gain market share. Total Return assumes reinvestment of any dividends and distributions realized during a given time period. Net Total Return (NTR) is obtained by reinvesting the net dividend, which is equal to the ordinary gross dividend minus the amount of withholding tax.
The Morningstar® Global Markets Net Return Index, measures the performance of the stocks located in the developed and emerging countries across the world. Stocks in the index are weighted by their float capital, which removes corporate cross ownership, government holdings and other locked-in shares.
One cannot invest directly in an index. Index performance does not reflect fund performance.
4 | May 31, 2022
ALPS Disruptive Technologies ETF
| Performance Overview | May 31, 2022 (Unaudited) |
The Fund’s shares are not individually redeemable. Investors buy and sell shares of the Fund on a secondary market. Only market makers or “authorized participants” may trade directly with the Fund, typically in blocks of 25,000 shares.
The ALPS Disruptive Technologies ETF is not suitable for all investors. Investments in the Fund are subject to investment risks, including possible loss of the principal amount invested.
ALPS Portfolio Solutions Distributor, Inc., a FINRA member, is the Distributor for the ALPS Disruptive Technologies ETF.
5 | May 31, 2022
ALPS Disruptive Technologies ETF
| Performance Overview | May 31, 2022 (Unaudited) |
Top Ten Holdings* (as of May 31, 2022)
| Black Knight, Inc. | 1.32% |
| Pagseguro Digital, Ltd., Class A | 1.31% |
| AeroVironment, Inc. | 1.31% |
| Kaspi.KZ JSC, GDR | 1.30% |
| Fidelity National Information Services, Inc. | 1.28% |
| VMware, Inc., Class A | 1.24% |
| Mastercard, Inc., Class A | 1.21% |
| PTC, Inc. | 1.21% |
| Itron, Inc. | 1.21% |
| FleetCor Technologies, Inc. | 1.19% |
| Total % of Top 10 Holdings | 12.58% |
| * | % of Total Investments (excluding investments purchased with collateral from securities loaned) |
Future holdings are subject to change.
Thematic Allocation* (as of May 31, 2022)
Growth of $10,000 (as of May 31, 2022)
Comparison of change in value of a $10,000 investment in the Fund and the Index

The chart above compares historical performance of a hypothetical investment of $10,000 in the Fund since inception with the performance of the Fund’s benchmark indices. Results include the reinvestment of all dividends and capital gains distributions. Past performance does not guarantee future results. The chart does not reflect the deduction of taxes that a shareholder would pay on Fund distributions or the redemption of Fund shares.
6 | May 31, 2022
ALPS Global Travel Beneficiaries ETF
| Performance Overview | May 31, 2022 (Unaudited) |
Investment Objective
ALPS Global Travel Beneficiaries ETF (the "Fund" or "JRNY") seeks investment results that replicate as closely as possible, before fees and expenses, the performance of the S-Network Global Travel Index (ticker symbol TRAVEL) (the “Underlying Index”).
The Underlying Index uses a rules-based methodology developed by S-Network Global Indexes Inc. (the "Index Provider"), which is designed to identify exchange-traded stocks of companies that are materially engaged in the global travel industry, including four segments: Airlines & Airport Services; Hotels, Casinos, Cruise Lines; Booking & Rental Agencies; and Ancillary Beneficiaries. The Underlying Index is compiled by the Index Provider and may be comprised of U.S. and non-U.S. companies, including foreign and emerging markets companies. In order to be eligible for inclusion in the Underlying Index's Index Universe, a company's stock must be traded on one or more major global securities exchanges and is principally engaged in or derives significant revenue from each of the segments. In addition, a company's stock must have a minimum market capitalization of at least $100 million, a three-month minimum average daily trading volume of $1 million, and a minimum free float factor of 18%. All equity securities meeting the above criteria are selected for inclusion in the Index Universe. From the Index Universe, the Underlying Index methodology selects and weights twenty stocks in each segment, subject to a minimum of one constituent per geographic region (U.S. & Canada, Europe, Pacific (ex-Canada), and Emerging) and a 65% maximum weight per geographic region. The Underlying Index is rebalanced and reconstituted quarterly on the third Friday of the last month in each calendar quarter.
Fund Performance (as of May 31, 2022)
| 6 Months | Since Inception^ | |
| ALPS Global Travel Beneficiaries ETF - NAV | -8.65% | -13.53% |
| ALPS Global Travel Beneficiaries ETF - Market Price* | -8.39% | -13.17% |
| S-Network Global Travel Net Total Return Index | -8.36% | -13.20% |
| Morningstar® Global Markets Net Return Index | -9.38% | -11.45% |
Total Expense Ratio (per the current prospectus) is 0.65%.
Performance data quoted represents past performance. Past performance does not guarantee future results. Total return figures assume reinvestment of dividends and capital gains distributions, if any. The table does not reflect the deduction of taxes that a shareholder would pay on Fund distributions or the redemption of Fund shares. Investment return and principal value of an investment will fluctuate so that an investor’s shares, when sold or redeemed, may be worth more or less than the original cost. Current performance data may be higher or lower than actual data quoted. For the most current month-end performance data please visit www. alpsfunds.com or call 1.866.759.5679.
NAV is an exchange-traded fund’s per-share value. The per-share dollar amount of the fund is derived by dividing the total value of all the securities in its portfolio, less any liabilities, by the number of fund shares outstanding. Market Price is the price at which a share can currently be traded in the market. Information detailing the number of days the Market Price of the Fund was greater than the Fund’s NAV and the number of days it was less than the Fund’s NAV can be obtained at www.alpsfunds.com.
| ^ | The Fund commenced operations on September 8, 2021, with the first day of trading on the exchange of September 9, 2021. |
| * | Market Price means the official closing price of a share or, if it more accurately reflects the market value of a share at the time as of which the Fund calculates current net asset value per share, the price that is the midpoint of the bid-ask spread as of that time. It does not represent the returns an investor would receive if shares were traded at other times. |
The Fund is new with limited operating history.
The S-Network Global Travel Net Total Return Index (Ticker: TRAVEL) is an Index of stocks listed on global recognized stock exchanges that are materially engaged in segments of the global travel industry, including Airlines & Airport Services; Hotels, Casinos, and Cruise Lines; Booking & Rental Agencies; and ancillary beneficiaries of global travel. Total Return assumes reinvestment of any dividends and distributions realized during a given time period. Net Total Return (NTR) is obtained by reinvesting the net dividend, which is equal to the ordinary gross dividend minus the amount of withholding tax.
The Morningstar® Global Markets Net Return Index, measures the performance of the stocks located in the developed and emerging countries across the world. Stocks in the index are weighted by their float capital, which removes corporate cross ownership, government holdings and other locked-in shares.
One cannot invest directly in an index. Index performance does not reflect fund performance.
7 | May 31, 2022
ALPS Global Travel Beneficiaries ETF
| Performance Overview | May 31, 2022 (Unaudited) |
The Fund’s shares are not individually redeemable. Investors buy and sell shares of the Fund on a secondary market. Only market makers or “authorized participants” may trade directly with the Fund, typically in blocks of 25,000 shares.
The ALPS Global Travel Beneficiaries ETF is not suitable for all investors. Investments in the Fund are subject to investment risks, including possible loss of the principal amount invested.
ALPS Portfolio Solutions Distributor, Inc., a FINRA member, is the Distributor for the ALPS Global Travel Beneficiaries ETF.
8 | May 31, 2022
ALPS Global Travel Beneficiaries ETF
| Performance Overview | May 31, 2022 (Unaudited) |
Top Ten Holdings* (as of May 31, 2022)
| Booking Holdings, Inc. | 5.11% |
| Marriott International, Inc., Class A | 4.90% |
| American Express Co. | 4.62% |
| LVMH Moet Hennessy Louis Vuitton SE | 4.61% |
| Hilton Worldwide Holdings, Inc. | 4.58% |
| Cintas Corp. | 4.38% |
| The Estee Lauder Company, Inc., Class A | 4.31% |
| Walt Disney Co. | 3.84% |
| Airbnb, Inc., Class A | 3.70% |
| Shiseido Co., Ltd. | 2.92% |
| Total % of Top 10 Holdings | 42.97% |
| * | % of Total Investments (excluding investments purchased with collateral from securities loaned) |
Future holdings are subject to change.
Sector Allocation* (as of May 31, 2022)
Growth of $10,000 (as of May 31, 2022)
Comparison of change in value of a $10,000 investment in the Fund and the Index
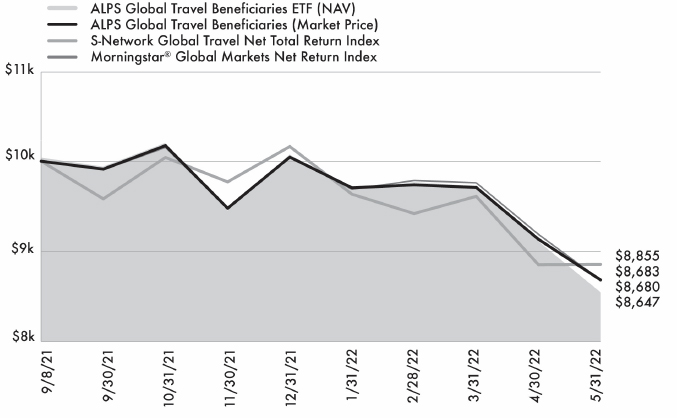
The chart above compares historical performance of a hypothetical investment of $10,000 in the Fund since inception with the performance of the Fund’s benchmark indices. Results include the reinvestment of all dividends and capital gains distributions. Past performance does not guarantee future results. The chart does not reflect the deduction of taxes that a shareholder would pay on Fund distributions or the redemption of Fund shares.
9 | May 31, 2022
ALPS Medical Breakthroughs ETF
| Performance Overview | May 31, 2022 (Unaudited) |
Investment Objective
ALPS Medical Breakthroughs ETF (the “Fund” or “SBIO”) seeks investment results that correspond (before fees and expenses) generally to the performance of the S-Network® Medical Breakthroughs Total Return Index (the “Underlying Index”). The Fund will normally invest at least 80% of its net assets in securities that comprise the Underlying Index (or depositary receipts based on such securities).
The Fund employs a “passive management” – or indexing – investment approach designed to track the performance of the Underlying Index. The Underlying Index is comprised of small- and mid-cap stocks of biotechnology companies that have one or more drugs in either Phase II or Phase III of the U.S. Food and Drug Administration ("FDA") clinical trials. In a Phase II trial, the drug is administered to a group of 100-300 people to see if it is effective and to evaluate its safety. In a Phase III trial, the drug is given to a larger group, between 500-3,000 people, to confirm its effectiveness, monitor side effects, compare it to commonly used treatments and collect information that will allow the drug or treatment to be used safely. Stocks selected for inclusion in the Underlying Index must be listed on a U.S. stock exchange. Underlying Index constituents must have a market capitalization of no less than $200 million and no more than $5 billion. Stocks included in the Underlying Index must also sustain an average daily trading volume in excess of $1 million for the 90-day period preceding an Underlying Index reconstitution. Constituents must be able to sustain the monthly rates at which they use shareholder capital ("cash burn rates") for at least 24 months. The Underlying Index is reconstituted semi-annually on the third Fridays of June and December.
Fund Performance (as of May 31, 2022)
| 6 Months | 1 Year | 3 Year | 5 Year | Since Inception^ | |
| ALPS Medical Breakthroughs ETF - NAV | -40.13% | -44.90% | -7.33% | 1.93% | 1.20% |
| ALPS Medical Breakthroughs ETF - Market Price* | -40.08% | -44.90% | -7.36% | 1.93% | 1.19% |
| S-Network Medical Breakthroughs Total Return Index | -40.01% | -44.74% | -7.07% | 2.21% | 1.52% |
| NASDAQ Biotechnology Total Return Index | -22.16% | -21.52% | 6.46% | 5.04% | 2.63% |
Total Expense Ratio (per the current prospectus) is 0.50%
Performance data quoted represents past performance. Past performance does not guarantee future results. Total return figures assume reinvestment of dividends and capital gains distributions, if any. Investment return and principal value of an investment will fluctuate so that an investor’s shares, when sold or redeemed, may be worth more or less than the original cost. Current performance data may be higher or lower than actual data quoted. For most current month-end performance data please visit www.alpsfunds.com or call 1.844.234.5852.
NAV is an exchange-traded fund’s per-share value. The per-share dollar amount of the fund is derived by dividing the total value of all the securities in its portfolio, less any liabilities, by the number of fund shares outstanding. Market Price is the price at which a share can currently be traded in the market. Information detailing the number of days the Market Price of the Fund was greater than the Fund’s NAV and the number of days it was less than the Fund’s NAV can be obtained at www.alpsfunds.com.
| ^ | The Fund commenced investment operations on December 30, 2014. |
| * | Market Price means the official closing price of a share or, if it more accurately reflects the market value of a share at the time as of which the Fund calculates current net asset value per share, the price that is the midpoint of the bid-ask spread as of that time. It does not represent the returns an investor would receive if shares were traded at other times. |
NASDAQ Biotechnology Total Return Index (Ticker: NBI) is a modified market capitalization-weighted index designed to measure the performance of all the NASDAQ stocks in the biotechnology sector. Total return assumes reinvestment of any dividends and distributions realized during a given time period.
S-Network Medical Breakthroughs Total Return Index (Ticker: PMBI) is designed to capture research and development opportunities in the biotechnology industry. PMBI consists of small-cap and mid-cap biotechnology stocks listed on U.S. stock exchanges that have one or more drugs in either Phase II or Phase III U.S. FDA clinical trials. Total return assumes reinvestment of any dividends and distributions realized during a given time period.
One cannot invest directly in an index. Index performance does not reflect fund performance.
Companies in the pharmaceuticals and biotechnology industry may be subject to extensive litigation based on product liability and similar claims. Legislation introduced or considered by certain governments on such industries or on the healthcare sector cannot be predicted.
Companies in the pharmaceuticals industry are subject to competitive forces that may make it difficult to raise prices and, in fact, may result in price discounting. The profitability of some companies in the pharmaceuticals industry may be dependent on a relatively limited number of products. In addition, their products can become obsolete due to industry innovation, changes in technologies or other market developments. Many new products in the pharmaceuticals industry are subject to government approvals, regulation and reimbursement rates. The process of obtaining government approvals may be long and costly. Many companies in the pharmaceuticals industry are heavily dependent on patents and intellectual property rights. The loss or impairment of these rights may adversely affect the profitability of these companies.
10 | May 31, 2022
ALPS Medical Breakthroughs ETF
| Performance Overview | May 31, 2022 (Unaudited) |
The development of new drugs generally has a high failure rate, and such failures may negatively impact the stock price of the company developing the failed drug. Biotechnology companies may have persistent losses during a new product’s transition from development to production. In order to fund operations, biotechnology companies may require financing from the capital markets, which may not always be available on satisfactory terms or at all.
The Fund’s shares are not individually redeemable. Investors buy and sell shares of the Fund on a secondary market. Only market makers or “authorized participants” may trade directly with the Fund, typically in blocks of 25,000 shares.
The ALPS Medical Breakthroughs ETF is not suitable for all investors. Investments in the Fund are subject to investment risks, including possible loss of the principal amount invested.
ALPS Portfolio Solutions Distributor, Inc., a FINRA member, is the Distributor for the ALPS Medical Breakthroughs ETF.
ALPS Portfolio Solutions Distributor, Inc. is not affiliated with S-Network Global Indexes, Inc.
11 | May 31, 2022
ALPS Medical Breakthroughs ETF
| Performance Overview | May 31, 2022 (Unaudited) |
Top Ten Holdings* (as of May 31, 2022)
| Ionis Pharmaceuticals, Inc. | 5.33% |
| Alkermes PLC | 5.00% |
| Cerevel Therapeutics Holdings, Inc. | 3.99% |
| Galapagos NV, Sponsored ADR | 3.71% |
| Cytokinetics, Inc. | 3.45% |
| Karuna Therapeutics, Inc. | 3.21% |
| ACADIA Pharmaceuticals, Inc. | 2.68% |
| Insmed, Inc. | 2.31% |
| Amicus Therapeutics, Inc. | 2.20% |
| PTC Therapeutics, Inc. | 2.16% |
| Total % of Top 10 Holdings | 34.04% |
| * | % of Total Investments (excluding investments purchased with collateral from securities loaned) |
Future holdings are subject to change.
Sector Allocation* (as of May 31, 2022)
Growth of $10,000 (as of May 31, 2022)
Comparison of change in value of a $10,000 investment in the Fund and the Index
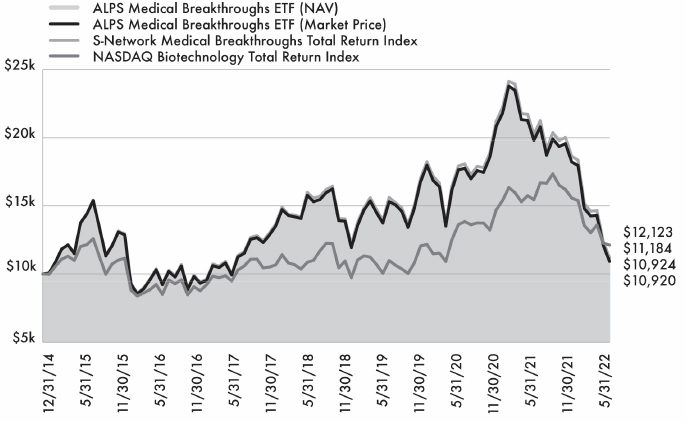
The chart above compares historical performance of a hypothetical investment of $10,000 in the Fund since inception with the performance of the Fund’s benchmark indices. Results include the reinvestment of all dividends and capital gains distributions. Past performance does not guarantee future results. The chart does not reflect the deduction of taxes that a shareholder would pay on Fund distributions or the redemption of Fund shares.
12 | May 31, 2022
ALPS ETF Trust
| Disclosure of Fund Expenses | May 31, 2022 (Unaudited) |
Shareholder Expense Example: As a shareholder of a Fund, you incur certain ongoing costs, including management fees and other Fund expenses. These examples are intended to help you understand your ongoing costs (in dollars) of investing in a Fund and to compare these costs with the ongoing costs of investing in other funds. It is based on an investment of $1,000 invested at the beginning of the six month period and held through May 31, 2022.
Actual Return: The first line of the table provides information about actual account values and actual expenses. You may use the information in this line, together with the amount you invested, to estimate the expenses that you incurred over the period. Simply divide your account value by $1,000 (for example, an $8,600 account value divided by $1,000 = 8.6), then multiply the result by the number in the first line under the heading entitled “Expenses Paid During Period” to estimate the expenses attributable to your investment during this period.
Hypothetical 5% Return: The second line of the table provides information about hypothetical account values and hypothetical expenses based on the Fund’s actual expense ratio and an assumed rate of return of 5% per year before expenses, which is not the Fund’s actual return. The hypothetical account values and expenses may not be used to estimate the actual ending account balance or expenses you paid for the period. You may use this information to compare ongoing costs of investing in the Fund and other funds. To do so, compare this 5% hypothetical example with the 5% hypothetical examples that appear in the shareholder reports of the other funds.
The expenses shown in the table are meant to highlight ongoing Fund costs only and do not reflect any transaction costs, such as brokerage commissions and other fees to financial intermediaries. Therefore, the second line is useful in comparing ongoing costs only, and will not help you determine the relative total costs of owning different funds. In addition, if these costs were included, your costs would have been higher.
| Beginning Account Value 12/1/21 | Ending Account Value 5/31/22 | Expense Ratio(a) | Expenses Paid During Period 12/1/21 - 5/31/22(b) | |
| ALPS Clean Energy ETF | ||||
| Actual | $1,000.00 | $721.30 | 0.55% | $2.36 |
| Hypothetical (5% return before expenses) | $1,000.00 | $1,022.19 | 0.55% | $2.77 |
| ALPS Disruptive Technologies ETF | ||||
| Actual | $1,000.00 | $758.90 | 0.50% | $2.19 |
| Hypothetical (5% return before expenses) | $1,000.00 | $1,022.44 | 0.50% | $2.52 |
| ALPS Global Travel Beneficiaries ETF | ||||
| Actual | $1,000.00 | $913.50 | 0.65% | $3.10 |
| Hypothetical (5% return before expenses) | $1,000.00 | $1,021.69 | 0.65% | $3.28 |
| ALPS Medical Breakthroughs ETF | ||||
| Actual | $1,000.00 | $598.70 | 0.50% | $1.99 |
| Hypothetical (5% return before expenses) | $1,000.00 | $1,022.44 | 0.50% | $2.52 |
| (a) | Annualized, based on the Fund's most recent fiscal half year expenses. |
| (b) | Expenses are equal to the Fund's annualized expense ratio multiplied by the average account value over the period, multiplied by the number of days in the most recent fiscal half year (182), divided by 365. |
13 | May 31, 2022
ALPS Clean Energy ETF
| Schedule of Investments | May 31, 2022 (Unaudited) |
| Security Description | Shares | Value | ||||||
| COMMON STOCKS (87.83%) | ||||||||
| Consumer Discretionary (14.15%) | ||||||||
| EVgo, Inc.(a)(b) | 441,688 | $ | 4,231,371 | |||||
| Lucid Group, Inc.(a)(b) | 1,520,241 | 30,678,463 | ||||||
| Rivian Automotive, Inc.(a) | 725,084 | 22,767,638 | ||||||
| Tesla, Inc.(a) | 40,996 | 31,085,627 | ||||||
| Volta, Inc.(a)(b) | 692,736 | 1,704,131 | ||||||
| Workhorse Group, Inc.(a)(b) | 869,959 | 2,688,173 | ||||||
| XL Fleet Corp.(a) | 737,978 | 892,953 | ||||||
| Total Consumer Discretionary | 94,048,356 | |||||||
| Energy (5.84%) | ||||||||
| Aemetis, Inc.(a)(b) | 182,404 | 1,479,296 | ||||||
| Archaea Energy, Inc., Class A(a) | 345,443 | 6,888,134 | ||||||
| Green Plains, Inc.(a) | 334,427 | 10,895,632 | ||||||
| Renewable Energy Group, Inc.(a) | 318,977 | 19,556,479 | ||||||
| Total Energy | 38,819,541 | |||||||
| Financials (3.11%) | ||||||||
| Hannon Armstrong Sustainable | ||||||||
| Infrastructure Capital, Inc.(b) | 543,797 | 20,702,352 | ||||||
| Industrials (25.26%) | ||||||||
| Ameresco, Inc., Class A(a) | 195,664 | 11,489,390 | ||||||
| American Superconductor | ||||||||
| Corp.(a) | 165,615 | 884,384 | ||||||
| Array Technologies, Inc.(a) | 900,399 | 9,976,421 | ||||||
| Ballard Power Systems, Inc.(a)(b) | 1,537,130 | 11,174,935 | ||||||
| Blink Charging Co.(a)(b) | 236,577 | 3,768,672 | ||||||
| ChargePoint Holdings, Inc.(a)(b) | 1,510,045 | 19,313,475 | ||||||
| Fluence Energy, Inc.(a)(b) | 230,968 | 2,263,486 | ||||||
| Hyliion Holdings Corp.(a)(b) | 804,220 | 2,919,319 | ||||||
| Hyzon Motors, Inc.(a)(b) | 486,623 | 2,364,988 | ||||||
| Infrastructure and Energy | ||||||||
| Alternatives, Inc.(a)(b) | 181,902 | 1,478,863 | ||||||
| Li-Cycle Holdings Corp.(a)(b) | 734,991 | 5,990,177 | ||||||
| Lightning eMotors, Inc.(a) | 282,696 | 1,133,611 | ||||||
| Lion Electric Co.(a)(b) | 554,777 | 3,201,063 | ||||||
| Microvast Holdings, Inc.(a)(b) | 964,377 | 4,821,885 | ||||||
| Plug Power, Inc.(a)(b) | 1,491,223 | 27,557,801 | ||||||
| Proterra, Inc.(a)(b) | 1,322,313 | 8,528,919 | ||||||
| Shoals Technologies Group, | ||||||||
| Inc., Class A(a) | 341,819 | 5,332,376 | ||||||
| Stem, Inc.(a)(b) | 965,951 | 8,345,817 | ||||||
| Sunrun, Inc.(a) | 1,311,168 | 34,247,708 | ||||||
| TPI Composites, Inc.(a) | 231,779 | 3,196,232 | ||||||
| Total Industrials | 167,989,522 | |||||||
| Security Description | Shares | Value | ||||||
| Information Technology (14.87%) | ||||||||
| Enphase Energy, Inc.(a) | 217,502 | $40,496,698 | ||||||
| First Solar, Inc.(a) | 478,263 | 33,770,151 | ||||||
| Itron, Inc.(a) | 289,319 | 14,931,754 | ||||||
| SunPower Corp.(a)(b) | 542,632 | 9,588,307 | ||||||
| Total Information Technology | 98,786,910 | |||||||
| Materials (4.96%) | ||||||||
| Livent Corp.(a) | 1,040,348 | 33,072,662 | ||||||
| Utilities (19.64%) | ||||||||
| Boralex, Inc., Class A(b) | 658,527 | 20,101,773 | ||||||
| Clearway Energy, Inc., Class C | 526,597 | 18,457,225 | ||||||
| Innergex Renewable Energy, Inc.(b) | 994,455 | 13,412,976 | ||||||
| Northland Power, Inc.(b) | 1,073,068 | 32,543,692 | ||||||
| Ormat Technologies, Inc. | 291,912 | 24,508,932 | ||||||
| Sunnova Energy International, Inc.(a)(b) | 600,147 | 12,002,940 | ||||||
| TransAlta Renewables, Inc.(b) | 690,830 | 9,470,682 | ||||||
| Total Utilities | 130,498,220 | |||||||
| TOTAL COMMON STOCKS | ||||||||
| (Cost $716,851,485) | 583,917,563 | |||||||
| Security Description | Shares | Value | ||||||
| MASTER LIMITED PARTNERSHIPS (11.90%) | ||||||||
| Energy (2.31%) | ||||||||
| Enviva, Inc. | 197,201 | 15,359,986 | ||||||
| Utilities (9.59%) | ||||||||
| Brookfield Renewable Partners LP | 927,600 | 32,994,207 | ||||||
| NextEra Energy Partners LP | 428,907 | 30,731,187 | ||||||
| Total Utilities | 63,725,394 | |||||||
| TOTAL MASTER LIMITED PARTNERSHIPS | ||||||||
| (Cost $71,255,956) | 79,085,380 | |||||||
14 | May 31, 2022
ALPS Clean Energy ETF
| Schedule of Investments | May 31, 2022 (Unaudited) |
| 7 Day Yield | Shares | Value | ||||||||||
| SHORT TERM INVESTMENTS (11.51%) | ||||||||||||
| Money Market Fund (0.17%) | ||||||||||||
| State Street Institutional | ||||||||||||
| Treasury Plus Money | ||||||||||||
| Market Fund | ||||||||||||
| (Cost $1,140,115) | 0.75 | % | 1,140,115 | $ | 1,140,115 | |||||||
| Investments Purchased with Collateral from Securities Loaned (11.34%) | ||||||||||||
| State Street Navigator | ||||||||||||
| Securities Lending | ||||||||||||
| Government Money Market | ||||||||||||
| Portfolio, 0.80% | ||||||||||||
| (Cost $75,385,575) | 75,385,575 | 75,385,575 | ||||||||||
| TOTAL SHORT TERM INVESTMENTS | ||||||||||||
| (Cost $76,525,690) | 76,525,690 | |||||||||||
| TOTAL INVESTMENTS (111.24%) | ||||||||||||
| (Cost $864,633,131) | $ | 739,528,633 | ||||||||||
| LIABILITIES IN EXCESS OF OTHER ASSETS (-11.24%) | (74,743,929 | ) | ||||||||||
| NET ASSETS - 100.00% | $ | 664,784,704 | ||||||||||
| (a) | Non-income producing security. |
| (b) | Security, or a portion of the security position is currently on loan. The total market value of securities on loan is $121,262,523. |
See Notes to Financial Statements.
15 | May 31, 2022
ALPS Disruptive Technologies ETF
| Schedule of Investments | May 31, 2022 (Unaudited) |
| Security Description | Shares | Value | ||||||
| COMMON STOCKS (98.85%) | ||||||||
| Communication Services (0.61%) | ||||||||
| Netflix, Inc.(a) | 4,636 | $ | 915,332 | |||||
| Consumer Discretionary (4.03%) | ||||||||
| ADT, Inc. | 220,599 | 1,650,081 | ||||||
| Garmin, Ltd. | 14,872 | 1,570,781 | ||||||
| iRobot Corp.(a) | 28,085 | 1,336,565 | ||||||
| Tesla, Inc.(a) | 1,960 | 1,486,190 | ||||||
| Total Consumer Discretionary | 6,043,617 | |||||||
| Financials (4.48%) | ||||||||
| American Express Co. | 9,759 | 1,647,514 | ||||||
| Kaspi.KZ JSC, GDR(b) | 36,837 | 1,941,310 | ||||||
| Moody's Corp. | 5,285 | 1,593,798 | ||||||
| S&P Global, Inc. | 4,340 | 1,516,743 | ||||||
| Total Financials | 6,699,365 | |||||||
| Health Care (10.88%) | ||||||||
| ABIOMED, Inc.(a) | 5,432 | 1,432,418 | ||||||
| Align Technology, Inc.(a) | 3,829 | 1,063,084 | ||||||
| Azenta, Inc. | 20,414 | 1,564,529 | ||||||
| Boston Scientific Corp.(a) | 39,557 | 1,622,233 | ||||||
| Cutera, Inc.(a) | 38,104 | 1,714,298 | ||||||
| Dexcom, Inc.(a) | 4,060 | 1,209,636 | ||||||
| DiaSorin SpA(c) | 12,464 | 1,639,137 | ||||||
| Insulet Corp.(a) | 7,056 | 1,506,315 | ||||||
| Intuitive Surgical, Inc.(a) | 5,989 | 1,363,336 | ||||||
| ResMed, Inc. | 6,830 | 1,389,632 | ||||||
| Smith & Nephew PLC, | ||||||||
| Sponsored ADR | 53,614 | 1,754,786 | ||||||
| Total Health Care | 16,259,404 | |||||||
| Industrials (15.90%) | ||||||||
| ABB, Ltd., Sponsored ADR | 50,311 | 1,558,132 | ||||||
| AeroVironment, Inc.(a) | 21,343 | 1,962,702 | ||||||
| Experian PLC | 44,091 | 1,475,645 | ||||||
| FANUC Corp. | 9,789 | 1,604,823 | ||||||
| Proto Labs, Inc.(a) | 31,195 | 1,503,287 | ||||||
| RELX PLC, Sponsored ADR(c) | 60,186 | 1,723,727 | ||||||
| Schneider Electric SE | 10,749 | 1,489,067 | ||||||
| Sensata Technologies Holding PLC | 31,219 | 1,499,449 | ||||||
| Siemens Gamesa Renewable | ||||||||
| Energy SA(a) | 81,840 | 1,577,952 | ||||||
| Thomson Reuters Corp. | 16,021 | 1,585,697 | ||||||
| TransUnion | 17,236 | 1,496,257 | ||||||
| Verisk Analytics, Inc. | 8,926 | 1,561,336 | ||||||
| Vestas Wind Systems A/S | 53,558 | 1,368,425 | ||||||
| Wolters Kluwer NV | 17,031 | 1,684,652 | ||||||
| Security Description | Shares | Value | ||||||
| Industrials (continued) | ||||||||
| Xinjiang Goldwind Science & Technology Co., Ltd., Class H | 1,073,800 | $ | 1,759,744 | |||||
| Total Industrials | 23,850,895 | |||||||
| Information Technology (60.81%) | ||||||||
| Adobe, Inc.(a) | 3,779 | 1,573,878 | ||||||
| Adyen NV(a)(b)(d) | 981 | 1,524,121 | ||||||
| Alarm.com Holdings, Inc.(a) | 25,129 | 1,588,907 | ||||||
| Allegro MicroSystems, Inc.(a) | 63,228 | 1,628,121 | ||||||
| ams-OSRAM AG(a) | 125,142 | 1,531,659 | ||||||
| ANSYS, Inc.(a) | 5,422 | 1,411,672 | ||||||
| Autodesk, Inc.(a) | 8,260 | 1,716,015 | ||||||
| Avast PLC(b) | 197,309 | 1,207,588 | ||||||
| Black Knight, Inc.(a) | 28,980 | 1,968,032 | ||||||
| Block, Inc., Class A(a) | 15,207 | 1,330,765 | ||||||
| Cerence, Inc.(a)(c) | 51,740 | 1,643,262 | ||||||
| Check Point Software Technologies, Ltd.(a) | 11,647 | 1,456,807 | ||||||
| Cognex Corp. | 25,133 | 1,216,940 | ||||||
| Crowdstrike Holdings, Inc., Class A(a) | 8,651 | 1,384,073 | ||||||
| Dassault Systemes SE | 36,281 | 1,526,233 | ||||||
| Datadog, Inc., Class A(a) | 11,859 | 1,131,230 | ||||||
| Dynatrace, Inc.(a) | 40,250 | 1,516,218 | ||||||
| FARO Technologies, Inc.(a) | 31,253 | 1,006,972 | ||||||
| Fidelity National Information | ||||||||
| Services, Inc. | 18,373 | 1,919,978 | ||||||
| First Solar, Inc.(a) | 21,652 | 1,528,848 | ||||||
| Fiserv, Inc.(a) | 17,394 | 1,742,531 | ||||||
| FleetCor Technologies, Inc.(a) | 7,141 | 1,776,752 | ||||||
| Fortinet, Inc.(a) | 5,771 | 1,697,482 | ||||||
| Global Payments, Inc. | 13,004 | 1,704,044 | ||||||
| GMO Payment Gateway, Inc. | 17,200 | 1,426,931 | ||||||
| Intuit, Inc. | 3,670 | 1,521,068 | ||||||
| Itron, Inc.(a) | 35,009 | 1,806,814 | ||||||
| Keyence Corp. | 3,546 | 1,421,044 | ||||||
| Mastercard, Inc., Class A | 5,074 | 1,815,832 | ||||||
| Materialise NV, ADR(a)(c) | 85,381 | 1,249,124 | ||||||
| Nemetschek SE | 20,709 | 1,477,547 | ||||||
| NortonLifeLock, Inc. | 59,384 | 1,445,407 | ||||||
| Okta, Inc.(a) | 9,909 | 822,942 | ||||||
| Omron Corp. | 24,900 | 1,436,342 | ||||||
| Pagseguro Digital, Ltd., Class A(a) | 128,048 | 1,966,817 | ||||||
| Palo Alto Networks, Inc.(a) | 3,000 | 1,508,340 | ||||||
| PayPal Holdings, Inc.(a) | 16,814 | 1,432,721 | ||||||
| PTC, Inc.(a) | 15,537 | 1,810,527 | ||||||
| Qorvo, Inc.(a) | 13,210 | 1,476,218 | ||||||
| Renishaw PLC | 33,055 | 1,692,757 | ||||||
16 | May 31, 2022
ALPS Disruptive Technologies ETF
| Schedule of Investments | May 31, 2022 (Unaudited) |
| Security Description | Shares | Value | ||||||
| Information Technology (continued) | ||||||||
| Salesforce, Inc.(a) | 8,280 | $ | 1,326,787 | |||||
| SAP SE, Sponsored ADR | 15,243 | 1,521,861 | ||||||
| ServiceNow, Inc.(a) | 3,119 | 1,458,039 | ||||||
| Silicon Laboratories, Inc.(a) | 11,786 | 1,757,999 | ||||||
| Skyworks Solutions, Inc. | 12,517 | 1,362,726 | ||||||
| Snowflake, Inc., Class A(a) | 8,371 | 1,068,558 | ||||||
| SolarEdge Technologies, Inc.(a) | 5,241 | 1,429,692 | ||||||
| Splunk, Inc.(a) | 13,042 | 1,337,588 | ||||||
| SS&C Technologies Holdings, Inc. | 22,151 | 1,417,442 | ||||||
| StoneCo, Ltd., Class A(a) | 173,850 | 1,745,454 | ||||||
| Stratasys, Ltd.(a) | 69,373 | 1,383,298 | ||||||
| Temenos AG | 18,221 | 1,769,670 | ||||||
| Trend Micro, Inc. | 28,490 | 1,675,297 | ||||||
| Visa, Inc., Class A | 8,357 | 1,773,105 | ||||||
| VMware, Inc., Class A | 14,451 | 1,851,173 | ||||||
| Workday, Inc., Class A(a) | 7,238 | 1,131,299 | ||||||
| Xero, Ltd.(a) | 22,864 | 1,465,098 | ||||||
| Xinyi Solar Holdings, Ltd. | 872,000 | 1,553,492 | ||||||
| Zoom Video Communications, Inc., Class A(a) | 15,941 | 1,712,860 | ||||||
| Zscaler, Inc.(a) | 7,919 | 1,212,320 | ||||||
| Total Information Technology | 90,996,317 | |||||||
| Real Estate (1.08%) | ||||||||
| Equinix, Inc. | 2,351 | 1,615,349 | ||||||
| Utilities (1.06%) | ||||||||
| China Longyuan Power Group | ||||||||
| Corp., Ltd., Class H | 737,000 | 1,583,472 | ||||||
| TOTAL COMMON STOCKS | ||||||||
| (Cost $169,687,987) | 147,963,751 | |||||||
| Security Description | Shares | Value | ||||||
| MASTER LIMITED PARTNERSHIPS (0.96%) | ||||||||
| Utilities (0.96%) | ||||||||
| Brookfield Renewable Partners LP | 40,560 | 1,442,696 | ||||||
| TOTAL MASTER LIMITED PARTNERSHIPS | ||||||||
| (Cost $1,140,531) | 1,442,696 | |||||||
| 7 Day Yield | Shares | Value | ||||||||||
| SHORT TERM INVESTMENTS (0.74%) | ||||||||||||
| Money Market Fund (0.13%) | ||||||||||||
| State Street Institutional | ||||||||||||
| Treasury Plus Money | ||||||||||||
| Market Fund | ||||||||||||
| (Cost $188,012) | 0.75 | % | 188,012 | $ | 188,012 | |||||||
| Investments Purchased with Collateral | ||||||||||||
| from Securities Loaned (0.61%) | ||||||||||||
| State Street Navigator | ||||||||||||
| Securities Lending | ||||||||||||
| Government Money Market | ||||||||||||
| Portfolio, 0.80% | ||||||||||||
| (Cost $919,800) | 919,800 | 919,800 | ||||||||||
| TOTAL SHORT TERM INVESTMENTS | ||||||||||||
| (Cost $1,107,812) | 1,107,812 | |||||||||||
| TOTAL INVESTMENTS (100.55%) | ||||||||||||
| (Cost $171,936,330) | $ | 150,514,259 | ||||||||||
| LIABILITIES IN EXCESS OF OTHER ASSETS (-0.55%) | (825,690 | ) | ||||||||||
| NET ASSETS - 100.00% | $ | 149,688,569 | ||||||||||
| (a) | Non-income producing security. |
| (b) | Securities were purchased pursuant to Regulation S under the Securities Act of 1933, which exempts securities offered and sold outside of the United States from registration. Such securities cannot be sold in the United States without either an effective registration statement filed pursuant to the Securities Act of 1933, or pursuant to an exemption from registration. As of May 31, 2022, the market value of those securities was $4,673,019 representing 3.12% of net assets. |
| (c) | Security, or a portion of the security position is currently on loan. The total market value of securities on loan is $2,586,449. |
| (d) | Securities exempt from registration under Rule 144A of the Securities Act of 1933. These securities may be sold in the ordinary course of business in transactions exempt from registration, normally to qualified institutional buyers. At period end, the aggregate market value of those securities was $1,524,121, representing 1.02% of net assets. |
See Notes to Financial Statements.
17 | May 31, 2022
ALPS Global Travel Beneficiaries ETF
| Schedule of Investments | May 31, 2022 (Unaudited) |
| Security Description | Shares | Value | ||||||
| COMMON STOCKS (99.94%) | ||||||||
| Communication Services (4.10%) | ||||||||
| TripAdvisor, Inc.(a) | 916 | $ | 22,753 | |||||
| Walt Disney Co.(a) | 2,988 | 329,995 | ||||||
| Total Communication Services | 352,748 | |||||||
| Consumer Discretionary (46.13%) | ||||||||
| Airbnb, Inc., Class A(a) | 2,631 | 318,009 | ||||||
| Booking Holdings, Inc.(a) | 196 | 439,739 | ||||||
| Boyd Gaming Corp. | 898 | 52,775 | ||||||
| Caesars Entertainment, Inc.(a) | 1,889 | 94,771 | ||||||
| Choice Hotels International, Inc. | 419 | 53,586 | ||||||
| Cie Financiere Richemont SA, Class A | 1,481 | 164,204 | ||||||
| Dufry AG(a) | 584 | 24,122 | ||||||
| Expedia Group, Inc.(a) | 1,281 | 165,672 | ||||||
| Galaxy Entertainment Group, Ltd. | 26,000 | 138,661 | ||||||
| Hilton Grand Vacations, Inc.(a) | 1,118 | 51,149 | ||||||
| Hilton Worldwide Holdings, Inc. | 2,797 | 393,985 | ||||||
| Huazhu Group, Ltd., ADR | 3,457 | 112,353 | ||||||
| Intercontinental Hotels Group(a) | 501 | 31,136 | ||||||
| Las Vegas Sands Corp.(a) | 2,702 | 95,813 | ||||||
| LVMH Moet Hennessy Louis Vuitton SE | 619 | 396,855 | ||||||
| Marriott International, Inc., Class A | 2,458 | 421,744 | ||||||
| Marriott Vacations Worldwide Corp. | 526 | 77,701 | ||||||
| MGM Resorts International | 3,234 | 113,093 | ||||||
| Moncler SpA | 667 | 32,008 | ||||||
| Oriental Land Co., Ltd. | 1,660 | 247,578 | ||||||
| Penn National Gaming, Inc.(a) | 2,028 | 64,815 | ||||||
| Thule Group AB(b)(c) | 605 | 20,245 | ||||||
| Tongcheng Travel Holdings, Ltd.(a)(c) | 14,000 | 26,868 | ||||||
| Trainline PLC(a)(b)(c) | 9,130 | 36,665 | ||||||
| Trip.com Group, Ltd., ADR | 6,372 | 140,566 | ||||||
| TUI AG(a) | 7,515 | 18,088 | ||||||
| Vail Resorts, Inc. | 459 | 115,764 | ||||||
| WH Smith PLC(a) | 1,196 | 24,023 | ||||||
| Wyndham Hotels & Resorts, Inc. | 1,211 | 97,037 | ||||||
| Total Consumer Discretionary | 3,969,025 | |||||||
| Consumer Staples (10.69%) | ||||||||
| L'Oreal SA | 694 | 244,784 | ||||||
| Security Description | Shares | Value | ||||||
| Consumer Staples (continued) | ||||||||
| Pilgrim's Pride Corp.(a) | 974 | $ | 32,454 | |||||
| Premium Brands Holdings Corp. | 254 | 20,477 | ||||||
| Shiseido Co., Ltd. | 5,970 | 251,627 | ||||||
| The Estee Lauder Company, Inc., Class A | 1,457 | 371,025 | ||||||
| Total Consumer Staples | 920,367 | |||||||
| Financials (4.62%) | ||||||||
| American Express Co. | 2,354 | 397,402 | ||||||
| Industrials (29.43%) | ||||||||
| Aena SME SA(a)(b)(c) | 348 | 53,107 | ||||||
| Air China, Ltd., Class H(a) | 31,000 | 22,597 | ||||||
| Airbus SE | 1,586 | 185,214 | ||||||
| Alaska Air Group, Inc.(a) | 1,249 | 60,277 | ||||||
| American Airlines Group, Inc.(a) | 4,670 | 83,453 | ||||||
| ANA Holdings, Inc.(a) | 4,700 | 92,806 | ||||||
| Auckland International Airport, Ltd.(a) | 4,539 | 22,123 | ||||||
| Avis Budget Group, Inc.(a) | 274 | 52,137 | ||||||
| CAE, Inc.(a) | 2,952 | 73,727 | ||||||
| China Airlines, Ltd.(a) | 51,000 | 47,618 | ||||||
| China Southern Airlines Co., Ltd., Class H(a)(d) | 38,000 | 20,968 | ||||||
| Cintas Corp. | 947 | 377,219 | ||||||
| Dassault Aviation SA | 156 | 26,411 | ||||||
| Delta Air Lines, Inc.(a) | 5,445 | 227,002 | ||||||
| Deutsche Lufthansa AG(a) | 2,954 | 21,647 | ||||||
| Elis SA | 1,642 | 26,036 | ||||||
| Eva Airways Corp.(a) | 36,000 | 42,295 | ||||||
| Flight Centre Travel Group, Ltd.(a)(d) | 1,600 | 23,539 | ||||||
| Grupo Aeroportuario del Pacifico SAB de CV, ADR | | | 546 | | | | 82,107 | |
| Grupo Aeroportuario del Sureste SAB de CV, ADR | | | 140 | | | | 30,421 | |
| Hertz Global Holdings, Inc.(a) | 1,054 | 21,154 | ||||||
| International Consolidated Airlines Group SA(a)(d) | | | 12,865 | | | | 20,692 | |
| Japan Airlines Co., Ltd.(a) | 4,400 | 80,183 | ||||||
| Korean Air Lines Co., Ltd.(a) | 2,390 | 56,118 | ||||||
| Localiza Rent a Car SA | 4,834 | 58,506 | ||||||
| Lyft, Inc., Class A(a) | 1,567 | 27,705 | ||||||
| Qantas Airways, Ltd.(a) | 18,443 | 72,928 | ||||||
| Ryanair Holdings PLC(a) | 1,520 | 23,294 | ||||||
| Sixt SE | 159 | 21,422 | ||||||
| Southwest Airlines Co.(a) | 5,441 | 249,523 | ||||||
| Uber Technologies, Inc.(a) | 9,292 | 215,573 | ||||||
18 | May 31, 2022
ALPS Global Travel Beneficiaries ETF
| Schedule of Investments | May 31, 2022 (Unaudited) |
| Security Description | Shares | Value | ||||||
| Industrials (continued) | ||||||||
| United Airlines Holdings, Inc.(a) | 2,416 | $ | 115,074 | |||||
| Total Industrials | 2,532,876 | |||||||
| Information Technology (1.73%) | ||||||||
| Amadeus IT Holding SA, Class A(a) | 1,744 | 108,292 | ||||||
| Sabre Corp.(a) | 2,384 | 17,904 | ||||||
| TravelSky Technology, Ltd., Class H | 14,000 | 22,765 | ||||||
| Total Information Technology | 148,961 | |||||||
| Real Estate (3.24%) | ||||||||
| Gaming and Leisure | ||||||||
| Properties, Inc. | 3,168 | 148,325 | ||||||
| Host Hotels & Resorts, Inc. | 6,538 | 130,695 | ||||||
| Total Real Estate | 279,020 | |||||||
| TOTAL COMMON STOCKS | ||||||||
| (Cost $9,712,091) | 8,600,399 | |||||||
| 7 Day Yield | Shares | Value | ||||||||||
| SHORT TERM INVESTMENTS (0.60%) | ||||||||||||
| Money Market Fund (0.04%) | ||||||||||||
| State Street Institutional | ||||||||||||
| Treasury Plus Money | ||||||||||||
| Market Fund | ||||||||||||
| (Cost $3,672) | 0.75 | % | 3,672 | 3,672 | ||||||||
| Investments Purchased with Collateral | ||||||||||||
| from Securities Loaned (0.56%) | ||||||||||||
| State Street Navigator | ||||||||||||
| Securities Lending | ||||||||||||
| Government Money Market | ||||||||||||
| Portfolio, 0.80% | ||||||||||||
| (Cost $48,416) | 48,416 | 48,416 | ||||||||||
| TOTAL SHORT TERM INVESTMENTS | ||||||||||||
| (Cost $52,088) | 52,088 | |||||||||||
| TOTAL INVESTMENTS (100.54%) | ||||||||||||
| (Cost $9,764,179) | $ | 8,652,487 | ||||||||||
| LIABILITIES IN EXCESS OF OTHER ASSETS (-0.54%) | (46,553 | ) | ||||||||||
| NET ASSETS - 100.00% | $ | 8,605,934 | ||||||||||
| (a) | Non-income producing security. |
| (b) | Securities exempt from registration under Rule 144A of the Securities Act of 1933. These securities may be sold in the ordinary course of business in transactions exempt from registration, normally to qualified institutional buyers. At period end, the aggregate market value of those securities was $110,017, representing 1.28% of net assets. |
| (c) | Securities were purchased pursuant to Regulation S under the Securities Act of 1933, which exempts securities offered and sold outside of the United States from registration. Such securities cannot be sold in the United States without either an effective registration statement filed pursuant to the Securities Act of 1933, or pursuant to an exemption from registration. As of May 31, 2022, the market value of those securities was $136,885 representing 1.59% of net assets. |
| (d) | Security, or a portion of the security position is currently on loan. The total market value of securities on loan is $44,491. |
See Notes to Financial Statements.
19 | May 31, 2022
ALPS Medical Breakthroughs ETF
| Schedule of Investments | May 31, 2022 (Unaudited) |
| Security Description | Shares | Value | ||||||
| COMMON STOCKS (100.00%) | ||||||||
| Biotechnology (97.89%) | ||||||||
| 89bio, Inc.(a)(b) | 19,820 | $ | 59,658 | |||||
| Aadi Bioscience, Inc.(a)(b) | 20,219 | 325,728 | ||||||
| ACADIA Pharmaceuticals, Inc.(a) | 155,460 | 2,510,679 | ||||||
| ADC Therapeutics SA(a) | 74,264 | 507,966 | ||||||
| Aeglea BioTherapeutics, Inc.(a)(b) | | | 47,792 | | | | 75,511 | |
| Affimed NV(a) | 115,974 | 359,519 | ||||||
| Agenus, Inc.(a) | 248,943 | 415,735 | ||||||
| Agios Pharmaceuticals, Inc.(a) | 52,902 | 1,030,002 | ||||||
| Akero Therapeutics, Inc.(a)(b) | 33,896 | 292,861 | ||||||
| Albireo Pharma, Inc.(a) | 18,748 | 373,648 | ||||||
| Aldeyra Therapeutics, Inc.(a) | 56,241 | 173,785 | ||||||
| Alector, Inc.(a) | 79,369 | 703,209 | ||||||
| Alkermes PLC(a) | 157,174 | 4,691,644 | ||||||
| Allakos, Inc.(a) | 53,057 | 159,171 | ||||||
| Allovir, Inc.(a)(b) | 63,264 | 244,832 | ||||||
| Alpine Immune Sciences, Inc.(a)(b) | | | 28,284 | | | | 263,041 | |
| Altimmune, Inc.(a)(b) | 38,468 | 194,648 | ||||||
| ALX Oncology Holdings, Inc.(a)(b) | 39,343 | 301,761 | ||||||
| Amicus Therapeutics, Inc.(a)(b) | 271,084 | 2,065,660 | ||||||
| AnaptysBio, Inc.(a)(b) | 26,792 | 508,780 | ||||||
| Anavex Life Sciences Corp.(a)(b) | 73,741 | 671,781 | ||||||
| Annexon, Inc.(a)(b) | 37,484 | 117,700 | ||||||
| Applied Molecular Transport, Inc.(a)(b) | | | 37,426 | | | | 123,880 | |
| Arbutus Biopharma Corp.(a)(b) | 143,894 | 349,662 | ||||||
| Arcturus Therapeutics | ||||||||
| Holdings, Inc.(a) | 25,527 | 507,477 | ||||||
| Arcus Biosciences, Inc.(a)(b) | 68,801 | 1,303,779 | ||||||
| Arcutis Biotherapeutics, Inc.(a) | 48,777 | 1,018,464 | ||||||
| Atara Biotherapeutics, Inc.(a) | 90,129 | 468,671 | ||||||
| Atossa Therapeutics, Inc.(a)(b) | 122,582 | 119,186 | ||||||
| Autolus Therapeutics PLC, | ||||||||
| ADR(a)(b) | 88,007 | 241,139 | ||||||
| AVEO Pharmaceuticals, Inc.(a)(b) | 33,273 | 135,421 | ||||||
| BELLUS Health, Inc.(a) | 103,341 | 820,528 | ||||||
| Beyondspring, Inc.(a)(b) | 38,226 | 52,370 | ||||||
| BioAtla, Inc.(a) | 35,970 | 86,688 | ||||||
| Bioxcel Therapeutics, Inc.(a)(b) | 27,081 | 316,848 | ||||||
| Cardiff Oncology, Inc.(a)(b) | 41,928 | 56,603 | ||||||
| Catalyst Pharmaceuticals, Inc.(a) | | | 99,824 | | | | 718,733 | |
| Cerevel Therapeutics Holdings, Inc.(a)(b) | | | 143,286 | | | | 3,744,063 | |
| Checkpoint Therapeutics, Inc.(a)(b) | | | 81,098 | | | | 115,159 | |
| ChemoCentryx, Inc.(a) | 67,573 | 1,504,851 | ||||||
| Chinook Therapeutics, Inc.(a) | 71,905 | 777,292 | ||||||
| Security Description | Shares | Value | ||||||
| Biotechnology (continued) | ||||||||
| Clene, Inc.(a)(b) | 60,323 | $ | 131,504 | |||||
| Cogent Biosciences, Inc.(a) | 38,584 | 177,872 | ||||||
| Coherus Biosciences, Inc.(a)(b) | 74,812 | 549,120 | ||||||
| Compass Pathways PLC, ADR(a)(b) | 40,757 | 370,481 | ||||||
| Crinetics Pharmaceuticals, Inc.(a) | 45,980 | 770,165 | ||||||
| Cytokinetics, Inc.(a)(b) | 81,204 | 3,240,040 | ||||||
| CytomX Therapeutics, Inc.(a)(b) | 63,306 | 101,923 | ||||||
| Day One Biopharmaceuticals, Inc.(a)(b) | 59,972 | 373,026 | ||||||
| eFFECTOR Therapeutics, Inc.(a)(b) | | | 43,828 | | | | 94,668 | |
| Emergent BioSolutions, Inc.(a) | �� | 48,890 | 1,611,414 | |||||
| Enanta Pharmaceuticals, Inc.(a) | 19,879 | 793,768 | ||||||
| FibroGen, Inc.(a) | 90,033 | 885,925 | ||||||
| Forma Therapeutics Holdings, Inc.(a) | | | 45,954 | | | | 261,478 | |
| Fortress Biotech, Inc.(a)(b) | 96,454 | 83,085 | ||||||
| Galapagos NV, Sponsored ADR(a)(b) | 63,265 | 3,480,208 | ||||||
| Geron Corp.(a)(b) | 313,390 | 432,478 | ||||||
| Gossamer Bio, Inc.(a) | 74,040 | 521,982 | ||||||
| Gritstone bio, Inc.(a)(b) | 70,385 | 142,178 | ||||||
| Imago Biosciences, Inc.(a) | 32,462 | 524,586 | ||||||
| Immunic, Inc.(a)(b) | 27,012 | 167,474 | ||||||
| Immunocore Holdings PLC, ADR(a) | 41,661 | 1,181,089 | ||||||
| ImmunoGen, Inc.(a) | 213,491 | 781,377 | ||||||
| Immunovant, Inc.(a) | 112,677 | 477,750 | ||||||
| Immutep, Ltd., ADR(a)(b) | 83,927 | 249,263 | ||||||
| Impel Pharmaceuticals, Inc.(a)(b) | 22,298 | 153,633 | ||||||
| Infinity Pharmaceuticals, Inc.(a)(b) | 87,022 | 58,514 | ||||||
| Inmune Bio, Inc.(a)(b) | 17,301 | 119,377 | ||||||
| Innate Pharma SA, ADR(a) | 79,097 | 210,398 | ||||||
| Insmed, Inc.(a) | 115,112 | 2,166,408 | ||||||
| Instil Bio, Inc.(a)(b) | 125,008 | 750,673 | ||||||
| Intercept Pharmaceuticals, Inc.(a)(b) | 28,742 | 520,230 | ||||||
| Ionis Pharmaceuticals, Inc.(a) | 136,863 | 4,998,238 | ||||||
| Iovance Biotherapeutics, Inc.(a) | 152,150 | 1,027,013 | ||||||
| IVERIC bio, Inc.(a) | 111,966 | 1,168,925 | ||||||
| Jounce Therapeutics, Inc.(a) | 50,040 | 193,655 | ||||||
| KalVista Pharmaceuticals, Inc.(a) | 23,752 | 211,155 | ||||||
| Karuna Therapeutics, Inc.(a) | 28,855 | 3,010,154 | ||||||
| Keros Therapeutics, Inc.(a)(b) | 23,240 | 785,512 | ||||||
| Kezar Life Sciences, Inc.(a) | 47,574 | 240,249 | ||||||
| Kodiak Sciences, Inc.(a) | 50,281 | 364,034 | ||||||
20 | May 31, 2022
ALPS Medical Breakthroughs ETF
| Schedule of Investments | May 31, 2022 (Unaudited) |
| Security Description | Shares | Value | ||||||
| Biotechnology (continued) | ||||||||
| Kronos Bio, Inc.(a)(b) | 54,801 | $ | 203,860 | |||||
| Krystal Biotech, Inc.(a) | 24,410 | 1,437,261 | ||||||
| LianBio, ADR(a)(b) | 103,820 | 295,887 | ||||||
| Ligand Pharmaceuticals, Inc.(a) | 16,316 | 1,450,656 | ||||||
| Longeveron, Inc.(a) | 18,512 | 151,243 | ||||||
| MacroGenics, Inc.(a) | 59,362 | 205,986 | ||||||
| Magenta Therapeutics, Inc.(a)(b) | 56,924 | 66,032 | ||||||
| MannKind Corp.(a)(b) | 243,763 | 1,018,929 | ||||||
| MEI Pharma, Inc.(a) | 128,735 | 61,329 | ||||||
| Merus NV(a) | 42,091 | 781,209 | ||||||
| MiMedx Group, Inc.(a) | 108,770 | 425,291 | ||||||
| Myovant Sciences, Ltd.(a)(b) | 90,899 | 942,623 | ||||||
| Organogenesis Holdings, Inc.(a) | 124,656 | 699,320 | ||||||
| Oyster Point Pharma, Inc.(a) | 25,773 | 101,288 | ||||||
| PDS Biotechnology Corp.(a) | 27,520 | 107,878 | ||||||
| Praxis Precision Medicines, Inc.(a) | 44,029 | 365,441 | ||||||
| Prometheus Biosciences, Inc.(a) | 37,824 | 985,693 | ||||||
| ProQR Therapeutics NV(a) | 69,542 | 45,898 | ||||||
| Protagonist Therapeutics, Inc.(a) | 46,871 | 410,590 | ||||||
| Prothena Corp. PLC(a) | 45,193 | 1,230,605 | ||||||
| PTC Therapeutics, Inc.(a) | 69,085 | 2,029,026 | ||||||
| Radius Health, Inc.(a) | 45,872 | 290,370 | ||||||
| RAPT Therapeutics, Inc.(a) | 28,631 | 421,448 | ||||||
| Recursion Pharmaceuticals, Inc.(a) | 163,595 | 1,001,201 | ||||||
| REGENXBIO, Inc.(a) | 41,573 | 874,696 | ||||||
| Replimune Group, Inc.(a) | 45,705 | 664,094 | ||||||
| Rigel Pharmaceuticals, Inc.(a) | 166,206 | 300,833 | ||||||
| Rocket Pharmaceuticals, Inc.(a) | 62,442 | 739,938 | ||||||
| SAB Biotherapeutics, Inc.(a)(b) | 42,491 | 83,282 | ||||||
| Sage Therapeutics, Inc.(a) | 57,165 | 1,787,550 | ||||||
| Scholar Rock Holding Corp.(a)(b) | 34,172 | 171,543 | ||||||
| Seres Therapeutics, Inc.(a) | 89,084 | 276,160 | ||||||
| SpringWorks Therapeutics, Inc.(a) | 47,772 | 904,802 | ||||||
| Stoke Therapeutics, Inc.(a) | 36,161 | 437,910 | ||||||
| Surface Oncology, Inc.(a) | 45,468 | 84,116 | ||||||
| Syndax Pharmaceuticals, Inc.(a) | 53,251 | 878,642 | ||||||
| Tonix Pharmaceuticals Holding Corp.(a)(b) | 15,013 | 36,631 | ||||||
| Travere Therapeutics, Inc.(a) | 61,466 | 1,432,772 | ||||||
| uniQure NV(a) | 44,971 | 645,784 | ||||||
| Valneva SE, ADR(a)(b) | 50,769 | 1,244,348 | ||||||
| Vanda Pharmaceuticals, Inc.(a) | 54,116 | 531,960 | ||||||
| Vaxart, Inc.(a) | 121,792 | 443,323 | ||||||
| Viking Therapeutics, Inc.(a)(b) | 75,861 | 168,411 | ||||||
| VistaGen Therapeutics, Inc.(a) | 199,935 | 229,925 | ||||||
| XBiotech, Inc. | 29,419 | 161,805 | ||||||
| Security Description | Shares | Value | ||||
| Biotechnology (continued) | ||||||
| Xencor, Inc.(a) | 57,480 | $ | 1,283,528 | |||
| Xenon Pharmaceuticals, Inc.(a) | 50,271 | 1,324,641 | ||||
| Y-mAbs Therapeutics, Inc.(a)(b) | 42,317 | 526,423 | ||||
| Total Biotechnology | 91,851,336 | |||||
| Health Care Providers & Services (2.11%) | ||||||
| OPKO Health, Inc.(a)(b) | 659,406 | 1,978,218 | ||||
| TOTAL COMMON STOCKS | ||||||
| (Cost $175,640,320) | 93,829,554 | |||||
| 7 Day Yield | Shares | Value | ||||||||||
| SHORT TERM INVESTMENTS (6.53%) | ||||||||||||
| Money Market Fund (0.02%) | ||||||||||||
| State Street Institutional | ||||||||||||
| Treasury Plus Money | ||||||||||||
| Market Fund | ||||||||||||
| (Cost $23,017) | 0.75 | % | 23,017 | 23,017 | ||||||||
| Investments Purchased with Collateral | ||||||||||||
| from Securities Loaned (6.51%) | ||||||||||||
| State Street Navigator | ||||||||||||
| Securities Lending | ||||||||||||
| Government Money Market | ||||||||||||
| Portfolio, 0.80% | ||||||||||||
| (Cost $6,107,385) | 6,107,385 | 6,107,385 | ||||||||||
| TOTAL SHORT TERM INVESTMENTS | ||||||||||||
| (Cost $6,130,402) | 6,130,402 | |||||||||||
| TOTAL INVESTMENTS (106.53%) | ||||||||||||
| (Cost $181,770,722) | $ | 99,959,956 | ||||||||||
| LIABILITIES IN EXCESS OF OTHER ASSETS (-6.53%) | (6,129,874 | ) | ||||||||||
| NET ASSETS - 100.00% | $ | 93,830,082 | ||||||||||
| (a) | Non-income producing security. |
| (b) | Security, or a portion of the security position is currently on loan. The total market value of securities on loan is $12,117,651. |
See Notes to Financial Statements.
21 | May 31, 2022
ALPS ETF Trust
| Statements of Assets and Liabilities | May 31, 2022 (Unaudited) |
| ALPS Clean Energy ETF | ALPS Disruptive Technologies ETF | ALPS Global Travel Beneficiaries ETF | ALPS Medical Breakthroughs ETF | |||||||||||||
| ASSETS: | ||||||||||||||||
| Investments, at value | $ | 739,528,633 | $ | 150,514,259 | $ | 8,652,487 | $ | 99,959,956 | ||||||||
| Cash | – | – | – | 9,543 | ||||||||||||
| Foreign Currency, at value (Cost $37,873, $1,207, $266 and $–) | 37,873 | 1,207 | 266 | – | ||||||||||||
| Dividends receivable | 912,546 | 155,078 | 6,027 | 9,591 | ||||||||||||
| Receivable for investments sold | 16,059,076 | – | – | – | ||||||||||||
| Total Assets | 756,538,128 | 150,670,544 | 8,658,780 | 99,979,090 | ||||||||||||
| LIABILITIES: | ||||||||||||||||
| Payable to adviser | 304,420 | 62,175 | 4,430 | 41,623 | ||||||||||||
| Payable for capital shares redeemed | 16,063,429 | – | – | – | ||||||||||||
| Payable for collateral upon return of securities loaned | 75,385,575 | 919,800 | 48,416 | 6,107,385 | ||||||||||||
| Total Liabilities | 91,753,424 | 981,975 | 52,846 | 6,149,008 | ||||||||||||
| NET ASSETS | $ | 664,784,704 | $ | 149,688,569 | $ | 8,605,934 | $ | 93,830,082 | ||||||||
| NET ASSETS CONSIST OF: | ||||||||||||||||
| Paid-in capital | $ | 865,960,823 | $ | 163,321,583 | $ | 9,626,175 | $ | 269,175,409 | ||||||||
| Total distributable earnings | (201,176,119 | ) | (13,633,014 | ) | (1,020,241 | ) | (175,345,327 | ) | ||||||||
| NET ASSETS | $ | 664,784,704 | $ | 149,688,569 | $ | 8,605,934 | $ | 93,830,082 | ||||||||
| INVESTMENTS, AT COST | $ | 864,633,131 | $ | 171,936,330 | $ | 9,764,179 | $ | 181,770,722 | ||||||||
| PRICING OF SHARES | ||||||||||||||||
| Net Assets | $ | 664,784,704 | $ | 149,688,569 | $ | 8,605,934 | $ | 93,830,082 | ||||||||
| Shares of beneficial interest outstanding (Unlimited number of shares authorized, par value $0.01 per share) | 12,500,002 | 4,100,002 | 400,002 | 3,650,000 | ||||||||||||
| Net Asset Value, offering and redemption price per share | $ | 53.18 | $ | 36.51 | $ | 21.51 | $ | 25.71 | ||||||||
See Notes to Financial Statements.
22 | May 31, 2022
ALPS ETF Trust
| Statements of Operations | For the Six Months Ended May 31, 2022 (Unaudited) |
| ALPS Clean Energy ETF | ALPS Disruptive Technologies ETF | ALPS Global Travel Beneficiaries ETF | ALPS Medical Breakthroughs ETF | |||||||||||||
| INVESTMENT INCOME: | ||||||||||||||||
| Dividends* | $ | 4,045,746 | $ | 612,510 | $ | 26,307 | $ | 28 | ||||||||
| Securities Lending Income | 1,823,858 | 6,876 | 135 | 81,784 | ||||||||||||
| Total Investment Income | 5,869,604 | 619,386 | 26,442 | 81,812 | ||||||||||||
| EXPENSES: | ||||||||||||||||
| Investment adviser fees | 2,096,670 | 479,009 | 24,559 | 350,433 | ||||||||||||
| Total Expenses | 2,096,670 | 479,009 | 24,559 | 350,433 | ||||||||||||
| NET INVESTMENT INCOME/(LOSS) | 3,772,934 | 140,377 | 1,883 | (268,621 | ) | |||||||||||
| REALIZED AND UNREALIZED GAIN/LOSS | ||||||||||||||||
| Net realized gain/(loss) on investments(a) | (28,136,858 | ) | 12,517,207 | 109,180 | (14,664,545 | ) | ||||||||||
| Net realized gain/(loss) on foreign currency transactions | (52,109 | ) | 12,075 | (164 | ) | – | ||||||||||
| Total net realized gain/(loss) | (28,188,967 | ) | 12,529,282 | 109,016 | (14,664,545 | ) | ||||||||||
| Net change in unrealized depreciation on investments | (257,690,863 | ) | (66,614,674 | ) | (736,503 | ) | (55,114,354 | ) | ||||||||
| Net change in unrealized appreciation/(depreciation) on translation of assets and liabilities denominated in foreign currencies | 4,073 | (1,425 | ) | (28 | ) | – | ||||||||||
| Total net change in unrealized depreciation | (257,686,790 | ) | (66,616,099 | ) | (736,531 | ) | (55,114,354 | ) | ||||||||
| NET REALIZED AND UNREALIZED LOSS ON INVESTMENTS | (285,875,757 | ) | (54,086,817 | ) | (627,515 | ) | (69,778,899 | ) | ||||||||
| NET DECREASE IN NET ASSETS RESULTING FROM OPERATIONS | $ | (282,102,823 | ) | $ | (53,946,440 | ) | $ | (625,632 | ) | $ | (70,047,520 | ) | ||||
| *Net of foreign tax withholding. | $ | 225,738 | $ | 44,131 | $ | 1,488 | $ | – | ||||||||
| (a) | Includes realized gain or loss as a result of in-kind transactions (See Note 4 in Notes to Financial Statements). |
See Notes to Financial Statements.
23 | May 31, 2022
ALPS Clean Energy ETF
Statement of Changes in Net Assets
| | | For the Six Months Ended May 31, 2022 (Unaudited) | | | For the Year Ended November 30, 2021 | | ||
| OPERATIONS: | ||||||||
| Net investment income | $ | 3,772,934 | $ | 2,492,485 | ||||
| Net realized gain/(loss) | (28,188,967 | ) | 85,403,452 | |||||
| Net change in unrealized depreciation | (257,686,790 | ) | (103,058,310 | ) | ||||
| Net decrease in net assets resulting from operations | (282,102,823 | ) | (15,162,373 | ) | ||||
| DISTRIBUTIONS TO SHAREHOLDERS: | ||||||||
| From distributable earnings | (2,427,333 | ) | (2,023,844 | ) | ||||
| From tax return of capital | – | (3,160,255 | ) | |||||
| Total distributions | (2,427,333 | ) | (5,184,099 | ) | ||||
| CAPITAL SHARE TRANSACTIONS: | ||||||||
| Proceeds from sale of shares | 86,093,355 | 667,197,824 | ||||||
| Cost of shares redeemed | (151,545,454 | ) | (241,541,495 | ) | ||||
| Net increase/(decrease) from capital share transactions | (65,452,099 | ) | 425,656,329 | |||||
| Net increase/(decrease) in net assets | (349,982,255 | ) | 405,309,857 | |||||
| NET ASSETS: | ||||||||
| Beginning of period | 1,014,766,959 | 609,457,102 | ||||||
| End of period | $ | 664,784,704 | $ | 1,014,766,959 | ||||
| OTHER INFORMATION: | ||||||||
| CAPITAL SHARE TRANSACTIONS: | ||||||||
| Beginning shares | 13,725,002 | 8,700,002 | ||||||
| Shares sold | 1,475,000 | 8,400,000 | ||||||
| Shares redeemed | (2,700,000 | ) | (3,375,000 | ) | ||||
| Shares outstanding, end of period | 12,500,002 | 13,725,002 | ||||||
See Notes to Financial Statements.
24 | May 31, 2022
ALPS Disruptive Technologies ETF
Statement of Changes in Net Assets
For the Six Months Ended May 31, 2022 (Unaudited) | For the Year Ended November 30, 2021 | |||||||
| OPERATIONS: | ||||||||
| Net investment income | $ | 140,377 | $ | 676,422 | ||||
| Net realized gain | 12,529,282 | 14,565,809 | ||||||
| Net change in unrealized appreciation/(depreciation) | (66,616,099 | ) | 5,497,585 | |||||
| Net increase/(decrease) in net assets resulting from operations | (53,946,440 | ) | 20,739,816 | |||||
| DISTRIBUTIONS TO SHAREHOLDERS: | ||||||||
| From distributable earnings | (621,903 | ) | (633,863 | ) | ||||
| Total distributions | (621,903 | ) | (633,863 | ) | ||||
| CAPITAL SHARE TRANSACTIONS: | ||||||||
| Proceeds from sale of shares | 14,781,794 | 100,271,458 | ||||||
| Cost of shares redeemed | (48,070,483 | ) | (33,290,851 | ) | ||||
| Net increase/(decrease) from capital share transactions | (33,288,689 | ) | 66,980,607 | |||||
| Net increase/(decrease) in net assets | (87,857,032 | ) | 87,086,560 | |||||
| NET ASSETS: | ||||||||
| Beginning of period | 237,545,601 | 150,459,041 | ||||||
| End of period | $ | 149,688,569 | $ | 237,545,601 | ||||
| OTHER INFORMATION: | ||||||||
| CAPITAL SHARE TRANSACTIONS: | ||||||||
| Beginning shares | 4,925,002 | 3,500,002 | ||||||
| Shares sold | 325,000 | 2,125,000 | ||||||
| Shares redeemed | (1,150,000 | ) | (700,000 | ) | ||||
| Shares outstanding, end of period | 4,100,002 | 4,925,002 | ||||||
See Notes to Financial Statements.
25 | May 31, 2022
ALPS Global Travel Beneficiaries ETF
Statement of Changes in Net Assets
| For the Six Months Ended May 31, 2022 (Unaudited) | For the Period September 8, 2021 (Commencement of Operations) to November 30, 2021 | |||||||
| OPERATIONS: | ||||||||
| Net investment income | $ | 1,883 | $ | 12,482 | ||||
| Net realized gain/(loss) | 109,016 | (19,713 | ) | |||||
| Net change in unrealized depreciation | (736,531 | ) | (375,185 | ) | ||||
| Net decrease in net assets resulting from operations | (625,632 | ) | (382,416 | ) | ||||
| DISTRIBUTIONS: | ||||||||
| From distributable earnings | (12,194 | ) | – | |||||
| Total distributions | (12,194 | ) | – | |||||
| CAPITAL SHARE TRANSACTIONS: | ||||||||
| Proceeds from sale of shares | 6,150,252 | 8,047,426 | ||||||
| Cost of shares redeemed | (4,571,502 | ) | – | |||||
| Net increase from capital share transactions | 1,578,750 | 8,047,426 | ||||||
| Net increase in net assets | 940,924 | 7,665,010 | ||||||
| NET ASSETS: | ||||||||
| Beginning of period | 7,665,010 | – | ||||||
| End of period | $ | 8,605,934 | $ | 7,665,010 | ||||
| OTHER INFORMATION: | ||||||||
| CAPITAL SHARE TRANSACTIONS: | ||||||||
| Beginning shares | 325,002 | – | ||||||
| Shares sold | 275,000 | 325,002 | ||||||
| Shares redeemed | (200,000 | ) | – | |||||
| Shares outstanding, end of period | 400,002 | 325,002 | ||||||
See Notes to Financial Statements.
26 | May 31, 2022
ALPS Medical Breakthroughs ETF
Statements of Changes in Net Assets
| | | For the Six Months Ended May 31, 2022 (Unaudited) | | | For the Year Ended November 30, 2021 | | ||
| OPERATIONS: | ||||||||
| Net investment loss | $ | (268,621 | ) | $ | (852,170 | ) | ||
| Net realized gain/(loss) | (14,664,545 | ) | 46,250,415 | |||||
| Net change in unrealized depreciation | (55,114,354 | ) | (77,077,650 | ) | ||||
| Net decrease in net assets resulting from operations | (70,047,520 | ) | (31,679,405 | ) | ||||
| CAPITAL SHARE TRANSACTIONS: | ||||||||
| Proceeds from sale of shares | 7,287,789 | 97,970,744 | ||||||
| Cost of shares redeemed | (32,339,502 | ) | (119,904,054 | ) | ||||
| Net decrease from capital share transactions | (25,051,713 | ) | (21,933,310 | ) | ||||
| Net decrease in net assets | (95,099,233 | ) | (53,612,715 | ) | ||||
| NET ASSETS: | ||||||||
| Beginning of period | 188,929,315 | 242,542,030 | ||||||
| End of period | $ | 93,830,082 | $ | 188,929,315 | ||||
| OTHER INFORMATION: | ||||||||
| CAPITAL SHARE TRANSACTIONS: | ||||||||
| Beginning shares | 4,400,000 | 4,950,000 | ||||||
| Shares sold | 200,000 | 1,800,000 | ||||||
| Shares redeemed | (950,000 | ) | (2,350,000 | ) | ||||
| Shares outstanding, end of period | 3,650,000 | 4,400,000 | ||||||
See Notes to Financial Statements.
27 | May 31, 2022
ALPS Clean Energy ETF
| Financial Highlights | For a Share Outstanding Throughout the Periods Presented |
For the Six Months Ended May 31, 2022 (Unaudited) | For the Year Ended November 30, 2021 | For the Year Ended November 30, 2020 | For the Year Ended November 30, 2019 | For the Period June 28, 2018 (Commencement of Operations) to November 30, 2018 | ||||||||||||||||
| NET ASSET VALUE, BEGINNING OF PERIOD | $ | 73.94 | $ | 70.05 | $ | 32.23 | $ | 25.03 | $ | 24.95 | ||||||||||
| INCOME/(LOSS) FROM INVESTMENT OPERATIONS: | ||||||||||||||||||||
| Net investment income (a) | 0.28 | 0.20 | 0.25 | 0.32 | 0.09 | |||||||||||||||
| Net realized and unrealized gain/(loss) | (20.86 | ) | 4.11 | 38.08 | 7.42 | (0.01 | ) | |||||||||||||
| Total from investment operations | (20.58 | ) | 4.31 | 38.33 | 7.74 | 0.08 | ||||||||||||||
| DISTRIBUTIONS: | ||||||||||||||||||||
| From net investment income | (0.18 | ) | (0.17 | ) | (0.18 | ) | (0.23 | ) | – | |||||||||||
| Tax return of capital | – | (0.25 | ) | (0.33 | ) | (0.31 | ) | – | ||||||||||||
| Total distributions | (0.18 | ) | (0.42 | ) | (0.51 | ) | (0.54 | ) | – | |||||||||||
| Net increase/(decrease) in net asset value | (20.76 | ) | 3.89 | 37.82 | 7.20 | 0.08 | ||||||||||||||
| NET ASSET VALUE, END OF PERIOD | $ | 53.18 | $ | 73.94 | $ | 70.05 | $ | 32.23 | $ | 25.03 | ||||||||||
| TOTAL RETURN(b) | (27.87 | )% | 6.16 | % | 120.45 | % | 31.28 | % | 0.32 | % | ||||||||||
| RATIOS/SUPPLEMENTAL DATA: | ||||||||||||||||||||
| Net assets, end of period (000s) | $ | 664,785 | $ | 1,014,767 | $ | 609,457 | $ | 106,359 | $ | 16,271 | ||||||||||
| Ratio of expenses to average net assets | 0.55 | %(c) | 0.56 | %(d) | 0.65 | % | 0.65 | % | 0.65 | %(c) | ||||||||||
| Ratio of net investment income to average net assets | 0.99 | %(c) | 0.26 | % | 0.57 | % | 1.10 | % | 0.89 | %(c) | ||||||||||
| Portfolio turnover rate(e) | 29 | % | 39 | % | 34 | % | 15 | % | 9 | % |
| (a) | Based on average shares outstanding during the period. |
| (b) | Total return is calculated assuming an initial investment made at the net asset value at the beginning of the period and redemption at the net asset value on the last day of the period and assuming all distributions are reinvested at reinvestment prices. Total return calculated for a period of less than one year is not annualized. |
| (c) | Annualized. |
| (d) | Effective January 1, 2021, the Fund's Advisory Fee changed from 0.65% to 0.55%. |
| (e) | Portfolio turnover for periods less than one year are not annualized and does not include securities received or delivered from processing creations or redemptions in-kind. |
See Notes to Financial Statements.
28 | May 31, 2022
ALPS Disruptive Technologies ETF
| Financial Highlights | For a Share Outstanding Throughout the Periods Presented |
For the Six Months Ended May 31, 2022 (Unaudited) | For the Year Ended November 30, 2021 | For the Year Ended November 30, 2020 | For the Year Ended November 30, 2019 | For the Period December 28, 2017 (Commencement of Operations) to November 30, 2018 | ||||||||||||||||
| NET ASSET VALUE, BEGINNING OF PERIOD | $ | 48.23 | $ | 42.99 | $ | 31.88 | $ | 26.21 | $ | 25.08 | ||||||||||
| INCOME/(LOSS) FROM INVESTMENT OPERATIONS: | ||||||||||||||||||||
| Net investment income (a) | 0.03 | 0.15 | 0.25 | 0.14 | 0.13 | |||||||||||||||
| Net realized and unrealized gain/(loss) | (11.63 | ) | 5.26 | 11.00 | 5.61 | 1.00 | (b) | |||||||||||||
| Total from investment operations | (11.60 | ) | 5.41 | 11.25 | 5.75 | 1.13 | ||||||||||||||
| DISTRIBUTIONS: | ||||||||||||||||||||
| From net investment income | (0.12 | ) | (0.17 | ) | (0.14 | ) | (0.08 | ) | – | |||||||||||
| Total distributions | (0.12 | ) | (0.17 | ) | (0.14 | ) | (0.08 | ) | – | |||||||||||
| Net increase/(decrease) in net asset value | (11.72 | ) | 5.24 | 11.11 | 5.67 | 1.13 | ||||||||||||||
| NET ASSET VALUE, END OF PERIOD | $ | 36.51 | $ | 48.23 | $ | 42.99 | $ | 31.88 | $ | 26.21 | ||||||||||
| TOTAL RETURN(c) | (24.11 | )% | 12.60 | % | 35.42 | % | 22.04 | % | 4.47 | % | ||||||||||
| RATIOS/SUPPLEMENTAL DATA: | ||||||||||||||||||||
| Net assets, end of period (000s) | $ | 149,689 | $ | 237,546 | $ | 150,459 | $ | 74,910 | $ | 48,483 | ||||||||||
| Ratio of expenses to average net assets | 0.50 | %(d) | 0.50 | % | 0.50 | % | 0.50 | % | 0.50 | %(d) | ||||||||||
| Ratio of net investment income to average net assets | | | 0.15 | %(d) | | | 0.31 | % | | | 0.72 | % | | | 0.48 | % | | | 0.53 | %(d) |
| Portfolio turnover rate(e) | 16 | % | 26 | % | 38 | % | 42 | % | 33 | % | ||||||||||
| (a) | Based on average shares outstanding during the period. |
| (b) | Net realized and unrealized loss on investments per share does not correlate to aggregate of the net realized and unrealized gain in the Statements of Operations for the period ended November 30, 2018, primarily due to the timing of the sales and repurchases of the Fund's shares in relation to the fluctuating market values for the Fund's portfolio. |
| (c) | Total return is calculated assuming an initial investment made at the net asset value at the beginning of the period and redemption at the net asset value on the last day of the period and assuming all distributions are reinvested at reinvestment prices. Total return calculated for a period of less than one year is not annualized. |
| (d) | Annualized. |
| (e) | Portfolio turnover for periods less than one year are not annualized and does not include securities received or delivered from processing creations or redemptions in-kind. |
See Notes to Financial Statements.
29 | May 31, 2022
ALPS Global Travel Beneficiaries ETF
| Financial Highlights | For a Share Outstanding Throughout the Periods Presented |
| For the Six Months Ended May 31, 2022 (Unaudited) | For the Period September 8, 2021 (Commencement of Operations) to November 30, 2021 | |||||||
| NET ASSET VALUE, BEGINNING OF PERIOD | $ | 23.58 | $ | 24.91 | ||||
| INCOME/(LOSS) FROM INVESTMENT OPERATIONS: | ||||||||
| Net investment income (a) | 0.01 | 0.05 | ||||||
| Net realized and unrealized loss | (2.05 | ) | (1.38 | ) | ||||
| Total from investment operations | (2.04 | ) | (1.33 | ) | ||||
| DISTRIBUTIONS: | ||||||||
| From net investment income | (0.03 | ) | – | |||||
| Total distributions | (0.03 | ) | – | |||||
| Net (decrease) in net asset value | (2.07 | ) | (1.33 | ) | ||||
| NET ASSET VALUE, END OF PERIOD | $ | 21.51 | $ | 23.58 | ||||
| TOTAL RETURN(b) | (8.65 | )% | (5.34 | )% | ||||
| RATIOS/SUPPLEMENTAL DATA: | ||||||||
| Net assets, end of period (000s) | $ | 8,606 | $ | 7,665 | ||||
| Ratio of expenses to average net assets | 0.65 | %(c) | 0.65 | %(c) | ||||
| Ratio of net investment income to average net assets | 0.05 | %(c) | 0.82 | %(c) | ||||
| Portfolio turnover rate(d) | 25 | % | 19 | % | ||||
| (a) | Based on average shares outstanding during the period. |
| (b) | Total return is calculated assuming an initial investment made at the net asset value at the beginning of the period and redemption at the net asset value on the last day of the period and assuming all distributions are reinvested at reinvestment prices. Total return calculated for a period of less than one year is not annualized. |
| (c) | Annualized. |
| (d) | Portfolio turnover for periods less than one year are not annualized and does not include securities received or delivered from processing creations or redemptions in-kind. |
See Notes to Financial Statements.
30 | May 31, 2022
ALPS Medical Breakthroughs ETF
| Financial Highlights | For a Share Outstanding Throughout the Periods Presented |
| For the Six Months Ended May 31, 2022 (Unaudited) | For the Year Ended November 30, 2021 | For the Year Ended November 30, 2020 | For the Year Ended November 30, 2019 | For the Year Ended November 30, 2018 | For the Year Ended November 30, 2017 | |||||||||||||||||||
| NET ASSET VALUE, BEGINNING OF PERIOD | $ | 42.94 | $ | 49.00 | $ | 39.51 | $ | 33.59 | $ | 31.70 | $ | 24.16 | ||||||||||||
| INCOME/(LOSS) FROM INVESTMENT OPERATIONS: | ||||||||||||||||||||||||
| Net investment income/(loss) (a) | (0.07 | ) | (0.18 | ) | (0.13 | ) | 0.03 | (0.10 | ) | 0.18 | ||||||||||||||
| Net realized and unrealized gain/(loss) | (17.16 | ) | (5.88 | ) | 9.64 | 6.67 | 2.57 | (b) | 7.36 | |||||||||||||||
| Total from investment operations | (17.23 | ) | (6.06 | ) | 9.51 | 6.70 | 2.47 | 7.54 | ||||||||||||||||
| DISTRIBUTIONS: | ||||||||||||||||||||||||
| From net investment income | – | – | (0.02 | ) | (0.78 | ) | (0.58 | ) | – | |||||||||||||||
| Total distributions | – | – | (0.02 | ) | (0.78 | ) | (0.58 | ) | – | |||||||||||||||
| Net increase/(decrease) in net asset value | (17.23 | ) | (6.06 | ) | 9.49 | 5.92 | 1.89 | 7.54 | ||||||||||||||||
| NET ASSET VALUE, END OF PERIOD | $ | 25.71 | $ | 42.94 | $ | 49.00 | $ | 39.51 | $ | 33.59 | $ | 31.70 | ||||||||||||
| TOTAL RETURN(c) | (40.13 | )% | (12.37 | )% | 24.07 | % | 20.99 | % | 7.81 | % | 31.21 | % | ||||||||||||
| RATIOS/SUPPLEMENTAL DATA: | ||||||||||||||||||||||||
| Net assets, end of period (000s) | $ | 93,830 | $ | 188,929 | $ | 242,542 | $ | 197,570 | $ | 221,694 | $ | 128,402 | ||||||||||||
| Ratio of expenses to average net | ||||||||||||||||||||||||
| assets | 0.50 | %(d) | 0.50 | % | 0.50 | % | 0.50 | % | 0.50 | % | 0.50 | % | ||||||||||||
| Ratio of net investment | ||||||||||||||||||||||||
| income/(loss) to average net | ||||||||||||||||||||||||
| assets | (0.38 | )%(d) | (0.36 | )% | (0.33 | )% | 0.09 | % | (0.27 | )% | 0.66 | % | ||||||||||||
| Portfolio turnover rate(e) | 45 | % | 81 | % | 68 | % | 88 | % | 48 | % | 43 | % | ||||||||||||
| (a) | Based on average shares outstanding during the period. |
| (b) | Net realized and unrealized loss on investments per share does not correlate to aggregate of the net realized and unrealized gain in the Statements of Operations for the year ended November 30, 2018, primarily due to the timing of the sales and repurchases of the Fund's shares in relation to the fluctuating market values for the Fund's portfolio. |
| (c) | Total return is calculated assuming an initial investment made at the net asset value at the beginning of the period and redemption at the net asset value on the last day of the period and assuming all distributions are reinvested at reinvestment prices. Total return calculated for a period of less than one year is not annualized. |
| (d) | Annualized. |
| (e) | Portfolio turnover for periods less than one year are not annualized and does not include securities received or delivered from processing creations or redemptions in-kind. |
See Notes to Financial Statements.
31 | May 31, 2022
ALPS ETF Trust
| Notes to Financial Statements | May 31, 2022 (Unaudited) |
| 1. | ORGANIZATION |
ALPS ETF Trust (the “Trust”), a Delaware statutory trust, is an open-end management investment company registered under the Investment Company Act of 1940, as amended (the “1940 Act”). As of May 31, 2022, the Trust consisted of nineteen separate portfolios. Each portfolio represents a separate series of the Trust. This report pertains to the ALPS Clean Energy ETF, ALPS Disruptive Technologies ETF, ALPS Global Travel Beneficiaries ETF and the ALPS Medical Breakthroughs ETF (each a “Fund” and collectively, the “Funds”). ALPS Clean Energy ETF is considered non-diversified and may invest a greater portion of assets in securities of individual issuers than a diversified fund. As a result, changes in the market value of a single investment could cause greater fluctuations in share price than would occur in a diversified fund. ALPS Disruptive Technologies ETF, ALPS Global Travel Beneficiaries ETF and ALPS Medical Breakthroughs ETF have elected to qualify as a diversified series of the Trust under the 1940 Act.
The investment objective of the ALPS Clean Energy ETF is to seek investment results that correspond generally, before fees and expenses, to the performance of the CIBC Atlas Clean Energy Total Return Index. The investment objective of the ALPS Disruptive Technologies ETF is to seek investment results that correspond generally, before fees and expenses, to the performance of the Indxx Disruptive Technologies Total Return Index. The investment objective of the ALPS Global Travel Beneficiaries ETF is to seek investment results that correspond generally, before fees and expenses, to the performance of the S-Network Global Travel Index. The investment objective of the ALPS Medical Breakthroughs ETF is to seek investment results that correspond generally, before fees and expenses, to the performance of the S-Network Medical Breakthroughs Total Return Index.
The shares of the ALPS Clean Energy ETF, ALPS Disruptive Technologies ETF, the ALPS Global Travel Beneficiaries ETF and the ALPS Medical Breakthroughs ETF (“Shares”) are listed on the NYSE Arca, Inc. (the “NYSE Arca”). Each Fund issues and redeems Shares at net asset value (“NAV”) in blocks of 25,000 Shares, each of which is called a “Creation Unit”. Creation Units are issued and redeemed principally in-kind for securities included in the Underlying Index. Except when aggregated in Creation Units, Shares are not redeemable securities of the Fund. On October 1, 2021, ALPS Clean Energy ETF, ALPS Disruptive Technologies ETF and ALPS Medical Breakthroughs ETF each reduced its Creation Unit size from 50,000 to 25,000 shares.
Pursuant to the Trust’s organizational documents, its Officers and Trustees are indemnified against certain liability arising out of the performance of their duties to the Trust. Additionally, in the normal course of business, the Trust enters into contracts with service providers that contain general indemnification clauses. The Trust’s maximum exposure under these arrangements is unknown, as this would involve future claims that may be made against the Trust that have not yet occurred.
| 2. | SIGNIFICANT ACCOUNTING POLICIES |
The following is a summary of significant accounting policies consistently followed by the Funds in the preparation of the financial statements. The accompanying financial statements were prepared in accordance with accounting principles generally accepted in the United States of America (“U.S. GAAP”). The preparation of financial statements in conformity with U.S. GAAP requires management to make certain estimates and assumptions that affect the reported amounts of assets and liabilities and disclosures of contingent assets and liabilities at the date of the financial statements and the reported amounts of revenue and expenses during the period. Actual results could differ from those estimates. Each Fund is considered an investment company under U.S. GAAP and follows the accounting and reporting guidance applicable to investment companies in the Financial Accounting Standards Board (“FASB”) Accounting Standards Codification Topic 946.
| A. | Portfolio Valuation |
Each Fund’s NAV is determined daily, as of the close of regular trading on the New York Stock Exchange (the “NYSE”), normally 4:00 p.m. Eastern time, on each day the NYSE is open for trading. The NAV is computed by dividing the value of all assets of the Fund (including accrued interest and dividends), less all liabilities (including accrued expenses and dividends declared but unpaid), by the total number of shares outstanding.
Portfolio securities listed on any exchange other than the NASDAQ Stock Market LLC (“NASDAQ”) are valued at the last sale price on the business day as of which such value is being determined. If there has been no sale on such day, the securities are valued at the mean of the most recent bid and ask prices on such day. Securities traded on the NASDAQ are valued at the NASDAQ Official Closing Price as determined by NASDAQ. Portfolio securities traded on more than one securities exchange are valued at the last sale price on the business day as of which such value is being determined at the close of the exchange representing the principal market for such securities. Portfolio securities traded in the over-the-counter market, but excluding securities traded on the NASDAQ, are valued at the last quoted sale price in such market.
The Funds’ investments are valued at market value or, in the absence of market value with respect to any portfolio securities, at fair value according to procedures adopted by the Trust’s Board of Trustees (the “Board”). When market quotations are not readily available or when events occur that make established valuation methods unreliable, securities of the Funds may be valued in good faith by or under the direction of the Board. These securities generally include, but are not limited to, restricted securities (securities which may not be publicly sold without registration under the Securities Act of 1933) for which a pricing service is unable to provide a market price; securities whose trading has been formally suspended; a security whose market price is not available from a pre-established primary pricing source or the pricing source is not willing to provide a price; a security with respect to which an event has occurred that is most likely to materially affect the value of the security after the market has closed but before the calculation of the Fund’s NAV or make it difficult or impossible to obtain a reliable market quotation; or a security whose price, as provided by the pricing service, does not reflect the security’s “fair value” due to the security being de-listed from a national exchange or the security’s primary trading market is temporarily closed at a time when, under normal conditions, it would be open. As a general principle, the current “fair value” of a security would be the amount which the owner might reasonably expect to receive from the sale on the applicable exchange or principal market. A variety of factors may be considered in determining the fair value of such securities.
32 | May 31, 2022
ALPS ETF Trust
| Notes to Financial Statements | May 31, 2022 (Unaudited) |
| B. | Fair Value Measurements |
Each Fund discloses the classification of its fair value measurements following a three-tier hierarchy based on the inputs used to measure fair value. Inputs refer broadly to the assumptions that market participants would use in pricing the asset or liability; including assumptions about risk. Inputs may be observable or unobservable. Observable inputs reflect the assumptions market participants would use in pricing the asset or liability that are developed based on market data obtained from sources independent of the reporting entity. Unobservable inputs reflect the reporting entity’s own assumptions about the assumptions market participants would use in pricing the asset or liability that are developed based on the best information available.
Valuation techniques used to value the Funds’ investments by major category are as follows:
Equity securities, including restricted securities, for which market quotations are readily available, are valued at the last reported sale price or official closing price as reported by a third party pricing vendor on the primary market or exchange on which they are traded and are categorized as Level 1 in the hierarchy. In the event there were no sales during the day or closing prices are not available, securities are valued at the mean of the most recent quoted bid and ask prices on such day and are generally categorized as Level 2 in the hierarchy. Investments in open-end mutual funds are valued at their closing NAV each business day and are categorized as Level 1 in the hierarchy.
Changes in valuation techniques may result in transfers in or out of an assigned level within the disclosure hierarchy.
Various inputs are used in determining the value of each Fund’s investments as of the end of the reporting period. When inputs used fall into different levels of the fair value hierarchy, the level in the hierarchy within which the fair value measurement falls is determined based on the lowest level input that is significant to the fair value measurement in its entirety. The designated input levels are not necessarily an indication of the risk or liquidity associated with these investments.
These inputs are categorized in the following hierarchy under applicable financial accounting standards:
| Level 1 | – | Unadjusted quoted prices in active markets for identical investments, unrestricted assets or liabilities that a Fund has the ability to access at the measurement date; |
| Level 2 | – | Quoted prices which are not active, quoted prices for similar assets or liabilities in active markets or inputs other than quoted prices that are observable (either directly or indirectly) for substantially the full term of the asset or liability; and |
| Level 3 | – | Significant unobservable prices or inputs (including the Fund’s own assumptions in determining the fair value of investments) where there is little or no market activity for the asset or liability at the measurement date. |
33 | May 31, 2022
ALPS ETF Trust
| Notes to Financial Statements | May 31, 2022 (Unaudited) |
The following is a summary of the inputs used to value the Funds’ investments as of May 31, 2022:
ALPS Clean Energy ETF
| Investments in Securities at Value | Level 1 - Quoted and Unadjusted Prices | Level 2 - Other Significant Observable Inputs | Level 3 - Significant Unobservable Inputs | Total | ||||||||||||
| Common Stocks* | $ | 583,917,563 | $ | – | $ | – | $ | 583,917,563 | ||||||||
| Master Limited Partnerships* | 79,085,380 | – | – | 79,085,380 | ||||||||||||
| Short Term Investments | 76,525,690 | – | – | 76,525,690 | ||||||||||||
| Total | $ | 739,528,633 | $ | – | $ | – | $ | 739,528,633 | ||||||||
ALPS Disruptive Technologies ETF
| Investments in Securities at Value | | Level 1 - Quoted and Unadjusted Prices | | | Level 2 - Other Significant Observable Inputs | | | Level 3 - Significant Unobservable Inputs | | | Total | | ||||
| Common Stocks* | $ | 147,963,751 | $ | – | $ | – | $ | 147,963,751 | ||||||||
| Master Limited Partnerships* | 1,442,696 | – | – | 1,442,696 | ||||||||||||
| Short Term Investments | 1,107,812 | – | – | 1,107,812 | ||||||||||||
| Total | $ | 150,514,259 | $ | – | $ | – | $ | 150,514,259 | ||||||||
ALPS Global Travel Beneficiaries ETF
| Investments in Securities at Value | | Level 1 - Quoted and Unadjusted Prices | | | Level 2 - Other Significant Observable Inputs | | | Level 3 - Significant Unobservable Inputs | | | Total | | ||||
| Common Stocks* | $ | 8,600,399 | $ | – | $ | – | $ | 8,600,399 | ||||||||
| Short Term Investments | 52,088 | – | – | 52,088 | ||||||||||||
| Total | $ | 8,652,487 | $ | – | $ | – | $ | 8,652,487 | ||||||||
ALPS Medical Breakthroughs ETF
| Investments in Securities at Value | | Level 1 - Quoted and Unadjusted Prices | | | Level 2 - Other Significant Observable Inputs | | | Level 3 - Significant Unobservable Inputs | | | �� Total | | ||||
| Common Stocks* | $ | 93,829,554 | $ | – | $ | – | $ | 93,829,554 | ||||||||
| Short Term Investments | 6,130,402 | – | – | 6,130,402 | ||||||||||||
| Total | $ | 99,959,956 | $ | – | $ | – | $ | 99,959,956 | ||||||||
| * | For a detailed sector breakdown, see the accompanying Schedule of Investments. |
The Funds did not have any securities that used significant unobservable inputs (Level 3) in determining fair value and there were no transfers into or out of Level 3 during the six months ended May 31, 2022.
| C. | Foreign Investment Risk |
The Funds may directly purchase securities of foreign issuers. Investments in non-U.S. issuers may involve unique risks compared to investing in securities of U.S. issuers, including, among others, less liquidity generally, greater market volatility than U.S. securities and less complete financial information than for U.S. issuers. In addition, adverse political, economic or social developments could undermine the value of the Fund’s investments or prevent the Fund from realizing the full value of its investments. Financial reporting standards for companies based in foreign markets differ from those in the United States. Finally, the value of the currency of the country in which the Fund has invested could decline relative to the value of the U.S. dollar, which may affect the value of the investment to U.S. investors. The Fund will not enter into transactions to hedge against declines in the value of the Fund’s assets that are denominated in foreign currency.
Countries with emerging markets may have relatively unstable governments and may present the risks of nationalization of businesses, restrictions on foreign ownership and prohibitions on the repatriation of assets. The economies of emerging markets countries also may be based on only a few industries, making them more vulnerable to changes in local or global trade conditions and more sensitive to debt burdens, inflation rates or adverse news and events.
34 | May 31, 2022
ALPS ETF Trust
| Notes to Financial Statements | May 31, 2022 (Unaudited) |
Because foreign markets may be open on different days than the days during which investors may purchase the shares of the Fund, the value of the Funds’ securities may change on the days when investors are not able to purchase the shares of the Fund. The value of securities denominated in foreign currencies is converted into U.S. dollars using exchange rates determined daily as of the close of regular trading on the NYSE. Any use of a different rate from the rates used by the Index may adversely affect a Fund's ability to track its Index.
| D. | Foreign Currency Translation |
The books and records of the Funds are maintained in U.S. dollars. Investment valuations and other assets and liabilities initially expressed in foreign currencies are converted each business day into U.S. dollars based upon current exchange rates. The portion of realized and unrealized gains or losses on investments due to fluctuations in foreign currency exchange rates is not separately disclosed and is included in realized and unrealized gains or losses on investments, when applicable.
| E. | Securities Transactions and Investment Income |
Securities transactions are recorded as of the trade date. Realized gains and losses from securities transactions are recorded on the specific identification in accordance with GAAP. Dividend income and capital gains distributions, if any, are recorded on the ex-dividend date, net of any foreign taxes withheld. Interest income, if any, is recorded on the accrual basis.
| F. | Dividends and Distributions to Shareholders |
Dividends from net investment income for the ALPS Disruptive Technologies ETF, the ALPS Global Travel Beneficiaries ETF and the ALPS Medical Breakthroughs ETF, if any, are declared and paid annually or as the Board may determine from time to time. Dividends from net investment income for ALPS Clean Energy ETF, if any, are declared and paid quarterly or as the Board may determine from time to time. Distributions of net realized capital gains earned by the Funds, if any, are distributed at least annually.
| G. | Federal Tax and Tax Basis Information |
The timing and character of income and capital gain distributions are determined in accordance with income tax regulations, which may differ from U.S. GAAP. Reclassifications are made to the Funds’ capital accounts for permanent tax differences to reflect income and gains available for distribution (or available capital loss carryforwards) under income tax regulations. The amounts and characteristics of tax basis distributions and composition of distributable earnings/(accumulated losses) are finalized at fiscal year-end; accordingly, tax basis balances have not been determined as of May 31, 2022.
The tax character of the distributions paid during the fiscal year ended November 30, 2021 was as follows:
| Ordinary Income | Long-Term Capital Gain | Return of Capital | ||||||||||
| November 30, 2021 | ||||||||||||
| ALPS Clean Energy ETF | $ | 2,023,844 | $ | – | $ | 3,160,255 | ||||||
| ALPS Disruptive Technologies ETF | 633,863 | – | – | |||||||||
| ALPS Global Travel Beneficiaries ETF | – | – | – | |||||||||
| ALPS Medical Breakthroughs ETF | – | – | – | |||||||||
The character of distributions made during the year may differ from its ultimate characterization for federal income tax purposes.
Under current law, capital losses maintain their character as short-term or long-term and are carried forward to the next tax year without expiration. As of November 30, 2021, the following amounts are available as carry forwards to the next tax year:
| Fund | Short-Term | Long-Term | ||||||
| ALPS Clean Energy ETF | $ | 47,831,913 | $ | – | ||||
| ALPS Disruptive Technologies ETF | 2,798,682 | 1,737,476 | ||||||
| ALPS Global Travel Beneficiaries ETF | 15,333 | – | ||||||
| ALPS Medical Breakthroughs ETF | 44,254,973 | 32,473,807 | ||||||
35 | May 31, 2022
ALPS ETF Trust
| Notes to Financial Statements | May 31, 2022 (Unaudited) |
The ALPS Medical Breakthrough ETF elects to defer to the year ending November 30, 2022, late year ordinary losses in the amount of $774,798.
As of May 31, 2022, the cost of investments for federal income tax purposes and accumulated net unrealized appreciation/(depreciation) on investments were as follows:
| ALPS Clean Energy ETF | ALPS Disruptive Technologies ETF | ALPS Global Travel Beneficiaries ETF | ALPS Medical Breakthroughs ETF | |||||||||||||
| Gross appreciation (excess of value over tax cost) | $ | 74,025,004 | $ | 12,819,020 | $ | 144,730 | $ | 6,767,703 | ||||||||
| Gross depreciation (excess of tax cost over | ||||||||||||||||
| value) | (202,349,695 | ) | (35,029,279 | ) | (1,266,467 | ) | (89,209,649 | |||||||||
| Net unrealized appreciation (depreciation) | $ | (128,324,691 | ) | $ | (22,210,259 | ) | $ | (1,121,737 | ) | $ | (82,441,946 | |||||
| Cost of investments for income tax purposes | $ | 868,217,049 | $ | 172,742,806 | $ | 9,774,224 | $ | 182,401,902 | ||||||||
The differences between book-basis and tax-basis are primarily due to the deferral of losses from wash sales and investments in partnerships. In addition, certain tax cost basis adjustments are finalized at fiscal year-end and therefore have not been determined as of May 31, 2022.
| H. | Income Taxes |
No provision for income taxes is included in the accompanying financial statements, as each Fund intends to distribute to shareholders all taxable investment income and realized gains and otherwise comply with Subchapter M of the Internal Revenue Code of 1986, as amended, applicable to regulated investment companies. Each Fund evaluates tax positions taken (or expected to be taken) in the course of preparing the Fund’s tax returns to determine whether these positions meet a “more-likely-than-not” standard that, based on the technical merits, have a more than fifty percent likelihood of being sustained by a taxing authority upon examination. A tax position that meets the “more-likely-than-not” recognition threshold is measured to determine the amount of benefit to recognize in the financial statements.
As of and during the six months ended May 31, 2022, each Fund did not have a liability for any unrecognized tax benefits. Each Fund files U.S. federal, state, and local tax returns as required. Each Fund’s tax returns are subject to examination by the relevant tax authorities until expiration of the applicable statute of limitations, which is generally three years after the filing of the tax return, but may extend to four years in certain jurisdictions. Tax returns for open years have incorporated no uncertain tax positions that require a provision for income taxes.
| I. | Lending of Portfolio Securities |
The Funds have entered into a securities lending agreement with State Street Bank & Trust Co. (“SSB”), the Funds’ lending agent. Each Fund may lend their portfolio securities only to borrowers that are approved by SSB. Each Fund will limit such lending to not more than 33 1/3% of the value of its total assets. Each Funds’ securities held at SSB as custodian shall be available to be lent except those securities the Fund or ALPS Advisors, Inc. specifically identifies in writing as not being available for lending. The borrower pledges and maintains with each Fund collateral consisting of cash (U.S. Dollars only), securities issued or guaranteed by the U.S. government or its agencies or instrumentalities, and cash equivalents (including irrevocable bank letters of credit) issued by a person other than the borrower or an affiliate of the borrower. The initial collateral received by each Fund is required to have a value of no less than 102% of the market value of the loaned securities for U.S equity securities and a value of no less than 105% of the market value for non-U.S. equity securities. The collateral is maintained thereafter, at a market value equal to not less than 102% of the current value of the U.S. equity securities on loan and not less than 105% of the current value of the non-U.S. equity securities on loan. The market value of the loaned securities is determined at the close of each business day and any additional required collateral is delivered to each Fund on the next business day. During the term of the loan, each Fund is entitled to all distributions made on or in respect of the loaned securities. Loans of securities are terminable at any time and the borrower, after notice, is required to return borrowed securities within the customary time period for settlement of securities transactions.
Any cash collateral received is reinvested in a money market fund managed by SSB as disclosed in the Fund’s Schedule of Investments and is reflected in the Statements of Assets and Liabilities as a payable for collateral upon return of securities loaned. Non-cash collateral, in the form of securities issued or guaranteed by the U.S. government or its agencies or instrumentalities, is not disclosed in a Fund’s Statements of Assets and Liabilities as it is held by the lending agent on behalf of each Fund, and each Fund does not have the ability to re-hypothecate these securities. Income earned by the Fund from securities lending activity is disclosed in the Statement of Operations.
36 | May 31, 2022
ALPS ETF Trust
| Notes to Financial Statements | May 31, 2022 (Unaudited) |
The following is a summary of each Fund's securities lending agreement and related cash and non-cash collateral received as of May 31, 2022:
| Fund | Market Value of Securities on Loan | Cash Collateral Received | Non-Cash Collateral Received | Total Collateral Received | ||||||||||||
| ALPS Clean Energy ETF | $ | 121,262,523 | $ | 75,385,575 | $ | 52,333,546 | $ | 127,719,121 | ||||||||
| ALPS Disruptive Technologies ETF | 2,586,449 | 919,800 | 1,883,770 | 2,803,570 | ||||||||||||
| ALPS Global Travel Beneficiaries ETF | 44,491 | 48,416 | – | 48,416 | ||||||||||||
| ALPS Medical Breakthroughs ETF | 12,117,651 | 6,107,385 | 6,757,341 | 12,864,726 | ||||||||||||
The risks of securities lending include the risk that the borrower may not provide additional collateral when required or may not return the securities when due. To mitigate these risks, each Fund benefits from a borrower default indemnity provided by SSB. SSB’s indemnity allows for full replacement of securities lent wherein SSB will purchase the unreturned loaned securities on the open market by applying the proceeds of the collateral or to the extent such proceeds are insufficient or the collateral is unavailable, SSB will purchase the unreturned loan securities at SSB’s expense. However, the Funds could suffer a loss if the value of the investments purchased with cash collateral falls below the value of the cash collateral received.
The following tables reflect a breakdown of transactions accounted for as secured borrowings, the gross obligation by the type of collateral pledged or securities loaned, and the remaining contractual maturity of those transactions as of May 31, 2022:
| ALPS Clean Energy ETF | Remaining contractual maturity of the agreements | |||||||||||||||||||
| Securities Lending Transactions | Overnight & Continuous | Up to 30 days | 30-90 days | Greater than 90 days | Total | |||||||||||||||
| Common Stocks | $ | 75,385,575 | $ | – | $ | – | $ | – | $ | 75,385,575 | ||||||||||
| Total Borrowings | 75,385,575 | |||||||||||||||||||
| Gross amount of recognized liabilities for securities lending (collateral received) | $ | 75,385,575 | ||||||||||||||||||
| ALPS Disruptive Technologies ETF | Remaining contractual maturity of the agreements | |||||||||||||||||||
| Securities Lending Transactions | Overnight & Continuous | Up to 30 days | 30-90 days | Greater than 90 days | Total | |||||||||||||||
| Common Stocks | $ | 919,800 | $ | – | $ | – | $ | – | $ | 919,800 | ||||||||||
| Total Borrowings | 919,800 | |||||||||||||||||||
| Gross amount of recognized liabilities for securities lending (collateral received) | $ | 919,800 | ||||||||||||||||||
| ALPS Global Travel Beneficiaries ETF | Remaining contractual maturity of the agreements | |||||||||||||||||||
| Securities Lending Transactions | Overnight & Continuous | Up to 30 days | 30-90 days | Greater than 90 days | Total | |||||||||||||||
| Common Stocks | $ | 48,416 | $ | – | $ | – | $ | – | $ | 48,416 | ||||||||||
| Total Borrowings | 48,416 | |||||||||||||||||||
| Gross amount of recognized liabilities for securities lending (collateral received) | $ | 48,416 | ||||||||||||||||||
| ALPS Medical Breakthroughs ETF | Remaining contractual maturity of the agreements | |||||||||||||||||||
| Securities Lending Transactions | Overnight & Continuous | Up to 30 days | 30-90 days | Greater than 90 days | Total | |||||||||||||||
| Common Stocks | $ | 6,107,385 | $ | – | $ | – | $ | – | $ | 6,107,385 | ||||||||||
| Total Borrowings | 6,107,385 | |||||||||||||||||||
| Gross amount of recognized liabilities for securities lending (collateral received) | $ | 6,107,385 | ||||||||||||||||||
| 3. | INVESTMENT ADVISORY FEE AND OTHER AFFILIATED TRANSACTIONS |
ALPS Advisors, Inc. (the “Adviser”) serves as the Funds’ investment adviser pursuant to an Investment Advisory Agreement with the Trust on behalf of each Fund (the “Advisory Agreement”). Pursuant to the Advisory Agreement, each Fund pays the Adviser an annual management fee for the services and facilities it provides, payable on a monthly basis as a percentage of the relevant Fund’s average daily net assets as set out below. From time to time, the Adviser may waive all or a portion of its fee.
37 | May 31, 2022
ALPS ETF Trust
| Notes to Financial Statements | May 31, 2022 (Unaudited) |
| Fund | Advisory Fee |
| ALPS Clean Energy ETF | 0.55% |
| ALPS Disruptive Technologies ETF | 0.50% |
| ALPS Global Travel Beneficiaries ETF | 0.65% |
| ALPS Medical Breakthroughs ETF | 0.50% |
Out of the unitary management fee, the Adviser pays substantially all expenses of each Fund, including licensing fees to the Underlying Index provider, the cost of transfer agency, custody, fund administration, legal, audit, trustees and other services, except for interest expenses, distribution fees or expenses, brokerage expenses, taxes and extraordinary expenses not incurred in the ordinary course of each Fund's business. The Adviser’s unitary management fee is designed to pay substantially all of each Fund's expenses and to compensate the Adviser for providing services for each Fund.
ALPS Fund Services, Inc., an affiliate of the Adviser, is the administrator for the Funds.
Prior to February 16, 2022, each Trustee received (1) a quarterly retainer of $10,000, (2) a per meeting fee of $5,000, (3) $1,500 for any special meeting held outside of a regularly scheduled board meeting, and (4) reimbursement for all reasonable out-of-pocket expenses relating to attendance at meetings. In addition, the Chairman of the Board and Chairman of the Audit Committee each received a quarterly retainer of $2,000, in connection with their respective roles. Effective February 16, 2022, each Trustee receives (1) a quarterly retainer of $20,000, (2) a per meeting fee of $10,000, (3) $2,500 for any special meeting held outside of a regularly scheduled board meeting, and (4) reimbursement for all reasonable out-of-pocket expenses relating to attendance at meetings. In addition, the Chairman of the Board receives a quarterly retainer of $5,000, the Chairman of the Audit Committee receives a quarterly retainer of $3,000, and the Chairman of the Nominating & Governance Committee receives a quarterly retainer of $2,000, each in connection with their respective roles.
| 4. | PURCHASES AND SALES OF SECURITIES |
For the six months ended May 31, 2022, the cost of purchases and proceeds from sales of investment securities, excluding short-term investments and in-kind transactions, were as follows:
| Fund | Purchases | Sales | ||||||
| ALPS Clean Energy ETF | $ | 227,565,502 | $ | 226,716,621 | ||||
| ALPS Disruptive Technologies ETF | 31,378,968 | 31,980,213 | ||||||
| ALPS Global Travel Beneficiaries ETF | 1,958,907 | 1,861,571 | ||||||
| ALPS Medical Breakthroughs ETF | 63,637,676 | 63,747,143 | ||||||
For the six months ended May 31, 2022, the cost of in-kind purchases and proceeds from in-kind sales were as follows:
| Fund | Purchases | Sales | ||||||
| ALPS Clean Energy ETF | $ | 86,099,314 | $ | 151,620,937 | ||||
| ALPS Disruptive Technologies ETF | 14,720,020 | 48,006,103 | ||||||
| ALPS Global Travel Beneficiaries ETF | 5,986,686 | 4,512,152 | ||||||
| ALPS Medical Breakthroughs ETF | 7,288,883 | 32,332,607 | ||||||
For the six months ended May 31, 2022, the in-kind net realized gains/(losses) were as follows:
| Fund | Net Realized Gain/(Loss) | |||
| ALPS Clean Energy ETF | $ | 42,583,011 | ||
| ALPS Disruptive Technologies ETF | 14,898,105 | |||
| ALPS Global Travel Beneficiaries ETF | 230,239 | |||
| ALPS Medical Breakthroughs ETF | (5,725,325 | ) | ||
Gains on in-kind transactions are not considered taxable for federal income tax purposes and losses on in-kind transactions are also not deductible for tax purposes.
38 | May 31, 2022
ALPS ETF Trust
| Notes to Financial Statements | May 31, 2022 (Unaudited) |
| 5. | CAPITAL SHARE TRANSACTIONS |
Shares are created and redeemed by each Fund only in Creation Unit size aggregations of 25,000 Shares. Only broker-dealers or large institutional investors with creation and redemption agreements called Authorized Participants (“AP”) are permitted to purchase or redeem Creation Units from the Funds. Such transactions are generally permitted on an in-kind basis, with a balancing cash component to equate the transaction to the NAV per unit of each Fund on the transaction date. Cash may be substituted equivalent to the value of certain securities generally when they are not available in sufficient quantity for delivery, not eligible for trading by the AP or as a result of other market circumstances.
| 6. | MARKET RISK |
The Funds are subject to investment and operational risks associated with financial, economic and other global market developments and disruptions, including the recent spread of an infectious respiratory illness caused by a novel strain of coronavirus (known as COVID-19), which can negatively impact the securities markets and cause each Fund to lose value. Securities in each Fund's portfolio may underperform in comparison to securities in general financial markets, a particular financial market or other asset classes due to a number of factors, including inflation (or expectations for inflation), deflation (or expectations for deflation), interest rates, global demand for particular products or resources, market instability, debt crises and downgrades, embargoes, tariffs, sanctions and other trade barriers, regulatory events, other governmental trade or market control programs and related geopolitical events. In addition, the value of the Fund's investments may be negatively affected by the occurrence of global events such as war, terrorism, environmental disasters, natural disasters or events, country instability, and infectious disease epidemics or pandemics.
The spread of COVID-19 has caused volatility, severe market dislocations and liquidity constraints in many markets, including markets for the securities each Fund holds, and may adversely affect each Fund’s investments and operations. The transmission of COVID-19 and efforts to contain its spread have resulted in travel restrictions and disruptions, closed international borders, enhanced health screenings at ports of entry and elsewhere, disruption of and delays in healthcare service preparation and delivery, quarantines, event and service cancellations or interruptions, disruptions to business operations and supply chains, and a reduction in consumer and business spending, as well as general concern and uncertainty that has negatively affected the economy. These disruptions have led to instability in the market place and the jobs market. The impact of COVID-19 could adversely affect the economies of many nations or the entire global economy, the financial well-being and performance of individual issuers, borrowers and sectors and the health of the markets generally in potentially significant and unforeseen ways.
The foregoing could lead to a significant economic downturn or recession, increased market volatility, a greater number of market closures, higher default rates and adverse effects on the values and liquidity of each Fund’s securities or other assets. Such impacts may adversely affect the performance of the Funds.
| 7. | SUBSEQUENT EVENTS |
Effective as of the close of business on March 31, 2022, Deloitte & Touche LLP (“Deloitte”) resigned as the independent registered public accounting firm for the Funds. The report of Deloitte on the Funds' financial statements as of and for the fiscal years or periods ended November 30, 2021 and November 30, 2020 did not contain an adverse opinion or a disclaimer of opinion, and was not qualified or modified as to uncertainties, audit scope or accounting principles. During the Funds' fiscal year or period ended November 30, 2021 and November 30, 2020, and through March 31, 2022, there were no disagreements between the Funds and Deloitte on any matter of accounting principles or practices, financial statement disclosure or auditing scope or procedure, which disagreements, if not resolved to the satisfaction of Deloitte, would have caused it to make reference to the subject matter of the disagreements in its report on the financial statements of the Funds for such year or period. During the Funds' fiscal years or periods ended November 30, 2021 and November 30, 2020, there were no “reportable events” (as defined in Item 304(a)(1)(v) of Regulation S-K under the Securities Exchange Act of 1934, as amended (the “Exchange Act”)).
During each Fund's fiscal year or period ended November 30, 2021 and November 30, 2020, and during the subsequent interim period through March 31, 2022, neither the Funds, nor anyone on their behalf, consulted with Deloitte, on behalf of the Funds, regarding any matter that was either the subject of a “disagreement,” as defined in Item 304(a)(1)(iv) of Regulation S-K under the Securities Exchange Act of 1934, as amended (the “Exchange Act”), and the instructions thereto, or a “reportable event,” as defined in Item 304(a)(1)(v) of Regulation S-K under the Exchange Act.
On June 21, 2022, upon the recommendation of the Funds' Audit Committee, the Board of Trustees of the Funds approved the engagement of BBD, LLP (“BBD”) as the independent registered public accounting firm for each Fund for the fiscal year ending November 30, 2022. The Board and its Audit Committee considered the engagement of BBD in connection with the resignation of the Funds' former independent registered accounting firm on March 31, 2022.
39 | May 31, 2022
ALPS ETF Trust
| Additional Information | May 31, 2022 (Unaudited) |
PROXY VOTING RECORDS, POLICIES AND PROCEDURES
Information regarding how each Fund voted proxies relating to portfolio securities during the most recent 12-month period ended June 30 and a description of the Fund’s proxy voting policies and procedures used in determining how to vote for proxies are available without charge on the SEC’s website at www.sec.gov and upon request, by calling (toll-free) 1-866-759-5679.
PORTFOLIO HOLDINGS
The Fund files a complete schedule of portfolio holdings with the U.S. Securities and Exchange Commission (“SEC”) for the first and third quarters of each fiscal year on Form N-PORT within 60 days after the end of the period. Copies of the Fund’s Form N-PORT are available without a charge, upon request, by contacting the Fund at 1-866-759-5679 and on the SEC’s website at https://www.sec.gov.
TAX INFORMATION
The Funds designate the following as a percentage of taxable ordinary income distributions, or up to the maximum amount allowable, for the calendar year ended December 31, 2021:
| Qualified Dividend Income | Dividend Received Deduction | |||||||
| ALPS Clean Energy ETF | 76.58 | % | 15.40 | % | ||||
| ALPS Disruptive Technologies ETF | 100.00 | % | 100.00 | % | ||||
| ALPS Global Travelers Beneficiaries ETF | 77.73 | % | 28.51 | % | ||||
| ALPS Medical Breakthroughs ETF | 0.00 | % | 0.00 | % | ||||
In early 2022, if applicable, shareholders of record received this information for the distributions paid to them by the Funds during the calendar year 2021 via Form 1099. The Funds will notify shareholders in early 2023 of amounts paid to them by the Funds, if any, during the calendar year 2022.
LICENSING AGREEMENT
ALPS Clean Energy ETF
CIBC NTC is the designer of the construction and methodology for the Underlying Index. “CIBC NTC” and “CIBC Atlas Clean Energy Index” are service marks or trademarks of the Index Provider. CIBC NTC acts as brand licensor for the Underlying Index and is not responsible for the descriptions of the Fund that appear herein.
The Fund is not sponsored by CIBC NTC or any of its affiliates. CIBC NTC makes no representation or warranty, express or implied, to the owners of the Fund or any member of the public regarding the advisability of investing in securities or commodities generally or in the Fund particularly. CIBC NTC does not guarantee the quality, accuracy or completeness of the Underlying Index or any Underlying Index data included herein or derived therefrom and assumes no liability in connection with their use. The Underlying Index is determined and composed without regard to the Adviser or the Fund. CIBC NTC has no obligation to take the needs of the Adviser, the Fund or the shareholders of the Fund into consideration in determining, composing or calculating the Underlying Index. CIBC NTC is not responsible for and has not participated in the determination of the timing of, prices at, or quantities of the Fund to be issued or in the determination or calculation of the equation by which the Fund is to be converted into cash. CIBC NTC has no obligation or liability in connection with the administration, marketing or trading of the Fund and is not responsible for and has not participated in the determination of pricing or the timing of the issuance or sale of the Shares of the Fund or in the determination or calculation of the NAV of the Fund.
CIBC NTC has no obligation or liability in connection with the administration, marketing or trading of the Fund. CIBC NTC makes no warranty, express or implied, as to results to be obtained by the Adviser, the Fund, Fund shareholders or any other person or entity from the use of the Underlying Index or any data included therein. CIBC NTC makes no express or implied warranties, and expressly disclaims all warranties of merchantability or fitness for a particular purpose or use with respect to the Underlying Index or any data included therein. Without limiting any of the foregoing, in no event shall CIBC NTC have any liability for any special, punitive, indirect, or consequential damages (including lost profits) arising out of matters relating to the use of the Underlying Index, even if notified of the possibility of such damages.
All intellectual property rights in the Underlying Index vests in CIBC NTC.
40 | May 31, 2022
ALPS ETF Trust
| Additional Information | May 31, 2022 (Unaudited) |
The Underlying Index is the property of CIBC NTC, which has contracted with S&P Opco, LLC (a subsidiary of S&P Dow Jones Indices LLC) to calculate and maintain the Underlying Index. The Underlying Index is not sponsored by S&P Dow Jones Indices or its affiliates or its third party licensors (collectively, “S&P Dow Jones Indices”). S&P Dow Jones Indices will not be liable for any errors or omissions in calculating the Underlying Index. “Calculated by S&P Dow Jones Indices” and the related stylized mark(s) are service marks of S&P Dow Jones Indices and have been licensed for use by CIBC NTC. S&P® is a registered trademark of Standard & Poor’s Financial Services LLC (“SPFS”), and Dow Jones® is a registered trademark of Dow Jones Trademark Holdings LLC (“Dow Jones”).
The Fund is not sponsored, endorsed, sold or promoted by S&P Dow Jones Indices. S&P Dow Jones Indices does not make any representation or warranty, express or implied, to the owners of the Fund or any member of the public regarding the advisability of investing in securities generally or in the Fund particularly or the ability of the Underlying Index to track general market performance. S&P Dow Jones Indices’ only relationship to CIBC NTC with respect to the Underlying Index is the licensing of certain trademarks, service marks and trade names of S&P Dow Jones Indices, and the provision of the calculation services related to the Underlying Index. S&P Dow Jones Indices is not responsible for and has not participated in the determination of the prices and amount of the Fund or the timing of the issuance or sale of the Fund or in the determination or calculation of the equation by which the Fund may be converted into cash or other redemption mechanics. S&P Dow Jones Indices has no obligation or liability in connection with the administration, marketing or trading of the Fund. S&P Dow Jones Indices LLC is not an investment advisor. Inclusion of a security within the Underlying Index is not a recommendation by S&P Dow Jones Indices to buy, sell, or hold such security, nor is it investment advice.
S&P DOW JONES INDICES DOES NOT GUARANTEE THE ADEQUACY, ACCURACY, TIMELINESS AND/OR THE COMPLETENESS OF THE UNDERLYING INDEX OR ANY DATA RELATED THERETO OR ANY COMMUNICATION WITH RESPECT THERETO, INCLUDING, ORAL, WRITTEN, OR ELECTRONIC COMMUNICATIONS. S&P DOW JONES INDICES SHALL NOT BE SUBJECT TO ANY DAMAGES OR LIABILITY FOR ANY ERRORS, OMISSIONS, OR DELAYS THEREIN. S&P DOW JONES INDICES MAKES NO EXPRESS OR IMPLIED WARRANTIES, AND EXPRESSLY DISCLAIMS ALL WARRANTIES, OF MERCHANTABILITY OR FITNESS FOR A PARTICULAR PURPOSE OR USE OR AS TO RESULTS TO BE OBTAINED BY CIBC NTC, OWNERS OF THE FUND, OR ANY OTHER PERSON OR ENTITY FROM THE USE OF THE UNDERLYING INDEX OR WITH RESPECT TO ANY DATA RELATED THERETO. WITHOUT LIMITING ANY OF THE FOREGOING, IN NO EVENT WHATSOEVER SHALL S&P DOW JONES INDICES BE LIABLE FOR ANY INDIRECT, SPECIAL, INCIDENTAL, PUNITIVE, OR CONSEQUENTIAL DAMAGES, INCLUDING BUT NOT LIMITED TO, LOSS OF PROFITS, TRADING LOSSES, LOST TIME, OR GOODWILL, EVEN IF THEY HAVE BEEN ADVISED OF THE POSSIBILITY OF SUCH DAMAGES, WHETHER IN CONTRACT, TORT, STRICT LIABILITY, OR OTHERWISE.
The Index Provider is not affiliated with the Trust, the Adviser or ALPS Portfolio Solutions Distributor, Inc. (the “Distributor”). The Index Provider has entered into a license agreement with the Adviser (the “License Agreement”). The use of the Underlying Index by the Adviser and the Fund is subject to the terms of the License Agreement, which impose certain limitations and conditions on the Fund’s ability to use the Underlying Index.
The Adviser does not guarantee the accuracy and/or the completeness of the Underlying Index or any data included therein, and the Adviser shall have no liability for any errors, omissions or interruptions therein. The Adviser makes no warranty, express or implied, as to results to be obtained by the Fund, owners of the Shares of the Fund or any other person or entity from the use of the Underlying Index or any data included therein. The Adviser makes no express or implied warranties, and expressly disclaims all warranties of merchantability or fitness for a particular purpose or use with respect to the Underlying Index or any data included therein. Without limiting any of the foregoing, in no event shall the Adviser have any liability for any special, punitive, direct, indirect, or consequential damages (including lost profits) arising out of matters relating to the use of the Underlying Index, even if notified of the possibility of such damages.
ALPS Disruptive Technologies ETF
“Indxx” is a service mark of Indxx, LLC (“Indxx” or the “Index Provider”) and has been licensed for use for certain purposes by ALPS Advisors, Inc. (the “Adviser”).
The ALPS Disruptive Technologies ETF is not sponsored, endorsed, sold or promoted by Indxx. Indxx makes no representation or warranty, express or implied, to the owners of the ALPS Disruptive Technologies ETF or any member of the public regarding the advisability of investing in securities generally or in the ALPS Disruptive Technologies ETF particularly. Indxx has no obligation to take the needs of ALPS Advisors, Inc. or the shareholders of ALPS Disruptive Technologies ETF into consideration in determining, composing, or calculating the Underlying Index. Indxx is not responsible for and has not participated in the determination of the timing, amount or pricing of the ALPS Disruptive Technologies ETF shares to be issued or in the determination or calculation of the equation by which the ALPS Disruptive Technologies ETF is to be converted into cash. Indxx has no obligation or liability in connection with the administration, marketing or trading of the ALPS Disruptive Technologies ETF.
INDXX MAKES NO WARRANTY, EXPRESS OR IMPLIED, AS TO THE RESULTS TO BE OBTAINED BY ANY PERSON OR ENTITY FROM THE USE OF THE INDEX(ES), TRADING BASED ON THE INDEX(ES), OR ANY DATA INCLUDED THEREIN IN CONNECTION WITH THE PRODUCTS, OR FOR ANY OTHER USE. INDXX EXPRESSLY DISCLAIMS ALL WARRANTIES AND CONDITIONS, EXPRESS, STATUTORY, OR IMPLIED, EXCEPT AS SET FORTH IN THIS AGREEMENT. EXCEPT AS OTHERWISE SPECIFICALLY SET FORTH IN THIS AGREEMENT, INDXX HEREBY EXPRESSLY DISCLAIMS ALL IMPLIED WARRANTIES AND CONDITIONS OF MERCHANTABILITY, TITLE, OR FITNESS FOR A PARTICULAR PURPOSE OR USE WITH RESPECT TO THE INDEX(ES) OR ANY DATA INCLUDED THEREIN. INDXX DOES NOT GUARANTEE THE ACCURACY AND/OR THE COMPLETENESS OF ANY DATA SUPPLIED BY IT OR ANY DATA INCLUDED THEREIN. INDXX MAKES NO WARRANTY, EXPRESS OR IMPLIED, AS TO RESULTS TO BE OBTAINED BY THE FUNDS, ITS SHAREHOLDERS OR AFFILIATES, OR ANY OTHER PERSON OR ENTITY FROM THE USE OF THE DATA SUPPLIED BY INDXX OR ANY DATA INCLUDED THEREIN. INDXX MAKES NO EXPRESS OR IMPLIED WARRANTIES, AND EXPRESSLY DISCLAIMS ALL WARRANTIES OF MERCHANTABILITY OR FITNESS FOR A PARTICULAR PURPOSE OR USE WITH RESPECT TO THE DATA SUPPLIED BY INDXX OR ANY DATA INCLUDED THEREIN. WITHOUT LIMITING ANY OF THE FOREGOING, IN NO EVENT SHALL INDXX HAVE ANY LIABILITY FOR ANY SPECIAL, PUNITIVE, INDIRECT, OR CONSEQUENTIAL DAMAGES (INCLUDING LOST PROFITS), EVEN IF NOTIFIED OF THE POSSIBILITY OF SUCH DAMAGES.
41 | May 31, 2022
ALPS ETF Trust
| Additional Information | May 31, 2022 (Unaudited) |
The Adviser does not guarantee the accuracy and/or the completeness of the Underlying Index or any data included therein, and the Adviser shall have no liability for any errors, omissions or interruptions therein. The Adviser makes no warranty, express or implied, as to results to be obtained by the Fund, owners of the Shares of the Fund or any other person or entity from the use of the Underlying Index or any data included therein. Adviser makes no express or implied warranties, and expressly disclaims all warranties of merchantability or fitness for a particular purpose or use with respect to the Underlying Index or any data included therein. Without limiting any of the foregoing, in no event shall the Adviser have any liability for any special, punitive, direct, indirect or consequential damages (including lost profits) arising out of matters relating to the use of the Underlying Index, even if notified of the possibility of such damages.
ALPS Global Travel Beneficiaries ETF
S-Network and S-Network Global Travel Index are service marks of S-Network Global Indexes, Inc. ("S-Network") and have been licensed for use by the ALPS Advisors, Inc. (“ALPS”). The Fund is not issued, sponsored, endorsed, sold or promoted by S-Network or its affiliates. S-Network makes no representation or warranty, express or implied, to the purchasers or owners of the Fund or any member of the public regarding the advisability of investing in securities generally or in the Fund particularly or the ability of the Index to track general market performance. S-Network's only relationship to the Fund is the licensing of the service marks and the Index, which is determined, composed and calculated by S-Network without regard to ALPS or the Fund. S-Network is not responsible for and has not participated in the determination of the timing of, prices at, or quantities of the Fund issued by ALPS. S-Network has no obligation or liability in connection with the issuance, administration, marketing or trading of the Fund.
S-NETWORK DOES NOT GUARANTEE THE ACCURACY AND/OR THE COMPLETENESS OF THE S-NETWORK GLOBAL TRAVEL INDEX OR ANY DATA INCLUDED THEREIN AND S-NETWORK SHALL HAVE NO LIABILITY FOR ANY ERRORS, OMISSIONS, OR INTERRUPTIONS THEREIN. S-NETWORK MAKES NO WARRANTY, EXPRESS OR IMPLIED, AS TO RESULTS TO BE OBTAINED BY LICENSEE, OWNERS OF THE FUND, OR ANY OTHER PERSON OR ENTITY FROM THE USE OF THE S-NETWORK GLOBAL TRAVEL INDEX OR ANY DATA INCLUDED THEREIN. S-NETWORK MAKES NO EXPRESS OR IMPLIED WARRANTIES, AND EXPRESSLY DISCLAIMS ALL WARRANTIES OF MERCHANTABILITY OR FITNESS FOR A PARTICULAR PURPOSE OR USE WITH RESPECT TO THE S-NETWORK GLOBAL TRAVEL INDEX OR ANY DATA INCLUDED THEREIN. WITHOUT LIMITING ANY OF THE FOREGOING, UNLESS ARISING AS A RESULT OF S-NETWORK'S (i) GROSS NEGLIGENCE OR WILLFUL MISCONDUCT, (ii) BREACH OF ITS CONFIDENTIALITY OBLIGATIONS: OR (iii) INDEMNIFICATION OBLIGATIONS, S-NETWORK SHALL NOT HAVE ANY LIABILITY FOR ANY SPECIAL, PUNITIVE, INDIRECT, OR CONSEQUENTIAL DAMAGES (INCLUDING LOST PROFITS), EVEN IF NOTIFIED OF THE POSSIBILITY OF SUCH DAMAGES.
The Adviser does not guarantee the accuracy and/or the completeness of the Underlying Index or any data included therein, and the Adviser shall have no liability for any errors, omissions or interruptions therein. The Adviser makes no warranty, express or implied, as to results to be obtained by the Fund, owners of the Shares of the Fund or any other person or entity from the use of the Underlying Index or any data included therein. The Adviser makes no express or implied warranties, and expressly disclaims all warranties of merchantability or fitness for a particular purpose or use with respect to the Underlying Index or any data included therein. Without limiting any of the foregoing, in no event shall the Adviser have any liability for any special, punitive, direct, indirect or consequential damages (including lost profits) arising out of matters relating to the use of the Underlying Index even if notified of the possibility of such damages.
ALPS Medical Breakthroughs ETF
The Fund is not sponsored, endorsed, sold or promoted by S-Network Global Indexes, Inc. (“Licensor”). Licensor makes no representation or warranty, express or implied, to the owners of the Fund or any member of the public regarding the advisability of investing in securities generally or in the Fund particularly or the ability of the Underlying Index to track the performance of the physical commodities market. Licensor’s only relationship to the Licensee is the licensing of certain service marks and trade names of Licensor and of the Underlying Index that is determined, composed and calculated by Licensor without regard to the Licensee or the Fund. Licensor has no obligation to take the needs of the Licensee or the owners of the Fund into consideration in determining, composing or calculating the Underlying Index. Licensor is not responsible for and has not participated in the determination of the timing of, prices at, or quantities of the Fund to be issued or in the determination or calculation of the equation by which the Fund is to be converted into cash. Licensor has no obligation or liability in connection with the administration, marketing or trading of the Fund.
LICENSOR DOES NOT GUARANTEE THE ACCURACY AND/OR THE COMPLETENESS OF THE UNDERLYING INDEX OR ANY DATA INCLUDED THEREIN AND LICENSOR SHALL HAVE NO LIABILITY FOR ANY ERRORS, OMISSIONS, OR INTERRUPTIONS THEREIN. LICENSOR MAKES NO WARRANTY, EXPRESS OR IMPLIED, AS TO RESULTS TO BE OBTAINED BY LICENSEE, OWNERS OF THE FUND, OR ANY OTHER PERSON OR ENTITY FROM THE USE OF THE UNDERLYING INDEX OR ANY DATA INCLUDED THEREIN. LICENSOR MAKES NO EXPRESS OR IMPLIED WARRANTIES, AND EXPRESSLY DISCLAIMS ALL WARRANTIES OF MERCHANTABILITY OR FITNESS FOR A PARTICULAR PURPOSE OR USE WITH RESPECT TO THE UNDERLYING INDEX OR ANY DATA INCLUDED THEREIN. WITHOUT LIMITING ANY OF THE FOREGOING, IN NO EVENT SHALL LICENSOR HAVE ANY LIABILITY FOR ANY SPECIAL, PUNITIVE, INDIRECT, OR CONSEQUENTIAL DAMAGES (INCLUDING LOST PROFITS), EVEN IF NOTIFIED OF THE POSSIBILITY OF SUCH DAMAGES.
42 | May 31, 2022
ALPS ETF Trust
| Additional Information | May 31, 2022 (Unaudited) |
Standard & Poor’s Custom Indexes serves as calculation agent for the Index. The Fund is not sponsored, endorsed, sold or promoted by Standard & Poor’s, a division of The McGraw-Hill Companies, Inc. (“S&P”) or its third party licensors. Neither S&P nor its third party licensors make any representation or warranty, express or implied, to the owners of the Fund or any member of the public regarding the advisability of investing in securities generally or in the Fund particularly or the ability of the Underlying Index to track general stock market performance. S&P’s and its third party licensor’s only relationship to S-Network Global Indexes, Inc. is the licensing of certain trademarks, service marks and trade names of S&P and/or its third party licensors and for the providing of calculation and maintenance services related to the Underlying Index. Neither S&P nor its third party licensors is responsible for and has not participated in the determination of the prices and amount of the Fund or the timing of the issuance or sale of the Fund or in the determination or calculation of the equation by which the Fund is to be converted into cash. S&P has no obligation or liability in connection with the administration, marketing or trading of the Fund.
NEITHER S&P, ITS AFFILIATES NOR THEIR THIRD PARTY LICENSORS GUARANTEE THE ADEQUACY, ACCURACY, TIMELINESS OR COMPLETENESS OF THE UNDERLYING INDEX OR ANY DATA INCLUDED THEREIN OR ANY COMMUNICATIONS, INCLUDING BUT NOT LIMITED TO, ORAL OR WRITTEN COMMUNICATIONS (INCLUDING ELECTRONIC COMMUNICATIONS) WITH RESPECT THERETO. S&P, ITS AFFILIATES AND THEIR THIRD PARTY LICENSORS SHALL NOT BE SUBJECT TO ANY DAMAGES OR LIABILITY FOR ANY ERRORS, OMISSIONS OR DELAYS THEREIN. S&P MAKES NO EXPRESS OR IMPLIED WARRANTIES, AND EXPRESSLY DISCLAIMS ALL WARRANTIES OF MERCHANTABILITY OR FITNESS FOR A PARTICULAR PURPOSE OR USE WITH RESPECT TO ITS TRADEMARKS, THE UNDERLYING INDEX OR ANY DATA INCLUDED THEREIN. WITHOUT LIMITING ANY OF THE FOREGOING, IN NO EVENT WHATSOEVER SHALL S&P, ITS AFFILIATES OR THEIR THIRD PARTY LICENSORS BE LIABLE FOR ANY INDIRECT, SPECIAL, INCIDENTAL, PUNITIVE OR CONSEQUENTIAL DAMAGES, INCLUDING BUT NOT LIMITED TO, LOSS OF PROFITS, TRADING LOSSES, LOST TIME OR GOODWILL, EVEN IF THEY HAVE BEEN ADVISED OF THE POSSIBILITY OF SUCH DAMAGES, WHETHER IN CONTRACT, TORT, STRICT LIABILITY OR OTHERWISE.
Standard & Poor’s®, and S&P® are registered trademarks of The McGraw-Hill Companies, Inc.; “Calculated by S&P Custom Indices” and its related stylized mark are service marks of The McGraw-Hill Companies, Inc. These marks have been licensed for use by S-Network Global Indexes, Inc.
The Adviser does not guarantee the accuracy and/or the completeness of the Underlying Index or any data included therein, and the Adviser shall have no liability for any errors, omissions or interruptions therein. The Adviser makes no warranty, express or implied, as to results to be obtained by the Fund, owners of the Shares of the Fund or any other person or entity from the use of the Underlying Index or any data included therein. The Adviser makes no express or implied warranties, and expressly disclaims all warranties of merchantability or fitness for a particular purpose or use with respect to the Underlying Index or any data included therein. Without limiting any of the foregoing, in no event shall the Adviser have any liability for any special, punitive, direct, indirect, or consequential damages (including lost profits) arising out of matters relating to the use of the Underlying Index, even if notified of the possibility of such damages.
43 | May 31, 2022
ALPS ETF Trust
| Liquidity Risk Management Program | May 31, 2022 (Unaudited) |
In compliance with the Securities and Exchange Commission’s liquidity risk management rule (the “Liquidity Rule”), the ALPS ETF Trust (the “Trust”) has established a liquidity risk management program (the “Program”) to govern the Trust’s approach to managing liquidity risk for each series of the Trust (each a “Fund”). The Program is overseen by the Liquidity Committee (the “Committee”), a committee comprised of representatives of the Trust’s investment adviser, ALPS Advisors, Inc. The Trust’s Board of Trustees (the “Board”) has approved the designation of the Committee to oversee the Program.
The Program’s principal objectives include supporting each Fund’s compliance with limits on investments in illiquid assets and assessing and managing the risk that a Fund will be unable to meet its redemption obligations without significant dilution of remaining investors’ interests in the Fund. The Program includes a number of elements that support the management and assessment of liquidity risk, including an annual assessment of factors that influence a Fund’s liquidity and, for Funds that are not “In-Kind ETFs,” the periodic classification and re-classification of such Fund’s investments into groupings that reflect the Committee’s assessment of their liquidity under current market conditions.
At a meeting of the Board held on March 7, 2022, the Trustees received a report from the Committee regarding the design and operational effectiveness of the Program for the period January 1, 2021 through December 31, 2021 (the “Period”). The Committee determined, and reported to the Board, that the Program has been operating effectively to assess and manage each Fund’s liquidity risk and has been and continues to be adequately and effectively implemented to monitor and (as applicable) respond to the Funds’ liquidity developments.
The Committee reported that during the period covered by the report, there were no liquidity events that impacted the Funds or their ability to timely meet redemptions without dilution to existing shareholders. The report also discussed notable events affecting liquidity over the Period, including extended market holidays and closures in certain countries. Among other things, the Committee’s report noted that no Fund is required to have a highly liquid investment minimum based either on its status as an In-Kind ETF or on its ability to rely on another exemption under the Liquidity Rule. The Committee’s report further noted that no material changes have been made to the Program since its implementation.
44 | May 31, 2022


Table of Contents
| Performance Overview | 1 |
| Disclosure of Fund Expenses | 10 |
| Financial Statements | |
| Schedule of Investments | 11 |
| Statements of Assets and Liabilities | 17 |
| Statements of Operations | 18 |
| Statements of Changes in Net Assets | 19 |
| Financial Highlights | 23 |
| Notes to Financial Statements | 27 |
| Additional Information | 35 |
| Liquidity Risk Management Program | 37 |
alpsfunds.com
ALPS Sector Dividend Dogs ETF
| Performance Overview | May 31, 2022 (Unaudited) |
Investment Objective
The ALPS Sector Dividend Dogs ETF (the “Fund” or “SDOG”) seeks investment results that replicate as closely as possible, before fees and expenses, the performance of the S-Network® Sector Dividend Dogs Index (the “Underlying Index”).
The Underlying Index is a rules based index intended to give investors a means of tracking the overall performance of the highest dividend paying stocks (i.e. “Dividend Dogs”) in the S&P 500® Total Return Index (“SPX”) on a sector-by-sector basis. “Dividend Dogs” refers to the five stocks in each of the Global Industry Classification Standard (“GICS”) sectors, excluding the real estate sector, that make up the S&P 500® Total Return Index which offer the highest dividend yields.
Performance (as of May 31, 2022)
| 6 Months | 1 Year | 5 Year | Since Inception^ | |
| ALPS Sector Dividend Dogs ETF – NAV | 13.00% | 6.42% | 9.78% | 12.48% |
| ALPS Sector Dividend Dogs ETF – Market Price* | 13.05% | 6.38% | 9.78% | 12.48% |
| S-Network® Sector Dividend Dogs Total Return Index | 13.30% | 6.86% | 10.26% | 13.00% |
| S&P 500® Total Return Index | -8.85% | -0.30% | 13.38% | 14.05% |
Total Expense Ratio (per the current prospectus) 0.40%.
Performance data quoted represents past performance. Past performance does not guarantee future results. Total return figures assume reinvestment of dividends and capital gains distributions, if any. The table does not reflect the deduction of taxes that a shareholder would pay on Fund distributions or the redemption of Fund shares. Investment return and principal value of an investment will fluctuate so that an investor’s shares, when sold or redeemed, may be worth more or less than the original cost. Current performance data may be higher or lower than actual data quoted. For the most current month-end performance data please visit www.alpsfunds.com or call 1.866.675.2639.
NAV is an exchange-traded fund’s per-share value. The per-share dollar amount of the Fund is derived by dividing the total value of all the securities in its portfolio, less any liabilities, by the number of Fund shares outstanding. Market Price is the price at which a share can currently be traded in the market. Information detailing the number of days the Market Price of the Fund was greater than the Fund’s NAV and the number of days it was less than the Fund’s NAV can be obtained at www.alpsfunds.com.
| ^ | The Fund Commencement Date was June 29, 2012. |
| * | Market Price means the official closing price of a share or, if it more accurately reflects the market value of a share at the time as of which the Fund calculates current net asset value per share, the price that is the midpoint of the bid-ask spread as of that time. It does not represent the returns an investor would receive if shares were traded at other times. |
The S-Network® Sector Dividend Dogs Total Return Index is designed to serve as a fair, impartial and transparent measure of the performance of US large cap equities with above average dividend yields. The Underlying Index is a portfolio of fifty stocks derived from the S&P 500® Index. The index is reported on a total return basis, which assumes reinvestment of any dividends and distributions realized during a given time period.
The S&P 500® Total Return Index is an index of 500 stocks chosen for market size, liquidity and industry grouping among other factors. Total return assumes reinvestment of any dividends and distributions realized during a given time period.
The indexes are not actively managed and do not reflect any deductions for fees, expenses or taxes. One cannot invest directly in an index. Index performance does not reflect fund performance.
The Fund’s shares are not individually redeemable. Investors buy and sell shares of the Fund on a secondary market. Only market makers or “authorized participants” may trade directly with the Fund, typically in blocks of 25,000 shares.
The ALPS Sector Dividend Dogs ETF is not suitable for all investors. Investments in the Fund are subject to investment risks, including possible loss of the principal amount invested.
ALPS Portfolio Solutions Distributor, Inc., a FINRA member, is the distributor for the ETF.
1 | May 31, 2022
ALPS Sector Dividend Dogs ETF
| Performance Overview | May 31, 2022 (Unaudited) |
Top 10 Holdings* (as of May 31, 2022)
| Valero Energy Corp. | 2.74% |
| Amcor PLC | 2.33% |
| AT&T, Inc. | 2.32% |
| Philip Morris International, Inc. | 2.32% |
| Williams Cos., Inc. | 2.25% |
| PPL Corp. | 2.23% |
| Lumen Technologies, Inc. | 2.22% |
| International Paper Co. | 2.22% |
| Exxon Mobil Corp. | 2.19% |
| Amgen, Inc. | 2.18% |
| Total % of Top 10 Holdings | 23.00% |
| * | % of Total Investments |
Future holdings are subject to change.
Sector Allocation* (as of May 31, 2022)
| Energy | 11.24% |
| Materials | 10.57% |
| Health Care | 10.47% |
| Utilities | 10.40% |
| Consumer Staples | 10.27% |
| Communication Services | 10.21% |
| Industrials | 10.15% |
| Consumer Discretionary | 9.38% |
| Information Technology | 9.35% |
| Financials | 7.87% |
| Money Market Fund | 0.09% |
| Total | 100.00% |
Growth of $10,000 (as of May 31, 2022)
Comparison of Change in Value of $10,000 Investment in the Fund and the Indexes
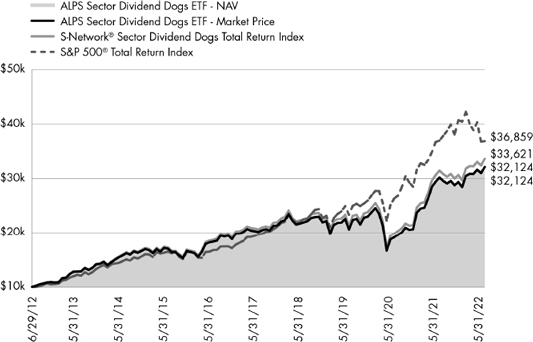
The chart above compares historical performance of a hypothetical investment of $10,000 in the Fund since inception with the performance of the Fund’s benchmark index. Results include the reinvestment of all dividends and capital gains distributions. Past performance does not guarantee future results. The chart does not reflect the deduction of taxes that a shareholder would pay on Fund distributions or the redemption of Fund shares.
2 | May 31, 2022
ALPS International Sector Dividend Dogs ETF
| Performance Overview | May 31, 2022 (Unaudited) |
Investment Objective
The ALPS International Sector Dividend Dogs ETF (the “Fund” or “IDOG”) seeks investment results that replicate as closely as possible, before fees and expenses, the performance of the S-Network® International Sector Dividend Dogs Net Total Return Index (the “Underlying Index”).
The Underlying Index is a rules-based index intended to give investors a means of tracking the overall performance of the highest dividend paying stocks (i.e. “Dividend Dogs”) in the S-Network® Developed Markets (ex NA) Index, a universe of mainly large capitalization stocks in international developed markets not located in the Americas (the “S-Net Developed Markets”) on a sector-by-sector basis. “Dividend Dogs” refers to the five stocks in each of the Global Industry Classification Standard (“GICS”) sectors, excluding the real estate sector, that make up the S-Net Developed Markets which offer the highest dividend yields.
Performance (as of May 31, 2022)
| 6 Months | 1 Year | 5 Year | Since Inception^ | |
| ALPS International Sector Dividend Dogs ETF – NAV | 8.13% | 1.38% | 5.25% | 5.41% |
| ALPS International Sector Dividend Dogs ETF – Market Price* | 8.81% | 1.81% | 5.24% | 5.44% |
| S-Network® International Sector Dividend Dogs Net Total Return Index | 8.44% | 2.43% | 5.69% | 5.84% |
| Morningstar® Developed Markets ex-North America Net Total Return Index | -7.72% | -11.33% | 4.08% | 5.31% |
Total Expense Ratio (per the current prospectus) 0.50%.
Performance data quoted represents past performance. Past performance does not guarantee future results. Total return figures assume reinvestment of dividends and capital gains distributions, if any. The table does not reflect the deduction of taxes that a shareholder would pay on Fund distributions or the redemption of Fund shares. Investment return and principal value of an investment will fluctuate so that an investor’s shares, when sold or redeemed, may be worth more or less than the original cost. Current performance data may be higher or lower than actual data quoted. For the most current month-end performance data please visit www.alpsfunds.com or call 1.866.675.2639.
NAV is an exchange-traded fund’s per-share value. The per-share dollar amount of the Fund is derived by dividing the total value of all the securities in its portfolio, less any liabilities, by the number of Fund shares outstanding. Market Price is the price at which a share can currently be traded in the market. Information detailing the number of days the Market Price of the Fund was greater than the Fund’s NAV and the number of days it was less than the Fund’s NAV can be obtained at www.alpsfunds.com.
| ^ | The Fund Commencement Date was June 28, 2013. |
| * | Market Price means the official closing price of a share or, if it more accurately reflects the market value of a share at the time as of which the Fund calculates current net asset value per share, the price that is the midpoint of the bid-ask spread as of that time. It does not represent the returns an investor would receive if shares were traded at other times. |
The S-Network® International Sector Dividend Dogs Net Total Return Index is designed to serve as a fair, impartial and transparent measure of the performance of international large cap equities with above average dividend yields. The Underlying Index is a portfolio of fifty stocks derived from the S-Network International Developed Markets (ex-Americas) Index. Total Return assumes reinvestment of any dividends and distributions realized during a given time period. Net Total Return (NTR) is obtained by reinvesting the net dividend, which is equal to the ordinary gross dividend minus the amount of withholding tax.
Morningstar® Developed Markets ex-North America Net Total Return Index measures the performance of companies in developed markets ex-North America. It covers approximately 97% of the full market capitalization in the Developed Markets ex-North America.
The indexes are not actively managed and do not reflect any deductions for fees, expenses or taxes. One cannot invest directly in an index. Index performance does not reflect fund performance.
The Fund’s shares are not individually redeemable. Investors buy and sell shares of the Fund on a secondary market. Only market makers or “authorized participants” may trade directly with the Fund, typically in blocks of 25,000 shares.
The ALPS International Sector Dividend Dogs ETF is not suitable for all investors. Investments in the Fund are subject to investment risks, including possible loss of the principal amount invested.
ALPS Portfolio Solutions Distributor, Inc., a FINRA member, is the distributor for the ETF.
3 | May 31, 2022
ALPS International Sector Dividend Dogs ETF
| Performance Overview | May 31, 2022 (Unaudited) |
Top 10 Holdings* (as of May 31, 2022)
| Repsol SA | 2.42% |
| OMV AG | 2.39% |
| Telefonica SA | 2.38% |
| TotalEnergies SE | 2.29% |
| Bayer AG | 2.26% |
| BP PLC | 2.22% |
| Imperial Brands PLC | 2.16% |
| Telia Co. AB | 2.15% |
| Naturgy Energy Group SA | 2.13% |
| British American Tobacco PLC | 2.10% |
| Total % of Top 10 Holdings | 22.50% |
| * | % of Total Investments (excluding investments purchased with collateral from securities loaned). |
Future holdings are subject to change.
Sector Allocation* (as of May 31, 2022)
| Energy | 11.57% |
| Communication Services | 10.46% |
| Health Care | 10.28% |
| Utilities | 10.24% |
| Consumer Staples | 10.20% |
| Information Technology | 9.57% |
| Consumer Discretionary | 9.50% |
| Financials | 9.45% |
| Materials | 9.36% |
| Industrials | 9.08% |
| Money Market Fund | 0.29% |
| Total | 100.00% |
Growth of $10,000 (as of May 31, 2022)
Comparison of Change in Value of $10,000 Investment in the Fund and the Indexes
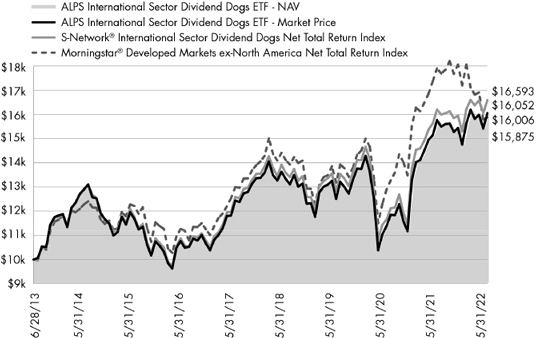
The chart above compares historical performance of a hypothetical investment of $10,000 in the Fund since inception with the performance of the Fund’s benchmark index. Results include the reinvestment of all dividends and capital gains distributions. Past performance does not guarantee future results. The chart does not reflect the deduction of taxes that a shareholder would pay on Fund distributions or the redemption of Fund shares.
4 | May 31, 2022
ALPS Emerging Sector Dividend Dogs ETF
| Performance Overview | May 31, 2022 (Unaudited) |
Investment Objective
The ALPS Emerging Sector Dividend Dogs ETF (the “Fund” or “EDOG”) seeks investment results that replicate as closely as possible, before fees and expenses, the performance of the S-Network® Emerging Sector Dividend Dogs Net Total Return Index (the “Underlying Index”).
The Underlying Index is a rules-based index intended to give investors a means of tracking the overall performance of the highest dividend paying stocks (i.e. “Dividend Dogs”) in the S-Network® Emerging Markets Index, a universe of mainly large capitalization stocks domiciled in emerging markets (the “S-Network Emerging Markets”) on a sector-by-sector basis. “Dividend Dogs” refers to the five stocks in each of the Global Industry Classification Standard (“GICS”) sectors, excluding the real estate sector, that make up the S-Network® Emerging Markets which offer the highest dividend yields. Emerging market countries are countries that major international financial institutions, such as the World Bank, generally consider to be less economically mature than developed nations.
Performance (as of May 31, 2022)
| 6 Months | 1 Year | 5 Year | Since Inception^ | |
| ALPS Emerging Sector Dividend Dogs ETF – NAV | -4.15% | -6.16% | 2.63% | 2.42% |
| ALPS Emerging Sector Dividend Dogs ETF – Market Price* | -3.39% | -5.69% | 2.73% | 2.50% |
| S-Network® Emerging Sector Dividend Dogs Net Total Return Index | -3.77% | -6.28% | 3.38% | 3.26% |
| Morningstar® Emerging Markets Net Total Return Index | -8.54% | -17.42% | 4.66% | 4.39% |
Total Expense Ratio (per the current prospectus) 0.60%.
Performance data quoted represents past performance. Past performance does not guarantee future results. Total return figures assume reinvestment of dividends and capital gains distributions, if any. The table does not reflect the deduction of taxes that a shareholder would pay on Fund distributions or the redemption of Fund shares. Investment return and principal value of an investment will fluctuate so that an investor’s shares, when sold or redeemed, may be worth more or less than the original cost. Current performance data may be higher or lower than actual data quoted. For the most current month-end performance data please visit www.alpsfunds.com or call 1.866.675.2639.
NAV is an exchange-traded fund’s per-share value. The per-share dollar amount of the Fund is derived by dividing the total value of all the securities in its portfolio, less any liabilities, by the number of Fund shares outstanding. Market Price is the price at which a share can currently be traded in the market. Information detailing the number of days the Market Price of the Fund was greater than the Fund’s NAV and the number of days it was less than the Fund’s NAV can be obtained at www.alpsfunds.com.
| ^ | The Fund Commencement Date was March 28, 2014. |
| * | Market Price means the official closing price of a share or, if it more accurately reflects the market value of a share at the time as of which the Fund calculates current net asset value per share, the price that is the midpoint of the bid-ask spread as of that time. It does not represent the returns an investor would receive if shares were traded at other times. |
The S-Network® Emerging Sector Dividend Dogs Net Total Return Index is a portfolio of stocks derived from a universe of mainly large capitalization stocks domiciled in emerging markets (the “S-Network Emerging Markets Index” “SNEMX”). The index methodology selects the five stocks in each of the GICS sectors, excluding the real estate sector, that make up the universe which offer the highest dividend yields as of the last trading day of November. The fifty stocks that are selected for inclusion in the portfolio are equally weighted. The universe includes stocks whose domicile and primary exchange listings are in countries identified by the World Bank as Upper Middle Income (certain lower middle income countries are also included, as well as stocks traded on the Taiwan Stock Exchange despite non-recognition by the World Bank). The selection criteria for the universe, in addition to the aforementioned country qualifications, also include requirements for sector inclusion, primary exchange listing, minimum market capitalization, share price, average daily trading volume and other factors. Total Return assumes reinvestment of any dividends and distributions realized during a given time period. Net Total Return (NTR) is obtained by reinvesting the net dividend, which is equal to the ordinary gross dividend minus the amount of withholding tax.
Morningstar® Emerging Markets Net Total Return Index measures the performance of emerging markets targeting the top 97% of stocks by market capitalization.
The indexes are not actively managed and do not reflect any deductions for fees, expenses or taxes. One cannot invest directly in an index. Index performance does not reflect fund performance.
The Fund’s shares are not individually redeemable. Investors buy and sell shares of the Fund on a secondary market. Only market makers or “authorized participants” may trade directly with the Fund, typically in blocks of 25,000 shares.
The ALPS Emerging Sector Dividend Dogs ETF is not suitable for all investors. Investments in the Fund are subject to investment risks, including possible loss of the principal amount invested.
ALPS Portfolio Solutions Distributor, Inc., a FINRA member, is the distributor for the ETF.
5 | May 31, 2022
ALPS Emerging Sector Dividend Dogs ETF
| Performance Overview | May 31, 2022 (Unaudited) |
Top 10 Holdings* (as of May 31, 2022)
| Centrais Eletricas Brasileiras SA, ADR | 2.61% |
| CEZ AS | 2.59% |
| China Shenhua Energy Co., Ltd., Class H | 2.44% |
| Kimberly-Clark de Mexico SAB de CV, Class A | 2.37% |
| Engie Brasil Energia SA | 2.33% |
| Ford Otomotiv Sanayi AS | 2.27% |
| Grupo Aeroportuario del Sureste SAB de CV, ADR | 2.25% |
| El Puerto de Liverpool SAB de CV | 2.16% |
| JBS SA | 2.14% |
| Ternium SA, Sponsored ADR | 2.14% |
| Total % of Top 10 Holdings | 23.30% |
| * | % of Total Investments (excluding investments purchased with collateral from securities loaned). |
Future holdings are subject to change.
Sector Allocation* (as of May 31, 2022)
| Utilities | 11.53% |
| Consumer Discretionary | 10.34% |
| Energy | 10.20% |
| Consumer Staples | 10.17% |
| Industrials | 10.00% |
| Materials | 9.92% |
| Financials | 9.77% |
| Communication Services | 9.44% |
| Health Care | 9.32% |
| Information Technology | 9.13% |
| Money Market Fund | 0.18% |
| Total | 100.00% |
Growth of $10,000 (as of May 31, 2022)
Comparison of Change in Value of $10,000 Investment in the Fund and the Indexes
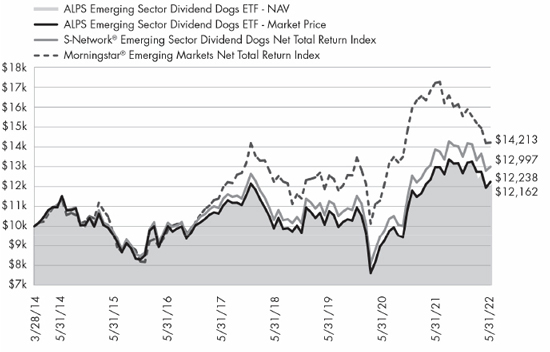
The chart above compares historical performance of a hypothetical investment of $10,000 in the Fund since inception with the performance of the Fund’s benchmark index. Results include the reinvestment of all dividends and capital gains distributions. Past performance does not guarantee future results. The chart does not reflect the deduction of taxes that a shareholder would pay on Fund distributions or the redemption of Fund shares.
6 | May 31, 2022
ALPS REIT Dividend Dogs ETF
| Performance Overview | May 31, 2022 (Unaudited) |
Investment Objective
The ALPS REIT Dividend Dogs ETF (the “Fund” or "RDOG") seeks investment results that replicate as closely as possible, before fees and expenses, the performance of the S-Network® REIT Dividend Dogs Total Return Index (the “Underlying Index”).
The Underlying Index is a rules-based index intended to give investors a means of tracking the overall performance of the highest dividend paying real estate investment trusts (“REITs”) (i.e. “Dividend Dogs”) in the S-Network® Composite US REIT Index, a universe of mainly REITs listed in the United States (the “S-Net U.S. REIT” or "SNREIT"), on a segment-by-segment basis. “Dividend Dogs” refers to the five REITs in each of the nine segments that make up the S-Net U.S. REIT which offer the highest dividend yields.
Performance (as of May 31, 2022)
| 6 Months | 1 Year | 5 Year | 10 Year | Since Inception^ | |
| ALPS REIT Dividend Dogs ETF – NAV | -5.08% | 2.51% | 5.27% | 6.94% | 3.50% |
| ALPS REIT Dividend Dogs ETF – Market Price** | -5.23% | 2.51% | 5.32% | 6.90% | 3.50% |
| S-Network® REIT Dividend Dogs Total Return Index | -4.84% | 2.98% | – | – | – |
| S-Network® Composite US REIT Index | -5.03% | 3.28% | 8.41% | – | – |
| S-Network® REIT Dividend Dogs Index/S&P United States REIT Index*** | -4.84% | 2.98% | 6.22% | 8.07% | 6.49% |
Total Expense Ratio (per the current prospectus) is 0.35%.
Performance data quoted represents past performance. Past performance does not guarantee future results. On January 2, 2020, the Fund changed its Underlying Index and principal investment strategies. Consequently, the Fund's total returns shown above for the periods prior to January 2, 2020 are not necessarily indicative of the performance of the Fund, as it is currently managed. Total return figures assume reinvestment of dividends and capital gains distributions, if any. The table does not reflect the deduction of taxes that a shareholder would pay on Fund distributions or the redemption of Fund shares. Investment return and principal value of an investment will fluctuate so that an investor’s shares, when sold or redeemed, may be worth more or less than the original cost. Current performance data may be higher or lower than actual data quoted. For the most current month-end performance data please visit www.alpsfunds.com or call 1.866.759.5679.
NAV is an exchange-traded fund’s per-share value. The per-share dollar amount of the Fund is derived by dividing the total value of all the securities in its portfolio, less any liabilities, by the number of Fund shares outstanding. Market Price is the price at which a share can currently be traded in the market. Information detailing the number of days the Market Price of the Fund was greater than the Fund’s NAV and the number of days it was less than the Fund’s NAV can be obtained at www.alpsfunds.com.
| ^ | The Fund Inception Date was May 7, 2008. |
| * | Excludes adjustments in accordance with accounting principles generally accepted in the United States of America and as such, the net asset value and total return for shareholder transactions reported to the market may differ from the net asset value for financial reporting purposes. |
| ** | Market Price means the official closing price of a share or, if it more accurately reflects the market value of a share at the time as of which the Fund calculates current net asset value per share, the price that is the midpoint of the bid-ask spread as of that time. It does not represent the returns an investor would receive if shares were traded at other times. *** The performance shown reflects a combination of the Fund's Underlying Index, and for periods prior to January 2, 2020, the S&P United States REIT Index. Therefore, the historical returns shown for the periods prior to January 2, 2020, are not necessarily indicative of the historical strategy of the Fund. |
The S-Network® REIT Dividend Dogs Total Return Index, like the S-Net U.S. REIT from which components of the Underlying Index are selected, divides into nine segments, eight of which are based on Global Industry Classification Standard (“GICS”) Sub-Industries (excluding Technology REITs involved in cell towers and/or data centers) and a separate Technology REIT segment based on the research of the Underlying Index provider, S-Network® Global Indexes, Inc. (the “Index Provider”). The Underlying Index generally consists of 45 REITs on each annual reconstitution date. The Underlying Index’s REITs must be constituents of the S-Net U.S. REIT universe, which includes a universe of mainly REITs listed in the United States. The selection criteria for the universe also includes requirements for segment inclusion, primary exchange listing, minimum market capitalization, share price, average daily trading volume and other factors. The Underlying Index is rebalanced quarterly. The index is reported on a total return basis, which assumes reinvestment of any dividends and distributions realized during a given time period. The index commenced operations on October 29, 2019.
The S-Network® Composite US REIT Index (the “S-Net U.S. REIT” or “SNREIT”) is a benchmark index for the Real Estate Investment Trust component of the US stock market. The SNREIT provides the universe of stocks for RDOGX. The selection criteria for SNREIT include requirements for sector inclusion, primary exchange listing, minimum market capitalization, minimum average daily trading volume, and other factors. All constituents of RDOGX must be constituents of SNREIT. The index commenced operations on February 12, 2016.
The S&P United States REIT Index defines and measures the investable universe of publicly traded real estate investment trusts domiciled in the United States.
7 | May 31, 2022
ALPS REIT Dividend Dogs ETF
| Performance Overview | May 31, 2022 (Unaudited) |
The indexes are not actively managed and do not reflect any deductions for fees, expenses or taxes. Total return assumes reinvestment of any dividends and distributions realized during a given time period. One cannot invest directly in an index. Index performance does not reflect fund performance.
The Fund’s shares are not individually redeemable. Investors buy and sell shares of the Fund on a secondary market. Only market makers or “authorized participants” may trade directly with the Fund, typically in blocks of 25,000 shares.
The ALPS REIT Dividend Dogs ETF is not suitable for all investors. Investments in the Fund are subject to investment risks, including possible loss of the principal amount invested.
ALPS Portfolio Solutions Distributor, Inc., a FINRA member, is the distributor for the ETF.
8 | May 31, 2022
ALPS REIT Dividend Dogs ETF
| Performance Overview | May 31, 2022 (Unaudited) |
Top 10 Holdings* (as of May 31, 2022)
| American Campus Communities, Inc. | 2.99% |
| VICI Properties, Inc. | 2.85% |
| Crown Castle International Corp. | 2.74% |
| American Tower Corp. | 2.73% |
| Agree Realty Corp. | 2.72% |
| LTC Properties, Inc. | 2.72% |
| Iron Mountain, Inc. | 2.68% |
| WP Carey, Inc. | 2.65% |
| Gaming and Leisure Properties, Inc. | 2.64% |
| Realty Income Corp. | 2.62% |
| Total % of Top 10 Holdings | 27.35% |
| * | % of Total Investments |
Future holdings are subject to change.
REIT Sector Allocation* (as of May 31, 2022)
| Health Care REITs | 12.75% |
| Specialized REITs | 12.67% |
| Retail REITs | 12.39% |
| Diversified REITs | 12.17% |
| Residential REITs | 11.58% |
| Technology REITs | 10.74% |
| Office REITs | 10.51% |
| Industrial REITs | 10.00% |
| Hotel & Resort REITs | 6.79% |
| Money Market Fund | 0.40% |
| Total | 100.00% |
Growth of $10,000 (as of May 31, 2022)
Comparison of Change in Value of $10,000 Investment in the Fund and the Indexes
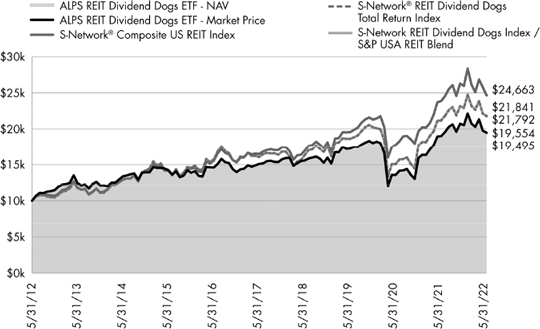
The chart above compares historical performance of a hypothetical investment of $10,000 in the Fund over the past ten years with the performance of the Fund’s benchmark index. Results include the reinvestment of all dividends and capital gains distributions. Past performance does not guarantee future results. The chart does not reflect the deduction of taxes that a shareholder would pay on Fund distributions or the redemption of Fund shares.
9 | May 31, 2022
ALPS ETF Trust
| Disclosure of Fund Expenses | May 31, 2022 (Unaudited) |
Shareholder Expense Example: As a shareholder of a Fund, you incur certain ongoing costs, including management fees and other Fund expenses. These examples are intended to help you understand your ongoing costs (in dollars) of investing in the Fund and to compare these costs with the ongoing costs of investing in other funds. It is based on an investment of $1,000 invested at the beginning of the six month period and held through May 31, 2022.
Actual Return: The first line of the table provides information about actual account values and actual expenses. You may use the information in this line, together with the amount you invested, to estimate the expenses that you incurred over the period. Simply divide your account value by $1,000 (for example, an $8,600 account value divided by $1,000 = 8.6), then multiply the result by the number in the first line under the heading entitled “Expenses Paid During Period” to estimate the expenses attributable to your investment during this period.
Hypothetical 5% Return: The second line of the table provides information about hypothetical account values and hypothetical expenses based on the Fund’s actual expense ratio and an assumed rate of return of 5% per year before expenses, which is not the Fund’s actual return. The hypothetical account values and expenses may not be used to estimate the actual ending account balance or expenses you paid for the period. You may use this information to compare ongoing costs of investing in the Fund and other funds. To do so, compare this 5% hypothetical example with the 5% hypothetical examples that appear in the shareholder reports of other funds.
The expenses shown in the table are meant to highlight ongoing Fund costs only and do not reflect any transaction costs, such as brokerage commissions and other fees to financial intermediaries. Therefore, the second line is useful in comparing ongoing costs only, and will not help you determine the relative total costs of owning different funds. In addition, if these costs were included, your costs would have been higher.
| Beginning Account Value 12/1/21 | Ending Account Value 5/31/22 | Expense Ratio(a) | Expenses Paid During Period 12/1/21 - 5/31/22(b) | |||||||||||||
| ALPS Sector Dividend Dogs ETF | ||||||||||||||||
| Actual | $ | 1,000.00 | $ | 1,130.00 | 0.40% | $ | 2.12 | |||||||||
| Hypothetical (5% return before expenses) | $ | 1,000.00 | $ | 1,022.94 | 0.40% | $ | 2.02 | |||||||||
| ALPS International Sector Dividend Dogs ETF | ||||||||||||||||
| Actual | $ | 1,000.00 | $ | 1,081.30 | 0.50% | $ | 2.59 | |||||||||
| Hypothetical (5% return before expenses) | $ | 1,000.00 | $ | 1,022.44 | 0.50% | $ | 2.52 | |||||||||
| ALPS Emerging Sector Dividend Dogs ETF | ||||||||||||||||
| Actual | $ | 1,000.00 | $ | 958.50 | 0.60% | $ | 2.93 | |||||||||
| Hypothetical (5% return before expenses) | $ | 1,000.00 | $ | 1,021.94 | 0.60% | $ | 3.02 | |||||||||
| ALPS REIT Dividend Dogs ETF | ||||||||||||||||
| Actual | $ | 1,000.00 | $ | 949.20 | 0.35% | $ | 1.70 | |||||||||
| Hypothetical (5% return before expenses) | $ | 1,000.00 | $ | 1,023.19 | 0.35% | $ | 1.77 | |||||||||
| (a) | Annualized based on the Fund's most recent half-year expenses. |
| (b) | Expenses are equal to the Fund's annualized expense ratio multiplied by the average account value over the period, multiplied by the number of days in the most recent fiscal half year (182), divided by 365. |
10 | May 31, 2022
ALPS Sector Dividend Dogs ETF
| Schedule of Investments | May 31, 2022 (Unaudited) |
| Security Description | Shares | Value | ||||||
| COMMON STOCKS (99.49%) | ||||||||
| Communication Services (10.17%) | ||||||||
| AT&T, Inc. | 1,424,923 | $ | 30,336,611 | |||||
| Interpublic Group of Cos., Inc. | 767,869 | 24,748,418 | ||||||
| Lumen Technologies, Inc. | 2,371,872 | 29,031,713 | ||||||
| Omnicom Group, Inc. | 332,260 | 24,789,919 | ||||||
| Verizon Communications, Inc. | 476,343 | 24,431,632 | ||||||
| Total Communication Services | 133,338,293 | |||||||
| Consumer Discretionary (9.34%) | ||||||||
| Best Buy Co., Inc. | 267,838 | 21,978,786 | ||||||
| Hasbro, Inc. | 292,925 | 26,290,019 | ||||||
| Newell Brands, Inc. | 1,173,805 | 25,166,379 | ||||||
| VF Corp. | 472,284 | 23,831,451 | ||||||
| Whirlpool Corp. | 136,627 | 25,172,158 | ||||||
| Total Consumer Discretionary | 122,438,793 | |||||||
| Consumer Staples (10.23%) | ||||||||
| Altria Group, Inc. | 501,768 | 27,140,631 | ||||||
| Conagra Brands, Inc. | 841,596 | 27,680,093 | ||||||
| Kraft Heinz Co. | 677,999 | 25,648,702 | ||||||
| Philip Morris International, Inc. | 285,072 | 30,288,900 | ||||||
| Walgreens Boots Alliance, Inc. | 532,582 | 23,343,069 | ||||||
| Total Consumer Staples | 134,101,395 | |||||||
| Energy (11.18%) | ||||||||
| Exxon Mobil Corp. | 298,323 | 28,639,008 | ||||||
| Kinder Morgan, Inc. | 1,399,539 | 27,556,923 | ||||||
| ONEOK, Inc. | 382,431 | 25,183,081 | ||||||
| Valero Energy Corp. | 276,354 | 35,815,479 | ||||||
| Williams Cos., Inc. | 794,053 | 29,427,604 | ||||||
| Total Energy | 146,622,095 | |||||||
| Financials (7.83%) | ||||||||
| Franklin Resources, Inc. | 926,832 | 25,098,611 | ||||||
| Huntington Bancshares, Inc. | 1,716,311 | 23,822,397 | ||||||
| Principal Financial Group, Inc. | 389,324 | 28,393,399 | ||||||
| Prudential Financial, Inc. | 238,893 | 25,382,381 | ||||||
| Total Financials | 102,696,788 | |||||||
| Health Care (10.43%) | ||||||||
| AbbVie, Inc. | 169,988 | 25,051,132 | ||||||
| Amgen, Inc. | 110,700 | 28,421,118 | ||||||
| Bristol-Myers Squibb Co. | 367,806 | 27,750,963 | ||||||
| Cardinal Health, Inc. | 481,844 | 27,137,454 | ||||||
| Gilead Sciences, Inc. | 436,765 | 28,324,210 | ||||||
| Total Health Care | 136,684,877 | |||||||
| Industrials (10.11%) | ||||||||
| 3M Co. | 179,719 | 26,830,250 | ||||||
| Cummins, Inc. | 129,759 | 27,135,202 | ||||||
| Huntington Ingalls Industries, Inc. | 122,951 | 25,876,267 | ||||||
| Lockheed Martin Corp. | 57,595 | 25,348,135 | ||||||
| Security Description | Shares | Value | ||||||
| Industrials (continued) | ||||||||
| Snap-On, Inc. | 123,153 | $ | 27,325,188 | |||||
| Total Industrials | 132,515,042 | |||||||
| Information Technology (9.31%) | ||||||||
| Cisco Systems, Inc. | 461,951 | 20,810,893 | ||||||
| Hewlett Packard Enterprise Co. | 1,526,509 | 23,813,540 | ||||||
| Intel Corp. | 552,686 | 24,550,312 | ||||||
| International Business Machines Corp. | 204,334 | 28,369,733 | ||||||
| Seagate Technology Holdings PLC | 290,108 | 24,563,444 | ||||||
| Total Information Technology | 122,107,922 | |||||||
| Materials (10.53%) | ||||||||
| Amcor PLC | 2,323,946 | 30,443,693 | ||||||
| International Paper Co. | 597,048 | 28,926,976 | ||||||
| LyondellBasell Industries NV, Class A | 244,890 | 27,978,682 | ||||||
| Newmont Mining Corp. | 329,464 | 22,354,132 | ||||||
| The Dow Chemical Co. | 415,869 | 28,270,775 | ||||||
| Total Materials | 137,974,258 | |||||||
| Utilities (10.36%) | ||||||||
| Edison International | 390,977 | 27,333,202 | ||||||
| FirstEnergy Corp. | 576,106 | 24,749,514 | ||||||
| Pinnacle West Capital Corp. | 343,467 | 26,670,212 | ||||||
| PPL Corp. | 964,279 | 29,101,940 | ||||||
| Southern Co. | 368,756 | 27,900,079 | ||||||
| Total Utilities | 135,754,947 | |||||||
| TOTAL COMMON STOCKS | ||||||||
| (Cost $1,186,186,436) | 1,304,234,410 | |||||||
| 7 Day Yield | Shares | Value | ||||||||||
| SHORT TERM INVESTMENTS (0.09%) | ||||||||||||
| Money Market Fund | ||||||||||||
| State Street Institutional Treasury Plus Money Market Fund | 0.75 | % | 1,221,380 | 1,221,380 | ||||||||
| TOTAL SHORT TERM INVESTMENTS | ||||||||||||
| (Cost $1,221,380) | 1,221,380 | |||||||||||
| TOTAL INVESTMENTS (99.58%) | ||||||||||||
| (Cost $1,187,407,816) | $ | 1,305,455,790 | ||||||||||
| OTHER ASSETS IN EXCESS OF LIABILITIES (0.42%) | 5,545,657 | |||||||||||
| NET ASSETS - 100.00% | $ | 1,311,001,447 | ||||||||||
See Notes to Financial Statements.
11 | May 31, 2022
ALPS International Sector Dividend Dogs ETF
| Schedule of Investments | May 31, 2022 (Unaudited) |
| Security Description | Shares | Value | ||||||
| COMMON STOCKS (99.14%) | ||||||||
| Australia (11.43%) | ||||||||
| Australia & New Zealand | ||||||||
| Banking Group, Ltd. | 182,491 | $ | 3,279,348 | |||||
| BHP Group, Ltd. | 99,178 | 3,175,114 | ||||||
| Coles Group, Ltd. | 275,314 | 3,463,554 | ||||||
| Fortescue Metals Group, Ltd. | 258,731 | 3,733,982 | ||||||
| Wesfarmers, Ltd. | 95,866 | 3,246,582 | ||||||
| Westpac Banking Corp. | 208,051 | 3,563,969 | ||||||
| Woodside Energy Group, Ltd. | 17,452 | 372,726 | ||||||
| Total Australia | 20,835,275 | |||||||
| Austria (2.38%) | ||||||||
| OMV AG | 74,290 | 4,338,615 | ||||||
| Finland (1.88%) | ||||||||
| Nordea Bank Abp | 336,277 | 3,416,504 | ||||||
| France (8.34%) | ||||||||
| Danone SA | 62,040 | 3,645,180 | ||||||
| Orange SA | 302,197 | 3,778,882 | ||||||
| Sanofi | 34,005 | 3,627,969 | ||||||
| TotalEnergies SE | 69,492 | 4,147,184 | ||||||
| Total France | 15,199,215 | |||||||
| Germany (7.83%) | ||||||||
| BASF SE | 58,840 | 3,239,867 | ||||||
| Bayer AG | 57,227 | 4,090,407 | ||||||
| Bayerische Motoren Werke AG | 43,733 | 3,785,539 | ||||||
| SAP SE | 31,788 | 3,166,549 | ||||||
| Total Germany | 14,282,362 | |||||||
| Hong Kong (1.93%) | ||||||||
| CITIC, Ltd. | 3,137,000 | 3,521,889 | ||||||
| Italy (6.03%) | ||||||||
| Enel SpA | 552,796 | 3,586,833 | ||||||
| Eni SpA | 242,712 | 3,699,476 | ||||||
| Snam SpA | 638,239 | 3,706,828 | ||||||
| Total Italy | 10,993,137 | |||||||
| Japan (18.88%) | ||||||||
| Bridgestone Corp.(a) | 96,000 | 3,790,485 | ||||||
| Canon, Inc.(a) | 148,363 | 3,736,302 | ||||||
| Honda Motor Co., Ltd. | 129,300 | 3,200,987 | ||||||
| Japan Tobacco, Inc.(a) | 200,400 | 3,643,424 | ||||||
| Kyocera Corp. | 64,900 | 3,663,559 | ||||||
| Marubeni Corp. | 302,900 | 3,184,644 | ||||||
| Mitsubishi Corp. | 97,000 | 3,340,203 | ||||||
| Sumitomo Corp. | 206,300 | 2,964,656 | ||||||
| Takeda Pharmaceutical Co., Ltd. | 119,100 | 3,425,854 | ||||||
| Tokyo Electron, Ltd. | 7,575 | 3,470,490 | ||||||
| Total Japan | 34,420,604 | |||||||
| Norway (3.61%) | ||||||||
| DNB Bank ASA | 161,322 | 3,272,861 | ||||||
| Security Description | Shares | Value | ||||||
| Norway (continued) | ||||||||
| Telenor ASA | 238,751 | $ | 3,300,047 | |||||
| Total Norway | 6,572,908 | |||||||
| Spain (8.98%) | ||||||||
| Endesa SA | 171,905 | 3,807,234 | ||||||
| Naturgy Energy Group SA(a) | 128,075 | 3,869,103 | ||||||
| Repsol SA | 272,306 | 4,383,545 | ||||||
| Telefonica SA | 793,379 | 4,309,759 | ||||||
| Total Spain | 16,369,641 | |||||||
| Sweden (7.69%) | ||||||||
| H & M Hennes & Mauritz AB, Class B(a) | 232,511 | 3,205,078 | ||||||
| Swedbank AB, Class A | 238,056 | 3,596,697 | ||||||
| Telefonaktiebolaget LM Ericsson, Class B | 409,193 | 3,318,059 | ||||||
| Telia Co. AB | 952,578 | 3,903,580 | ||||||
| Total Sweden | 14,023,414 | |||||||
| Switzerland (2.06%) | ||||||||
| Novartis AG | 41,498 | 3,757,836 | ||||||
| United Kingdom (18.10%) | ||||||||
| Anglo American PLC | 68,710 | 3,365,412 | ||||||
| BAE Systems PLC | 361,622 | 3,444,930 | ||||||
| BP PLC | 736,011 | 4,027,430 | ||||||
| British American Tobacco PLC | 86,401 | 3,812,753 | ||||||
| GSK PLC | 171,335 | 3,740,660 | ||||||
| Imperial Brands PLC | 173,637 | 3,917,603 | ||||||
| Rio Tinto PLC | 47,725 | 3,457,941 | ||||||
| SSE PLC | 160,876 | 3,592,186 | ||||||
| Vodafone Group PLC | 2,216,897 | 3,647,758 | ||||||
| Total United Kingdom | 33,006,673 | |||||||
| TOTAL COMMON STOCKS | ||||||||
| (Cost $179,881,877) | 180,738,073 | |||||||
12 | May 31, 2022
ALPS International Sector Dividend Dogs ETF
| Schedule of Investments | May 31, 2022 (Unaudited) |
| 7 Day Yield | Shares | Value | ||||||||||
| SHORT TERM INVESTMENTS (6.74%) | ||||||||||||
| Money Market Fund (0.29%) | ||||||||||||
| State Street Institutional Treasury Plus Money Market Fund | ||||||||||||
| (Cost $524,229) | 0.75 | % | 524,229 | $ | 524,229 | |||||||
| Investments Purchased with Collateral from Securities Loaned (6.45%) | ||||||||||||
| State Street Navigator Securities Lending Government Money Market Portfolio, 0.80% | ||||||||||||
| (Cost $11,767,319) | 11,767,319 | 11,767,319 | ||||||||||
| TOTAL SHORT TERM INVESTMENTS | ||||||||||||
| (Cost $12,291,548) | 12,291,548 | |||||||||||
| TOTAL INVESTMENTS (105.88%) | ||||||||||||
| (Cost $192,173,425) | $ | 193,029,621 | ||||||||||
| LIABILITIES IN EXCESS OF OTHER ASSETS (-5.88%) | (10,714,198 | ) | ||||||||||
| NET ASSETS - 100.00% | $ | 182,315,423 | ||||||||||
| (a) | Security, or a portion of the security position is currently on loan. The total market value of securities on loan is $11,477,826. |
See Notes to Financial Statements.
13 | May 31, 2022
ALPS Emerging Sector Dividend Dogs ETF
| Schedule of Investments | May 31, 2022 (Unaudited) |
| Security Description | Shares | Value | ||||||
| COMMON STOCKS (99.14%) | ||||||||
| Brazil (10.93%) | ||||||||
| Centrais Eletricas Brasileiras SA, ADR(a) | 69,170 | $ | 608,004 | |||||
| Engie Brasil Energia SA | 58,700 | 542,220 | ||||||
| JBS SA | 66,500 | 498,133 | ||||||
| Petroleo Brasileiro SA | 66,800 | 467,490 | ||||||
| Vibra Energia SA | 108,600 | 444,221 | ||||||
| Total Brazil | 2,560,068 | |||||||
| Chile (9.47%) | ||||||||
| Banco Santander Chile | 8,959,200 | 448,107 | ||||||
| Cencosud SA | 252,300 | 404,425 | ||||||
| Empresas CMPC SA | 276,800 | 478,510 | ||||||
| Empresas COPEC SA | 56,400 | 447,787 | ||||||
| Enel Chile SA, ADR(a) | 320,848 | 439,562 | ||||||
| Total Chile | 2,218,391 | |||||||
| China (10.60%) | ||||||||
| China Railway Signal & Communication Corp., Ltd., Class H(b)(c) | 1,382,000 | 491,357 | ||||||
| China Shenhua Energy Co., Ltd., Class H | 169,500 | 567,002 | ||||||
| Huadian Power International Corp., Ltd., Class H(a) | 1,362,000 | 487,718 | ||||||
| Legend Holdings Corp., Class H(b)(c) | 378,200 | 448,219 | ||||||
| Zoomlion Heavy Industry Science and Technology Co., Ltd., Class H | 791,000 | 487,873 | ||||||
| Total China | 2,482,169 | |||||||
| Czech Republic (2.57%) | ||||||||
| CEZ AS | 12,379 | 602,759 | ||||||
| Hungary (1.90%) | ||||||||
| Richter Gedeon Nyrt | 22,698 | 444,328 | ||||||
| India (3.10%) | ||||||||
| Infosys, Ltd., Sponsored ADR | 19,136 | 360,905 | ||||||
| Wipro, Ltd., ADR | 61,066 | 365,175 | ||||||
| Total India | 726,080 | |||||||
| Indonesia (3.97%) | ||||||||
| Gudang Garam Tbk PT | 213,600 | 461,450 | ||||||
| Kalbe Farma Tbk PT | 4,077,400 | 468,393 | ||||||
| Total Indonesia | 929,843 | |||||||
| Luxembourg (2.12%) | ||||||||
| Ternium SA, Sponsored ADR(a) | 11,320 | 497,740 | ||||||
| Malaysia (9.14%) | ||||||||
| Hartalega Holdings Bhd | 449,600 | 431,271 | ||||||
| Malayan Banking Bhd | 217,000 | 450,999 | ||||||
| RHB Bank Bhd | 332,800 | 462,127 | ||||||
| Sime Darby Bhd | 851,700 | 425,996 | ||||||
| Security Description | Shares | Value | ||||||
| Malaysia (continued) | ||||||||
| Top Glove Corp. Bhd | 1,157,400 | $ | 370,072 | |||||
| Total Malaysia | 2,140,465 | |||||||
| Mexico (8.83%) | ||||||||
| El Puerto de Liverpool SAB de CV(d) | 95,100 | 501,920 | ||||||
| Grupo Aeroportuario del Sureste SAB de CV, ADR | 2,406 | 522,800 | ||||||
| Kimberly-Clark de Mexico SAB de CV, Class A | 355,600 | 550,551 | ||||||
| Orbia Advance Corp. SAB de CV | 183,665 | 493,214 | ||||||
| Total Mexico | 2,068,485 | |||||||
| Philippines (3.94%) | ||||||||
| Globe Telecom, Inc. | 9,600 | 444,931 | ||||||
| PLDT, Inc. | 13,170 | 477,652 | ||||||
| Total Philippines | 922,583 | |||||||
| Poland (4.09%) | ||||||||
| LPP SA | 200 | 480,647 | ||||||
| Powszechny Zaklad Ubezpieczen SA | 62,900 | 477,063 | ||||||
| Total Poland | 957,710 | |||||||
| Russia (0.01%) | ||||||||
| Magnit PJSC, GDR(c)(e) | 32,174 | 321 | ||||||
| Mobile TeleSystems PJSC, Sponsored ADR(e) | 64,600 | 646 | ||||||
| Novolipetsk Steel PJSC, GDR(c)(e) | 17,594 | 177 | ||||||
| Severstal PAO, GDR(c)(e) | 23,283 | 233 | ||||||
| X5 Retail Group NV, GDR(c)(e) | 17,785 | 178 | ||||||
| Total Russia | 1,555 | |||||||
| South Africa (9.46%) | ||||||||
| African Rainbow Minerals, Ltd. | 25,200 | 419,776 | ||||||
| Exxaro Resources, Ltd. | 32,257 | 456,253 | ||||||
| Mr Price Group, Ltd. | 34,100 | 452,283 | ||||||
| MultiChoice Group | 54,876 | 469,316 | ||||||
| Vodacom Group, Ltd. | 44,400 | 417,215 | ||||||
| Total South Africa | 2,214,843 | |||||||
| Thailand (9.46%) | ||||||||
| Bangkok Dusit Medical Services PCL | 602,400 | 453,296 | ||||||
| BTS Group Holdings PCL | 1,669,900 | 434,311 | ||||||
| Delta Electronics Thailand PCL | 45,400 | 459,041 | ||||||
| PTT PCL | 388,800 | 434,588 | ||||||
| TMBThanachart Bank PCL | 11,701,300 | 434,268 | ||||||
| Total Thailand | 2,215,504 | |||||||
| Turkey (9.55%) | ||||||||
| BIM Birlesik Magazalar AS | 89,800 | 451,648 | ||||||
| Enka Insaat ve Sanayi AS | 475,400 | 455,888 | ||||||
14 | May 31, 2022
ALPS Emerging Sector Dividend Dogs ETF
| Schedule of Investments | May 31, 2022 (Unaudited) |
| Security Description | Shares | Value | ||||||
| Turkey (continued) | ||||||||
| Eregli Demir ve Celik Fabrikalari TAS | 200,200 | $ | 417,407 | |||||
| Ford Otomotiv Sanayi AS | 27,921 | 526,990 | ||||||
| Turkcell Iletisim Hizmetleri AS, ADR | 128,570 | 385,710 | ||||||
| Total Turkey | 2,237,643 | |||||||
| TOTAL COMMON STOCKS | ||||||||
| (Cost $24,944,790) | 23,220,166 | |||||||
| RIGHTS (0.00%) | ||||||||
| Thailand (0.00%) | ||||||||
| TMBThanachart Bank PCL (Expiring 5/10/2025), Strike Price THB 0.95 | 116,013 | 1,085 | ||||||
| TOTAL RIGHTS | ||||||||
| (Cost $–) | 1,085 | |||||||
| 7 Day Yield | Shares | Value | ||||||||||
| SHORT TERM INVESTMENTS (3.92%) | ||||||||||||
| Money Market Fund (0.18%) | ||||||||||||
| State Street Institutional Treasury Plus Money Market Fund | ||||||||||||
| (Cost $41,261) | 0.75 | % | 41,261 | 41,261 | ||||||||
| Investments Purchased with Collateral | ||||||||||||
| from Securities Loaned (3.74%) | ||||||||||||
| State Street Navigator Securities Lending Government Money Market Portfolio, 0.80% | ||||||||||||
| (Cost $876,302) | 876,302 | 876,302 | ||||||||||
| TOTAL SHORT TERM INVESTMENTS | ||||||||||||
| (Cost $917,563) | 917,563 | |||||||||||
| TOTAL INVESTMENTS (103.06%) | ||||||||||||
| (Cost $25,862,353) | $ | 24,138,814 | ||||||||||
| LIABILITIES IN EXCESS OF OTHER ASSETS (-3.06%) | (715,667 | ) | ||||||||||
| NET ASSETS - 100.00% | $ | 23,423,147 | ||||||||||
| (a) | Security, or a portion of the security position is currently on loan. The total market value of securities on loan is $1,187,927. |
| (b) | Securities exempt from registration under Rule 144A of the Securities Act of 1933. These securities may be sold in the ordinary course of business in transactions exempt from registration, normally to qualified institutional buyers. At period end, the aggregate market value of those securities was $939,576, representing 4.01% of net assets. |
| (c) | Securities were purchased pursuant to Regulation S under the Securities Act of 1933, which exempts securities offered and sold outside of the United States from registration. Such securities cannot be sold in the United States without either an effective registration statement filed pursuant to the Securities Act of 1933, or pursuant to an exemption from registration. As of May 31, 2022, the market value of those securities was $940,484 representing 4.02% of net assets. |
| (d) | Non-income producing security. |
| (e) | As a result of the use of significant unobservable inputs to determine fair value, these investments have been classified as Level 3 securities under the fair value hierarchy. |
Currency Abbreviations:
THB - Thai Bhat
See Notes to Financial Statements.
15 | May 31, 2022
ALPS REIT Dividend Dogs ETF
| Schedule of Investments | May 31, 2022 (Unaudited) |
| Security Description | Shares | Value | ||||||
| COMMON STOCKS (99.54%) | ||||||||
| Diversified REITs (12.17%) | ||||||||
| American Assets Trust, Inc. | 17,577 | $ | 599,376 | |||||
| Broadstone Net Lease, Inc. | 30,180 | 638,307 | ||||||
| Essential Properties Realty Trust, Inc. | 25,795 | 590,190 | ||||||
| STORE Capital Corp. | 21,753 | 600,165 | ||||||
| WP Carey, Inc. | 8,024 | 675,139 | ||||||
| Total Diversified REITs | 3,103,177 | |||||||
| Health Care REITs (12.73%) | ||||||||
| LTC Properties, Inc. | 17,875 | 692,478 | ||||||
| Medical Properties Trust, Inc. | 31,747 | 589,859 | ||||||
| National Health Investors, Inc. | 11,142 | 659,049 | ||||||
| Omega Healthcare Investors, Inc. | 22,264 | 662,799 | ||||||
| Sabra Health Care REIT, Inc. | 45,890 | 644,296 | ||||||
| Total Health Care REITs | 3,248,481 | |||||||
| Hotel & Resort REITs (6.79%) | ||||||||
| Apple Hospitality REIT, Inc. | 35,405 | 591,617 | ||||||
| RLJ Lodging Trust | 48,135 | 646,453 | ||||||
| Service Properties Trust | 78,020 | 493,867 | ||||||
| Total Hotel & Resort REITs | 1,731,937 | |||||||
| Industrial REITs (10.00%) | ||||||||
| Duke Realty Corp. | 11,930 | 630,262 | ||||||
| Industrial Logistics Properties Trust | 29,098 | 444,036 | ||||||
| Innovative Industrial Properties, Inc. | 3,427 | 455,962 | ||||||
| LXP Industrial Trust | 41,545 | 480,260 | ||||||
| STAG Industrial, Inc. | 16,189 | 539,094 | ||||||
| Total Industrial REITs | 2,549,614 | |||||||
| Office REITs (10.50%) | ||||||||
| Brandywine Realty Trust | 47,990 | 535,089 | ||||||
| Easterly Government Properties, Inc. | 30,394 | 596,634 | ||||||
| Piedmont Office Realty Trust, Inc., Class A | 38,223 | 563,407 | ||||||
| SL Green Realty Corp. | 8,096 | 500,090 | ||||||
| Vornado Realty Trust | 13,843 | 483,951 | ||||||
| Total Office REITs | 2,679,171 | |||||||
| Residential REITs (11.58%) | ||||||||
| American Campus | ||||||||
| Communities, Inc. | 11,731 | 762,514 | ||||||
| AvalonBay Communities, Inc. | 2,652 | 551,510 | ||||||
| Centerspace | 6,417 | 532,483 | ||||||
| Equity Residential | 7,371 | 566,314 | ||||||
| UDR, Inc. | 11,296 | 539,949 | ||||||
| Total Residential REITs | 2,952,770 | |||||||
| Retail REITs (12.39%) | ||||||||
| Agree Realty Corp. | 9,975 | 693,961 | ||||||
| National Retail Properties, Inc. | 14,809 | 656,039 | ||||||
| Security Description | Shares | Value | ||||||
| Retail REITs (continued) | ||||||||
| Realty Income Corp. | 9,787 | $ | 667,669 | |||||
| Simon Property Group, Inc. | 4,916 | 563,619 | ||||||
| Spirit Realty Capital, Inc. | 13,771 | 578,244 | ||||||
| Total Retail REITs | 3,159,532 | |||||||
| Specialized REITs (18.06%) | ||||||||
| American Tower Corp. | 2,722 | 697,186 | ||||||
| EPR Properties | 12,163 | 623,232 | ||||||
| Four Corners Property Trust, Inc. | 23,693 | 653,216 | ||||||
| Gaming and Leisure Properties, Inc. | 14,378 | 673,178 | ||||||
| Iron Mountain, Inc. | 12,665 | 682,643 | ||||||
| Uniti Group, Inc. | 48,582 | 550,920 | ||||||
| VICI Properties, Inc. | 23,581 | 727,474 | ||||||
| Total Specialized REITs | 4,607,849 | |||||||
| Technology REITs (5.32%) | ||||||||
| Crown Castle International Corp. | 3,688 | 699,429 | ||||||
| Digital Realty Trust, Inc. | 4,713 | 657,888 | ||||||
| Total Technology REITs | 1,357,317 | |||||||
| TOTAL COMMON STOCKS | ||||||||
| (Cost $26,606,821) | 25,389,848 | |||||||
| 7 Day Yield | Shares | Value | ||||||||||
| SHORT TERM INVESTMENTS (0.40%) | ||||||||||||
| Money Market Fund | ||||||||||||
| State Street Institutional Treasury Plus Money Market Fund | 0.75 | % | 103,133 | 103,133 | ||||||||
| TOTAL SHORT TERM INVESTMENTS | ||||||||||||
| (Cost $103,133) | 103,133 | |||||||||||
| TOTAL INVESTMENTS (99.94%) | ||||||||||||
| (Cost $26,709,954) | $ | 25,492,981 | ||||||||||
| OTHER ASSETS IN EXCESS OF LIABILITIES (0.06%) | 16,410 | |||||||||||
| NET ASSETS - 100.00% | $ | 25,509,391 | ||||||||||
0
See Notes to Financial Statements.
16 | May 31, 2022
ALPS ETF Trust
| Statements of Assets and Liabilities | May 31, 2022 (Unaudited) |
| ALPS Sector Dividend Dogs ETF | ALPS International Sector Dividend Dogs ETF | ALPS Emerging Sector Dividend Dogs ETF | ALPS REIT Dividend Dogs ETF | |||||||||||||
| ASSETS: | ||||||||||||||||
| Investments, at value | $ | 1,305,455,790 | $ | 193,029,621 | $ | 24,138,814 | $ | 25,492,981 | ||||||||
| Foreign currency, at value (Cost $–, $45,457, $13,577 and $–) | – | 45,014 | 13,588 | – | ||||||||||||
| Foreign tax reclaims | – | 353,724 | 4,049 | 3,206 | ||||||||||||
| Dividends receivable | 5,978,443 | 727,497 | 154,556 | 20,639 | ||||||||||||
| Total Assets | 1,311,434,233 | 194,155,856 | 24,311,007 | 25,516,826 | ||||||||||||
| LIABILITIES: | ||||||||||||||||
| Payable to adviser | 432,786 | 73,114 | 11,558 | 7,435 | ||||||||||||
| Payable for collateral upon return of securities loaned | – | 11,767,319 | 876,302 | – | ||||||||||||
| Total Liabilities | 432,786 | 11,840,433 | 887,860 | 7,435 | ||||||||||||
| NET ASSETS | $ | 1,311,001,447 | $ | 182,315,423 | $ | 23,423,147 | $ | 25,509,391 | ||||||||
| NET ASSETS CONSIST OF: | ||||||||||||||||
| Paid-in capital | $ | 1,387,560,971 | $ | 231,242,858 | $ | 32,905,986 | $ | 33,244,620 | ||||||||
| Total Distributable earnings | (76,559,524 | ) | (48,927,435 | ) | (9,482,839 | ) | (7,735,229 | ) | ||||||||
| NET ASSETS | $ | 1,311,001,447 | $ | 182,315,423 | $ | 23,423,147 | $ | 25,509,391 | ||||||||
| INVESTMENTS, AT COST | $ | 1,187,407,816 | $ | 192,173,425 | $ | 25,862,353 | $ | 26,709,954 | ||||||||
| PRICING OF SHARES: | ||||||||||||||||
| Net Assets | $ | 1,311,001,447 | $ | 182,315,423 | $ | 23,423,147 | $ | 25,509,391 | ||||||||
| Shares of beneficial interest outstanding (Unlimited number of shares authorized, par value $0.01 per share) | 23,434,141 | 6,475,000 | 1,050,000 | 550,000 | ||||||||||||
| Net Asset Value, offering and redemption price per share | $ | 55.94 | $ | 28.16 | $ | 22.31 | $ | 46.38 | ||||||||
See Notes to Financial Statements.
17 | May 31, 2022
ALPS ETF Trust
| Statements of Operations | For the Six Months Ended May 31, 2022 (Unaudited) |
| ALPS Sector Dividend Dogs ETF | ALPS International Sector Dividend Dogs ETF | ALPS Emerging Sector Dividend Dogs ETF | ALPS REIT Dividend Dogs ETF | |||||||||||||
| INVESTMENT INCOME: | ||||||||||||||||
| Dividends* | $ | 25,754,571 | $ | 4,281,116 | $ | 598,016 | $ | 633,903 | ||||||||
| Securities Lending Income | 33 | 1,367 | 1,465 | 162 | ||||||||||||
| Total Investment Income | 25,754,604 | 4,282,483 | 599,481 | 634,065 | ||||||||||||
| EXPENSES: | ||||||||||||||||
| Investment adviser fees | 2,468,585 | 417,652 | 73,594 | 47,784 | ||||||||||||
| Total Expenses | 2,468,585 | 417,652 | 73,594 | 47,784 | ||||||||||||
| NET INVESTMENT INCOME | 23,286,019 | 3,864,831 | 525,887 | 586,281 | ||||||||||||
| REALIZED AND UNREALIZED GAIN/(LOSS) | ||||||||||||||||
| Net realized gain on investments(a) | 84,412,912 | 2,699,310 | 674,075 | 2,957,111 | ||||||||||||
| Net realized loss on foreign currency transactions | – | (84,463 | ) | (4,321 | ) | – | ||||||||||
| Total net realized gain | 84,412,912 | 2,614,847 | 669,754 | 2,957,111 | ||||||||||||
| Net change in unrealized appreciation/(depreciation) on investments | 39,862,256 | 6,282,416 | (2,212,191 | ) | (4,789,455 | ) | ||||||||||
| Net change in unrealized appreciation/(depreciation) on translation of assets and liabilities denominated in foreign currencies | – | (27,368 | ) | 3,290 | (161 | ) | ||||||||||
| Total net change in unrealized appreciation/(depreciation) | 39,862,256 | 6,255,048 | (2,208,901 | ) | (4,789,616 | ) | ||||||||||
| NET REALIZED AND UNREALIZED GAIN/(LOSS) ON INVESTMENTS | 124,275,168 | 8,869,895 | (1,539,147 | ) | (1,832,505 | ) | ||||||||||
| NET INCREASE/(DECREASE) IN NET ASSETS RESULTING FROM OPERATIONS | $ | 147,561,187 | $ | 12,734,726 | $ | (1,013,260 | ) | $ | (1,246,224 | ) | ||||||
| *Net of foreign tax withholding: | $ | – | $ | 677,618 | $ | 62,141 | $ | – | ||||||||
| (a) | Includes realized gain or loss as a result of in-kind transactions (See Note 4 in Notes to Financial Statements). |
See Notes to Financial Statements.
18 | May 31, 2022
ALPS Sector Dividend Dogs ETF
Statements of Changes in Net Assets
| For the Six Months Ended May 31, 2022 (Unaudited) | For the Year Ended November 30, 2021 | |||||||
| OPERATIONS: | ||||||||
| Net investment income | $ | 23,286,019 | $ | 39,668,912 | ||||
| Net realized gain | 84,412,912 | 20,856,818 | ||||||
| Net change in unrealized appreciation | 39,862,256 | 133,811,971 | ||||||
| Net increase in net assets resulting from operations | 147,561,187 | 194,337,701 | ||||||
| Net Equalization Credits/(Debits) | 400,916 | (376,556 | ) | |||||
| DISTRIBUTIONS TO SHAREHOLDERS: | ||||||||
| From distributable earnings | (23,881,226 | ) | (41,129,463 | ) | ||||
| Total distributions | (23,881,226 | ) | (41,129,463 | ) | ||||
| CAPITAL SHARE TRANSACTIONS: | ||||||||
| Proceeds from sale of shares | 71,355,477 | 42,671,156 | ||||||
| Cost of shares redeemed | (18,777,387 | ) | (68,650,049 | ) | ||||
| Net income equalization (Note 2) | (400,916 | ) | 376,556 | |||||
| Net increase/(decrease) from share transactions | 52,177,174 | (25,602,337 | ) | |||||
| Net increase in net assets | 176,258,051 | 127,229,345 | ||||||
| NET ASSETS: | ||||||||
| Beginning of period | 1,134,743,396 | 1,007,514,051 | ||||||
| End of period | $ | 1,311,001,447 | $ | 1,134,743,396 | ||||
| OTHER INFORMATION: | ||||||||
| CAPITAL SHARE TRANSACTIONS: | ||||||||
| Beginning shares | 22,484,141 | 23,059,141 | ||||||
| Shares sold | 1,300,000 | 800,000 | ||||||
| Shares redeemed | (350,000 | ) | (1,375,000 | ) | ||||
| Shares outstanding, end of period | 23,434,141 | 22,484,141 | ||||||
See Notes to Financial Statements.
19 | May 31, 2022
ALPS International Sector Dividend Dogs ETF
Statements of Changes in Net Assets
| For the Six Months Ended May 31, 2022 (Unaudited) | For the Year Ended November 30, 2021 | |||||||
| OPERATIONS: | ||||||||
| Net investment income | $ | 3,864,831 | $ | 6,944,021 | ||||
| Net realized gain/(loss) | 2,614,847 | (3,001,108 | ) | |||||
| Net change in unrealized appreciation | 6,255,048 | 12,459,941 | ||||||
| Net increase in net assets resulting from operations | 12,734,726 | 16,402,854 | ||||||
| Net Equalization Credits/(Debits) | 172,626 | (1,568,545 | ) | |||||
| DISTRIBUTIONS TO SHAREHOLDERS: | ||||||||
| From distributable earnings | (2,850,765 | ) | (7,018,603 | ) | ||||
| From tax return of capital | – | (36,242 | ) | |||||
| Total distributions | (2,850,765 | ) | (7,054,845 | ) | ||||
| CAPITAL SHARE TRANSACTIONS: | ||||||||
| Proceeds from sale of shares | 28,181,257 | 22,093,394 | ||||||
| Cost of shares redeemed | (13,238,416 | ) | (20,383,668 | ) | ||||
| Net income equalization (Note 2) | (172,626 | ) | 1,568,545 | |||||
| Net increase from share transactions | 14,770,215 | 3,278,271 | ||||||
| Net increase in net assets | 24,826,802 | 11,057,735 | ||||||
| NET ASSETS: | ||||||||
| Beginning of period | 157,488,621 | 146,430,886 | ||||||
| End of period | $ | 182,315,423 | $ | 157,488,621 | ||||
| OTHER INFORMATION: | ||||||||
| CAPITAL SHARE TRANSACTIONS: | ||||||||
| Beginning shares | 5,950,000 | 5,900,000 | ||||||
| Shares sold | 1,000,000 | 800,000 | ||||||
| Shares redeemed | (475,000 | ) | (750,000 | ) | ||||
| Shares outstanding, end of period | 6,475,000 | 5,950,000 | ||||||
See Notes to Financial Statements.
20 | May 31, 2022
ALPS Emerging Sector Dividend Dogs ETF
Statements of Changes in Net Assets
| For the Six Months Ended May 31, 2022 (Unaudited) | For the Year Ended November 30, 2021 | |||||||
| OPERATIONS: | ||||||||
| Net investment income | $ | 525,887 | $ | 1,061,607 | ||||
| Net realized gain | 669,754 | 998,537 | ||||||
| Net change in unrealized appreciation/(depreciation) | (2,208,901 | ) | 1,419,906 | |||||
| Net increase/(decrease) in net assets resulting from operations | (1,013,260 | ) | 3,480,050 | |||||
| Net Equalization Credits | – | 19,079 | ||||||
| DISTRIBUTIONS TO SHAREHOLDERS: | ||||||||
| From distributable earnings | (305,099 | ) | (971,386 | ) | ||||
| Total distributions | (305,099 | ) | (971,386 | ) | ||||
| CAPITAL SHARE TRANSACTIONS: | ||||||||
| Proceeds from sale of shares | – | 1,275,304 | ||||||
| Net income equalization (Note 2) | – | (19,079 | ) | |||||
| Net increase from share transactions | – | 1,256,225 | ||||||
| Net increase/(decrease) in net assets | (1,318,359 | ) | 3,783,968 | |||||
| NET ASSETS: | ||||||||
| Beginning of period | 24,741,506 | 20,957,538 | ||||||
| End of period | $ | 23,423,147 | $ | 24,741,506 | ||||
| OTHER INFORMATION: | ||||||||
| CAPITAL SHARE TRANSACTIONS: | ||||||||
| Beginning shares | 1,050,000 | 1,000,000 | ||||||
| Shares sold | – | 50,000 | ||||||
| Shares redeemed | – | – | ||||||
| Shares outstanding, end of period | 1,050,000 | 1,050,000 | ||||||
See Notes to Financial Statements.
21 | May 31, 2022
ALPS REIT Dividend Dogs ETF
Statements of Changes in Net Assets
| For the Six Months Ended May 31, 2022 (Unaudited) | For the Year Ended November 30, 2021 | |||||||
| OPERATIONS: | ||||||||
| Net investment income | $ | 586,281 | $ | 770,660 | ||||
| Net realized gain/(loss) | 2,957,111 | (1,539,997 | ) | |||||
| Net change in unrealized appreciation/(depreciation) | (4,789,616 | ) | 8,191,103 | |||||
| Net increase/(decrease) in net assets resulting from operations | (1,246,224 | ) | 7,421,766 | |||||
| DISTRIBUTIONS TO SHAREHOLDERS: | ||||||||
| From distributable earnings | (611,532 | ) | (874,838 | ) | ||||
| From tax return of capital | – | (444,426 | ) | |||||
| Total distributions | (611,532 | ) | (1,319,264 | ) | ||||
| CAPITAL SHARE TRANSACTIONS: | ||||||||
| Cost of shares redeemed | (1,322,275 | ) | (3,733,564 | ) | ||||
| Net decrease from share transactions | (1,322,275 | ) | (3,733,564 | ) | ||||
| Net increase/(decrease) in net assets | (3,180,031 | ) | 2,368,938 | |||||
| NET ASSETS: | ||||||||
| Beginning of period | 28,689,422 | 26,320,484 | ||||||
| End of period | $ | 25,509,391 | $ | 28,689,422 | ||||
| OTHER INFORMATION: | ||||||||
| CAPITAL SHARE TRANSACTIONS: | ||||||||
| Beginning shares | 575,000 | 650,000 | ||||||
| Shares sold | – | – | ||||||
| Shares redeemed | (25,000 | ) | (75,000 | ) | ||||
| Shares outstanding, end of period | 550,000 | 575,000 | ||||||
See Notes to Financial Statements.
22 | May 31, 2022
ALPS Sector Dividend Dogs ETF
| Financial Highlights | For a Share Outstanding Throughout the Periods Presented |
| For the Six Months Ended May 31, 2022 (Unaudited) | For the Year Ended November 30, 2021 | For the Year Ended November 30, 2020 | For the Year Ended November 30, 2019 | For the Year Ended November 30, 2018 | For the Year Ended November 30, 2017 | |||||||||||||||||||
| NET ASSET VALUE, BEGINNING OF PERIOD | $ | 50.47 | $ | 43.69 | $ | 45.78 | $ | 44.26 | $ | 45.61 | $ | 42.29 | ||||||||||||
| INCOME/(LOSS) FROM INVESTMENT OPERATIONS: | ||||||||||||||||||||||||
| Net investment income (a) | 1.02 | 1.75 | 1.70 | 1.71 | 1.54 | 1.40 | ||||||||||||||||||
| Net realized and unrealized gain/(loss) | 5.51 | 6.84 | (2.14 | ) | 1.34 | (1.31 | ) | 3.39 | ||||||||||||||||
| Total from investment operations | 6.53 | 8.59 | (0.44 | ) | 3.05 | 0.23 | 4.79 | |||||||||||||||||
| DISTRIBUTIONS: | ||||||||||||||||||||||||
| From net investment income | (1.06 | ) | (1.81 | ) | (1.65 | ) | (1.53 | ) | (1.58 | ) | (1.42 | ) | ||||||||||||
| Tax return of capital | – | – | – | – | – | (0.05 | ) | |||||||||||||||||
| Total distributions | (1.06 | ) | (1.81 | ) | (1.65 | ) | (1.53 | ) | (1.58 | ) | (1.47 | ) | ||||||||||||
| Net increase/(decrease) in net asset value | 5.47 | 6.78 | (2.09 | ) | 1.52 | (1.35 | ) | 3.32 | ||||||||||||||||
| NET ASSET VALUE, END OF PERIOD | $ | 55.94 | $ | 50.47 | $ | 43.69 | $ | 45.78 | $ | 44.26 | $ | 45.61 | ||||||||||||
| TOTAL RETURN(b) | 13.00 | % | 19.77 | % | (0.27 | )% | 7.26 | % | 0.51 | % | 11.59 | % | ||||||||||||
| RATIOS/SUPPLEMENTAL DATA: | ||||||||||||||||||||||||
| Net assets, end of period (000s) | $ | 1,311,001 | $ | 1,134,743 | $ | 1,007,514 | $ | 1,746,784 | $ | 2,166,709 | $ | 2,322,205 | ||||||||||||
| Ratio of expenses to average net assets | 0.40 | %(c) | 0.40 | % | 0.40 | % | 0.40 | % | 0.40 | % | 0.40 | % | ||||||||||||
| Ratio of net investment income to average net assets | 3.77 | %(c) | 3.43 | % | 4.27 | % | 3.97 | % | 3.40 | % | 3.24 | % | ||||||||||||
| Portfolio turnover rate(d) | 43 | % | 54 | % | 77 | % | 55 | % | 61 | % | 48 | % | ||||||||||||
| Undistributed net investment income included in price of units issued and redeemed(a)(e) | $ | 0.02 | $ | (0.02 | ) | $ | 0.12 | $ | 0.06 | $ | 0.04 | $ | 0.03 | |||||||||||
| (a) | Based on average shares outstanding during the period. |
| (b) | Total return is calculated assuming an initial investment made at the net asset value at the beginning of the period and redemption at the net asset value on the last day of the period and assuming all distributions are reinvested at reinvestment prices. Total return calculated for a period of less than one year is not annualized. |
| (c) | Annualized. |
| (d) | Portfolio turnover for periods less than one year is not annualized and does not include securities received or delivered from processing creations or redemptions in-kind. |
| (e) | The per share amount of equalization is presented to show the impact of equalization on distributable earnings per share. |
See Notes to Financial Statements.
23 | May 31, 2022
ALPS International Sector Dividend Dogs ETF
| Financial Highlights | For a Share Outstanding Throughout the Periods Presented |
| For the Six Months Ended May 31, 2022 (Unaudited) | For the Year Ended November 30, 2021 | For the Year Ended November 30, 2020 | For the Year Ended November 30, 2019 | For the Year Ended November 30, 2018 | For the Year Ended November 30, 2017 | |||||||||||||||||||
| NET ASSET VALUE, BEGINNING OF PERIOD | $ | 26.47 | $ | 24.82 | $ | 26.88 | $ | 25.14 | $ | 28.27 | $ | 22.84 | ||||||||||||
| INCOME/(LOSS) FROM INVESTMENT OPERATIONS: | ||||||||||||||||||||||||
| Net investment income(a) | 0.64 | 1.09 | 0.75 | 1.20 | 1.15 | 0.94 | ||||||||||||||||||
| Net realized and unrealized gain/(loss) | 1.51 | 1.65 | (1.66 | ) | 1.69 | (3.19 | ) | 5.41 | ||||||||||||||||
| Total from investment operations | 2.15 | 2.74 | (0.91 | ) | 2.89 | (2.04 | ) | 6.35 | ||||||||||||||||
| DISTRIBUTIONS: | ||||||||||||||||||||||||
| From net investment income | (0.46 | ) | (1.08 | ) | (1.11 | ) | (1.15 | ) | (1.09 | ) | (0.92 | ) | ||||||||||||
| Tax return of capital | – | (0.01 | ) | (0.04 | ) | – | – | – | ||||||||||||||||
| Total distributions | (0.46 | ) | (1.09 | ) | (1.15 | ) | (1.15 | ) | (1.09 | ) | (0.92 | ) | ||||||||||||
| Net increase/(decrease) in net asset value | 1.69 | 1.65 | (2.06 | ) | 1.74 | (3.13 | ) | 5.43 | ||||||||||||||||
| NET ASSET VALUE, END OF PERIOD | $ | 28.16 | $ | 26.47 | $ | 24.82 | $ | 26.88 | $ | 25.14 | $ | 28.27 | ||||||||||||
| TOTAL RETURN(b) | 8.13 | % | 10.93 | % | (3.08 | )% | 11.79 | % | (7.47 | )% | 28.21 | % | ||||||||||||
| RATIOS/SUPPLEMENTAL DATA: | ||||||||||||||||||||||||
| Net assets, end of period (000s) | $ | 182,315 | $ | 157,489 | $ | 146,431 | $ | 221,741 | $ | 285,327 | $ | 349,184 | ||||||||||||
| Ratio of expenses to average net assets | 0.50 | %(c) | 0.50 | % | 0.50 | % | 0.50 | % | 0.50 | % | 0.50 | % | ||||||||||||
| Ratio of net investment income to average net assets | 4.63 | %(c) | 3.92 | % | 3.22 | % | 4.65 | % | 4.16 | % | 3.55 | % | ||||||||||||
| Portfolio turnover rate(d) | 44 | % | 61 | % | 79 | % | 58 | % | 72 | % | 37 | % | ||||||||||||
| Undistributed net investment income included in price of units issued and redeemed(a)(e) | $ | 0.03 | $ | (0.25 | ) | $ | 0.00 | (f) | $ | 0.04 | $ | 0.05 | $ | 0.12 | ||||||||||
| (a) | Based on average shares outstanding during the period. |
| (b) | Total return is calculated assuming an initial investment made at the net asset value at the beginning of the period and redemption at the net asset value on the last day of the period and assuming all distributions are reinvested at reinvestment prices. Total return calculated for a period of less than one year is not annualized. |
| (c) | Annualized. |
| (d) | Portfolio turnover for periods less than one year is not annualized and does not include securities received or delivered from processing creations or redemptions in-kind. |
| (e) | The per share amount of equalization is presented to show the impact of equalization on distributable earnings per share. |
| (f) | Less than $0.005. |
See Notes to Financial Statements.
24 | May 31, 2022
ALPS Emerging Sector Dividend Dogs ETF
| Financial Highlights | For a Share Outstanding Throughout the Periods Presented |
| For the Six Months Ended May 31, 2022 (Unaudited) | For the Year Ended November 30, 2021 | For the Year Ended November 30, 2020 | For the Year Ended November 30, 2019 | For the Year Ended November 30, 2018 | For the Year Ended November 30, 2017 | |||||||||||||||||||
| NET ASSET VALUE, BEGINNING OF PERIOD | $ | 23.56 | $ | 20.96 | $ | 20.67 | $ | 21.33 | $ | 24.29 | $ | 21.17 | ||||||||||||
| INCOME/(LOSS) FROM INVESTMENT OPERATIONS: | ||||||||||||||||||||||||
| Net investment income(a) | 0.50 | 1.04 | 0.56 | 0.89 | 0.91 | 0.80 | ||||||||||||||||||
| Net realized and unrealized gain/(loss) | (1.46 | ) | 2.50 | 0.42 | (0.33 | ) | (3.02 | ) | 3.06 | |||||||||||||||
| Total from investment operations | (0.96 | ) | 3.54 | 0.98 | 0.56 | (2.11 | ) | 3.86 | ||||||||||||||||
| DISTRIBUTIONS: | ||||||||||||||||||||||||
| From net investment income | (0.29 | ) | (0.94 | ) | (0.69 | ) | (1.22 | ) | (0.85 | ) | (0.74 | ) | ||||||||||||
| Total distributions | (0.29 | ) | (0.94 | ) | (0.69 | ) | (1.22 | ) | (0.85 | ) | (0.74 | ) | ||||||||||||
| Net increase/(decrease) in net asset value | (1.25 | ) | 2.60 | 0.29 | (0.66 | ) | (2.96 | ) | 3.12 | |||||||||||||||
| NET ASSET VALUE, END OF PERIOD | $ | 22.31 | $ | 23.56 | $ | 20.96 | $ | 20.67 | $ | 21.33 | $ | 24.29 | ||||||||||||
| TOTAL RETURN(b) | (4.15 | )% | 16.81 | % | 5.20 | % | 2.67 | % | (8.76 | )% | 18.37 | % | ||||||||||||
| RATIOS/SUPPLEMENTAL DATA: | ||||||||||||||||||||||||
| Net assets, end of period (000s) | $ | 23,423 | $ | 24,742 | $ | 20,958 | $ | 28,941 | $ | 35,201 | $ | 47,356 | ||||||||||||
| Ratio of expenses to average net assets | 0.60 | %(c) | 0.60 | % | 0.60 | % | 0.60 | % | 0.60 | % | 0.60 | % | ||||||||||||
| Ratio of net investment income to average net assets | 4.29 | %(c) | 4.32 | % | 2.92 | % | 4.16 | % | 3.88 | % | 3.33 | % | ||||||||||||
| Portfolio turnover rate(d) | 76 | % | 84 | % | 93 | % | 83 | % | 85 | % | 42 | % | ||||||||||||
| Undistributed net investment income included in price of units issued and redeemed(a)(e) | $ | – | $ | 0.02 | $ | 0.02 | $ | 0.01 | $ | 0.10 | $ | 0.05 | ||||||||||||
| (a) | Based on average shares outstanding during the period. |
| (b) | Total return is calculated assuming an initial investment made at the net asset value at the beginning of the period and redemption at the net asset value on the last day of the period and assuming all distributions are reinvested at reinvestment prices. Total return calculated for a period of less than one year is not annualized. |
| (c) | Annualized. |
| (d) | Portfolio turnover for periods less than one year is not annualized and does not include securities received or delivered from processing creations or redemptions in-kind. |
| (e) | The per share amount of equalization is presented to show the impact of equalization on distributable earnings per share. |
See Notes to Financial Statements.
25 | May 31, 2022
ALPS REIT Dividend Dogs ETF
| Financial Highlights | For a Share Outstanding Throughout the Periods Presented |
| For the Six Months Ended May 31, 2022 (Unaudited) | For the Year Ended November 30, 2021 | For the Year Ended November 30, 2020 (a) | For the Year Ended November 30, 2019 | For the Year Ended November 30, 2018 | For the Year Ended November 30, 2017 | |||||||||||||||||||
| NET ASSET VALUE, BEGINNING OF PERIOD | $ | 49.89 | $ | 40.49 | $ | 48.42 | $ | 44.18 | $ | 45.37 | $ | 41.31 | ||||||||||||
| INCOME/(LOSS) FROM INVESTMENT OPERATIONS: | ||||||||||||||||||||||||
| Net investment income (b) | 1.06 | 1.21 | 1.29 | 1.19 | 1.17 | 0.75 | ||||||||||||||||||
| Net realized and unrealized gain/(loss) | (3.48 | ) | 10.25 | (7.26 | ) | 4.45 | (0.53 | ) | 4.45 | |||||||||||||||
| Total from investment operations | (2.42 | ) | 11.46 | (5.97 | ) | 5.64 | 0.64 | 5.20 | ||||||||||||||||
| DISTRIBUTIONS: | ||||||||||||||||||||||||
| From net investment income | (1.09 | ) | (1.36 | ) | (1.57 | ) | (1.40 | ) | (1.83 | ) | (1.14 | ) | ||||||||||||
| Tax return of capital | – | (0.70 | ) | (0.39 | ) | – | – | – | ||||||||||||||||
| Total distributions | (1.09 | ) | (2.06 | ) | (1.96 | ) | (1.40 | ) | (1.83 | ) | (1.14 | ) | ||||||||||||
| Net increase/(decrease) in net asset value | (3.51 | ) | 9.40 | (7.93 | ) | 4.24 | (1.19 | ) | 4.06 | |||||||||||||||
| NET ASSET VALUE, END OF PERIOD | $ | 46.38 | $ | 49.89 | $ | 40.49 | $ | 48.42 | $ | 44.18 | $ | 45.37 | ||||||||||||
| TOTAL RETURN(c) | (5.08 | )% | 29.03 | % | (11.77 | )% | 13.00 | % | 1.47 | % | 12.77 | % | ||||||||||||
| RATIOS/SUPPLEMENTAL DATA: | ||||||||||||||||||||||||
| Net assets, end of period (000s) | $ | 25,509 | $ | 28,689 | $ | 26,320 | $ | 53,265 | $ | 55,222 | $ | 68,050 | ||||||||||||
| Ratio of expenses to average net assets | 0.35 | %(d) | 0.35 | % | 0.38 | %(e) | 0.55 | % | 0.55 | % | 0.55 | % | ||||||||||||
| Ratio of net investment income to average net assets | 4.29 | %(d) | 2.60 | % | 3.26 | % | 2.56 | % | 2.67 | % | 1.71 | % | ||||||||||||
| Portfolio turnover rate(f) | 60 | % | 78 | % | 148 | % | 10 | % | 14 | % | 10 | % | ||||||||||||
| (a) | Prior to January 2, 2020, the ALPS REIT Dividend Dogs ETF was known as the Cohen & Steers Global Realty Majors ETF. |
| (b) | Based on average shares outstanding during the period. |
| (c) | Total return is calculated assuming an initial investment made at the net asset value at the beginning of the period and redemption at the net asset value on the last day of the period and assuming all distributions are reinvested at reinvestment prices. Total return calculated for a period of less than one year is not annualized. |
| (d) | Annualized. |
| (e) | Effective January 2, 2020 the Fund's Advisory Fee changed from 0.55% to 0.35%. |
| (f) | Portfolio turnover for periods less than one year is not annualized and does not include securities received or delivered from processing creations or redemptions in-kind. |
See Notes to Financial Statements.
26 | May 31, 2022
ALPS ETF Trust
| Notes to Financial Statements | May 31, 2022 (Unaudited) |
1. ORGANIZATION
ALPS ETF Trust (the “Trust”), a Delaware statutory trust, is an open-end management investment company registered under the Investment Company Act of 1940, as amended (the “1940 Act”). As of May 31, 2022, the Trust consisted of nineteen separate portfolios. Each portfolio represents a separate series of the Trust. This report pertains to the ALPS Sector Dividend Dogs ETF, the ALPS International Sector Dividend Dogs ETF, the ALPS Emerging Sector Dividend Dogs ETF, and the ALPS REIT Dividend Dogs ETF (each a “Fund” and collectively, the “Funds”). Each Fund has elected to qualify as a diversified series of the Trust under the 1940 Act.
The investment objective of the ALPS Sector Dividend Dogs ETF is to seek investment results that replicate as closely as possible, before fees and expenses, the performance of the S-Network® Sector Dividend Dogs Index. The investment objective of the ALPS International Sector Dividend Dogs ETF is to seek investment results that replicate as closely as possible, before fees and expenses, the performance of the S-Network® International Sector Dividend Dogs Index. The investment objective of the ALPS Emerging Sector Dividend Dogs ETF is to seek investment results that replicate as closely as possible, before fees and expenses, the performance of the S-Network® Emerging Sector Dividend Dogs Index. The investment objective of the ALPS REIT Dividend Dogs ETF is to seek investment results that replicate as closely as possible, before fees and expenses, the performance of the S-Network® REIT Dividend Dogs Index.
The shares of the ALPS Sector Dividend Dogs ETF, the ALPS International Sector Dividend Dogs ETF, the ALPS Emerging Sector Dividend Dogs ETF, and the ALPS REIT Dividend Dogs ETF (“Shares”) are listed on the NYSE Arca, Inc. (the “NYSE Arca”). Each Fund issues and redeems Shares, at net asset value (“NAV”) in blocks of 25,000 Shares (prior to October 1, 2021 in blocks of 50,000 Shares), each of which is called a “Creation Unit”. Creation Units are issued and redeemed principally in-kind for securities included in the Underlying Index. Except when aggregated in Creation Units, Shares are not redeemable securities of the Fund.
Pursuant to the Trust’s organizational documents, its Officers and Trustees are indemnified against certain liability arising out of the performance of their duties to the Trust. Additionally, in the normal course of business, the Trust enters into contracts with service providers that contain general indemnification clauses. The Trust’s maximum exposure under these arrangements is unknown, as this would involve future claims that may be made against the Trust that have not yet occurred.
2. SIGNIFICANT ACCOUNTING POLICIES
The following is a summary of significant accounting policies consistently followed by the Funds in the preparation of the financial statements. The accompanying financial statements were prepared in accordance with accounting principles generally accepted in the United States of America (“U.S. GAAP”). The preparation of financial statements in conformity with U.S. GAAP requires management to make certain estimates and assumptions that affect the reported amounts of assets and liabilities and disclosures of contingent assets and liabilities at the date of the financial statements and the reported amounts of revenue and expenses during the period. Actual results could differ from those estimates. Each Fund is considered an investment company under U.S. GAAP and follows the accounting and reporting guidance applicable to investment companies in the Financial Accounting Standards Board (“FASB”) Accounting Standards Codification Topic 946.
A. Portfolio Valuation
Each Fund’s NAV is determined daily, as of the close of regular trading on the New York Stock Exchange (“NYSE”), normally 4:00 p.m. Eastern time, on each day the NYSE is open for trading. The NAV is computed by dividing the value of all assets of the Fund (including accrued interest and dividends), less all liabilities (including accrued expenses and dividends declared but unpaid), by the total number of shares outstanding.
Portfolio securities listed on any exchange other than the NASDAQ Stock Market LLC (“NASDAQ”) are valued at the last sale price on the business day as of which such value is being determined. If there has been no sale on such day, the securities are valued at the mean of the most recent bid and ask prices on such day. Securities traded on the NASDAQ are valued at the NASDAQ Official Closing Price as determined by NASDAQ. Portfolio securities traded on more than one securities exchange are valued at the last sale price on the business day as of which such value is being determined at the close of the exchange representing the principal market for such securities. Portfolio securities traded in the over-the-counter market, but excluding securities traded on the NASDAQ, are valued at the latest quoted sale price in such market.
The Funds’ investments are valued at market value or, in the absence of market value with respect to any portfolio securities, at fair value according to procedures adopted by the Trust’s Board of Trustees (the “Board”). When market quotations are not readily available or when events occur that make established valuation methods unreliable, securities of the Funds may be valued in good faith by or under the direction of the Board. These securities generally include, but are not limited to, restricted securities (securities which may not be publicly sold without registration under the Securities Act of 1933) for which a pricing service is unable to provide a market price; securities whose trading has been formally suspended; a security whose market price is not available from a pre-established primary pricing source or the pricing source is not willing to provide a price; a security with respect to which an event has occurred that is most likely to materially affect the value of the security after the market has closed but before the calculation of the Fund’s NAV or make it difficult or impossible to obtain a reliable market quotation; or a security whose price, as provided by the pricing service, does not reflect the security’s “fair value” due to the security being de-listed from a national exchange or the security’s primary trading market is temporarily closed at a time when, under normal conditions, it would be open. As a general principle, the current “fair value” of a security would be the amount which the owner might reasonably expect to receive from the sale on the applicable exchange or principal market. A variety of factors may be considered in determining the fair value of such securities.
27 | May 31, 2022
ALPS ETF Trust
| Notes to Financial Statements | May 31, 2022 (Unaudited) |
B. Fair Value Measurements
Each Fund discloses the classification of its fair value measurements following a three-tier hierarchy based on the inputs used to measure fair value. Inputs refer broadly to the assumptions that market participants would use in pricing the asset or liability, including assumptions about risk. Inputs may be observable or unobservable. Observable inputs reflect the assumptions market participants would use in pricing the asset or liability that are developed based on market data obtained from sources independent of the reporting entity. Unobservable inputs reflect the reporting entity’s own assumptions about the assumptions market participants would use in pricing the asset or liability that are developed based on the best information available.
Valuation techniques used to value the Funds’ investments by major category are as follows:
Equity securities, including restricted securities, for which market quotations are readily available, are valued at the last reported sale price or official closing price as reported by a third party pricing vendor on the primary market or exchange on which they are traded and are categorized as Level 1 in the hierarchy. In the event there were no sales during the day or closing prices are not available, securities are valued at the mean of the most recent quoted bid and ask prices on such day and are generally categorized as Level 2 in the hierarchy. Investments in open-end mutual funds are valued at their closing NAV each business day and are categorized as Level 1 in the hierarchy.
Changes in valuation techniques may result in transfers in or out of an assigned level within the disclosure hierarchy.
Various inputs are used in determining the value of each Fund’s investments as of the end of the reporting period. When inputs used fall into different levels of the fair value hierarchy, the level in the hierarchy within which the fair value measurement falls is determined based on the lowest level input that is significant to the fair value measurement in its entirety. The designated input levels are not necessarily an indication of the risk or liquidity associated with these investments.
These inputs are categorized in the following hierarchy under applicable financial accounting standards:
| Level 1 | – | Unadjusted quoted prices in active markets for identical investments, unrestricted assets or liabilities that a Fund has the ability to access at the measurement date; |
| Level 2 | – | Quoted prices which are not active, quoted prices for similar assets or liabilities in active markets or inputs other than quoted prices that are observable (either directly or indirectly) for substantially the full term of the asset or liability; and |
| Level 3 | – | Significant unobservable prices or inputs (including the Fund’s own assumptions in determining the fair value of investments) where there is little or no market activity for the asset or liability at the measurement date. |
The following is a summary of the inputs used to value the Funds’ investments as of May 31, 2022:
ALPS Sector Dividend Dogs ETF
| Investments in Securities at Value | Level 1 - Quoted and Unadjusted Prices | Level 2 - Other Significant Observable Inputs | Level 3 - Significant Unobservable Inputs | Total | ||||||||||||
| Common Stocks* | $ | 1,304,234,410 | $ | – | $ | – | $ | 1,304,234,410 | ||||||||
| Short Term Investments | 1,221,380 | – | – | 1,221,380 | ||||||||||||
| Total | $ | 1,305,455,790 | $ | – | $ | – | $ | 1,305,455,790 | ||||||||
ALPS International Sector Dividend Dogs ETF
| Investments in Securities at Value | Level 1 - Quoted and Unadjusted Prices | Level 2 - Other Significant Observable Inputs | Level 3 - Significant Unobservable Inputs | Total | ||||||||||||
| Common Stocks* | $ | 180,738,073 | $ | – | $ | – | $ | 180,738,073 | ||||||||
| Short Term Investments | 12,291,548 | – | – | 12,291,548 | ||||||||||||
| Total | $ | 193,029,621 | $ | – | $ | – | $ | 193,029,621 | ||||||||
28 | May 31, 2022
ALPS ETF Trust
Notes to Financial Statements May 31, 2022 (Unaudited)
ALPS Emerging Sector Dividend Dogs ETF
| Investments in Securities at Value | Level 1 - Quoted and Unadjusted Prices | Level 2 - Other Significant Observable Inputs | Level 3 - Significant Unobservable Inputs | Total | ||||||||||||
| Common Stocks* | ||||||||||||||||
| Russia | $ | – | $ | – | $ | 1,555 | $ | 1,555 | ||||||||
| Other* | 23,218,611 | – | – | 23,218,611 | ||||||||||||
| Rights and Warrants* | – | 1,085 | – | 1,085 | ||||||||||||
| Short Term Investments | 917,563 | – | – | 917,563 | ||||||||||||
| Total | $ | 24,136,174 | $ | 1,085 | $ | 1,555 | $ | 24,138,814 | ||||||||
ALPS REIT Dividend Dogs ETF
| Investments in Securities at Value | Level 1 - Quoted and Unadjusted Prices | Level 2 - Other Significant Observable Inputs | Level 3 - Significant Unobservable Inputs | Total | ||||||||||||
| Common Stocks* | $ | 25,389,848 | $ | – | $ | – | $ | 25,389,848 | ||||||||
| Short Term Investments | 103,133 | – | – | 103,133 | ||||||||||||
| Total | $ | 25,492,981 | $ | – | $ | – | $ | 25,492,981 | ||||||||
| * | For a detailed sector/country breakdown, see the accompanying Schedule of Investments. |
The Funds, except for the ALPS Emerging Sector Dividend Dogs ETF, did not have any securities that used significant unobservable inputs (Level 3) in determining fair value and there were no transfers into or out of Level 3 during the six months ended May 31, 2022. As of May 31, 2022, ALPS Emerging Sector Dividend Dogs ETF held securities classified as Level 3 in the fair value hierarchy valued at $1,555, which represents 0.1% of net assets.
C. Foreign Securities
The ALPS International Sector Dividend Dogs ETF, the ALPS Emerging Sector Dividend Dogs ETF, and the ALPS REIT Dividend Dogs ETF may directly purchase securities of foreign issuers. Investments in non-U.S. issuers may involve unique risks compared to investing in securities of U.S. issuers, including, among others, less liquidity generally, greater market volatility than U.S. securities and less complete financial information than for U.S. issuers. In addition, adverse political, economic or social developments could undermine the value of the Fund’s investments or prevent the Fund from realizing the full value of its investments. Financial reporting standards for companies based in foreign markets differ from those in the United States. Finally, the value of the currency of the country in which the Fund has invested could decline relative to the value of the U.S. dollar, which may affect the value of the investment to U.S. investors.
Because foreign markets may be open on different days than the days during which investors may purchase the shares of each Fund, the value of each Fund's securities may change on the days when investors are not able to purchase the shares of the Funds. The value of securities denominated in foreign currencies is converted into U.S. dollars using exchange rates determined daily as of the close of regular trading on the NYSE or NASDAQ. Any use of a different rate from the rates used by the Index may adversely affect a Fund's ability to track its Index.
D. Foreign Currency Translation
The books and records of the Funds are maintained in U.S. dollars. Investment valuations and other assets and liabilities initially expressed in foreign currencies are converted each business day into U.S. dollars based upon current exchange rates. The portion of realized and unrealized gains or losses on investments due to fluctuations in foreign currency exchange rates is not separately disclosed and is included in realized and unrealized gains or losses on investments, when applicable.
E. Securities Transactions and Investment Income
Securities transactions are recorded as of the trade date. Realized gains and losses from securities transactions are recorded on the specific identification in accordance with GAAP. Dividend income and capital gains distributions, if any, are recorded on the ex-dividend date, net of any foreign taxes withheld. Interest income, if any, is recorded on the accrual basis, including any amortization of premiums and accretion of discounts.
F. Dividends and Distributions to Shareholders
Dividends from net investment income for each Fund, if any, are declared and paid quarterly or as the Board may determine from time to time. Distributions of net realized capital gains earned by the Funds, if any, are distributed at least annually.
29 | May 31, 2022
ALPS ETF Trust
| Notes to Financial Statements | May 31, 2022 (Unaudited) |
G. Equalization
The ALPS Sector Dividend Dogs ETF, the ALPS International Sector Dividend Dogs ETF, and the ALPS Emerging Sector Dividend Dogs ETF utilize the accounting practice known as “Equalization” by which a portion of the proceeds from sales and costs of reacquiring the Funds’ shares, equivalent on a per share basis to the amount of distributable net investment income on the date of the transaction, is credited or charged to undistributed net investment income. As a result, undistributed net investment income per share is unaffected by sales or reacquisitions of the Funds’ shares. Amounts related to Equalization can be found on the Statement of Changes in Net Assets.
H. Real Estate Investment Trusts (“REITs”)
As part of its investments in real estate related securities, the ALPS REIT Dividend Dogs ETF (“RDOG”) will invest in REITs and is subject to certain risks associated with direct investment in REITs. REITs possess certain risks which differ from an investment in common stocks. REITs are financial vehicles that pool investors’ capital to acquire, develop and/or finance real estate and provide services to their tenants. REITs may concentrate their investments in specific geographic areas or in specific property types, e.g., regional malls, shopping centers, office buildings, apartment buildings and industrial warehouses. REITs may be affected by changes in the value of their underlying properties and by defaults by borrowers or tenants. REITs depend generally on their ability to generate cash flow to make distributions to shareowners, and certain REITs have self-liquidation provisions by which mortgages held may be paid in full and distributions of capital returns may be made at any time.
As REITs generally pay a higher rate of dividends than most other operating companies, to the extent application of RDOG’s investment strategy results in RDOG investing in REIT shares, the percentage of RDOG’s dividend income received from REIT shares will likely exceed the percentage of RDOG’s portfolio that is comprised of REIT shares. Distributions received by RDOG from REITs may consist of dividends, capital gains and/or return of capital.
Dividend income from REITs is recognized on the ex-dividend date. The calendar year-end amounts of ordinary income, capital gains, and return of capital included in distributions received from RDOG’s investments in REITs are reported to RDOG after the end of the calendar year; accordingly, RDOG estimates these amounts for accounting purposes until the characterization of REIT distributions is reported to RDOG after the end of the calendar year. Estimates are based on the most recent REIT distribution information available.
The performance of a REIT may be affected by its failure to qualify for tax-free pass-through of income under the Internal Revenue Code of 1986, as amended (the “Code”), or its failure to maintain exemption from registration under the 1940 Act. Due to RDOG’s investments in REITs, RDOG may also make distributions in excess of RDOG’s earnings and capital gains. Distributions, if any, in excess of RDOG’s earnings and profits will first reduce the adjusted tax basis of a holder’s shares and, after that basis has been reduced to zero, will constitute capital gains to the shareholder.
I. Federal Tax and Tax Basis Information
The timing and character of income and capital gain distributions are determined in accordance with income tax regulations, which may differ from U.S. GAAP. Reclassifications are made to the Funds’ capital accounts for permanent tax differences to reflect income and gains available for distribution (or available capital loss carryforwards) under income tax regulations. The amounts and characteristics of tax basis distributions and composition of distributable earnings/(accumulated losses) are finalized at fiscal year-end; accordingly, tax basis balances have not been determined as of May 31, 2022.
The tax character of distributions paid during the fiscal year ended November 30, 2021 was as follows:
| Fund | Ordinary Income | Return of Capital | ||||||
| November 30, 2021 | ||||||||
| ALPS Sector Dividend Dogs ETF | $ | 41,129,463 | $ | – | ||||
| ALPS International Sector Dividend Dogs ETF | 7,018,603 | 36,242 | ||||||
| ALPS Emerging Sector Dividend Dogs ETF | 971,386 | – | ||||||
| ALPS REIT Dividend Dogs ETF | 874,838 | 444,426 | ||||||
The character of distributions made during the year may differ from its ultimate characterization for federal income tax purposes.
30 | May 31, 2022
ALPS ETF Trust
| Notes to Financial Statements | May 31, 2022 (Unaudited) |
Under current law, capital losses maintain their character as short-term or long-term and are carried forward to the next tax year without expiration. As of November 30, 2021, the following amounts are available as carry forwards to the next tax year:
| Fund | Short-Term | Long-Term | ||||||
| ALPS Sector Dividend Dogs ETF | $ | – | $ | 278,703,992 | ||||
| ALPS International Sector Dividend Dogs ETF | 4,432,773 | 48,112,299 | ||||||
| ALPS Emerging Sector Dividend Dogs ETF | 439,844 | 8,114,494 | ||||||
| ALPS REIT Dividend Dogs ETF | 6,887,991 | 2,417,872 | ||||||
As of May 31, 2022, the cost of investments for federal income tax purposes and accumulated net unrealized appreciation/(depreciation) on investments were as follows:
| Gross Appreciation (excess of value over tax cost) | Gross Depreciation (excess of tax cost over value) | Net Unrealized Appreciation/ (Depreciation) | Cost of Investments for Income Tax Purposes | |||||||||||||
| ALPS Sector Dividend Dogs ETF | $ | 172,493,937 | $ | (59,517,171 | ) | $ | 112,976,766 | $ | 1,192,479,024 | |||||||
| ALPS International Sector Dividend Dogs ETF | 14,459,685 | (14,224,253 | ) | 235,432 | 192,794,189 | |||||||||||
| ALPS Emerging Sector Dividend Dogs ETF | 2,606,285 | (4,480,143 | ) | (1,873,858 | ) | 26,012,672 | ||||||||||
| ALPS REIT Dividend Dogs ETF | 1,672,063 | (2,992,371 | ) | (1,320,308 | ) | 26,813,289 | ||||||||||
The differences between book-basis and tax-basis are primarily due to the deferral of losses from wash sales. In addition, certain tax cost basis adjustments are finalized at fiscal year-end and therefore have not been determined as of May 31, 2022.
J. Income Taxes
No provision for income taxes is included in the accompanying financial statements, as each Fund intends to distribute to shareholders all taxable investment income and realized gains and otherwise comply with Subchapter M of the Code, applicable to regulated investment companies. Each Fund evaluates tax positions taken (or expected to be taken) in the course of preparing the Fund’s tax returns to determine whether these positions meet a “more-likely-than-not” standard that, based on the technical merits, have a more than fifty percent likelihood of being sustained by a taxing authority upon examination. A tax position that meets the “more-likely-than-not” recognition threshold is measured to determine the amount of benefit to recognize in the financial statements.
As of and during the six months ended May 31, 2022, each Fund did not have a liability for any unrecognized tax benefits. Each Fund files U.S. federal, state, and local tax returns as required. Each Fund’s tax returns are subject to examination by the relevant tax authorities until expiration of the applicable statute of limitations, which is generally three years after the filing of the tax return, but may extend to four years in certain jurisdictions. Each Fund’s tax returns for open years have incorporated no uncertain tax positions that require a provision for income taxes.
K. Lending of Portfolio Securities
The Funds have entered into a securities lending agreement with State Street Bank & Trust Co. (“SSB”), the Funds’ lending agent. Each Fund may lend its portfolio securities only to borrowers that are approved by SSB. Each Fund will limit such lending to not more than 33 1/3% of the value of its total assets. The Fund’s securities held at SSB as custodian shall be available to be lent except those securities the Fund or ALPS Advisors, Inc. specifically identifies in writing as not being available for lending. The borrower pledges and maintains with the Fund collateral consisting of cash (U.S. Dollars only), securities issued or guaranteed by the U.S. government or its agencies or instrumentalities, and cash equivalents (including irrevocable bank letters of credit) issued by a person other than the borrower or an affiliate of the borrower. The initial collateral received by the Fund is required to have a value of no less than 102% of the market value of the loaned securities for U.S equity securities and a value of no less than 105% of the market value for non-U.S. equity securities. The collateral is maintained thereafter, at a market value equal to not less than 102% of the current value of the U.S. equity securities on loan and not less than 105% of the current value of the non-U.S. equity securities on loan. The market value of the loaned securities is determined at the close of each business day and any additional required collateral is delivered to the Fund on the next business day. During the term of the loan, each Fund is entitled to all distributions made on or in respect of the loaned securities. Loans of securities are terminable at any time and the borrower, after notice, is required to return borrowed securities within the customary time period for settlement of securities transactions.
Any cash collateral received is reinvested in a money market fund managed by SSB as disclosed in the Fund’s Schedule of Investments and is reflected in the Statements of Assets and Liabilities as a payable for collateral upon return of securities loaned. Non-cash collateral, in the form of securities issued or guaranteed by the U.S. government or its agencies or instrumentalities, is not disclosed in the Fund’s Statement of Assets and Liabilities as it is held by the lending agent on behalf of the Fund, and the Fund does not have the ability to re-hypothecate these securities. Income earned by the Fund from securities lending activity is disclosed in the Statement of Operations.
31 | May 31, 2022
ALPS ETF Trust
| Notes to Financial Statements | May 31, 2022 (Unaudited) |
The following is a summary of the Fund's securities lending agreement and related cash and non-cash collateral received as of May 31, 2022:
| Fund | Market Value of Securities on Loan | Cash Collateral Received | Non-Cash Collateral Received | Total Collateral Received | ||||||||||||
| ALPS Emerging Sector Dividend Dogs ETF | $ | 1,187,927 | $ | 876,302 | $ | 384,421 | $ | 1,260,723 | ||||||||
| ALPS International Sector Dividend Dogs ETF | 11,477,826 | 11,767,319 | 24,202 | 11,791,521 | ||||||||||||
The risks of securities lending include the risk that the borrower may not provide additional collateral when required or may not return the securities when due. To mitigate these risks, the Funds benefit from a borrower default indemnity provided by SSB. SSB’s indemnity allows for full replacement of securities lent wherein SSB will purchase the unreturned loaned securities on the open market by applying the proceeds of the collateral, or to the extent such proceeds are insufficient or the collateral is unavailable, SSB will purchase the unreturned loan securities at SSB’s expense. However, the Funds could suffer a loss if the value of the investments purchased with cash collateral falls below the value of the cash collateral received.
The following table reflects a breakdown of transactions accounted for as secured borrowings, the gross obligation by the type of collateral pledged or securities loaned, and the remaining contractual maturity of those transactions as of May 31, 2022:
| ALPS International Sector Dividend Dogs ETF | Remaining contractual maturity of the agreements |
| Securities Lending Transactions | Overnight & Continuous | Up to 30 days | 30-90 days | Greater than 90 days | Total | |||||||||||||||
| Common Stocks | $ | 11,767,319 | $ | – | $ | – | $ | – | $ | 11,767,319 | ||||||||||
| Total Borrowings | 11,767,319 | |||||||||||||||||||
| Gross amount of recognized liabilities for securities lending (collateral received) | $ | 11,767,319 | ||||||||||||||||||
| ALPS Emerging Sector Dividend Dogs ETF | Remaining contractual maturity of the agreements |
| Securities Lending Transactions | Overnight & Continuous | Up to 30 days | 30-90 days | Greater than 90 days | Total | |||||||||||||||
| Common Stocks | $ | 876,302 | $ | – | $ | – | $ | – | $ | 876,302 | ||||||||||
| Total Borrowings | 876,302 | |||||||||||||||||||
| Gross amount of recognized liabilities for securities lending (collateral received) | $ | 876,302 | ||||||||||||||||||
3. INVESTMENT ADVISORY FEE AND OTHER AFFILIATED TRANSACTIONS
ALPS Advisors, Inc. (the “Adviser”) serves as the Funds’ investment adviser pursuant to an Investment Advisory Agreement with the Trust on behalf of each Fund (the “Advisory Agreement”). Pursuant to the Advisory Agreement, each Fund pays the Adviser an annual management fee for the services and facilities it provides, payable on a monthly basis as a percentage of the relevant Fund’s average daily net assets as set out below. From time to time, the Adviser may waive all or a portion of its fee.
| Fund | Advisory Fee |
| ALPS Sector Dividend Dogs ETF | 0.40% |
| ALPS International Sector Dividend Dogs ETF | 0.50% |
| ALPS Emerging Sector Dividend Dogs ETF | 0.60% |
| ALPS REIT Dividend Dogs ETF | 0.35% |
Out of the unitary management fee, the Adviser pays substantially all expenses of each Fund, including licensing fees to the Underlying Index provider, the cost of transfer agency, custody, fund administration, legal, audit, trustees and other services, except for interest expenses, distribution fees or expenses, brokerage expenses, taxes and extraordinary expenses not incurred in the ordinary course of each Fund's business. The Adviser’s unitary management fee is designed to pay substantially all of each Fund's expenses and to compensate the Adviser for providing services for each Fund.
32 | May 31, 2022
ALPS ETF Trust
| Notes to Financial Statements | May 31, 2022 (Unaudited) |
ALPS Fund Services, Inc., an affiliate of the Adviser, is the administrator of the Funds.
Prior to February 16, 2022, each Trustee received (1) a quarterly retainer of $10,000, (2) a per meeting fee of $5,000, (3) $1,500 for any special meeting held outside of a regularly scheduled board meeting, and (4) reimbursement for all reasonable out-of-pocket expenses relating to attendance at meetings. In addition, the Chairman of the Board and Chairman of the Audit Committee each received a quarterly retainer of $2,000, in connection with their respective roles. Effective February 16, 2022, each Trustee receives (1) a quarterly retainer of $20,000, (2) a per meeting fee of $10,000, (3) $2,500 for any special meeting held outside of a regularly scheduled board meeting, and (4) reimbursement for all reasonable out-of-pocket expenses relating to attendance at meetings. In addition, the Chairman of the Board receives a quarterly retainer of $5,000, the Chairman of the Audit Committee receives a quarterly retainer of $3,000, and the Chairman of the Nominating & Governance Committee receives a quarterly retainer of $2,000, each in connection with their respective roles.
4. PURCHASES AND SALES OF SECURITIES
For the six months ended May 31, 2022, the cost of purchases and proceeds from sales of investment securities, excluding short-term investments and in-kind transactions, were as follows:
| Fund | Purchases | Sales | ||||||
| ALPS Sector Dividend Dogs ETF | $ | 524,572,481 | $ | 525,850,361 | ||||
| ALPS International Sector Dividend Dogs ETF | 72,787,398 | 71,989,441 | ||||||
| ALPS Emerging Sector Dividend Dogs ETF | 18,687,900 | 18,598,538 | ||||||
| ALPS REIT Dividend Dogs ETF | 16,301,560 | 16,387,346 | ||||||
For the six months ended May 31, 2022, the cost of in-kind purchases and proceeds from in-kind sales were as follows:
| Fund | Purchases | Sales | ||||||
| ALPS Sector Dividend Dogs ETF | $ | 71,344,674 | $ | 18,773,348 | ||||
| ALPS International Sector Dividend Dogs ETF | 27,934,417 | 13,215,589 | ||||||
| ALPS REIT Dividend Dogs ETF | – | 1,322,194 | ||||||
For the six months ended May 31, 2022, the in-kind net realized gains/(losses) were as follows:
| Fund | Net Realized Gain/(Loss) | |||
| ALPS Sector Dividend Dogs ETF | $ | 2,960,315 | ||
| ALPS International Sector Dividend Dogs ETF | 1,265,065 | |||
| ALPS REIT Dividend Dogs ETF | 177,216 | |||
Gains on in-kind transactions are not considered taxable for federal income tax purposes and losses on in-kind transactions are also not deductible for tax purposes.
5. CAPITAL SHARE TRANSACTIONS
Shares are created and redeemed by each Fund only in Creation Unit size aggregations of 25,000 shares (prior to October 1, 2021, the Creation Unit size was 50,000 Shares). Only broker-dealers or large institutional investors with creation and redemption agreements called Authorized Participants (“AP”) are permitted to purchase or redeem Creation Units from the Funds. Such transactions are generally permitted on an in-kind basis, with a balancing cash component to equate the transaction to the NAV per unit of each Fund on the transaction date. Cash may be substituted equivalent to the value of certain securities generally when they are not available in sufficient quantity for delivery, not eligible for trading by the AP or as a result of other market circumstances.
6. RELATED PARTY TRANSACTIONS
The ALPS Sector Dvidend Dogs ETF engaged in cross trades between other funds in the Trust during the six months ended May 31, 2022 pursuant to Rule 17a-7 under the 1940 Act. Cross trading is the buying or selling of portfolio securities between funds to which the Adviser serves as the investment adviser. The Board previously adopted procedures that apply to transactions between the Funds of the Trust pursuant to Rule 17a-7. These transactions related to cross trades during the period complied with the requirements set forth by Rule 17a-7 and the Trust’s procedures.
33 | May 31, 2022
ALPS ETF Trust
| Notes to Financial Statements | May 31, 2022 (Unaudited) |
Transactions related to cross trades during the six months ended May 31, 2022, were as follows:
| Purchase cost paid | Sale proceeds received | Realized gain/(loss) on sales | ||||||||||
| ALPS Sector Dividend Dogs ETF | $ | 423,942 | $ | 686,814 | $ | 54,037 | ||||||
7. MARKET RISK
The Funds are subject to investment and operational risks associated with financial, economic and other global market developments and disruptions, including the recent spread of an infectious respiratory illness caused by a novel strain of coronavirus (known as COVID-19), which can negatively impact the securities markets and cause each Fund to lose value. Securities in each Fund’s portfolio may underperform in comparison to securities in general financial markets, a particular financial market or other asset classes due to a number of factors, including inflation (or expectations for inflation), deflation (or expectations for deflation), interest rates, global demand for particular products or resources, market instability, debt crises and downgrades, embargoes, tariffs, sanctions and other trade barriers, regulatory events, other governmental trade or market control programs and related geopolitical events. In addition, the value of the Fund’s investments may be negatively affected by the occurrence of global events such as war, terrorism, environmental disasters, natural disasters or events, country instability, and infectious disease epidemics or pandemics.
The spread of COVID-19 has caused volatility, severe market dislocations and liquidity constraints in many markets, including markets for the securities each Fund holds, and may adversely affect each Fund’s investments and operations. The transmission of COVID-19 and efforts to contain its spread have resulted in travel restrictions and disruptions, closed international borders, enhanced health screenings at ports of entry and elsewhere, disruption of and delays in healthcare service preparation and delivery, quarantines, event and service cancellations or interruptions, disruptions to business operations and supply chains, and a reduction in consumer and business spending, as well as general concern and uncertainty that has negatively affected the economy. These disruptions have led to instability in the market place and the jobs market. The impact of COVID-19 could adversely affect the economies of many nations or the entire global economy, the financial well-being and performance of individual issuers, borrowers and sectors and the health of the markets generally in potentially significant and unforeseen ways.
The foregoing could lead to a significant economic downturn or recession, increased market volatility, a greater number of market closures, higher default rates and adverse effects on the values and liquidity of each Fund’s securities or other assets. Such impacts may adversely affect the performance of the Funds.
8. SUBSEQUENT EVENTS
Effective as of the close of business on March 31, 2022, Deloitte & Touche LLP (“Deloitte”) resigned as the independent registered public accounting firm for the Funds. The report of Deloitte on the Funds’ financial statements as of and for the fiscal years or periods ended November 30, 2021 and November 30, 2020 did not contain an adverse opinion or a disclaimer of opinion, and was not qualified or modified as to uncertainties, audit scope or accounting principles. During the Funds’ fiscal year or period ended November 30, 2021 and November 30, 2020, and through March 31, 2022, there were no disagreements between the Funds and Deloitte on any matter of accounting principles or practices, financial statement disclosure or auditing scope or procedure, which disagreements, if not resolved to the satisfaction of Deloitte, would have caused it to make reference to the subject matter of the disagreements in its report on the financial statements of the Funds for such year or period. During the Funds’ fiscal years or periods ended November 30, 2021 and November 30, 2020, there were no “reportable events” (as defined in Item 304(a)(1)(v) of Regulation S-K under the Securities Exchange Act of 1934, as amended (the “Exchange Act”)).
During each Fund’s fiscal year or period ended November 30, 2021 and November 30, 2020, and during the subsequent interim period through March 31, 2022, neither the Funds, nor anyone on their behalf, consulted with Deloitte, on behalf of the Funds, regarding any matter that was either the subject of a “disagreement,” as defined in Item 304(a)(1)(iv) of Regulation S-K under the Securities Exchange Act of 1934, as amended (the “Exchange Act”), and the instructions thereto, or a “reportable event,” as defined in Item 304(a)(1)(v) of Regulation S-K under the Exchange Act.
On June 21, 2022, upon the recommendation of the Funds’ Audit Committee, the Board of Trustees of the Funds approved the engagement of BBD, LLP (“BBD”) as the independent registered public accounting firm for each Fund for the fiscal year ending November 30, 2022. The Board and its Audit Committee considered the engagement of BBD in connection with the resignation of the Funds’ former independent registered accounting firm on March 31, 2022.
34 | May 31, 2022
ALPS ETF Trust
| Additional Information | May 31, 2022 (Unaudited) |
PROXY VOTING POLICIES AND PROCEDURES
Information regarding how the Fund voted proxies relating to portfolio securities during the most recent 12-month period ended June 30 and a description of the Fund’s proxy voting policies and procedures used in determining how to vote for proxies are available without charge on the SEC’s website at www.sec.gov and upon request, by calling (toll-free) 1-866-759-5679.
PORTFOLIO HOLDINGS
The Fund files a complete schedule of portfolio holdings with the U.S. Securities and Exchange Commission (“SEC”) for the first and third quarters of each fiscal year on Form N-PORT within 60 days after the end of the period. Copies of the Fund’s Form N-PORT are available without a charge, upon request, by contacting the Fund at 1-866-759-5679 and on the SEC’s website at https://www.sec.gov.
TAX INFORMATION
The Funds designate the following as a percentage of taxable ordinary income distributions, or up to the maximum amount allowable, for the calendar year ended December 31, 2021:
| Qualified Dividend Income | Dividend Received Deduction | 199A | |
| ALPS Sector Dividend Dogs ETF | 97.81% | 91.15% | 0.00% |
| ALPS International Sector Dividend Dogs ETF | 100.00% | 0.00% | 0.00% |
| ALPS Emerging Sector Dividend Dogs ETF | 73.67% | 0.00% | 0.00% |
| ALPS REIT Dividend Dogs ETF | 0.47% | 0.00% | 70.35% |
In early 2022, if applicable, shareholders of record received this information for the distributions paid to them by the Funds during the calendar year 2021 via Form 1099. The Funds will notify shareholders in early 2023 of amounts paid to them by the Funds, if any, during the calendar year 2022.
LICENSING AGREEMENTS
ALPS Sector Dividend Dogs ETF, ALPS International Sector Dividend Dogs ETF, ALPS Emerging Sector Dividend Dogs ETF, and ALPS REIT Dividend Dogs ETF
The Funds are not sponsored, endorsed, sold or promoted by S-Network Global Indexes, Inc.SM (“Licensor”). Licensor makes no representation or warranty, express or implied, to the owners of the Funds or any member of the public regarding the advisability of investing in securities generally or in the Funds particularly or the ability of the (i) SDOG, S-Network Sector Dividend DogsSM, (ii) IDOG, S-Network International Sector Dividend DogsSM, (iii) EDOG, S-Network Emerging Sector Dividend Dogs IndexSM, and (iv) RDOG, S-Network REIT Dividend Dogs IndexSM (each an “Underlying Index”) to track the performance of a market or sector. Licensor’s only relationship to the Licensee is the licensing of certain service marks and trade names of Licensor and of the Underlying Index that is determined, composed and calculated by Licensor without regard to the Licensee or the Fund. Licensor has no obligation to take the needs of the Licensee or the owners of the Fund into consideration in determining, composing or calculating the Underlying Index. Licensor is not responsible for and has not participated in the determination of the timing of, prices at, or quantities of the Fund to be issued or in the determination or calculation of the equation by which the Fund is to be converted into cash. Licensor has no obligation or liability in connection with the administration, marketing or trading of the Fund.
LICENSOR DOES NOT GUARANTEE THE ACCURACY AND/OR THE COMPLETENESS OF THE UNDERLYING INDEX OR ANY DATA INCLUDED THEREIN AND LICENSOR SHALL HAVE NO LIABILITY FOR ANY ERRORS, OMISSIONS, OR INTERRUPTIONS THEREIN. LICENSOR MAKES NO WARRANTY, EXPRESS OR IMPLIED, AS TO RESULTS TO BE OBTAINED BY LICENSEE, OWNERS OF THE FUND, OR ANY OTHER PERSON OR ENTITY FROM THE USE OF THE UNDERLYING INDEX OR ANY DATA INCLUDED THEREIN. LICENSOR MAKES NO EXPRESS OR IMPLIED WARRANTIES, AND EXPRESSLY DISCLAIMS ALL WARRANTIES OF MERCHANTABILITY OR FITNESS FOR A PARTICULAR PURPOSE OR USE WITH RESPECT TO THE UNDERLYING INDEX OR ANY DATA INCLUDED THEREIN. WITHOUT LIMITING ANY OF THE FOREGOING, IN NO EVENT SHALL LICENSOR HAVE ANY LIABILITY FOR ANY SPECIAL, PUNITIVE, INDIRECT, OR CONSEQUENTIAL DAMAGES (INCLUDING LOST PROFITS), EVEN IF NOTIFIED OF THE POSSIBILITY OF SUCH DAMAGES.
35 | May 31, 2022
ALPS ETF Trust
| Additional Information | May 31, 2022 (Unaudited) |
The Funds are not sponsored, endorsed, sold or promoted by Standard & Poor’s, a division of The McGraw-Hill Companies, Inc. (“S&P”) or its third party licensors. Neither S&P nor its third party licensors make any representation or warranty, express or implied, to the owners of each Fund or any member of the public regarding the advisability of investing in securities generally or in each Fund particularly or the ability of each Underlying Index to track general stock market performance. S&P’s and its third party licensor’s only relationship to the Index Provider is the licensing of certain trademarks, service marks and trade names of S&P and/or its third party licensors and for the providing of calculation and maintenance services related to the Underlying Index. Neither S&P nor its third party licensors is responsible for and has not participated in the determination of the prices and amount of each Fund or the timing of the issuance or sale of each Fund or in the determination or calculation of the equation by which each Fund is to be converted into cash. S&P has no obligation or liability in connection with the administration, marketing or trading of each Fund.
NEITHER S&P, ITS AFFILIATES NOR THEIR THIRD PARTY LICENSORS GUARANTEE THE ADEQUACY, ACCURACY, TIMELINESS OR COMPLETENESS OF EACH UNDERLYING INDEX OR ANY DATA INCLUDED THEREIN OR ANY COMMUNICATIONS, INCLUDING BUT NOT LIMITED TO, ORAL OR WRITTEN COMMUNICATIONS (INCLUDING ELECTRONIC COMMUNICATIONS) WITH RESPECT THERETO. S&P, ITS AFFILIATES AND THEIR THIRD PARTY LICENSORS SHALL NOT BE SUBJECT TO ANY DAMAGES OR LIABILITY FOR ANY ERRORS, OMISSIONS OR DELAYS THEREIN. S&P MAKES NO EXPRESS OR IMPLIED WARRANTIES, AND EXPRESSLY DISCLAIMS ALL WARRANTIES OF MERCHANTABILITY OR FITNESS FOR A PARTICULAR PURPOSE OR USE WITH RESPECT TO ITS TRADEMARKS, EACH UNDERLYING INDEX OR ANY DATA INCLUDED THEREIN. WITHOUT LIMITING ANY OF THE FOREGOING, IN NO EVENT WHATSOEVER SHALL S&P, ITS AFFILIATES OR THEIR THIRD PARTY LICENSORS BE LIABLE FOR ANY INDIRECT, SPECIAL, INCIDENTAL, PUNITIVE OR CONSEQUENTIAL DAMAGES, INCLUDING BUT NOT LIMITED TO, LOSS OF PROFITS, TRADING LOSSES, LOST TIME OR GOODWILL, EVEN IF THEY HAVE BEEN ADVISED OF THE POSSIBILITY OF SUCH DAMAGES, WHETHER IN CONTRACT, TORT, STRICT LIABILITY OR OTHERWISE.
Standard & Poor’s® and S&P® are registered trademarks of The McGraw-Hill Companies, Inc.; “Calculated by S&P Custom Indices” and its related stylized mark are service marks of The McGraw-Hill Companies, Inc. These marks have been licensed for use by the Index Provider.
The S&P 500® is the property of Standard and Poor’s Financial Services LLC (“S&P”) and has been licensed by S&P for use by S-Network® Global Indexes, Inc. in connection with the S-Network® Sector Dividend Dogs Index (Ticker: SDOGX), the S-Network® International Sector Dividend Dogs Index (Ticker: IDOGX), the S-Network® Emerging Sector Dividend Dogs Index (Ticker: EDOGX), and the S-Network® REIT Dividend Dogs Index (Ticker: RDOGX).
The Adviser does not guarantee the accuracy and/or the completeness of each Underlying Index or any data included therein, and the Adviser shall have no liability for any errors, omissions or interruptions therein. The Adviser makes no warranty, express or implied, as to results to be obtained by each Fund, owners of the Shares of each Fund or any other person or entity from the use of each Underlying Index or any data included therein. The Adviser makes no express or implied warranties, and expressly disclaims all warranties of merchantability or fitness for a particular purpose or use with respect to each Underlying Index or any data included therein. Without limiting any of the foregoing, in no event shall the Adviser have any liability for any special, punitive, direct, indirect or consequential damages (including lost profits) arising out of matters relating to the use of each Underlying Index, even if notified of the possibility of such damages.
36 | May 31, 2022
ALPS ETF Trust
| Liquidity Risk Management Program | May 31, 2022 (Unaudited) |
In compliance with the Securities and Exchange Commission’s liquidity risk management rule (the “Liquidity Rule”), the ALPS ETF Trust (the “Trust”) has established a liquidity risk management program (the “Program”) to govern the Trust’s approach to managing liquidity risk for each series of the Trust (each a “Fund”). The Program is overseen by the Liquidity Committee (the “Committee”), a committee comprised of representatives of the Trust’s investment adviser, ALPS Advisors, Inc. The Trust’s Board of Trustees (the “Board”) has approved the designation of the Committee to oversee the Program.
The Program’s principal objectives include supporting each Fund’s compliance with limits on investments in illiquid assets and assessing and managing the risk that a Fund will be unable to meet its redemption obligations without significant dilution of remaining investors’ interests in the Fund. The Program includes a number of elements that support the management and assessment of liquidity risk, including an annual assessment of factors that influence a Fund’s liquidity and, for Funds that are not “In-Kind ETFs,” the periodic classification and re-classification of such Fund’s investments into groupings that reflect the Committee’s assessment of their liquidity under current market conditions.
At a meeting of the Board held on March 7, 2022, the Trustees received a report from the Committee regarding the design and operational effectiveness of the Program for the period January 1, 2021 through December 31, 2021 (the “Period”). The Committee determined, and reported to the Board, that the Program has been operating effectively to assess and manage each Fund’s liquidity risk and has been and continues to be adequately and effectively implemented to monitor and (as applicable) respond to the Funds’ liquidity developments.
The Committee reported that during the period covered by the report, there were no liquidity events that impacted the Funds or their ability to timely meet redemptions without dilution to existing shareholders. The report also discussed notable events affecting liquidity over the Period, including extended market holidays and closures in certain countries. Among other things, the Committee’s report noted that no Fund is required to have a highly liquid investment minimum based either on its status as an In-Kind ETF or on its ability to rely on another exemption under the Liquidity Rule. The Committee’s report further noted that no material changes have been made to the Program since its implementation.
37 | May 31, 2022


TABLE OF CONTENTS
| Performance Overview | 1 |
| Disclosure of Fund Expenses | 3 |
| Schedule of Investments | 4 |
| Statement of Assets and Liabilities | 9 |
| Statement of Operations | 10 |
| Statements of Changes in Net Assets | 11 |
| Financial Highlights | 12 |
| Notes to Financial Statements | 13 |
| Additional Information | 19 |
| Liquidity Risk Management Program | 21 |
Barron’s 400SM ETF
| Performance Overview | May 31, 2022 (Unaudited) |
Investment Objective
The Barron’s 400SM ETF (the “Fund” or “BFOR”) seeks investment results that correspond generally, before fees and expenses, to the performance of the Barron’s 400 IndexSM (the “Underlying Index”). The Underlying Index is a rules-based index intended to give investors a means of tracking the overall performance of high performing equity securities of U.S. companies. The Fund will invest at least 80% of its total assets in the equity securities which comprise the Underlying Index.
The Underlying Index generally consists of 400 stocks. The Underlying Index’s stocks are constituents of the MarketGrader U.S. Coverage Universe. In compiling the Underlying Index, MarketGrader Capital, LLC (the “Index Provider”) selects the 400 stocks from the MarketGrader U.S. Coverage Universe by using a methodology that selects components based on the strength of their fundamentals in growth, value, profitability and cash flow and then screens such potential Underlying Index components for certain criteria regarding concentration, market capitalization, and liquidity. The eligible stocks that are selected for inclusion in the Underlying Index’s portfolio are equally weighted. The Underlying Index is rebalanced by the Index Provider semiannually, on the third Friday of March and September each year.
Performance (as of May 31, 2022)
| 6 Months | 1 Year | 5 Year | Since Inception^ | |
| Barron’s 400SM ETF – NAV | -8.41% | -3.43% | 9.71% | 10.33% |
| Barron’s 400SM ETF – Market Price* | -8.44% | -3.47% | 9.70% | 10.33% |
| Barron’s 400 IndexSM | -8.07% | -2.79% | 10.43% | 11.07% |
Total Expense Ratio (per the current prospectus) is 0.65%
Performance data quoted represents past performance. Past performance does not guarantee future results. Total return figures assume reinvestment of dividends and capital gains distributions, if any. The table does not reflect the deduction of taxes that a shareholder would pay on Fund distributions or the redemption of Fund shares. Investment return and principal value of an investment will fluctuate so that an investor’s shares, when sold or redeemed, may be worth more or less than the original cost. Current performance data may be higher or lower than actual data quoted. For the most current month-end performance data please visit www.alpsfunds.com or call 1.866.759.5679.
NAV is an exchange-traded fund’s per-share value. The per-share dollar amount of the Fund is derived by dividing the total value of all the securities in its portfolio, less any liabilities, by the number of Fund shares outstanding. Market Price is the price at which a share can currently be traded in the market. Information detailing the number of days the Market Price of the Fund was greater than the Fund’s NAV and the number of days it was less than the Fund’s NAV can be obtained at www.alpsfunds.com.
| ^ | The Fund commenced Investment Operations on June 4, 2013. |
| * | Market Price means the official closing price of a share or, if it more accurately reflects the market value of a share at the time as of which the Fund calculates current net asset value per share, the price that is the midpoint of the bid-ask spread as of that time. It does not represent the returns an investor would receive if shares were traded at other times. |
The Barron’s 400 IndexSM, calculated by NYSE Arca or its affiliates, measures the performance of a diversified group of U.S. companies selected in part based on fundamentals-related rules-based criteria. The index includes companies that have scored highest according to fundamentals-related rankings calculated by MarketGrader Capital, LLC. Additional rules-based screening provides for sector and market cap diversification. The Underlying Index has been licensed by MarketGrader for use with the Barron’s 400SM ETF.
The index is not actively managed and does not reflect any deductions for fees, expenses or taxes. One cannot invest directly in an index. Index performance does not reflect Fund performance.
Funds that emphasize investments in small/mid cap companies will generally experience greater price volatility.
Barron’s 400SM ETF shares are not individually redeemable. Investors buy and sell shares of the Barron’s 400SM ETF on a secondary market. Only market makers or “authorized participants” may trade directly with the Fund, typically in blocks of 25,000 shares.
The Barron’s 400SM ETF is not suitable for all investors. Investments in the Fund are subject to investment risks, including possible loss of the principal amount invested.
ALPS Portfolio Solutions Distributor, Inc., a FINRA member, is the distributor for the Fund.
1 | May 31, 2022
Barron’s 400SM ETF
| Performance Overview | May 31, 2022 (Unaudited) |
Top 10 Holdings* (as of May 31, 2022)
| San Juan Basin Royalty Trust | 0.52% |
| SandRidge Energy, Inc. | 0.44% |
| Citizens Financial Group, Inc. | 0.41% |
| VAALCO Energy, Inc. | 0.38% |
| Coterra Energy, Inc. | 0.37% |
| Marathon Oil Corp. | 0.37% |
| Devon Energy Corp. | 0.36% |
| Civitas Resources, Inc. | 0.35% |
| Golden Ocean Group, Ltd. | 0.34% |
| Photronics, Inc. | 0.34% |
| Total % of Top 10 Holdings | 3.88% |
| * | % of Total Investments (excluding investments purchased with collateral from securities loaned). |
Future holdings are subject to change.
Sector Allocation* (as of May 31, 2022)
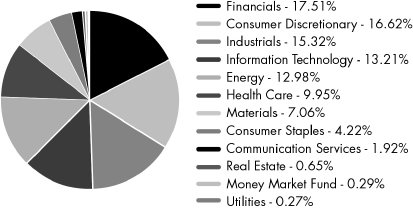
Growth of $10,000 (as of May 31, 2022)
Comparison of change in value of a $10,000 investment in the Fund and the Underlying Index
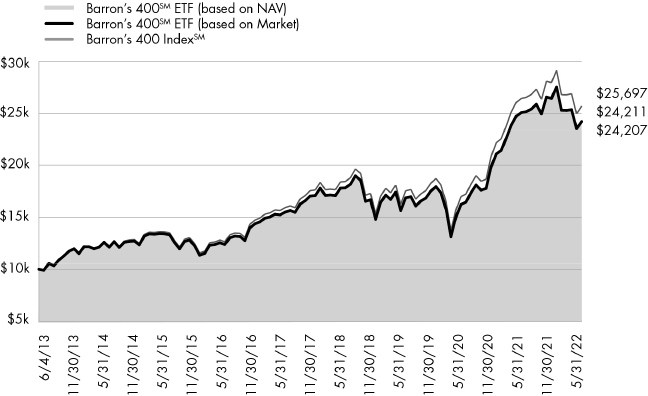
The chart above compares historical performance of a hypothetical investment of $10,000 in the Fund since inception with the performance of the Fund’s benchmark index. Results include the reinvestment of all dividends and capital gains distributions. Past performance does not guarantee future results. The chart does not reflect the deduction of taxes that a shareholder would pay on Fund distributions or the redemption of Fund shares.
2 | May 31, 2022
Barron’s 400SM ETF
| Disclosure of Fund Expenses | May 31, 2022 (Unaudited) |
Shareholder Expense Example: As a shareholder of the Fund, you incur certain ongoing costs, including management fees and other Fund expenses. These examples are intended to help you understand your ongoing costs (in dollars) of investing in the Fund and to compare these costs with the ongoing costs of investing in other funds. It is based on an investment of $1,000 invested at the beginning of the six month period and held through May 31, 2022.
Actual Return: The first line of the table provides information about actual account values and actual expenses. You may use the information in this line, together with the amount you invested, to estimate the expenses that you incurred over the period. Simply divide your account value by $1,000 (for example, an $8,600 account value divided by $1,000 = 8.6), then multiply the result by the number in the first line under the heading entitled “Expenses Paid During Period” to estimate the expenses attributable to your investment during this period.
Hypothetical 5% Return: The second line of the table provides information about hypothetical account values and hypothetical expenses based on the Fund’s actual expense ratio and an assumed rate of return of 5% per year before expenses, which is not the Fund’s actual return. The hypothetical account values and expenses may not be used to estimate the actual ending account balance or expenses you paid for the period. You may use this information to compare ongoing costs of investing in the Fund and other funds. To do so, compare this 5% hypothetical example with the 5% hypothetical examples that appear in the shareholder reports of other funds.
The expenses shown in the table are meant to highlight ongoing Fund costs only and do not reflect any transaction costs, such as brokerage commissions and other fees to financial intermediaries. Therefore, the second line is useful in comparing ongoing costs only, and will not help you determine the relative total costs of owning different funds. In addition, if these costs were included, your costs would have been higher.
| Beginning Account Value 12/1/21 | Ending Account Value 5/31/22 | Expense Ratio(a) | Expenses Paid During Period 12/1/21 - 5/31/22(b) | |||||||||||||
| Barron's 400 ETF | ||||||||||||||||
| Actual | $ | 1,000.00 | $ | 915.90 | 0.65 | % | $ | 3.10 | ||||||||
| Hypothetical (5% return before expenses) | $ | 1,000.00 | $ | 1,021.69 | 0.65 | % | $ | 3.28 | ||||||||
| (a) | Annualized, based on the Fund's most recent fiscal half year expenses. |
| (b) | Expenses are equal to the Fund's annualized expense ratio multiplied by the average account value over the period, multiplied by the number of days in the most recent fiscal half year (182), divided by 365. |
3 | May 31, 2022
Barron’s 400SM ETF
| Schedule of Investments | May 31, 2022 (Unaudited) |
| Security Description | Shares | Value | ||||||
| COMMON STOCKS (97.68%) | ||||||||
| Communication Services (1.92%) | ||||||||
| Activision Blizzard, Inc. | 4,390 | $ | 341,893 | |||||
| Alphabet, Inc., Class A(a) | 137 | 311,708 | ||||||
| Entravision Communications | ||||||||
| Corp., Class A | 56,080 | 293,298 | ||||||
| Fox Corp., Class A | 8,839 | 313,873 | ||||||
| Interpublic Group of Cos., Inc. | 10,015 | 322,783 | ||||||
| Omnicom Group, Inc. | 4,316 | 322,017 | ||||||
| Paramount Global(b) | 10,020 | 343,987 | ||||||
| World Wrestling Entertainment, Inc., Class A(b) | 6,280 | 419,316 | ||||||
| Total Communication Services | 2,668,875 | |||||||
| Consumer Discretionary (16.60%) | ||||||||
| Academy Sports & Outdoors, Inc.(b) | 9,744 | 326,521 | ||||||
| American Eagle Outfitters, Inc. | 19,310 | 233,844 | ||||||
| Asbury Automotive Group, Inc.(a) | 1,899 | 344,004 | ||||||
| AutoNation, Inc.(a) | 3,024 | 361,549 | ||||||
| AutoZone, Inc.(a) | 185 | 381,035 | ||||||
| Best Buy Co., Inc. | 3,521 | 288,933 | ||||||
| Big 5 Sporting Goods Corp.(b) | 21,646 | 275,987 | ||||||
| Boot Barn Holdings, Inc.(a) | 3,903 | 314,972 | ||||||
| Boyd Gaming Corp. | 5,279 | 310,247 | ||||||
| Brunswick Corp. | 3,966 | 298,362 | ||||||
| Buckle, Inc. | 9,657 | 317,329 | ||||||
| Build-A-Bear Workshop, Inc. | 20,710 | 422,277 | ||||||
| Cavco Industries, Inc.(a) | 1,260 | 279,922 | ||||||
| Children's Place, Inc.(a) | 6,720 | 319,066 | ||||||
| Churchill Downs, Inc. | 1,600 | 323,888 | ||||||
| Columbia Sportswear Co. | 3,939 | 306,375 | ||||||
| Crocs, Inc.(a) | 4,823 | 268,930 | ||||||
| Darden Restaurants, Inc. | 2,815 | 351,875 | ||||||
| Dick's Sporting Goods, Inc.(b) | 3,134 | 254,575 | ||||||
| Dillard's, Inc., Class A(b) | 1,308 | 394,336 | ||||||
| Dollar General Corp. | 1,640 | 361,358 | ||||||
| DR Horton, Inc. | 4,336 | 325,850 | ||||||
| Ethan Allen Interiors, Inc. | 13,360 | 310,754 | ||||||
| Etsy, Inc.(a) | 2,790 | 226,325 | ||||||
| Five Below, Inc.(a) | 2,266 | 295,917 | ||||||
| Harley-Davidson, Inc.(b) | 9,250 | 325,415 | ||||||
| Home Depot, Inc. | 1,060 | 320,915 | ||||||
| KB Home | 9,490 | 327,310 | ||||||
| Lennar Corp., Class B | 4,876 | 327,521 | ||||||
| Levi Strauss & Co. | 18,865 | 342,588 | ||||||
| Lithia Motors, Inc., Class A | 1,078 | 328,219 | ||||||
| LKQ Corp. | 7,723 | 396,885 | ||||||
| Malibu Boats, Inc., Class A(a) | 5,862 | 343,513 | ||||||
| MarineMax, Inc.(a) | 7,776 | 322,004 | ||||||
| Marriott International, Inc., Class A | 2,100 | 360,318 | ||||||
| MasterCraft Boat Holdings, Inc.(a)(b) | 13,289 | 310,963 | ||||||
| Mattel, Inc.(a) | 15,400 | 386,848 | ||||||
| Security Description | Shares | Value | ||||||
| Consumer Discretionary (continued) | ||||||||
| Monarch Casino & Resort, Inc.(a) | 4,112 | $ | 278,999 | |||||
| Movado Group, Inc. | 10,327 | 350,395 | ||||||
| Murphy USA, Inc. | 1,865 | 464,609 | ||||||
| NVR, Inc.(a) | 73 | 324,895 | ||||||
| OneWater Marine, Inc. | 8,680 | 296,856 | ||||||
| O'Reilly Automotive, Inc.(a) | 505 | 321,771 | ||||||
| Patrick Industries, Inc. | 5,294 | 318,222 | ||||||
| Pool Corp. | 775 | 308,931 | ||||||
| PulteGroup, Inc. | 7,546 | 341,532 | ||||||
| Ralph Lauren Corp. | 3,230 | 326,521 | ||||||
| Ruth's Hospitality Group, Inc. | 15,700 | 289,351 | ||||||
| Shoe Carnival, Inc. | 11,180 | 304,767 | ||||||
| Signet Jewelers, Ltd. | 4,804 | 286,318 | ||||||
| Skechers U.S.A., Inc., Class A(a) | 9,392 | 370,045 | ||||||
| Skyline Champion Corp.(a) | 5,296 | 281,376 | ||||||
| Smith & Wesson Brands, Inc. | 22,352 | 346,009 | ||||||
| Steven Madden, Ltd. | 9,065 | 337,037 | ||||||
| Sturm Ruger & Co., Inc. | 4,998 | 339,314 | ||||||
| Tapestry, Inc. | 10,035 | 346,208 | ||||||
| Target Corp. | 1,620 | 262,246 | ||||||
| Taylor Morrison Home Corp., Class A(a) | 11,460 | 331,996 | ||||||
| Tempur Sealy International, Inc. | 11,078 | 292,127 | ||||||
| Tesla, Inc.(a) | 430 | 326,052 | ||||||
| Texas Roadhouse, Inc. | 4,475 | 348,916 | ||||||
| Thor Industries, Inc.(b) | 4,160 | 316,035 | ||||||
| Tilly's, Inc., Class A(b) | 36,000 | 298,080 | ||||||
| TJX Cos., Inc. | 5,695 | 362,031 | ||||||
| Tractor Supply Co. | 1,540 | 288,534 | ||||||
| Ulta Beauty, Inc.(a) | 942 | 398,560 | ||||||
| Vista Outdoor, Inc.(a) | 9,708 | 374,146 | ||||||
| Whirlpool Corp. | 1,845 | 339,923 | ||||||
| Williams-Sonoma, Inc.(b) | 2,347 | 300,228 | ||||||
| Winnebago Industries, Inc.(b) | 5,906 | 292,052 | ||||||
| Zumiez, Inc.(a) | 8,484 | 278,360 | ||||||
| Total Consumer Discretionary | 23,029,172 | |||||||
| Consumer Staples (4.22%) | ||||||||
| Archer-Daniels-Midland Co. | 4,215 | 382,806 | ||||||
| Bunge, Ltd. | 3,251 | 384,658 | ||||||
| Church & Dwight Co., Inc. | 3,520 | 317,011 | ||||||
| Coca-Cola Co. | 5,888 | 373,181 | ||||||
| Costco Wholesale Corp. | 645 | 300,712 | ||||||
| Darling Ingredients, Inc.(a) | 4,930 | 394,745 | ||||||
| Estee Lauder Cos., Inc., Class A | 1,348 | 343,268 | ||||||
| Hershey Co. | 1,677 | 355,038 | ||||||
| Ingles Markets, Inc., Class A | 3,875 | 345,107 | ||||||
| Inter Parfums, Inc. | 4,252 | 313,798 | ||||||
| Kellogg Co. | 5,690 | 396,821 | ||||||
| MGP Ingredients, Inc. | 4,397 | 425,893 | ||||||
| Monster Beverage Corp.(a) | 4,647 | 414,141 | ||||||
| Procter & Gamble Co. | 2,341 | 346,187 | ||||||
| Sanderson Farms, Inc. | 1,953 | 389,624 | ||||||
| Tyson Foods, Inc., Class A | 4,073 | 364,982 | ||||||
| Total Consumer Staples | 5,847,972 | |||||||
4 | May 31, 2022
Barron’s 400SM ETF
| Schedule of Investments | May 31, 2022 (Unaudited) |
| Security Description | Shares | Value | ||||||
| Energy (11.58%) | ||||||||
| APA Corp. | 9,570 | $ | 449,886 | |||||
| Brigham Minerals, Inc., Class A | 14,550 | 441,010 | ||||||
| California Resources Corp. | 8,299 | 362,417 | ||||||
| Callon Petroleum Co.(a) | 6,495 | 379,698 | ||||||
| Chesapeake Energy Corp.(b) | 4,660 | 453,791 | ||||||
| Chevron Corp. | 2,220 | 387,745 | ||||||
| Civitas Resources, Inc. | 6,360 | 485,586 | ||||||
| ConocoPhillips | 3,695 | 415,170 | ||||||
| Continental Resources, Inc. | 6,180 | 420,673 | ||||||
| Coterra Energy, Inc. | 14,970 | 513,920 | ||||||
| Denbury, Inc.(a) | 5,090 | 372,283 | ||||||
| Devon Energy Corp. | 6,635 | 496,961 | ||||||
| Diamondback Energy, Inc. | 2,825 | 429,457 | ||||||
| EOG Resources, Inc. | 3,066 | 419,919 | ||||||
| Exxon Mobil Corp. | 4,560 | 437,760 | ||||||
| FLEX LNG, Ltd.(b) | 16,865 | 452,319 | ||||||
| Halliburton Co. | 10,115 | 409,658 | ||||||
| Hess Corp. | 3,795 | 467,051 | ||||||
| Kimbell Royalty Partners LP | 22,800 | 432,288 | ||||||
| Laredo Petroleum, Inc.(a) | 5,165 | 434,738 | ||||||
| Magnolia Oil & Gas Corp., Class A | 16,312 | 450,374 | ||||||
| Marathon Oil Corp. | 16,235 | 510,266 | ||||||
| Matador Resources Co. | 6,920 | 421,428 | ||||||
| Oasis Petroleum, Inc. | 2,506 | 397,777 | ||||||
| Occidental Petroleum Corp. | 6,450 | 447,050 | ||||||
| ONEOK, Inc. | 5,473 | 360,397 | ||||||
| Ovintiv, Inc. | 8,160 | 456,878 | ||||||
| PDC Energy, Inc. | 5,400 | 427,356 | ||||||
| Pioneer Natural Resources Co. | 1,540 | 428,028 | ||||||
| San Juan Basin Royalty Trust | 56,370 | 726,609 | ||||||
| SandRidge Energy, Inc.(a) | 26,070 | 614,470 | ||||||
| Targa Resources Corp. | 5,410 | 389,628 | ||||||
| Texas Pacific Land Corp. | 284 | 444,741 | ||||||
| VAALCO Energy, Inc.(b) | 68,750 | 526,625 | ||||||
| Whiting Petroleum Corp. | 4,434 | 392,232 | ||||||
| Williams Cos., Inc. | 11,240 | 416,554 | ||||||
| Total Energy | 16,072,743 | |||||||
| Financials (17.27%) | ||||||||
| Allegiance Bancshares, Inc. | 7,824 | 314,916 | ||||||
| Ally Financial, Inc. | 8,475 | 373,239 | ||||||
| A-Mark Precious Metals, Inc. | 5,105 | 388,133 | ||||||
| American Express Co. | 1,995 | 336,796 | ||||||
| American International Group, Inc. | 6,005 | 352,373 | ||||||
| Ameriprise Financial, Inc. | 1,250 | 345,337 | ||||||
| Ameris Bancorp | 7,466 | 340,375 | ||||||
| Associated Banc-Corp | 15,180 | 314,226 | ||||||
| Atlantic Union Bankshares Corp. | 8,925 | 314,695 | ||||||
| Atlanticus Holdings Corp.(a) | 7,217 | 280,813 | ||||||
| BancFirst Corp. | 4,345 | 394,222 | ||||||
| Bank OZK | 8,009 | 332,133 | ||||||
| Banner Corp. | 5,835 | 339,072 | ||||||
| Blackstone, Inc. | 3,180 | 374,572 | ||||||
| Byline Bancorp, Inc. | 13,174 | 329,087 | ||||||
| Capital One Financial Corp. | 2,609 | 333,587 | ||||||
| Security Description | Shares | Value | ||||||
| Financials (continued) | ||||||||
| Cathay General Bancorp | 7,779 | $ | 319,795 | |||||
| Central Pacific Financial Corp. | 12,592 | 303,971 | ||||||
| Cincinnati Financial Corp. | 2,685 | 343,304 | ||||||
| Citizens Financial Group, Inc. | 13,844 | 572,850 | ||||||
| Cohen & Steers, Inc. | 4,513 | 343,936 | ||||||
| ConnectOne Bancorp, Inc. | 10,750 | 296,270 | ||||||
| Credit Acceptance Corp.(a)(b) | 708 | 421,479 | ||||||
| Customers Bancorp, Inc.(a) | 6,150 | 253,995 | ||||||
| Dime Community Bancshares, Inc. | 10,370 | 326,033 | ||||||
| Eagle Bancorp, Inc. | 5,985 | 296,617 | ||||||
| East West Bancorp, Inc. | 4,600 | 338,284 | ||||||
| Enova International, Inc.(a) | 9,940 | 313,905 | ||||||
| Enterprise Financial Services Corp. | 7,110 | 329,264 | ||||||
| Evercore, Inc., Class A | 3,106 | 354,705 | ||||||
| FactSet Research Systems, Inc. | 842 | 321,459 | ||||||
| FB Financial Corp. | 7,641 | 321,075 | ||||||
| Fidelity National Financial, Inc., Class A | 7,260 | 307,098 | ||||||
| Fifth Third Bancorp | 7,660 | 302,034 | ||||||
| First BanCorp | 27,299 | 407,574 | ||||||
| First Foundation, Inc. | 13,645 | 307,695 | ||||||
| Flagstar Bancorp, Inc. | 8,001 | 308,279 | ||||||
| Flushing Financial Corp. | 15,120 | 349,272 | ||||||
| Franklin Resources, Inc. | 13,025 | 352,717 | ||||||
| Hamilton Lane, Inc., Class A | 4,690 | 326,189 | ||||||
| Hanmi Financial Corp. | 14,160 | 330,494 | ||||||
| HomeStreet, Inc. | 6,860 | 276,527 | ||||||
| Horizon Bancorp, Inc. | 17,545 | 315,284 | ||||||
| Houlihan Lokey, Inc. | 3,571 | 306,892 | ||||||
| Independent Bank Corp. | 14,958 | 296,318 | ||||||
| International Bancshares Corp. | 8,235 | 345,294 | ||||||
| KeyCorp | 14,712 | 293,652 | ||||||
| Kinsale Capital Group, Inc. | 1,610 | 354,007 | ||||||
| Lakeland Bancorp, Inc. | 19,950 | 309,624 | ||||||
| Live Oak Bancshares, Inc. | 6,331 | 254,253 | ||||||
| Merchants Bancorp | 12,507 | 318,803 | ||||||
| Mr Cooper Group, Inc.(a) | 7,425 | 321,948 | ||||||
| OFG Bancorp | 12,945 | 366,861 | ||||||
| Old Republic International Corp. | 13,740 | 328,661 | ||||||
| Origin Bancorp, Inc. | 7,965 | 311,272 | ||||||
| Pacific Premier Bancorp, Inc. | 9,546 | 310,818 | ||||||
| Piper Sandler Cos. | 2,810 | 370,330 | ||||||
| Popular, Inc. | 4,345 | 355,030 | ||||||
| Premier Financial Corp. | 10,950 | 297,511 | ||||||
| Regional Management Corp. | 7,793 | 370,791 | ||||||
| Regions Financial Corp. | 15,410 | 340,407 | ||||||
| SEI Investments Co. | 6,070 | 354,670 | ||||||
| ServisFirst Bancshares, Inc. | 3,879 | 323,353 | ||||||
| Signature Bank/New York NY | 1,195 | 258,443 | ||||||
| SLM Corp. | 20,015 | 392,094 | ||||||
| Stifel Financial Corp. | 5,350 | 343,309 | ||||||
| Synovus Financial Corp. | 7,282 | 310,577 | ||||||
| Towne Bank | 11,325 | 333,861 | ||||||
| US Bancorp | 6,465 | 343,098 | ||||||
| Western Alliance Bancorp | 4,214 | 342,893 | ||||||
5 | May 31, 2022
Barron’s 400SM ETF
| Schedule of Investments | May 31, 2022 (Unaudited) |
| Security Description | Shares | Value | ||||||
| Financials (continued) | ||||||||
| WSFS Financial Corp. | 6,925 | $ | 296,251 | |||||
| Zions Bancorp NA | 5,377 | 306,704 | ||||||
| Total Financials | 23,961,406 | |||||||
| Health Care (9.94%) | ||||||||
| Abbott Laboratories | 2,990 | 351,205 | ||||||
| AbbVie, Inc. | 2,253 | 332,025 | ||||||
| Agilent Technologies, Inc. | 2,680 | 341,861 | ||||||
| Amgen, Inc. | 1,510 | 387,677 | ||||||
| AMN Healthcare Services, Inc.(a) | 3,440 | 333,336 | ||||||
| Bio-Rad Laboratories, Inc., Class A(a) | 637 | 342,572 | ||||||
| Bio-Techne Corp. | 860 | 317,968 | ||||||
| Bristol-Myers Squibb Co. | 5,045 | 380,645 | ||||||
| Catalent, Inc.(a) | 3,630 | 374,108 | ||||||
| Catalyst Pharmaceuticals, Inc.(a) | 46,261 | 333,079 | ||||||
| Cooper Cos, Inc. | 893 | 313,211 | ||||||
| Corcept Therapeutics, Inc.(a) | 14,635 | 304,993 | ||||||
| Cross Country Healthcare, Inc.(a) | 16,870 | 297,755 | ||||||
| Danaher Corp. | 1,291 | 340,592 | ||||||
| DaVita, Inc.(a) | 3,181 | 310,116 | ||||||
| Doximity, Inc.(a)(b) | 8,070 | 282,369 | ||||||
| Dynavax Technologies Corp.(a)(b) | 33,585 | 398,318 | ||||||
| Edwards Lifesciences Corp.(a) | 3,282 | 330,990 | ||||||
| HCA Healthcare, Inc. | 1,314 | 276,466 | ||||||
| Henry Schein, Inc.(a) | 4,043 | 346,243 | ||||||
| Hologic, Inc.(a) | 4,949 | 372,511 | ||||||
| IDEXX Laboratories, Inc.(a) | 694 | 271,784 | ||||||
| Innoviva, Inc.(a) | 18,932 | 287,198 | ||||||
| Johnson & Johnson | 1,992 | 357,624 | ||||||
| Laboratory Corp. of America Holdings | 1,291 | 318,516 | ||||||
| Maravai LifeSciences Holdings, Inc., Class A(a) | 9,071 | 282,562 | ||||||
| Merck & Co., Inc. | 4,480 | 412,294 | ||||||
| Mettler-Toledo International, Inc.(a) | 263 | 338,250 | ||||||
| Moderna, Inc.(a) | 2,359 | 342,833 | ||||||
| PerkinElmer, Inc. | 2,067 | 309,368 | ||||||
| Pfizer, Inc. | 6,731 | 357,012 | ||||||
| Quest Diagnostics, Inc. | 2,467 | 347,896 | ||||||
| QuidelOrtho Corp.(a) | 3,360 | 319,301 | ||||||
| Regeneron Pharmaceuticals, Inc.(a) | 528 | 350,983 | ||||||
| Thermo Fisher Scientific, Inc. | 636 | 360,975 | ||||||
| Veeva Systems, Inc., Class A(a) | 2,005 | 341,371 | ||||||
| Vertex Pharmaceuticals, Inc.(a) | 1,414 | 379,871 | ||||||
| Vir Biotechnology, Inc.(a) | 15,170 | 391,538 | ||||||
| Waters Corp.(a) | 1,097 | 359,761 | ||||||
| West Pharmaceutical Services, Inc. | 904 | 280,584 | ||||||
| Zoetis, Inc. | 1,850 | 316,220 | ||||||
| Total Health Care | 13,793,981 | |||||||
| Security Description | Shares | Value | ||||||
| Industrials (15.30%) | ||||||||
| AGCO Corp. | 2,763 | $ | 354,023 | |||||
| Allison Transmission Holdings, Inc. | 9,120 | 364,891 | ||||||
| AMETEK, Inc. | 2,700 | 327,969 | ||||||
| AO Smith Corp. | 5,304 | 318,876 | ||||||
| ArcBest Corp. | 4,150 | 313,865 | ||||||
| Atkore, Inc.(a) | 3,454 | 376,210 | ||||||
| Atlas Air Worldwide Holdings, Inc.(a) | 4,139 | 288,530 | ||||||
| BlueLinx Holdings, Inc.(a) | 3,996 | 330,309 | ||||||
| Boise Cascade Co. | 4,487 | 346,935 | ||||||
| Builders FirstSource, Inc.(a) | 4,800 | 312,432 | ||||||
| BWX Technologies, Inc. | 6,625 | 339,200 | ||||||
| Carlisle Cos., Inc. | 1,470 | 374,012 | ||||||
| CH Robinson Worldwide, Inc. | 3,540 | 384,125 | ||||||
| Cintas Corp. | 915 | 364,472 | ||||||
| Copart, Inc.(a) | 2,905 | 332,710 | ||||||
| CSW Industrials, Inc. | 2,959 | 314,009 | ||||||
| CSX Corp. | 10,244 | 325,657 | ||||||
| Donaldson Co., Inc. | 6,780 | 354,458 | ||||||
| Dover Corp. | 2,296 | 307,457 | ||||||
| Eagle Bulk Shipping, Inc. | 6,335 | 464,102 | ||||||
| Emerson Electric Co. | 3,797 | 336,642 | ||||||
| Encore Wire Corp. | 2,861 | 357,682 | ||||||
| Equifax, Inc. | 1,514 | 306,706 | ||||||
| Expeditors International of Washington, Inc. | 3,508 | 381,811 | ||||||
| Fastenal Co. | 6,295 | 337,160 | ||||||
| Fortune Brands Home & Security, Inc. | 4,140 | 287,109 | ||||||
| Franklin Electric Co., Inc. | 4,220 | 311,098 | ||||||
| Genco Shipping & Trading, Ltd. | 18,470 | 466,368 | ||||||
| Generac Holdings, Inc.(a) | 1,220 | 301,438 | ||||||
| Golden Ocean Group, Ltd.(b) | 31,725 | 468,261 | ||||||
| Graco, Inc. | 5,054 | 319,918 | ||||||
| Heidrick & Struggles International, Inc. | 8,800 | 304,128 | ||||||
| IDEX Corp. | 1,810 | 346,706 | ||||||
| Insteel Industries, Inc. | 9,348 | 387,101 | ||||||
| JB Hunt Transport Services, Inc. | 1,756 | 303,050 | ||||||
| Knight-Swift Transportation Holdings, Inc. | 6,610 | 321,510 | ||||||
| Korn Ferry | 5,380 | 330,655 | ||||||
| Landstar System, Inc. | 2,280 | 345,260 | ||||||
| Lockheed Martin Corp. | 780 | 343,286 | ||||||
| Matson, Inc. | 3,074 | 276,291 | ||||||
| Mueller Industries, Inc. | 6,160 | 331,716 | ||||||
| Nordson Corp. | 1,590 | 346,429 | ||||||
| Norfolk Southern Corp. | 1,304 | 312,517 | ||||||
| Northrop Grumman Corp. | 780 | 365,017 | ||||||
| Old Dominion Freight Line, Inc. | 1,134 | 292,844 | ||||||
| Owens Corning | 3,762 | 359,572 | ||||||
| PACCAR, Inc. | 4,010 | 348,228 | ||||||
| Parker-Hannifin Corp. | 1,252 | 340,757 | ||||||
| Republic Services, Inc. | 2,720 | 364,045 | ||||||
| Robert Half International, Inc. | 3,085 | 278,113 | ||||||
| Saia, Inc.(a) | 1,350 | 266,747 | ||||||
6 | May 31, 2022
Barron’s 400SM ETF
| Schedule of Investments | May 31, 2022 (Unaudited) |
| Security Description | Shares | Value | ||||||
| Industrials (continued) | ||||||||
| Schneider National, Inc., Class B | 13,600 | $ | 328,304 | |||||
| Simpson Manufacturing Co., Inc. | 2,997 | 324,725 | ||||||
| Snap-on, Inc. | 1,732 | 384,296 | ||||||
| TriNet Group, Inc.(a) | 3,970 | 311,804 | ||||||
| Triton International, Ltd. | 5,330 | 339,894 | ||||||
| UFP Industries, Inc. | 4,071 | 314,281 | ||||||
| Union Pacific Corp. | 1,342 | 294,945 | ||||||
| United Parcel Service, Inc., Class B | 1,667 | 303,811 | ||||||
| United Rentals, Inc.(a) | 1,070 | 319,053 | ||||||
| Watsco, Inc. | 1,200 | 306,756 | ||||||
| Werner Enterprises, Inc. | 8,190 | 332,268 | ||||||
| WW Grainger, Inc. | 706 | 343,871 | ||||||
| Total Industrials | 21,236,415 | |||||||
| Information Technology (13.19%) | ||||||||
| Adobe, Inc.(a) | 833 | 346,928 | ||||||
| Advanced Micro Devices, Inc.(a) | 3,223 | 328,295 | ||||||
| Akamai Technologies, Inc.(a) | 3,162 | 319,488 | ||||||
| Alpha & Omega Semiconductor, Ltd.(a) | 7,170 | 314,978 | ||||||
| Amkor Technology, Inc. | 16,353 | 334,255 | ||||||
| Amphenol Corp., Class A | 4,754 | 336,868 | ||||||
| Apple, Inc. | 2,268 | 337,569 | ||||||
| Applied Materials, Inc. | 2,803 | 328,764 | ||||||
| Arista Networks, Inc.(a) | 2,898 | 296,407 | ||||||
| Automatic Data Processing, Inc. | 1,646 | 366,959 | ||||||
| Axcelis Technologies, Inc.(a) | 5,410 | 335,744 | ||||||
| Badger Meter, Inc. | 3,690 | 292,027 | ||||||
| Broadcom, Inc. | 594 | 344,597 | ||||||
| Cadence Design Systems, Inc.(a) | 2,468 | 379,406 | ||||||
| Ciena Corp.(a) | 6,220 | 316,100 | ||||||
| Cisco Systems, Inc. | 6,316 | 284,536 | ||||||
| Clearfield, Inc.(a)(b) | 5,887 | 363,817 | ||||||
| Cognex Corp. | 5,228 | 253,140 | ||||||
| Cognizant Technology Solutions Corp., Class A | 3,957 | 295,588 | ||||||
| Corning, Inc. | 9,612 | 344,302 | ||||||
| Diodes, Inc.(a) | 4,143 | 319,052 | ||||||
| Entegris, Inc. | 2,828 | 313,795 | ||||||
| Fair Isaac Corp.(a) | 732 | 299,791 | ||||||
| FleetCor Technologies, Inc.(a) | 1,523 | 378,938 | ||||||
| Fortinet, Inc.(a) | 1,239 | 364,439 | ||||||
| Gartner, Inc.(a) | 1,250 | 328,000 | ||||||
| Global Payments, Inc. | 2,740 | 359,050 | ||||||
| GoDaddy, Inc., Class A(a) | 4,585 | 344,104 | ||||||
| Intel Corp. | 7,845 | 348,475 | ||||||
| Intuit, Inc. | 796 | 329,910 | ||||||
| Jack Henry & Associates, Inc. | 1,965 | 369,656 | ||||||
| Keysight Technologies, Inc.(a) | 2,350 | 342,160 | ||||||
| KLA Corp. | 1,049 | 382,728 | ||||||
| Mastercard, Inc., Class A | 1,050 | 375,763 | ||||||
| Microchip Technology, Inc. | 4,900 | 355,985 | ||||||
| Micron Technology, Inc. | 4,815 | 355,540 | ||||||
| Microsoft Corp. | 1,222 | 332,225 | ||||||
| Security Description | Shares | Value | ||||||
| Information Technology (continued) | ||||||||
| MKS Instruments, Inc. | 2,440 | $ | 301,340 | |||||
| Monolithic Power Systems, Inc. | 833 | 375,175 | ||||||
| NetApp, Inc. | 4,282 | 308,090 | ||||||
| NVIDIA Corp. | 1,559 | 291,096 | ||||||
| ON Semiconductor Corp.(a) | 6,208 | 376,701 | ||||||
| Onto Innovation, Inc.(a) | 4,476 | 359,781 | ||||||
| Paychex, Inc. | 2,859 | 354,030 | ||||||
| Photronics, Inc.(a) | 21,485 | 467,084 | ||||||
| Power Integrations, Inc. | 3,999 | 337,436 | ||||||
| Qorvo, Inc.(a) | 2,900 | 324,075 | ||||||
| QUALCOMM, Inc. | 2,435 | 348,741 | ||||||
| SS&C Technologies Holdings, Inc. | 4,590 | 293,714 | ||||||
| Synopsys, Inc.(a) | 1,230 | 392,616 | ||||||
| Teledyne Technologies, Inc.(a) | 820 | 332,223 | ||||||
| Texas Instruments, Inc. | 2,037 | 360,060 | ||||||
| Visa, Inc., Class A, Class A | 1,700 | 360,689 | ||||||
| Zebra Technologies Corp., Class A(a) | 905 | 306,062 | ||||||
| Total Information Technology | 18,308,292 | |||||||
| Materials (6.74%) | ||||||||
| Alcoa Corp. | 4,765 | 294,096 | ||||||
| Ball Corp. | 3,843 | 272,430 | ||||||
| Celanese Corp. | 2,537 | 397,091 | ||||||
| CF Industries Holdings, Inc. | 3,705 | 365,943 | ||||||
| Cliffs Natural Resources, Inc.(a) | 13,881 | 321,762 | ||||||
| Commercial Metals Co. | 8,500 | 337,705 | ||||||
| Dow Chemical Co. | 5,983 | 406,724 | ||||||
| Eagle Materials, Inc. | 2,636 | 344,156 | ||||||
| FMC Corp. | 2,755 | 337,708 | ||||||
| Freeport-McMoRan, Inc. | 7,940 | 310,295 | ||||||
| Greif, Inc., Class A | 5,870 | 349,089 | ||||||
| Hawkins, Inc. | 7,690 | 278,070 | ||||||
| Huntsman Corp. | 9,120 | 330,600 | ||||||
| Louisiana-Pacific Corp. | 5,097 | 351,999 | ||||||
| Mesabi Trust(b) | 13,620 | 370,873 | ||||||
| Mosaic Co. | 5,971 | 374,083 | ||||||
| Nucor Corp. | 2,577 | 341,350 | ||||||
| Olin Corp. | 6,980 | 459,214 | ||||||
| Packaging Corp. of America | 2,311 | 363,474 | ||||||
| Reliance Steel & Aluminum Co. | 1,840 | 357,696 | ||||||
| Royal Gold, Inc. | 2,566 | 290,163 | ||||||
| Schnitzer Steel Industries, Inc., Class A | 7,330 | 297,745 | ||||||
| Southern Copper Corp. | 5,141 | 317,611 | ||||||
| Steel Dynamics, Inc. | 4,772 | 407,433 | ||||||
| TimkenSteel Corp.(a) | 17,470 | 403,557 | ||||||
| United States Steel Corp. | 10,880 | 272,762 | ||||||
| Westlake Corp. | 3,030 | 400,293 | ||||||
| Total Materials | 9,353,922 | |||||||
| Real Estate (0.65%) | ||||||||
| CBRE Group, Inc., Class A(a) | 3,980 | 329,703 | ||||||
| Marcus & Millichap, Inc. | 7,590 | 317,869 | ||||||
7 | May 31, 2022
Barron’s 400SM ETF
| Schedule of Investments | May 31, 2022 (Unaudited) |
| Security Description | Shares | Value | ||||||
| Real Estate (continued) | ||||||||
| Newmark Group, Inc. | 22,680 | $ | 251,068 | |||||
| Total Real Estate | 898,640 | |||||||
| Utilities (0.27%) | ||||||||
| CMS Energy Corp. | 5,190 | 368,698 | ||||||
| TOTAL COMMON STOCKS | ||||||||
| (Cost $126,162,372) | 135,540,116 | |||||||
| Security Description | Shares | Value | ||||||
| LIMITED PARTNERSHIPS (1.92%) | ||||||||
| Energy (1.38%) | ||||||||
| Cheniere Energy Partners LP | 7,350 | 395,209 | ||||||
| Enterprise Products Partners LP | 14,560 | 399,235 | ||||||
| KKR & Co., LP | 6,701 | 367,282 | ||||||
| Magellan Midstream Partners LP | 7,470 | 386,199 | ||||||
| MPLX LP | 11,190 | 368,711 | ||||||
| Total Energy | 1,916,636 | |||||||
| Financials (0.23%) | ||||||||
| Carlyle Group, Inc. | 8,147 | 313,904 | ||||||
| Materials (0.31%) | ||||||||
| CVR Partners LP | 3,310 | 429,307 | ||||||
| TOTAL LIMITED PARTNERSHIPS | ||||||||
| (Cost $2,670,738) | 2,659,847 | |||||||
| 7 Day Yield | Shares | Value | ||||||||||
| SHORT TERM INVESTMENTS (1.98%) | ||||||||||||
| Money Market Fund (0.29%) | ||||||||||||
| State Street Institutional | ||||||||||||
| Treasury Plus | ||||||||||||
| Money Market Fund | ||||||||||||
| (Cost $399,804) | 0.75 | % | 399,804 | 399,804 | ||||||||
| Investments Purchased with Collateral from Securities Loaned (1.69%) | ||||||||||||
| State Street Navigator | ||||||||||||
| Securities Lending | ||||||||||||
| Government Money Market | ||||||||||||
| Portfolio, 0.80% | ||||||||||||
| (Cost $2,349,632) | 2,349,632 | 2,349,632 | ||||||||||
| TOTAL SHORT TERM INVESTMENTS | ||||||||||||
| (Cost $2,749,436) | 2,749,436 | |||||||||||
| TOTAL INVESTMENTS (101.58%) | ||||||||||||
| (Cost $131,582,546) | $ | 140,949,399 | ||||||||||
| LIABILITIES IN EXCESS OF OTHER ASSETS (-1.58%) | (2,188,046 | ) | ||||||||||
| NET ASSETS - 100.00% | $ | 138,761,353 | ||||||||||
| (a) | Non-income producing security. |
| (b) | Security, or a portion of the security position is currently on loan. The total market value of securities on loan is $5,186,628. |
See Notes to Financial Statements.
8 | May 31, 2022
Barron’s 400SM ETF
| Statement of Assets and Liabilities | May 31, 2022 (Unaudited) |
| ASSETS: | ||||
| Investments, at value | $ | 140,949,399 | ||
| Dividends receivable | 235,621 | |||
| Total Assets | 141,185,020 | |||
| LIABILITIES: | ||||
| Payable to adviser | 74,035 | |||
| Payable for collateral upon return of securities loaned | 2,349,632 | |||
| Total Liabilities | 2,423,667 | |||
| NET ASSETS | $ | 138,761,353 | ||
| NET ASSETS CONSIST OF: | ||||
| Paid-in capital | $ | 176,748,941 | ||
| Total distributable earnings | (37,987,588 | ) | ||
| NET ASSETS | $ | 138,761,353 | ||
| INVESTMENTS, AT COST | $ | 131,582,546 | ||
| PRICING OF SHARES | ||||
| Net Assets | $ | 138,761,353 | ||
| Shares of beneficial interest outstanding (Unlimited number of shares authorized, par value $0.01 per share) | 2,450,000 | |||
| Net Asset Value, offering and redemption price per share | $ | 56.64 | ||
See Notes to Financial Statements.
9 | May 31, 2022
Barron’s 400SM ETF
| Statement of Operations | For the Six Months Ended May 31, 2022 (Unaudited) |
| INVESTMENT INCOME: | ||||
| Dividends(a) | $ | 1,309,801 | ||
| Securities Lending Income | 4,462 | |||
| Total Investment Income | 1,314,263 | |||
| EXPENSES: | ||||
| Investment adviser fees | 472,369 | |||
| Net Expenses | 472,369 | |||
| NET INVESTMENT INCOME | 841,894 | |||
| REALIZED AND UNREALIZED GAIN: | ||||
| Net realized gain on investments(b) | 7,670,296 | |||
| Net change in unrealized appreciation/(depreciation) on investments | (21,126,236 | ) | ||
| NET REALIZED AND UNREALIZED LOSS ON INVESTMENTS | (13,455,940 | ) | ||
| NET DECREASE IN NET ASSETS RESULTING FROM OPERATIONS | $ | (12,614,046 | ) | |
| (a) | Net of foreign tax withholding of $1,520. |
| (b) | Includes realized gain or loss as a result of in-kind transactions (See Note 4 in Notes to Financial Statements). |
See Notes to Financial Statements.
10 | May 31, 2022
Barron’s 400SM ETF
Statements of Changes in Net Assets
| For the Six Months Ended May 31, 2022 (Unaudited) | For the Year Ended November 30, 2021 | |||||||
| OPERATIONS: | ||||||||
| Net investment income | $ | 841,894 | $ | 1,264,631 | ||||
| Net realized gain | 7,670,296 | 35,081,287 | ||||||
| Net change in unrealized appreciation/depreciation | (21,126,236 | ) | 2,133,972 | |||||
| Net increase/(decrease) in net assets resulting from operations | (12,614,046 | ) | 38,479,890 | |||||
| DISTRIBUTIONS TO SHAREHOLDERS: | ||||||||
| From distributable earnings | (1,433,725 | ) | (1,258,708 | ) | ||||
| Total distributions | (1,433,725 | ) | (1,258,708 | ) | ||||
| CAPITAL SHARE TRANSACTIONS: | ||||||||
| Proceeds from sale of shares | – | 94,843,165 | ||||||
| Cost of shares redeemed | (3,159,145 | ) | (94,389,197 | ) | ||||
| Net increase/(decrease) from capital share transactions | (3,159,145 | ) | 453,968 | |||||
| Net increase/(decrease) in net assets | (17,206,916 | ) | 37,675,150 | |||||
| NET ASSETS: | ||||||||
| Beginning of period | 155,968,269 | 118,293,119 | ||||||
| End of period | $ | 138,761,353 | $ | 155,968,269 | ||||
| OTHER INFORMATION: | ||||||||
| CAPITAL SHARE TRANSACTIONS: | ||||||||
| Beginning shares | 2,500,000 | 2,500,000 | ||||||
| Shares sold | – | 1,650,000 | ||||||
| Shares redeemed | (50,000 | ) | (1,650,000 | ) | ||||
| Shares outstanding, end of period | 2,450,000 | 2,500,000 | ||||||
See Notes to Financial Statements.
11 | May 31, 2022
Barron’s 400SM ETF
| Financial Highlights | For a Share Outstanding Throughout the Periods Presented |
| For the Six Months Ended May 31, 2022 (Unaudited) | For the Year Ended November 30, 2021 | For the Year Ended November 30, 2020 | For the Year Ended November 30, 2019 | For the Year Ended November 30, 2018 | For the Year Ended November 30, 2017 | |||||||||||||||||||
| NET ASSET VALUE, BEGINNING OF PERIOD | $ | 62.39 | $ | 47.32 | $ | 42.04 | $ | 40.42 | $ | 41.54 | $ | 34.35 | ||||||||||||
| INCOME FROM OPERATIONS: | ||||||||||||||||||||||||
| Net investment income(a) | 0.34 | 0.52 | 0.43 | 0.44 | 0.40 | 0.29 | ||||||||||||||||||
| Net realized and unrealized gain/(loss) | (5.52 | ) | 15.05 | 5.14 | 1.51 | (1.27 | ) | 7.17 | ||||||||||||||||
| Total from investment operations | (5.18 | ) | 15.57 | 5.57 | 1.95 | (0.87 | ) | 7.46 | ||||||||||||||||
| DISTRIBUTIONS: | ||||||||||||||||||||||||
| From net investment income | (0.57 | ) | (0.50 | ) | (0.29 | ) | (0.33 | ) | (0.25 | ) | (0.27 | ) | ||||||||||||
| Total distributions | (0.57 | ) | (0.50 | ) | (0.29 | ) | (0.33 | ) | (0.25 | ) | (0.27 | ) | ||||||||||||
| NET INCREASE/(DECREASE) IN NET ASSET VALUE | (5.75 | ) | 15.07 | 5.28 | 1.62 | (1.12 | ) | 7.19 | ||||||||||||||||
| NET ASSET VALUE, END OF PERIOD | $ | 56.64 | $ | 62.39 | $ | 47.32 | $ | 42.04 | $ | 40.42 | $ | 41.54 | ||||||||||||
| TOTAL RETURN(b) | (8.41 | )% | 33.18 | % | 13.33 | % | 5.00 | % | (2.12 | )% | 21.87 | % | ||||||||||||
| RATIOS/SUPPLEMENTAL DATA: | ||||||||||||||||||||||||
| Net assets, end of period (in 000s) | $ | 138,761 | $ | 155,968 | $ | 118,293 | $ | 147,150 | $ | 163,708 | $ | 205,601 | ||||||||||||
| RATIOS TO AVERAGE NET ASSETS | ||||||||||||||||||||||||
| Ratio of expenses to average net assets | 0.65 | %(c) | 0.65 | % | 0.65 | % | 0.65 | % | 0.65 | % | 0.65 | % | ||||||||||||
| Ratio of net investment income to average net assets | 1.16 | %(c) | 0.90 | % | 1.08 | % | 1.10 | % | 0.93 | % | 0.78 | % | ||||||||||||
| Portfolio turnover rate(d) | 49 | % | 91 | % | 83 | % | 109 | % | 88 | % | 84 | % | ||||||||||||
| (a) | Based on average shares outstanding during the period. |
| (b) | Total return is calculated assuming an initial investment made at the net asset value at the beginning of the period and redemption at the net asset value on the last day of the period and assuming all distributions are reinvested at the reinvestment prices. Total return calculated for a period of less than one year is not annualized. |
| (c) | Annualized. |
| (d) | Portfolio turnover for periods less than one year are not annualized and does not include securities received or delivered from processing creations or redemptions in-kind. |
See Notes to Financial Statements.
12 | May 31, 2022
Barron’s 400SM ETF
| Notes to Financial Statements | May 31, 2022 (Unaudited) |
1. ORGANIZATION
ALPS ETF Trust (the “Trust”), a Delaware statutory trust, is an open-end management investment company registered under the Investment Company Act of 1940, as amended (the “1940 Act”). As of May 31, 2022, the Trust consisted of nineteen separate portfolios. Each portfolio represents a separate series of the Trust. This report pertains solely to the Barron’s 400SM ETF (the “Fund”). The investment objective of the Fund is to seek investment results that correspond generally, before fees and expenses, to the performance of the Barron’s 400 IndexSM (the “Underlying Index”). The Fund has elected to qualify as a diversified series of the Trust under the 1940 Act.
The Fund’s Shares (“Shares”) are listed on the NYSE Arca, Inc. (the “NYSE Arca”). The Fund issues and redeems Shares at net asset value (“NAV”) in blocks of 25,000 Shares, each of which is called a “Creation Unit”. Creation Units are issued and redeemed principally in-kind for securities included in the Underlying Index. Except when aggregated in Creation Units, Shares are not redeemable securities of the Fund. On October 1, 2021, the Fund reduced its Creation Unit size from 50,000 to 25,000 shares.
Pursuant to the Trust’s organizational documents, its Officers and Trustees are indemnified against certain liability arising out of the performance of their duties to the Trust. Additionally, in the normal course of business, the Trust enters into contracts with service providers that contain general indemnification clauses. The Trust’s maximum exposure under these arrangements is unknown, as this would involve future claims that may be made against the Trust that have not yet occurred.
2. SIGNIFICANT ACCOUNTING POLICIES
The following is a summary of significant accounting policies consistently followed by the Fund in the preparation of the financial statements. The accompanying financial statements were prepared in accordance with accounting principles generally accepted in the United States of America (“U.S. GAAP”). The preparation of financial statements in conformity with U.S. GAAP requires management to make certain estimates and assumptions that affect the reported amounts of assets and liabilities and disclosures of contingent assets and liabilities at the date of the financial statements and the reported amounts of revenue and expenses during the period. Actual results could differ from those estimates. The Fund is considered an investment company under U.S. GAAP and follows the accounting and reporting guidance applicable to investment companies in the Financial Accounting Standards Board (“FASB”) Accounting Standards Codification Topic 946.
A. Portfolio Valuation
The Fund’s NAV is determined daily, as of the close of regular trading on the New York Stock Exchange (the “NYSE”), normally 4:00 p.m. Eastern time, on each day the NYSE is open for trading. The NAV is computed by dividing the value of all assets of the Fund (including accrued interest and dividends), less all liabilities (including accrued expenses and dividends declared but unpaid), by the total number of shares outstanding.
Portfolio securities listed on any exchange other than the NASDAQ Stock Market LLC (“NASDAQ”) are valued at the last sale price on the business day as of which such value is being determined. If there has been no sale on such day, the securities are valued at the mean of the most recent bid and ask prices on such day. Securities traded on the NASDAQ are valued at the NASDAQ Official Closing Price as determined by NASDAQ. Portfolio securities traded on more than one securities exchange are valued at the last sale price on the business day as of which such value is being determined at the close of the exchange representing the principal market for such securities. Portfolio securities traded in the over-the-counter market, but excluding securities traded on the NASDAQ, are valued at the latest quoted sale price in such market.
The Fund’s investments are valued at market value or, in the absence of market value with respect to any portfolio securities, at fair value according to procedures adopted by the Trust’s Board of Trustees (the “Board”). When market quotations are not readily available or when events occur that make established valuation methods unreliable, securities of the Fund may be valued in good faith by or under the direction of the Board. These securities generally include, but are not limited to, restricted securities (securities which may not be publicly sold without registration under the Securities Act of 1933) for which a pricing service is unable to provide a market price; securities whose trading has been formally suspended; a security whose market price is not available from a pre-established primary pricing source or the pricing source is not willing to provide a price; a security with respect to which an event has occurred that is most likely to materially affect the value of the security after the market has closed but before the calculation of the Fund’s NAV or make it difficult or impossible to obtain a reliable market quotation; or a security whose price, as provided by the pricing service, does not reflect the security’s “fair value” due to the security being de-listed from a national exchange or the security’s primary trading market is temporarily closed at a time when, under normal conditions, it would be open. As a general principle, the current “fair value” of a security would be the amount which the owner might reasonably expect to receive from the sale on the applicable exchange or principal market. A variety of factors may be considered in determining the fair value of such securities.
13 | May 31, 2022
Barron’s 400SM ETF
| Notes to Financial Statements | May 31, 2022 (Unaudited) |
B. Fair Value Measurements
The Fund discloses the classification of its fair value measurements following a three-tier hierarchy based on the inputs used to measure fair value. Inputs refer broadly to the assumptions that market participants would use in pricing the asset or liability; including assumptions about risk. Inputs may be observable or unobservable. Observable inputs reflect the assumptions market participants would use in pricing the asset or liability that are developed based on market data obtained from sources independent of the reporting entity. Unobservable inputs reflect the reporting entity’s own assumptions about the assumptions market participants would use in pricing the asset or liability that are developed based on the best information available.
Valuation techniques used to value the Fund's investments by major category are as follows:
Equity securities and Limited Partnerships, including restricted securities, for which market quotations are readily available, are valued at the last reported sale price or official closing price as reported by a third party pricing vendor on the primary market or exchange on which they are traded and are categorized as Level 1 in the hierarchy. In the event there were no sales during the day or closing prices are not available, securities are valued at the mean of the most recent quoted bid and ask prices on such day and are generally categorized as Level 2 in the hierarchy. Investments in open-end mutual funds are valued at their closing NAV each business day and are categorized as Level 1 in the hierarchy.
Changes in valuation techniques may result in transfers in or out of an assigned level within the disclosure hierarchy.
Various inputs are used in determining the value of the Fund’s investments as of the end of the reporting period. When inputs used fall into different levels of the fair value hierarchy, the level in the hierarchy within which the fair value measurement falls is determined based on the lowest level input that is significant to the fair value measurement in its entirety. The designated input levels are not necessarily an indication of the risk or liquidity associated with these investments.
These inputs are categorized in the following hierarchy under applicable financial accounting standards:
| Level 1 | – | Unadjusted quoted prices in active markets for identical investments, unrestricted assets or liabilities that a Fund has the ability to access at the measurement date; |
| Level 2 | – | Quoted prices which are not active, quoted prices for similar assets or liabilities in active markets or inputs other than quoted prices that are observable (either directly or indirectly) for substantially the full term of the asset or liability; and |
| Level 3 | – | Significant unobservable prices or inputs (including the Fund’s own assumptions in determining the fair value of investments) where there is little or no market activity for the asset or liability at the measurement date.
|
The following is a summary of the inputs used to value the Fund’s investments as of May 31, 2022:
Barron's 400 ETF
| Investments in Securities at Value | Level 1 - Quoted and Unadjusted Prices | Level 2 - Other Significant Observable Inputs | Level 3 - Significant Unobservable Inputs | Total | ||||||||||||
| Common Stocks* | $ | 135,540,116 | $ | – | $ | – | $ | 135,540,116 | ||||||||
| Limited Partnerships* | 2,659,847 | – | – | 2,659,847 | ||||||||||||
| Short Term Investments | 2,749,436 | – | – | 2,749,436 | ||||||||||||
| Total | $ | 140,949,399 | $ | – | $ | – | $ | 140,949,399 | ||||||||
| * | For a detailed sector breakdown, see the accompanying Schedule of Investments. |
The Fund did not have any securities that used significant unobservable inputs (Level 3) in determining fair value and there were no transfers into or out of Level 3 during the six months ended May 31, 2022.
C. Securities Transactions and Investment Income
Securities transactions are recorded as of the trade date. Realized gains and losses from securities transactions are recorded on the specific identification in accordance with GAAP. Dividend income and capital gains distributions, if any, are recorded on the ex-dividend date. Interest income, if any, is recorded on the accrual basis.
14 | May 31, 2022
Barron’s 400SM ETF
| Notes to Financial Statements | May 31, 2022 (Unaudited) |
D. Dividends and Distributions to Shareholders
Dividends from net investment income of the Fund, if any, are declared and paid annually or as the Board may determine from time to time. Distributions of net realized capital gains earned by the Fund, if any, are distributed at least annually.
E. Federal Tax and Tax Basis Information
The timing and character of income and capital gain distributions are determined in accordance with income tax regulations, which may differ from U.S. GAAP. Reclassifications are made to the Fund’s capital accounts for permanent tax differences to reflect income and gains available for distribution (or available capital loss carryforwards) under income tax regulations. The amounts and characteristics of tax basis distributions and composition of distributable earnings/(accumulated losses) are finalized at fiscal year-end; accordingly, tax basis balances have not been determined as of May 31, 2022.
The tax character of the distributions paid during the fiscal year ended November 30, 2021 was as follows:
| Ordinary Income | Long-Term Capital Gain | Return of Capital | ||||||||||
| November 30, 2021 | ||||||||||||
| Barron’s 400SM ETF | $ | 1,258,708 | $ | – | $ | – | ||||||
The character of distributions made during the year may differ from its ultimate characterization for federal income tax purposes.
Under current law, capital losses maintain their character as short-term or long-term and are carried forward to the next tax year without expiration. As of November 30, 2021, the following amounts are available as carry forwards to the next tax year:
| Fund | Short-Term | Long-Term | ||||||
| Barron’s 400SM ETF | $ | 37,589,993 | $ | 17,906,661 | ||||
The Barron’s 400SM ETF used capital loss carryovers during the year ended November 30, 2021 in the amount of $538,562.
As of May 31, 2022, the cost of investments for federal income tax purposes and accumulated net unrealized appreciation/(depreciation) on investments were as follows:
| Barron’s 400SM ETF | ||||
| Gross appreciation (excess of value over tax cost) | $ | 19,012,257 | ||
| Gross depreciation (excess of tax cost over value) | (9,626,275 | ) | ||
| Net unrealized appreciation (depreciation) | $ | 9,385,982 | ||
| Cost of investments for income tax purposes | $ | 131,563,417 | ||
The differences between book-basis and tax-basis are primarily due to the deferral of losses from wash sales and investments in partnerships. In addition, certain tax cost basis adjustments are finalized at fiscal year-end and therefore have not been determined as of May 31, 2022.
F. Income Taxes
No provision for income taxes is included in the accompanying financial statements, as the Fund intends to distribute to shareholders all taxable investment income and realized gains and otherwise comply with Subchapter M of the Internal Revenue Code of 1986, as amended, applicable to regulated investment companies. The Fund evaluates tax positions taken (or expected to be taken) in the course of preparing the Fund’s tax returns to determine whether these positions meet a “more-likely-than-not” standard that, based on the technical merits, have a more than fifty percent likelihood of being sustained by a taxing authority upon examination. A tax position that meets the “more-likely-than-not” recognition threshold is measured to determine the amount of benefit to recognize in the financial statements.
As of and during the six months ended May 31, 2022, the Fund did not have a liability for any unrecognized tax benefits. The Fund files U.S. federal, state, and local tax returns as required. The Fund’s tax returns are subject to examination by the relevant tax authorities until expiration of the applicable statute of limitations, which is generally three years after the filing of the tax return, but may extend to four years in certain jurisdictions. Tax returns for open years have incorporated no uncertain tax positions that require a provision for income taxes.
15 | May 31, 2022
Barron’s 400SM ETF
| Notes to Financial Statements | May 31, 2022 (Unaudited) |
G. Lending of Portfolio Securities
The Fund has entered into a securities lending agreement with State Street Bank & Trust Co. (“SSB”), the Fund’s lending agent. The Fund may lend its portfolio securities only to borrowers that are approved by SSB. The Fund will limit such lending to not more than 33 1/3% of the value of its total assets. The Fund’s securities held at SSB as custodian shall be available to be lent except those securities the Fund or ALPS Advisors, Inc. specifically identifies in writing as not being available for lending. The borrower pledges and maintains with the Fund collateral consisting of cash (U.S. Dollars only), securities issued or guaranteed by the U.S. government or its agencies or instrumentalities, and cash equivalents (including irrevocable bank letters of credit) issued by a person other than the borrower or an affiliate of the borrower. The initial collateral received by the Fund is required to have a value of no less than 102% of the market value of the loaned securities for U.S equity securities and a value of no less than 105% of the market value for non-U.S. equity securities. The collateral is maintained thereafter, at a market value equal to not less than 102% of the current value of the U.S. equity securities on loan and not less than 105% of the current value of the non-U.S. equity securities on loan. The market value of the loaned securities is determined at the close of each business day and any additional required collateral is delivered to the Fund on the next business day. During the term of the loan, the Fund is entitled to all distributions made on or in respect of the loaned securities. Loans of securities are terminable at any time and the borrower, after notice, is required to return borrowed securities within the customary time period for settlement of securities transactions.
Any cash collateral received is reinvested in a money market fund managed by SSB as disclosed in the Fund’s Schedule of Investments and is reflected in the Statements of Assets and Liabilities as a payable for collateral upon return of securities loaned. Non-cash collateral, in the form of securities issued or guaranteed by the U.S. government or its agencies or instrumentalities, is not disclosed in the Fund’s Statements of Assets and Liabilities as it is held by the lending agent on behalf of the Fund, and the Fund does not have the ability to re-hypothecate these securities. Income earned by the Fund from securities lending activity is disclosed in the Statement of Operations.
The following is a summary of the Fund's securities lending agreement and related cash and non-cash collateral received as of May 31, 2022:
| Market Value of Securities on Loan | Cash Collateral Received | Non-Cash Collateral Received | Total Collateral Received | |||||||||||||
| Barron's 400 ETF | $ | 5,186,628 | $ | 2,349,632 | $ | 3,066,995 | $ | 5,416,627 | ||||||||
The risks of securities lending include the risk that the borrower may not provide additional collateral when required or may not return the securities when due. To mitigate these risks, the Fund benefits from a borrower default indemnity provided by SSB. SSB’s indemnity allows for full replacement of securities lent wherein SSB will purchase the unreturned loaned securities on the open market by applying the proceeds of the collateral, or to the extent such proceeds are insufficient or the collateral is unavailable, SSB will purchase the unreturned loan securities at SSB’s expense. However, the Fund could suffer a loss if the value of the investments purchased with cash collateral falls below the value of the cash collateral received.
The following table reflects a breakdown of transactions accounted for as secured borrowings, the gross obligation by the type of collateral pledged or securities loaned, and the remaining contractual maturity of those transactions as of May 31, 2022:
| Barron's 400 ETF | Remaining contractual maturity of the agreements |
| Securities Lending Transactions | Overnight & Continuous | Up to 30 days | 30-90 days | Greater than 90 days | Total | |||||||||||||||
| Common Stocks | $ | 2,349,632 | $ | – | $ | – | $ | – | $ | 2,349,632 | ||||||||||
| Total Borrowings | 2,349,632 | |||||||||||||||||||
| Gross amount of recognized liabilities for securities lending (collateral received) | $ | 2,349,632 | ||||||||||||||||||
3. INVESTMENT ADVISORY FEE AND OTHER AFFILIATED TRANSACTIONS
ALPS Advisors, Inc. (the “Adviser”) serves as the Fund’s investment adviser pursuant to an Investment Advisory Agreement with the Trust on behalf of the Fund (the “Advisory Agreement”). Pursuant to the Advisory Agreement, the Fund pays the Adviser an annual management fee for the services and facilities it provides, payable on a monthly basis at the annual rate of 0.65% of the Fund’s average daily net assets. From time to time, the Adviser may waive all or a portion of its fee.
Out of the unitary management fees, the Adviser pays substantially all expenses of the Fund, including the cost of transfer agency, custody, fund administration, legal, audit, trustees and other services, except for interest expenses, distribution fees or expenses, brokerage expenses, taxes and extraordinary expenses not incurred in the ordinary course of the Fund's business. The Adviser’s unitary management fee is designed to pay substantially all of the Fund’s expenses and to compensate the Adviser for providing services to the Fund.
16 | May 31, 2022
Barron’s 400SM ETF
| Notes to Financial Statements | May 31, 2022 (Unaudited) |
ALPS Fund Services, Inc., an affiliate of the Adviser, is the administrator of the Fund.
Prior to February 16, 2022, each Trustee received (1) a quarterly retainer of $10,000, (2) a per meeting fee of $5,000, (3) $1,500 for any special meeting held outside of a regularly scheduled board meeting, and (4) reimbursement for all reasonable out-of-pocket expenses relating to attendance at meetings. In addition, the Chairman of the Board and Chairman of the Audit Committee each received a quarterly retainer of $2,000, in connection with their respective roles. Effective February 16, 2022, each Trustee receives (1) a quarterly retainer of $20,000, (2) a per meeting fee of $10,000, (3) $2,500 for any special meeting held outside of a regularly scheduled board meeting, and (4) reimbursement for all reasonable out-of-pocket expenses relating to attendance at meetings. In addition, the Chairman of the Board receives a quarterly retainer of $5,000, the Chairman of the Audit Committee receives a quarterly retainer of $3,000, and the Chairman of the Nominating & Governance Committee receives a quarterly retainer of $2,000, each in connection with their respective roles.
4. PURCHASES AND SALES OF SECURITIES
For the six months ended May 31, 2022 the cost of purchases and proceeds from sales of investment securities, excluding in-kind transactions and short-term investments, were as follows:
| Fund | Purchases | Sales | ||||||
| Barron's 400 ETF | $ | 71,896,343 | $ | 72,597,451 | ||||
For the six months ended May 31, 2022, the cost of in-kind purchases and proceeds from in-kind sales were as follows:
| Fund | Purchases | Sales | ||||||
| Barron's 400 ETF | $ | – | $ | 3,156,132 | ||||
For the six months ended May 31, 2022 the Barron's 400 ETF had in-kind net realized gains of $801,304.
Gains on in-kind transactions are not considered taxable for federal income tax purposes and losses on in-kind transactions are also not deductible for tax purposes.
5. CAPITAL SHARE TRANSACTIONS
Shares are created and redeemed by the Fund only in Creation Unit size aggregations of 25,000 Shares. Only broker-dealers or large institutional investors with creation and redemption agreements called Authorized Participants (“AP”) are permitted to purchase or redeem Creation Units from the Fund. Such transactions are generally permitted on an in-kind basis, with a balancing cash component to equate the transaction to the NAV per unit of the Fund on the transaction date. Cash may be substituted equivalent to the value of certain securities generally when they are not available in sufficient quantity for delivery, not eligible for trading by the AP or as a result of other market circumstances.
6. RELATED PARTY TRANSACTIONS
The Fund engaged in cross trades between other funds in the Trust during the six months ended May 31, 2022 pursuant to Rule 17a-7 under the 1940 Act. Cross trading is the buying or selling of portfolio securities between funds to which the Adviser serves as the investment adviser. The Board previously adopted procedures that apply to transactions between the Funds of the Trust pursuant to Rule 17a-7. These transactions related to cross trades during the period complied with the requirements set forth by Rule 17a-7 and the Trust’s procedures.
Transactions related to cross trades during the six months ended May 31, 2022, were as follows:
| Fund | Purchase cost paid | Sale proceeds received | Realized gain/(loss) on sales | |||||||||
| Barron's 400 ETF | $ | 2,128,652 | $ | 304,289 | $ | (62,415 | ) | |||||
7. MARKET RISK
The Fund is subject to investment and operational risks associated with financial, economic and other global market developments and disruptions, including the recent spread of an infectious respiratory illness caused by a novel strain of coronavirus (known as COVID-19), which can negatively impact the securities markets and cause the Fund to lose value. Securities in the Fund’s portfolio may underperform in comparison to securities in general financial markets, a particular financial market or other asset classes due to a number of factors, including inflation (or expectations for inflation), deflation (or expectations for deflation), interest rates, global demand for particular products or resources, market instability, debt crises and downgrades, embargoes, tariffs, sanctions and other trade barriers, regulatory events, other governmental trade or market control programs and related geopolitical events. In addition, the value of the Fund’s investments may be negatively affected by the occurrence of global events such as war, terrorism, environmental disasters, natural disasters or events, country instability, and infectious disease epidemics or pandemics.
17 | May 31, 2022
Barron’s 400SM ETF
| Notes to Financial Statements | May 31, 2022 (Unaudited) |
The spread of COVID-19 has caused volatility, severe market dislocations and liquidity constraints in many markets, including markets for the securities the Fund holds, and may adversely affect the Fund’s investments and operations. The transmission of COVID-19 and efforts to contain its spread have resulted in travel restrictions and disruptions, closed international borders, enhanced health screenings at ports of entry and elsewhere, disruption of and delays in healthcare service preparation and delivery, quarantines, event and service cancellations or interruptions, disruptions to business operations and supply chains, and a reduction in consumer and business spending, as well as general concern and uncertainty that has negatively affected the economy. These disruptions have led to instability in the market place and the jobs market. The impact of COVID-19 could adversely affect the economies of many nations or the entire global economy, the financial well-being and performance of individual issuers, borrowers and sectors and the health of the markets generally in potentially significant and unforeseen ways.
The foregoing could lead to a significant economic downturn or recession, increased market volatility, a greater number of market closures, higher default rates and adverse effects on the values and liquidity of the Fund’s securities or other assets. Such impacts may adversely affect the performance of the Fund.
8. SUBSEQUENT EVENTS
Effective as of the close of business on March 31, 2022, Deloitte & Touche LLP (“Deloitte”) resigned as the independent registered public accounting firm for the Fund. The report of Deloitte on the Fund’s financial statements as of and for the fiscal years or periods ended November 30, 2021 and November 30, 2020 did not contain an adverse opinion or a disclaimer of opinion, and was not qualified or modified as to uncertainties, audit scope or accounting principles. During the Fund’s fiscal year or period ended November 30, 2021 and November 30, 2020, and through March 31, 2022, there were no disagreements between the Fund and Deloitte on any matter of accounting principles or practices, financial statement disclosure or auditing scope or procedure, which disagreements, if not resolved to the satisfaction of Deloitte, would have caused it to make reference to the subject matter of the disagreements in its report on the financial statements of the Fund for such year or period. During the Fund’s fiscal years or periods ended November 30, 2021 and November 30, 2020, there were no “reportable events” (as defined in Item 304(a)(1)(v) of Regulation S-K under the Securities Exchange Act of 1934, as amended (the “Exchange Act”)).
During the Fund’s fiscal year or period ended November 30, 2021 and November 30, 2020, and during the subsequent interim period through March 31, 2022, neither the Fund, nor anyone on their behalf, consulted with Deloitte, on behalf of the Fund, regarding any matter that was either the subject of a “disagreement,” as defined in Item 304(a)(1)(iv) of Regulation S-K under the Securities Exchange Act of 1934, as amended (the “Exchange Act”), and the instructions thereto, or a “reportable event,” as defined in Item 304(a)(1)(v) of Regulation S-K under the Exchange Act.
On June 21, 2022, upon the recommendation of the Fund’s Audit Committee, the Board of Trustees of the Fund approved the engagement of BBD, LLP (“BBD”) as the independent registered public accounting firm for the Fund for the fiscal year ending November 30, 2022. The Board and its Audit Committee considered the engagement of BBD in connection with the resignation of the Fund’s former independent registered accounting firm on March 31, 2022.
18 | May 31, 2022
Barron’s 400SM ETF
| Additional Information | May 31, 2022 (Unaudited) |
PROXY VOTING RECORDS, POLICIES AND PROCEDURES
Information regarding how the Fund voted proxies relating to portfolio securities during the most recent 12-month period ended June 30 and a description of the Fund’s proxy voting policies and procedures used in determining how to vote for proxies are available without charge on the SEC’s website at www.sec.gov and upon request, by calling (toll-free) 1-866-759-5679.
PORTFOLIO HOLDINGS
The Fund files a complete schedule of portfolio holdings with the U.S. Securities and Exchange Commission (“SEC”) for the first and third quarters of each fiscal year on Form N-PORT within 60 days after the end of the period. Copies of the Fund’s Form N-PORT are available without a charge, upon request, by contacting the Fund at 1-866-759-5679 and on the SEC’s website at https://www.sec.gov.
TAX INFORMATION
The Barron’s 400 ETF designates the following as a percentage of taxable ordinary income distributions, or up to the maximum amount allowable, for the calendar year ended December 31, 2021:
| Qualified Dividend Income | Dividend Received Deduction | |
| Barron's 400 ETF | 100.00% | 100.00% |
In early 2022, if applicable, shareholders of record received this information for the distributions paid to them by the Fund during the calendar year 2021 via Form 1099. The Fund will notify shareholders in early 2023 of amounts paid to them by the Fund, if any, during the calendar year 2022.
LICENSING AGREEMENT
MarketGrader Capital, LLC (the “Index Provider”) has entered into a license agreement with Dow Jones & Company to use the “Barron’s” name and certain related intellectual property in connection with the Underlying Index. The Index Provider also has entered into a license and services agreement with its parent company, MarketGrader.com, to use the methodology for constructing the Underlying Index. The Index Provider in turn has entered into the Sublicense Agreement with ALPS Advisers, Inc. to use the Underlying Index. The following disclosure relates to such licensing agreements:
The Barron’s 400 ETF (the “Fund”) is not sponsored, managed or advised by the Index Provider. The Index Provider makes no representation or warranty, express or implied, to the owners of the Fund or any member of the public regarding the advisability of investing in securities generally or in the Fund particularly or the ability of the Underlying Index to track the performance of a market or sector. The Index Provider’s only relationship to ALPS Advisors, Inc. (the “Adviser”) or the Fund is the licensing of certain service marks and trade names of the Index Provider and of the Underlying Index that is determined, composed and calculated by the Index Provider without regard to the Adviser or the Fund. The Index Provider has no obligation to take the needs of the Adviser or the Fund or the owners of the Fund into consideration in determining, composing or calculating the Underlying Index.
THE INDEX PROVIDER DOES NOT GUARANTEE THE ACCURACY AND/OR THE COMPLETENESS OF THE UNDERLYING INDEX OR ANY DATA INCLUDED THEREIN AND THE INDEX PROVIDER SHALL HAVE NO LIABILITY FOR ANY ERRORS, OMISSIONS, OR INTERRUPTIONS THEREIN. THE INDEX PROVIDER MAKES NO WARRANTY, EXPRESS OR IMPLIED, AS TO RESULTS TO BE OBTAINED BY THE ADVISER, THE FUND, OWNERS OF THE FUND, OR ANY OTHER PERSON OR ENTITY FROM THE USE OF THE UNDERLYING INDEX OR ANY DATA INCLUDED THEREIN. THE INDEX PROVIDER MAKES NO EXPRESS OR IMPLIED WARRANTIES, AND EXPRESSLY DISCLAIMS ALL WARRANTIES OF MERCHANTABILITY OR FITNESS FOR A PARTICULAR PURPOSE OR USE WITH RESPECT TO THE UNDERLYING INDEX OR ANY DATA INCLUDED THEREIN. WITHOUT LIMITING ANY OF THE FOREGOING, IN NO EVENT SHALL THE INDEX PROVIDER HAVE ANY LIABILITY FOR ANY SPECIAL, PUNITIVE, INDIRECT, OR CONSEQUENTIAL DAMAGES (INCLUDING LOST PROFITS), EVEN IF NOTIFIED OF THE POSSIBILITY OF SUCH DAMAGES.
“The Barron’s 400 IndexSM” is calculated and published by MarketGrader Capital, LLC (“MarketGrader”). “Barron’s,” “Barron’s 400” and “Barron’s 400 Index” are trademarks or service marks of DJC & Company, Inc. or its affiliates and have been licensed to MarketGrader and sublicensed for certain purposes by Barron’s 400 Exchange Traded Fund, a sub-fund of that certain ALPS ETF Trust, a Delaware Statutory Trust (the “Sub-Licensee”). The Barron’s 400SM ETF (the “Product”) is not sponsored or advised by DJC or its affiliates. DJC and its affiliates make no representation or warranty, express or implied, to the owners of the Fund or any member of the public regarding the advisability of trading in the Fund particularly. DJC and its affiliates’ only relationship to the Licensee is the licensing of certain trademarks and trade names of DJC. The Barron's 400 IndexSM is determined, composed and calculated by MarketGrader without regard to DJC. DJC has no obligation to take the needs of the Licensee or the owners of the Fund into consideration in connection with its licensing of the Barron’s 400 Index to MarketGrader or the sublicense to Licensee. DJC and its affiliates are not responsible for and have not participated in the calculation of the Barron's 400 IndexSM or in the determination of the timing of, prices at, or quantities of the Fund to be sold or in the determination or calculation of the equation by which the Product are to be converted into cash. DJC and its affiliates have no obligation or liability in connection with the administration, marketing or trading of the Barron’s 400 Index or the Product.
19 | May 31, 2022
Barron’s 400SM ETF
| Additional Information | May 31, 2022 (Unaudited) |
DOW JONES DOES NOT GUARANTEE THE ACCURACY AND/OR THE COMPLETENESS OF THE BARRON’S 400 INDEX OR ANY DATA INCLUDED THEREIN AND DOW JONES AND ITS AFFILIATES SHALL HAVE NO LIABILITY FOR ANY ERRORS, OMISSIONS, OR INTERRUPTIONS THEREIN. DOW JONESAND ITS AFFILIATES MAKE NO WARRANTY, EXPRESS OR IMPLIED, AS TO RESULTS TO BE OBTAINED BY THE LICENSEE, OWNERS OF THE FUND, OR ANY OTHER PERSON OR ENTITY FROM THE USE OF THE BARRON’S 400 INDEX OR ANY DATA INCLUDED THEREIN. DOW JONES AND ITS AFFILIATES MAKE NO EXPRESS OR IMPLIED WARRANTIES. AND EXPRESSLY DISCLAIM ALL WARRANTIES, OF MERCHANTABILITY OR FITNESS FOR A PARTICULAR PURPOSE OR USE WITH RESPECT TO THE BARRON’S 400 INDEX OR ANY DATA INCLUDED THEREIN. WITHOUT LIMITING ANY OF THE FOREGOING, IN NO EVENT SHALL DOW JONES AND ITS AFFILIATES HAVE ANY LIABILITY FOR ANY LOST PROFITS OR INDIRECT, PUNITIVE, SPECIAL OR CONSEQUENTIAL DAMAGES OR LOSSES, EVEN IF NOTIFIED OF THE POSSIBILITY OF SUCH DAMAGES. THERE ARE NO THIRD PARTY BENEFICIARIES OF ANY AGREEMENTS OR ARRANGEMENTS BETWEEN DJC AND THE LICENSEE, OTHER THAN THE LICENSORS OF MARKETGRADER.
The Adviser does not guarantee the accuracy and/or the completeness of the Underlying Index or any data included therein, and the Adviser shall have no liability for any errors, omissions or interruptions therein. The Adviser makes no warranty, express or implied, as to results to be obtained by the Fund, owners of the Shares of the Fund or any other person or entity from the use of the Underlying Index or any data included therein. The Adviser makes no express or implied warranties, and expressly disclaims all warranties of merchantability or fitness for a particular purpose or use with respect to the Underlying Index or any data included therein. Without limiting any of the foregoing, in no event shall the Adviser have any liability for any special, punitive, direct, indirect or consequential damages (including lost profits) arising out of matters relating to the use of the Underlying Index, even if notified of the possibility of such damages.
20 | May 31, 2022
Barron’s 400SM ETF
| Liquidity Risk Management Program | May 31, 2022 (Unaudited) |
In compliance with the Securities and Exchange Commission’s liquidity risk management rule (the “Liquidity Rule”), the ALPS ETF Trust (the “Trust”) has established a liquidity risk management program (the “Program”) to govern the Trust’s approach to managing liquidity risk for each series of the Trust (each a “Fund”). The Program is overseen by the Liquidity Committee (the “Committee”), a committee comprised of representatives of the Trust’s investment adviser, ALPS Advisors, Inc. The Trust’s Board of Trustees (the “Board”) has approved the designation of the Committee to oversee the Program.
The Program’s principal objectives include supporting each Fund’s compliance with limits on investments in illiquid assets and assessing and managing the risk that a Fund will be unable to meet its redemption obligations without significant dilution of remaining investors’ interests in the Fund. The Program includes a number of elements that support the management and assessment of liquidity risk, including an annual assessment of factors that influence a Fund’s liquidity and, for Funds that are not “In-Kind ETFs,” the periodic classification and re-classification of such Fund’s investments into groupings that reflect the Committee’s assessment of their liquidity under current market conditions.
At a meeting of the Board held on March 7, 2022, the Trustees received a report from the Committee regarding the design and operational effectiveness of the Program for the period January 1, 2021 through December 31, 2021 (the “Period”). The Committee determined, and reported to the Board, that the Program has been operating effectively to assess and manage each Fund’s liquidity risk and has been and continues to be adequately and effectively implemented to monitor and (as applicable) respond to the Funds’ liquidity developments.
The Committee reported that during the period covered by the report, there were no liquidity events that impacted the Funds or their ability to timely meet redemptions without dilution to existing shareholders. The report also discussed notable events affecting liquidity over the Period, including extended market holidays and closures in certain countries. Among other things, the Committee’s report noted that no Fund is required to have a highly liquid investment minimum based either on its status as an In-Kind ETF or on its ability to rely on another exemption under the Liquidity Rule. The Committee’s report further noted that no material changes have been made to the Program since its implementation.
21 | May 31, 2022

Must be accompanied or preceded by a prospectus.
ALPS Portfolio Solutions Distributor, Inc., a FINRA member, is the Distributor for the Barron’s 400SM ETF.

Table of Contents
| Performance Overview | |
| RiverFront Dynamic Core Income ETF | 1 |
| RiverFront Dynamic US Dividend Advantage ETF | 3 |
| RiverFront Dynamic US Flex-Cap ETF | 5 |
| RiverFront Strategic Income Fund | 7 |
| Disclosure of Fund Expenses | 9 |
| Financial Statements | |
| Schedule of Investments | |
| RiverFront Dynamic Core Income ETF | 10 |
| RiverFront Dynamic US Dividend Advantage ETF | 13 |
| RiverFront Dynamic US Flex-Cap ETF | 15 |
| RiverFront Strategic Income Fund | 17 |
| Statement of Assets and Liabilities | 20 |
| Statement of Operations | 21 |
| Statements of Changes in Net Assets | |
| RiverFront Dynamic Core Income ETF | 22 |
| RiverFront Dynamic US Dividend Advantage ETF | 23 |
| RiverFront Dynamic US Flex-Cap ETF | 24 |
| RiverFront Strategic Income Fund | 25 |
| Financial Highlights | 26 |
| Notes to Financial Statements | 30 |
| Additional Information | 38 |
| Liquidity Risk Management Program | 39 |
alpsfunds.com
RiverFront Dynamic Core Income ETF
| Performance Overview | May 31, 2022 (Unaudited) |
Investment Objective
RiverFront Dynamic Core Income ETF (the “Fund” or "RFCI") seeks total return, with an emphasis on income as the source of that total return. The Fund seeks to achieve its investment objective by investing in a global portfolio of fixed income securities of various maturities, ratings and currency denominations.
Performance (as of May 31, 2022)
| 6 Months | 1 Year | 5 Year | Since Inception^ | |
| RiverFront Dynamic Core Income ETF – NAV | -6.91% | -6.25% | 1.18% | 1.08% |
| RiverFront Dynamic Core Income ETF – Market Price* | -6.83% | -6.14% | 1.14% | 1.09% |
| Bloomberg U.S. Aggregate Bond Total Return Index | -9.15% | -8.22% | 1.18% | 1.07% |
Total Expense Ratio (per the current prospectus) is 0.51%.
Performance data quoted represents past performance. Past performance does not guarantee future results. Total return figures assume reinvestment of dividends and capital gains distributions, if any. The table does not reflect the deduction of taxes that a shareholder would pay on Fund distributions or the redemption of Fund shares. Investment return and principal value of an investment will fluctuate so that an investor’s shares, when sold or redeemed, may be worth more or less than the original cost. Current performance data may be higher or lower than actual data quoted. For the most current month-end performance data please visit www.alpsfunds.com or call 1.866.759.5679.
NAV is an exchange-traded fund’s per-share value. The per-share dollar amount of the fund is derived by dividing the total value of all the securities in its portfolio, less any liabilities, by the number of fund shares outstanding. Market Price is the price at which a share can currently be traded in the market. Information detailing the number of days the Market Price of the Fund was greater than the Fund’s NAV and the number of days it was less than the Fund’s NAV can be obtained at www.alpsfunds.com.
| ^ | The Fund commenced operations on June 14, 2016. |
| * | Market Price means the official closing price of a share or, if it more accurately reflects the market value of a share at the time as of which the Fund calculates current net asset value per share, the price that is the midpoint of the bid-ask spread as of that time. It does not represent the returns an investor would receive if shares were traded at other times. |
Bloomberg U.S. Aggregate Bond Total Return Index is a broad-based benchmark that measures the investment grade, U.S. dollar-denominated, fixed-rate taxable bond market, including Treasuries, government-related and corporate securities, MBS (agency fixed-rate and hybrid ARM pass-throughs), ABS, and CMBS (agency and non-agency). The index is reported on a total return basis, which assumes reinvestment of any dividends and distributions realized during a given time period. The index is not actively managed and does not reflect any deductions for fees, expenses or taxes. One cannot invest directly in an index. Index performance does not reflect fund performance.
The RiverFront Dynamic Core Income ETF is not suitable for all investors. Investments in the Fund are subject to investment risks, including possible loss of the principal amount invested.
The Fund’s shares are not individually redeemable. Investors buy and sell shares of the Fund on a secondary market. Only market makers or “authorized participants” may trade directly with the Fund, typically in blocks of 25,000 shares.
ALPS Portfolio Solutions Distributor, Inc., a FINRA member, is the Distributor for the RiverFront Dynamic Core Income ETF.
1 | May 31, 2022
RiverFront Dynamic Core Income ETF
| Performance Overview | May 31, 2022 (Unaudited) |
Top 10 Holdings*^ (as of May 31, 2022)
| United States Treasury Bond | 6.28 | % | ||
| United States Treasury Note | 3.18 | % | ||
| Iron Mountain, Inc. | 2.03 | % | ||
| Dollar Tree, Inc. | 1.97 | % | ||
| Ball Corp. | 1.97 | % | ||
| Marathon Oil Corp. | 1.96 | % | ||
| Boeing Co. | 1.95 | % | ||
| Sabine Pass Liquefaction LLC | 1.95 | % | ||
| Citigroup, Inc. | 1.94 | % | ||
| HSBC Holdings PLC | 1.94 | % | ||
| Total % of Top 10 Holdings | 25.17 | % |
| * | % of Total Investments. |
| ^ | Excludes Money Market Fund |
Future holdings are subject to change.
Asset Allocation* (as of May 31, 2022)
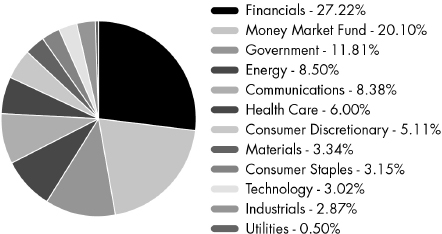
Growth of $10,000 (as of May 31, 2022)
Comparison of Change in Value of $10,000 Investment in the Fund and the Fund’s benchmark
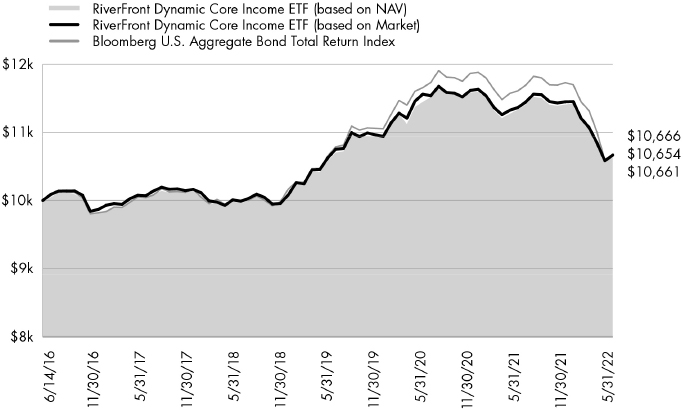
The chart above compares historical performance of a hypothetical investment of $10,000 in the Fund since inception with the performance of the Fund’s benchmark index. Results include the reinvestment of all dividends and capital gains distributions. Past performance does not guarantee future results. The graph does not reflect the deduction of taxes that a shareholder would pay on Fund distributions or the redemption of Fund shares.
2 | May 31, 2022
RiverFront Dynamic US Dividend Advantage ETF
| Performance Overview | May 31, 2022 (Unaudited) |
Investment Objective
RiverFront Dynamic US Dividend Advantage ETF (the “Fund” or "RFDA") seeks to provide capital appreciation and dividend income. Under normal market conditions, the Fund seeks to achieve its investment objective by investing at least 65% of its net assets in a portfolio of equity securities of publicly traded U.S. companies with the potential for dividend income. Equity securities include common stocks and common or preferred shares of real estate investment trusts (“REITs”).
Performance (as of May 31, 2022)
| 6 Months | 1 Year | 5 Year | Since Inception^ | |
| RiverFront Dynamic US Dividend Advantage ETF – NAV | 6.39% | 12.71% | 13.03% | 13.27% |
| RiverFront Dynamic US Dividend Advantage ETF – Market Price* | 6.27% | 12.64% | 13.02% | 13.26% |
| S&P 500® Total Return Index | -8.85% | -0.30% | 13.38% | 13.98% |
Total Expense Ratio (per the current prospectus) is 0.52%.
Performance data quoted represents past performance. Past performance does not guarantee future results. Total return figures assume reinvestment of dividends and capital gains distributions, if any. The table does not reflect the deduction of taxes that a shareholder would pay on Fund distributions or the redemption of Fund shares. Investment return and principal value of an investment will fluctuate so that an investor’s shares, when sold or redeemed, may be worth more or less than the original cost. Current performance data may be higher or lower than actual data quoted. For the most current month-end performance data please visit www.alpsfunds.com or call 1.866.759.5679.
NAV is an exchange-traded fund’s per-share value. The per-share dollar amount of the fund is derived by dividing the total value of all the securities in its portfolio, less any liabilities, by the number of fund shares outstanding. Market Price is the price at which a share can currently be traded in the market. Information detailing the number of days the Market Price of the Fund was greater than the Fund’s NAV and the number of days it was less than the Fund’s NAV can be obtained at www.alpsfunds.com.
| ^ | The Fund commenced operations on June 7, 2016. |
| * | Market Price means the official closing price of a share or, if it more accurately reflects the market value of a share at the time as of which the Fund calculates current net asset value per share, the price that is the midpoint of the bid-ask spread as of that time. It does not represent the returns an investor would receive if shares were traded at other times. |
S&P 500® Total Return Index is the Standard & Poor’s composite index of 500 stocks, a widely recognized, unmanaged index of common stock prices. The index is reported on a total return basis, which assumes reinvestment of any dividends and distributions realized during a given time period. The index is not actively managed and does not reflect any deductions for fees, expenses or taxes. One cannot invest directly in an index. Index performance does not reflect fund performance.
The RiverFront Dynamic US Dividend Advantage ETF is not suitable for all investors. Investments in the Fund are subject to investment risks, including possible loss of the principal amount invested.
The Fund’s shares are not individually redeemable. Investors buy and sell shares of the Fund on a secondary market. Only market makers or “authorized participants” may trade directly with the Fund, typically in blocks of 25,000 shares.
ALPS Portfolio Solutions Distributor, Inc., a FINRA member, is the Distributor for the RiverFront Dynamic US Dividend Advantage ETF.
3 | May 31, 2022
RiverFront Dynamic US Dividend Advantage ETF
| Performance Overview | May 31, 2022 (Unaudited) |
Top 10 Holdings* (as of May 31, 2022)
| Exxon Mobil Corp. | 5.12 | % | ||
| AbbVie, Inc. | 4.29 | % | ||
| Bristol-Myers Squibb Co. | 3.57 | % | ||
| Altria Group, Inc. | 3.49 | % | ||
| Merck & Co., Inc. | 3.45 | % | ||
| Coca-Cola Co. | 3.40 | % | ||
| International Business Machines Corp. | 3.38 | % | ||
| Southwest Gas Holdings, Inc. | 3.07 | % | ||
| Microsoft Corp. | 2.94 | % | ||
| Duke Energy Corp. | 2.89 | % | ||
| Total % of Top 10 Holdings | 35.60 | % |
| * | % of Total Investments (excluding investments purchased with collateral from securities loaned) |
Asset Allocation* (as of May 31, 2022)
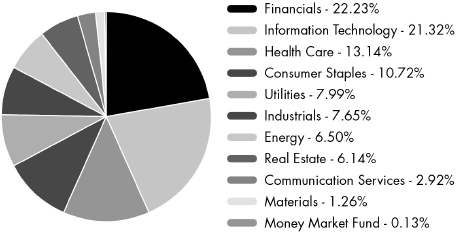
Future holdings are subject to change.
Growth of $10,000 (as of May 31, 2022)
Comparison of Change in Value of $10,000 Investment in the Fund and the Fund’s benchmark
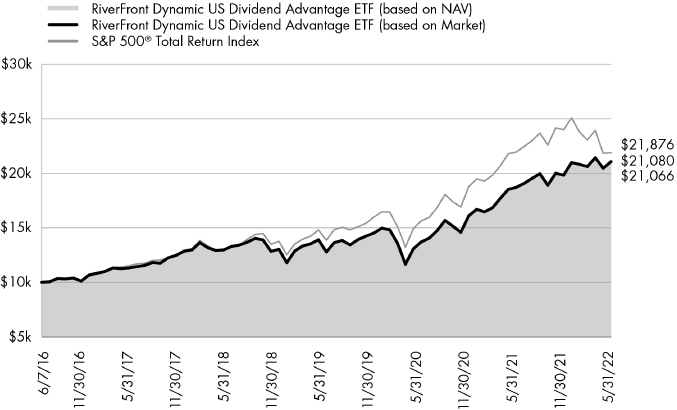
The chart above compares historical performance of a hypothetical investment of $10,000 in the Fund since inception with the performance of the Fund’s benchmark index. Results include the reinvestment of all dividends and capital gains distributions. Past performance does not guarantee future results. The graph does not reflect the deduction of taxes that a shareholder would pay on Fund distributions or the redemption of Fund shares.
4 | May 31, 2022
RiverFront Dynamic US Flex-Cap ETF
| Performance Overview | May 31, 2022 (Unaudited) |
Investment Objective
RiverFront Dynamic US Flex-Cap ETF (the “Fund” or "RFFC") seeks to provide capital appreciation. Under normal market conditions, the Fund seeks to achieve its investment objective by investing at least 65% of its net assets in a portfolio of equity securities of publicly traded U.S. companies. Equity securities include common stocks and common or preferred shares of real estate investment trusts (“REITs”).
Performance (as of May 31, 2022)
| 6 Months | 1 Year | 5 Year | Since Inception^ | |
| RiverFront Dynamic US Flex-Cap ETF – NAV | -4.73% | 1.30% | 9.77% | 10.95% |
| RiverFront Dynamic US Flex-Cap ETF – Market Price* | -4.75% | 1.26% | 9.75% | 10.94% |
| S&P Composite 1500® Total Return Index | -8.68% | -0.91% | 13.04% | 13.68% |
Total Expense Ratio (per the current prospectus) is 0.52%.
Performance data quoted represents past performance. Past performance does not guarantee future results. Total return figures assume reinvestment of dividends and capital gains distributions, if any. The table does not reflect the deduction of taxes that a shareholder would pay on Fund distributions or the redemption of Fund shares. Investment return and principal value of an investment will fluctuate so that an investor’s shares, when sold or redeemed, may be worth more or less than the original cost. Current performance data may be higher or lower than actual data quoted. For the most current month-end performance data please visit www.alpsfunds.com or call 1.866.759.5679.
NAV is an exchange-traded fund’s per-share value. The per-share dollar amount of the fund is derived by dividing the total value of all the securities in its portfolio, less any liabilities, by the number of fund shares outstanding. Market Price is the price at which a share can currently be traded in the market. Information detailing the number of days the Market Price of the Fund was greater than the Fund’s NAV and the number of days it was less than the Fund’s NAV can be obtained at www.alpsfunds.com.
| ^ | The Fund commenced operations on June 7, 2016. |
| * | Market Price means the official closing price of a share or, if it more accurately reflects the market value of a share at the time as of which the Fund calculates current net asset value per share, the price that is the midpoint of the bid-ask spread as of that time. It does not represent the returns an investor would receive if shares were traded at other times. |
S&P Composite 1500® Total Return Index is the Standard & Poor’s broad-based unmanaged capitalization-weighted index comprising 1,500 stocks of Large-cap, Mid-cap, and Small-cap U.S. companies. The index is reported on a total return basis, which assumes reinvestment of any dividends and distributions realized during a given time period. The index is not actively managed and does not reflect any deductions for fees, expenses or taxes. One cannot invest directly in an index. Index performance does not reflect fund performance.
The RiverFront Dynamic US Flex-Cap ETF is not suitable for all investors. Investments in the Fund are subject to investment risks, including possible loss of the principal amount invested.
The Fund’s shares are not individually redeemable. Investors buy and sell shares of the Fund on a secondary market. Only market makers or “authorized participants” may trade directly with the Fund, typically in blocks of 25,000 shares.
ALPS Portfolio Solutions Distributor, Inc., a FINRA member, is the Distributor for the RiverFront Dynamic US Flex-Cap ETF.
5 | May 31, 2022
RiverFront Dynamic US Flex-Cap ETF
| Performance Overview | May 31, 2022 (Unaudited) |
Top 10 Holdings* (as of May 31, 2022)
| Apple, Inc. | 5.76 | % | ||
| Microsoft Corp. | 4.77 | % | ||
| Amazon.com, Inc. | 2.95 | % | ||
| UnitedHealth Group, Inc. | 1.85 | % | ||
| Exxon Mobil Corp. | 1.75 | % | ||
| Berkshire Hathaway, Inc. | 1.65 | % | ||
| Johnson & Johnson | 1.63 | % | ||
| Pfizer, Inc. | 1.57 | % | ||
| Visa, Inc. | 1.52 | % | ||
| Mastercard, Inc. | 1.45 | % | ||
| Total % of Top 10 Holdings | 24.90 | % |
| * | % of Total Investments (excluding investments purchased with collateral from securities loaned) |
Asset Allocation* (as of May 31, 2022)
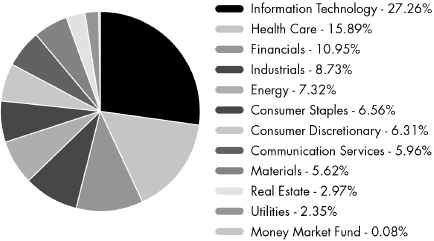
Future holdings are subject to change.
Growth of $10,000 (as of May 31, 2022)
Comparison of Change in Value of $10,000 Investment in the Fund and the Fund’s benchmark

The chart above compares historical performance of a hypothetical investment of $10,000 in the Fund since inception with the performance of the Fund’s benchmark index. Results include the reinvestment of all dividends and capital gains distributions. Past performance does not guarantee future results. The graph does not reflect the deduction of taxes that a shareholder would pay on Fund distributions or the redemption of Fund shares.
6 | May 31, 2022
RiverFront Strategic Income Fund
| Performance Overview | May 31, 2022 (Unaudited) |
Investment Objective
The RiverFront Strategic Income Fund (the “Fund” or "RIGS") seeks total return, with an emphasis on income as the source of that total return. The Fund seeks to achieve its investment objective by investing in a global portfolio of fixed income securities of various maturities, ratings and currency denominations. The Fund utilizes various investment strategies in a broad array of fixed income sectors.
Performance (as of May 31, 2022)
| 6 Months | 1 Year | 5 Year | Since Inception^ | |
| RiverFront Strategic Income Fund – NAV | -3.74% | -3.48% | 1.95% | 3.16% |
| RiverFront Strategic Income Fund – Market Price* | -3.66% | -3.44% | 1.90% | 3.16% |
| Bloomberg U.S. Aggregate Bond Total Return Index | -9.15% | -8.22% | 1.18% | 1.99% |
Total Expense Ratio (per the current prospectus) is 0.46%. The Fund’s management fees consist of a fee of 0.11% paid to the Fund’s investment adviser and a fee of 0.35% paid to the Fund’s sub-adviser. Performance data quoted represents past performance. Past performance does not guarantee future results. Total return figures assume reinvestment of dividends and capital gains distributions, if any. The table does not reflect the deduction of taxes that a shareholder would pay on Fund distributions or the redemption of Fund shares. Investment return and principal value of an investment will fluctuate so that an investor’s shares, when sold or redeemed, may be worth more or less than the original cost. Current performance data may be higher or lower than actual data quoted. For most current month-end performance data please visit www.alpsfunds.com or call 1.866.759.5679.
NAV is an exchange-traded fund’s per-share value. The per-share dollar amount of the Fund is derived by dividing the total value of all the securities in its portfolio, less any liabilities, by the number of Fund shares outstanding. Market Price is the price at which a share can currently be traded in the market. Information detailing the number of days the Market Price of the Fund was greater than the Fund’s NAV and the number of days it was less than the Fund’s NAV can be obtained at www.alpsfunds.com.
| ^ | The Fund commenced Investment Operations on October 8, 2013. |
| * | Market Price means the official closing price of a share or, if it more accurately reflects the market value of a share at the time as of which the Fund calculates current net asset value per share, the price that is the midpoint of the bid-ask spread as of that time. It does not represent the returns an investor would receive if shares were traded at other times. |
Duration is a measure of the sensitivity of the price (the value of principal) of a fixed-income investment to a change in interest rates. Duration is expressed as a number of years. The duration number is a calculation involving present value, yield, coupon, final maturity and call features. The bigger the duration number, the greater the interest-rate risk or reward for bond prices. Rising interest rates mean falling bond prices, while declining interest rates mean rising bond prices.
Bloomberg U.S. Aggregate Bond Total Return Index is a broad-based benchmark that measures the investment grade, U.S. dollar-denominated, fixed-rate taxable bond market, including Treasuries, government-related and corporate securities, MBS (agency fixed-rate and hybrid ARM pass-throughs), ABS, and CMBS (agency and non-agency). The index is reported on a total return basis, which assumes reinvestment of any dividends and distributions realized during a given time period. The index is not actively managed and does not reflect any deductions for fees, expenses or taxes. One cannot invest directly in an index. Index performance does not reflect fund performance.
The RiverFront Strategic Income Fund is not suitable for all investors. Investments in the Fund are subject to investment risks, including possible loss of the principal amount invested.
The Fund's shares are not individually redeemable. Investors buy and sell shares of the fund on a secondary market. Only market makers or "authorized participants" may trade directly with the Fund, typically in blocks of 25,000 shares.
ALPS Portfolio Solutions Distributor, Inc., a FINRA member, is the distributor for the RiverFront Strategic Income Fund.
7 | May 31, 2022
RiverFront Strategic Income Fund
| Performance Overview | May 31, 2022 (Unaudited) |
Top 10 Holdings*^ (as of May 31, 2022)
| U.S. Treasury Note | 3.72 | % | ||
| T-Mobile USA, Inc. | 1.32 | % | ||
| DR Horton, Inc. | 1.24 | % | ||
| Vistra Operations Co. LLC | 1.20 | % | ||
| PulteGroup, Inc. | 1.20 | % | ||
| Goldman Sachs Group, Inc. | 1.19 | % | ||
| Bank of America Corp. | 1.19 | % | ||
| JPMorgan Chase & Co. | 1.18 | % | ||
| Citigroup, Inc. | 1.18 | % | ||
| WESCO Distribution, Inc. | 1.11 | % | ||
| Total % of Top 10 Holdings | 14.53 | % |
| * | % of Total Investments. |
| ^ | Excludes Money Market |
Fund Future holdings are subject to change.
Asset Allocation* (as of May 31, 2022)

Growth of $10,000 (as of May 31, 2022)
Comparison of Change in Value of $10,000 Investment in the Fund and the Fund’s benchmark
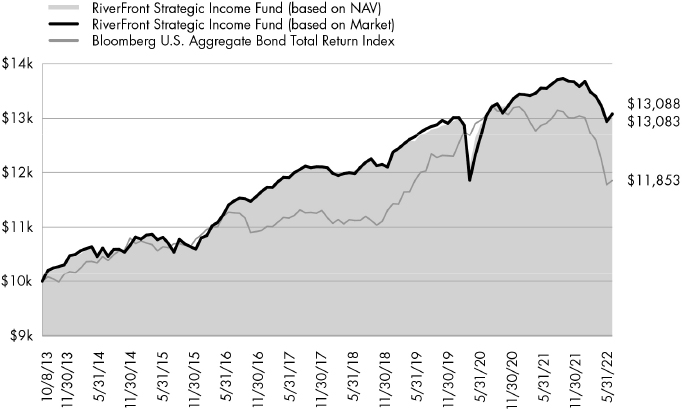
The chart above compares historical performance of a hypothetical investment of $10,000 in the Fund since inception with the performance of the Fund’s benchmark index. Results include the reinvestment of all dividends and capital gains distributions. Past performance does not guarantee future results. The graph does not reflect the deduction of taxes that a shareholder would pay on Fund distributions or the redemption of Fund shares.
8 | May 31, 2022
RiverFront ETFs
| Disclosure of Fund Expenses | May 31, 2022 (Unaudited) |
Shareholder Expense Example: As a shareholder of a Fund, you incur certain ongoing costs, including management fees and other Fund expenses. These examples are intended to help you understand your ongoing costs (in dollars) of investing in a Fund and to compare these costs with the ongoing costs of investing in other funds. It is based on an investment of $1,000 invested at the beginning of the six month period and held through May 31, 2022.
Actual Return: The first line of the table provides information about actual account values and actual expenses. You may use the information in this line, together with the amount you invested, to estimate the expenses that you incurred over the period. Simply divide your account value by $1,000 (for example, an $8,600 account value divided by $1,000 = 8.6), then multiply the result by the number in the first line under the heading entitled “Expenses Paid During Period” to estimate the expenses attributable to your investment during this period.
Hypothetical 5% Return: The second line of the table provides information about hypothetical account values and hypothetical expenses based on the Fund’s actual expense ratio and an assumed rate of return of 5% per year before expenses, which is not the Fund’s actual return. The hypothetical account values and expenses may not be used to estimate the actual ending account balance or expenses you paid for the period. You may use this information to compare ongoing costs of investing in the Fund and other funds. To do so, compare this 5% hypothetical example with the 5% hypothetical examples that appear in the shareholder reports of other funds.
The expenses shown in the table are meant to highlight ongoing Fund costs only and do not reflect any transaction costs, such as brokerage commissions and other fees to financial intermediaries. Therefore, the second line is useful in comparing ongoing costs only, and will not help you determine the relative total costs of owning different funds. In addition, if these costs were included, your costs would have been higher.
| Beginning Account Value 12/1/21 | Ending Account Value 5/31/22 | Expense Ratio(a) | Expenses Paid During Period 12/1/21 - 5/31/22(b) | |||||||||||||
| RiverFront Dynamic Core Income ETF | ||||||||||||||||
| Actual | $ | 1,000.00 | $ | 930.90 | 0.51 | % | $ | 2.46 | ||||||||
| Hypothetical (5% return before expenses) | $ | 1,000.00 | $ | 1,022.39 | 0.51 | % | $ | 2.57 | ||||||||
| RiverFront Dynamic US Dividend Advantage ETF | ||||||||||||||||
| Actual | $ | 1,000.00 | $ | 1,063.90 | 0.52 | % | $ | 2.68 | ||||||||
| Hypothetical (5% return before expenses) | $ | 1,000.00 | $ | 1,022.34 | 0.52 | % | $ | 2.62 | ||||||||
| RiverFront Dynamic US Flex-Cap ETF | ||||||||||||||||
| Actual | $ | 1,000.00 | $ | 952.70 | 0.52 | % | $ | 2.53 | ||||||||
| Hypothetical (5% return before expenses) | $ | 1,000.00 | $ | 1,022.34 | 0.52 | % | $ | 2.62 | ||||||||
| RiverFront Strategic Income Fund | ||||||||||||||||
| Actual | $ | 1,000.00 | $ | 962.60 | 0.46 | % | $ | 2.25 | ||||||||
| Hypothetical (5% return before expenses) | $ | 1,000.00 | $ | 1,022.64 | 0.46 | % | $ | 2.32 | ||||||||
| (a) | Annualized, based on the Fund's most recent fiscal half year expenses. |
| (b) | Expenses are equal to the Fund's annualized expense ratio multiplied by the average account value over the period, multiplied by the number of days in the most recent fiscal half year (182), divided by 365. |
9 | May 31, 2022
RiverFront Dynamic Core Income ETF
| Schedule of Investments | May 31, 2022 (Unaudited) |
| Security Description | Principal Amount | Value | ||||||
| CORPORATE BONDS (67.69%) | ||||||||
| Communications (8.33%) | ||||||||
| AT&T, Inc. | ||||||||
| 2.55%, 12/01/2033 | $ | 1,449,000 | $ | 1,234,870 | ||||
| Charter Communications | ||||||||
| Operating LLC / Charter Communications Operating Capital | ||||||||
| 4.91%, 07/23/2025 | 789,000 | 806,660 | ||||||
| Comcast Corp. | ||||||||
| 4.15%, 10/15/2028 | 783,000 | 802,683 | ||||||
| Discovery Communications LLC | ||||||||
| 3.95%, 03/20/2028 | 1,466,000 | 1,415,624 | ||||||
| Sirius XM Radio, Inc. | ||||||||
| 3.13%, 09/01/2026(a) | 894,000 | 845,192 | ||||||
| Verizon Communications, Inc. | ||||||||
| 2.36%, 03/15/2032(a) | 725,000 | 622,267 | ||||||
| Walt Disney Co. | ||||||||
| 2.00%, 09/01/2029 | 894,000 | 789,839 | ||||||
| Total Communications | 6,517,135 | |||||||
| Consumer Discretionary (5.09%) | ||||||||
| Alibaba Group Holding, Ltd. | ||||||||
| 3.60%, 11/28/2024 | 173,000 | 172,942 | ||||||
| 3.40%, 12/06/2027 | 147,000 | 141,870 | ||||||
| Amazon.com, Inc. | ||||||||
| 3.15%, 08/22/2027 | 299,000 | 296,255 | ||||||
| CoreCivic, Inc. | ||||||||
| 4.63%, 05/01/2023 | 155,000 | 155,071 | ||||||
| Ford Motor Co. | ||||||||
| 9.63%, 04/22/2030 | 1,129,000 | 1,372,225 | ||||||
| General Motors Financial Co., Inc. | ||||||||
| 3.70%, 05/09/2023 | 250,000 | 251,355 | ||||||
| 3.60%, 06/21/2030 | 778,000 | 699,372 | ||||||
| Goodyear Tire & Rubber Co. | ||||||||
| 4.88%, 03/15/2027 | 789,000 | 758,860 | ||||||
| Marriott International, Inc. | ||||||||
| 4.00%, 04/15/2028(b) | 135,000 | 131,398 | ||||||
| Total Consumer Discretionary | 3,979,348 | |||||||
| Consumer Staples (3.13%) | ||||||||
| Anheuser-Busch InBev | ||||||||
| Worldwide, Inc. | ||||||||
| 4.00%, 04/13/2028 | 908,000 | 916,955 | ||||||
| Dollar Tree, Inc. | ||||||||
| 4.00%, 05/15/2025 | 1,520,000 | 1,534,003 | ||||||
| Total Consumer Staples | 2,450,958 | |||||||
| Energy (8.45%) | ||||||||
| Chevron Corp. | ||||||||
| 2.90%, 03/03/2024 | 250,000 | 250,972 | ||||||
| Continental Resources, Inc. | ||||||||
| 3.80%, 06/01/2024 | 147,000 | 148,072 | ||||||
| Enterprise Products Operating LLC | ||||||||
| 3.35%, 03/15/2023 | 250,000 | 251,033 | ||||||
| Energy (continued) | ||||||||
| Exxon Mobil Corp. | ||||||||
| 3.04%, 03/01/2026 | 345,000 | 343,489 | ||||||
| Hess Midstream Operations LP | ||||||||
| 4.25%, 02/15/2030(a) | 789,000 | 725,174 | ||||||
| Kinder Morgan Energy Partners LP | ||||||||
| 4.25%, 09/01/2024 | 147,000 | 148,929 | ||||||
| Marathon Oil Corp. | ||||||||
| 4.40%, 07/15/2027 | 1,516,000 | 1,525,234 | ||||||
| ONEOK Partners LP | ||||||||
| 3.38%, 10/01/2022 | 250,000 | 250,211 | ||||||
| Ovintiv Exploration, Inc. | ||||||||
| 5.63%, 07/01/2024 | 147,000 | 154,743 | ||||||
| Sabine Pass Liquefaction LLC | ||||||||
| 5.75%, 05/15/2024 | 1,466,000 | 1,515,430 | ||||||
| Schlumberger Investment SA | ||||||||
| 3.65%, 12/01/2023 | 405,000 | 410,918 | ||||||
| Shell International Finance BV | ||||||||
| 2.75%, 04/06/2030 | 789,000 | 731,852 | ||||||
| Williams Cos., Inc. | ||||||||
| 3.90%, 01/15/2025 | 156,000 | 156,386 | ||||||
| Total Energy | 6,612,443 | |||||||
| Financials (27.06%) | ||||||||
| Aflac, Inc. | ||||||||
| 3.63%, 11/15/2024 | 173,000 | 175,468 | ||||||
| Bank of America Corp. | ||||||||
| 4.25%, 10/22/2026 | 1,197,000 | 1,211,352 | ||||||
| Berkshire Hathaway, Inc. | ||||||||
| 3.13%, 03/15/2026 | 250,000 | 249,886 | ||||||
| Blackstone Private Credit Fund | ||||||||
| 3.25%, 03/15/2027(a) | 847,000 | 749,599 | ||||||
| Chubb INA Holdings, Inc. | ||||||||
| 3.35%, 05/03/2026 | 239,000 | 238,120 | ||||||
| Citigroup, Inc. | ||||||||
| 3M US L + 1.43%, | ||||||||
| 09/01/2023(c) | 250,000 | 250,320 | ||||||
| 4.45%, 09/29/2027 | 1,502,000 | 1,508,815 | ||||||
| 6.63%, 06/15/2032 | 503,000 | 573,044 | ||||||
| Credit Suisse Group AG | ||||||||
| 4.55%, 04/17/2026 | 222,000 | 222,069 | ||||||
| CubeSmart LP | ||||||||
| 2.25%, 12/15/2028 | 1,643,000 | 1,446,109 | ||||||
| Discover Bank | ||||||||
| 4.65%, 09/13/2028 | 135,000 | 134,450 | ||||||
| FS KKR Capital Corp. | ||||||||
| 4.25%, 02/14/2025(a) | 1,567,000 | 1,507,363 | ||||||
| Goldman Sachs Group, Inc. | ||||||||
| 3M US L + 0.75%, | ||||||||
| 02/23/2023(c) | 405,000 | 404,365 | ||||||
| 3M US L + 1.60%, | ||||||||
| 11/29/2023(c) | 250,000 | 252,428 | ||||||
| 5.95%, 01/15/2027 | 678,000 | 726,797 | ||||||
| Host Hotels & Resorts LP | ||||||||
| 4.00%, 06/15/2025 | 1,078,000 | 1,068,184 | ||||||
See Notes to Financial Statements.
10 | May 31, 2022
RiverFront Dynamic Core Income ETF
| Schedule of Investments | May 31, 2022 (Unaudited) |
| Security Description | Principal Amount | Value | ||||||
| Financials (continued) | ||||||||
| HSBC Holdings PLC | ||||||||
| 4.30%, 03/08/2026 | $ | 135,000 | $ | 136,516 | ||||
| 3.90%, 05/25/2026 | 173,000 | 171,151 | ||||||
| 4.38%, 11/23/2026 | 1,502,000 | 1,507,519 | ||||||
| Iron Mountain, Inc. | ||||||||
| 4.88%, 09/15/2027(a) | 1,602,000 | 1,580,653 | ||||||
| JPMorgan Chase & Co. | ||||||||
| 3M US L + 1.23%, | ||||||||
| 10/24/2023(c) | 559,000 | 560,394 | ||||||
| 4.25%, 10/01/2027 | 939,000 | 944,899 | ||||||
| Lincoln National Corp. | ||||||||
| 3.35%, 03/09/2025 | 173,000 | 172,059 | ||||||
| M&T Bank Corp. | ||||||||
| 3M US L + 0.68%, | ||||||||
| 07/26/2023(c) | 250,000 | 250,435 | ||||||
| MetLife, Inc. | ||||||||
| 3.60%, 04/10/2024 | 241,000 | 244,049 | ||||||
| Mitsubishi UFJ Financial Group, | ||||||||
| Inc. | ||||||||
| 3.85%, 03/01/2026 | 173,000 | 172,430 | ||||||
| Mizuho Financial Group, Inc. | ||||||||
| 3M US L + 1.00%, | ||||||||
| 09/11/2024(c) | 496,000 | 498,678 | ||||||
| Morgan Stanley | ||||||||
| 3M US L + 1.40%, | ||||||||
| 10/24/2023(c) | 496,000 | 497,451 | ||||||
| 5.00%, 11/24/2025 | 291,000 | 301,587 | ||||||
| 3.63%, 01/20/2027 | 384,000 | 380,361 | ||||||
| NatWest Markets PLC | ||||||||
| 3.48%, 03/22/2025(a) | 920,000 | 913,497 | ||||||
| PNC Financial Services Group, Inc. | ||||||||
| 3.15%, 05/19/2027 | 173,000 | 168,909 | ||||||
| 3.45%, 04/23/2029 | 778,000 | 748,899 | ||||||
| Truist Bank | ||||||||
| 3.30%, 05/15/2026 | 173,000 | 170,285 | ||||||
| Wells Fargo & Co. | ||||||||
| 3.00%, 04/22/2026 | 1,075,000 | 1,043,536 | ||||||
| Total Financials | 21,181,677 | |||||||
| Health Care (5.96%) | ||||||||
| AbbVie, Inc. | ||||||||
| 3.20%, 11/21/2029 | 789,000 | 743,174 | ||||||
| Bausch Health Cos., Inc. | ||||||||
| 6.13%, 02/01/2027(a) | 1,615,000 | 1,476,110 | ||||||
| Cigna Corp. | ||||||||
| 3.00%, 07/15/2023 | 240,000 | 240,577 | ||||||
| CVS Health Corp. | ||||||||
| 4.30%, 03/25/2028 | 289,000 | 293,121 | ||||||
| HCA, Inc. | ||||||||
| 5.38%, 09/01/2026 | 789,000 | 822,556 | ||||||
| Johnson & Johnson | ||||||||
| 2.45%, 03/01/2026 | 250,000 | 245,705 | ||||||
| Merck & Co., Inc. | ||||||||
| 2.80%, 05/18/2023 | 481,000 | 483,049 | ||||||
| Pfizer, Inc. | ||||||||
| 3.20%, 09/15/2023 | 184,000 | 185,791 | ||||||
| Health Care (continued) | ||||||||
| UnitedHealth Group, Inc. | ||||||||
| 3.75%, 07/15/2025 | 173,000 | 176,293 | ||||||
| Total Health Care | 4,666,376 | |||||||
| Industrials (2.86%) | ||||||||
| 3M Co. | ||||||||
| 3.25%, 02/14/2024 | 405,000 | 408,886 | ||||||
| Boeing Co. | ||||||||
| 4.88%, 05/01/2025 | 1,500,000 | 1,516,685 | ||||||
| CNH Industrial NV | ||||||||
| 4.50%, 08/15/2023 | 173,000 | 175,518 | ||||||
| Textron, Inc. | ||||||||
| 3.65%, 03/15/2027 | 135,000 | 133,212 | ||||||
| Total Industrials | 2,234,301 | |||||||
| Materials (3.32%) | ||||||||
| Ball Corp. | ||||||||
| 4.00%, 11/15/2023 | 1,527,000 | 1,532,726 | ||||||
| DuPont de Nemours, Inc. | ||||||||
| 4.73%, 11/15/2028 | 789,000 | 818,685 | ||||||
| Glencore Funding LLC | ||||||||
| 3.00%, 10/27/2022(a) | 250,000 | 249,914 | ||||||
| Total Materials | 2,601,325 | |||||||
| Technology (3.00%) | ||||||||
| Apple, Inc. | ||||||||
| 3.20%, 05/11/2027 | 789,000 | 789,908 | ||||||
| Flex, Ltd. | ||||||||
| 5.00%, 02/15/2023 | 173,000 | 175,147 | ||||||
| Microsoft Corp. | ||||||||
| 3.30%, 02/06/2027 | 671,000 | 679,970 | ||||||
| Oracle Corp. | ||||||||
| 3.25%, 11/15/2027 | 754,000 | 706,231 | ||||||
| Total Technology | 2,351,256 | |||||||
| Utilities (0.49%) | ||||||||
| Dominion Energy, Inc. | ||||||||
| 4.25%, 06/01/2028 | 135,000 | 136,152 | ||||||
| Southern Co. | ||||||||
| 2.95%, 07/01/2023 | 250,000 | 250,457 | ||||||
| Total Utilities | 386,609 | |||||||
| TOTAL CORPORATE BONDS | ||||||||
| (Cost $57,049,024) | 52,981,428 | |||||||
| GOVERNMENT BONDS (11.74%) | ||||||||
| United States Treasury Bond | ||||||||
| 2.75%, 02/15/2028 | 4,917,000 | 4,888,764 | ||||||
| United States Treasury Inflation | ||||||||
| Indexed Bonds | ||||||||
| 2.13%, 02/15/2040(d) | 273,634 | 343,030 | ||||||
See Notes to Financial Statements.
11 | May 31, 2022
RiverFront Dynamic Core Income ETF
| Schedule of Investments | May 31, 2022 (Unaudited) |
| Security Description | Principal Amount | Value | ||||||
| Government Bonds (continued) | ||||||||
| United States Treasury Note | ||||||||
| 2.88%, 10/31/2023 | $ | 1,470,000 | $ | 1,482,203 | ||||
| 3.00%, 10/31/2025 | 2,454,000 | 2,472,789 | ||||||
| TOTAL GOVERNMENT BONDS | ||||||||
| (Cost $9,447,357) | 9,186,786 | |||||||
| 7 Day Yield | Shares | Value | ||||||||||
| SHORT TERM INVESTMENTS (19.98%) | ||||||||||||
| Money Market Fund | ||||||||||||
| State Street Institutional | ||||||||||||
| Treasury Plus Money | ||||||||||||
| Market Fund | 0.75 | % | 15,637,713 | 15,637,713 | ||||||||
| TOTAL SHORT TERM INVESTMENTS | ||||||||||||
| (Cost $15,637,713) | 15,637,713 | |||||||||||
| TOTAL INVESTMENTS (99.41%) | ||||||||||||
| (Cost $82,134,094) | $ | 77,805,927 | ||||||||||
| OTHER ASSETS IN EXCESS OF LIABILITIES (0.59%) | 463,549 | |||||||||||
| NET ASSETS - 100.00% | $ | 78,269,476 | ||||||||||
Investment Abbreviations:
LIBOR - London Interbank Offered Rate
Reference Rates:
3M US L - 3 Month LIBOR as of May 31, 2022 was 0.97%
| (a) | Securities exempt from registration under Rule 144A of the Securities Act of 1933. These securities may be sold in the ordinary course of business in transactions exempt from registration, normally to qualified institutional buyers. At period end, the aggregate market value of those securities was $8,669,769, representing 11.08% of net assets. |
| (b) | Securities were purchased pursuant to Regulation S under the Securities Act of 1933, which exempts securities offered and sold outside of the United States from registration. Such securities cannot be sold in the United States without either an effective registration statement filed pursuant to the Securities Act of 1933, or pursuant to an exemption from registration. As of May 31, 2022, the market value of those securities was $131,398 representing 0.17% of net assets. |
| (c) | Floating or variable rate security. The reference rate is described above. The rate in effect as of May 31, 2022 is based on the reference rate plus the displayed spread as of the security's last reset date. |
| (d) | Principal amount of security is adjusted for inflation. |
See Notes to Financial Statements.
12 | May 31, 2022
RiverFront Dynamic US Dividend Advantage ETF
| Schedule of Investments | May 31, 2022 (Unaudited) |
| Security Description | Shares | Value | ||||||
| COMMON STOCKS (99.62%) | ||||||||
| Communication Services (2.92%) | ||||||||
| AT&T, Inc. | 46,648 | $ | 993,136 | |||||
| Meta Platforms, Inc., Class A(a) | 1,460 | 282,714 | ||||||
| Sirius XM Holdings, Inc.(b) | 129,684 | 829,978 | ||||||
| Verizon Communications, Inc. | 23,232 | 1,191,569 | ||||||
| Total Communication Services | 3,297,397 | |||||||
| Consumer Staples (10.69%) | ||||||||
| Altria Group, Inc. | 72,755 | 3,935,318 | �� | |||||
| Coca-Cola Co. | 60,543 | 3,837,215 | ||||||
| Colgate-Palmolive Co. | 18,037 | 1,421,496 | ||||||
| Mondelez International, Inc., Class A | 26,247 | 1,668,259 | ||||||
| Philip Morris International, Inc. | 4,395 | 466,969 | ||||||
| Vector Group, Ltd. | 61,392 | 755,736 | ||||||
| Total Consumer Staples | 12,084,993 | |||||||
| Energy (6.48%) | ||||||||
| Exxon Mobil Corp. | 60,118 | 5,771,328 | ||||||
| Kinder Morgan, Inc. | 78,923 | 1,553,994 | ||||||
| Total Energy | 7,325,322 | |||||||
| Financials (22.17%) | ||||||||
| AllianceBernstein Holding LP | 33,562 | 1,427,727 | ||||||
| Annaly Capital Management, Inc. | 133,648 | 883,413 | ||||||
| Artisan Partners Asset Management, Inc., Class A | 16,523 | 634,648 | ||||||
| Bank of America Corp. | 32,504 | 1,209,149 | ||||||
| Central Pacific Financial Corp. | 87,401 | 2,109,860 | ||||||
| Dynex Capital, Inc.(b) | 39,365 | 641,650 | ||||||
| Ellington Financial, Inc.(b) | 63,932 | 990,307 | ||||||
| FNB Corp. | 55,275 | 671,591 | ||||||
| Franklin BSP Realty Trust, Inc. | 105,374 | 1,631,190 | ||||||
| Fulton Financial Corp. | 52,417 | 830,809 | ||||||
| Mercury General Corp. | 10,000 | 489,500 | ||||||
| Navient Corp. | 34,532 | 552,512 | ||||||
| New Residential Investment Corp. | 153,593 | 1,735,601 | ||||||
| OneMain Holdings, Inc. | 20,948 | 922,969 | ||||||
| PennyMac Mortgage Investment Trust | 60,232 | 974,554 | ||||||
| Ready Capital Corp. | 68,617 | 1,007,298 | ||||||
| Starwood Property Trust, Inc. | 28,387 | 678,165 | ||||||
| Truist Financial Corp. | 53,904 | 2,681,185 | ||||||
| Trustmark Corp. | 21,309 | 619,879 | ||||||
| US Bancorp | 52,310 | 2,776,092 | ||||||
| UWM Holdings Corp.(b) | 395,428 | 1,601,483 | ||||||
| Total Financials | 25,069,582 | |||||||
| Health Care (13.11%) | ||||||||
| AbbVie, Inc. | 32,841 | 4,839,778 | ||||||
| Bristol-Myers Squibb Co. | 53,414 | 4,030,086 | ||||||
| Merck & Co., Inc. | 42,251 | 3,888,360 | ||||||
| Health Care (continued) | ||||||||
| Pfizer, Inc. | 38,930 | 2,064,847 | ||||||
| Total Health Care | 14,823,071 | |||||||
| Industrials (7.63%) | ||||||||
| 3M Co. | 11,424 | 1,705,489 | ||||||
| Fastenal Co. | 29,423 | 1,575,896 | ||||||
| MDU Resources Group, Inc. | 93,470 | 2,559,209 | ||||||
| Northrop Grumman Corp. | 2,788 | 1,304,700 | ||||||
| United Parcel Service, Inc., Class B | 8,140 | 1,483,515 | ||||||
| Total Industrials | 8,628,809 | |||||||
| Information Technology (21.26%) | ||||||||
| Apple, Inc. | 7,851 | 1,168,543 | ||||||
| Broadcom, Inc. | 4,295 | 2,491,658 | ||||||
| Cisco Systems, Inc. | 60,777 | 2,738,004 | ||||||
| Hewlett Packard Enterprise Co. | 191,951 | 2,994,436 | ||||||
| Intel Corp. | 66,909 | 2,972,098 | ||||||
| International Business Machines Corp. | 27,429 | 3,808,242 | ||||||
| Microsoft Corp. | 12,212 | 3,320,076 | ||||||
| National Instruments Corp. | 13,106 | 462,904 | ||||||
| Paychex, Inc. | 3,102 | 384,121 | ||||||
| Texas Instruments, Inc. | 16,679 | 2,948,180 | ||||||
| Western Union Co. | 41,458 | 752,048 | ||||||
| Total Information Technology | 24,040,310 | |||||||
| Materials (1.26%) | ||||||||
| Newmont Mining Corp. | 20,988 | 1,424,036 | ||||||
| Real Estate (6.13%) | ||||||||
| American Assets Trust, Inc. | 20,225 | 689,673 | ||||||
| Brandywine Realty Trust | 44,047 | 491,124 | ||||||
| Douglas Elliman, Inc. | 31,558 | 181,459 | ||||||
| Douglas Emmett, Inc. | 12,882 | 364,174 | ||||||
| Iron Mountain, Inc. | 27,747 | 1,495,563 | ||||||
| LXP Industrial Trust | 34,104 | 394,242 | ||||||
| National Health Investors, Inc. | 7,445 | 440,372 | ||||||
| Omega Healthcare Investors, Inc. | 13,449 | 400,377 | ||||||
| Paramount Group, Inc. | 67,425 | 610,871 | ||||||
| Piedmont Office Realty Trust, Inc., Class A | 58,314 | 859,548 | ||||||
| Sabra Health Care REIT, Inc. | 30,606 | 429,708 | ||||||
| SITE Centers Corp. | 36,171 | 568,608 | ||||||
| Total Real Estate | 6,925,719 | |||||||
| Utilities (7.97%) | ||||||||
| Clearway Energy, Inc., Class C | 20,310 | 711,865 | ||||||
| Duke Energy Corp. | 28,973 | 3,260,042 | ||||||
| Entergy Corp. | 6,445 | 775,462 | ||||||
| PPL Corp. | 26,442 | 798,020 | ||||||
See Notes to Financial Statements.
13 | May 31, 2022
RiverFront Dynamic US Dividend Advantage ETF
| Schedule of Investments | May 31, 2022 (Unaudited) |
| Security Description | Shares | Value | ||||||
| Utilities (continued) | ||||||||
| Southwest Gas Holdings, Inc. | 37,183 | $ | 3,462,853 | |||||
| Total Utilities | 9,008,242 | |||||||
| TOTAL COMMON STOCKS | ||||||||
| (Cost $98,892,724) | 112,627,481 | |||||||
| 7 Day Yield | Shares | Value | ||||||||||
| SHORT TERM INVESTMENTS (1.27%) | ||||||||||||
| Money Market Fund (0.13%) | ||||||||||||
| State Street Institutional Treasury Plus Money Market Fund | ||||||||||||
| (Cost $149,922) | 0.75 | % | 149,922 | 149,922 | ||||||||
| Investments Purchased with Collateral from Securities Loaned (1.14%) | ||||||||||||
| State Street Navigator Securities Lending Government Money Market Portfolio, 0.80% | ||||||||||||
| (Cost $1,291,293) | 1,291,293 | 1,291,293 | ||||||||||
| TOTAL SHORT TERM INVESTMENTS | ||||||||||||
| (Cost $1,441,215) | 1,441,215 | |||||||||||
| TOTAL INVESTMENTS (100.89%) | ||||||||||||
| (Cost $100,333,939) | $ | 114,068,696 | ||||||||||
| LIABILITIES IN EXCESS OF OTHER ASSETS (-0.89%) | (1,011,388 | ) | ||||||||||
| NET ASSETS - 100.00% | $ | 113,057,308 | ||||||||||
| (a) | Non-income producing security. |
| (b) | Security, or a portion of the security position is currently on loan. The total market value of securities on loan is $2,014,357. |
See Notes to Financial Statements.
14 | May 31, 2022
RiverFront Dynamic US Flex-Cap ETF
| Schedule of Investments | May 31, 2022 (Unaudited) |
| Security Description | Shares | Value | ||||||
| COMMON STOCKS (99.82%) | ||||||||
| Communication Services (5.95%) | ||||||||
| Alphabet, Inc., Class A(a) | 227 | $ | 516,479 | |||||
| Alphabet, Inc., Class C(a) | 108 | 246,324 | ||||||
| Comcast Corp., Class A | 5,579 | 247,038 | ||||||
| EverQuote, Inc.(a) | 15,168 | 135,754 | ||||||
| Interpublic Group of Cos., Inc. | 6,482 | 208,915 | ||||||
| Magnite, Inc.(a) | 4,746 | 52,158 | ||||||
| Meta Platforms, Inc., Class A(a) | 2,067 | 400,254 | ||||||
| New York Times Co., Class A | 3,251 | 112,127 | ||||||
| Sirius XM Holdings, Inc.(b) | 34,162 | 218,637 | ||||||
| Total Communication Services | 2,137,686 | |||||||
| Consumer Discretionary (6.30%) | ||||||||
| Adtalem Global Education, Inc.(a) | 4,238 | 138,243 | ||||||
| Amazon.com, Inc.(a) | 441 | 1,060,248 | ||||||
| Choice Hotels International, Inc. | 804 | 102,824 | ||||||
| Clarus Corp. | 5,011 | 109,791 | ||||||
| Home Depot, Inc. | 1,299 | 393,272 | ||||||
| NIKE, Inc., Class B | 2,272 | 270,027 | ||||||
| Tapestry, Inc. | 5,464 | 188,508 | ||||||
| Total Consumer Discretionary | 2,262,913 | |||||||
| Consumer Staples (6.55%) | ||||||||
| Archer-Daniels-Midland Co. | 3,679 | 334,127 | ||||||
| Coca-Cola Co. | 7,684 | 487,012 | ||||||
| Colgate-Palmolive Co. | 3,353 | 264,250 | ||||||
| Mondelez International, Inc., Class A | 5,183 | 329,431 | ||||||
| Procter & Gamble Co. | 2,429 | 359,200 | ||||||
| SpartanNash Co. | 5,415 | 186,330 | ||||||
| Sprouts Farmers Market, Inc.(a) | 6,008 | 162,757 | ||||||
| Walgreens Boots Alliance, Inc. | 5,253 | 230,239 | ||||||
| Total Consumer Staples | 2,353,346 | |||||||
| Energy (7.32%) | ||||||||
| Aemetis, Inc.(a)(b) | 22,714 | 184,211 | ||||||
| Archrock, Inc. | 18,398 | 184,532 | ||||||
| Coterra Energy, Inc. | 8,852 | 303,889 | ||||||
| Exxon Mobil Corp. | 6,529 | 626,784 | ||||||
| Marathon Oil Corp. | 14,041 | 441,309 | ||||||
| New Fortress Energy, Inc. | 7,226 | 336,659 | ||||||
| Transocean, Ltd.(a) | 57,474 | 236,793 | ||||||
| Williams Cos., Inc. | 8,469 | 313,861 | ||||||
| Total Energy | 2,628,038 | |||||||
| Financials (10.94%) | ||||||||
| Arbor Realty Trust, Inc. | 7,482 | 122,854 | ||||||
| Bank of America Corp. | 8,398 | 312,406 | ||||||
| Berkshire Hathaway, Inc., Class B(a) | 1,877 | 593,094 | ||||||
| Central Pacific Financial Corp. | 4,977 | 120,145 | ||||||
| Cincinnati Financial Corp. | 1,934 | 247,281 | ||||||
| First Commonwealth Financial Corp. | 9,103 | 127,533 | ||||||
| Financials (continued) | ||||||||
| Hope Bancorp, Inc. | 9,681 | 141,149 | ||||||
| JPMorgan Chase & Co. | 3,664 | 484,491 | ||||||
| Kearny Financial Corp. | 10,414 | 129,238 | ||||||
| KeyCorp | 10,221 | 204,011 | ||||||
| Markel Corp.(a) | 204 | 279,364 | ||||||
| OceanFirst Financial Corp. | 7,110 | 143,409 | ||||||
| Provident Financial Services, Inc. | 5,803 | 133,411 | ||||||
| Regions Financial Corp. | 10,043 | 221,850 | ||||||
| Travelers Cos., Inc. | 1,588 | 284,316 | ||||||
| US Bancorp | 4,820 | 255,797 | ||||||
| Willis Towers Watson PLC | 34 | 7,176 | ||||||
| WSFS Financial Corp. | 2,835 | 121,281 | ||||||
| Total Financials | 3,928,806 | |||||||
| Health Care (15.88%) | ||||||||
| Abbott Laboratories | 2,980 | 350,031 | ||||||
| AbbVie, Inc. | 3,395 | 500,321 | ||||||
| Cigna Corp. | 903 | 242,266 | ||||||
| CVS Health Corp. | 3,299 | 319,178 | ||||||
| Exelixis, Inc.(a) | 9,576 | 175,528 | ||||||
| Johnson & Johnson | 3,268 | 586,704 | ||||||
| Merck & Co., Inc. | 4,518 | 415,792 | ||||||
| Multiplan Corp.(a) | 48,812 | 244,060 | ||||||
| NeoGenomics, Inc.(a) | 4,393 | 36,989 | ||||||
| Pacific Biosciences of California, Inc.(a)(b) | 6,390 | 35,976 | ||||||
| Pfizer, Inc. | 10,637 | 564,187 | ||||||
| Quest Diagnostics, Inc. | 1,421 | 200,389 | ||||||
| Regeneron Pharmaceuticals, Inc.(a) | 306 | 203,410 | ||||||
| Signify Health, Inc.(a) | 14,534 | 198,098 | ||||||
| TransMedics Group, Inc.(a) | 10,472 | 305,468 | ||||||
| UnitedHealth Group, Inc. | 1,338 | 664,692 | ||||||
| Vertex Pharmaceuticals, Inc.(a) | 937 | 251,725 | ||||||
| Zoetis, Inc. | 1,733 | 296,222 | ||||||
| Zynex, Inc.(b) | 15,854 | 115,576 | ||||||
| Total Health Care | 5,706,612 | |||||||
| Industrials (8.72%) | ||||||||
| ACCO Brands Corp. | 17,090 | 128,859 | ||||||
| Air Transport Services Group, Inc.(a) | 5,260 | 158,957 | ||||||
| Boise Cascade Co. | 3,028 | 234,125 | ||||||
| BWX Technologies, Inc. | 2,469 | 126,413 | ||||||
| CACI International, Inc., Class A(a) | 605 | 169,624 | ||||||
| Casella Waste Systems, Inc.(a) | 2,538 | 181,670 | ||||||
| Cintas Corp. | 558 | 222,268 | ||||||
| CoreCivic, Inc.(a) | 12,906 | 166,100 | ||||||
| CRA International, Inc. | 1,388 | 118,993 | ||||||
| Gorman-Rupp Co. | 3,002 | 89,430 | ||||||
| Heidrick & Struggles International, Inc. | 3,828 | 132,296 | ||||||
| Matson, Inc. | 2,674 | 240,339 | ||||||
| Oshkosh Corp. | 1,447 | 134,441 | ||||||
| Rush Enterprises, Inc., Class A | 2,386 | 121,638 | ||||||
See Notes to Financial Statements.
15 | May 31, 2022
RiverFront Dynamic US Flex-Cap ETF
| Schedule of Investments | May 31, 2022 (Unaudited) |
| Security Description | Shares | Value | ||||||
| Industrials (continued) | ||||||||
| Snap-on, Inc. | 146 | $ | 32,394 | |||||
| Standex International Corp. | 1,331 | 123,916 | ||||||
| Trinity Industries, Inc. | 5,805 | 144,312 | ||||||
| United Parcel Service, Inc., Class B | 2,106 | 383,818 | ||||||
| Univar Solutions, Inc.(a) | 7,216 | 221,676 | ||||||
| Total Industrials | 3,131,269 | |||||||
| Information Technology (27.25%) | ||||||||
| Adobe, Inc.(a) | 60 | 24,989 | ||||||
| Advanced Micro Devices, Inc.(a) | 3,371 | 343,370 | ||||||
| Amdocs, Ltd. | 2,995 | 260,236 | ||||||
| Apple, Inc. | 13,893 | 2,067,834 | ||||||
| Block, Inc., Class A(a) | 1,539 | 134,678 | ||||||
| Broadcom, Inc. | 752 | 436,258 | ||||||
| Cisco Systems, Inc. | 7,006 | 315,620 | ||||||
| Cloudflare, Inc., Class A(a) | 3,086 | 172,816 | ||||||
| Crowdstrike Holdings, Inc.(a) | 1,422 | 227,506 | ||||||
| Ebix, Inc. | 2,824 | 82,320 | ||||||
| Enphase Energy, Inc.(a) | 868 | 161,613 | ||||||
| Identiv, Inc.(a) | 16,936 | 216,611 | ||||||
| Knowles Corp.(a) | 6,266 | 120,433 | ||||||
| Mastercard, Inc., Class A | 1,450 | 518,911 | ||||||
| Maximus, Inc. | 1,901 | 123,356 | ||||||
| Methode Electronics, Inc. | 3,018 | 135,961 | ||||||
| Microsoft Corp. | 6,291 | 1,710,334 | ||||||
| NCR Corp.(a) | 4,759 | 165,090 | ||||||
| NortonLifeLock, Inc. | 11,904 | 289,743 | ||||||
| NVIDIA Corp. | 1,276 | 238,255 | ||||||
| Progress Software Corp. | 2,810 | 135,751 | ||||||
| QUALCOMM, Inc. | 2,020 | 289,304 | ||||||
| Salesforce.com, Inc.(a) | 1,874 | 300,290 | ||||||
| SolarEdge Technologies, Inc.(a) | 1,174 | 320,255 | ||||||
| Texas Instruments, Inc. | 1,838 | 324,885 | ||||||
| Visa, Inc., Class A | 2,576 | 546,550 | ||||||
| Xperi Corp. | 7,574 | 124,668 | ||||||
| Total Information Technology | 9,787,637 | |||||||
| Materials (5.61%) | ||||||||
| American Vanguard Corp. | 9,365 | 231,128 | ||||||
| FMC Corp. | 2,077 | 254,599 | ||||||
| Glatfelter Corp. | 8,077 | 69,624 | ||||||
| Mosaic Co. | 4,929 | 308,802 | ||||||
| Myers Industries, Inc. | 6,829 | 162,530 | ||||||
| Nucor Corp. | 2,062 | 273,132 | ||||||
| O-I, Inc.(a) | 17,204 | 283,006 | ||||||
| Sealed Air Corp. | 308 | 19,151 | ||||||
| SunCoke Energy, Inc. | 21,347 | 172,697 | ||||||
| United States Steel Corp. | 9,594 | 240,522 | ||||||
| Total Materials | 2,015,191 | |||||||
| Real Estate (2.96%) | ||||||||
| Duke Realty Corp. | 3,753 | 198,271 | ||||||
| Highwoods Properties, Inc. | 3,349 | 131,582 | ||||||
| Kilroy Realty Corp. | 4,164 | 252,755 | ||||||
| Kimco Realty Corp. | 9,734 | 230,209 | ||||||
| SL Green Realty Corp.(b) | 2,065 | 127,555 | ||||||
| Real Estate (continued) | ||||||||
| Uniti Group, Inc. | 10,917 | 123,799 | ||||||
| Total Real Estate | 1,064,171 | |||||||
| Utilities (2.34%) | ||||||||
| Duke Energy Corp. | 1,286 | 144,701 | ||||||
| National Fuel Gas Co. | 2,470 | 181,619 | ||||||
| OGE Energy Corp. | 7,682 | 317,267 | ||||||
| Southwest Gas Holdings, Inc. | 2,134 | 198,739 | ||||||
| Total Utilities | 842,326 | |||||||
| TOTAL COMMON STOCKS | ||||||||
| (Cost $32,854,191) | 35,857,995 | |||||||
| 7 Day Yield | Shares | Value | ||||||||||
| SHORT TERM INVESTMENTS (0.75%) | ||||||||||||
| Money Market Fund (0.08%) | ||||||||||||
| State Street Institutional Treasury Plus Money Market Fund | ||||||||||||
| (Cost $28,156) | 0.75 | % | 28,156 | 28,156 | ||||||||
| Investments Purchased with Collateral | ||||||||||||
| from Securities Loaned (0.67%) | ||||||||||||
| State Street Navigator Securities Lending Government Money Market Portfolio, 0.80% | ||||||||||||
| (Cost $241,204) | 241,204 | 241,204 | ||||||||||
| TOTAL SHORT TERM INVESTMENTS | ||||||||||||
| (Cost $269,360) | 269,360 | |||||||||||
| TOTAL INVESTMENTS (100.57%) | ||||||||||||
| (Cost $33,123,551) | $ | 36,127,355 | ||||||||||
| LIABILITIES IN EXCESS OF OTHER ASSETS (-0.57%) | (203,745 | ) | ||||||||||
| NET ASSETS - 100.00% | $ | 35,923,610 | ||||||||||
| (a) | Non-income producing security. |
| (b) | Security, or a portion of the security position is currently on loan. The total market value of securities on loan is $451,149. |
See Notes to Financial Statements.
16 | May 31, 2022
RiverFront Strategic Income Fund
| Schedule of Investments | May 31, 2022 (Unaudited) |
| Security Description | Principal Amount | Value | ||||||
| CORPORATE BONDS (78.82%) | ||||||||
| Communications (6.16%) | ||||||||
| AMC Networks, Inc. | ||||||||
| 5.00%, 04/01/2024 | $ | 402,000 | $ | 401,403 | ||||
| 4.75%, 08/01/2025 | 482,000 | 475,669 | ||||||
| CCO Holdings LLC / CCO Holdings | ||||||||
| Capital Corp. | ||||||||
| 5.50%, 05/01/2026(a) | 553,000 | 554,844 | ||||||
| CSC Holdings LLC | ||||||||
| 5.50%, 04/15/2027(a) | 1,030,000 | 1,032,595 | ||||||
| Level 3 Financing, Inc. | ||||||||
| 3.75%, 07/15/2029(a) | 1,214,000 | 1,037,591 | ||||||
| Netflix, Inc. | ||||||||
| 4.38%, 11/15/2026 | 955,000 | 953,969 | ||||||
| Sirius XM Radio, Inc. | ||||||||
| 3.13%, 09/01/2026(a) | 1,000,000 | 945,405 | ||||||
| T-Mobile USA, Inc. | ||||||||
| 2.63%, 04/15/2026 | 1,860,000 | 1,767,581 | ||||||
| WMG Acquisition Corp. | ||||||||
| 3.75%, 12/01/2029(a) | 955,000 | 877,077 | ||||||
| Total Communications | 8,046,134 | |||||||
| Consumer Discretionary (14.64%) | ||||||||
| Air Canada | ||||||||
| 3.88%, 08/15/2026(a) | 1,053,000 | 982,897 | ||||||
| Aramark Services, Inc. | ||||||||
| 6.38%, 05/01/2025(a) | 1,053,000 | 1,072,712 | ||||||
| Caesars Entertainment, Inc. | ||||||||
| 6.25%, 07/01/2025(a) | 1,246,000 | 1,262,447 | ||||||
| DR Horton, Inc. | ||||||||
| 4.38%, 09/15/2022 | 1,658,000 | 1,660,822 | ||||||
| Ford Motor Credit Co. LLC | ||||||||
| 2.30%, 02/10/2025 | 1,423,000 | 1,328,282 | ||||||
| Goodyear Tire & Rubber Co. | ||||||||
| 5.00%, 05/31/2026 | 1,268,000 | 1,245,810 | ||||||
| Hilton Domestic Operating Co., Inc. | ||||||||
| 3.75%, 05/01/2029(a) | 1,155,000 | 1,059,424 | ||||||
| International Game Technology PLC | ||||||||
| 6.50%, 02/15/2025(a) | 1,091,000 | 1,118,242 | ||||||
| Las Vegas Sands Corp. | ||||||||
| 3.20%, 08/08/2024 | 927,000 | 890,070 | ||||||
| Lennar Corp. | ||||||||
| 4.75%, 11/29/2027 | 1,155,000 | 1,163,528 | ||||||
| MGM Resorts International | ||||||||
| 6.00%, 03/15/2023 | 1,246,000 | 1,261,612 | ||||||
| Newell Brands, Inc. | ||||||||
| 4.10%, 04/01/2023 | 382,000 | 382,065 | ||||||
| 4.45%, 04/01/2026 | 955,000 | 955,191 | ||||||
| Nissan Motor Co., Ltd. | ||||||||
| 3.52%, 09/17/2025(a) | 1,155,000 | 1,117,585 | ||||||
| PulteGroup, Inc. | ||||||||
| 5.50%, 03/01/2026 | 1,538,000 | 1,608,407 | ||||||
| Royal Caribbean Cruises, Ltd. | ||||||||
| 10.88%, 06/01/2023(a) | 1,291,000 | 1,344,292 | ||||||
| Consumer Discretionary (continued) | ||||||||
| Six Flags Entertainment Corp. | ||||||||
| 4.88%, 07/31/2024(a) | 690,000 | 678,919 | ||||||
| Total Consumer Discretionary | 19,132,305 | |||||||
| Consumer Staples (2.33%) | ||||||||
| Anheuser-Busch InBev | ||||||||
| Worldwide, Inc. | ||||||||
| 4.75%, 01/23/2029 | 1,053,000 | 1,097,120 | ||||||
| JBS Finance Luxembourg Sarl | ||||||||
| 2.50%, 01/15/2027(a) | 955,000 | 855,695 | ||||||
| Spectrum Brands, Inc. | ||||||||
| 5.75%, 07/15/2025 | 30,000 | 30,067 | ||||||
| US Foods, Inc. | ||||||||
| 6.25%, 04/15/2025(a) | 1,030,000 | 1,060,869 | ||||||
| Total Consumer Staples | 3,043,751 | |||||||
| Energy (4.37%) | ||||||||
| Cheniere Corpus Christi Holdings LLC | ||||||||
| 7.00%, 06/30/2024 | 1,217,000 | 1,278,365 | ||||||
| DCP Midstream Operating LP | ||||||||
| 5.38%, 07/15/2025 | 1,000,000 | 1,025,835 | ||||||
| EQM Midstream Partners LP | ||||||||
| 4.75%, 07/15/2023 | 390,000 | 397,059 | ||||||
| Petroleos Mexicanos | ||||||||
| 4.88%, 01/18/2024 | 1,020,000 | 1,018,557 | ||||||
| Reliance Industries, Ltd. | ||||||||
| 4.13%, 01/28/2025(a) | 945,000 | 953,674 | ||||||
| Schlumberger Holdings Corp. | ||||||||
| 3.90%, 05/17/2028(a) | 1,053,000 | 1,030,765 | ||||||
| Total Energy | 5,704,255 | |||||||
| Financials (23.49%) | ||||||||
| Air Lease Corp. | ||||||||
| 4.25%, 02/01/2024 | 963,000 | 967,587 | ||||||
| Ares Capital Corp. | ||||||||
| 3.50%, 02/10/2023 | 1,158,000 | 1,161,369 | ||||||
| Avolon Holdings Funding, Ltd. | ||||||||
| 2.53%, 11/18/2027(a) | 1,085,000 | 938,458 | ||||||
| Bancolombia SA | ||||||||
| 5.13%, 09/11/2022 | 951,000 | 953,349 | ||||||
| Bank of America Corp. | ||||||||
| 4.25%, 10/22/2026 | 1,577,000 | 1,595,909 | ||||||
| Blackstone Secured Lending Fund | ||||||||
| 3.63%, 01/15/2026 | 1,142,000 | 1,090,156 | ||||||
| Capital One Financial Corp. | ||||||||
| 4.20%, 10/29/2025 | 1,053,000 | 1,060,488 | ||||||
| Citigroup, Inc. | ||||||||
| 4.45%, 09/29/2027 | 1,577,000 | 1,584,156 | ||||||
| EPR Properties | ||||||||
| 4.75%, 12/15/2026 | 1,000,000 | 981,220 | ||||||
| FS KKR Capital Corp. | ||||||||
| 3.40%, 01/15/2026 | 1,155,000 | 1,080,008 | ||||||
See Notes to Financial Statements.
17 | May 31, 2022
RiverFront Strategic Income Fund
| Schedule of Investments | May 31, 2022 (Unaudited) |
| Security Description | Principal Amount | Value | ||||||
| Financials (continued) | ||||||||
| GLP Capital LP / GLP Financing II, Inc. | ||||||||
| 3.35%, 09/01/2024 | $ | 927,000 | $ | 912,797 | ||||
| Goldman Sachs Group, Inc. | ||||||||
| 4.25%, 10/21/2025 | 1,577,000 | 1,599,611 | ||||||
| HAT Holdings I LLC / HAT Holdings II LLC | ||||||||
| 3.38%, 06/15/2026(a) | 1,074,000 | 993,772 | ||||||
| Icahn Enterprises LP / Icahn | ||||||||
| Enterprises Finance Corp. | ||||||||
| 4.75%, 09/15/2024 | 1,247,000 | 1,245,254 | ||||||
| Iron Mountain, Inc. | ||||||||
| 4.88%, 09/15/2027(a) | 1,104,000 | 1,089,289 | ||||||
| iStar, Inc. | ||||||||
| 4.75%, 10/01/2024 | 1,299,000 | 1,295,753 | ||||||
| JPMorgan Chase & Co. | ||||||||
| 4.25%, 10/01/2027 | 1,577,000 | 1,586,907 | ||||||
| MPT Operating Partnership LP / | ||||||||
| MPT Finance Corp. | ||||||||
| 5.25%, 08/01/2026 | 927,000 | 930,135 | ||||||
| NatWest Markets PLC | ||||||||
| 3.48%, 03/22/2025(a) | 960,000 | 953,214 | ||||||
| Newmark Group, Inc. | ||||||||
| 6.13%, 11/15/2023 | 1,227,000 | 1,240,454 | ||||||
| Omega Healthcare Investors, Inc. | ||||||||
| 4.38%, 08/01/2023 | 312,000 | 313,278 | ||||||
| 5.25%, 01/15/2026 | 642,000 | 651,542 | ||||||
| OneMain Finance Corp. | ||||||||
| 6.13%, 03/15/2024 | 1,246,000 | 1,277,499 | ||||||
| Park Aerospace Holdings, Ltd. | ||||||||
| 5.25%, 08/15/2022(a) | 26,000 | 26,056 | ||||||
| Santander Holdings USA, Inc. | ||||||||
| 3.50%, 06/07/2024 | 478,000 | 475,943 | ||||||
| SBA Communications Corp. | ||||||||
| 3.88%, 02/15/2027 | 1,475,000 | 1,446,120 | ||||||
| Starwood Property Trust, Inc. | ||||||||
| 4.75%, 03/15/2025 | 955,000 | 946,439 | ||||||
| Synchrony Financial | ||||||||
| 2.85%, 07/25/2022 | 985,000 | 985,354 | ||||||
| VICI Properties LP / VICI Note Co., Inc. | ||||||||
| 4.25%, 12/01/2026(a) | 1,367,000 | 1,300,072 | ||||||
| Total Financials | 30,682,189 | |||||||
| Health Care (1.12%) | ||||||||
| DaVita, Inc. | ||||||||
| 4.63%, 06/01/2030(a) | 1,104,000 | 961,420 | ||||||
| HCA, Inc. | ||||||||
| 5.38%, 02/01/2025 | 482,000 | 498,658 | ||||||
| Total Health Care | 1,460,078 | |||||||
| Industrials (5.13%) | ||||||||
| Boeing Co. | ||||||||
| 4.88%, 05/01/2025 | 1,155,000 | 1,167,847 | ||||||
| MasTec, Inc. | ||||||||
| 4.50%, 08/15/2028(a) | 1,069,000 | 1,020,679 | ||||||
| Industrials (continued) | ||||||||
| Sensata Technologies BV | ||||||||
| 5.00%, 10/01/2025(a) | 955,000 | 965,477 | ||||||
| Stericycle, Inc. | ||||||||
| 5.38%, 07/15/2024(a) | 1,001,000 | 1,003,267 | ||||||
| TransDigm, Inc. | ||||||||
| 6.25%, 03/15/2026(a) | 1,030,000 | 1,054,514 | ||||||
| WESCO Distribution, Inc. | ||||||||
| 7.13%, 06/15/2025(a) | 1,437,000 | 1,497,095 | ||||||
| Total Industrials | 6,708,879 | |||||||
| Materials (13.01%) | ||||||||
| Alcoa Nederland Holding BV | ||||||||
| 4.13%, 03/31/2029(a) | 1,291,000 | 1,232,008 | ||||||
| ArcelorMittal SA | ||||||||
| 3.60%, 07/16/2024 | 1,076,000 | 1,078,138 | ||||||
| Arconic Corp. | ||||||||
| 6.00%, 05/15/2025(a) | 1,053,000 | 1,081,957 | ||||||
| Ardagh Packaging Finance PLC / | ||||||||
| Ardagh Holdings USA, Inc. | ||||||||
| 5.25%, 04/30/2025(a) | 1,264,000 | 1,257,029 | ||||||
| Ball Corp. | ||||||||
| 5.25%, 07/01/2025 | 798,000 | 814,977 | ||||||
| 4.88%, 03/15/2026 | 482,000 | 488,013 | ||||||
| Berry Global, Inc. | ||||||||
| 4.88%, 07/15/2026(a) | 1,103,000 | 1,086,091 | ||||||
| Braskem Finance, Ltd. | ||||||||
| 6.45%, 02/03/2024 | 1,269,000 | 1,332,139 | ||||||
| Freeport-McMoRan, Inc. | ||||||||
| 3.88%, 03/15/2023 | 1,076,000 | 1,081,653 | ||||||
| 5.00%, 09/01/2027 | 523,000 | 529,154 | ||||||
| Graphic Packaging International LLC | ||||||||
| 4.88%, 11/15/2022 | 1,418,000 | 1,424,526 | ||||||
| Mauser Packaging Solutions Holding Co. | ||||||||
| 5.50%, 04/15/2024(a) | 416,000 | 412,275 | ||||||
| Methanex Corp. | ||||||||
| 5.13%, 10/15/2027 | 1,030,000 | 996,546 | ||||||
| NOVA Chemicals Corp. | ||||||||
| 4.88%, 06/01/2024(a) | 1,246,000 | 1,228,699 | ||||||
| Novelis Corp. | ||||||||
| 3.25%, 11/15/2026(a) | 1,000,000 | 919,915 | ||||||
| Sasol Financing International, Ltd. | ||||||||
| 4.50%, 11/14/2022 | 555,000 | 556,138 | ||||||
| Sasol Financing USA LLC | ||||||||
| 4.38%, 09/18/2026 | 642,000 | 589,870 | ||||||
| Standard Industries, Inc. | ||||||||
| 3.38%, 01/15/2031(a) | 1,053,000 | 889,674 | ||||||
| Total Materials | 16,998,802 | |||||||
| Technology (4.00%) | ||||||||
| CDW LLC / CDW Finance Corp. | ||||||||
| 3.57%, 12/01/2031 | 955,000 | 847,351 | ||||||
| Flex, Ltd. | ||||||||
| 5.00%, 02/15/2023 | 1,267,000 | 1,282,722 | ||||||
See Notes to Financial Statements.
18 | May 31, 2022
RiverFront Strategic Income Fund
| Schedule of Investments | May 31, 2022 (Unaudited) |
| Security Description | Principal Amount | Value | ||||||
| Technology (continued) | ||||||||
| Microchip Technology, Inc. | ||||||||
| 4.25%, 09/01/2025 | $ | 1,069,000 | $ | 1,064,532 | ||||
| NortonLifeLock, Inc. | ||||||||
| 3.95%, 06/15/2022 | 137,000 | 137,000 | ||||||
| 5.00%, 04/15/2025(a) | 823,000 | 823,012 | ||||||
| Seagate HDD Cayman | ||||||||
| 4.75%, 06/01/2023 | 1,053,000 | 1,070,338 | ||||||
| Total Technology | 5,224,955 | |||||||
| Utilities (4.57%) | ||||||||
| AmeriGas Partners LP / AmeriGas | ||||||||
| Finance Corp. | ||||||||
| 5.88%, 08/20/2026 | 1,074,000 | 1,094,857 | ||||||
| Calpine Corp. | ||||||||
| 5.25%, 06/01/2026(a) | 511,000 | 504,493 | ||||||
| NextEra Energy Operating | ||||||||
| Partners LP | ||||||||
| 4.25%, 07/15/2024(a) | 1,433,000 | 1,439,520 | ||||||
| NRG Energy, Inc. | ||||||||
| 3.75%, 06/15/2024(a) | 955,000 | 947,724 | ||||||
| 6.63%, 01/15/2027 | 356,000 | 366,153 | ||||||
| Vistra Operations Co. LLC | ||||||||
| 3.55%, 07/15/2024(a) | 1,645,000 | 1,613,395 | ||||||
| Total Utilities | 5,966,142 | |||||||
| TOTAL CORPORATE BONDS | ||||||||
| (Cost $108,474,521) | 102,967,490 | |||||||
| GOVERNMENT BONDS (3.82%) | ||||||||
| U.S. Treasury Note | ||||||||
| 2.50%, 05/31/2024 | 5,000,000 | 4,996,095 | ||||||
| TOTAL GOVERNMENT BONDS | ||||||||
| (Cost $4,994,727) | 4,996,095 | |||||||
| 7 Day Yield | Shares | Value | ||||||||||
| SHORT TERM INVESTMENTS (20.24%) | ||||||||||||
| Money Market Fund | ||||||||||||
| State Street Institutional Treasury Plus Money Market Fund | 0.75 | % | 26,445,753 | 26,445,753 | ||||||||
| TOTAL SHORT TERM INVESTMENTS | ||||||||||||
| (Cost $26,445,753) | 26,445,753 | |||||||||||
| TOTAL INVESTMENTS (102.88%) | ||||||||||||
| (Cost $139,915,001) | $ | 134,409,338 | ||||||||||
| LIABILITIES IN EXCESS OF OTHER ASSETS (-2.88%) | (3,766,657 | ) | ||||||||||
| NET ASSETS - 100.00% | $ | 130,642,681 | ||||||||||
| (a) | Securities exempt from registration under Rule 144A of the Securities Act of 1933. These securities may be sold in the ordinary course of business in transactions exempt from registration, normally to qualified institutional buyers. At period end, the aggregate market value of those securities was 42,224,140, representing 32.32% of net assets. |
See Notes to Financial Statements.
19 | May 31, 2022
RiverFront ETFs
| Statement of Assets and Liabilities | May 31, 2022 (Unaudited) |
| RiverFront Dynamic Core Income ETF | RiverFront Dynamic US Dividend Advantage ETF | RiverFront Dynamic US Flex-Cap ETF | RiverFront Strategic Income Fund | |||||||||||||
| ASSETS: | ||||||||||||||||
| Investments, at value | $ | 77,805,927 | $ | 114,068,696 | $ | 36,127,355 | $ | 134,409,338 | ||||||||
| Dividend receivable | – | 328,544 | 52,419 | – | ||||||||||||
| Interest receivable | 498,066 | – | – | 1,278,795 | ||||||||||||
| Receivable for investments sold | – | – | – | 342 | ||||||||||||
| Total Assets | 78,303,993 | 114,397,240 | 36,179,774 | 135,688,475 | ||||||||||||
| LIABILITIES: | ||||||||||||||||
| Payable to adviser | 34,517 | 48,639 | 14,960 | 50,725 | ||||||||||||
| Payable for investments purchased | – | – | – | 4,995,069 | ||||||||||||
| Payable for collateral upon return of securities loaned | – | 1,291,293 | 241,204 | – | ||||||||||||
| Total Liabilities | 34,517 | 1,339,932 | 256,164 | 5,045,794 | ||||||||||||
| NET ASSETS | $ | 78,269,476 | $ | 113,057,308 | $ | 35,923,610 | $ | 130,642,681 | ||||||||
| NET ASSETS CONSIST OF: | ||||||||||||||||
| Paid-in capital | $ | 83,906,094 | $ | 85,702,090 | $ | 46,611,445 | $ | 147,793,256 | ||||||||
| Total distributable earnings | (5,636,618 | ) | 27,355,218 | (10,687,835 | ) | (17,150,575 | ) | |||||||||
| NET ASSETS | $ | 78,269,476 | $ | 113,057,308 | $ | 35,923,610 | $ | 130,642,681 | ||||||||
| INVESTMENTS, AT COST | $ | 82,134,094 | $ | 100,333,939 | $ | 33,123,551 | $ | 139,915,001 | ||||||||
| PRICING OF SHARES | ||||||||||||||||
| Net Assets | $ | 78,269,476 | $ | 113,057,308 | $ | 35,923,610 | $ | 130,642,681 | ||||||||
| Shares of beneficial interest outstanding (Unlimited number of shares authorized, par value $0.01 per share) | 3,400,000 | 2,400,002 | 825,002 | 5,600,000 | ||||||||||||
| Net Asset Value, offering and redemption price per share | $ | 23.02 | $ | 47.11 | $ | 43.54 | $ | 23.33 | ||||||||
See Notes to Financial Statements.
20 | May 31, 2022
RiverFront ETFs
| Statement of Operations | For the Six Months Ended May 31, 2022 (Unaudited) |
| RiverFront Dynamic Core Income ETF | RiverFront Dynamic US Dividend Advantage ETF | RiverFront Dynamic US Flex-Cap ETF | RiverFront Strategic Income Fund | |||||||||||||
| INVESTMENT INCOME: | ||||||||||||||||
| Interest | $ | 1,081,653 | $ | – | $ | – | $ | 1,716,674 | ||||||||
| Dividends(a) | 13,795 | 2,275,963 | 358,459 | 19,190 | ||||||||||||
| Securities Lending Income | – | 11,600 | 2,196 | – | ||||||||||||
| Total Investment Income | 1,095,448 | 2,287,563 | 360,655 | 1,735,864 | ||||||||||||
| EXPENSES: | ||||||||||||||||
| Investment adviser and sub-adviser fees (Note 3) | 236,076 | 301,391 | 96,155 | 318,283 | ||||||||||||
| Total Expenses | 236,076 | 301,391 | 96,155 | 318,283 | ||||||||||||
| NET INVESTMENT INCOME | 859,372 | 1,986,172 | 264,500 | 1,417,581 | ||||||||||||
| REALIZED AND UNREALIZED GAIN/(LOSS) | ||||||||||||||||
| Net realized gain/(loss) on investments(b) | (1,252,081 | ) | 30,471,196 | 10,435,228 | (1,331,165 | ) | ||||||||||
| NET REALIZED GAIN/(LOSS) | (1,252,081 | ) | 30,471,196 | 10,435,228 | (1,331,165 | ) | ||||||||||
| Net change in unrealized depreciation on investments | (6,221,915 | ) | (25,102,978 | ) | (12,516,068 | ) | (5,484,301 | ) | ||||||||
| NET CHANGE IN UNREALIZED APPRECIATION/(DEPRECIATION) | (6,221,915 | ) | (25,102,978 | ) | (12,516,068 | ) | (5,484,301 | ) | ||||||||
| NET REALIZED AND UNREALIZED GAIN/(LOSS) ON INVESTMENTS | (7,473,996 | ) | 5,368,218 | (2,080,840 | ) | (6,815,466 | ) | |||||||||
| NET INCREASE/(DECREASE) IN NET ASSETS RESULTING FROM OPERATIONS | $ | (6,614,624 | ) | $ | 7,354,390 | $ | (1,816,340 | ) | $ | (5,397,885 | ) | |||||
| (a) | Net of foreign tax withholding in the amounts of $–, $–, $– and $42, respectively. |
| (b) | Includes realized gain or loss as a result of in-kind transactions (See Note 4 in Notes to Financial Statements). |
See Notes to Financial Statements.
21 | May 31, 2022
RiverFront Dynamic Core Income ETF
Statements of Changes in Net Assets
| For the Six Months Ended May 31, 2022 (Unaudited) | For the Year Ended November 30, 2021 | |||||||
| OPERATIONS: | ||||||||
| Net investment income | $ | 859,372 | $ | 1,990,198 | ||||
| Net realized gain/(loss) | (1,252,081 | ) | 2,564,824 | |||||
| Net change in unrealized depreciation | (6,221,915 | ) | (6,289,006 | ) | ||||
| Net decrease in net assets resulting from operations | (6,614,624 | ) | (1,733,984 | ) | ||||
| DISTRIBUTIONS TO SHAREHOLDERS: | ||||||||
| From distributable earnings | (2,635,978 | ) | (1,962,506 | ) | ||||
| Total distributions | (2,635,978 | ) | (1,962,506 | ) | ||||
| CAPITAL SHARE TRANSACTIONS: | ||||||||
| Proceeds from sale of shares | 595,048 | 17,914,173 | ||||||
| Shares redeemed | (30,947,841 | ) | (9,068,318 | ) | ||||
| Net increase/(decrease) from share transactions | (30,352,793 | ) | 8,845,855 | |||||
| Net increase/(decrease) in net assets | (39,603,395 | ) | 5,149,365 | |||||
| NET ASSETS: | ||||||||
| Beginning of period | 117,872,871 | 112,723,506 | ||||||
| End of period | $ | 78,269,476 | $ | 117,872,871 | ||||
| OTHER INFORMATION: | ||||||||
| CAPITAL SHARE TRANSACTIONS: | ||||||||
| Beginning shares | 4,650,000 | 4,300,000 | ||||||
| Shares sold | 25,000 | 700,000 | ||||||
| Shares redeemed | (1,275,000 | ) | (350,000 | ) | ||||
| Shares outstanding, end of period | 3,400,000 | 4,650,000 | ||||||
See Notes to Financial Statements.
22 | May 31, 2022
RiverFront Dynamic US Dividend Advantage ETF
Statements of Changes in Net Assets
| For the Six Months Ended May 31, 2022 (Unaudited) | For the Year Ended November 30, 2021 | |||||||
| OPERATIONS: | ||||||||
| Net investment income | $ | 1,986,172 | $ | 1,902,769 | ||||
| Net realized gain | 30,471,196 | 8,733,483 | ||||||
| Net change in unrealized appreciation/(depreciation) | (25,102,978 | ) | 15,974,138 | |||||
| Net increase in net assets resulting from operations | 7,354,390 | 26,610,390 | ||||||
| DISTRIBUTIONS TO SHAREHOLDERS: | ||||||||
| From distributable earnings | (1,649,659 | ) | (1,936,954 | ) | ||||
| Total distributions | (1,649,659 | ) | (1,936,954 | ) | ||||
| CAPITAL SHARE TRANSACTIONS: | ||||||||
| Proceeds from sale of shares | 27,111,743 | 4,577,634 | ||||||
| Shares redeemed | (52,283,359 | ) | (30,021,042 | ) | ||||
| Net decrease from share transactions | (25,171,616 | ) | (25,443,408 | ) | ||||
| Net decrease in net assets | (19,466,885 | ) | (769,972 | ) | ||||
| NET ASSETS: | ||||||||
| Beginning of period | 132,524,193 | 133,294,165 | ||||||
| End of period | $ | 113,057,308 | $ | 132,524,193 | ||||
| OTHER INFORMATION: | ||||||||
| CAPITAL SHARE TRANSACTIONS: | ||||||||
| Beginning shares | 2,950,002 | 3,600,002 | ||||||
| Shares sold | 600,000 | 100,000 | ||||||
| Shares redeemed | (1,150,000 | ) | (750,000 | ) | ||||
| Shares outstanding, end of period | 2,400,002 | 2,950,002 | ||||||
See Notes to Financial Statements.
23 | May 31, 2022
RiverFront Dynamic US Flex-Cap ETF
Statements of Changes in Net Assets
| For the Six Months Ended May 31, 2022 (Unaudited) | For the Year Ended November 30, 2021 | |||||||
| OPERATIONS: | ||||||||
| Net investment income | $ | 264,500 | $ | 604,208 | ||||
| Net realized gain | 10,435,228 | 10,365,533 | ||||||
| Net change in unrealized appreciation/(depreciation) | (12,516,068 | ) | 2,789,216 | |||||
| Net increase/(decrease) in net assets resulting from operations | (1,816,340 | ) | 13,758,957 | |||||
| DISTRIBUTIONS TO SHAREHOLDERS: | ||||||||
| From distributable earnings | (224,944 | ) | (679,274 | ) | ||||
| Total distributions | (224,944 | ) | (679,274 | ) | ||||
| CAPITAL SHARE TRANSACTIONS: | ||||||||
| Proceeds from sale of shares | 14,523,047 | – | ||||||
| Shares redeemed | (28,292,821 | ) | (32,744,774 | ) | ||||
| Net decrease from share transactions | (13,769,774 | ) | (32,744,774 | ) | ||||
| Net decrease in net assets | (15,811,058 | ) | (19,665,091 | ) | ||||
| NET ASSETS: | ||||||||
| Beginning of period | 51,734,668 | 71,399,759 | ||||||
| End of period | $ | 35,923,610 | $ | 51,734,668 | ||||
| OTHER INFORMATION: | ||||||||
| CAPITAL SHARE TRANSACTIONS: | ||||||||
| Beginning shares | 1,125,002 | 1,900,002 | ||||||
| Shares sold | 325,000 | – | ||||||
| Shares redeemed | (625,000 | ) | (775,000 | ) | ||||
| Shares outstanding, end of period | 825,002 | 1,125,002 | ||||||
See Notes to Financial Statements.
24 | May 31, 2022
RiverFront Strategic Income Fund
Statements of Changes in Net Assets
| For the Six Months Ended May 31, 2022 (Unaudited) | For the Year Ended November 30, 2021 | |||||||
| OPERATIONS: | ||||||||
| Net investment income | $ | 1,417,581 | $ | 2,793,818 | ||||
| Net realized gain/(loss) | (1,331,165 | ) | 491,816 | |||||
| Net change in unrealized depreciation | (5,484,301 | ) | (1,547,122 | ) | ||||
| Net increase/(decrease) in net assets resulting from operations | (5,397,885 | ) | 1,738,512 | |||||
| DISTRIBUTIONS TO SHAREHOLDERS: | ||||||||
| From distributable earnings | (1,664,530 | ) | (3,171,669 | ) | ||||
| Total distributions | (1,664,530 | ) | (3,171,669 | ) | ||||
| CAPITAL SHARE TRANSACTIONS: | ||||||||
| Proceeds from sale of shares | 1,839,643 | 43,888,656 | ||||||
| Shares redeemed | (7,027,733 | ) | (18,545,978 | ) | ||||
| Net increase/(decrease) from share transactions | (5,188,090 | ) | 25,342,678 | |||||
| Net increase/(decrease) in net assets | (12,250,505 | ) | 23,909,521 | |||||
| NET ASSETS: | ||||||||
| Beginning of period | 142,893,186 | 118,983,665 | ||||||
| End of period | $ | 130,642,681 | $ | 142,893,186 | ||||
| OTHER INFORMATION: | ||||||||
| CAPITAL SHARE TRANSACTIONS: | ||||||||
| Beginning shares | 5,825,000 | 4,800,000 | ||||||
| Shares sold | 75,000 | 1,775,000 | ||||||
| Shares redeemed | (300,000 | ) | (750,000 | ) | ||||
| Shares outstanding, end of period | 5,600,000 | 5,825,000 | ||||||
See Notes to Financial Statements.
25 | May 31, 2022
RiverFront Dynamic Core Income ETF
| Financial Highlights | For a share outstanding throughout the periods presented |
| For the Six Months Ended May 31, 2022 (Unaudited) | For the Year Ended November 30, 2021 | For the Year Ended November 30, 2020 | For the Year Ended November 30, 2019 | For the Year Ended November 30, 2018 | For the Year Ended November 30, 2017 | |||||||||||||||||||
| NET ASSET VALUE, BEGINNING OF PERIOD | $ | 25.35 | $ | 26.21 | $ | 25.22 | $ | 23.52 | $ | 24.60 | $ | 24.32 | ||||||||||||
| INCOME/(LOSS) FROM INVESTMENT OPERATIONS: | ||||||||||||||||||||||||
| Net investment income(a) | 0.22 | 0.47 | 0.50 | 0.68 | 0.68 | 0.53 | ||||||||||||||||||
| Net realized and unrealized gain/(loss) | (1.93 | ) | (0.87 | ) | 0.99 | 1.70 | (1.10 | ) | 0.23 | |||||||||||||||
| Total from investment operations | (1.71 | ) | (0.40 | ) | 1.49 | 2.38 | (0.42 | ) | 0.76 | |||||||||||||||
| DISTRIBUTIONS: | ||||||||||||||||||||||||
| From net investment income | (0.24 | ) | (0.46 | ) | (0.50 | ) | (0.68 | ) | (0.66 | ) | (0.48 | ) | ||||||||||||
| From net realized gains | (0.38 | ) | – | – | – | – | – | |||||||||||||||||
| Total distributions | (0.62 | ) | (0.46 | ) | (0.50 | ) | (0.68 | ) | (0.66 | ) | (0.48 | ) | ||||||||||||
| NET INCREASE/(DECREASE) IN NET ASSET VALUE | (2.33 | ) | (0.86 | ) | 0.99 | 1.70 | (1.08 | ) | 0.28 | |||||||||||||||
| NET ASSET VALUE, END OF PERIOD | $ | 23.02 | $ | 25.35 | $ | 26.21 | $ | 25.22 | $ | 23.52 | $ | 24.60 | ||||||||||||
| TOTAL RETURN(b) | (6.91 | )% | (1.51 | )% | 5.97 | % | 10.22 | % | (1.74 | )% | 3.15 | % | ||||||||||||
| RATIOS/SUPPLEMENTAL DATA: | ||||||||||||||||||||||||
| Net assets, end of period (000s) | $ | 78,269 | $ | 117,873 | $ | 112,724 | $ | 134,951 | $ | 150,527 | $ | 47,962 | ||||||||||||
| Ratio of expenses to average net assets | 0.51 | %(c) | 0.51 | % | 0.51 | % | 0.51 | % | 0.51 | % | 0.51 | % | ||||||||||||
| Ratio of net investment income to average net assets | 1.86 | %(c) | 1.83 | % | 1.94 | % | 2.74 | % | 2.83 | % | 2.15 | % | ||||||||||||
| Portfolio turnover rate(d) | 57 | % | 45 | % | 11 | % | �� | 6 | % | 15 | % | 18 | % | |||||||||||
| (a) | Based on average shares outstanding during the period. |
| (b) | Total return is calculated assuming an initial investment made at the net asset value at the beginning of the period and the redemption at the net asset value on the last day of the period and assuming all distributions are reinvested at the actual reinvestment prices. Total return calculated for a period of less than one year is not annualized. |
| (c) | Annualized. |
| (d) | Portfolio turnover for periods less than one year are not annualized and does not include securities received or delivered from processing creations or redemptions in-kind. |
See Notes to Financial Statements.
26 | May 31, 2022
RiverFront Dynamic US Dividend Advantage ETF
| Financial Highlights | For a share outstanding throughout the periods presented |
| For the Six Months Ended May 31, 2022 (Unaudited) | For the Year Ended November 30, 2021 | For the Year Ended November 30, 2020 | For the Year Ended November 30, 2019 | For the Year Ended November 30, 2018 | For the Year Ended November 30, 2017 | |||||||||||||||||||
| NET ASSET VALUE, BEGINNING OF PERIOD | $ | 44.92 | $ | 37.03 | $ | 33.98 | $ | 31.19 | $ | 31.39 | $ | 26.59 | ||||||||||||
| INCOME/(LOSS) FROM INVESTMENT OPERATIONS: | ||||||||||||||||||||||||
| Net investment income(a) | 0.80 | 0.62 | 0.56 | 0.65 | 0.73 | 0.63 | ||||||||||||||||||
| Net realized and unrealized gain/(loss) | 2.06 | 7.90 | 3.08 | 2.81 | (0.26 | ) | 4.76 | |||||||||||||||||
| Total from investment operations | 2.86 | 8.52 | 3.64 | 3.46 | 0.47 | 5.39 | ||||||||||||||||||
| DISTRIBUTIONS: | ||||||||||||||||||||||||
| From net investment income | (0.67 | ) | (0.63 | ) | (0.59 | ) | (0.67 | ) | (0.67 | ) | (0.59 | ) | ||||||||||||
| Total distributions | (0.67 | ) | (0.63 | ) | (0.59 | ) | (0.67 | ) | (0.67 | ) | (0.59 | ) | ||||||||||||
| NET INCREASE/(DECREASE) IN NET ASSET VALUE | 2.19 | 7.89 | 3.05 | 2.79 | (0.20 | ) | 4.80 | |||||||||||||||||
| NET ASSET VALUE, END OF PERIOD | $ | 47.11 | $ | 44.92 | $ | 37.03 | $ | 33.98 | $ | 31.19 | $ | 31.39 | ||||||||||||
| TOTAL RETURN(b) | 6.39 | % | 23.13 | % | 10.92 | % | 11.29 | % | 1.45 | % | 20.49 | % | ||||||||||||
| RATIOS/SUPPLEMENTAL DATA: | ||||||||||||||||||||||||
| Net assets, end of period (000s) | $ | 113,057 | $ | 132,524 | $ | 133,294 | $ | 130,828 | $ | 151,293 | $ | 59,644 | ||||||||||||
| Ratio of expenses to average net assets | 0.52 | %(c) | 0.52 | % | 0.52 | % | 0.52 | % | 0.52 | % | 0.52 | % | ||||||||||||
| Ratio of net investment income to average net assets | 3.43 | %(c) | 1.47 | % | 1.68 | % | 2.05 | % | 2.27 | % | 2.19 | % | ||||||||||||
| Portfolio turnover rate(d) | 111 | % | 0 | % | 75 | % | 64 | % | 96 | % | 54 | % | ||||||||||||
| (a) | Based on average shares outstanding during the period. |
| (b) | Total return is calculated assuming an initial investment made at the net asset value at the beginning of the period and the redemption at the net asset value on the last day of the period and assuming all distributions are reinvested at the actual reinvestment prices. Total return calculated for a period of less than one year is not annualized. |
| (c) | Annualized. |
| (d) | Portfolio turnover for periods less than one year are not annualized and does not include securities received or delivered from processing creations or redemptions in-kind. |
See Notes to Financial Statements.
27 | May 31, 2022
RiverFront Dynamic US Flex-Cap ETF
| Financial Highlights | For a share outstanding throughout the periods presented |
| For the Six Months Ended May 31, 2022 (Unaudited) | For the Year Ended November 30, 2021 | For the Year Ended November 30, 2020 | For the Year Ended November 30, 2019 | For the Year Ended November 30, 2018 | For the Year Ended November 30, 2017 | |||||||||||||||||||
| NET ASSET VALUE, BEGINNING OF PERIOD | $ | 45.99 | $ | 37.58 | $ | 34.70 | $ | 32.79 | $ | 32.46 | $ | 26.84 | ||||||||||||
| INCOME/(LOSS) FROM INVESTMENT OPERATIONS: | ||||||||||||||||||||||||
| Net investment income(a) | 0.33 | 0.42 | 0.45 | 0.48 | 0.44 | 0.31 | ||||||||||||||||||
| Net realized and unrealized gain/(loss) | (2.50 | ) | 8.43 | 2.87 | (b) | 1.93 | 0.27 | (b) | 5.59 | |||||||||||||||
| Total from investment operations | (2.17 | ) | 8.85 | 3.32 | 2.41 | 0.71 | 5.90 | |||||||||||||||||
| DISTRIBUTIONS: | ||||||||||||||||||||||||
| From net investment income | (0.28 | ) | (0.44 | ) | (0.44 | ) | (0.50 | ) | (0.38 | ) | (0.28 | ) | ||||||||||||
| Total distributions | (0.28 | ) | (0.44 | ) | (0.44 | ) | (0.50 | ) | (0.38 | ) | (0.28 | ) | ||||||||||||
| NET INCREASE/(DECREASE) IN NET ASSET VALUE | (2.45 | ) | 8.41 | 2.88 | 1.91 | 0.33 | 5.62 | |||||||||||||||||
| NET ASSET VALUE, END OF PERIOD | $ | 43.54 | $ | 45.99 | $ | 37.58 | $ | 34.70 | $ | 32.79 | $ | 32.46 | ||||||||||||
| TOTAL RETURN(c) | (4.73 | )% | 23.65 | % | 9.75 | % | 7.49 | % | 2.16 | % | 22.08 | % | ||||||||||||
| RATIOS/SUPPLEMENTAL DATA: | ||||||||||||||||||||||||
| Net assets, end of period (000s) | $ | 35,924 | $ | 51,735 | $ | 71,400 | $ | 126,662 | $ | 152,464 | $ | 40,576 | ||||||||||||
| Ratio of expenses to average net assets | 0.52 | %(d) | 0.52 | % | 0.52 | % | 0.52 | % | 0.52 | % | 0.52 | % | ||||||||||||
| Ratio of net investment income to average net assets | 1.43 | %(d) | 0.97 | % | 1.34 | % | 1.46 | % | 1.30 | % | 1.05 | % | ||||||||||||
| Portfolio turnover rate(e) | 168 | % | 5 | % | 99 | % | 98 | % | 152 | % | 86 | % | ||||||||||||
| (a) | Based on average shares outstanding during the period. |
| (b) | Net realized and unrealized gain on investments per share does not correlate to the aggregate of the net realized and unrealized gain/(loss) in the Statements of Operations for the period(s) presented, primarily due to the timing of the sales and repurchases of the Fund's shares in relation to the fluctuating market values for the Fund's portfolio. |
| (c) | Total return is calculated assuming an initial investment made at the net asset value at the beginning of the period and the redemption at the net asset value on the last day of the period and assuming all distributions are reinvested at the actual reinvestment prices. Total return calculated for a period of less than one year is not annualized. |
| (d) | Annualized. |
| (e) | Portfolio turnover for periods less than one year are not annualized and does not include securities received or delivered from processing creations or redemptions in-kind. |
See Notes to Financial Statements.
28 | May 31, 2022
RiverFront Strategic Income Fund
| Financial Highlights | For a share outstanding throughout the periods presented |
| For the Six Months Ended May 31, 2022 (Unaudited) | For the Year Ended November 30, 2021 | For the Year Ended November 30, 2020 | For the Year Ended November 30, 2019 | For the Year Ended November 30, 2018 | For the Year Ended November 30, 2017 | |||||||||||||||||||
| NET ASSET VALUE, BEGINNING OF PERIOD | $ | 24.53 | $ | 24.79 | $ | 24.69 | $ | 24.27 | $ | 25.21 | $ | 25.02 | ||||||||||||
| INCOME/(LOSS) FROM INVESTMENT OPERATIONS: | ||||||||||||||||||||||||
| Net investment income(a) | 0.24 | 0.55 | 0.81 | 0.94 | 1.06 | 1.11 | ||||||||||||||||||
| Net realized and unrealized gain/(loss) | (1.15 | ) | (0.18 | ) | 0.13 | (b) | 0.48 | (0.92 | ) | 0.19 | ||||||||||||||
| Total from investment operations | (0.91 | ) | 0.37 | 0.94 | 1.42 | 0.14 | 1.30 | |||||||||||||||||
| DISTRIBUTIONS: | ||||||||||||||||||||||||
| From net investment income | (0.29 | ) | (0.63 | ) | (0.84 | ) | (1.00 | ) | (1.08 | ) | (1.11 | ) | ||||||||||||
| Total distributions | (0.29 | ) | (0.63 | ) | (0.84 | ) | (1.00 | ) | (1.08 | ) | (1.11 | ) | ||||||||||||
| NET INCREASE/(DECREASE) IN NET ASSET VALUE | (1.20 | ) | (0.26 | ) | 0.10 | 0.42 | (0.94 | ) | 0.19 | |||||||||||||||
| NET ASSET VALUE, END OF PERIOD | $ | 23.33 | $ | 24.53 | $ | 24.79 | $ | 24.69 | $ | 24.27 | $ | 25.21 | ||||||||||||
| TOTAL RETURN(c) | (3.74 | )% | 1.52 | % | 3.95 | % | 5.96 | % | 0.57 | % | 5.29 | % | ||||||||||||
| RATIOS/SUPPLEMENTAL DATA: | ||||||||||||||||||||||||
| Net assets, end of period (000s) | $ | 130,643 | $ | 142,893 | $ | 118,984 | $ | 167,889 | $ | 152,880 | $ | 337,769 | ||||||||||||
| Ratio of expenses excluding waiver/reimbursement to average net assets | 0.46 | %(d) | 0.46 | % | 0.46 | % | 0.46 | % | 0.46 | % | 0.46 | % | ||||||||||||
| Ratio of expenses including waiver/reimbursement to average net assets | 0.46 | %(d) | 0.46 | % | 0.46 | % | 0.46 | % | 0.17 | %(e) | 0.16 | %(f) | ||||||||||||
| Ratio of net investment income including expenses waiver/reimbursement to average net assets | 2.05 | %(d) | 2.23 | % | 3.32 | % | 3.83 | % | 4.31 | % | 4.41 | % | ||||||||||||
| Portfolio turnover rate(g) | 25 | % | 50 | % | 54 | % | 44 | % | 35 | % | 32 | % | ||||||||||||
| (a) | Based on average shares outstanding during the period. |
| (b) | Net realized and unrealized gain on investments per share does not correlate to the aggregate of the net realized and unrealized gain/(loss) in the Statements of Operations for the period(s) presented, primarily due to the timing of the sales and repurchases of the Fund's shares in relation to the fluctuating market values for the Fund's portfolio. |
| (c) | Total return is calculated assuming an initial investment made at the net asset value at the beginning of the period and the redemption at the net asset value on the last day of the period and assuming all distributions are reinvested at the actual reinvestment prices. Total return calculated for a period of less than one year is not annualized. |
| (d) | Annualized. |
| (e) | Effective November 1, 2018, the Fund’s management fee consists of a fee of 0.11% paid to the Fund’s investment adviser and a fee of 0.35% paid to the Fund’s sub-adviser. The Fund’s sub-adviser ceased its voluntary waiver effective November 1, 2018. |
| (f) | Effective July 1, 2016, the Fund’s management fee consists of a fee of 0.16% paid to the Fund’s investment adviser and a fee of 0.30% paid to the Fund’s sub-adviser. The Fund’s sub-adviser voluntarily waived all of its 0.30% annual sub-advisory fee payable by the Fund until November 1, 2018. |
| (g) | Portfolio turnover for periods less than one year are not annualized and does not include securities received or delivered from processing creations or redemptions in-kind. |
See Notes to Financial Statements.
29 | May 31, 2022
RiverFront ETFs
| Notes to Financial Statements | May 31, 2022 (Unaudited) |
| 1. | ORGANIZATION |
ALPS ETF Trust (the “Trust”), a Delaware statutory trust, is an open-end management investment company registered under the Investment Company Act of 1940, as amended (the “1940 Act”). As of May 31, 2022, the Trust consists of nineteen separate portfolios. Each portfolio represents a separate series of the Trust. This report pertains solely to the RiverFront Dynamic Core Income ETF, the RiverFront Dynamic US Dividend Advantage ETF, the RiverFront Dynamic US Flex-Cap ETF, and the RiverFront Strategic Income Fund (each a “Fund” and collectively, the “Funds”).
The investment objective of the RiverFront Dynamic Core Income ETF Fund is to seek total return, with an emphasis on income as the source of that total return. The Fund has elected to qualify as a diversified series of the Trust under the 1940 Act.
The investment objective of the RiverFront Dynamic US Dividend Advantage ETF Fund is to seek to provide capital appreciation and dividend income. The Fund has elected to qualify as a diversified series of the Trust under the 1940 Act.
The investment objective of the RiverFront Dynamic US Flex-Cap ETF Fund is to seek to provide capital appreciation. The Fund has elected to qualify as a diversified series of the Trust under the 1940 Act.
The investment objective of the RiverFront Strategic Income Fund is to seek total return, with an emphasis on income as the source of that total return. The Fund has elected to qualify as a diversified series of the Trust under the 1940 Act.
Each Fund’s Shares (“Shares”) are listed on the NYSE Arca, Inc. Each Fund issues and redeems Shares at net asset value (“NAV”) in blocks of 25,000 Shares (prior to October 1, 2021 in blocks of 50,000 Shares), each of which is called a “Creation Unit”. Creation Units are issued and redeemed principally in-kind for securities and/or cash. Except when aggregated in Creation Units, Shares are not redeemable securities of a Fund.
Pursuant to the Trust’s organizational documents, its Officers and Trustees are indemnified against certain liability arising out of the performance of their duties to the Trust. Additionally, in the normal course of business, the Trust enters into contracts with service providers that contain general indemnification clauses. The Trust’s maximum exposure under these arrangements is unknown, as this would involve future claims that may be made against the Trust that have not yet occurred.
2. SIGNIFICANT ACCOUNTING POLICIES
The following is a summary of significant accounting policies consistently followed by the Funds in the preparation of the financial statements. The accompanying financial statements were prepared in accordance with accounting principles generally accepted in the United States of America (“U.S. GAAP”). The preparation of financial statements in conformity with U.S. GAAP requires management to make certain estimates and assumptions that affect the reported amounts of assets and liabilities and disclosures of contingent assets and liabilities at the date of the financial statements and the reported amounts of revenue and expenses during the period. Actual results could differ from those estimates. Each Fund is considered an investment company under U.S. GAAP and follows the accounting and reporting guidance applicable to investment companies in the Financial Accounting Standards Board (“FASB”) Accounting Standards Codification Topic 946.
A. Portfolio Valuation
Each Fund’s NAV is determined daily, as of the close of regular trading on the New York Stock Exchange (the “NYSE”), normally 4:00 p.m. Eastern Time, on each day the NYSE is open for trading. The NAV is computed by dividing the value of all assets of each Fund (including accrued interest and dividends), less all liabilities (including accrued expenses and dividends declared but unpaid), by the total number of shares outstanding.
Portfolio securities listed on any exchange other than the NASDAQ Stock Market LLC (“NASDAQ”) are valued at the last sale price on the business day as of which such value is being determined. If there has been no sale on such day, the securities are valued at the mean of the most recent bid and ask prices on such day. Securities traded on the NASDAQ are valued at the NASDAQ Official Closing Price as determined by NASDAQ. Portfolio securities traded on more than one securities exchange are valued at the last sale price on the business day as of which such value is being determined at the close of the exchange representing the principal market for such securities. Portfolio securities traded in the over-the-counter market, but excluding securities traded on the NASDAQ, are valued at the last quoted sale price in such market.
Corporate bonds and United States government bonds are typically valued at the mean between the evaluated bid and ask prices formulated by an independent pricing service.
Each Fund’s investments are valued at market value or, in the absence of market value with respect to any portfolio securities, at fair value according to procedures adopted by the Trust’s Board of Trustees (the “Board”). When market quotations are not readily available or when events occur that make established valuation methods unreliable, securities of the Funds may be valued in good faith by or under the direction of the Board. These securities generally include, but are not limited to, restricted securities (securities which may not be publicly sold without registration under the Securities Act of 1933) for which a pricing service is unable to provide a market price; securities whose trading has been formally suspended; a security whose market price is not available from a pre-established primary pricing source or the pricing source is not willing to provide a price; a security with respect to which an event has occurred that is most likely to materially affect the value of the security after the market has closed but before the calculation of a Fund’s NAV or make it difficult or impossible to obtain a reliable market quotation; or a security whose price, as provided by the pricing service, does not reflect the security’s “fair value” due to the security being de-listed from a national exchange or the security’s primary trading market is temporarily closed at a time when, under normal conditions, it would be open. As a general principle, the current “fair value” of a security would be the amount which the owner might reasonably expect to receive from the sale on the applicable exchange or principal market. A variety of factors may be considered in determining the fair value of such securities.
30 | May 31, 2022
RiverFront ETFs
| Notes to Financial Statements | May 31, 2022 (Unaudited) |
B. Fair Value Measurements
Each Fund discloses the classification of its fair value measurements following a three-tier hierarchy based on the inputs used to measure fair value. Inputs refer broadly to the assumptions that market participants would use in pricing the asset or liability, including assumptions about risk. Inputs may be observable or unobservable. Observable inputs reflect the assumptions market participants would use in pricing the asset or liability that are developed based on market data obtained from sources independent of the reporting entity. Unobservable inputs reflect the reporting entity’s own assumptions about the assumptions market participants would use in pricing the asset or liability that are developed based on the best information available.
Valuation techniques used to value the Funds’ investments by major category are as follows:
Equity securities, including restricted securities, for which market quotations are readily available, are valued at the last reported sale price or official closing price as reported by a third party pricing vendor on the primary market or exchange on which they are traded and are categorized as Level 1 in the hierarchy. In the event there were no sales during the day or closing prices are not available, securities are valued at the mean of the most recent quoted bid and ask prices on such day and are generally categorized as Level 2 in the hierarchy. Investments in open-end mutual funds are valued at their closing NAV each business day and are categorized as Level 1 in the hierarchy.
Debt securities, including restricted securities, are valued based on evaluated prices received from third party pricing vendors or from brokers who make markets in such securities. For corporate bonds, pricing vendors utilize matrix pricing which considers yield or price of bonds of comparable quality, coupon, maturity and type as well as broker-supplied prices. When independent prices are unavailable or unreliable, debt securities may be valued utilizing pricing methodologies which consider similar factors that would be used by third party pricing vendors. Debt securities are generally categorized as Level 2 in the hierarchy but may be Level 3 depending on the circumstances. The RiverFront Dynamic Core Income ETF, the RiverFront Dynamic Unconstrained Income ETF, and the RiverFront Strategic Income Fund may invest a significant portion of their assets in below investment grade securities. The value of these securities can be more volatile due to changes in the credit quality of the issuer and is sensitive to changes in economic, market and regulatory conditions.
Changes in valuation techniques may result in transfers in or out of an assigned level within the disclosure hierarchy.
Various inputs are used in determining the value of each Fund’s investments as of the end of the reporting period. When inputs used fall into different levels of the fair value hierarchy, the level in the hierarchy within which the fair value measurement falls is determined based on the lowest level input that is significant to the fair value measurement in its entirety. The designated input levels are not necessarily an indication of the risk or liquidity associated with these investments.
These inputs are categorized in the following hierarchy under applicable financial accounting standards:
| Level 1 – | Unadjusted quoted prices in active markets for identical investments, unrestricted assets or liabilities that a Fund has the ability to access at the measurement date; |
| Level 2 – | Quoted prices which are not active, quoted prices for similar assets or liabilities in active markets or inputs other than quoted prices that are observable (either directly or indirectly) for substantially the full term of the asset or liability; and |
| Level 3 – | Significant unobservable prices or inputs (including the Fund’s own assumptions in determining the fair value of investments) where there is little or no market activity for the asset or liability at the measurement date. |
31 | May 31, 2022
RiverFront ETFs
| Notes to Financial Statements | May 31, 2022 (Unaudited) |
The following is a summary of the inputs used to value the Funds’ investments as of May 31, 2022:
RiverFront Dynamic Core Income ETF
| Investments in Securities at Value | Level 1 - Quoted and Unadjusted Prices | Level 2 - Other Significant Observable Inputs | Level 3 - Significant Unobservable Inputs | Total | ||||||||||||
| Corporate Bonds* | $ | – | $ | 52,981,428 | $ | – | $ | 52,981,428 | ||||||||
| Government Bonds* | – | 9,186,786 | – | 9,186,786 | ||||||||||||
| Short Term Investments | 15,637,713 | – | – | 15,637,713 | ||||||||||||
| Total | $ | 15,637,713 | $ | 62,168,214 | $ | – | $ | 77,805,927 | ||||||||
RiverFront Dynamic US Dividend Advantage ETF
| Investments in Securities at Value | Level 1 - Quoted and Unadjusted Prices | Level 2 - Other Significant Observable Inputs | Level 3 - Significant Unobservable Inputs | Total | ||||||||||||
| Common Stocks* | $ | 112,627,481 | $ | – | $ | – | $ | 112,627,481 | ||||||||
| Short Term Investments | 1,441,215 | – | – | 1,441,215 | ||||||||||||
| Total | $ | 114,068,696 | $ | – | $ | – | $ | 114,068,696 | ||||||||
RiverFront Dynamic US Flex-Cap ETF
| Investments in Securities at Value | Level 1 - Quoted and Unadjusted Prices | Level 2 - Other Significant Observable Inputs | Level 3 - Significant Unobservable Inputs | Total | ||||||||||||
| Common Stocks* | $ | 35,857,995 | $ | – | $ | – | $ | 35,857,995 | ||||||||
| Short Term Investments | 269,360 | – | – | 269,360 | ||||||||||||
| Total | $ | 36,127,355 | $ | – | $ | – | $ | 36,127,355 | ||||||||
RiverFront Strategic Income Fund
| Investments in Securities at Value | Level 1 - Quoted and Unadjusted Prices | Level 2 - Other Significant Observable Inputs | Level 3 - Significant Unobservable Inputs | Total | ||||||||||||
| Corporate Bonds* | $ | – | $ | 102,967,490 | $ | – | $ | 102,967,490 | ||||||||
| Government Bonds* | – | 4,996,095 | – | 4,996,095 | ||||||||||||
| Short Term Investments | 26,445,753 | – | – | 26,445,753 | ||||||||||||
| Total | $ | 26,445,753 | $ | 107,963,585 | $ | – | $ | 134,409,338 | ||||||||
| * | For a detailed sector breakdown, see the accompanying Schedule of Investments. |
The Funds did not have any securities that used significant unobservable inputs (Level 3) in determining fair value and there were no transfers into or out of Level 3 during the six months ended May 31, 2022.
C. Securities Transactions and Investment Income
Securities transactions are recorded as of the trade date. Realized gains and losses from securities transactions are recorded on the specific identification in accordance with GAAP. Dividend income and capital gains distributions, if any, are recorded on the ex-dividend date. Interest income, if any, is recorded on the accrual basis, including amortization of premiums and accretion of discounts.
D. Dividends and Distributions to Shareholders
Dividends from net investment income for each Fund, if any, are declared and paid monthly or as the Board may determine from time to time. Distributions of net realized capital gains earned by the Funds, if any, are distributed at least annually.
E. Federal Tax and Tax Basis Information
The timing and character of income and capital gain distributions are determined in accordance with income tax regulations, which may differ from U.S. GAAP. Reclassifications are made to the Funds’ capital accounts for permanent tax differences to reflect income and gains available for distribution (or available capital loss carryforwards) under income tax regulations. The amounts and characteristics of tax basis distributions and composition of distributable earnings/(accumulated losses) are finalized at fiscal year-end; accordingly, tax basis balances have not been determined as of May 31, 2022.
32 | May 31, 2022
RiverFront ETFs
| Notes to Financial Statements | May 31, 2022 (Unaudited) |
The tax character of the distributions paid during the fiscal year ended November 30, 2021 was as follows:
| Ordinary Income | Long-Term Capital Gain | Return of Capital | ||||||||||
| November 30, 2021 | ||||||||||||
| RiverFront Dynamic Core Income ETF | $ | 1,962,506 | $ | – | $ | – | ||||||
| RiverFront Dynamic US Dividend Advantage ETF | 1,936,954 | – | – | |||||||||
| RiverFront Dynamic US Flex-Cap ETF | 679,274 | – | – | |||||||||
| RiverFront Strategic Income Fund | 3,171,669 | – | – | |||||||||
The character of distributions made during the year may differ from its ultimate characterization for federal income tax purposes.
Under current law, capital losses maintain their character as short-term or long-term and are carried forward to the next tax year without expiration. As of November 30, 2021, the following amounts are available as carry forwards to the next tax year:
| Fund | Short-Term | Long-Term | ||||||
| RiverFront Dynamic US Dividend Advantage ETF | $ | 5,611,019 | $ | 11,582,063 | ||||
| RiverFront Dynamic US Flex-Cap ETF | 12,308,600 | 11,857,380 | ||||||
| RiverFront Strategic Income Fund | 7,097,858 | 2,743,833 | ||||||
As of May 31, 2022, the cost of investments for federal income tax purposes and accumulated net unrealized appreciation/(depreciation) on investments were as follows:
| RiverFront Dynamic Core Income ETF | RiverFront Dynamic US Dividend Advantage ETF | RiverFront Dynamic US Flex- Cap ETF | RiverFront Strategic Income Fund | |||||||||||||
| Gross appreciation (excess of value over tax cost) | $ | 78,828 | $ | 17,459,471 | $ | 5,117,276 | $ | 32,539 | ||||||||
| Gross depreciation (excess of tax cost over value) | (4,426,380 | ) | (4,066,152 | ) | (2,227,160 | ) | (5,538,202 | ) | ||||||||
| Net unrealized appreciation/(depreciation) | (4,347,552 | ) | 13,393,319 | 2,890,116 | (5,505,663 | ) | ||||||||||
| Cost of investments for income tax purposes | $ | 82,153,479 | $ | 100,675,377 | $ | 33,237,239 | $ | 139,915,001 | ||||||||
The differences between book-basis and tax-basis are primarily due to the deferral of losses from wash sales and difference between premium amortization due to Accounting Standards Update 2017-08. In addition, certain tax cost basis adjustments are finalized at fiscal year-end and therefore have not been determined as of May 31, 2022.
F. Income Taxes
No provision for income taxes is included in the accompanying financial statements, as each Fund intends to distribute to shareholders all taxable investment income and realized gains and otherwise comply with Subchapter M of the Internal Revenue Code of 1986, as amended, applicable to regulated investment companies. Each Fund evaluates tax positions taken (or expected to be taken) in the course of preparing the Funds’ tax returns to determine whether these positions meet a “more-likely-than-not” standard that, based on the technical merits, have a more than fifty percent likelihood of being sustained by a taxing authority upon examination. A tax position that meets the “more-likely-than-not” recognition threshold is measured to determine the amount of benefit to recognize in the financial statements.
As of and during the six months ended May 31, 2022, the Funds did not have a liability for any unrecognized tax benefits. Each Fund files U.S. federal, state, and local tax returns as required. Each Fund’s tax returns are subject to examination by the relevant tax authorities until expiration of the applicable statute of limitations, which is generally three years after the filing of the tax return, but may extend to four years in certain jurisdictions. Tax returns for open years have incorporated no uncertain tax positions that require a provision for income taxes.
In addition, certain tax cost basis adjustments are finalized at fiscal year-end and therefore have not been determined as of May 31, 2022.
33 | May 31, 2022
RiverFront ETFs
| Notes to Financial Statements | May 31, 2022 (Unaudited) |
G. Lending of Portfolio Securities
The RiverFront Dynamic US Dividend Advantage ETF and the RiverFront Dynamic US Flex-Cap ETF have entered into a securities lending agreement with State Street Bank & Trust Co. (“SSB”), the Funds’ lending agent. Each Fund may lend its portfolio securities only to borrowers that are approved by SSB. Each Fund will limit such lending to not more than 33 1/3% of the value of its total assets. Each Fund’s securities held at SSB as custodian shall be available to be lent except those securities the Fund or ALPS Advisors, Inc. specifically identifies in writing as not being available for lending. The borrower pledges and maintains with the Fund collateral consisting of cash (U.S. Dollars only), securities issued or guaranteed by the U.S. government or its agencies or instrumentalities, and cash equivalents (including irrevocable bank letters of credit) issued by a person other than the borrower or an affiliate of the borrower. The initial collateral received by each Fund is required to have a value of no less than 102% of the market value of the loaned securities for U.S equity securities and a value of no less than 105% of the market value for non-U.S. equity securities. The collateral is maintained thereafter, at a market value equal to not less than 102% of the current value of the U.S. equity securities on loan and not less than 105% of the current value of the non-U.S. equity securities on loan. The market value of the loaned securities is determined at the close of each business day and any additional required collateral is delivered to each Fund on the next business day. During the term of the loan, each Fund is entitled to all distributions made on or in respect of the loaned securities. Loans of securities are terminable at any time and the borrower, after notice, is required to return borrowed securities within the customary time period for settlement of securities transactions.
Any cash collateral received is reinvested in a money market fund managed by SSB as disclosed in the Fund’s Schedule of Investments and is reflected in the Statements of Assets and Liabilities as a payable for collateral upon return of securities loaned. Non-cash collateral, in the form of securities issued or guaranteed by the U.S. government or its agencies or instrumentalities, is not disclosed in the Fund’s Statements of Assets and Liabilities as it is held by the lending agent on behalf of the Fund, and the Fund does not have the ability to re-hypothecate these securities. Income earned by the Fund from securities lending activity is disclosed in the Statement of Operations.
The following is a summary of the Funds' securities lending agreement and related cash and non-cash collateral received as of May 31, 2022:
| Fund | Market Value of Securities on Loan | Cash Collateral Received | Non-Cash Collateral Received | Total Collateral Received
| ||||||||||||
| RiverFront Dynamic US Dividend Advantage ETF | $ | 2,014,357 | $ | 1,291,293 | $ | 783,883 | $ | 2,075,176 | ||||||||
| RiverFront Dynamic US Flex-Cap ETF | 451,149 | 241,204 | 234,565 | 475,769 | ||||||||||||
The risks of securities lending include the risk that the borrower may not provide additional collateral when required or may not return the securities when due. To mitigate these risks, the Funds benefit from a borrower default indemnity provided by SSB. SSB’s indemnity allows for full replacement of securities lent wherein SSB will purchase the unreturned loaned securities on the open market by applying the proceeds of the collateral, or to the extent such proceeds are insufficient or the collateral is unavailable, SSB will purchase the unreturned loan securities at SSB’s expense. However, the Funds could suffer a loss if the value of the investments purchased with cash collateral falls below the value of the cash collateral received. As of May 31, 2022, Riverfront Dynamic Core Income Fund ETF and the Riverfront Strategic Income Fund did not have any securities on loan.
The following table reflects a breakdown of transactions accounted for as secured borrowings, the gross obligation by the type of collateral pledged or securities loaned, and the remaining contractual maturity of those transactions as of May 31, 2022:
| RiverFront Dynamic US Dividend Advantage ETF | Remaining contractual maturity of the agreements |
| Securities Lending Transactions | Overnight & Continuous | Up to 30 days | 30-90 days | Greater than 90 days | Total | |||||||||||||||
| Common Stocks | $ | 1,291,293 | $ | – | $ | – | $ | – | $ | 1,291,293 | ||||||||||
| Total Borrowings | 1,291,293 | |||||||||||||||||||
| Gross amount of recognized liabilities for securities lending (collateral received) | $ | 1,291,293 | ||||||||||||||||||
| RiverFront Dynamic US Flex-Cap ETF | Remaining contractual maturity of the agreements |
| Securities Lending Transactions | Overnight & Continuous | Up to 30 days | 30-90 days | Greater than 90 days | Total | |||||||||||||||
| Common Stocks | $ | 241,204 | $ | – | $ | – | $ | – | $ | 241,204 | ||||||||||
| Total Borrowings | 241,204 | |||||||||||||||||||
| Gross amount of recognized liabilities for securities lending (collateral received) | $ | 241,204 | ||||||||||||||||||
34 | May 31, 2022
RiverFront ETFs
| Notes to Financial Statements | May 31, 2022 (Unaudited) |
3. INVESTMENT ADVISORY FEE AND OTHER AFFILIATED TRANSACTIONS
ALPS Advisors, Inc. (the “Adviser”) serves as the Funds’ investment adviser pursuant to an Investment Advisory Agreement with the Trust on behalf of each Fund (the “Advisory Agreement”). Pursuant to the Advisory Agreement, each Fund pays the Adviser an annual management fee for the services and facilities it provides, payable on a monthly basis as a percentage of the relevant Fund’s average daily net assets as set out below:
| Fund | Advisory Fee |
| RiverFront Dynamic Core Income ETF | 0.51%(a) |
| RiverFront Dynamic US Dividend Advantage ETF | 0.52%(b) |
| RiverFront Dynamic US Flex-Cap ETF | 0.52%(b) |
| RiverFront Strategic Income Fund | 0.11% |
| (a) | The unitary advisory fee as a percentage of net assets is subject to the following breakpoints: (i) 0.51% for average net assets up to $600 million, (ii) 0.48% for average net assets equal to or greater than $600 million. |
| (b) | The unitary advisory fee as a percentage of net assets is subject to the following breakpoints: (i) 0.52% for average net assets up to $600 million, (ii) 0.49% for average net assets equal to or greater than $600 million. |
Out of the unitary management fee, the Adviser pays substantially all expenses of each Fund, including the cost of transfer agency, custody, fund administration, legal, audit, trustees and other services, except for interest expenses, distribution fees or expenses, brokerage expenses, taxes and extraordinary expenses not incurred in the ordinary course of each Fund's business. The Adviser’s unitary management fee is designed to pay substantially all of each Fund's expenses and to compensate the Adviser for providing services for each Fund.
RiverFront Investment Group, LLC (the “Sub-Adviser”) serves as each Fund’s sub-adviser pursuant to a sub-advisory agreement with the Trust (the ‘‘Sub-Advisory Agreement’’). Pursuant to the Sub-Advisory Agreement, the Adviser pays the Sub-Adviser a sub-advisory fee out of the Adviser’s advisory fee for the services it provides besides RiverFront Strategic Income Fund, in which the Fund directly pays the Sub-Adviser. The fee is payable on a monthly basis at the annual rate of the relevant Fund’s average daily net assets as set out below:
| Fund | Sub-Advisory Fee |
| RiverFront Dynamic Core Income ETF | 0.35% |
| RiverFront Dynamic US Dividend Advantage ETF | 0.35% |
| RiverFront Dynamic US Flex-Cap ETF | 0.35% |
| RiverFront Strategic Income Fund | 0.35% |
ALPS Fund Services, Inc., an affiliate of the Adviser, is the administrator of the Funds.
Prior to February 16, 2022, each Trustee received (1) a quarterly retainer of $10,000, (2) a per meeting fee of $5,000, (3) $1,500 for any special meeting held outside of a regularly scheduled board meeting, and (4) reimbursement for all reasonable out-of-pocket expenses relating to attendance at meetings. In addition, the Chairman of the Board and Chairman of the Audit Committee each received a quarterly retainer of $2,000, in connection with their respective roles. Effective February 16, 2022, each Trustee receives (1) a quarterly retainer of $20,000, (2) a per meeting fee of $10,000, (3) $2,500 for any special meeting held outside of a regularly scheduled board meeting, and (4) reimbursement for all reasonable out-of-pocket expenses relating to attendance at meetings. In addition, the Chairman of the Board receives a quarterly retainer of $5,000, the Chairman of the Audit Committee receives a quarterly retainer of $3,000, and the Chairman of the Nominating & Governance Committee receives a quarterly retainer of $2,000, each in connection with their respective roles.
4. PURCHASES AND SALES OF SECURITIES
For the six months ended May 31, 2022, the cost of purchases and proceeds from sales of investment securities, excluding in-kind transactions and short-term investments, were as follows:
| Fund | Purchases | Sales | ||||||
| RiverFront Dynamic Core Income ETF | $ | 24,164,135 | $ | 25,148,325 | ||||
| RiverFront Dynamic US Dividend Advantage ETF | 69,421,614 | 70,595,035 | ||||||
| RiverFront Dynamic US Flex-Cap ETF | 34,186,081 | 34,098,302 | ||||||
| RiverFront Strategic Income Fund | 7,615,295 | 10,461,045 | ||||||
35 | May 31, 2022
RiverFront ETFs
| Notes to Financial Statements | May 31, 2022 (Unaudited) |
For the six months ended May 31, 2022, the cost of U.S. Government security purchases and proceeds from U.S. Government security sales were as follows:
| Fund | Purchases | Sales | ||||||
| RiverFront Dynamic Core Income ETF | $ | – | $ | 12,632,780 | ||||
| RiverFront Strategic Income Fund | 6,824,566 | 9,054,157 | ||||||
For the six months ended May 31, 2022, the cost of in-kind purchases and proceeds from in-kind sales were as follows:
| Fund | Purchases | Sales | ||||||
| RiverFront Dynamic Core Income ETF | $ | 553,993 | $ | 20,807,017 | ||||
| RiverFront Dynamic US Dividend Advantage ETF | 27,084,333 | 50,577,677 | ||||||
| RiverFront Dynamic US Flex-Cap ETF | 14,496,414 | 28,241,956 | ||||||
| RiverFront Strategic Income Fund | 1,800,743 | 6,925,870 | ||||||
For the six months ended May 31, 2022, the in-kind net realized gains/(losses) were as follows:
| Fund | Net Realized Gain/(Loss) | |||
| RiverFront Dynamic Core Income ETF | $ | (104,187 | ) | |
| RiverFront Dynamic US Dividend Advantage ETF | 17,684,323 | |||
| RiverFront Dynamic US Flex-Cap ETF | 7,440,304 | |||
| RiverFront Strategic Income Fund | (319,583 | ) | ||
Gains on in-kind transactions are not considered taxable for federal income tax purposes and losses on in-kind transactions are also not deductible for tax purposes.
5. CAPITAL SHARE TRANSACTIONS
Shares are created and redeemed by each Fund only in Creation Unit size aggregations of 25,000 Shares. Only broker-dealers or large institutional investors with creation and redemption agreements called Authorized Participants (“AP”) are permitted to purchase or redeem Creation Units from each Fund. Such transactions are generally permitted on an in-kind basis, with a balancing cash component to equate the transaction to the NAV per unit of each Fund on the transaction date. Cash may be substituted equivalent to the value of certain securities generally when they are not available in sufficient quantity for delivery, not eligible for trading by the AP or as a result of other market circumstances.
6. MARKET RISK
The Funds are subject to investment and operational risks associated with financial, economic and other global market developments and disruptions, including the recent spread of an infectious respiratory illness caused by a novel strain of coronavirus (known as COVID-19), which can negatively impact the securities markets and cause each Fund to lose value. Securities in the Fund’s portfolio may underperform in comparison to securities in general financial markets, a particular financial market or other asset classes due to a number of factors, including inflation (or expectations for inflation), deflation (or expectations for deflation), interest rates, global demand for particular products or resources, market instability, debt crises and downgrades, embargoes, tariffs, sanctions and other trade barriers, regulatory events, other governmental trade or market control programs and related geopolitical events. In addition, the value of the Fund’s investments may be negatively affected by the occurrence of global events such as war, terrorism, environmental disasters, natural disasters or events, country instability, and infectious disease epidemics or pandemics.
The spread of COVID-19 has caused volatility, severe market dislocations and liquidity constraints in many markets, including markets for the securities each Fund holds, and may adversely affect each Fund’s investments and operations. The transmission of COVID-19 and efforts to contain its spread have resulted in travel restrictions and disruptions, closed international borders, enhanced health screenings at ports of entry and elsewhere, disruption of and delays in healthcare service preparation and delivery, quarantines, event and service cancellations or interruptions, disruptions to business operations and supply chains, and a reduction in consumer and business spending, as well as general concern and uncertainty that has negatively affected the economy. These disruptions have led to instability in the market place and the jobs market. The impact of COVID-19 could adversely affect the economies of many nations or the entire global economy, the financial well-being and performance of individual issuers, borrowers and sectors and the health of the markets generally in potentially significant and unforeseen ways.
36 | May 31, 2022
RiverFront ETFs
| Notes to Financial Statements | May 31, 2022 (Unaudited) |
The foregoing could lead to a significant economic downturn or recession, increased market volatility, a greater number of market closures, higher default rates and adverse effects on the values and liquidity of each Fund’s securities or other assets. Such impacts may adversely affect the performance of the Funds.
7. SUBSEQUENT EVENTS
Effective as of the close of business on March 31, 2022, Deloitte & Touche LLP (“Deloitte”) resigned as the independent registered public accounting firm for the Funds. The report of Deloitte on the Funds’ financial statements as of and for the fiscal years or periods ended November 30, 2021 and November 30, 2020 did not contain an adverse opinion or a disclaimer of opinion, and was not qualified or modified as to uncertainties, audit scope or accounting principles. During the Funds’ fiscal year or period ended November 30, 2021 and November 30, 2020, and through March 31, 2022, there were no disagreements between the Funds and Deloitte on any matter of accounting principles or practices, financial statement disclosure or auditing scope or procedure, which disagreements, if not resolved to the satisfaction of Deloitte, would have caused it to make reference to the subject matter of the disagreements in its report on the financial statements of the Funds for such year or period. During the Funds’ fiscal years or periods ended November 30, 2021 and November 30, 2020, there were no “reportable events” (as defined in Item 304(a)(1)(v) of Regulation S-K under the Securities Exchange Act of 1934, as amended (the “Exchange Act”)).
During each Fund’s fiscal year or period ended November 30, 2021 and November 30, 2020, and during the subsequent interim period through March 31, 2022, neither the Funds, nor anyone on their behalf, consulted with Deloitte, on behalf of the Funds, regarding any matter that was either the subject of a “disagreement,” as defined in Item 304(a)(1)(iv) of Regulation S-K under the Securities Exchange Act of 1934, as amended (the “Exchange Act”), and the instructions thereto, or a “reportable event,” as defined in Item 304(a)(1)(v) of Regulation S-K under the Exchange Act.
On June 21, 2022, upon the recommendation of the Funds’ Audit Committee, the Board of Trustees of the Funds approved the engagement of BBD, LLP (“BBD”) as the independent registered public accounting firm for each Fund for the fiscal year ending November 30, 2022. The Board and its Audit Committee considered the engagement of BBD in connection with the resignation of the Funds’ former independent registered accounting firm on March 31, 2022.
37 | May 31, 2022
RiverFront ETFs
| Additional Information | May 31, 2022 (Unaudited) |
PROXY VOTING RECORDS, POLICIES AND PROCEDURES
Information regarding how each Fund voted proxies relating to portfolio securities during the most recent 12-month period ended June 30 and a description of the Funds’ proxy voting policies and procedures used in determining how to vote for proxies are available without charge on the SEC’s website at www.sec.gov and upon request, by calling (toll-free) 1-866-759-5679.
PORTFOLIO HOLDINGS
The Fund files a complete schedule of portfolio holdings with the U.S. Securities and Exchange Commission (“SEC”) for the first and third quarters of each fiscal year on Form N-PORT within 60 days after the end of the period. Copies of the Fund’s Form N-PORT are available without a charge, upon request, by contacting the Fund at 1-866-759-5679 and on the SEC’s website at https://www.sec.gov.
TAX INFORMATION
The Funds designate the following as a percentage of taxable ordinary income distributions, or up to the maximum amount allowable, for the calendar year ended December 31, 2021:
| Qualified Dividend Income | Dividend Received Deduction | |
| RiverFront Dynamic Core Income ETF | 0.00% | 0.00% |
| RiverFront Dynamic US Dividend Advantage ETF | 100.00% | 97.31% |
| RiverFront Dynamic US Flex-Cap ETF | 100.00% | 100.00% |
| RiverFront Strategic Income Fund | 0.00% | 0.00% |
In early 2022, if applicable, shareholders of record received this information for the distributions paid to them by the Funds during the calendar year 2021 via Form 1099. The Funds will notify shareholders in early 2023 of amounts paid to them by the Funds, if any, during the calendar year 2022.
38 | May 31, 2022
RiverFront ETFs
| Liquidity Risk Management Program | May 31, 2022 (Unaudited) |
In compliance with the Securities and Exchange Commission’s liquidity risk management rule (the “Liquidity Rule”), the ALPS ETF Trust (the “Trust”) has established a liquidity risk management program (the “Program”) to govern the Trust’s approach to managing liquidity risk for each series of the Trust (each a “Fund”). The Program is overseen by the Liquidity Committee (the “Committee”), a committee comprised of representatives of the Trust’s investment adviser, ALPS Advisors, Inc. The Trust’s Board of Trustees (the “Board”) has approved the designation of the Committee to oversee the Program.
The Program’s principal objectives include supporting each Fund’s compliance with limits on investments in illiquid assets and assessing and managing the risk that a Fund will be unable to meet its redemption obligations without significant dilution of remaining investors’ interests in the Fund. The Program includes a number of elements that support the management and assessment of liquidity risk, including an annual assessment of factors that influence a Fund’s liquidity and, for Funds that are not “In-Kind ETFs,” the periodic classification and re-classification of such Fund’s investments into groupings that reflect the Committee’s assessment of their liquidity under current market conditions.
At a meeting of the Board held on March 7, 2022, the Trustees received a report from the Committee regarding the design and operational effectiveness of the Program for the period January 1, 2021 through December 31, 2021 (the “Period”). The Committee determined, and reported to the Board, that the Program has been operating effectively to assess and manage each Fund’s liquidity risk and has been and continues to be adequately and effectively implemented to monitor and (as applicable) respond to the Funds’ liquidity developments.
The Committee reported that during the period covered by the report, there were no liquidity events that impacted the Funds or their ability to timely meet redemptions without dilution to existing shareholders. The report also discussed notable events affecting liquidity over the Period, including extended market holidays and closures in certain countries. Among other things, the Committee’s report noted that no Fund is required to have a highly liquid investment minimum based either on its status as an In-Kind ETF or on its ability to rely on another exemption under the Liquidity Rule. The Committee’s report further noted that no material changes have been made to the Program since its implementation.
39 | May 31, 2022

| (b) | Not applicable |
| Item 2. | Code of Ethics. |
Not Applicable to this Report.
| Item 3. | Audit Committee Financial Expert. |
Not Applicable to this Report.
| Item 4. | Principal Accountant Fees and Services. |
Not Applicable to this Report.
| Item 5. | Audit Committee of Listed Registrants. |
Not applicable to Registrant.
| Item 6. | Investments. |
(a) Schedule of Investments is included as part of the Report to Stockholders filed under Item 1 of this Form N-CSR.
(b) Not applicable
| Item 7. | Disclosure of Proxy Voting Policies and Procedures for Closed-End Management Investment Companies. |
Not applicable to Registrant.
| Item 8. | Portfolio Managers of Closed-End Management Investment Companies. |
Not applicable to Registrant.
| Item 9. | Purchases of Equity Securities by Closed-End Management Investment Company and Affiliated Purchasers. |
Not applicable to Registrant.
| Item 10. | Submission of Matters to a Vote of Security Holders. |
No material changes to the procedures by which the shareholders may recommend nominees to the Registrant’s Board of Trustees have been implemented after the Registrant’s last provided disclosure in response to the requirements of Item 407(c)(2)(iv) of Regulation S-K (17 CFR 229.407) (as required by Item 22(b)(15) of Schedule 14A (17 CFR 240.14a-101)), or this Item.
| Item 11. | Controls and Procedures. |
| (a) | The Registrant’s principal executive officer and principal financial officer have concluded that the Registrant’s disclosure controls and procedures (as defined in Rule 30a-3(c) under the Investment Company Act of 1940, as amended) are effective based on their evaluation of these controls and procedures as of a date within 90 days of the filing date of this report. |
| (b) | There was no change in the Registrant's internal control over financial reporting (as defined in Rule 30a-3(d) under the Investment Company Act of 1940, as amended) that occurred during the period covered by this report that has materially affected, or is reasonably likely to materially affect, the Registrant's internal control over financial reporting. |
| Item 12. | Disclosure of Securities Lending Activities for Closed-End Management Investment Companies. |
Not applicable.
| Item 13. | Exhibits. |
| (a)(1) | Not applicable to this Report. |
| (a)(2) | The certifications required by Rule 30a-2(a) of the Investment Company Act of 1940, as amended, and Section 302 of the Sarbanes-Oxley Act of 2002 are attached hereto as Exhibit 99.Cert. |
| (a)(3) | Not applicable. |
| (a)(4) |
(i) Effective as of the close of business on March 31, 2022, Deloitte & Touche LLP (“Deloitte”) resigned as the independent registered public accounting firm for the Funds. The report of Deloitte on the Funds’ financial statements as of and for the fiscal years or periods ended November 30, 2021 and November 30, 2020 did not contain an adverse opinion or a disclaimer of opinion, and was not qualified or modified as to uncertainties, audit scope or accounting principles. During the Funds’ fiscal year or period ended November 30, 2021 and November 30, 2020, and through March 31, 2022, there were no disagreements between the Funds and Deloitte on any matter of accounting principles or practices, financial statement disclosure or auditing scope or procedure, which disagreements, if not resolved to the satisfaction of Deloitte, would have caused it to make reference to the subject matter of the disagreements in its report on the financial statements of the Funds for such year or period. During the Funds’ fiscal years or periods ended November 30, 2021 and November 30, 2020, there were no “reportable events” (as defined in Item 304(a)(1)(v) of Regulation S-K under the Securities Exchange Act of 1934, as amended (the “Exchange Act”)).
During each Fund’s fiscal year or period ended November 30, 2021 and November 30, 2020, and the subsequent interim period through March 31, 2022, neither the Funds, nor anyone on their behalf, consulted with Deloitte, on behalf of the Funds, regarding any matter that was either the subject of a “disagreement,” as defined in Item 304(a)(1)(iv) of Regulation S-K under the Securities Exchange Act of 1934, as amended (the “Exchange Act”), and the instructions thereto, or a “reportable event,” as defined in Item 304(a)(1)(v) of Regulation S-K under the Exchange Act.
On June 21, 2022, upon the recommendation of the Funds’ Audit Committee, the Board of Trustees of the Funds approved the engagement of BBD, LLP (“BBD”) as the independent registered public accounting firm for each Fund for the fiscal year ending November 30, 2022. The Board and its Audit Committee considered the engagement of BBD in connection with the resignation of the Funds’ former independent registered accounting firm on March 31, 2022. |
-3-
SIGNATURES
Pursuant to the requirements of the Securities Exchange Act of 1934 and the Investment Company Act of 1940, the Registrant has duly caused this report to be signed on its behalf by the undersigned, thereunto duly authorized.
ALPS ETF TRUST
| By: | /s/ Laton Spahr | |
| Laton Spahr (Principal Executive Officer) | ||
| President | ||
| Date: | August 5, 2022 |
Pursuant to the requirements of the Securities Exchange Act of 1934 and the Investment Company Act of 1940, this report has been signed below by the following persons on behalf of the Registrant and in the capacities and on the dates indicated.
| By: | /s/ Laton Spahr | |
| Laton Spahr (Principal Executive Officer) | ||
| President | ||
| Date: | August 5, 2022 | |
| By: | /s/ Kathryn Burns | |
| Kathryn Burns (Principal Financial Officer) | ||
| Treasurer | ||
| Date: | August 5, 2022 |
-4-