united states
securities and exchange commission
washington, d.c. 20549
form n-csr
certified shareholder report of registered management
investment companies
Investment Company Act file number 811-22153
Dunham Funds
(Exact name of registrant as specified in charter)
10251 Vista Sorrento Pkwy, Ste. 200, San Diego, CA 92121
(Address of principal executive offices) (Zip code)
Richard Malinowski
Gemini Fund Services, LLC., 80Arkay Drive Hauppauge, NY 11788
(Name and address of agent for service)
Registrant's telephone number, including area code: 631-470-2619
Date of fiscal year end: 10/31
Date of reporting period:10/31/19
Item 1. Reports to Stockholders.
Beginning on January 1, 2021, as permitted by regulations adopted by the Securities and Exchange Commission, paper copies of the Dunham Funds’ shareholder reports like this one will no longer be sent by mail, unless you specifically request paper copies of the reports from the Dunham Funds or from your financial intermediary, such as a broker-dealer or bank. Instead, the reports will be made available on a website, and you will be notified by mail each time a report is posted and provided with a website link to access the report.
If you already elected to receive shareholder reports electronically, you will not be affected by this change and you need not take any action. You may elect to receive shareholder reports and other communications from the Dunham Funds electronically by calling (888)-3DUNHAM (338-6426) or contacting your financial intermediary.
You may elect to receive all future reports in paper free of charge. You can inform the Dunham Funds or your financial intermediary that you wish to continue receiving paper copies of your shareholder reports by calling (888)-3DUNHAM (338-6426) or contacting your financial intermediary. Your election to receive reports in paper will apply to all Dunham Funds held by you or through your financial intermediary.
| This Annual Report contains “forward-looking statements” within the meaning of the Private Securities Litigation Reform Act of 1995. Forward-looking statements also include those preceded by, followed by or that include the words “believes”, “expects”, “anticipates” or similar expressions. Such statements should be viewed with caution. Actual results or experience could differ materially from the forward-looking statements as a result of many factors. Each Fund makes no commitments to disclose any revisions to forward-looking statements, or any facts, events or circumstances after the date hereof that may bear upon forward-looking statements. In addition, prospective purchasers of the Funds should consider carefully the information set forth herein and the applicable fund’s prospectus. Other factors and assumptions not identified above may also have been involved in the derivation of these forward-looking statements, and the failure of these other assumptions to be realized may also cause actual results to differ materially from those projected. |
Dear Fellow Shareholders,
While the economic backdrop and company fundamentals generally did not waver during this fiscal year, rhetoric and headlines caused both equities and bonds to experience meaningful volatility. Whether the focus was on the Federal Reserve’s stance on monetary policy, a looming trade war with China, or the future of shale oil, the markets appeared to take note and responded fairly drastically. Over the 12-month period, investors that focused on the strength of the economy and the broadly positive earnings releases generally experienced a strong return regardless of their preference for bonds or equities. When considering these factors in broad strokes, U.S. bonds, as measured by the Bloomberg Barclays Aggregate Bond Index, increased 11.5 percent over the 12-month period, while U.S. equities, as measured by the S&P 500 Index, increased 14.3 percent. It is interesting that these results emerged despite persistent concerns during the period of an impending recession – clearly, the cooler heads prevailed.
This is not to say that all areas of the markets were capable of navigating the sea of headlines and end the fiscal year with such positive results. Some of the most precarious pockets of the equity and bond markets found this past fiscal year to be far less lucrative than their predominately blue-chip and investment-grade counterparts. Specifically, small cap stocks and the lowest quality tier of high-yield bonds each treaded into negative territory numerous times during the 12-month period. Small cap stocks, as measured by the Russell 2000 Index, managed a 4.9 percent return by the end of the fiscal year, despite battling between negative and positive status through early October. In the bottom rating tiers of the debt market, specifically bonds rated CCC and lower, measured by the BofA Merrill Lynch CCC and Lower Cash Pay High-Yield Index, positive performance was difficult to muster for most of the fiscal year. After briefly managing a positive fiscal year-to-date return in late-spring, these bonds with the highest estimated risk of default withered back into negative territory and eventually ended the fiscal year down 2.6 percent. While investors in general continually demand income, even the 12 percent yield offered by these lowest-rated bonds was not sufficient to attract enough capital to end the period with a positive return.
We are keenly aware of how it is often difficult to focus purely on the fundamental information as we comb through the deluge of headlines and “noise” that inundates our inboxes every day. As investors, you are the ultimate target of most of those fear-inducing diatribes. At Dunham, our focus will always be clarity of thought and consistency, especially in these turbulent markets, and we greatly appreciate the opportunity to provide that for each of you.
We thank you for your continued trust and the confidence you have placed in us. We take that trust very seriously and look forward to servicing your investment needs for years to come.
Sincerely,

Jeffrey A. Dunham
President
Dunham & Associates
October 31, 2019
1
| Dunham Floating Rate Bond Fund (Unaudited) |
| Message from the Sub-Adviser (Newfleet Asset Management, LLC) |
Asset Class Recap
Since the commencement of the fiscal year, interest rates generally declined, a trend that coincided with bank loans trailing lower. This is primarily attributable to investors using bank loans as a means to potentially hedge the adverse effects of a rising interest rate environment. Therefore, as rising rate fears have substantially subsided from 12 months ago, the bank loan market has generally seen bank loan principal values shrink. While LIBOR declined close to 66 basis points since the start of the fiscal year, the average yield on bank loans increased 69 basis points. This disparity helps to evidence how the reduction in bank loan principal value was in excess of the amount needed to maintain a similar yield. What may be even more interesting is that high-yield traditional bonds, as measured by the BofA Merrill Lynch High- Yield Bond Index, ended the fiscal year with an average yield only 12 basis points higher than the average bank loan. For context, the fiscal year started with the spread between traditional high- yield bonds and bank loans at 140 basis points. During the most recent fiscal quarter, bank loans declined 0.4 percent while traditional high-yield bonds increased 1.0 percent. When considering the full fiscal year, bank loans increased 2.6 percent while traditional high-yield bonds rose 8.4 percent.
Portfolio Review
Higher quality credit within the bank loan space has consistently out performed lower tier credit all year as repayments and less issuance shrinks the size of the quality cohort at a time when investors are seeking safety. At the same time, the increased supply of lower tier credit comes when investors are placing greater scrutiny on riskier transactions. These two correlated factors broadly helped the Fund, as the Sub- Adviser generally focuses on the higher-rated bank loans. The sector with the highest overweight in the Fund continued to be gaming and the largest underweights were to the information technology and financial services sectors. As bank loan prices on average declined and the yield slightly increased, the overall duration saw a slight decline. The average duration of the Fund ended the fiscal year at 0.35 years. This very small duration is primarily attributable to some traditional bonds that the Fund holds. Overall, those positions comprise less than 10 percent of the Fund assets.
Holdings Insights
While the vast majority of the bank loans in the Fund saw their values fluctuate by less than one percent during the decline of the final fiscal quarter, only a handful appreciated more than one percent and nearly one quarter of the bank loans saw valuations decline by more than one percent. This overstates the overall loss to the Fund, as these are simply price declines and do not include the positive impact of the accrued interest on those same bank loans. As the average coupon on the bank loans in the Fund was slightly higher than five percent, these slight price declines were generally offset by the positive contribution from the coupon. Some of the largest losses during the fiscal year came in the final months of the period. Bank loans that had some of the largest price declines included the Securus Technologies Adj% loan maturing in 2024 (BL2438150) (holding weight*: 0.07 percent), a communication solutions provider for prisons, the Fieldwood Energy Adj% loan maturing in 2023 (BL2684480) (holding weight*: 0.02 percent), one of the largest offshore oil operators in the Gulf of Mexico, and the McDermott International Adj% loan maturing in 2025 (BL2604710) (holding weight*: 0.35 percent), an energy-related engineering, procurement, construction and installation company. While the Securus, Fieldwood, and McDermott loans experienced price declines of 42.0 percent, 36.7 percent, and 36.6 percent, respectively, two of the positions comprised less than 0.1 percent of the Fund even when combined. In addition, amid some of these large sell-offs during the final fiscal quarter, the Sub-Adviser found opportunities to enter into loans related to these same companies. For example, the Sub- Adviser added the McDermott Technology Adj% loan maturing in 2021 (BL3199017) (holding weight*: 0.31 percent), the processing technologies arm of McDermott International. Since it was added near the end of the fiscal year, the loan value appreciated 4.0 percent.
In regard to positive contributors, one of the stronger performers was the 21st Century Oncology Adj% loan maturing in 2023 (BL2629725) (holding weight*: 0.07 percent), a cancer care service provider including radiation therapy and integrated cancer treatments. Although the loan’s value had slumped close to 9 percent between March and mid-May, the loan value surged nearly 14 percent during the second half of the fiscal year as it continued to make headway following emerging from bankruptcy in 2018. However, its small position size in the Fund resulted in it having a low impact on overall performance. Conversely, the Diversey Adj% loan maturing in 2024 (BL2482646) (holding weight*: 0.38 percent), a provider of cleaning and hygiene products, and the Bass Pro loan maturing in 2023 (BL2282806) (holding weight*: 0.47 percent), an owner and operator of outdoor recreation superstores, were more sizable positions in the Fund, so their total return increases of between 1 percent and 4 percent during the fiscal year were more impactful. Both loans were rattled in the first half of the fiscal year, dropping between 5 and 11 percent. However, between a partial rebound and coupons ranging between five and six percent, the bonds eked out positive contributions to the Fund for the fiscal year.
Sub-Adviser Outlook
Debt covenants have continued to become less and less restrictive, posing additional risks for bond investors as defaults eventually experience a meaning rise. While the Sub- Adviser generally sought to shift the Fund’s exposure away from the lower rated credit qualities to higher-rated loans, it is still concerned how an adverse event may ripple through the space. Different qualities are generally represented by different industry groups, such as a higher weighting of energy and retail bonds within the lowest credit tiers, which makes lateral shifts in credit quality more cumbersome. Overall, the Sub- Adviser is optimistic about the enhanced yield prospects within the bank loan market, but remains cautious that bank loans have been singularly labeled as a means to reduce the risk of rising interest rates and therefore is concerned with how a flat-to-lower rate outlook may affect bank loan investor sentiment.
| * | Holdings percentage(s) of total investments as of 10/31/2019. |
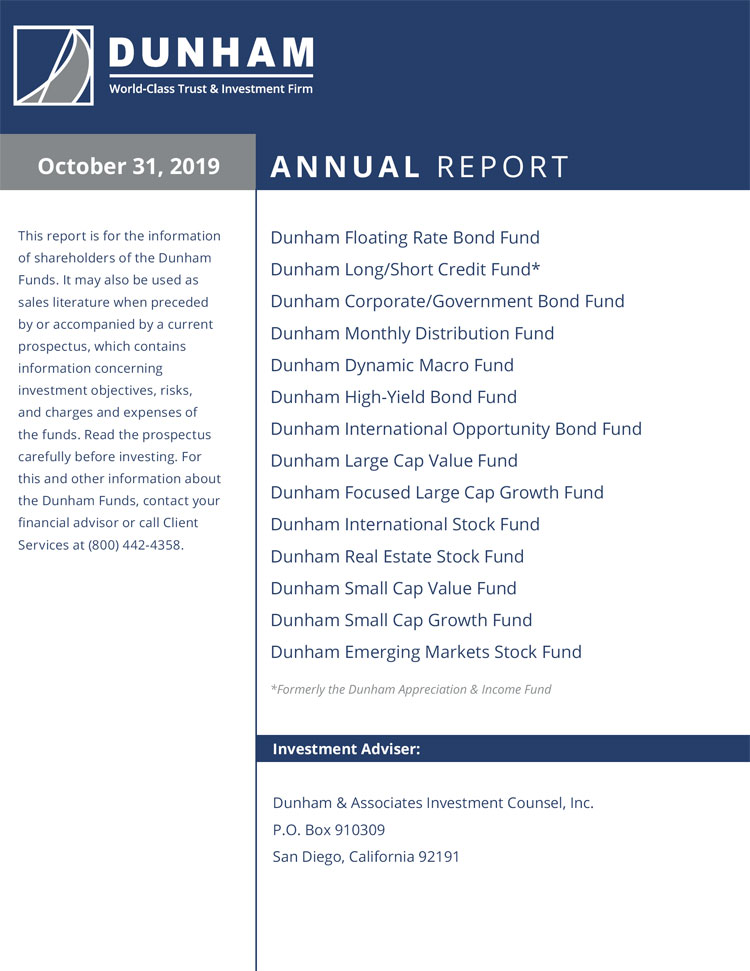
Growth of $100,000 Investment
| Total Returns(a) as of October 31, 2019 | |||
| Annualized | |||
| Annualized | Since Inception | ||
| One Year | Five Years | (11/1/13) | |
| Class N | 1.88% | 2.80% | 2.57% |
| Class C | 1.24% | 2.06% | 1.82% |
| Class A with load of 4.50% | (2.92)% | 1.58% | 1.53% |
| Class A without load | 1.63% | 2.53% | 2.31% |
| Credit Suisse Leveraged Loan Total Return Index | 2.59% | 3.95% | 3.93% |
| S&P/LSTA Leveraged Loan 100 Index ** | 2.67% | 3.45% | 3.43% |
| Morningstar Bank Loan Category | 1.99% | 3.02% | 2.93% |
| (a) | Total Returns are calculated based on traded NAVs. |
| ** | Change in Fund’s benchmark due to the implementation of the Sub- Adviser’s investment strategy primarily using the new benchmark index. As a result, the Fund’s performance is compared to both indices in the table above. |
The Credit Suisse Leveraged Loan Total Return Index tracks the investable market of the U.S. dollar denominated leveraged loan market. It consists of issues rated “5B” or lower, meaning that the highest rated issues included in this index are Moody’s/S&P ratings of Baa1/BB+ or Ba1/BBB+. All loans are funded term loans with a tenor of at least one year and are made by issuers domiciled in developed countries.
The S&P/LSTA Leveraged Loan 100 Index is designed to reflect the performance of the largest facilities in the leveraged loan market. Investors cannot invest directly in an index or benchmark.
The Morningstar Bank Loan Category is generally representative of mutual funds that primarily invest in floating- rate bank loans instead of bonds. These bank loans generally offer interest payments that typically float above a common short-term benchmark such as the London interbank offered rate, or LIBOR.
| As disclosed in the Trust’s latest registration statement, the Fund’s total annual operating expenses, including cost of underlying funds, are 0.98% for Class N, 1.73% for Class C and 1.23% for Class A. Class A shares are subject to a sales load of 4.50% and a deferred sales charge of up to 0.75%. The performance data quoted here represents past performance, which is not indicative of future results. Current performance may be lower or higher than the performance data quoted. The investment return and NAV will fluctuate, so that an investor’s shares, when redeemed, may be worth more or less than their original cost. Total returns are calculated assuming reinvestment of all dividends and capital gains distributions, if any. The returns do not reflect the deductions of taxes a shareholder would pay on the redemption of Fund shares or Fund distributions. For performance information current to the most recent month-end, please call 1-800-442-4358 or visit our website www.dunham.com |
2
| SCHEDULE OF INVESTMENTS |
| Dunham Floating Rate Bond Fund |
| October 31, 2019 |
| Variable | Principal | Interest | Maturity | |||||||||||
| Security | Rate | Amount | Rate % | Date | Value | |||||||||
| ASSET BACKED SECURITIES - 0.9% | ||||||||||||||
| Barclays Commercial Mortgage Securities | 1 mo LIBOR + 0.722% | $ | 470,000 | 2.635 | + | 3/15/2037 | $ | 469,624 | ||||||
| Drive Auto Receivables Trust - 144A | 470,000 | 2.900 | 8/15/2025 | 476,654 | ||||||||||
| Ellington Financial Mortgage Trust - 144A | 427,400 | 2.934 | 6/25/2059 | 431,127 | ||||||||||
| Pretium Mortgage Credit Partners - 144A | 315,010 | 4.826 | 9/25/2058 | 317,544 | ||||||||||
| TOTAL ASSET BACKED SECURITIES (Cost - $1,683,720) | 1,694,949 | |||||||||||||
| BANK LOANS - 91.7% | ||||||||||||||
| BASIC MATERIALS - 3.3% | ||||||||||||||
| Acuity Specialty Products, Inc., Initial Term Loan (First Lien) | LIBOR + 4.000% | 274,400 | 6.085 | + | 8/11/2024 | 212,888 | ||||||||
| Ascend Performance Materials Operations LLC, Initial Term Loan | LIBOR + 5.250% | 225,000 | 7.152 | + | 8/27/2026 | 225,984 | ||||||||
| ClearWater Paper Corp., Initial Term Loan | LIBOR + 3.250% | 135,000 | 5.152 | + | 7/26/2026 | 135,169 | ||||||||
| Covia Holdings Corp., Initial Term Loan | LIBOR + 4.000% | 562,875 | 6.012 | + | 6/01/2025 | 395,923 | ||||||||
| Element Solutions, Inc., Initial Term Loan | LIBOR + 2.250% | 729,488 | 4.152 | + | 1/31/2026 | 733,022 | ||||||||
| Graftech International Ltd., Initial Term Loan | LIBOR + 3.500% | 374,750 | 5.402 | + | 2/12/2025 | 361,165 | ||||||||
| H.B. Fuller Co., Commitment Loan | LIBOR + 2.000% | 624,645 | 3.934 | + | 10/20/2024 | 623,836 | ||||||||
| Hexion, Inc., USD Term Loan | LIBOR + 3.500% | 573,563 | 5.589 | + | 7/01/2026 | 572,487 | ||||||||
| Ineos US Finance LLC, New 2024 Dollar Term Loan | LIBOR + 2.000% | 1,886,400 | 3.902 | + | 3/31/2024 | 1,869,781 | ||||||||
| Kraton Polymers LLC, Dollar Replacement Term Loan (2018) | LIBOR + 2.500% | 355,351 | 4.402 | + | 3/08/2025 | 353,460 | ||||||||
| Omnova Solutions, Inc., Term B-2 Loan | LIBOR + 3.250% | 495,459 | 5.152 | + | 8/25/2023 | 495,305 | ||||||||
| US Salt LLC, Initial Term Loan | LIBOR + 4.750% | 273,625 | 6.652 | + | 1/16/2026 | 273,967 | ||||||||
| 6,252,987 | ||||||||||||||
| COMMUNICATIONS - 16.2% | ||||||||||||||
| Advantage Sales & Marketing, Inc., Initial Term Loan (First Lien) | LIBOR + 3.250% | 386,253 | 5.152 | + | 7/25/2021 | 361,485 | ||||||||
| Altice France SA, USD TLB-13 Incremental Term Loan | LIBOR + 4.000% | 232,650 | 6.002 | + | 8/14/2026 | 229,659 | ||||||||
| CenturyLink, Inc., Initial Term B Loan | LIBOR + 2.750% | 1,004,946 | 4.652 | + | 1/31/2025 | 996,218 | ||||||||
| Charter Communications Operating LLC, Term B-2 Loan | LIBOR + 1.750% | 2,245,013 | 3.686 | + | 2/01/2027 | 2,256,238 | ||||||||
| Clear Channel Outdoor Holdings, Inc., Term B Loan | LIBOR + 3.500% | 575,000 | 5.402 | + | 8/21/2026 | 576,797 | ||||||||
| Commscope, Inc., Initial Term Loan | LIBOR + 3.250% | 615,000 | 5.152 | + | 4/04/2026 | 604,431 | ||||||||
| Consolidated Communications, Inc., Initial Term Loan | LIBOR + 3.000% | 673,274 | 4.902 | + | 10/05/2023 | 626,565 | ||||||||
| CSC Holdings, LLC, March 2017 Refinancing Term Loan | LIBOR + 2.250% | 1,747,339 | 4.252 | + | 7/17/2025 | 1,742,404 | ||||||||
| CSC Holdings, LLC, October 2018 Incremental Term Loan | LIBOR + 2.250% | 377,150 | 4.252 | + | 1/15/2026 | 375,170 | ||||||||
| Diamond Sports Group, LLC, Term Loan | LIBOR + 3.250% | 910,000 | 5.190 | + | 8/24/2026 | 915,574 | ||||||||
| Frontier Communications Corp., Term B-1 Loan | LIBOR + 3.750% | 1,532,932 | 5.652 | + | 6/15/2024 | 1,530,441 | ||||||||
| Go Daddy Operating Co. LLC, Tranche B-2 Term Loan | LIBOR + 1.750% | 563,854 | 3.652 | + | 2/15/2024 | 565,136 | ||||||||
| Hoya Midco LLC., Initial Term Loan (First Lien) | LIBOR + 3.500% | 867,936 | 5.402 | + | 6/30/2024 | 844,792 | ||||||||
| iHeart Communications, Inc., Escrow Bond # | 1,605,000 | — | 5/01/2023 | — | ||||||||||
| iHeart Communications, Inc., Initial Term Loan | LIBOR + 4.000% | 332,924 | 6.089 | + | 5/01/2026 | 334,484 | ||||||||
| Iridium Communications, Inc., Term Loan B | LIBOR + 3.750% | 105,000 | 5.806 | + | 10/18/2026 | 105,738 | ||||||||
| LCPR Loan Financing LLC, Initial Term Loan | LIBOR + 5.000% | 205,000 | 6.928 | + | 10/22/2026 | 206,730 | ||||||||
| Level 3 Financing, Inc., Tranche B 2024 Term Loan | LIBOR + 2.250% | 2,410,000 | 4.152 | + | 2/22/2024 | 2,416,025 | ||||||||
| MCC Iowa LLC, Tranche M Term Loan | LIBOR + 2.000% | 779,212 | 3.935 | + | 1/15/2025 | 782,134 | ||||||||
| Mcgraw-Hill Global Education Holdings LLC, Term B Loan (First Lien) | LIBOR + 4.000% | 988,940 | 5.902 | + | 5/04/2022 | 907,970 | ||||||||
| Mediacom Illinois LLC, Tranche N Term Loan | LIBOR + 1.750% | 643,487 | 3.685 | + | 2/15/2024 | 644,292 | ||||||||
| Meredith Corp., Tranche B-1 Term Loan | LIBOR + 2.750% | 520,864 | 4.652 | + | 1/31/2025 | 523,224 | ||||||||
| Nexstar Broadcasting, Inc., Term B-4 Loan | LIBOR + 2.750% | 1,240,000 | 4.686 | + | 9/18/2026 | 1,246,113 | ||||||||
| Numericable US LLC, USD TLB-11 Term Loan | LIBOR + 2.750% | 633,750 | 4.652 | + | 7/31/2025 | 615,187 | ||||||||
| Numericable US LLC, USD TLB-12 Term Loan | LIBOR + 3.688% | 321,578 | 5.690 | + | 1/31/2026 | 314,744 | ||||||||
| Radiate Holdco LLC, Closing Date Term Loan | LIBOR + 3.000% | 1,159,693 | 4.902 | + | 2/01/2024 | 1,149,226 | ||||||||
| Red Ventures LLC, Term B-1 Loan (First Lien) | LIBOR + 3.000% | 726,953 | 4.909 | + | 11/08/2024 | 726,350 | ||||||||
| Rodan & Fields LLC, Closing Date Term Loan | LIBOR + 4.000% | 636,938 | 6.002 | + | 6/16/2025 | 522,289 | ||||||||
| SBA Senior Finance II LLC, Initial Term Loan | LIBOR + 2.000% | 1,145,041 | 3.902 | + | 4/11/2025 | 1,149,203 | ||||||||
| Securus Technologies Holdings, Inc., Initial Term Loan (First Lien) | LIBOR + 4.500% | 199,451 | 6.402 | + | 11/01/2024 | 158,421 | ||||||||
| Securus Technologies Holdings, Inc., Initial Loan (Second Lien) | LIBOR + 8.250% | 255,000 | 10.152 | + | 11/01/2025 | 134,194 | ||||||||
| Sinclair Television Group, Inc., Tranche B Term Loan | LIBOR + 2.250% | 359,217 | 4.152 | + | 1/03/2024 | 359,330 | ||||||||
| Sprint Communications, Inc., Initial Term Loan | LIBOR + 2.500% | 1,037,921 | 4.402 | + | 2/03/2024 | 1,027,977 | ||||||||
| Sprint Communications, Inc., 2019 Incremental Term Loan | LIBOR + 3.000% | 652,225 | 4.902 | + | 2/03/2024 | 649,372 | ||||||||
| Telenet Financing USD LLC., Term Loan AN Facility | LIBOR + 2.250% | 680,000 | 4.227 | + | 8/15/2026 | 680,187 | ||||||||
| Univision Communications, Inc., 2017 Replacement Repriced First-Lien Term Loan | LIBOR + 2.750% | 2,264,710 | 4.652 | + | 3/15/2024 | 2,190,813 | ||||||||
| Virgin Media Bristol LLC, K Facility | LIBOR + 2.500% | 690,000 | 4.477 | + | 1/31/2028 | 688,023 | ||||||||
| West Corporation, Initial Term B Loan | LIBOR + 4.000% | 442,901 | 5.902 | + | 10/10/2024 | 370,139 | ||||||||
See accompanying notes to financial statements.
3
| SCHEDULE OF INVESTMENTS |
| Dunham Floating Rate Bond Fund (Continued) |
| October 31, 2019 |
| Variable | Principal | Interest | Maturity | |||||||||||
| Security | Rate | Amount | Rate % | Date | Value | |||||||||
| BANK LOANS - 91.7% (Continued) | ||||||||||||||
| COMMUNICATIONS - 16.2% (Continued) | ||||||||||||||
| West Corporation, Incremental Term B-1 Loan | LIBOR + 3.500% | $ | 246,875 | 5.402 + | 10/10/2024 | $ | 205,215 | |||||||
| Ziggo Secured Finance Partnership, Term Loan E Facility | LIBOR + 2.500% | 890,000 | 4.502 + | 4/15/2025 | 880,575 | |||||||||
| 30,612,865 | ||||||||||||||
| CONSUMER, CYCLICAL - 19.7% | ||||||||||||||
| 84 Lumber Co., Term B-1 Loan | LIBOR + 5.250% | 412,919 | 4.178 + | 10/25/2023 | 413,777 | |||||||||
| Accuride Corp., 2017 Refinancing Term Loan | LIBOR + 5.250% | 448,555 | 7.335 + | 11/10/2023 | 374,544 | |||||||||
| Affinity Gaming, Initial Term Loan | LIBOR + 3.250% | 356,415 | 5.152 + | 7/03/2023 | 341,846 | |||||||||
| American Airlines, Inc., 2017 Class B Term Loan | LIBOR + 2.000% | 86,330 | 3.927 + | 4/28/2023 | 86,364 | |||||||||
| American Airlines, Inc., 2017 Class B Term Loan | LIBOR + 2.000% | 489,559 | 4.002 + | 12/14/2023 | 489,559 | |||||||||
| American Airlines, Inc., 2018 Replacement Term Loan | LIBOR + 1.750% | 422,358 | 3.685 + | 6/27/2025 | 419,006 | |||||||||
| American Axle & Manufacturing, Inc., Tranche B Term Loan | LIBOR + 2.250% | 552,236 | 4.178 + | 4/06/2024 | 527,157 | |||||||||
| American Builders & Contractors Supply Co., Inc., Restatement Effective Date Term Loan | LIBOR + 2.000% | 1,480,000 | 3.927 + | 1/15/2027 | 1,479,541 | |||||||||
| American Greetings Corp., Initial Term Loan | LIBOR + 4.500% | 630,688 | 6.402 + | 4/06/2024 | 614,920 | |||||||||
| Aramark Intermediate HoldCo Corp., U.S. Term B-2 Loan | LIBOR + 1.750% | 195,170 | 3.652 + | 3/28/2024 | 195,819 | |||||||||
| Aramark Intermediate HoldCo Corp., U.S. Term B-3 Loan | LIBOR + 1.750% | 1,357,024 | 3.652 + | 3/11/2025 | 1,360,980 | |||||||||
| Aristocrat Leisure Ltd., Term B-3 Loan | LIBOR + 1.750% | 1,405,019 | 3.684 + | 10/19/2024 | 1,409,965 | |||||||||
| Bass Pro Group LLC, Initial Term Loan | LIBOR + 5.000% | 928,964 | 6.902 + | 9/25/2024 | 898,605 | |||||||||
| Boyd Gaming Corp., Refinancing Term B Loan | LIBOR + 2.250% | 724,513 | 4.152 + | 9/15/2023 | 726,494 | |||||||||
| Caesars Resort Collection LLC, Term B Loan | LIBOR + 2.750% | 1,940,438 | 4.652 + | 12/22/2024 | 1,914,562 | |||||||||
| Carlisle FoodService Products, Inc., Initial Term Loan (First Lien) | LIBOR + 3.000% | 552,389 | 4.902 + | 3/20/2025 | 523,388 | |||||||||
| CDS US Intermediate Holdings, Inc., Term B Loan (First Lien) | LIBOR + 3.750% | 619,169 | 5.835 + | 7/08/2022 | 560,156 | |||||||||
| CEOC LLC, Term B Loan | LIBOR + 2.000% | 1,154,404 | 3.902 + | 10/06/2024 | 1,155,310 | |||||||||
| CityCenter Holdings LLC, Term B Loan | LIBOR + 2.250% | 1,167,842 | 4.152 + | 4/18/2024 | 1,169,027 | |||||||||
| Crown Finance US, Inc., Initial Dollar Tranche Term Loan | LIBOR + 2.250% | 680,287 | 4.152 + | 2/28/2025 | 672,171 | |||||||||
| CSC SW Holdco, Inc., Term B-1 Loan (First Lien) | LIBOR + 3.250% | 574,808 | 5.253 + | 11/14/2022 | 559,205 | |||||||||
| DexKo Global, Inc., Replacement U.S. Dollar Term B Loan (First Lien) | LIBOR + 3.500% | 511,864 | 5.402 + | 7/24/2024 | 505,625 | |||||||||
| Eldorado Resorts, Inc., Term Loan | LIBOR + 2.250% | 723,252 | 4.255 + | 4/17/2024 | 723,401 | |||||||||
| Formula One Management Ltd., Facility B3 (USD) | LIBOR + 2.500% | 615,202 | 4.416 + | 2/01/2024 | 607,641 | |||||||||
| Gateway Casinos & Entertainment Ltd., Initial Term Loan | LIBOR + 3.000% | 498,688 | 5.085 + | 12/01/2023 | 488,714 | |||||||||
| Global Appliance, Inc., Tranche B Term Loan | LIBOR + 4.000% | 926,926 | 5.902 + | 9/29/2024 | 899,118 | |||||||||
| Golden Nugget, Inc., Initial B Term Loan | LIBOR + 2.750% | 1,357,994 | 4.655 + | 10/04/2023 | 1,357,145 | |||||||||
| GVC Holdings PLC, Facility B2 (USD) | LIBOR + 2.250% | 566,375 | 4.457 + | 3/16/2024 | 567,703 | |||||||||
| HD Supply, Inc., Term B-5 Loan | LIBOR + 1.750% | 840,999 | 3.652 + | 10/17/2023 | 845,310 | |||||||||
| Hilton Worldwide Finance LLC, Refinanced Series B-2 Term loan | LIBOR + 1.750% | 1,208,344 | 3.678 + | 6/21/2026 | 1,214,712 | |||||||||
| Isagenix International LLC, Senior Lien Term Loan | LIBOR + 5.750% | 552,967 | 7.849 + | 6/14/2025 | 425,094 | |||||||||
| Libbey Glass, Inc., Initial Loan | LIBOR + 3.000% | 552,019 | 4.984 + | 4/09/2021 | 434,025 | |||||||||
| Michaels Stores, Inc., 2018 New Replacement Term B Loan | LIBOR + 2.500% | 885,515 | 4.417 + | 1/28/2023 | 864,849 | |||||||||
| Navistar, Inc., Tranche B Term Loan | LIBOR + 3.500% | 923,550 | 5.503 + | 11/06/2024 | 916,041 | |||||||||
| Neiman Marcus Group Ltd. LLC, Cash Pay Extended Term Loan | LIBOR + 6.000% | 997,620 | 8.012 + | 10/25/2023 | 732,767 | |||||||||
| Panther BF Aggregator 2 LP, Initial Dollar Term Loan (First Lien) | LIBOR + 3.500% | 1,045,000 | 5.409 + | 4/30/2026 | 1,033,244 | |||||||||
| PCI Gaming Authority, Term B Facility Loan | LIBOR + 3.000% | 583,849 | 4.902 + | 5/31/2026 | 588,412 | |||||||||
| PetSmart, Inc., Amended Loan | LIBOR + 4.000% | 603,641 | 6.002 + | 3/11/2022 | 589,933 | |||||||||
| Playa Resorts Holding BV, Initial Term Loan | LIBOR + 2.750% | 835,456 | 4.652 + | 4/29/2024 | 816,395 | |||||||||
| Scientific Games International, Inc., Initial Term B-5 Loan | LIBOR + 2.750% | 795,892 | 4.652 + | 8/14/2024 | 787,993 | |||||||||
| Serta Simmons Bedding LLC, Initial Term Loan (First Lien) | LIBOR + 3.500% | 297,585 | 5.487 + | 11/08/2023 | 177,212 | |||||||||
| Siteone Landscape Supply LLC, Tranche E Term Loan | LIBOR + 2.750% | 689,022 | 4.652 + | 10/29/2024 | 691,606 | |||||||||
| Stars Group Holdings BV, USD Term Loan | LIBOR + 3.500% | 514,921 | 5.585 + | 7/10/2025 | 517,769 | |||||||||
| Station Casinos LLC, Term B Facility Loan | LIBOR + 2.500% | 864,389 | 4.402 + | 6/08/2023 | 866,463 | |||||||||
| Tenneco, Inc., Tranche B Term Loan | LIBOR + 3.000% | 789,038 | 4.902 + | 10/01/2025 | 720,656 | |||||||||
| TI Group Automotive Systems LLC, Initial US Term Loan | LIBOR + 2.500% | 356,576 | 4.402 + | 6/30/2022 | 354,182 | |||||||||
| TKC Holdings, Inc., Initial Term Loan (First Lien) | LIBOR + 3.750% | 701,847 | 5.652 + | 2/01/2023 | 681,796 | |||||||||
| UFC Holdings LLC, Term Loan (First Lien) | LIBOR + 3.250% | 1,275,843 | 5.152 + | 4/29/2026 | 1,276,800 | |||||||||
| Univar USA, Inc., Term B-3 Loan | LIBOR + 2.250% | 718,439 | 4.152 + | 7/01/2024 | 721,658 | |||||||||
| WestJet Airlines Ltd., Term Loan B | LIBOR + 3.000% | 780,000 | 5.181 + | 10/08/2026 | 784,715 | |||||||||
| 37,083,375 | ||||||||||||||
| CONSUMER, NON-CYCLICAL - 19.4% | ||||||||||||||
| 21st Century Oncology, Inc., Tranche B Term Loan | LIBOR + 6.125% | 144,046 | 8.128 + | 1/16/2023 | 136,124 | |||||||||
| Accelerated Health Systems LLC, Initial Term Loan | LIBOR + 3.500% | 461,513 | 5.484 + | 10/31/2025 | 462,380 | |||||||||
| Advanz Pharma Corp., Initial Dollar Term Loan | LIBOR + 5.500% | 89,180 | 7.409 + | 9/06/2024 | 84,084 | |||||||||
| Agiliti Health, Inc., Initial Term Loan | LIBOR + 3.000% | 432,825 | 5.089 + | 1/04/2026 | 432,273 | |||||||||
| AHP Health Partners, Inc., Term Loan | LIBOR + 4.500% | 577,688 | 6.402 + | 6/30/2025 | 578,626 | |||||||||
| Albertson’s LLC, 2019-1 Term B-7 Loan | LIBOR + 2.750% | 859,227 | 4.652 + | 11/17/2025 | 864,464 | |||||||||
See accompanying notes to financial statements.
4
| SCHEDULE OF INVESTMENTS |
| Dunham Floating Rate Bond Fund (Continued) |
| October 31, 2019 |
| Variable | Principal | Interest | Maturity | |||||||||||
| Security | Rate | Amount | Rate % | Date | Value | |||||||||
| BANK LOANS - 91.7% (Continued) | ||||||||||||||
| CONSUMER, NON-CYCLICAL - 19.4% (Continued) | ||||||||||||||
| Albertson’s LLC, 2019 Term B-8 Loan | LIBOR + 2.750% | $ | 383,826 | 4.652 + | 8/17/2026 | $ | 386,169 | |||||||
| AlixPartners LLP, 2017 Refinancing Term Loan | LIBOR + 2.750% | 940,424 | 4.652 + | 4/04/2024 | 941,139 | |||||||||
| Amneal Pharmaceuticals LLC, Initial Term Loan | LIBOR + 3.500% | 602,234 | 5.402 + | 5/04/2025 | 461,913 | |||||||||
| Atlantic Aviation FBO, Inc., Initial Term Loan | LIBOR + 3.750% | 129,025 | 5.652 + | 12/06/2025 | 129,831 | |||||||||
| Avantor, Inc., Initial B-2 Dollar Term Loan | LIBOR + 3.000% | 252,868 | 4.902 + | 11/21/2024 | 254,764 | |||||||||
| Bausch Health Companies, Inc., Initial Term Loan | LIBOR + 3.000% | 1,083,403 | 5.002 + | 6/02/2025 | 1,088,425 | |||||||||
| Bausch Health Companies, Inc., First Incremental Term Loan | LIBOR + 2.750% | 188,125 | 4.752 + | 11/27/2025 | 188,569 | |||||||||
| Change Healthcare Holdings, Inc., Closing Date Term Loan | LIBOR + 2.500% | 775,173 | 4.402 + | 3/01/2024 | 771,541 | |||||||||
| CHG Healthcare Services, Inc., New Term Loan (2017) (First Lien) | LIBOR + 3.000% | 362,165 | 4.902 + | 6/07/2023 | 362,197 | |||||||||
| CHG PPC Parent LLC, Initial Term Loan (First Lien) | LIBOR + 2.750% | 582,625 | 4.652 + | 3/31/2025 | 581,168 | |||||||||
| Chobani LLC, New Term Loan (First Lien) | LIBOR + 3.500% | 1,039,118 | 5.402 + | 10/10/2023 | 1,018,767 | |||||||||
| CPI Acquisition, Inc., Term Loan (First Lien) | LIBOR + 4.500% | 1,013,336 | 6.484 + | 8/17/2022 | 788,644 | |||||||||
| Diamond BV, Initial USD Term Loan | LIBOR + 3.000% | 778,160 | 4.902 + | 9/06/2024 | 727,385 | |||||||||
| Dole Food Company, Inc., Tranche B Term Loan | LIBOR + 2.750% | 904,396 | 4.677 + | 4/06/2024 | 891,056 | |||||||||
| Envision Healthcare Corp., Initial Term Loan | LIBOR + 3.750% | 1,338,384 | 5.652 + | 10/10/2025 | 1,087,015 | |||||||||
| Explorer Holdings, Inc., Initial Term Loan | LIBOR + 3.750% | 583,914 | 5.835 + | 5/02/2023 | 583,914 | |||||||||
| Fort Dearborn Holding Company, Inc., Initial Term Loan (First Lien) | LIBOR + 4.000% | 390,594 | 5.986 + | 10/19/2023 | 376,923 | |||||||||
| Garda World Security Corp., Initial Term Loan | LIBOR + 4.750% | 750,000 | 6.659 + | 10/24/2026 | 747,031 | |||||||||
| Gentiva Health Services, Inc., Closing Data Initial Term Loan (First Lien) | LIBOR + 3.750% | 294,257 | 5.652 + | 7/02/2025 | 294,257 | |||||||||
| Greatbatch Ltd., New Term B Loan (2017) | LIBOR + 3.000% | 551,763 | 5.010 + | 10/27/2022 | 554,944 | |||||||||
| Greenrock Finance, Inc., Initial USD Term B Loan (First Lien) | LIBOR + 3.500% | 250,538 | 5.585 + | 6/05/2024 | 251,007 | |||||||||
| Heartland Dental, LLC, Initial Term Loan | LIBOR + 3.750% | 603,522 | 5.652 + | 4/30/2025 | 587,528 | |||||||||
| Herbalife Nutrition Ltd., Term Loan B | LIBOR + 3.250% | 242,550 | 5.152 + | 8/16/2025 | 243,599 | |||||||||
| H-Food Holdings LLC, Initial Term Loan | LIBOR + 3.688% | 469,063 | 5.590 + | 5/31/2025 | 436,130 | |||||||||
| Hostess Brands LLC, 2019 Refinancing Term B Loan (First Lien) | LIBOR + 2.250% | 916,102 | 4.152 + | 8/03/2025 | 912,955 | |||||||||
| Jaguar Holding Company I LLC, 2018 Term Loan | LIBOR + 2.500% | 1,149,314 | 4.402 + | 8/18/2022 | 1,148,464 | |||||||||
| JBS USA Lux S.A., New Term Loan | LIBOR + 2.500% | 736,300 | 4.402 + | 5/01/2026 | 739,562 | |||||||||
| Kronos Acquisition Intermediate, Inc., Initial Loan | LIBOR + 4.000% | 1,186,837 | 5.936 + | 5/15/2023 | 1,124,854 | |||||||||
| Milk Specialties Company, New Term Loan | LIBOR + 4.000% | 527,767 | 5.902 + | 8/16/2023 | 491,895 | |||||||||
| NAB Holdings LLC, 2018 Refinancing Term Loan | LIBOR + 3.000% | 962,357 | 5.085 + | 6/30/2024 | 956,342 | |||||||||
| National Mentor Holdings, Inc., Initial Term Loan (First Lien) | LIBOR + 4.250% | 201,469 | 6.335 + | 3/08/2026 | 201,952 | |||||||||
| National Mentor Holdings, Inc., Initial Term C Loan (First Lien) | LIBOR + 4.250% | 7,895 | 6.152 + | 3/08/2026 | 7,914 | |||||||||
| NVA Holdings, Inc., Term B-3 Loan (First Lien) | LIBOR + 2.750% | 768,339 | 4.652 + | 2/02/2025 | 768,339 | |||||||||
| NVA Holdings, Inc., Incremental Term B-4 Loan | LIBOR + 3.500% | 19,950 | 5.402 + | 2/02/2025 | 19,975 | |||||||||
| Ortho-Clinical Diagnostics, Inc., Second Amendment New Term Loan | LIBOR + 3.250% | 987,605 | 5.277 + | 6/30/2025 | 946,046 | |||||||||
| Parexel International Corp., Initial Term Loan | LIBOR + 2.750% | 551,967 | 4.652 + | 9/27/2024 | 528,114 | |||||||||
| Parfums Holding Co., Inc., Initial Term Loan (First Lien) | LIBOR + 4.250% | 637,041 | 6.388 + | 6/30/2024 | 631,750 | |||||||||
| PetVet Care Centers LLC, Initial Term Loan (First Lien) | LIBOR + 2.750% | 896,122 | 4.652 + | 2/14/2025 | 874,091 | |||||||||
| Phoenix Guarantor, Inc., Initial Term Loan (First Lien) | LIBOR + 4.500% | 134,663 | 6.512 + | 3/05/2026 | 134,642 | |||||||||
| Prime Security Services Borrower LLC, 2019 Refinancing Term B-1 Loan (First Lien) | LIBOR + 3.250% | 783,582 | 5.277 + | 9/23/2026 | 757,994 | |||||||||
| Refinitiv US Holdings, Inc., Initial Dollar Term Loan | LIBOR + 3.750% | 932,950 | 5.652 + | 10/01/2025 | 938,725 | |||||||||
| Regionalcare Hospital Partners Holdings, Inc., Term B Loan (First Lien) | LIBOR + 4.500% | 798,963 | 6.436 + | 11/16/2025 | 798,128 | |||||||||
| Revlon Consumer Products Corp., Initial Term B Loan | LIBOR + 3.500% | 646,712 | 5.637 + | 9/07/2023 | 510,230 | |||||||||
| Sage Borrowco LLC, Term B Loan (First Lien) | LIBOR + 4.750% | 284,288 | 6.659 + | 6/20/2026 | 285,709 | |||||||||
| Select Medical Corp., Tranche B Term Loan | LIBOR + 2.500% | 563,789 | 4.613 + | 3/06/2025 | 562,146 | |||||||||
| Shearer’s Foods LLC, Refinancing Term Loan (First Lien) | LIBOR + 4.250% | 695,000 | 6.152 + | 3/27/2022 | 694,569 | |||||||||
| Sigma Holdco BV, Facility B2 | LIBOR + 3.000% | 852,292 | 5.017 + | 7/02/2025 | 843,313 | |||||||||
| Sotera Health Holdings LLC, Incremental Term Loan | LIBOR + 3.000% | 1,006,341 | 4.902 + | 5/15/2022 | 991,563 | |||||||||
| Sotera Health Holdings LLC, Incremental Term Loan (2019) | LIBOR + 3.500% | 438,900 | 5.402 + | 5/16/2022 | 438,351 | |||||||||
| St. George’s University Scholastic Services LLC, Term Loan | LIBOR + 3.500% | 851,557 | 5.402 + | 7/17/2025 | 853,332 | |||||||||
| Surgery Center Holdings, Inc., Initial Term Loan | LIBOR + 3.250% | 749,700 | 5.152 + | 8/31/2024 | 725,961 | |||||||||
| Trans Union LLC, 2017 Replacement Term B-3 Loan | LIBOR + 2.000% | 1,273,572 | 3.909 + | 4/09/2023 | 1,277,813 | |||||||||
| Viant Medical Holdings, Inc., Initial Term Loan (First Lien) | LIBOR + 3.750% | 173,250 | 5.835 + | 7/02/2025 | 162,422 | |||||||||
| WEX, Inc., Term B-3 Loan | LIBOR + 2.250% | 876,851 | 4.152 + | 5/17/2026 | 881,630 | |||||||||
| 36,520,648 | ||||||||||||||
| ENERGY - 3.2% | ||||||||||||||
| Buckeye Partners LP, Term Loan | LIBOR + 2.750% | 265,000 | 4.753 + | 10/16/2026 | 266,544 | |||||||||
| California Resources Corp., Initial Loan | LIBOR + 4.750% | 405,000 | 6.659 + | 12/31/2022 | 350,528 | |||||||||
| CITGO Holding, Inc., Term Loan | LIBOR + 7.000% | 145,000 | 8.902 + | 8/01/2023 | 146,662 | |||||||||
| CITGO Petroleum Corp., 2019 Incremental Term B Loan | LIBOR + 5.000% | 875,600 | 7.085 + | 3/27/2024 | 877,789 | |||||||||
| Fieldwood Energy LLC, Closing Date Loan (First Lien) | LIBOR + 5.250% | 605,554 | 7.152 + | 4/11/2022 | 489,893 | |||||||||
| Fieldwood Energy LLC, Closing Date Loan 2018 (Second Lien) | LIBOR + 7.250% | 81,748 | 9.152 + | 4/11/2023 | 42,917 | |||||||||
See accompanying notes to financial statements.
5
| SCHEDULE OF INVESTMENTS |
| Dunham Floating Rate Bond Fund (Continued) |
| October 31, 2019 |
| Variable | Principal | Interest | Maturity | |||||||||||
| Security | Rate | Amount | Rate % | Date | Value | |||||||||
| BANK LOANS - 91.7% (Continued) | ||||||||||||||
| ENERGY - 3.2% (Continued) | ||||||||||||||
| Gavilan Resources LLC, Initial Term Loan (Second Lien) | LIBOR + 6.000% | $ | 490,000 | 7.902 + | 3/01/2024 | $ | 218,150 | |||||||
| McDermott International, Inc., Term Loan | LIBOR + 10.000% | 573,269 | 11.934 + | 10/21/2021 | 596,200 | |||||||||
| McDermott International, Inc., Term Loan | LIBOR + 5.000% | 1,098,275 | 7.085 + | 5/10/2025 | 667,477 | |||||||||
| Medallion Midland Acquisition LLC, Initial Term Loan | LIBOR + 3.250% | 763,925 | 5.152 + | 10/30/2024 | 721,271 | |||||||||
| MRC Global Inc., 2018 Refinancing Term Loan | LIBOR + 3.000% | 750,273 | 4.902 + | 9/22/2024 | 742,770 | |||||||||
| Paragon Offshore Finance Co., Term Loan | LIBOR + 2.750% | 1,153 | 4.752 + | 7/16/2021 | — | |||||||||
| Seadrill Operating LP, Initial Term Loan | LIBOR + 6.000% | 466,172 | 8.085 + | 2/21/2021 | 238,580 | |||||||||
| Traverse Midstream Partners LLC, Advance | LIBOR + 4.000% | 374,832 | 5.909 + | 9/27/2024 | 330,789 | |||||||||
| Ultra Resources, Inc., Loan | LIBOR + 4.000% | 661,675 | 5.936 + | 4/12/2024 | 397,713 | |||||||||
| 6,087,283 | ||||||||||||||
| FINANCIAL - 5.7% | ||||||||||||||
| Asurion LLC, Amendment No. 14 Replacement B-4 Term Loan | LIBOR + 3.000% | 514,349 | 4.902 + | 8/04/2022 | 515,220 | |||||||||
| Asurion LLC, Replacement B-6 Term Loan | LIBOR + 3.000% | 322,234 | 4.902 + | 11/03/2023 | 323,011 | |||||||||
| Asurion LLC, New B-7 Term Loan | LIBOR + 3.000% | 385,125 | 4.902 + | 11/03/2024 | 385,968 | |||||||||
| Asurion LLC, Second Lien Replacement B-2 Term Loan | LIBOR + 6.500% | 607,456 | 8.402 + | 8/04/2025 | 611,632 | |||||||||
| Blackhawk Network Holdings, Inc., Term Loan (First Lien) | LIBOR + 3.000% | 866,301 | 4.902 + | 6/16/2025 | 860,579 | |||||||||
| Capital Automotive LP, Initial Tranche B-2 Term Loan (First Lien) | LIBOR + 2.500% | 445,464 | 4.402 + | 3/25/2024 | 445,861 | |||||||||
| Capital Automotive LP, Initial Tranche B Term Loan (Second Lien) | LIBOR + 6.000% | 439,812 | 7.902 + | 3/24/2025 | 442,011 | |||||||||
| Ellie Mae, Inc., Term Loan (First Lien) | LIBOR + 4.000% | 1,045,000 | 5.902 + | 4/16/2026 | 1,040,428 | |||||||||
| FinCo I LLC, 2018 Replacement Loan | LIBOR + 2.000% | 282,020 | 3.902 + | 12/27/2022 | 282,814 | |||||||||
| iStar, Inc., Loan | LIBOR + 2.750% | 846,672 | 4.730 + | 6/28/2023 | 848,789 | |||||||||
| Lightstone Holdco LLC, Refinancing Term B Loan | LIBOR + 3.750% | 470,678 | 5.652 + | 1/30/2024 | 439,569 | |||||||||
| Lightstone Holdco LLC, Refinancing Term C Loan | LIBOR + 3.750% | 26,547 | 5.652 + | 1/30/2024 | 24,793 | |||||||||
| MGM Growth Properties Operating Partnership LP, Term B Loan | LIBOR + 2.000% | 908,164 | 3.902 + | 3/25/2025 | 912,074 | |||||||||
| Pl UK Holdco II Ltd., Facility B1 | LIBOR + 3.250% | 1,846,875 | 5.152 + | 1/03/2025 | 1,838,795 | |||||||||
| Sedgwick Claims Management Services, Inc., Initial Term Loan | LIBOR + 3.250% | 1,359,725 | 5.152 + | 12/31/2025 | 1,322,013 | |||||||||
| Sedgwick Claims Management Services, Inc., 2019 Term Loan | LIBOR + 4.000% | 194,513 | 5.902 + | 9/30/2026 | 193,378 | |||||||||
| Uniti Group, Inc., Shortfall Term Loan | LIBOR + 5.000% | 292,128 | 6.902 + | 10/24/2022 | 281,942 | |||||||||
| 10,768,877 | ||||||||||||||
| INDUSTRIALS - 14.8% | ||||||||||||||
| Anchor Glass Container Corp., July 2017 Additional Term Loan (First Lien) | LIBOR + 2.750% | 425,896 | 4.756 + | 12/07/2023 | 321,978 | |||||||||
| Anchor Glass Container Corp., Term Loan (Second Lien) | LIBOR + 7.750% | 244,000 | 9.762 + | 12/07/2024 | 138,318 | |||||||||
| Berlin Packaging LLC, Initial Term Loan (First Lien) | LIBOR + 3.000% | 587,563 | 5.721 + | 11/07/2025 | 572,383 | |||||||||
| Berry Global, Inc., Term W Loan | LIBOR + 2.000% | 308,192 | 3.953 + | 10/01/2022 | 309,511 | |||||||||
| Berry Global, Inc., Term X Loan | LIBOR + 2.000% | 518,710 | 3.953 + | 1/19/2024 | 520,754 | |||||||||
| Berry Global, Inc., Term U Loan | LIBOR + 2.500% | 1,182,038 | 4.486 + | 7/01/2026 | 1,187,410 | |||||||||
| Brand Energy & Infrastructure Services, Inc., Initial Term Loan | LIBOR + 4.250% | 694,515 | 6.224 + | 6/21/2024 | 675,850 | |||||||||
| Brookfield WEC Holdings, Inc., Initial Term Loan (First Lien) | LIBOR + 3.500% | 839,386 | 5.402 + | 8/01/2025 | 835,365 | |||||||||
| BWay Holding Co., Initial Term Loan | LIBOR + 3.250% | 818,108 | 5.251 + | 4/03/2024 | 797,516 | |||||||||
| Circor International, Inc., Initial Term Loan | LIBOR + 3.500% | 578,886 | 5.502 + | 12/11/2024 | 575,051 | |||||||||
| CPG International LLC, New Term Loan | LIBOR + 3.750% | 1,937,646 | 5.835 + | 5/06/2024 | 1,913,425 | |||||||||
| CPI Holdco LLC, Term Loan B | LIBOR + 4.250% | 190,000 | 6.306 + | 10/29/2026 | 190,000 | |||||||||
| Crosby US Acquisition Corp., Initial Term Loan (First Lien) | LIBOR + 4.750% | 428,925 | 6.686 + | 6/27/2026 | 408,373 | |||||||||
| Dynasty Acquisition Co., Inc., Initial Term B-1 Loan | LIBOR + 4.000% | 399,965 | 6.085 + | 4/06/2026 | 401,373 | |||||||||
| Dynasty Acquisition Co., Inc., Initial Term B-2 Loan | LIBOR + 4.000% | 215,035 | 6.085 + | 4/06/2026 | 215,792 | |||||||||
| Filtration Group Corp., Initial Dollar Term Loan | LIBOR + 3.000% | 819,845 | 4.902 + | 3/29/2025 | 820,230 | |||||||||
| Fluidra SA, USD Term Loan | LIBOR + 2.250% | 832,395 | 4.152 + | 7/02/2025 | 833,955 | |||||||||
| Gardner Denver, Inc., Tranche B-1 Dollar Term Loan | LIBOR + 2.750% | 999,411 | 4.652 + | 7/30/2024 | 1,002,709 | |||||||||
| Gates Global LLC, Initial B-2 Dollar Term Loan | LIBOR + 2.750% | 917,087 | 4.652 + | 3/31/2024 | 900,552 | |||||||||
| GFL Environmental, Inc., Effective Date Incremental Term Loan | LIBOR + 3.000% | 608,835 | 4.902 + | 5/30/2025 | 607,693 | |||||||||
| Gopher Resource LLC, Initial Term Loan | LIBOR + 3.250% | 465,182 | 5.152 + | 3/06/2025 | 459,948 | |||||||||
| Hillman Group, Inc., Initial Term Loan | LIBOR + 4.000% | 701,125 | 5.902 + | 5/31/2025 | 665,017 | |||||||||
| Klockner Pentaplast Of America, Inc., Dollar Term Loan | LIBOR + 4.250% | 1,057,500 | 6.152 + | 6/30/2022 | 880,808 | |||||||||
| KSBR Holding Corp., Initial Term Loan | LIBOR + 4.250% | 562,175 | 6.184 + | 4/15/2026 | 564,292 | |||||||||
| NN, Inc., 2017 Incremental Term Loan | LIBOR + 3.250% | 171,000 | 5.152 + | 4/03/2021 | 166,475 | |||||||||
| NN, Inc., Tranche B Term Loan | LIBOR + 3.750% | 211,966 | 5.652 + | 10/19/2022 | 206,844 | |||||||||
| Patriot Container Corp., Closing Date Term Loan (First Lien) | LIBOR + 3.500% | 630,400 | 5.402 + | 3/20/2025 | 619,368 | |||||||||
| Quikrete Holdings, Inc., Initial Loan (First Lien) | LIBOR + 2.750% | 786,538 | 4.652 + | 11/15/2023 | 784,450 | |||||||||
| RBS Global, Inc., Refinancing Term Loan | LIBOR + 2.000% | 800,971 | 3.902 + | 8/21/2024 | 806,378 | |||||||||
| Reynolds Group Holdings, Inc., Incremental U.S. Term Loan | LIBOR + 2.750% | 1,175,563 | 4.652 + | 2/05/2023 | 1,176,838 | |||||||||
| Spectrum Holdings III Corp., Clsing Date Term Loan (First Lien) | LIBOR + 3.250% | 434,730 | 5.152 + | 1/31/2025 | 369,883 | |||||||||
| Summit Materials LLC, New Term Loan | LIBOR + 2.000% | 1,325,397 | 3.902 + | 11/21/2024 | 1,329,744 | |||||||||
See accompanying notes to financial statements.
6
| SCHEDULE OF INVESTMENTS |
| Dunham Floating Rate Bond Fund (Continued) |
| October 31, 2019 |
| Variable | Principal | Interest | Maturity | |||||||||||
| Security | Rate | Amount | Rate % | Date | Value | |||||||||
| BANK LOANS - 91.7% (Continued) | ||||||||||||||
| INDUSTRIALS - 14.8% (Continued) | ||||||||||||||
| Titan Acquisition Ltd., Initial Term Loan | LIBOR + 3.000% | $ | 1,004,700 | 4.902 + | 3/28/2025 | $ | 952,581 | |||||||
| Transdigm, Inc., New Tranche F Term Loan (2018) | LIBOR + 2.500% | 1,286,083 | 4.402 + | 6/09/2023 | 1,281,961 | |||||||||
| Transdigm, Inc., New Tranche G Term Loan | LIBOR + 2.500% | 734,171 | 4.402 + | 8/22/2024 | 729,755 | |||||||||
| Transdigm, Inc., New Tranche E Term Loan (2018) | LIBOR + 2.500% | 793,117 | 4.402 + | 5/30/2025 | 788,117 | |||||||||
| Tricorbraun Holdings, Inc., Closing Date Term Loan (First Lien) | LIBOR + 3.750% | 634,572 | 5.837 + | 11/30/2023 | 621,288 | |||||||||
| Trident TPI Holdings, Inc., Tranche B-1 Term Loan | LIBOR + 3.250% | 722,716 | 5.152 + | 10/05/2024 | 682,667 | |||||||||
| Tunnel Hill Partners LP, Initial Term Loan | LIBOR + 3.500% | 651,725 | 5.402 + | 2/08/2026 | 650,506 | |||||||||
| US Farathane LLC, Term B-4 Loan | LIBOR + 3.500% | 366,532 | 5.402 + | 12/23/2021 | 335,377 | |||||||||
| Vertiv Group Corp., Term B Loan | LIBOR + 4.000% | 565,000 | 5.902 + | 11/15/2023 | 534,137 | |||||||||
| 27,834,672 | ||||||||||||||
| TECHNOLOGY - 7.8% | ||||||||||||||
| Applied Systems, Inc., Closing Date Term Loan (First Lien) | LIBOR + 3.000% | 686,643 | 5.085 + | 9/19/2024 | 683,643 | |||||||||
| Applied Systems, Inc., Initial Term Loan (Second Lien) | LIBOR + 7.000% | 105,000 | 9.085 + | 9/19/2025 | 106,531 | |||||||||
| Astin Finco SARL, Dollar Term Loan (First Lien) | LIBOR + 4.250% | 240,000 | 6.234 + | 10/09/2026 | 238,500 | |||||||||
| Azalea TopCo, Inc., Initial Term Loan (First Lien) | LIBOR + 3.500% | 300,000 | 5.402 + | 7/26/2026 | 295,875 | |||||||||
| Boxer Parent Company, Inc., Initial Dollar Term Loan | LIBOR + 4.250% | 1,314,200 | 6.152 + | 10/02/2025 | 1,221,739 | |||||||||
| Dell International LLC, Refinancing Term B-1 Loan | LIBOR + 2.000% | 1,401,612 | 3.902 + | 9/19/2025 | 1,408,781 | |||||||||
| Dun & Bradstreet Corp., Initial Term Borrowing | LIBOR + 5.000% | 565,000 | 6.936 + | 2/06/2026 | 567,294 | |||||||||
| DynCorp International, Inc., Term Loan | LIBOR + 6.000% | 310,000 | 8.003 + | 8/15/2025 | 303,995 | |||||||||
| Everi Payments, Inc., Term B Loan | LIBOR + 3.000% | 724,661 | 4.902 + | 5/09/2024 | 725,024 | |||||||||
| Iqvia, Inc., Term B-1 Dollar Loan | LIBOR + 2.000% | 144,019 | 4.085 + | 3/07/2024 | 144,664 | |||||||||
| Iqvia, Inc., Incremental Term B-2 Dollar Loan | LIBOR + 2.000% | 73,500 | 4.085 + | 1/18/2025 | 73,791 | |||||||||
| Iqvia, Inc., Term B-3 Dollar Loan | LIBOR + 1.750% | 1,138,610 | 3.835 + | 6/11/2025 | 1,139,413 | |||||||||
| Kronos, Inc., Incremental Term Loan (First Lien) | LIBOR + 3.000% | 2,250,628 | 5.287 + | 11/01/2023 | 2,249,042 | |||||||||
| Kronos, Inc., Initial Term Loan (Second Lien) | LIBOR + 8.250% | 120,000 | 10.537 + | 11/01/2024 | 121,328 | |||||||||
| Navircure, Inc., Initial Term Loan (First Lien) | LIBOR + 4.000% | 165,000 | 5.936 + | 10/22/2026 | 164,773 | |||||||||
| NCR Corp., Initial Term Loan (2019) | LIBOR + 2.500% | 136,813 | 4.402 + | 8/08/2026 | 137,012 | |||||||||
| Neustar, Inc., TLB4 (First Lien) | LIBOR + 3.500% | 230,300 | 5.402 + | 8/08/2024 | 220,915 | |||||||||
| Presidio Holdings, Inc., Term B Loan | LIBOR + 2.750% | 504,823 | 4.833 + | 2/02/2024 | 505,587 | |||||||||
| Rackspace Hosting, Inc., Term B Loan (First Lien) | LIBOR + 3.000% | 561,477 | 5.209 + | 11/03/2023 | 501,233 | |||||||||
| SS&C Technologies Holdings, Inc., Term B-3 Loan | LIBOR + 2.250% | 582,086 | 4.152 + | 4/16/2025 | 584,342 | |||||||||
| SS&C Technologies Holdings, Inc., Term B-4 Loan | LIBOR + 2.250% | 379,974 | 4.152 + | 4/16/2025 | 381,465 | |||||||||
| SS&C Technologies Holdings, Inc., Term B-5 Loan | LIBOR + 2.250% | 272,218 | 4.152 + | 4/16/2025 | 273,325 | |||||||||
| Tempo Acquisition LLC, Initial Term Loan | LIBOR + 3.000% | 547,400 | 4.902 + | 5/01/2024 | 548,541 | |||||||||
| Vertafore, Inc., Initial Term Loan (First Lien) | LIBOR + 3.250% | 1,541,639 | 5.152 + | 7/02/2025 | 1,499,244 | |||||||||
| Zelis Cost Management Buyer, Inc., Initial Term Loan | LIBOR + 4.750% | 590,000 | 6.652 + | 9/30/2026 | 584,838 | |||||||||
| 14,680,895 | ||||||||||||||
| UTILITIES - 1.6% | ||||||||||||||
| APLP Holdings LP, Term Loan | LIBOR + 2.750% | 254,286 | 4.652 + | 4/13/2023 | 254,710 | |||||||||
| Calpine Construction Finance Co. LP, Term B Loan | LIBOR + 2.500% | 711,489 | 4.402 + | 1/15/2025 | 712,887 | |||||||||
| Calpine Corp., Term Loan | LIBOR + 2.500% | 374,036 | 4.402 + | 8/12/2026 | 373,978 | |||||||||
| Pacific Gas and Electric Company, Initial Term Loan (DIP) | LIBOR + 2.250% | 155,000 | 4.190 + | 12/31/2020 | 154,903 | |||||||||
| Talen Energy Supply LLC, Initial Term Loan | LIBOR + 3.750% | 515,000 | 5.734 + | 7/08/2026 | 509,850 | |||||||||
| Texas Competitive Electric Holdings Co. LLC Escrow Bonds # | 635,000 | — | 10/01/2049 | 445 | ||||||||||
| Vistra Operations Co. LLC, Initial Term Loan | LIBOR + 2.000% | 154,827 | 3.902 + | 8/04/2023 | 155,512 | |||||||||
| Vistra Operations Co. LLC, 2018 Incremental Term Loan | LIBOR + 2.000% | 811,563 | 3.928 + | 12/31/2025 | 815,219 | |||||||||
| 2,977,504 | ||||||||||||||
| TOTAL BANK LOANS (Cost - $177,563,176) | 172,819,106 | |||||||||||||
| BONDS & NOTES - 3.8% | ||||||||||||||
| AUTO PARTS & EQUIPMENT - 0.0% | ||||||||||||||
| Panther BF Aggregator 2 LP - 144A | 25,000 | 6.250 | 5/15/2026 | 26,492 | ||||||||||
| COMPUTERS - 0.1% | ||||||||||||||
| Exela Intermediate LLC - 144A | 520,000 | 10.000 | 7/15/2023 | 250,900 | ||||||||||
| DIVERSIFIED FINANCIAL SERVICES - 0.1% | ||||||||||||||
| Springleaf Finance Corp. | 250,000 | 6.125 | 5/15/2022 | 270,000 | ||||||||||
| ELECTRIC - 0.3% | ||||||||||||||
| Vistra Operations Co. LLC - 144A | 460,000 | 3.550 | 7/15/2024 | 471,603 | ||||||||||
See accompanying notes to financial statements.
7
| SCHEDULE OF INVESTMENTS |
| Dunham Floating Rate Bond Fund (Continued) |
| October 31, 2019 |
| Principal | Interest | Maturity | ||||||||||
| Security | Amount | Rate % | Date | Value | ||||||||
| BONDS & NOTES - 3.8% (Continued) | ||||||||||||
| FOOD - 0.1% | ||||||||||||
| Dole Food Co., Inc. - 144A | $ | 175,000 | 7.250 | 6/15/2025 | $ | 167,562 | ||||||
| HEALTHCARE-SERVICES - 0.7% | ||||||||||||
| Eagle Holding Co. II LLC - 144A | 175,000 | 4.625 | 5/15/2022 | 176,969 | ||||||||
| Eagle Holding Co. II LLC - 144A | 280,000 | 7.750 | 5/15/2022 | 284,900 | ||||||||
| One Call Corp. - 144A | 638,167 | 7.500 | 7/01/2024 | 480,221 | ||||||||
| Tenet Healthcare Corp. | 405,000 | 4.625 | 7/15/2024 | 418,669 | ||||||||
| 1,360,759 | ||||||||||||
| HOME BUILDERS - 0.3% | ||||||||||||
| Lennar Corp. | 420,000 | 2.950 | 11/29/2020 | 421,575 | ||||||||
| TRI Pointe Group, Inc. | 130,000 | 4.875 | 7/01/2021 | 134,225 | ||||||||
| 555,800 | ||||||||||||
| INSURANCE - 0.1% | ||||||||||||
| Acrisure LLC - 144A | 90,000 | 8.125 | 2/15/2024 | 95,654 | ||||||||
| MEDIA - 0.6% | ||||||||||||
| CCO Holdings LLC - 144A | 180,000 | 4.000 | 3/01/2023 | 183,600 | ||||||||
| Clear Channel Worldwide Holdings, Inc. - 144A | 65,000 | 5.125 | 8/15/2027 | 67,823 | ||||||||
| Diamond Sports Group LLC - 144A | 210,000 | 5.375 | 8/15/2026 | 219,975 | ||||||||
| DISH DBS Corp. | 175,000 | 5.875 | 7/15/2022 | 183,673 | ||||||||
| iHeartCommunications, Inc. | 96,514 | 6.375 | 5/01/2026 | 103,994 | ||||||||
| iHeartCommunications, Inc. | 174,933 | 8.375 | 5/01/2027 | 188,490 | ||||||||
| Sirius XM Radio, Inc. - 144A | 85,000 | 4.625 | 7/15/2024 | 89,038 | ||||||||
| 1,036,593 | ||||||||||||
| OIL & GAS - 0.1% | ||||||||||||
| Denbury Resources, Inc. - 144A | 60,000 | 9.250 | 3/31/2022 | 49,500 | ||||||||
| Denbury Resources, Inc. - 144A | 185,000 | 7.750 | 2/15/2024 | 136,900 | ||||||||
| 186,400 | ||||||||||||
| PACKAGING & CONTAINERS - 0.1% | ||||||||||||
| Ardagh Packaging Finance PLC - 144A | 235,000 | 6.000 | 2/15/2025 | 247,338 | ||||||||
| PHARMACEUTICALS - 0.2% | ||||||||||||
| Bausch Health Companies, Inc. - 144A | 445,000 | 5.500 | 11/01/2025 | 466,698 | ||||||||
| PIPELINES - 0.1% | ||||||||||||
| Energy Transfer Operating LP | 190,000 | 4.250 | 3/15/2023 | 199,308 | ||||||||
| PRIVATE EQUITY - 0.2% | ||||||||||||
| Icahn Enterprises LP | 310,000 | 6.250 | 2/01/2022 | 318,137 | ||||||||
| REAL ESTATE INVESTMENT TRUSTS - 0.2% | ||||||||||||
| iStar, Inc. | 60,000 | 6.000 | 4/01/2022 | 61,725 | ||||||||
| iStar, Inc. | 335,000 | 5.250 | 9/15/2022 | 343,794 | ||||||||
| 405,519 | ||||||||||||
| RETAIL - 0.1% | ||||||||||||
| Cumberland Farms, Inc. - 144A | 125,000 | 6.750 | 5/01/2025 | 134,037 | ||||||||
| SEMICONDUCTORS - 0.5% | ||||||||||||
| Broadcom, Inc. - 144A | 1,000,000 | 3.125 | 10/15/2022 | 1,018,765 | ||||||||
| TELECOMMUNICATIONS - 0.0% | ||||||||||||
| Frontier Communications Corp. | 90,000 | 8.500 | 4/15/2020 | 52,200 | ||||||||
| TOTAL BONDS & NOTES (Cost - $7,657,330) | 7,263,765 | |||||||||||
See accompanying notes to financial statements.
8
| SCHEDULE OF INVESTMENTS |
| Dunham Floating Rate Bond Fund (Continued) |
| October 31, 2019 |
| Security | Shares | Value | ||||||||||
| COMMON STOCK - 0.1% | ||||||||||||
| ADVERTISING - 0.1% | ||||||||||||
| Clear Channel Outdoor Holdings, Inc. * | 40,131 | $ | 93,506 | |||||||||
| MEDIA - 0.0% | ||||||||||||
| iHeartMedia, Inc. - Class A * | 2,133 | 30,587 | ||||||||||
| iHeartMedia, Inc. - Class B * | 29 | 377 | ||||||||||
| 30,964 | ||||||||||||
| TOTAL COMMON STOCK (Cost - $271,898) | 124,470 | |||||||||||
| EXCHANGE TRADED FUNDS - 0.8% | ||||||||||||
| iShares iBoxx High Yield Corporate Bond ETF | 5,000 | 434,050 | ||||||||||
| SPDR Bloomberg Barclays High Yield Bond ETF | 5,000 | 540,950 | ||||||||||
| SPDR Bloomberg Barclays Short Term High Yield Bond ETF | 20,000 | 535,800 | ||||||||||
| TOTAL EXCHANGE TRADED FUNDS - (Cost - $1,520,623) | 1,510,800 | |||||||||||
| Expiration | ||||||||||||
| Date | ||||||||||||
| RIGHTS - 0.0% | ||||||||||||
| TRA Rights | 10,588 | 11/22/2049 | 9,370 | |||||||||
| TOTAL RIGHTS (Cost - $17,470) | ||||||||||||
| WARRANTS - 0.1% | ||||||||||||
| iHeartMedia, Inc. | 14,905 | 5/01/2039 | 208,329 | |||||||||
| TOTAL WARRANTS (Cost - $287,609) | ||||||||||||
| Principal | Interest | Maturity | ||||||||||
| Amount | Rate % | Date | ||||||||||
| U.S. GOVERNMENT - 1.1% | ||||||||||||
| Treasury Bill | $ | 2,000,000 | 1.471 + | 12/05/2019 | 1,997,190 | |||||||
| TOTAL U.S. GOVERNMENT(Cost - $1,996,355) | ||||||||||||
| SHORT-TERM INVESTMENT - 1.0% | Shares | |||||||||||
| MONEY MARKET FUND - 1.0% | ||||||||||||
| Fidelity Investments Money Market Fund - Class I | 1,812,679 | 1.720 + | 1,812,679 | |||||||||
| TOTAL SHORT-TERM INVESTMENT - (Cost - $1,812,679) | ||||||||||||
| TOTAL INVESTMENTS - 99.5% (Cost - $192,810,860) | 187,440,658 | |||||||||||
| OTHER ASSETS IN EXCESS OF LIABILITIES - 0.5% | 967,198 | |||||||||||
| NET ASSETS - 100.0% | $ | 188,407,856 | ||||||||||
ETF - Exchange Traded Fund
LIBOR - London Inter-bank Offered Rate
LP - Limited Partnership
LLC - Limited Liability Company
LLP - Limited Liability Partnership
PLC - Public Limited Company
SARL - Société à Responsabilité Limitée
144A- Security exempt from registration under Rule 144A of the Securities Act of 1933. These securities may be sold in transactions exempt from registration, normally to qualified institutional buyers. As of October 31, 2019 the total market value of 144A securities is $5,793,300 or 3.07% of net assets.
| * | Non-Income producing security. |
| + | Variable rate security. Interest rate is as of October 31, 2019. |
| # | Fair Value estimated using fair value procedures adopted by Board of Trustees. Total Value of such securities is $445 or 0.0% of net assets as of October 31, 2019. |
See accompanying notes to financial statements.
9
| SCHEDULE OF INVESTMENTS |
| Dunham Floating Rate Bond Fund (Continued) |
| October 31, 2019 |
| Portfolio Composition* - (Unaudited) | ||||||||||
| Bank Loans | 92.2 | % | Financial | 0.6 | % | |||||
| U.S. Government | 1.1 | % | Consumer, Cyclical | 0.4 | % | |||||
| Consumer, Non-Cyclical | 1.0 | % | Utilities | 0.3 | % | |||||
| Short-Term Investment | 1.0 | % | Energy | 0.2 | % | |||||
| Assets Backed Securities | 0.9 | % | Industrial | 0.1 | % | |||||
| Exchange Traded Funds | 0.8 | % | Warrants | 0.1 | % | |||||
| Technology | 0.7 | % | Rights | 0.0 | % | |||||
| Communications | 0.6 | % | Total | 100.0 | % | |||||
| * | Based on total value of investments as of October 31, 2019. |
Percentage may differ from Schedule of Investments which are based on Fund net assets.
See accompanying notes to financial statements.
10
| Dunham Long/Short Credit Fund (Unaudited) |
| Message from the Sub-Adviser (MetLife Investment Advisors LLC) |
Asset Class Recap
Although the magnitude of yield curve inversion dissipated since the start of the fiscal year, Treasury yields across maturities remained extremely flat. Therefore, opportunities to capitalize on yield spreads were primarily through corporate bonds and other debt securities. Treasury yields broadly fell during the fiscal year, as intermediate-term Treasuries, as measured by the BofA Merrill Lynch 5-7 Year Treasury Index, saw its yield decline 146 basis points during the fiscal year. During the most recent fiscal quarter, the decline in yields was 31 basis points. While intermediate -term corporate bond yields, as measured by the BofA Merrill Lynch 5-7 Year BBB U.S. Corporate Index, declined in lock-step during the fiscal quarter, during the fiscal year, intermediate-term corporate bonds experienced an approximate 20 basis points in spread contraction versus Treasuries. When comparing this to high-yield debt, spreads on single-B bonds, as measured by the BofA Merrill Lynch 5-7 Year B U.S. Cash Pay High-Yield Index, and CCC-rated bonds, as measured by the BofA Merrill Lynch 5-7 Year CCC & Lower U.S. Cash Pay High-Yield Index, both saw spreads widen during the most recent fiscal quarter by 20 to 40 basis points. This contributed to the fiscal year’s overall wide ning spreads on high-yield bonds, which widened by 70 to 270 basis points, with CCC-rated bond spreads widening the most.
Allocation Review
As yield spreads for high-yield bonds generally widened, this generally detracted from long/short credit strategies that benefit from taking long positions in higher-yielding bonds and short positions in Treasuries or lower-yielding bonds. Therefore, the Sub-Adviser’s arsenal of strategies that it implements were broadly tested during the most recent fiscal quarter and the fiscal year. For example, the Sub-Adviser retained meaningful weights in catalyst driven and opportunistic trades that have traditionally been short-term in nature. Opportunistic trading generally seeks to capitalize on short-term pricing anomalies that occasionally appear in the bond market. While these strategies generally comprise close to half of the Fund, credit shorts and rate hedging broadly comprise the other half. As the rate hedge provided neither benefit nor detriment, the credit shorts generally detracted as bonds overall rallied. The strongest contributors during the fiscal year were generally found within the long positions with underlying catalysts and in the opportunistic trades that allowed for short-term financing as they were brought to market.
Holdings Insights
As short credit positions broadly detracted, short positions such as the SWAPs on the iBoxx USD Liquid High-Yield Index (IBOXHY) (holding weight*: -15.00 percent) was one of the Fund’s poorest performers during the fiscal year. The IBOXHY increased 9.1 percent during the 12-month period, detracting a similar amount from the Fund due to the short position accessed through the SWAPs. Some short positions, such as the Dell Inc. SWAP contributed positively to Fund performance since the position was added in March. The Dell Inc. SWAP (holding weight*: -3.33 percent) was part of a pairs trade including a long position in the Xerox Corp. SWAP (holding weight*: 3.35 percent). Therefore, as the Dell Inc. SWAP increased 2.4 percent, the Xerox Corp. SWAP declined 1.6 percent. While the spread between these positions had widened during the fiscal year, generally detracting from performance, this overall spread compression between the two positions in the final fiscal quarter provided an overall net benefit to the Fund to end the fiscal year.
Within the Fund, the opportunistic bucket was diversified across multiple holdings, but one of the stronger contributors during the fiscal year was the participation in a new issue from Petroleos Mexicanos (aka “Pemex”) (71654QCW0) (holding weight**: 1.10 percent), the Mexican state-owned petroleum company. Pemex tendered for bonds during the final fiscal quarter and issued new long-term debt which came at a significant concession and rallied sharply in the secondary market. The Pemex bond in the Fund increased 5.3 percent from when it was added to the Fund in September until it was sold in Mid-October. The Fund’s position in the General Electric Capital International Funding Co. (36164QNA2) (holding weight*: 1.51 percent) also enjoyed the catalyst of disposing of part of its s take in Baker Hughes (holding weight: not held) and using the proceeds to tender for debt. Similar to Pemex, this action drove strong total returns in the bonds, as they surged 35.4 percent during the fiscal year. The catalyst driven strategy also benefitted from the materialization of a few credit positive events. For example, the Sprint Capital Corp. (852060AT9) (holding weight*: 1.04 percent) benefitted since it was added to the Fund in May as Sprint continued to make progress on its combination with T-Mobile U.S. Inc. (holding weight: not held), receiving merger approval from the DOJ near the end of the fiscal year. Although volatile, this news lifted the Sprint bonds higher to end the fiscal year with a 17.8 percent gain since it was added to the Fund. Similarly, the Viacom Inc. bond (92553PBC5) (holding weight*: 1.89 percent) enjoyed positive news on the merger front, agreeing to re-combine with CBS (holding weight: not held). This provided a lift to the Fund’s position in the hybrid bonds, which increased 22.7 percent since the position was added to the Fund in January.
Sub-Adviser Outlook
The Sub-Adviser believes that there is a broad risk-off bias amongst bond market participants. The Sub-Adviser sees this sentiment driving dispersion amongst risk assets, creating what it views as interesting opportunities. This dispersion is not solely exhibited amongst the quality and maturity spectrum, but is evident in the sector and single name dispersion, as well. While yields are depressed globally, there are many individual bonds and sectors where the Sub-Adviser can find high yielding, short dated assets that complement the strategies that it implements. The Sub-Adviser anticipates that this type of environment of elevated volatility will be particularly conducive to implementing non-directional strategies such as pairs trades. Ultimately, the Sub-Adviser has retained a more conservative approach to its selection across investment-grade and high-yield opportunities.
| * | Holdings percentage(s) of total investments as of 10/31/2019. |
| ** | Holding percentage(s) as of the date prior to the sale of the security. |
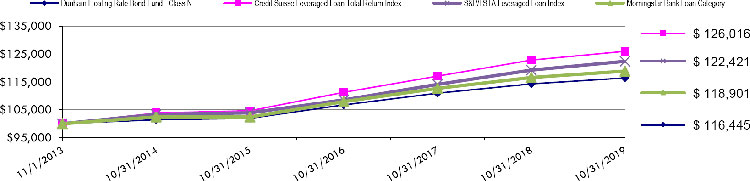
Growth of $100,000 Investment
| Total Returns(a) as of October 31, 2019 | |||
| Annualized | Annualized | ||
| One Year | Five Years | Ten Years | |
| Class N | 5.31% | 3.92% | 6.82% |
| Class C | 4.23% | 2.89% | 5.75% |
| Class A with load of 5.75% | (0.99)% | 2.45% | 5.92% |
| Class A without load | 5.06% | 3.66% | 6.55% |
| BofA Merrill Lynch US 3-Month Treasury Bill Index +3% | 5.47% | 4.05% | 3.57% |
| Morningstar Long-Short Credit Category | 3.55% | 1.39% | 3.14% |
(a) Total Returns are calculated based on traded NAVs.
The BofA Merrill Lynch US 3-Month Treasury Bill Index + 3% is comprised of a single issue purchased at the beginning of the month and held for a full month. At the end of the month that issue is sold and rolled in a newly selected issue. The issue selected at each month-end rebalancing is the outstanding Treasury Bill that matures closest to, but not beyond, three months from the rebalancing date. To qualify for selection, an issue must have settled on or before the month-end rebalancing date. Plus an annualized return of 3%.
The Morningstar Long-Short Credit Category is generally representative of funds that purchase or sell bonds, credit default swaps, or other credit derivatives to potentially benefit from changes in the credit markets and/or individual issuers.
| As disclosed in the Trust’s latest registration statement as supplemented the Fund’s total annual operating expenses, including the cost of underlying funds, are 1.66% for Class N, 2.66% for Class C and 1.91% for Class A. Class A shares are subject to a sales load of 5.75% and a deferred sales charge of up to 0.75%. The performance data quoted here represents past performance, which is not indicative of future results. Current performance may be lower or higher than the performance data quoted. The investment return and NAV will fluctuate, so that an investor’s shares, when redeemed, may be worth more or less than their original cost. Total returns are calculated assuming reinvestment of all dividends and capital gains distributions, if any. The returns do not reflect the deductions of taxes a shareholder would pay on the redemption of Fund shares or Fund distributions. For performance information current to the most recent month-end, please call 1-800-442-4358 or visit our website www.dunham.com |
11
| SCHEDULE OF INVESTMENTS |
| Dunham Long/Short Credit Fund |
| October 31, 2019 |
| Variable | Principal | Interest | Maturity | |||||||||||
| Security | Rate | Amount | Rate % | Date | Value | |||||||||
| BANK LOANS - 1.3% | ||||||||||||||
| HEALTHCARE PRODUCTS - 1.3% | ||||||||||||||
| Weight Watchers International, Inc. | LIBOR + 4.750% | $ | 1,070,608 | 7.249 | + | 11/29/2024 | $ | 1,070,908 | ||||||
| TOTAL BANK LOANS (Cost - $1,060,521) | ||||||||||||||
| BONDS & NOTES - 38.5% | ||||||||||||||
| AGRICULTURE - 0.9% | ||||||||||||||
| Bat Capital Corp. | 735,000 | 3.215 | 9/6/2026 | 731,657 | ||||||||||
| AIRLINES - 1.3% | ||||||||||||||
| American Airlines 2019-1 Class A Pass Through Trust | 990,000 | 3.500 | 8/15/2033 | 1,026,949 | ||||||||||
| BANKS - 3.0% | ||||||||||||||
| Goldman Sachs Capital I | 1,150,000 | 6.345 | 2/15/2034 | 1,494,202 | ||||||||||
| Wachovia Capital Trust II | 3 mo. LIBOR + 0.500% | 1,000,000 | 2.501 | + | 1/15/2027 | 936,955 | ||||||||
| 2,431,157 | ||||||||||||||
| CHEMICALS - 1.2% | ||||||||||||||
| Braskem Netherlands Finance BV - 144A | 1,000,000 | 4.500 | 1/31/2030 | 992,000 | ||||||||||
| COMPUTERS - 1.0% | ||||||||||||||
| Harland Clarke Holdings Corp. - 144A | 1,000,000 | 8.375 | 8/15/2022 | 802,500 | ||||||||||
| DIVERSIFIED FINANCIAL SERVICES - 5.0% | ||||||||||||||
| Citadel LP - 144A | 985,000 | 4.875 | 1/15/2027 | 1,031,707 | ||||||||||
| GE Capital International Funding Co. Unlimited Co. | 325,000 | 2.342 | 11/15/2020 | 324,878 | ||||||||||
| GE Capital International Funding Co. Unlimited Co. | 1,240,000 | 4.418 | 11/15/2035 | 1,310,953 | ||||||||||
| Global Aircraft Leasing Co. Ltd. - 144A | 1,455,000 | 6.500 | 9/15/2024 | 1,492,757 | ||||||||||
| 4,160,295 | ||||||||||||||
| ENTERTAINMENT - 1.6% | ||||||||||||||
| Enterprise Development Authority - 144A | 1,175,000 | 12.000 | 7/15/2024 | 1,292,500 | ||||||||||
| FOOD - 2.3% | ||||||||||||||
| JBS Investments GmbH - 144A | 258,000 | 6.250 | 2/5/2023 | 263,650 | ||||||||||
| JBS USA LLC - 144A | 700,000 | 5.875 | 7/15/2024 | 722,750 | ||||||||||
| Smithfield Foods, Inc. - 144A | 835,000 | 5.200 | 4/1/2029 | 922,576 | ||||||||||
| 1,908,976 | ||||||||||||||
| FOREST PRODUCTS & PAPER - 0.9% | ||||||||||||||
| Suzano Austria GmbH- 144A | 655,000 | 7.000 | 3/16/2047 | 762,666 | ||||||||||
| HEALTHCARE-SERVICES - 2.8% | ||||||||||||||
| CommonSpirit Health | 1,500,000 | 4.187 | 10/1/2049 | 1,543,244 | ||||||||||
| HCA, Inc. | 710,000 | 5.250 | 6/15/2049 | 788,779 | ||||||||||
| 2,332,023 | ||||||||||||||
| INSURANCE - 3.1% | ||||||||||||||
| Hallmark Financial Services, Inc. | 1,500,000 | 6.250 | 8/15/2029 | 1,554,375 | ||||||||||
| United Insurance Holdings Corp. | 1,000,000 | 6.250 | 12/15/2027 | 1,039,088 | ||||||||||
| 2,593,463 | ||||||||||||||
| IRON/STEEL - 1.7% | ||||||||||||||
| CSN Resources | 1,351,000 | 6.500 | 7/21/2020 | 1,381,398 | ||||||||||
| LODGING - 0.9% | ||||||||||||||
| Las Vegas Sands Corp. | 730,000 | 3.500 | 8/18/2026 | 745,132 | ||||||||||
| MEDIA - 2.0% | ||||||||||||||
| Viacom, Inc. | 3 mo. LIBOR + 3.899% | 150,000 | 6.250 | + | 2/28/2057 | 1,640,625 | ||||||||
| OIL & GAS - 5.7% | ||||||||||||||
| Occidental Petroleum Corp. | 3 mo. LIBOR + 1.450% | 1,500,000 | 3.637 | + | 8/15/2022 | 1,509,453 | ||||||||
| Transocean Poseidon Ltd. - 144A | 1,600,000 | 6.875 | 2/1/2027 | 1,621,232 | ||||||||||
| Transocean Sentry Ltd. - 144A | 1,570,000 | 5.375 | 5/15/2023 | 1,560,187 | ||||||||||
| 4,690,872 | ||||||||||||||
See accompanying notes to financial statements.
12
| SCHEDULE OF INVESTMENTS |
| Dunham Long/Short Credit Fund (Continued) |
| October 31, 2019 |
| Principal | Interest | Maturity | ||||||||||
| Security | Amount | Rate % | Date | Value | ||||||||
| BONDS & NOTES - 38.5% (Continued) | ||||||||||||
| SOVEREIGN - 0.4% | ||||||||||||
| Abu Dhabi Government International - 144A | $ | 310,000 | 3.125 | 9/30/2049 | $ | 299,116 | ||||||
| TELECOMMUNICATIONS - 4.7% | ||||||||||||
| Gogo Intermediate Holdings LLC - 144A | 500,000 | 9.875 | 5/1/2024 | 527,500 | ||||||||
| New Cingular Wireless Services, Inc. | 600,000 | 8.750 | 3/1/2031 | 850,795 | ||||||||
| Sprint Capital Corp. | 740,000 | 8.750 | 3/15/2032 | 904,191 | ||||||||
| Sprint Spectrum Co. LLC - 144A | 1,000,000 | 4.738 | 3/20/2025 | 1,068,760 | ||||||||
| Verizon Communications, Inc. | 420,000 | 6.000 | 4/1/2041 | 566,085 | ||||||||
| 3,917,331 | ||||||||||||
| TOTAL BONDS & NOTES (Cost - $30,307,579) | 31,708,660 | |||||||||||
| Shares | ||||||||||||
| COMMON STOCK - 0.0% | ||||||||||||
| TELECOMMUNICATIONS - 0.0% | ||||||||||||
| NII Holdings, Inc. * | 10,000 | 18,900 | ||||||||||
| TOTAL COMMON STOCK (Cost - $57,730) | ||||||||||||
| Principal | Interest | Maturity | ||||||||||
| Amount | Rate % | Date | ||||||||||
| U.S. GOVERNMENT - 52.1% | ||||||||||||
| TREASURY BILLS - 44.8% | ||||||||||||
| Treasury Bill | $ | 12,300,000 | 1.481 | + | 11/21/2019 | 12,289,630 | ||||||
| Treasury Bill | 12,310,000 | 1.471 | + | 12/5/2019 | 12,292,703 | |||||||
| Treasury Bill | 12,360,000 | 1.520 | + | 12/24/2019 | 12,329,328 | |||||||
| 36,911,661 | ||||||||||||
| TREASURY NOTES/BONDS - 7.3% | ||||||||||||
| Treasury Note / Bond | 2,475,000 | 1.625 | 8/15/2029 | 2,460,595 | ||||||||
| Treasury Note / Bond | 2,195,000 | 2.875 | 5/15/2049 | 2,529,909 | ||||||||
| Treasury Note / Bond | 1,050,000 | 2.250 | 8/15/2049 | 1,066,878 | ||||||||
| 6,057,382 | ||||||||||||
| TOTAL U.S. GOVERNMENT (Cost - $43,057,262) | 42,969,043 | |||||||||||
| Shares | ||||||||||||
| SHORT-TERM INVESTMENT - 8.2% | ||||||||||||
| MONEY MARKET FUND - 8.2% | ||||||||||||
| First American Government Obligations Fund - Class Z | 6,756,790 | 1.740 | + | 6,756,790 | ||||||||
| TOTAL SHORT-TERM INVESTMENT (Cost - $6,756,790) | ||||||||||||
| TOTAL INVESTMENTS - 100.1% (Cost - $81,239,882) | $ | 82,524,301 | ||||||||||
| LIABILITIES IN EXCESS OF OTHER ASSETS - (0.1)% | (84,274 | ) | ||||||||||
| TOTAL NET ASSETS - 100.0% | $ | 82,440,027 | ||||||||||
LIBOR - London Inter-Bank Offered Rate
LLC - Limited Liability Company
LP - Limited Partnership
| * | Non-income producing security. |
| + | Variable rate security. Interest rate is as of October 31, 2019. |
144A- Security exempt from registration under Rule 144A of the Securities Act of 1933. These securities may be sold in transactions exempt from registration, normally to qualified institutional buyers. As of October 31, 2019 the total market value of 144A securities is $13,359,901 or 16.2% of net assets.
| Short | Notional Value at | Maturity | Unrealized | ||||||||||
| Security | Contracts | October 31, 2019 | Date | Appreciation | |||||||||
| OPEN SHORT FUTURES CONTRACTS - (0.3)% | |||||||||||||
| U.S. 10 Year Treasury Note | 84 | $ | 10,944,938 | December-19 | $ | 33,297 | |||||||
| U.S. Treasury Long Bond | 69 | 11,134,875 | December-19 | 247,968 | |||||||||
| NET UNREALIZED GAIN FROM OPEN SHORT FUTURE CONTRACTS | $ | 281,265 | |||||||||||
See accompanying notes to financial statements.
13
| SCHEDULE OF INVESTMENTS |
| Dunham Long/Short Credit Fund (Continued) |
| October 31, 2019 |
CREDIT DEFAULT SWAPS
| Unrealized | ||||||||||||||||
| Notional Value at | Premium | Maturity | Appreciation/ | |||||||||||||
| Description | Counterparty | October 31, 2019 | Paid (Received) | Date | (Depreciation) | |||||||||||
| To Buy Protection - Commonwealth Bank of Australia | Goldman Sachs | $ | 2,000,000 | $ | (13,815 | ) | 12/20/2023 | $ | (45,009 | ) | ||||||
| To Buy Protection - CDX NA IG. 32 | HSBC Securities, Inc. | 1,000,000 | (19,527 | ) | 6/20/2024 | 40,289 | ||||||||||
| To Buy Protection - Prudential Financial, Inc. | JPMorgan | 3,000,000 | (43,017 | ) | 6/20/2024 | (16,592 | ) | |||||||||
| To Buy Protection - Xerox Corp. | JPMorgan | 3,000,000 | 162,334 | 6/20/2024 | (102,529 | ) | ||||||||||
| To Sell Protection - Dell, Inc. (1) | JPMorgan | (3,000,000 | ) | (153,458 | ) | 6/20/2024 | 112,098 | |||||||||
| To Buy Protection - Kraft Heinz Food | JPMorgan | 2,000,000 | (31,954 | ) | 6/20/2023 | (3,974 | ) | |||||||||
| To Sell Protection - Kraft Heinz Food (1) | Goldman Sachs | (2,000,000 | ) | 14,987 | 12/20/2023 | 19,878 | ||||||||||
| To Buy Protection - Newell Brands | Goldman Sachs | 2,000,000 | 22,030 | 12/20/2023 | (51,771 | ) | ||||||||||
| To Sell Protection - Newell Brands (1) | JPMorgan | (2,000,000 | ) | (32,614 | ) | 6/20/2023 | 63,418 | |||||||||
| NET UNREALIZED GAIN (LOSS) FROM CREDIT DEFAULT SWAPS | $ | 15,808 | ||||||||||||||
| TOTAL RETURN SWAPS | ||||||||||||||||
| Reference Entity | Variable Rate | |||||||||||||||
| iBoxx USD Liquid High Yield Index | JPMorgan | 3,000,000 | 3 mo LIBOR + 1.90% | 12/20/2019 | 935 | |||||||||||
| iBoxx USD Liquid High Yield Index | Goldman Sachs | 5,000,000 | 3 mo LIBOR + 1.90% | 12/26/2019 | 13,137 | |||||||||||
| iBoxx USD Liquid High Yield Index | JPMorgan | 5,000,000 | 3 mo LIBOR + 1.90% | 3/20/2020 | 13,154 | |||||||||||
| NET UNREALIZED GAIN (LOSS) FROM TOTAL RETURN SWAPS | $ | 27,226 | ||||||||||||||
LIBOR - London Inter-bank Offered Rate
| (1) | If the Fund is a seller of protection and if a credit event occurs, as defined under the terms of that particular swap agreement, the Fund will either (i) pay the buyer of protection an amount equal to the notional amount of the swap and take delivery of the referenced obligation or underlying securities comprising the referenced index or (ii) pay a net settlement amount in the form of cash or securities equal to the notional amount of the swap less the recovery value of the referenced obligation or underlying securities comprising of the referenced index. |
| Portfolio Composition*- (Unaudited) | ||||
| U.S. Government | 52.1 | % | ||
| Bonds & Notes | 38.4 | % | ||
| Short-Term Investment | 8.2 | % | ||
| Bank Loans | 1.3 | % | ||
| Common Stock | 0.0 | % | ||
| Total | 100.0 | % | ||
| * | Based on total value of investments as of October 31, 2019. |
Percentage may differ from Schedule of Investments which are based on Fund net assets.
See accompanying notes to financial statements.
14
| Dunham Corporate/Government Bond Fund (Unaudited) |
| Message from the Sub-Adviser (Newfleet Asset Management, LLC) |
Asset Class Recap
With interest rates declining, rather than increasing, the investment-grade fixed income market, as measured by the Bloomberg Barclays US Aggregate Bond Index, received yet another injection of life. The 10-year Treasury yield fell 32 basis points during the final fiscal quarter, bringing the total decline since the beginning of the fiscal year to 137 basis points. As investment-grade fixed bonds in general have an average duration of 5.8 years, this significant decline in rates generally translated to meaningful principal appreciation. During the most recent fiscal quarter, broad bonds advanced 2.4 percent. This healthy advance brought the performance since the start of the fiscal year into double-digits, finishing at 11.5 percent. Corporate bonds in general, as measured by the BofA Merrill Lynch Corporate Bond Index, surged 15.1 percent during the fiscal year while government bonds, as measured by the BofA Merrill Lynch Treasury & Agency Index, rose 11.3 percent. The significant decline in yields broadly supported most of these gains. Additionally, the Fed’s comments after each of its decisions to reduce rates has also been accommodative toward holders of higher duration bonds, as Fed Chair Powell has avoided using language that preempted the rate increases seen in previous years.
Allocation Review
The vast majority of the benchmark index is comprised of U.S. Treasuries and agency bonds, mortgage-backed securities, and investment-grade corporate bonds, with the Treasury and agency bonds making up 40 percent of the index alone. As the Sub-Adviser generally seeks to benefit from spread exposure and security selection, the Fund’s largest underweight is generally in the area of Treasury and agency bonds. Investment-grade corporate bonds were one of the best performing bond sectors during the fiscal year and also made up the largest allocation in the Fund, contributing positively to overall performance. Although the underweight to Treasuries generally detracted from absolute performance, the Fund’s exposure tended to be in longer maturities, which out performed and offset a significant portion of the adverse effect of the underweight. While the overall allocation across bond sectors remained fairly static during the past six months, since the start fiscal year the largest changes were represented by an overall decrease in the Fund’s exposure to high-yield and investment-grade corporate bonds, bank loans, and mortgage-backed securities. These reductions primarily coincided with increases in allocations to residential and commercial mortgage-backed securities and Treasuries.
Holdings Insights
The performance differences across bond sectors was fairly muted during the past six-month period. Therefore, the performance of individual holdings had a more meaningful impact on the Fund’s relative performance. For example, although the overall high-yield bond exposure in the Fund only slightly contributed to excess performance, high-yield holdings such as PulteGroup, Inc. 6.375% maturing in 2033 (745867AP6) (holding weight*: 0.27 percent), the third largest home construction company in the United States based on the number of homes closed, increased 30.8 percent during the fiscal year. The Pulte bond benefitted two-fold from the decline in interest rates, not only benefitting from the bond’s higher duration but also receiving a tailwind from increased housing affordability and buying activity due to lower mortgage rates. Within high-yield, the Fund also held Alliance Resource Operating Partners LP 7.5% maturing in 2025 (01879NAA3) (holding weight*: 0.11 percent), the largest coal producer in the Illinois Basin and the second largest coal producer in the eastern United States. The Alliance bond holding was one of the more significant detractors for the Fund since it was added in May, as it declined 18.6 percent along with a sharp sell-off in the value of coal and natural gas.
Residential mortgage-backed securities (RMBS) continued to be the Fund’s largest overweight during the fiscal year. While the RMBS exposure in the Fund provided positive overall performance, it slightly detracted on a relative basis. RMBS holdings in the Fund included the American Homes 4 Rent 4.691% maturing in 2045 (02666BAC0) (holding weight*: 0.46 percent) and the Mill City Mortgage Trust Adj% maturing in 2066 (59980YAB1) (holding weight*: 0.59 percent). Since each of these bonds’ addition to the Fund earlier in the fiscal year, the American Homes 4 Rent and Mill City Mortgage Trust appreciated 7.8 percent and 4.7 percent, respectively. Despite the moderate detraction from relative returns, the Sub-Adviser remains constructive on the space, as low unemployment, strong consumer confidence, and a growing economy continue to provide a positive backdrop to consumer credit and housing/residential credit. The Sub-Adviser also believes that stable underlying deal performance and spread give non-agency RMBS attractive metrics versus U.S. Treasuries and other short duration alternatives, which may serve the Fund well during periods of rising rates.
Sub-Adviser Outlook
The Sub-Adviser continues to believe that technicals are favorable for both high-yield and investment-grade corporate bonds. This view is also supported by the moderately growing economy and generally positive earnings releases. In addition, default rates have remained low, but the Sub-Adviser is cautious about credit conditions deteriorating. Specifically, credit downgrades saw a recent spike with single-B downgrades reaching a decade-high rate in September. There are also individual industries that concern the Sub-Adviser, particularly those tied to global commodities. Therefore, the Sub-Adviser believes that a risk-off environment could produce significant headwinds and has been careful to reduce exposures it believes are most prone to those significant declines.
| * | Holdings percentage(s) of total investments as of 10/31/2019. |
Growth of $100,000 Investment
| Total Returns(a) as of October 31, 2019 | |||
| Annualized | Annualized | ||
| One Year | Five Years | Ten Years | |
| Class N | 10.27% | 2.61% | 3.64% |
| Class C | 9.53% | 1.84% | 2.87% |
| Class A with load of 4.50% | 5.10% | 1.40% | 2.90% |
| Class A without load | 10.01% | 2.34% | 3.37% |
| Bloomberg Barclays US Aggregate Bond Index | 11.51% | 3.24% | 3.73% |
| Morningstar Intermediate Core Plus Bond Category | 10.37% | 3.18% | 4.29% |
| (a) | Total Returns are calculated based on traded NAVs. |
The Bloomberg Barclays US Aggregate Bond Index is an unmanaged index which represents the U.S. investment-grade fixed-rate bond market (including government and corporate securities, mortgage pass-through securities and asset-backed securities). Investors cannot invest directly in an index or benchmark.
The Morningstar Intermediate Core Plus Bond Category is generally representative of intermediate-term bond mutual funds that primarily invest in corporate and other investment-grade U.S. fixed-income securities and typically have durations of 3.5 to 6.0 years. Funds in this category also invest in high-yield and foreign bonds.
| As disclosed in the Trust’s latest registration statement, the Fund’s total annual operating expenses, including underlying funds, are 1.20% for Class N, 1.95% for Class C and 1.45% for Class A. Class A shares are subject to a sales load of 4.50% and a deferred sales charge of up to 0.75%. The performance data quoted here represents past performance, which is not indicative of future results. Current performance may be lower or higher than the performance data quoted. The investment return and NAV will fluctuate, so that an investor’s shares, when redeemed, may be worth more or less than their original cost. Total returns are calculated assuming reinvestment of all dividends and capital gains distributions, if any. The returns do not reflect the deductions of taxes a shareholder would pay on the redemption of Fund shares or Fund distributions. For performance information current to the most recent month-end, please call 1-800-442-4358 or visit our website www.dunham.com |
15
| SCHEDULE OF INVESTMENTS |
| Dunham Corporate/Government Bond Fund |
| October 31, 2019 |
| Variable | Principal | Interest | Maturity | |||||||||||
| Security | Rate | Amount | Rate % | Date | Value | |||||||||
| CORPORATE BONDS & NOTES - 66.7% | ||||||||||||||
| AEROSPACE / DEFENSE - 0.2% | ||||||||||||||
| TransDigm, Inc. - 144A | $ | 55,000 | 6.250 | 3/15/2026 | $ | 59,056 | ||||||||
| TransDigm, Inc. - 144A | 35,000 | 5.500 | 11/15/2027 | 34,972 | ||||||||||
| 94,028 | ||||||||||||||
| AGRICULTURE - 0.2% | ||||||||||||||
| Bunge Ltd Finance Corp. | 110,000 | 4.350 | 3/15/2024 | 116,454 | ||||||||||
| APPAREL - 0.1% | ||||||||||||||
| Under Armour, Inc. | 75,000 | 3.250 | 6/15/2026 | 72,480 | ||||||||||
| AUTO PARTS & EQUIPMENT - 0.6% | ||||||||||||||
| American Axle & Manufacturing, Inc. | 80,000 | 6.500 | 4/1/2027 | 76,100 | ||||||||||
| Lear Corp. | 165,000 | 3.800 | 9/15/2027 | 167,257 | ||||||||||
| Panther BF Aggregator 2 LP / Panther Finance Co., Inc. - 144A | 5,000 | 6.250 | 5/15/2026 | 5,298 | ||||||||||
| Tenneco, Inc. | 65,000 | 5.000 | 7/15/2026 | 51,675 | ||||||||||
| 300,330 | ||||||||||||||
| AUTOMOBILE ABS - 5.9% | ||||||||||||||
| American Credit Acceptance Receivables Trust 2017-2 - 144A | 41,032 | 2.860 | 6/12/2023 | 41,092 | ||||||||||
| American Credit Acceptance Receivables Trust 2018-3 - 144A | 165,000 | 3.750 | 10/15/2024 | 166,581 | ||||||||||
| American Credit Acceptance Receivables Trust 2019-2 - 144A | 125,000 | 3.170 | 6/12/2025 | 126,721 | ||||||||||
| Americredit Automobile Receivables Trust 2018-1 | 135,000 | 3.820 | 3/18/2024 | 140,509 | ||||||||||
| Avid Automobile Receivables Trust 2018-1 - 144A | 69,008 | 2.840 | 8/15/2023 | 69,110 | ||||||||||
| Avis Budget Rental Car Funding AESOP LLC - 144A | 150,000 | 3.070 | 9/20/2023 | 153,601 | ||||||||||
| Capital Auto Receivables Asset Trust 2017-1 - 144A | 160,000 | 2.700 | 9/20/2022 | 161,629 | ||||||||||
| Carmax Auto Owner Trust 2019-1 | 140,000 | 3.740 | 1/15/2025 | 145,980 | ||||||||||
| Carnow Auto Receivables Trust - 144A | 9,703 | 2.920 | 9/15/2022 | 9,704 | ||||||||||
| Carvana Auto Receivables Trust 2019-1 - 144A | 145,000 | 3.880 | 10/15/2024 | 149,620 | ||||||||||
| Carvana Auto Receivables Trust 2019-3 - 144A | 185,000 | 2.710 | 10/15/2024 | 185,636 | ||||||||||
| Centre Point Funding LLC - 144A | 32,456 | 2.610 | 8/20/2020 | 32,369 | ||||||||||
| CPS Auto Receivables Trust 2017-D - 144A | 56,516 | 2.430 | 1/18/2022 | 56,540 | ||||||||||
| Drive Auto Receivables Trust 2017-3 | 49,321 | 2.800 | 7/15/2022 | 49,366 | ||||||||||
| Drive Auto Receivables Trust 2017-A - 144A | 28,823 | 2.980 | 1/18/2022 | 28,848 | ||||||||||
| Drive Auto Receivables Trust 2019-1 | 165,000 | 3.780 | 4/15/2025 | 168,446 | ||||||||||
| Drive Auto Receivables Trust 2019-4 | 135,000 | 2.510 | 11/17/2025 | 135,328 | ||||||||||
| DT Auto Owner Trust 2017-3 - 144A | 71,121 | 3.010 | 5/15/2023 | 71,209 | ||||||||||
| DT Auto Owner Trust 2019-1 - 144A | 120,000 | 3.610 | 11/15/2024 | 122,530 | ||||||||||
| First Investors Auto Owner Trust 2017-2 - 144A | 135,000 | 2.650 | 11/15/2022 | 135,399 | ||||||||||
| First Investors Auto Owner Trust 2019-1 - 144A | 150,000 | 3.260 | 3/17/2025 | 153,477 | ||||||||||
| Flagship Credit Auto Trust 2017-3 - 144A | 160,000 | 2.910 | 9/15/2023 | 161,149 | ||||||||||
| Hertz Vehicle Financing II LP - 144A | 135,000 | 2.670 | 9/25/2021 | 135,581 | ||||||||||
| Hyundai Auto Lease Securitization Trust 2018-A - 144A | 4,414 | 2.550 | 8/17/2020 | 4,415 | ||||||||||
| OneMain Direct Auto Receivables Trust 2017-2 - 144A | 135,000 | 2.820 | 7/15/2024 | 135,471 | ||||||||||
| OneMain Direct Auto Receivables Trust 2018-1 - 144A | 125,000 | 3.850 | 10/14/2025 | 128,628 | ||||||||||
| Santander Drive Auto Receivables Trust 2016-1 | 18,012 | 3.090 | 4/15/2022 | 18,026 | ||||||||||
| Santander Drive Auto Receivables Trust 2017-1 | 72,805 | 2.580 | 5/16/2022 | 72,888 | ||||||||||
| Westlake Automobile Receivables Trust 2018-3 - 144A | 150,000 | 3.610 | 10/16/2023 | 152,565 | ||||||||||
| 3,112,418 | ||||||||||||||
| BANKS - 6.5% | ||||||||||||||
| Banco de Credito e Inversiones SA - 144A | 370,000 | 3.500 | 10/12/2027 | 385,564 | ||||||||||
| Bank of America Corp. | 106,000 | 4.200 | 8/26/2024 | 114,196 | ||||||||||
| Bank of Montreal | 5 Year Swap Rate US + 1.432% | 234,000 | 3.803 | + | 12/15/2032 | 242,986 | ||||||||
| Bank of New York Mellon Corp. | 3 Month LIBOR + 3.420% | 190,000 | 4.950 | + | 12/29/2049 | 191,944 | ||||||||
| BBVA Bancomer SA/Texas - 144A | 5 Year Treasury Note + 2.650% | 200,000 | 5.125 | + | 1/18/2033 | 195,502 | ||||||||
| Citigroup, Inc. | 160,000 | 4.050 | 7/30/2022 | 167,955 | ||||||||||
| Citigroup, Inc. | 222,000 | 3.200 | 10/21/2026 | 230,435 | ||||||||||
| Goldman Sachs Group, Inc. | 230,000 | 4.250 | 10/21/2025 | 247,941 | ||||||||||
| JPMorgan Chase & Co. | 3 Month LIBOR + 3.800% | 205,000 | 5.300 | + | 12/29/2049 | 208,119 | ||||||||
| M&T Bank Corp. | 3 Month LIBOR + 3.520% | 109,000 | 5.125 | + | 12/29/2049 | 116,456 | ||||||||
| Morgan Stanley | 120,000 | 6.375 | 7/24/2042 | 176,257 | ||||||||||
| PNC Financial Services Group, Inc. | 3 Month LIBOR + 3.300% | 170,000 | 5.000 | + | 12/29/2049 | 180,151 | ||||||||
| Santander Holdings USA, Inc. | 133,000 | 3.700 | 3/28/2022 | 136,766 | ||||||||||
See accompanying notes to financial statements.
16
| SCHEDULE OF INVESTMENTS |
| Dunham Corporate/Government Bond Fund (Continued) |
| October 31, 2019 |
| Variable | Principal | Interest | Maturity | |||||||||||
| Security | Rate | Amount | Rate % | Date | Value | |||||||||
| CORPORATE BONDS & NOTES - 66.7% (Continued) | ||||||||||||||
| BANKS - 6.5% (Continued) | ||||||||||||||
| Santander Holdings USA, Inc. | $ | 105,000 | 3.500 | 6/7/2024 | $ | 108,058 | ||||||||
| Santander Holdings USA, Inc. | 65,000 | 4.400 | 7/13/2027 | 70,024 | ||||||||||
| Synovus Financial Corp. | 5 Year Swap Rate US + 3.379% | 70,000 | 5.900 | + | 2/7/2029 | 75,075 | ||||||||
| Toronto-Dominion Bank | 5 Year Swap Rate US + 2.205% | 195,000 | 3.625 | + | 9/15/2031 | 203,724 | ||||||||
| UBS AG/Stamford CT | 250,000 | 7.625 | 8/17/2022 | 281,849 | ||||||||||
| Wells Fargo & Co. | 3 Month LIBOR + 3.110% | 115,000 | 5.900 | + | Perpetual | 124,282 | ||||||||
| 3,457,284 | ||||||||||||||
| BEVERAGES - 0.6% | ||||||||||||||
| Anheuser-Busch InBev Worldwide, Inc. | 50,000 | 4.000 | 4/13/2028 | 55,238 | ||||||||||
| Anheuser-Busch InBev Worldwide, Inc. | 40,000 | 4.750 | 1/23/2029 | 46,524 | ||||||||||
| Bacardi Ltd. - 144A | 200,000 | 4.700 | 5/15/2028 | 219,094 | ||||||||||
| 320,856 | ||||||||||||||
| BUILDING MATERIALS - 1.1% | ||||||||||||||
| CRH America Finance, Inc. - 144A | 200,000 | 3.400 | 5/9/2027 | 208,165 | ||||||||||
| Owens Corning | 165,000 | 3.400 | 8/15/2026 | 166,609 | ||||||||||
| Owens Corning | 25,000 | 3.950 | 8/15/2029 | 25,756 | ||||||||||
| Vulcan Materials Co. | 165,000 | 3.900 | 4/1/2027 | 175,463 | ||||||||||
| 575,993 | ||||||||||||||
| CHEMICALS - 0.9% | ||||||||||||||
| Celanese US Holdings LLC | 130,000 | 3.500 | 5/8/2024 | 134,300 | ||||||||||
| Olin Corp. | 120,000 | 5.625 | 8/1/2029 | 124,892 | ||||||||||
| SABIC Capital II BV - 144A | 200,000 | 4.500 | 10/10/2028 | 221,989 | ||||||||||
| 481,181 | ||||||||||||||
| COAL - 0.1% | ||||||||||||||
| Alliance Resource Operating Partners LP - 144A | 70,000 | 7.500 | 5/1/2025 | 59,500 | ||||||||||
| COMMERCIAL MBS - 4.5% | ||||||||||||||
| Aventura Mall Trust 2013-AVM - 144A | 155,000 | 3.743 | ++ | 12/5/2032 | 156,702 | |||||||||
| Aventura Mall Trust 2013-AVM - 144A | 100,000 | 3.867 | ++ | 12/5/2032 | 101,044 | |||||||||
| BAMLL Commercial Mortgage Securities Trust 2015-200P - 144A | 105,000 | 3.218 | 4/14/2033 | 110,631 | ||||||||||
| Caesars Palace Las Vegas Trust 2017-VICI - 144A | 100,000 | 4.138 | 10/15/2034 | 104,763 | ||||||||||
| CHC Commercial Mortgage Trust 2019 - CHC - 144A | 1 Month LIBOR + 1.120% | 235,000 | 3.034 | + | 6/15/2034 | 235,564 | ||||||||
| Citigroup Commercial Mortgage Trust 2013-375P - 144A | 135,000 | 3.518 | ++ | 5/10/2035 | 139,885 | |||||||||
| Citigroup Commercial Mortgage Trust 2019-SST2 - 144A | 1 Month LIBOR + 0.920% | 145,000 | 2.841 | + | 12/15/2036 | 144,876 | ||||||||
| Credit Suisse Mortgage Capital Certificates 2019-ICE4 - 144A | 1 Month LIBOR + 0.980% | 205,000 | 2.894 | + | 5/15/2036 | 205,449 | ||||||||
| GS Mortgage Securities Corp. Trust 2012-ALOHA - 144A | 252,000 | 3.551 | 4/10/2022 | 259,446 | ||||||||||
| Hilton USA Trust 2016-SFP - 144A | 185,000 | 3.323 | 11/5/2035 | 185,627 | ||||||||||
| JP Morgan Chase Commercial Mortgage Securities Trust 2011-C4 - 144A | 90,418 | 4.388 | 5/15/2021 | 92,662 | ||||||||||
| JPMBB Commercial Mortgage Securities Trust 2015-C31 | 125,000 | 4.106 | 8/15/2048 | 135,258 | ||||||||||
| Morgan Stanley Capital I Trust 2017-CLS - 144A | 1 Month LIBOR + 0.700% | 85,000 | 2.613 | + | 11/15/2034 | 85,009 | ||||||||
| One Market Plaza Trust 2017-1MKT - 144A | 105,000 | 3.614 | 2/10/2024 | 108,472 | ||||||||||
| Sutherland Commercial Mortgage Loans 2018-SBC7 - 144A | 69,858 | 4.720 | ++ | 5/25/2039 | 71,028 | |||||||||
| Wells Fargo Commercial Mortgage Trust 2015-LC20 | 125,000 | 3.184 | 4/15/2050 | 130,932 | ||||||||||
| WFRBS Commercial Mortgage Trust 2014-C24 | 125,000 | 3.931 | 11/15/2047 | 133,118 | ||||||||||
| 2,400,466 | ||||||||||||||
| COMMERCIAL SERVICES - 0.2% | ||||||||||||||
| DP World PLC - 144A | 100,000 | 6.850 | 7/2/2037 | 131,738 | ||||||||||
| COMPUTERS - 0.5% | ||||||||||||||
| Dell International LLC / EMC Corp. - 144A | 155,000 | 6.020 | 6/15/2026 | 177,046 | ||||||||||
| Hewlett Packard Enterprise Co. | 100,000 | 4.900 | 10/15/2025 | 112,024 | ||||||||||
| 289,070 | ||||||||||||||
| DISTRIBUTION / WHOLESALE - 0.0% | ||||||||||||||
| American Builders & Contractors Supply Co., Inc. - 144A | 15,000 | 4.000 | 1/15/2028 | 15,000 | ||||||||||
| DIVERSIFIED FINANCIAL SERVICES - 3.0% | ||||||||||||||
| AerCap Ireland Capital DAC / AerCap Global Aviation Trust | 150,000 | 3.650 | 7/21/2027 | 154,707 | ||||||||||
| Avolon Holdings Funding Ltd. - 144A | 125,000 | 4.375 | 5/1/2026 | 132,399 | ||||||||||
| Brightsphere Investment Group, Inc. | 165,000 | 4.800 | 7/27/2026 | 172,149 | ||||||||||
| Brookfield Finance LLC | 174,000 | 4.000 | 4/1/2024 | 185,549 | ||||||||||
| Capital One Financial Corp. | 120,000 | 4.200 | 10/29/2025 | 129,468 | ||||||||||
| Capital One Financial Corp. | 165,000 | 3.750 | 7/28/2026 | 174,259 | ||||||||||
| Citadel LP - 144A | 105,000 | 4.875 | 1/15/2027 | 109,979 | ||||||||||
| E*TRADE Financial Corp. | 175,000 | 4.500 | 6/20/2028 | 190,939 | ||||||||||
| Jefferies Group LLC | 14,000 | 6.875 | 4/15/2021 | 14,869 | ||||||||||
| Navient Corp. | 95,000 | 6.750 | 6/25/2025 | 100,434 | ||||||||||
| Springleaf Finance Corp. | 70,000 | 6.875 | 3/15/2025 | 79,450 | ||||||||||
| Synchrony Financial | 135,000 | 3.950 | 12/1/2027 | 140,764 | ||||||||||
| 1,584,966 | ||||||||||||||
See accompanying notes to financial statements.
17
| SCHEDULE OF INVESTMENTS |
| Dunham Corporate/Government Bond Fund (Continued) |
| October 31, 2019 |
| Variable | Principal | Interest | Maturity | |||||||||||
| Security | Rate | Amount | Rate % | Date | Value | |||||||||
| CORPORATE BONDS & NOTES - 66.7% (Continued) | ||||||||||||||
| ELECTRIC - 1.6% | ||||||||||||||
| CenterPoint Energy, Inc. | $ | 150,000 | 4.250 | 11/1/2028 | $ | 165,799 | ||||||||
| DPL, Inc. - 144A | 155,000 | 4.350 | 4/15/2029 | 154,961 | ||||||||||
| Exelon Corp. | 175,000 | 3.497 | 6/1/2022 | 180,142 | ||||||||||
| Pennsylvania Electric Co. - 144A | 140,000 | 3.600 | 6/1/2029 | 149,774 | ||||||||||
| Talen Energy Supply LLC - 144A | 60,000 | 6.625 | 1/15/2028 | 58,200 | ||||||||||
| Vistra Operations Co. LLC - 144A | 130,000 | 4.300 | 7/15/2029 | 135,276 | ||||||||||
| 844,152 | ||||||||||||||
| ENERGY - ALTERNATE SOURCES - 0.2% | ||||||||||||||
| TerraForm Power Operating LLC - 144A | 90,000 | 5.000 | 1/31/2028 | 95,373 | ||||||||||
| ENTERTAINMENT - 0.3% | ||||||||||||||
| Eldorado Resorts, Inc. | 35,000 | 6.000 | 9/15/2026 | 38,544 | ||||||||||
| Gateway Casinos & Entertainment Ltd. - 144A | 45,000 | 8.250 | 3/1/2024 | 46,462 | ||||||||||
| Scientific Games International, Inc. - 144A | 50,000 | 8.250 | 3/15/2026 | 53,000 | ||||||||||
| 138,006 | ||||||||||||||
| FOOD - 0.3% | ||||||||||||||
| Kraft Heinz Foods Co. | 165,000 | 3.000 | 6/1/2026 | 164,524 | ||||||||||
| HEALTHCARE PRODUCTS - 0.4% | ||||||||||||||
| Zimmer Biomet Holdings, Inc. | 230,000 | 3.550 | 4/1/2025 | 243,421 | ||||||||||
| HEALTHCARE - SERVICES - 0.7% | ||||||||||||||
| Anthem, Inc. | 105,000 | 2.875 | 9/15/2029 | 104,222 | ||||||||||
| Catalent Pharma Solutions, Inc. - 144A | 15,000 | 5.000 | 7/15/2027 | 15,712 | ||||||||||
| Charles River Laboratories International, Inc. - 144A | 25,000 | 4.250 | 5/1/2028 | 25,534 | ||||||||||
| HCA, Inc. | 65,000 | 5.375 | 2/1/2025 | 71,581 | ||||||||||
| HCA, Inc. | 135,000 | 4.125 | 6/15/2029 | 143,299 | ||||||||||
| 360,348 | ||||||||||||||
| HOME BUILDERS - 0.9% | ||||||||||||||
| Brookfield Residential Properties, Inc. - 144A | 110,000 | 6.250 | 9/15/2027 | 112,475 | ||||||||||
| PulteGroup, Inc. | 125,000 | 6.375 | 5/15/2033 | 142,813 | ||||||||||
| TRI Pointe Group, Inc. | 85,000 | 5.875 | 6/15/2024 | 91,800 | ||||||||||
| William Lyon Homes, Inc. | 135,000 | 6.000 | 9/1/2023 | 140,400 | ||||||||||
| 487,488 | ||||||||||||||
| HOME EQUITY ABS - 0.2% | ||||||||||||||
| GSAA Trust 2005-1 AF4 (a) | 36,546 | 5.619 | 11/25/2034 | 36,590 | ||||||||||
| NovaStar Mortgage Funding Trust Series 2004-4 | 1 Month LIBOR + 1.725% | 71,717 | 3.548 | + | 3/25/2035 | 72,512 | ||||||||
| 109,102 | ||||||||||||||
| INSURANCE - 1.5% | ||||||||||||||
| Allstate Corp. | 3 Month LIBOR + 2.938% | 150,000 | 5.750 | + | 8/15/2053 | 161,532 | ||||||||
| Athene Holding Ltd. | 135,000 | 4.125 | 1/12/2028 | 140,479 | ||||||||||
| MetLife, Inc. | 3 Month LIBOR + 2.959% | 76,000 | 5.875 | + | Perpetual | 82,947 | ||||||||
| Prudential Financial, Inc. | 3 Month LIBOR + 3.920% | 230,000 | 5.625 | + | 6/15/2043 | 249,404 | ||||||||
| Teachers Insurance & Annuity Association of America - 144A | 3 Month LIBOR + 2.661% | 110,000 | 4.375 | + | 9/15/2054 | 115,130 | ||||||||
| Trinity Acquisition PLC | 60,000 | 4.400 | 3/15/2026 | 65,049 | ||||||||||
| 814,541 | ||||||||||||||
| INTERNET - 0.1% | ||||||||||||||
| Expedia Group, Inc. - 144A | 80,000 | 3.250 | 2/15/2030 | 80,229 | ||||||||||
| INVESTMENT COMPANIES - 0.4% | ||||||||||||||
| FS KKR Capital Corp. | 64,000 | 4.250 | 1/15/2020 | 64,103 | ||||||||||
| Icahn Enterprises LP / Icahn Enterprises Finance Corp. | 130,000 | 6.250 | 5/15/2026 | 138,125 | ||||||||||
| 202,228 | ||||||||||||||
| LODGING - 0.1% | ||||||||||||||
| Wyndham Destinations, Inc. | 45,000 | 5.750 | 4/1/2027 | 49,331 | ||||||||||
| MACHINERY- CONSTRUCTION & MINING - 0.4% | ||||||||||||||
| Oshkosh Corp. | 183,000 | 4.600 | 5/15/2028 | 195,810 | ||||||||||
| MACHINERY- DIVERSIFIED - 0.3% | ||||||||||||||
| CNH Industrial NV | 137,000 | 4.500 | 8/15/2023 | 145,972 | ||||||||||
See accompanying notes to financial statements.
18
| SCHEDULE OF INVESTMENTS |
| Dunham Corporate/Government Bond Fund (Continued) |
| October 31, 2019 |
| Variable | Principal | Interest | Maturity | |||||||||||
| Security | Rate | Amount | Rate % | Date | Value | |||||||||
| CORPORATE BONDS & NOTES - 66.7% (Continued) | ||||||||||||||
| MEDIA - 0.9% | ||||||||||||||
| Diamond Sports Group LLC / Diamond Sports Finance Co. - 144A | $ | 55,000 | 5.375 | 8/15/2026 | $ | 57,613 | ||||||||
| Diamond Sports Group LLC / Diamond Sports Finance Co. - 144A | 30,000 | 6.625 | 8/15/2027 | 30,975 | ||||||||||
| Discovery Communications LLC | 160,000 | 3.950 | 3/20/2028 | 168,646 | ||||||||||
| DISH DBS Corp. | 80,000 | 5.875 | 7/15/2022 | 83,965 | ||||||||||
| iHeartCommunications, Inc. - 144A | 10,000 | 5.250 | 8/15/2027 | 10,342 | ||||||||||
| Meredith Corp. | 85,000 | 6.875 | 2/1/2026 | 88,037 | ||||||||||
| Sirius XM Radio, Inc. - 144A | 35,000 | 5.500 | 7/1/2029 | 37,921 | ||||||||||
| 477,499 | ||||||||||||||
| MINING - 0.8% | ||||||||||||||
| BHP Billiton Finance USA Ltd. - 144A | 5 Year Swap Rate USD + 5.093% | 200,000 | 6.750 | + | 10/19/2075 | 234,794 | ||||||||
| Glencore Funding LLC - 144A | 165,000 | 4.000 | 3/27/2027 | 171,285 | ||||||||||
| 406,079 | ||||||||||||||
| MISCELLANEOUS MANUFACTURING - 0.9% | ||||||||||||||
| General Electric Co. | 3 Month LIBOR + 3.330% | 136,000 | 5.000 | + | 12/29/2049 | 131,277 | ||||||||
| Hillenbrand, Inc. | 135,000 | 4.500 | 9/15/2026 | 139,391 | ||||||||||
| Pentair Finance Sarl | 180,000 | 4.500 | 7/1/2029 | 187,877 | ||||||||||
| 458,545 | ||||||||||||||
| OIL & GAS - 1.9% | ||||||||||||||
| CrownRock LP / CrownRock Finance, Inc. - 144A | 75,000 | 5.625 | 10/15/2025 | 73,595 | ||||||||||
| Helmerich & Payne, Inc. | 100,000 | 4.650 | 3/15/2025 | 108,702 | ||||||||||
| Holly Frontier Corp. | 165,000 | 5.875 | 4/1/2026 | 184,950 | ||||||||||
| Pertamina Persero PT - 144A | 200,000 | 6.450 | 5/30/2044 | 255,624 | ||||||||||
| Petroleos Mexicanos - 144A | 100,000 | 7.690 | 1/23/2050 | 108,914 | ||||||||||
| State Oil Co. of the Azerbaijan Republic | 200,000 | 6.950 | 3/18/2030 | 240,771 | ||||||||||
| Transocean Guardian Ltd. - 144A | 35,600 | 5.875 | 1/15/2024 | 35,778 | ||||||||||
| 1,008,334 | ||||||||||||||
| OIL & GAS SERVICES - 0.2% | ||||||||||||||
| USA Compression Partners LP / USA Compression Finance Corp. | 105,000 | 6.875 | 4/1/2026 | 106,575 | ||||||||||
| OTHER ABS - 10.5% | ||||||||||||||
| Ajax Mortgage Loan Trust 2019-D - 144A (a) | 193,247 | 2.956 | 9/25/2065 | 193,299 | ||||||||||
| American Homes 4 Rent 2014-SFR2 Trust - 144A | 230,000 | 4.705 | 10/17/2036 | 247,619 | ||||||||||
| American Homes 4 Rent 2015-SFR2 Trust - 144A | 220,000 | 4.691 | 10/17/2045 | 240,755 | ||||||||||
| Amur Equipment Finance Receivables VI LLC - 144A | 134,341 | 3.890 | 7/20/2022 | 136,663 | ||||||||||
| Aqua Finance Trust 2019-A - 144A | 160,000 | 3.140 | 7/16/2040 | 160,795 | ||||||||||
| Bayview Opportunity Master Fund IVa Trust 2017-RT1 - 144A | 65,524 | 3.000 | ++ | 3/28/2057 | 66,656 | |||||||||
| Bayview Opportunity Master Fund IVa Trust 2017-SPL5 - 144A | 100,000 | 4.000 | ++ | 6/28/2057 | 104,411 | |||||||||
| BRE Grand Islander Timeshare Issuer 2019-A LLC - 144A | 133,365 | 3.280 | 9/26/2033 | 136,874 | ||||||||||
| CoreVest American Finance 2018-1 Trust - 144A | 200,592 | 3.804 | 5/15/2023 | 209,004 | ||||||||||
| CoreVest American Finance 2018-2 Trust - 144A | 230,592 | 4.026 | 11/15/2052 | 244,527 | ||||||||||
| Diamond Resorts Owner Trust - 144A | 63,540 | 3.270 | 10/22/2029 | 64,277 | ||||||||||
| Foundation Finance Trust 2019-1 - 144A | 117,235 | 3.860 | 11/15/2034 | 119,406 | ||||||||||
| Marlette Funding Trust 2019-4 - 144A | 155,000 | 2.390 | 12/17/2029 | 155,494 | ||||||||||
| Mill City Mortgage Loan Trust 2017-1 - 144A | 74,212 | 2.750 | ++ | 11/25/2058 | 74,530 | |||||||||
| Mill City Mortgage Loan Trust 2018-4 - 144A | 295,000 | 3.500 | ++ | 4/25/2066 | 304,481 | |||||||||
| MVW 2019-2 LLC - 144A | 160,000 | 2.220 | 10/20/2038 | 160,013 | ||||||||||
| MVW Owner Trust 2016-1 - 144A | 51,552 | 2.250 | 12/20/2033 | 51,333 | ||||||||||
| MVW Owner Trust 2017-1 - 144A | 76,166 | 2.420 | 12/20/2034 | 76,431 | ||||||||||
| Orange Lake Timeshare Trust 2019-A - 144A | 135,088 | 3.360 | 4/9/2038 | 137,406 | ||||||||||
| PRPM 2019-2 LLC - 144A (a) | 184,289 | 3.967 | 4/25/2024 | 185,244 | ||||||||||
| Small Business Lending Trust 2019-A - 144A | 127,231 | 2.850 | 7/15/2026 | 127,601 | ||||||||||
| Sofi Consumer Loan Program 2017-5 LLC - 144A | 88,772 | 2.780 | 9/25/2026 | 89,132 | ||||||||||
| Sofi Consumer Loan Program 2017-6 LLC - 144A | 85,422 | 2.820 | 11/25/2026 | 85,791 | ||||||||||
| SoFi Consumer Loan Program 2019-3 Trust - 144A | 124,599 | 2.900 | 5/25/2028 | 125,525 | ||||||||||
| Towd Point Mortgage Trust - 144A | 172,000 | 3.250 | ++ | 10/25/2053 | 173,027 | |||||||||
| Towd Point Mortgage Trust 2015-6 - 144A | 130,000 | 3.750 | ++ | 4/25/2055 | 139,070 | |||||||||
| Towd Point Mortgage Trust 2017-1 - 144A | 246,741 | 2.750 | ++ | 10/25/2056 | 249,103 | |||||||||
| Towd Point Mortgage Trust 2017-1 - 144A | 115,000 | 3.750 | ++ | 10/25/2056 | 120,749 | |||||||||
| Towd Point Mortgage Trust 2018-4 - 144A | 204,952 | 3.000 | ++ | 6/25/2058 | 211,749 | |||||||||
| Towd Point Mortgage Trust 2018-6 - 144A | 185,000 | 3.750 | ++ | 3/25/2058 | 197,245 | |||||||||
| Towd Point Mortgage Trust 2018-SJ1 - 144A | 173,696 | 4.000 | ++ | 10/25/2058 | 175,569 | |||||||||
| Towd Point Mortgage Trust 2019-MH1 - 144A | 156,028 | 3.000 | ++ | 11/25/2058 | 158,243 | |||||||||
| Tricon American Homes 2017-SFR1 Trust - 144A | 99,552 | 2.716 | 9/17/2022 | 100,183 | ||||||||||
| Trinity Rail Leasing 2019 LLC - 144A | 122,968 | 3.820 | 4/17/2049 | 128,206 | ||||||||||
| TRIP Rail Master Funding LLC - 144A | 106,064 | 2.709 | 8/15/2047 | 106,234 | ||||||||||
| VOLT LXIV LLC - 144A (a) | 64,189 | 3.375 | 10/25/2047 | 64,472 | ||||||||||
| VOLT LXXV LLC - 144A (a) | 137,363 | 4.336 | 1/25/2049 | 138,708 | ||||||||||
| VSE 2017-A VOI Mortgage LLC - 144A | 73,260 | 2.330 | 3/20/2035 | 73,325 | ||||||||||
| 5,533,150 | ||||||||||||||
See accompanying notes to financial statements.
19
| SCHEDULE OF INVESTMENTS |
| Dunham Corporate/Government Bond Fund (Continued) |
| October 31, 2019 |
| Variable | Principal | Interest | Maturity | |||||||||||
| Security | Rate | Amount | Rate % | Date | Value | |||||||||
| CORPORATE BONDS & NOTES - 66.7% (Continued) | ||||||||||||||
| PACKAGING & CONTAINERS - 0.1% | ||||||||||||||
| Greif, Inc. - 144A | $ | 70,000 | 6.500 | 3/1/2027 | $ | 75,425 | ||||||||
| PHARMACEUTICALS - 0.7% | ||||||||||||||
| AbbVie, Inc. | 55,000 | 3.600 | 5/14/2025 | 57,760 | ||||||||||
| AbbVie, Inc. | 100,000 | 3.200 | 5/14/2026 | 102,490 | ||||||||||
| Mylan NV | 145,000 | 3.950 | 6/15/2026 | 150,980 | ||||||||||
| Par Pharmaceutical, Inc. - 144A | 50,000 | 7.500 | 4/1/2027 | 47,625 | ||||||||||
| 358,855 | ||||||||||||||
| PIPELINES - 2.2% | ||||||||||||||
| Cheniere Energy Partners LP | 55,000 | 5.625 | 10/1/2026 | 58,369 | ||||||||||
| Energy Transfer Partners LP | 165,000 | 4.200 | 4/15/2027 | 172,739 | ||||||||||
| Kinder Morgan Inc/DE | 160,000 | 4.300 | 6/1/2025 | 173,185 | ||||||||||
| Kinder Morgan Inc/DE | 45,000 | 7.750 | 1/15/2032 | 62,007 | ||||||||||
| MPLX LP | 55,000 | 4.875 | 12/1/2024 | 59,942 | ||||||||||
| MPLX LP - 144A | 135,000 | 4.250 | 12/1/2027 | 142,198 | ||||||||||
| NuStar Logistics LP | 145,000 | 5.625 | 4/28/2027 | 151,343 | ||||||||||
| Sabine Pass Liquefaction LLC | 100,000 | 6.250 | 3/15/2022 | 107,797 | ||||||||||
| Sabine Pass Liquefaction LLC | 85,000 | 4.200 | 3/15/2028 | 89,745 | ||||||||||
| Valero Energy Partners LP | 120,000 | 4.500 | 3/15/2028 | 131,632 | ||||||||||
| 1,148,957 | ||||||||||||||
| PRIVATE EQUITY - 0.3% | ||||||||||||||
| Apollo Management Holdings LP - 144A | 135,000 | 4.000 | 5/30/2024 | 142,147 | ||||||||||
| REITS - 4.7% | ||||||||||||||
| Alexandria Real Estate Equities, Inc. | 100,000 | 3.950 | 1/15/2027 | 107,752 | ||||||||||
| Corporate Office Properties LP | 196,000 | 3.600 | 5/15/2023 | 201,267 | ||||||||||
| EPR Properties | 220,000 | 4.750 | 12/15/2026 | 239,873 | ||||||||||
| ESH Hospitality, Inc. - 144A | 80,000 | 4.625 | 10/1/2027 | 80,408 | ||||||||||
| GLP Capital LP / GLP Financing II, Inc. | 155,000 | 5.750 | 6/1/2028 | 176,037 | ||||||||||
| Healthcare Realty Trust, Inc. | 90,000 | 3.875 | 5/1/2025 | 94,831 | ||||||||||
| Healthcare Trust of America Holdings LP | 150,000 | 3.750 | 7/1/2027 | 158,185 | ||||||||||
| Iron Mountain, Inc. - 144A | 110,000 | 4.875 | 9/15/2029 | 112,887 | ||||||||||
| Kilroy Realty LP | 165,000 | 4.375 | 10/1/2025 | 178,893 | ||||||||||
| Life Storage LP | 65,000 | 3.875 | 12/15/2027 | 69,010 | ||||||||||
| LifeStorage LP/CA | 205,000 | 3.500 | 7/1/2026 | 212,050 | ||||||||||
| MPT Operating Partnership LP / MPT Finance Corp. | 85,000 | 5.000 | 10/15/2027 | 89,675 | ||||||||||
| MPT Operating Partnership LP / MPT Finance Corp. | 25,000 | 4.625 | 8/1/2029 | 26,125 | ||||||||||
| Office Properties Income Trust | 170,000 | 4.500 | 2/1/2025 | 176,326 | ||||||||||
| Physicians Realty LP | 140,000 | 3.950 | 1/15/2028 | 147,533 | ||||||||||
| Retail Opportunity Investments Partnership LP | 105,000 | 4.000 | 12/15/2024 | 107,521 | ||||||||||
| SBA Tower Trust - 144A | 135,000 | 2.836 | 1/15/2025 | 136,529 | ||||||||||
| Service Properties Trust | 165,000 | 4.950 | 2/15/2027 | 169,769 | ||||||||||
| 2,484,671 | ||||||||||||||
| RETAIL - 0.7% | ||||||||||||||
| Dollar Tree, Inc. | 150,000 | 4.000 | 5/15/2025 | 161,418 | ||||||||||
| QVC, Inc. | 195,000 | 4.375 | 3/15/2023 | 202,682 | ||||||||||
| 364,100 | ||||||||||||||
| SEMICONDUCTORS - 0.3% | ||||||||||||||
| Broadcom Corp. / Broadcom Cayman Finance Ltd. | 144,000 | 3.625 | 1/15/2024 | 148,343 | ||||||||||
| SOFTWARE - 0.4% | ||||||||||||||
| Citrix Systems, Inc. | 120,000 | 4.500 | 12/1/2027 | 131,380 | ||||||||||
| Vmware, Inc. | 88,000 | 3.900 | 8/21/2027 | 90,914 | ||||||||||
| 222,294 | ||||||||||||||
| TELECOMMUNICATIONS - 1.1% | ||||||||||||||
| AT&T, Inc. | 3 Month LIBOR + 1.180% | 50,000 | 3.312 | + | 6/12/2024 | 50,903 | ||||||||
| AT&T, Inc. | 71,000 | 4.100 | 2/15/2028 | 77,452 | ||||||||||
| Frontier Communications Corp. - 144A | 70,000 | 8.500 | 4/1/2026 | 70,350 | ||||||||||
| Juniper Networks, Inc. | 120,000 | 3.750 | 8/15/2029 | 122,207 | ||||||||||
| Motorola Solutions, Inc. | 96,429 | 4.600 | 2/23/2028 | 105,228 | ||||||||||
| Motorola Solutions, Inc. | 50,000 | 4.600 | 5/23/2029 | 54,968 | ||||||||||
| Sprint Spectrum Co. LLC - 144A | 100,000 | 3.360 | 9/20/2021 | 100,875 | ||||||||||
| 581,983 | ||||||||||||||
| TRUCKING & LEASING - 0.7% | ||||||||||||||
| Aviation Capital Group LLC - 144A | 205,000 | 3.500 | 11/1/2027 | 206,013 | ||||||||||
| Penske Truck Leasing Co. LP - 144A | 140,000 | 4.125 | 8/1/2023 | 148,773 | ||||||||||
| 354,786 | ||||||||||||||
See accompanying notes to financial statements.
20
| SCHEDULE OF INVESTMENTS |
| Dunham Corporate/Government Bond Fund (Continued) |
| October 31, 2019 |
| Variable | Principal | Interest | Maturity | |||||||||||
| Security | Rate | Amount | Rate % | Date | Value | |||||||||
| CORPORATE BONDS & NOTES - 66.7% (Continued) | ||||||||||||||
| WHOLE LOAN COLLATERAL CMO - 8.5% | ||||||||||||||
| Angel Oak Mortgage Trust 2019-3 - 144A | $ | 140,657 | 2.930 | ++ | 5/25/2059 | $ | 142,607 | |||||||
| Angel Oak Mortgage Trust I LLC 2018-2 - 144A | 33,941 | 3.674 | ++ | 7/27/2048 | 34,384 | |||||||||
| Angel Oak Mortgage Trust I LLC 2019-1 - 144A | 166,874 | 3.920 | ++ | 11/25/2048 | 169,795 | |||||||||
| Arroyo Mortgage Trust 2019-2 - 144A | 91,294 | 3.347 | ++ | 4/25/2049 | 93,022 | |||||||||
| Banc of America Funding 2005-1 Trust | 38,712 | 5.500 | 2/25/2035 | 39,868 | ||||||||||
| Bunker Hill Loan Depositary Trust 2019-1 - 144A (a) | 84,059 | 3.613 | 10/26/2048 | 87,681 | ||||||||||
| Chase Home Lending Mortgage Trust 2019-ATR1 - 144A | 85,321 | 4.000 | ++ | 4/25/2049 | 88,794 | |||||||||
| Chase Mortgage Finance Corp. - 144A | 80,555 | 3.750 | ++ | 2/25/2044 | 84,650 | |||||||||
| Chase Mortgage Finance Corp. - 144A | 119,051 | 3.750 | ++ | 4/25/2045 | 123,771 | |||||||||
| Citigroup Mortgage Loan Trust 2019-IMC1 - 144A | 126,085 | 2.720 | ++ | 7/25/2049 | 126,780 | |||||||||
| Citigroup Mortgage Loan Trust 2019-RP1 - 144A | 183,857 | 3.500 | ++ | 1/25/2066 | 189,707 | |||||||||
| Citigroup Mortgage Loan Trust, Inc. | 43,166 | 6.750 | 8/25/2034 | 47,864 | ||||||||||
| COLT 2018-1 Mortgage Loan Trust - 144A | 28,146 | 2.930 | ++ | 2/25/2048 | 28,237 | |||||||||
| COLT 2019-3 Mortgage Loan Trust - 144A | 208,232 | 2.764 | ++ | 8/25/2049 | 210,349 | |||||||||
| Deephaven Residential Mortgage Trust 2017-2 - 144A | 46,761 | 2.453 | ++ | 6/25/2047 | 46,765 | |||||||||
| Ellington Financial Mortgage Trust 2017-1 - 144A | 117,603 | 2.687 | ++ | 10/25/2047 | 117,460 | |||||||||
| Ellington Financial Mortgage Trust 2019-1 - 144A | 96,510 | 2.934 | ++ | 6/25/2059 | 97,351 | |||||||||
| Galton Funding Mortgage Trust 2017-1 - 144A | 89,210 | 3.500 | ++ | 11/25/2057 | 90,173 | |||||||||
| Galton Funding Mortgage Trust 2018-2 - 144A | 66,819 | 4.500 | ++ | 10/25/2058 | 68,609 | |||||||||
| Homeward Opportunities Fund I Trust 2018-2 - 144A | 200,754 | 3.985 | ++ | 11/25/2058 | 205,298 | |||||||||
| JP Morgan Mortgage Trust 2005-A5 | 83,052 | 4.080 | ++ | 8/25/2035 | 84,961 | |||||||||
| JP Morgan Mortgage Trust 2017-5 - 144A | 249,066 | 3.178 | ++ | 12/15/2047 | 252,857 | |||||||||
| LHOME Mortgage Trust 2019-RTL1 - 144A (a) | 145,000 | 4.580 | 10/25/2023 | 148,266 | ||||||||||
| MASTR Alternative Loan Trust 2004-4 | 43,537 | 5.500 | 4/25/2034 | 46,182 | ||||||||||
| Metlife Securitization Trust - 144A | 100,000 | 3.716 | ++ | 4/25/2055 | 104,918 | |||||||||
| Metlife Securitization Trust 2019-1 - 144A | 136,595 | 3.750 | ++ | 4/25/2058 | 141,003 | |||||||||
| New Residential Mortgage Loan Trust 2016-4 - 144A | 93,086 | 3.750 | ++ | 11/25/2056 | 97,707 | |||||||||
| New Residential Mortgage Loan Trust 2018-1 - 144A | 187,511 | 4.000 | ++ | 12/25/2057 | 196,682 | |||||||||
| New Residential Mortgage Loan Trust 2019-NQM4 - 144A | 128,986 | 2.492 | ++ | 9/25/2059 | 130,128 | |||||||||
| OBX 2018-EXP2 Trust - 144A | 116,129 | 4.000 | ++ | 11/25/2048 | 117,692 | |||||||||
| OBX 2019-INV1 Trust - 144A | 131,892 | 4.500 | ++ | 11/25/2048 | 136,925 | |||||||||
| RCO V Mortgage LLC 2019-1 - 144A (a) | 94,943 | 3.721 | 5/24/2024 | 95,319 | ||||||||||
| Residential Asset Securitization Trust 2005-A1 | 70,666 | 5.500 | 4/25/2035 | 73,596 | ||||||||||
| Residential Mortgage Loan Trust 2019-2 - 144A | 177,683 | 2.913 | ++ | 5/25/2059 | 178,320 | |||||||||
| Structured Adjustable Rate Mortgage Loan Trust Series 2004-4 | 58,549 | 4.608 | ++ | 4/25/2034 | 61,393 | |||||||||
| Thornburg Mortgage Securities Trust 2004-2 | 1 Month LIBOR + 0.620% | 88,823 | 2.443 | + | 6/25/2044 | 89,570 | ||||||||
| Towd Point HE Trust 2019-HE1 - 144A | 1 Month LIBOR + 0.900% | 180,221 | 2.723 | + | 4/25/2048 | 180,914 | ||||||||
| Verus Securitization Trust 2018-1 - 144A | 42,971 | 2.929 | ++ | 2/25/2048 | 43,121 | |||||||||
| Verus Securitization Trust 2018-2 - 144A | 105,000 | 4.426 | ++ | 6/1/2058 | 106,751 | |||||||||
| Verus Securitization Trust 2018-3 - 144A | 106,298 | 4.108 | ++ | 10/25/2058 | 107,872 | |||||||||
| 4,487,342 | ||||||||||||||
| TOTAL CORPORATE BONDS & NOTES (Cost - $33,950,956) | 35,301,374 | |||||||||||||
| FOREIGN GOVERNMENT BONDS - 0.7% | ||||||||||||||
| Dominican Republic International Bond - 144A | 150,000 | 6.000 | 7/19/2028 | 166,314 | ||||||||||
| Turkey Government International Bond | 200,000 | 7.375 | 2/5/2025 | 214,944 | ||||||||||
| TOTAL FOREIGN GOVERNMENT BONDS - (Cost - $359,252) | 381,258 | |||||||||||||
| MUNICIPAL BONDS - 6.0% | ||||||||||||||
| City of Bristol VA | 340,000 | 4.210 | 1/1/2042 | 355,866 | ||||||||||
| Idaho Health Facilities Authority | 135,000 | 5.020 | 3/1/2048 | 168,895 | ||||||||||
| New York City Transitional Finance Authority Future Tax Secured Revenue | 265,000 | 4.000 | 5/1/2042 | 299,428 | ||||||||||
| Rockdale County Water & Sewerage Authority | 305,000 | 3.060 | 7/1/2024 | 314,269 | ||||||||||
| San Diego County Regional Airport Authority | 325,000 | 5.594 | 7/1/2043 | 372,312 | ||||||||||
| State of California | 765,000 | 7.600 | 11/1/2040 | 1,292,456 | ||||||||||
| State of Texas | 245,000 | 3.011 | 10/1/2026 | 260,523 | ||||||||||
| University of California | 115,000 | 4.428 | 5/15/2048 | 126,605 | ||||||||||
| TOTAL MUNICIPAL - (Cost - $2,955,354) | 3,190,354 | |||||||||||||
| U.S. GOVERNMENT & AGENCY - 18.1% | ||||||||||||||
| U.S. GOVERNMENT AGENCY - 4.0% | ||||||||||||||
| Fannie Mae Pool | 17,369 | 6.000 | 11/1/2034 | 19,995 | ||||||||||
| Fannie Mae Pool | 15,184 | 6.000 | 3/1/2036 | 17,451 | ||||||||||
| Fannie Mae Pool | 146,178 | 5.500 | 9/1/2036 | 164,493 | ||||||||||
| Fannie Mae Pool | 60,530 | 6.500 | 5/1/2037 | 71,841 | ||||||||||
| Fannie Mae Pool | 25,549 | 5.500 | 4/1/2038 | 28,736 | ||||||||||
| Fannie Mae Pool | 22,367 | 5.000 | 4/1/2038 | 24,974 | ||||||||||
| Fannie Mae Pool | 63,565 | 6.000 | 8/1/2038 | 73,000 | ||||||||||
See accompanying notes to financial statements.
21
| SCHEDULE OF INVESTMENTS |
| Dunham Corporate/Government Bond Fund (Continued) |
| October 31, 2019 |
| Variable | Principal | Interest | Maturity | |||||||||||
| Security | Rate | Amount | Rate % | Date | Value | |||||||||
| U.S. GOVERNMENT & AGENCY - 18.1% (Continued) | ||||||||||||||
| U.S. GOVERNMENT AGENCY - 4.0% (Continued) | ||||||||||||||
| Fannie Mae Pool | $ | 137,304 | 5.000 | 6/1/2039 | $ | 151,716 | ||||||||
| Fannie Mae Pool | 190,306 | 4.000 | 9/1/2044 | 201,229 | ||||||||||
| Fannie Mae Pool | 172,603 | 3.500 | 1/1/2046 | 179,982 | ||||||||||
| Fannie Mae Pool | 290,148 | 4.000 | 4/1/2046 | 306,396 | ||||||||||
| Fannie Mae Pool | 454,176 | 4.000 | 4/1/2048 | 474,809 | ||||||||||
| Fannie Mae Pool | 178,209 | 3.000 | 9/1/2049 | 181,431 | ||||||||||
| Freddie Mac Gold Pool | 159,447 | 5.000 | 12/1/2035 | 178,173 | ||||||||||
| Freddie Mac Gold Pool | 24,864 | 5.500 | 10/1/2039 | 27,963 | ||||||||||
| 2,102,189 | ||||||||||||||
| U.S. TREASURY OBLIGATIONS - 14.1% | ||||||||||||||
| United States Treasury Bond | 1,170,000 | 1.375 | 4/30/2020 | 1,168,674 | ||||||||||
| United States Treasury Bond | 105,000 | 2.625 | 8/31/2020 | 105,887 | ||||||||||
| United States Treasury Bond | 850,000 | 2.000 | 2/15/2025 | 869,225 | ||||||||||
| United States Treasury Bond | 1,165,000 | 2.875 | 8/15/2028 | 1,280,021 | ||||||||||
| United States Treasury Bond | 160,000 | 2.625 | 2/15/2029 | 173,022 | ||||||||||
| United States Treasury Bond | 3,290,000 | 3.000 | 8/15/2048 | 3,868,384 | ||||||||||
| 7,465,213 | ||||||||||||||
| TOTAL U.S. GOVERNMENT & AGENCY (Cost - $8,859,745) | 9,567,402 | |||||||||||||
| BANK LOANS - 4.3% | ||||||||||||||
| AEROSPACE - 0.1% | ||||||||||||||
| Atlantic Aviation FBO, Inc. Term Loan | 1 Month LIBOR + 3.750% | 14,888 | 5.652 | + | 12/06/2025 | 14,981 | ||||||||
| TransDigm, Inc. New Tranche E Term Loan | 1 Month LIBOR + 2.500% | 49,497 | 4.402 | + | 5/30/2025 | 49,185 | ||||||||
| 64,166 | ||||||||||||||
| CONSUMER NON-DURABLES - 0.2% | ||||||||||||||
| Kronos Acquisition Intermediate, Inc. Initial Loan | 1 Month LIBOR + 4.000% | 108,120 | 5.936 | + | 5/15/2023 | 102,473 | ||||||||
| ENERGY - 0.2% | ||||||||||||||
| Buckeye Partners, L.P. Term Loan | 1 Month LIBOR + 2.750% | 25,000 | 4.753 | + | 10/16/2026 | 25,145 | ||||||||
| CITGO Petroleum Corporation 2019 Incremental Term B Loan | 3 Month LIBOR + 5.000% | 64,675 | 7.085 | + | 3/27/2024 | 64,837 | ||||||||
| 89,982 | ||||||||||||||
| FOREST PROD/CONTAINERS - 0.1% | ||||||||||||||
| Berry Global, Inc. Term U Loan | 1 Month LIBOR + 2.500% | 54,863 | 4.486 | + | 7/01/2026 | 55,112 | ||||||||
| GAMING / LEISURE - 0.3% | ||||||||||||||
| Seminole Tribe of Florida 2018 Replacement Term B Loan | 1 Month LIBOR + 1.750% | 98,175 | 3.652 | + | 7/08/2024 | 98,780 | ||||||||
| Station Casinos LLC Term B Facility Loan | 1 Month LIBOR + 2.500% | 55,059 | 4.402 | + | 6/08/2023 | 55,191 | ||||||||
| 153,971 | ||||||||||||||
| HEALTHCARE - 0.6% | ||||||||||||||
| Bausch Health Companies, Inc. Initial Term Loan | 1 Month LIBOR + 3.000% | 8,613 | 5.002 | + | 6/02/2025 | 8,653 | ||||||||
| Bausch Health Companies, Inc. First Incremental Term Loan | 1 Month LIBOR + 2.750% | 26,250 | 4.752 | + | 11/27/2025 | 26,312 | ||||||||
| CHG Healthcare Services, Inc. New Term Loan (2017) | 1 Month LIBOR + 3.000% | 77,457 | 4.902 | + | 6/07/2023 | 77,464 | ||||||||
| Iqvia, Inc. Term B-3 Dollar Loan | 3 Month LIBOR + 1.750% | 108,625 | 3.835 | + | 6/11/2025 | 108,702 | ||||||||
| Regionalcare Hospital Partners Holdings, Inc. Term B Loan | 1 Month LIBOR + 4.500% | 99,250 | 6.436 | + | 11/16/2025 | 99,146 | ||||||||
| 320,277 | ||||||||||||||
| HOUSING - 0.9% | ||||||||||||||
| 84 Lumber Company Term B-1 Loan | 1 Month LIBOR + 5.250% | 74,677 | 7.178 | + | 10/25/2023 | 74,832 | ||||||||
| American Builders & Contractors Supply Co., Inc. Term B2 | 1 Month LIBOR + 2.000% | 105,000 | 3.927 | + | 1/15/2027 | 104,968 | ||||||||
| Capital Automotive L.P. Initial Tranche B-2 Term Loan | 1 Month LIBOR + 2.500% | 108,644 | 4.402 | + | 3/25/2024 | 108,740 | ||||||||
| CPG International LLC New Term Loan | 3 Month LIBOR + 3.750% | 94,275 | 5.835 | + | 5/06/2024 | 93,097 | ||||||||
| Summit Materials, LLC New Term Loan | 1 Month LIBOR + 2.000% | 98,992 | 3.902 | + | 11/21/2024 | 99,317 | ||||||||
| 480,954 | ||||||||||||||
| INFORMATION TECHNOLOGY - 0.2% | ||||||||||||||
| Boxer Parent Company, Inc. Initial Dollar Term Loan | 1 Month LIBOR + 4.250% | 44,175 | 6.152 | + | 10/02/2025 | 41,067 | ||||||||
| Kronos Incorporated Incremental Term Loan | 3 Month LIBOR + 3.000% | 78,625 | 5.287 | + | 11/01/2023 | 78,570 | ||||||||
| 119,637 | ||||||||||||||
See accompanying notes to financial statements.
22
| SCHEDULE OF INVESTMENTS |
| Dunham Corporate/Government Bond Fund (Continued) |
| October 31, 2019 |
| Variable | Principal | Interest | Maturity | |||||||||||
| Security | Rate | Amount | Rate % | Date | Value | |||||||||
| BANK LOANS - 4.3% (Continued) | ||||||||||||||
| MEDIA / TELECOMMUNICATIONS - 0.5% | ||||||||||||||
| CenturyLink, Inc. Initial Term B Loan | 1 Month LIBOR + 2.750% | $ | 112,988 | 4.652 | + | 1/31/2025 | $ | 112,006 | ||||||
| Commscope, Inc. Initial Term Loan | 1 Month LIBOR + 3.250% | 40,000 | 5.152 | + | 4/04/2026 | 39,313 | ||||||||
| Nexstar Broadcasting, Inc. Term Loan B | 1 Month LIBOR + 2.750% | 85,000 | 4.686 | + | 9/18/2026 | 85,419 | ||||||||
| 236,738 | ||||||||||||||
| SERVICE - 0.5% | ||||||||||||||
| Dun & Bradstreet Corporation Initial Term Borrowing | 1 Month LIBOR + 5.000% | 95,000 | 6.936 | + | 2/06/2026 | 95,386 | ||||||||
| Sedgwick Claims Management Services, Inc. Initial Term Loan | 1 Month LIBOR + 3.250% | 104,461 | 5.152 | + | 12/31/2025 | 101,564 | ||||||||
| TKC Holdings, Inc. Initial Term Loan | 1 Month LIBOR + 3.750% | 82,282 | 5.652 | + | 2/01/2023 | 79,931 | ||||||||
| 276,881 | ||||||||||||||
| TRANSPORTATION - AUTOMOTIVE - 0.3% | ||||||||||||||
| Navistar, Inc. Tranche B Term Loan | 1 Month LIBOR + 3.500% | 88,650 | 5.503 | + | 11/06/2024 | 87,930 | ||||||||
| Panther BF Aggregator 2 L P Initial Dollar Term Loan | 1 Month LIBOR + 3.500% | 65,000 | 5.409 | + | 4/30/2026 | 64,269 | ||||||||
| 152,199 | ||||||||||||||
| UTILITY - 0.4% | ||||||||||||||
| Brookfield WEC Holdings, Inc. Initial Term Loan | 1 Month LIBOR + 3.500% | 119,300 | 5.402 | + | 8/01/2025 | 118,728 | ||||||||
| Calpine Corporation Term Loan (2019) | 3 Month LIBOR + 2.750% | 99,750 | 4.835 | + | 4/05/2026 | 99,975 | ||||||||
| 218,703 | ||||||||||||||
| TOTAL BANK LOANS - (Cost - $2,276,379) | 2,271,093 | |||||||||||||
| TOTAL INVESTMENTS - 95.8% (Cost - $48,401,686) | $ | 50,711,481 | ||||||||||||
| OTHER ASSETS IN EXCESS OF LIABILITIES - 4.2% | 2,200,651 | |||||||||||||
| NET ASSETS - 100.0% | $ | 52,912,132 | ||||||||||||
LLC - Limited Liability Corporation
ABS - Asset Backed Security
MBS - Mortgage Backed Security
CMO - Collateralized Mortgage Obligation
LP - Limited Partnership
REITS - Real Estate Investment Trust
Perpetual - Perpetual bonds are fixed income instruments without defined maturity dates
| + | Variable rate security. Interest rate is as of October 31, 2019. |
| ++ | Variable or floating rate security, the interest rate of which adjusts periodically based on changes in current interest rates and prepayments on the underlying pool of assets. |
144A - Security exempt from registration under Rule 144A of the Securities Act of 1933. These securities may be sold in transactions exempt from registration, normally to qualified institutional buyers. The 144A securities amounted to $19,403,904 or 36.67% of net assets.
| (a) | Step-Up Bond; the interest rate shown is the rate in effect as of October 31, 2019. |
| Portfolio Composition* - (Unaudited) | ||||||||||
| Corporate Bonds & Notes | 69.4 | % | Foreign Government Bonds | 0.8 | % | |||||
| U.S. Government & Agencies | 18.8 | % | Total | 100.0 | % | |||||
| Municipal | 6.3 | % | ||||||||
| Bank Loans | 4.7 | % | ||||||||
| * | Based on total value of investments as of October 31, 2019. |
Percentage may differ from Schedule of Investments which is based on Fund net assets.
See accompanying notes to financial statements.
23
| Dunham Monthly Distribution Fund (Unaudited) |
| Message from the Sub-Adviser (Weiss Multi-Strategy Advisers LLC) |
Asset Class Recap
As the fiscal year began with lingering fears and uncertainty surrounding trade deals and interest rates, investors broadly approached each new headline with caution and even some trepidation. During the first fiscal quarter, the volatility reached levels seen only four other times in the last decade. Volatility relatively subsided through the second and third fiscal quarters, but meaningfully spiked once again to begin the most recent fiscal quarter, as heightened concerns regarding trade between the U.S. and both China and the European Union weighed on investors. Similar to the beginning of the fiscal year, these sell-offs and corresponding spikes in volatility were generally triggered by “concerns” and headlines rather than deteriorating fundamentals. Regardless of the cause, volatility spikes generally correspond with widening spreads on merger deals and other risk-arbitrage opportunities therefore, the fact that volatility levels subsided before the end of the fiscal quarter allowed for these risk-arbitrage strategies to recover and rally. During the fiscal year, event driven strategies, as measured by the Credit Suisse Event Driven Liquid Index, rose 9.7 percent. While bro ader in scope, long/short equity strategies, as measured by the Credit Suisse Long/Short Liquid Index, increased 5.3 percent.
Allocation Review
Within the Fund, the event driven allocation is primarily represented in the form of announced mergers. The event driven holdings allocation fell to a low of 38 percent in the second fiscal quarter as prominent positions came to fruition. As predicted by the Sub-Adviser, this allocation rose to approximately 47 percent by the end of the most recent fiscal quarter as the Sub-Adviser was able to identify above average spreads in strategic deals with manageable regulatory hurdles. Despite the increase in the event allocation, announcements for new deals have slowed. The Sub-Adviser attributes the lack of new deals to uncertainty around both the economic outlook and the predicted regulatory framework. Executives are unlikely to make transformational mergers. With that being said, the Fund finished the fiscal year with a l ower than average gross exposure, giving the Sub-Adviser the ability to easily capitalize on alpha generating opportunities when they present themselves.
Holdings Insights
The largest pharmaceutical deal ever, combining two of the world’s largest cancer drug businesses, was announced in the first fiscal quarter of this year and has been a highlight of the Fund’s event driven allocation ever since. The deal spread between Celgene Corp. (CELG) (holding weight: 9.25 percent) and Bristol-Myers Squibb Co. (BMY) (holding weight*: -5.23 percent) has compressed over the fiscal year following the deal receiving the backing from a prominent proxy advisory firm. The Sub-Adviser is confident that the deal will close. Over the previous fiscal quarter, BMY reported impressive earnings, and reiterated the target of completion and timing for the deal’s approval. Another contributor from the event driven allocation originally came from Chevron Corp.’s (CVX) (holding weight**: -1.24 percent) announcement that they intend to acquire Anadarko Petroleum Corp. (APC) (holding weight**: 6.73 percent) in the second fiscal quarter. Although the spread was not initially attractive, the prospect of another suitor was intriguing enough for the Sub-Adviser to enter the deal. On April 29, 2019, Occidental Petroleum Corp. (OXY) (holding weight*: 0.29 percent) made an offer to acquire all outstanding shares of APC. The spread on this deal tightened from a high of $3.94 to closing in the beginning of this most recent fiscal quarter.
Many other mergers closed within the Fund over the fiscal year including Nexstar Media Group’s (NXST) (not held) acquisition of Tribune Media Company (TRCO) (holding weight**: 2.12 percent), Salesforce.com Inc.’s (CRM) (holding weight**: 1.21 percent) acquisition of Tableau Software Inc. (DATA) (holding weight**: 3.47 percent), UGI Corps (UGI) (holding weight**: -0.56 percent) acquisition of AmeriGas Partners (APU) (holding weight**: 0.75percent), and Health Equity Inc.’s (HQY) (not held) acquisition of WageWorks, Inc. (WAGE) (holding weight**: 0.50 percent).
The low net profile of the long / short equity allocation within the Fund resulted in a negative contribution to Fund performance over the most recent fiscal year. The market hedges were, as expected, a positive contributor to Fund performance during the heightened volatility. However, as markets rallied, these hedges acted as a headwind to performance. For example, the short positions in the iShares U.S. Real Estate ETF (IYR) (holding weight*: -0.75 percent) and the SPDR S&P 500 ETF Trust (SPY) (holding weight*: -2.54) detracted from Fund performance during the fiscal year as these positions increased 24.1 percent and 14.3 percent, respectively. The exposure to the financial sector within the long / short equity allocation also detracted from Fund performance as macro headlines, yield curve inversion, and recession concerns weighed on the sector. Overall, the derivative exposure had a muted impact on performance. Some broad market options had mea ningful moves during the fiscal year but were generally offsetting due to the structure of the trade.
Sub-Adviser Outlook
Throughout the spikes in volatility and subsequent rallies throughout the fiscal year, the Sub-Adviser continued to reiterate its commitment to its investment approach and philosophy, focusing on capital preservation and opportunistically looking to deploy capital as appropriate. The Sub-Adviser’s multi-lens approach served the Fund during the volatility throughout the beginning of 2019, and the Sub-Adviser is optimistic that its approach is well suited for additional volatility that may arise through the end of the calendar year.
| * | Holdings percentage(s) of total investments, excluding collateral for securities loaned, as of 10/31/2019. |
| ** | Holding percentage(s) as of the date prior to the sale of the security. |
Growth of $100,000 Investment
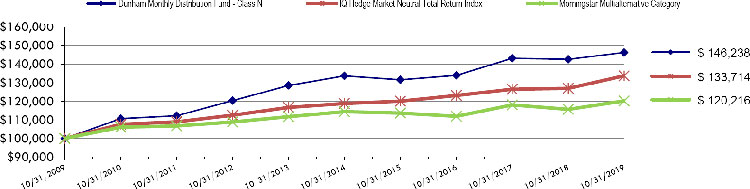
| Total Returns(a)as of October 31, 2019 | |||
| Annualized | Annualized | ||
| One Year | Five Years | Ten Years | |
| Class N | 2.55% | 1.82% | 3.87% |
| Class C | 1.52% | 0.80% | 2.84% |
| Class A with load of 5.75% | (3.58)% | 0.37% | 2.99% |
| Class A without load | 2.30% | 1.56% | 3.60% |
| IQ Hedge Market Neutral Total Return Index | 5.32% | 2.38% | 2.95% |
| Morningstar Multialternative Category | 3.91% | 0.99% | 1.86% |
| (a) | Total Returns are calculated based on traded NAVs. |
IQ Hedge Market Neutral Total Return Index seeks to replicate the risk-adjusted return characteristics of the collective hedge funds using a market neutral hedge fund investment style. Market Neutral hedge funds typically invest in both long and short positions in asset classes while minimizing exposure to systematic risk.
The Morningstar Multialternative Category is generally representative of mutual funds with static allocations to alternative strategies and mutual funds that tactically allocate among alternative strategies and asset classes. The gross short exposure in these mutual funds is generally greater than 20%.
| As disclosed in the Trust’s latest registration statement, the Fund’s total annual operating expenses before any fee waiver, including the cost of underlying funds, are 2.17% for Class N, 3.17% for Class C and 2.42% for Class A. Class A shares are subject to a sales load of 5.75% and a deferred sales charge of up to 0.75%. The performance data quoted here represents past performance, which is not indicative of future results. Current performance may be lower or higher than the performance data quoted. The investment return and NAV will fluctuate, so that an investor’s shares, when redeemed, may be worth more or less than their original cost. Total returns are calculated assuming reinvestment of all dividends and capital gains distributions, if any. The returns do not reflect the deductions of taxes a shareholder would pay on the redemption of Fund shares or Fund distributions. For performance information current to the most recent month-end, please call 1-800-442-4358 or visit our website www.dunham.com. |
24
| SCHEDULE OF INVESTMENTS |
| Dunham Monthly Distribution Fund |
| October 31, 2019 |
| Security | Shares | Value | ||||||
| COMMON STOCKS - 69.4% | ||||||||
| AEROSPACE/DEFENSE - 2.5% | ||||||||
| Boeing Co. | 3,762 | $ | 1,278,741 | |||||
| Harris Corp. | 18,355 | 3,786,820 | ||||||
| United Technologies Corp. | 9,421 | 1,352,667 | ||||||
| 6,418,228 | ||||||||
| AIRLINES - 0.1% | ||||||||
| American Airlines Group, Inc. | 2,410 | 72,445 | ||||||
| AMR Corp. * # | 101,283 | 126,604 | ||||||
| 199,049 | ||||||||
| APPAREL - 1.3% | ||||||||
| Nike, Inc. | 36,493 | 3,267,948 | ||||||
| AUTO MANUFACTURERS - 1.1% | ||||||||
| Fiat Chrysler Automobiles | 60,216 | 922,509 | ||||||
| General Motors Co. | 55,138 | 2,048,928 | ||||||
| 2,971,437 | ||||||||
| BANKS - 2.4% | ||||||||
| Citigroup, Inc. | 42,254 | 3,036,372 | ||||||
| SunTrust Banks, Inc. | 47,925 | 3,275,195 | ||||||
| 6,311,567 | ||||||||
| BIOTECHNOLOGY - 10.6% | ||||||||
| Alder BioPharmaceuticals, Inc. * # | 10,079 | 20,158 | ||||||
| Cambrex Corp. * | 18,529 | 1,106,737 | ||||||
| Celgene Corp. * | 234,872 | 25,373,222 | ||||||
| Corteva, Inc. | 38,024 | 1,003,073 | ||||||
| 27,503,190 | ||||||||
| BUILDING MATERIALS - 0.5% | ||||||||
| Masco Corp. | 28,901 | 1,336,671 | ||||||
| CHEMICALS - 1.5% | ||||||||
| A. Schulman, Inc. * # | 44,665 | 33,499 | ||||||
| Axalta Coating Systems Ltd. * | 39,621 | 1,168,423 | ||||||
| Huntsman Corp. | 117,393 | 2,597,907 | ||||||
| International Flavors & Fragrances, Inc. | -~ | 7 | ||||||
| 3,799,836 | ||||||||
| COMPUTERS - 0.8% | ||||||||
| Apple, Inc. | 8,880 | 2,208,989 | ||||||
| COSMETICS - 1.0% | ||||||||
| Procter & Gamble Co. | 21,022 | 2,617,449 | ||||||
| DIVERSIFIED FINANCIAL SERVICES - 0.2% | ||||||||
| Alliance Data Systems Corp. | 5,264 | 526,400 | ||||||
| ELECTRIC - 0.5% | ||||||||
| El Paso Electric Co. | 20,674 | 1,379,163 | ||||||
| GAMING & LEISURE - 2.4% | ||||||||
| Stars Group, Inc. * | 282,718 | 6,151,944 | ||||||
| HEALTHCARE - PRODUCTS - 0.8% | ||||||||
| Danaher Corp. | 15,132 | 2,085,492 | ||||||
| HEALTHCARE - SERVICES - 0.5% | ||||||||
| Centene Corp. * | 24,112 | 1,279,865 | ||||||
| HOLDING COMPANIES - DIVERSIFIED - 1.9% | ||||||||
| 8I Enterprises Acquisition Corp. * | 42,550 | 424,224 | ||||||
| Alberton Acquisition Corp. * | 84,727 | 868,452 | ||||||
| Boxwood Merger Corp. * | 111,882 | 1,131,127 | ||||||
| Legacy Acquisition Corp. * | 124,493 | 1,274,808 | ||||||
See accompanying notes to financial statements.
25
| SCHEDULE OF INVESTMENTS |
| Dunham Monthly Distribution Fund (Continued) |
| October 31, 2019 |
| Security | Shares | Value | ||||||
| COMMON STOCKS - 69.4% (Continued) | ||||||||
| HOLDING COMPANIES - DIVERSIFIED - 1.9% (Continued) | ||||||||
| Mosaic Acquisition Corp. * ^ | 65,697 | $ | 674,708 | |||||
| Pure Acquisition Corp. * | 42,906 | 441,932 | ||||||
| 4,815,251 | ||||||||
| INTERNET - 0.5% | ||||||||
| InterActiveCorp. * | 5,759 | 1,308,733 | ||||||
| IRON/STEEL - 0.1% | ||||||||
| Allegheny Technologies, Inc. * | 18,611 | 391,017 | ||||||
| LODGING - 2.9% | ||||||||
| Caesars Entertainment Corp. * | 424,291 | 5,210,293 | ||||||
| Hilton Grand Vacations, Inc. * | 11,054 | 383,905 | ||||||
| Wyndham Hotels & Resorts, Inc. | 36,663 | 1,978,702 | ||||||
| 7,572,900 | ||||||||
| MEDIA - 0.6% | ||||||||
| Discovery, Inc.* ^ | 48,092 | 1,296,320 | ||||||
| Viacom, Inc. | 8,438 | 181,923 | ||||||
| 1,478,243 | ||||||||
| MINING - 0.2% | ||||||||
| Freeport-McMoRan, Inc. | 58,971 | 579,095 | ||||||
| MISCELLANEOUS MANUFACTURERS - 0.3% | ||||||||
| Siemens AG | 7,037 | 811,620 | ||||||
| OIL & GAS - 2.8% | ||||||||
| Marathon Petroleum Corp. | 79,330 | 5,073,154 | ||||||
| Valero Energy Corp. | 22,546 | 2,186,511 | ||||||
| 7,259,665 | ||||||||
| OIL & GAS SERVICES - 0.1% | ||||||||
| TechnipFMC PLC | 17,500 | 345,275 | ||||||
| PACKAGING & CONTAINERS - 0.3% | ||||||||
| Berry Global Group, Inc. * | 18,536 | 769,429 | ||||||
| PHARMACEUTICALS - 9.2% | ||||||||
| Allergan PLC | 105,085 | 18,506,519 | ||||||
| Cigna Corp. | 12,920 | 2,305,703 | ||||||
| Elanco Animal Health, Inc. * | 64,493 | 1,742,601 | ||||||
| Mylan NV * | 61,615 | 1,179,927 | ||||||
| 23,734,750 | ||||||||
| PIPELINES - 6.2% | ||||||||
| Buckeye Partners LP | 297,256 | 12,324,234 | ||||||
| Columbia Pipeline Group, Inc. * # | 84,102 | — | ||||||
| SemGroup Corp. | 80,880 | 1,302,168 | ||||||
| Tallgrass Energy LP | 127,653 | 2,382,005 | ||||||
| 16,008,407 | ||||||||
| PRIVATE EQUITY - 0.1% | ||||||||
| Brookfield Asset Management, Inc. | 2,207 | 121,937 | ||||||
| REAL ESTATE INVESTMENT TRUSTS - 1.3% | ||||||||
| CyrusOne, Inc. | 12,775 | 910,602 | ||||||
| Rayonier, Inc. | 18,460 | 498,051 | ||||||
| Weyerhaeuser Co. | 61,811 | 1,805,499 | ||||||
| Winthrop Realty Trust # | 102,617 | 80,041 | ||||||
| 3,294,193 | ||||||||
| RETAIL - 1.9% | ||||||||
| Best Buy Co., Inc. | 21,677 | 1,557,059 | ||||||
| Gap, Inc. | 36,187 | 588,401 | ||||||
| O’Reilly Automotive, Inc. * | 2,680 | 1,167,167 | ||||||
| Tiffany & Co. | 13,691 | 1,704,666 | ||||||
| 5,017,293 | ||||||||
See accompanying notes to financial statements.
26
| SCHEDULE OF INVESTMENTS |
| Dunham Monthly Distribution Fund (Continued) |
| October 31, 2019 |
| Security | Shares | Value | ||||||||||||||||
| COMMON STOCKS - 69.4% (Continued) | ||||||||||||||||||
| SEMICONDUCTORS - 6.8% | ||||||||||||||||||
| Cypress Semiconductor Corp. | 266,866 | $ | 6,209,972 | |||||||||||||||
| Micron Technology, Inc. * | 70,150 | 3,335,633 | ||||||||||||||||
| NVIDIA Corp. | 6,433 | 1,293,162 | ||||||||||||||||
| NXP Semiconductors NV | 24,956 | 2,836,998 | ||||||||||||||||
| QUALCOMM, Inc. | 48,935 | 3,936,331 | ||||||||||||||||
| 17,612,096 | ||||||||||||||||||
| SOFTWARE - 1.6% | ||||||||||||||||||
| Borqs Technologies, Inc. * | 93,231 | 167,816 | ||||||||||||||||
| Microsoft Corp. | 27,896 | 3,999,450 | ||||||||||||||||
| 4,167,266 | ||||||||||||||||||
| TELECOMMUNICATIONS - 4.8% | ||||||||||||||||||
| T-Mobile US, Inc. * | 11,109 | 918,270 | ||||||||||||||||
| Zayo Group Holdings, Inc. * | 339,247 | 11,581,893 | ||||||||||||||||
| 12,500,163 | ||||||||||||||||||
| TRANSPORTATION - 1.6% | ||||||||||||||||||
| Genesee & Wyoming, Inc. * | 37,606 | 4,175,394 | ||||||||||||||||
| TOTAL COMMON STOCKS (Cost - $171,995,448) | 180,019,955 | |||||||||||||||||
| CLOSED END FUNDS - 1.5% | ||||||||||||||||||
| Altaba, Inc. # | 193,882 | 3,805,903 | ||||||||||||||||
| TOTAL CLOSED END FUNDS (Cost - $3,805,238) | ||||||||||||||||||
| EXCHANGE TRADED FUNDS - 3.3% | ||||||||||||||||||
| Invesco Senior Loan ETF ^ | 56,315 | 1,262,019 | ||||||||||||||||
| SPDR Blackstone / GSO Senior Loan ETF | 85,456 | 3,919,867 | ||||||||||||||||
| SPDR S&P Regional Banking ETF | 64,373 | 3,469,705 | ||||||||||||||||
| TOTAL EXCHANGE TRADED FUNDS - (Cost - $8,833,588) | 8,651,591 | |||||||||||||||||
| Expiration Date | ||||||||||||||||||
| RIGHTS - 0.0% | ||||||||||||||||||
| Nexstar Broadcasting Group, Inc. * # | 87,600 | Perpetual | 4,380 | |||||||||||||||
| TOTAL RIGHTS (Cost - $26,280) | ||||||||||||||||||
| WARRANTS - 0.0% | ||||||||||||||||||
| Borqs Technologies, Inc. * # | 105,552 | 10/28/2020 | 2,375 | |||||||||||||||
| TOTAL WARRANTS (Cost - $8,254) | ||||||||||||||||||
| Counterparty | Contracts** | Notional | Exercise Price | |||||||||||||||
| PURCHASED OPTIONS - 0.0% | ||||||||||||||||||
| PURCHASED CALL OPTIONS - 0.0% | ||||||||||||||||||
| Boeing Co. | JP Morgan | 50 | $ | 1,950,000 | $ | 390.00 | 11/15/2019 | 150 | ||||||||||
| L3Harris Technologies, Inc. | JP Morgan | 50 | 1,050,000 | 210.00 | 11/15/2019 | 11,050 | ||||||||||||
| TOTAL PURCHASED CALL OPTIONS(Cost - $80,262) | 11,200 | |||||||||||||||||
| PURCHASED PUT OPTIONS - 0.0% | ||||||||||||||||||
| PayPal Holdings, Inc. | JP Morgan | 150 | 1,500,000 | 100.00 | 11/15/2019 | 9,900 | ||||||||||||
| S&P 500 Index | JP Morgan | 75 | 22,275,000 | 2,970.00 | 11/15/2019 | 67,500 | ||||||||||||
| TOTAL PURCHASED PUT OPTIONS(Cost - $276,683) | 77,400 | |||||||||||||||||
| TOTAL PURCHASED OPTIONS (Cost - $356,945) | 88,600 | |||||||||||||||||
| Interest | ||||||||||||||||||
| Shares | Rate % | |||||||||||||||||
| SHORT-TERM INVESTMENT - 33.3% | ||||||||||||||||||
| MONEY MARKET FUND - 33.3% | ||||||||||||||||||
| Fidelity Investments Money Market Fund - Class I | 86,209,639 | 1.720 | + | 86,209,639 | ||||||||||||||
| TOTAL SHORT-TERM INVESTMENT (Cost - $86,209,639) | ||||||||||||||||||
| COLLATERAL FOR SECURITIES LOANED - 1.3% | ||||||||||||||||||
| HSBC US Government Money Market Fund - Class I ! | 2,935,000 | 1.719 | + | 2,935,000 | ||||||||||||||
| Morgan Stanley Institutional Liquidity Fund Prime Portfolio - Class Institutional ! | 349,250 | 1.940 | + | 349,494 | ||||||||||||||
| TOTAL COLLATERAL FOR SECURITIES LOANED (Cost - $3,284,250) | 3,284,494 | |||||||||||||||||
See accompanying notes to financial statements.
27
| SCHEDULE OF INVESTMENTS |
| Dunham Monthly Distribution Fund (Continued) |
| October 31, 2019 |
| Value | ||||
| TOTAL INVESTMENTS - 108.8% (Cost - $274,519,642) | $ | 282,066,937 | ||
| LIABILITIES IN EXCESS OF OTHER ASSETS - (8.8)% | (22,783,710 | ) | ||
| NET ASSETS - 100.0% | $ | 259,283,227 | ||
ETF - Exchange Traded Fund
LP - Limited Partnership
PLC - Public Limited Company
| * | Non-Income producing security. |
| ** | Each Purchased Option contract allows the option holder to buy/sell 100 shares of the underlying security at the exercise price. |
| + | Variable rate security. Interest rate is as of October 31, 2019. |
| # | Fair Value estimated using fair value procedures adopted by Board of Trustees. Total value of such securities is $4,072,960 or 1.57% of net assets as of October 31, 2019. |
| ^ | All or a portion of these securities are on loan. Total loaned securities had a value of $3,216,350 at October 31, 2019. |
| ! | The Trust’s securities lending policies and procedures require that the borrower: (i) deliver cash or U.S. Government securities as collateral with respect to each new loan of U.S. securities, equal to at least 102% of the value of the portfolio securities loaned, and (ii) at all times thereafter mark-to-market the collateral on a daily basis so that the market value of such collateral is at least 100% of the value of securities loaned. From time to time the collateral may not be 102% due to end of day market movement. The next business day additional collateral is obtained/received from the borrower to replenish/reestablish 102%. |
| ~ | Less than 0.5 shares. |
| Security | Counterparty | Contracts** | Notional Value | Exercise Price | Expiration Date | Value | ||||||||||||
| WRITTEN OPTIONS - (0.3)% | ||||||||||||||||||
| WRITTEN CALL OPTIONS - (0.3)% | ||||||||||||||||||
| Best Buy Co., Inc. | JP Morgan | 217 | $ | 1,519,000 | $ | 70.00 | 12/20/2019 | $ | 103,726 | |||||||||
| Boeing Co. | JP Morgan | 100 | 4,100,000 | 410.00 | 11/15/2019 | 250 | ||||||||||||
| Elanco Animal Health, Inc. | JP Morgan | 639 | 1,789,200 | 28.00 | 11/15/2019 | 28,755 | ||||||||||||
| General Motors Co. | JP Morgan | 250 | 925,000 | 37.00 | 11/15/2019 | 20,000 | ||||||||||||
| Marathon Petroleum Corp. | JP Morgan | 717 | 4,481,250 | 62.50 | 11/15/2019 | 173,514 | ||||||||||||
| Masco Corp. | JP Morgan | 282 | 1,297,200 | 46.00 | 12/20/2019 | 47,940 | ||||||||||||
| Micron Technology, Inc. | JP Morgan | 701 | 3,154,500 | 45.00 | 11/15/2019 | 199,785 | ||||||||||||
| NXP Semiconductors NV | JP Morgan | 136 | 1,523,200 | 112.00 | 11/15/2019 | 53,040 | ||||||||||||
| NXP Semiconductors NV | JP Morgan | 117 | 1,357,200 | 116.00 | 11/15/2019 | 18,135 | ||||||||||||
| QUALCOMM, Inc. | JP Morgan | 251 | 1,945,250 | 77.50 | 11/15/2019 | 110,440 | ||||||||||||
| QUALCOMM, Inc. | JP Morgan | 128 | 1,024,000 | 80.00 | 11/15/2019 | 36,224 | ||||||||||||
| Valero Energy Corp. | JP Morgan | 225 | 2,115,000 | 94.00 | 11/15/2019 | 88,875 | ||||||||||||
| TOTAL WRITTEN CALL OPTIONS - (Premiums Received - $826,157) | 880,684 | |||||||||||||||||
| WRITTEN PUT OPTIONS - (0.0)% | ||||||||||||||||||
| L3Harris Technologies, Inc. | JP Morgan | 50 | 975,000 | 195.00 | 11/15/2019 | 5,000 | ||||||||||||
| PayPal Holdings, Inc. | JP Morgan | 150 | 1,350,000 | 90.00 | 11/15/2019 | 900 | ||||||||||||
| S&P 500 Index | JP Morgan | 75 | 21,825,000 | 2,910.00 | 11/15/2019 | 31,125 | ||||||||||||
| TOTAL WRITTEN PUT OPTIONS - (Premiums Received - $156,172) | 37,025 | |||||||||||||||||
| TOTAL WRITTEN OPTIONS (Premiums Received - $982,329) | $ | 917,709 | ||||||||||||||||
| Shares | ||||||||||||||||||
| SECURITIES SOLD SHORT * - (30.0)% | ||||||||||||||||||
| AIRLINES - (0.0)% | ||||||||||||||||||
| American Airlines Group, Inc. | 3,836 | $ | 115,310 | |||||||||||||||
| BANKS - (1.3)% | ||||||||||||||||||
| BB&T Corp. | 61,927 | 3,285,227 | ||||||||||||||||
| CHEMICALS - (0.7)% | ||||||||||||||||||
| DuPont de Nemours, Inc. | 13,765 | 907,251 | ||||||||||||||||
| International Flavors & Fragrances, Inc. | 6,743 | 822,714 | ||||||||||||||||
| 1,729,965 | ||||||||||||||||||
| ENTERTAINMENT - (0.7)% | ||||||||||||||||||
| Eldorado Resorts, Inc. | 38,483 | 1,722,884 | ||||||||||||||||
See accompanying notes to financial statements.
28
| SCHEDULE OF INVESTMENTS |
| Dunham Monthly Distribution Fund (Continued) |
| October 31, 2019 |
| Security | Shares | Value | ||||||||
| SECURITIES SOLD SHORT * - (30.0)% (Continued) | ||||||||||
| EQUITY EXCHANGE TRADED FUNDS - (9.9)% | ||||||||||
| Consumer Staples Select Sector SPDR Fund | 106,844 | $ | 6,534,579 | |||||||
| Energy Select Sector SPDR Fund | 11,097 | 643,182 | ||||||||
| Health Care Select Sector SPDR Fund | 42,510 | 4,027,823 | ||||||||
| Industrial Select Sector SPDR Fund | 58,045 | 4,557,113 | ||||||||
| iShares Russell 2000 ETF | 9,232 | 1,435,114 | ||||||||
| iShares U.S. Real Estate ETF | 20,567 | 1,938,646 | ||||||||
| SPDR S&P 500 ETF Trust | 21,772 | 6,604,101 | ||||||||
| 25,740,558 | ||||||||||
| HEALTHCARE - PRODUCTS - (0.3)% | ||||||||||
| Envista Holdings Corp. | 23,206 | 680,632 | ||||||||
| HEALTHCARE - SERVICES - (0.2)% | ||||||||||
| UnitedHealth Group, Inc. | 2,087 | 527,385 | ||||||||
| INTERNET - (0.2)% | ||||||||||
| Roku, Inc. | 4,357 | 641,350 | ||||||||
| LODGING - (0.6)% | ||||||||||
| Marriott International, Inc. | 12,398 | 1,568,967 | ||||||||
| MACHINERY - DIVERSIFIED - (0.5)% | ||||||||||
| Deere & Co. | 4,798 | 835,524 | ||||||||
| IDEX Corp. | 3,332 | 518,226 | ||||||||
| 1,353,750 | ||||||||||
| MEDIA - (0.1)% | ||||||||||
| CBS Corp. | 5,640 | 203,266 | ||||||||
| MISCELLANEOUS MANUFACTURERS - (0.9)% | ||||||||||
| Illinois Tool Works, Inc. | 7,467 | 1,258,787 | ||||||||
| Parker-Hannifin Corp. | 5,391 | 989,195 | ||||||||
| 2,247,982 | ||||||||||
| OIL & GAS - (0.3)% | ||||||||||
| Exxon Mobile Corp. | 13,493 | 911,722 | ||||||||
| PHARMACEUTICALS - (9.1)% | ||||||||||
| AbbVie, Inc. | 76,424 | 6,079,529 | ||||||||
| Bristol-Myers Squibb Co. | 249,225 | 14,298,038 | ||||||||
| Cigna Corp. | 12,920 | 2,305,703 | ||||||||
| CVS Health Corp. | 15,731 | 1,044,381 | ||||||||
| 23,727,651 | ||||||||||
| PIPELINES - (0.3)% | ||||||||||
| Energy Transfer LP | 58,710 | 739,159 | ||||||||
| REAL ESTATE INVESTMENT TRUSTS - (1.3)% | ||||||||||
| American Tower Corp. | 8,561 | 1,866,983 | ||||||||
| Equinix, Inc. | 1,597 | 905,148 | ||||||||
| Kimco Realty Corp. | 24,134 | 520,329 | ||||||||
| 3,292,460 | ||||||||||
| RETAIL - (0.6)% | ||||||||||
| Starbucks Corp. | 18,640 | 1,576,198 | ||||||||
| Expiration Date | ||||||||||
| RIGHTS - (0.1)% | ||||||||||
| Celgene Corp. # | 89,152 | Perpetual | 200,592 | |||||||
| SEMICONDUCTORS - (1.3)% | ||||||||||
| Broadcom, Inc. | 3,320 | 972,262 | ||||||||
| Taiwan Semiconductor Manufacturing Co. Ltd. | 18,219 | 940,647 | ||||||||
| Texas Instruments, Inc. | 11,930 | 1,407,621 | ||||||||
| 3,320,530 | ||||||||||
See accompanying notes to financial statements.
29
| SCHEDULE OF INVESTMENTS |
| Dunham Monthly Distribution Fund (Continued) |
| October 31, 2019 |
| Security | Shares | Value | ||||||
| SECURITIES SOLD SHORT * - (30.0)% (Continued) | ||||||||
| SOFTWARE - (0.6)% | ||||||||
| Fiserv, Inc. | 16,031 | $ | 1,701,530 | |||||
| TELECOMMUNICATIONS - (1.0)% | ||||||||
| Cisco Systems, Inc. | 27,950 | 1,327,904 | ||||||
| Comcast Corp. - Class A | 28,949 | 1,297,494 | ||||||
| 2,625,398 | ||||||||
| TOTAL SECURITIES SOLD SHORT - (Proceeds - $72,637,494) | $ | 77,912,516 | ||||||
ETF - Exchange Traded Fund
LP - Limited Partnership
| * | Non-Income producing security. |
| ** | Each Written Option contract allows the option holder to buy/sell 100 shares of the underlying security at the exercise price. |
| # | Fair Value estimated using fair value procedures adopted by Board of Trustees. Total value of such securities is $200,592 or 0.08% of net assets as of October 31, 2019. |
| TOTAL RETURN SWAPS | ||||||||||||||
| Unrealized | ||||||||||||||
| Notional Value at | Maturity | Appreciation/ | ||||||||||||
| Reference Entity | Counterparty | October 31, 2019 | Interest Rate | Date | (Depreciation) | |||||||||
| LONG TOTAL RETURN SWAPS | ||||||||||||||
| Airbus SE | JPMorgan | $ | 846,775 | 3 mo. LIBOR + 0.300% | 10/21/2020 | $ | 55,475 | |||||||
| Airbus SE | JPMorgan | 331,539 | 3 mo. LIBOR + 0.300% | 10/22/2020 | 26,552 | |||||||||
| Airbus SE | JPMorgan | 326,637 | 3 mo. LIBOR + 0.300% | 10/23/2020 | 19,126 | |||||||||
| NET UNREALIZED GAIN FROM LONG TOTAL RETURN SWAPS | 101,153 | |||||||||||||
| SHORT TOTAL RETURN SWAPS | ||||||||||||||
| Flutter PLC | JPMorgan | 318,310 | 3 mo. LIBOR + 0.300% | 10/10/2020 | (5,677 | ) | ||||||||
| Flutter PLC | JPMorgan | 829,301 | 3 mo. LIBOR + 0.300% | 10/10/2020 | (2,759 | ) | ||||||||
| Flutter PLC | JPMorgan | 2,899 | 3 mo. LIBOR + 0.300% | 10/11/2020 | (59 | ) | ||||||||
| Flutter PLC | JPMorgan | 570,859 | 3 mo. LIBOR + 0.300% | 10/11/2020 | (30,955 | ) | ||||||||
| Flutter PLC | JPMorgan | 1,662,557 | 3 mo. LIBOR + 0.300% | 10/17/2020 | (118,974 | ) | ||||||||
| Flutter PLC | JPMorgan | 580,720 | 3 mo. LIBOR + 0.300% | 10/24/2020 | (36,628 | ) | ||||||||
| Flutter PLC | JPMorgan | 905,674 | 3 mo. LIBOR + 0.300% | 10/25/2020 | (61,820 | ) | ||||||||
| Peugeot SA | JPMorgan | 786,500 | 3 mo. LIBOR + 0.300% | 11/4/2020 | 8,220 | |||||||||
| NET UNREALIZED LOSS FROM SHORT TOTAL RETURN SWAPS | (248,652 | ) | ||||||||||||
| NET UNREALIZED LOSS FROM TOTAL RETURN SWAPS | $ | (147,499 | ) | |||||||||||
| Portfolio Composition*- (Unaudited) | ||||||||||
| Short-Term Investment | 30.4 | % | Exchange Traded Funds | 3.0 | % | |||||
| Consumer, Non-Cyclical | 22.3 | % | Diversified | 2.4 | % | |||||
| Technology | 8.4 | % | Basic Materials | 1.7 | % | |||||
| Energy | 8.3 | % | Collateral for securities on loan | 1.2 | % | |||||
| Consumer, Cyclical | 6.7 | % | Closed-End Fund | 1.3 | % | |||||
| Communications | 5.4 | % | Utilities | 0.5 | % | |||||
| Industrial | 4.8 | % | Options | 0.0 | % | |||||
| Financial | 3.6 | % | Warrants | 0.0 | % | |||||
| Rights | 0.0 | % | ||||||||
| Total | 100.0 | % | ||||||||
| * | Based on total value of investments as of October 31, 2019 |
Percentage may differ from Schedule of Investments which are based on Fund net assets.
See accompanying notes to financial statements.
30
| Dunham Dynamic Macro Fund (Unaudited) |
| Message from the Sub-Adviser (Mellon Investments Corporation) |
Asset Class Recap
It was a volatile beginning to the fiscal year for most asset classes around the globe. Over the first fiscal quarter, invest ors dealt with rising interest rates, a slowdown in Eurozone business confidence, weaker Chinese growth, increasing geopolitical tension across the globe and the likelihood of further meaningful fiscal stimulus was significantly reduced. Equity markets precipitously declined in December, while government bonds filled their more traditional role as a defensive portion of a balanced portfolio. Equities strongly rebounded through the second fiscal quarter as the 10-year U.S. Treasury precipitously declined over 80 basis points amid investor optimism. The positive sentiment was also supported by strong economic releases, satisfactory earnings releases from U.S. companies, and progress in the U.S.-China trade talks. Volatility once again spiked in the third and final fiscal quarters of the year. To start the third fiscal quarter, global equities suffered their worst month of May in seven years as escalating trade tensions and weaker economic data spooked investors. In August, global equities declined amid deteriorating trade talks between the U.S. and China and concerning economic reports. Despite these spikes in volatility, global equities put in a constructive second half of the fiscal year as central banks around the world shifted to accommodative policy decisions. This included the United States Federal Reserve, which cut their benchmark rate three times in 2019. Global macro strategies, as measured by the IQ Hedge Global Macro Beta Index, increased 5.2 percent over the fiscal year.
Allocation Review
As volatility spiked and equity markets tumbled in the first fiscal quarter, the defensive asset strategy fared well by providing a positive return while most asset classes across the globe precipitously declined. The Sub-Adviser viewed this as an opportunity to reduce the allocation to the defensive asset strategy and increase the exposure to the growth asset strategy. This shift benefitted the Fund as equity prices rallied off their lows in late December. As equity markets continued to rally through the end of the second fiscal quarter, the Sub-Adviser methodically took profits from the growth strategy and moved back into the defensive asset strategy. The allocation to the growth asset strategy continued to decline in the third and final fiscal quarter of the year, which benefited the Fund during the aforementioned spikes in volatility. The Sub-Adviser saw an opportunity in the equity decline in August and increased the allocation to the growth asset strategy. This allocation benefited the Fund as global equities rallied to close the fiscal quarter. Both the defensive and growth asset strategy contributed to Fund performance over the most recent fiscal quarter, while the real asset strategy detracted.
Holdings Insights
The growth asset strategy contributed positively to Fund Performance over the most recent fiscal quarter and the full fiscal year. The exposure within the growth asset strategy has shifted through the fiscal year. To begin the fiscal year, the allocation to U.S. equities was approximately 40 percent of the allocation. Due to the rapid increase in U.S. equities, the Sub-Adviser believed that their prices had outstripped the underlying earnings. This exposure was achieved through the SPDR S&P 500 ETF Trust (SPY) (holding weight*: 11.73 percent). Throughout the fiscal year, SPY increased 15.6 percent. The reduction of allocation to SPY through the fiscal year benefited the Fund as the bulk of the increase occurred early in the fiscal year with SPY increasing 1.3 percent in the most recent fiscal quarter. The Fund also received positive contributions from overseas which included the iShares Currency Hedged MSCI Japan ETF (HEWJ) (holding weight*: 7.67 percent), and the iShares Currency Hedged MSCI Germany ETF (HEWG) (holding weight*: 0.60 percent). HEWJ increased 6.0 percent and HEWG rose 12.7 percent.
The defensive asset strategy achieved its goal of attempting to provide downside protection for the Fund during spikes in volatility. As recent as August and multiple other times throughout the fiscal year, equity markets rapidly declined while U.S. bonds provided a positive return. Given that the largest portion of the defensive asset strategy is dedicated to U.S. bonds, this exposure benefited the Fund. Despite subsequent rallies in risk assets as volatility subsided, this exposure was still able to contribute to Fund performance as the yield on the 10-year U.S. Treasury declined 145 basis points in the full fiscal year and 32 basis points in the most recent fiscal quarter alone. While the bulk of derivative exposure had a muted impact on performance over the fiscal year, the U.S. bond exposure within the Fund was partially facilitated by the U.S. 10YR Note (CBT) DEC 19 (TYZ9) (holding weight*: 0.03 percent). This position has a notion exposure of approximately 31.5 perc ent of Fund assets and increased 1.9 percent in the final fiscal quarter of the year.
In the second fiscal quarter, the Sub-Adviser eliminated the exposure to TIPS, as it did not believe that a rapid rise in inflation was an immediate concern. This view remained throughout the final fiscal quarter of the year as the exposure to the real asset strategy remained consistent. One position within the real asset strategy that detract ed from Fund performance was the iShares Commodities Select Strategy ETF (COMT) (holding weight*: 5.42 percent). Over the fiscal year, COMT decreased 5.6 percent.
Sub-Adviser Outlook
The Sub-Adviser is optimistic for opportunities within the asset categories the Fund invests in for the rest of 2019 and 2020, albeit with continued volatility. The Sub-Adviser remains steadfast in its belief that this volatility-targeted strategy may provide investors with more consistent returns than traditional asset classes. It believes that through the flexibility of the strategy and the use of alternative investments, the Fund may provide what may be considered attractive returns with lower systematic risk and lower correlation than traditional equity investments.
| * | Holdings percentage(s) of total investments as of 10/31/2019. |
Growth of $100,000 Investment
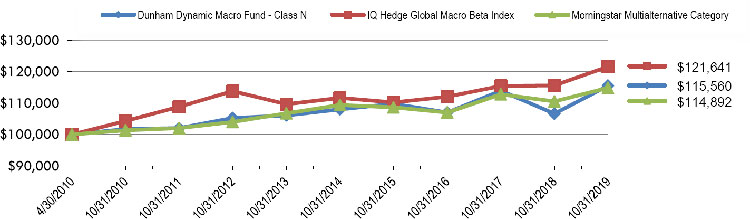
| Total Returns(a) as of October 31, 2019 | |||
| Annualized | |||
| Annualized | Since Inception | ||
| One Year | Five Years | (4/30/10) | |
| Class N | 8.35% | 1.36% | 1.53% |
| Class C | 7.20% | 0.33% | 0.52% |
| Class A with load of 5.75% | 1.80% | (0.10)% | 0.64% |
| Class A without load | 8.04% | 1.09% | 1.26% |
| IQ Hedge Global Macro Beta Index | 5.17% | 1.72% | 2.08% |
| Morningstar Multialternative Category | 3.91% | 0.99% | 1.47% |
| (a) | Total Returns are calculated based on traded NAVs. |
The IQ Hedge Global Macro Beta Index seeks to replicate the risk-adjusted return characteristics of the collective hedge funds using a global macro investment style.
Investors cannot invest directly in an index or benchmark.
The Morningstar Multialternative Category is generally representative of mutual funds with static allocations to alternative strategies and asset classes. The gross short exposure in these mutual funds is generally greater than 20%.
| As disclosed in the Trust’s latest registration statement, the Fund’s total annual operating expenses, including underlying funds, are 1.97% for Class N, 2.97% for Class C and 2.22% for Class A. Class A shares are subject to a sales load of 5.75% and a deferred sales charge of up to 0.75%. The performance data quoted here represents past performance, which is not indicative of future results. Current performance may be lower or higher than the performance data quoted. The investment return and NAV will fluctuate, so that an investor’s shares, when redeemed, may be worth more or less than their original cost. Total returns are calculated assuming reinvestment of all dividends and capital gains distributions, if any. The returns do not reflect the deductions of taxes a shareholder would pay on the redemption of Fund shares or Fund distributions. For performance information current to the most recent month-end, please call 1-800-442-4358 or visit our website www.dunham.co |
31
| SCHEDULE OF INVESTMENTS |
| Dunham Dynamic Macro Fund |
| October 31, 2019 |
| Security | Shares | Value | ||||||||||||||
| EXCHANGE TRADED FUNDS - 30.1% | ||||||||||||||||
| COMMODITY EXCHANGE TRADED FUNDS - 5.4% | ||||||||||||||||
| iShares Commodities Select Strategy ETF | 71,252 | $ | 2,264,388 | |||||||||||||
| DEBT EXCHANGE TRADED FUNDS - 4.6% | ||||||||||||||||
| SPDR Bloomberg Barclays High Yield Bond ETF | 17,884 | 1,934,870 | ||||||||||||||
| EQUITY EXCHANGE TRADED FUNDS - 20.1% | ||||||||||||||||
| iShares Currency Hedged MSCI Germany ETF | 8,944 | 252,489 | ||||||||||||||
| iShares Currency Hedged MSCI Japan ETF | 99,319 | 3,207,011 | ||||||||||||||
| SPDR S&P 500 ETF Trust | 16,163 | 4,902,723 | ||||||||||||||
| 8,362,223 | ||||||||||||||||
| TOTAL EXCHANGE TRADED FUNDS(Cost - $10,160,747) | 12,561,481 | |||||||||||||||
| Exercise | Expiration | |||||||||||||||
| Counterparty | Contracts | Notional | Price | Date | ||||||||||||
| PURCHASED OPTIONS * + - 2.0% | ||||||||||||||||
| CALL OPTION ON FUTURES PURCHASED - 2.0% | ||||||||||||||||
| US 10 Year Future | Goldman Sachs | 67 | $ | 7,906,000 | US $118 | 11/22/2019 | 823,891 | |||||||||
| 823,891 | ||||||||||||||||
| PUT OPTIONS ON FUTURES PURCHASED - 0.0% | ||||||||||||||||
| S&P 500 E-Mini Option | Goldman Sachs | 42 | 5,460,000 | US $2,600 | 12/20/2019 | 7,875 | ||||||||||
| S&P 500 E-Mini Option | Goldman Sachs | 42 | 5,460,000 | US $2,600 | 1/17/2020 | 19,110 | ||||||||||
| 26,985 | ||||||||||||||||
| TOTAL PURCHASED OPTIONS (Cost - $964,012) | 850,876 | |||||||||||||||
| Principal | Discount | |||||||||||||||
| Amount ($) | Rate (%) | Maturity | ||||||||||||||
| SHORT-TERM INVESTMENTS - 63.4% | ||||||||||||||||
| U.S. GOVERNMENT SECURITIES - 60.2% | ||||||||||||||||
| US Treasury Bill ^^ | 1,380,000 | 1.4353 | 12/12/2019 | 1,377,693 | ||||||||||||
| US Treasury Bill | 23,773,000 | 1.4155 | 12/19/2019 | 23,727,197 | ||||||||||||
| 25,104,890 | ||||||||||||||||
| Shares | Interest Rate (%) | |||||||||||||||
| MONEY MARKET - 3.2% | ||||||||||||||||
| Morgan Stanley Institutional Liquidity Fund | 1,340,071 | 1.7200 ^ | 1,340,071 | |||||||||||||
| TOTAL SHORT-TERM INVESTMENTS - (Cost - $26,430,465) | 26,444,961 | |||||||||||||||
| TOTAL INVESTMENTS - 95.5% (Cost - $37,555,224) | $ | 39,857,318 | ||||||||||||||
| OTHER ASSETS IN EXCESS OF LIABILITIES - 4.5% | 1,857,159 | |||||||||||||||
| NET ASSETS - 100.0% | $ | 41,714,477 | ||||||||||||||
See accompanying notes to financial statements.
32
| SCHEDULE OF INVESTMENTS |
| Dunham Dynamic Macro Fund (Continued) |
| October 31, 2019 |
| Unrealized | ||||||||||||||||
| Expiration | Appreciation | |||||||||||||||
| Open Futures Contracts ** | Counterparty | Contracts | Notional | Date | (Depreciation) | |||||||||||
| LONG FUTURES CONTRACTS - 0.4% | ||||||||||||||||
| 10 Year Mini JGB Future | Goldman Sachs | 71 | $ | 10,125,406 | 12/12/2019 | $ | (48,747 | ) | ||||||||
| CAC 40 10 Euro Future | Goldman Sachs | 7 | 447,253 | 11/15/2019 | 4,438 | |||||||||||
| CAN 10 Year Bond Future | Goldman Sachs | 16 | 1,729,098 | 12/18/2019 | 26,322 | |||||||||||
| Dax Index Future | Goldman Sachs | 2 | 719,232 | 12/20/2019 | 4,848 | |||||||||||
| FTSE 100 Index Future | Goldman Sachs | 29 | 2,719,136 | 12/20/2019 | 4,319 | |||||||||||
| FTSE/MIB Index Future | Goldman Sachs | 7 | 884,901 | 12/20/2019 | 38,659 | |||||||||||
| Hang Seng Index Future | Goldman Sachs | 15 | 2,582,135 | 11/28/2019 | 4,652 | |||||||||||
| IBEX 35 Index Future | Goldman Sachs | 5 | 517,528 | 11/15/2019 | 1,610 | |||||||||||
| MSCI Emerging Markets Future | Goldman Sachs | 15 | 781,050 | 12/20/2019 | 11,325 | |||||||||||
| S&P/TSX 60 IX Future | Goldman Sachs | 7 | 1,049,081 | 12/19/2019 | (55 | ) | ||||||||||
| S&P 500 E-mini Future | Goldman Sachs | 26 | 3,946,540 | 12/20/2019 | 64,135 | |||||||||||
| Swiss Market Index Future | Goldman Sachs | 2 | 206,922 | 12/20/2019 | 4,276 | |||||||||||
| US 10 Year Note (CBT) | Goldman Sachs | 93 | 12,117,609 | 12/19/2019 | 30,777 | |||||||||||
| TOTAL FUTURES CONTRACTS PURCHASED | 146,559 | |||||||||||||||
| SHORT FUTURES CONTRACTS - 0.2% | ||||||||||||||||
| Amsterdam Index Future | Goldman Sachs | (1) | (128,347 | ) | 11/15/2019 | 1,017 | ||||||||||
| AUST 10 Year Bond Future | Goldman Sachs | (46) | (37,596,501 | ) | 12/16/2019 | 42,241 | ||||||||||
| Euro-Bond Future | Goldman Sachs | (53) | (10,156,085 | ) | 12/6/2019 | 158,275 | ||||||||||
| Long Gilt Future | Goldman Sachs | (33) | (5,672,538 | ) | 12/27/2019 | (4,786 | ) | |||||||||
| SPI 200 Future | Goldman Sachs | (8) | (914,788 | ) | 12/19/2019 | (7,224 | ) | |||||||||
| Topix Index Future | Goldman Sachs | (23) | (3,549,836 | ) | 12/12/2019 | (104,346 | ) | |||||||||
| TOTAL FUTURES CONTRACTS SOLD | 85,177 | |||||||||||||||
| NET UNREALIZED GAIN FROM FUTURES CONTRACTS | $ | 231,736 | ||||||||||||||
| Exercise Price | Value | |||||||||||||||
| WRITTEN OPTIONS + - (0.1)% | ||||||||||||||||
| WRITTEN CALL FUTURE OPTIONS - (0.1)% | ||||||||||||||||
| S&P 500 E-Mini Option | Goldman Sachs | (17) | (2,584,000 | ) | US $3,040 | 11/8/2019 | $ | (12,750 | ) | |||||||
| S&P 500 E-Mini Option | Goldman Sachs | (17) | (2,601,000 | ) | US $3,060 | 11/15/2019 | (10,965 | ) | ||||||||
| S&P 500 E-Mini Option | Goldman Sachs | (17) | (2,626,500 | ) | US $3,090 | 11/22/2019 | (7,650 | ) | ||||||||
| (31,365 | ) | |||||||||||||||
| WRITTEN PUT FUTURE OPTIONS - (0.0)% | ||||||||||||||||
| S&P 500 E-Mini Option | Goldman Sachs | (17) | (2,422,500 | ) | US $2,850 | 11/22/2019 | (4,165 | ) | ||||||||
| (4,165 | ) | |||||||||||||||
| TOTAL WRITTEN OPTIONS -(Premiums Received - $31,783) | $ | (35,530 | ) | |||||||||||||
| AUD - Australian Dollar | EUR - Euro | JPY - Japanese Yen |
| CAD - Canadian Dollar | GBP - United Kingdom Pound | USD - US Dollar |
| CHF - Swiss Franc | HKD - Hong Kong Dollar |
ETF - Exchange Traded Fund
| * | Non income producing security. |
| + | Each option contract allows holder to purchase/sell 100 shares of the underlying security at the exercise price. |
| ^ | Variable rate security. Interest rate is as of October 31, 2019. |
| ^^ | All of this security is segregated as collateral for futures contracts. |
| ** | The amounts shown are the underlying reference notional amounts to stock exchange indices, debt securities and equities upon which the fair value of the futures contracts held by the Fund are based. Notional values do not represent the current fair value of, and are not necessarily indicative of the future cash flows futures contracts. Further, the underlying price changes in relation to the variables specified by the notional values affects the fair value of these derivative financial instruments. The notional values as set forth within this schedule do not purport to represent economic value at risk to the Fund. |
See accompanying notes to financial statements.
33
| Dunham High-Yield Bond Fund (Unaudited) |
| Message from the Sub-Adviser (PineBridge Investments LLC) |
Asset Class Recap
High-yield spreads came under pressure at the beginning of the fiscal year amid signs of global growth concerns and a disappointing Fed meeting that offered no flexibility concerning balance sheet runoff. However, spreads rallied sharply in January, benefitting from progress on U.S.-China trade talks, stable or better than expected earnings and, most importantly, a dovish pivot from Jerome Powell and the Fed. Spreads continued to tighten in the second fiscal quarter as the Fed continued to reiterate their dovish stance. Rhetoric from both the United States and China grew more and more rancorous and investors had to contend with weaker growth data in the form of lower than expected PMIs and slower job and wage growth. Fed Chairman Jerome Powell and the FOMC turned even more dovish in June and July alongside better than expected earnings, decent economic data, and a strong technical backdrop. The dovish stance of central banks continued on a global basis amid concerns about global growth, particularly in the Eurozon e Brexit, and risks of trade war escalation between the U.S. and China. Additionally, the Federal Reserve made the anticipated 25 bps, cuts in September and October. However, the Fed’s statement after the October meeting signaled a bias to remain on hold, as they will “monitor the implications of incoming information” before resuming further rate cuts. High-yield bonds, as measured by the ICE BofA ML US Cash Pay High-Yield Index, increased 10.2 percent over the most recent fiscal quarter.
Allocation Review
Security selection and sector allocation both detracted from performance over the most recent fiscal quarter and fiscal year. The Fund received strong positive contributions as a result of sector allocation and security selection within the technology, consumer non-cyclical, and REIT sectors. However, the positive returns from the aforementioned sectors were more than eroded by the adverse performance within the energy sector. In the most recent fiscal quarter and full fiscal year, security selection within the energy sector strongly detracted from performance while the sector allocation provided a small positive contribution.
Holdings Insights
The price of West Texas Intermediate Crude Oil had a volatile fiscal year, drastically falling over 17 percent. This volatili ty adversely affected the energy sector within the Fund, with pronounced weakness coming from the oil sub-sector. One of the worst performing credits within the Fund over the fiscal quarter and fiscal year was Chaparral Energy Inc. 8.75% 7/15/2023 (15942RAF6) (holdings weight*: 0.36 percent). This credit declined 23.2 percent in the most recent fiscal quarter and 48.8 percent in the full fiscal year amid the weakness in the energy sector. This credit also suffered from various idiosyncratic concerns including safety issues with some of their wells. Another detractor from Fund performance over the most recent fiscal quarter and fiscal year was Pioneer Energy Service Corp. 6.125% 3/15/2022 (723664AB4) (holding weight*: 0.23 percent). This position declined 0.11 percent over the most recent fiscal quarter and 47.4 percent for the full fiscal year. A detractor from Fund performance outside of the energy sector came from the communications sector. Frontier Communications 8.5% 04/1/2026 (35906AAN8) (holding weight**: 0.25 percent) suffered from the “cord cutting” trend and has seen their revenue consistently decline. The company is urgently looking for new management and to restructure debt, but the Sub-Adviser believes they are potentially headed toward bankruptcy. This position declined 9.8 percent over the most recent fiscal quarter and 3.8 percent for the full fiscal year before being sold.
As previously mentioned, the technology sector was one of the best performing sectors within the Fund over the most recent fiscal quarter and fiscal year. A strong positive contributor to Fund performance for the full fiscal year from the technology sector was Diebold Nixdorf Inc. 8.5% 4/15/2024 (253651AC7) (holding weight*: 0.55 percent). This credit initially declined early in the year amid concerns that the company was taking on excessive debt, but strongly rebounded as investors recognized the company’s efforts to deleverage. This position increased 52.5 percent in the full fiscal year despite declining 9.3 percent in the most recent fiscal quarter amid litigation concerns. A positive contributor to performance also came from the communications sector. Altice Luxembourg SA 7.625% 02/15/2025 (02154VAB7) (holding weight*: 0.66 percent) increased 6.8 percent over the most recent fiscal quarter and 31.2 percent for the full fiscal year. The Sub-Adviser attributes the positive performance to the company doing a partial refinance on some of their outstanding debt which the Sub-Adviser views as a good sign that they are worthy of doing primary deals.
Sub-Adviser Outlook
The Sub-Adviser believes that fundamentals remain decent, but the “up in quality” trade remains in favor with BB/B out performing. The Sub-Adviser does not see anything overly concerning on the default or fallen angel front, but it will continue to be cautious. With earnings weakness as the base case, valuations appear in line with expectations and the Sub-Adviser expects spreads to stay range bound. Technicals also remain supportive with volatile flows, but positive, as investors may be seeing the ’silver linings’ in earnings and macro issues. Against this backdrop, the Sub-Adviser is still finding what it believes are attractively priced credits in the high-yield market where issuers have positive fundamentals and sector outlooks, but generally favor the relative safety of being u p in the capital structure or holding higher cash balances, maintaining the flexibility to shift into areas that become dislocated from intrinsic value.
| * | Holdings percentage(s) of total investments, excluding collateral for securities loaned, as of 10/31/2019. |
| ** | Holding percentage(s) as of the date prior to the sale of the security. |
Growth of $100,000 Investment
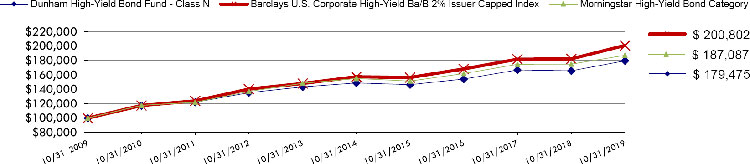
| Total Returns(a) as of October 31, 2019 | |||
| Annualized | Annualized | ||
| One Year | Five Years | Ten Years | |
| Class N | 8.42% | 3.82% | 6.02% |
| Class C | 7.55% | 3.06% | 5.24% |
| Class A with load of 4.50% | 3.38% | 2.63% | 5.28% |
| Class A without load | 8.19% | 3.57% | 5.77% |
| Barclays U.S. Corporate High-Yield Bond Ba/B 2% Issuer Capped Index | 10.25% | 5.01% | 7.22% |
| Morningstar High-Yield Bond Category | 7.06% | 3.85% | 6.46% |
| (a) | Total Returns are calculated based on traded NAVs. |
Barclays U.S. Corporate High-Yield Bond Ba/B 2% Issuer Capped Index is an issuer-constrained version of the flagship US Corporate High Yield Index, which measures the USD-denominated, high yield, fixed-rate corporate bond market. Investors cannot invest directly in an index or benchmark.
The Morningstar High-Yield Bond Category is generally representative of mutual funds that primarily invest in U.S. high-income debt securities where at least 65% or more of bond assets are not rated or are rated by a major agency such as Standard & Poor’s or Moody’s at the level of BB (considered speculative for taxable bonds) and below.
| As disclosed in the Trust’s latest registration statement, the Fund’s total annual operating expenses, including the cost of underlying funds, are 1.13% for Class N, 1.88% for Class C and 1.38% for Class A. Class A shares are subject to a sales load of 4.50% and a deferred sales charge of up to 0.75%. The performance data quoted here represents past performance, which is not indicative of future results. Current performance may be lower or higher than the performance data quoted. The investment return and NAV will fluctuate, so that an investor’s shares, when redeemed, may be worth more or less than their original cost. Total returns are calculated assuming reinvestment of all dividends and capital gains distributions, if any. The returns do not reflect the deductions of taxes a shareholder would pay on the redemption of Fund shares or Fund distributions. For performance information current to the most recent month-end, please call 1-800-442-4358 or visit our website www.dunham.com |
34
| SCHEDULE OF INVESTMENTS |
| Dunham High-Yield Bond Fund |
| October 31, 2019 |
| Principal | Interest | Maturity | ||||||||||
| Security | Amount | Rate % | Date | Value | ||||||||
| BONDS & NOTES - 93.1% | ||||||||||||
| ADVERTISING - 0.3% | ||||||||||||
| National CineMedia LLC - 144A | $ | 305,000 | 5.875 | 4/15/2028 | $ | 321,348 | ||||||
| AEROSPACE/DEFENSE - 0.2% | ||||||||||||
| UAL 2007-1 Pass Through Trust | 218,877 | 6.636 | 7/2/2022 | 232,080 | ||||||||
| AUTO MANUFACTURERS - 0.5% | ||||||||||||
| Allison Transmission, Inc. - 144A | 551,000 | 5.000 | 10/1/2024 | 565,464 | ||||||||
| AUTO PARTS & EQUIPMENT - 0.5% | ||||||||||||
| Delphi Technologies PLC - 144A | 640,000 | 5.000 | 10/1/2025 | 556,800 | ||||||||
| BUILDING MATERIALS - 0.7% | ||||||||||||
| Standard Industries, Inc. - 144A | 750,000 | 6.000 | 10/15/2025 | 791,250 | ||||||||
| CHEMICALS - 1.6% | ||||||||||||
| Consolidated Energy Finance SA - 144A | 735,000 | 6.875 | 6/15/2025 | 716,625 | ||||||||
| Neon Holdings, Inc. - 144A | 514,000 | 10.125 | 4/1/2026 | 509,503 | ||||||||
| OCI NV -144A | 517,000 | 5.250 | 11/1/2024 | 536,387 | ||||||||
| 1,762,515 | ||||||||||||
| COAL - 0.4% | ||||||||||||
| SunCoke Energy Partners LP - 144A | 527,000 | 7.500 | 6/15/2025 | 450,585 | ||||||||
| COMMERCIAL SERVICES - 5.4% | ||||||||||||
| Ahern Rentals, Inc. - 144A | 596,000 | 7.375 | 5/15/2023 | 485,740 | ||||||||
| Ashtead Capital, Inc. - 144A | 222,000 | 4.000 | 5/1/2028 | 223,388 | ||||||||
| Ashtead Capital, Inc. - 144A | 328,000 | 4.250 | 11/1/2029 | 332,100 | ||||||||
| BidFair MergeRight, Inc. - 144A | 550,000 | 7.375 | 10/15/2027 | 551,375 | ||||||||
| Capital Investment Merger Sub 2 LLC - 144A | 530,000 | 10.000 | 8/1/2024 | 547,225 | ||||||||
| GW B-CR Security Corp. - 144A | 1,070,000 | 9.500 | 11/1/2027 | 1,102,100 | ||||||||
| Harsco Corp. - 144A | 368,000 | 5.750 | 7/31/2027 | 383,187 | ||||||||
| MPH Acquisition Holdings LLC - 144A | 500,000 | 7.125 | 6/1/2024 | 465,025 | ||||||||
| Nielsen Finance LLC - 144A | 645,000 | 5.000 | 4/15/2022 | 651,463 | ||||||||
| Prime Security Services Borrower LLC - 144A | 631,000 | 5.250 | 4/15/2024 | 647,564 | ||||||||
| Prime Security Services Borrower LLC - 144A | 540,000 | 5.750 | 4/15/2026 | 554,688 | ||||||||
| 5,943,855 | ||||||||||||
| COMPUTERS - 2.9% | ||||||||||||
| Dell International LLC - 144A | 1,215,000 | 6.020 | 6/15/2026 | 1,387,815 | ||||||||
| Diebold Nixdorf, Inc. | 693,000 | 8.500 | 4/15/2024 | 600,311 | ||||||||
| NCR Corp. - 144A | 251,000 | 5.750 | 9/1/2027 | 258,216 | ||||||||
| NCR Corp. - 144A | 392,000 | 6.125 | 9/1/2029 | 412,090 | ||||||||
| Seagate HDD Cayman | 525,000 | 4.875 | 3/1/2024 | 558,448 | ||||||||
| 3,216,880 | ||||||||||||
| COSMETICS/PERSONAL CARE - 1.1% | ||||||||||||
| Coty, Inc. - 144A ^ | 575,000 | 6.500 | 4/15/2026 | 590,571 | ||||||||
| First Quality Finance Co., Inc. - 144A | 600,000 | 5.000 | 7/1/2025 | 622,620 | ||||||||
| 1,213,191 | ||||||||||||
| DISTRIBUTION/WHOLESALE - 1.3% | ||||||||||||
| American Builders & Contractors Supply Co., Inc. - 144A | 308,000 | 4.000 | 1/15/2028 | 308,000 | ||||||||
| Anixter, Inc. | 319,000 | 6.000 | 12/1/2025 | 328,570 | ||||||||
| H&E Equipment Services, Inc. | 762,000 | 5.625 | 9/1/2025 | 803,910 | ||||||||
| 1,440,480 | ||||||||||||
| DIVERSIFIED FINANCIAL SERVICES - 5.4% | ||||||||||||
| Avolon Holdings Funding Ltd. - 144A | 725,000 | 5.125 | 10/1/2023 | 784,088 | ||||||||
| Avolon Holdings Funding Ltd. - 144A | 145,000 | 5.250 | 5/15/2024 | 158,485 | ||||||||
| Credit Acceptance Corp. - 144A | 542,000 | 6.625 | 3/15/2026 | 577,230 | ||||||||
| Enova International, Inc. - 144A | 765,000 | 8.500 | 9/1/2024 | 713,362 | ||||||||
| Fairstone Financial, Inc. - 144A | 529,000 | 7.875 | 7/15/2024 | 558,690 | ||||||||
See accompanying notes to financial statements.
35
| SCHEDULE OF INVESTMENTS |
| Dunham High-Yield Bond Fund (Continued) |
| October 31, 2019 |
| Principal | Interest | Maturity | ||||||||||
| Security | Amount | Rate % | Date | Value | ||||||||
| BONDS & NOTES - 93.1% (Continued) | ||||||||||||
| DIVERSIFIED FINANCIAL SERVICES - 5.4% (Continued) | ||||||||||||
| LPL Holdings, Inc. - 144A | $ | 775,000 | 5.750 | 9/15/2025 | $ | 806,000 | ||||||
| Navient Corp. | 643,000 | 5.625 | 8/1/2033 | 562,625 | ||||||||
| Quicken Loans, Inc. - 144A | 875,000 | 5.750 | 5/1/2025 | 905,170 | ||||||||
| Springleaf Finance Corp. | 800,000 | 6.875 | 3/15/2025 | 908,000 | ||||||||
| 5,973,650 | ||||||||||||
| ELECTRIC - 2.2% | ||||||||||||
| Clearway Energy Operating LLC | 551,000 | 5.750 | 10/15/2025 | 567,530 | ||||||||
| Clearway Energy Operating LLC | 302,000 | 5.000 | 9/15/2026 | 303,510 | ||||||||
| NextEra Energy Operating Partners LP - 144A | 550,000 | 4.250 | 7/15/2024 | 567,023 | ||||||||
| Talen Energy Supply LLC - 144A | 229,000 | 7.250 | 5/15/2027 | 229,572 | ||||||||
| Talen Energy Supply LLC - 144A | 217,000 | 6.625 | 1/15/2028 | 210,490 | ||||||||
| Vistra Operations Co. LLC - 144A | 535,000 | 5.000 | 7/31/2027 | 553,725 | ||||||||
| 2,431,850 | ||||||||||||
| ELECTRICAL COMPONENTS & EQUIPMENT - 1.4% | ||||||||||||
| Energizer Holdings, Inc. - 144A | 640,000 | 6.375 | 7/15/2026 | 684,032 | ||||||||
| EnerSys - 144A | 794,000 | 5.000 | 4/30/2023 | 822,783 | ||||||||
| 1,506,815 | ||||||||||||
| ELECTRONICS - 0.9% | ||||||||||||
| Ingram Micro, Inc. | 925,000 | 5.450 | 12/15/2024 | 956,409 | ||||||||
| ENERGY - 0.8% | ||||||||||||
| Pattern Energy Group, Inc. - 144A | 839,000 | 5.875 | 2/1/2024 | 864,170 | ||||||||
| ENGINEERING & CONSTRUCTION - 0.9% | ||||||||||||
| Frontdoor, Inc. - 144A | 560,000 | 6.750 | 8/15/2026 | 611,100 | ||||||||
| Tutor Perini Corp. - 144A ^ | 396,000 | 6.875 | 5/1/2025 | 395,941 | ||||||||
| 1,007,041 | ||||||||||||
| ENTERTAINMENT - 1.0% | ||||||||||||
| Eldorado Resorts, Inc. | 660,000 | 6.000 | 9/15/2026 | 726,825 | ||||||||
| Twin River Worldwide Holdings, Inc. - 144A | 313,000 | 6.750 | 6/1/2027 | 330,309 | ||||||||
| 1,057,134 | ||||||||||||
| ENVIRONMETNAL CONTROLS - 0.3% | ||||||||||||
| Clean Harbors, Inc. - 144A | 343,000 | 4.875 | 7/15/2027 | 358,414 | ||||||||
| FOOD - 3.5% | ||||||||||||
| Albertsons Companies LLC | 562,000 | 5.750 | 3/15/2025 | 584,311 | ||||||||
| Albertsons Companies LLC - 144A | 330,000 | 5.875 | 2/15/2028 | 353,100 | ||||||||
| JBS USA LLC - 144A | 508,000 | 5.875 | 7/15/2024 | 524,510 | ||||||||
| JBS USA LLC - 144A | 272,000 | 5.750 | 6/15/2025 | 283,560 | ||||||||
| Lamb Weston Holdings, Inc. - 144A | 370,000 | 4.625 | 11/1/2024 | 390,812 | ||||||||
| Land O’Lakes, Inc. - 144A | 210,000 | 7.000 | 12/29/2049 | 197,794 | ||||||||
| Land O’Lakes Capital Trust I - 144A | 484,000 | 7.450 | 3/15/2028 | 546,920 | ||||||||
| Pilgrim’s Pride Corp. - 144A | 520,000 | 5.875 | 9/30/2027 | 559,140 | ||||||||
| Post Holdings, Inc. - 144A | 430,000 | 5.500 | 3/1/2025 | 452,081 | ||||||||
| 3,892,228 | ||||||||||||
| FOREST PRODUCTS & PAPER - 0.7% | ||||||||||||
| Cascades, Inc. - 144A | 183,000 | 5.500 | 7/15/2022 | 186,660 | ||||||||
| Cascades, Inc. - 144A ^ | 527,000 | 5.750 | 7/15/2023 | 542,810 | ||||||||
| 729,470 | ||||||||||||
| HEALTHCARE-PRODUCTS - 0.5% | ||||||||||||
| Hologic, Inc. - 144A | 525,000 | 4.375 | 10/15/2025 | 540,503 | ||||||||
| HEALTHCARE-SERVICES - 3.5% | ||||||||||||
| Catalent Pharma Solutions, Inc. - 144A | 280,000 | 5.000 | 7/15/2027 | 293,300 | ||||||||
| Centene Corp. | 174,000 | 4.750 | 1/15/2025 | 180,440 | ||||||||
| Centene Corp. - 144A | 547,000 | 5.375 | 6/1/2026 | 580,367 | ||||||||
| DaVita, Inc. | 825,000 | 5.125 | 7/15/2024 | 844,198 | ||||||||
| DaVita, Inc. | 325,000 | 5.000 | 5/1/2025 | 329,534 | ||||||||
| HCA, Inc. | 1,475,000 | 5.375 | 2/1/2025 | 1,624,344 | ||||||||
| 3,852,183 | ||||||||||||
See accompanying notes to financial statements.
36
| SCHEDULE OF INVESTMENTS |
| Dunham High-Yield Bond Fund (Continued) |
| October 31, 2019 |
| Variable | Principal | Interest | Maturity | |||||||||||
| Security | Rate | Amount | Rate % | Date | Value | |||||||||
| BONDS & NOTES - 93.1% (Continued) | ||||||||||||||
| HOUSEHOLD PRODUCTS - 0.6% | ||||||||||||||
| Central Garden & Pet Co. | $ | 600,000 | 5.125 | 2/1/2028 | $ | 619,380 | ||||||||
| INTERNET - 3.1% | ||||||||||||||
| Cogent Communications Group, Inc. - 144A | 505,000 | 5.375 | 3/1/2022 | 527,725 | ||||||||||
| Grubhub Holdings, Inc. - 144A | 695,000 | 5.500 | 7/1/2027 | 653,300 | ||||||||||
| Netflix, Inc. | 994,000 | 4.375 | 11/15/2026 | 1,014,178 | ||||||||||
| Netflix, Inc. - 144A | 1,165,000 | 4.875 | 6/15/2030 | 1,180,728 | ||||||||||
| 3,375,931 | ||||||||||||||
| INVESTMENT COMPANIES - 0.4% | ||||||||||||||
| FS Energy & Power Fund - 144A | 417,000 | 7.500 | 8/15/2023 | 423,839 | ||||||||||
| IRON/STEEL - 1.4% | ||||||||||||||
| Cleveland-Cliffs, Inc. - 144A | 475,000 | 4.875 | 1/15/2024 | 489,250 | ||||||||||
| Commercial Metals Co. | 462,000 | 5.750 | 4/15/2026 | 477,593 | ||||||||||
| Mineral Resources Ltd. - 144A | 525,000 | 8.125 | 5/1/2027 | 553,875 | ||||||||||
| 1,520,718 | ||||||||||||||
| LEISURE PRODUCTS - 0.5% | ||||||||||||||
| Silversea Cruise Finance Ltd. - 144A | 550,000 | 7.250 | 2/1/2025 | 587,466 | ||||||||||
| LODGING - 0.8% | ||||||||||||||
| Hilton Grand Vacations Borrower LLC | 298,000 | 6.125 | 12/1/2024 | 318,115 | ||||||||||
| Wyndham Destinations, Inc. | 346,000 | 4.150 | 4/1/2024 | 368,490 | ||||||||||
| Wyndham Destinations, Inc. | 175,000 | 5.750 | 4/1/2027 | 191,844 | ||||||||||
| 878,449 | ||||||||||||||
| MACHINERY-CONSTRUCTION/MINING - 0.4% | ||||||||||||||
| Terex Corp. - 144A | 445,000 | 5.625 | 2/1/2025 | 446,669 | ||||||||||
| MEDIA - 10.1% | ||||||||||||||
| Altice Financing SA - 144A | 535,000 | 7.500 | 5/15/2026 | 569,775 | ||||||||||
| Altice Luxembourg SA - 144A | 695,000 | 7.625 | 2/15/2025 | 719,325 | ||||||||||
| Belo Corp. | 235,000 | 7.250 | 9/15/2027 | 269,075 | ||||||||||
| Belo Corp. | 735,000 | 7.750 | 6/1/2027 | 852,600 | ||||||||||
| Block Communications, Inc. - 144A | 778,000 | 6.875 | 2/15/2025 | 814,955 | ||||||||||
| CCO Holdings LLC - 144A | 232,000 | 5.875 | 4/1/2024 | 242,440 | ||||||||||
| CCO Holdings LLC - 144A | 275,000 | 5.375 | 5/1/2025 | 286,000 | ||||||||||
| CCO Holdings LLC - 144A | 478,000 | 5.500 | 5/1/2026 | 504,888 | ||||||||||
| CCO Holdings LLC - 144A | 378,000 | 5.000 | 2/1/2028 | 396,295 | ||||||||||
| CCO Holdings LLC - 144A | 335,000 | 5.375 | 6/1/2029 | 358,450 | ||||||||||
| Charter Communications Operating LLC | 3 mo LIBOR + 1.650% | 545,000 | 3.903+ | 2/1/2024 | 561,130 | |||||||||
| Charter Communications Operating LLC | 355,000 | 5.050 | 3/30/2029 | 400,668 | ||||||||||
| CSC Holdings LLC - 144A | 225,000 | 5.375 | 7/15/2023 | 231,183 | ||||||||||
| CSC Holdings LLC | 440,000 | 5.250 | 6/1/2024 | 475,200 | ||||||||||
| CSC Holdings LLC - 144A | 1,800,000 | 5.500 | 4/15/2027 | 1,912,518 | ||||||||||
| EW Scripps Co. - 144A | 854,000 | 5.125 | 5/15/2025 | 867,878 | ||||||||||
| Sirius XM Radio, Inc. - 144A | 1,275,000 | 4.625 | 7/15/2024 | 1,335,562 | ||||||||||
| Sirius XM Radio, Inc. - 144A | 342,000 | 5.375 | 7/15/2026 | 362,093 | ||||||||||
| 11,160,035 | ||||||||||||||
| MINING - 2.0% | ||||||||||||||
| First Quantum Minerals Ltd. - 144A | 473,000 | 7.250 | 4/1/2023 | 476,843 | ||||||||||
| FMG Resources (August 2006) Pty Ltd. - 144A | 825,000 | 4.500 | 9/15/2027 | 818,297 | ||||||||||
| Freeport-McMoRan, Inc. | 525,000 | 3.875 | 3/15/2023 | 534,187 | ||||||||||
| Freeport-McMoRan, Inc. | 352,000 | 5.250 | 9/1/2029 | 359,146 | ||||||||||
| 2,188,473 | ||||||||||||||
| OIL & GAS - 4.1% | ||||||||||||||
| Brazos Valley Longhorn LLC | 639,000 | 6.875 | 2/1/2025 | 504,810 | ||||||||||
| Callon Petroleum Co. | 565,000 | 6.375 | 7/1/2026 | 529,687 | ||||||||||
| Centennial Resource Production LLC - 144A | 525,000 | 6.875 | 4/1/2027 | 517,125 | ||||||||||
| Chaparral Energy, Inc. - 144A ^ | 926,000 | 8.750 | 7/15/2023 | 393,550 | ||||||||||
See accompanying notes to financial statements.
37
| SCHEDULE OF INVESTMENTS |
| Dunham High-Yield Bond Fund (Continued) |
| October 31, 2019 |
| Principal | Interest | Maturity | ||||||||||
| Security | Amount | Rate % | Date | Value | ||||||||
| BONDS & NOTES - 93.1% (Continued) | ||||||||||||
| OIL & GAS - 4.1% (Continued) | ||||||||||||
| Extraction Oil & Gas, Inc. - 144A | $ | 725,000 | 5.625 | 2/1/2026 | $ | 311,750 | ||||||
| Hilcorp Energy I LP - 144A | 835,000 | 5.000 | 12/1/2024 | 745,488 | ||||||||
| Lonestar Resources America, Inc. - 144A | 521,000 | 11.250 | 1/1/2023 | 367,305 | ||||||||
| MEG Energy Corp. - 144A | 725,000 | 6.500 | 1/15/2025 | 756,719 | ||||||||
| Noble Holding International Ltd. - 144A | 232,000 | 7.875 | 2/1/2026 | 154,280 | ||||||||
| Southwestern Energy Co. | 264,000 | 7.500 | 4/1/2026 | 233,004 | ||||||||
| 4,513,718 | ||||||||||||
| OIL & GAS SERVICES - 1.6% | ||||||||||||
| Calfrac Holdings LP - 144A | 548,000 | 8.500 | 6/15/2026 | 237,859 | ||||||||
| Hi-Crush Partners LP - 144A | 871,000 | 9.500 | 8/1/2026 | 378,885 | ||||||||
| Nine Energy Service, Inc. - 144A | 265,000 | 8.750 | 11/1/2023 | 201,400 | ||||||||
| Pioneer Energy Service, Inc. | 652,000 | 6.125 | 3/15/2022 | 244,500 | ||||||||
| SESI LLC | 725,000 | 7.750 | 9/15/2024 | 402,375 | ||||||||
| USA Compression Partners LP | 241,000 | 6.875 | 4/1/2026 | 244,615 | ||||||||
| 1,709,634 | ||||||||||||
| PACKAGING & CONTAINERS - 4.0% | ||||||||||||
| Ardagh Packaging Finance PLC - 144A | 550,000 | 4.125 | 8/15/2026 | 557,398 | ||||||||
| Berry Global, Inc. - 144A | 248,000 | 4.500 | 2/15/2026 | 250,170 | ||||||||
| Crown Americas LLC | 300,000 | 4.500 | 1/15/2023 | 314,250 | ||||||||
| Crown Cork & Seal Co., Inc. | 311,000 | 7.375 | 12/15/2026 | 374,755 | ||||||||
| Intertape Polymer Group, Inc. - 144A | 524,000 | 7.000 | 10/15/2026 | 549,466 | ||||||||
| Owens-Brockway Glass Container, Inc. - 144A | 539,000 | 5.375 | 1/15/2025 | 545,737 | ||||||||
| Sealed Air Corp. - 144A | 592,000 | 5.125 | 12/1/2024 | 640,840 | ||||||||
| Silgan Holdings, Inc. | 550,000 | 4.750 | 3/15/2025 | 565,125 | ||||||||
| Trivium Packaging Finance B.V. - 144A | 525,000 | 8.500 | 8/15/2027 | 561,094 | ||||||||
| 4,358,835 | ||||||||||||
| PHARMACEUTICALS - 0.6% | ||||||||||||
| Bausch Health Companies, Inc. - 144A | 610,000 | 6.125 | 4/15/2025 | 634,781 | ||||||||
| PIPELINES - 4.0% | ||||||||||||
| Antero Midstream Partners LP - 144A | 28,000 | 5.750 | 3/1/2027 | 20,965 | ||||||||
| Cheniere Corpus Christi Holdings LLC | 600,000 | 7.000 | 6/30/2024 | 691,548 | ||||||||
| Cheniere Corpus Christi Holdings LLC | 350,000 | 5.875 | 3/31/2025 | 388,969 | ||||||||
| Cheniere Energy Partners LP | 432,000 | 5.250 | 10/1/2025 | 448,740 | ||||||||
| Cheniere Energy Partners LP - 144A | 248,000 | 4.500 | 10/1/2029 | 253,270 | ||||||||
| Genesis Energy LP. | 275,000 | 6.000 | 5/15/2023 | 269,500 | ||||||||
| Genesis Energy LP. | 625,000 | 5.625 | 6/15/2024 | 587,500 | ||||||||
| Holly Energy Partners LP - 144A | 525,000 | 6.000 | 8/1/2024 | 549,281 | ||||||||
| SemGroup Corp. | 428,000 | 5.625 | 7/15/2022 | 434,857 | ||||||||
| SemGroup Corp. | 475,000 | 5.625 | 11/15/2023 | 488,062 | ||||||||
| Summit Midstream Holdings LLC | 353,000 | 5.500 | 8/15/2022 | 317,700 | ||||||||
| 4,450,392 | ||||||||||||
| REAL ESTATE - 1.6% | ||||||||||||
| Kennedy-Wilson, Inc. | 935,000 | 5.875 | 4/1/2024 | 972,400 | ||||||||
| Newmark Group, Inc. | 679,000 | 6.125 | 11/15/2023 | 741,011 | ||||||||
| 1,713,411 | ||||||||||||
| REAL ESTATE INVESTMENT TRUSTS - 6.9% | ||||||||||||
| CTR Partnership LP | 604,000 | 5.250 | 6/1/2025 | 629,670 | ||||||||
| ESH Hospitality, Inc. - 144A | 700,000 | 5.250 | 5/1/2025 | 723,625 | ||||||||
| Extended Stay America, Inc. - 144A | 355,000 | 4.625 | 10/1/2027 | 356,811 | ||||||||
| GLP Capital LP | 550,000 | 5.375 | 4/15/2026 | 606,182 | ||||||||
| Hat Holdings I LLC - 144A | 621,000 | 5.250 | 7/15/2024 | 654,379 | ||||||||
| Iron Mountain, Inc. - 144A | 980,000 | 4.875 | 9/15/2027 | 1,017,975 | ||||||||
| iStar, Inc. | 250,000 | 6.000 | 4/1/2022 | 257,188 | ||||||||
| iStar, Inc. | 733,000 | 5.250 | 9/15/2022 | 752,241 | ||||||||
| MGM Growth Properties Operating Partnership LP - 144A | 513,000 | 5.750 | 2/1/2027 | 580,331 | ||||||||
| MPT Operating Partnership LP | 569,000 | 5.000 | 10/15/2027 | 600,295 | ||||||||
| Sabra Health Care LP | 812,000 | 5.125 | 8/15/2026 | 880,339 | ||||||||
| Starwood Property Trust, Inc. | 544,000 | 4.750 | 3/15/2025 | 566,270 | ||||||||
| 7,625,306 | ||||||||||||
See accompanying notes to financial statements.
38
| SCHEDULE OF INVESTMENTS |
| Dunham High-Yield Bond Fund (Continued) |
| October 31, 2019 |
| Principal | Interest | Maturity | ||||||||||
| Security | Amount | Rate % | Date | Value | ||||||||
| BONDS & NOTES - 93.1% (Continued) | ||||||||||||
| RETAIL - 3.0% | ||||||||||||
| Brinker International, Inc. - 144A | $ | 547,000 | 5.000 | 10/1/2024 | $ | 582,897 | ||||||
| Conn’s, Inc. ^ | 709,000 | 7.250 | 7/15/2022 | 721,407 | ||||||||
| EG Global Finance PLC - 144A | 605,000 | 6.750 | 2/4/2025 | 607,269 | ||||||||
| Lithia Motors, Inc. - 144A | 586,000 | 5.250 | 8/1/2025 | 616,032 | ||||||||
| Murphy Oil USA, Inc. | 375,000 | 4.750 | 9/15/2029 | 392,344 | ||||||||
| Yum! Brands, Inc. - 144A | 380,000 | 4.750 | 1/15/2030 | 399,475 | ||||||||
| 3,319,424 | ||||||||||||
| SEMICONDUCTORS - 0.5% | ||||||||||||
| Amkor Technology, Inc. - 144A | 531,000 | 6.625 | 9/15/2027 | 584,100 | ||||||||
| SOFTWARE - 2.5% | ||||||||||||
| Camelot Finance SA - 144A | 135,000 | 4.500 | 11/1/2026 | 136,742 | ||||||||
| CDK Global, Inc. | 539,000 | 5.875 | 6/15/2026 | 578,751 | ||||||||
| Donnelley Financial Solutions, Inc. | 678,000 | 8.250 | 10/15/2024 | 706,815 | ||||||||
| Rackspace Hosting, Inc. - 144A ^ | 725,000 | 8.625 | 11/15/2024 | 667,000 | ||||||||
| SS&C Technologies, Inc. - 144A | 630,000 | 5.500 | 9/30/2027 | 675,281 | ||||||||
| 2,764,589 | ||||||||||||
| TELECOMMUNICATIONS - 9.0% | ||||||||||||
| Altice France SA - 144A | 875,000 | 7.375 | 5/1/2026 | 939,177 | ||||||||
| Altice France SA - 144A | 213,000 | 8.125 | 2/1/2027 | 236,696 | ||||||||
| C&W Senior Financing Designated Activity Co. - 144A | 833,000 | 6.875 | 9/15/2027 | 879,856 | ||||||||
| CenturyLink, Inc. ^ | 1,435,000 | 7.500 | 4/1/2024 | 1,632,312 | ||||||||
| Hughes Satellite Systems Corp. | 646,000 | 6.625 | 8/1/2026 | 700,910 | ||||||||
| Intelsat Jackson Holdings SA | 769,000 | 5.500 | 8/1/2023 | 722,860 | ||||||||
| Level 3 Financing, Inc. - 144A | 462,000 | 4.625 | 9/15/2027 | 471,240 | ||||||||
| Sprint Corp. | 2,911,000 | 7.875 | 9/15/2023 | 3,220,294 | ||||||||
| Telesat LLC - 144A | 540,000 | 6.500 | 10/15/2027 | 565,137 | ||||||||
| T-Mobile USA, Inc. | 288,000 | 6.500 | 1/15/2024 | 299,880 | ||||||||
| T-Mobile USA, Inc. | 240,000 | 6.375 | 3/1/2025 | 249,650 | ||||||||
| 9,918,012 | ||||||||||||
| TOTAL BONDS & NOTES (Cost - $101,810,736) | 102,457,477 | |||||||||||
| Shares | ||||||||||||
| SHORT-TERM INVESTMENT - 0.7% | ||||||||||||
| MONEY MARKET FUND - 0.7% | ||||||||||||
| First American Government Obligations Fund - Class Z | 794,389 | 1.700 + | 794,389 | |||||||||
| TOTAL SHORT-TERM INVESTMENT (Cost - $794,389) | ||||||||||||
| COLLATERAL FOR SECURITIES LOANED - 3.3% | ||||||||||||
| HSBC US Government Money Market Fund - Class I # | 1,688,092 | 1.719 + | 1,688,092 | |||||||||
| Morgan Stanley Institutional Liquidity Fund Prime Portfolio - Class Institutional # | 1,964,233 | 1.940 + | 1,965,608 | |||||||||
| TOTAL COLLATERAL FOR SECURITIES LOANED (Cost - $3,652,325) | 3,653,700 | |||||||||||
| TOTAL INVESTMENTS - 97.1% (Cost - $106,257,450) | $ | 106,905,566 | ||||||||||
| OTHER ASSETS IN EXCESS OF LIABILITIES - 2.9% | 3,189,748 | |||||||||||
| NET ASSETS - 100.0% | $ | 110,095,314 | ||||||||||
LIBOR - London Inter-bank Offered Rate
LLC - Limited Liability Corporation
LP - Limited Partnership
PLC - Public Limited Company
| ^ | All or a portion of these securities are on loan. Total loaned securities had a value of $3,506,670 at October 31, 2019. |
| + | Variable rate security. Interest rate is as of October 31, 2019. |
| # | The Trust’s securities lending policies and procedures require that the borrower: (i) deliver cash or U.S. Government securities as collateral with respect to each new loan of U.S. securities, equal to at least 102% of the value of the portfolio securities loaned, and (ii) at all times thereafter mark-to-market the collateral on a daily basis so that the market value of such collateral is at least 100% of the value of securities loaned. From time to time the collateral may not be 102% due to end of day market movement. The next business day additional collateral is obtained/received from the borrower to replenish/reestablish 102%. |
144A - Security exempt from registration under Rule 144A of the Securities Act of 1933. These securities may be sold in transactions exempt from registration, normally to qualified institutional buyers. As of October 31, 2019 the total market value of 144A securities is $63,634,010 or 57.80% of net assets.
See accompanying notes to financial statements.
39
| SCHEDULE OF INVESTMENTS |
| Dunham High-Yield Bond Fund (Continued) |
| October 31, 2019 |
| Portfolio Composition** - (Unaudited) | ||||||||||
| Ba3 | 23.7 | % | Collateral For Securities Loaned | 3.4 | % | |||||
| B3 | 14.4 | % | Caa2 | 3.4 | % | |||||
| B2 | 13.9 | % | Caa1 | 3.1 | % | |||||
| Ba2 | 12.8 | % | Baa3 | 3.0 | % | |||||
| B1 | 12.6 | % | Short-Term Investment | 0.7 | % | |||||
| Ba1 | 8.4 | % | Other | 0.6 | % | |||||
| Total | 100.0 | % | ||||||||
| ** | Based on total value of investments as of October 31, 2019. Bond Ratings provided by Moody’s Ratings. |
Percentage may differ from Schedule of Investments which is based on Fund net assets.
See accompanying notes to financial statements.
40
| Dunham International Opportunity Bond Fund (Unaudited) |
| Message from the Sub-Adviser (Allianz Global Investors U.S. LLC) |
Asset Class Recap
The 2018 calendar year was a turbulent year for all asset classes as tightening financial conditions in the U.S. and the relatively stronger U.S. dollar weighed on global markets. The cyclical out performance of the U.S. from a growth perspective was driven by the pro-cyclical fiscal policy pushed through towards the end of 2017. So far in 2019, markets reversed course as a dovish stance by the Federal Reserve and the slowing dollar led to a record start to 2019. Despite the strong returns, spikes in volatility occurred throughout the fiscal year as tariff concerns escalated between the United States and China. Despite the spike in volatility, global bonds fared well as escalating volatility gave central banks another reason to discuss policy easing as the dovish rhetoric reverberated across global central banks. In the most recent fiscal quarter, volatility once again spiked as global growth concerns, and trade tensions between the U.S. and both China and the European Union reared its head. Foreign bonds, as measured by the Bloomberg Barclays Global Aggregate Bond ex-US Index, increased 7.8 percent during the fiscal year, which underperformed domestic bonds, as measured by the Bloomberg Barclays Aggregate Bond Index, by 3.7 percent.
Allocation Review
Country and yield curve selection strongly contributed to Fund performance over the most recent fiscal quarter and fiscal year. Also contributing to Fund performance was a German yield curve flattening bias. The currency effect in the Fund was relatively flat during the first six months of the fiscal year due to the Sub-Adviser being underweight a strong U.S. Dollar and going long the appreciating emerging market currencies. In the third fiscal quarter, emerging market currencies provided strong positive contributions, as well as the exposure to the Euro relative to the U.S. dollar. However, in the final fiscal quarter of the year, both developed market and emerging market currency exposure detracted from Fund performance. From a spread perspective, the overweight to corporate versus government bonds contributed in the first half of the fiscal year, but this positioning detracted from Fu nd performance over the second half of the fiscal year and the most recent fiscal quarter.
Holdings Insights
As previously mentioned, emerging markets external debt provided a strong contribution to Fund performance over the most recent fiscal quarter. F or example, a U.S. dollar-denominated emerging market government bond that contributed to Fund performance was the Republic of Kazakhstan 5.125% 7/21/2025 (Y7276LDE5) (holding weight*: 1.17 percent). This U.S. dollar-denominated issue returned 1.8 percent over the most recent fiscal quarter and 12.4 percent for the full fiscal year. Another emerging market government bond that contributed to performance was the Russia Government Bond 6.9% 5/23/2029 (BFX1TW9) (holding weight*: 1.76 percent), which increased 7.8 percent in the most recent fiscal quarter and 25.1 percent in the full fiscal year. The Fund also received a strong positive contribution from the exposure to Indonesia local rates. This exposure was achieved partially through the Indonesia Government 7.0% 5/15/2027 (B3ZR761) (holding weight*: 1.01 percent). This position increased 4.3 percent over the most recent fiscal quarter and 20.9 percent for the full fiscal year.
Detractors from relative Fund performance centered on the largest fund holdings, Japanese government bonds, despite the yen strengthening and rates declining in Japan. For example, the Japan Government Bond 1.9% 9/20/23 (6708557) (holding weight*: 4.68 percent) fell 0.1 percent over the fiscal quarter and increased only 0.5 percent for the ful l fiscal year. Another detractor from relative performance was the Japan Government Bond 2.1% 12/20/27 (B2B35B7) (holding weight*: 3.09 percent), which increased 0.2 percent in the most recent fiscal quarter and 2.6 percent for the full fiscal year. Overall, the derivative exposure within the Fund had a relatively muted impact on Fund performance over the fiscal year with positions providing small contribution and detractions to performance. For example, the Long Gilt Future Dec 19 (G Z9) (holding weight*: 0.01 percent) had a notional exposure of 2.66 percent and declined 0.7 percent since being initiated into the Fund in late August.
Sub-Adviser Outlook
The Sub-Adviser is cautiously optimistic for the remainder of 2019. The Sub-Adviser believes that strong returns will continue for fixed income, albeit at a slower pace. However, despite increasing focus on trade-related and global growth concerns, some downside risks have reduced following the shift towards a dovish bias by central banks around the globe. The Sub-Adviser believes that global inflation pressure will continue to be benign and more long-term inflation expectations remain anchored given structural drivers that are keeping prices suppressed. The Sub-Adviser is cautious on investment grade bonds given the significant rally in spreads against a relatively weaker global growth backdrop. The Sub-Adviser will carefully watch for escalation in trade wars and other geopolitical concerns, as well as bouts of volatility in credit markets given late-cycle dynamics.
| * | Holdings percentage(s) of total investments as of 10/31/2019. |
Growth of $100,000 Investment
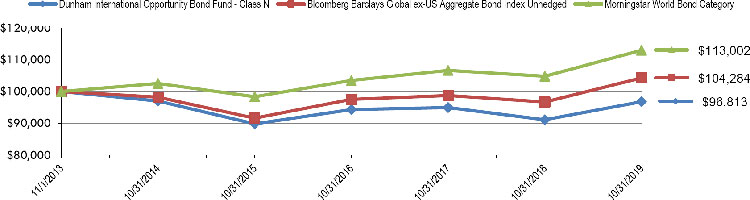
| Total Returns(a) as of October 31, 2019 | |||
| Annualized | |||
| Annualized | Since Inception | ||
| One Year | Five Years | (11/1/13) | |
| Class N | 6.29% | (0.04)% | (0.54)% |
| Class C | 5.36% | (0.80)% | (1.30)% |
| Class A with load of 4.50% | 1.18% | (1.19)% | (1.54)% |
| Class A without load | 5.98% | (0.29)% | (0.78)% |
| Barclays Global ex-US Aggregate Bond Index Unhedged | 7.84% | 1.20% | 0.70% |
| Morningstar World Bond Category | 7.80% | 3.29% | 2.06% |
| (a) | Total Returns are calculated based on traded NAVs. |
The Bloomberg Barclays Global ex US Aggregate Bond Index Unhedged is designed to be a broad based measure of the global investment-grade, fixed rate, fixed income corporate markets outside the United States. Investors cannot invest directly in an index or benchmark.
The Morningstar World Bond Category is generally representative of funds that invest at least 40% of bonds in foreign markets.
| As disclosed in the Trust’s latest registration statement, the Fund’s total annual operating expenses, including underlying funds, are 1.35% for Class N, 2.10% for Class C and 1.60% for Class A. Class A shares are subject to a sales load of 4.50% and a deferred sales charge of up to 0.75%. The performance data quoted here represents past performance, which is not indicative of future results. Current performance may be lower or higher than the performance data quoted. The investment return and NAV will fluctuate, so that an investor’s shares, when redeemed, may be worth more or less than their original cost. Total returns are calculated assuming reinvestment of all dividends and capital gains distributions, if any. The returns do not reflect the deductions of taxes a shareholder would pay on the redemption of Fund shares or Fund distributions. For performance information current to the most recent month-end, please call 1-800-442-4358 or visit our website www.dunham.com. |
41
| SCHEDULE OF INVESTMENTS |
| Dunham International Opportunity Bond Fund |
| October 31, 2019 |
| Principal | Maturity | |||||||||||||
| Security | Variable Rate | Amount ($) | Interest Rate % | Date | Value | |||||||||
| CORPORATE BONDS & NOTES - 28.9% | ||||||||||||||
| BANKS - 12.5% | ||||||||||||||
| ABN AMRO Bank NV | 200,000 | EUR | 6.3750 | 4/27/2021 | $ | 243,612 | ||||||||
| AIB Group PLC | 250,000 | EUR | 2.2500 | 7/3/2025 | 301,706 | |||||||||
| Banco Santander SA | 200,000 | EUR | 1.1250 | 1/17/2025 | 232,534 | |||||||||
| Banque Federative du Credit Mutuel SA | 200,000 | EUR | 2.6250 | 3/18/2024 | 248,470 | |||||||||
| Bayerische Landesbank | 300,000 | EUR | 0.2500 | 9/4/2024 | 343,838 | |||||||||
| BPCE SA | 200,000 | EUR | 4.6250 | 7/18/2023 | 258,563 | |||||||||
| Cooperatieve Rabobank UA | 200,000 | EUR | 1.3750 | 2/3/2027 | 243,412 | |||||||||
| Credit Agricole SA/London | 300,000 | EUR | 1.8750 | 12/20/2026 | 367,990 | |||||||||
| HSBC Holdings PLC | 3M Euro LIBOR + 1.36% | 350,000 | EUR | 1.5000 | + | 12/4/2024 | 412,806 | |||||||
| ING Bank NV | Euro 5 Year Swap Rate + 2.25% | 200,000 | EUR | 3.6250 | + | 2/25/2026 | 233,349 | |||||||
| Landesbank Hessen-Thueringen Girozentrale | 500,000 | EUR | 0.5000 | 9/25/2025 | 582,544 | |||||||||
| Nederlandse Waterschapsbank NV | 200,000 | EUR | 1.5000 | 4/27/2038 | 266,519 | |||||||||
| Royal Bank of Scotland Group PLC | 3M Euro LIBOR + 1.08% | 250,000 | EUR | 1.7500 | + | 3/2/2026 | 293,682 | |||||||
| UBS Group Funding Switzerland AG | 200,000 | EUR | 1.2500 | 9/1/2026 | 237,045 | |||||||||
| Westpac Banking Corp | 500,000 | EUR | 0.3750 | 3/5/2023 | 565,511 | |||||||||
| 4,831,581 | ||||||||||||||
| BEVERAGES - 2.2% | ||||||||||||||
| Anheuser-Busch InBev SA/NV | 300,000 | EUR | 0.8750 | 3/17/2022 | 342,263 | |||||||||
| Heineken NV | 200,000 | EUR | 3.5000 | 3/19/2024 | 257,899 | |||||||||
| Pernod Richard SA | 200,000 | EUR | 1.5000 | 5/18/2026 | 240,723 | |||||||||
| 840,885 | ||||||||||||||
| CHEMICALS - 1.5% | ||||||||||||||
| Air Liquide Finance SA | 500,000 | EUR | 0.7500 | 6/13/2024 | 578,719 | |||||||||
| ELECTRIC - 4.6% | ||||||||||||||
| EDP Finance BV | 250,000 | EUR | 1.5000 | 11/22/2027 | 300,902 | |||||||||
| Enel Finance International NV | 200,000 | EUR | 1.9660 | 1/27/2025 | 243,537 | |||||||||
| Engie SA | 300,000 | EUR | 2.3750 | 5/19/2026 | 386,038 | |||||||||
| Iberdrola Finanzas SA | 200,000 | EUR | 1.0000 | 3/7/2025 | 233,885 | |||||||||
| innogy Finance BV | 250,000 | EUR | 1.0000 | 4/13/2025 | 291,504 | |||||||||
| Orsted A/S | 250,000 | EUR | 1.5000 | 11/26/2029 | 307,386 | |||||||||
| 1,763,252 | ||||||||||||||
| ENGINEERING & CONSTRUCTION - 0.4% | ||||||||||||||
| Heathrow Funding Ltd. | 100,000 | GBP | 7.1250 | 2/14/2024 | 157,851 | |||||||||
| FOOD - 0.6% | ||||||||||||||
| Danone SA | 200,000 | EUR | 0.7090 | 11/3/2024 | 230,737 | |||||||||
| INSURANCE - 1.7% | ||||||||||||||
| Great-West Lifeco, Inc. | 300,000 | EUR | 2.5000 | 4/18/2023 | 363,232 | |||||||||
| NN Group NV | 250,000 | EUR | 1.6250 | 6/1/2027 | 304,717 | |||||||||
| 667,949 | ||||||||||||||
| MULTI-NATIONAL - 0.7% | ||||||||||||||
| European Investment Bank | 200,000 | EUR | 1.1250 | 9/15/2036 | 257,060 | |||||||||
| OIL & GAS - 1.0% | ||||||||||||||
| BG Energy Capital PLC | 350,000 | EUR | 1.2500 | 11/21/2022 | 405,082 | |||||||||
| PHARMACEUTICALS - 1.1% | ||||||||||||||
| GlaxoSmithKline Capital PLC | 350,000 | EUR | 1.2500 | 5/21/2026 | 417,701 | |||||||||
See accompanying notes to financial statements.
42
| SCHEDULE OF INVESTMENTS |
| Dunham International Opportunity Bond Fund (Continued) |
| October 31, 2019 |
| Principal | Maturity | |||||||||||||
| Security | Variable Rate | Amount ($) | Interest Rate % | Date | Value | |||||||||
| CORPORATE BONDS & NOTES - 28.9% (Continued) | ||||||||||||||
| REITS - 0.6% | ||||||||||||||
| Westfield America Management Ltd. | 200,000 | GBP | 2.1250 | 3/30/2025 | $ | 265,147 | ||||||||
| TELECOMMUNICATIONS - 1.4% | ||||||||||||||
| Deutsche Telekom International Finance BV | 250,000 | EUR | 0.6250 | 4/3/2023 | 285,008 | |||||||||
| Orange SA | 200,000 | EUR | 2.0000 | 1/15/2029 | 254,941 | |||||||||
| 539,949 | ||||||||||||||
| WATER - 0.6% | ||||||||||||||
| Veolia Environnement SA | 200,000 | EUR | 1.4960 | 11/30/2026 | 243,976 | |||||||||
| TOTAL CORPORATE BONDS & NOTES (Cost - $11,018,827) | 11,199,889 | |||||||||||||
| FOREIGN GOVERNMENT BONDS - 67.8% | ||||||||||||||
| Australia Government Bond | 700,000 | AUD | 2.7500 | 11/21/2029 | 555,907 | |||||||||
| Brazilian Government International Bond | 200,000 | USD | 4.6250 | 1/13/2028 | 214,356 | |||||||||
| Canadian Government Bond | 105,000 | CAD | 5.0000 | 6/1/2037 | 121,806 | |||||||||
| Colombia Government International Bond | 200,000 | EUR | 3.8750 | 3/22/2026 | 265,804 | |||||||||
| Dominican Republic International Bond | 150,000 | USD | 6.0000 | 7/19/2028 | 166,314 | |||||||||
| French Republic Government Bond OAT | 750,000 | EUR | 0.5000 | 5/25/2029 | 888,676 | |||||||||
| French Republic Government Bond OAT | 70,000 | EUR | 1.2500 | 5/25/2034 | 90,391 | |||||||||
| French Republic Government Bond OAT | 290,000 | EUR | 4.5000 | 4/25/2041 | 596,139 | |||||||||
| French Republic Government Bond OAT - 144A | 50,000 | EUR | 2.0000 | 5/25/2048 | 75,630 | |||||||||
| Hungary Government International Bond | 400,000 | USD | 5.3750 | 3/25/2024 | 450,761 | |||||||||
| Indonesia Government International Bond - 144A | 400,000 | EUR | 2.1500 | 7/18/2024 | 476,752 | |||||||||
| Indonesia Treasury Bond | 5,400,000,000 | IDR | 7.0000 | 5/15/2027 | 390,853 | |||||||||
| Indonesia Treasury Bond | 6,800,000,000 | IDR | 6.1250 | 5/15/2028 | 463,430 | |||||||||
| Ireland Government Bond | 130,000 | EUR | 5.4000 | 3/13/2025 | 189,715 | |||||||||
| Ireland Government Bond | 50,000 | EUR | 0.9000 | 5/15/2028 | 60,511 | |||||||||
| Ireland Government Bond | 130,000 | EUR | 1.3000 | 5/15/2033 | 164,325 | |||||||||
| Italy Buoni Poliennali Del Tesoro | 250,000 | EUR | 1.0000 | 7/15/2022 | 286,646 | |||||||||
| Italy Buoni Poliennali Del Tesoro | 240,000 | EUR | 4.5000 | 3/1/2024 | 316,509 | |||||||||
| Italy Buoni Poliennali Del Tesoro | 255,000 | EUR | 3.7500 | 9/1/2024 | 330,721 | |||||||||
| Italy Buoni Poliennali Del Tesoro | 750,000 | EUR | 2.8000 | 12/1/2028 | 980,154 | |||||||||
| Italy Buoni Poliennali Del Tesoro | 50,000 | EUR | 3.0000 | 8/1/2029 | 66,560 | |||||||||
| Italy Buoni Poliennali Del Tesoro - 144A | 235,000 | EUR | 5.0000 | 9/1/2040 | 407,750 | |||||||||
| Japan Government Forty Year Bond | 9,850,000 | JPY | 0.8000 | 3/20/2058 | 103,412 | |||||||||
| Japan Government Ten Year Bond | 179,000,000 | JPY | 0.1000 | 6/20/2026 | 1,696,314 | |||||||||
| Japan Government Ten Year Bond | 30,450,000 | JPY | 0.1000 | 12/20/2028 | 289,255 | |||||||||
| Japan Government Ten Year Bond | 20,000,000 | JPY | 0.1000 | 6/20/2029 | 189,642 | |||||||||
| Japan Government Thirty Year Bond | 93,850,000 | JPY | 2.0000 | 9/20/2041 | 1,187,556 | |||||||||
| Japan Government Thirty Year Bond | 53,450,000 | JPY | 1.5000 | 3/20/2045 | 636,956 | |||||||||
| Japan Government Thirty Year Bond | 53,800,000 | JPY | 0.5000 | 9/20/2046 | 517,157 | |||||||||
| Japan Government Twenty Year Bond | 180,600,000 | JPY | 1.9000 | 9/20/2023 | 1,810,702 | |||||||||
| Japan Government Twenty Year Bond | 108,300,000 | JPY | 2.1000 | 12/20/2027 | 1,195,676 | |||||||||
| Japan Government Twenty Year Bond | 122,150,000 | JPY | 1.7000 | 9/20/2033 | 1,390,463 | |||||||||
| Japan Government Twenty Year Bond | 24,800,000 | JPY | 1.5000 | 6/20/2034 | 277,483 | |||||||||
| Japan Government Twenty Year Bond | 9,800,000 | JPY | 0.7000 | 9/20/2038 | 98,931 | |||||||||
| Kazakhstan Government International Bond | 400,000 | USD | 5.1250 | 7/21/2025 | 454,292 | |||||||||
| Kingdom of Belgium Government Bond - 144A | 130,000 | EUR | 5.0000 | 3/28/2035 | 249,877 | |||||||||
| Korea Treasury Bond | 890,000,000 | KRW | 2.3750 | 12/10/2028 | 806,299 | |||||||||
| Mexican Bonos | 3,270,000 | MXN | 5.7500 | 3/5/2026 | 162,043 | |||||||||
| Mexican Bonos | 21,000,000 | MXN | 8.5000 | 5/31/2029 | 1,228,279 | |||||||||
| Mexico Government International Bond | 100,000 | EUR | 1.6250 | 4/8/2026 | 116,698 | |||||||||
| New Zealand Government Bond | 1,350,000 | NZD | 1.5000 | 5/15/2031 | 869,417 | |||||||||
| Portugal Obrigacoes do Tesouro OT - 144A | 100,000 | EUR | 4.1250 | 4/14/2027 | 145,552 | |||||||||
| Province of British Columbia Canada | 150,000 | CAD | 3.2000 | 6/18/2044 | 132,013 | |||||||||
| Province of Ontario Canada | 250,000 | CAD | 2.8000 | 6/2/2048 | 205,444 | |||||||||
See accompanying notes to financial statements.
43
| SCHEDULE OF INVESTMENTS |
| Dunham International Opportunity Bond Fund (Continued) |
| October 31, 2019 |
| Principal | Maturity | |||||||||||||
| Security | Variable Rate | Amount ($) | Interest Rate % | Date | Value | |||||||||
| FOREIGN GOVERNMENT BONDS - 67.8% (Continued) | ||||||||||||||
| Qatar Government International Bond - 144A | 350,000 | USD | 4.0000 | 3/14/2029 | $ | 388,966 | ||||||||
| Republic of Austria Government Bond - 144A | 190,000 | EUR | 2.4000 | 5/23/2034 | 282,898 | |||||||||
| Republic of Austria Government Bond - 144A | 150,000 | EUR | 1.5000 | 2/20/2047 | 213,946 | |||||||||
| Russian Federal Bond - OFZ | 41,500,000 | RUB | 6.9000 | 5/23/2029 | 672,074 | |||||||||
| Spain Government Bond | 300,000 | EUR | 0.4000 | 4/30/2022 | 341,500 | |||||||||
| Spain Government Bond - 144A | 600,000 | EUR | 1.4500 | 4/30/2029 | 747,452 | |||||||||
| Spain Government Bond - 144A | 250,000 | EUR | 1.9500 | 7/30/2030 | 327,688 | |||||||||
| Spain Government Bond - 144A | 140,000 | EUR | 4.2000 | 1/31/2037 | 246,218 | |||||||||
| United Kingdom Gilt | 350,000 | GBP | 4.2500 | 6/7/2032 | 643,309 | |||||||||
| United Kingdom Gilt | 185,000 | GBP | 4.5000 | 12/7/2042 | 405,881 | |||||||||
| United Kingdom Gilt | 125,000 | GBP | 3.2500 | 1/22/2044 | 234,598 | |||||||||
| United Kingdom Gilt | 70,000 | GBP | 4.2500 | 12/7/2055 | 176,920 | |||||||||
| United Kingdom Gilt | 20,000 | GBP | 4.0000 | 1/22/2060 | 51,054 | |||||||||
| United Kingdom Gilt | 70,000 | GBP | 3.5000 | 7/22/2068 | 175,850 | |||||||||
| TOTAL FOREIGN GOVERNMENT BONDS (Cost - $25,136,912) | 26,231,525 | |||||||||||||
| WHOLE LOAN COLLATERAL - 0.9% | ||||||||||||||
| Bankinter 10 FTA | 3M Euro LIBOR + 0.16% | 80,843 | EUR | 0.0001 | + | 6/21/2043 | 90,104 | |||||||
| Dutch Property Finance 2017-1 BV | 3M Euro LIBOR + 0.68% | 201,233 | EUR | 0.2760 | + | 1/28/2048 | 225,180 | |||||||
| Fondo de Titulizacion de Activos Santander Hipotecario 2 | 3M Euro LIBOR + 0.15% | 34,937 | EUR | 0.0001 | + | 1/18/2049 | 38,633 | |||||||
| TOTAL WHOLE LOAN COLLATERAL(Cost - $354,909) | 353,917 | |||||||||||||
| TOTAL INVESTMENTS - 97.6% (Cost - $36,510,648) | $ | 37,785,331 | ||||||||||||
| OTHER ASSETS IN EXCESS OF LIABILITIES - 2.4% | 940,866 | |||||||||||||
| NET ASSETS - 100.0% | $ | 38,726,197 | ||||||||||||
| AUD - Australian Dollar | GBP - United Kingdom Pound | KRW - South Korean Won | RUB - Russian Ruble |
| CAD - Canadian Dollar | IDR - Indonesian Rupiah | MXN - Mexican Peso | USD - US Dollar |
| EUR - Euro | JPY - Japanese Yen | NZD - New Zealand Dollar |
| + | Variable rate security. Interest rate is as of October 31, 2019. |
144A - Security exempt from registration under Rule 144A of the Securities Act of 1933. These securities may be sold in transactions exempt from registration, normally to qualified institutional buyers. The 144A securities amounted to $3,562,729 or 9.20% of net assets.
| Unrealized | ||||||||||||||
| Appreciation | ||||||||||||||
| Futures Contracts * | Counterparty | Contracts | Notional | Expiration | (Depreciation) | |||||||||
| LONG FUTURES CONTRACTS - (0.2)% | ||||||||||||||
| Canadian 10 Year Bond Future | Credit Suisse | 8 | $ | 864,549 | 12/18/2019 | $ | (18,399 | ) | ||||||
| EURO-BOBL Future | Credit Suisse | 5 | 750,945 | 12/6/2019 | (7,760 | ) | ||||||||
| EURO-BUXL 30 Year Bond Future | Credit Suisse | 3 | 702,726 | 12/6/2019 | (39,221 | ) | ||||||||
| Long Gilt Future | Credit Suisse | 6 | 1,031,370 | 12/27/2019 | (7,244 | ) | ||||||||
| NET UNREALIZED LOSS FROM FUTURES CONTRACTS PURCHASED | (72,624 | ) | ||||||||||||
| SHORT FUTURES CONTRACTS - 0.2% | ||||||||||||||
| EURO-BUND Future | Credit Suisse | (1) | (125,031 | ) | 12/6/2019 | 669 | ||||||||
| EURO-SCHATZ Future | Credit Suisse | (23) | (4,407,358 | ) | 12/6/2019 | 86,748 | ||||||||
| NET UNREALIZED GAIN FROM FUTURES CONTRACTS SOLD | 87,417 | |||||||||||||
| NET UNREALIZED GAIN FROM FUTURES CONTRACTS | $ | 14,793 | ||||||||||||
| * | Face amounts are the underlying reference notional amounts to stock exchange indices and bonds upon which the fair value of the futures contracts traded by the Fund are based. |
While face amounts do not represent the current fair value and are not necessarily indicative of the future cash flows of the Fund’s futures contracts, the underlying price changes in relation to the variables specified by the face amounts affect the fair value of these derivative financial instruments. Instrument is non-income producing.
See accompanying notes to financial statements.
44
| SCHEDULE OF INVESTMENTS |
| Dunham International Opportunity Bond Fund (Continued) |
| October 31, 2019 |
| Portfolio Composition ** - (Unaudited) | ||||||||||
| Japan | 24.9 | % | Mexico | 4.0 | % | |||||
| France | 11.8 | % | Australia | 3.7 | % | |||||
| Britain | 8.5 | % | Indonesia | 3.5 | % | |||||
| Netherlands | 7.7 | % | Germany | 2.5 | % | |||||
| Italy | 6.3 | % | Other Countries | 21.1 | % | |||||
| Spain | 6.0 | % | Total | 100.00 | % | |||||
| ** | Based on total value of investments as of October 31, 2019. |
Percentage may differ from Schedule of Investments which are based on Fund net assets.
See accompanying notes to financial statements.
45
| SCHEDULE OF INVESTMENTS |
| Dunham International Opportunity Bond Fund (Continued) |
| October 31, 2019 |
As of October 31, 2019 the following Forward Foreign Currency Exchange Contracts were open:
Forward Foreign Currency Exchange Contracts
| Unrealized | ||||||||||||||||||||||||||
| Settlement | Local Currency | U.S. Dollar | Appreciation | |||||||||||||||||||||||
| Foreign Currency | Date | Counterparty | Amount Purchased | Market Value | (Depreciation) | |||||||||||||||||||||
| To Sell USD and To Buy: | ||||||||||||||||||||||||||
| Australian Dollar | 12/10/2019 | Barclays | $ | 1,828,952 | $ | 1,261,308 | $ | 2,815 | ||||||||||||||||||
| British Pound | 12/10/2019 | Citigroup | 860,785 | 1,115,190 | 50,847 | |||||||||||||||||||||
| Canadian Dollar | 12/10/2019 | Citigroup | 1,311,900 | 998,262 | 277 | |||||||||||||||||||||
| Euro | 12/10/2019 | Barclays | 179,318 | 200,550 | 4,097 | |||||||||||||||||||||
| Euro | 12/10/2019 | Citigroup | 1,065,591 | 1,191,762 | 11,657 | |||||||||||||||||||||
| Japanese Yen | 12/10/2019 | Barclays | 249,131,630 | 2,309,738 | (33,337 | ) | ||||||||||||||||||||
| Japanese Yen | 12/10/2019 | Citigroup | 21,599,104 | 200,249 | (185 | ) | ||||||||||||||||||||
| New Zealand Dollar | 12/10/2019 | Citigroup | 831,747 | 533,755 | 4,579 | |||||||||||||||||||||
| Norwegian Krone | 12/10/2019 | Barclays | 3,486,000 | 379,769 | (4,703 | ) | ||||||||||||||||||||
| Brazilian Real | 1/15/2020 | Barclays | 3,284,000 | 814,719 | 14,214 | |||||||||||||||||||||
| China Yuan Renminbi | 1/15/2020 | Barclays | 2,613,000 | 370,150 | 4,431 | |||||||||||||||||||||
| China Yuan Renminbi | 1/15/2020 | Citigroup | 7,898,000 | 1,118,808 | 13,713 | |||||||||||||||||||||
| Czech Koruna | 1/15/2020 | Citigroup | 1,121,861 | 49,144 | 1,221 | |||||||||||||||||||||
| Hungary Forint | 1/15/2020 | Citigroup | 14,302,000 | 48,822 | 1,476 | |||||||||||||||||||||
| Indonesian Rupiah | 1/15/2020 | Barclays | 745,626,000 | 52,724 | 726 | |||||||||||||||||||||
| Polish Zloty | 1/15/2020 | Barclays | 421,790 | 110,621 | 3,404 | |||||||||||||||||||||
| Polish Zloty | 1/15/2020 | Citigroup | 150,000 | 39,340 | 1,221 | |||||||||||||||||||||
| Singapore Dollar | 1/15/2020 | Barclays | 165,000 | 121,336 | 1,593 | |||||||||||||||||||||
| South Korean Won | 1/15/2020 | Barclays | 160,835,552 | 138,512 | 3,544 | |||||||||||||||||||||
| Thai Baht | 1/15/2020 | Citigroup | 6,706,000 | 222,284 | 1,907 | |||||||||||||||||||||
| $ | 83,497 | |||||||||||||||||||||||||
| Unrealized | ||||||||||||||||||||||||||
| Settlement | Local Currency | U.S. Dollar | Appreciation | |||||||||||||||||||||||
| Foreign Currency | Date | Counterparty | Amount Sold | Market Value | (Depreciation) | |||||||||||||||||||||
| To Buy USD and To Sell: | ||||||||||||||||||||||||||
| Australian Dollar | 12/10/2019 | Barclays | $ | (826,889 | ) | $ | (570,251 | ) | $ | (16,293 | ) | |||||||||||||||
| Australian Dollar | 12/10/2019 | Citigroup | (9,712 | ) | (6,698 | ) | (15 | ) | ||||||||||||||||||
| British Pound | 12/10/2019 | Barclays | (78,077 | ) | (101,153 | ) | (5,153 | ) | ||||||||||||||||||
| British Pound | 12/10/2019 | Citigroup | (256,629 | ) | (332,475 | ) | (15,852 | ) | ||||||||||||||||||
| Canadian Dollar | 12/10/2019 | Barclays | (1,107,351 | ) | (842,614 | ) | (4,014 | ) | ||||||||||||||||||
| Euro | 12/10/2019 | Barclays | (1,163,495 | ) | (1,301,258 | ) | (9,825 | ) | ||||||||||||||||||
| Euro | 12/10/2019 | Citigroup | (321,604 | ) | (359,683 | ) | (5,601 | ) | ||||||||||||||||||
| Japanese Yen | 12/10/2019 | Barclays | (13,471,366 | ) | (124,895 | ) | 1,525 | |||||||||||||||||||
| Japanese Yen | 12/10/2019 | Citigroup | (79,238,081 | ) | (734,628 | ) | 8,991 | |||||||||||||||||||
| New Zealand Dollar | 12/10/2019 | Citigroup | (712,589 | ) | (457,288 | ) | 2,160 | |||||||||||||||||||
| Brazilian Real | 1/15/2020 | Barclays | (1,615,000 | ) | (400,661 | ) | 232 | |||||||||||||||||||
| Brazilian Real | 1/15/2020 | Citigroup | (1,669,000 | ) | (414,058 | ) | (6,099 | ) | ||||||||||||||||||
| Mexican Peso | 1/15/2020 | Barclays | (23,014,222 | ) | (1,187,070 | ) | (26,583 | ) | ||||||||||||||||||
| Russian Ruble | 1/15/2020 | Barclays | (34,943,311 | ) | (540,016 | ) | (8,517 | ) | ||||||||||||||||||
| South Korean Won | 1/15/2020 | Barclays | (111,384,000 | ) | (95,924 | ) | (581 | ) | ||||||||||||||||||
| Thai Baht | 1/15/2020 | Citigroup | (6,706,000 | ) | (222,284 | ) | (1,772 | ) | ||||||||||||||||||
| $ | (87,397 | ) | ||||||||||||||||||||||||
| Local Currency | Local Currency | U.S. Dollar | U.S. Dollar | Unrealized | ||||||||||||||||||||||
| Settlement | Amount Purchased | Amount Purchased | Market Value | Market Value | Appreciation | |||||||||||||||||||||
| Foreign Currency | Date | Counterparty | Buy | Sell | Buy | Sell | (Depreciation) | |||||||||||||||||||
| To Buy: | To Sell: | |||||||||||||||||||||||||
| British Pound | Euro | 12/10/2019 | Barclays | $ | 358,176 | $ | (399,320 | ) | $ | 464,035 | $ | (446,602 | ) | $ | 17,433 | |||||||||||
| Danish Krone | Euro | 12/10/2019 | Citigroup | 1,012,185 | (135,703 | ) | 151,587 | (151,771 | ) | (183 | ) | |||||||||||||||
| Euro | New Zealand Dollar | 12/10/2019 | Citigroup | 68,390 | (119,158 | ) | 76,488 | (76,467 | ) | 21 | ||||||||||||||||
| Euro | New Zealand Dollar | 12/10/2019 | Citigroup | 736,760 | (1,285,858 | ) | 823,996 | (825,171 | ) | (1,176 | ) | |||||||||||||||
| Norwegian Krone | Euro | 12/10/2019 | Barclays | 4,176,176 | (420,541 | ) | 454,958 | (470,335 | ) | (15,378 | ) | |||||||||||||||
| Swedish Krona | Euro | 12/10/2019 | Barclays | 2,842,384 | (266,610 | ) | 295,639 | (298,178 | ) | (2,539 | ) | |||||||||||||||
| Swiss Franc | Euro | 12/10/2019 | Citigroup | 34,922 | (31,999 | ) | 35,491 | (35,788 | ) | (297 | ) | |||||||||||||||
| Swiss Franc | Euro | 12/10/2019 | Barclays | 368,295 | (337,469 | ) | 374,294 | (377,427 | ) | (3,133 | ) | |||||||||||||||
| $ | (5,252 | ) | ||||||||||||||||||||||||
| Net Unrealized Loss on Forward Foreign Currency Exchange Contracts | $ | (9,152 | ) | |||||||||||||||||||||||
See accompanying notes to financial statements.
46
| Dunham Large Cap Value Fund (Unaudited) |
| Message from the Sub-Adviser (Rothschild & Co. Asset Management US Inc.) |
Asset Class Recap
As U.S. equities began the fiscal year with a downturn, and generally experienced some volatility mid-year, large cap value stocks, as measured by the Russell 1000 Value Index, were no exception. During the fiscal year, large cap value stocks declined along with their U.S. equity peers early in the 12-month period, declining nearly 12 percent before oscillating in an overall positive trajectory to end the fiscal year up 11.2 percent. Perspectives on interest rates and energy prices generally provided the greatest impacts on some of the most prominent large cap value sectors. As investor reactions to headlines tended to be binary and somewhat dramatic in regard to magnitude, it made navigating the large cap value space precarious during the fiscal year.
Allocation Review
The financial services sector is the largest sector allocation in the large cap value space, comprising 29 percent of the benchmark index. The Fund had a 2 percent underweight to the sector during the fiscal year, which generally detracted from performance as the sector increased 13.4 percent during the 12-month period. The performance dispersion across sectors during the fiscal year was significant, even when excluding the highest and lowest performing sectors. During the fiscal year, the highest performing sector was the technology sector, up 23.3 percent, and the worst performing sector was the energy sector, down 12.4 percent. The Fund generally benefitted from this particular dispersion, as the Fund’s largest overweight was to the technology sector and had an inline allocation to the energy sector. The Fund’s largest underweight was to the consumer discretionary sector, which generally performed inline with the benchmark index. Therefore, these overweights and underweights in aggregate proved to be a positive attribution to relative Fund performance during the fiscal year.
Holdings Insights
A common theme throughout the year was that the sector overweights and underweights provided far less impact to overall Fund performance when c ompared to the effect of security selection. For example, one of the best performing sectors on a relative basis for the Fund was the energy sector, since the Sub-Adviser’s stock selection avoided nearly one-third of the energy sector’s decline. Holdings such as Marathon Petroleum Corp. (MPC) (holding weight*: 1.12 percent), an oil refiner with a nationwide network of branded gas stations, and Phillips 66 (PSX) (holding weight*: 1.24 percent), a global refiner and producer of specialty products such as petroleum-based lubricants, were each positive relative contributors in the Fund’s energy allocation during the fiscal year. Although MPC declined 5.6 percent during the fiscal year, this negative return was only half of the downturn experienced by the sector as a whole. PSX bucked the sector’s negative trend, increasing 17.8 percent over the 12-month period. The Fund’s largest energy holding, Chevron Corp. (CVX) (holding weight*: 2.24 percent), is also one of the largest energy positions in the index. During the fiscal year, CVX was also able to produce a positive result, as it increased 8.2 percent. The Sub-Adviser believes that some of the negative pressure on the energy space was attributable to investor concerns about the increasing political pressures against the future of shale production.
While utilities was the third-strongest performing sector during the fiscal year, the Sub-Adviser’s stock selection in the sector resulted in the utilities sector being one of the best performing sectors in the Fund. The Fund’s two largest holdings in the space were also the largest positions in the sector within the benchmark index. In addition, o ne of the two holdings was also the Fund’s strongest performer in the utilities sector. Verizon Communications Inc. (VZ) (holding weight*: 3.01 percent) increased 10.4 percent during the fiscal year, not even meeting half of the sector’s 21.5 per cent return. VZ was in negative return territory heading into the final months of the fiscal year, when its strength in the small and medium businesses wireline service provider market generally buoyed the stock in the final fiscal q uarter and it increased 10.5 percent. AT&T Inc. (T) (holding weight*: 2.75 percent) surged 33.4 percent during the same time 12-month period, making it the strongest performing utility stock in the Fund. T ’s significant rise during the fiscal year was partially attributable to activist investors pressuring company management to make better use of its historical acquisitions that have yet to live up to their full potential.
The materials & processing sector is one of the smallest sectors in the benchmark index. The Fund had a similar weighting to the sector. However, the materials & processing sector was the best performing sector in the Fund during the fiscal year, despite it being a below-average performer for the benchmark index. Two of the strongest performers in the sector, Air Products & Chemicals Inc. (APD) (holding weight*: 1.19 percent) and Owens Corning (OC) (holding weight*: 0.79 percent), produced returns over 30 percent during the fiscal year, contributing to the Fund’s extreme relative out performance. APD, a global distributor of gases and chemicals for industrial uses, declined 6.1 percent in the final fiscal quarter, but still finished the fiscal year up 41.4 percent. OC, a roofing, insulation, and fiber glass composites manufacturer, increased 6.0 percent in the final months of the fiscal year, raising its 12-month return to 31.9 percent.
Sub-Adviser Outlook
The Sub-Adviser believes that the current environment exhibits a higher amount of uncertainty and adverse conditions can appear quick ly due to the binary reactions of investors to both economic releases and political headlines. Therefore, the Sub-Adviser has attempted to reduce its exposures to areas it believes are most prone to these behaviors. The Sub-Adviser continues to be encouraged by the strong earnings releases and generally positive economic data. The Sub-Adviser remains focused on identifying companies with what it believes are attractive valuations relative to peers.
| * | Holdings percentage(s) of total investments, excluding collateral for securities loaned, as of 10/31/2019. |
Growth of $100,000 Investment
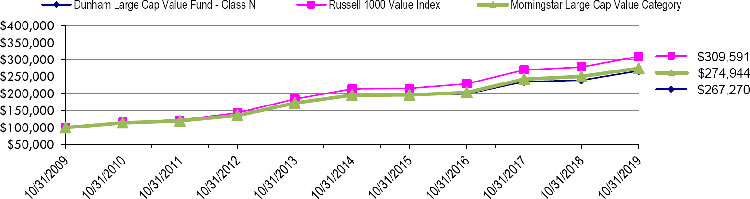
| Total Returns(a) as of October 31, 2019 | |||
| Annualized | Annualized | ||
| One Year | Five Years | Ten Years | |
| Class N | 11.37% | 6.66% | 10.33% |
| Class C | 10.24% | 5.60% | 9.24% |
| Class A with load of 5.75% | 4.62% | 5.13% | 9.40% |
| Class A without load | 11.00% | 6.39% | 10.05% |
| Russell 1000 Value Index | 11.21% | 7.61% | 11.96% |
| Morningstar Large Cap Value Category | 9.57% | 7.01% | 10.64% |
| (a) | Total Returns are calculated based on traded NAVs. |
The Russell 1000 Value Index is a subset of the Russell 1000 Index which measures the performance of the stocks of the 1000 largest companies in the Russell 3000 Index based on market capitalization. The Russell 1000 Value Index measures the performance of those Russell 1000 companies with lower price-to-book ratios and lower forecasted growth values. Investors cannot invest directly in an index or benchmark.
The Morningstar Large Cap Value Category is generally representative of mutual funds that primarily invest in big (large capitalization) U.S. companies that are less expensive or growing more slowly than other large-cap stocks.
| As disclosed in the Trust’s latest registration statement, the Fund’s total annual operating expenses, including underlying funds, are 1.30% for Class N, 2.30% for Class C and 1.55% for Class A. Class A shares are subject to a sales load of 5.75% and a deferred sales charge of up to 0.75%. The performance data quoted here represents past performance, which is not indicative of future results. Current performance may be lower or higher than the performance data quoted. The investment return and NAV will fluctuate, so that an investor’s shares, when redeemed, may be worth more or less than their original cost. Total returns are calculated assuming reinvestment of all dividends and capital gains distributions, if any. The returns do not reflect the deductions of taxes a shareholder would pay on the redemption of Fund shares or Fund distributions. For performance information current to the most recent month-end, please call 1-800-442-4358 or visit our website www.dunham.com. |
47
| SCHEDULE OF INVESTMENTS |
| Dunham Large Cap Value Fund |
| October 31, 2019 |
| Security | Shares | Value | ||||||
| COMMON STOCKS - 98.0% | ||||||||
| AEROSPACE/DEFENSE - 2.7% | ||||||||
| Lockheed Martin Corp. | 2,391 | $ | 900,642 | |||||
| Northrop Grumman Corp. | 3,752 | 1,322,505 | ||||||
| 2,223,147 | ||||||||
| AIRLINES - 1.4% | ||||||||
| Delta Air Lines, Inc. | 21,329 | 1,174,801 | ||||||
| APPAREL - 0.9% | ||||||||
| PVH Corp. | 8,500 | 740,860 | ||||||
| AUTO PARTS & EQUIPMENT - 0.5% | ||||||||
| BorgWarner, Inc. | 9,475 | 394,918 | ||||||
| BANKS - 10.9% | ||||||||
| Bank of America Corp. | 90,394 | 2,826,620 | ||||||
| JPMorgan Chase & Co. | 27,882 | 3,483,019 | ||||||
| State Street Corp. | 16,036 | 1,059,499 | ||||||
| SunTrust Banks, Inc. | 16,147 | 1,103,486 | ||||||
| Wells Fargo & Co. | 12,023 | 620,748 | ||||||
| 9,093,372 | ||||||||
| BEVERAGES - 1.8% | ||||||||
| PepsiCo, Inc. | 11,194 | 1,535,481 | ||||||
| BIOTECHNOLOGY - 1.9% | ||||||||
| Biogen, Inc. * | 2,566 | 766,490 | ||||||
| Gilead Sciences, Inc. | 13,051 | 831,479 | ||||||
| 1,597,969 | ||||||||
| BUILDING MATERIALS - 0.8% | ||||||||
| Owens Corning | 10,709 | 656,248 | ||||||
| CHEMICALS - 2.6% | ||||||||
| Air Products & Chemicals, Inc. | 4,628 | 986,967 | ||||||
| CF Industries Holdings, Inc. | 11,333 | 513,952 | ||||||
| Huntsman Corp. | 31,779 | 703,269 | ||||||
| 2,204,188 | ||||||||
| COMMERCIAL SERVICES - 1.3% | ||||||||
| Quanta Services, Inc. | 26,665 | 1,121,263 | ||||||
| COSMETICS / PERSONAL CARE - 3.1% | ||||||||
| Procter & Gamble Co. | 20,941 | 2,607,364 | ||||||
| DIVERSIFIED FINANCIAL SERVICES - 5.3% | ||||||||
| American Express Co. | 5,794 | 679,520 | ||||||
| Charles Schwab Corp. | 19,023 | 774,427 | ||||||
| Discover Financial Services | 15,112 | 1,212,889 | ||||||
| E*TRADE Financial Corp. | 17,702 | 739,767 | ||||||
| Intercontinental Exchange, Inc. | 11,038 | 1,041,104 | ||||||
| 4,447,707 | ||||||||
| ELECTRIC - 5.5% | ||||||||
| American Electric Power Co., Inc. | 16,532 | 1,560,456 | ||||||
| DTE Energy Co. | 10,493 | 1,335,969 | ||||||
| Xcel Energy, Inc. | 26,089 | 1,656,912 | ||||||
| 4,553,337 | ||||||||
| ELECTRONICS - 1.0% | ||||||||
| Honeywell International, Inc. | 5,021 | 867,277 | ||||||
| ENVIRONMENTAL CONTROL - 1.2% | ||||||||
| Waste Management, Inc. | 8,636 | 969,046 | ||||||
| FOOD - 2.0% | ||||||||
| Mondelez International, Inc. | 21,792 | 1,142,990 | ||||||
| Tyson Foods, Inc. | 5,939 | 491,690 | ||||||
| 1,634,680 | ||||||||
| Security | Shares | Value | ||||||
| HEALTHCARE-PRODUCTS - 5.8% | ||||||||
| Danaher Corp. | 5,437 | $ | 749,328 | |||||
| Hill-Rom Holdings, Inc. | 8,867 | 928,286 | ||||||
| Medtronic PLC | 18,587 | 2,024,124 | ||||||
| Thermo Fisher Scientific, Inc. | 3,845 | 1,161,113 | ||||||
| 4,862,851 | ||||||||
| HEALTHCARE-SERVICES - 0.9% | ||||||||
| UnitedHealth Group, Inc. | 2,783 | 703,264 | ||||||
| HOUSEHOLD PRODUCTS / WARES - 1.5% | ||||||||
| Kimberly-Clark Corp. | 9,524 | 1,265,549 | ||||||
| INSURANCE - 6.0% | ||||||||
| Allstate Corp. | 7,241 | 770,587 | ||||||
| Berkshire Hathaway, Inc. * | 4,534 | 963,838 | ||||||
| Hartford Financial Services Group, Inc. | 21,391 | 1,220,998 | ||||||
| Prudential Financial, Inc. | 15,546 | 1,416,863 | ||||||
| Travelers Cos., Inc. | 5,035 | 659,887 | ||||||
| 5,032,173 | ||||||||
| INTERNET - 1.0% | ||||||||
| Alphabet, Inc. * | 682 | 858,502 | ||||||
| LEISURE TIME - 1.5% | ||||||||
| Royal Caribbean Cruises Ltd. | 11,433 | 1,244,253 | ||||||
| MACHINERY- DIVERSIFIED - 1.1% | ||||||||
| Caterpillar, Inc. | 6,925 | 954,265 | ||||||
| MEDIA - 4.7% | ||||||||
| Comcast Corp. | 40,986 | 1,836,992 | ||||||
| Discovery, Inc. * ^ | 38,379 | 1,034,506 | ||||||
| Walt Disney Co. | 8,043 | 1,044,947 | ||||||
| 3,916,445 | ||||||||
| MISCELLANEOUS MANUFACTURING - 1.6% | ||||||||
| Ingersoll-Rand PLC | 6,351 | 805,878 | ||||||
| Textron, Inc. | 12,041 | 554,970 | ||||||
| 1,360,848 | ||||||||
| OIL & GAS - 7.9% | ||||||||
| Chevron Corp. | 16,051 | 1,864,163 | ||||||
| ConocoPhillips | 18,231 | 1,006,351 | ||||||
| Diamondback Energy, Inc. | 10,289 | 882,385 | ||||||
| EOG Resources, Inc. | 12,133 | 840,938 | ||||||
| Marathon Petroleum Corp. | 14,640 | 936,228 | ||||||
| Phillips 66 | 8,857 | 1,034,675 | ||||||
| 6,564,740 | ||||||||
| PHARMACEUTICALS - 4.5% | ||||||||
| Cigna Corp. | 4,470 | 797,716 | ||||||
| Eli Lilly & Co. | 6,523 | 743,296 | ||||||
| Johnson & Johnson | 7,684 | 1,014,595 | ||||||
| Merck & Co., Inc. | 13,866 | 1,201,628 | ||||||
| 3,757,235 | ||||||||
| REITS - 5.2% | ||||||||
| Alexandria Real Estate Equities, Inc. | 3,208 | 509,270 | ||||||
| AvalonBay Communities, Inc. | 2,979 | 648,409 | ||||||
| Boston Properties, Inc. | 8,159 | 1,119,415 | ||||||
| Equity LifeStyle Properties, Inc. | 6,614 | 462,583 | ||||||
| Highwoods Properties, Inc. | 9,746 | 456,113 | ||||||
| Prologis, Inc. | 13,250 | 1,162,820 | ||||||
| 4,358,610 | ||||||||
| RETAIL - 0.8% | ||||||||
| Best Buy Co., Inc. | 8,878 | 637,707 | ||||||
See accompanying notes to financial statements.
48
| SCHEDULE OF INVESTMENTS |
| Dunham Large Cap Value Fund (Continued) |
| October 31, 2019 |
| Security | Shares | Value | ||||||
| COMMON STOCKS - 98.0% (Continued) | ||||||||
| SEMICONDUCTORS - 3.7% | ||||||||
| Broadcom, Inc. | 4,476 | $ | 1,310,796 | |||||
| Intel Corp. | 13,673 | 772,935 | ||||||
| ON Semiconductor Corp. * | 49,328 | 1,006,291 | ||||||
| 3,090,022 | ||||||||
| SOFTWARE - 1.7% | ||||||||
| Microsoft Corp. | 5,018 | 719,431 | ||||||
| Oracle Corp. | 12,091 | 658,838 | ||||||
| 1,378,269 | ||||||||
| TELECOMMUNICATIONS - 7.2% | ||||||||
| AT&T, Inc. | 59,564 | $ | 2,292,618 | |||||
| Cisco Systems, Inc. | 25,397 | 1,206,611 | ||||||
| Verizon Communications, Inc. | 41,476 | 2,508,054 | ||||||
| 6,007,283 | ||||||||
| TOTAL COMMON STOCKS (Cost - $64,119,604) | 81,813,674 | |||||||
| Shares | Value | |||||||
| COLLATERAL FOR SECURITIES LOANED - 1.3% | ||||||||
| HSBC US Government Money Market Fund - Class Institutional, 1.72% + # | 52,600 | $ | 52,600 | |||||
| Morgan Stanley Institutional Liquidity Fund Prime Portfolio - Class Institutional, 1.94% + # | 992,400 | 993,095 | ||||||
| TOTAL COLLATERAL FOR SECURITIES LOANED (Cost - $1,045,000) | 1,045,695 | |||||||
| TOTAL INVESTMENTS - 99.3% (Cost - $65,164,604) | $ | 82,859,369 | ||||||
| OTHER ASSETS IN EXCESS OF LIABILITIES - 0.7% | 613,357 | |||||||
| NET ASSETS - 100.0% | $ | 83,472,726 | ||||||
PLC - Public Limited Company
REITS - Real Estate Investment Trust
| * | Non-income producing security. |
| ^ | All or a portion of these securities are on loan. Total loaned securities had a value of $1,024,290 at October 31, 2019. |
| + | Variable rate security. Interest rate is as of October 31, 2019. |
| # | The Trust’s securities lending policies and procedures require that the borrower: deliver cash or U.S. Government securities as collateral with respect to each new loan of U.S. securities, equal to at least 102% of the value of the portfolio securities loaned, and (ii) at all times thereafter mark-to-market the collateral on a daily basis so that the market value of such collateral is at least 100% of the value of securities loaned. From time to time the collateral may not be 102% due to end of day market movement. The next business day additional collateral is obtained/received from the borrower to replenish/reestablish 102%. |
| Portfolio Composition * - (Unaudited) | ||||||||||
| Financial | 27.7 | % | Utilities | 5.5 | % | |||||
| Consumer, Non-cyclical | 23.0 | % | Technology | 5.4 | % | |||||
| Communications | 13.0 | % | Consumer, Cyclical | 5.1 | % | |||||
| Industrial | 8.5 | % | Basic Materials | 2.7 | % | |||||
| Energy | 7.9 | % | Others | 1.2 | % | |||||
| Total | 100.0 | % | ||||||||
| * | Based on total value of investments as of October 31, 2019. |
Percentage may differ from Schedule of Investments which are based on Fund net assets.
See accompanying notes to financial statements.
49
| Dunham Focused Large Cap Growth Fund (Unaudited) |
| Message from the Sub-Adviser (The Ithaka Group, LLC) |
Asset Class Recap
Echoing the third fiscal quarter’s modest 2.4 percent gain, large cap growth stocks, as measured by the Russell 1000 Growth Index, finished the final fiscal quarter up 2.0 percent. Although each of the previous two fiscal quarters commenced with a decline, the magnitude for the most recent fiscal quarter was nearly half that of the prior period. Much of the same headlines drove equity movements during the final fiscal quarter as the rest of the fiscal year, such as politics, trade war concerns, and interest rate rhetoric contended with corporate earnings and economic releases. The modest finish to the fiscal year resulted in large cap growth stocks finishing more than 5 percent ahead of the next closest domestic asset category for the entire 12-month period. Large cap growth’s 17.1 percent return during the fiscal year dwarfed its small cap counterparts, which failed to break into double-digits and was 5.9 percent ahead of its large cap value peers.
Allocation Review
The Sub-Adviser remains focused on identifying what it believes are the best growth stocks. The resulting sector and industry allocation is solely representative of where the Sub-Adviser’s top picks resided. Despite being inline or even overweight the technology sector for much of the fiscal year, the Fund finished the fiscal year with a slight underweight to the sector. In general, this difference in exposure had little impact on relative performance. The Fund continued to have a large overweight to the financial services and health care sectors, with the largest underweight to the producer durables sector, to which the Fund has zero exposure. The best performing sectors during the fiscal year were the financial services and materials & processing sectors, while the worst performer was the energy sector. Not only was the energy sector the worst performer, down 18.1 percent, it was also the only negative sector in the benchmark index. The Fund did not have any holdings in the energy sector during the fiscal year.
Holdings Insights
Given the concentrated nature of the Fund, the vast majority of relative performance was explained by stock selection rather than sector allocation. Therefore, although the technology sector was the third-best performing sector for the benchmark index, it was one of the largest overall detractors for the Fund, underperforming by close to 2 percent. To clarify, any holding in the sector that did not perform above 19 percent for the 12-month period was effectively a “detractor.” Software as a service (SAAS) companies provided drastically diverse results, as Salesforce.com Inc. (CRM) (holding weight*: 5.01 percent), a customer relationship management software developer, increased 14.0 percent while Workday Inc. (WDAY) (holding weight*: 2.07 percent), a provider of cloud-based enterprise applications for managing financial and human capital resources, rose 21.9 percent. WDAY’s performance was substantially stronger before the final fiscal quarter stripped 18.9 percent from its fiscal year return. One of the strongest performers during the final fiscal quarter, NVIDIA Corp. (NVDA) (holding weight*: 2.91 percent), a designer of graphics processing units for the gaming and professional markets, surged 19.3 percent. However, NVDA was one of the poorest performers since it was added to the Fund during the fiscal year, posting an overall 1.7 percent gain. Its latest rebound was due to reporting strong earnings amid gains from some cryptocurrency problems that were resolved and some of its hyperscale clientele rebounded. As many computing-intensive companies, including hyperscalers, utilize graphics processing units for quick and simple computations, including cryp to currency mining, NVDA has been a net benefactor.
The Fund’s largest holdings during the fiscal year included Visa Inc. (V) (holding weight*: 7.13 percent) and Mastercard Inc. (MA) (holding weight*: 7.21 percent), two of the world’s largest consumer payment systems. Both V and MA finished the fiscal year ahead of the majority of their peers in the strong-performing financial services sector. As the financial services sector posted a 25.6 percent return, V and MA increased 30.6 percent and 40.8 percent, respectively. Experiencing a much greater dispersion during the fiscal year were Square Inc. (SQ) (holding weight*: 1.75 percent), a provider of card readers for smartphones and tablets for low-cost point-of-sale system solutions, and S&P Global Inc. (SPGI) (holding weight*: 2.53 percent), a ratings issuer, index provider, and mark et research service. As SQ has struggled to advance its utilization up-market and has seen additional competitors enter its marketplace, the guidance provided after its most recent earnings release worried investors and saw the stock plummet 23.6 percent during the last three months of the fiscal year. This decline resulted in SQ ending the fiscal year down 16.4 percent Conversely, SPGI has seen its profitable indexing business expand and revealed good earnings growth, which coincided with a 5.6 percent gain during the final fiscal quarter, locking in a 43.0 percent return for the fiscal year.
Sub-Adviser Outlook
The Sub-Adviser continues to focus on what it believes are the strongest growth stocks of our time, maintaining a concentrated allocation that requires only choosing those companies in which they have the highest conviction. It continues to believe that the stocks in the Fund not only have strong balance sheets, but also garner free cash flow even in a stressed U.S. economic environment. Therefore, the Sub-Adviser remains less concerned about temporary market downturns or shifts in momentum and is focused on the strong growth characteristics that led them to the concentrated group of stocks in the Fund.
| * | Holdings percentage(s) of total investments as of 10/31/2019. |
Growth of $100,000 Investment
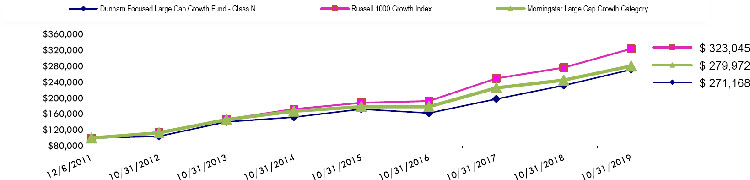
| Total Returns(a) as of October 31, 2019 | |||||||
| Annualized | |||||||
| Annualized | Since Inception | ||||||
| One Year | Five Years | (12/8/11) | |||||
| Class N | 17.19% | 12.26% | 13.46% | ||||
| Class C | 16.00% | 11.14% | 12.34% | ||||
| Class A with load of 5.75% | 10.11% | 10.64% | 12.33% | ||||
| Class A without load | 16.84% | 11.96% | 13.17% | ||||
| Russell 1000 Growth Index | 17.10% | 13.43% | 16.00% | ||||
| Morningstar Large Cap Growth Category | 14.45% | 10.87% | 13.92% | ||||
| (a) | Total Returns are calculated based on traded NAVs. |
The Russell 1000 Growth Index is a subset of the Russell 1000 Index which measures the performance of the stocks of the 1000 largest companies in the Russell 3000 Index based on market capitalization. The Russell 1000 Growth Index measures the performance of those stocks of the Russell 1000 with higher price-to-book ratios and higher relative forecasted growth rates. Investors cannot invest directly in an index or benchmark.
The Morningstar Large Cap Growth Category is generally representative of mutual funds that primarily invest in big (large capitalization) U.S. companies that are projected to grow faster than other large-cap stocks.
As disclosed in the Trust’s latest registration statement, the Fund’s total annual operating expenses, including the cost of underlying funds, are 1.30% for Class N, 2.30% for Class C and 1.55% for Class A. Class A shares are subject to a sales load of 5.75% and a deferred sales charge of up to 0.75%. The performance data quoted here represents past performance, which is not indicative of future results. Current performance may be lower or higher than the performance data quoted. The investment return and NAV will fluctuate, so that an investor’s shares, when redeemed, may be worth more or less than their original cost. Total returns are calculated assuming reinvestment of all dividends and capital gains distributions, if any. The returns do not reflect the deductions of taxes a shareholder would pay on the redemption of Fund shares or Fund distributions. For performance information current to the most recent month-end, please call 1-800-442-4358 or visit our website www.dunham.com
50
| SCHEDULE OF INVESTMENTS |
| Dunham Focused Large Cap Growth Fund |
| October 31, 2019 |
| Security | Shares | Value | ||||||
| COMMON STOCKS - 98.3% | ||||||||
| BIOTECHNOLOGY - 3.5% | ||||||||
| Illumina, Inc. * | 12,667 | $ | 3,743,352 | |||||
| COMMERCIAL SERVICES - 11.5% | ||||||||
| Global Payments, Inc. | 6,615 | 1,119,126 | ||||||
| PayPal Holdings, Inc. * | 39,935 | 4,157,234 | ||||||
| S&P Global, Inc. | 10,511 | 2,711,733 | ||||||
| Square, Inc. * | 30,579 | 1,878,468 | ||||||
| TransUnion | 29,372 | 2,426,715 | ||||||
| 12,293,276 | ||||||||
| DIVERSIFIED FINANCIAL SERVICES - 14.3% | ||||||||
| Mastercard, Inc. | 27,970 | 7,742,376 | ||||||
| Visa, Inc. | 42,786 | 7,652,704 | ||||||
| 15,395,080 | ||||||||
| HEALTHCARE-PRODUCTS - 9.4% | ||||||||
| Align Technology, Inc. * | 7,422 | 1,872,496 | ||||||
| Edwards Lifesciences Corp. * | 17,803 | 4,243,879 | ||||||
| Intuitive Surgical, Inc. * | 7,093 | 3,922,074 | ||||||
| 10,038,449 | ||||||||
| INTERNET - 18.4% | ||||||||
| Alibaba Group Holding Ltd. - ADR * | 12,684 | 2,240,882 | ||||||
| Alphabet, Inc. * | 3,313 | 4,174,744 | ||||||
| Amazon.com, Inc. * | 4,185 | 7,435,322 | ||||||
| Facebook, Inc. * | 17,644 | 3,381,473 | ||||||
| MercadoLibre, Inc. * | 3,075 | 1,603,674 | ||||||
| Zendesk, Inc. * | 12,000 | 847,800 | ||||||
| 19,683,895 | ||||||||
| PHARMACEUTICALS - 1.9% | ||||||||
| DexCom, Inc. * | 13,479 | 2,079,001 | ||||||
| RETAIL - 6.4% | ||||||||
| Burlington Stores, Inc. * | 22,755 | 4,372,828 | ||||||
| Ulta Beauty, Inc. * | 10,548 | 2,459,266 | ||||||
| 6,832,094 | ||||||||
| SEMICONDUCTORS - 2.9% | ||||||||
| NVIDIA Corp. | 15,524 | 3,120,635 | ||||||
| SOFTWARE - 30.0% | ||||||||
| Adobe, Inc. * | 11,700 | 3,251,781 | ||||||
| Autodesk, Inc. * | 27,512 | 4,054,168 | ||||||
| Microsoft Corp. | 44,638 | 6,399,750 | ||||||
| Salesforce.com, Inc. * | 34,367 | 5,378,092 | ||||||
| ServiceNow, Inc. * | 17,566 | 4,343,369 | ||||||
| Splunk, Inc. * | 18,086 | 2,169,597 | ||||||
| Veeva Systems, Inc. * | 26,088 | 3,700,061 | ||||||
| Workday, Inc. * | 17,888 | 2,900,718 | ||||||
| 32,197,536 | ||||||||
| TOTAL COMMON STOCKS (Cost - $59,529,708) | 105,383,318 | |||||||
| TOTAL INVESTMENTS - 98.3% (Cost - $59,529,708) | $ | 105,383,318 | ||||||
| OTHER ASSETS IN EXCESS OF LIABILITIES - 1.7% | 1,775,709 | |||||||
| NET ASSETS - 100.0% | $ | 107,159,027 | ||||||
ADR - American Depositary Receipt.
| * | Non-Income producing security. |
See accompanying notes to financial statements.
51
| SCHEDULE OF INVESTMENTS |
| Dunham Focused Large Cap Growth Fund (Continued) |
| October 31, 2019 |
| Portfolio Composition*- (Unaudited) | ||||||||||
| Technology | 33.5 | % | Financial | 14.6 | % | |||||
| Consumer, Non-Cyclical | 26.7 | % | Consumer, Cyclical | 6.5 | % | |||||
| Communications | 18.7 | % | Total | 100.0 | % | |||||
| * | Based on total value of investments as of October 31, 2019. |
Percentage may differ from Schedule of Investments which is based on Fund net assets
See accompanying notes to financial statements.
52
| Dunham International Stock Fund (Unaudited) |
| Message from the Sub-Adviser (Arrowstreet Capital, L.P.) |
Asset Class Recap
International equity markets, as measured by the MSCI All Country World ex USA Index (Net) (referred to as the “Index”), gained 11.27 percent during the year ending October 31, 2019 (the “fiscal year”). Across sectors, gains were led by information technology, utilities, and real estate.
The best performing developed market countries as measured by the Index during the fiscal year were New Zealand, up 24.47 percent, and the Netherlands, up 21.93 percent. The worst performing developed market countries were Israel, down 7.04 percent, and Austria, down 2.84 percent. The best performing emerging market countries during the fiscal year as measured by the Index were Russia, up 31.16 percent, and Greece, up 30.17 percent. The worst performing emerging market countries were Argentina, down 19.60 percent, and Chile, down 10.10 percent.
Allocation Review
The Sub-Adviser’s investment process is best characterized as a dynamic process that uses quantitative models to evaluate securities to exploit opportunities across companies, sectors, and countries while seeking to avoid long-term systematic biases toward any particular country, sector, style, or market capitalization. These stock selection models are designed to understand what information is likely to impact stock prices with a predictable and measurable lag that allows time to invest and profit. The models obtain the information to forecast individual stock returns by evaluating a stock’s potential on the basis of (1) direct effects - characteristics of the company itself; and (2) indirect effects - characteristics of other companies that are related by virtue of a common country and sector affiliation (called country/sector baskets); a common country affiliation; and a common global sector affiliation, and/or other common linkages. Over any time period, the strategy’s performance relative to the Index is driven by allocations to country/sector baskets, stock selection, and the effects of currency exposures differing from those of the Index.
Countries contributing the most to returns relative to the Index during the fiscal year were: The UK, mainly due to an underweight to energy, along with positive selection and an underweight to financials; and Russia, mainly due to an overweight and positive selection within energy. Countries contributing the most to underperformance relative to the Index included: China, primarily due to overweights and negative selection within energy and financials, along with an underweight and negative selection within consumer discretionary; and Australia, primarily due to negative selection within real estate, along with an overweight to health care.
Sectors contributing the most to returns relative to the Index during the fiscal year included: Information technology, primarily due to overweights and positive selection within Canada, France, Japan, and South Korea; and health care, primarily due to overweights and positive selection within Switzerland and the UK. Sectors contributing the most to underperformance relative to the Index included: consumer discretionary, mainly due to underweights and negative selection within China and France; and energy, mainly due to an overweight and negative selection within China.
Holdings Insights
Stocks contributing the most to returns relative to the Index during the fiscal year included: Enel SpA (ENEL IM) (holding weight*: 1.52 percent), an Italian utilities company; Roche Holding AG (ROG SW) (holding weight*: 2.55 percent), a Swiss health care company; Shopify Inc. (SHOP) (holding weight**: 0.33 percent), a Canadian information technology company. Stocks contributing the most to underperformance relative to the Index included: China Petroleum & Chemical (386 HK) (holding weight*: 0.68 percent), a Chinese energy company; PetroChina Co. Ltd. (PTR) (holding weight*: 0.31 percent), a Chinese energy company; Eni SpA (ENI IM) (holding weight*: 0.16 percent), an Italian energy company.
Sub-Adviser Outlook
The Sub-Adviser generally constructs its portfolios by using proprietary econometric models and a proprietary optimization process that balances the trade-off between a stock’s expected return, its contribution to portfolio level risk, portfolio specific restrictions, and its opportunity costs relative to trading costs. As this is performe d quantitatively, the Sub-Adviser’s outlook does not play a role in the disciplined investment process.
| * | Holdings percentage(s) of total investments, excluding collateral for securities loaned, as of 10/31/2019. |
| ** | Holdings percentage(s) as of the date prior to the sale of the security. |
Growth of $100,000 Investment
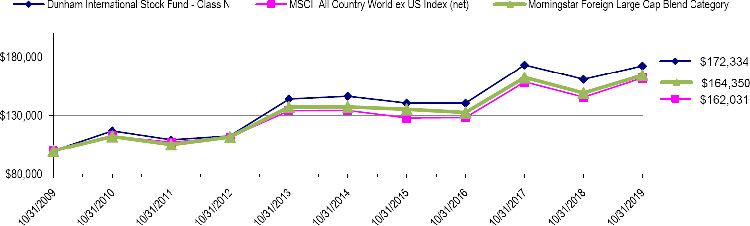
| Total Returns(a) as of October 31, 2019 | |||||||
| Annualized | Annualized | ||||||
| One Year | Five Years | Ten Years | |||||
| Class N | 7.08% | 3.30% | 5.59% | ||||
| Class C | 5.96% | 2.26% | 4.53% | ||||
| Class A with load of 5.75% | 0.61% | 1.81% | 4.70% | ||||
| Class A without load | 6.78% | 3.03% | 5.32% | ||||
| MSCI All Country World ex US Index (net) | 11.27% | 3.82% | 4.94% | ||||
| Morningstar Foreign Large Cap Blend Category | 10.18% | 3.64% | 5.09% | ||||
| (a) | Total Returns are calculated based on traded NAVs. |
The MSCI All Country World ex US Index (net) is a free float-adjusted market capitalization index designed to measure equity market performance in the global developed and emerging markets excluding holdings in the United States and is net of any withholding taxes. Investors cannot invest directly in an index or benchmark.
The Morningstar Foreign Large Cap Blend Category is generally representative of mutual funds that primarily invest in non-U.S. stocks that have market caps in the top 70% of each economically integrated market (such as Europe or Asia ex-Japan). The blend style is generally applicable where neither growth nor value characteristics dominate.
As disclosed in the Trust’s latest registration statement, the Fund’s total annual operating expenses, including underlying funds, are 1.67% for Class N, 2.67% for Class C and 1.92% for Class A. Class A shares are subject to a sales load of 5.75% and a deferred sales charge of up to 0.75%.The performance data quoted here represents past performance, which is not indicative of future results. Current performance may be lower or higher than the performance data quoted. The investment return and NAV will fluctuate, so that an investor’s shares, when redeemed, may be worth more or less than their original cost. Total returns are calculated assuming reinvestment of all dividends and capital gains distributions, if any. The returns do not reflect the deductions of taxes a shareholder would pay on the redemption of Fund shares or Fund distribution. For performance information current to the most recent month-end, please call 1-800-442-4358 or visit our website www.dunham.com
53
| SCHEDULE OF INVESTMENTS |
| Dunham International Stock Fund |
| October 31, 2019 |
| Security | Shares | Value | ||||||
| COMMON STOCKS - 98.6% | ||||||||
| AEROSPACE / DEFENSE - 1.3% | ||||||||
| Airbus SE | 3,634 | $ | 521,492 | |||||
| CAE, Inc. | 6,400 | 160,834 | ||||||
| Kawasaki Heavy Industries Ltd. | 20,400 | 489,045 | ||||||
| Leonardo SpA | 7,050 | 81,930 | ||||||
| Rolls-Royce Holdings PLC - ADR | 9,506 | 88,406 | ||||||
| Safran SA | 1,991 | 315,454 | ||||||
| 1,657,161 | ||||||||
| AGRICULTURE - 0.1% | ||||||||
| Imperial Brands PLC | 6,138 | 134,500 | ||||||
| AIRLINES - 0.6% | ||||||||
| Deutsche Lufthansa AG | 23,170 | 401,505 | ||||||
| International Consolidated Airlines Group SA - ADR | 3,800 | 52,136 | ||||||
| Qantas Airways Ltd. | 74,134 | 327,715 | ||||||
| Turk Hava Yollari AO * | 1 | 2 | ||||||
| 781,358 | ||||||||
| APPAREL - 1.8% | ||||||||
| adidas AG | 3,228 | 998,176 | ||||||
| Burberry Group PLC - ADR | 11,558 | 312,066 | ||||||
| Gildan Activewear, Inc. ^ | 8,236 | 210,265 | ||||||
| Kering SA | 1,154 | 656,829 | ||||||
| Pou Chen Corp. * | 92,000 | 122,998 | ||||||
| 2,300,334 | ||||||||
| AUTO MANUFACTURERS - 1.5% | ||||||||
| Fiat Chrysler Automobiles NV | 34,594 | 537,026 | ||||||
| Hino Motors Ltd. | 12,300 | 116,164 | ||||||
| Kia Motors Corp. | 11,634 | 425,192 | ||||||
| Porsche Automobil Holding SE - ADR | 21,800 | 159,358 | ||||||
| Porsche Automobil Holding SE | 3,193 | 235,177 | ||||||
| Renault SA | 3,188 | 162,827 | ||||||
| Volkswagen AG | 1,650 | 312,015 | ||||||
| 1,947,759 | ||||||||
| AUTO PARTS & EQUIPMENT - 2.3% | ||||||||
| Cie Generale des Etablissements Michelin SCA | 1,588 | 193,411 | ||||||
| Continental AG | 4,015 | 537,942 | ||||||
| Faurecia SE | 7,765 | 362,493 | ||||||
| Hankook Tire Co., Ltd. * | 7,314 | 195,029 | ||||||
| Hyundai Mobis Co., Ltd. | 553 | 112,775 | ||||||
| Magna International, Inc. | 19,482 | 1,047,547 | ||||||
| Schaeffler AG | 12,065 | 101,810 | ||||||
| Weichai Power Co., Ltd. | 61,000 | 95,994 | ||||||
| Yokohama Rubber Co., Ltd. | 13,900 | 310,129 | ||||||
| 2,957,130 | ||||||||
| BANKS - 5.4% | ||||||||
| Agricultural Bank of China Ltd. | 1,016,000 | 417,995 | ||||||
| Akbank T.A.S. * | 0 | — | ||||||
| Alpha Bank AE * | 25,659 | 54,768 | ||||||
| Banco do Brasil SA * | 25,300 | 302,574 | ||||||
| Banco Santander SA * | 46,741 | 185,652 | ||||||
| Bank of China Ltd. - ADR | 1,468 | 14,878 | ||||||
| Bank of China Ltd. | 1,784,000 | 727,326 | ||||||
| Bank of Communications Co., Ltd. | 384,000 | 262,193 | ||||||
| Bank of Zhengzhou Co., Ltd. | 270,000 | 90,504 | ||||||
| Bank Pan Indonesia Tbk PT * | 263,200 | 25,193 | ||||||
| BNP Paribas SA | 3,158 | 165,088 | ||||||
| China CITIC Bank Corp Ltd. | 397,000 | 230,074 | ||||||
| China Everbright Bank Co., Ltd. | 475,000 | 218,531 | ||||||
| China Merchants Bank Co Ltd | 83,000 | 395,758 | ||||||
| China Minsheng Banking Corp Ltd. | 288,500 | 201,752 | ||||||
| Erste Group Bank AG - ADR | 5,100 | 89,668 | ||||||
| Security | Shares | Value | ||||||
| BANKS - 5.4% (Continued) | ||||||||
| Eurobank Ergasias SA * | 56,951 | $ | 57,751 | |||||
| Fukuoka Financial Group, Inc. * | 10,700 | 206,048 | ||||||
| Grupo Elektra SAB DE CV * | 756 | 55,107 | ||||||
| Grupo Financiero Banorte SAB de CV | 67,000 | 83,628 | ||||||
| Industrial & Commercial Bank of China Ltd. - ADR | 16,287 | 231,601 | ||||||
| Industrial & Commercial Bank of China Ltd. | 815,000 | 583,730 | ||||||
| Mediobanca Banca di Credito Finanziario SpA | 27,046 | 321,714 | ||||||
| National Bank of Greece SA * | 83,517 | 283,329 | ||||||
| Sberbank of Russia PJSC - ADR * | 38,755 | 569,699 | ||||||
| Societe Generale SA | 9,676 | 275,262 | ||||||
| Turkiye Garanti Bankasi AS * | 66,475 | 106,938 | ||||||
| Turkiye Is Bankasi AS * | 81,167 | 82,315 | ||||||
| Turkiye Vakiflar Bankasi TAO * | 555,336 | 421,500 | ||||||
| UniCredit SpA | 26,976 | 342,354 | ||||||
| VTB Bank PJSC - ADR | 7,196 | 9,563 | ||||||
| Yapi ve Kredi Bankasi AS * | 184,313 | 73,490 | ||||||
| 7,085,983 | ||||||||
| BEVERAGES - 1.1% | ||||||||
| Carlsberg A/S | 3,075 | 433,242 | ||||||
| Coca-Cola HBC AG | 3,121 | 96,376 | ||||||
| Diageo PLC - ADR | 3,139 | 514,388 | ||||||
| Tsingtao Brewery Co., Ltd. | 60,000 | 347,623 | ||||||
| 1,391,629 | ||||||||
| BUILDING MATERIALS - 0.2% | ||||||||
| Asia Cement Corp. | 73,000 | 103,049 | ||||||
| Cie de Saint-Gobain | 4,573 | 186,307 | ||||||
| 289,356 | ||||||||
| CHEMICALS - 1.8% | ||||||||
| Akzo Nobel NV | 4,336 | 399,877 | ||||||
| Covestro AG | 7,604 | 365,274 | ||||||
| Hanwha Chemical Corp. * | 6,809 | 95,273 | ||||||
| KCC Corp. | 920 | 178,570 | ||||||
| Koninklijke DSM NV | 1,924 | 228,428 | ||||||
| Nitto Denko Corp. | 3,200 | 176,854 | ||||||
| Shin-Etsu Chemical Co., Ltd. - ADR | 1,100 | 30,690 | ||||||
| Shin-Etsu Chemical Co., Ltd. | 6,800 | 757,402 | ||||||
| Showa Denko KK | 3,100 | 86,884 | ||||||
| 2,319,252 | ||||||||
| COAL - 0.2% | ||||||||
| China Shenhua Energy Co., Ltd. - ADR | 7,400 | 59,274 | ||||||
| China Shenhua Energy Co., Ltd. | 70,500 | 143,149 | ||||||
| Indo Tambangraya Megah Tbk PT | 53,100 | 50,284 | ||||||
| 252,707 | ||||||||
| COMMERCIAL SERVICES - 3.1% | ||||||||
| Adyen NV * | 211 | 148,594 | ||||||
| Amadeus IT Group SA | 3,526 | 260,930 | ||||||
| Ashtead Group PLC | 11,360 | 345,504 | ||||||
| Benesse Holdings, Inc. * | 16,600 | 443,906 | ||||||
| Brambles Ltd. - ADR | 12,000 | 197,640 | ||||||
| Brambles Ltd. | 25,057 | 207,027 | ||||||
| CCR SA * | 35,000 | 144,729 | ||||||
| China Conch Venture Holdings Ltd. | 37,000 | 144,744 | ||||||
| Cielo SA | 48,300 | 90,238 | ||||||
| Experian PLC | 20,616 | 649,167 | ||||||
| Guangdong Provincial Expressway Development Co., Ltd. * | 92,100 | 67,641 | ||||||
| Recruit Holdings Co., Ltd. | 18,000 | 597,576 | ||||||
| RELX PLC | 8,912 | 214,336 | ||||||
| RELX PLC | 18,172 | 437,410 | ||||||
| Sichuan Expressway Co., Ltd. | 400,000 | 116,701 | ||||||
| 4,066,143 | ||||||||
See accompanying notes to financial statements.
54
| SCHEDULE OF INVESTMENTS |
| Dunham International Stock Fund (Continued) |
| October 31, 2019 |
| Security | Shares | Value | ||||||
| COMMON STOCKS - 98.6% (Continued) | ||||||||
| COMPUTERS - 3.3% | ||||||||
| Advantech Co., Ltd. * | 12,000 | $ | 118,558 | |||||
| CGI, Inc. * | 7,890 | 613,211 | ||||||
| Check Point Software Technologies Ltd. * ^ | 2,581 | 290,130 | ||||||
| Chicony Electronics Co., Ltd. * | 144,000 | 447,371 | ||||||
| Compal Electronics, Inc. | 276,000 | 164,763 | ||||||
| Computershare Ltd. | 25,961 | 283,212 | ||||||
| CyberArk Software Ltd. * | 2,200 | 223,476 | ||||||
| Eastern Communications Co., Ltd. * | 205,700 | 110,255 | ||||||
| Fujitsu Ltd. | 6,700 | 593,183 | ||||||
| Itochu Techno-Solutions Corp. | 600 | 16,141 | ||||||
| Lenovo Group Ltd. - ADR | 4,300 | 59,340 | ||||||
| NTT Data Corp. | 28,900 | 379,078 | ||||||
| Obic Co., Ltd. | 1,100 | 137,579 | ||||||
| Otsuka Corp. * | 6,600 | 265,816 | ||||||
| Phison Electronics Corp. * | 25,000 | 227,322 | ||||||
| Quanta Computer, Inc. | 196,000 | 375,983 | ||||||
| 4,305,418 | ||||||||
| COSMETICS / PERSONAL CARE - 2.1% | ||||||||
| Kao Corp. | 4,900 | 393,534 | ||||||
| L’Oreal SA | 2,925 | 854,550 | ||||||
| Unilever NV | 20,683 | 1,222,889 | ||||||
| Unilever PLC | 4,648 | 278,028 | ||||||
| 2,749,001 | ||||||||
| DISTRIBUTION / WHOLESALE - 0.7% | ||||||||
| Ferguson PLC - ADR | 30,400 | 257,488 | ||||||
| Hanwha Corp. * | 12,423 | 253,262 | ||||||
| Marubeni Corp. | 9,000 | 63,275 | ||||||
| Sumitomo Corp. | 9,900 | 160,629 | ||||||
| Toyota Tsusho Corp. | 5,700 | 196,432 | ||||||
| 931,086 | ||||||||
| DIVERSIFIED FINANCIAL SERVICES - 2.9% | ||||||||
| ASX Ltd. | 9,208 | 522,360 | ||||||
| B3 SA - Brasil Bolsa Balcao | 35,500 | 428,098 | ||||||
| BNK Financial Group, Inc. | 31,712 | 189,396 | ||||||
| China Merchants Securities Co., Ltd. | 39,600 | 44,817 | ||||||
| CI Financial Corp. | 2,554 | 37,251 | ||||||
| CSC Financial Co., Ltd. | 70,000 | 48,532 | ||||||
| Deutsche Boerse AG | 3,126 | 484,244 | ||||||
| Far East Horizon Ltd. | 233,000 | 220,542 | ||||||
| GF Securities Co Ltd. | 80,600 | 83,924 | ||||||
| Haitong Securities Co., Ltd. | 268,400 | 273,951 | ||||||
| Hana Financial Group, Inc. | 10,225 | 296,040 | ||||||
| Hargreaves Lansdown PLC | 7,275 | 166,884 | ||||||
| Investec Ltd. * | 42,643 | 243,058 | ||||||
| Magellan Financial Group Ltd. | 11,352 | 376,304 | ||||||
| Yuanta Financial Holding Co., Ltd. * | 498,000 | 311,235 | ||||||
| 3,726,636 | ||||||||
| ELECTRIC - 3.2% | ||||||||
| AGL Energy Ltd. | 6,818 | 93,016 | ||||||
| Centrais Eletricas Brasileiras SA * | 11,400 | 112,739 | ||||||
| Chubu Electric Power Co., Inc. | 3,500 | 52,627 | ||||||
| E.ON SE | 17,060 | 172,095 | ||||||
| Enel Americas SA | 1,507,008 | 281,667 | ||||||
| Enel Chile SA | 829,780 | 68,295 | ||||||
| Enel SpA * | 254,343 | 1,971,872 | ||||||
| Engie Brasil Energia SA | 32,500 | 364,313 | ||||||
| Engie SA - ADR | 6,379 | 107,040 | ||||||
| Iberdrola SA | 50,363 | 517,844 | ||||||
| Interconexion Electrica SA ESP | 41,129 | 237,394 | ||||||
| Kansai Electric Power Co., Inc. | 2,400 | 27,969 | ||||||
| Terna Rete Elettrica Nazionale SpA | 31,819 | 210,371 | ||||||
| 4,217,242 | ||||||||
| ELECTRICAL COMPONENTS & EQUIPMENT - 0.4% | ||||||||
| Brother Industries Ltd. | 10,100 | 189,618 | ||||||
| Delta Electronics, Inc. * | 76,000 | 333,677 | ||||||
| Dongfang Electric Corp., Ltd. | 107,800 | 60,705 | ||||||
| 584,000 | ||||||||
| ELECTRONICS - 2.7% | ||||||||
| Hitachi High-Technologies Corp. | 3,300 | 205,094 | ||||||
| Hoya Corp. | 10,600 | 935,802 | ||||||
| Kyocera Corp. | 11,600 | 760,230 | ||||||
| Security | Shares | Value | ||||||
| ELECTRONICS - 2.7% (Continued) | ||||||||
| LG Display Co., Ltd. * | 11,340 | $ | 132,928 | |||||
| Omron Corp. | 7,000 | 409,077 | ||||||
| TDK Corp. | 4,000 | 394,275 | ||||||
| Yokogawa Electric Corp. | 34,700 | 635,129 | ||||||
| 3,472,535 | ||||||||
| ENERGY-ALTERNATE SOURCES - 0.2% | ||||||||
| Xinyi Solar Holdings Ltd. | 372,000 | 210,147 | ||||||
| ENGINEERING & CONSTRUCTION - 0.4% | ||||||||
| ACS Actividades de Construccion y Servicios SA | 7,566 | 307,111 | ||||||
| China Communications Services Corp., Ltd. | 80,000 | 49,391 | ||||||
| Enka Insaat ve Sanayi AS | 1 | 1 | ||||||
| Sydney Airport | 26,607 | 161,050 | ||||||
| 517,553 | ||||||||
| ENTERTAINMENT - 0.5% | ||||||||
| Aristocrat Leisure Ltd. | 29,681 | 646,820 | ||||||
| Astro Malaysia Holdings Bhd | 149,500 | 48,330 | ||||||
| 695,150 | ||||||||
| FOOD - 3.1% | ||||||||
| Associated British Foods PLC - ADR | 11,300 | 329,621 | ||||||
| CJ CheilJedang Corp. * | 362 | 30,413 | ||||||
| Coles Group Ltd. | 43,616 | 451,115 | ||||||
| JBS SA * | 87,700 | 618,033 | ||||||
| Nestle SA | 11,877 | 1,270,296 | ||||||
| NH Foods Ltd. | 2,900 | 121,716 | ||||||
| Want Want China Holdings Ltd. | 350,000 | 294,777 | ||||||
| WH Group Ltd. | 167,500 | 176,764 | ||||||
| Woolworths Group Ltd. | 26,512 | 683,246 | ||||||
| 3,975,981 | ||||||||
| FOOD SERVICE - 0.3% | ||||||||
| Compass Group PLC - ADR | 16,490 | 438,634 | ||||||
| FOREST PRODUCTS & PAPER- 0.1% | ||||||||
| Shandong Chenming Paper Holdings Ltd. * | 168,900 | 67,599 | ||||||
| GAS - 0.6% | ||||||||
| Grupo Energia Bogota SA ESP | 289,184 | 186,174 | ||||||
| National Grid PLC - ADR ^ | 4,852 | 283,211 | ||||||
| Naturgy Energy Group SA | 12,697 | 346,040 | ||||||
| 815,425 | ||||||||
| HAND / MACHINE TOOLS - 0.3% | ||||||||
| Disco Corp. | 800 | 174,404 | ||||||
| Techtronic Industries Co., Ltd. - ADR | 5,200 | 203,632 | ||||||
| 378,036 | ||||||||
| HEALTHCARE - PRODUCTS - 1.8% | ||||||||
| Cochlear Ltd. | 849 | 123,789 | ||||||
| Getinge AB | 12,450 | 213,325 | ||||||
| Koninklijke Philips NV - ADR ^ | 1,300 | 57,070 | ||||||
| Koninklijke Philips NV | 25,356 | 1,112,822 | ||||||
| Smith & Nephew PLC - ADR ^ | 3,925 | 169,639 | ||||||
| Smith & Nephew PLC | 27,710 | 594,215 | ||||||
| Sonova Holding AG - ADR | 1,170 | 53,621 | ||||||
| 2,324,481 | ||||||||
| HEALTHCARE - SERVICES - 0.2% | ||||||||
| ICON PLC * | 1,400 | 205,660 | ||||||
| HOLDING COMPANIES-DIVERSIFIED - 0.0% | ||||||||
| Haci Omer Sabanci Holding AS * | 1 | 1 | ||||||
| HOME BUILDERS - 0.4% | ||||||||
| Daiwa House Industry Co., Ltd. | 4,700 | 161,626 | ||||||
| Sekisui Chemical Co., Ltd. | 16,900 | 294,351 | ||||||
| Taylor Wimpey PLC | 36,241 | 77,645 | ||||||
| 533,622 | ||||||||
| HOME FURNISHINGS - 0.7% | ||||||||
| Arcelik AS * | 64,164 | 198,946 | ||||||
| LG Electronics, Inc. | 2,286 | 131,009 | ||||||
| Nien Made Enterprise Co., Ltd. | 16,000 | 145,138 | ||||||
| Panasonic Corp. | 57,700 | 484,417 | ||||||
| 959,510 | ||||||||
See accompanying notes to financial statements.
55
| SCHEDULE OF INVESTMENTS |
| Dunham International Stock Fund (Continued) |
| October 31, 2019 |
| Security | Shares | Value | ||||||
| COMMON STOCKS - 98.6% (Continued) | ||||||||
| HOUSEHOLD PRODUCTS/WARES - 0.2% | ||||||||
| Henkel AG & Co. KGaA | 366 | $ | 35,227 | |||||
| Henkel AG & Co. KGaA | 2,593 | 269,427 | ||||||
| 304,654 | ||||||||
| INSURANCE - 8.1% | ||||||||
| Aegon NV - ADR | 54,233 | 234,287 | ||||||
| Aegon NV | 19,140 | 83,062 | ||||||
| Allianz SE | 8,507 | 2,078,257 | ||||||
| Assicurazioni Generali SpA | 30,414 | 616,914 | ||||||
| Aviva PLC - ADR | 18,700 | 203,643 | ||||||
| AXA SA | 30,706 | 813,082 | ||||||
| BB Seguridade Participacoes SA | 28,700 | 242,717 | ||||||
| China Life Insurance Co., Ltd. | 203,000 | 521,937 | ||||||
| China Pacific Insurance Group Co., Ltd. | 116,000 | 420,787 | ||||||
| China Reinsurance Group Corp. | 568,000 | 92,644 | ||||||
| CNP Assurances | 14,352 | 284,966 | ||||||
| Dai-ichi Life Holdings, Inc. | 17,800 | 289,821 | ||||||
| Japan Post Holdings Co., Ltd. | 27,900 | 255,828 | ||||||
| Japan Post Insurance Co., Ltd. | 16,700 | 263,176 | ||||||
| Manulife Financial Corp. | 25,792 | 480,247 | ||||||
| Mapfre SA | 63,895 | 178,387 | ||||||
| MS&AD Insurance Group Holdings, Inc. | 20,500 | 661,266 | ||||||
| Muenchener Rueckversicherungs-Gesellschaft AG | 1,737 | 482,760 | ||||||
| NN Group NV | 15,461 | 590,130 | ||||||
| People’s Insurance Co. Group of China Ltd. | 206,000 | 86,742 | ||||||
| Sompo Holdings, Inc. | 6,000 | 235,586 | ||||||
| Sun Life Financial, Inc. | 10,254 | 460,199 | ||||||
| T&D Holdings, Inc. | 12,000 | 133,511 | ||||||
| Tokio Marine Holdings, Inc. | 15,400 | 831,725 | ||||||
| 10,541,674 | ||||||||
| INTERNET - 0.6% | ||||||||
| Auto Trader Group PLC | 48,367 | 352,049 | ||||||
| SEEK Ltd. | 11,618 | 181,716 | ||||||
| Trend Micro, Inc. | 4,800 | 242,019 | ||||||
| 775,784 | ||||||||
| INVESTMENT COMPANIES - 0.2% | ||||||||
| EXOR NV | 1,160 | 88,958 | ||||||
| Grupo de Inversiones Suramericana SA | 6,016 | 55,167 | ||||||
| Itausa - Investimentos Itau SA | 50,738 | 173,154 | ||||||
| 317,279 | ||||||||
| IRON / STEEL - 0.4% | ||||||||
| Fortescue Metals Group Ltd. - ADR | 14,700 | 177,135 | ||||||
| Fortescue Metals Group Ltd | 8,249 | 50,460 | ||||||
| POSCO | 1,122 | 203,582 | ||||||
| Ternium SA - ADR | 4,716 | 94,273 | ||||||
| 525,450 | ||||||||
| LEISURE TIME - 0.5% | ||||||||
| Carnival PLC | 8,014 | 320,360 | ||||||
| Giant Manufacturing Co., Ltd. | 23,000 | 170,072 | ||||||
| Yamaha Motor Co., Ltd. | 7,100 | 140,549 | ||||||
| 630,981 | ||||||||
| LODGING - 0.8% | ||||||||
| Galaxy Entertainment Group Ltd. | 11,000 | 75,725 | ||||||
| Genting Malaysia Berhad * | 604,800 | 463,874 | ||||||
| Melco Resorts & Entertainment Ltd. - ADR ^ | 8,240 | 177,490 | ||||||
| NagaCorp., Ltd. | 66,000 | 119,901 | ||||||
| Sands China Ltd. - ADR | 2,300 | 113,666 | ||||||
| Shanghai Jinjiang International Hotels Development Co., Ltd. * | 48,300 | 88,582 | ||||||
| 1,039,238 | ||||||||
| MACHINERY CONSTRUCTION & MINING - 1.1% | ||||||||
| Doosan Fuel Cell Co., Ltd. * | 2,769 | 13,804 | ||||||
| Doosan Solus Co., Ltd. * | 1,526 | 10,808 | ||||||
| Hitachi Ltd. - ADR | 1,793 | 133,686 | ||||||
| Hitachi Ltd. | 21,200 | 790,394 | ||||||
| Mitsubishi Electric Corp. | 16,500 | 235,492 | ||||||
| Mitsubishi Heavy Industries Ltd. | 5,000 | 202,132 | ||||||
| 1,386,316 | ||||||||
| Security | Shares | Value | ||||||
| MACHINERY - DIVERSIFIED - 1.0% | ||||||||
| Atlas Copco AB | 13,464 | $ | 418,693 | |||||
| CNH Industrial NV | 51,375 | 559,530 | ||||||
| Doosan Corp. | 828 | 48,191 | ||||||
| Hexagon AB | 5,836 | 299,455 | ||||||
| Shanghai Mechanical and Electrical Industry Co., Ltd. * | 16,300 | 24,580 | ||||||
| 1,350,449 | ||||||||
| MEDIA - 0.8% | ||||||||
| ProSiebenSat.1 Media SE - ADR | 11,700 | 42,471 | ||||||
| Thomson Reuters Corp. | 5,000 | 336,300 | ||||||
| Vivendi SA | 21,438 | 597,185 | ||||||
| Wolters Kluwer NV * | 1,876 | 138,217 | ||||||
| 1,114,173 | ||||||||
| MINING - 5.8% | ||||||||
| Anglo American PLC | 46,438 | 1,193,935 | ||||||
| BHP Group Ltd. - ADR ^ | 9,825 | 480,541 | ||||||
| BHP Group Ltd. | 38,130 | 934,118 | ||||||
| BHP Group PLC - ADR | 8,300 | 352,086 | ||||||
| BHP Group PLC | 36,022 | 763,250 | ||||||
| Glencore PLC - ADR | 8,716 | 52,034 | ||||||
| Glencore PLC | 116,121 | 350,132 | ||||||
| Lundin Mining Corp. | 13,300 | 67,292 | ||||||
| MMC Norilsk Nickel PJSC - ADR | 3,591 | 99,471 | ||||||
| Newcrest Mining Ltd. | 15,245 | 332,580 | ||||||
| Rio Tinto Ltd. | 9,035 | 564,658 | ||||||
| Rio Tinto PLC - ADR | 29,192 | 1,518,276 | ||||||
| Rio Tinto PLC | 4,296 | 223,425 | ||||||
| South32 Ltd. | 26,158 | 45,748 | ||||||
| Teck Resources Ltd. | 19,452 | 308,130 | ||||||
| Vale Indonesia Tbk PT * | 1,189,300 | 314,015 | ||||||
| 7,599,691 | ||||||||
| MISCELLANEOUS MANUFACTURING - 0.7% | ||||||||
| China Railway Signal & Communication Corp., Ltd. | 45,000 | 26,858 | ||||||
| Siemens AG | 7,652 | 883,320 | ||||||
| 910,178 | ||||||||
| OFFICE / BUSINESS EQUIPMENT - 0.6% | ||||||||
| FUJIFILM Holdings Corp. | 12,400 | 543,809 | ||||||
| Konica Minolta, Inc. | 25,900 | 189,898 | ||||||
| Seiko Epson Corp. - ADR | 15,900 | 111,459 | ||||||
| 845,166 | ||||||||
| OIL & GAS - 3.5% | ||||||||
| China Petroleum & Chemical Corp. | 1,550,000 | 881,405 | ||||||
| CNOOC Ltd. | 371,000 | 552,018 | ||||||
| Eni SpA | 13,571 | 205,950 | ||||||
| Gazprom PJSC - ADR | 30,800 | 246,785 | ||||||
| Gazprom PJSC - ADR | 67,456 | 539,918 | ||||||
| LUKOIL PJSC - ADR | 12,323 | 1,133,223 | ||||||
| Petrobras Distribuidora SA | 42,700 | 302,083 | ||||||
| PetroChina Co., Ltd. | 328,000 | 159,917 | ||||||
| PetroChina Co., Ltd. - ADR * | 8,450 | 407,543 | ||||||
| Tourmaline Oil Corp. | 21,648 | 186,117 | ||||||
| 4,614,959 | ||||||||
| PHARMACEUTICALS - 9.5% | ||||||||
| Astellas Pharma, Inc. | 39,200 | 672,062 | ||||||
| AstraZeneca PLC - ADR ^ | 21,482 | 1,053,262 | ||||||
| Bayer AG ^ | 9,438 | 732,395 | ||||||
| China Biologic Products Holdings, Inc. * | 2,600 | 296,504 | ||||||
| Eisai Co., Ltd. - ADR ^ | 2,800 | 203,616 | ||||||
| Eisai Co., Ltd. | 1,800 | 130,162 | ||||||
| GlaxoSmithKline PLC - ADR ^ | 22,900 | 1,048,820 | ||||||
| Livzon Pharmaceutical Group, Inc. | 24,500 | 71,532 | ||||||
| Novartis AG | 21,381 | 1,867,698 | ||||||
| Novo Nordisk A/S - ADR | 3,302 | 182,336 | ||||||
| Novo Nordisk A/S | 16,055 | 883,266 | ||||||
| Roche Holding AG - ADR ^ | 13,300 | 500,346 | ||||||
| Roche Holding AG | 11,030 | 3,318,703 | ||||||
| Sanofi | 7,170 | 661,190 | ||||||
| Shionogi & Co., Ltd. | 8,000 | 479,672 | ||||||
| UCB SA | 3,051 | 245,985 | ||||||
| 12,347,549 | ||||||||
| PIPELINES - 0.0% | ||||||||
| Transportadora de Gas del Sur SA - ADR | 5,842 | 44,166 | ||||||
56
| SCHEDULE OF INVESTMENTS |
| Dunham International Stock Fund (Continued) |
| October 31, 2019 |
| Security | Shares | Value | ||||||
| COMMON STOCKS - 98.6% (Continued) | ||||||||
| PRIVATE EQUITY - 0.6% | ||||||||
| 3i Group PLC | 51,117 | $ | 746,189 | |||||
| REAL ESTATE - 0.4% | ||||||||
| Hang Lung Group Ltd. | 37,000 | 92,651 | ||||||
| Hysan Development Co., Ltd. | 36,000 | 141,853 | ||||||
| Pakuwon Jati Tbk PT | 2,859,100 | 127,239 | ||||||
| REA Group Ltd. | 2,068 | 155,112 | ||||||
| 516,855 | ||||||||
| REIT - 0.7% | ||||||||
| Fortress REIT Ltd. | 148,565 | 88,665 | ||||||
| Goodman Group | 27,924 | 276,838 | ||||||
| H&R REAL ESTATE INV-REIT UTS * | 2,721 | 46,125 | ||||||
| Link REIT | 38,000 | 414,292 | ||||||
| Scentre Group | 34,108 | 90,000 | ||||||
| 915,920 | ||||||||
| RETAIL - 1.8% | ||||||||
| Alimentation Couche-Tard, Inc. | 6,861 | 206,193 | ||||||
| Atacadao SA | 20,900 | 99,908 | ||||||
| Canadian Tire Corp Ltd. | 1,607 | 173,605 | ||||||
| Cie Financiere Richemont SA - ADR | 47,574 | 371,553 | ||||||
| Dollarama, Inc. | 2,419 | 81,551 | ||||||
| Domino’s Pizza Enterprises Ltd. | 2,026 | 71,237 | ||||||
| Hennes & Mauritz AB | 16,983 | 356,746 | ||||||
| Kingfisher PLC - ADR | 1,800 | 9,648 | ||||||
| Kingfisher PLC | 130,026 | 348,445 | ||||||
| Lao Feng Xiang Co., Ltd. | 18,100 | 60,020 | ||||||
| Lojas Americanas SA * | 30,200 | 113,069 | ||||||
| Pandora A/S - ADR | 4,800 | 58,944 | ||||||
| Wesfarmers Ltd. | 12,057 | 331,073 | ||||||
| 2,281,992 | ||||||||
| SEMICONDUCTORS - 8.0% | ||||||||
| Advantest Corp. | 11,000 | 500,061 | ||||||
| ASM Pacific Technology Ltd. | 14,900 | 208,000 | ||||||
| ASML Holding NV - ADR | 480 | 125,745 | ||||||
| Infineon Technologies AG | 9,829 | 190,436 | ||||||
| MediaTek, Inc. | 36,000 | 480,775 | ||||||
| Nanya Technology Corp. | 54,000 | 123,514 | ||||||
| Novatek Microelectronics Corp. * | 62,000 | 397,149 | ||||||
| NXP Semiconductors NV | 4,226 | 480,412 | ||||||
| Renesas Electronics Corp. * | 25,700 | 173,796 | ||||||
| Rohm Co., Ltd. | 2,100 | 166,204 | ||||||
| Samsung Electronics Co., Ltd. - ADR | 126 | 134,568 | ||||||
| Samsung Electronics Co., Ltd. - ADR | 375 | 324,375 | ||||||
| Samsung Electronics Co., Ltd. | 67,400 | 2,913,018 | ||||||
| Samsung Electronics Co., Ltd. | 8,550 | 300,967 | ||||||
| SK Hynix, Inc. * | 14,214 | 999,472 | ||||||
| STMicroelectronics NV - ADR ^ | 24,490 | 555,433 | ||||||
| STMicroelectronics NV | 8,951 | 203,343 | ||||||
| Taiwan Semiconductor Manufacturing Co., Ltd. - ADR ^ | 13,218 | 682,445 | ||||||
| Taiwan Semiconductor Manufacturing Co., Ltd. * | 35,000 | 342,993 | ||||||
| Tokyo Electron Ltd. | 5,200 | 1,052,392 | ||||||
| United Microelectronics Corp. * | 185,000 | 85,196 | ||||||
| 10,440,294 | ||||||||
| SOFTWARE - 2.7% | ||||||||
| Constellation Software, Inc. | 300 | 296,914 | ||||||
| Dassault Systemes SE - ADR | 1,011 | 154,066 | ||||||
| Dassault Systemes SE | 550 | 83,558 | ||||||
| Konami Holdings Corp. | 5,600 | 245,572 | ||||||
| Micro Focus International PLC | 20,549 | 281,746 | ||||||
| NetEase, Inc. - ADR | 982 | 280,714 | ||||||
| Open Text Corp. | 4,000 | 161,040 | ||||||
| Oracle Corp. Japan | 2,500 | 219,507 | ||||||
| Sage Group PLC | 16,965 | 157,951 | ||||||
| SAP SE | 11,299 | 1,497,606 | ||||||
| Xero Ltd. * | 3,984 | 188,868 | ||||||
| 3,567,542 | ||||||||
| TELECOMMUNICATIONS - 3.9% | ||||||||
| BT Group PLC | 70,000 | 185,577 | ||||||
| China Mobile Ltd. | 6,500 | 52,812 | ||||||
| China Telecom Corp., Ltd. - ADR ^ | 2,800 | 118,692 | ||||||
| China Unicom Hong Kong Ltd. - ADR | 22,552 | 219,882 | ||||||
| Security | Shares | Value | ||||||||
| TELECOMMUNICATIONS - 3.9% (Continued) | ||||||||||
| Deutsche Telekom AG * | 54,760 | $ | 963,837 | |||||||
| Hellenic Telecommunications Organization SA * | 10,966 | 166,367 | ||||||||
| Hikari Tsushin, Inc. * | 1,500 | 328,445 | ||||||||
| KDDI Corp. | 12,300 | 339,993 | ||||||||
| Koninklijke KPN NV | 19,522 | 60,623 | ||||||||
| Nice Ltd. - ADR * ^ | 1,319 | 208,125 | ||||||||
| Nippon Telegraph & Telephone Corp. | 14,800 | 733,934 | ||||||||
| NTT DOCOMO, Inc. | 8,600 | 235,519 | ||||||||
| Telecom Italia SpA - ADR * | 37,978 | 219,513 | ||||||||
| Telecom Italia SpA - ADR | 7,800 | 44,772 | ||||||||
| Telecom Italia SpA | 292,289 | 169,232 | ||||||||
| Telefonaktiebolaget LM Ericsson | 13,184 | 115,468 | ||||||||
| Telefonica Brasil SA * | 7,000 | 92,539 | ||||||||
| Telefonica SA | 103,506 | 795,102 | ||||||||
| 5,050,432 | ||||||||||
| TOYS / GAMES / HOBBIES - 0.3% | ||||||||||
| Nintendo Co., Ltd. | 1,000 | 366,397 | ||||||||
| TRANSPORTATION - 2.8% | ||||||||||
| Aurizon Holdings Ltd. | 56,206 | 228,527 | ||||||||
| Canadian National Railway Co. | 6,832 | 612,325 | ||||||||
| Canadian Pacific Railway Ltd. | 3,561 | 809,451 | ||||||||
| Central Japan Railway Co. | 1,100 | 225,407 | ||||||||
| Deutsche Post AG | 17,402 | 616,661 | ||||||||
| East Japan Railway Co. | 6,100 | 553,175 | ||||||||
| Nippon Express Co., Ltd. | 3,000 | 170,985 | ||||||||
| West Japan Railway Co. | 5,800 | 503,428 | ||||||||
| 3,719,959 | ||||||||||
| WATER - 0.3% | ||||||||||
| Aguas Andinas SA | 456,664 | 209,530 | ||||||||
| Cia de Saneamento Basico do Estado de Sao Paulo * | 12,000 | 163,481 | ||||||||
| 373,011 | ||||||||||
| TOTAL COMMON STOCKS (Cost - $117,738,919) | 128,617,327 | |||||||||
| EXCHANGE TRADED FUND - 0.5% | ||||||||||
| EQUITY FUND - 0.5% | ||||||||||
| iShares MSCI EAFE ETF | 9,748 | 657,211 | ||||||||
| TOTAL EXCHANGE TRADED FUND (Cost - $559,555) | ||||||||||
| Expiration Date | ||||||||||
| WARRANT- 0.0% | ||||||||||
| Barito Pacific TBK PT * ++ | 6/3/2021 | 178,610 | 7,507 | |||||||
| TOTAL WARRANTS (Cost - $0) | ||||||||||
| Principal | ||||||||||
| Interest Rate % | Amount $ | |||||||||
| PREFERRED STOCKS - 0.1% | ||||||||||
| BANKS - 0.1% | ||||||||||
| Banco Bradesco SA * | 0.540 | 11,300 | 99,280 | |||||||
| TOTAL PREFERRED STOCKS (Cost -$107,170) | ||||||||||
| Shares | ||||||||||
| COLLATERAL FOR SECURITIES LOANED - 4.9% | ||||||||||
| Mount Vernon Prime Portfolio, 2.04% + # (Cost - $6,325,040) | 6,325,040 | 6,325,040 | ||||||||
| TOTAL INVESTMENTS - 104.1% (Cost - $124,730,684) | $ | 135,706,365 | ||||||||
| LIABILITIES IN EXCESS OF OTHER ASSETS - (4.1)% | (5,293,281 | ) | ||||||||
| NET ASSETS - 100.0% | $ | 130,413,084 | ||||||||
| ^ | All or a portion of these securities are on loan. Total loaned securities had a value of $6,175,100 at October 31, 2019. |
| * | Non-income producing security. |
ADR - American Depositary Receipt.
NV - Non-Voting
PLC - Public Limited Company REIT - Real Estate Investment Trust.
| + | Variable rate security. Interest rate is as of October 31, 2019. |
| ++ | The Advisor or Trustees have determined these securities to be illiquid. On October 31, 2019, these securities amounted to $7,507 or 0.00% of net assets. |
| # | The Trust’s securities lending policies and procedures require that the borrower: (i) deliver cash or U.S. Government securities as collateral with respect to each new loan of U.S. securities, equal to at least 102% (105% for non US Shares) of the value of the portfolio securities loaned, and (ii) at all times thereafter mark-to-market the collateral on a daily basis so that the market value of such collateral is at least 100% of the value of securities loaned. From time to time the collateral may not be 102% due to end of day market movement. The next business day additional collateral is obtained/received from the borrower to replenish/reestablish 102%. |
| See accompanying notes to financial statements. |
57
| SCHEDULE OF INVESTMENTS |
| Dunham International Stock Fund (Continued) |
| October 31, 2019 |
| Portfolio Composition* - (Unaudited) | ||||||||||
| Japan | 16.8 | % | South Korea | 5.2 | % | |||||
| Britain | 12.1 | % | France | 4.7 | % | |||||
| Germany | 8.5 | % | Canada | 4.7 | % | |||||
| China | 7.0 | % | Taiwan | 3.4 | % | |||||
| Switzerland | 6.3 | % | Other Countries ** | 25.6 | % | |||||
| Australia | 5.7 | % | Total | 100.0 | % | |||||
| * | Based on total value of investments as of October 31, 2019. |
| ** | Includes collateral for securities loaned as of October 31, 2019. |
Percentage may differ from Schedule of Investments which are based on Fund net assets.
See accompanying notes to financial statements.
58
| Dunham Real Estate Stock Fund (Unaudited) |
| Message from the Sub-Adviser (Barings LLC) |
Asset Class Recap
In December, the Federal Open Market Committee raised base rates by 25 basis points, moving the Fed Funds rate to 2.50 percent. However, Jerome Powell reversed from his hawkish stance announced in December and sought to reduce the expected interest rate hikes in 2019 from three to two. With inflation remaining stubbornly low and trade war tensions escalating, Fed Chairman Jerome Powell announced a halt to the interest rate hike plans in 2019 and cut interest rates in July. In the final fiscal quarter, volatility spiked once again amid global growth concerns and increasing tensions between the U.S. and China. Markets rebounded to finish the fiscal year as the Fed cut interest rates two more times in the fourth fiscal quarter and the dovish central bank tone reverberated around the globe. REITs, as measured by the FTSE NAREIT All REITs Index, increased 24.2 percent during the most recent fiscal year, and out performed both broad equity and bonds indexes. Broad equity indexes, as measured by the S&P 500 Index, increased 14.3 percent. Bonds, as measured by the Bloomberg Barclays U.S. Aggregate Bond Index, rose 11.5 percent during the fiscal year.
Allocation Review
During the first fiscal quarter, concerns about a slowing economy coincided with the defensive REIT sectors such as net lease , healthcare and manufactured housing out performing. However, for the remainder of the fiscal year concerns about a slowing economy somewhat dissipated and central banks tilted toward a dovish stance, aiding cyclical sectors such as data centers to out perform. For the full fiscal year and the most recent fiscal quarter, sector allocation strongly contributed to relative Fund performance while security selection detracted. In the most recent fiscal quarter and coincidentally for the full fiscal year, the strongest performing sectors within the Fund on an absolute basis were the data center, industrials, and manufactured homes REITS, while the worst performing sectors were the regional mall and lodging REITs.
Holdings Insights
American Tower Corp. (AMT) (holding weight*: 7.42 percent), an owner and operator of wireless and broadcast communications infrastructure, was a strong contributor to Fund performance through the full fiscal year despite detracting from performance in the final fiscal quarter. AMT continued to post solid cash flows and the Sub-Adviser believes it is poised to benefit from investment in 5G-tower infrastructure. Although the Sub-Adviser sold the holding during the first fiscal quarter, the Fund reinitiated the holding during the second fiscal quarter. AMT increased 38 percent over the full fiscal year but slightly detracted on a relative basis in the final fiscal quarter of the year by increasing 5 percent. Another contributor was Prologis Inc. (PLD) (holding weight*: 5.09 percent), which operates and invests in industrial properties. The company had better-than-expected earnings during both fiscal quarters; however, it faced weakness from its 2018 merger. Over the full fiscal year, PLD increased 37.5 percent, and 7.8 percent in the most recent fiscal quarter.
As previously mentioned, one of the worst performing REIT sectors was the regional mall sector. A position within this sector that detracted from Fund performance was Simon Property Group, Inc. (SPG) (holding weight*: 1.92 percent). SPG decreased 12 percent in the most recent fiscal quarter and 15.8 percent for the full fiscal year. The Sub-Adviser believes that this sector will continue to face significant headwinds but the Sub-Adviser believes that SPG is the best-positioned regional mall REIT. SPG has the largest footprint, is customer experience focused, and made significant investments in E-sports and online clothing rentals. The Fund’s underweight to the data centers REIT sector detracted from relative performance, as it was one of the best performing sectors. One of the largest contributors to the Fund’s absolute performance over the fiscal quarter was Equinix Inc. (EQIX) (holding weight*: 6.39 percent), a data center REIT that owns over 200 data centers in 24 countries. This position benefited from continued strength in the interconnection market, in addition to the company further expanding its portfolio of international data centers. During the most recent fiscal quarter, EQIX increased 27.5 percent and increased 53.7 percent in the full fiscal year.
Sub-Adviser Outlook
The Sub-Adviser believes that there is a significant bifurcation in net asset values across REIT sectors that will continue to present opportunities for superior sector allocation and stock selection. The Sub-Adviser believes that industrials and manufactured homes are steady with the strongest same-store net operating income. The Sub-Adviser also believes that macro factors, such as trade and international travel, will continue to weigh on lodging. The Sub-Adviser is confident that rent growth for single family remains strong, and expenses, which have been an issue, could stabilize this year as the sector matures.
| * | Holdings percentage(s) of total investments as of 10/31/2019. |
Growth of $100,000 Investment
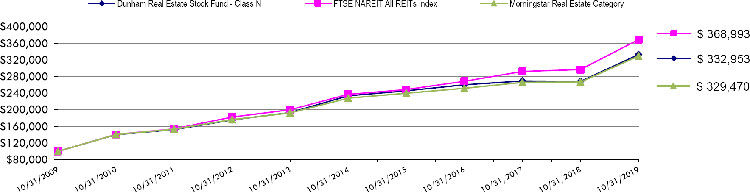
| Total Returns(a) as of October 31, 2019 | |||||||
| Annualized | Annualized | ||||||
| One Year | Five Years | Ten Years | |||||
| Class N | 24.16% | 7.32% | 12.78% | ||||
| Class C | 22.97% | 6.26% | 11.67% | ||||
| Class A with load of 5.75% | 16.72% | 5.80% | 11.84% | ||||
| Class A without load | 23.81% | 7.06% | 12.51% | ||||
| FTSE NAREIT All REITs Index | 24.21% | 8.21% | 13.94% | ||||
| Morningstar Real Estate Category | 23.52% | 7.62% | 12.66% | ||||
| (a) | Total Returns are calculated based on traded NAVs. |
The FTSE NAREIT All REITs Index is a free float adjusted market capitalization weighted index that includes all tax qualified REITs listed on the NYSE and NASDAQ National Market. Investors cannot invest directly in an index or benchmark.
The Morningstar Real Estate Category is generally representative of mutual funds that primarily invest in REITs of various types. REITs are companies that develop and manage real estate properties.
As disclosed in the Trust’s latest registration statement, the Fund’s total annual operating expenses, including the cost of underlying funds, are 1.10% for Class N, 2.10% for Class C and 1.35% for Class A. Class A shares are subject to a sales load of 5.75% and a deferred sales charge of up to 0.75% The performance data quoted here represents past performance, which is not indicative of future results. Current performance may be lower or higher than the performance data quoted. The investment return and NAV will fluctuate, so that an investor’s shares, when redeemed, may be worth more or less than their original cost. Total returns are calculated assuming reinvestment of all dividends and capital gains distributions, if any. The returns do not reflect the deductions of taxes a shareholder would pay on the redemption of Fund shares or Fund distributions. For performance information current to the most recent month-end, please call 1-800-442-4358 or visit our website www.dunham.com
59
| SCHEDULE OF INVESTMENTS |
| Dunham Real Estate Stock Fund |
| October 31, 2019 |
| Security | Shares | Value | ||||||
| REITS - 98.9% | ||||||||
| APARTMENTS - 18.6% | ||||||||
| American Homes 4 Rent | 37,710 | $ | 998,184 | |||||
| AvalonBay Communities, Inc. | 9,128 | 1,986,800 | ||||||
| Equity Residential | 34,551 | 3,063,292 | ||||||
| Invitation Homes, Inc. | 50,233 | 1,546,674 | ||||||
| Mid-America Apartment Communities, Inc. | 18,951 | 2,633,999 | ||||||
| 10,228,949 | ||||||||
| DIVERSIFIED - 30.2% | ||||||||
| American Tower Corp. | 18,688 | 4,075,479 | ||||||
| Crown Castle International Corp. | 19,530 | 2,710,569 | ||||||
| Digital Realty Trust, Inc. | 6,659 | 845,959 | ||||||
| Equinix, Inc. | 6,193 | 3,510,069 | ||||||
| Lexington Realty Trust | 48,418 | 526,788 | ||||||
| New Residential Investment Corp. | 73,391 | 1,162,513 | ||||||
| SBA Communications Corp. | 6,383 | 1,536,069 | ||||||
| VICI Properties, Inc. | 57,365 | 1,350,946 | ||||||
| Weyerhaeuser Co. | 29,136 | 851,063 | ||||||
| 16,569,455 | ||||||||
| FINANCE - MORTGAGE LOAN/BANKER - 2.1% | ||||||||
| TPG RE Finance Trust, Inc. | 56,983 | 1,152,766 | ||||||
| HEALTHCARE - 9.6% | ||||||||
| Medical Properties Trust, Inc. | 46,110 | 955,860 | ||||||
| National Health Investors, Inc. | 7,819 | 670,792 | ||||||
| Ventas, Inc. | 18,059 | 1,175,641 | ||||||
| Welltower, Inc. | 27,176 | 2,464,591 | ||||||
| 5,266,884 | ||||||||
| HOTELS - 1.7% | ||||||||
| Host Hotels & Resorts, Inc. | 56,398 | 924,363 | ||||||
| MANUFACTURED HOMES - 2.2% | ||||||||
| Sun Communities, Inc. | 7,522 | 1,223,453 | ||||||
| OFFICE - 9.0% | ||||||||
| Alexandria Real Estate Equities, Inc. | 8,487 | 1,347,311 | ||||||
| Boston Properties, Inc. | 13,194 | 1,810,217 | ||||||
| Kilroy Realty Corp. | 21,018 | 1,764,041 | ||||||
| 4,921,569 | ||||||||
| REGIONAL MALLS - 1.9% | ||||||||
| Simon Property Group, Inc. | 6,982 | 1,052,048 | ||||||
| SHOPPING CENTERS - 2.2% | ||||||||
| Regency Centers Corp. | 17,651 | 1,186,853 | ||||||
| SINGLE FAMILY - 9.2% | ||||||||
| Agree Realty Corp. | 14,392 | 1,133,658 | ||||||
| National Retail Properties, Inc. | 22,761 | 1,340,851 | ||||||
| Spirit Realty Capital, Inc. | 17,223 | 858,394 | ||||||
| STORE Capital Corp. | 42,149 | 1,707,035 | ||||||
| 5,039,938 | ||||||||
| STORAGE - 2.3% | ||||||||
| Extra Space Storage, Inc. | 11,086 | 1,244,625 | ||||||
| WAREHOUSE/INDUSTRIAL - 9.9% | ||||||||
| First Industrial Realty Trust, Inc. | 34,674 | 1,460,122 | ||||||
| Prologis, Inc. | 30,784 | 2,701,604 | ||||||
| Rexford Industrial Realty, Inc. | 26,741 | 1,285,975 | ||||||
| 5,447,701 | ||||||||
| TOTAL REITS (Cost - $42,047,989) | 54,258,604 | |||||||
See accompanying notes to financial statements.
60
| SCHEDULE OF INVESTMENTS |
| Dunham Real Estate Stock Fund (Continued) |
| October 31, 2019 |
| Value | ||||
| TOTAL INVESTMENTS - 98.9% (Cost - $42,047,989) | $ | 54,258,604 | ||
| OTHER ASSETS IN EXCESS OF LIABILITIES - 1.1% | 579,156 | |||
| TOTAL NET ASSETS - 100.00% | $ | 54,837,760 | ||
REITS - Real Estate Investment Trusts
| Portfolio Composition * - (Unaudited) | ||||||||||
| Diversified | 30.5 | % | Storage | 2.3 | % | |||||
| Apartments | 18.9 | % | Manufactured Homes | 2.3 | % | |||||
| Warehouse/Industrial | 10.0 | % | Shopping Centers | 2.2 | % | |||||
| Healthcare | 9.7 | % | Finance - Mortgage Loan/Banker | 2.1 | % | |||||
| Single Family | 9.3 | % | Regional Malls | 1.9 | % | |||||
| Office | 9.1 | % | Hotels | 1.7 | % | |||||
| Total | 100.0 | % | ||||||||
| * | Based on total value of investments as of October 31, 2019. |
Percentage may differ from Schedule of Investments which are based on Fund net assets.
See accompanying notes to financial statements.
61
| Dunham Small Cap Value Fund (Unaudited) |
| Message from the Sub-Adviser (Ziegler Capital Management, LLC) |
Asset Class Recap
After proving to be one of the few asset classes in the third fiscal quarter to post a negative return, small cap value stocks, as measured by the Russell 2000 Value Index, experienced a modest rebound in the final fiscal quarter. Small cap value stocks rose 1.7 percent during the fourth fiscal quarter after declining 2.2 percent in the third fiscal quarter. This was only the second fiscal quarter of the fiscal year that small cap value stocks eked out a positive return, resulting in small cap value stocks only increasing 3.2 percent over the fiscal year as a whole. This lackluster return over the 12-month period was significantly less than small cap value’s equity peers as well as broad bonds, in general. This modest overall return for the fiscal year masked the massive dispersion in returns within the small cap value space.
Allocation Review
During the fiscal year, the dispersion in small cap value stocks between the best performing sector, technology, and the worst performing sector, energy, was close to 70 percent. As the energy sector plummeted close to 43 percent, the technology sector surged over 27 percent. While the Fund performed fairly in-line with the energy sector’s overall return, the technology sector proved to be one of the best relative performing sectors for the Fund, as the Sub-Adviser’s stock selection added more than 12 percent out performance in the sector. The Sub-Adviser is keenly aware that attempting to tactically navigate changing sector leadership can greatly increase risk and detract from positive attribution provided from individual stock selection. Therefore, the Fund did not benefit nor was it adversely affected by its sector allocation during the fiscal year. The Sub-Adviser implements sector-specific models that highlight the various factors pertinent to evaluate the stocks within that sector. The factor groups that had the highest exposure during the fiscal year were the valuation-based factors and the sentiment & share-related factors. Together, these factor groups comprise close to half of the aggregate factor weights. In addition, during the final fiscal quarter, these factor groups generally corresponded with positive stock selection. As these factor groups had generally been out of favor during much of the fiscal year, as well as most of the recent bull market, the Sub-Adviser’s discipline of maintaining strategic weights to each of its factors proved itself in the final months of the fiscal year. However, in the homestretch of the fiscal year, the two poorest performing factor groups were earnings quality and balance sheet-oriented factors. While these generally detracted on a broad level, the total weighting between the two groups comprised less than 17 percent of the factor allocation.
Holdings Insights
As the worst performing sector in the benchmark index, the energy sector provided many of the worst performing holdings in the Fund, as well. For example, the Fund held Penn Virginia Corp (PVAC) (holding weight*: 0.74 percent), an oil and natural gas exploration company focused on shale in Texas, and Helix Energy Solutions Group (HLX) (holding weight*: 0.94 percent), a deep-water oil and gas contractor. Since its addition to the Fund, PVAC declined 34.6 percent through the end of the fiscal year. The vast majority of this decline occurred in the final fiscal quarter, as concerns over Eagle Ford Shale prospects pressured stock prices lower. HLX was one of the Fund’s best-performing energy holding during the fiscal year, eking out a 0.8 percent return for the 12-month period. One of the poorest performers in the sector, Whiting Petroleum Corp. (WLL) (holding weight**: 0.28 percent), an oil and gas exploration company in the Rocky Mountains, fared far worse as it continued its downward spiral until the Sub-Adviser exited the position in August, after it had dropped more than 74 percent since the start of the fiscal year. WLL’s freefall primarily took place in the latter half of the fiscal year and was primarily in response to poor earnings releases coupled with a significantly lowered outlook for its oil production.
Within the strongest performing sector, technology, stocks such as Jabil Inc. (JBL) (holding weight*: 1.59 percent), one of the leading providers of outsourced electronics manuf acturing services, and Synaptics Inc. (SYNA) (holding weight*: 1.15 percent), a human interface product manufacturer, including touch-sensitive pads for laptops, increased 48.6 percent and 47.3 percent respectively. JBL’s gain was generally attributable to its announcement that it would repurchase $600 million of its stock and some analyst upgrades, while SYNA’s leap was primarily due to a positive earnings beats.
The financials sector is the largest small cap value sector, nearly quadruple the size of the second largest sector. As the Sub-Adviser seeks to diversify its exposures within the large sector, all of the holdings sizes were below 2 percent, with the majority below 1 percent. The largest financials sector holding in the Fund during the fiscal year was Rexford Industrial Realty Inc. (REXR) (holding weight*: 1.72 percent), a real estate investment trust focused on Los Angeles warehousing. Since it was added, REXR was also one of the Fund’s best performers, as it increased 54.8 percent as the company reported strong earnings. One of the largest detractors from Fund performance was Mercury General Corp. (MCY) (holding weight*: 1.05 percent), the national auto insurance provider with some homeowners and umbrella insurance underwriting. Its 14.3 percent decline in the final fiscal quarter brought the stock below break-even since it was added earlier in the fiscal year, seeing it end with a loss of 2.5 percent. This latest decline landed as MCY’s high exposure to California came under pressure due to the recent wildfires and a decline in non-California personal auto policies.
Sub-Adviser Outlook
The Sub-Adviser has remained disciplined in its implementation of its quantitatively-driven approach which has generally benefitted its stock selection over the fiscal year. The Sub-Adviser continues to believe that the current market is underappreciating some of the factors that the Sub-Adviser focuses on, but was recently encouraged as its valuation-oriented signals emerged as a positive contributor to its stock selection for the Fund.
| * | Holdings percentage(s) of total investments, excluding collateral for securities loaned, as of 10/31/2019. |
| ** | Holdings percentage(s) as of the date prior to the sale of the security. |
Growth of $100,000 Investment
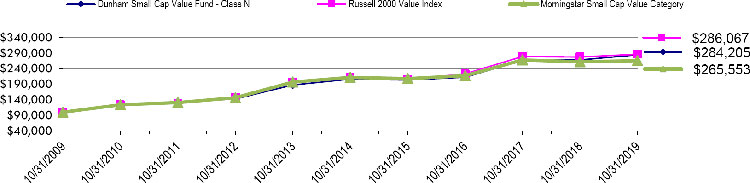
| Total Returns(a) as of October 31, 2019 | |||||||
| Annualized | Annualized | ||||||
| One Year | Five Years | Ten Years | |||||
| Class N | 6.15% | 6.60% | 11.01% | ||||
| Class C | 5.06% | 5.53% | 9.90% | ||||
| Class A with load of 5.75% | (0.24)% | 5.07% | 10.09% | ||||
| Class A without load | 5.85% | 6.33% | 10.74% | ||||
| Russell 2000 Value Index | 3.22% | 6.24% | 11.08% | ||||
| Morningstar Small Cap Value Category | 1.52% | 4.62% | 10.26% | ||||
| (a) | Total Returns are calculated based on traded NAVs. |
The Russell 2000 Value Index is an unmanaged index that measures the performance of small cap companies in the Russell 2000 Index with lower price-to-book ratios and lower forecasted growth rates. Investors cannot invest directly in an index or benchmark.
The Morningstar Small Cap Value Category is generally representative of mutual funds that primarily invest in small (small capitalization) U.S. companies that are less expensive or growing more slowly than other small-cap stocks.
As disclosed in the Trust’s latest registration statement, the Fund’s total annual operating expenses, including underlying funds, are 1.54% for Class N, 2.54% for Class C and 1.79% for Class A. Class A shares are subject to a sales load of 5.75% and a deferred sales charge of up to 0.75%. The performance data quoted here represents past performance, which is not indicative of future results. Current performance may be lower or higher than the performance data quoted. The investment return and NAV will fluctuate, so that an investor’s shares, when redeemed, may be worth more or less than their original cost. Total returns are calculated assuming reinvestment of all dividends and capital gains distributions, if any. The returns do not reflect the deductions of taxes a shareholder would pay on the redemption of Fund shares or Fund distributions. For performance information current to the most recent month-end, please call 1-800-442-4358 or visit our website www.dunham.com.
62
| SCHEDULE OF INVESTMENTS |
| Dunham Small Cap Value Fund |
| October 31, 2019 |
| Security | Shares | Value | ||||||
| COMMON STOCKS - 99.4% | ||||||||
| AUTO PARTS & EQUIPMENT - 1.0% | ||||||||
| Cooper Tire & Rubber Co. | 6,104 | $ | 172,377 | |||||
| Goodyear Tire & Rubber Co. | 26,000 | 412,620 | ||||||
| 584,997 | ||||||||
| BANKS - 20.4% | ||||||||
| BancFirst Corp. | 5,440 | 314,921 | ||||||
| Bancorp, Inc. * | 34,278 | 373,630 | ||||||
| BankUnited, Inc. | 15,452 | 530,004 | ||||||
| Banner Corp. | 10,960 | 591,621 | ||||||
| CenterState Bank Corp. | 20,400 | 517,344 | ||||||
| Central Pacific Financial Corp. | 18,270 | 528,368 | ||||||
| First Interstate BancSystem, Inc. | 11,970 | 502,261 | ||||||
| First Midwest Bancorp, Inc. | 33,110 | 680,079 | ||||||
| Flagstar Bancorp, Inc. | 18,012 | 654,556 | ||||||
| Heartland Financial USA, Inc. | 12,060 | 564,167 | ||||||
| Heritage Commerce Corp. | 23,000 | 276,460 | ||||||
| Independent Bank Corp. | 17,780 | 400,228 | ||||||
| International Bancshares Corp. | 15,380 | 629,965 | ||||||
| Old National Bancorp | 37,800 | 680,211 | ||||||
| Simmons First National Corp. | 22,730 | 543,702 | ||||||
| Texas Capital Bancshares, Inc. * | 10,820 | 584,929 | ||||||
| TriCo Bancshares | 8,813 | 331,633 | ||||||
| TrustCo Bank Corp. NY | 23,000 | 198,720 | ||||||
| UMB Financial Corp. | 9,530 | 621,928 | ||||||
| Umpqua Holdings Corp. | 37,290 | 589,928 | ||||||
| United Community Banks, Inc. | 24,710 | 746,489 | ||||||
| Wintrust Financial Corp. | 9,540 | 608,843 | ||||||
| 11,469,987 | ||||||||
| BUILDING MATERIALS - 1.5% | ||||||||
| Continental Building Products, Inc. * | 15,000 | 448,650 | ||||||
| Masonite International Corp. * | 6,800 | 417,588 | ||||||
| 866,238 | ||||||||
| CHEMICALS - 1.5% | ||||||||
| Koppers Holdings, Inc. * | 10,723 | 344,208 | ||||||
| Minerals Technologies, Inc. | 10,298 | 509,236 | ||||||
| 853,444 | ||||||||
| COMMERCIAL SERVICES - 5.4% | ||||||||
| Aaron’s, Inc. | 14,740 | 1,104,468 | ||||||
| CBIZ, Inc. * | 21,310 | 583,255 | ||||||
| FTI Consulting, Inc. * | 7,750 | 843,742 | ||||||
| K12, Inc. * | 24,240 | 479,710 | ||||||
| 3,011,175 | ||||||||
| COMPUTERS - 0.6% | ||||||||
| MTS Systems Corp. | 6,410 | 362,037 | ||||||
| COSMETICS/PERSONAL CARE - 1.6% | ||||||||
| Edgewell Personal Care Co.* | 13,268 | 464,380 | ||||||
| elf Beauty, Inc. * | 25,000 | 420,000 | ||||||
| 884,380 | ||||||||
| DISTRIBUTION/WHOLESALE - 1.0% | ||||||||
| WESCO International, Inc.* | 11,371 | 570,256 | ||||||
| DIVERSIFIED FINANCIAL SERVICES - 1.9% | ||||||||
| Boston Private Financial Holdings, Inc. | 36,580 | 411,525 | ||||||
| Piper Jaffray Cos. | 8,540 | 670,732 | ||||||
| 1,082,257 | ||||||||
| ELECTRIC - 3.8% | ||||||||
| PNM Resources, Inc. | 16,120 | 840,658 | ||||||
| Portland General Electric Co. | 14,900 | 847,512 | ||||||
| Unitil Corp. | 7,220 | 449,589 | ||||||
| 2,137,759 | ||||||||
| Security | Shares | Value | ||||||
| ELECTRONICS - 3.3% | ||||||||
| Coherent, Inc. * | 1,400 | $ | 208,488 | |||||
| Comtech Telecommunications Corp. | 17,400 | 608,130 | ||||||
| Jabil, Inc. | 23,600 | 868,952 | ||||||
| Vishay Precision Group, Inc. * | 5,574 | 189,795 | ||||||
| 1,875,365 | ||||||||
| FOOD - 1.5% | ||||||||
| Fresh Del Monte Produce, Inc. | 11,137 | 355,270 | ||||||
| Simply Good Foods Co. * | 19,790 | 485,647 | ||||||
| 840,917 | ||||||||
| GAS - 1.4% | ||||||||
| Spire, Inc. | 9,370 | 787,642 | ||||||
| HAND / MACHINE TOOLS - 0.9% | ||||||||
| Regal Beloit Corp. | 7,150 | 529,457 | ||||||
| HEALTHCARE - PRODUCTS - 2.7% | ||||||||
| Integer Holdings Corp.* | 6,910 | 535,110 | ||||||
| Lantheus Holdings, Inc.* | 20,600 | 429,510 | ||||||
| Varex Imaging Corp. * | 18,665 | 560,137 | ||||||
| 1,524,757 | ||||||||
| HEALTHCARE - SERVICES - 0.5% | ||||||||
| National HealthCare Corp. | 3,220 | 264,620 | ||||||
| HOME BUILDERS- 1.5% | ||||||||
| Taylor Morrison Home Corp. * | 33,430 | 837,421 | ||||||
| HOME FURNISHINGS - 1.6% | ||||||||
| Ethan Allen Interiors, Inc. | 17,790 | 350,641 | ||||||
| Sleep Number Corp. * | 11,160 | 537,019 | ||||||
| 887,660 | ||||||||
| HOUSEHOLD PRODUCTS/WARES - 0.8% | ||||||||
| ACCO Brands Corp. | 46,227 | 422,977 | ||||||
| INSURANCE - 5.8% | ||||||||
| American Equity Investment Life Holding Co. | 25,400 | 626,872 | ||||||
| Assured Guaranty Ltd. | 13,760 | 645,619 | ||||||
| Essent Group Ltd. | 14,300 | 744,887 | ||||||
| Mercury General Corp. | 12,673 | 609,064 | ||||||
| Selective Insurance Group, Inc. | 8,940 | 617,933 | ||||||
| 3,244,375 | ||||||||
| IRON / STEEL - 0.7% | ||||||||
| Schnitzer Steel Industries, Inc. | 18,427 | 393,232 | ||||||
| LEISURE TIME - 0.1% | ||||||||
| Johnson Outdoors, Inc. | 1,326 | 77,637 | ||||||
| LODGING - 1.5% | ||||||||
| Hilton Grand Vacations, Inc. * | 13,550 | 470,592 | ||||||
| Marcus Corp. | 10,620 | 383,382 | ||||||
| 853,974 | ||||||||
| MACHINERY - DIVERSIFIED - 0.8% | ||||||||
| Altra Industrial Motion Corp. | 14,190 | 437,052 | ||||||
| METAL FABRICATE / HARDWARE - 2.3% | ||||||||
| AZZ, Inc. | 8,300 | 321,957 | ||||||
| Mueller Industries, Inc. | 19,790 | 608,938 | ||||||
| TriMas Corp. * | 10,330 | 333,866 | ||||||
| 1,264,761 | ||||||||
| MISCELLANEOUS MANUFACTURING - 1.5% | ||||||||
| Federal Signal Corp. | 15,710 | 509,632 | ||||||
| Lydall, Inc. * | 16,800 | 328,776 | ||||||
| 838,408 | ||||||||
See accompanying notes to financial statements.
63
| SCHEDULE OF INVESTMENTS |
| Dunham Small Cap Value Fund (Continued) |
| October 31, 2019 |
| Security | Shares | Value | ||||||
| COMMON STOCKS - 99.4% (Continued) | ||||||||
| OFFICE FURNISHINGS - 0.7% | ||||||||
| HNI Corp. | 10,600 | $ | 402,800 | |||||
| OIL & GAS - 3.0% | ||||||||
| Bonanza Creek Energy, Inc. * | 15,510 | 276,388 | ||||||
| CVR Energy, Inc. | 7,300 | 346,166 | ||||||
| Delek US Holdings, Inc. | 17,810 | 711,510 | ||||||
| Penn Virginia Corp. * | 16,000 | 380,800 | ||||||
| 1,714,864 | ||||||||
| OIL & GAS SERVICES - 2.4% | ||||||||
| Archrock, Inc. | 47,000 | 453,080 | ||||||
| Helix Energy Solutions Group, Inc. * | 63,050 | 541,600 | ||||||
| Newpark Resources, Inc. * | 60,827 | 364,962 | ||||||
| 1,359,642 | ||||||||
| PACKAGING & CONTAINERS - 1.0% | ||||||||
| Silgan Holdings, Inc. | 18,800 | 578,476 | ||||||
| PHARMACEUTICALS - 1.1 % | ||||||||
| Anika Therapeutics, Inc. * | 9,003 | 633,721 | ||||||
| REITS - 13.2% | ||||||||
| Alexander & Baldwin, Inc. | 24,000 | 564,240 | ||||||
| Arbor Realty Trust, Inc. ^ | 39,800 | 543,668 | ||||||
| Armada Hoffler Properties, Inc. | 17,970 | 336,758 | ||||||
| Columbia Property Trust, Inc. | 29,128 | 597,707 | ||||||
| Corporate Office Properties Trust | 21,900 | 649,116 | ||||||
| Getty Realty Corp. | 9,950 | 333,723 | ||||||
| Hersha Hospitality Trust | 27,920 | 385,296 | ||||||
| Ladder Capital Corp. | 33,820 | 584,071 | ||||||
| Piedmont Office Realty Trust, Inc. | 28,000 | 628,320 | ||||||
| Preferred Apartment Communities, Inc. | 31,522 | 451,395 | ||||||
| QTS Realty Trust, Inc. | 2,720 | 145,765 | ||||||
| Rexford Industrial Realty, Inc. | 20,700 | 995,463 | ||||||
| RLJ Lodging Trust | 33,550 | 550,556 | ||||||
| STAG Industrial, Inc. | 21,510 | 667,670 | ||||||
| 7,433,748 | ||||||||
| RETAIL - 3.2% | ||||||||
| Conn’s, Inc. * | 14,626 | 353,803 | ||||||
| Denny’s Corp. * | 22,200 | 446,664 | ||||||
| Sonic Automotive, Inc. | 17,000 | 547,910 | ||||||
| Zumiez, Inc. * | 14,530 | 463,652 | ||||||
| 1,812,029 | ||||||||
| Security | Shares | Value | ||||||
| SAVINGS & LOANS - 0.5% | ||||||||
| OceanFirst Financial Corp. | 11,300 | $ | 270,409 | |||||
| SEMICONDUCTORS - 2.0% | ||||||||
| Rambus, Inc. * | 37,480 | 518,911 | ||||||
| Synaptics, Inc. * | 14,000 | 589,540 | ||||||
| 1,108,451 | ||||||||
| SOFTWARE - 2.2% | ||||||||
| MicroStrategy, Inc. * | 3,960 | 606,870 | ||||||
| Progress Software Corp. | 15,310 | 610,563 | ||||||
| 1,217,433 | ||||||||
| TELECOMMUNICATIONS - 1.6% | ||||||||
| LogMeIn, Inc. | 8,700 | 571,416 | ||||||
| United States Cellular Corp. * | 9,140 | 340,191 | ||||||
| 911,607 | ||||||||
| TRANSPORTATION - 1.9% | ||||||||
| Covenant Transportation Group, Inc. * | 12,120 | 186,284 | ||||||
| Echo Global Logistics, Inc. * | 20,195 | 402,083 | ||||||
| Marten Transport Ltd. | 20,940 | 453,560 | ||||||
| 1,041,927 | ||||||||
| WATER - 1.0% | ||||||||
| SJW Group | 7,635 | 552,392 | ||||||
| TOTAL COMMON STOCKS - (Cost - $52,501,858) | 55,940,284 | |||||||
| COLLATERAL FOR SECURITIES LOANED - 1.0% | ||||||||
| HSBC US Government Money Market Fund - Class I, 1.72% + # | 542,100 | 542,100 | ||||||
| TOTAL COLLATERAL FOR SECURITIES LOANED (Cost - $542,100) | ||||||||
| TOTAL INVESTMENTS - 100.4% (Cost - $53,043,958) | $ | 56,482,384 | ||||||
| LIABILITIES IN EXCESS OF OTHER ASSETS - (0.4)% | (235,566 | ) | ||||||
| NET ASSETS - 100.0% | $ | 56,246,818 | ||||||
REITS - Real Estate Investment Trust
| * | Non Income producing security. |
| ^ | All or a portion of these securities are on loan. Total loaned securities had a value of $532,740 at October 31, 2019. |
| + | Variable rate security - interest rate is as of October 31, 2019. |
| # | The Trust’s securities lending policies and procedures require that the borrower: (i) deliver cash or U.S. Government securities as collateral with respect to each new loan of U.S. securities, equal to at least 102% of the value of the portfolio securities loaned, and (ii) at all times thereafter mark-to-market the collateral on a daily basis so that the market value of such collateral is at least 100% of the value of securities loaned. From time to time the collateral may not be 102% due to end of day market movement. The next business day additional collateral is obtained/received from the borrower to replenish/reestablish 102%. |
| Portfolio Composition * - (Unaudited) | ||||||||||
| Financial | 41.6 | % | Energy | 5.4 | % | |||||
| Consumer, Non-cyclical | 13.4 | % | Technology | 4.8 | % | |||||
| Industrial | 13.2 | % | Basic Materials | 2.2 | % | |||||
| Consumer, Cyclical | 10.7 | % | Communications | 1.6 | % | |||||
| Utilities | 6.1 | % | Other | 1.0 | % | |||||
| Total | 100.0 | % | ||||||||
| * | Based on total value of investments as of October 31, 2019. |
Percentage may differ from Schedule of Investments which are based on Fund net assets.
See accompanying notes to financial statements.
64
| Dunham Small Cap Growth Fund (Unaudited) |
| Message from the Sub-Adviser (Pier Capital, LLC) |
Asset Class Recap
The performance of small cap growth stocks throughout the year can be characterized by strong growth with two significant spikes of volatility in the first fiscal quarter and final fiscal quarter ended October 31, 2019. In the first fiscal quarter, concerns that the Fed was raising rates too quickly came to a precipice as small cap growth stocks fell over 16 percent. To the surprise of many, the Federal Reserve drastically changed its stance by announcing their intention to be patient with future rate rises. Small cap growth stocks reacted positively to the news as they rebounded over 20 percent to finish the first fiscal quarter and rose nearly 9 percent in the subsequent two fiscal quarters. Volatility meaningfully spiked once again in the most recent fiscal quarter as investors became increasingly focused on headlines detailing the lack of progress on global trade and the potential for impeachment hearings regarding President Trump’s dealings with Ukraine. Additionally, incrementally decelerating data points on the economy had investors weighing the possibility of a near-term recession. Over the fiscal year, small cap growth stocks, as measured by the Russell 2000 Growth Index, rose 6.4 percent.
Allocation Review
The sector allocation within the Fund is predominately a result of the Sub-Adviser’s bottom-up stock selection. With that being said, both the Sub-Adviser’s stock selection and sector allocation strongly contributed to Fund performance through the first three fiscal quarters. However, in the final fiscal quarter, the Sub-Adviser’s stock selection and sector allocation detracted from relative Fund performance. The Fund’s largest overweight by a significant margin was to the information technology sector. This overweight strongly contributed to Fund performance through most of the fiscal year, but as the appetite for risk diminished throughout the final fiscal quarter there was a rotation out of higher growth names. Many of these higher growth stocks can be found in the technology sector. The focus shifted to lower -multiple, value-oriented names, and stocks considered to be defensive. Despite the shift in market sentiment, the Sub-Adviser does not believe that shifting to a defensive positioning would be wise at this time. While there is a current slowdown in demand for cyclical products, the appetite for products with secular catalysts are likely to remain robust as companies recognize that is not only beneficial, but also imperative to continue the digital transformation required to continue to grow revenue, while simultaneously cutting costs and expanding profit margins.
Holdings Insights
Despite the Fund being underweight the industrial sector, two of the best performing positions within the Fund over the most recent fiscal quarter and fiscal year came from this sector. An example was Saia, Inc. (SAIA) (holding weight*: 1.05 percent), a less-than-truckload carrier, which has meaningful exposure to the secular ecommerce trend. Additionally, the Sub-Adviser believes they are still in the early innings of growing out their Northeast U.S. footprint, which serves as an additional catalyst for growth. In the most recent fiscal quarter SAIA increased 16.9 percent, and 41.9 percent for the full fiscal year. Another contributor from the industrial sector was Trex Company, Inc. (TREX) (holding weight*: 1.03 percent). TREX is a well-established manufacturer of composite decking materials that consists mostly of reclaimed wood fiber and recycled plastic film. TREX’s products have a reputation for longevity and low maintenance but also carry a significant price premium versus traditional wood products. TREX increased 7.5 percent and 26.7 percent since it was purchased into the Fund in early April.
As previously mentioned, the technology sector strongly contributed to Fund performance over the first three fiscal quarters of the year but detracted from performance in the most recent fiscal quarter. This was the case with Bandwidth Inc. (BAND) (holding weight*: 1.01 percent), a cloud-based software communications platform-as-a-service provider in the U.S. BAND increased 39.6 percent through the third fiscal quarter but declined 24.6 percent in the most recent fiscal quarter. A position that detracted from Fund performance in the most recent fiscal quarter and the fiscal year was Atlas Air Worldwide Holdings Inc. (AAWW) (holding weight**: 0.98 percent). AAWW is an operator of a cargo airline. The company counts several high-profile clients, including the Department of Defense and Amazon Inc. (AMZN) (holding weight: not held). The Sub-Adviser was bullish on AAWW with the expectations that as AMZN vertically integrated AAWW into transportation/logistic capabilities away from other carriers, AAWW would be a significant beneficiary. Unfortunately, the company faced execution issues in 2019. Those issues, coupled with a pilot strike, resulted in AMZN redirecting some volume to a competitor. Over the most recent fiscal quarter and fiscal year, until it was eliminated from the Fund, AAWW declined 46.3 percent and 52.5 percent, respectively.
Sub-Adviser Outlook
The Sub-Adviser does not forecast. The Sub-Adviser’s investment approach involves a thorough understanding of each stock’s value proposition and risk. However, the Sub-Adviser perpetually monitors the effects of these macro themes on each underlying position within the Fund. The Sub-Adviser is keeping a close eye on updates to global trade, health care policies, and infrastructure spending to evaluate current positions and identify future opportunities.
| * | Holdings percentage(s) of total investments, excluding collateral for securities loaned, as of 10/31/2019. |
| ** | Holdings percentage(s) as of the date prior to the sale of the security. |
Growth of $100,000 Investment
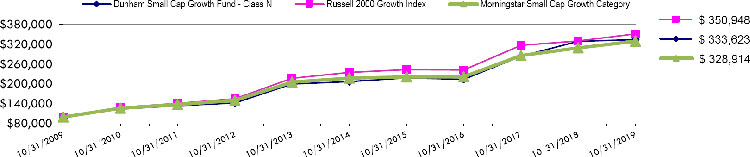
| Total Returns(a) as of October 31, 2019 | |||||||
| Annualized | Annualized | ||||||
| One Year | Five Years | Ten Years | |||||
| Class N | 1.49% | 10.02% | 12.80% | ||||
| Class C | 0.45% | 8.92% | 11.68% | ||||
| Class A with load of 5.75% | (4.56)% | 8.45% | 11.85% | ||||
| Class A without load | 1.24% | 9.75% | 12.52% | ||||
| Russell 2000 Growth Index | 6.40% | 8.38% | 13.38% | ||||
| Morningstar Small Cap Growth Category | 6.62% | 8.61% | 12.64% | ||||
| (a) | Total Returns are calculated based on traded NAVs. |
The Russell 2000 Growth Index measures the performance of the Russell 2000 companies with higher price-to-book ratios and higher forecasted growth values. Investors cannot invest directly in an index or benchmark.
The Morningstar Small Cap Growth Category is generally representative of mutual funds that primarily invest in small (small capitalization) U.S. companies that are projected to grow faster than other small-cap stocks.
As disclosed in the Trust’s latest registration statement, the Fund’s total annual operating expenses, including the cost of underlying funds, are 1.95% for Class N, 2.95% for Class C and 2.20% for Class A. Class A shares are subject to a sales load of 5.75% and a deferred sales charge of up to 0.75%. The performance data quoted here represents past performance, which is not indicative of future results. Current performance may be lower or higher than the performance data quoted. The investment return and NAV will fluctuate, so that an investor’s shares, when redeemed, may be worth more or less than their original cost. Total returns are calculated assuming reinvestment of all dividends and capital gains distributions, if any. The returns do not reflect the deductions of taxes a shareholder would pay on the redemption of Fund shares or Fund distributions. For performance information current to the most recent month-end, please call 1-800-442-4358 or visit our website www.dunham.com
65
| SCHEDULE OF INVESTMENTS |
| Dunham Small Cap Growth Fund |
| October 31, 2019 |
| Security | Shares | Value | ||||||
| COMMON STOCKS - 95.2% | ||||||||
| ADVERTISING - 1.0% | ||||||||
| Trade Desk, Inc. * | 2,483 | $ | 498,586 | |||||
| AEROSPACE/DEFENSE - 2.1% | ||||||||
| Kratos Defense & Security Solutions, Inc. * | 28,892 | 545,481 | ||||||
| Mercury Systems, Inc. * | 7,017 | 516,872 | ||||||
| 1,062,353 | ||||||||
| APPAREL - 1.4% | ||||||||
| Canada Goose Holdings, Inc. * | 10,279 | 429,971 | ||||||
| Crocs, Inc. * | 7,242 | 253,398 | ||||||
| 683,369 | ||||||||
| AUTO PARTS & EQUIPMENT - 0.5% | ||||||||
| Methode Electronics, Inc. | 7,725 | 265,740 | ||||||
| BANKS - 3.7% | ||||||||
| First Merchants Corp. | 17,421 | 689,001 | ||||||
| Seacoast Banking Corp. of Florida * | 17,848 | 499,744 | ||||||
| United Community Banks, Inc. | 22,341 | 674,922 | ||||||
| 1,863,667 | ||||||||
| BIOTECHNOLOGY - 4.7% | ||||||||
| Biohaven Pharmaceutical Holding Co. Ltd. * | 8,062 | 370,207 | ||||||
| Emergent BioSolutions, Inc. * | 9,618 | 549,765 | ||||||
| Exact Sciences Corp. * | 3,146 | 273,702 | ||||||
| Guardant Health, Inc. * | 6,254 | 434,653 | ||||||
| Livongo Health, Inc. * ^ | 23,447 | 506,221 | ||||||
| REGENXBIO, Inc. * | 6,799 | 242,656 | ||||||
| 2,377,204 | ||||||||
| BUILDING MATERIALS - 1.0% | ||||||||
| Trex Co., Inc. * | 5,954 | 523,297 | ||||||
| CHEMICALS - 0.9% | ||||||||
| Rogers Corp. * | 3,480 | 471,470 | ||||||
| COMMERICAL SERVICES - 3.6% | ||||||||
| Avalara, Inc. * | 6,991 | 496,361 | ||||||
| Chegg, Inc. * | 9,227 | 282,900 | ||||||
| HealthEquity, Inc. * | 6,242 | 354,483 | ||||||
| K12, Inc. * | 11,670 | 230,949 | ||||||
| LiveRamp Holdings, Inc. * | 11,827 | 462,317 | ||||||
| 1,827,010 | ||||||||
| COMPUTERS - 5.4% | ||||||||
| Cubic Corp. | 8,803 | 649,133 | ||||||
| Elastic NV * | 6,365 | 458,344 | ||||||
| Globant SA * | 4,657 | 434,312 | ||||||
| Vocera Communications, Inc. * | 12,719 | 253,363 | ||||||
| WNS Holdings Ltd. - ADR * | 9,223 | 570,350 | ||||||
| Zscaler, Inc. * | 7,744 | 340,581 | ||||||
| 2,706,083 | ||||||||
| COSMETICS/PERSONAL CARE - 0.3% | ||||||||
| Inter Parfums, Inc. | 1,602 | 124,043 | ||||||
| DISTRIBUTION/WHOLESALE - 1.3% | ||||||||
| SiteOne Landscape Supply, Inc. * ^ | 7,298 | 642,662 | ||||||
| DIVERSIFIED FINANCIAL SERVICES - 4.6% | ||||||||
| Evercore, Inc. | 8,368 | 616,220 | ||||||
| Houlihan Lokey, Inc. | 12,868 | 608,142 | ||||||
| LendingTree, Inc. * | 1,573 | 566,044 | ||||||
| Moelis & Co. | 14,602 | 520,999 | ||||||
| 2,311,405 | ||||||||
See accompanying notes to financial statements.
66
| SCHEDULE OF INVESTMENTS |
| Dunham Small Cap Growth Fund (Continued) |
| October 31, 2019 |
| Security | Shares | Value | ||||||
| COMMON STOCKS - 95.2% (Continued) | ||||||||
| ELECTRICAL COMPONENTS & EQUIPMENT - 0.5% | ||||||||
| Littelfuse, Inc. | 1,374 | $ | 241,233 | |||||
| ELECTRONICS - 0.5% | ||||||||
| Woodward, Inc. | 2,429 | 259,077 | ||||||
| ENGINEERING & CONSTRUCTION - 1.0% | ||||||||
| Primoris Services Corp. | 24,517 | 501,128 | ||||||
| ENTERTAINMENT - 1.0% | ||||||||
| Red Rock Resorts, Inc. | 23,435 | 510,414 | ||||||
| FOOD - 1.2% | ||||||||
| Grocery Outlet Holding Corp. * | 18,881 | 602,304 | ||||||
| HEALTHCARE-PRODUCTS - 5.6% | ||||||||
| Cerus Corp. * | 82,643 | 359,497 | ||||||
| Glaukos Corp. * | 4,546 | 290,171 | ||||||
| Inspire Medical Systems, Inc. * | 4,100 | 250,018 | ||||||
| Insulet Corp. * | 2,359 | 342,810 | ||||||
| iRhythm Technologies, Inc. * | 4,914 | 328,354 | ||||||
| Repligen Corp. * | 4,433 | 352,379 | ||||||
| Shockwave Medical, Inc. * ^ | 11,057 | 376,159 | ||||||
| Tandem Diabetes Care, Inc. * | 9,040 | 556,683 | ||||||
| 2,856,071 | ||||||||
| HEALTHCARE-SERVICES - 4.3% | ||||||||
| Addus HomeCare Corp. * | 7,329 | 617,175 | ||||||
| Amedisys, Inc. * | 3,374 | 433,627 | ||||||
| Catalent, Inc. * | 11,654 | 566,967 | ||||||
| LHC Group, Inc. * | 5,054 | 560,842 | ||||||
| 2,178,611 | ||||||||
| HOME BUILDERS - 3.9% | ||||||||
| Century Communities, Inc. * | 11,392 | 343,697 | ||||||
| Installed Building Products, Inc. * | 8,593 | 560,435 | ||||||
| LGI Homes, Inc. * | 7,256 | 569,451 | ||||||
| Skyline Corp. * | 17,193 | 485,358 | ||||||
| 1,958,941 | ||||||||
| INTERNET - 8.7% | ||||||||
| Cadlytics, Inc. * | 13,642 | 571,736 | ||||||
| Chewy, Inc. * ^ | 24,202 | 597,063 | ||||||
| Okta, Inc. * | 2,490 | 271,584 | ||||||
| Pinterest, Inc. * | 12,758 | 320,736 | ||||||
| Q2 Holdings, Inc. * | 6,768 | 483,844 | ||||||
| Spotify Technology SA * | 4,461 | 643,722 | ||||||
| Stitch Fix, Inc. * ^ | 17,311 | 395,729 | ||||||
| Wix.com Ltd. * | 4,278 | 522,216 | ||||||
| Zendesk, Inc. * | 8,330 | 588,515 | ||||||
| 4,395,145 | ||||||||
| LODGING - 1.5% | ||||||||
| Boyd Gaming Corp. | 28,755 | 783,574 | ||||||
| MACHINERY-CONSTRUCTION/MINING - 0.6% | ||||||||
| BWX Technologies, Inc. | 5,174 | 300,609 | ||||||
| MISCELLANEOUS MANUFACTURING - 1.1% | ||||||||
| ESCO Technologies, Inc. | 6,574 | 555,437 | ||||||
| OIL & GAS - 0.6% | ||||||||
| Matador Resources Co. * ^ | 23,709 | 329,792 | ||||||
See accompanying notes to financial statements.
67
| SCHEDULE OF INVESTMENTS |
| Dunham Small Cap Growth Fund (Continued) |
| October 31, 2019 |
| Security | Shares | Value | ||||||
| COMMON STOCKS - 95.2% (Continued) | ||||||||
| PHARMACEUTICALS - 1.6% | ||||||||
| DexCom, Inc. * | 1,798 | $ | 277,324 | |||||
| Heron Therapeutics, Inc. * | 24,476 | 520,115 | ||||||
| 797,439 | ||||||||
| REAL ESTATE - 0.8% | ||||||||
| Marcus & Millichap, Inc. * | 12,068 | 431,069 | ||||||
| RETAIL - 6.9% | ||||||||
| Casey’s General Stores, Inc. | 3,836 | 655,227 | ||||||
| Floor & Décor Holdings, Inc. * | 7,475 | 342,579 | ||||||
| Freshpet, Inc. * | 9,719 | 507,915 | ||||||
| Hudson Ltd. * | 40,661 | 505,010 | ||||||
| National Vision Holdings, Inc. * | 13,354 | 317,825 | ||||||
| Ollie’s Bargain Outlet Holdings, Inc. * | 5,706 | 364,499 | ||||||
| Texas Roadhouse, Inc. | 6,943 | 392,280 | ||||||
| Wingstop, Inc. | 4,829 | 402,883 | ||||||
| 3,488,218 | ||||||||
| SEMICONDUCTORS - 4.0% | ||||||||
| Impinj, Inc. * | 11,871 | 390,497 | ||||||
| Lattice Semiconductor Corp. * | 26,978 | 528,499 | ||||||
| Semtech Corp. * | 10,276 | 518,527 | ||||||
| Silicon Laboratories, Inc. * | 5,355 | 568,915 | ||||||
| 2,006,438 | ||||||||
| SOFTWARE - 15.8% | ||||||||
| Altair Engineering, Inc. * | 7,701 | 283,936 | ||||||
| Alteryx, Inc. * | 3,554 | 325,191 | ||||||
| Appfolio, Inc. * | 3,903 | 379,489 | ||||||
| Appian Corp. * | 11,835 | 528,314 | ||||||
| Atlassian Corp. PLC * | 2,234 | 269,845 | ||||||
| Bandwidth, Inc. * | 9,177 | 515,289 | ||||||
| Blackline, Inc. * | 9,611 | 449,218 | ||||||
| Coupa Software, Inc. * | 2,609 | 358,711 | ||||||
| Everbridge, Inc. * | 5,211 | 362,217 | ||||||
| Five9, Inc. * | 9,564 | 530,898 | ||||||
| LivePerson, Inc. * | 7,119 | 292,235 | ||||||
| MongoDB, Inc. * | 2,796 | 357,245 | ||||||
| Omnicell, Inc. * | 3,515 | 247,421 | ||||||
| Pluralsight, Inc. * | 21,180 | 382,934 | ||||||
| PROS Holdings, Inc. * | 8,748 | 448,248 | ||||||
| ServiceNow, Inc. * | 1,420 | 351,109 | ||||||
| Smartsheet, Inc. * | 13,653 | 537,928 | ||||||
| Tabula Rasa HealthCare, Inc. * ^ | 9,145 | 465,846 | ||||||
| Twilio, Inc. * | 4,013 | 387,495 | ||||||
| Yext, Inc. * | 30,830 | 507,462 | ||||||
| 7,981,031 | ||||||||
| STORAGE/WAREHOUSING - 0.5% | ||||||||
| Mobile Mini, Inc. | 6,609 | 248,631 | ||||||
| TOYS/GAMES/HOBBIES - 0.5% | ||||||||
| Funko, Inc. * | 14,197 | 255,546 | ||||||
| TRANSPORTATION - 4.1% | ||||||||
| Air Transport Services Group, Inc. * | 28,254 | 590,791 | ||||||
| CryoPort, Inc. * | 24,585 | 344,928 | ||||||
| Marten Transport Ltd. | 28,776 | 623,288 | ||||||
| Saia, Inc. * | 6,001 | 535,289 | ||||||
| 2,094,296 | ||||||||
| TOTAL COMMON STOCKS (Cost - $42,901,436) | 48,131,893 | |||||||
See accompanying notes to financial statements.
68
| SCHEDULE OF INVESTMENTS |
| Dunham Small Cap Growth Fund (Continued) |
| October 31, 2019 |
| Security | Shares | Interest Rate % | Value | |||||||||
| SHORT-TERM INVESTMENT - 0.0% | ||||||||||||
| MONEY MARKET FUND - 0.0% | ||||||||||||
| Fidelity Investments Money Market - Class I | 22,769 | 1.72 + | $ | 22,769 | ||||||||
| TOTAL SHORT-TERM INVESTMENT (Cost - $22,769) | ||||||||||||
| COLLATERAL FOR SECURITIES LOANED - 4.2% | ||||||||||||
| HSBC US Government Money Market Fund - Class I # | 1,113,441 | 1.72 + | 1,113,441 | |||||||||
| Morgan Stanley Institutional Liquidity Fund Prime Portfolio - Class Institutional # | 1,010,439 | 1.94 + | 1,011,146 | |||||||||
| TOTAL COLLATERAL FOR SECURITIES LOANED (Cost - $2,123,880) | 2,124,587 | |||||||||||
| TOTAL INVESTMENTS - 99.4% (Cost - $45,048,085) | $ | 50,279,249 | ||||||||||
| OTHER ASSETS IN EXCESS OF LIABILITIES - 0.6% | 297,299 | |||||||||||
| TOTAL NET ASSETS - 100.00% | $ | 50,576,548 | ||||||||||
ADR - American Depositary Receipt.
PLC - Public Limited Company
| ^ | All or a portion of these securities are on loan. Total loaned securities had a value of $2,069,994 at October 31, 2019. |
| # | The Trust’s securities lending policies and procedures require that the borrower: (i) deliver cash or U.S. Government securities as collateral with respect to each new loan of U.S. securities, equal to at least 102% of the value of the portfolio securities loaned, and (ii) at all times thereafter mark-to-market the collateral on a daily basis so that the market value of such collateral is at least 100% of the value of securities loaned. From time to time the collateral may not be 102% due to end of day market movement. The next business day additional collateral is obtained/received from the borrower to replenish/reestablish 102%. |
| * | Non-Income producing security. |
| + | Variable rate security. Interest rate is as of October 31, 2019. |
| Portfolio Composition * - (Unaudited) | ||||||||||
| Technology | 25.3 | % | Financial | 9.2 | % | |||||
| Consumer, Non-Cyclical | 21.4 | % | Collateral For Securities Loaned | 4.2 | % | |||||
| Consumer, Cyclical | 17.6 | % | Basic Materials | 0.9 | % | |||||
| Industrial | 11.0 | % | Energy | 0.7 | % | |||||
| Communications | 9.7 | % | Short-Term Investment | 0.0 | % | |||||
| Total | 100.0 | % | ||||||||
| * | Based on total value of investments as of October 31, 2019. |
Percentage may differ from Schedule of Investments which are based on Fund net assets.
See accompanying notes to financial statements.
69
| Dunham Emerging Markets Stock Fund (Unaudited) |
| Message from the Sub-Adviser (NS Partners Ltd.) |
Asset Class Recap
Emerging markets stocks, as measured by the MSCI Emerging Markets Index, surged 13.8 percent in the first half of the fiscal year. The surge started the fiscal year with most emerging markets countries in positive territory, some up as much as 26 percent. Only Taiwan, United Arab Emirates, Pakistan, and Greece failed to end the most recent fiscal quarter in the black. Geopolitical concerns highlighted the emerging markets asset class to begin the third fiscal quarter. Among others, headlines weighing on investors were the escalated U.S.-China trade war, tensions flared in the Gulf, and mass protests in Hong Kong amid the announcement of an extradition agreement with China. Subsequently, investors’ pessimism turned to optimism as the U.S. Federal Reserve boosted markets by indicating a more dovish monetary policy. Volatility once again spiked to begin the most recent fiscal quarter amid a breakdown in the U.S.-China trade negotiations. Despite the nearly seven percent decline, a global theme of supportive central bank actions helped propel emerging market stocks into positive territory for the final quarter of the fiscal year. Emerging markets stocks, as measured by the MSCI Emerging Markets Index, increased 11.9 percent during the fiscal year.
Allocation Review
During the first five months of the fiscal year, country selection detracted from Fund performance while security selection had a relatively muted impact. The Funds overweight position to Brazil, Argentina, and Indonesia detracted from Fund performance, while the Fund’s underweight to Thailand, South Africa, and Malaysia helped offset some of the decline. Effective April 1, 2019, the Fund was managed by a new Sub-Adviser. This change was the catalyst for larger than normal turnover, and a shift in country allocation to reflect the new Sub-Adviser’s conviction. For the final seven months of the fiscal year and the most recent fiscal quarter, security selection and country allocation both positively contributed to Fund performance. The largest contribution to performance came from the Fund’s allocation to China, which more than made up for the adverse effects of the overweight to India. The Fund also benefited from the allocation to frontier markets and an increased allocation to Taiwan in the most recent fiscal quarter. From a sector perspective, the Fund received strong contributions from the consumer discretionary and technology sectors, while the energy and real estate sector exposures detracted.
Holdings Insights
Security selection in China and Taiwan strongly contributed to Fund performance. From China, Li Ning Co. LTD (2331 HK) (holding weight*: 2.37 percent), a leading sports brand company, mainly providing sporting goods including footwear, apparel, and equipment, was the strongest contributor to Fund performance over the most recent fiscal quarter. The Sub-Adviser believes that this is the best local sportswear brand in China. The founder has regained control of the company, and instilled good brand awareness while improving cash flow and inventory controls. Additionally, the Chinese consumer is becoming wealthier, and they are spending a portion of that income on “athleisure.” 2331 HK increased 37.2 percent over the most recent fiscal quarter and 210.4 percent since being added to the Fund in the first fiscal quarter. In Taiwan, some companies are benefitting from a global supply chain shift as a result of the trade war and the 5G expansion, which is occurring in China much sooner than anticipated. The Sub-Adviser identified MediaTek Inc. (2454 TT) (holding weight*: 7.87 percent) as a beneficiary of these shifts early in the third quarter and has positively contributed to Fund performance. Since being added to the Fund in mid-June, 2454 TT increased 39.8 percent and increased 22.3 percent in the most recent fiscal quarter.
A position from Taiwan that detracted from Fund performance was Chain Life Insurance Co Ltd (2628 HK) (holding weight**: 0.11 percent). This position detracted 9.9 percent in the most recent fiscal quarter and 14.3 percent since being added in the portfolio in the second fiscal quarter. Security selection in India also detracted from performance. Lemon Tree Hotels Ltd (BF2LSQ7 IN) (holding weight*: 2.27 percent) a mid-priced hotel chain, declined 28.9 percent since it was initiated into the portfolio in early April and 0.9 percent in the most recent fiscal quarter. The Sub-Adviser still believes the fundamentals are strong with this company. The Sub-Adviser believes that the adverse quarter was the result of macro concerns limiting the amount of business travel to India. In India, mid-priced hotels have been undersupplied for the last 10 years and demand for this segment has been surging due to the increase in business.
Sub-Adviser Outlook
The Sub-Adviser’s outlook has improved over the most recent fiscal quarter, but it cautiously monitors geopolitical developments and economic data. The Sub-Adviser believes that global economic momentum will likely remain weak through the beginning of 2020. The Sub-Adviser is keeping a close eye on the labor markets and tightening financial conditions in China. The Sub-Adviser believes that both the global industrial cycle and commodity prices may be bottoming. Despite these concerns, the Sub-Adviser is cautiously optimistic moving forward and will continue to focus on companies with impressive returns on invested capital and emphasize companies that it believes are beneficiaries of structural change.
| * | Holdings percentage(s) of total investments, excluding collateral for securities loaned, as of 10/31/2019. |
| ** | Holdings percentage(s) as of the date prior to the sale of the security. |
Growth of $100,000 Investment
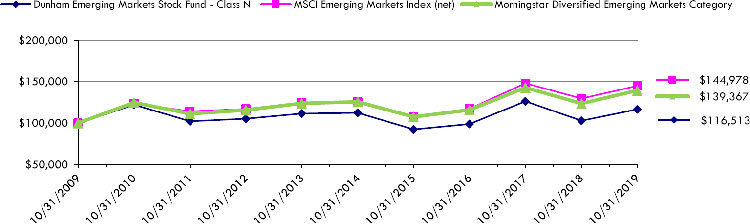
| Total Returns(a) as of October 31, 2019 | |||||||
| Annualized | Annualized | ||||||
| One Year | Five Years | Ten Years | |||||
| Class N | 13.29% | 0.74% | 1.54% | ||||
| Class C | 12.18% | (0.25)% | 0.53% | ||||
| Class A with load of 5.75% | 6.46% | (0.68)% | 0.70% | ||||
| Class A without load | 12.98% | 0.50% | 1.30% | ||||
| MSCI Emerging Markets Index (net) | 11.86% | 2.93% | 3.78% | ||||
| Morningstar Diversified Emerging Markets Category | 12.70% | 2.11% | 3.38% | ||||
| (a) | Total Returns are calculated based on traded NAVs. |
The MSCI Emerging Markets Index (net) is a free float-adjusted market capitalization index that is designed to measure equity market performance in the global emerging markets. Investors cannot invest directly in an index or benchmark.
The Morningstar Diversified Emerging Markets Category is generally representative of mutual funds that primarily invest among 20 or more developing nations, with a general focus on the emerging markets of Asia and Latin America rather than on the emerging markets countries in the Middle East, Africa, or Europe.
As disclosed in the Trust’s latest registration statement, the Fund’s total annual operating expenses, including underlying funds, are 1.52% for Class N, 2.52% for Class C and 1.77% for Class A. Class A shares are subject to a sales load of 5.75% and a deferred sales charge of up to 0.75%. The performance data quoted here represents past performance, which is not indicative of future results. Current performance may be lower or higher than the performance data quoted. The investment return and NAV will fluctuate, so that an investor’s shares, when redeemed, may be worth more or less than their original cost. Total returns are calculated assuming reinvestment of all dividends and capital gains distributions, if any. The returns do not reflect the deductions of taxes a shareholder would pay on the redemption of Fund shares or Fund distributions. For performance information current to the most recent month-end, please call 1-800-442-4358 or visit our website www.dunham.com.
70
| SCHEDULE OF INVESTMENTS |
| Dunham Emerging Markets Stock Fund |
| October 31, 2019 |
| Security | Shares | Value | ||||||
| COMMON STOCKS - 96.4% | ||||||||
| APPAREL - 1.3% | ||||||||
| Shenzhou International Group Holdings Ltd. | 70,400 | $ | 972,616 | |||||
| AUTO PARTS & EQUIPMENT - 1.6% | ||||||||
| Minth Group Ltd. | 336,000 | 1,188,228 | ||||||
| BANKS - 15.4% | ||||||||
| Banco Bradesco SA - ADR ^ | 125,900 | 1,102,884 | ||||||
| Banco Santander Chile - ADR | 34,000 | 823,820 | ||||||
| Bank of the Philippine Islands | 303,150 | 579,163 | ||||||
| Bank Rakyat Indonesia Persero Tbk PT | 2,843,400 | 851,983 | ||||||
| China Construction Bank Corp. | 1,134,000 | 908,438 | ||||||
| China Merchants Bank Co. Ltd. | 213,000 | 1,015,619 | ||||||
| Credicorp Ltd. | 3,200 | 684,928 | ||||||
| FirstRand Ltd. | 148,650 | 644,617 | ||||||
| Grupo Financiero Banorte SAB de CV | 105,600 | 579,335 | ||||||
| HDFC Bank Ltd. | 33,417 | 578,993 | ||||||
| ICICI Bank Ltd. - ADR ^ | 64,900 | 845,647 | ||||||
| Itau Unibanco Holding SA - ADR | 50,000 | 451,500 | ||||||
| Santander Bank Polska SA * | 5,490 | 451,032 | ||||||
| Sberbank of Russia PJSC * | 77,535 | 1,139,765 | ||||||
| Standard Bank Group Ltd. | 82,001 | 944,329 | ||||||
| 11,602,053 | ||||||||
| BEVERAGES - 1.9% | ||||||||
| Fomento Economico Mexicano SAB de CV - ADR ^ | 7,800 | 694,356 | ||||||
| Varun Beverages Ltd. | 82,017 | 716,243 | ||||||
| 1,410,599 | ||||||||
| BUILDING MATERIALS - 0.9% | ||||||||
| Anhui Conch Cement Co. Ltd. | 108,500 | 648,331 | ||||||
| CHEMICALS - 0.9% | ||||||||
| LG Chem Ltd. | 2,388 | 630,062 | ||||||
| COMMERCIAL SERVICES - 1.5% | ||||||||
| China Education Group Holdings Ltd. | 767,000 | 1,145,475 | ||||||
| COMPUTERS - 1.1% | ||||||||
| Venustech Group, Inc. | 185,600 | 870,787 | ||||||
| DIVERSIFIED FINANCIAL SERVICES - 5.5% | ||||||||
| China International Capital Corp Ltd. - 144A | 228,000 | 415,653 | ||||||
| Housing Development Finance Corp. Ltd. | 82,797 | 2,484,909 | ||||||
| KB Financial Group, Inc. | 20,873 | 751,416 | ||||||
| Tisco Financial Group PCL | 148,400 | 479,071 | ||||||
| 4,131,049 | ||||||||
| ELECTRONICS - 0.7% | ||||||||
| Hangzhou Hikvision Digital Technology Co. Ltd. | 122,022 | 559,251 | ||||||
| ENGINEERING & CONSTRUCTION - 0.9% | ||||||||
| Mytilineos Holdings SA | 62,652 | 686,841 | ||||||
| ENTERTAINMENT - 0.6% | ||||||||
| OPAP SA | 38,693 | 420,935 | ||||||
| FOOD - 1.0% | ||||||||
| China Mengniu Dairy Co. Ltd. | 192,000 | 765,284 | ||||||
| HOME FURNISHINGS - 1.8% | ||||||||
| Hangzhou Robam Appliances Co. Ltd. | 160,572 | 718,213 | ||||||
| Midea Group Co. Ltd. | 85,087 | 670,521 | ||||||
| 1,388,734 | ||||||||
| INSURANCE - 6.5% | ||||||||
| AIA Group Ltd. | 209,600 | 2,086,778 | ||||||
| Odontoprev SA * | 86,400 | 320,901 | ||||||
| Security | Shares | Value | ||||||||||
| INSURANCE - 6.5% (Continued) | ||||||||||||
| Ping An Insurance Group Co. of China Ltd. | 157,500 | $ | 1,817,426 | |||||||||
| Powszechny Zaklad Ubezpieczen SA * | 23,241 | 225,238 | ||||||||||
| Samsung Life Insurance Co. Ltd. | 6,858 | 416,469 | ||||||||||
| 4,866,812 | ||||||||||||
| INTERNET- 11.9% | ||||||||||||
| Alibaba Group Holding Ltd. * | 23,600 | 4,169,412 | ||||||||||
| JD.com, Inc. * | 33,600 | 1,046,640 | ||||||||||
| Naspers Ltd. | 3,500 | 496,826 | ||||||||||
| Pinduoduo, Inc. * ^ | 11,000 | 449,680 | ||||||||||
| Tencent Holdings Ltd. | 60,600 | 2,457,564 | ||||||||||
| Yandex NV * ^ | 12,000 | 400,680 | ||||||||||
| 9,020,802 | ||||||||||||
| IRON/STEEL 0.4% | ||||||||||||
| Kumba Iron Ore Ltd. | 11,000 | 268,862 | ||||||||||
| LODGING - 4.6% | ||||||||||||
| Lemon Tree Hotels Ltd.- 144A * | 1,964,995 | 1,690,027 | ||||||||||
| Minor International PCL | 1,021,700 | 1,218,122 | ||||||||||
| Wynn Macau Ltd. | 272,800 | 591,866 | ||||||||||
| 3,500,015 | ||||||||||||
| IRON/STEEL- 0.8% | ||||||||||||
| Jiangxi Copper Co. Ltd. | 524,000 | 613,325 | ||||||||||
| MISCELLANEOUS MANUFACTURING - 1.1% | ||||||||||||
| Airtac International Group | 60,000 | 815,440 | ||||||||||
| OIL & GAS - 5.9% | ||||||||||||
| LUKOIL PJSC - ADR | 13,000 | 1,195,480 | ||||||||||
| Oil & Natural Gas Corp. Ltd. | 552,260 | 1,102,238 | ||||||||||
| PTT Exploration & Production PCL | 217,300 | 866,919 | ||||||||||
| Reliance Industries Ltd. * | 64,663 | 1,332,789 | ||||||||||
| 4,497,426 | ||||||||||||
| REAL ESTATE - 2.7% | ||||||||||||
| Ayala Corp. | 40,780 | 690,456 | ||||||||||
| China Overseas Land & Investment Ltd. | 284,000 | 895,960 | ||||||||||
| Pakuwon Jati Tbk PT | 10,525,700 | 468,425 | ||||||||||
| 2,054,841 | ||||||||||||
| RETAIL - 4.8% | ||||||||||||
| Atacadao SA | 141,000 | 674,021 | ||||||||||
| Li Ning Co. Ltd. | 521,000 | 1,766,224 | ||||||||||
| Lojas Renner SA * | 94,670 | 1,200,119 | ||||||||||
| 3,640,364 | ||||||||||||
| SEMICONDUCTORS - 17.3% | ||||||||||||
| MediaTek, Inc. | 163,000 | 2,176,842 | ||||||||||
| Samsung Electronics Co. Ltd. - ADR - 144A | 511 | 545,748 | ||||||||||
| Samsung Electronics Co. Ltd. | 78,000 | 3,371,148 | ||||||||||
| Samsung Electronics Co. Ltd. | 17,399 | 612,459 | ||||||||||
| SK Hynix, Inc.* | 14,381 | 1,011,214 | ||||||||||
| Taiwan Semiconductor Manufacturing Co. Ltd. - ADR ^ | 48,800 | 2,519,544 | ||||||||||
| Taiwan Semiconductor Manufacturing Co. Ltd. * | 289,000 | 2,832,143 | ||||||||||
| 13,069,098 | ||||||||||||
| SOFTWARE - 2.0% | ||||||||||||
| CD Projekt SA | 11,097 | 733,639 | ||||||||||
| HCL Technologies Ltd. * | 45,767 | 750,448 | ||||||||||
| 1,484,087 | ||||||||||||
| TELECOMMUNICATIONS - 1.3% | ||||||||||||
| Accton Technology Corp. | 169,000 | 1,005,327 | ||||||||||
| WATER - 2.0% | ||||||||||||
| Guangdong Investment Ltd. | 706,000 | 1,527,653 | ||||||||||
| TOTAL COMMON STOCKS (Cost - $67,684,567) | 72,784,297 | |||||||||||
| Interest | Principal | |||||||||||
| Rate % | Amount $ | |||||||||||
| PREFERRED STOCK - 0.7% | ||||||||||||
| OIL & GAS - 0.7% | ||||||||||||
| TATNEFT PJSC | 0.000 | 48,900 | 502,555 | |||||||||
| TOTAL PREFERRED STOCK (Cost - $491,843) | ||||||||||||
See accompanying notes to financial statements.
71
| SCHEDULE OF INVESTMENTS |
| Dunham Emerging Markets Stock Fund (Continued) |
| October 31, 2019 |
| Security | Shares | Value | ||||||
| CLOSED END FUND - 1.0% | ||||||||
| Vietnam Enterprise Investments Limited | 117,461 | $ | 737,174 | |||||
| TOTAL CLOSED END FUND (Cost - $679,829) | ||||||||
| WARRANT - 0.0% | ||||||||
| Minor International PCL - NVDR - Warrant ++ | 51,085 | 5,143 | ||||||
| TOTAL WARRANT(Cost - $0) | ||||||||
| COLLATERAL FOR SECURITIES LOANED - 5.7% | 4,347,391 | 4,347,391 | ||||||
| Mount Vernon Prime Portfolio, 2.04% + # (Cost - $4,347,391) | ||||||||
| TOTAL INVESTMENTS - 103.8% (Cost - $73,203,630) | $ | 78,376,560 | ||||||
| LIABILITIES IN EXCESS OF OTHER ASSETS - (3.8)% | (2,875,715 | ) | ||||||
| NET ASSETS - 100.0% | $ | 75,500,845 | ||||||
ADR - American Depositary Receipt
| * | Non-income producing security |
| ^ | All or a portion of these securities are on loan. Total loaned securities had a value of $4,210,767 at October 31, 2019. |
| + | Variable rate security. Interest rate is as of October 31, 2019. |
| ++ | The value of this security has been determined in good faith under policies of the Board of Trustees. The total of these securities is $5,143 or 0.0% of net assets. |
144A - Security exempt from registration under Rule 144A of the Securities Act of 1933. These securities may be sold in transactions exempt from registration, normally to qualified institutional buyers. The 144A securities amounted to $2,651,428 or 3.5% of net assets.
| # | The Trust’s securities lending policies and procedures require that the borrower: (i) deliver cash or U.S. Government securities as collateral with respect to each new loan of U.S. securities, equal to at least 102% (105% for non US Shares) of the value of the portfolio securities loaned, and (ii) at all times thereafter mark-to-market the collateral on a daily basis so that the market value of such collateral is at least 100% of the value of securities loaned. From time to time the collateral may not be 102% due to end of day market movement. The next business day additional collateral is obtained/received from the borrower to replenish/reestablish 102%. |
| Portfolio Composition * - (Unaudited) | ||||||||||
| China | 25.3 | % | Brazil | 4.8 | % | |||||
| India | 12.1 | % | Russia | 4.1 | % | |||||
| Taiwan | 11.9 | % | Thailand | 3.3 | % | |||||
| South Korea | 9.4 | % | Other Countries ** | 21.9 | % | |||||
| Hong Kong | 7.2 | % | Total | 100.0 | % | |||||
| * | Based on total value of investments as of October 31, 2019. |
| ** | Includes Collateral for Securities Loaned as of October 31, 2019. |
Percentage may differ from Schedule of Investments which is based on Fund net assets.
See accompanying notes to financial statements.
72
| STATEMENTS OF ASSETS AND LIABILITIES |
| October 31, 2019 |
| Dunham | Dunham | Dunham | ||||||||||||||||||||||||||
| Dunham | Dunham | Corporate / | Monthly | Dunham | Dunham | International | ||||||||||||||||||||||
| Floating Rate | Long/Short | Government | Distribution | Dynamic Macro | High-Yield | Opportunity | ||||||||||||||||||||||
| Bond Fund | Credit Fund | Bond Fund | Fund | Fund | Bond Fund | Bond Fund | ||||||||||||||||||||||
| Assets: | ||||||||||||||||||||||||||||
| Investments in securities, at cost | $ | 192,810,860 | $ | 81,239,882 | $ | 48,401,686 | $ | 274,519,642 | $ | 37,555,224 | $ | 106,257,450 | $ | 36,510,648 | ||||||||||||||
| Investments in securities, at value | $ | 187,440,658 | $ | 82,524,301 | $ | 50,711,481 | $ | 282,066,937 | $ | 39,857,318 | $ | 106,905,566 | $ | 37,785,331 | ||||||||||||||
| Cash | 1,952,193 | 3,879,285 | 1,315,797 | 10,786,180 | 1,944,737 | 5,158,480 | 848,771 | |||||||||||||||||||||
| Foreign currency, at value (cost $831 and $57,835, respectively) | — | — | — | — | 777 | — | 58,248 | |||||||||||||||||||||
| Deposits with brokers | — | 103,987 | — | 49,632,668 | — | — | 115,355 | |||||||||||||||||||||
| Unrealized appreciation on forward foreign currency exchange contracts | — | — | — | — | — | — | 152,084 | |||||||||||||||||||||
| Unrealized appreciation on futures | — | 281,265 | — | — | 396,894 | — | 87,417 | |||||||||||||||||||||
| Premiums paid on swap contracts | — | 199,351 | — | — | — | — | — | |||||||||||||||||||||
| Unrealized appreciation on swap contracts | — | 262,909 | — | 109,373 | — | — | — | |||||||||||||||||||||
| Receivable for securities sold | 4,738,478 | — | 913,433 | 19,283,049 | — | 1,058,524 | 632,117 | |||||||||||||||||||||
| Interest and dividends receivable | 521,032 | 466,141 | 366,289 | 348,931 | 5,588 | 1,450,299 | 308,427 | |||||||||||||||||||||
| Receivable for Fund shares sold | 216 | 87,582 | 51 | 17,711 | 1,272 | 112 | 36 | |||||||||||||||||||||
| Prepaid expenses and other assets | 24,253 | 17,751 | 17,979 | 25,785 | 17,946 | 17,377 | 20,856 | |||||||||||||||||||||
| Total Assets | 194,676,830 | 87,822,572 | 53,325,030 | 362,270,634 | 42,224,532 | 114,590,358 | 40,008,642 | |||||||||||||||||||||
| Liabilities: | ||||||||||||||||||||||||||||
| Option contracts written (premiums received $982,329 and $31,783, respectively) | — | — | — | 917,709 | 35,530 | — | — | |||||||||||||||||||||
| Securities sold short (proceeds $72,637,494) | — | — | — | 77,912,516 | — | — | — | |||||||||||||||||||||
| Foreign currency overdraft (proceeds $816,101 and 193,700) | — | — | — | 819,770 | 194,479 | — | — | |||||||||||||||||||||
| Payable for securities purchased | 5,892,653 | 4,727,070 | 319,350 | 18,909,237 | 1,602 | 601,133 | 963,182 | |||||||||||||||||||||
| Payable for Fund shares redeemed | 176,909 | 25,317 | 16,237 | 278,660 | 21,358 | 116,882 | 21,598 | |||||||||||||||||||||
| Distributions payable | 4,372 | 1,801 | 1,468 | 74,632 | — | 6,751 | — | |||||||||||||||||||||
| Payable upon return of securities loaned | — | — | — | 3,284,250 | — | 3,652,325 | — | |||||||||||||||||||||
| Unrealized depreciation on forward foreign currency exchange contracts | — | — | — | — | — | — | 161,236 | |||||||||||||||||||||
| Unrealized depreciation on futures | — | — | — | — | 165,158 | — | 72,624 | |||||||||||||||||||||
| Unrealized depreciation on swap contracts | — | 219,875 | — | 256,872 | — | — | — | |||||||||||||||||||||
| Payable for dividends on short sales | — | — | — | 201,508 | — | — | — | |||||||||||||||||||||
| Payable for interest on short sales | — | — | — | 46,034 | — | — | — | |||||||||||||||||||||
| Premiums received on swap contracts | — | 294,385 | — | — | — | — | — | |||||||||||||||||||||
| Payable to adviser | 95,968 | 45,037 | 22,390 | 143,637 | 22,785 | 56,054 | 19,597 | |||||||||||||||||||||
| Payable to sub-adviser | 40,922 | 31,776 | 8,189 | 41,997 | 39,027 | 7,918 | 7,546 | |||||||||||||||||||||
| Payable for distribution fees | 7,590 | 10,183 | 5,173 | 40,922 | 4,097 | 18,346 | 319 | |||||||||||||||||||||
| Payable for administration fees | 17,357 | 8,114 | 13,281 | 12,984 | 5,413 | 11,533 | 7,938 | |||||||||||||||||||||
| Payable for fund accounting fees | 3,242 | 823 | 848 | 4,756 | 1,162 | 1,872 | 1,008 | |||||||||||||||||||||
| Payable for transfer agent fees | 5,103 | 2,387 | 1,904 | 7,249 | 1,923 | 3,553 | 1,635 | |||||||||||||||||||||
| Payable for custody fees | 9,947 | 1,232 | 7,164 | 11,583 | 1,505 | 2,536 | 8,602 | |||||||||||||||||||||
| Payable for third party administrative servicing fees | 219 | 729 | 69 | 3,881 | 704 | 480 | 490 | |||||||||||||||||||||
| Accrued expenses and other liabilities | 14,692 | 13,816 | 16,825 | 19,210 | 15,312 | 15,661 | 16,670 | |||||||||||||||||||||
| Total Liabilities | 6,268,974 | 5,382,545 | 412,898 | 102,987,407 | 510,055 | 4,495,044 | 1,282,445 | |||||||||||||||||||||
| Net Assets | $ | 188,407,856 | $ | 82,440,027 | $ | 52,912,132 | $ | 259,283,227 | $ | 41,714,477 | $ | 110,095,314 | $ | 38,726,197 | ||||||||||||||
| Net Assets: | ||||||||||||||||||||||||||||
| Paid in capital | $ | 198,226,656 | $ | 80,695,398 | $ | 53,761,839 | $ | 263,270,640 | $ | 40,552,965 | $ | 117,033,567 | $ | 37,529,350 | ||||||||||||||
| Accumulated earnings (loss) | (9,818,800 | ) | 1,744,629 | (849,707 | ) | (3,987,413 | ) | 1,161,512 | (6,938,253 | ) | 1,196,847 | |||||||||||||||||
| Net Assets | $ | 188,407,856 | $ | 82,440,027 | $ | 52,912,132 | $ | 259,283,227 | $ | 41,714,477 | $ | 110,095,314 | $ | 38,726,197 | ||||||||||||||
| Net Asset Value Per Share | ||||||||||||||||||||||||||||
| Class N Shares: | ||||||||||||||||||||||||||||
| Net Assets | $ | 157,757,304 | $ | 67,275,580 | $ | 42,729,986 | $ | 183,318,663 | $ | 32,074,231 | $ | 90,262,113 | $ | 32,926,730 | ||||||||||||||
| Shares of beneficial interest outstanding (no par value; unlimited shares authorized) | 16,859,928 | 7,190,591 | 3,046,935 | 5,410,928 | 3,181,900 | 10,063,859 | 3,491,205 | |||||||||||||||||||||
| Net asset value, offering and redemption price per share | $ | 9.36 | $ | 9.36 | $ | 14.02 | $ | 33.88 | $ | 10.08 | $ | 8.97 | $ | 9.43 | ||||||||||||||
| Class A Shares: | ||||||||||||||||||||||||||||
| Net Assets | $ | 21,996,532 | $ | 11,087,005 | $ | 7,509,677 | $ | 42,051,975 | $ | 7,712,801 | $ | 12,336,283 | $ | 4,357,047 | ||||||||||||||
| Shares of beneficial interest outstanding (no par value; unlimited shares authorized) | 2,353,103 | 1,188,099 | 536,212 | 1,285,649 | 771,066 | 1,361,647 | 466,340 | |||||||||||||||||||||
| Net asset value and redemption price per share * | $ | 9.35 | $ | 9.33 | $ | 14.01 | $ | 32.71 | $ | 10.00 | $ | 9.06 | $ | 9.34 | ||||||||||||||
| Front-end sales charge factor | 0.9550 | 0.9425 | 0.9550 | 0.9425 | 0.9425 | 0.9550 | 0.9550 | |||||||||||||||||||||
| Offering price per share (Net asset value per share / front-end sales charge factor) | $ | 9.79 | $ | 9.90 | $ | 14.67 | $ | 34.71 | $ | 10.61 | $ | 9.49 | $ | 9.78 | ||||||||||||||
| Class C Shares: | ||||||||||||||||||||||||||||
| Net Assets | $ | 8,654,020 | $ | 4,077,442 | $ | 2,672,469 | $ | 33,912,589 | $ | 1,927,445 | $ | 7,496,918 | $ | 1,442,420 | ||||||||||||||
| Shares of beneficial interest outstanding (no par value; unlimited shares authorized) | 925,375 | 449,244 | 192,159 | 1,324,684 | 201,920 | 840,189 | 158,247 | |||||||||||||||||||||
| Net asset value, offering and redemption price per share | $ | 9.35 | $ | 9.08 | $ | 13.91 | $ | 25.60 | $ | 9.55 | $ | 8.92 | $ | 9.11 | ||||||||||||||
| * | For certain purchases of $1 million or more, a 0.75% contingent deferred sales charge may apply to redemptions made within eighteen months of purchase. |
See accompanying notes to financial statements.
73
| STATEMENTS OF ASSETS AND LIABILITIES (Continued) |
| October 31, 2019 |
| Dunham | Dunham | |||||||||||||||||||||||||||
| Dunham | Focused | Dunham | Dunham | Dunham | Dunham | Emerging | ||||||||||||||||||||||
| Large Cap | Large Cap | International | Real Estate | Small Cap | Small Cap | Markets | ||||||||||||||||||||||
| Value Fund | Growth Fund | Stock Fund | Stock Fund | Value Fund | Growth Fund | Stock Fund | ||||||||||||||||||||||
| Assets: | ||||||||||||||||||||||||||||
| Investments in securities, at cost | $ | 65,164,604 | $ | 59,529,708 | $ | 124,730,684 | $ | 42,047,989 | $ | 53,043,958 | $ | 45,048,085 | $ | 73,203,630 | ||||||||||||||
| Investments in securities, at value | $ | 82,859,369 | $ | 105,383,318 | $ | 135,706,365 | $ | 54,258,604 | $ | 56,482,384 | $ | 50,279,249 | $ | 78,376,560 | ||||||||||||||
| Cash | 1,422,378 | 1,943,878 | 645,651 | 636,740 | 402,987 | 2,559,071 | 26,034 | |||||||||||||||||||||
| Foreign currency, at value (cost $156,831 and 399,543, respectively) | — | — | 158,711 | — | — | — | 397,626 | |||||||||||||||||||||
| Receivable for securities sold | 246,980 | — | 951,707 | — | — | 769,460 | 2,369,035 | |||||||||||||||||||||
| Interest and dividends receivable | 108,475 | 14,591 | 676,096 | 21,896 | 17,198 | 7,618 | 67,750 | |||||||||||||||||||||
| Receivable for Fund shares sold | 2,380 | 2,222 | 3,815 | 1,429 | 1,586 | 1,109 | 2,065 | |||||||||||||||||||||
| Prepaid expenses and other assets | 20,349 | 24,944 | 20,440 | 18,921 | 16,479 | 28,250 | 16,873 | |||||||||||||||||||||
| Total Assets | 84,659,931 | 107,368,953 | 138,162,785 | 54,937,590 | 56,920,634 | 53,644,757 | 81,255,943 | |||||||||||||||||||||
| Liabilities: | ||||||||||||||||||||||||||||
| Payable upon return of securities loaned | 1,045,000 | — | 6,325,040 | — | 542,100 | 2,123,880 | 4,347,391 | |||||||||||||||||||||
| Payable for securities purchased | — | — | 1,161,539 | — | — | 866,730 | 935,612 | |||||||||||||||||||||
| Payable for Fund shares redeemed | 30,433 | 76,147 | 95,688 | 29,155 | 34,715 | 12,137 | 49,055 | |||||||||||||||||||||
| Payable to adviser | 45,124 | 57,945 | 70,240 | 30,075 | 30,513 | 27,765 | 40,758 | |||||||||||||||||||||
| Payable to sub-adviser | 27,314 | 30,727 | 31,125 | 15,886 | 35,775 | — | 333,984 | |||||||||||||||||||||
| Payable for distribution fees | 11,405 | 18,278 | 13,174 | — | 5,053 | 12,044 | 7,965 | |||||||||||||||||||||
| Payable for administration fees | 5,511 | 6,186 | 11,199 | 4,546 | 4,534 | 4,381 | 6,222 | |||||||||||||||||||||
| Payable for fund accounting fees | 1,386 | 1,632 | 1,951 | 947 | 896 | 847 | 1,200 | |||||||||||||||||||||
| Payable for transfer agent fees | 2,965 | 883 | 3,667 | 2,311 | 2,295 | 2,329 | 2,375 | |||||||||||||||||||||
| Payable for custody fees | 2,846 | 414 | 21,958 | 1,778 | 2,473 | 2,423 | 14,336 | |||||||||||||||||||||
| Payable for third party administrative servicing fees | 255 | 1,339 | 523 | 300 | 465 | 442 | 131 | |||||||||||||||||||||
| Accrued expenses and other liabilities | 14,966 | 16,375 | 13,597 | 14,832 | 14,997 | 15,231 | 16,069 | |||||||||||||||||||||
| Total Liabilities | 1,187,205 | 209,926 | 7,749,701 | 99,830 | 673,816 | 3,068,209 | 5,755,098 | |||||||||||||||||||||
| Net Assets | $ | 83,472,726 | $ | 107,159,027 | $ | 130,413,084 | $ | 54,837,760 | $ | 56,246,818 | $ | 50,576,548 | $ | 75,500,845 | ||||||||||||||
| Net Assets: | ||||||||||||||||||||||||||||
| Paid in capital | $ | 63,646,269 | $ | 59,285,436 | $ | 121,809,221 | $ | 39,416,887 | $ | 54,054,822 | $ | 46,747,888 | $ | 71,574,605 | ||||||||||||||
| Accumulated earnings | 19,826,457 | 47,873,591 | 8,603,863 | 15,420,873 | 2,191,996 | 3,828,660 | 3,926,240 | |||||||||||||||||||||
| Net Assets | $ | 83,472,726 | $ | 107,159,027 | $ | 130,413,084 | $ | 54,837,760 | $ | 56,246,818 | $ | 50,576,548 | $ | 75,500,845 | ||||||||||||||
| Net Asset Value Per Share | ||||||||||||||||||||||||||||
| Class N Shares: | ||||||||||||||||||||||||||||
| Net Assets | $ | 61,790,592 | $ | 74,714,208 | $ | 101,505,227 | $ | 42,864,867 | $ | 43,563,642 | $ | 37,339,570 | $ | 59,931,017 | ||||||||||||||
| Shares of beneficial interest outstanding (no par value; unlimited shares authorized) | 4,131,278 | 3,082,817 | 6,545,109 | 2,294,138 | 2,969,775 | 2,333,488 | 4,198,355 | |||||||||||||||||||||
| Net asset value, offering and redemption price per share | $ | 14.96 | $ | 24.24 | $ | 15.51 | $ | 18.68 | $ | 14.67 | $ | 16.00 | $ | 14.27 | ||||||||||||||
| Class A Shares: | ||||||||||||||||||||||||||||
| Net Assets | $ | 16,362,722 | $ | 24,130,538 | $ | 22,498,936 | $ | 9,161,099 | $ | 9,848,360 | $ | 10,797,443 | $ | 12,106,402 | ||||||||||||||
| Shares of beneficial interest outstanding (no par value; unlimited shares authorized) | 1,100,209 | 1,017,576 | 1,462,443 | 486,918 | 681,430 | 715,530 | 868,276 | |||||||||||||||||||||
| Net asset value, and redemption price per share * | $ | 14.87 | $ | 23.71 | $ | 15.38 | $ | 18.81 | $ | 14.45 | $ | 15.09 | $ | 13.94 | ||||||||||||||
| Front-end sales charge factor | 0.9425 | 0.9425 | 0.9425 | 0.9425 | 0.9425 | 0.9425 | 0.9425 | |||||||||||||||||||||
| Offering price per share (Net asset value per share / front-end sales charge factor) | $ | 15.78 | $ | 25.16 | $ | 16.32 | $ | 19.96 | $ | 15.33 | $ | 16.01 | $ | 14.79 | ||||||||||||||
| Class C Shares: | ||||||||||||||||||||||||||||
| Net Assets | $ | 5,319,412 | $ | 8,314,281 | $ | 6,408,921 | $ | 2,811,794 | $ | 2,834,816 | $ | 2,439,535 | $ | 3,463,426 | ||||||||||||||
| Shares of beneficial interest outstanding (no par value; unlimited shares authorized) | 375,510 | 373,699 | 440,600 | 158,949 | 226,633 | 211,442 | 263,239 | |||||||||||||||||||||
| Net asset value, offering and redemption price per share | $ | 14.17 | $ | 22.25 | $ | 14.55 | $ | 17.69 | $ | 12.51 | $ | 11.54 | $ | 13.16 | ||||||||||||||
| * | For certain purchases of $1 million or more, a 0.75% contingent deferred sales charge may apply to redemptions made within eighteen months of purchase. |
See accompanying notes to financial statements.
74
| STATEMENTS OF OPERATIONS |
| For the Year Ended October 31, 2019 |
| Dunham | Dunham | Dunham | ||||||||||||||||||||||||||
| Dunham | Dunham | Corporate / | Monthly | Dunham | Dunham | International | ||||||||||||||||||||||
| Floating Rate | Long/Short | Government | Distribution | Dynamic Macro | High-Yield | Opportunity | ||||||||||||||||||||||
| Bond Fund | Credit Fund | Bond Fund | Fund | Fund | Bond Fund | Bond Fund | ||||||||||||||||||||||
| Investment Income: | ||||||||||||||||||||||||||||
| Interest income | $ | 10,468,562 | $ | 2,552,403 | $ | 1,992,630 | $ | 2,395,019 | $ | 480,357 | $ | 6,724,515 | $ | 428,576 | ||||||||||||||
| Dividend income | 20,345 | — | — | 3,618,260 | 648,074 | 37,587 | — | |||||||||||||||||||||
| Securities lending income-net | 1,077 | 4,081 | 877 | 8,826 | 18,485 | 27,209 | — | |||||||||||||||||||||
| Less: Foreign withholding taxes | — | — | — | (28,813 | ) | — | — | (30,344 | ) | |||||||||||||||||||
| Total Investment Income | 10,489,984 | 2,556,484 | 1,993,507 | 5,993,292 | 1,146,916 | 6,789,311 | 398,232 | |||||||||||||||||||||
| Operating Expenses: | ||||||||||||||||||||||||||||
| Investment advisory fees | 1,121,127 | 431,695 | 257,260 | 1,743,248 | 264,087 | 653,024 | 224,883 | |||||||||||||||||||||
| Sub-advisory fees | 540,247 | 398,488 | 154,356 | 1,609,152 | 304,716 | 348,279 | 168,662 | |||||||||||||||||||||
| Sub-advisory performance fees | (200,947 | ) | (225,828 | ) | (72,688 | ) | (275,125 | ) | (103,557 | ) | (77,483 | ) | (91,917 | ) | ||||||||||||||
| Fund accounting fees | 37,035 | 12,600 | 9,963 | 53,192 | 8,417 | 21,363 | 7,772 | |||||||||||||||||||||
| Distribution fees- Class C Shares | 61,425 | 35,757 | 20,370 | 347,330 | 17,656 | 55,123 | 10,423 | |||||||||||||||||||||
| Distribution fees- Class A Shares | 52,089 | 21,086 | 14,746 | 106,189 | 18,181 | 30,125 | 10,001 | |||||||||||||||||||||
| Administration fees | 155,729 | 51,939 | 103,124 | 138,789 | 32,759 | 96,931 | 56,364 | |||||||||||||||||||||
| Registration fees | 42,616 | 54,035 | 49,251 | 55,264 | 44,264 | 52,285 | 37,350 | |||||||||||||||||||||
| Transfer agent fees | 40,273 | 23,502 | 21,189 | 51,859 | 19,919 | 29,722 | 19,521 | |||||||||||||||||||||
| Custodian fees | 41,363 | 10,333 | 40,556 | 65,199 | 8,245 | 12,278 | 46,381 | |||||||||||||||||||||
| Professional fees | 25,556 | 18,635 | 16,111 | 29,770 | 15,660 | 20,216 | 15,424 | |||||||||||||||||||||
| Chief Compliance Officer fees | 23,149 | 8,059 | 6,592 | 33,343 | 5,376 | 13,782 | 6,059 | |||||||||||||||||||||
| Printing and postage expense | 29,391 | 20,385 | 16,535 | 76,743 | 8,162 | 20,808 | 10,704 | |||||||||||||||||||||
| Trustees’ fees | 12,034 | 4,600 | 3,487 | 16,184 | 3,170 | 7,108 | 2,696 | |||||||||||||||||||||
| Insurance expense | 3,259 | 724 | 952 | 3,074 | 764 | 1,962 | 701 | |||||||||||||||||||||
| Line of credit expense | — | — | 3,118 | 1,013,810 | 142 | — | 579 | |||||||||||||||||||||
| Interest expense | 355 | — | — | 10,458 | 7,811 | 969 | — | |||||||||||||||||||||
| Third party administrative servicing fees | 4,515 | 6,243 | 2,438 | 37,151 | 1,935 | 5,365 | 1,243 | |||||||||||||||||||||
| Dividend expense on short sales | — | — | — | 2,304,719 | — | — | — | |||||||||||||||||||||
| Miscellaneous expenses | 12,993 | 6,744 | 5,279 | 15,563 | 4,736 | 7,391 | 3,640 | |||||||||||||||||||||
| Net Operating Expenses | 2,002,209 | 878,997 | 652,639 | 7,435,912 | 662,443 | 1,299,248 | 530,486 | |||||||||||||||||||||
| Net Investment Income (Loss) | 8,487,775 | 1,677,487 | 1,340,868 | (1,442,620 | ) | 484,473 | 5,490,063 | (132,254 | ) | |||||||||||||||||||
| Realized and Unrealized Gain (Loss) on Investments, Futures, Purchased Options, Securities Sold Short, Written Options, Swap Contracts, Foreign Currency Transactions, and Forward Foreign Currency Exchange Contracts: | ||||||||||||||||||||||||||||
| Net realized gain (loss) from: | ||||||||||||||||||||||||||||
| Investments | (1,573,440 | ) | 2,707,557 | 113,200 | 5,542,612 | 2,356,909 | (1,991,065 | ) | (79,653 | ) | ||||||||||||||||||
| Futures | — | (1,914,195 | ) | — | — | (63,751 | ) | — | 218,469 | |||||||||||||||||||
| Purchased options | — | — | — | 3,258,819 | 661,022 | — | — | |||||||||||||||||||||
| Securities sold short | — | — | — | (5,149,692 | ) | — | — | — | ||||||||||||||||||||
| Written options | — | — | — | (2,155,046 | ) | 183,987 | — | — | ||||||||||||||||||||
| Swap contracts | — | (425,806 | ) | — | 515,796 | — | — | — | ||||||||||||||||||||
| Foreign currency transactions | — | — | — | (271,465 | ) | 25,517 | — | — | ||||||||||||||||||||
| Forward foreign currency exchange contracts | — | — | — | — | — | — | (31,324 | ) | ||||||||||||||||||||
| Net realized gain (loss) | (1,573,440 | ) | 367,556 | 113,200 | 1,741,024 | 3,163,684 | (1,991,065 | ) | 107,492 | |||||||||||||||||||
| Net change in unrealized appreciation (depreciation) on: | ||||||||||||||||||||||||||||
| Investments | (3,869,644 | ) | 1,474,370 | 3,618,411 | 15,593,404 | (1,936,054 | ) | 4,726,623 | 2,366,135 | |||||||||||||||||||
| Futures | — | 159,108 | — | — | 924,345 | — | 20,397 | |||||||||||||||||||||
| Purchased options | — | — | — | (1,410,366 | ) | 280,130 | — | — | ||||||||||||||||||||
| Securities sold short | — | — | — | (7,971,017 | ) | — | — | — | ||||||||||||||||||||
| Written options | — | — | — | (555,567 | ) | (3,205 | ) | — | — | |||||||||||||||||||
| Swap contracts | — | 39,218 | — | (147,499 | ) | — | — | — | ||||||||||||||||||||
| Foreign currency translations | — | — | — | 227,697 | (9,212 | ) | — | 665 | ||||||||||||||||||||
| Forward foreign currency exchange contracts | — | — | — | — | — | — | (91,347 | ) | ||||||||||||||||||||
| Net change in unrealized appreciation (depreciation) | (3,869,644 | ) | 1,672,696 | 3,618,411 | 5,736,652 | (743,996 | ) | 4,726,623 | 2,295,850 | |||||||||||||||||||
| Net Realized and Unrealized Gain (Loss) | (5,443,084 | ) | 2,040,252 | 3,731,611 | 7,477,676 | 2,419,688 | 2,735,558 | 2,403,342 | ||||||||||||||||||||
| Net Increase in Net Assets Resulting From Operations | $ | 3,044,691 | $ | 3,717,739 | $ | 5,072,479 | $ | 6,035,056 | $ | 2,904,161 | $ | 8,225,621 | $ | 2,271,088 | ||||||||||||||
See accompanying notes to financial statements.
75
| STATEMENTS OF OPERATIONS (Continued) |
| For the Year Ended October 31, 2019 |
| Dunham | Dunham | |||||||||||||||||||||||||||
| Dunham | Focused | Dunham | Dunham | Dunham | Dunham | Emerging | ||||||||||||||||||||||
| Large Cap | Large Cap | International | Real Estate | Small Cap | Small Cap | Markets | ||||||||||||||||||||||
| Value Fund | Growth Fund | Stock Fund | Stock Fund | Value Fund | Growth Fund | Stock Fund | ||||||||||||||||||||||
| Investment Income: | ||||||||||||||||||||||||||||
| Interest income | $ | 36,863 | $ | 6,576 | $ | 13,014 | $ | 18,151 | $ | 10,968 | $ | 52,060 | $ | 14,681 | ||||||||||||||
| Dividend income | 1,876,174 | 253,399 | 5,012,665 | 1,633,865 | 842,743 | 172,991 | 2,321,813 | |||||||||||||||||||||
| Securities lending income-net | 2,104 | 3,152 | 38,530 | 2,447 | 3,787 | 40,960 | 6,815 | |||||||||||||||||||||
| Less: Foreign withholding taxes | — | — | (579,462 | ) | — | — | — | (218,198 | ) | |||||||||||||||||||
| Total Investment Income | 1,915,141 | 263,127 | 4,484,747 | 1,654,463 | 857,498 | 266,011 | 2,125,111 | |||||||||||||||||||||
| Operating Expenses: | ||||||||||||||||||||||||||||
| Investment advisory fees | 510,013 | 645,159 | 784,061 | 363,725 | 325,425 | 325,050 | 456,017 | |||||||||||||||||||||
| Sub-advisory fees | 235,390 | 347,393 | 784,061 | 223,831 | 175,229 | 250,038 | 329,678 | |||||||||||||||||||||
| Sub-advisory performance fees | (65,089 | ) | 84,529 | (260,552 | ) | (125,217 | ) | 145,175 | 159,806 | 47,623 | ||||||||||||||||||
| Sub-advisory fees Minimum | — | — | — | — | 50,065 | — | — | |||||||||||||||||||||
| Fund accounting fees | 15,280 | 19,313 | 23,523 | 10,905 | 9,886 | 9,777 | 13,652 | |||||||||||||||||||||
| Distribution fees- Class C Shares | 48,164 | 73,588 | 60,263 | 26,030 | 25,283 | 24,279 | 32,463 | |||||||||||||||||||||
| Distribution fees- Class A Shares | 37,351 | 54,976 | 50,100 | 23,056 | 21,294 | 27,022 | 28,930 | |||||||||||||||||||||
| Administration fees | 47,276 | 56,468 | 113,402 | 37,639 | 36,190 | 36,554 | 54,950 | |||||||||||||||||||||
| Registration fees | 51,288 | 47,572 | 53,160 | 50,410 | 43,702 | 66,482 | 51,862 | |||||||||||||||||||||
| Transfer agent fees | 28,434 | 32,532 | 31,754 | 22,740 | 21,958 | 24,503 | 24,156 | |||||||||||||||||||||
| Custodian fees | 12,006 | 7,659 | 119,284 | 9,128 | 7,835 | 17,881 | 82,172 | |||||||||||||||||||||
| Professional fees | 19,086 | 20,285 | 21,523 | 17,311 | 16,800 | 17,484 | 21,934 | |||||||||||||||||||||
| Chief Compliance Officer fees | 10,086 | 14,798 | 15,492 | 7,396 | 6,439 | 6,269 | 8,679 | |||||||||||||||||||||
| Printing and postage expense | 13,475 | 17,323 | 19,473 | 10,241 | 10,732 | 15,613 | 13,538 | |||||||||||||||||||||
| Trustees’ fees | 5,141 | 6,041 | 7,694 | 3,780 | 3,078 | 3,278 | 4,547 | |||||||||||||||||||||
| Insurance expense | 1,230 | 1,345 | 1,850 | 908 | 670 | 682 | 1,130 | |||||||||||||||||||||
| Interest expense | — | 1,793 | — | 133 | — | 354 | — | |||||||||||||||||||||
| Third party administrative servicing fees | 4,668 | 13,446 | 4,131 | 4,166 | 3,259 | 9,516 | 5,683 | |||||||||||||||||||||
| Line of credit expense | 156 | — | 1,167 | — | 204 | — | 2,807 | |||||||||||||||||||||
| Miscellaneous expenses | 5,727 | 5,913 | 12,155 | 6,806 | 6,560 | 5,242 | 10,247 | |||||||||||||||||||||
| Total Operating Expenses | 979,682 | 1,450,133 | 1,842,541 | 692,988 | 909,784 | 999,830 | 1,190,068 | |||||||||||||||||||||
| Less: Fees paid indirectly | (2,227 | ) | (973 | ) | (1,062 | ) | — | — | (6,128 | ) | — | |||||||||||||||||
| Net Operating Expenses | 977,455 | 1,449,160 | 1,841,479 | 692,988 | 909,784 | 993,702 | 1,190,068 | |||||||||||||||||||||
| Net Investment Income (Loss) | 937,686 | (1,186,033 | ) | 2,643,268 | 961,475 | (52,286 | ) | (727,691 | ) | 935,043 | ||||||||||||||||||
| Realized and Unrealized Gain (Loss) on Investments and Foreign Currency Transactions: | ||||||||||||||||||||||||||||
| Net realized gain (loss) from: | ||||||||||||||||||||||||||||
| Investments | 1,944,710 | 4,250,180 | (4,756,479 | ) | 3,193,888 | (1,163,298 | ) | (118,043 | ) | (842,082 | ) | |||||||||||||||||
| Foreign currency transactions | — | — | (86,899 | ) | — | — | — | (181,728 | ) | |||||||||||||||||||
| Net realized gain (loss) | 1,944,710 | 4,250,180 | (4,843,378 | ) | 3,193,888 | (1,163,298 | ) | (118,043 | ) | (1,023,810 | ) | |||||||||||||||||
| Net change in unrealized appreciation on: | — | — | ||||||||||||||||||||||||||
| Investments | 5,655,326 | 12,506,512 | 10,779,871 | 7,934,838 | 4,454,208 | 2,086,493 | 8,465,649 | |||||||||||||||||||||
| Foreign currency translations | — | — | 9,930 | — | — | — | 236 | |||||||||||||||||||||
| Net change in unrealized appreciation | 5,655,326 | 12,506,512 | 10,789,801 | 7,934,838 | 4,454,208 | 2,086,493 | 8,465,885 | |||||||||||||||||||||
| Net Realized and Unrealized Gain | 7,600,036 | 16,756,692 | 5,946,423 | 11,128,726 | 3,290,910 | 1,968,450 | 7,442,075 | |||||||||||||||||||||
| Net Increase in Net Assets Resulting From Operations | $ | 8,537,722 | $ | 15,570,659 | $ | 8,589,691 | $ | 12,090,201 | $ | 3,238,624 | $ | 1,240,759 | $ | 8,377,118 | ||||||||||||||
See accompanying notes to financial statements.
76
| STATEMENTS OF CHANGES IN NET ASSETS |
| Dunham | Dunham | Dunham | Dunham | Dunham | ||||||||||||||||||||||||||||||||||||
| Floating Rate | Long/Short | Corporate/Government | Monthly Distribution | Dynamic Macro | ||||||||||||||||||||||||||||||||||||
| Bond Fund | Credit Fund | Bond Fund | Fund | Fund | ||||||||||||||||||||||||||||||||||||
| Year Ended | Year Ended | Year Ended | Year Ended | Year Ended | Year Ended | Year Ended | Year Ended | Year Ended | Year Ended | |||||||||||||||||||||||||||||||
| Oct. 31, 2019 | Oct. 31, 2018 | Oct. 31, 2019 | Oct. 31, 2018 | Oct. 31, 2019 | Oct. 31, 2018 | Oct. 31, 2019 | Oct. 31, 2018 | Oct. 31, 2019 | Oct. 31, 2018 | |||||||||||||||||||||||||||||||
| Operations: | ||||||||||||||||||||||||||||||||||||||||
| Net investment income (loss) | $ | 8,487,775 | $ | 7,513,198 | $ | 1,677,487 | $ | 590,638 | $ | 1,340,868 | $ | 1,551,962 | $ | (1,442,620 | ) | $ | 277,888 | $ | 484,473 | $ | 56,596 | |||||||||||||||||||
| Net realized gain (loss) from investments, futures, purchased options, securities sold short, written options, swap contracts, foreign currency transactions and forward foreign currency exchange contracts | (1,573,440 | ) | (331,695 | ) | 367,556 | 2,210,212 | 113,200 | (1,340,800 | ) | 1,741,024 | 5,972,173 | 3,163,684 | (1,621,185 | ) | ||||||||||||||||||||||||||
| Net change in unrealized appreciation (depreciation) on investments, futures, purchased options, securities sold short, written options, foreign currency translations and forward foreign currency exchange contracts | (3,869,644 | ) | (1,770,479 | ) | 1,672,696 | (1,199,986 | ) | 3,618,411 | (2,180,187 | ) | 5,736,652 | (8,557,186 | ) | (743,996 | ) | (1,415,776 | ) | |||||||||||||||||||||||
| Net Increase (Decrease) in Net Assets Resulting From Operations | 3,044,691 | 5,411,024 | 3,717,739 | 1,600,864 | 5,072,479 | (1,969,025 | ) | 6,035,056 | (2,307,125 | ) | 2,904,161 | (2,980,365 | ) | |||||||||||||||||||||||||||
| Distributions to Shareholders From: | ||||||||||||||||||||||||||||||||||||||||
| Distributions From Paid In Capital: | ||||||||||||||||||||||||||||||||||||||||
| Class N | — | — | — | — | — | — | (10,187,402 | ) | (7,909,457 | ) | (178,934 | ) | — | |||||||||||||||||||||||||||
| Class A | — | — | — | — | — | — | (2,350,197 | ) | (1,741,683 | ) | (40,574 | ) | — | |||||||||||||||||||||||||||
| Class C | — | — | — | — | — | — | (2,424,555 | ) | (1,667,572 | ) | (9,272 | ) | — | |||||||||||||||||||||||||||
| Total Other Distributions Paid | ||||||||||||||||||||||||||||||||||||||||
| Class N | (7,355,813 | ) | (6,592,532 | ) | (1,851,434 | ) | (364,941 | ) | (1,166,344 | ) | (1,401,772 | ) | — | (1,898,259 | ) | (631,590 | ) | — | ||||||||||||||||||||||
| Class A | (929,175 | ) | (741,771 | ) | (244,159 | ) | (72,290 | ) | (145,603 | ) | (146,528 | ) | — | (415,753 | ) | (125,095 | ) | — | ||||||||||||||||||||||
| Class C | (325,188 | ) | (226,608 | ) | (92,505 | ) | (42,412 | ) | (53,076 | ) | (59,070 | ) | — | (402,623 | ) | (14,866 | ) | — | ||||||||||||||||||||||
| Total Distributions to Shareholders | (8,610,176 | ) | (7,560,911 | ) | (2,188,098 | ) | (479,643 | ) | (1,365,023 | ) | (1,607,370 | ) | (14,962,154 | ) | (14,035,347 | ) | (1,000,331 | ) | — | |||||||||||||||||||||
| Share Transactions of | ||||||||||||||||||||||||||||||||||||||||
| Beneficial Interest: | ||||||||||||||||||||||||||||||||||||||||
| Net proceeds from shares sold | ||||||||||||||||||||||||||||||||||||||||
| Class N | 39,184,312 | 53,805,879 | 49,856,416 | 24,690,679 | 18,045,990 | 26,102,884 | 53,671,386 | 79,596,658 | 4,498,166 | 10,438,482 | ||||||||||||||||||||||||||||||
| Class A | 6,544,499 | 9,607,696 | 6,262,396 | 4,941,263 | 3,282,599 | 2,745,411 | 16,026,986 | 16,902,262 | 2,260,121 | 4,198,213 | ||||||||||||||||||||||||||||||
| Class C | 3,605,718 | 2,552,475 | 1,130,847 | 966,403 | 498,975 | 776,525 | 8,179,345 | 9,988,079 | 393,839 | 534,780 | ||||||||||||||||||||||||||||||
| Reinvestment of distributions | ||||||||||||||||||||||||||||||||||||||||
| Class N | 7,342,514 | 6,585,506 | 1,830,183 | 364,087 | 1,159,769 | 1,400,755 | 9,872,584 | 9,579,318 | 809,408 | — | ||||||||||||||||||||||||||||||
| Class A | 899,214 | 714,614 | 221,475 | 60,330 | 140,795 | 139,151 | 2,043,964 | 1,880,728 | 163,799 | — | ||||||||||||||||||||||||||||||
| Class C | 318,158 | 223,666 | 91,248 | 38,665 | 50,669 | 57,080 | 2,063,878 | 1,747,942 | 24,112 | — | ||||||||||||||||||||||||||||||
| Cost of shares redeemed | ||||||||||||||||||||||||||||||||||||||||
| Class N | (48,969,779 | ) | (51,103,375 | ) | (21,756,496 | ) | (2,712,641 | ) | (20,749,068 | ) | (46,043,475 | ) | (75,962,023 | ) | (88,657,959 | ) | (10,343,817 | ) | (8,552,847 | ) | ||||||||||||||||||||
| Class A | (5,055,411 | ) | (6,113,143 | ) | (1,842,303 | ) | (2,061,767 | ) | (1,616,819 | ) | (3,493,266 | ) | (17,630,659 | ) | (14,526,312 | ) | (2,964,315 | ) | (2,009,156 | ) | ||||||||||||||||||||
| Class C | (2,272,992 | ) | (1,675,351 | ) | (348,842 | ) | (729,306 | ) | (829,785 | ) | (1,102,595 | ) | (9,103,352 | ) | (9,085,236 | ) | (282,970 | ) | (673,743 | ) | ||||||||||||||||||||
| Net Increase (Decrease) in Net Assets From Share Transactions of Beneficial Interest | 1,596,233 | 14,597,967 | 35,444,924 | 25,557,713 | (16,875 | ) | (19,417,530 | ) | (10,837,891 | ) | 7,425,480 | (5,441,657 | ) | 3,935,729 | ||||||||||||||||||||||||||
| Total Increase (Decrease) in Net Assets | (3,969,252 | ) | 12,448,080 | 36,974,565 | 26,678,934 | 3,690,581 | (22,993,925 | ) | (19,764,989 | ) | (8,916,992 | ) | (3,537,827 | ) | 955,364 | |||||||||||||||||||||||||
| Net Assets: | ||||||||||||||||||||||||||||||||||||||||
| Beginning of Year | 192,377,108 | 179,929,028 | 45,465,462 | 18,786,528 | 49,221,551 | 72,215,476 | 279,048,216 | 287,965,208 | 45,252,304 | 44,296,940 | ||||||||||||||||||||||||||||||
| End of Year | $ | 188,407,856 | $ | 192,377,108 | $ | 82,440,027 | $ | 45,465,462 | $ | 52,912,132 | $ | 49,221,551 | $ | 259,283,227 | $ | 279,048,216 | $ | 41,714,477 | $ | 45,252,304 | ||||||||||||||||||||
See accompanying notes to financial statements.
77
| STATEMENTS OF CHANGES IN NET ASSETS (Continued) |
| Dunham | Dunham | Dunham | Dunham | Dunham | ||||||||||||||||||||||||||||||||||||
| High-Yield | International Opportunity | Large Cap | Focused Large Cap | International | ||||||||||||||||||||||||||||||||||||
| Bond Fund | Bond Fund | Value Fund | Growth Fund | Stock Fund | ||||||||||||||||||||||||||||||||||||
| Year Ended | Year Ended | Year Ended | Year Ended | Year Ended | Year Ended | Year Ended | Year Ended | Year Ended | Year Ended | |||||||||||||||||||||||||||||||
| Oct. 31, 2019 | Oct. 31, 2018 | Oct. 31, 2019 | Oct. 31, 2018 | Oct. 31, 2019 | Oct. 31, 2018 | Oct. 31, 2019 | Oct. 31, 2018 | Oct. 31, 2019 | Oct. 31, 2018 | |||||||||||||||||||||||||||||||
| Operations: | ||||||||||||||||||||||||||||||||||||||||
| Net investment income (loss) | $ | 5,490,063 | $ | 5,633,847 | $ | (132,254 | ) | $ | (148,640 | ) | $ | 937,686 | $ | 635,854 | �� | $ | (1,186,033 | ) | $ | (966,560 | ) | $ | 2,643,268 | $ | 1,350,212 | |||||||||||||||
| Net realized gain (loss) from investments, futures and foreign currency transactions | (1,991,065 | ) | (321,233 | ) | 107,492 | 322,454 | 1,944,710 | 2,733,977 | 4,250,180 | 6,846,462 | (4,843,378 | ) | 6,533,665 | |||||||||||||||||||||||||||
| Net change in unrealized appreciation (depreciation) on investments, swap contracts, futures, foreign currency transactions and foreign currency exchange contracts | 4,726,623 | (6,315,823 | ) | 2,295,850 | (1,574,463 | ) | 5,655,326 | (1,893,243 | ) | 12,506,512 | 7,268,219 | 10,789,801 | (16,664,110 | ) | ||||||||||||||||||||||||||
| Net Increase (Decrease) in Net Assets Resulting From Operations | 8,225,621 | (1,003,209 | ) | 2,271,088 | (1,400,649 | ) | 8,537,722 | 1,476,588 | 15,570,659 | 13,148,121 | 8,589,691 | (8,780,233 | ) | |||||||||||||||||||||||||||
| Distributions to Shareholders From: | ||||||||||||||||||||||||||||||||||||||||
| Total Distributions Paid | ||||||||||||||||||||||||||||||||||||||||
| Class N | (4,676,120 | ) | (4,663,689 | ) | (206,819 | ) | (37,115 | ) | (2,696,550 | ) | (1,037,225 | ) | (4,430,347 | ) | (529,592 | ) | (5,927,318 | ) | (3,839,253 | ) | ||||||||||||||||||||
| Class A | (597,867 | ) | (548,313 | ) | (16,011 | ) | (3,597 | ) | (634,655 | ) | (179,080 | ) | (1,226,758 | ) | (125,188 | ) | (1,198,236 | ) | (663,334 | ) | ||||||||||||||||||||
| Class C | (332,845 | ) | (308,033 | ) | (2,165 | ) | (1,630 | ) | (174,020 | ) | (54,544 | ) | (564,922 | ) | (67,305 | ) | (358,199 | ) | (254,735 | ) | ||||||||||||||||||||
| Total Distributions to Shareholders | (5,606,832 | ) | (5,520,035 | ) | (224,995 | ) | (42,342 | ) | (3,505,225 | ) | (1,270,849 | ) | (6,222,027 | ) | (722,085 | ) | (7,483,753 | ) | (4,757,322 | ) | ||||||||||||||||||||
| Share Transactions of Beneficial Interest: | ||||||||||||||||||||||||||||||||||||||||
| Net proceeds from shares sold | ||||||||||||||||||||||||||||||||||||||||
| Class N | 19,813,226 | 25,839,703 | 6,400,219 | 8,552,449 | 9,646,917 | 11,276,861 | 21,107,712 | 14,557,522 | 18,220,512 | 20,225,562 | ||||||||||||||||||||||||||||||
| Class A | 3,165,578 | 4,933,144 | 1,348,987 | 1,815,069 | 5,417,648 | 5,983,202 | 19,065,395 | 6,139,307 | 6,588,356 | 9,177,700 | ||||||||||||||||||||||||||||||
| Class C | 918,509 | 1,222,617 | 232,881 | 438,364 | 1,174,322 | 770,794 | 2,938,833 | 1,148,834 | 1,156,103 | 1,236,899 | ||||||||||||||||||||||||||||||
| Reinvestment of distributions | ||||||||||||||||||||||||||||||||||||||||
| Class N | 4,652,938 | 4,624,638 | 206,756 | 37,090 | 2,688,416 | 1,034,573 | 4,369,570 | 527,415 | 5,919,259 | 3,736,841 | ||||||||||||||||||||||||||||||
| Class A | 565,402 | 500,869 | 15,700 | 3,538 | 612,304 | 174,869 | 1,096,111 | 119,002 | 1,172,202 | 644,219 | ||||||||||||||||||||||||||||||
| Class C | 306,338 | 277,641 | 2,165 | 1,630 | 171,204 | 53,746 | 513,630 | 63,642 | 355,855 | 250,970 | ||||||||||||||||||||||||||||||
| Cost of shares redeemed | ||||||||||||||||||||||||||||||||||||||||
| Class N | (30,912,858 | ) | (34,003,205 | ) | (7,278,732 | ) | (7,995,121 | ) | (9,736,416 | ) | (12,244,072 | ) | (17,190,050 | ) | (21,393,431 | ) | (12,936,799 | ) | (14,178,501 | ) | ||||||||||||||||||||
| Class A | (4,095,837 | ) | (4,450,345 | ) | (1,024,835 | ) | (809,868 | ) | (3,148,530 | ) | (3,792,405 | ) | (12,817,565 | ) | (6,326,125 | ) | (3,706,725 | ) | (4,944,496 | ) | ||||||||||||||||||||
| Class C | (1,318,561 | ) | (1,476,839 | ) | (229,054 | ) | (333,168 | ) | (505,098 | ) | (1,312,478 | ) | (2,573,388 | ) | (2,135,494 | ) | (877,014 | ) | (1,547,611 | ) | ||||||||||||||||||||
| Net Increase (Decrease) in Net Assets From Share Transactions of Beneficial Interest | (6,905,265 | ) | (2,531,777 | ) | (325,913 | ) | 1,709,983 | 6,320,767 | 1,945,090 | 16,510,248 | (7,299,328 | ) | 15,891,749 | 14,601,583 | ||||||||||||||||||||||||||
| Total Increase (Decrease) in Net Assets | (4,286,476 | ) | (9,055,021 | ) | 1,720,180 | 266,992 | 11,353,264 | 2,150,829 | 25,858,880 | 5,126,708 | 16,997,687 | 1,064,028 | ||||||||||||||||||||||||||||
| Net Assets: | ||||||||||||||||||||||||||||||||||||||||
| Beginning of Year | 114,381,790 | 123,436,811 | 37,006,017 | 36,739,025 | 72,119,462 | 69,968,633 | 81,300,147 | 76,173,439 | 113,415,397 | 112,351,369 | ||||||||||||||||||||||||||||||
| End of Year | $ | 110,095,314 | $ | 114,381,790 | $ | 38,726,197 | $ | 37,006,017 | $ | 83,472,726 | $ | 72,119,462 | $ | 107,159,027 | $ | 81,300,147 | $ | 130,413,084 | $ | 113,415,397 | ||||||||||||||||||||
See accompanying notes to financial statements.
78
| STATEMENTS OF CHANGES IN NET ASSETS (Continued) |
| Dunham | Dunham | Dunham | Dunham | |||||||||||||||||||||||||||||
| Real Estate | Small Cap | Small Cap | Emerging Markets | |||||||||||||||||||||||||||||
| Stock Fund | Value Fund | Growth Fund | Stock Fund | |||||||||||||||||||||||||||||
| Year Ended | Year Ended | Year Ended | Year Ended | Year Ended | Year Ended | Year Ended | Year Ended | |||||||||||||||||||||||||
| Oct. 31, 2019 | Oct. 31, 2018 | Oct. 31, 2019 | Oct. 31, 2018 | Oct. 31, 2019 | Oct. 31, 2018 | Oct. 31, 2019 | Oct. 31, 2018 | |||||||||||||||||||||||||
| Operations: | ||||||||||||||||||||||||||||||||
| Net investment income (loss) | $ | 961,475 | $ | 899,505 | $ | (52,286 | ) | $ | (45,684 | ) | $ | (727,691 | ) | $ | (590,382 | ) | $ | 935,043 | $ | 1,152,940 | ||||||||||||
| Net realized gain (loss) from investments and foreign currency transactions | 3,193,888 | (174,994 | ) | (1,163,298 | ) | 5,105,140 | (118,043 | ) | 9,207,612 | (1,023,810 | ) | 1,431,468 | ||||||||||||||||||||
| Net change in unrealized appreciation (depreciation) on investments and foreign currency translations | 7,934,838 | (546,360 | ) | 4,454,208 | (5,420,545 | ) | 2,086,493 | (3,717,938 | ) | 8,465,885 | (16,889,852 | ) | ||||||||||||||||||||
| Net Increase (Decrease) in Net Assets Resulting From Operations | 12,090,201 | 178,151 | 3,238,624 | (361,089 | ) | 1,240,759 | 4,899,292 | 8,377,118 | (14,305,444 | ) | ||||||||||||||||||||||
| Distributions to Shareholders From: | ||||||||||||||||||||||||||||||||
| Total Distributions Paid | ||||||||||||||||||||||||||||||||
| Class N | (798,931 | ) | (545,647 | ) | (3,953,207 | ) | (2,382,575 | ) | (6,275,235 | ) | (3,540,224 | ) | (1,006,872 | ) | (510,282 | ) | ||||||||||||||||
| Class A | (140,920 | ) | (80,421 | ) | (859,290 | ) | (495,340 | ) | (2,133,326 | ) | (1,070,104 | ) | (167,073 | ) | (67,957 | ) | ||||||||||||||||
| Class C | (23,866 | ) | (19,495 | ) | (272,184 | ) | (301,971 | ) | (652,365 | ) | (474,106 | ) | (29,750 | ) | (13,160 | ) | ||||||||||||||||
| Total Distributions to Shareholders | (963,717 | ) | (645,563 | ) | (5,084,681 | ) | (3,179,886 | ) | (9,060,926 | ) | (5,084,434 | ) | (1,203,695 | ) | (591,399 | ) | ||||||||||||||||
| Share Transactions of Beneficial Interest: | ||||||||||||||||||||||||||||||||
| Net proceeds from shares sold | ||||||||||||||||||||||||||||||||
| Class N | 4,820,022 | 18,420,383 | 9,580,246 | 17,353,604 | 13,660,779 | 12,088,512 | 10,284,122 | 20,915,714 | ||||||||||||||||||||||||
| Class A | 2,547,627 | 4,483,032 | 3,224,004 | 4,612,064 | 4,059,178 | 5,475,767 | 4,738,975 | 6,171,549 | ||||||||||||||||||||||||
| Class C | 487,070 | 555,329 | 887,413 | 433,472 | 981,344 | 468,765 | 660,262 | 1,090,420 | ||||||||||||||||||||||||
| Reinvestment of distributions | ||||||||||||||||||||||||||||||||
| Class N | 797,852 | 544,150 | 3,947,325 | 2,312,130 | 5,929,101 | 3,415,609 | 997,722 | 494,306 | ||||||||||||||||||||||||
| Class A | 138,429 | 78,284 | 796,269 | 445,163 | 1,888,425 | 959,794 | 162,685 | 64,832 | ||||||||||||||||||||||||
| Class C | 23,724 | 19,299 | 272,184 | 264,864 | 648,129 | 474,106 | 28,820 | 13,079 | ||||||||||||||||||||||||
| Cost of shares redeemed | ||||||||||||||||||||||||||||||||
| Class N | (14,694,994 | ) | (9,723,240 | ) | (5,804,339 | ) | (2,502,809 | ) | (10,930,828 | ) | (6,253,725 | ) | (10,266,820 | ) | (7,511,939 | ) | ||||||||||||||||
| Class A | (3,802,083 | ) | (2,038,975 | ) | (1,723,295 | ) | (1,141,557 | ) | (3,921,776 | ) | (2,475,581 | ) | (3,631,729 | ) | (2,670,093 | ) | ||||||||||||||||
| Class C | (521,603 | ) | (661,776 | ) | (343,347 | ) | (868,985 | ) | (1,318,920 | ) | (777,346 | ) | (732,423 | ) | (659,386 | ) | ||||||||||||||||
| Net Increase (Decrease) in Net Assets From Share Transactions of Beneficial Interest | (10,203,956 | ) | 11,676,486 | 10,836,460 | 20,907,946 | 10,995,432 | 13,375,901 | 2,241,614 | 17,908,482 | |||||||||||||||||||||||
| Total Increase in Net Assets | 922,528 | 11,209,074 | 8,990,403 | 17,366,971 | 3,175,265 | 13,190,759 | 9,415,037 | 3,011,639 | ||||||||||||||||||||||||
| Net Assets: | ||||||||||||||||||||||||||||||||
| Beginning of Year | 53,915,232 | 42,706,158 | 47,256,415 | 29,889,444 | 47,401,283 | 34,210,524 | 66,085,808 | 63,074,169 | ||||||||||||||||||||||||
| End of Year | $ | 54,837,760 | $ | 53,915,232 | $ | 56,246,818 | $ | 47,256,415 | $ | 50,576,548 | $ | 47,401,283 | $ | 75,500,845 | $ | 66,085,808 | ||||||||||||||||
See accompanying notes to financial statements.
79
| FINANCIAL HIGHLIGHTS |
| Dunham Floating Rate Bond Fund |
The table sets forth financial data for one share of beneficial interest outstanding throughout each year.
| Class N | ||||||||||||||||||||||||||||||||||||||||
| Year Ended October 31, | ||||||||||||||||||||||||||||||||||||||||
| 2019 | 2018 | 2017 | 2016 | 2015 | ||||||||||||||||||||||||||||||||||||
| Net asset value, beginning of year | $ | 9.62 | $ | 9.73 | $ | 9.70 | $ | 9.60 | $ | 9.87 | ||||||||||||||||||||||||||||||
| Income from investment operations: | ||||||||||||||||||||||||||||||||||||||||
| Net investment income* | 0.44 | 0.40 | 0.35 | 0.33 | 0.32 | |||||||||||||||||||||||||||||||||||
| Net realized and unrealized gain (loss) | (0.26 | ) | (0.11 | ) | 0.03 | 0.10 | (0.27 | ) | ||||||||||||||||||||||||||||||||
| Total income from investment operations | 0.18 | 0.29 | 0.38 | 0.43 | 0.05 | |||||||||||||||||||||||||||||||||||
| Less distributions: | ||||||||||||||||||||||||||||||||||||||||
| Distributions from net investment income | (0.44 | ) | (0.40 | ) | (0.35 | ) | (0.33 | ) | (0.32 | ) | ||||||||||||||||||||||||||||||
| Total distributions | (0.44 | ) | (0.40 | ) | (0.35 | ) | (0.33 | ) | (0.32 | ) | ||||||||||||||||||||||||||||||
| Net asset value, end of year | $ | 9.36 | $ | 9.62 | $ | 9.73 | $ | 9.70 | $ | 9.60 | ||||||||||||||||||||||||||||||
| Total return + # | 1.99 | % | 3.02 | % | 4.01 | % | 4.63 | % | 0.51 | % | ||||||||||||||||||||||||||||||
| Ratios/Supplemental Data: | ||||||||||||||||||||||||||||||||||||||||
| Net assets, end of year (in 000s) | $ | 157,757 | $ | 164,936 | $ | 157,485 | $ | 94,219 | $ | 73,316 | ||||||||||||||||||||||||||||||
| Ratios of expenses to average net assets: | 1.01 | % | 0.97 | % | 1.03 | % | 1.34 | % | 1.27 | % | ||||||||||||||||||||||||||||||
| Ratios of net investment income to average net assets: | 4.60 | % | 4.08 | % | 3.60 | % | 3.24 | % | 3.24 | % | ||||||||||||||||||||||||||||||
| Portfolio turnover rate | 44 | % | 79 | % | 91 | % | 62 | % | 51 | % | ||||||||||||||||||||||||||||||
| Class A | Class C | |||||||||||||||||||||||||||||||||||||||
| Year Ended October 31, | Year Ended October 31, | |||||||||||||||||||||||||||||||||||||||
| 2019 | 2018 | 2017 | 2016 | 2015 | 2019 | 2018 | 2017 | 2016 | 2015 | |||||||||||||||||||||||||||||||
| Net asset value, beginning of year | $ | 9.61 | $ | 9.72 | $ | 9.70 | $ | 9.59 | $ | 9.87 | $ | 9.62 | $ | 9.73 | $ | 9.69 | $ | 9.59 | $ | 9.86 | ||||||||||||||||||||
| Income (loss) from investment operations: | ||||||||||||||||||||||||||||||||||||||||
| Net investment income* | 0.41 | 0.37 | 0.32 | 0.31 | 0.30 | 0.37 | 0.33 | 0.28 | 0.26 | 0.24 | ||||||||||||||||||||||||||||||
| Net realized and unrealized gain (loss) | (0.25 | ) | (0.11 | ) | 0.03 | 0.11 | (0.28 | ) | (0.27 | ) | (0.11 | ) | 0.04 | 0.10 | (0.26 | ) | ||||||||||||||||||||||||
| Total income (loss) from investment operations | 0.16 | 0.26 | 0.35 | 0.42 | 0.02 | 0.10 | 0.22 | 0.32 | 0.36 | (0.02 | ) | |||||||||||||||||||||||||||||
| Less distributions: | ||||||||||||||||||||||||||||||||||||||||
| Distributions from net investment income | (0.42 | ) | (0.37 | ) | (0.33 | ) | (0.31 | ) | (0.30 | ) | (0.37 | ) | (0.33 | ) | (0.28 | ) | (0.26 | ) | (0.25 | ) | ||||||||||||||||||||
| Total distributions | (0.42 | ) | (0.37 | ) | (0.33 | ) | (0.31 | ) | (0.30 | ) | (0.37 | ) | (0.33 | ) | (0.28 | ) | (0.26 | ) | (0.25 | ) | ||||||||||||||||||||
| Net asset value, end of year | $ | 9.35 | $ | 9.61 | $ | 9.72 | $ | 9.70 | $ | 9.59 | $ | 9.35 | $ | 9.62 | $ | 9.73 | $ | 9.69 | $ | 9.59 | ||||||||||||||||||||
| Total return + # | 1.74 | % | 2.77 | % | 3.64 | % | 4.49 | % | 0.16 | % | 1.13 | % | 2.26 | % | 3.31 | % | 3.87 | % | (0.23 | )% | ||||||||||||||||||||
| Ratios/Supplemental Data: | ||||||||||||||||||||||||||||||||||||||||
| Net assets, end of year (in 000s) | $ | 21,997 | $ | 20,205 | $ | 16,229 | $ | 10,923 | $ | 8,598 | $ | 8,654 | $ | 7,236 | $ | 6,215 | $ | 4,545 | $ | 3,573 | ||||||||||||||||||||
| Ratios of expenses to average net assets: | 1.26 | % | 1.22 | % | 1.28 | % | 1.59 | % | 1.52 | % | 1.76 | % | 1.72 | % | 1.78 | % | 2.10 | % | 2.02 | % | ||||||||||||||||||||
| Ratios of net investment income to average net assets: | 4.36 | % | 3.84 | % | 3.33 | % | 3.49 | % | 2.99 | % | 3.86 | % | 3.43 | % | 2.89 | % | 2.74 | % | 2.49 | % | ||||||||||||||||||||
| Portfolio turnover rate | 44 | % | 79 | % | 91 | % | 62 | % | 51 | % | 44 | % | 79 | % | 91 | % | 62 | % | 51 | % | ||||||||||||||||||||
| * | The net investment income per share data was determined using the average shares outstanding throughout each year. |
| + | Assumes reinvestment of all dividends and distributions, if any. Total return does not reflect the deductions of taxes that a shareholder would pay on distributions or on the redemption of shares and does not reflect the impact of any sales charge. |
| # | Includes adjustments in accordance with accounting principles generally accepted in the United States and, consequently, the net asset values for financial reporting purposes and the returns based upon those net asset values may differ from the net asset values and returns for shareholder transactions. Adjustments may apply to some but not all years and classes. |
See accompanying notes to financial statements.
80
| FINANCIAL HIGHLIGHTS |
| Dunham Long/Short Credit Fund |
The table sets forth financial data for one share of beneficial interest outstanding throughout each year.
| Class N | ||||||||||||||||||||||||||||||||||||||||
| Year Ended October 31, | ||||||||||||||||||||||||||||||||||||||||
| 2019 | 2018 | 2017 | 2016 | 2015 | ||||||||||||||||||||||||||||||||||||
| Net asset value, beginning of year | $ | 9.19 | $ | 8.68 | $ | 8.05 | $ | 8.75 | $ | 10.88 | ||||||||||||||||||||||||||||||
| Income (loss) from investment operations: | ||||||||||||||||||||||||||||||||||||||||
| Net investment income* | 0.24 | 0.23 | 0.16 | 0.23 | 0.27 | |||||||||||||||||||||||||||||||||||
| Net realized and unrealized gain (loss) | 0.24 | 0.49 | 0.72 | (0.39 | ) | (0.51 | ) | |||||||||||||||||||||||||||||||||
| Total income (loss) from investment operations | 0.48 | 0.72 | 0.88 | (0.16 | ) | (0.24 | ) | |||||||||||||||||||||||||||||||||
| Less distributions: | ||||||||||||||||||||||||||||||||||||||||
| Distributions from net investment income | (0.31 | ) | (0.21 | ) | (0.25 | ) | (0.36 | ) | (0.17 | ) | ||||||||||||||||||||||||||||||
| Distributions from net realized gains | — | — | — | (0.18 | ) | (1.72 | ) | |||||||||||||||||||||||||||||||||
| Total distributions | (0.31 | ) | (0.21 | ) | (0.25 | ) | (0.54 | ) | (1.89 | ) | ||||||||||||||||||||||||||||||
| Net asset value, end of year | $ | 9.36 | $ | 9.19 | $ | 8.68 | $ | 8.05 | $ | 8.75 | ||||||||||||||||||||||||||||||
| Total return + # | 5.31 | % | 8.42 | % | 11.20 | % | (1.92 | )% | (2.67 | )% | ||||||||||||||||||||||||||||||
| Ratios/Supplemental Data: | ||||||||||||||||||||||||||||||||||||||||
| Net assets, end of year (in 000s) | $ | 67,276 | $ | 36,055 | $ | 12,953 | $ | 16,929 | $ | 20,210 | ||||||||||||||||||||||||||||||
| Ratios of expenses to average net assets: | 1.24 | % | 1.44 | % | 1.41 | % | 1.42 | % | 1.34 | % | ||||||||||||||||||||||||||||||
| Ratios of net investment income to average net assets: | 2.60 | % | 2.52 | % | 1.90 | % | 2.83 | % | 2.83 | % | ||||||||||||||||||||||||||||||
| Portfolio turnover rate | 426 | % | 275 | % | 106 | % | 96 | % | 82 | % | ||||||||||||||||||||||||||||||
| Class A | Class C | |||||||||||||||||||||||||||||||||||||||
| Year Ended October 31, | Year Ended October 31, | |||||||||||||||||||||||||||||||||||||||
| 2019 | 2018 | 2017 | 2016 | 2015 | 2019 | 2018 | 2017 | 2016 | 2015 | |||||||||||||||||||||||||||||||
| Net asset value, beginning of year | $ | 9.17 | $ | 8.66 | $ | 8.03 | $ | 8.73 | $ | 10.85 | $ | 8.94 | $ | 8.46 | $ | 7.86 | $ | 8.56 | $ | 10.66 | ||||||||||||||||||||
| Income (loss) from investment operations: | ||||||||||||||||||||||||||||||||||||||||
| Net investment income* | 0.22 | 0.19 | 0.14 | 0.20 | 0.24 | 0.15 | 0.11 | 0.07 | 0.14 | 0.18 | ||||||||||||||||||||||||||||||
| Net realized and unrealized gain (loss) | 0.22 | 0.50 | 0.72 | (0.39 | ) | (0.50 | ) | 0.23 | 0.49 | 0.71 | (0.39 | ) | (0.50 | ) | ||||||||||||||||||||||||||
| Total income (loss) from investment operations | 0.44 | 0.69 | 0.86 | (0.19 | ) | (0.26 | ) | 0.38 | 0.60 | 0.78 | (0.25 | ) | (0.32 | ) | ||||||||||||||||||||||||||
| Less distributions: | ||||||||||||||||||||||||||||||||||||||||
| Distributions from net investment income | (0.28 | ) | (0.18 | ) | (0.23 | ) | (0.33 | ) | (0.14 | ) | (0.24 | ) | (0.12 | ) | (0.18 | ) | (0.27 | ) | (0.06 | ) | ||||||||||||||||||||
| Distributions from net realized gains | — | — | — | (0.18 | ) | (1.72 | ) | — | — | — | (0.18 | ) | (1.72 | ) | ||||||||||||||||||||||||||
| Total distributions | (0.28 | ) | (0.18 | ) | (0.23 | ) | (0.51 | ) | (1.86 | ) | (0.24 | ) | (0.12 | ) | (0.18 | ) | (0.45 | ) | (1.78 | ) | ||||||||||||||||||||
| Net asset value, end of year | $ | 9.33 | $ | 9.17 | $ | 8.66 | $ | 8.03 | $ | 8.73 | $ | 9.08 | $ | 8.94 | $ | 8.46 | $ | 7.86 | $ | 8.56 | ||||||||||||||||||||
| Total return + # | 4.95 | % | 8.10 | % | 10.92 | % | (2.19 | )% | (2.84 | )% | 4.34 | % | 7.21 | % | 10.08 | % | (2.95 | )% | (3.53 | )% | ||||||||||||||||||||
| Ratios/Supplemental Data: | ||||||||||||||||||||||||||||||||||||||||
| Net assets, end of year (in 000s) | $ | 11,087 | $ | 6,265 | $ | 3,125 | $ | 3,638 | $ | 4,211 | $ | 4,077 | $ | 3,145 | $ | 2,708 | $ | 3,181 | $ | 4,956 | ||||||||||||||||||||
| Ratios of expenses to average net assets: | 1.48 | % | 1.69 | % | 1.66 | % | 1.67 | % | 1.59 | % | 2.22 | % | 2.44 | % | 2.41 | % | 2.44 | % | 2.34 | % | ||||||||||||||||||||
| Ratios of net investment income to average net assets: | 2.36 | % | 2.13 | % | 1.66 | % | 2.57 | % | 2.56 | % | 1.63 | % | 1.22 | % | 0.93 | % | 1.81 | % | 1.91 | % | ||||||||||||||||||||
| Portfolio turnover rate | 426 | % | 275 | % | 106 | % | 96 | % | 82 | % | 426 | % | 275 | % | 106 | % | 96 | % | 82 | % | ||||||||||||||||||||
| * | The net investment income per share data was determined using the average shares outstanding throughout each year. |
| + | Assumes reinvestment of all dividends and distributions, if any. Total return does not reflect the deductions of taxes that a shareholder would pay on distributions or on the redemption of shares and does not reflect the impact of any sales charge. |
| # | Includes adjustments in accordance with accounting principles generally accepted in the United States and, consequently, the net asset values for financial reporting purposes and the returns based upon those net asset values may differ from the net asset values and returns for shareholder transactions. Adjustments may apply to some but not all years and classes. |
See accompanying notes to financial statements.
81
| FINANCIAL HIGHLIGHTS |
| Dunham Corporate/Government Bond Fund |
The table sets forth financial data for one share of beneficial interest outstanding throughout each year.
| Class N | ||||||||||||||||||||||||||||||||||||||||
| Year Ended October 31, | ||||||||||||||||||||||||||||||||||||||||
| 2019 | 2018 | 2017 | 2016 | 2015 | ||||||||||||||||||||||||||||||||||||
| Net asset value, beginning of year | $ | 13.06 | $ | 13.82 | $ | 13.92 | $ | 13.75 | $ | 14.14 | ||||||||||||||||||||||||||||||
| Income (loss) from investment operations: | ||||||||||||||||||||||||||||||||||||||||
| Net investment income* | 0.36 | 0.34 | 0.31 | 0.36 | 0.42 | |||||||||||||||||||||||||||||||||||
| Net realized and unrealized gain (loss) | 0.96 | (0.74 | ) | (0.08 | ) | 0.19 | (0.37 | ) | ||||||||||||||||||||||||||||||||
| Total income (loss) from investment operations | 1.32 | (0.40 | ) | 0.23 | 0.55 | 0.05 | ||||||||||||||||||||||||||||||||||
| Less distributions: | ||||||||||||||||||||||||||||||||||||||||
| Distributions from net investment income | (0.36 | ) | (0.36 | ) | (0.33 | ) | (0.38 | ) | (0.44 | ) | ||||||||||||||||||||||||||||||
| Total distributions | (0.36 | ) | (0.36 | ) | (0.33 | ) | (0.38 | ) | (0.44 | ) | ||||||||||||||||||||||||||||||
| Net asset value, end of year | $ | 14.02 | $ | 13.06 | $ | 13.82 | $ | 13.92 | $ | 13.75 | ||||||||||||||||||||||||||||||
| Total return + # | 10.27 | % | (2.93 | )% | 1.72 | % | 4.09 | % | 0.36 | % | ||||||||||||||||||||||||||||||
| Ratios/Supplemental Data: | ||||||||||||||||||||||||||||||||||||||||
| Net assets, end of year (in 000s) | $ | 42,730 | $ | 41,151 | $ | 62,757 | $ | 48,025 | $ | 41,989 | ||||||||||||||||||||||||||||||
| Ratios of expenses to average net assets: | 1.20 | % | 1.20 | % | 1.35 | % | 1.13 | % | 1.06 | % | ||||||||||||||||||||||||||||||
| Ratios of net investment income to average net assets: | 2.68 | % | 2.53 | % | 2.27 | % | 2.61 | % | 3.00 | % | ||||||||||||||||||||||||||||||
| Portfolio turnover rate | 76 | % | 92 | % | 61 | % | 58 | % | 54 | % | ||||||||||||||||||||||||||||||
| Class A | Class C | |||||||||||||||||||||||||||||||||||||||
| Year Ended October 31, | Year Ended October 31, | |||||||||||||||||||||||||||||||||||||||
| 2019 | 2018 | 2017 | 2016 | 2015 | 2019 | 2018 | 2017 | 2016 | 2015 | |||||||||||||||||||||||||||||||
| Net asset value, beginning of year | $ | 13.04 | $ | 13.80 | $ | 13.90 | $ | 13.73 | $ | 14.13 | $ | 12.95 | $ | 13.71 | $ | 13.81 | $ | 13.65 | $ | 14.05 | ||||||||||||||||||||
| Income (loss) from investment operations: | ||||||||||||||||||||||||||||||||||||||||
| Net investment income* | 0.33 | 0.31 | 0.28 | 0.33 | 0.38 | 0.26 | 0.24 | 0.21 | 0.26 | 0.31 | ||||||||||||||||||||||||||||||
| Net realized and unrealized gain (loss) | 0.97 | (0.74 | ) | (0.08 | ) | 0.19 | (0.37 | ) | 0.96 | (0.74 | ) | (0.08 | ) | 0.18 | (0.37 | ) | ||||||||||||||||||||||||
| Total income (loss) from investment operations | 1.30 | (0.43 | ) | 0.20 | 0.52 | 0.01 | 1.22 | (0.50 | ) | 0.13 | 0.44 | (0.06 | ) | |||||||||||||||||||||||||||
| Less distributions: | ||||||||||||||||||||||||||||||||||||||||
| Distributions from net investment income | (0.33 | ) | (0.33 | ) | (0.30 | ) | (0.35 | ) | (0.41 | ) | (0.26 | ) | (0.26 | ) | (0.23 | ) | (0.28 | ) | (0.34 | ) | ||||||||||||||||||||
| Total distributions | (0.33 | ) | (0.33 | ) | (0.30 | ) | (0.35 | ) | (0.41 | ) | (0.26 | ) | (0.26 | ) | (0.23 | ) | (0.28 | ) | (0.34 | ) | ||||||||||||||||||||
| Net asset value, end of year | $ | 14.01 | $ | 13.04 | $ | 13.80 | $ | 13.90 | $ | 13.73 | $ | 13.91 | $ | 12.95 | $ | 13.71 | $ | 13.81 | $ | 13.65 | ||||||||||||||||||||
| Total return + # | 10.09 | % | (3.17 | )% | 1.47 | % | 3.86 | % | 0.04 | % | 9.53 | % | (3.67 | )% | 0.98 | % | 3.27 | % | (0.45 | )% | ||||||||||||||||||||
| Ratios/Supplemental Data: | ||||||||||||||||||||||||||||||||||||||||
| Net assets, end of year (in 000s) | $ | 7,510 | $ | 5,311 | $ | 6,260 | $ | 4,832 | $ | 4,788 | $ | 2,672 | $ | 2,760 | $ | 3,199 | $ | 3,364 | $ | 3,698 | ||||||||||||||||||||
| Ratios of expenses to average net assets: | 1.45 | % | 1.45 | % | 1.60 | % | 1.38 | % | 1.31 | % | 1.95 | % | 1.95 | % | 2.10 | % | 1.88 | % | 1.81 | % | ||||||||||||||||||||
| Ratios of net investment income to average net assets: | 2.41 | % | 2.31 | % | 2.01 | % | 2.40 | % | 2.74 | % | 1.92 | % | 1.81 | % | 1.52 | % | 1.89 | % | 2.27 | % | ||||||||||||||||||||
| Portfolio turnover rate | 76 | % | 92 | % | 61 | % | 58 | % | 54 | % | 76 | % | 92 | % | 61 | % | 58 | % | 54 | % | ||||||||||||||||||||
| * | The net investment income per share data was determined using the average shares outstanding throughout each year. |
| + | Assumes reinvestment of all dividends and distributions, if any. Total return does not reflect the deductions of taxes that a shareholder would pay on distributions or on the redemption of shares and does not reflect the impact of any sales charge. |
| # | Includes adjustments in accordance with accounting principles generally accepted in the United States and, consequently, the net asset values for financial reporting purposes and the returns based upon those net asset values may differ from the net asset values and returns for shareholder transactions. Adjustments may apply to some but not all years and classes. |
See accompanying notes to financial statements.
82
| FINANCIAL HIGHLIGHTS |
| Dunham Monthly Distribution Fund |
The table sets forth financial data for one share of beneficial interest outstanding throughout each year.
| Class N | ||||||||||||||||||||||||||||||||||||||||
| Year Ended October 31, | ||||||||||||||||||||||||||||||||||||||||
| 2019 | 2018 | 2017 | 2016 | 2015 | ||||||||||||||||||||||||||||||||||||
| Net asset value, beginning of year | $ | 34.84 | $ | 36.71 | $ | 35.74 | $ | 36.36 | $ | 38.16 | ||||||||||||||||||||||||||||||
| Income (loss) from investment operations: | ||||||||||||||||||||||||||||||||||||||||
| Net investment income (loss)* | (0.13 | ) | 0.09 | (0.36 | ) | 0.14 | (0.18 | ) | ||||||||||||||||||||||||||||||||
| Net realized and unrealized gain (loss) | 1.02 | (0.25 | ) | 2.79 | 0.49 | (0.39 | ) | |||||||||||||||||||||||||||||||||
| Total income (loss) from investment operations | 0.89 | (0.16 | ) | 2.43 | 0.63 | (0.57 | ) | |||||||||||||||||||||||||||||||||
| Less distributions: | ||||||||||||||||||||||||||||||||||||||||
| Distributions from net investment income | — | — | — | (0.55 | ) | — | ||||||||||||||||||||||||||||||||||
| Distributions from net realized gains | — | (0.35 | ) | — | — | (0.80 | ) | |||||||||||||||||||||||||||||||||
| Tax return of capital | (1.85 | ) | (1.36 | ) | (1.46 | ) | (0.70 | ) | (0.43 | ) | ||||||||||||||||||||||||||||||
| Total distributions | (1.85 | ) | (1.71 | ) | (1.46 | ) | (1.25 | ) | (1.23 | ) | ||||||||||||||||||||||||||||||
| Net asset value, end of year | $ | 33.88 | $ | 34.84 | $ | 36.71 | $ | 35.74 | $ | 36.36 | ||||||||||||||||||||||||||||||
| Total return + # | 2.61 | % | (0.45 | )% | 6.92 | % | 1.79 | % | (1.53 | )% | ||||||||||||||||||||||||||||||
| Ratios/Supplemental Data: | ||||||||||||||||||||||||||||||||||||||||
| Net assets, end of year (in 000s) | $ | 183,319 | $ | 201,405 | $ | 212,178 | $ | 153,084 | $ | 163,843 | ||||||||||||||||||||||||||||||
| Ratios of expenses to average net assets: | ||||||||||||||||||||||||||||||||||||||||
| After waivers | 2.62 | % | 2.16 | % | 2.73 | % | 1.85 | % | 2.09 | % | ||||||||||||||||||||||||||||||
| Dividends/borrowings on short sales | 1.24 | % | 1.10 | % | 1.17 | % | 0.61 | % | 0.47 | % | ||||||||||||||||||||||||||||||
| Excluding dividends/borrowings on short sales: | ||||||||||||||||||||||||||||||||||||||||
| Before fee waivers | 1.38 | % | 1.06 | % | 1.59 | % | 1.26 | % | 2.17 | % | ||||||||||||||||||||||||||||||
| After fee waivers | 1.38 | % | 1.06 | % | 1.56 | % | 1.24 | % | 1.62 | % | ||||||||||||||||||||||||||||||
| Ratios of net investment income (loss) to average net assets: | ||||||||||||||||||||||||||||||||||||||||
| Before fee waivers | (0.39 | )% | 0.25 | % | (1.06 | )% | 0.39 | % | (0.56 | )% | ||||||||||||||||||||||||||||||
| After fee waivers | (0.39 | )% | 0.25 | % | (1.03 | )% | 0.40 | % | (0.48 | )% | ||||||||||||||||||||||||||||||
| Portfolio turnover rate | 496 | % | 453 | % | 382 | % | 208 | % | 155 | % | ||||||||||||||||||||||||||||||
| Class A | Class C | |||||||||||||||||||||||||||||||||||||||
| Year Ended October 31, | Year Ended October 31, | |||||||||||||||||||||||||||||||||||||||
| 2019 | 2018 | 2017 | 2016 | 2015 | 2019 | 2018 | 2017 | 2016 | 2015 | |||||||||||||||||||||||||||||||
| Net asset value, beginning of year | $ | 33.77 | $ | 35.73 | $ | 34.90 | $ | 35.63 | $ | 37.52 | $ | 27.02 | $ | 29.15 | $ | 28.94 | $ | 29.99 | $ | 32.01 | ||||||||||||||||||||
| Income (loss) from investment operations: | ||||||||||||||||||||||||||||||||||||||||
| Net investment income (loss)* | (0.21 | ) | 0.00 | (a) | (0.40 | ) | 0.13 | (0.27 | ) | (0.36 | ) | (0.21 | ) | (0.55 | ) | (0.14 | ) | (0.46 | ) | |||||||||||||||||||||
| Net realized and unrealized gain (loss) | 1.00 | (0.25 | ) | 2.69 | 0.39 | (0.39 | ) | 0.79 | (0.21 | ) | 2.22 | 0.34 | (0.33 | ) | ||||||||||||||||||||||||||
| Total income (loss) from investment operations | 0.79 | (0.25 | ) | 2.29 | 0.52 | (0.66 | ) | 0.43 | (0.42 | ) | 1.67 | 0.20 | (0.79 | ) | ||||||||||||||||||||||||||
| Less distributions: | ||||||||||||||||||||||||||||||||||||||||
| Distributions from net investment income | — | — | — | (0.55 | ) | — | — | — | — | (0.55 | ) | — | ||||||||||||||||||||||||||||
| Distributions from net realized gains | — | (0.35 | ) | — | — | (0.80 | ) | — | (0.35 | ) | — | — | (0.80 | ) | ||||||||||||||||||||||||||
| Tax return of capital | (1.85 | ) | (1.36 | ) | (1.46 | ) | (0.70 | ) | (0.43 | ) | (1.85 | ) | (1.36 | ) | (1.46 | ) | (0.70 | ) | (0.43 | ) | ||||||||||||||||||||
| Total distributions | (1.85 | ) | (1.71 | ) | (1.46 | ) | (1.25 | ) | (1.23 | ) | (1.85 | ) | (1.71 | ) | (1.46 | ) | (1.25 | ) | (1.23 | ) | ||||||||||||||||||||
| Net asset value, end of year | $ | 32.71 | $ | 33.77 | $ | 35.73 | $ | 34.90 | $ | 35.63 | $ | 25.60 | $ | 27.02 | $ | 29.15 | $ | 28.94 | $ | 29.99 | ||||||||||||||||||||
| Total return + # | 2.39 | % | (0.72 | )% | 6.64 | % | 1.54 | % | (1.80 | )% | 1.63 | % | (1.48 | )% | 5.82 | % | 0.75 | % | (2.53 | )% | ||||||||||||||||||||
| Ratios/Supplemental Data: | ||||||||||||||||||||||||||||||||||||||||
| Net assets, end of year (in 000s) | $ | 42,052 | $ | 42,980 | $ | 41,186 | $ | 45,552 | $ | 74,247 | $ | 33,913 | $ | 34,664 | $ | 34,601 | $ | 39,118 | $ | 50,215 | ||||||||||||||||||||
| Ratios of expenses to average net assets: | ||||||||||||||||||||||||||||||||||||||||
| After waivers | 2.87 | % | 2.41 | % | 2.93 | % | 2.06 | % | 2.33 | % | 3.62 | % | 3.16 | % | 3.68 | % | 2.83 | % | 3.09 | % | ||||||||||||||||||||
| Dividends/borrowings on short sales | 1.24 | % | 1.10 | % | 1.12 | % | 0.59 | % | 0.47 | % | 1.23 | % | 1.10 | % | 1.12 | % | 0.60 | % | 0.47 | % | ||||||||||||||||||||
| Excluding dividends/borrowings on short sales: | ||||||||||||||||||||||||||||||||||||||||
| Before fee waivers | 1.63 | % | 1.31 | % | 1.83 | % | 1.49 | % | 2.42 | % | 2.39 | % | 2.06 | % | 2.58 | % | 2.24 | % | 3.16 | % | ||||||||||||||||||||
| After fee waivers | 1.63 | % | 1.31 | % | 1.81 | % | 1.48 | % | 1.86 | % | 2.39 | % | 2.06 | % | 2.56 | % | 2.23 | % | 2.62 | % | ||||||||||||||||||||
| Ratios of net investment income (loss) to average net assets: | ||||||||||||||||||||||||||||||||||||||||
| Before fee waivers | (0.63 | )% | 0.01 | % | (1.14 | )% | 0.36 | % | (0.79 | )% | (1.38 | )% | (0.73 | )% | (1.89 | )% | (0.50 | )% | (1.54 | )% | ||||||||||||||||||||
| After fee waivers | (0.63 | )% | 0.01 | % | (1.11 | )% | 0.37 | % | (0.71 | )% | (1.38 | )% | (0.73 | )% | (1.86 | )% | (0.48 | )% | (1.46 | )% | ||||||||||||||||||||
| Portfolio turnover rate | 496 | % | 453 | % | 382 | % | 208 | % | 155 | % | 496 | % | 453 | % | 382 | % | 208 | % | 155 | % | ||||||||||||||||||||
| * | The net investment income (loss) per share data was determined using the average shares outstanding throughout each year. |
| + | Assumes reinvestment of all dividends and distributions, if any. Total return does not reflect the deductions of taxes that a shareholder would pay on distributions or on the redemption of shares and does not reflect the impact of any sales charge. |
| # | Includes adjustments in accordance with accounting principles generally accepted in the United States and, consequently, the net asset values for financial reporting purposes and the returns based upon those net asset values may differ from the net asset values and returns for shareholder transactions. Adjustments may apply to some but not all years and classes. |
| (a) | Represents less than $0.01 per share. |
See accompanying notes to financial statements.
83
| FINANCIAL HIGHLIGHTS |
| Dunham Dynamic Macro Fund |
The table sets forth financial data for one share of beneficial interest outstanding throughout each year.
| Class N | ||||||||||||||||||||||||||||||||||||||||
| Year Ended October 31, | ||||||||||||||||||||||||||||||||||||||||
| 2019 | 2018 | 2017 | 2016 | 2015 | ||||||||||||||||||||||||||||||||||||
| Net asset value, beginning of year | $ | 9.53 | $ | 10.18 | $ | 9.55 | $ | 9.81 | $ | 9.65 | ||||||||||||||||||||||||||||||
| Income (loss) from investment operations: | ||||||||||||||||||||||||||||||||||||||||
| Net investment income (loss) * | 0.12 | 0.02 | (0.03 | ) | (0.00 | ) (a) | (0.14 | ) | ||||||||||||||||||||||||||||||||
| Net realized and unrealized gain (loss) ** | 0.65 | (0.67 | ) | 0.66 | (0.26 | ) | 0.30 | |||||||||||||||||||||||||||||||||
| Total income (loss) from investment operations | 0.77 | (0.65 | ) | 0.63 | (0.26 | ) | 0.16 | |||||||||||||||||||||||||||||||||
| Less distributions: | ||||||||||||||||||||||||||||||||||||||||
| Distributions from net investment income | (0.17 | ) | — | — | — | — | ||||||||||||||||||||||||||||||||||
| Tax return of capital | (0.05 | ) | — | — | — | — | ||||||||||||||||||||||||||||||||||
| Total distributions | (0.22 | ) | — | — | — | — | ||||||||||||||||||||||||||||||||||
| Net asset value, end of year | $ | 10.08 | $ | 9.53 | $ | 10.18 | $ | 9.55 | $ | 9.81 | ||||||||||||||||||||||||||||||
| Total return + # | 8.35 | % | (6.39 | )% | 6.60 | % | (2.68 | )% | 1.66 | % | ||||||||||||||||||||||||||||||
| Ratios/Supplemental Data: | ||||||||||||||||||||||||||||||||||||||||
| Net assets, end of year (in 000s) | $ | 32,074 | $ | 35,638 | $ | 36,104 | $ | 28,650 | $ | 28,518 | ||||||||||||||||||||||||||||||
| Ratios of expenses to average net assets: | 1.54 | % | 1.80 | % | 1.83 | % | 1.63 | % | 2.15 | % | ||||||||||||||||||||||||||||||
| Ratios of net investment income (loss) to average net assets: | 1.29 | % | 0.20 | % | (0.32 | )% | (0.03 | )% | (1.37 | )% | ||||||||||||||||||||||||||||||
| Portfolio turnover rate | 28 | % | 11 | % | 7 | % | 54 | % | 70 | % | ||||||||||||||||||||||||||||||
| Class A | Class C | |||||||||||||||||||||||||||||||||||||||
| Year Ended October 31, | Year Ended October 31, | |||||||||||||||||||||||||||||||||||||||
| 2019 | 2018 | 2017 | 2016 | 2015 | 2019 | 2018 | 2017 | 2016 | 2015 | |||||||||||||||||||||||||||||||
| Net asset value, beginning of year | $ | 9.46 | $ | 10.12 | $ | 9.52 | $ | 9.81 | $ | 9.68 | $ | 9.03 | $ | 9.74 | $ | 9.23 | $ | 9.58 | $ | 9.52 | ||||||||||||||||||||
| Income (loss) from investment operations: | ||||||||||||||||||||||||||||||||||||||||
| Net investment income (loss) * | 0.10 | 0.00 | (a) | (0.06 | ) | (0.02 | ) | (0.14 | ) | 0.02 | (0.08 | ) | (0.12 | ) | (0.09 | ) | (0.26 | ) | ||||||||||||||||||||||
| Net realized and unrealized gain (loss) ** | 0.64 | (0.66 | ) | 0.66 | (0.27 | ) | 0.27 | 0.63 | (0.63 | ) | 0.63 | (0.26 | ) | 0.32 | ||||||||||||||||||||||||||
| Total income (loss) from investment operations | 0.74 | (0.66 | ) | 0.60 | (0.29 | ) | 0.13 | 0.65 | (0.71 | ) | 0.51 | (0.35 | ) | 0.06 | ||||||||||||||||||||||||||
| Less distributions: | ||||||||||||||||||||||||||||||||||||||||
| Distributions from net investment income | (0.15 | ) | — | — | — | — | (0.08 | ) | — | — | — | — | ||||||||||||||||||||||||||||
| Tax return of capital | (0.05 | ) | — | — | — | — | (0.05 | ) | — | — | — | — | ||||||||||||||||||||||||||||
| Total distributions | (0.20 | ) | — | — | — | — | (0.13 | ) | — | — | — | — | ||||||||||||||||||||||||||||
| Net asset value, end of year | $ | 10.00 | $ | 9.46 | $ | 10.12 | $ | 9.52 | $ | 9.81 | $ | 9.55 | $ | 9.03 | $ | 9.74 | $ | 9.23 | $ | 9.58 | ||||||||||||||||||||
| Total return + # | 8.04 | % | (6.52 | )% | 6.30 | % | (2.95 | )% | 1.34 | % | 7.31 | % | (7.29 | )% | 5.53 | % | (3.66 | )% | 0.63 | % | ||||||||||||||||||||
| Ratios/Supplemental Data: | ||||||||||||||||||||||||||||||||||||||||
| Net assets, end of year (in 000s) | $ | 7,713 | $ | 7,918 | $ | 6,224 | $ | 3,897 | $ | 3,296 | $ | 1,927 | $ | 1,696 | $ | 1,969 | $ | 2,131 | $ | 1,938 | ||||||||||||||||||||
| Ratios of expenses to average net assets: | 1.79 | % | 2.05 | % | 2.08 | % | 1.88 | % | 2.40 | % | 2.54 | % | 2.80 | % | 2.83 | % | 2.63 | % | 3.15 | % | ||||||||||||||||||||
| Ratios of net investment income (loss) to average net assets: | 1.03 | % | 0.00 | % (b) | (0.58 | )% | (0.26 | )% | (1.63 | )% | 0.20 | % | (0.84 | )% | (1.34 | )% | (1.02 | )% | (2.35 | )% | ||||||||||||||||||||
| Portfolio turnover rate | 28 | % | 11 | % | 7 | % | 54 | % | 70 | % | 28 | % | 11 | % | 7 | % | 54 | % | 70 | % | ||||||||||||||||||||
| * | The net investment income (loss) per share data was determined using the average shares outstanding throughout each year. |
| ** | The amount of net realized and unrealized gain (loss) on investment per share for the year ended October 31, 2015 does not accord with the amounts in the Statements of Operations due to the timing of purchases and sales of Fund shares in relation to fluctuating market values. |
| + | Assumes reinvestment of all dividends and distributions, if any. Total return does not reflect the deductions of taxes that a shareholder would pay on distributions or on the redemption of shares and does not reflect the impact of any sales charge. |
| # | Includes adjustments in accordance with accounting principles generally accepted in the United States and, consequently, the net asset values for financial reporting purposes and the returns based upon those net asset values may differ from the net asset values and returns for shareholder transactions. Adjustments may apply to some but not all years and classes. |
| (a) | Represents less than $0.01 per share. |
| (b) | Represents less than 0.01%. |
See accompanying notes to financial statements.
84
| FINANCIAL HIGHLIGHTS |
| Dunham High-Yield Bond Fund |
The table sets forth financial data for one share of beneficial interest outstanding throughout each year.
| Class N | ||||||||||||||||||||||||||||||||||||||||
| Year Ended October 31, | ||||||||||||||||||||||||||||||||||||||||
| 2019 | 2018 | 2017 | 2016 | 2015 | ||||||||||||||||||||||||||||||||||||
| Net asset value, beginning of year | $ | 8.72 | $ | 9.22 | $ | 8.94 | $ | 8.92 | $ | 9.51 | ||||||||||||||||||||||||||||||
| Income (loss) from investment operations: | ||||||||||||||||||||||||||||||||||||||||
| Net investment income* | 0.45 | 0.44 | 0.42 | 0.44 | 0.44 | |||||||||||||||||||||||||||||||||||
| Net realized and unrealized gain (loss) | 0.26 | (0.51 | ) | 0.30 | 0.02 | (0.59 | ) | |||||||||||||||||||||||||||||||||
| Total income (loss) from investment operations | 0.71 | (0.07 | ) | 0.72 | 0.46 | (0.15 | ) | |||||||||||||||||||||||||||||||||
| Less distributions: | ||||||||||||||||||||||||||||||||||||||||
| Distributions from net investment income | (0.46 | ) | (0.43 | ) | (0.44 | ) | (0.44 | ) | (0.44 | ) | ||||||||||||||||||||||||||||||
| Total distributions | (0.46 | ) | (0.43 | ) | (0.44 | ) | (0.44 | ) | (0.44 | ) | ||||||||||||||||||||||||||||||
| Net asset value, end of year | $ | 8.97 | $ | 8.72 | $ | 9.22 | $ | 8.94 | $ | 8.92 | ||||||||||||||||||||||||||||||
| Total return + # | 8.42 | % | (0.80 | )% | 8.19 | % | 5.39 | % | (1.63 | )% | ||||||||||||||||||||||||||||||
| Ratios/Supplemental Data: | ||||||||||||||||||||||||||||||||||||||||
| Net assets, end of year (in 000s) | $ | 90,262 | $ | 94,596 | $ | 103,567 | $ | 78,194 | $ | 78,654 | ||||||||||||||||||||||||||||||
| Ratios of expenses to average net assets: | 1.12 | % | 1.12 | % | 1.19 | % | 1.08 | % | 1.02 | % | ||||||||||||||||||||||||||||||
| Ratios of net investment income to average net assets: | 5.12 | % | 4.84 | % | 4.62 | % | 5.09 | % | 4.77 | % | ||||||||||||||||||||||||||||||
| Portfolio turnover rate | 70 | % | 101 | % | 142 | % | 62 | % | 51 | % | ||||||||||||||||||||||||||||||
| Class A | Class C | |||||||||||||||||||||||||||||||||||||||
| Year Ended October 31, | Year Ended October 31, | |||||||||||||||||||||||||||||||||||||||
| 2019 | 2018 | 2017 | 2016 | 2015 | 2019 | 2018 | 2017 | 2016 | 2015 | |||||||||||||||||||||||||||||||
| Net asset value, beginning of year | $ | 8.81 | $ | 9.29 | $ | 9.02 | $ | 8.99 | $ | 9.58 | $ | 8.68 | $ | 9.17 | $ | 8.88 | $ | 8.86 | $ | 9.46 | ||||||||||||||||||||
| Income (loss) from investment operations: | ||||||||||||||||||||||||||||||||||||||||
| Net investment income* | 0.44 | 0.42 | 0.40 | 0.42 | 0.41 | 0.39 | 0.37 | 0.35 | 0.37 | 0.37 | ||||||||||||||||||||||||||||||
| Net realized and unrealized gain (loss) | 0.25 | (0.49 | ) | 0.28 | 0.03 | (0.59 | ) | 0.25 | (0.50 | ) | 0.30 | 0.02 | (0.60 | ) | ||||||||||||||||||||||||||
| Total income (loss) from investment operations | 0.69 | (0.07 | ) | 0.68 | 0.45 | (0.18 | ) | 0.64 | (0.13 | ) | 0.65 | 0.39 | (0.23 | ) | ||||||||||||||||||||||||||
| Less distributions: | ||||||||||||||||||||||||||||||||||||||||
| Distributions from net investment income | (0.44 | ) | (0.41 | ) | (0.41 | ) | (0.42 | ) | (0.41 | ) | (0.40 | ) | (0.36 | ) | (0.36 | ) | (0.37 | ) | (0.37 | ) | ||||||||||||||||||||
| Total distributions | (0.44 | ) | (0.41 | ) | (0.41 | ) | (0.42 | ) | (0.41 | ) | (0.40 | ) | (0.36 | ) | (0.36 | ) | (0.37 | ) | (0.37 | ) | ||||||||||||||||||||
| Net asset value, end of year | $ | 9.06 | $ | 8.81 | $ | 9.29 | $ | 9.02 | $ | 8.99 | $ | 8.92 | $ | 8.68 | $ | 9.17 | $ | 8.88 | $ | 8.86 | ||||||||||||||||||||
| Total return + # | 8.07 | % | (0.82 | )% | 7.70 | % | 5.21 | % | (1.88 | )% | 7.55 | % | (1.43 | )% | 7.45 | % | 4.65 | % | (2.47 | )% | ||||||||||||||||||||
| Ratios/Supplemental Data: | ||||||||||||||||||||||||||||||||||||||||
| Net assets, end of year (in 000s) | $ | 12,336 | $ | 12,393 | $ | 12,085 | $ | 10,478 | $ | 10,224 | $ | 7,497 | $ | 7,392 | $ | 7,785 | $ | 7,687 | $ | 9,231 | ||||||||||||||||||||
| Ratios of expenses to average net assets: | 1.37 | % | 1.37 | % | 1.44 | % | 1.33 | % | 1.27 | % | 1.87 | % | 1.87 | % | 1.94 | % | 1.83 | % | 1.77 | % | ||||||||||||||||||||
| Ratios of net investment income to average net assets: | 4.87 | % | 4.60 | % | 4.38 | % | 4.84 | % | 4.52 | % | 4.37 | % | 4.09 | % | 3.88 | % | 4.34 | % | 4.02 | % | ||||||||||||||||||||
| Portfolio turnover rate | 70 | % | 101 | % | 142 | % | 62 | % | 51 | % | 70 | % | 101 | % | 142 | % | 62 | % | 51 | % | ||||||||||||||||||||
| * | The net investment income per share data was determined using the average shares outstanding throughout each year. |
| + | Assumes reinvestment of all dividends and distributions, if any. Total return does not reflect the deductions of taxes that a shareholder would pay on distributions or on the redemption of shares and does not reflect the impact of any sales charge. |
| # | Includes adjustments in accordance with accounting principles generally accepted in the United States and, consequently, the net asset values for financial reporting purposes and the returns based upon those net asset values may differ from the net asset values and returns for shareholder transactions. Adjustments may apply to some but not all years and classes. |
See accompanying notes to financial statements.
85
| FINANCIAL HIGHLIGHTS |
| Dunham International Opportunity Bond Fund |
The table sets forth financial data for one share of beneficial interest outstanding throughout each year.
| Class N | ||||||||||||||||||||||||||||||||||||||||
| Year Ended October 31, | ||||||||||||||||||||||||||||||||||||||||
| 2019 | 2018 | 2017 | 2016 | 2015 | ||||||||||||||||||||||||||||||||||||
| Net asset value, beginning of year | $ | 8.93 | $ | 9.32 | $ | 9.37 | $ | 8.92 | $ | 9.64 | ||||||||||||||||||||||||||||||
| Income (loss) from investment operations: | ||||||||||||||||||||||||||||||||||||||||
| Net investment income (loss)* | (0.03 | ) | (0.03 | ) | (0.03 | ) | 0.04 | 0.05 | ||||||||||||||||||||||||||||||||
| Net realized and unrealized gain (loss) | 0.58 | (0.35 | ) | 0.07 | 0.42 | (0.77 | ) | |||||||||||||||||||||||||||||||||
| Total income (loss) from investment operations | 0.55 | (0.38 | ) | 0.04 | 0.46 | (0.72 | ) | |||||||||||||||||||||||||||||||||
| Less distributions: | ||||||||||||||||||||||||||||||||||||||||
| Distributions from net investment income | (0.04 | ) | — | — | (0.01 | ) | — | |||||||||||||||||||||||||||||||||
| Distributions from net realized gains | (0.01 | ) | (0.01 | ) | (0.09 | ) | — | — | ||||||||||||||||||||||||||||||||
| Total distributions | (0.05 | ) | (0.01 | ) | (0.09 | ) | (0.01 | ) | — | |||||||||||||||||||||||||||||||
| Net asset value, end of year | $ | 9.43 | $ | 8.93 | $ | 9.32 | $ | 9.37 | $ | 8.92 | ||||||||||||||||||||||||||||||
| Total return + # | 6.29 | % | (4.08 | )% | 0.57 | % | 5.14 | % | (7.42 | )% | �� | |||||||||||||||||||||||||||||
| Ratios/Supplemental Data: | ||||||||||||||||||||||||||||||||||||||||
| Net assets, end of year (in 000s) | $ | 32,927 | $ | 31,838 | $ | 32,441 | $ | 24,728 | $ | 31,935 | ||||||||||||||||||||||||||||||
| Ratios of expenses to average net assets: | 1.36 | % | 1.35 | % | 1.54 | % | 1.28 | % | 1.38 | % | ||||||||||||||||||||||||||||||
| Ratios of net investment income (loss) to average net assets: | (0.30 | )% | (0.35 | )% | (0.37 | )% | 0.41 | % | 0.52 | % | ||||||||||||||||||||||||||||||
| Portfolio turnover rate | 109 | % | 45 | % | 56 | % | 64 | % | 52 | % | ||||||||||||||||||||||||||||||
| Class A | Class C | |||||||||||||||||||||||||||||||||||||||
| Year Ended October 31, | Year Ended October 31, | |||||||||||||||||||||||||||||||||||||||
| 2019 | 2018 | 2017 | 2016 | 2015 | 2019 | 2018 | 2017 | 2016 | 2015 | |||||||||||||||||||||||||||||||
| Net asset value, beginning of year | $ | 8.85 | $ | 9.26 | $ | 9.32 | $ | 8.90 | $ | 9.64 | $ | 8.66 | $ | 9.10 | $ | 9.22 | $ | 8.84 | $ | 9.62 | ||||||||||||||||||||
| Income (loss) from investment operations: | ||||||||||||||||||||||||||||||||||||||||
| Net investment income (loss)* | (0.05 | ) | (0.06 | ) | (0.06 | ) | 0.01 | 0.02 | (0.09 | ) | (0.10 | ) | (0.10 | ) | (0.03 | ) | (0.02 | ) | ||||||||||||||||||||||
| Net realized and unrealized gain (loss) | 0.57 | (0.34 | ) | 0.09 | 0.41 | (0.76 | ) | 0.55 | (0.33 | ) | 0.07 | 0.41 | (0.76 | ) | ||||||||||||||||||||||||||
| Total income (loss) from investment operations | 0.52 | (0.40 | ) | 0.03 | 0.42 | (0.74 | ) | 0.46 | (0.43 | ) | (0.03 | ) | 0.38 | (0.78 | ) | |||||||||||||||||||||||||
| Less distributions: | ||||||||||||||||||||||||||||||||||||||||
| Distributions from net investment income | (0.02 | ) | — | — | (0.00 | ) (a) | — | — | — | — | (0.00 | ) (a) | — | |||||||||||||||||||||||||||
| Distributions from net realized gains | (0.01 | ) | (0.01 | ) | (0.09 | ) | — | — | (0.01 | ) | (0.01 | ) | (0.09 | ) | — | — | ||||||||||||||||||||||||
| Total distributions | (0.03 | ) | (0.01 | ) | (0.09 | ) | (0.00 | ) (a) | — | (0.01 | ) | (0.01 | ) | (0.09 | ) | (0.00 | ) (a) | — | ||||||||||||||||||||||
| Net asset value, end of year | $ | 9.34 | $ | 8.85 | $ | 9.26 | $ | 9.32 | $ | 8.90 | $ | 9.11 | $ | 8.66 | $ | 9.10 | $ | 9.22 | $ | 8.84 | ||||||||||||||||||||
| Total return + # | 5.98 | % | (4.32 | )% | 0.46 | % | 4.77 | % | (7.65 | )% | 5.36 | % | (4.72 | )% | (0.19 | )% | 4.31 | % | (8.11 | )% | ||||||||||||||||||||
| Ratios/Supplemental Data: | ||||||||||||||||||||||||||||||||||||||||
| Net assets, end of year (in 000s) | $ | 4,357 | $ | 3,802 | $ | 2,968 | $ | 2,118 | $ | 3,208 | $ | 1,442 | $ | 1,366 | $ | 1,330 | $ | 1,204 | $ | 1,638 | ||||||||||||||||||||
| Ratios of expenses to average net assets: | 1.61 | % | 1.60 | % | 1.79 | % | 1.53 | % | 1.63 | % | 2.11 | % | 2.10 | % | 2.29 | % | 2.03 | % | 2.13 | % | ||||||||||||||||||||
| Ratios of net investment income (loss) to average net assets: | (0.55 | )% | (0.59 | )% | (0.63 | )% | 0.10 | % | 0.29 | % | (1.05 | )% | (1.10 | )% | (1.11 | )% | (0.33 | )% | (0.24 | )% | ||||||||||||||||||||
| Portfolio turnover rate | 109 | % | 45 | % | 56 | % | 64 | % | 52 | % | 109 | % | 45 | % | 56 | % | 64 | % | 52 | % | ||||||||||||||||||||
| * | The net investment income (loss) per share data was determined using the average shares outstanding throughout the year. |
| + | Assumes reinvestment of all dividends and distributions, if any. Total return does not reflect the deductions of taxes that a shareholder would pay on distributions or on the redemption of shares and does not reflect the impact of any sales charge. |
| # | Includes adjustments in accordance with accounting principles generally accepted in the United States and, consequently, the net asset values for financial reporting purposes and the returns based upon those net asset values may differ from the net asset values and returns for shareholder transactions. Adjustments may apply to some but not all years and classes. |
| (a) | Represents less than $0.01 per share. |
See accompanying notes to financial statements.
86
| FINANCIAL HIGHLIGHTS |
| Dunham Large Cap Value Fund |
| The table sets forth financial data for one share of beneficial interest outstanding throughout each year. |
| Class N | ||||||||||||||||||||||||||||||||||||||||
| Year Ended October 31, | ||||||||||||||||||||||||||||||||||||||||
| 2019 | 2018 | 2017 | 2016 | 2015 | ||||||||||||||||||||||||||||||||||||
| Net asset value, beginning of year | $ | 14.18 | $ | 14.16 | $ | 12.22 | $ | 16.32 | $ | 16.21 | ||||||||||||||||||||||||||||||
| Income from investment operations: | ||||||||||||||||||||||||||||||||||||||||
| Net investment income * | 0.18 | 0.14 | 0.15 | 0.22 | 0.17 | |||||||||||||||||||||||||||||||||||
| Net realized and unrealized gain (loss) | 1.29 | 0.15 | 2.01 | (0.04 | ) | 0.06 | ||||||||||||||||||||||||||||||||||
| Total income from investment operations | 1.47 | 0.29 | 2.16 | 0.18 | 0.23 | |||||||||||||||||||||||||||||||||||
| Less distributions: | ||||||||||||||||||||||||||||||||||||||||
| Distributions from net investment income | (0.15 | ) | (0.13 | ) | (0.22 | ) | (0.18 | ) | (0.12 | ) | ||||||||||||||||||||||||||||||
| Distributions from net realized gains | (0.54 | ) | (0.14 | ) | — | (4.10 | ) | — | ||||||||||||||||||||||||||||||||
| Total distributions | (0.69 | ) | (0.27 | ) | (0.22 | ) | (4.28 | ) | (0.12 | ) | ||||||||||||||||||||||||||||||
| Net asset value, end of year | $ | 14.96 | $ | 14.18 | $ | 14.16 | $ | 12.22 | $ | 16.32 | ||||||||||||||||||||||||||||||
| Total return + # | 11.37 | % | 1.98 | % | 17.84 | % | 1.73 | % | 1.41 | % | ||||||||||||||||||||||||||||||
| Ratios/Supplemental Data: | ||||||||||||||||||||||||||||||||||||||||
| Net assets, end of year (in 000s) | $ | 61,791 | $ | 55,428 | $ | 55,155 | $ | 45,026 | $ | 44,620 | ||||||||||||||||||||||||||||||
| Ratios of expenses to average net assets: | ||||||||||||||||||||||||||||||||||||||||
| Before fees paid indirectly | 1.14 | % | 1.30 | % | 1.13 | % | 0.93 | % | 1.12 | % | ||||||||||||||||||||||||||||||
| After fees paid indirectly | 1.14 | % | 1.30 | % | 1.12 | % | 0.93 | % | 1.12 | % | ||||||||||||||||||||||||||||||
| Ratios of net investment income to average net assets: | ||||||||||||||||||||||||||||||||||||||||
| Before fees paid indirectly | 1.30 | % | 0.94 | % | 1.12 | % | 1.81 | % | 1.03 | % | ||||||||||||||||||||||||||||||
| After fees paid indirectly | 1.30 | % | 0.94 | % | 1.13 | % | 1.81 | % | 1.03 | % | ||||||||||||||||||||||||||||||
| Portfolio turnover rate | 44 | % | 45 | % | 61 | % | 59 | % | 101 | % | ||||||||||||||||||||||||||||||
| Class A | Class C | |||||||||||||||||||||||||||||||||||||||
| Year Ended October 31, | Year Ended October 31, | |||||||||||||||||||||||||||||||||||||||
| 2019 | 2018 | 2017 | 2016 | 2015 | 2019 | 2018 | 2017 | 2016 | 2015 | |||||||||||||||||||||||||||||||
| Net asset value, beginning of year | $ | 14.11 | $ | 14.10 | $ | 12.16 | $ | 16.26 | $ | 16.16 | $ | 13.45 | $ | 13.47 | $ | 11.65 | $ | 15.74 | $ | 15.68 | ||||||||||||||||||||
| Income from investment operations: | ||||||||||||||||||||||||||||||||||||||||
| Net investment income (loss)* | 0.15 | 0.10 | 0.11 | 0.19 | 0.13 | 0.04 | (0.01 | ) | 0.02 | 0.10 | 0.00 | (a) | ||||||||||||||||||||||||||||
| Net realized and unrealized gain (loss) | 1.27 | 0.15 | 2.02 | (0.05 | ) | 0.06 | 1.23 | 0.15 | 1.92 | (0.06 | ) | 0.06 | ||||||||||||||||||||||||||||
| Total income from investment operations | 1.42 | 0.25 | 2.13 | 0.14 | 0.19 | 1.27 | 0.14 | 1.94 | 0.04 | 0.06 | ||||||||||||||||||||||||||||||
| Less distributions: | ||||||||||||||||||||||||||||||||||||||||
| Distributions from net investment income | (0.12 | ) | (0.10 | ) | (0.19 | ) | (0.14 | ) | (0.09 | ) | (0.01 | ) | (0.02 | ) | (0.12 | ) | (0.03 | ) | — | |||||||||||||||||||||
| Distributions from net realized gains | (0.54 | ) | (0.14 | ) | 0.00 | (4.10 | ) | — | (0.54 | ) | (0.14 | ) | — | (4.10 | ) | — | ||||||||||||||||||||||||
| Total distributions | (0.66 | ) | (0.24 | ) | (0.19 | ) | (4.24 | ) | (0.09 | ) | (0.55 | ) | (0.16 | ) | (0.12 | ) | (4.13 | ) | — | |||||||||||||||||||||
| Net asset value, end of year | $ | 14.87 | $ | 14.11 | $ | 14.10 | $ | 12.16 | $ | 16.26 | $ | 14.17 | $ | 13.45 | $ | 13.47 | $ | 11.65 | $ | 15.74 | ||||||||||||||||||||
| Total return + # | 11.00 | % | 1.71 | % | 17.66 | % | 1.43 | % | 1.15 | % | 10.24 | % | 1.00 | % | 16.72 | % | 0.66 | % | 0.38 | % | ||||||||||||||||||||
| Ratios/Supplemental Data: | ||||||||||||||||||||||||||||||||||||||||
| Net assets, end of year (in 000s) | $ | 16,363 | $ | 12,525 | $ | 10,174 | $ | 6,544 | $ | 6,577 | $ | 5,319 | $ | 4,167 | $ | 4,640 | $ | 4,850 | $ | 5,805 | ||||||||||||||||||||
| Ratios of expenses to average net assets: | ||||||||||||||||||||||||||||||||||||||||
| Before fees paid indirectly | 1.39 | % | 1.55 | % | 1.38 | % | 1.18 | % | 1.37 | % | 2.14 | % | 2.30 | % | 2.13 | % | 1.93 | % | 2.12 | % | ||||||||||||||||||||
| After fees paid indirectly | 1.39 | % | 1.55 | % | 1.37 | % | 1.18 | % | 1.37 | % | 2.14 | % | 2.30 | % | 2.12 | % | 1.93 | % | 2.12 | % | ||||||||||||||||||||
| Ratios of net investment income (loss) to average net assets: | ||||||||||||||||||||||||||||||||||||||||
| Before fees paid indirectly | 1.05 | % | 0.70 | % | 0.84 | % | 1.57 | % | 0.78 | % | 0.30 | % | (0.07 | )% | 0.14 | % | 0.83 | % | 0.03 | % | ||||||||||||||||||||
| After fees paid indirectly | 1.05 | % | 0.70 | % | 0.85 | % | 1.57 | % | 0.78 | % | 0.30 | % | (0.07 | )% | 0.15 | % | 0.83 | % | 0.03 | % | ||||||||||||||||||||
| Portfolio turnover rate | 44 | % | 45 | % | 61 | % | 59 | % | 101 | % | 44 | % | 45 | % | 61 | % | 59 | % | 101 | % | ||||||||||||||||||||
| * | The net investment income (loss) per share data was determined using the average shares outstanding throughout each year. |
| + | Assumes reinvestment of all dividends and distributions, if any. Total return does not reflect the deductions of taxes that a shareholder would pay on distributions or on the redemption of shares and does not reflect the impact of any sales charge. |
| # | Includes adjustments in accordance with accounting principles generally accepted in the United States and, consequently, the net asset values for financial reporting purposes and the returns based upon those net asset values may differ from the net asset values and returns for shareholder transactions. Adjustments may apply to some but not all years and classes. |
| (a) | Represents less than $0.01 per share. |
See accompanying notes to financial statements.
87
| FINANCIAL HIGHLIGHTS |
| Dunham Focused Large Cap Growth Fund |
| The table sets forth financial data for one share of beneficial interest outstanding throughout each year. |
| Class N | ||||||||||||||||||||||||||||||||||||||||
| Year Ended October 31, | ||||||||||||||||||||||||||||||||||||||||
| 2019 | 2018 | 2017 | 2016 | 2015 | ||||||||||||||||||||||||||||||||||||
| Net asset value, beginning of year | $ | 22.50 | $ | 19.37 | $ | 15.92 | $ | 16.97 | $ | 15.01 | ||||||||||||||||||||||||||||||
| Income (loss) from investment operations: | ||||||||||||||||||||||||||||||||||||||||
| Net investment loss* | (0.25 | ) | (0.22 | ) | (0.14 | ) | (0.10 | ) | (0.16 | ) | ||||||||||||||||||||||||||||||
| Net realized and unrealized gain (loss) | 3.69 | 3.53 | 3.59 | (0.86 | ) | 2.12 | ||||||||||||||||||||||||||||||||||
| Total income (loss) from investment operations | 3.44 | 3.31 | 3.45 | (0.96 | ) | 1.96 | ||||||||||||||||||||||||||||||||||
| Less distributions: | ||||||||||||||||||||||||||||||||||||||||
| Distributions from net realized gains | (1.70 | ) | (0.18 | ) | — | (0.09 | ) | — | ||||||||||||||||||||||||||||||||
| Total distributions | (1.70 | ) | (0.18 | ) | — | (0.09 | ) | — | ||||||||||||||||||||||||||||||||
| Net asset value, end of year | $ | 24.24 | $ | 22.50 | $ | 19.37 | $ | 15.92 | $ | 16.97 | ||||||||||||||||||||||||||||||
| Total return + # | 17.19 | % | 17.24 | % | 21.67 | % | (5.66 | )% | 13.06 | % | ||||||||||||||||||||||||||||||
| Ratios/Supplemental Data: | ||||||||||||||||||||||||||||||||||||||||
| Net assets, end of year (in 000s) | $ | 74,714 | $ | 59,424 | $ | 56,472 | $ | 51,242 | $ | 51,312 | ||||||||||||||||||||||||||||||
| Ratios of expenses to average net assets: | ||||||||||||||||||||||||||||||||||||||||
| Before fee waivers and fees paid indirectly | 1.33 | % | 1.30 | % | 1.16 | % | 1.20 | % | 1.34 | % | ||||||||||||||||||||||||||||||
| After fee waivers and fees paid indirectly | 1.33 | % | 1.29 | % | 1.14 | % | 1.20 | % | 1.34 | % | ||||||||||||||||||||||||||||||
| Ratios of net investment loss to average net assets: | ||||||||||||||||||||||||||||||||||||||||
| Before fee waivers and fees paid indirectly | (1.06 | )% | (1.01 | )% | (0.79 | )% | (0.64 | )% | (1.00 | )% | ||||||||||||||||||||||||||||||
| After fee waivers and fees paid indirectly | (1.06 | )% | (1.01 | )% | (0.77 | )% | (0.64 | )% | (1.00 | )% | ||||||||||||||||||||||||||||||
| Portfolio turnover rate | 28 | % | 25 | % | 38 | % | 29 | % | 45 | % | ||||||||||||||||||||||||||||||
| Class A | Class C | |||||||||||||||||||||||||||||||||||||||
| Year Ended October 31, | Year Ended October 31, | |||||||||||||||||||||||||||||||||||||||
| 2019 | 2018 | 2017 | 2016 | 2015 | 2019 | 2018 | 2017 | 2016 | 2015 | |||||||||||||||||||||||||||||||
| Net asset value, beginning of year | $ | 22.11 | $ | 19.08 | $ | 15.73 | $ | 16.80 | $ | 14.91 | $ | 21.00 | $ | 18.27 | $ | 15.17 | $ | 16.33 | $ | 14.59 | ||||||||||||||||||||
| Income (loss) from investment operations: | ||||||||||||||||||||||||||||||||||||||||
| Net investment loss* | (0.30 | ) | (0.28 | ) | (0.18 | ) | (0.14 | ) | (0.19 | ) | (0.44 | ) | (0.42 | ) | (0.30 | ) | (0.25 | ) | (0.31 | ) | ||||||||||||||||||||
| Net realized and unrealized gain (loss) | 3.60 | 3.49 | 3.53 | (0.84 | ) | 2.08 | 3.39 | 3.33 | 3.40 | (0.82 | ) | 2.05 | ||||||||||||||||||||||||||||
| Total income (loss) from investment operations | 3.30 | 3.21 | 3.35 | (0.98 | ) | 1.89 | 2.95 | 2.91 | 3.10 | (1.07 | ) | 1.74 | ||||||||||||||||||||||||||||
| Less distributions: | ||||||||||||||||||||||||||||||||||||||||
| Distributions from net realized gains | (1.70 | ) | (0.18 | ) | — | (0.09 | ) | — | (1.70 | ) | (0.18 | ) | — | (0.09 | ) | — | ||||||||||||||||||||||||
| Total distributions | (1.70 | ) | (0.18 | ) | — | (0.09 | ) | — | (1.70 | ) | (0.18 | ) | — | (0.09 | ) | — | ||||||||||||||||||||||||
| Net asset value, end of year | $ | 23.71 | $ | 22.11 | $ | 19.08 | $ | 15.73 | $ | 16.80 | $ | 22.25 | $ | 21.00 | $ | 18.27 | $ | 15.17 | $ | 16.33 | ||||||||||||||||||||
| Total return + # | 16.84 | % | 16.98 | % | 21.30 | % | (5.84 | )% | 12.68 | % | 16.00 | % | 16.08 | % | 20.44 | % | (6.56 | )% | 11.93 | % | ||||||||||||||||||||
| Ratios/Supplemental Data: | ||||||||||||||||||||||||||||||||||||||||
| Net assets, end of year (in 000s) | $ | 24,131 | $ | 15,031 | $ | 12,944 | $ | 9,620 | $ | 8,762 | $ | 8,314 | $ | 6,844 | $ | 6,758 | $ | 4,988 | $ | 5,222 | ||||||||||||||||||||
| Ratios of expenses to average net assets: | ||||||||||||||||||||||||||||||||||||||||
| Before fee waivers and fees paid indirectly | 1.58 | % | 1.55 | % | 1.41 | % | 1.45 | % | 1.59 | % | 2.33 | % | 2.30 | % | 2.16 | % | 2.20 | % | 2.34 | % | ||||||||||||||||||||
| After fee waivers and fees paid indirectly | 1.58 | % | 1.54 | % | 1.39 | % | 1.45 | % | 1.59 | % | 2.33 | % | 2.29 | % | 2.14 | % | 2.20 | % | 2.34 | % | ||||||||||||||||||||
| Ratios of net investment loss to average net assets: | ||||||||||||||||||||||||||||||||||||||||
| Before fee waivers and fees paid indirectly | (1.32 | )% | (1.26 | )% | (1.05 | )% | (0.91 | )% | (1.20 | )% | (2.06 | )% | (2.01 | )% | (1.80 | )% | (1.67 | )% | (2.00 | )% | ||||||||||||||||||||
| After fee waivers and fees paid indirectly | (1.32 | )% | (1.26 | )% | (1.03 | )% | (0.91 | )% | (1.20 | )% | (2.06 | )% | (2.01 | )% | (1.78 | )% | (1.67 | )% | (2.00 | )% | ||||||||||||||||||||
| Portfolio turnover rate | 28 | % | 25 | % | 38 | % | 29 | % | 45 | % | 28 | % | 25 | % | 38 | % | 29 | % | 45 | % | ||||||||||||||||||||
| * | The net investment income (loss) per share data was determined using the average shares outstanding throughout each year. |
| + | Assumes reinvestment of all dividends and distributions, if any. Total return does not reflect the deductions of taxes that a shareholder would pay on distributions or on the redemption of shares and does not reflect the impact of any sales charge. |
| # | Includes adjustments in accordance with accounting principles generally accepted in the United States and, consequently, the net asset values for financial reporting purposes and the returns based upon those net asset values may differ from the net asset values and returns for shareholder transactions. Adjustments may apply to some but not all years and classes. |
See accompanying notes to financial statements.
88
| FINANCIAL HIGHLIGHTS |
| Dunham International Stock Fund |
| The table sets forth financial data for one share of beneficial interest outstanding throughout each year. |
| Class N | ||||||||||||||||||||||||||||||||||||||||
| Year Ended October 31, | ||||||||||||||||||||||||||||||||||||||||
| 2019 | 2018 | 2017 | 2016 | 2015 | ||||||||||||||||||||||||||||||||||||
| Net asset value, beginning of year | $ | 15.61 | $ | 17.54 | $ | 14.24 | $ | 14.24 | $ | 15.21 | ||||||||||||||||||||||||||||||
| Income (loss) from investment operations: | ||||||||||||||||||||||||||||||||||||||||
| Net investment income * | 0.34 | 0.21 | 0.21 | 0.16 | 0.00 | (a) | ||||||||||||||||||||||||||||||||||
| Net realized and unrealized gain (loss) | 0.62 | (1.39 | ) | 3.09 | (0.15 | ) | (0.61 | ) | ||||||||||||||||||||||||||||||||
| Total income (loss) from investment operations | 0.96 | (1.18 | ) | 3.30 | 0.01 | (0.61 | ) | |||||||||||||||||||||||||||||||||
| Less distributions: | ||||||||||||||||||||||||||||||||||||||||
| Distributions from net investment income | (0.18 | ) | (0.26 | ) | — | (0.01 | ) | (0.30 | ) | |||||||||||||||||||||||||||||||
| Distributions from net realized gains | (0.88 | ) | (0.49 | ) | — | — | (0.06 | ) | ||||||||||||||||||||||||||||||||
| Total distributions | (1.06 | ) | (0.75 | ) | — | (0.01 | ) | (0.36 | ) | |||||||||||||||||||||||||||||||
| Net asset value, end of year | $ | 15.51 | $ | 15.61 | $ | 17.54 | $ | 14.24 | $ | 14.24 | ||||||||||||||||||||||||||||||
| Total return + # | 7.08 | % | (7.08 | )% | 23.17 | % | 0.06 | % | (4.10 | )% | ||||||||||||||||||||||||||||||
| Ratios/Supplemental Data: | ||||||||||||||||||||||||||||||||||||||||
| Net assets, end of year (in 000s) | $ | 101,505 | $ | 89,401 | $ | 90,257 | $ | 78,640 | $ | 76,992 | ||||||||||||||||||||||||||||||
| Ratios of expenses to average net assets: | ||||||||||||||||||||||||||||||||||||||||
| Before fees paid indirectly | 1.43 | % | 1.67 | % | 1.56 | % | 1.63 | % | 2.04 | % | ||||||||||||||||||||||||||||||
| After fees paid indirectly | 1.43 | % | 1.67 | % | 1.55 | % | 1.63 | % | 2.04 | % | ||||||||||||||||||||||||||||||
| Ratios of net investment income to average net assets: | ||||||||||||||||||||||||||||||||||||||||
| Before fees paid indirectly | 2.28 | % | 1.24 | % | 1.34 | % | 1.17 | % | 0.03 | % | ||||||||||||||||||||||||||||||
| After fees paid indirectly | 2.28 | % | 1.24 | % | 1.35 | % | 1.17 | % | 0.03 | % | ||||||||||||||||||||||||||||||
| Portfolio turnover rate | 100 | % | 113 | % | 119 | % | 143 | % | 125 | % | ||||||||||||||||||||||||||||||
| Class A | Class C | |||||||||||||||||||||||||||||||||||||||
| Year Ended October 31, | Year Ended October 31, | |||||||||||||||||||||||||||||||||||||||
| 2019 | 2018 | 2017 | 2016 | 2015 | 2019 | 2018 | 2017 | 2016 | 2015 | |||||||||||||||||||||||||||||||
| Net asset value, beginning of year | $ | 15.49 | $ | 17.42 | $ | 14.17 | $ | 14.21 | $ | 15.16 | $ | 14.68 | $ | 16.59 | $ | 13.60 | $ | 13.73 | $ | 14.68 | ||||||||||||||||||||
| Income (loss) from investment operations: | ||||||||||||||||||||||||||||||||||||||||
| Net investment income (loss)* | 0.30 | 0.17 | 0.17 | 0.13 | (0.03 | ) | 0.18 | 0.04 | 0.04 | 0.03 | (0.14 | ) | ||||||||||||||||||||||||||||
| Net realized and unrealized gain (loss) | 0.61 | (1.38 | ) | 3.08 | (0.17 | ) | (0.60 | ) | 0.59 | (1.31 | ) | 2.95 | (0.16 | ) | (0.59 | ) | ||||||||||||||||||||||||
| Total income (loss) from investment operations | 0.91 | (1.21 | ) | 3.25 | (0.04 | ) | (0.63 | ) | 0.77 | (1.27 | ) | 2.99 | (0.13 | ) | (0.73 | ) | ||||||||||||||||||||||||
| Less distributions: | ||||||||||||||||||||||||||||||||||||||||
| Distributions from net investment income | (0.14 | ) | (0.23 | ) | — | — | (0.26 | ) | (0.02 | ) | (0.15 | ) | — | — | (0.16 | ) | ||||||||||||||||||||||||
| Distributions from net realized gains | (0.88 | ) | (0.49 | ) | — | — | (0.06 | ) | (0.88 | ) | (0.49 | ) | — | — | (0.06 | ) | ||||||||||||||||||||||||
| Total distributions | (1.02 | ) | (0.72 | ) | — | — | (0.32 | ) | (0.90 | ) | (0.64 | ) | — | — | (0.22 | ) | ||||||||||||||||||||||||
| Net asset value, end of year | $ | 15.38 | $ | 15.49 | $ | 17.42 | $ | 14.17 | $ | 14.21 | $ | 14.55 | $ | 14.68 | $ | 16.59 | $ | 13.60 | $ | 13.73 | ||||||||||||||||||||
| Total return + # | 6.78 | % | (7.30 | )% | 22.94 | % | (0.28 | )% | (4.26 | )% | 6.03 | % | (8.03 | )% | 21.99 | % | (0.95 | )% | (5.06 | )% | ||||||||||||||||||||
| Ratios/Supplemental Data: | ||||||||||||||||||||||||||||||||||||||||
| Net assets, end of year (in 000s) | $ | 22,499 | $ | 18,250 | $ | 15,524 | $ | 10,305 | $ | 9,032 | $ | 6,409 | $ | 5,764 | $ | 6,570 | $ | 6,483 | $ | 7,268 | ||||||||||||||||||||
| Ratios of expenses to average net assets: | ||||||||||||||||||||||||||||||||||||||||
| Before fees paid indirectly | 1.68 | % | 1.92 | % | 1.81 | % | 1.88 | % | 2.29 | % | 2.43 | % | 2.67 | % | 2.56 | % | 2.63 | % | 3.04 | % | ||||||||||||||||||||
| After fees paid indirectly | 1.68 | % | 1.92 | % | 1.80 | % | 1.88 | % | 2.29 | % | 2.43 | % | 2.67 | % | 2.55 | % | 2.63 | % | 3.04 | % | ||||||||||||||||||||
| Ratios of net investment income (loss) to average net assets: | ||||||||||||||||||||||||||||||||||||||||
| Before fees paid indirectly | 2.04 | % | 1.01 | % | 1.07 | % | 0.93 | % | (0.19 | )% | 1.26 | % | 0.22 | % | 0.30 | % | 0.20 | % | (0.94 | )% | ||||||||||||||||||||
| After fees paid indirectly | 2.04 | % | 1.01 | % | 1.08 | % | 0.93 | % | (0.19 | )% | 1.26 | % | 0.22 | % | 0.31 | % | 0.20 | % | (0.94 | )% | ||||||||||||||||||||
| Portfolio turnover rate | 100 | % | 113 | % | 119 | % | 143 | % | 125 | % | 100 | % | 113 | % | 119 | % | 143 | % | 125 | % | ||||||||||||||||||||
| * | The net investment income (loss) per share data was determined using the average shares outstanding throughout each year. |
| + | Assumes reinvestment of all dividends and distributions, if any. Total return does not reflect the deductions of taxes that a shareholder would pay on distributions or on the redemption of shares and does not reflect the impact of any sales charge. |
| # | Includes adjustments in accordance with accounting principles generally accepted in the United States and, consequently, the net asset values for financial reporting purposes and the returns based upon those net asset values may differ from the net asset values and returns for shareholder transactions. Adjustments may apply to some but not all years and classes. |
| (a) | Represents less than $0.01 per share. |
See accompanying notes to financial statements.
89
| FINANCIAL HIGHLIGHTS |
| Dunham Real Estate Stock Fund |
| The table sets forth financial data for one share of beneficial interest outstanding throughout each year. |
| Class N | ||||||||||||||||||||||||||||||||||||||||
| Year Ended October 31, | ||||||||||||||||||||||||||||||||||||||||
| 2019 | 2018 | 2017 | 2016 | 2015 | ||||||||||||||||||||||||||||||||||||
| Net asset value, beginning of year | $ | 15.35 | $ | 15.66 | $ | 18.31 | $ | 19.23 | $ | 19.27 | ||||||||||||||||||||||||||||||
| Income (loss) from investment operations: | ||||||||||||||||||||||||||||||||||||||||
| Net investment income * | 0.30 | 0.28 | 0.13 | 0.32 | 0.15 | |||||||||||||||||||||||||||||||||||
| Net realized and unrealized gain (loss) | 3.32 | (0.35 | ) | 0.40 | 0.73 | 0.85 | ||||||||||||||||||||||||||||||||||
| Total income (loss) from investment operations | 3.62 | (0.07 | ) | 0.53 | 1.05 | 1.00 | ||||||||||||||||||||||||||||||||||
| Less distributions: | ||||||||||||||||||||||||||||||||||||||||
| Distributions from net investment income | (0.29 | ) | (0.12 | ) | (0.36 | ) | (0.21 | ) | (0.11 | ) | ||||||||||||||||||||||||||||||
| Distributions from net realized gains | — | (0.12 | ) | (2.82 | ) | (1.76 | ) | (0.93 | ) | |||||||||||||||||||||||||||||||
| Total distributions | (0.29 | ) | (0.24 | ) | (3.18 | ) | (1.97 | ) | (1.04 | ) | ||||||||||||||||||||||||||||||
| Net asset value, end of year | $ | 18.68 | $ | 15.35 | $ | 15.66 | $ | 18.31 | $ | 19.23 | ||||||||||||||||||||||||||||||
| Total return +# | 24.16 | % | (0.48 | )% | 3.63 | % | 5.77 | % | 5.13 | % | ||||||||||||||||||||||||||||||
| Ratios/Supplemental Data: | ||||||||||||||||||||||||||||||||||||||||
| Net assets, end of year (in 000s) | $ | 42,865 | $ | 43,163 | $ | 34,256 | $ | 25,479 | $ | 33,379 | ||||||||||||||||||||||||||||||
| Ratios of expenses to average net assets: | 1.15 | % | 1.10 | % | 1.17 | % | 1.21 | % | 1.64 | % | ||||||||||||||||||||||||||||||
| Ratios of net investment income to average net assets: | 1.81 | % | 1.82 | % | 0.79 | % | 1.74 | % | 0.80 | % | ||||||||||||||||||||||||||||||
| Portfolio turnover rate | 63 | % | 74 | % | 101 | % | 110 | % | 110 | % | ||||||||||||||||||||||||||||||
| Class A | Class C | |||||||||||||||||||||||||||||||||||||||
| Year Ended October 31, | Year Ended October 31, | |||||||||||||||||||||||||||||||||||||||
| 2019 | 2018 | 2017 | 2016 | 2015 | 2019 | 2018 | 2017 | 2016 | 2015 | |||||||||||||||||||||||||||||||
| Net asset value, beginning of year | $ | 15.46 | $ | 15.78 | $ | 18.35 | $ | 19.26 | $ | 19.33 | $ | 14.54 | $ | 14.88 | $ | 17.55 | $ | 18.50 | $ | 18.65 | ||||||||||||||||||||
| Income (loss) from investment operations: | ||||||||||||||||||||||||||||||||||||||||
| Net investment income (loss) * | 0.26 | 0.24 | 0.10 | 0.27 | 0.10 | 0.13 | 0.12 | (0.02 | ) | 0.13 | (0.04 | ) | ||||||||||||||||||||||||||||
| Net realized and unrealized gain (loss) | 3.35 | (0.35 | ) | 0.41 | 0.74 | 0.85 | 3.17 | (0.34 | ) | 0.38 | 0.70 | 0.82 | ||||||||||||||||||||||||||||
| Total income (loss) from investment operations | 3.61 | (0.11 | ) | 0.51 | 1.01 | 0.95 | 3.30 | (0.22 | ) | 0.36 | 0.83 | 0.78 | ||||||||||||||||||||||||||||
| Less distributions: | ||||||||||||||||||||||||||||||||||||||||
| Distributions from net investment income | (0.26 | ) | (0.09 | ) | (0.26 | ) | (0.16 | ) | (0.09 | ) | (0.15 | ) | — | (0.21 | ) | (0.02 | ) | 0.00 | ||||||||||||||||||||||
| Distributions from net realized gains | — | (0.12 | ) | (2.82 | ) | (1.76 | ) | (0.93 | ) | — | (0.12 | ) | (2.82 | ) | (1.76 | ) | (0.93 | ) | ||||||||||||||||||||||
| Total distributions | (0.26 | ) | (0.21 | ) | (3.08 | ) | (1.92 | ) | (1.02 | ) | (0.15 | ) | (0.12 | ) | (3.03 | ) | (1.78 | ) | (0.93 | ) | ||||||||||||||||||||
| Net asset value, end of year | $ | 18.81 | $ | 15.46 | $ | 15.78 | $ | 18.35 | $ | 19.26 | $ | 17.69 | $ | 14.54 | $ | 14.88 | $ | 17.55 | $ | 18.50 | ||||||||||||||||||||
| Total return +# | 23.81 | % | (0.74 | )% | 3.44 | % | 5.54 | % | 4.85 | % | 22.97 | % | (1.50 | )% | 2.61 | % | 4.73 | % | 4.08 | % | ||||||||||||||||||||
| Ratios/Supplemental Data: | ||||||||||||||||||||||||||||||||||||||||
| Net assets, end of year (in 000s) | $ | 9,161 | $ | 8,444 | $ | 6,002 | $ | 9,376 | $ | 10,386 | $ | 2,812 | $ | 2,308 | $ | 2,448 | $ | 3,211 | $ | 3,847 | ||||||||||||||||||||
| Ratios of expenses to average net assets: | 1.40 | % | 1.35 | % | 1.42 | % | 1.45 | % | 1.89 | % | 2.15 | % | 2.10 | % | 2.17 | % | 2.21 | % | 2.64 | % | ||||||||||||||||||||
| Ratios of net investment income (loss) to average net assets: | 1.56 | % | 1.57 | % | 0.60 | % | 1.45 | % | 0.53 | % | 0.79 | % | 0.85 | % | (0.11 | )% | 0.70 | % | (0.21 | )% | ||||||||||||||||||||
| Portfolio turnover rate | 63 | % | 74 | % | 101 | % | 110 | % | 110 | % | 63 | % | 74 | % | 101 | % | 110 | % | 110 | % | ||||||||||||||||||||
| * | The net investment income (loss) per share data was determined using the average shares outstanding throughout each year. |
| + | Assumes reinvestment of all dividends and distributions, if any. Total return does not reflect the deductions of taxes that a shareholder would pay on distributions or on the redemption of shares and does not reflect the impact of any sales charge. |
| # | Includes adjustments in accordance with accounting principles generally accepted in the United States and, consequently, the net asset values for financial reporting purposes and the returns based upon those net asset values may differ from the net asset values and returns for shareholder transactions. Adjustments may apply to some but not all years and classes. |
See accompanying notes to financial statements.
90
| FINANCIAL HIGHLIGHTS |
| Dunham Small Cap Value Fund |
| The table sets forth financial data for one share of beneficial interest outstanding throughout each year. |
| Class N | ||||||||||||||||||||||||||||||||||||||||
| Year Ended October 31, | ||||||||||||||||||||||||||||||||||||||||
| 2019 | 2018 | 2017 | 2016 | 2015 | ||||||||||||||||||||||||||||||||||||
| Net asset value, beginning of year | $ | 15.72 | $ | 17.47 | $ | 14.41 | $ | 14.27 | $ | 15.45 | ||||||||||||||||||||||||||||||
| Income (loss) from investment operations: | ||||||||||||||||||||||||||||||||||||||||
| Net investment income (loss) * | (0.00 | ) (a) | 0.00 | (a) | 0.07 | 0.09 | (0.01 | ) | ||||||||||||||||||||||||||||||||
| Net realized and unrealized gain (loss) | 0.65 | 0.10 | (b) | 3.57 | 0.54 | (0.18 | ) | |||||||||||||||||||||||||||||||||
| Total income (loss) from investment operations | 0.65 | 0.10 | 3.64 | 0.63 | (0.19 | ) | ||||||||||||||||||||||||||||||||||
| Less distributions: | ||||||||||||||||||||||||||||||||||||||||
| Distributions from net investment income | — | (0.04 | ) | (0.10 | ) | (0.01 | ) | (0.04 | ) | |||||||||||||||||||||||||||||||
| Distributions from net realized gains | (1.70 | ) | (1.81 | ) | (0.48 | ) | (0.48 | ) | (0.95 | ) | ||||||||||||||||||||||||||||||
| Total distributions | (1.70 | ) | (1.85 | ) | (0.58 | ) | (0.49 | ) | (0.99 | ) | ||||||||||||||||||||||||||||||
| Net asset value, end of year | $ | 14.67 | $ | 15.72 | $ | 17.47 | $ | 14.41 | $ | 14.27 | ||||||||||||||||||||||||||||||
| Total return + # | 6.15 | % | 0.37 | % | 25.55 | % | 4.58 | % | (1.59 | )% | ||||||||||||||||||||||||||||||
| Ratios/Supplemental Data: | ||||||||||||||||||||||||||||||||||||||||
| Net assets, end of year (in 000s) | $ | 43,564 | $ | 37,248 | $ | 22,710 | $ | 22,254 | $ | 22,068 | ||||||||||||||||||||||||||||||
| Ratios of expenses to average net assets: | 1.72 | % | 1.54 | % | 1.32 | % | 1.48 | % | 1.79 | % | ||||||||||||||||||||||||||||||
| Ratios of net investment income (loss) to average net assets: (c) ! | (0.01 | )% | 0.01 | % | 0.45 | % | 0.64 | % | (0.10 | )% | ||||||||||||||||||||||||||||||
| Portfolio turnover rate | 85 | % | 101 | % | 100 | % | 129 | % | 122 | % | ||||||||||||||||||||||||||||||
| Class A | Class C | |||||||||||||||||||||||||||||||||||||||
| Year Ended October 31, | Year Ended October 31, | |||||||||||||||||||||||||||||||||||||||
| 2019 | 2018 | 2017 | 2016 | 2015 | 2019 | 2018 | 2017 | 2016 | 2015 | |||||||||||||||||||||||||||||||
| Net asset value, beginning of year | $ | 15.55 | $ | 17.31 | $ | 14.29 | $ | 14.18 | $ | 15.36 | $ | 13.81 | $ | 15.67 | $ | 13.02 | $ | 13.06 | $ | 14.32 | ||||||||||||||||||||
| Income (loss) from investment operations: | ||||||||||||||||||||||||||||||||||||||||
| Net investment income (loss)* | (0.04 | ) | (0.04 | ) | 0.03 | 0.05 | (0.05 | ) | (0.12 | ) | (0.15 | ) | (0.08 | ) | (0.05 | ) | (0.15 | ) | ||||||||||||||||||||||
| Net realized and unrealized gain (loss) | 0.64 | 0.09 | (b) | 3.54 | 0.54 | (0.18 | ) | 0.52 | 0.10 | (b) | 3.21 | 0.49 | (0.16 | ) | ||||||||||||||||||||||||||
| Total income (loss) from investment operations | 0.60 | 0.05 | 3.57 | 0.59 | (0.23 | ) | 0.40 | (0.05 | ) | 3.13 | 0.44 | (0.31 | ) | |||||||||||||||||||||||||||
| Less distributions: | ||||||||||||||||||||||||||||||||||||||||
| Distributions from net investment income | — | (0.00 | ) (a) | (0.07 | ) | — | — | — | — | — | — | — | ||||||||||||||||||||||||||||
| Distributions from net realized gains | (1.70 | ) | (1.81 | ) | (0.48 | ) | (0.48 | ) | (0.95 | ) | (1.70 | ) | (1.81 | ) | (0.48 | ) | (0.48 | ) | (0.95 | ) | ||||||||||||||||||||
| Total distributions | (1.70 | ) | (1.81 | ) | (0.55 | ) | (0.48 | ) | (0.95 | ) | (1.70 | ) | (1.81 | ) | (0.48 | ) | (0.48 | ) | (0.95 | ) | ||||||||||||||||||||
| Net asset value, end of year | $ | 14.45 | $ | 15.55 | $ | 17.31 | $ | 14.29 | $ | 14.18 | $ | 12.51 | $ | 13.81 | $ | 15.67 | $ | 13.02 | $ | 13.06 | ||||||||||||||||||||
| Total return + # | 5.85 | % | 0.08 | % | 25.26 | % | 4.33 | % | (1.83 | )% | 5.06 | % | (0.63 | )% | 24.29 | % | 3.52 | % | (2.56 | )% | ||||||||||||||||||||
| Ratios/Supplemental Data: | ||||||||||||||||||||||||||||||||||||||||
| Net assets, end of year (in 000s) | $ | 9,848 | $ | 7,869 | $ | 4,569 | $ | 3,802 | $ | 3,801 | $ | 2,835 | $ | 2,139 | $ | 2,611 | $ | 2,241 | $ | 2,383 | ||||||||||||||||||||
| Ratios of expenses to average net assets: | 1.97 | % | 1.79 | % | 1.57 | % | 1.73 | % | 2.04 | % | 2.72 | % | 2.54 | % | 2.32 | % | 2.48 | % | 2.79 | % | ||||||||||||||||||||
| Ratios of net investment income (loss) to average net assets: (c) ! | (0.26 | )% | (0.26 | )% | 0.19 | % | 0.40 | % | (0.36 | )% | (1.01 | )% | (1.04 | )% | (0.57 | )% | (0.36 | )% | (1.11 | )% | ||||||||||||||||||||
| Portfolio turnover rate | 85 | % | 101 | % | 100 | % | 129 | % | 122 | % | 85 | % | 101 | % | 100 | % | 129 | % | 122 | % | ||||||||||||||||||||
| * | The net investment income (loss) per share data was determined using the average shares outstanding throughout each year. |
| + | Assumes reinvestment of all dividends and distributions, if any. Total return does not reflect the deductions of taxes that a shareholder would pay on distributions or on the redemption of shares and does not reflect the impact of any sales charge. |
| # | Includes adjustments in accordance with accounting principles generally accepted in the United States and, consequently, the net asset values for financial reporting purposes and the returns based upon those net asset values may differ from the net asset values and returns for shareholder transactions. Adjustments may apply to some but not all years and classes. |
| ! | Recognition of net investment income (loss) is affected by the timing and declaration of dividends by underlying funds in which the Fund invests. |
| (a) | Represents less than $0.01 per share. |
| (b) | The amount of net realized and unrealized gain (loss) on investment per share for the year ended October 31, 2018 does not accord with the amounts in the Statements of Operations due to the timing of purchases and sales of Fund shares in relation to fluctuating market values. |
| (c) | Does not Include the expenses of other investment companies in which the Fund invests. |
See accompanying notes to financial statements.
91
| FINANCIAL HIGHLIGHTS |
| Dunham Small Cap Growth Fund |
| The table sets forth financial data for one share of beneficial interest outstanding throughout each year. |
| Class N | ||||||||||||||||||||||||||||||||||||||||
| Year Ended October 31, | ||||||||||||||||||||||||||||||||||||||||
| 2019 | 2018 | 2017 | 2016 | 2015 | ||||||||||||||||||||||||||||||||||||
| Net asset value, beginning of year | $ | 20.28 | $ | 20.31 | $ | 15.34 | $ | 17.08 | $ | 17.71 | ||||||||||||||||||||||||||||||
| Income (loss) from investment operations: | ||||||||||||||||||||||||||||||||||||||||
| Net investment loss* | (0.23 | ) | (0.27 | ) | (0.15 | ) | (0.06 | ) | (0.24 | ) | ||||||||||||||||||||||||||||||
| Net realized and unrealized gain (loss) (a) | (0.25 | ) | 3.20 | 5.12 | (0.24 | ) | 1.19 | |||||||||||||||||||||||||||||||||
| Total income (loss) from investment operations | (0.48 | ) | 2.93 | 4.97 | (0.30 | ) | 0.95 | |||||||||||||||||||||||||||||||||
| Less distributions: | ||||||||||||||||||||||||||||||||||||||||
| Distributions from net investment income | ||||||||||||||||||||||||||||||||||||||||
| Distributions from net realized gains | (3.80 | ) | (2.96 | ) | — | (1.40 | ) | (1.58 | ) | |||||||||||||||||||||||||||||||
| Tax return of capital | — | — | — | (0.04 | ) | — | ||||||||||||||||||||||||||||||||||
| Total distributions | (3.80 | ) | (2.96 | ) | — | (1.44 | ) | (1.58 | ) | |||||||||||||||||||||||||||||||
| Net asset value, end of year | $ | 16.00 | $ | 20.28 | $ | 20.31 | $ | 15.34 | $ | 17.08 | ||||||||||||||||||||||||||||||
| Total return + # | 1.36 | % | 16.02 | % | 32.40 | % | (1.88 | )% | 5.36 | % | ||||||||||||||||||||||||||||||
| Ratios/Supplemental Data: | ||||||||||||||||||||||||||||||||||||||||
| Net assets, end of year (in 000s) | $ | 37,340 | $ | 33,882 | $ | 24,641 | $ | 26,010 | $ | 23,152 | ||||||||||||||||||||||||||||||
| Ratios of expenses to average net assets: | ||||||||||||||||||||||||||||||||||||||||
| Before fees paid indirectly | 1.90 | % | 1.94 | % | 1.36 | % | 1.23 | % | 1.58 | % | ||||||||||||||||||||||||||||||
| After fees paid indirectly | 1.88 | % | 1.93 | % | 1.35 | % | 1.23 | % | 1.58 | % | ||||||||||||||||||||||||||||||
| Ratios of net investment loss to average net assets: | ||||||||||||||||||||||||||||||||||||||||
| Before fees paid indirectly | (1.36 | )% | (1.31 | )% | (0.86 | )% | (0.38 | )% | (1.30 | )% | ||||||||||||||||||||||||||||||
| After fees paid indirectly | (1.34 | )% | (1.29 | )% | (0.85 | )% | (0.38 | )% | (1.30 | )% | ||||||||||||||||||||||||||||||
| Portfolio turnover rate | 169 | % | 190 | % | 174 | % | 181 | % | 138 | % | ||||||||||||||||||||||||||||||
| Class A | Class C | |||||||||||||||||||||||||||||||||||||||
| Year Ended October 31, | Year Ended October 31, | |||||||||||||||||||||||||||||||||||||||
| 2019 | 2018 | 2017 | 2016 | 2015 | 2019 | 2018 | 2017 | 2016 | 2015 | |||||||||||||||||||||||||||||||
| Net asset value, beginning of year | $ | 19.42 | $ | 19.62 | $ | 14.85 | $ | 16.62 | $ | 17.31 | $ | 16.00 | $ | 16.77 | $ | 12.79 | $ | 14.61 | $ | 15.51 | ||||||||||||||||||||
| Income (loss) from investment operations: | ||||||||||||||||||||||||||||||||||||||||
| Net investment loss* | (0.25 | ) | (0.31 | ) | (0.19 | ) | (0.10 | ) | (0.27 | ) | (0.29 | ) | (0.37 | ) | (0.28 | ) | (0.18 | ) | (0.36 | ) | ||||||||||||||||||||
| Net realized and unrealized gain (loss) (a) | (0.28 | ) | 3.07 | 4.96 | (0.23 | ) | 1.16 | (0.37 | ) | 2.56 | 4.26 | (0.20 | ) | 1.04 | ||||||||||||||||||||||||||
| Total income (loss) from investment operations | (0.53 | ) | 2.76 | 4.77 | (0.33 | ) | 0.89 | (0.66 | ) | 2.19 | 3.98 | (0.38 | ) | 0.68 | ||||||||||||||||||||||||||
| Less distributions: | ||||||||||||||||||||||||||||||||||||||||
| Distributions from net investment income | ||||||||||||||||||||||||||||||||||||||||
| Distributions from net realized gains | (3.80 | ) | (2.96 | ) | — | (1.40 | ) | (1.58 | ) | (3.80 | ) | (2.96 | ) | — | (1.40 | ) | (1.58 | ) | ||||||||||||||||||||||
| Tax return of capital | — | — | — | (0.04 | ) | — | — | — | — | (0.04 | ) | — | ||||||||||||||||||||||||||||
| Total distributions | (3.80 | ) | (2.96 | ) | — | (1.44 | ) | (1.58 | ) | (3.80 | ) | (2.96 | ) | — | (1.44 | ) | (1.58 | ) | ||||||||||||||||||||||
| Net asset value, end of year | $ | 15.09 | $ | 19.42 | $ | 19.62 | $ | 14.85 | $ | 16.62 | $ | 11.54 | $ | 16.00 | $ | 16.77 | $ | 12.79 | $ | 14.61 | ||||||||||||||||||||
| Total return + # | 1.11 | % | 15.69 | % | 32.12 | % | (2.12 | )% | 5.12 | % | 0.36 | % | 14.84 | % | 31.12 | % | (2.82 | )% | 4.29 | % | ||||||||||||||||||||
| Ratios/Supplemental Data: | ||||||||||||||||||||||||||||||||||||||||
| Net assets, end of year (in 000s) | $ | 10,797 | $ | 10,799 | $ | 6,925 | $ | 5,540 | $ | 6,326 | $ | 2,440 | $ | 2,720 | $ | 2,644 | $ | 2,155 | $ | 3,163 | ||||||||||||||||||||
| Ratios of expenses to average net assets: | ||||||||||||||||||||||||||||||||||||||||
| Before fees paid indirectly | 2.15 | % | 2.19 | % | 1.61 | % | 1.48 | % | 1.83 | % | 2.90 | % | 2.94 | % | 2.36 | % | 2.23 | % | 2.58 | % | ||||||||||||||||||||
| After fees paid indirectly | 2.13 | % | 2.18 | % | 1.60 | % | 1.48 | % | 1.83 | % | 2.88 | % | 2.93 | % | 2.35 | % | 2.23 | % | 2.58 | % | ||||||||||||||||||||
| Ratios of net investment loss to average net assets: | ||||||||||||||||||||||||||||||||||||||||
| Before fees paid indirectly | (1.61 | )% | (1.56 | )% | (1.13 | )% | (0.69 | )% | (1.53 | )% | (2.37 | )% | (2.30 | )% | (1.89 | )% | (1.45 | )% | (2.29 | )% | ||||||||||||||||||||
| After fees paid indirectly | (1.59 | )% | (1.55 | )% | (1.12 | )% | (0.69 | )% | (1.53 | )% | (2.35 | )% | (2.29 | )% | (1.88 | )% | (1.45 | )% | (2.29 | )% | ||||||||||||||||||||
| Portfolio turnover rate | 169 | % | 190 | % | 174 | % | 181 | % | 138 | % | 169 | % | 190 | % | 174 | % | 181 | % | 138 | % | ||||||||||||||||||||
| * | The net investment (loss) per share data was determined using the average shares outstanding throughout each year. |
| + | Assumes reinvestment of all dividends and distributions, if any. Total return does not reflect the deductions of taxes that a shareholder would pay on distributions or on the redemption of shares and does not reflect the impact of any sales charge. |
| # | Includes adjustments in accordance with accounting principles generally accepted in the United States and, consequently, the net asset values for financial reporting purposes and the returns based upon those net asset values may differ from the net asset values and returns for shareholder transactions. Adjustments may apply to some but not all years and classes. |
| (a) | The amount of net realized and unrealized gain (loss) on investment per share for the years ended October 31, 2019 and October 31, 2016 does not accord with the amounts in the Statements of Operations due to the timing of purchases and sales of Fund shares in relation to fluctuating market values. |
See accompanying notes to financial statements.
92
| FINANCIAL HIGHLIGHTS |
| Dunham Emerging Markets Stock Fund |
| The table sets forth financial data for one share of beneficial interest outstanding throughout each year. |
| Class N | ||||||||||||||||||||||||||||||||||||||||
| Year Ended October 31, | ||||||||||||||||||||||||||||||||||||||||
| 2019 | 2018 | 2017 | 2016 | 2015 | ||||||||||||||||||||||||||||||||||||
| Net asset value, beginning of year | $ | 12.85 | $ | 15.94 | $ | 12.73 | $ | 11.97 | $ | 14.75 | ||||||||||||||||||||||||||||||
| Income (loss) from investment operations: | ||||||||||||||||||||||||||||||||||||||||
| Net investment income * | 0.19 | 0.27 | 0.17 | 0.20 | 0.08 | |||||||||||||||||||||||||||||||||||
| Net realized and unrealized gain (loss) | 1.48 | (3.20 | ) | 3.28 | 0.64 | (2.67 | ) | |||||||||||||||||||||||||||||||||
| Total income (loss) from investment operations | 1.67 | (2.93 | ) | 3.45 | 0.84 | (2.59 | ) | |||||||||||||||||||||||||||||||||
| Less distributions: | ||||||||||||||||||||||||||||||||||||||||
| Distributions from net investment income | (0.25 | ) | (0.16 | ) | (0.24 | ) | (0.08 | ) | (0.19 | ) | ||||||||||||||||||||||||||||||
| Total distributions | (0.25 | ) | (0.16 | ) | (0.24 | ) | (0.08 | ) | (0.19 | ) | ||||||||||||||||||||||||||||||
| Net asset value, end of year | $ | 14.27 | $ | 12.85 | $ | 15.94 | $ | 12.73 | $ | 11.97 | ||||||||||||||||||||||||||||||
| Total return + # | 13.29 | % | (18.57 | )% | 27.69 | % | 7.13 | % | (17.73 | )% | ||||||||||||||||||||||||||||||
| Ratios/Supplemental Data: | ||||||||||||||||||||||||||||||||||||||||
| Net assets, end of year (in 000s) | $ | 59,931 | $ | 53,261 | $ | 51,365 | $ | 46,481 | $ | 42,831 | ||||||||||||||||||||||||||||||
| Ratios of expenses to average net assets: | 1.61 | % | 1.19 | % | 1.75 | % | 1.27 | % | 1.76 | % | ||||||||||||||||||||||||||||||
| Ratios of net investment income to average net assets: | 1.42 | % | 1.79 | % | 1.18 | % | 1.73 | % | 0.59 | % | ||||||||||||||||||||||||||||||
| Portfolio turnover rate | 129 | % | 66 | % | 74 | % | 97 | % | 137 | % | ||||||||||||||||||||||||||||||
| Class A | Class C | |||||||||||||||||||||||||||||||||||||||
| Year Ended October 31, | Year Ended October 31, | |||||||||||||||||||||||||||||||||||||||
| 2019 | 2018 | 2017 | 2016 | 2015 | 2019 | 2018 | 2017 | 2016 | 2015 | |||||||||||||||||||||||||||||||
| Net asset value, beginning of year | $ | 12.56 | $ | 15.58 | $ | 12.45 | $ | 11.71 | $ | 14.44 | $ | 11.85 | $ | 14.74 | $ | 11.82 | $ | 11.14 | $ | 13.76 | ||||||||||||||||||||
| Income (loss) from investment operations: | ||||||||||||||||||||||||||||||||||||||||
| Net investment income (loss)* | 0.16 | 0.23 | 0.14 | 0.17 | 0.05 | 0.05 | 0.11 | 0.02 | 0.08 | (0.06 | ) | |||||||||||||||||||||||||||||
| Net realized and unrealized gain (loss) | 1.44 | (3.13 | ) | 3.20 | 0.62 | (2.62 | ) | 1.38 | (2.94 | ) | 3.04 | 0.60 | (2.49 | ) | ||||||||||||||||||||||||||
| Total income (loss) from investment operations | 1.60 | (2.90 | ) | 3.34 | 0.79 | (2.57 | ) | 1.43 | (2.83 | ) | 3.06 | 0.68 | (2.55 | ) | ||||||||||||||||||||||||||
| Less distributions: | ||||||||||||||||||||||||||||||||||||||||
| Distributions from net investment income | (0.22 | ) | (0.12 | ) | (0.21 | ) | (0.05 | ) | (0.16 | ) | (0.12 | ) | (0.06 | ) | (0.14 | ) | — | (0.07 | ) | |||||||||||||||||||||
| Total distributions | (0.22 | ) | (0.12 | ) | (0.21 | ) | (0.05 | ) | (0.16 | ) | (0.12 | ) | (0.06 | ) | (0.14 | ) | — | (0.07 | ) | |||||||||||||||||||||
| Net asset value, end of year | $ | 13.94 | $ | 12.56 | $ | 15.58 | $ | 12.45 | $ | 11.71 | $ | 13.16 | $ | 11.85 | $ | 14.74 | $ | 11.82 | $ | 11.14 | ||||||||||||||||||||
| Total return + # | 12.98 | % | (18.73 | )% | 27.36 | % | 6.84 | % | (17.94 | )% | 12.18 | % | (19.30 | )% | 26.31 | % | 6.10 | % | (18.60 | )% | ||||||||||||||||||||
| Ratios/Supplemental Data: | ||||||||||||||||||||||||||||||||||||||||
| Net assets, end of year (in 000s) | $ | 12,106 | $ | 9,662 | $ | 8,242 | $ | 6,348 | $ | 4,594 | $ | 3,463 | $ | 3,163 | $ | 3,467 | $ | 3,380 | $ | 3,216 | ||||||||||||||||||||
| Ratios of expenses to average net assets: | 1.86 | % | 1.44 | % | 2.00 | % | 1.52 | % | 2.01 | % | 2.61 | % | 2.19 | % | 2.75 | % | 2.27 | % | 2.76 | % | ||||||||||||||||||||
| Ratios of net investment income (loss) to average net assets: | 1.17 | % | 1.54 | % | 0.98 | % | 1.46 | % | 0.40 | % | 0.41 | % | 0.77 | % | 0.10 | % | 0.77 | % | (0.48 | )% | ||||||||||||||||||||
| Portfolio turnover rate | 129 | % | 66 | % | 74 | % | 97 | % | 137 | % | 129 | % | 66 | % | 74 | % | 97 | % | 137 | % | ||||||||||||||||||||
| * | The net investment income (loss) per share data was determined using the average shares outstanding throughout each year. |
| + | Assumes reinvestment of all dividends and distributions, if any. Total return does not reflect the deductions of taxes that a shareholder would pay on distributions or on the redemption of shares and does not reflect the impact of any sales charge. |
| # | Includes adjustments in accordance with accounting principles generally accepted in the United States and, consequently, the net asset values for financial reporting purposes and the returns based upon those net asset values may differ from the net asset values and returns for shareholder transactions. Adjustments may apply to some but not all years and classes. |
See accompanying notes to financial statements.
93
| NOTES TO FINANCIAL STATEMENTS |
| October 31, 2019 |
| 1. | ORGANIZATION |
Each Dunham Fund (each, a “Fund” and collectively the “Funds”) is a series of shares of beneficial interest in the Dunham Funds (the “Trust”), a Delaware Business Trust organized on November 28, 2007 and registered under the Investment Company Act of 1940, as amended, (the “1940 Act”) as an open-end management investment company. The Dunham Funds currently consist of fourteen funds: Dunham Floating Rate Bond Fund; Dunham Long/Short Credit Fund (formerly known as Dunham Appreciation & Income Fund); Dunham Corporate/Government Bond Fund; Dunham Monthly Distribution Fund; Dunham Dynamic Macro Fund; Dunham High-Yield Bond Fund; Dunham International Opportunity Bond Fund; Dunham Large Cap Value Fund; Dunham Focused Large Cap Growth Fund; Dunham International Stock Fund; Dunham Real Estate Stock Fund; Dunham Small Cap Value Fund; Dunham Small Cap Growth Fund; and Dunham Emerging Markets Stock Fund. With the exception of Dunham Focused Large Cap Growth Fund, Dunham International Opportunity Bond Fund, and Dunham Real Estate Stock Fund, the remaining Funds are diversified funds within the meaning of the 1940 Act.
| Fund | Primary Objective | |
| Dunham Floating Rate Bond Fund (“Floating Rate | High level of current income | |
| Bond”) | ||
| Dunham Long/Short Credit Fund (“Long/Short Credit”) | Maximize total return under varying market conditions through both current income and capital appreciation | |
| Dunham Corporate/Government Bond Fund (“Corporate/Government Bond”) | Current income and capital appreciation | |
| Dunham Monthly Distribution Fund (“Monthly Distribution”) | Positive returns in rising and falling market environments | |
| Dunham Dynamic Macro Fund (“Dynamic Macro”) | Maximize total return from capital appreciation and dividends | |
| Dunham High-Yield Bond Fund (“High-Yield Bond”) | High level of current income | |
| Dunham International Opportunity Bond Fund (“International Opportunity Bond”) | High level of current income | |
| Dunham Large Cap Value Fund (“Large Cap Value”) | Maximize total return from capital appreciation and dividends | |
| Dunham Focused Large Cap Growth Fund (“Focused Large Cap Growth”) | Maximize capital appreciation | |
| Dunham International Stock Fund (“International Stock”) | Maximize total return from capital appreciation and dividends | |
| Dunham Real Estate Stock Fund (“Real Estate Stock”) | Maximize total return from capital appreciation and dividends | |
| Dunham Small Cap Value Fund (“Small Cap Value”) | Maximize total return from capital appreciation and income | |
| Dunham Small Cap Growth Fund (“Small Cap Growth”) | Maximize capital appreciation | |
| Dunham Emerging Markets Stock Fund (“Emerging Markets Stock”) | Maximize capital appreciation |
Currently, each Fund offers Class A, Class C and Class N shares. Each class represents an interest in the same assets of the applicable Fund with the only differences being that Class A shares are subject to a front-end sales charge and an annual service fee, Class C shares are subject to an annual service and distribution fee and Class N shares have a higher minimum investment amount. Investors that purchase $1,000,000 or more of Class A shares will not pay any initial sales charge on the purchase. However, purchases of $1,000,000 or more of Class A shares may be subject to a contingent deferred sales charge (“CDSC”) on shares redeemed during the first 18 months after their purchase in the amount of the commissions paid on the shares redeemed. The Class C and Class N shares, with the exception of Monthly Distribution, High-Yield Bond , Dynamic Macro, Focused Large Cap Growth, Floating Rate Bond, and International Opportunity Bond commenced operations on December 10, 2004 and were formed as a result of tax-free conversions from common trusts. The conversions were accomplished through the exchange of the common trust securities, cash, and other assets for equivalent value of the Funds’ shares. High-Yield Bond Class C and Class N shares commenced operations on July 1, 2005. The Class A shares for all Funds except Monthly Distribution, Dynamic Macro, Focused Large Cap Growth, Floating Rate Bond, and International Opportunity Bond commenced operations on January 3, 2007. Monthly Distribution’s Predecessor Fund’s Class A shares and Class C shares commenced operations on December 26, 2000. Monthly Distribution’s Class N shares commenced operations on September 29, 2008. Dynamic Macro commenced operations on April 30, 2010. Focused Large Cap Growth commenced operations on December 8, 2011. Floating Rate Bond and International Opportunity Bond commenced operations on November 1, 2013.
| 2. | SUMMARY OF SIGNIFICANT ACCOUNTING POLICIES |
The preparation of financial statements in conformity with accounting principles generally accepted in the United States of America (“GAAP”) requires management to make estimates and assumptions that affect the reported amounts of assets and liabilities and disclosure of contingent assets and liabilities at the date of the financial statements and the reported amounts of increases and decreases in net assets from operations during the reporting period. Actual results could differ from those estimates. The Funds are investment companies and accordingly follow the investment company accounting and reporting guidance of the Financial Accounting Standards Board (FASB) Accounting Standard Codification Topic 946 “Financial Services – Investment Companies” including FASB Accounting Standard Update ASU 2013-08.
94
| NOTES TO FINANCIAL STATEMENTS |
| October 31, 2019 (Continued) |
The following is a summary of significant accounting policies followed by the Funds in preparation of their financial statements.
a. Security Valuation – In determining each Fund’s Net Asset Value (“NAV”) per share, equity securities for which market quotations are readily available are valued at current market value using the last reported sales price. NASDAQ traded securities are valued using the NASDAQ official closing price (“NOCP”). If no sale price is reported, the mean between the current bid and ask price is used. If market quotations are not readily available, then securities are valued at fair value as determined by the Board of Trustees of the Trust (the “Board”) (or its delegate). U.S. Government and Agency securities are valued at the mean between the most recent bid and ask prices. Short-term debt instruments with a remaining maturity of more than 60 days, intermediate and long-term bonds, convertible bonds, bank loans and other debt securities are generally valued on the basis of dealer supplied quotations or by a pricing system selected by Dunham & Associates Investment Counsel, Inc. (“Dunham & Associates” or the “Adviser”) and approved by the Board. Where such prices are not available, valuations will be obtained from brokers who are market makers for such securities. However, in circumstances where the Adviser deems it appropriate to do so, the mean of the bid and ask prices for over-the-counter securities or the last available sale price for exchange-traded debt securities may be used. Where no last sale price for exchange traded debt securities is available, the mean of the bid and ask prices may be used. Short-term debt securities with a remaining maturity of 60 days or less may be valued at amortized cost, provided such valuations represent fair value.
Options are valued at the last reported sale price at the close of the exchange on which the security is primarily traded. If no sales are reported for the exchange-traded options, or the options are not exchange-traded, then they are valued at the mean of their most recent quoted bid and ask price.
Futures and future options are valued daily at the final settled price or, in the absence of a settled price, at the mean between the current bid and ask prices on the day of valuation.
Swap transactions are valued through an independent pricing service or at fair value based on daily price reporting from the swap counterparty issuing the swap. Total return swaps on securities listed on an exchange shall be valued at the last quoted sales price or, in the absence of a sale, at the mean between the current bid and ask prices.
Trading in securities on Far East securities exchanges and over-the-counter markets is normally completed well before the close of business on each business day in New York (i.e., a day on which the New York Stock Exchange (“NYSE”) is open). In addition, Far East securities trading generally, or in a particular country or countries, may not take place on all business days in New York. Furthermore, trading takes place in Japanese markets on certain Saturdays and in various foreign markets on days, which are not business days in New York, and on which a Fund’s NAV is not calculated. Each Fund calculates the NAV per share, and therefore effects sales, redemptions and repurchases of its shares, as of the close of regular trading on the NYSE once on each day on which the NYSE is open. Such calculation may not take place contemporaneously with the determination of the prices of the majority of the portfolio securities used in such calculation. If events that may materially affect the value of such securities occur between the time when their price is determined and the time when the Fund’s NAV is calculated, such securities may be valued at fair value as determined in good faith in accordance with procedures approved by the Board.
Securities in which the Funds invest may be traded in markets that close before 4:00 p.m. Eastern Time (“ET”). Normally, developments that occur between the close of the foreign markets and 4:00 p.m. ET will not be reflected in a Fund’s NAV. However, management may determine that such developments are so significant that they will materially affect the value of a Fund’s securities, and the Fund may adjust the previous closing prices to reflect what the Board believes to be the fair value of these securities as of 4:00 p.m. ET. Both International Stock and Emerging Markets Stock utilize fair value prices as provided by an independent pricing vendor on a daily basis for those securities traded on a foreign exchange.
Securities for which current market quotations are not readily available, or for which quotations are not deemed to be representative of market values, are valued at fair value as determined in good faith by or under the direction of the Board in accordance with the Trust’s Portfolio Securities Valuation Procedures (the “Procedures”). The Procedures consider, among others, the following factors to determine a security’s fair value: the nature and pricing history (if any) of the security; whether any dealer quotations for the security are available; and possible valuation methodologies that could be used to determine the fair value of the security.
Valuation of Fund of Funds – The Funds may invest in portfolios of open-end investment companies. Open-end investment companies are valued at their respective net asset values as reported by such investment companies. Open-end investment companies value securities in their portfolios for which market quotations are readily available at their market values (generally the last reported sale price) and all other securities and assets at their fair value based on the methods established by the board of directors of the open-end investment companies.
95
| NOTES TO FINANCIAL STATEMENTS |
| October 31, 2019 (Continued) |
The Funds utilize various methods to measure the fair value of their investments on a recurring basis. GAAP establishes a hierarchy that prioritizes inputs to valuation methods. The three levels of input are:
Level 1 –Unadjusted quoted prices in active markets for identical assets and liabilities.
Level 2 – Observable inputs other than quoted prices included in Level 1 that are observable for the asset or liability, either directly or indirectly. These inputs may include quoted prices for the identical instrument on an inactive market, prices for similar instruments, interest rates, prepayment speeds, credit risk, yield curves, default rates and similar data.
Level 3 –Unobservable inputs for the asset or liability, to the extent relevant observable inputs are not available, representing the Funds’ own assumptions about the assumptions a market participant would use in valuing the asset or liability, and would be based on the best information available.
The availability of observable inputs can vary from security to security and is affected by a wide variety of factors, including, for example, the type of security, whether the security is new and not yet established in the marketplace, the liquidity of markets, and other characteristics particular to the security. To the extent that valuation is based on models or inputs that are less observable or unobservable in the market, the determination of fair value requires more judgment. Accordingly, the degree of judgment exercised in determining fair value is greatest for instruments categorized in Level 3.
The inputs used to measure fair value may fall into different levels of the fair value hierarchy. In such cases, for disclosure purposes, the level in the fair value hierarchy within which the fair value measurement falls in its entirety, is determined based on the lowest level input that is significant to the fair value measurement in its entirety.
The inputs or methodology used for valuing securities are not necessarily an indication of the risk associated with investing in those securities. The following tables summarize the inputs used as of October 31, 2019 for the Funds’ assets and liabilities measured at fair value:
| Floating Rate Bond | ||||||||||||||||
| Assets | Level 1 | Level 2 | Level 3 | Total | ||||||||||||
| Asset Backed Securities | $ | — | $ | 1,694,949 | $ | — | $ | 1,694,949 | ||||||||
| Bank Loans * | — | 172,819,106 | — | 172,819,106 | ||||||||||||
| Bonds & Notes * | — | 7,263,765 | — | 7,263,765 | ||||||||||||
| Common Stock * | 124,470 | — | — | 124,470 | ||||||||||||
| Exchange Traded Funds | 1,510,800 | — | — | 1,510,800 | ||||||||||||
| Rights | — | 9,370 | — | 9,370 | ||||||||||||
| Warrants | — | 208,329 | — | 208,329 | ||||||||||||
| U.S. Government | — | 1,997,190 | — | 1,997,190 | ||||||||||||
| Short-Term Investment | 1,812,679 | — | — | 1,812,679 | ||||||||||||
| Total | $ | 3,447,949 | $ | 183,992,709 | $ | — | $ | 187,440,658 | ||||||||
| Long/Short Credit | ||||||||||||||||
| Assets | Level 1 | Level 2 | Level 3 | Total | ||||||||||||
| Bank Loans * | $ | — | $ | 1,070,908 | $ | — | $ | 1,070,908 | ||||||||
| Bonds & Notes * | — | 31,708,660 | — | 31,708,660 | ||||||||||||
| Common Stock * | 18,900 | — | — | 18,900 | ||||||||||||
| U.S. Government | — | 42,969,043 | — | 42,969,043 | ||||||||||||
| Short-Term Investment | 6,756,790 | — | — | 6,756,790 | ||||||||||||
| Total Assets | $ | 6,775,690 | $ | 75,748,611 | $ | — | $ | 82,524,301 | ||||||||
| Assets - Derivatives | ||||||||||||||||
| Swap Contracts | $ | — | $ | 262,909 | $ | — | $ | 262,909 | ||||||||
| Futures Contracts | 281,265 | — | — | 281,265 | ||||||||||||
| Total Asset Derivatives | $ | 281,265 | $ | 262,909 | $ | — | $ | 544,174 | ||||||||
| Liabilities - Derivatives | ||||||||||||||||
| Swap Contracts | $ | — | $ | 219,875 | $ | — | $ | 219,875 | ||||||||
| Total Liability Derivatives | $ | — | $ | 219,875 | $ | — | $ | 219,875 | ||||||||
96
| NOTES TO FINANCIAL STATEMENTS |
| October 31, 2019 (Continued) |
| Corporate/Government Bond | ||||||||||||||||
| Assets | Level 1 | Level 2 | Level 3 | Total | ||||||||||||
| Corporate Bonds & Notes * | $ | — | $ | 35,301,374 | $ | — | $ | 35,301,374 | ||||||||
| Foreign Government Bonds | — | 381,258 | — | 381,258 | ||||||||||||
| Municipal Bonds | — | 3,190,354 | — | 3,190,354 | ||||||||||||
| U.S. Government & Agency | — | 9,567,402 | — | 9,567,402 | ||||||||||||
| Bank Loans * | — | 2,271,093 | — | 2,271,093 | ||||||||||||
| Total | $ | — | $ | 50,711,481 | $ | — | $ | 50,711,481 | ||||||||
| Monthly Distribution | ||||||||||||||||
| Assets | Level 1 | Level 2 | Level 3 | Total | ||||||||||||
| Common Stocks * | $ | 179,759,653 | $ | 260,302 | $ | — | $ | 180,019,955 | ||||||||
| Closed-End Fund | — | 3,805,903 | — | 3,805,903 | ||||||||||||
| Exchange Traded Funds | 8,651,591 | — | — | 8,651,591 | ||||||||||||
| Rights | — | 4,380 | — | 4,380 | ||||||||||||
| Warrants | — | 2,375 | — | 2,375 | ||||||||||||
| Purchased Options | 88,600 | — | — | 88,600 | ||||||||||||
| Short-Term Investment | 86,209,639 | — | — | 86,209,639 | ||||||||||||
| Collateral for Securities Loaned | 3,284,494 | — | — | 3,284,494 | ||||||||||||
| Total Assets | $ | 277,993,977 | $ | 4,072,960 | $ | — | $ | 282,066,937 | ||||||||
| Asset - Derivatives | ||||||||||||||||
| Swap Contracts | $ | — | $ | 109,373 | $ | — | $ | 109,373 | ||||||||
| Total Asset Derivatives | $ | — | $ | 109,373 | $ | — | $ | 109,373 | ||||||||
| Liabilities-Derivatives | ||||||||||||||||
| Written Options | $ | 917,459 | $ | 250 | $ | — | $ | 917,709 | ||||||||
| Swap Contracts | — | 256,872 | — | 256,872 | ||||||||||||
| Total Liability Derivatives | $ | 917,459 | $ | 257,122 | $ | — | $ | 1,174,581 | ||||||||
| Liabilities | ||||||||||||||||
| Liabilities-Securities Sold Short | $ | 77,711,924 | $ | 200,592 | $ | — | $ | 77,912,516 | ||||||||
| Total Liabilities | $ | 77,711,924 | $ | 200,592 | $ | — | $ | 77,912,516 | ||||||||
| Dynamic Macro | ||||||||||||||||
| Assets | Level 1 | Level 2 | Level 3 | Total | ||||||||||||
| Exchange Traded Funds * | $ | 12,561,481 | $ | — | $ | — | $ | 12,561,481 | ||||||||
| Purchased Options | 850,876 | — | — | 850,876 | ||||||||||||
| Short-Term Investments | 1,340,071 | 25,104,890 | — | 26,444,961 | ||||||||||||
| Total Assets | $ | 14,752,428 | $ | 25,104,890 | $ | — | $ | 39,857,318 | ||||||||
| Assets - Derivatives | ||||||||||||||||
| Futures Contracts | $ | 396,894 | $ | — | $ | — | $ | 396,894 | ||||||||
| Total Asset Derivatives | $ | 396,894 | $ | — | $ | — | $ | 396,894 | ||||||||
| Liabilities - Derivatives | ||||||||||||||||
| Futures Contracts | $ | 165,158 | $ | — | $ | — | $ | 165,158 | ||||||||
| Written Options | 35,530 | — | — | 35,530 | ||||||||||||
| Total Liability Derivatives | $ | 200,688 | $ | — | $ | — | $ | 200,688 | ||||||||
| High-Yield Bond | ||||||||||||||||
| Assets | Level 1 | Level 2 | Level 3 | Total | ||||||||||||
| Bonds & Notes * | $ | — | $ | 102,457,477 | $ | — | $ | 102,457,477 | ||||||||
| Short-Term Investment | 794,389 | — | — | 794,389 | ||||||||||||
| Collateral for Securities Loaned | 3,653,700 | — | — | 3,653,700 | ||||||||||||
| Total | $ | 4,448,089 | $ | 102,457,477 | $ | — | $ | 106,905,566 | ||||||||
97
| NOTES TO FINANCIAL STATEMENTS |
| October 31, 2019 (Continued) |
| International Opportunity Bond | ||||||||||||||||
| Assets | Level 1 | Level 2 | Level 3 | Total | ||||||||||||
| Corporate Bonds & Notes * | $ | — | $ | 11,199,889 | $ | — | $ | 11,199,889 | ||||||||
| Foreign Government Bonds * | — | 26,231,525 | — | 26,231,525 | ||||||||||||
| Whole Loan Collateral | — | 353,917 | — | 353,917 | ||||||||||||
| Total Assets | $ | — | $ | 37,785,331 | $ | — | $ | 37,785,331 | ||||||||
| Assets - Derivatives | ||||||||||||||||
| Futures Contracts | $ | 87,417 | $ | — | $ | — | $ | 87,417 | ||||||||
| Forward Foreign Currency Exchange Contracts | — | 152,084 | — | 152,084 | ||||||||||||
| Total Asset Derivatives | $ | 87,417 | $ | 152,084 | $ | — | $ | 239,501 | ||||||||
| Liabilities - Derivatives | ||||||||||||||||
| Futures Contracts | $ | 72,624 | $ | — | $ | — | $ | 72,624 | ||||||||
| Forward Foreign Currency Exchange Contracts | — | 161,236 | — | 161,236 | ||||||||||||
| Total Liability Derivatives | $ | 72,624 | $ | 161,236 | $ | — | $ | 233,860 | ||||||||
| Large Cap Value | ||||||||||||||||
| Assets | Level 1 | Level 2 | Level 3 | Total | ||||||||||||
| Common Stocks * | $ | 81,813,674 | $ | — | $ | — | $ | 81,813,674 | ||||||||
| Collateral for Securities Loaned | 1,045,695 | — | — | 1,045,695 | ||||||||||||
| Total | $ | 82,859,369 | $ | — | $ | — | $ | 82,859,369 | ||||||||
| Focused Large Cap Growth | ||||||||||||||||
| Assets | Level 1 | Level 2 | Level 3 | Total | ||||||||||||
| Common Stocks * | $ | 105,383,318 | $ | — | $ | — | $ | 105,383,318 | ||||||||
| Total | $ | 105,383,318 | $ | — | $ | — | $ | 105,383,318 | ||||||||
| International Stock | ||||||||||||||||
| Assets | Level 1 | Level 2 | Level 3 | Total | ||||||||||||
| Common Stocks * | $ | 30,768,090 | $ | 97,849,237 | $ | — | $ | 128,617,327 | ||||||||
| Exchange Traded Fund | 657,211 | — | — | 657,211 | ||||||||||||
| Warrant | 7,507 | — | — | 7,507 | ||||||||||||
| Preferred Stocks * | 99,280 | — | — | 99,280 | ||||||||||||
| Collateral for Securities Loaned | 6,325,040 | — | — | 6,325,040 | ||||||||||||
| Total | $ | 37,857,128 | $ | 97,849,237 | $ | — | $ | 135,706,365 | ||||||||
| Real Estate Stock | ||||||||||||||||
| Assets | Level 1 | Level 2 | Level 3 | Total | ||||||||||||
| REITs * | $ | 54,258,604 | $ | — | $ | — | $ | 54,258,604 | ||||||||
| Total | $ | 54,258,604 | $ | — | $ | — | $ | 54,258,604 | ||||||||
| Small Cap Value | ||||||||||||||||
| Assets | Level 1 | Level 2 | Level 3 | Total | ||||||||||||
| Common Stocks * | $ | 55,940,284 | $ | — | $ | — | $ | 55,940,284 | ||||||||
| Collateral for Securities Loaned | 542,100 | — | — | 542,100 | ||||||||||||
| Total | $ | 56,482,384 | $ | — | $ | — | $ | 56,482,384 | ||||||||
| Small Cap Growth | ||||||||||||||||
| Assets | Level 1 | Level 2 | Level 3 | Total | ||||||||||||
| Common Stocks * | $ | 48,131,893 | $ | — | $ | — | $ | 48,131,893 | ||||||||
| Short-Term Investment | 22,769 | — | — | 22,769 | ||||||||||||
| Collateral for Securities Loaned | 2,124,587 | — | — | 2,124,587 | ||||||||||||
| Total | $ | 50,279,249 | $ | — | $ | — | $ | 50,279,249 | ||||||||
98
| NOTES TO FINANCIAL STATEMENTS |
| October 31, 2019 (Continued) |
| Emerging Markets Stock | ||||||||||||||||
| Assets | Level 1 | Level 2 | Level 3 | Total | ||||||||||||
| Common Stocks * | $ | 20,062,584 | $ | 52,721,713 | $ | — | $ | 72,784,297 | ||||||||
| Preferred Stock | 502,555 | — | — | 502,555 | ||||||||||||
| Closed End Fund | 737,174 | — | — | 737,174 | ||||||||||||
| Warrant | 5,143 | — | — | 5,143 | ||||||||||||
| Collateral for Securities Loaned | 4,347,391 | — | — | 4,347,391 | ||||||||||||
| Total | $ | 25,654,847 | $ | 52,721,713 | $ | — | $ | 78,376,560 | ||||||||
| * | See each Fund’s Schedule of Investments for breakdown by industry. |
The Funds did not hold any Level 3 securities during the year.
b. Foreign Currency Translations – The accounting records of the Funds are maintained in U.S. dollars. Investment securities and other assets and liabilities denominated in a foreign currency, and income receipts and expense payments, are translated into U.S. dollars using the prevailing exchange rates at the London market close. Purchases and sales of securities are translated into U.S. dollars at the contractual currency rates established at the approximate time of the trade.
Net realized gains and losses on foreign currency transactions represent net gains and losses from currency realized between the trade and settlement dates on securities transactions and the difference between income accrued versus income received. The effects of changes in foreign currency exchange rates on investments in securities are included with the net realized and unrealized gain or loss on investment securities.
c. Forward Foreign Currency Exchange Contracts – As foreign securities are purchased, a Fund generally enters into forward foreign currency exchange contracts in order to hedge against foreign currency exchange rate risks. The market value of the contract fluctuates with changes in currency exchange rates. The contract is marked-to-market daily and the change in market value is recorded by a Fund as an unrealized gain or loss. As foreign securities are sold, a portion of the contract is generally closed and the Fund records a realized gain or loss equal to the difference between the value of the contract at the time it was opened and the value at the time it was closed. A Fund may also enter into forward foreign currency exchange contracts as an investment strategy consistent with that Fund’s investment objective. Realized gains and losses from contract transactions are included as a component of net realized gains (losses) from investments and forward foreign currency exchange contracts in the Statements of Operations.
d. Options –Monthly Distribution and Dynamic Macro are subject to stock market risk in the normal course of pursuing their investment objectives and may purchase or sell options to help hedge against this risk.
A Fund may write call options only if it (i) owns an offsetting position in the underlying security or (ii) has an absolute or immediate right to acquire that security without additional cash consideration or exchange of other securities held in its portfolio. When a Fund writes an option, there is no taxable event and an amount equal to the premium received is recorded by that Fund as a liability. The liability is thereafter valued to reflect the current value of the option. If the option is not exercised and expires, or if a Fund effects a closing purchase transaction, the Fund realizes a gain (or loss in the case of a closing purchase transaction where the cost to close the transaction exceeds the original premium received), and the liability related to the option is extinguished. Any such gain or loss generally is a short-term capital gain or loss for federal income tax purposes. If a call option that a Fund has written on any equity security is exercised, that Fund will realize a capital gain or loss (long-term or short-term, depending on the holding period of the underlying security) from the sale of the underlying security, and the proceeds from such sale are increased by the premium originally received. If a put option that a Fund has written on an equity security is exercised, the amount of the premium originally received reduces the cost of the security that a Fund purchases upon exercise of the option. When a Fund writes a put option, that Fund must deposit cash or liquid securities into a segregated account equal to the put option’s exercise value (number of shares times strike price).
A Fund may purchase put and call options. Put options are purchased to hedge against a decline in the value of securities held in that Fund’s portfolio. If such a decline occurs, the put options will permit that Fund to sell the securities underlying such options at the exercise price, or to close out the options at a profit. The premium paid for a put or call option plus any transaction costs will reduce the benefit, if any, realized by that Fund upon exercise of the option, and, unless the price of the underlying security rises or declines sufficiently, the option may expire worthless to that Fund. In addition, in the event that the price of the security in connection with which an option was purchased moves in a direction favorable to that Fund, the benefits realized by that Fund as a result of such favorable movement will be reduced by the amount of the premium paid for the option and related transaction costs. Written and purchased options are non-income producing securities.
e. Cash –The Funds consider their investments in an FDIC insured interest bearing savings account to be cash. The Funds maintain cash balances, which, at times, may exceed federally insured limits. The Funds maintain these balances with a high quality financial institution.
99
| NOTES TO FINANCIAL STATEMENTS |
| October 31, 2019 (Continued) |
f. Swap Agreements – Long/Short Credit and Monthly Distribution are subject to stock market risk and fixed income risk in the normal course of pursuing their investment objectives. The Funds may enter into various swap transactions for investment purposes to manage equity risk and credit risk. These are two-party contracts entered into primarily to exchange the returns (or differentials in rates of returns) earned or realized on particular pre-determined investments or instruments. The gross returns to be exchanged or “swapped” between parties are calculated with respect to a notional amount, i.e., the return on or increase in value of a particular dollar amount invested at a particular interest rate, in a particular foreign currency, or in a “basket” of securities representing a particular index or market segment. Changes in the value of swap agreements are recognized as unrealized gains or losses in the Statements of Operations by “marking to market” on a daily basis to reflect the value of the swap agreement at the end of each trading day. Payments received or paid at the beginning of the agreement are reflected as such on the Statements of Assets and Liabilities and may be referred to as upfront payments. The Funds amortize upfront payments and/or accrue for the fixed payment stream on swap agreements on a daily basis with the net amount recorded as a component of unrealized gain or loss on the Statements of Operations. A liquidation payment received or made at the termination of the swap agreement is recorded as a realized gain or loss on the Statements of Operations. The Funds segregate liquid securities having a value at least equal to the amount of its current obligation under any swap transaction. Entering into these agreements involves, to varying degrees, lack of liquidity and elements of credit, market, and counterparty risk in excess of amounts recognized on the Statements of Assets and Liabilities. The Funds’ maximum risk of loss from counterparty credit risk is the discounted net value of the cash flows to be received from/paid to the counterparty over the contract’s remaining life, to the extent that that amount is positive.
g. Futures Contracts– Long/Short Credit, Dynamic Macro and International Opportunity Bond are subject to equity risk, interest rate risk and forward currency exchange rate risk in the normal course of pursuing their investment objectives. The Funds may purchase or sell futures contracts to gain exposure to, or hedge against, changes in the value of equities, interest rates, and foreign exchange rates. Initial margin deposits required upon entering into futures contracts are satisfied by the segregation of specific securities or cash as collateral for the account of the broker (the Fund’s agent in acquiring the futures position). During the period the futures contracts are open, changes in the value of the contracts are recognized as unrealized gains or losses by “marking to market” on a daily basis to reflect the market value of the contracts at the end of each day’s trading. Variation margin payments are received or made depending upon whether unrealized gains or losses are incurred. When the contracts are closed, the Funds recognize a realized gain or loss equal to the difference between the proceeds from, or cost of, the closing transaction and the Fund’s basis in the contract. If the Funds were unable to liquidate a futures contract and/or enter into an offsetting closing transaction, the Funds would continue to be subject to market risk with respect to the value of the contracts and continue to be required to maintain the margin deposits on the futures contracts. The Funds segregate cash having a value at least equal to the amount of the current obligation under any open futures contract. Risks may exceed amounts recognized in the Statements of Assets and Liabilities. With futures, there is minimal counterparty credit risk to the Funds since futures are exchange traded and the exchange’s clearinghouse, as counterparty to all exchange traded futures, guarantees the futures against default.
h. Short Sales – A “short sale” is a transaction in which a Fund sells a security it does not own but has borrowed in anticipation that the market price of that security will decline. The Fund would be obligated to replace the security borrowed by purchasing it on the open market at a later date. If the price of the security sold short increases between the time of the short sale and the time the Fund replaces the borrowed security, the Fund will incur a loss. Conversely, if the price declines, the Fund will realize a gain.
i. Impact of Derivatives on the Statements of Assets and Liabilities and Statements of Operations– The following is a summary of the location of derivative investments of each Fund in the Statement of Assets and Liabilities as of October 31, 2019:
| Location on the Statements of Assets and Liabilities | ||||
| Derivatives Investment Type | Asset Derivatives | Liability Derivatives | ||
| Equity/Currency/Commodity | Investments in securities | Option contracts written | ||
| Interest rate contracts | Unrealized appreciation on futures contracts | Unrealized depreciation on futures contracts | ||
| Unrealized appreciation on swap contracts | Unrealized depreciation on swap contracts | |||
| Unrealized appreciation on forward foreign currency exchange contracts | Unrealized depreciation on forward foreign currency exchange contracts | |||
100
| NOTES TO FINANCIAL STATEMENTS |
| October 31, 2019 (Continued) |
The following table sets forth the fair value of each Fund’s derivative contracts by primary risk exposure as of October 31, 2019:
| Asset Derivatives Investment Value | ||||||||||||||||||||
| Total value at | ||||||||||||||||||||
| Equity | Currency | Commodity | Interest Rate | October 31, | ||||||||||||||||
| Contracts | Contracts | Contracts | Contracts | 2019 | ||||||||||||||||
| Long/Short Credit | ||||||||||||||||||||
| Futures Contracts | $ | — | $ | — | $ | — | $ | 281,265 | $ | 281,265 | ||||||||||
| Credit Default Swap Contracts | 235,683 | — | — | — | 235,683 | |||||||||||||||
| Total Return Swap Contracts | — | — | — | 27,226 | 27,226 | |||||||||||||||
| Monthly Distribution | ||||||||||||||||||||
| Purchased Options | $ | 88,600 | $ | — | $ | — | $ | — | $ | 88,600 | ||||||||||
| Total Return Swap Contracts | 109,373 | — | — | — | 109,373 | |||||||||||||||
| Dynamic Macro | ||||||||||||||||||||
| Futures Contracts | $ | 139,279 | $ | — | $ | — | $ | 257,615 | $ | 396,894 | ||||||||||
| Purchased Options | 26,985 | — | — | 823,891 | 850,876 | |||||||||||||||
| International Opportunity Bond | ||||||||||||||||||||
| Forward Foreign Currency Exchange Contracts | $ | — | $ | 152,084 | $ | — | $ | — | $ | 152,084 | ||||||||||
| Futures Contracts | — | — | — | 87,417 | 87,417 | |||||||||||||||
| Liability Derivatives Investment Value | ||||||||||||||||||||
| Total value at | ||||||||||||||||||||
| Equity | Currency | Commodity | Interest Rate | October 31, | ||||||||||||||||
| Contracts | Contracts | Contracts | Contracts | 2019 | ||||||||||||||||
| Long/Short Credit | ||||||||||||||||||||
| Credit Default Swap Contracts | $ | 219,875 | $ | — | $ | — | $ | — | $ | 219,875 | ||||||||||
| Monthly Distribution | ||||||||||||||||||||
| Written Options | $ | 917,709 | $ | — | $ | — | $ | — | $ | 917,709 | ||||||||||
| Total Return Swap Contracts | 256,872 | — | — | — | 256,872 | |||||||||||||||
| Dynamic Macro | ||||||||||||||||||||
| Futures Contracts | $ | 111,625 | $ | — | $ | — | $ | 53,533 | $ | 165,158 | ||||||||||
| Written Options | 35,530 | — | — | — | 35,530 | |||||||||||||||
| International Opportunity Bond Forward Foreign Currency Exchange Contracts | $ | — | $ | 161,236 | $ | — | $ | — | $ | 161,236 | ||||||||||
| Futures Contracts | — | — | — | 72,624 | 72,624 | |||||||||||||||
The following is a summary of the location of derivative investments of each Fund in the Statements of Operations for the year ended October 31, 2019.
| Derivative Investment Type | Location of Gain (Loss) on Derivatives | |
| Equity/Currency/Commodity/ Interest rate contracts | Net realized gain (loss) from: Futures contracts, Purchased options, Written options, Swap contracts, Forward foreign currency exchange contracts | |
| Net change in unrealized appreciation (depreciation) on: Futures contracts, Purchased options, Written options, Swap contracts, and Forward foreign currency exchange contracts |
101
| NOTES TO FINANCIAL STATEMENTS |
| October 31, 2019 (Continued) |
The following is a summary of each Fund’s realized gain (loss) and change in unrealized appreciation (depreciation) on derivative investments recognized in the Statements of Operations categorized by primary risk exposure for the year ended October 31, 2019:
| Realized gain (loss) on derivatives recognized in the Statements of Operations | ||||||||||||||||||||
| Total value at | ||||||||||||||||||||
| Equity | Currency | Commodity | Interest Rate | October 31, | ||||||||||||||||
| Derivative Investment type | Contracts | Contracts | Contracts | Contracts | 2019 | |||||||||||||||
| Long/Short Credit | ||||||||||||||||||||
| Futures Contracts | $ | — | $ | — | $ | — | $ | (1,914,195 | ) | $ | (1,914,195 | ) | ||||||||
| Swaps Contracts | 1,723 | — | — | (427,529 | ) | (425,806 | ) | |||||||||||||
| Monthly Distribution | ||||||||||||||||||||
| Purchased Options | $ | 3,258,819 | $ | — | $ | — | $ | — | $ | 3,258,819 | ||||||||||
| Written Options | (2,155,046 | ) | — | — | — | (2,155,046 | ) | |||||||||||||
| Swaps Contracts | 515,796 | — | — | — | 515,796 | |||||||||||||||
| Dynamic Macro | ||||||||||||||||||||
| Futures Contracts | $ | 16,879 | $ | — | $ | — | $ | (80,630 | ) | $ | (63,751 | ) | ||||||||
| Purchased Options | (465,891 | ) | — | — | 1,126,913 | 661,022 | ||||||||||||||
| Written Options | 183,987 | — | — | — | 183,987 | |||||||||||||||
| International Opportunity Bond | ||||||||||||||||||||
| Futures Contracts | $ | — | $ | — | $ | — | $ | 218,469 | $ | 218,469 | ||||||||||
| Forward Foreign Currency Exchange Contracts | — | (31,324 | ) | — | — | (31,324 | ) | |||||||||||||
| Changes in unrealized appreciation (depreciation) on derivatives recognized in the Statements of Operations | ||||||||||||||||||||
| Total value at | ||||||||||||||||||||
| Equity | Currency | Commodity | Interest Rate | October 31, | ||||||||||||||||
| Derivative Investment type | Contracts | Contracts | Contracts | Contracts | 2019 | |||||||||||||||
| Long/Short Credit | ||||||||||||||||||||
| Futures Contracts | $ | — | $ | — | $ | — | $ | 159,108 | $ | 159,108 | ||||||||||
| Swaps Contracts | 11,992 | — | — | 27,226 | 39,218 | |||||||||||||||
| Monthly Distribution | ||||||||||||||||||||
| Purchased Options | $ | (1,410,366 | ) | $ | — | $ | — | $ | — | $ | (1,410,366 | ) | ||||||||
| Written Options | (555,567 | ) | — | — | — | (555,567 | ) | |||||||||||||
| Swaps Contracts | (147,499 | ) | — | — | — | (147,499 | ) | |||||||||||||
| Dynamic Macro | ||||||||||||||||||||
| Futures Contracts | $ | 659,716 | $ | — | $ | — | $ | 264,629 | $ | 924,345 | ||||||||||
| Purchased Options | (130,633 | ) | — | — | 410,763 | 280,130 | ||||||||||||||
| Written Options | (3,205 | ) | — | — | — | (3,205 | ) | |||||||||||||
| International Opportunity Bond | ||||||||||||||||||||
| Futures Contracts | $ | — | $ | — | $ | — | $ | 20,397 | $ | 20,397 | ||||||||||
| Forward Foreign Currency Exchange Contracts | — | (91,347 | ) | — | — | (91,347 | ) | |||||||||||||
The average notional value of the derivative instruments for the year ended October 31, 2019 is disclosed below:
| Average Notional Value | ||||||||||||||||||||||||
| Long | Short | Purchased | Written | Long | Short | |||||||||||||||||||
| Futures | Futures | Options | Options | Swaps | Swaps | |||||||||||||||||||
| Long/Short Credit | $ | — | $ | 16,132,755 | $ | — | $ | — | $ | 9,750,000 | $ | 7,000,002 | ||||||||||||
| Monthly Distribution | — | — | 27,506,463 | 37,610,163 | 1,504,951 | (1) | 5,656,820 | (1) | ||||||||||||||||
| Dynamic Macro | 26,236,621 | 47,911,905 | 21,331,036 | 13,783,286 | — | — | ||||||||||||||||||
| International Opportunity Bond | 3,516,374 | 4,368,628 | — | — | — | — | ||||||||||||||||||
| (1) | Monthly Distribution only invested in swaps in quarter 4, therefore notional shown is not averaged. |
102
| NOTES TO FINANCIAL STATEMENTS |
| October 31, 2019 (Continued) |
j. Offsetting of Financial Assets & Liabilities and Derivative Assets & Liabilities– Long/Short Credit, Monthly Distribution, Dynamic Macro, and International Opportunity Bond policies are to recognize a gross asset or liability equal to the unrealized on futures contracts, forward foreign currency exchange contracts, swaps and written options. During the year ended October 31, 2019, Long/Short Credit is subject to a master netting arrangement for swaps. The following table shows additional information regarding the offsetting of assets and liabilities at October 31, 2019.
| Long/Short Credit | ||||||||||||||||||||||||||
| Gross Amounts Not Offset in the | ||||||||||||||||||||||||||
| Assets: | Statement of Assets & Liabilities | |||||||||||||||||||||||||
| Gross Amounts | Net Amounts of | |||||||||||||||||||||||||
| Gross Amounts of | Offset in the | Assets Presented in | ||||||||||||||||||||||||
| Recognized | Statement of Assets | the Statement of | Financial | Cash Collateral | ||||||||||||||||||||||
| Description | Counterparty | Assets | & Liabilities | Assets & Liabilities | Instruments | Received | Net Amount | |||||||||||||||||||
| Futures Contracts | HSBC | $ | 281,265 | $ | — | $ | 281,265 | $ | — | $ | — | $ | 281,265 | |||||||||||||
| Credit Default Swaps | HSBC | 40,289 | — | 40,289 | — | — | 40,289 | |||||||||||||||||||
| Credit Default Swaps | JP Morgan | 175,516 | — | 175,516 | — | — | 175,516 | |||||||||||||||||||
| Credit Default Swaps | Goldman Sachs | 19,878 | — | 19,878 | — | — | 19,878 | |||||||||||||||||||
| Total Return Swaps | JP Morgan | 14,089 | — | 14,089 | — | — | 14,089 | |||||||||||||||||||
| Total Return Swaps | Goldman Sachs | 13,137 | — | 13,137 | — | — | 13,137 | |||||||||||||||||||
| Total | $ | 544,174 | $ | — | $ | 544,174 | $ | — | $ | — | $ | 544,174 | ||||||||||||||
| Gross Amounts Not Offset in the | ||||||||||||||||||||||||||
| Liabilities: | Statement of Assets & Liabilities | |||||||||||||||||||||||||
| Gross Amounts | Net Amounts of | |||||||||||||||||||||||||
| Gross Amounts of | Offset in the | Liabilities Presented | ||||||||||||||||||||||||
| Recognized | Statement of Assets | in the Statement of | Financial | Cash Collateral | ||||||||||||||||||||||
| Description | Counterparty | Liabilities | & Liabilities | Assets & Liabilities | Instruments | Pledged (1) | Net Amount | |||||||||||||||||||
| Credit Default Swaps | Goldman Sachs | $ | (96,781 | ) | $ | — | $ | (96,781 | ) | $ | — | $ | 96,781 | $ | — | |||||||||||
| Credit Default Swaps | JP Morgan | (123,094 | ) | — | (123,094 | ) | — | — | (123,094 | ) | ||||||||||||||||
| Total | $ | (219,875 | ) | $ | — | $ | (219,875 | ) | $ | — | $ | 96,781 | $ | (123,094 | ) | |||||||||||
| Monthly Distribution | ||||||||||||||||||||||||||
| Gross Amounts Not Offset in the | ||||||||||||||||||||||||||
| Assets: | Statement of Assets & Liabilities | |||||||||||||||||||||||||
| Gross Amounts | Net Amounts of | |||||||||||||||||||||||||
| Gross Amounts | Offset in the | Assets Presented in | ||||||||||||||||||||||||
| of Recognized | Statement of Assets | the Statement of | Financial | Cash Collateral | ||||||||||||||||||||||
| Description | Counterparty | Assets | & Liabilities | Assets & Liabilities | Instruments | Received | Net Amount | |||||||||||||||||||
| Purchased Options | JP Morgan | $ | 88,600 | $ | — | $ | 88,600 | $ | — | $ | — | $ | 88,600 | |||||||||||||
| Total Return Swap | JP Morgan | 109,373 | — | 109,373 | (109,373 | ) | — | — | ||||||||||||||||||
| Total | $ | 197,973 | $ | — | $ | 197,973 | $ | (109,373 | ) | $ | — | $ | 88,600 | |||||||||||||
| Gross Amounts Not Offset in the | ||||||||||||||||||||||||||
| Liabilities: | Statement of Assets & Liabilities | |||||||||||||||||||||||||
| Gross Amounts | Net Amounts of | |||||||||||||||||||||||||
| Gross Amounts | Offset in the | Liabilities Presented | ||||||||||||||||||||||||
| of Recognized | Statement of Assets | in the Statement of | Financial | Cash Collateral | ||||||||||||||||||||||
| Description | Counterparty | Liabilities | & Liabilities | Assets & Liabilities | Instruments | Pledged (1) | Net Amount | |||||||||||||||||||
| Written Options | JP Morgan | $ | (917,709 | ) | $ | — | $ | (917,709 | ) | $ | — | $ | — | $ | (917,709 | ) | ||||||||||
| Total Return Swaps | JP Morgan | (256,872 | ) | — | (256,872 | ) | 109,373 | — | (147,499 | ) | ||||||||||||||||
| Total | $ | (1,174,581 | ) | $ | — | $ | (1,174,581 | ) | $ | 109,373 | $ | — | $ | (1,065,208 | ) | |||||||||||
| (1) | The amount is limited to the derivative liability balance and accordingly, does not include excess collateral pledged. |
103
| NOTES TO FINANCIAL STATEMENTS |
| October 31, 2019 (Continued) |
| Dynamic Macro | ||||||||||||||||||||||||||
| Gross Amounts Not Offset in the | ||||||||||||||||||||||||||
| Statement of Assets & | ||||||||||||||||||||||||||
| Assets: | Liabilities | |||||||||||||||||||||||||
| Gross | Gross Amounts | Net Amounts of | ||||||||||||||||||||||||
| Amounts of | Offset in the | Assets Presented in | Cash | |||||||||||||||||||||||
| Recognized | Statement of Assets | the Statement of | Financial | Collateral | ||||||||||||||||||||||
| Description | Counterparty | Assets | & Liabilities | Assets & Liabilities | Instruments | Received | Net Amount | |||||||||||||||||||
| Futures Contracts | Goldman Sachs | $ | 396,894 | $ | — | $ | 396,894 | $ | (165,158 | ) | $ | — | $ | 231,736 | ||||||||||||
| Purchased Options | Goldman Sachs | 850,876 | — | 850,876 | — | — | 850,876 | |||||||||||||||||||
| Total | $ | 1,247,770 | $ | — | $ | 1,247,770 | $ | (165,158 | ) | $ | — | $ | 1,082,612 | |||||||||||||
| Gross Amounts Not Offset in the | ||||||||||||||||||||||||||
| Statement of Assets & | ||||||||||||||||||||||||||
| Liabilities: | Liabilities | |||||||||||||||||||||||||
| Gross | Gross Amounts | Net Amounts of | ||||||||||||||||||||||||
| Amounts of | Offset in the | Liabilities Presented | Cash | |||||||||||||||||||||||
| Recognized | Statement of Assets | in the Statement of | Financial | Collateral | ||||||||||||||||||||||
| Description | Counterparty | Liabilities | & Liabilities | Assets & Liabilities | Instruments | Pledged | Net Amount | |||||||||||||||||||
| Futures Contracts | Goldman Sachs | $ | (165,158 | ) | $ | — | $ | (165,158 | ) | $ | 165,158 | $ | — | $ | — | |||||||||||
| Written Options | Goldman Sachs | (35,530 | ) | — | (35,530 | ) | — | — | (35,530 | ) | ||||||||||||||||
| Total | $ | (200,688 | ) | $ | — | $ | (200,688 | ) | $ | 165,158 | $ | — | $ | (35,530 | ) | |||||||||||
| International Opportunity Bond | ||||||||||||||||||||||||||
| Gross Amounts Not Offset in | ||||||||||||||||||||||||||
| the Statement of Assets & | ||||||||||||||||||||||||||
| Assets: | Liabilities | |||||||||||||||||||||||||
| Gross | ||||||||||||||||||||||||||
| Amounts | ||||||||||||||||||||||||||
| Gross | Offset in the | Net Amounts of | ||||||||||||||||||||||||
| Amounts of | Statement of | Assets Presented in | Cash | |||||||||||||||||||||||
| Recognized | Assets & | the Statement of | Financial | Collateral | ||||||||||||||||||||||
| Description | Counterparty | Assets | Liabilities | Assets & Liabilities | Instruments | Received | Net Amount | |||||||||||||||||||
| Forward Foreign | ||||||||||||||||||||||||||
| Currency Exchange | ||||||||||||||||||||||||||
| Contracts | Barclays | $ | 54,014 | $ | — | $ | 54,014 | $ | (54,014 | ) | $ | — | $ | — | ||||||||||||
| Citigroup | 98,070 | — | 98,070 | (31,180 | ) | — | 66,890 | |||||||||||||||||||
| Futures Contracts | Credit Suisse | 87,417 | — | 87,417 | (72,624 | ) | — | 14,793 | ||||||||||||||||||
| Total | $ | 239,501 | $ | — | $ | 239,501 | $ | (157,818 | ) | $ | — | $ | 81,683 | |||||||||||||
| Gross Amounts Not Offset in | ||||||||||||||||||||||||||
| the Statement of Assets & | ||||||||||||||||||||||||||
| Liabilities: | Liabilities | |||||||||||||||||||||||||
| Gross | ||||||||||||||||||||||||||
| Gross | Amounts | Net Amounts of | ||||||||||||||||||||||||
| Amounts of | Offset in the | Liabilities Presented | Cash | |||||||||||||||||||||||
| Recognized | Statement of | in the Statement of | Financial | Collateral | ||||||||||||||||||||||
| Description | Counterparty | Liabilities | Assets & | Assets & Liabilities | Instruments | Pledged | Net Amount | |||||||||||||||||||
| Forward Foreign | ||||||||||||||||||||||||||
| Currency Exchange | ||||||||||||||||||||||||||
| Contracts | Barclays | $ | (130,056 | ) | $ | — | $ | (130,056 | ) | $ | 54,014 | $ | — | $ | (76,042 | ) | ||||||||||
| Citigroup | (31,180 | ) | — | (31,180 | ) | 31,180 | — | — | ||||||||||||||||||
| Futures Contracts | Credit Suisse | (72,624 | ) | — | (72,624 | ) | 72,624 | — | — | |||||||||||||||||
| Total | $ | (233,860 | ) | $ | — | $ | (233,860 | ) | $ | 157,818 | $ | — | $ | (76,042 | ) | |||||||||||
k. Exchange Traded Funds – The Funds may invest in exchange traded funds (“ETFs”). ETFs are a type of index fund bought and sold on a securities exchange. An ETF trades like common stock and represents a fixed portfolio of securities. A Fund may purchase an ETF to temporarily gain exposure to a portion of the U.S. or a foreign market while awaiting purchase of underlying securities. The risks of owning an ETF generally reflect the risks of owning the underlying securities they are designed to track, although the lack of liquidity on an ETF could result in it being more volatile. Additionally, ETFs have fees and expenses that reduce their value.
104
| NOTES TO FINANCIAL STATEMENTS |
| October 31, 2019 (Continued) |
l. Investment Transactions, Investment Income and Expenses – Investment transactions are recorded on a trade date basis. Realized gains and losses from investment transactions and foreign exchange transactions are calculated using the identified cost method. Dividend income and expense is recorded on the ex-dividend date (“ex -date”) except in the case of certain dividends from foreign securities, which are recorded as soon after the ex-date that the respective Fund, using reasonable diligence, becomes aware of such dividends. Interest income is recorded on an accrual basis. Discounts are accreted and premiums are amortized as adjustments to interest income and the identified cost of investments. Expenses of the Trust that are directly identifiable to a specific Fund are charged to that Fund. Expenses, which are not readily identifiable to a specific Fund, are allocated in such a manner as deemed equitable, taking into consideration the nature and type of expense and the relative sizes of the Funds. Each Fund’s income, expenses (other than the class specific distribution fees) and realized and unrealized gains and losses are allocated proportionally each day between the classes based upon the relative net assets of each class.
m. Concentration of Risk – Investing in securities of foreign issuers and currency transactions may involve certain considerations and risks not typically associated with investments in the United States. These risks include revaluation of currencies, adverse fluctuations in foreign currency values and possible adverse political, social and economic developments, including those particular to a specific industry, country or region. These conditions could cause the securities and their markets to be less liquid and prices more volatile than those of comparable U.S. companies and U.S. government securities.
Small capitalization (“small cap”) companies may be more vulnerable than larger capitalization companies to adverse business or economic developments. Small cap companies may also have limited product lines, markets or financial resources, and may be dependent on a relatively small management group. Securities of such companies may be less liquid and more volatile than securities of larger capitalization companies or the market averages in general and therefore may involve greater risk than investing in larger capitalization companies.
The ability of issuers of debt securities held by the Funds to meet their obligations may be affected by economic and political developments particular to a specific industry, country, state or region. Investments in lower grade debt securities are subject to special risks, including greater price volatility and a greater risk of loss of principal and interest.
Certain Funds may invest in collateralized mortgage obligations which are secured by groups of individual mortgages, but are similar to a conventional bond where the investor looks only to the issuer for payment of principal and interest. Although the obligations are recourse obligations to the issuer, the issuer typically has no significant assets, other than assets pledged as collateral for the obligations, and the market value of the collateral, which is sensitive to interest rate movements, may affect the market value of the obligations. A public market for a particular collateralized mortgage obligation may or may not develop and thus, there can be no guarantee of liquidity of an investment in such obligations.
The risk in writing a call option is that a Fund may forgo the opportunity of profit if the market value of the underlying security increases and the option is exercised, although any potential loss is reduced by the amount of option premium received. The risk in writing a put option is that a Fund may be called on to pay the exercise price of the option for a security that has decreased (potentially to zero) in market price, although any potential loss is reduced by the amount of option premium received. Generally, option transactions also involve risks concerning liquidity of the options market. An illiquid market for an option may limit a Fund’s ability to write options or enter closing transactions. As the options written by the Funds are traded on a national exchange, counterparty and credit risk are limited to the failure of the exchange on which the options are traded.
n. Federal Income Taxes – It is each Fund’s policy to continue to comply with all sections of the Internal Revenue Code applicable to regulated investment companies and to distribute all of its taxable income and gains, if any, to its shareholders and therefore, no provision for federal income tax has been made. Each Fund is treated as a separate taxpayer for federal income tax purposes. The Funds recognize the tax benefits of uncertain tax positions only when the position is “more likely than not” to be sustained assuming examination by tax authorities. Management has reviewed the tax positions in the open tax years of 2016 to 2018 and expected to be taken in tax year 2019 and concluded that no liability for unrecognized tax benefits should be recorded related to uncertain tax positions taken in the above open tax years. The Funds identify their major tax jurisdiction as U.S. Federal. The Funds recognize interest and penalties, if any, related to unrecognized tax benefits as income tax expense in the Statements of Operations. During the year, the Funds did not incur any interest or penalties. Generally tax authorities can examine tax returns filed for the last three years.
o. Distributions to Shareholders – It is each Fund’s policy to distribute its respective net investment income and net capital gains, if any, annually except for Long/Short Credit, Monthly Distribution, Corporate/Government Bond, High-Yield Bond , Floating Rate Bond and International Opportunity Bond which will distribute their respective net investment income, if any, monthly. Distributions of net investment income and net capital gains are determined in accordance with income tax regulations which may differ from GAAP. Differences in dividends from net investment income per share between the classes are due to service and distribution related expenses. Dividends and distributions to shareholders are recorded on ex-date. Monthly Distribution’s distribution policy is to make twelve monthly distributions to shareholders. The level of monthly distributions (including any return of capital) is not fixed but is expected to be at or near the level of the prime interest rate (“Prime Rate”). Additionally, Monthly Distribution’s distribution policy is not designed to generate, and is not expected to result in, distributions that equal a fixed percentage of Monthly Distribution’s current net asset value per share. Shareholders receiving periodic payments from Monthly Distribution may be under the impression that they are receiving net income.
105
| NOTES TO FINANCIAL STATEMENTS |
| October 31, 2019 (Continued) |
However, all or a portion of a distribution may consist of a return of capital. Shareholders should not assume that the source of a distribution from Monthly Distribution is net income.
p. Real Estate Investment Trusts – Real Estate Stock invests primarily in Real Estate Investment Trusts (REITs). Distributions from REITs may be characterized as dividends, capital gains, and/or return of capital.
q. Indemnification – The Trust indemnifies its officers and Trustees for certain liabilities that may arise from the performance of their duties to the Trust. Additionally, in the normal course of business, each Fund enters into contracts that contain a variety of representations and warranties and which provide general indemnities. A Fund’s maximum exposure under these arrangements is unknown, as this would involve future claims that may be made against the Fund that have not yet occurred. However, based on experience, the Funds expect the risk of loss due to these warranties and indemnities to be remote.
| 3. | INVESTMENT ADVISORY FEES AND OTHER TRANSACTIONS WITH AFFILIATES |
| a. | Management Fees –Dunham & Associates serves as each Fund’s investment adviser. Pursuant to an investment advisory agreement with the Trust, on behalf of the Funds, Dunham & Associates, subject to the supervision of the Board and in conformity with the stated policies of the Funds, manages the operations of the Funds. The Adviser, subject to the review and approval of the Board, selects Sub-Advisers for each Fund and supervises and monitors the performance of each Sub-Adviser. As compensation for its services, each Fund pays the Adviser a fixed fee, accrued daily and paid monthly, based on each Fund’s respective average daily net assets. The Adviser has entered into a Sub-Advisory Agreement with each Sub-Adviser and the Trust, on behalf of each Fund. Under the Sub-Advisory Agreements, each Fund pays the Sub-Adviser a “Fulcrum Fee.” A Fulcrum Fee is a performance fee whereby the Sub-Adviser is rewarded when out-performing, or is penalized when under -performing, a Fund’s benchmark index. As a result of the Fulcrum Fee arrangement, the total annual management fee for a Fund will have a range as shown in the table below. |
| Adviser’s | Sub-Adviser’s | |||||
| Management Fee | Portion | Portion | ||||
| Floating Rate Bond* | 0.70% – 1.06% | 0.60% | 0.10% – 0.46% | |||
| Long/Short Credit | 0.70% – 1.80% | 0.65% | 0.05% – 1.15% | |||
| Corporate/Government Bond | 0.65% – 0.95% | 0.50% | 0.15% – 0.45% | |||
| Monthly Distribution | 0.87% – 1.63% | 0.65% | 0.22% – 0.98% | |||
| Dynamic Macro | 1.05% – 1.75% | 0.65% | 0.40% – 1.10% | |||
| High-Yield Bond | 0.82% – 1.02% | 0.60% | 0.22% – 0.42% | |||
| International Opportunity Bond | 0.80% – 1.30% | 0.60% | 0.20% – 0.70% | |||
| Large Cap Value | 0.75% – 1.15% | 0.65% | 0.10% – 0.50% | |||
| Focused Large Cap Growth | 0.85% – 1.15% | 0.65% | 0.20% – 0.50% | |||
| International Stock | 0.95% – 1.65% | 0.65% | 0.30% – 1.00% | |||
| Real Estate Stock | 0.75% – 1.35% | 0.65% | 0.10% – 0.70% | |||
| Small Cap Value | 0.75% – 1.45% | 0.65% | 0.10% – 0.80% | |||
| Small Cap Growth | 0.65% – 1.65% | 0.65% | 0.00% – 1.00% | |||
| Emerging Markets Stock ** | 0.70% – 1.50% | 0.65% | 0.05% – 0.85% | |||
| * | Prior to March 1, 2019, the Sub-Adviser’s portion for Floating Rate Bond was 0.10%-0.50% and the Management Fee was 0.70%-1.10%. |
| ** | Prior to April 1, 2019, the Sub-Adviser’s portion for Emerging Markets Stock was 0.10%-0.90% and the Management Fee was 0.75%-1.55%. |
Each Fund’s Sub-Advisory Fulcrum Fee is calculated daily using an annual base Sub-Advisory fee of a specified amount of the average daily net assets of the Fund (the “Base Fee”), adjusted by the Fund’s Class N share performance relative to the Fund’s benchmark (the “Performance Fee”). Depending on a Fund’s net performance versus its benchmark, the Sub-Adviser will receive a fee adjustment in accordance with a formula that equates a percentage of out- or under-performance to a percentage of fee increases or decreases, respectively. In addition, some Fulcrum Fees employ a “null zone” around the base fee, whereby small differences in performance versus the benchmark will not trigger a fee increase or decrease. During the first 12 months of the Fulcrum Fee arrangement, the Performance Fee is calculated daily from inception date of the agreement to the calculation date and is applied to the average daily net assets of the Funds during the calculation period. After the initial 12 months, the Performance Fee is calculated on a daily basis based on comparative performance over a rolling 12-month period. All Funds, with the exception of Emerging Markets Stock which is in its initial year of a new Fulcrum Fee arrangement, are calculating Performance Fees on a rolling 12-month basis as of October 31, 2019.
106
| NOTES TO FINANCIAL STATEMENTS |
| October 31, 2019 (Continued) |
Depending on the particular Sub-Advisory Agreement, the Performance Fee can adjust the Base Fee up or down by as much as 100% of the Base Fee, such that the Sub-Advisory fee can vary anywhere from 0.00% (the “Minimum Fee”) to twice the Base Fee (the “Maximum Fee”). However, because each such Sub-Advisory Agreement requires that the Sub-Adviser only be paid out the monthly Minimum Fee during the first year (in most cases, 0.10%), the Sub-Adviser, in most cases, will receive less compensation until the end of the first year. At the end of the first year of the agreement, the Sub-Adviser will be paid a lump sum that reflects the accrued Fulcrum Fee over the year, less any Minimum Fees paid out during the first year. Therefore, in the first year, the Fulcrum Fee methodology has three elements: 1) daily calculation of the Performance Fee and daily accrual of the Fulcrum Fee; 2) monthly payment of the Minimum Fee only (if any); and 3) a lump sum payment at the end of the initial 12-month period of the accrued Fulcrum Fee less the Minimum Fee.
By virtue of using average daily net assets over a “rolling” 12-month period for purposes of calculating the Performance Fee while using average daily net assets for the most recent month for purposes of calculating the Base Fee, the actual total Fulcrum Fee paid by the Fund to the Sub-Adviser may be higher or lower than the maximum or minimum annual rates described above if the average daily net assets do not remain constant during the rolling 12-month period. If the Fund is significantly underperforming versus the Index and the Fund’s net assets have declined significantly, the monthly total Fulcrum Fee can be a negative number (although the performance fee rate can never be negative, the Performance Fee can be negative). In such instances, if the negative Fulcrum Fee is not earned back or offset the following month, the Sub-Adviser must reimburse the Fund the amount of the negative Fulcrum Fee within an agreed upon time. Likewise, in the case where the Fund has significantly underperformed versus the Index but net assets have increased significantly, the monthly total Fulcrum Fee can be positive although the performance fee rate may be 0.00%. In such instances, the Fund will pay the Sub-Adviser the monthly Fulcrum Fee.
The table below lists the current Sub-Advisers along with their Fulcrum Fee arrangements.
| Null | Minimum | Maximum | |||||||||||||||||
| Fund | Sub-Adviser | Benchmark | Base Fee | Zone | Fee | Fee | |||||||||||||
| Floating Rate Bond | New fleet Asset Management, LLC | Credit Suisse Leveraged Loan Total Return Index | 0.28% | +/- 0.00% | 0.10% | 0.46% | |||||||||||||
| Long/Short Credit | Metlife Investment Advisors, LLC | BofA Merrill Lynch US 3-month Treasury Bill Index PLUS 300 bps (3.00%) | 0.60% | +/- 0.00% | 0.05% | 1.15% | |||||||||||||
| Corporate/Government Bond | New fleet Asset Management, LLC | Bloomberg Barclays Aggregate Bond Index | 0.30% | +/- 0.15% | 0.15% | 0.45% | |||||||||||||
| Monthly Distribution * | Weiss Multi-Strategy Advisers, LLC | IQ Hedge Market Neutral Total Return Index | 0.60% | +/- 0.00% | 0.22% | 0.98% | |||||||||||||
| Dynamic Macro | Mellon Investments Corporation | IQ Hedge Global Macro Beta Index | 0.75% | +/- 0.00% | 0.40% | 1.10% | |||||||||||||
| High-Yield Bond | PineBridge Investments LLC | Barclays U.S. Corporate High Yield Bond Ba/B 2% Issuer Capped Index | 0.32% | +/- 0.00% | 0.22% | 0.42% | |||||||||||||
| International Opportunity Bond | Allianz Global Investors U.S. LLC | Barclays Global ex US Aggregate Bond Index (Unhedged) | 0.45% | +/- 0.00% | 0.20% | 0.70% | |||||||||||||
| Large Cap Value | Rothschild & Co. Asset Management US Inc. | Russell 1000 Value Index | 0.30% | +/- 0.00% | 0.10% | 0.50% | |||||||||||||
| Focused Large Cap Growth | The Ithaka Group, LLC | Russell 1000 Growth Index | 0.35% | +/- 0.30% | 0.20% | 0.50% | |||||||||||||
| International Stock | Arrow street Capital L.P. | MSCI All Country World Index ex USA (Net) | 0.65% | +/- 0.20% | 0.30% | 1.00% | |||||||||||||
| Real Estate Stock | Barings, LLC | FTSE NAREIT All REITs Index | 0.40% | +/- 0.00% | 0.10% | 0.70% | |||||||||||||
| Small Cap Value *** | Ziegler Capital Management, LLC | Russell 2000 Value Index | 0.45% | +/- 0.00% | 0.10% | 0.80% | |||||||||||||
| Small Cap Growth | Pier Capital, LLC | Russell 2000 Growth Index | 0.50% | +/- 0.20% | 0.00% | 1.00% | |||||||||||||
| Emerging Markets Stock ** | NS Partners Ltd. | MSCI Emerging Markets Index (Net) | 0.45% | +/- 0.00% | 0.05% | 0.85% |
| * | Effective August 2, 2019 Weiss Multi-Strategy Advisers, LLC. replaced Perella Weinberg Partners Capital Management LP. as the sub-adviser to Monthly Distribution. Perella Weinberg Partners Capital Management LP had a Base fee of 0.60%, a Minimum fee of 0.22% and a Maximum Fee of 0.98%. |
| ** | Effective April 1, 2019 NS Partners Ltd. replaced Bailard, Inc. as the sub-adviser to Emerging Markets Stock. Bailard, Inc. had a Base fee of 0.50%, a Minimum fee of 0.10% and a Maximum Fee of 0.90%. |
| *** | Effective March 29, 2019 Piermont Capital Management, Inc. was acquired by Ziegler Capital Management, LLC. |
107
| NOTES TO FINANCIAL STATEMENTS |
| October 31, 2019 (Continued) |
b. Administration, Fund Accounting and Transfer Agency Fees – Gemini Fund Services, LLC (“GFS” or the “Administrator”) serves as the administrator, fund accountant and transfer agent for the Funds. For providing administration services, GFS receives from each Fund a monthly fee based on the combined average daily net assets at the following annual rates; 0.07% on the first $250 million of average net assets; 0.06% on average net assets between $250 million and $500 million; 0.04% on average net assets over $500 million; and 0.02% on average net assets over $1 billion. Such fees are subject to an annual minimum of $400,000 in total for the entire Trust. For providing fund accounting services, GFS receives from the Trust a minimum annual fee of $245,000. For providing transfer agent services, GFS receives from the Trust a minimum annual fee of $200,000. Pursuant to the terms of a Custody Administration Agreement, Monthly Distribution pays GFS a monthly fee of $300.
Blu Giant, LLC, (“Blu Giant”), an affiliate of GFS, provides EDGAR conversion and filing services as well as some print management services for the Funds on an ad-hoc basis. For the provision of these services, Blu Giant receives customary fees from the Funds. An individual from GFS serves as an officer for the Trust and receives no additional compensation from the Trust for serving in that role.
Effective February 1, 2019, NorthStar Financial Services Group, LLC, the parent company of GFS and its affiliated companies including Blu Giant (collectively, the “Gemini Companies”), sold its interest in the Gemini Companies to a third party private equity firm that contemporaneously acquired Ultimus Fund Solutions, LLC (an independent mutual fund administration firm) and its affiliates (collectively, the “Ultimus Companies”). As a result of these separate transactions, the Gemini Companies and the Ultimus Companies are now indirectly owned through a common parent entity, The Ultimus Group, LLC.
c. Distributor – The Distributor of the Funds is Dunham & Associates (the “Distributor”). The Funds have adopted an Amended and Restated Rule 12b-1 Plan (the “Plan”) in accordance with Rule 12b-1 under the 1940 Act for Class A and Class C shares. The Plan for Class A shares authorizes the Funds to pay distribution fees to the Distributor or other entities on a monthly basis at an annualized rate of up to 0.25% of the average daily net assets attributable to Class A shares. The Plan for Class C shares authorizes the Funds to pay distribution fees at the annualized rate of 0.75% for the equity Funds and 0.50% for the fixed income Funds and shareholder servicing fees at the annualized rate of 0.25% to the Distributor or other entities on a monthly basis based on the average daily net assets attributable to Class C shares. Class N shares do not pay distribution fees or shareholder servicing fees.
d. Trustees’ Fees – The Board has approved the following Trustee compensation schedule: Each Trustee who is not an interested person of the Trust will receive $6,250 for each Board meeting attended in-person; $1,000 for all telephonic Board meetings; $1,000 for in-person committee meetings and $500 for telephonic committee meetings, unless the committee meeting is on the same day as a Board meeting, in which case the Trustee will not be compensated for the committee meeting. The Funds also reimburse each such Trustee for travel and other expenses incurred in attending meetings of the Board.
With the exception of the Trust’s Chief Compliance Officer as discussed below, officers of the Trust and Trustees who are interested persons of the Trust do not receive any compensation from the Trust or any other Funds managed by the Adviser. The Trust has agreed to pay the Adviser a fee in the amount of $150,000 per annum plus an annual discretionary bonus as may be awarded as compensation for providing an officer or employee of the Adviser to serve as Chief Compliance Officer for the Funds (each Fund bearing its pro rata share of the fee), plus the cost of reasonable expenses related to the performance of the Chief Compliance Officer’s duties, including travel expenses, and may compensate the Adviser for the time of other officers or employees of the Adviser who serve in other compliance capacities for the Funds.
e. Commission Recapture –During the year ended October 31, 2019, certain Funds had portfolio trades executed with a certain broker pursuant to a commission recapture agreement under which the broker returned a portion of the Fund’s brokerage commissions on the Fund’s behalf. Such amounts, under such commission recapture agreement, are included in fees paid indirectly in the Funds’ Statements of Operations and were paid directly by the broker to the Administrator for providing administration services. For the year ended October 31, 2019, the amounts received by the Administrator on behalf of certain participating Funds under this arrangement were: Large Cap Value - $2,227, Focused Large Cap Growth - $973, International Stock - $1,062 and Small Cap Growth - $6,128.
108
| NOTES TO FINANCIAL STATEMENTS |
| October 31, 2019 (Continued) |
| 4. | INVESTMENT TRANSACTIONS |
The cost of purchases and the proceeds from sales of investments, other than short-term investments, for the year ended October 31, 2019 were as follows:
| Purchases | Sale Proceeds | Proceeds of | ||||||||||||||
| (excluding U.S. | (excluding U.S. | Purchases of | U.S. | |||||||||||||
| Government | Government | U.S. Government | Government | |||||||||||||
| Fund | Securities) | Securities) | Securities | Securities | ||||||||||||
| Floating Rate Bond | $ | 84,623,573 | $ | 78,822,886 | $ | — | $ | — | ||||||||
| Long/Short Credit | 89,117,539 | 74,462,834 | 60,908,063 | 57,327,663 | ||||||||||||
| Corporate/Government Bond | 25,216,248 | 27,424,182 | 12,398,103 | 11,871,649 | ||||||||||||
| Monthly Distribution | 1,068,771,008 | 1,140,800,097 | — | — | ||||||||||||
| Dynamic Macro | 4,910,693 | 17,503,935 | — | — | ||||||||||||
| High-Yield Bond | 72,023,785 | 82,393,051 | — | — | ||||||||||||
| International Opportunity Bond | 40,094,682 | 39,952,979 | — | — | ||||||||||||
| Large Cap Value | 37,466,906 | 33,605,891 | — | — | ||||||||||||
| Focused Large Cap Growth | 35,422,458 | 27,265,691 | — | — | ||||||||||||
| International Stock | 130,225,472 | 119,405,172 | — | — | ||||||||||||
| Real Estate Stock | 34,943,972 | 44,258,428 | — | — | ||||||||||||
| Small Cap Value | 47,989,016 | 42,065,567 | — | — | ||||||||||||
| Small Cap Growth | 81,306,682 | 80,268,474 | — | — | ||||||||||||
| Emerging Markets Stock | 89,962,855 | 88,910,817 | — | — | ||||||||||||
| 5. | AGGREGATE UNREALIZED APPRECIATION AND DEPRECIATION – TAX BASIS |
The identified cost of investments in securities owned by each Fund for federal income tax purposes, and its respective gross unrealized appreciation and depreciation at October 31, 2019, were as follows:
| Gross | Gross | Net Unrealized | ||||||||||||||
| Tax | Unrealized | Unrealized | Appreciation/ | |||||||||||||
| Cost | Appreciation | Depreciation | (Depreciation) | |||||||||||||
| Floating Rate Bond | $ | 192,811,379 | $ | 692,642 | $ | (6,063,363 | ) | $ | (5,370,721 | ) | ||||||
| Long/Short Credit | 81,571,224 | 1,577,043 | (299,667 | ) | 1,277,376 | |||||||||||
| Corporate/Government Bond | 48,396,078 | 2,398,545 | (83,142 | ) | 2,315,403 | |||||||||||
| Monthly Distribution | 205,013,525 | 13,421,935 | (15,134,917 | ) | (1,712,982 | ) | ||||||||||
| Dynamic Macro | 37,526,238 | 3,211,819 | (684,533 | ) | 2,527,286 | |||||||||||
| High-Yield Bond | 106,342,247 | 3,906,542 | (3,343,223 | ) | 563,319 | |||||||||||
| International Opportunity Bond | 36,498,599 | 1,659,682 | (364,382 | ) | 1,295,300 | |||||||||||
| Large Cap Value | 65,701,164 | 19,078,586 | (1,920,381 | ) | 17,158,205 | |||||||||||
| Focused Large Cap Growth | 60,143,317 | 46,339,257 | (1,099,256 | ) | 45,240,001 | |||||||||||
| International Stock | 125,131,132 | 16,292,731 | (5,717,498 | ) | 10,575,233 | |||||||||||
| Real Estate Stock | 42,360,073 | 12,749,498 | (850,967 | ) | 11,898,531 | |||||||||||
| Small Cap Value | 53,074,295 | 5,555,006 | (2,146,917 | ) | 3,408,089 | |||||||||||
| Small Cap Growth | 46,620,610 | 6,919,434 | (3,260,795 | ) | 3,658,639 | |||||||||||
| Emerging Markets Stock | 73,607,812 | 8,141,399 | (3,372,651 | ) | 4,768,748 | |||||||||||
109
| NOTES TO FINANCIAL STATEMENTS |
| October 31, 2019 (Continued) |
| 6. | SHARES OF BENEFICIAL INTEREST |
Following is a summary of shareholder transactions for each Fund for the year ended October 31, 2019 and the year ended October 31, 2018, respectively:
For the year ended October 31, 2019:
| Class N Shares | Class A Shares | |||||||||||||||||||||||||||||||
| Net Increase | Net Increase | |||||||||||||||||||||||||||||||
| Distributions | (Decrease) in | Distributions | (Decrease) in | |||||||||||||||||||||||||||||
| Fund | Issued | Reinvested | Redeemed | Shares | Issued | Reinvested | Redeemed | Shares | ||||||||||||||||||||||||
| Floating Rate Bond | 4,135,951 | 779,224 | (5,195,790 | ) | (280,615 | ) | 691,894 | 95,516 | (535,999 | ) | 251,411 | |||||||||||||||||||||
| Long/Short Credit | 5,434,899 | 199,627 | (2,368,449 | ) | 3,266,077 | 680,269 | 24,160 | (199,739 | ) | 504,690 | ||||||||||||||||||||||
| Corporate/Government Bond | 1,358,705 | 85,602 | (1,548,844 | ) | (104,537 | ) | 238,649 | 10,366 | (120,020 | ) | 128,995 | |||||||||||||||||||||
| Monthly Distribution | 1,550,592 | 287,081 | (2,207,230 | ) | (369,557 | ) | 481,103 | 61,442 | (529,598 | ) | 12,947 | |||||||||||||||||||||
| Dynamic Macro | 462,025 | 89,536 | (1,109,155 | ) | (557,594 | ) | 234,015 | 18,240 | (318,335 | ) | (66,080 | ) | ||||||||||||||||||||
| High-Yield Bond | 2,250,727 | 527,921 | (3,558,884 | ) | (780,236 | ) | 353,882 | 63,555 | (462,947 | ) | (45,510 | ) | ||||||||||||||||||||
| International Opportunity Bond | 699,740 | 22,947 | (794,969 | ) | (72,282 | ) | 147,890 | 1,757 | (112,758 | ) | 36,889 | |||||||||||||||||||||
| Large Cap Value | 695,868 | 214,901 | (687,966 | ) | 222,803 | 384,880 | 49,142 | (221,805 | ) | 212,217 | ||||||||||||||||||||||
| Focused Large Cap Growth | 959,514 | 225,236 | (743,219 | ) | 441,531 | 841,812 | 57,629 | (561,841 | ) | 337,600 | ||||||||||||||||||||||
| International Stock | 1,246,392 | 435,239 | (862,721 | ) | 818,910 | 447,321 | 86,701 | (249,533 | ) | 284,489 | ||||||||||||||||||||||
| Real Estate Stock | 285,995 | 55,368 | (859,354 | ) | (517,991 | ) | 150,462 | 9,521 | (219,442 | ) | (59,459 | ) | ||||||||||||||||||||
| Small Cap Value | 688,673 | 319,621 | (408,023 | ) | 600,271 | 232,547 | 65,268 | (122,444 | ) | 175,371 | ||||||||||||||||||||||
| Small Cap Growth | 899,200 | 444,127 | (680,884 | ) | 662,443 | 278,378 | 149,638 | (268,644 | ) | 159,372 | ||||||||||||||||||||||
| Emerging Markets Stock | 749,368 | 80,396 | (775,088 | ) | 54,676 | 363,428 | 13,390 | (277,895 | ) | 98,923 | ||||||||||||||||||||||
| Class C Shares | ||||||||||||||||||||||||||||||||
| Net Increase | ||||||||||||||||||||||||||||||||
| Distributions | (Decrease) | |||||||||||||||||||||||||||||||
| Fund | Issued | Reinvested | Redeemed | in Shares | ||||||||||||||||||||||||||||
| Floating Rate Bond | 379,932 | 33,786 | (240,739 | ) | 172,979 | |||||||||||||||||||||||||||
| Long/Short Credit | 126,205 | 10,251 | (38,884 | ) | 97,572 | |||||||||||||||||||||||||||
| Corporate/Government Bond | 37,167 | 3,771 | (61,875 | ) | (20,937 | ) | ||||||||||||||||||||||||||
| Monthly Distribution | 309,307 | 78,470 | (345,815 | ) | 41,962 | |||||||||||||||||||||||||||
| Dynamic Macro | 42,791 | 2,794 | (31,545 | ) | 14,040 | |||||||||||||||||||||||||||
| High-Yield Bond | 104,964 | 34,960 | (151,150 | ) | (11,226 | ) | ||||||||||||||||||||||||||
| International Opportunity Bond | 26,236 | 248 | (25,990 | ) | 494 | |||||||||||||||||||||||||||
| Large Cap Value | 88,590 | 14,327 | (37,247 | ) | 65,670 | |||||||||||||||||||||||||||
| Focused Large Cap Growth | 137,733 | 28,599 | (118,605 | ) | 47,727 | |||||||||||||||||||||||||||
| International Stock | 82,464 | 27,672 | (62,141 | ) | 47,995 | |||||||||||||||||||||||||||
| Real Estate Stock | 30,559 | 1,724 | (32,045 | ) | 238 | |||||||||||||||||||||||||||
| Small Cap Value | 73,760 | 25,630 | (27,700 | ) | 71,690 | |||||||||||||||||||||||||||
| Small Cap Growth | 84,693 | 66,749 | (110,039 | ) | 41,403 | |||||||||||||||||||||||||||
| Emerging Markets Stock | 53,034 | 2,497 | (59,245 | ) | (3,714 | ) | ||||||||||||||||||||||||||
110
| NOTES TO FINANCIAL STATEMENTS |
| October 31, 2019 (Continued) |
For the year ended October 31, 2018:
| Class N Shares | Class A Shares | |||||||||||||||||||||||||||||||
| Net Increase | Net Increase | |||||||||||||||||||||||||||||||
| Distributions | (Decrease) in | Distributions | (Decrease) in | |||||||||||||||||||||||||||||
| Fund | Issued | Reinvested | Redeemed | Shares | Issued | Reinvested | Redeemed | Shares | ||||||||||||||||||||||||
| Floating Rate Bond | 5,544,126 | 680,867 | (5,269,356 | ) | 955,637 | 990,916 | 73,952 | (632,403 | ) | 432,465 | ||||||||||||||||||||||
| Long/Short Credit | 2,695,549 | 41,172 | (304,528 | ) | 2,432,193 | 544,088 | 6,854 | (228,544 | ) | 322,398 | ||||||||||||||||||||||
| Corporate/Government Bond | 1,912,073 | 104,386 | (3,405,957 | ) | (1,389,498 | ) | 204,083 | 10,399 | (260,731 | ) | (46,249 | ) | ||||||||||||||||||||
| Monthly Distribution | 2,204,120 | 268,595 | (2,471,857 | ) | 858 | 484,297 | 54,294 | (418,482 | ) | 120,109 | ||||||||||||||||||||||
| Dynamic Macro | 1,045,881 | — | (854,490 | ) | 191,391 | 424,021 | — | (201,583 | ) | 222,438 | ||||||||||||||||||||||
| High-Yield Bond | 2,859,505 | 516,584 | (3,764,538 | ) | (388,449 | ) | 541,122 | 55,424 | (489,836 | ) | 106,710 | |||||||||||||||||||||
| International Opportunity Bond | 918,537 | 3,921 | (838,505 | ) | 83,953 | 194,919 | 376 | (86,308 | ) | 108,987 | ||||||||||||||||||||||
| Large Cap Value | 774,929 | 70,716 | (831,786 | ) | 13,859 | 412,732 | 11,986 | (258,513 | ) | 166,205 | ||||||||||||||||||||||
| Focused Large Cap Growth | 652,409 | 27,172 | (953,801 | ) | (274,220 | ) | 281,769 | 6,227 | (286,311 | ) | 1,685 | |||||||||||||||||||||
| International Stock | 1,185,724 | 219,814 | (823,998 | ) | 581,540 | 538,029 | 38,097 | (289,098 | ) | 287,028 | ||||||||||||||||||||||
| Real Estate Stock | 1,215,646 | 34,637 | (625,212 | ) | 625,071 | 292,170 | 4,939 | (131,144 | ) | 165,965 | ||||||||||||||||||||||
| Small Cap Value | 1,077,210 | 144,058 | (151,459 | ) | 1,069,809 | 284,243 | 27,980 | (70,164 | ) | 242,059 | ||||||||||||||||||||||
| Small Cap Growth | 574,078 | 186,952 | (303,103 | ) | 457,927 | 273,170 | 54,752 | (124,818 | ) | 203,104 | ||||||||||||||||||||||
| Emerging Markets Stock | 1,385,394 | 31,305 | (495,926 | ) | 920,773 | 412,227 | 4,193 | (176,092 | ) | 240,328 | ||||||||||||||||||||||
| Class C Shares | ||||||||||||||||||||||||||||||||
| Net Increase | ||||||||||||||||||||||||||||||||
| Distributions | (Decrease) | |||||||||||||||||||||||||||||||
| Fund | Issued | Reinvested | Redeemed | in Shares | ||||||||||||||||||||||||||||
| Floating Rate Bond | 263,265 | 23,134 | (172,957 | ) | 113,442 | |||||||||||||||||||||||||||
| Long/Short Credit | 110,059 | 4,514 | (83,122 | ) | 31,451 | |||||||||||||||||||||||||||
| Corporate/Government Bond | 58,106 | 4,299 | (82,611 | ) | (20,206 | ) | ||||||||||||||||||||||||||
| Monthly Distribution | 355,558 | 62,509 | (322,392 | ) | 95,675 | |||||||||||||||||||||||||||
| Dynamic Macro | 56,142 | — | (70,500 | ) | (14,358 | ) | ||||||||||||||||||||||||||
| High-Yield Bond | 135,855 | 31,188 | (164,632 | ) | 2,411 | |||||||||||||||||||||||||||
| International Opportunity Bond | 48,016 | 177 | (36,571 | ) | 11,622 | |||||||||||||||||||||||||||
| Large Cap Value | 55,368 | 3,842 | (93,744 | ) | (34,534 | ) | ||||||||||||||||||||||||||
| Focused Large Cap Growth | 54,856 | 3,483 | (102,259 | ) | (43,920 | ) | ||||||||||||||||||||||||||
| International Stock | 76,579 | 15,569 | (95,633 | ) | (3,485 | ) | ||||||||||||||||||||||||||
| Real Estate Stock | 38,155 | 1,286 | (45,238 | ) | (5,797 | ) | ||||||||||||||||||||||||||
| Small Cap Value | 30,003 | 18,626 | (60,317 | ) | (11,688 | ) | ||||||||||||||||||||||||||
| Small Cap Growth | 28,475 | 32,629 | (48,775 | ) | 12,329 | |||||||||||||||||||||||||||
| Emerging Markets Stock | 77,471 | 891 | (46,538 | ) | 31,824 | |||||||||||||||||||||||||||
111
| NOTES TO FINANCIAL STATEMENTS |
| October 31, 2019 (Continued) |
| 7. | DISTRIBUTIONS TO SHAREHOLDERS AND TAX COMPONENTS OF CAPITAL |
The tax character of dividends paid during the year ended October 31, 2019 and October 31, 2018 was as follows:
| For the year ended October 31, 2019 | For the year ended October 31, 2018 | |||||||||||||||||||||||||||||||
| Ordinary | Long-Term | Return of | Ordinary | Long-Term | Return of | |||||||||||||||||||||||||||
| Fund | Income | Capital Gains | Capital | Total | Income | Capital Gains | Capital | Total | ||||||||||||||||||||||||
| Floating Rate Bond** | $ | 8,609,420 | $ | — | $ | — | $ | 8,609,420 | $ | 7,558,793 | $ | — | $ | — | $ | 7,558,793 | ||||||||||||||||
| Long/Short Credit** | 2,186,769 | — | — | 2,186,769 | 479,171 | — | — | 479,171 | ||||||||||||||||||||||||
| Corporate/Government Bond** | 1,364,485 | — | — | 1,364,485 | 1,586,252 | — | 21,031 | 1,607,283 | ||||||||||||||||||||||||
| Monthly Distribution** | — | — | 14,962,154 | 14,962,154 | 2,716,635 | — | 11,318,712 | 14,035,347 | ||||||||||||||||||||||||
| Dynamic Macro | 771,551 | — | 228,780 | 1,000,331 | — | — | — | — | ||||||||||||||||||||||||
| High-Yield Bond** | 5,606,169 | — | 1,997 | 5,608,166 | 5,523,745 | — | — | 5,523,725 | ||||||||||||||||||||||||
| International Opportunity Bond | 78,557 | 143,753 | 2,685 | 224,995 | — | 42,342 | — | 42,342 | ||||||||||||||||||||||||
| Large Cap Value | 1,029,945 | 2,475,280 | — | 3,505,225 | 557,584 | 713,265 | — | 1,270,849 | ||||||||||||||||||||||||
| Focused Large Cap Growth | — | 6,222,027 | — | 6,222,027 | — | 722,085 | — | 722,085 | ||||||||||||||||||||||||
| International Stock * | 1,605,914 | 6,332,594 | — | 7,938,508 | 1,605,505 | 3,151,817 | — | 4,757,322 | ||||||||||||||||||||||||
| Real Estate Stock | 963,717 | — | — | 963,717 | 344,955 | 300,608 | — | 645,563 | ||||||||||||||||||||||||
| Small Cap Value | 1,864,480 | 3,196,685 | 23,516 | 5,084,681 | 1,593,661 | 1,586,225 | — | 3,179,886 | ||||||||||||||||||||||||
| Small Cap Growth | 3,935,267 | 5,125,659 | — | 9,060,926 | 1,842,122 | 3,242,312 | — | 5,084,434 | ||||||||||||||||||||||||
| Emerging Markets Stock * | 1,399,913 | — | — | 1,399,913 | 824,337 | — | — | 824,337 | ||||||||||||||||||||||||
| * | The difference between ordinary distributions paid from book and ordinary distributions paid from tax relates to allowable foreign tax credits of $454,755 and $196,218 for fiscal year ended October 31, 2019 for the International Stock Fund and Emerging Markets Stock Fund respectively, and $232,938 for the fiscal year ended October 31, 2018 for the Emerging Markets Stock Fund, which have been passed through to the Funds’ underlying shareholders and are deemed dividends for tax purposes. |
| ** | Differences in distributions between the Statements of Changes paid from book and tax on the relate to adjustments for dividends payable for tax purposes. |
Permanent book and tax differences, primarily attributable to the reclass of net operating losses and fund distributions and the expiration of capital loss carry forwards, resulted in reclassification for the tax year ended October 31, 2019 as follows:
| Paid | ||||||||
| In | Accumulated | |||||||
| Fund | Capital | Earnings (Loss) | ||||||
| Floating Rate Bond | $ | — | $ | — | ||||
| Long/Short Credit | — | — | ||||||
| Corporate/Government Bond | — | — | ||||||
| Monthly Distribution | (1,072,043 | ) | 1,072,043 | |||||
| Dynamic Macro | (152,059 | ) | 152,059 | |||||
| High-Yield Bond | (1,997 | ) | 1,997 | |||||
| International Opportunity Bond | (126,390 | ) | 126,390 | |||||
| Large Cap Value | — | — | ||||||
| Focused Large Cap Growth | (179,273 | ) | 179,273 | |||||
| International Stock | — | — | ||||||
| Real Estate Stock | — | — | ||||||
| Small Cap Value | (23,516 | ) | 23,516 | |||||
| Small Cap Growth | (92,315 | ) | 92,315 | |||||
| Emerging Markets Stock | (351,019 | ) | 351,019 | |||||
Net assets were unaffected by the above reclassifications.
112
| NOTES TO FINANCIAL STATEMENTS |
| October 31, 2019 (Continued) |
As of each of the Fund’s tax year-ended October 31, 2019, the components of distributable earnings on a tax basis were as follows:
| Undistributed | Undistributed | Capital Loss | Other | Unrealized | Total | |||||||||||||||||||||||
| Ordinary | Long-Term | Carry | Book/Tax | Appreciation/ | Accumulated | |||||||||||||||||||||||
| Fund | Income | Capital Gains | Late Year Loss | Forwards | Differences | (Depreciation) | Earnings/(Deficits) | |||||||||||||||||||||
| Floating Rate Bond | $ | 113,538 | $ | — | $ | — | $ | (4,557,245 | ) | $ | (4,372 | ) | $ | (5,370,721 | ) | $ | (9,818,800 | ) | ||||||||||
| Long/Short Credit | 469,055 | — | — | — | (1,802 | ) | 1,277,376 | 1,744,629 | ||||||||||||||||||||
| Corporate/Government Bond | 21,206 | — | — | (3,184,848 | ) | (1,468 | ) | 2,315,403 | (849,707 | ) | ||||||||||||||||||
| Monthly Distribution | — | — | (804,617 | ) | (950,040 | ) | (515,974 | ) | (1,716,782 | ) | (3,987,413 | ) | ||||||||||||||||
| Dynamic Macro | — | — | — | (1,364,940 | ) | — | 2,526,452 | 1,161,512 | ||||||||||||||||||||
| High-Yield Bond | — | — | — | (7,494,821 | ) | (6,751 | ) | 563,319 | (6,938,253 | ) | ||||||||||||||||||
| International Opportunity Bond | — | — | (100,060 | ) | — | — | 1,296,907 | 1,196,847 | ||||||||||||||||||||
| Large Cap Value | 724,977 | 1,943,275 | — | — | — | 17,158,205 | 19,826,457 | |||||||||||||||||||||
| Focused Large Cap Growth | — | 3,667,504 | (1,033,914 | ) | — | — | 45,240,001 | 47,873,591 | ||||||||||||||||||||
| International Stock | 2,718,040 | — | — | (4,689,441 | ) | — | 10,575,264 | 8,603,863 | ||||||||||||||||||||
| Real Estate Stock | 1,480,197 | 2,042,145 | — | — | — | 11,898,531 | 15,420,873 | |||||||||||||||||||||
| Small Cap Value | — | — | (72,334 | ) | (1,143,759 | ) | — | 3,408,089 | 2,191,996 | |||||||||||||||||||
| Small Cap Growth | — | 805,397 | (635,376 | ) | — | — | 3,658,639 | 3,828,660 | ||||||||||||||||||||
| Emerging Markets Stock | 630,372 | — | — | (1,472,324 | ) | — | 4,768,192 | 3,926,240 | ||||||||||||||||||||
The difference between book basis and tax basis unrealized appreciation (depreciation), undistributed net investment income (loss) and accumulated net realized gain (loss) from security transactions are primarily attributable to the tax deferral of losses on wash sales, the mark-to -market treatment of open forward foreign currency contracts, options, dividend payable and swap contracts, and adjustments for partnerships, perpetual bonds, passive foreign investment companies, constructive sales of securities held short, straddles and C Corporation return of capital distributions. The unrealized appreciation (depreciation) in the table above includes unrealized foreign currency gains (losses) for the Funds. In addition, the amount listed under other book/tax differences are primarily attributable to the tax deferral of losses on straddles and constructive sales, and tax adjustments for accrued dividend payable.
Late year losses incurred after December 31 within the fiscal year are deemed to arise on the first business day of the following fiscal year for tax purposes. The Funds incurred and elected to defer such late year losses as follows:
| Late Year | ||||
| Fund | Losses | |||
| Floating Rate Bond | $ | — | ||
| Long/Short Credit | — | |||
| Corporate/Government Bond | — | |||
| Monthly Distribution | 804,617 | |||
| Dynamic Macro | — | |||
| High-Yield Bond | — | |||
| International Opportunity Bond | 100,060 | |||
| Large Cap Value | — | |||
| Focused Large Cap Growth | 1,033,914 | |||
| International Stock | — | |||
| Real Estate Stock | — | |||
| Small Cap Value | 72,334 | |||
| Small Cap Growth | 635,376 | |||
| Emerging Markets Stock | — | |||
113
| NOTES TO FINANCIAL STATEMENTS |
| October 31, 2019 (Continued) |
At October 31, 2019, the following Funds had capital loss carryforwards for federal income tax purposes available to offset future capital gains as follows:
| Non-Expiring | Non-Expiring | Capital Loss Carry | Capital Loss Carry | |||||||||||||||||
| Fund | Short-Term | Long-Term | Total | Forward Expired | Forward Utilized | |||||||||||||||
| Floating Rate Bond | $ | 978,122 | $ | 3,579,123 | $ | 4,557,245 | $ | — | $ | — | ||||||||||
| Long/Short Credit | — | — | — | — | 66,482 | |||||||||||||||
| Corporate/Government Bond | 1,121,080 | 2,063,768 | 3,184,848 | — | 57,915 | |||||||||||||||
| Monthly Distribution | — | 950,040 | 950,040 | — | — | |||||||||||||||
| Dynamic Macro | 1,364,940 | — | 1,364,940 | 152,059 | 3,926,174 | |||||||||||||||
| High-Yield Bond | 3,837,612 | 3,657,209 | 7,494,821 | — | — | |||||||||||||||
| International Opportunity Bond | — | — | — | — | — | |||||||||||||||
| Large Cap Value | — | — | — | — | — | |||||||||||||||
| Focused Large Cap Growth | — | — | — | — | — | |||||||||||||||
| International Stock | 4,689,441 | — | 4,689,441 | — | — | |||||||||||||||
| Real Estate Stock | — | — | — | — | — | |||||||||||||||
| Small Cap Value | 889,147 | 254,612 | 1,143,759 | — | — | |||||||||||||||
| Small Cap Growth | — | — | — | — | — | |||||||||||||||
| Emerging Markets Stock | 1,472,324 | — | 1,472,324 | 351,019 | — | |||||||||||||||
| 8. | LINE OF CREDIT |
Currently, the Funds have a $40,000,000 uncommitted line of credit provided by U.S. Bank National Association (the “Bank”) under an agreement (the “Uncommitted Line”). Any advance under the Uncommitted Line is contemplated primarily for temporary or emergency purposes, including the meeting of redemption requests that otherwise might require the untimely disposition of securities. Interest on borrowings is payable on an annualized basis. The Uncommitted Line is not a “committed” line of credit, which is to say that the Bank is not obligated to lend money to a Fund. Accordingly, it is possible that a Fund may wish to borrow money for a temporary or emergency purpose but may not be able to do so. Based only on the days borrowed, the average amount of borrowings outstanding were as follows:
| Average borrowings | ||||
| Fund | outstanding | |||
| Corporate/Government Bond | $ | 3,741,667 | ||
| Dynamic Macro | 461,000 | |||
| High-Yield Bond | 1,743,250 | |||
| International Opportunity Bond | 307,889 | |||
| Focused Large Cap Growth | 1,645,500 | |||
| International Stock | 154,353 | |||
| Real Estate Stock | 609,000 | |||
| Small Cap Value | 74,000 | |||
| Small Cap Growth | 425,333 | |||
| Emerging Markets Stock | 607,906 | |||
The interest expense for all the Funds listed above is immaterial.
As of October 31, 2019, all the Funds listed above had no outstanding borrowings on the Uncommitted Line.
Funds not listed above did not access the line of credit during the year ended October 31, 2019.
| 9. | SECURITIES LENDING |
The Funds have entered into separate Securities Lending Agreements (“Agreements”) with the US Bank NA and Securities Finance Trust Company (“SFTC”). International Stock and Emerging Market Stock lend securities with US Bank NA. All other Funds lend securities with SFTC. Each participating Fund can lend their securities to brokers, dealers and other financial institutions approved by the Board to earn additional income. Loans are collateralized at a value at least equal to 105% of the then current market value of any loaned security that are foreign, or 102% of the then current market value of any other loaned security. The International Stock Fund is below the 105% threshold due to market fluctuation. All interest and dividend payments received on securities which are held on loan, provided that there is no material default, will be paid to the respective Fund. A portion of the income generated by the investment in the Funds collateral, net of any rebates paid by the Bank to the borrowers is remitted to US Bank or SFTC as lending agent and the remainder is paid to the Fund(s).
114
| NOTES TO FINANCIAL STATEMENTS |
| October 31, 2019 (Continued) |
Securities lending income, if any, is disclosed in the Funds’ Statements of Operations and is net of fees retained by the counterparty. Although risk is mitigated by the collateral, the Funds could experience a delay in recovering their securities and possible loss of income or value if the Borrower fails to return them. Should the borrower of the securities fail financially, each Fund has the right to repurchase the securities using the collateral in the open market. The remaining contractual maturity of all securities lending transactions are overnight and continuous.
The below table shows the collateral held by each Fund at the end of the period.
| Gross Amounts Not Offset in the | ||||||||||||||||||||||||||
| Statement of Assets & Liabilities | ||||||||||||||||||||||||||
| Gross Amounts | Net Amounts of | |||||||||||||||||||||||||
| Gross Amounts | Offset in the | Liabilities Presented | ||||||||||||||||||||||||
| of Recognized | Statement of Assets | in the Statement of | Financial | Cash Collateral | ||||||||||||||||||||||
| Description | Counterparty | Liabilities | & Liabilities | Assets & Liabilities | Instruments | Pledged | Net Amount | |||||||||||||||||||
| Monthly Distribution | ||||||||||||||||||||||||||
| Liabilities | ||||||||||||||||||||||||||
| Securities Loaned | SFTC | $ | (2,935,000 | ) | $ | — | $ | (2,935,000 | ) | $ | 2,935,000 | $ | — | $ | — | |||||||||||
| Securities Loaned | SFTC | (349,250 | ) | — | (349,250 | ) | 349,250 | — | — | |||||||||||||||||
| Total | $ | (3,284,250 | ) | $ | — | $ | (3,284,250 | ) | $ | 3,284,250 | $ | — | $ | — | ||||||||||||
| High-Yield Bond | ||||||||||||||||||||||||||
| Liabilities | ||||||||||||||||||||||||||
| Securities Loaned | SFTC | $ | (1,688,092 | ) | $ | — | $ | (1,688,092 | ) | $ | 1,688,092 | $ | — | $ | — | |||||||||||
| Securities Loaned | SFTC | (1,964,233 | ) | — | (1,964,233 | ) | 1,964,233 | — | — | |||||||||||||||||
| Total | $ | (3,652,325 | ) | $ | — | $ | (3,652,325 | ) | $ | 3,652,325 | $ | — | $ | — | ||||||||||||
| Large Cap Value | ||||||||||||||||||||||||||
| Liabilities | ||||||||||||||||||||||||||
| Securities Loaned | SFTC | $ | (52,600 | ) | $ | — | $ | (52,600 | ) | $ | 52,600 | $ | — | $ | — | |||||||||||
| Securities Loaned | SFTC | (992,400 | ) | — | (992,400 | ) | 992,400 | — | — | |||||||||||||||||
| Total | $ | (1,045,000 | ) | $ | — | $ | (1,045,000 | ) | $ | 1,045,000 | $ | — | $ | — | ||||||||||||
| International Stock | ||||||||||||||||||||||||||
| Liabilities | ||||||||||||||||||||||||||
| Securities Loaned | US Bank | $ | (6,325,040 | ) | $ | — | $ | (6,325,040 | ) | $ | 6,325,040 | $ | — | $ | — | |||||||||||
| Small Cap Value | ||||||||||||||||||||||||||
| Liabilities | ||||||||||||||||||||||||||
| Securities Loaned | SFTC | $ | (542,100 | ) | $ | — | $ | (542,100 | ) | $ | 542,100 | $ | — | $ | — | |||||||||||
| Small Cap Growth | ||||||||||||||||||||||||||
| Liabilities | ||||||||||||||||||||||||||
| Securities Loaned | SFTC | $ | (1,113,441 | ) | $ | — | $ | (1,113,441 | ) | $ | 1,113,441 | $ | — | $ | — | |||||||||||
| Securities Loaned | SFTC | (1,010,439 | ) | — | (1,010,439 | ) | 1,010,439 | — | — | |||||||||||||||||
| Total | $ | (2,123,880 | ) | $ | — | $ | (2,123,880 | ) | $ | 2,123,880 | $ | — | $ | — | ||||||||||||
| Emerging Markets Stock | ||||||||||||||||||||||||||
| Liabilities | ||||||||||||||||||||||||||
| Securities Loaned | US Bank | $ | (4,347,391 | ) | $ | — | $ | (4,347,391 | ) | $ | 4,347,391 | $ | — | $ | — | |||||||||||
115
| NOTES TO FINANCIAL STATEMENTS |
| October 31, 2019 (Continued) |
The following table presents financial instruments that are subject to enforceable netting arrangements as of October 31, 2019.
| Gross Amounts of Assets Presented in the Statements of Assets and Liabilities | ||||||||
| Market Value of | Market Value of | |||||||
| Fund | Loaned Securities | Collateral (1) | ||||||
| Floating Rate Bond | $ | — | $ | — | ||||
| Long/Short Credit | — | — | ||||||
| Corporate/Government Bond | — | — | ||||||
| Monthly Distribution | 3,216,350 | 3,216,350 | ||||||
| Dynamic Macro | — | — | ||||||
| High-Yield Bond | 3,506,670 | 3,506,670 | ||||||
| International Opportunity Bond | — | — | ||||||
| Large Cap Value | 1,024,290 | 1,024,290 | ||||||
| Focused Large Cap Growth | — | — | ||||||
| International Stock * | 6,175,100 | 6,175,100 | ||||||
| Real Estate Stock | — | — | ||||||
| Small Cap Value | 532,740 | 532,740 | ||||||
| Small Cap Growth | 2,069,994 | 2,069,994 | ||||||
| Emerging Markets Stock * | 4,210,767 | 4,210,767 | ||||||
| (1) | The amount is limited to the loaned securities and accordingly, does not include excess collateral pledged. |
* Securities collateralized below 102% or 105% for foreign securities. The Trust’s securities lending policies and procedures require that the borrower: (i) deliver cash or U.S. Government securities as collateral with respect to each new loan of U.S. securities, equal to at least 102% or 105% of the value of the portfolio securities loaned, and (ii) at all times thereafter mark-to-market the collateral on a daily basis so that the market value of such collateral is at least 100% of the value of securities loaned. From time to time the collateral may not be 102% or 105% due to end of day market movement. The next business day additional collateral is obtained/received from the borrower to replenish/reestablish 102% or 105%.
| 10. | UNDERLYING INVESTMENTS IN OTHER INVESTMENT COMPANIES |
The Funds invest in other investment companies. Each underlying fund, including each ETF, is subject to specific risks, depending on the nature of the underlying fund. These risks could include liquidity risk, sector risk, foreign and related currency risk and high yield risk. Investors in the Funds will indirectly bear fees and expenses charged by the underlying investment companies in which the Funds invest in addition to the Funds’ direct fees and expenses. All the Funds may invest in investment companies. Such investments would subject the Funds to similar risks.
The performance of the Monthly Distribution Fund will be directly affected by the performance of the Fidelity Investments Money Market Fund – Class I. The financial statements of this Fund, including the portfolio of investments, can be found at the Securities and Exchange Commission’s (“SEC”) website www.sec.gov and should be read in conjunction with the Monthly Distribution Fund’s financial statements. As of October 31, 2019, the percentage of the Monthly Distribution Fund invested in the Fidelity Investments Money Market Fund- Class I was 33.3%.
| 11. | RECENT ACCOUNTING PRONOUNCEMENTS |
In March 2017, the Financial Accounting Standards Board (FASB) issued Accounting Standards Update (ASU) No. 2017-08, Receivables—Nonrefundable Fees and Other Costs (Subtopic 310-20): Premium Amortization on Purchased Callable Debt Securities. The amendments in the ASU shorten the amortization period for certain callable debt securities, held at a premium, to be amortized to the earliest call date. The ASU does not require an accounting change for securities held at a discount; which continues to be amortized to maturity. The ASU is effective for fiscal years and interim periods within those fiscal years beginning after December 15, 2018. Management is currently evaluating the impact, if any, of applying this provision.
In August 2018, the FASB issued Accounting Standards Update (“ASU”) No. 2018-13, which changes certain fair value measurement disclosure requirements. The new ASU, in addition to other modifications and additions, removes the requirement to disclose the amount and reasons for transfers between Level 1 and Level 2 of the fair value hierarchy, and the policy for the timing of transfers between levels. For investment companies, the amendments are effective for financial statements issued for fiscal years beginning after December 15, 2019, and interim periods within those fiscal years. Early adoption is allowed. These amendments have been adopted with these financial statements.
116
| NOTES TO FINANCIAL STATEMENTS |
| October 31, 2019 (Continued) |
| 12. | SUBSEQUENT EVENTS |
Subsequent events after the date of the Statements of Assets and Liabilities have been evaluated through the date the financial statements were issued. Management has determined that no events or transactions occurred requiring adjustment or disclosure in the financial statements.
117

REPORT OF INDEPENDENT REGISTERED PUBLIC ACCOUNTING FIRM
To the Board of Trustees and the Shareholders of the Dunham Funds
Opinion on the Financial Statements
We have audited the accompanying statements of assets and liabilities of Dunham Floating Rate Bond Fund, Dunham Long/Short Credit Fund (formerly, Dunham Appreciation & Income Fund), Dunham Corporate/Government Bond Fund, Dunham Monthly Distribution Fund, Dunham Dynamic Macro Fund, Dunham High-Yield Bond Fund, Dunham International Opportunity Bond Fund, Dunham Large Cap Value Fund, Dunham Focused Large Cap Growth Fund, Dunham International Stock Fund, Dunham Real Estate Stock Fund, Dunham Small Cap Value Fund, Dunham Small Cap Growth Fund, and Dunham Emerging Markets Stock Fund, each a series of shares of beneficial interest in Dunham Funds (the“Funds”), including the schedules of investments, as of October 31, 2019, and the related statements of operations for the year then ended, the statements of changes in net assets for each of the years in the two-year period then ended and the financial highlights for each of the years in the five-year period then ended, and the related notes (collectively referred to as the“financial statements”). In our opinion, the financial statements present fairly, in all material respects, the financial position of the Funds as of October 31, 2019, and the results of their operations for the year then ended, the changes in their net assets for each of the years in the two-year period then ended and their financial highlights for each of the years in the five-year period then ended, in conformity with accounting principles generally accepted in the United States of America.
Basis for Opinion
These financial statements are the responsibility of the Funds’ management. Our responsibility is to express an opinion on the Funds’ financial statements based on our audits. We are a public accounting firm registered with the Public Company Accounting Oversight Board (United States) (“PCAOB”) and are required to be independent with respect to the Funds in accordance with the U.S. federal securities law and the applicable rules and regulations of the Securities and Exchange Commission and the PCAOB.
We conducted our audits in accordance with the standards of the PCAOB. Those standards require that we plan and perform the audits to obtain reasonable assurance about whether the financial statements are free of material misstatement, whether due to error or fraud. The Funds are not required to have, nor were we engaged to perform, an audit of their internal control over financial reporting. As part of our audits we are required to obtain an understanding of internal control over financial reporting but not for the purpose of expressing an opinion on the effectiveness of the Funds’ internal control over financial reporting. Accordingly, we express no such opinion.
118
Our audits included performing procedures to assess the risk of material misstatement of the financial statements, whether due to error or fraud, and performing procedures that respond to those risks. Such procedures included examining, on a test basis, evidence regarding the amounts and disclosures in the financial statements. Our procedures included confirmation of securities owned as of October 31, 2019 by correspondence with the custodian, counterparties and brokers,or by other appropriate auditing procedures where replies from brokers were not received. Our audits also included evaluating the accounting principles used and significant estimates made by management, as well as evaluating the overall presentation of the financial statements. We believe that our audits provide a reasonable basis for our opinion.

BBD, LLP
We have served as the auditor of one or more of the Funds in the Dunham Funds since 2007.
Philadelphia, Pennsylvania
December 30, 2019
119
| TRUSTEES & OFFICERS (Unaudited) |
Trustees and Officers of the Trust, together with information as to their principal business occupations during the last five years, are shown below. Each Trustee who is considered an “interested person” of the Trust (as defined in Section 2(a)(19) of the 1940 Act) is indicated by an asterisk next to his name. Unless otherwise noted, the address of each Trustee and Officer is 10251 Vista Sorrento Parkway, Suite 200, San Diego, CA 92121.
| Name, Age and Address | Position(s) Held with Trust | Term of Office and Length of Time Served ^ | Principal Occupation(s) During the Past 5 Years and Current Directorships | Number of Funds in the Trust Overseen by Trustee | Other Directorships |
| Non-Interested Trustees | |||||
| Henry R. Goldstein c/o Gemini Fund Services, LLC, 17605 Wright Street, Suite #2, Omaha, NE 68130 Age:88 | Trustee | Since January 2008 | Self-employed consultant/mediator (financial services), 2009-present; Independent Contractor, RBC Daniels (financial services company for telecom industry), 2007-2009. | 14 | None |
| Paul A. Rosinack c/o Gemini Fund Services, LLC, 17605 Wright Street, Suite #2, Omaha, NE 68130 Age: 72 | Trustee | Since January 2008 | Retired; President/Chief Executive Officer / Director, Qualigen, Inc., (manufacturer of medical products and equipment) 2004-2017. | 14 | None |
| Interested Trustees and Officers | |||||
| Jeffrey A. Dunham* Age: 58 | Trustee, Chairman of Board, President & Principal Executive Officer | Since January 2008 | Chief Executive Officer, Dunham & Associates Investment Counsel, Inc. (registered investment adviser, broker-dealer and distributor for mutual funds), 1985-present; Chief Executive Officer, Dunham & Associates Holdings, Inc. (holding company), 1999-present; Chief Executive Officer, Dunham & Associates Securities, Inc. (general partner for various limited partnerships), 1986-present; Chief Executive Officer, Asset Managers, Inc. (general partner for various limited partnerships), 1985-present; Chairman and Chief Executive Officer, Dunham Trust Company, 1999-present. | 14 | None |
| Denise S. Iverson Age: 60 | Treasurer & Principal Financial Officer | Since January 2008 | Chief Financial Officer, Dunham & Associates Investment Counsel, Inc. (registered investment adviser, broker-dealer and distributor for mutual funds), 1999-present; Chief Financial Officer, Dunham & Associates Holdings, Inc. (holding company), 1999-present; Chief Financial Officer, Dunham & Associates Securities, Inc. (general partner for various limited partnerships), 1999-present; Chief Financial Officer, Asset Managers, Inc. (general partner for various limited partnerships), 1999-present; Chief Financial Officer and Director, Dunham Trust Company, 1999-present. | N/A | N/A |
| Joseph P. Kelly II Age: 44 | Chief Compliance Officer | Since January 2014 | General Counsel and Chief Compliance Officer, Dunham & Associates, Investment Counsel, Inc. (registered investment adviser, broker-dealer and distributor for mutual funds), November 2013-present; Senior Associate, Dechert LLP (law firm), 2005-October 2013. | N/A | N/A |
| Tamara Beth Wendoll Age: 48 | Secretary and AML Officer | Since October 2015 – Secretary (December 2008 -Assistant Secretary); Since September 2010 – AML Officer | Chief Operating Officer, Dunham & Associates Investment Counsel, Inc. (registered investment adviser, broker-dealer and distributor for mutual funds), 2008-present. | N/A | N/A |
| Ryan Dykmans Age: 37 | Assistant Secretary | Since October 2015 | Director of Research, June 2013-present; Senior Investment Analyst from 2009-2013, Dunham & Associates Investment Counsel, Inc. (registered investment adviser, broker-dealer and distributor for mutual funds). | N/A | N/A |
| James Colantino Age: 50 | Assistant Treasurer | Since January 2008 | Senior Vice President-Fund Administration, 2012-present; Vice President, 2004-2012;Senior Fund Administrator, 1999-2004,Gemini Fund Services, LLC.
| N/A | N/A |
| ^ | Each Trustee will serve an indefinite term until his successor, if any, is duly elected and qualified. Officers of the Trust are elected annually. |
The Trust’s Statement of Additional Information includes additional information about the Trustees and is available free of charge, upon request, by calling toll-free at 1-888-3DUNHAM (338-6426).
120
| ADDITIONAL INFORMATION (Unaudited) |
| Meeting of the Board of Trustees Held on June 25, 2019 |
On June 25, 2019, the Board of Trustees (the “Board”) of Dunham Funds (the “Trust”), a Delaware business trust, met to consider, among other things, a new sub-advisory agreement (the “Sub-Advisory Agreement”) for the following Trust series (the “Fund”):
| Fund | Sub-Advisory Agreement |
| Dunham Monthly Distribution Fund | Weiss Multi-Strategy Advisers LLC |
The Sub-Advisory Agreement with Weiss Multi-Strategy Advisers LLC (the “Sub-Adviser”) would take effect on or about August 1, 2019. Weiss would take over sub-advisory responsibilities from the current sub-adviser Perella Weinberg Partners, LLC (“Perella”).
In considering the Sub-Advisory Agreement, the Independent Trustees had requested and reviewed materials that Dunham & Associates Investment Counsel, Inc. (the “Adviser”) and the Sub-Adviser. This information was provided prior to and during the meeting. The Independent Trustees also had reviewed a memorandum from Fund counsel that addressed their fiduciary duties pertaining to the new Sub-Advisory Agreement and the factors they should consider in evaluating the Sub-Advisory Agreement.
Among other information, the Adviser and the Sub-Adviser provided information to assist the Independent Trustees in assessing the nature, extent and quality of services provided, information comparing the investment performance, sub-advisory fees and operating expense ratio of the Fund to other funds, information about estimated profitability and/or financial condition and compliance and regulatory matters. The Board determined that, given the totality of the information provided with respect to the Sub-Advisory Agreement, the Board had received sufficient information to approve the Sub-Advisory Agreement.
Based upon its review, the Board concluded that it was in the best interests of the Fund that the Sub-Advisory Agreement be approved. In considering the approval of the Sub-Advisory Agreement, the Board did not identify any single factor or group of factors as all-important or controlling, and considered a variety of factors in its analysis, including those discussed below. The Board did not allot a particular weight to any one factor or group of factors.
| I. | Sub-Advisory Agreement |
Nature, Extent and Quality of Services.In considering the approval of the Sub-Advisory Agreement between the Fund and the Sub-Adviser, the Board considered the nature, extent and quality of services the Sub-Adviser would provide under the Sub-Advisory Agreement. The Board reviewed the background of the investment professionals that would service the Fund, and the Sub-Adviser’s reputation, resources and investment approach. The Board also reviewed information provided regarding the structure of portfolio manager compensation, trading and brokerage practices, soft dollar usage, risk management and compliance matters.
The Board noted in particular that, after the Fund’s current sub-adviser Perella reorganized its business operations, some of Perella’s personnel – including the Fund’s portfolio manager David Baker – would be joining the Sub-Adviser. The Sub-Adviser is a 40-year old firm that initially advised a family office. The firm has approximately $1.9 billion in assets under management in mostly market neutral and balanced risk strategies. It advises a $90 million liquid alternative mutual fund and serves as sub-adviser to two other funds. The Board believed that the Fund would benefit from the Sub-Adviser’s large asset management department and use of extensive analytics. The firm has over 100 full-time employees with senior investment personnel working out of its New York City office.
Performance.With the Fund retaining the same portfolio manager, the Board noted in particular that the Sub-Adviser intends to retain a similar investment structure employed by the current sub-adviser Perella.
Sub-Advisory Fees and Economies of Scale.The Board considered the Fund’s sub-advisory fee schedule and noted the fees charged to comparable portfolios, if any, that the Sub-Adviser managed. The Board considered that the fee schedule was negotiated between the Adviser and the Sub-Adviser, an unaffiliated third party.
The Board reviewed the operation of the performance fee and the impact on fees and expenses based on various performance results. They discussed the unique nature of the performance fee, which results in higher fees when the Sub-Adviser delivers results, and how performance fees should be integrated into their analysis.
121
| ADDITIONAL INFORMATION (Unaudited) (Continued) |
The Board confirmed its belief that performance fees help ensure that any significant fee adjustments are attributable to the Sub-Adviser’s skill, rather than to random performance fluctuations, and the performance fee aligns the Sub-Adviser’s interest with those of Fund shareholders.
The Board also noted in particular that the Fund’s sub-advisory fee schedule will remain the same after the Sub-Adviser takes over from the current sub-adviser Perella. The Fund will pay a “fulcrum fee” consisting of: a “base fee” of 60 basis points (0.60%) annually; and a “performance fee” at a rate that will vary by up to +/-38 bps (0.38%). The performance fee will be added to or subtracted from the base fee to arrive at the total fulcrum fee. The comparative index will be the IndexIQ IQ Hedge Market Neutral Total Return Index over the applicable measurement period. The Board concluded that the Sub-Adviser’s fees were in a reasonable range.
The Board reviewed the relevance of economies of scale in the context of the Sub-Adviser that receives a performance-based fee. The Board agreed that the Adviser had successfully negotiated a favorable base fee with the Sub-Adviser, and that reductions based on asset growth, when coupled with the possibility of fee reductions based on performance, could hinder the Adviser’s ability to attract top sub-advisory talent. The Board agreed that pursuing breakpoints with the Sub-Adviser would not be in the best interests of Fund shareholders at this time.
Profitability and Fallout Benefits.The Board considered any information provided regarding the Sub-Adviser’s estimated profitability from providing sub-advisory services to the Fund. The Board noted that the sub-advisory fee schedule was negotiated between the Adviser and the Sub-Adviser, an unaffiliated third party. The Board reviewed materials provided as to any additional benefits the Sub-Adviser would receive.
Conclusion.Based on all of the information considered and the conclusions reached, the Board determined that the terms of the Sub-Advisory Agreement for the Fund are fair and reasonable, and that the approval of the Sub-Advisory Agreement is in the best interests of the Fund.
122
| DUNHAM FUNDS’ EXPENSES (Unaudited) |
Example
Shareholders of mutual funds will pay (1) transitional costs, such as sales load, and (2) ongoing expenses, such as advisory fees, distribution and service fees (12b-1), and other fund expenses. The following examples are intended to help you understand the ongoing cost (in dollars) of investing in a fund and to compare these costs with the ongoing costs of investing in other mutual funds. Please note, the expenses shown in the tables are meant to highlight ongoing costs only and do not reflect any transactional costs, such as sales charges (loads), or contingent deferred sales charges on redemptions which may be assessed by mutual funds. This Example is based on an investment of $1,000 invested at the beginning of the period and held for the entire period as indicated below.
Actual Expenses
The columns under the heading entitled “Actual” help you estimate the actual expenses you paid over the period. The “Actual-Ending Account Value” shown is derived from the Fund’s actual return, and the “Actual- Expenses Paid During Period” shows the dollar amount that would have been paid by an investor who started with $1,000 in the Fund. To estimate the expenses you paid on your account during this period, simply divide your account value by $1,000 (for example, an $8,600 account value divided by $1,000 = 8.6), then multiply the result by the number in the column under the heading entitled “Actual-Expenses Paid During Period”.
Hypothetical Examples for Comparison Purposes
The columns under the heading entitled “Hypothetical” provide information about hypothetical account value and hypothetical expenses based on the Fund’s actual expense ratio and an assumed rate of return of 5% per year before expenses, which is not the Fund’s actual return. The hypothetical account values and expenses may not be used to estimate the actual ending account balance or expenses you paid for the period. You may use this information to compare the ongoing costs of investing in the Fund and other funds. To do so, compare this 5% hypothetical example with the 5% hypothetical examples that appear in the shareholder reports of other funds.
Please note that the expenses shown in the table are meant to highlight your ongoing costs only and do not reflect any transactional costs which may be applicable to your account. Therefore, the last column of the table (Hypothetical- Expenses Paid During Period) is useful in comparing ongoing costs only, and will not help you determine the relative total costs of owning different funds. In addition, if these transactional costs were included, your costs would have been higher.
| Actual | Hypothetical | |||||||||||
| Fund’s | Ending | Ending | ||||||||||
| Annualized | Beginning | Account | Expenses | Account | Expenses | |||||||
| Expense | Account | Value | Paid During | Value | Paid During | |||||||
| Ratio | Value 5/1/19 | 10/31/19 | Period* | 10/31/19 | Period* | |||||||
| Class N: | ||||||||||||
| Floating Rate Bond Fund | 1.03% | $1,000.00 | $1,001.00 | $5.21 | $1,020.00 | $5.26 | ||||||
| Long/Short Credit Fund | 1.20% | $1,000.00 | $1,025.40 | $6.12 | $1,019.16 | $6.10 | ||||||
| Corporate/Government Bond Fund | 1.23% | $1,000.00 | $1,052.90 | $6.34 | $1,019.03 | $6.24 | ||||||
| Monthly Distribution Fund | 1.94% | $1,000.00 | $1,000.00 | $9.76 | $1,015.44 | $9.84 | ||||||
| Dynamic Macro Fund | 1.63% | $1,000.00 | $1,018.20 | $8.30 | $1,016.98 | $8.29 | ||||||
| High-Yield Bond Fund | 1.04% | $1,000.00 | $1,023.20 | $5.29 | $1,019.97 | $5.29 | ||||||
| International Opportunity Bond Fund | 1.38% | $1,000.00 | $1,039.70 | $7.08 | $1,018.27 | $7.00 | ||||||
| Large Cap Value Fund | 1.21% | $1,000.00 | $1,028.90 | $6.19 | $1,019.10 | $6.16 | ||||||
| Focused Large Cap Growth Fund | 1.30% | $1,000.00 | $985.00 | $6.50 | $1,018.65 | $6.61 | ||||||
| International Stock Fund | 1.34% | $1,000.00 | $1,018.40 | $6.81 | $1,018.46 | $6.81 | ||||||
| Real Estate Stock Fund | 1.22% | $1,000.00 | $1,101.40 | $6.46 | $1,019.05 | $6.21 | ||||||
| Small Cap Value Fund | 1.76% | $1,000.00 | $1,010.30 | $8.94 | $1,016.31 | $8.96 | ||||||
| Small Cap Growth Fund | 1.75% | $1,000.00 | $931.90 | $8.51 | $1,016.40 | $8.88 | ||||||
| Emerging Markets Stock Fund | 1.99% | $1,000.00 | $1,005.60 | $10.04 | $1,015.19 | $10.09 | ||||||
| Class A: | ||||||||||||
| Floating Rate Bond Fund | 1.28% | $1,000.00 | $999.70 | $6.46 | $1,018.74 | $6.52 | ||||||
| Long/Short Credit Fund | 1.40% | $1,000.00 | $1,024.10 | $7.13 | $1,018.16 | $7.11 | ||||||
| Corporate/Government Bond Fund | 1.47% | $1,000.00 | $1,051.70 | $7.61 | $1,017.79 | $7.48 | ||||||
| Monthly Distribution Fund | 2.18% | $1,000.00 | $998.80 | $11.01 | $1,014.19 | $11.09 | ||||||
| Dynamic Macro Fund | 1.88% | $1,000.00 | $1,017.30 | $9.57 | $1,015.72 | $9.56 | ||||||
| High-Yield Bond Fund | 1.29% | $1,000.00 | $1,021.60 | $6.56 | $1,018.71 | $6.55 | ||||||
| International Opportunity Bond Fund | 1.63% | $1,000.00 | $1,038.90 | $8.36 | $1,017.01 | $8.27 | ||||||
| Large Cap Value Fund | 1.46% | $1,000.00 | $1,026.90 | $7.46 | $1,017.85 | $7.42 | ||||||
| Focused Large Cap Growth Fund | 1.55% | $1,000.00 | $983.40 | $7.75 | $1,017.39 | $7.88 | ||||||
| International Stock Fund | 1.59% | $1,000.00 | $1,016.50 | $8.08 | $1,017.19 | $8.08 | ||||||
| Real Estate Stock Fund | 1.47% | $1,000.00 | $1,100.00 | $7.78 | $1,017.80 | $7.48 | ||||||
| Small Cap Value Fund | 2.01% | $1,000.00 | $1,009.10 | $10.19 | $1,015.06 | $10.23 | ||||||
| Small Cap Growth Fund | 2.00% | $1,000.00 | $931.00 | $9.74 | $1,015.11 | $10.17 | ||||||
| Emerging Markets Stock Fund | 2.24% | $1,000.00 | $1,004.30 | $11.31 | $1,013.92 | $11.36 | ||||||
123
| DUNHAM FUNDS’ EXPENSES (Unaudited) (Continued) |
| Actual | Hypothetical | |||||||||||
| Fund’s | Ending | Ending | ||||||||||
| Annualized | Beginning | Account | Expenses | Account | Expenses | |||||||
| Expense | Account | Value | Paid During | Value | Paid During | |||||||
| Ratio | Value 5/1/19 | 10/31/19 | Period* | 10/31/19 | Period* | |||||||
| Class C: | ||||||||||||
| Floating Rate Bond Fund | 1.78% | $1,000.00 | $998.20 | $8.97 | $1,016.22 | $9.05 | ||||||
| Long/Short Credit Fund | 2.20% | $1,000.00 | $1,020.00 | $11.22 | $1,014.10 | $11.18 | ||||||
| Corporate/Government Bond Fund | 1.97% | $1,000.00 | $1,049.40 | $10.20 | $1,015.25 | $10.03 | ||||||
| Monthly Distribution Fund | 2.94% | $1,000.00 | $995.10 | $14.77 | $1,010.40 | $14.89 | ||||||
| Dynamic Macro Fund | 2.63% | $1,000.00 | $1,013.80 | $13.36 | $1,011.94 | $13.35 | ||||||
| High-Yield Bond Fund | 1.79% | $1,000.00 | $1,018.30 | $9.09 | $1,016.19 | $9.08 | ||||||
| International Opportunity Bond Fund | 2.13% | $1,000.00 | $1,035.20 | $10.91 | $1,014.49 | $10.80 | ||||||
| Large Cap Value Fund | 2.21% | $1,000.00 | $1,023.80 | $11.27 | $1,014.06 | $11.22 | ||||||
| Focused Large Cap Growth Fund | 2.30% | $1,000.00 | $979.70 | $11.48 | $1,013.61 | $11.67 | ||||||
| International Stock Fund | 2.34% | $1,000.00 | $1,012.50 | $11.86 | $1,013.42 | $11.86 | ||||||
| Real Estate Stock Fund | 2.22% | $1,000.00 | $1,096.00 | $11.73 | $1,014.02 | $11.27 | ||||||
| Small Cap Value Fund | 2.76% | $1,000.00 | $1,005.60 | $13.97 | $1,011.27 | $14.01 | ||||||
| Small Cap Growth Fund | 2.74% | $1,000.00 | $927.00 | $13.29 | $1,011.41 | $13.88 | ||||||
| Emerging Markets Stock Fund | 2.99% | $1,000.00 | $1,001.50 | $15.06 | $1,010.16 | $15.12 | ||||||
| * | Expenses Paid During Period are equal to the Fund’s annualized expense ratio, multiplied by the average account value over the period, multiplied by 184 days and divided by 365 (to reflect the number of days in the six month period ending October 31, 2019). |
124
Privacy Notice
| FACTS | WHAT DO THE DUNHAM FUNDS DO WITH YOUR PERSONAL INFORMATION? |
| Why? | Financial companies choose how they share your personal information. Federal law gives consumers the right to limit some but not all sharing. Federal law also requires us to tell you how we collect, share, and protect your personal information. Please read this notice carefully to understand what we do. |
| What? | The types of personal information we collect and share depend on the product or service you have with us. This information can include:
■ Social Security number and wire transfer instructions
■ account transactions and transaction history
■ investment experience and purchase history
When you areno longera customer, we continue to share your information as described in this notice. |
| How? | All financial companies need to share customers’ personal information to run their everyday business. In the section below, we list the reasons financial companies can share their customers’ personal information; the reasons the Dunham Funds chooses to share; and whether you can limit this sharing. |
| Reasons we can share your personal information | Do Dunham Funds share? | Can you limit this sharing? |
| For our everyday business purposes -such as to process your transactions, maintain your account(s), respond to court orders and legal investigations, or report to credit bureaus | Yes | No |
| For our marketing purposes -to offer our products and services to you | Yes | No |
| For joint marketing with other financial companies | No | We don’t share |
| For our affiliates’ everyday business purposes -information about your transactions and experiences | No | We don’t share |
| For our affiliates’ everyday business purposes -information about your creditworthiness | No | We don’t share |
| For nonaffiliates to market to you | No | We don’t share |
| Questions? | Call (800) 442-4358 or go towww.dunham.com |
125
| What we do | |
| How do Dunham Funds protect my personal information? | To protect your personal information from unauthorized access and use, we use security measures that comply with federal law. These measures include computer safeguards and secured files and buildings.
We permit only authorized parties and affiliates (as permitted by law) who have signed an agreement (which protects your personal information) with us to have access to customer information. |
| How do Dunham Funds collect my personal information? | We collect your personal information, for example, when you ■ open and account or deposit money
■ direct us to buy securities or direct us to sell your securities
■ seek advice about your investments
We also collect your personal information from others, such as credit bureaus, affiliates, or other companies. |
| Why can’t I limit all sharing? | Federal law gives you the right to limit only ■ sharing for affiliates’ everyday business purposes-information about your creditworthiness
■ affiliates from using your information to market to you
■ sharing for nonaffiliates to market to you
State laws and individual companies may give you additional rights to limit sharing. |
| Definitions | |
| Affiliates | Companies related by common ownership or control. They can be financial and nonfinancial companies.
■ Our affiliates include financial companies, such as Dunham & Associates Investment Counsel, Inc. |
| Nonaffiliates | Companies not related by common ownership or control. They can be financial and nonfinancial companies.
■ Dunham Funds do not share with nonaffiliates so they can market to you. |
| Joint marketing | A formal agreement between nonaffiliated financial companies that together market financial products or services to you.
■ Dunham Funds doesn’t jointly market |
126
How to Obtain Proxy Voting Information
Information regarding how the Funds voted proxies relating to portfolio securities for the most recent 12-month period ended June 30 as well as a description of the policies and procedures that the Funds use to determine how to vote proxies is available without charge, upon request, by calling (888)-3DUNHAM (338-6426) or by referring to the Securities and Exchange Commission’s (“SEC”) website athttp://www.sec.gov.
How to Obtain 1st and 3rd Fiscal Quarter Portfolio Holdings
Each Fund files its complete schedule of portfolio holdings with the SEC for the first and third quarters of each fiscal year on Form N-Q. Form N-Q is available on the SEC’s website at http://www.sec.gov and may be reviewed and copied at the SEC’s Public Reference Room in Washington, DC (800)-SEC-0330. The information on Form N-Q is available without charge, upon request, by calling (888)-3DUNHAM (338-6426).

| P.O. Box 910309 |
| San Diego, California 92191 |
| (800) 442-4358 |
Distributed by Dunham & Associates Investment Counsel, Inc. Member FINRA/SIPC
THIS REPORT AND FINANCIAL STATEMENTS CONTAINED HEREIN ARE NOT INTENDED TO BE A FORECAST OF FUTURE EVENTS, A GUARANTEE OF FUTURE RESULTS, OR INVESTMENT ADVICE. FURTHER, THERE IS NO ASSURANCE THAT CERTAIN SECURITIES WILL REMAIN IN OR OUT OF EACH FUND’S PORTFOLIO.
THE FIGURES IN THIS REPORT REPRESENT PAST PERFORMANCE AND DO NOT GUARANTEE FUTURE RESULTS. THE PRINCIPAL VALUE OF AN INVESTMENT AND INVESTMENT RETURN WILL FLUCTUATE SO THAT AN INVESTOR’S SHARES, WHEN REDEEMED, MAY BE WORTH MORE OR LESS THAN THEIR ORIGINAL COST.
Item 2. Code of Ethics.
(a) As of the end of the period covered by this report, the registrant has adopted a code of ethics that applies to the registrant's principal executive officer, principal financial officer, principal accounting officer or controller, or persons performing similar functions, regardless of whether these individuals are employed by the registrant or a third party.
(b) For purposes of this item, “code of ethics” means written standards that are reasonably designed to deter wrongdoing and to promote:
| (1) | Honest and ethical conduct, including the ethical handling of actual or apparent conflicts of interest between personal and professional relationships; |
| (2) | Full, fair, accurate, timely, and understandable disclosure in reports and documents that a registrant files with, or submits to, the Commission and in other public communications made by the registrant; |
(3) Compliance with applicable governmental laws, rules, and regulations;
| (4) | The prompt internal reporting of violations of the code to an appropriate person or persons identified in the code; and |
(5) Accountability for adherence to the code.
(c) Amendments:
During the period covered by the report, there have not been any amendments to the provisions of the code of ethics.
(d) Waivers:
During the period covered by the report, the registrant has not granted any express or implicit waivers from the provisions of the code of ethics.
Item 3. Audit Committee Financial Expert.
| (a) | Timothy M. Considine, who served as an audit committee financial expert, resigned as a member of the Board of Trustees effective October 8, 2019. The search for his replacement is ongoing. As a result, the Registrant’s Board of Trustees has determined that it does not have an audit committee financial expert serving on its audit committee. In the interim, the Registrant believes that the experience provided by each member of the audit committee together offer the Registrant adequate oversight for the Registrant’s level of financial complexity. |
Item 4. Principal Accountant Fees and Services.
| (a) | Audit Fees |
FY 2019 $ 173,600
FY 2018 $ 186,000
| (b) | Audit-Related Fees |
FY 2019 $ 0
FY 2018 $ 0
Nature of the fees:
| (c) | Tax Fees |
FY 2019 $ 30,800
FY 2018 $ 30,000
Nature of the fees: Preparation of federal and state tax returns and review of annual dividend calculations.
| (d) | All Other Fees |
RegistrantAdviser
FY 2019 $ 0 $ 0
FY 2018 $ 0 $ 0
Nature of the fees:
| (e) | (1)Audit Committee’s Pre-Approval Policies |
The registrant’s Audit Committee is required to pre-approve all audit services and, when appropriate, any non-audit services (including audit-related, tax and all other services) to the registrant. The registrant’s Audit Committee is also required to pre-approve, when appropriate, any non-audit services (including audit-related, tax and all other services) to its adviser, or any entity controlling, controlled by or under common control with the adviser that provides ongoing services to the registrant to the extent that the services are determined to have a direct impact on the operations or financial reporting of the registrant. Services are reviewed on an engagement by engagement basis by the audit committee.
| (2) | Percentages of 2018 Services Approved by the Audit Committee |
| Registrant | Adviser | |||||||
| Audit-Related Fees: | 0 | % | 0 | % | ||||
| Tax Fees: | 0 | % | 0 | % | ||||
| All Other Fees: | 0 | % | 0 | % | ||||
(f) During audit of registrant's financial statements for the most recent fiscal year, less than 50 percent of the hours expended on the principal accountant's engagement were attributed to work performed by persons other than the principal accountant's full-time, permanent employees.
(g) The aggregate non-audit fees billed by the registrant's accountant for services rendered to the registrant, and rendered to the registrant's investment adviser (not including any sub-adviser whose role is primarily portfolio management and is subcontracted with or overseen by another investment adviser), and any entity controlling, controlled by, or under common control with the adviser that provides ongoing services to the registrant:
| Registrant | Adviser | |||||||||
| FY 2019 | $30,800 | $ None | ||||||||
| FY 2018 | $30,000 | $ None | ||||||||
(h) Not applicable. All non-audit services to the registrant were pre-approved by the Audit Committee.
Item 5. Audit Committee of Listed Companies.Not applicable to open-end investment companies.
Item 6. Schedule of Investments.Schedule of investments in securities of unaffiliated issuers is included under Item 1.
Item 7. Disclosure of Proxy Voting Policies and Procedures for Closed-End Funds. Not applicable to open-end investment companies.
Item 8. Portfolio Managers of Closed-End Funds. Not applicable to open-end investment companies.
Item 9. Purchases of Equity Securities by Closed-End Funds. Not applicable to open-end investment companies.
Item 10. Submission of Matters to a Vote of Security Holders. None
Item 11. Controls and Procedures.
(a) Based on an evaluation of the registrant’s disclosure controls and procedures as of a date within 90 days of filing date of this Form N-CSR, the disclosure controls and procedures are reasonably designed to ensure that the information required in filings on Forms N-CSR is recorded, processed, summarized, and reported on a timely basis.
(b) There were no significant changes in the registrant’s internal control over financial reporting that occurred during the registrant’s last fiscal half-year that have materially affected, or are reasonably likely to materially affect, the registrant’s internal control over financial reporting.
Item 12. Disclosure of Securities Lending Activities for Closed-End Management Investment Companies.Not applicable to open-end investment companies.
Item 13. Exhibits.
(a)(1) Code of Ethics filed herewith.
(a)(3) Not applicable.
SIGNATURES
Pursuant to the requirements of the Securities Exchange Act of 1934 and the Investment Company Act of 1940, the registrant has duly caused this report to be signed on its behalf by the undersigned, thereunto duly authorized.
(Registrant)Dunham Funds
By (Signature and Title)
/s/ Jeffrey Dunham
Jeffrey Dunham, Principal Executive Officer/President
Date 1/8/20
Pursuant to the requirements of the Securities Exchange Act of 1934 and the Investment Company Act of 1940, this report has been signed below by the following persons on behalf of the registrant and in the capacities and on the dates indicated.
By (Signature and Title)
/s/ Jeffrey Dunham
Jeffrey Dunham, Principal Executive Officer/President
Date 1/8/20
By (Signature and Title)
/s/ Denise Iverson
Denise Iverson, Principal Financial Officer/Treasurer
Date 1/8/20