UNITED STATES
SECURITIES AND EXCHANGE COMMISSION
Washington, D.C. 20549
FORM N-CSRS
CERTIFIED SHAREHOLDER REPORT OF REGISTERED MANAGEMENT
INVESTMENT COMPANIES
Investment Company Act file number 811-22209
Global X Funds
(Exact name of registrant as specified in charter)
605 Third Avenue, 43rd floor
New York, NY 10158
(Address of principal executive offices) (Zip code)
Ryan O’Connor
Global X Management Company LLC
605 Third Avenue, 43rd floor
New York, NY 10158
(Name and address of agent for service)
With a copy to:
Global X Management Company LLC 605 Third Avenue, 43rd floor New York, NY 10158 | Eric S. Purple, Esq. Stradley Ronon Stevens & Young, LLP 2000 K Street, N.W., Suite 700 Washington, DC 20006-1871 |
Registrant’s telephone number, including area code: (212) 644-6440
Date of fiscal year end: October 31, 2024
Date of reporting period: April 30, 2024
Item 1. Reports to Stockholders.
(a) A copy of the report transmitted to stockholders pursuant to Rule 30e-1 under the Investment Company Act of 1940, as amended (the “Act”) (17 CFR § 270.30e-1), is attached hereto.
![]()
Global X S&P 500® Covered Call ETF (ticker: XYLD)
Global X NASDAQ 100® Covered Call ETF (ticker: QYLD)
Global X Russell 2000 Covered Call ETF (ticker: RYLD)
Global X Nasdaq 100® Covered Call & Growth ETF (ticker: QYLG)
Global X S&P 500® Covered Call & Growth ETF (ticker: XYLG)
Global X NASDAQ 100® Risk Managed Income ETF (ticker: QRMI)
Global X S&P 500® Risk Managed Income ETF (ticker: XRMI)
Global X Dow 30® Covered Call ETF (ticker: DJIA)
Global X Russell 2000 Covered Call & Growth ETF (ticker: RYLG)
Global X Financials Covered Call & Growth ETF (ticker: FYLG)
Global X Health Care Covered Call & Growth ETF (ticker: HYLG)
Global X Information Technology Covered Call & Growth ETF (ticker: TYLG)
Global X NASDAQ 100 ESG Covered Call ETF (ticker: QYLE)
Global X S&P 500 ESG Covered Call ETF (ticker: XYLE)
Global X Dow 30® Covered Call & Growth ETF (ticker: DYLG)
Global X MSCI Emerging Markets Covered Call ETF (ticker: EMCC)
Semi-Annual Report
April 30, 2024
As permitted by regulations adopted by the Securities and Exchange Commission, paper copies of the Funds’ (defined below) shareholder reports will no longer be sent by mail, unless you specifically request paper copies of the reports from your financial intermediary (such as a broker-dealer or bank). Instead, shareholder reports will be available on the Funds’ website (www.globalxetfs.com/explore), and you will be notified by mail each time a report is posted and provided with a website link to access the report.
If you already elected to receive shareholder reports electronically, you will not be affected by this change and you need not take any action. You may elect to receive shareholder reports and other communications from the Funds electronically anytime by contacting your financial intermediary.
You may elect to receive all future Fund shareholder reports in paper free of charge. Please contact your financial intermediary to inform them that you wish to continue receiving paper copies of Fund shareholder reports and for details about whether your election to receive reports in paper will apply to all funds held with your financial intermediary.
![]()
Table of Contents
![]()
Table of Contents
Shares are bought and sold at market price (not NAV) and are not individually redeemed from a Fund. Shares may only be redeemed directly from a Fund by Authorized Participants, in very large creation/redemption units. Brokerage commissions will reduce returns.
The Funds file their complete schedules of Fund holdings with the Securities and Exchange Commission (the “SEC” or “Commission”) for the first and third quarters of each fiscal year as an exhibit to its reports on Form N-PORT. The Funds’ Form N-PORT is available on the Commission’s website at https://www.sec.gov, and may be reviewed and copied at the Commission’s Public Reference Room in Washington, DC. Information on the operation of the Public Reference Room may be obtained by calling 1-800-SEC-0330.
A description of the policies and procedures that Global X Funds uses to determine how to vote proxies relating to Fund securities, as well as information relating to how the Funds voted proxies relating to Fund securities during the most recent 12-month period ended June 30, is available (i) without charge, upon request, by calling 1-888-493-8631; and (ii) on the Commission’s website at https://www.sec.gov.
![]()
| Schedule of Investments | April 30, 2024 (Unaudited) | |
| Global X S&P 500® Covered Call ETF | ||
Sector Weightings †:
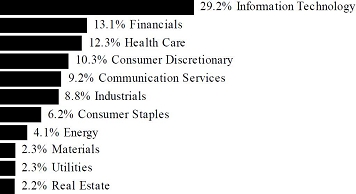
† Sector weightings percentages are based on the total market value of investments. Total investments do not include derivatives such as options, futures contracts, forward contracts, and swap contracts, if applicable.
| Shares | Value | |||||||
| COMMON STOCK — 101.7% | ||||||||
| CHINA — 0.2% | ||||||||
| Information Technology — 0.2% | ||||||||
| NXP Semiconductors | 16,639 | $ | 4,262,745 | |||||
| UNITED STATES — 101.5% | ||||||||
| Communication Services — 9.3% | ||||||||
| Alphabet, Cl A * | 397,123 | 64,643,682 | ||||||
| Alphabet, Cl C * | 332,679 | 54,772,271 | ||||||
| AT&T | 470,676 | 7,949,718 | ||||||
| Charter Communications, Cl A * | 6,574 | 1,682,549 | ||||||
| Comcast, Cl A | 265,607 | 10,122,283 | ||||||
| Electronic Arts | 15,377 | 1,950,111 | ||||||
| Fox, Cl A | 19,834 | 615,052 | ||||||
| Fox, Cl B | 7,559 | 216,792 | ||||||
| Interpublic Group | 29,049 | 884,252 | ||||||
| Live Nation Entertainment * | 9,456 | 840,733 | ||||||
| Match Group * | 20,718 | 638,529 | ||||||
| Meta Platforms, Cl A | 148,211 | 63,755,926 | ||||||
| Netflix * | 28,818 | 15,868,343 | ||||||
| News, Cl A | 23,970 | 570,486 | ||||||
| News, Cl B | 11,843 | 290,627 | ||||||
The accompanying notes are an integral part of the financial statements.
1
![]()
| Schedule of Investments | April 30, 2024 (Unaudited) |
| Global X S&P 500® Covered Call ETF | |
| Shares | Value | |||||||
| COMMON STOCK — continued | ||||||||
| Communication Services — continued | ||||||||
| Omnicom Group | 13,180 | $ | 1,223,631 | |||||
| Paramount Global, Cl B | 41,768 | 475,737 | ||||||
| Take-Two Interactive Software * | 9,676 | 1,381,830 | ||||||
| T-Mobile US | 34,536 | 5,669,775 | ||||||
| Verizon Communications | 286,720 | 11,322,573 | ||||||
| Walt Disney | 124,759 | 13,860,725 | ||||||
| Warner Bros Discovery * | 153,794 | 1,131,924 | ||||||
| 259,867,549 | ||||||||
| Consumer Discretionary — 10.5% | ||||||||
| Airbnb, Cl A * | 29,306 | 4,647,052 | ||||||
| Amazon.com * | 615,279 | 107,673,825 | ||||||
| Aptiv * | 18,571 | 1,318,541 | ||||||
| AutoZone * | 1,156 | 3,417,598 | ||||||
| Bath & Body Works | 17,019 | 773,003 | ||||||
| Best Buy | 12,367 | 910,706 | ||||||
| Booking Holdings | 2,355 | 8,129,531 | ||||||
| BorgWarner | 13,740 | 450,260 | ||||||
| Caesars Entertainment * | 15,868 | 568,392 | ||||||
| CarMax * | 11,589 | 787,704 | ||||||
| Carnival * | 76,016 | 1,126,557 | ||||||
| Chipotle Mexican Grill, Cl A * | 1,819 | 5,747,312 | ||||||
| Darden Restaurants | 7,954 | 1,220,223 | ||||||
| Deckers Outdoor * | 1,715 | 1,403,676 | ||||||
| Domino’s Pizza | 2,249 | 1,190,328 | ||||||
| DR Horton | 20,632 | 2,939,854 | ||||||
| eBay | 34,284 | 1,766,997 | ||||||
| Etsy * | 7,945 | 545,583 | ||||||
| Expedia Group * | 9,553 | 1,286,120 | ||||||
| Ford Motor | 259,828 | 3,156,910 | ||||||
| Garmin | 10,203 | 1,474,027 | ||||||
| General Motors | 76,867 | 3,422,888 | ||||||
| Genuine Parts | 9,228 | 1,450,734 | ||||||
| Hasbro | 9,375 | 574,687 | ||||||
| Hilton Worldwide Holdings | 16,436 | 3,242,494 | ||||||
| Home Depot | 66,625 | 22,267,407 | ||||||
| Las Vegas Sands | 22,291 | 988,829 | ||||||
| Lennar, Cl A | 16,466 | 2,496,575 | ||||||
| LKQ | 17,807 | 768,016 | ||||||
The accompanying notes are an integral part of the financial statements.
2
![]()
| Schedule of Investments | April 30, 2024 (Unaudited) | |
| Global X S&P 500® Covered Call ETF | ||
| Shares | Value | |||||||
| COMMON STOCK — continued | ||||||||
| Consumer Discretionary — continued | ||||||||
| Lowe’s | 38,039 | $ | 8,672,512 | |||||
| Lululemon Athletica * | 7,391 | 2,665,195 | ||||||
| Marriott International, Cl A | 17,032 | 4,021,766 | ||||||
| McDonald’s | 49,365 | 13,478,620 | ||||||
| MGM Resorts International * | 15,331 | 604,655 | ||||||
| Mohawk Industries * | 3,507 | 404,427 | ||||||
| NIKE, Cl B | 80,642 | 7,440,031 | ||||||
| Norwegian Cruise Line Holdings * | 28,328 | 535,966 | ||||||
| NVR * | 213 | 1,584,475 | ||||||
| O’Reilly Automotive * | 4,030 | 4,083,438 | ||||||
| Pool | 2,585 | 937,140 | ||||||
| PulteGroup | 15,124 | 1,685,116 | ||||||
| Ralph Lauren, Cl A | 2,609 | 426,937 | ||||||
| Ross Stores | 21,685 | 2,809,292 | ||||||
| Royal Caribbean Cruises * | 15,879 | 2,217,185 | ||||||
| Starbucks | 75,030 | 6,639,405 | ||||||
| Tapestry | 13,426 | 535,966 | ||||||
| Tesla * | 187,334 | 34,334,576 | ||||||
| TJX | 75,203 | 7,075,850 | ||||||
| Tractor Supply | 7,744 | 2,114,732 | ||||||
| Ulta Beauty * | 3,037 | 1,229,499 | ||||||
| Wynn Resorts | 6,145 | 563,189 | ||||||
| Yum! Brands | 19,702 | 2,782,907 | ||||||
| 292,588,708 | ||||||||
| Consumer Staples — 6.3% | ||||||||
| Altria Group | 119,100 | 5,217,771 | ||||||
| Archer-Daniels-Midland | 37,838 | 2,219,577 | ||||||
| Brown-Forman, Cl B | 13,426 | 642,434 | ||||||
| Bunge Global | 10,377 | 1,055,963 | ||||||
| Campbell Soup | 16,317 | 745,850 | ||||||
| Church & Dwight | 15,017 | 1,620,184 | ||||||
| Clorox | 8,510 | 1,258,374 | ||||||
| Coca-Cola | 264,330 | 16,327,664 | ||||||
| Colgate-Palmolive | 53,455 | 4,913,584 | ||||||
| Conagra Brands | 35,981 | 1,107,495 | ||||||
| Constellation Brands, Cl A | 10,955 | 2,776,654 | ||||||
| Costco Wholesale | 30,070 | 21,737,603 | ||||||
| Dollar General | 14,756 | 2,053,888 | ||||||
The accompanying notes are an integral part of the financial statements.
3
![]()
| Schedule of Investments | April 30, 2024 (Unaudited) | |
| Global X S&P 500® Covered Call ETF | ||
| Shares | Value | |||||||
| COMMON STOCK — continued | ||||||||
| Consumer Staples — continued | ||||||||
| Dollar Tree * | 14,011 | $ | 1,656,801 | |||||
| Estee Lauder, Cl A | 16,304 | 2,391,960 | ||||||
| General Mills | 37,823 | 2,665,009 | ||||||
| Hershey | 9,273 | 1,798,220 | ||||||
| Hormel Foods | 19,292 | 686,023 | ||||||
| J M Smucker | 6,842 | 785,804 | ||||||
| Kellanova | 16,718 | 967,303 | ||||||
| Kenvue | 121,188 | 2,280,758 | ||||||
| Keurig Dr Pepper | 70,670 | 2,381,579 | ||||||
| Kimberly-Clark | 22,436 | 3,063,187 | ||||||
| Kraft Heinz | 55,709 | 2,150,924 | ||||||
| Kroger | 44,408 | 2,459,315 | ||||||
| Lamb Weston Holdings | 9,962 | 830,233 | ||||||
| McCormick | 18,718 | 1,423,691 | ||||||
| Molson Coors Beverage, Cl B | 12,150 | 695,709 | ||||||
| Mondelez International, Cl A | 89,650 | 6,449,421 | ||||||
| Monster Beverage * | 49,188 | 2,629,099 | ||||||
| PepsiCo | 93,349 | 16,421,023 | ||||||
| Philip Morris International | 106,140 | 10,076,932 | ||||||
| Procter & Gamble | 157,045 | 25,629,744 | ||||||
| Sysco | 34,263 | 2,546,426 | ||||||
| Target | 32,049 | 5,159,248 | ||||||
| Tyson Foods, Cl A | 19,517 | 1,183,706 | ||||||
| Walgreens Boots Alliance | 47,655 | 844,923 | ||||||
| Walmart | 290,522 | 17,242,481 | ||||||
| 176,096,560 | ||||||||
| Energy — 4.2% | ||||||||
| APA | 20,595 | 647,507 | ||||||
| Baker Hughes, Cl A | 71,102 | 2,319,347 | ||||||
| Chevron | 117,603 | 18,965,836 | ||||||
| ConocoPhillips | 78,265 | 9,831,649 | ||||||
| Coterra Energy | 50,089 | 1,370,435 | ||||||
| Devon Energy | 41,346 | 2,116,088 | ||||||
| Diamondback Energy | 11,968 | 2,407,124 | ||||||
| EOG Resources | 40,438 | 5,343,073 | ||||||
| EQT | 27,171 | 1,089,285 | ||||||
| Exxon Mobil | 268,285 | 31,730,067 | ||||||
| Halliburton | 59,237 | 2,219,610 | ||||||
The accompanying notes are an integral part of the financial statements.
4
![]()
| Schedule of Investments | April 30, 2024 (Unaudited) | |
| Global X S&P 500® Covered Call ETF | ||
| Shares | Value | |||||||
| COMMON STOCK — continued | ||||||||
| Energy — continued | ||||||||
| Hess | 18,812 | $ | 2,962,702 | |||||
| Kinder Morgan | 136,236 | 2,490,394 | ||||||
| Marathon Oil | 38,958 | 1,046,022 | ||||||
| Marathon Petroleum | 24,491 | 4,450,505 | ||||||
| Occidental Petroleum | 43,036 | 2,846,401 | ||||||
| ONEOK | 39,663 | 3,138,137 | ||||||
| Phillips 66 | 28,634 | 4,100,675 | ||||||
| Pioneer Natural Resources | 16,082 | 4,331,204 | ||||||
| Schlumberger | 92,762 | 4,404,340 | ||||||
| Targa Resources | 13,715 | 1,564,333 | ||||||
| Valero Energy | 23,323 | 3,728,648 | ||||||
| Williams | 80,990 | 3,106,777 | ||||||
| 116,210,159 | ||||||||
| Financials — 13.3% | ||||||||
| Aflac | 33,814 | 2,828,541 | ||||||
| Allstate | 18,322 | 3,115,839 | ||||||
| American Express | 37,947 | 8,880,736 | ||||||
| American International Group | 44,988 | 3,388,046 | ||||||
| Ameriprise Financial | 6,418 | 2,642,868 | ||||||
| Aon PLC, Cl A | 13,415 | 3,783,164 | ||||||
| Arch Capital Group * | 23,842 | 2,230,181 | ||||||
| Arthur J Gallagher | 13,864 | 3,253,742 | ||||||
| Assurant | 3,076 | 536,454 | ||||||
| Bank of America | 467,274 | 17,293,811 | ||||||
| Bank of New York Mellon | 48,901 | 2,762,417 | ||||||
| Berkshire Hathaway, Cl B * | 122,714 | 48,684,325 | ||||||
| BlackRock, Cl A | 9,637 | 7,272,466 | ||||||
| Blackstone | 47,600 | 5,550,636 | ||||||
| Brown & Brown | 15,735 | 1,283,032 | ||||||
| Capital One Financial | 26,118 | 3,746,105 | ||||||
| Cboe Global Markets | 7,247 | 1,312,794 | ||||||
| Charles Schwab | 99,097 | 7,328,223 | ||||||
| Chubb | 26,770 | 6,656,093 | ||||||
| Cincinnati Financial | 10,424 | 1,205,953 | ||||||
| Citigroup | 126,721 | 7,771,799 | ||||||
| Citizens Financial Group | 31,579 | 1,077,160 | ||||||
| CME Group, Cl A | 23,428 | 4,911,446 | ||||||
| Comerica | 11,483 | 576,102 | ||||||
The accompanying notes are an integral part of the financial statements.
5
![]()
| Schedule of Investments | April 30, 2024 (Unaudited) | |
| Global X S&P 500® Covered Call ETF | ||
| Shares | Value | |||||||
| COMMON STOCK — continued | ||||||||
| Financials — continued | ||||||||
| Corpay * | 5,117 | $ | 1,546,050 | |||||
| Discover Financial Services | 16,578 | 2,100,930 | ||||||
| Everest Group | 3,165 | 1,159,688 | ||||||
| FactSet Research Systems | 2,776 | 1,157,287 | ||||||
| Fidelity National Information Services | 39,441 | 2,678,833 | ||||||
| Fifth Third Bancorp | 42,891 | 1,563,806 | ||||||
| Fiserv * | 39,254 | 5,992,908 | ||||||
| Franklin Resources | 16,442 | 375,535 | ||||||
| Global Payments | 18,016 | 2,211,824 | ||||||
| Globe Life | 5,698 | 434,017 | ||||||
| Goldman Sachs Group | 22,338 | 9,531,848 | ||||||
| Hartford Financial Services Group | 19,987 | 1,936,540 | ||||||
| Huntington Bancshares | 98,036 | 1,320,545 | ||||||
| Intercontinental Exchange | 37,247 | 4,795,924 | ||||||
| Invesco | 34,662 | 491,161 | ||||||
| Jack Henry & Associates | 4,721 | 768,059 | ||||||
| JPMorgan Chase | 195,194 | 37,426,498 | ||||||
| KeyCorp | 61,686 | 893,830 | ||||||
| Loews | 14,024 | 1,053,904 | ||||||
| M&T Bank | 10,400 | 1,501,656 | ||||||
| MarketAxess Holdings | 2,745 | 549,247 | ||||||
| Marsh & McLennan | 32,752 | 6,531,731 | ||||||
| Mastercard, Cl A | 55,195 | 24,903,984 | ||||||
| MetLife | 39,573 | 2,812,849 | ||||||
| Moody’s | 10,158 | 3,761,812 | ||||||
| Morgan Stanley | 83,015 | 7,541,083 | ||||||
| MSCI, Cl A | 5,260 | 2,450,055 | ||||||
| Nasdaq | 24,715 | 1,479,193 | ||||||
| Northern Trust | 14,152 | 1,165,983 | ||||||
| PayPal Holdings * | 71,367 | 4,847,247 | ||||||
| PNC Financial Services Group | 25,729 | 3,943,227 | ||||||
| Principal Financial Group | 15,807 | 1,250,966 | ||||||
| Progressive | 38,961 | 8,113,628 | ||||||
| Prudential Financial | 24,048 | 2,656,823 | ||||||
| Raymond James Financial | 11,667 | 1,423,374 | ||||||
| Regions Financial | 63,425 | 1,222,200 | ||||||
| S&P Global | 21,370 | 8,886,287 | ||||||
| State Street | 22,100 | 1,602,029 | ||||||
| Synchrony Financial | 24,083 | 1,059,170 | ||||||
The accompanying notes are an integral part of the financial statements.
6
![]()
| Schedule of Investments | April 30, 2024 (Unaudited) | |
| Global X S&P 500® Covered Call ETF | ||
| Shares | Value | |||||||
| COMMON STOCK — continued | ||||||||
| Financials — continued | ||||||||
| T Rowe Price Group | 14,865 | $ | 1,628,758 | |||||
| Travelers | 14,635 | 3,104,962 | ||||||
| Truist Financial | 88,799 | 3,334,402 | ||||||
| US Bancorp | 100,848 | 4,097,454 | ||||||
| Visa, Cl A | 106,926 | 28,721,393 | ||||||
| W R Berkley | 13,696 | 1,054,181 | ||||||
| Wells Fargo | 240,594 | 14,272,036 | ||||||
| Willis Towers Watson | 6,870 | 1,725,332 | ||||||
| 371,172,182 | ||||||||
| Health Care — 12.5% | ||||||||
| Abbott Laboratories | 118,233 | 12,529,151 | ||||||
| AbbVie | 119,671 | 19,463,291 | ||||||
| Agilent Technologies | 18,543 | 2,541,133 | ||||||
| Align Technology * | 4,317 | 1,219,035 | ||||||
| Amgen | 35,356 | 9,685,423 | ||||||
| Baxter International | 30,493 | 1,231,002 | ||||||
| Becton Dickinson | 18,852 | 4,422,679 | ||||||
| Biogen * | 9,887 | 2,123,925 | ||||||
| Bio-Rad Laboratories, Cl A * | 1,574 | 424,587 | ||||||
| Bio-Techne | 9,781 | 618,257 | ||||||
| Boston Scientific * | 99,270 | 7,134,535 | ||||||
| Bristol-Myers Squibb | 133,445 | 5,863,573 | ||||||
| Cardinal Health | 16,455 | 1,695,523 | ||||||
| Catalent * | 11,399 | 636,634 | ||||||
| Cencora | 11,626 | 2,779,195 | ||||||
| Centene * | 34,964 | 2,554,470 | ||||||
| Charles River Laboratories International * | 3,592 | 822,568 | ||||||
| Cigna Group | 19,194 | 6,853,026 | ||||||
| Cooper | 14,458 | 1,287,630 | ||||||
| CVS Health | 83,793 | 5,673,624 | ||||||
| Danaher | 44,927 | 11,079,897 | ||||||
| DaVita * | 3,575 | 496,961 | ||||||
| Dexcom * | 25,661 | 3,268,955 | ||||||
| Edwards Lifesciences * | 38,983 | 3,300,691 | ||||||
| Elevance Health | 16,117 | 8,519,124 | ||||||
| Eli Lilly | 53,809 | 42,030,210 | ||||||
| GE HealthCare Technologies | 27,790 | 2,118,710 | ||||||
| Gilead Sciences | 82,961 | 5,409,057 | ||||||
The accompanying notes are an integral part of the financial statements.
7
![]()
| Schedule of Investments | April 30, 2024 (Unaudited) | |
| Global X S&P 500® Covered Call ETF | ||
| Shares | Value | |||||||
| COMMON STOCK — continued | ||||||||
| Health Care — continued | ||||||||
| HCA Healthcare | 13,625 | $ | 4,221,298 | |||||
| Henry Schein * | 7,909 | 547,936 | ||||||
| Hologic * | 14,442 | 1,094,270 | ||||||
| Humana | 8,147 | 2,461,127 | ||||||
| IDEXX Laboratories * | 5,525 | 2,722,499 | ||||||
| Illumina * | 9,889 | 1,216,841 | ||||||
| Incyte * | 12,380 | 644,379 | ||||||
| Insulet * | 5,330 | 916,440 | ||||||
| Intuitive Surgical * | 24,152 | 8,951,214 | ||||||
| IQVIA Holdings * | 12,477 | 2,891,794 | ||||||
| Johnson & Johnson | 162,932 | 23,558,338 | ||||||
| Laboratory Corp of America Holdings | 5,522 | 1,111,965 | ||||||
| McKesson | 9,005 | 4,837,576 | ||||||
| Medtronic PLC | 87,478 | 7,019,235 | ||||||
| Merck | 171,655 | 22,181,259 | ||||||
| Mettler-Toledo International * | 1,472 | 1,810,118 | ||||||
| Moderna * | 22,309 | 2,460,906 | ||||||
| Molina Healthcare * | 3,564 | 1,219,244 | ||||||
| Pfizer | 373,179 | 9,560,846 | ||||||
| Quest Diagnostics | 7,617 | 1,052,517 | ||||||
| Regeneron Pharmaceuticals * | 7,034 | 6,264,902 | ||||||
| ResMed | 9,239 | 1,977,054 | ||||||
| Revvity | 8,477 | 868,638 | ||||||
| Solventum * | 8,861 | 576,054 | ||||||
| STERIS | 6,127 | 1,253,339 | ||||||
| Stryker | 22,521 | 7,578,317 | ||||||
| Teleflex | 3,243 | 676,976 | ||||||
| Thermo Fisher Scientific | 26,263 | 14,936,293 | ||||||
| UnitedHealth Group | 62,492 | 30,227,380 | ||||||
| Universal Health Services, Cl B | 3,815 | 650,190 | ||||||
| Vertex Pharmaceuticals * | 17,170 | 6,744,548 | ||||||
| Viatris | 79,130 | 915,534 | ||||||
| Waters * | 3,926 | 1,213,291 | ||||||
| West Pharmaceutical Services | 5,071 | 1,812,781 | ||||||
| Zimmer Biomet Holdings | 13,272 | 1,596,356 | ||||||
| Zoetis, Cl A | 31,104 | 4,953,001 | ||||||
| 348,507,322 | ||||||||
The accompanying notes are an integral part of the financial statements.
8
![]()
| Schedule of Investments | April 30, 2024 (Unaudited) | |
| Global X S&P 500® Covered Call ETF | ||
| Shares | Value | |||||||
| COMMON STOCK — continued | ||||||||
| Industrials — 8.9% | ||||||||
| 3M | 35,420 | $ | 3,418,384 | |||||
| A O Smith | 8,111 | 671,915 | ||||||
| Allegion | 5,841 | 710,032 | ||||||
| American Airlines Group * | 41,908 | 566,177 | ||||||
| AMETEK | 15,726 | 2,746,703 | ||||||
| Automatic Data Processing | 27,350 | 6,615,692 | ||||||
| Axon Enterprise * | 4,683 | 1,468,870 | ||||||
| Boeing * | 37,951 | 6,369,696 | ||||||
| Broadridge Financial Solutions | 8,209 | 1,587,703 | ||||||
| Builders FirstSource * | 8,139 | 1,487,972 | ||||||
| Carrier Global | 57,597 | 3,541,640 | ||||||
| Caterpillar | 33,746 | 11,290,399 | ||||||
| CH Robinson Worldwide | 9,580 | 680,180 | ||||||
| Cintas | 5,574 | 3,669,587 | ||||||
| Copart * | 57,779 | 3,137,978 | ||||||
| CSX | 131,576 | 4,370,955 | ||||||
| Cummins | 9,649 | 2,725,746 | ||||||
| Dayforce * | 9,999 | 613,639 | ||||||
| Deere | 17,547 | 6,868,071 | ||||||
| Delta Air Lines | 43,140 | 2,160,020 | ||||||
| Dover | 9,267 | 1,661,573 | ||||||
| Eaton | 26,582 | 8,459,987 | ||||||
| Emerson Electric | 39,986 | 4,309,691 | ||||||
| Equifax | 7,992 | 1,759,759 | ||||||
| Expeditors International of Washington | 9,514 | 1,059,003 | ||||||
| Fastenal | 38,113 | 2,589,397 | ||||||
| FedEx | 15,313 | 4,008,637 | ||||||
| Fortive | 22,209 | 1,671,671 | ||||||
| GE Vernova * | 17,976 | 2,763,091 | ||||||
| Generac Holdings * | 5,276 | 717,325 | ||||||
| General Dynamics | 15,849 | 4,550,089 | ||||||
| General Electric | 74,293 | 12,022,093 | ||||||
| Honeywell International | 45,189 | 8,709,276 | ||||||
| Howmet Aerospace | 25,722 | 1,716,944 | ||||||
| Hubbell, Cl B | 3,898 | 1,444,287 | ||||||
| Huntington Ingalls Industries | 2,522 | 698,418 | ||||||
| IDEX | 5,029 | 1,108,693 | ||||||
| Illinois Tool Works | 17,793 | 4,343,449 | ||||||
| Ingersoll Rand | 27,269 | 2,544,743 | ||||||
The accompanying notes are an integral part of the financial statements.
9
![]()
| Schedule of Investments | April 30, 2024 (Unaudited) | |
| Global X S&P 500® Covered Call ETF | ||
| Shares | Value | |||||||
| COMMON STOCK — continued | ||||||||
| Industrials — continued | ||||||||
| Jacobs Solutions | 8,371 | $ | 1,201,490 | |||||
| JB Hunt Transport Services | 5,552 | 902,589 | ||||||
| Johnson Controls International | 45,348 | 2,950,794 | ||||||
| L3Harris Technologies | 13,298 | 2,846,437 | ||||||
| Leidos Holdings | 9,214 | 1,291,987 | ||||||
| Lockheed Martin | 14,452 | 6,719,168 | ||||||
| Masco | 14,635 | 1,001,766 | ||||||
| Nordson | 4,082 | 1,053,932 | ||||||
| Norfolk Southern | 14,577 | 3,357,375 | ||||||
| Northrop Grumman | 9,399 | 4,558,797 | ||||||
| Old Dominion Freight Line | 12,578 | 2,285,548 | ||||||
| Otis Worldwide | 26,994 | 2,461,853 | ||||||
| PACCAR | 35,947 | 3,814,336 | ||||||
| Parker-Hannifin | 8,326 | 4,536,921 | ||||||
| Paychex | 21,324 | 2,533,504 | ||||||
| Paycom Software | 3,843 | 722,407 | ||||||
| Pentair | 10,677 | 844,444 | ||||||
| Quanta Services | 10,091 | 2,609,129 | ||||||
| Republic Services, Cl A | 13,835 | 2,652,170 | ||||||
| Robert Half | 6,849 | 473,540 | ||||||
| Rockwell Automation | 7,790 | 2,110,778 | ||||||
| Rollins | 15,797 | 703,914 | ||||||
| RTX | 88,337 | 8,967,972 | ||||||
| Snap-On | 3,502 | 938,396 | ||||||
| Southwest Airlines | 40,124 | 1,040,817 | ||||||
| Stanley Black & Decker | 11,207 | 1,024,320 | ||||||
| Textron | 13,048 | 1,103,730 | ||||||
| Trane Technologies | 14,769 | 4,686,794 | ||||||
| TransDigm Group | 3,807 | 4,751,250 | ||||||
| Uber Technologies * | 136,094 | 9,018,949 | ||||||
| Union Pacific | 40,274 | 9,551,382 | ||||||
| United Airlines Holdings * | 22,891 | 1,177,971 | ||||||
| United Parcel Service, Cl B | 47,498 | 7,005,005 | ||||||
| United Rentals | 4,424 | 2,955,188 | ||||||
| Veralto | 14,603 | 1,368,009 | ||||||
| Verisk Analytics, Cl A | 9,870 | 2,151,265 | ||||||
| Waste Management | 23,848 | 4,960,861 | ||||||
| Westinghouse Air Brake Technologies | 10,937 | 1,761,732 | ||||||
| WW Grainger | 3,048 | 2,808,275 | ||||||
The accompanying notes are an integral part of the financial statements.
10
![]()
| Schedule of Investments | April 30, 2024 (Unaudited) | |
| Global X S&P 500® Covered Call ETF | ||
| Shares | Value | |||||||
| COMMON STOCK — continued | ||||||||
| Industrials — continued | ||||||||
| Xylem | 16,166 | $ | 2,112,896 | |||||
| 249,857,176 | ||||||||
| Information Technology — 29.5% | ||||||||
| Accenture, Cl A | 41,673 | 12,539,822 | ||||||
| Adobe * | 30,240 | 13,995,979 | ||||||
| Advanced Micro Devices * | 109,710 | 17,375,870 | ||||||
| Akamai Technologies * | 10,054 | 1,014,750 | ||||||
| Amphenol, Cl A | 41,832 | 5,052,051 | ||||||
| Analog Devices | 32,640 | 6,547,910 | ||||||
| ANSYS * | 5,776 | 1,876,507 | ||||||
| Apple | 976,559 | 166,337,294 | ||||||
| Applied Materials | 55,348 | 10,994,880 | ||||||
| Arista Networks * | 16,880 | 4,330,733 | ||||||
| Autodesk * | 13,765 | 2,929,880 | ||||||
| Broadcom | 29,722 | 38,646,625 | ||||||
| Cadence Design Systems * | 17,751 | 4,892,708 | ||||||
| CDW | 9,472 | 2,290,898 | ||||||
| Cisco Systems | 276,577 | 12,993,587 | ||||||
| Cognizant Technology Solutions, Cl A | 33,153 | 2,177,489 | ||||||
| Corning | 50,866 | 1,697,907 | ||||||
| Enphase Energy * | 8,883 | 966,115 | ||||||
| EPAM Systems * | 3,831 | 901,281 | ||||||
| F5 * | 3,651 | 603,547 | ||||||
| Fair Isaac * | 1,684 | 1,908,528 | ||||||
| First Solar * | 7,524 | 1,326,481 | ||||||
| Fortinet * | 40,605 | 2,565,424 | ||||||
| Gartner * | 5,485 | 2,263,056 | ||||||
| Gen Digital | 41,601 | 837,844 | ||||||
| Hewlett Packard Enterprise | 86,570 | 1,471,690 | ||||||
| HP | 54,896 | 1,542,029 | ||||||
| Intel | 288,994 | 8,805,647 | ||||||
| International Business Machines | 62,412 | 10,372,874 | ||||||
| Intuit | 18,574 | 11,620,266 | ||||||
| Jabil | 8,322 | 976,670 | ||||||
| Juniper Networks | 20,540 | 715,203 | ||||||
| Keysight Technologies * | 11,622 | 1,719,359 | ||||||
| KLA | 9,012 | 6,211,882 | ||||||
| Lam Research | 8,669 | 7,753,640 | ||||||
The accompanying notes are an integral part of the financial statements.
11
![]()
| Schedule of Investments | April 30, 2024 (Unaudited) | |
| Global X S&P 500® Covered Call ETF | ||
| Shares | Value | |||||||
| COMMON STOCK — continued | ||||||||
| Information Technology — continued | ||||||||
| Microchip Technology | 34,488 | $ | 3,172,206 | |||||
| Micron Technology | 74,601 | 8,426,929 | ||||||
| Microsoft | 499,807 | 194,589,859 | ||||||
| Monolithic Power Systems | 2,998 | 2,006,651 | ||||||
| Motorola Solutions | 10,685 | 3,623,818 | ||||||
| NetApp | 12,742 | 1,302,360 | ||||||
| NVIDIA | 166,201 | 143,600,988 | ||||||
| ON Semiconductor * | 29,299 | 2,055,618 | ||||||
| Oracle | 108,623 | 12,355,866 | ||||||
| Palo Alto Networks * | 20,857 | 6,067,093 | ||||||
| PTC * | 7,964 | 1,413,132 | ||||||
| Qorvo * | 6,427 | 750,931 | ||||||
| QUALCOMM | 76,053 | 12,613,390 | ||||||
| Roper Technologies | 6,894 | 3,526,005 | ||||||
| Salesforce | 64,702 | 17,400,956 | ||||||
| Seagate Technology Holdings | 12,543 | 1,077,569 | ||||||
| ServiceNow * | 13,552 | 9,396,008 | ||||||
| Skyworks Solutions | 10,657 | 1,135,930 | ||||||
| Super Micro Computer * | 3,252 | 2,792,818 | ||||||
| Synopsys * | 10,167 | 5,394,509 | ||||||
| TE Connectivity | 19,818 | 2,803,851 | ||||||
| Teledyne Technologies * | 2,865 | 1,092,940 | ||||||
| Teradyne | 10,191 | 1,185,417 | ||||||
| Texas Instruments | 62,140 | 10,962,739 | ||||||
| Trimble * | 15,680 | 941,898 | ||||||
| Tyler Technologies * | 2,771 | 1,278,955 | ||||||
| VeriSign * | 5,392 | 913,836 | ||||||
| Western Digital * | 21,595 | 1,529,574 | ||||||
| Zebra Technologies, Cl A * | 3,895 | 1,225,211 | ||||||
| 822,893,483 | ||||||||
| Materials — 2.4% | ||||||||
| Air Products & Chemicals | 14,242 | 3,365,954 | ||||||
| Albemarle | 7,635 | 918,567 | ||||||
| Amcor | 98,568 | 881,198 | ||||||
| Avery Dennison | 5,948 | 1,292,382 | ||||||
| Ball | 20,465 | 1,423,750 | ||||||
| Celanese, Cl A | 6,679 | 1,025,961 | ||||||
| CF Industries Holdings | 13,010 | 1,027,400 | ||||||
The accompanying notes are an integral part of the financial statements.
12
![]()
| Schedule of Investments | April 30, 2024 (Unaudited) | |
| Global X S&P 500® Covered Call ETF | ||
| Shares | Value | |||||||
| COMMON STOCK — continued | ||||||||
| Materials — continued | ||||||||
| Corteva | 46,720 | $ | 2,528,954 | |||||
| Dow | 47,708 | 2,714,585 | ||||||
| DuPont de Nemours | 27,999 | 2,029,928 | ||||||
| Eastman Chemical | 7,813 | 737,860 | ||||||
| Ecolab | 17,335 | 3,920,310 | ||||||
| FMC | 8,312 | 490,491 | ||||||
| Freeport-McMoRan | 99,743 | 4,981,166 | ||||||
| International Flavors & Fragrances | 15,304 | 1,295,484 | ||||||
| International Paper | 22,798 | 796,562 | ||||||
| Linde PLC | 32,950 | 14,529,632 | ||||||
| LyondellBasell Industries, Cl A | 15,666 | 1,566,130 | ||||||
| Martin Marietta Materials | 3,888 | 2,282,528 | ||||||
| Mosaic | 22,088 | 693,342 | ||||||
| Newmont | 76,738 | 3,118,632 | ||||||
| Nucor | 15,689 | 2,644,067 | ||||||
| Packaging Corp of America | 6,698 | 1,158,620 | ||||||
| PPG Industries | 14,771 | 1,905,459 | ||||||
| Sherwin-Williams | 15,830 | 4,742,826 | ||||||
| Steel Dynamics | 9,849 | 1,281,552 | ||||||
| Vulcan Materials | 8,975 | 2,312,229 | ||||||
| Westrock | 16,146 | 774,362 | ||||||
| 66,439,931 | ||||||||
| Real Estate — 2.2% | ||||||||
| Alexandria Real Estate Equities ‡ | 11,634 | 1,348,032 | ||||||
| American Tower ‡ | 31,050 | 5,326,938 | ||||||
| AvalonBay Communities ‡ | 9,539 | 1,808,308 | ||||||
| Boston Properties ‡ | 10,680 | 660,985 | ||||||
| Camden Property Trust ‡ | 5,746 | 572,761 | ||||||
| CBRE Group, Cl A * | 20,434 | 1,775,510 | ||||||
| CoStar Group * | 27,188 | 2,488,518 | ||||||
| Crown Castle ‡ | 27,734 | 2,600,895 | ||||||
| Digital Realty Trust ‡ | 20,003 | 2,776,016 | ||||||
| Equinix ‡ | 6,126 | 4,356,260 | ||||||
| Equity Residential ‡ | 23,629 | 1,521,708 | ||||||
| Essex Property Trust ‡ | 4,876 | 1,200,715 | ||||||
| Extra Space Storage ‡ | 14,277 | 1,917,116 | ||||||
| Federal Realty Investment Trust ‡ | 4,191 | 436,576 | ||||||
| Healthpeak Properties ‡ | 45,211 | 841,377 | ||||||
The accompanying notes are an integral part of the financial statements.
13
![]()
| Schedule of Investments | April 30, 2024 (Unaudited) | |
| Global X S&P 500® Covered Call ETF | ||
| Shares | Value | |||||||
| COMMON STOCK — continued | ||||||||
| Real Estate — continued | ||||||||
| Host Hotels & Resorts ‡ | 53,314 | $ | 1,006,035 | |||||
| Invitation Homes ‡ | 35,175 | 1,202,985 | ||||||
| Iron Mountain ‡ | 19,437 | 1,506,756 | ||||||
| Kimco Realty ‡ | 41,063 | 765,004 | ||||||
| Mid-America Apartment Communities ‡ | 7,510 | 976,300 | ||||||
| ProLogis ‡ | 60,845 | 6,209,232 | ||||||
| Public Storage ‡ | 10,525 | 2,730,711 | ||||||
| Realty Income ‡ | 55,376 | 2,964,831 | ||||||
| Regency Centers ‡ | 13,304 | 787,863 | ||||||
| SBA Communications, Cl A ‡ | 7,727 | 1,438,149 | ||||||
| Simon Property Group ‡ | 20,891 | 2,935,812 | ||||||
| UDR ‡ | 19,692 | 749,871 | ||||||
| Ventas ‡ | 27,524 | 1,218,763 | ||||||
| VICI Properties, Cl A ‡ | 67,274 | 1,920,673 | ||||||
| Welltower ‡ | 37,785 | 3,600,155 | ||||||
| Weyerhaeuser ‡ | 48,577 | 1,465,568 | ||||||
| 61,110,423 | ||||||||
| Utilities — 2.4% | ||||||||
| AES | 42,023 | 752,212 | ||||||
| Alliant Energy | 15,954 | 794,509 | ||||||
| Ameren | 17,496 | 1,292,429 | ||||||
| American Electric Power | 36,472 | 3,137,686 | ||||||
| American Water Works | 12,986 | 1,588,447 | ||||||
| Atmos Energy | 11,102 | 1,308,926 | ||||||
| CenterPoint Energy | 42,030 | 1,224,754 | ||||||
| CMS Energy | 19,601 | 1,188,017 | ||||||
| Consolidated Edison | 24,179 | 2,282,498 | ||||||
| Constellation Energy | 21,066 | 3,917,012 | ||||||
| Dominion Energy | 55,717 | 2,840,453 | ||||||
| DTE Energy | 14,253 | 1,572,391 | ||||||
| Duke Energy | 51,345 | 5,045,160 | ||||||
| Edison International | 25,617 | 1,820,344 | ||||||
| Entergy | 14,917 | 1,591,196 | ||||||
| Evergy | 17,486 | 917,141 | ||||||
| Eversource Energy | 20,927 | 1,268,595 | ||||||
| Exelon | 66,251 | 2,489,713 | ||||||
| FirstEnergy | 34,385 | 1,318,321 | ||||||
| NextEra Energy | 136,601 | 9,148,169 | ||||||
The accompanying notes are an integral part of the financial statements.
14
![]()
| Schedule of Investments | April 30, 2024 (Unaudited) | |
| Global X S&P 500® Covered Call ETF | ||
| Shares | Value | |||||||
| COMMON STOCK — continued | ||||||||
| Utilities — continued | ||||||||
| NiSource | 27,118 | $ | 755,507 | |||||
| NRG Energy | 14,427 | 1,048,410 | ||||||
| PG&E | 142,025 | 2,430,048 | ||||||
| Pinnacle West Capital | 6,641 | 489,110 | ||||||
| PPL | 51,403 | 1,411,526 | ||||||
| Public Service Enterprise Group | 35,055 | 2,421,599 | ||||||
| Sempra | 41,903 | 3,001,512 | ||||||
| Southern | 72,628 | 5,338,158 | ||||||
| WEC Energy Group | 21,083 | 1,742,299 | ||||||
| Xcel Energy | 38,584 | 2,073,118 | ||||||
| 66,209,260 | ||||||||
| TOTAL UNITED STATES | 2,830,952,753 | |||||||
| TOTAL COMMON STOCK (Cost $2,241,081,989) | 2,835,215,498 | |||||||
| TOTAL INVESTMENTS — 101.7% (Cost $2,241,081,989) | $ | 2,835,215,498 | ||||||
| WRITTEN OPTIONS— (1.8)% (Premiums Received $(48,030,031)) | $ | (50,895,200 | ) | |||||
Percentages are based on Net Assets of $2,787,818,336.
A list of the exchange traded option contracts held by the Fund at April 30, 2024, is as follows:
| Description | Number of Contracts | Notional Amount | Exercise Price | Expiration Date | Value | |||||||||||||||
| WRITTEN OPTIONS — (1.8)% | ||||||||||||||||||||
| Call Options | ||||||||||||||||||||
| S&P 500 Index | (5,630 | ) | $ | (2,835,093,470 | ) | $ | 5,005 | 05/17/24 | $ | (50,895,200 | ) | |||||||||
| * | Non-income producing security. |
| ‡ | Real Estate Investment Trust |
The accompanying notes are an integral part of the financial statements.
15
![]()
| Schedule of Investments | April 30, 2024 (Unaudited) | |
| Global X S&P 500® Covered Call ETF | ||
The following is a summary of the level of inputs used as of April 30, 2024, in valuing the Fund’s investments and other financial instruments carried at value:
| Investments in Securities | Level 1 | Level 2 | Level 3 | Total | ||||||||||||
| Common Stock | $ | 2,835,215,498 | $ | — | $ | — | $ | 2,835,215,498 | ||||||||
| Total Investments in Securities | $ | 2,835,215,498 | $ | — | $ | — | $ | 2,835,215,498 | ||||||||
| Other Financial Instruments | Level 1 | Level 2 | Level 3 | Total | ||||||||||||
| Written Options | $ | (50,895,200 | ) | $ | — | $ | — | $ | (50,895,200 | ) | ||||||
| Total Other Financial Instruments | $ | (50,895,200 | ) | $ | — | $ | — | $ | (50,895,200 | ) | ||||||
See “Glossary” for abbreviations.
The accompanying notes are an integral part of the financial statements.
16
![]()
| Schedule of Investments | April 30, 2024 (Unaudited) |
Global X NASDAQ 100® Covered Call ETF
Sector Weightings †:
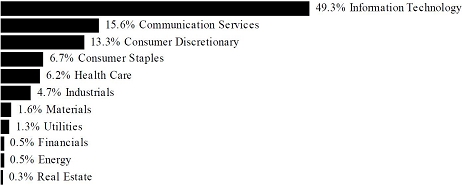
† Sector weightings percentages are based on the total market value of investments. Total investments do not include derivatives such as options, futures contracts, forward contracts, and swap contracts, if applicable.
| Shares | Value | |||||||
| COMMON STOCK — 102.5% | ||||||||
| BRAZIL — 0.6% | ||||||||
| Consumer Discretionary — 0.6% | ||||||||
| MercadoLibre * | 31,326 | $ | 45,695,236 | |||||
| CHINA — 1.1% | ||||||||
| Consumer Discretionary — 0.6% | ||||||||
| PDD Holdings ADR * | 412,335 | 51,616,096 | ||||||
| Information Technology — 0.5% | ||||||||
| NXP Semiconductors | 158,280 | 40,549,753 | ||||||
| TOTAL CHINA | 92,165,849 | |||||||
| NETHERLANDS — 0.6% | ||||||||
| Information Technology — 0.6% | ||||||||
| ASML Holding, Cl G | 53,302 | 46,504,396 | ||||||
| UNITED KINGDOM — 0.6% | ||||||||
| Consumer Staples — 0.3% | ||||||||
| Coca-Cola Europacific Partners | 277,255 | 19,967,905 | ||||||
The accompanying notes are an integral part of the financial statements.
17
![]()
| Schedule of Investments | April 30, 2024 (Unaudited) |
Global X NASDAQ 100® Covered Call ETF
| Shares | Value | |||||||
| COMMON STOCK — continued | ||||||||
| Health Care — 0.3% | ||||||||
| AstraZeneca ADR | 359,490 | $ | 27,278,101 | |||||
| TOTAL UNITED KINGDOM | 47,246,006 | |||||||
| UNITED STATES — 99.6% | ||||||||
| Communication Services — 16.0% | ||||||||
| Alphabet, Cl A * | 1,408,520 | 229,278,886 | ||||||
| Alphabet, Cl C * | 1,355,474 | 223,165,239 | ||||||
| Charter Communications, Cl A * | 89,657 | 22,946,813 | ||||||
| Comcast, Cl A | 2,446,191 | 93,224,339 | ||||||
| Electronic Arts | 162,660 | 20,628,541 | ||||||
| Meta Platforms, Cl A | 836,528 | 359,849,250 | ||||||
| Netflix * | 267,173 | 147,116,141 | ||||||
| Sirius XM Holdings | 2,319,423 | 6,819,104 | ||||||
| Take-Two Interactive Software * | 103,213 | 14,739,848 | ||||||
| T-Mobile US | 732,695 | 120,286,538 | ||||||
| Trade Desk, Cl A * | 274,725 | 22,760,966 | ||||||
| Warner Bros Discovery * | 1,477,029 | 10,870,933 | ||||||
| 1,271,686,598 | ||||||||
| Consumer Discretionary — 12.4% | ||||||||
| Airbnb, Cl A * | 270,455 | 42,886,049 | ||||||
| Amazon.com * | 2,482,689 | 434,470,575 | ||||||
| Booking Holdings | 21,053 | 72,675,588 | ||||||
| DoorDash, Cl A * | 232,582 | 30,063,549 | ||||||
| Lululemon Athletica * | 73,908 | 26,651,225 | ||||||
| Marriott International, Cl A | 178,718 | 42,200,681 | ||||||
| O’Reilly Automotive * | 36,464 | 36,947,513 | ||||||
| Ross Stores | 207,878 | 26,930,595 | ||||||
| Starbucks | 698,923 | 61,847,696 | ||||||
| Tesla * | 1,152,189 | 211,173,200 | ||||||
| 985,846,671 | ||||||||
| Consumer Staples — 6.6% | ||||||||
| Costco Wholesale | 273,931 | 198,024,720 | ||||||
| Dollar Tree * | 132,199 | 15,632,532 | ||||||
| Keurig Dr Pepper | 856,636 | 28,868,633 | ||||||
| Kraft Heinz | 748,857 | 28,913,369 | ||||||
| Mondelez International, Cl A | 831,214 | 59,797,535 | ||||||
| Monster Beverage * | 642,419 | 34,337,295 | ||||||
The accompanying notes are an integral part of the financial statements.
18
![]()
| Schedule of Investments | April 30, 2024 (Unaudited) |
Global X NASDAQ 100® Covered Call ETF
| Shares | Value | |||||||
| COMMON STOCK — continued | ||||||||
| Consumer Staples — continued | ||||||||
| PepsiCo | 848,527 | $ | 149,264,385 | |||||
| Walgreens Boots Alliance | 521,611 | 9,248,163 | ||||||
| 524,086,632 | ||||||||
| Energy — 0.5% | ||||||||
| Baker Hughes, Cl A | 617,926 | 20,156,746 | ||||||
| Diamondback Energy | 110,124 | 22,149,240 | ||||||
| 42,305,986 | ||||||||
| Financials — 0.6% | ||||||||
| PayPal Holdings * | 661,583 | 44,934,717 | ||||||
| Health Care — 6.0% | ||||||||
| Amgen | 330,821 | 90,625,105 | ||||||
| Biogen * | 88,278 | 18,963,880 | ||||||
| Dexcom * | 237,974 | 30,315,508 | ||||||
| GE HealthCare Technologies | 281,096 | 21,430,759 | ||||||
| Gilead Sciences | 769,080 | 50,144,016 | ||||||
| IDEXX Laboratories * | 51,283 | 25,270,211 | ||||||
| Illumina * | 96,079 | 11,822,521 | ||||||
| Intuitive Surgical * | 217,526 | 80,619,486 | ||||||
| Moderna * | 235,854 | 26,017,055 | ||||||
| Regeneron Pharmaceuticals * | 66,596 | 59,314,393 | ||||||
| Vertex Pharmaceuticals * | 159,419 | 62,621,377 | ||||||
| 477,144,311 | ||||||||
| Industrials — 4.8% | ||||||||
| Automatic Data Processing | 253,638 | 61,352,496 | ||||||
| Cintas | 62,547 | 41,177,192 | ||||||
| Copart * | 593,548 | 32,235,592 | ||||||
| CSX | 1,209,406 | 40,176,467 | ||||||
| Fastenal | 353,286 | 24,002,251 | ||||||
| Honeywell International | 402,634 | 77,599,651 | ||||||
| Old Dominion Freight Line | 134,384 | 24,418,917 | ||||||
| PACCAR | 323,406 | 34,316,611 | ||||||
| Paychex | 223,013 | 26,496,174 | ||||||
| Verisk Analytics, Cl A | 87,122 | 18,989,111 | ||||||
| 380,764,462 | ||||||||
The accompanying notes are an integral part of the financial statements.
19
![]()
| Schedule of Investments | April 30, 2024 (Unaudited) |
Global X NASDAQ 100® Covered Call ETF
| Shares | Value | |||||||
| COMMON STOCK — continued | ||||||||
| Information Technology — 49.5% | ||||||||
| Adobe * | 279,027 | $ | 129,142,066 | |||||
| Advanced Micro Devices * | 997,502 | 157,984,367 | ||||||
| Analog Devices | 306,170 | 61,420,764 | ||||||
| ANSYS * | 52,689 | 17,117,602 | ||||||
| Apple | 3,690,831 | 628,659,244 | ||||||
| Applied Materials | 512,924 | 101,892,353 | ||||||
| Atlassian, Cl A * | 95,452 | 16,446,380 | ||||||
| Autodesk * | 132,068 | 28,110,674 | ||||||
| Broadcom | 286,064 | 371,960,437 | ||||||
| Cadence Design Systems * | 168,093 | 46,331,474 | ||||||
| CDW | 81,618 | 19,740,129 | ||||||
| Cisco Systems | 2,499,744 | 117,437,973 | ||||||
| Cognizant Technology Solutions, Cl A | 302,674 | 19,879,628 | ||||||
| Crowdstrike Holdings, Cl A * | 140,517 | 41,106,843 | ||||||
| Datadog, Cl A * | 188,850 | 23,700,675 | ||||||
| Fortinet * | 471,020 | 29,759,044 | ||||||
| GLOBALFOUNDRIES * | 332,107 | 16,233,390 | ||||||
| Intel | 2,610,094 | 79,529,564 | ||||||
| Intuit | 172,861 | 108,145,299 | ||||||
| KLA | 83,501 | 57,556,404 | ||||||
| Lam Research | 80,956 | 72,407,856 | ||||||
| Marvell Technology | 533,718 | 35,177,353 | ||||||
| Microchip Technology | 333,575 | 30,682,229 | ||||||
| Micron Technology | 681,493 | 76,981,449 | ||||||
| Microsoft | 1,775,983 | 691,443,461 | ||||||
| MongoDB, Cl A * | 43,782 | 15,988,311 | ||||||
| NVIDIA | 597,526 | 516,274,415 | ||||||
| ON Semiconductor * | 259,603 | 18,213,746 | ||||||
| Palo Alto Networks * | 199,429 | 58,011,902 | ||||||
| QUALCOMM | 688,942 | 114,261,031 | ||||||
| Roper Technologies | 66,028 | 33,770,681 | ||||||
| Synopsys * | 94,165 | 49,963,007 | ||||||
| Texas Instruments | 561,312 | 99,026,663 | ||||||
| Workday, Cl A * | 129,040 | 31,579,959 | ||||||
| Zscaler * | 90,008 | 15,565,984 | ||||||
| 3,931,502,357 | ||||||||
The accompanying notes are an integral part of the financial statements.
20
![]()
| Schedule of Investments | April 30, 2024 (Unaudited) |
Global X NASDAQ 100® Covered Call ETF
| Shares | Value | |||||||
| COMMON STOCK — continued | ||||||||
| Materials — 1.6% | ||||||||
| Linde PLC | 297,340 | $ | 131,115,047 | |||||
| Real Estate — 0.3% | ||||||||
| CoStar Group * | 252,171 | 23,081,212 | ||||||
| Utilities — 1.3% | ||||||||
| American Electric Power | 324,824 | 27,944,609 | ||||||
| Constellation Energy | 195,465 | 36,344,762 | ||||||
| Exelon | 617,007 | 23,187,123 | ||||||
| Xcel Energy | 336,556 | 18,083,154 | ||||||
| 105,559,648 | ||||||||
| TOTAL UNITED STATES | 7,918,027,641 | |||||||
| TOTAL COMMON STOCK (Cost $5,696,253,281) | 8,149,639,128 | |||||||
| TOTAL INVESTMENTS — 102.5% (Cost $5,696,253,281) | $ | 8,149,639,128 | ||||||
| WRITTEN OPTIONS— (2.6)% (Premiums Received $(170,088,337)) | $ | (208,931,840 | ) | |||||
Percentages are based on Net Assets of $7,947,496,867.
A list of the exchange traded option contracts held by the Fund at April 30, 2024, is as follows:
| Description | Number of Contracts | Notional Amount | Exercise Price | Expiration Date | Value | |||||||||||||
| WRITTEN OPTIONS — (2.6)% | ||||||||||||||||||
| Call Options | ||||||||||||||||||
| Nasdaq-100 | (4,672 | ) | $ | (8,148,290,368 | ) | $ | 17,250 | 05/17/24 | $ | (208,931,840 | ) | |||||||
| * | Non-income producing security. |
The accompanying notes are an integral part of the financial statements.
21
![]()
| Schedule of Investments | April 30, 2024 (Unaudited) |
Global X NASDAQ 100® Covered Call ETF
The following is a summary of the level of inputs used as of April 30, 2024, in valuing the Fund’s investments and other financial instruments carried at value:
| Investments in Securities | Level 1 | Level 2 | Level 3 | Total | ||||||||||||
| Common Stock | $ | 8,149,639,128 | $ | — | $ | — | $ | 8,149,639,128 | ||||||||
| Total Investments in Securities | $ | 8,149,639,128 | $ | — | $ | — | $ | 8,149,639,128 | ||||||||
| Other Financial Instruments | Level 1 | Level 2 | Level 3 | Total | ||||||||||||
| Written Options | $ | (208,931,840 | ) | $ | — | $ | — | $ | (208,931,840 | ) | ||||||
| Total Other Financial Instruments | $ | (208,931,840 | ) | $ | — | $ | — | $ | (208,931,840 | ) | ||||||
See “Glossary” for abbreviations.
The accompanying notes are an integral part of the financial statements.
22
![]()
| Schedule of Investments | April 30, 2024 (Unaudited) |
Global X Russell 2000 Covered Call ETF
Sector Weightings †:
† Sector weightings percentages are based on the total market value of investments. Total investments do not include derivatives such as options, futures contracts, forward contracts, and swap contracts, if applicable.
| Shares | Value | |||||||
| COMMON STOCK — 80.9% | ||||||||
| BAHAMAS — 0.0% | ||||||||
| Consumer Discretionary — 0.0% | ||||||||
| OneSpaWorld Holdings * | 37,553 | $ | 477,674 | |||||
| BERMUDA — 0.2% | ||||||||
| Energy — 0.0% | ||||||||
| Teekay * | 49,003 | 358,702 | ||||||
| Financials — 0.2% | ||||||||
| Bank of NT Butterfield & Son | 22,896 | 778,464 | ||||||
| Fidelis Insurance Holdings | 27,400 | 509,092 | ||||||
| Hamilton Insurance Group, Cl B * | 7,546 | 102,475 | ||||||
| SiriusPoint * | 52,035 | 612,972 | ||||||
| 2,003,003 | ||||||||
| Industrials — 0.0% | ||||||||
| Himalaya Shipping | 15,759 | 128,751 | ||||||
| TOTAL BERMUDA | 2,490,456 | |||||||
The accompanying notes are an integral part of the financial statements.
23
![]()
| Schedule of Investments | April 30, 2024 (Unaudited) |
Global X Russell 2000 Covered Call ETF
| Shares | Value | |||||||
| COMMON STOCK — continued | ||||||||
| BRAZIL — 0.2% | ||||||||
| Financials — 0.2% | ||||||||
| Pagseguro Digital, Cl A * | 89,399 | $ | 1,113,017 | |||||
| StoneCo, Cl A * | 132,303 | 2,063,927 | ||||||
| TOTAL BRAZIL | 3,176,944 | |||||||
| CAMEROON — 0.1% | ||||||||
| Energy — 0.1% | ||||||||
| Golar LNG | 45,612 | 1,118,406 | ||||||
| CANADA — 0.2% | ||||||||
| Consumer Staples — 0.0% | ||||||||
| SunOpta * | 40,348 | 264,280 | ||||||
| Energy — 0.1% | ||||||||
| Encore Energy * | 1 | 4 | ||||||
| Teekay Tankers, Cl A | 11,110 | 647,380 | ||||||
| 647,384 | ||||||||
| Financials — 0.0% | ||||||||
| Kingsway Financial Services * | 7,322 | 65,166 | ||||||
| Health Care — 0.0% | ||||||||
| Aurinia Pharmaceuticals * | 60,419 | 307,533 | ||||||
| Fennec Pharmaceuticals * | 10,398 | 95,453 | ||||||
| 402,986 | ||||||||
| Industrials — 0.0% | ||||||||
| Brookfield Business, Cl A | 11,675 | 237,586 | ||||||
| Li-Cycle Holdings * | 1 | 1 | ||||||
| 237,587 | ||||||||
| Materials — 0.0% | ||||||||
| i-80 Gold * | 1 | 1 | ||||||
| NioCorp Developments * | 1 | 2 | ||||||
| Novagold Resources * | 1 | 3 | ||||||
| 6 | ||||||||
The accompanying notes are an integral part of the financial statements.
24
![]()
| Schedule of Investments | April 30, 2024 (Unaudited) |
Global X Russell 2000 Covered Call ETF
| Shares | Value | |||||||
| COMMON STOCK — continued | ||||||||
| Utilities — 0.1% | ||||||||
| Brookfield Infrastructure, Cl A | 54,907 | $ | 1,673,016 | |||||
| TOTAL CANADA | 3,290,425 | |||||||
| CAYMAN ISLANDS — 0.0% | ||||||||
| Consumer Discretionary — 0.0% | ||||||||
| Livewire Group * | 6,872 | 45,974 | ||||||
| Financials — 0.0% | ||||||||
| Patria Investments, Cl A | 25,362 | 339,851 | ||||||
| TOTAL CAYMAN ISLANDS | 385,825 | |||||||
| CHINA — 0.0% | ||||||||
| Information Technology — 0.0% | ||||||||
| Bit Digital * | 1 | 2 | ||||||
| indie Semiconductor, Cl A * | 62,955 | 353,807 | ||||||
| TOTAL CHINA | 353,809 | |||||||
| GERMANY — 0.1% | ||||||||
| Materials — 0.1% | ||||||||
| Orion | 26,461 | 626,067 | ||||||
| GHANA — 0.1% | ||||||||
| Energy — 0.1% | ||||||||
| Kosmos Energy * | 205,527 | 1,165,338 | ||||||
| GIBRALTAR — 0.0% | ||||||||
| Consumer Staples — 0.0% | ||||||||
| Forafric Global * | 4,326 | 44,428 | ||||||
| GUERNSEY — 0.0% | ||||||||
| Consumer Discretionary — 0.0% | ||||||||
| Super Group SGHC * | 1 | 3 | ||||||
The accompanying notes are an integral part of the financial statements.
25
![]()
| Schedule of Investments | April 30, 2024 (Unaudited) |
Global X Russell 2000 Covered Call ETF
| Shares | Value | |||||||
| COMMON STOCK — continued | ||||||||
| IRELAND — 0.1% | ||||||||
| Energy — 0.0% | ||||||||
| Ardmore Shipping | 18,427 | $ | 308,652 | |||||
| Health Care — 0.0% | ||||||||
| Prothena * | 19,349 | 393,559 | ||||||
| Industrials — 0.1% | ||||||||
| Cimpress * | 8,069 | 688,044 | ||||||
| TOTAL IRELAND | 1,390,255 | |||||||
| ISRAEL — 0.1% | ||||||||
| Health Care — 0.0% | ||||||||
| Nano-X Imaging, Cl X * | 22,381 | 200,534 | ||||||
| Information Technology — 0.1% | ||||||||
| Sapiens International | 14,240 | 438,592 | ||||||
| TOTAL ISRAEL | 639,126 | |||||||
| JERSEY — 0.2% | ||||||||
| Materials — 0.2% | ||||||||
| Arcadium Lithium * | 462,795 | 2,036,298 | ||||||
| MALTA — 0.0% | ||||||||
| Communication Services — 0.0% | ||||||||
| Gambling.com Group * | 3,671 | 31,754 | ||||||
| MEXICO — 0.0% | ||||||||
| Energy — 0.0% | ||||||||
| Borr Drilling | 112,613 | 596,849 | ||||||
| MONACO — 0.1% | ||||||||
| Energy — 0.1% | ||||||||
| Scorpio Tankers | 23,640 | 1,663,311 | ||||||
| Industrials — 0.0% | ||||||||
| Costamare | 21,890 | 262,242 | ||||||
The accompanying notes are an integral part of the financial statements.
26
![]()
| Schedule of Investments | April 30, 2024 (Unaudited) |
Global X Russell 2000 Covered Call ETF
| Shares | Value | |||||||
| COMMON STOCK — continued | ||||||||
| Industrials — continued | ||||||||
| Safe Bulkers | 1 | $ | 5 | |||||
| 262,247 | ||||||||
| TOTAL MONACO | 1,925,558 | |||||||
| NORWAY — 0.2% | ||||||||
| Energy — 0.1% | ||||||||
| FLEX LNG | 13,963 | 363,178 | ||||||
| Seadrill * | 22,782 | 1,106,066 | ||||||
| SFL | 49,682 | 662,261 | ||||||
| 2,131,505 | ||||||||
| Industrials — 0.1% | ||||||||
| Golden Ocean Group | 55,409 | 780,713 | ||||||
| TOTAL NORWAY | 2,912,218 | |||||||
| PANAMA — 0.0% | ||||||||
| Financials — 0.0% | ||||||||
| Banco Latinoamericano de Comercio Exterior, Cl E | 12,522 | 355,750 | ||||||
| PUERTO RICO — 0.3% | ||||||||
| Communication Services — 0.1% | ||||||||
| Liberty Latin America, Cl A * | 16,493 | 124,522 | ||||||
| Liberty Latin America, Cl C * | 63,564 | 479,273 | ||||||
| 603,795 | ||||||||
| Financials — 0.2% | ||||||||
| EVERTEC | 30,023 | 1,126,763 | ||||||
| First BanCorp | 83,523 | 1,440,772 | ||||||
| OFG Bancorp | 21,279 | 768,384 | ||||||
| 3,335,919 | ||||||||
| TOTAL PUERTO RICO | 3,939,714 | |||||||
| SINGAPORE — 0.1% | ||||||||
| Communication Services — 0.0% | ||||||||
| Grindr * | 21,848 | 213,892 | ||||||
The accompanying notes are an integral part of the financial statements.
27
![]()
| Schedule of Investments | April 30, 2024 (Unaudited) |
Global X Russell 2000 Covered Call ETF
| Shares | Value | |||||||
| COMMON STOCK — continued | ||||||||
| Information Technology — 0.1% | ||||||||
| Kulicke & Soffa Industries | 25,569 | $ | 1,183,333 | |||||
| TOTAL SINGAPORE | 1,397,225 | |||||||
| SOUTH AFRICA — 0.0% | ||||||||
| Materials — 0.0% | ||||||||
| Caledonia Mining | 8,946 | 87,760 | ||||||
| THAILAND — 0.2% | ||||||||
| Information Technology — 0.2% | ||||||||
| Fabrinet * | 16,735 | 2,896,326 | ||||||
| UNITED KINGDOM — 0.0% | ||||||||
| Health Care — 0.0% | ||||||||
| Zura Bio, Cl A * | 1 | 4 | ||||||
| Industrials — 0.0% | ||||||||
| Luxfer Holdings | 12,150 | 117,005 | ||||||
| TOTAL UNITED KINGDOM | 117,009 | |||||||
| UNITED STATES — 78.7% | ||||||||
| Communication Services — 1.6% | ||||||||
| Advantage Solutions * | 1 | 4 | ||||||
| AMC Networks, Cl A * | 13,913 | 147,756 | ||||||
| Anterix * | 8,236 | 259,599 | ||||||
| AST SpaceMobile, Cl A * | 1 | 2 | ||||||
| Atlanta Braves Holdings, Cl A * | 4,604 | 185,725 | ||||||
| Atlanta Braves Holdings, Cl C * | 21,402 | 801,077 | ||||||
| ATN International | 4,949 | 94,427 | ||||||
| Bandwidth, Cl A * | 10,561 | 192,210 | ||||||
| Boston Omaha, Cl A * | 10,381 | 160,283 | ||||||
| Bumble, Cl A * | 45,130 | 455,813 | ||||||
| Cardlytics * | 18,771 | 229,945 | ||||||
| Cargurus, Cl A * | 49,170 | 1,104,358 | ||||||
| Cars.com * | 29,699 | 496,270 | ||||||
| Chicken Soup For The Soul Entertainment, Cl A * | 1 | — | ||||||
| Cinemark Holdings * | 49,483 | 848,139 | ||||||
| Clear Channel Outdoor Holdings, Cl A * | 1 | 1 | ||||||
The accompanying notes are an integral part of the financial statements.
28
![]()
| Schedule of Investments | April 30, 2024 (Unaudited) |
Global X Russell 2000 Covered Call ETF
| Shares | Value | |||||||
| COMMON STOCK — continued | ||||||||
| Communication Services — continued | ||||||||
| Cogent Communications Holdings | 19,972 | $ | 1,281,803 | |||||
| Consolidated Communications Holdings * | 1 | 4 | ||||||
| DHI Group * | 1 | 2 | ||||||
| EchoStar, Cl A * | 54,851 | 877,068 | ||||||
| Emerald Holding * | 12,101 | 69,581 | ||||||
| Entravision Communications, Cl A | 1 | 2 | ||||||
| Eventbrite, Cl A * | 34,805 | 183,770 | ||||||
| EverQuote, Cl A * | 8,145 | 164,285 | ||||||
| EW Scripps, Cl A * | 24,766 | 93,120 | ||||||
| fuboTV * | 1 | 2 | ||||||
| Gannett * | 1 | 2 | ||||||
| Globalstar * | 1 | 1 | ||||||
| Gogo * | 30,432 | 275,714 | ||||||
| Gray Television | 36,295 | 208,696 | ||||||
| IDT, Cl B | 6,963 | 247,465 | ||||||
| iHeartMedia, Cl A * | 1 | 2 | ||||||
| IMAX * | 21,399 | 342,598 | ||||||
| Integral Ad Science Holding * | 30,568 | 293,147 | ||||||
| John Wiley & Sons, Cl A | 19,509 | 732,953 | ||||||
| Lions Gate Entertainment, Cl A * | 23,892 | 241,070 | ||||||
| Lions Gate Entertainment, Cl B * | 53,047 | 500,233 | ||||||
| Loop Media * | 1 | — | ||||||
| Lumen Technologies * | 1 | 1 | ||||||
| Madison Square Garden Entertainment, Cl A * | 19,661 | 769,728 | ||||||
| Magnite * | 58,167 | 513,615 | ||||||
| Marcus | 10,412 | 135,773 | ||||||
| MediaAlpha, Cl A * | 10,547 | 213,577 | ||||||
| Nextdoor Holdings * | 1 | 2 | ||||||
| Outbrain * | 11,814 | 47,847 | ||||||
| Playstudios * | 1 | 2 | ||||||
| PubMatic, Cl A * | 20,006 | 448,935 | ||||||
| QuinStreet * | 22,452 | 406,157 | ||||||
| Reservoir Media * | 8,401 | 75,189 | ||||||
| Scholastic | 13,744 | 489,561 | ||||||
| Shenandoah Telecommunications | 21,869 | 280,361 | ||||||
| Shutterstock | 11,290 | 482,196 | ||||||
| Sinclair | 19,040 | 234,192 | ||||||
| Sphere Entertainment * | 11,969 | 465,115 | ||||||
| Spok Holdings | 9,495 | 146,698 | ||||||
The accompanying notes are an integral part of the financial statements.
29
![]()
| Schedule of Investments | April 30, 2024 (Unaudited) |
Global X Russell 2000 Covered Call ETF
| Shares | Value | |||||||
| COMMON STOCK — continued | ||||||||
| Communication Services — continued | ||||||||
| Stagwell, Cl A * | 47,748 | $ | 284,101 | |||||
| System1 * | 1 | 2 | ||||||
| TechTarget * | 11,786 | 324,115 | ||||||
| TEGNA | 100,910 | 1,376,412 | ||||||
| Telephone and Data Systems | 44,217 | 691,996 | ||||||
| Thryv Holdings * | 16,815 | 386,913 | ||||||
| Townsquare Media, Cl A | 7,102 | 85,721 | ||||||
| TrueCar * | 1 | 3 | ||||||
| Urban One * | 1 | 2 | ||||||
| Urban One, Cl A * | 1 | 2 | ||||||
| Vimeo * | 59,315 | 212,941 | ||||||
| Vivid Seats, Cl A * | 37,786 | 198,754 | ||||||
| WideOpenWest * | 22,515 | 80,379 | ||||||
| Yelp, Cl A * | 30,617 | 1,232,028 | ||||||
| Ziff Davis * | 21,521 | 1,078,417 | ||||||
| ZipRecruiter, Cl A * | 35,718 | 367,181 | ||||||
| 21,515,043 | ||||||||
| Consumer Discretionary — 8.8% | ||||||||
| 1-800-Flowers.com, Cl A * | 10,860 | 98,500 | ||||||
| 2U * | 1 | — | ||||||
| Aaron’s | 14,220 | 98,260 | ||||||
| Abercrombie & Fitch, Cl A * | 22,970 | 2,791,314 | ||||||
| Academy Sports & Outdoors | 35,457 | 2,067,143 | ||||||
| Accel Entertainment, Cl A * | 24,148 | 259,350 | ||||||
| Acushnet Holdings | 14,665 | 894,272 | ||||||
| Adient * | 43,451 | 1,297,881 | ||||||
| Adtalem Global Education * | 20,529 | 1,018,649 | ||||||
| Allbirds, Cl A * | 1 | 1 | ||||||
| American Axle & Manufacturing Holdings * | 51,046 | 374,678 | ||||||
| American Eagle Outfitters | 82,169 | 1,993,420 | ||||||
| America’s Car-Mart * | 2,799 | 160,215 | ||||||
| AMMO * | 1 | 3 | ||||||
| Arko | 36,905 | 158,691 | ||||||
| Asbury Automotive Group * | 10,218 | 2,148,232 | ||||||
| Bally’s * | 16,695 | 219,372 | ||||||
| BARK * | 1 | 1 | ||||||
| Beazer Homes USA * | 13,176 | 369,323 | ||||||
| Beyond * | 24,953 | 502,304 | ||||||
The accompanying notes are an integral part of the financial statements.
30
![]()
| Schedule of Investments | April 30, 2024 (Unaudited) |
Global X Russell 2000 Covered Call ETF
| Shares | Value | |||||||
| COMMON STOCK — continued | ||||||||
| Consumer Discretionary — continued | ||||||||
| Big 5 Sporting Goods | 9,816 | $ | 34,749 | |||||
| Big Lots | 12,716 | 44,760 | ||||||
| Biglari Holdings, Cl B * | 340 | 67,017 | ||||||
| BJ’s Restaurants * | 10,189 | 332,060 | ||||||
| Bloomin’ Brands | 39,926 | 1,029,692 | ||||||
| Boot Barn Holdings * | 14,016 | 1,492,284 | ||||||
| Bowlero | 17,514 | 205,789 | ||||||
| Brinker International * | 19,747 | 1,058,439 | ||||||
| Buckle | 13,641 | 510,037 | ||||||
| Build-A-Bear Workshop, Cl A | 5,927 | 178,758 | ||||||
| Caleres | 15,728 | 579,262 | ||||||
| Camping World Holdings, Cl A | 19,181 | 388,799 | ||||||
| CarParts.com * | 1 | 1 | ||||||
| Carriage Services, Cl A | 6,416 | 164,121 | ||||||
| Carrols Restaurant Group | 21,103 | 200,901 | ||||||
| Carvana, Cl A * | 46,677 | 3,870,457 | ||||||
| Cato, Cl A | 7,975 | 38,439 | ||||||
| Cavco Industries * | 4,430 | 1,613,450 | ||||||
| Century Casinos * | 1 | 3 | ||||||
| Century Communities | 13,478 | 1,069,075 | ||||||
| Cheesecake Factory | 22,140 | 764,273 | ||||||
| Chegg * | 53,289 | 275,504 | ||||||
| Children’s Place * | 5,914 | 41,161 | ||||||
| Chuy’s Holdings * | 8,607 | 253,562 | ||||||
| Clarus | 11,872 | 75,150 | ||||||
| ContextLogic, Cl A * | 8,000 | 44,400 | ||||||
| Cooper-Standard Holdings * | 23,623 | 364,503 | ||||||
| Coursera * | 57,451 | 587,149 | ||||||
| Cracker Barrel Old Country Store | 9,919 | 577,187 | ||||||
| Cricut, Cl A | 35,325 | 187,929 | ||||||
| Dana | 59,278 | 736,826 | ||||||
| Dave & Buster’s Entertainment * | 19,298 | 1,030,513 | ||||||
| Denny’s * | 25,181 | 201,952 | ||||||
| Designer Brands, Cl A | 25,968 | 241,243 | ||||||
| Destination XL Group * | 24,746 | 79,435 | ||||||
| Dillard’s, Cl A | 2,131 | 933,357 | ||||||
| Dine Brands Global | 6,933 | 305,745 | ||||||
| Dorman Products * | 12,128 | 1,060,594 | ||||||
| Dream Finders Homes, Cl A * | 18,714 | 664,347 | ||||||
The accompanying notes are an integral part of the financial statements.
31
![]()
| Schedule of Investments | April 30, 2024 (Unaudited) |
Global X Russell 2000 Covered Call ETF
| Shares | Value | |||||||
| COMMON STOCK — continued | ||||||||
| Consumer Discretionary — continued | ||||||||
| Duluth Holdings, Cl B * | 5,057 | $ | 21,290 | |||||
| Duolingo, Cl A * | 14,546 | 3,283,759 | ||||||
| El Pollo Loco Holdings * | 12,725 | 108,417 | ||||||
| Envela * | 6,280 | 26,941 | ||||||
| Escalade | 5,929 | 73,875 | ||||||
| Ethan Allen Interiors | 10,537 | 297,565 | ||||||
| European Wax Center, Cl A * | 17,368 | 204,248 | ||||||
| Everi Holdings * | 37,720 | 308,172 | ||||||
| EVgo, Cl A * | 1 | 2 | ||||||
| Figs, Cl A * | 52,803 | 269,823 | ||||||
| First Watch Restaurant Group * | 14,277 | 364,349 | ||||||
| Fisker * | 1 | — | ||||||
| Foot Locker | 38,182 | 796,095 | ||||||
| Fossil Group * | 1 | 1 | ||||||
| Fox Factory Holding * | 19,510 | 759,329 | ||||||
| Frontdoor * | 37,049 | 1,137,034 | ||||||
| Full House Resorts * | 13,575 | 69,232 | ||||||
| Funko, Cl A * | 13,343 | 81,259 | ||||||
| Genesco * | 6,040 | 152,872 | ||||||
| Gentherm * | 15,304 | 773,923 | ||||||
| G-III Apparel Group * | 18,895 | 531,894 | ||||||
| Global Business Travel Group I * | 17,011 | 102,917 | ||||||
| Golden Entertainment | 9,311 | 298,418 | ||||||
| Goodyear Tire & Rubber * | 126,763 | 1,516,085 | ||||||
| GoPro, Cl A * | 1 | 2 | ||||||
| Graham Holdings, Cl B | 1,844 | 1,293,326 | ||||||
| Green Brick Partners * | 12,936 | 700,226 | ||||||
| Group 1 Automotive | 6,960 | 2,046,379 | ||||||
| GrowGeneration * | 1 | 3 | ||||||
| Guess? | 16,627 | 445,271 | ||||||
| Hanesbrands * | 159,701 | 728,237 | ||||||
| Haverty Furniture | 6,949 | 214,029 | ||||||
| Helen of Troy * | 11,671 | 1,082,018 | ||||||
| Hibbett | 5,909 | 509,592 | ||||||
| Hilton Grand Vacations * | 40,711 | 1,695,206 | ||||||
| Holley * | 17,001 | 68,344 | ||||||
| Hooker Furnishings | 6,083 | 103,411 | ||||||
| Hovnanian Enterprises, Cl A * | 2,388 | 353,018 | ||||||
| Inspired Entertainment * | 9,225 | 78,412 | ||||||
The accompanying notes are an integral part of the financial statements.
32
![]()
| Schedule of Investments | April 30, 2024 (Unaudited) |
Global X Russell 2000 Covered Call ETF
| Shares | Value | |||||||
| COMMON STOCK — continued | ||||||||
| Consumer Discretionary — continued | ||||||||
| Installed Building Products | 11,034 | $ | 2,601,045 | |||||
| International Game Technology | 49,393 | 975,018 | ||||||
| iRobot * | 12,568 | 107,582 | ||||||
| J Jill * | 3,083 | 76,828 | ||||||
| Jack in the Box | 9,256 | 528,240 | ||||||
| JAKKS Pacific * | 4,271 | 80,765 | ||||||
| Johnson Outdoors, Cl A | 2,348 | 96,291 | ||||||
| KB Home | 33,714 | 2,183,319 | ||||||
| Kontoor Brands | 26,015 | 1,614,491 | ||||||
| Krispy Kreme | 38,633 | 488,707 | ||||||
| Kura Sushi USA, Cl A * | 5,090 | 560,307 | ||||||
| Lands’ End * | 5,973 | 81,711 | ||||||
| Landsea Homes * | 4,344 | 50,173 | ||||||
| Latham Group * | 1 | 3 | ||||||
| Laureate Education, Cl A | 60,053 | 870,769 | ||||||
| La-Z-Boy, Cl Z | 20,128 | 661,004 | ||||||
| Lazydays Holdings * | 7,630 | 27,010 | ||||||
| LCI Industries | 11,394 | 1,184,748 | ||||||
| Legacy Housing * | 4,723 | 96,208 | ||||||
| Leslie’s * | 80,319 | 315,654 | ||||||
| LGI Homes * | 9,538 | 857,752 | ||||||
| Life Time Group Holdings * | 18,174 | 248,257 | ||||||
| Light & Wonder * | 42,406 | 3,785,160 | ||||||
| Lincoln Educational Services * | 13,861 | 147,758 | ||||||
| Lindblad Expeditions Holdings * | 12,659 | 92,917 | ||||||
| Lovesac * | 6,290 | 139,512 | ||||||
| Luminar Technologies, Cl A * | 1 | 1 | ||||||
| M/I Homes * | 12,118 | 1,408,354 | ||||||
| Malibu Boats, Cl A * | 9,326 | 317,271 | ||||||
| Marine Products | 3,258 | 35,024 | ||||||
| MarineMax * | 9,855 | 243,123 | ||||||
| MasterCraft Boat Holdings * | 8,121 | 164,288 | ||||||
| Meritage Homes | 16,646 | 2,758,908 | ||||||
| Modine Manufacturing * | 26,440 | 2,449,137 | ||||||
| Monarch Casino & Resort | 6,184 | 419,090 | ||||||
| Mondee Holdings, Cl A * | 1 | 2 | ||||||
| Monro | 14,176 | 386,296 | ||||||
| Movado Group | 6,868 | 174,928 | ||||||
| Nathan’s Famous | 1,523 | 98,401 | ||||||
The accompanying notes are an integral part of the financial statements.
33
![]()
| Schedule of Investments | April 30, 2024 (Unaudited) |
Global X Russell 2000 Covered Call ETF
| Shares | Value | |||||||
| COMMON STOCK — continued | ||||||||
| Consumer Discretionary — continued | ||||||||
| National Vision Holdings * | 34,948 | $ | 608,794 | |||||
| Nerdy * | 1 | 3 | ||||||
| Noodles, Cl A * | 1 | 2 | ||||||
| ODP * | 19,146 | 974,723 | ||||||
| ONE Group Hospitality * | 8,858 | 47,479 | ||||||
| OneWater Marine, Cl A * | 5,423 | 112,310 | ||||||
| Oxford Industries | 6,844 | 737,646 | ||||||
| Papa John’s International | 15,639 | 964,770 | ||||||
| Patrick Industries | 9,683 | 1,011,777 | ||||||
| Perdoceo Education | 30,242 | 553,429 | ||||||
| PetMed Express | 8,924 | 35,250 | ||||||
| PlayAGS * | 20,388 | 180,230 | ||||||
| Portillo’s, Cl A * | 19,761 | 242,270 | ||||||
| Potbelly * | 14,278 | 145,493 | ||||||
| Purple Innovation, Cl A | 1 | 2 | ||||||
| Qurate Retail, Cl B * | 3,460 | 13,217 | ||||||
| RCI Hospitality Holdings | 3,926 | 199,284 | ||||||
| Red Robin Gourmet Burgers * | 8,665 | 65,421 | ||||||
| Red Rock Resorts, Cl A | 22,732 | 1,207,524 | ||||||
| Revolve Group, Cl A * | 18,401 | 366,364 | ||||||
| Rocky Brands | 3,095 | 79,758 | ||||||
| Rush Street Interactive * | 29,280 | 187,099 | ||||||
| Sabre * | 1 | 3 | ||||||
| Sally Beauty Holdings * | 46,061 | 499,762 | ||||||
| Savers Value Village * | 11,446 | 189,088 | ||||||
| Shake Shack, Cl A * | 17,606 | 1,863,595 | ||||||
| Shoe Carnival | 8,467 | 283,136 | ||||||
| Signet Jewelers | 21,575 | 2,114,997 | ||||||
| Six Flags Entertainment * | 32,555 | 767,647 | ||||||
| Skyline Champion * | 24,606 | 1,845,204 | ||||||
| Sleep Number * | 9,394 | 125,034 | ||||||
| Smith & Wesson Brands | 20,208 | 342,930 | ||||||
| Snap One Holdings * | 7,602 | 80,429 | ||||||
| Solid Power * | 1 | 2 | ||||||
| Solo Brands, Cl A * | 1 | 2 | ||||||
| Sonic Automotive, Cl A | 9,075 | 524,898 | ||||||
| Sonos * | 57,797 | 976,769 | ||||||
| Sportsman’s Warehouse Holdings * | 17,919 | 57,341 | ||||||
| Standard Motor Products | 10,008 | 321,257 | ||||||
The accompanying notes are an integral part of the financial statements.
34
![]()
| Schedule of Investments | April 30, 2024 (Unaudited) |
Global X Russell 2000 Covered Call ETF
| Shares | Value | |||||||
| COMMON STOCK — continued | ||||||||
| Consumer Discretionary — continued | ||||||||
| Steven Madden | 33,883 | $ | 1,369,212 | |||||
| Stitch Fix, Cl A * | 1 | 2 | ||||||
| Stoneridge * | 11,478 | 171,940 | ||||||
| Strategic Education | 10,155 | 1,166,200 | ||||||
| Stride * | 19,095 | 1,274,591 | ||||||
| Sturm Ruger | 8,839 | 408,627 | ||||||
| Sweetgreen, Cl A * | 48,505 | 1,089,907 | ||||||
| Target Hospitality * | 15,056 | 167,498 | ||||||
| Taylor Morrison Home, Cl A * | 50,113 | 2,806,829 | ||||||
| ThredUp, Cl A * | 1 | 2 | ||||||
| Tile Shop Holdings * | 12,964 | 87,118 | ||||||
| Tilly’s, Cl A * | 9,231 | 56,032 | ||||||
| Topgolf Callaway Brands * | 66,266 | 1,061,581 | ||||||
| Torrid Holdings * | 1 | 5 | ||||||
| Traeger * | 1 | 2 | ||||||
| Tri Pointe Homes * | 45,804 | 1,687,877 | ||||||
| Udemy * | 45,570 | 456,611 | ||||||
| United Homes Group * | 4,691 | 31,336 | ||||||
| United Parks & Resorts * | 20,666 | 1,050,246 | ||||||
| Universal Technical Institute * | 15,024 | 228,665 | ||||||
| Upbound Group, Cl A | 26,432 | 819,656 | ||||||
| Urban Outfitters * | 28,997 | 1,129,723 | ||||||
| Vera Bradley * | 15,044 | 99,140 | ||||||
| Vista Outdoor * | 27,374 | 960,554 | ||||||
| Visteon * | 12,880 | 1,424,914 | ||||||
| Vizio Holding, Cl A * | 34,129 | 361,767 | ||||||
| VOXX International, Cl A * | 8,087 | 47,713 | ||||||
| Warby Parker, Cl A * | 37,732 | 442,974 | ||||||
| Weyco Group | 2,368 | 69,501 | ||||||
| Winmark | 1,459 | 524,248 | ||||||
| Winnebago Industries | 13,733 | 845,678 | ||||||
| Wolverine World Wide | 34,427 | 369,746 | ||||||
| Workhorse Group * | 1 | — | ||||||
| Worthington Enterprises | 13,943 | 796,982 | ||||||
| WW International * | 1 | 2 | ||||||
| XPEL * | 10,703 | 562,443 | ||||||
| Xponential Fitness, Cl A * | 11,122 | 141,806 | ||||||
| Zumiez * | 8,005 | 137,686 | ||||||
| 122,149,311 | ||||||||
The accompanying notes are an integral part of the financial statements.
35
![]()
| Schedule of Investments | April 30, 2024 (Unaudited) |
Global X Russell 2000 Covered Call ETF
| Shares | Value | |||||||
| COMMON STOCK — continued | ||||||||
| Consumer Staples — 2.7% | ||||||||
| Alico | 3,353 | $ | 93,582 | |||||
| Andersons | 14,686 | 806,849 | ||||||
| B&G Foods | 32,279 | 358,297 | ||||||
| Beauty Health * | 1 | 3 | ||||||
| BellRing Brands * | 62,486 | 3,447,353 | ||||||
| Benson Hill * | 1 | — | ||||||
| Beyond Meat * | 26,529 | 179,867 | ||||||
| BRC, Cl A * | 1 | 4 | ||||||
| Calavo Growers | 7,487 | 201,775 | ||||||
| Cal-Maine Foods | 18,676 | 1,033,343 | ||||||
| Central Garden & Pet * | 4,269 | 174,816 | ||||||
| Central Garden & Pet, Cl A * | 23,091 | 818,114 | ||||||
| Chefs’ Warehouse * | 16,141 | 533,944 | ||||||
| Coca-Cola Consolidated | 2,372 | 1,959,272 | ||||||
| Dole | 33,071 | 402,474 | ||||||
| Duckhorn Portfolio * | 18,445 | 156,229 | ||||||
| Edgewell Personal Care | 22,938 | 862,928 | ||||||
| elf Beauty * | 24,277 | 3,945,741 | ||||||
| Energizer Holdings | 32,259 | 926,478 | ||||||
| Fresh Del Monte Produce | 16,691 | 426,789 | ||||||
| Hain Celestial Group * | 38,883 | 238,742 | ||||||
| Herbalife * | 46,417 | 401,507 | ||||||
| HF Foods Group * | 15,391 | 44,942 | ||||||
| Ingles Markets, Cl A | 6,259 | 449,083 | ||||||
| Inter Parfums | 9,038 | 1,051,842 | ||||||
| Ispire Technology * | 4,245 | 21,947 | ||||||
| J & J Snack Foods | 6,781 | 930,963 | ||||||
| J M Smucker | 1,820 | 209,027 | ||||||
| John B Sanfilippo & Son | 4,117 | 410,465 | ||||||
| Lancaster Colony | 8,924 | 1,702,788 | ||||||
| Limoneira | 9,111 | 180,216 | ||||||
| Medifast | 4,948 | 136,218 | ||||||
| MGP Ingredients | 7,187 | 563,748 | ||||||
| Mission Produce * | 19,777 | 224,469 | ||||||
| National Beverage * | 10,847 | 482,691 | ||||||
| Natural Grocers by Vitamin Cottage | 4,396 | 71,919 | ||||||
| Nature’s Sunshine Products * | 6,108 | 118,801 | ||||||
| Nu Skin Enterprises, Cl A | 21,942 | 258,038 | ||||||
| Oil-Dri Corp of America | 2,562 | 177,418 | ||||||
The accompanying notes are an integral part of the financial statements.
36
![]()
| Schedule of Investments | April 30, 2024 (Unaudited) |
Global X Russell 2000 Covered Call ETF
| Shares | Value | |||||||
| COMMON STOCK — continued | ||||||||
| Consumer Staples — continued | ||||||||
| PriceSmart | 11,922 | $ | 960,794 | |||||
| Primo Water | 71,198 | 1,343,506 | ||||||
| Seneca Foods, Cl A * | 2,565 | 149,001 | ||||||
| Simply Good Foods * | 41,800 | 1,523,610 | ||||||
| SpartanNash | 15,328 | 292,611 | ||||||
| Sprouts Farmers Market * | 47,480 | 3,135,104 | ||||||
| TreeHouse Foods * | 23,992 | 900,900 | ||||||
| Turning Point Brands | 7,984 | 230,259 | ||||||
| United Natural Foods * | 26,223 | 234,171 | ||||||
| Universal | 11,016 | 566,553 | ||||||
| USANA Health Sciences * | 4,988 | 207,102 | ||||||
| Utz Brands | 32,820 | 591,745 | ||||||
| Vector Group | 63,787 | 660,195 | ||||||
| Village Super Market, Cl A | 3,880 | 108,524 | ||||||
| Vita Coco * | 18,075 | 438,138 | ||||||
| Vital Farms * | 13,185 | 352,831 | ||||||
| Waldencast, Cl A * | 16,226 | 79,021 | ||||||
| WD-40 | 6,952 | 1,572,056 | ||||||
| Weis Markets | 7,550 | 476,631 | ||||||
| Westrock Coffee * | 14,488 | 146,908 | ||||||
| Zevia PBC, Cl A * | 1 | 1 | ||||||
| 37,972,343 | ||||||||
| Energy — 5.6% | ||||||||
| Amplify Energy * | 16,438 | 116,052 | ||||||
| Archrock | 63,252 | 1,213,806 | ||||||
| Atlas Energy Solutions, Cl A | 8,514 | 189,096 | ||||||
| Berry | 34,161 | 290,027 | ||||||
| Bristow Group * | 10,899 | 286,753 | ||||||
| Cactus, Cl A | 29,101 | 1,444,574 | ||||||
| California Resources | 33,972 | 1,795,760 | ||||||
| Centrus Energy, Cl A *(A) | 6,752 | 289,863 | ||||||
| ChampionX | 90,338 | 3,032,647 | ||||||
| Chord Energy | 18,994 | 3,361,558 | ||||||
| Civitas Resources | 36,545 | 2,629,778 | ||||||
| Clean Energy Fuels * | 1 | 2 | ||||||
| CNX Resources * | 72,950 | 1,715,784 | ||||||
| Comstock Resources | 41,381 | 416,293 | ||||||
| CONSOL Energy | 15,193 | 1,257,373 | ||||||
The accompanying notes are an integral part of the financial statements.
37
![]()
| Schedule of Investments | April 30, 2024 (Unaudited) |
Global X Russell 2000 Covered Call ETF
| Shares | Value | |||||||
| COMMON STOCK — continued | ||||||||
| Energy — continued | ||||||||
| Core Laboratories | 21,570 | $ | 340,806 | |||||
| Crescent Energy, Cl A | 34,924 | 371,591 | ||||||
| CVR Energy | 13,890 | 421,978 | ||||||
| Delek US Holdings | 31,089 | 849,662 | ||||||
| DHT Holdings | 60,707 | 693,274 | ||||||
| Diamond Offshore Drilling * | 56,929 | 696,811 | ||||||
| DMC Global * | 8,765 | 138,925 | ||||||
| Dorian LPG | 15,716 | 649,385 | ||||||
| Dril-Quip * | 14,976 | 272,264 | ||||||
| Empire Petroleum * | 7,779 | 40,295 | ||||||
| Energy Fuels *(A) | 70,715 | 366,304 | ||||||
| Equitrans Midstream | 194,254 | 2,628,257 | ||||||
| Evolution Petroleum | 16,712 | 90,245 | ||||||
| Excelerate Energy, Cl A | 7,687 | 129,603 | ||||||
| Expro Group Holdings * | 40,114 | 752,539 | ||||||
| Forum Energy Technologies * | 5,898 | 109,998 | ||||||
| FutureFuel | 10,690 | 57,940 | ||||||
| Gevo * | 1 | 1 | ||||||
| Granite Ridge Resources | 14,778 | 96,353 | ||||||
| Green Plains * | 26,565 | 549,099 | ||||||
| Gulfport Energy * | 5,082 | 806,564 | ||||||
| Hallador Energy * | 12,566 | 64,212 | ||||||
| Helix Energy Solutions Group * | 68,016 | 730,492 | ||||||
| Helmerich & Payne | 45,500 | 1,789,515 | ||||||
| HighPeak Energy | 5,416 | 76,961 | ||||||
| International Seaways | 19,016 | 1,051,395 | ||||||
| Kinetik Holdings, Cl A | 16,546 | 634,374 | ||||||
| KLX Energy Services Holdings * | 8,063 | 53,458 | ||||||
| Kodiak Gas Services | 6,756 | 183,628 | ||||||
| Liberty Energy, Cl A | 76,845 | 1,690,590 | ||||||
| Magnolia Oil & Gas, Cl A | 83,311 | 2,088,607 | ||||||
| Mammoth Energy Services * | 15,016 | 48,802 | ||||||
| Matador Resources | 52,282 | 3,257,169 | ||||||
| Murphy Oil | 68,073 | 3,038,779 | ||||||
| Nabors Industries * | 4,305 | 310,089 | ||||||
| NACCO Industries, Cl A | 1,669 | 45,964 | ||||||
| Newpark Resources * | 33,682 | 233,753 | ||||||
| NextDecade * | 39,129 | 251,208 | ||||||
| Noble | 50,924 | 2,260,007 | ||||||
The accompanying notes are an integral part of the financial statements.
38
![]()
| Schedule of Investments | April 30, 2024 (Unaudited) |
Global X Russell 2000 Covered Call ETF
| Shares | Value | |||||||
| COMMON STOCK — continued | ||||||||
| Energy — continued | ||||||||
| Nordic American Tankers | 89,408 | $ | 348,691 | |||||
| Northern Oil & Gas | 39,733 | 1,620,709 | ||||||
| Oceaneering International * | 47,853 | 1,096,312 | ||||||
| Oil States International * | 24,978 | 99,662 | ||||||
| Overseas Shipholding Group, Cl A | 30,943 | 188,133 | ||||||
| Par Pacific Holdings * | 25,185 | 775,698 | ||||||
| Patterson-UTI Energy | 164,709 | 1,782,151 | ||||||
| PBF Energy, Cl A | 51,599 | 2,748,679 | ||||||
| Peabody Energy | 56,675 | 1,243,449 | ||||||
| Permian Resources, Cl A | 209,037 | 3,501,370 | ||||||
| PrimeEnergy Resources * | 559 | 57,275 | ||||||
| ProFrac Holding, Cl A * | 10,918 | 79,374 | ||||||
| ProPetro Holding * | 43,512 | 379,425 | ||||||
| Ranger Energy Services, Cl A | 9,074 | 89,288 | ||||||
| REX American Resources * | 6,930 | 383,437 | ||||||
| Riley Exploration Permian | 4,819 | 124,957 | ||||||
| Ring Energy * | 1 | 2 | ||||||
| RPC | 38,282 | 256,107 | ||||||
| SandRidge Energy | 13,766 | 188,594 | ||||||
| SEACOR Marine Holdings * | 12,683 | 154,986 | ||||||
| Select Water Solutions, Cl A | 36,566 | 337,870 | ||||||
| SilverBow Resources * | 12,886 | 395,858 | ||||||
| Sitio Royalties, Cl A | 40,855 | 949,470 | ||||||
| SM Energy | 54,677 | 2,651,288 | ||||||
| Solaris Oilfield Infrastructure, Cl A | 13,032 | 114,812 | ||||||
| Talos Energy * | 62,177 | 819,493 | ||||||
| Tellurian * | 1 | — | ||||||
| TETRA Technologies * | 1 | 4 | ||||||
| Tidewater * | 21,711 | 1,994,155 | ||||||
| Uranium Energy *(A) | 178,526 | 1,205,050 | ||||||
| US Silica Holdings * | 33,930 | 523,540 | ||||||
| VAALCO Energy | 48,156 | 308,198 | ||||||
| Valaris * | 28,022 | 1,823,111 | ||||||
| Verde Clean Fuels * | 1 | 5 | ||||||
| Vertex Energy * | 1 | 1 | ||||||
| Vital Energy * | 10,573 | 560,580 | ||||||
| Vitesse Energy | 12,058 | 267,567 | ||||||
| W&T Offshore | 1 | 2 | ||||||
| Weatherford International * | 32,644 | 4,035,451 | ||||||
The accompanying notes are an integral part of the financial statements.
39
![]()
| Schedule of Investments | April 30, 2024 (Unaudited) |
Global X Russell 2000 Covered Call ETF
| Shares | Value | |||||||
| COMMON STOCK — continued | ||||||||
| Energy — continued | ||||||||
| World Kinect | 28,193 | $ | 662,536 | |||||
| 77,677,553 | ||||||||
| Financials — 12.7% | ||||||||
| 1st Source | 7,661 | 379,986 | ||||||
| Acacia Research * | 22,079 | 107,525 | ||||||
| ACNB | 3,764 | 122,481 | ||||||
| AFC Gamma ‡ | 7,440 | 89,280 | ||||||
| Alerus Financial | 8,191 | 161,363 | ||||||
| AlTi Global * | 14,545 | 66,907 | ||||||
| Amalgamated Financial | 7,884 | 193,473 | ||||||
| A-Mark Precious Metals | 8,522 | 341,477 | ||||||
| Ambac Financial Group * | 19,837 | 286,645 | ||||||
| Amerant Bancorp, Cl A | 12,075 | 261,544 | ||||||
| American Coastal Insurance * | 13,657 | 142,989 | ||||||
| American Equity Investment Life Holding | 35,907 | 2,014,742 | ||||||
| Ameris Bancorp | 30,112 | 1,429,718 | ||||||
| AMERISAFE | 8,682 | 395,899 | ||||||
| Ames National | 5,021 | 96,654 | ||||||
| Angel Oak Mortgage REIT ‡ | 4,577 | 48,196 | ||||||
| Apollo Commercial Real Estate Finance ‡ | 63,341 | 609,974 | ||||||
| Arbor Realty Trust ‡ | 80,452 | 1,032,199 | ||||||
| Ares Commercial Real Estate ‡ | 24,708 | 167,767 | ||||||
| ARMOUR Residential REIT ‡ | 22,579 | 410,260 | ||||||
| Arrow Financial | 6,673 | 148,608 | ||||||
| Artisan Partners Asset Management, Cl A | 27,976 | 1,145,058 | ||||||
| AssetMark Financial Holdings * | 9,846 | 332,893 | ||||||
| Associated Banc-Corp | 74,227 | 1,563,963 | ||||||
| Atlantic Union Bankshares | 40,487 | 1,286,272 | ||||||
| Atlanticus Holdings * | 2,185 | 57,793 | ||||||
| AvidXchange Holdings * | 76,750 | 894,905 | ||||||
| Axos Financial * | 25,898 | 1,310,698 | ||||||
| B Riley Financial | 9,172 | 315,517 | ||||||
| Baldwin Insurance Group, Cl A * | 26,646 | 709,849 | ||||||
| Banc of California | 61,117 | 836,692 | ||||||
| BancFirst | 9,926 | 885,101 | ||||||
| Bancorp * | 23,756 | 711,255 | ||||||
| Bank First | 4,177 | 322,423 | ||||||
| Bank of Hawaii | 17,753 | 1,006,418 | ||||||
The accompanying notes are an integral part of the financial statements.
40
![]()
| Schedule of Investments | April 30, 2024 (Unaudited) |
Global X Russell 2000 Covered Call ETF
| Shares | Value | |||||||
| COMMON STOCK — continued | ||||||||
| Financials — continued | ||||||||
| Bank of Marin Bancorp | 7,106 | $ | 102,042 | |||||
| Bank7 | 2,579 | 70,407 | ||||||
| BankUnited | 35,625 | 952,256 | ||||||
| Bankwell Financial Group | 2,541 | 58,265 | ||||||
| Banner | 15,631 | 681,981 | ||||||
| Bar Harbor Bankshares | 6,723 | 168,613 | ||||||
| BayCom | 5,376 | 106,337 | ||||||
| BCB Bancorp | 6,883 | 64,838 | ||||||
| Berkshire Hills Bancorp | 20,596 | 439,107 | ||||||
| BGC Group, Cl A | 165,948 | 1,299,373 | ||||||
| Blackstone Mortgage Trust, Cl A ‡ | 78,307 | 1,381,335 | ||||||
| Blue Foundry Bancorp * | 11,233 | 95,930 | ||||||
| Blue Ridge Bankshares | 1 | 2 | ||||||
| Bread Financial Holdings | 22,506 | 830,696 | ||||||
| Bridgewater Bancshares * | 9,415 | 102,435 | ||||||
| Brightsphere Investment Group | 14,582 | 324,304 | ||||||
| BrightSpire Capital, Cl A ‡ | 60,047 | 377,696 | ||||||
| Brookline Bancorp | 39,886 | 331,054 | ||||||
| Burke & Herbert Financial Services | 3,111 | 162,954 | ||||||
| Business First Bancshares | 10,771 | 217,466 | ||||||
| Byline Bancorp | 11,108 | 240,710 | ||||||
| C&F Financial | 1,855 | 72,660 | ||||||
| Cadence Bank | 82,664 | 2,287,313 | ||||||
| Cambridge Bancorp | 4,226 | 259,350 | ||||||
| Camden National | 6,413 | 200,214 | ||||||
| Cannae Holdings * | 34,932 | 679,427 | ||||||
| Cantaloupe * | 43,132 | 249,734 | ||||||
| Capital Bancorp | 3,894 | 75,544 | ||||||
| Capital City Bank Group | 5,960 | 158,059 | ||||||
| Capitol Federal Financial | 53,587 | 255,610 | ||||||
| Carter Bankshares * | 10,520 | 128,028 | ||||||
| Cass Information Systems | 6,139 | 265,143 | ||||||
| Cathay General Bancorp | 31,319 | 1,078,626 | ||||||
| Central Pacific Financial | 11,758 | 234,455 | ||||||
| Chemung Financial | 2,120 | 89,390 | ||||||
| Chicago Atlantic Real Estate Finance ‡ | 12,715 | 200,134 | ||||||
| Chimera Investment ‡ | 99,791 | 411,139 | ||||||
| ChoiceOne Financial Services | 4,017 | 99,863 | ||||||
| Citizens & Northern | 6,685 | 113,979 | ||||||
The accompanying notes are an integral part of the financial statements.
41
![]()
| Schedule of Investments | April 30, 2024 (Unaudited) |
Global X Russell 2000 Covered Call ETF
| Shares | Value | |||||||
| COMMON STOCK — continued | ||||||||
| Financials — continued | ||||||||
| Citizens Financial Services | 2,179 | $ | 88,032 | |||||
| City Holding | 6,633 | 670,066 | ||||||
| Civista Bancshares | 6,568 | 93,791 | ||||||
| Claros Mortgage Trust ‡ | 39,535 | 343,954 | ||||||
| CNB Financial | 8,955 | 170,145 | ||||||
| CNO Financial Group | 51,756 | 1,362,735 | ||||||
| Coastal Financial * | 5,034 | 194,715 | ||||||
| Codorus Valley Bancorp | 5,356 | 118,903 | ||||||
| Cohen & Steers | 12,303 | 846,200 | ||||||
| Colony Bankcorp | 6,722 | 73,068 | ||||||
| Columbia Financial * | 16,328 | 271,045 | ||||||
| Community Bank System | 23,978 | 1,036,329 | ||||||
| Community Trust Bancorp | 6,796 | 285,500 | ||||||
| Community West Bancshares | 5,919 | 101,629 | ||||||
| Compass Diversified Holdings | 28,437 | 624,761 | ||||||
| ConnectOne Bancorp | 15,994 | 286,453 | ||||||
| Consumer Portfolio Services * | 5,964 | 51,052 | ||||||
| Crawford, Cl A | 6,686 | 62,046 | ||||||
| CrossFirst Bankshares * | 19,747 | 238,544 | ||||||
| Customers Bancorp * | 13,062 | 596,542 | ||||||
| CVB Financial | 59,909 | 978,913 | ||||||
| Diamond Hill Investment Group | 1,276 | 190,405 | ||||||
| Dime Community Bancshares | 16,102 | 293,056 | ||||||
| Donegal Group, Cl A | 6,720 | 90,317 | ||||||
| Donnelley Financial Solutions * | 12,474 | 783,118 | ||||||
| Dynex Capital ‡ | 24,142 | 281,737 | ||||||
| Eagle Bancorp | 13,887 | 256,771 | ||||||
| Eastern Bankshares | 71,290 | 895,402 | ||||||
| eHealth * | 10,147 | 43,429 | ||||||
| Ellington Financial ‡ | 28,792 | 329,380 | ||||||
| Employers Holdings | 11,959 | 509,334 | ||||||
| Enact Holdings | 13,417 | 398,887 | ||||||
| Encore Capital Group * | 10,437 | 428,856 | ||||||
| Enova International * | 14,981 | 906,800 | ||||||
| Enstar Group * | 6,200 | 1,800,294 | ||||||
| Enterprise Bancorp | 4,159 | 101,064 | ||||||
| Enterprise Financial Services | 16,338 | 621,007 | ||||||
| Equity Bancshares, Cl A | 6,590 | 219,513 | ||||||
| Esquire Financial Holdings | 3,161 | 148,757 | ||||||
The accompanying notes are an integral part of the financial statements.
42
![]()
| Schedule of Investments | April 30, 2024 (Unaudited) |
Global X Russell 2000 Covered Call ETF
| Shares | Value | |||||||
| COMMON STOCK — continued | ||||||||
| Financials — continued | ||||||||
| ESSA Bancorp | 5,226 | $ | 84,661 | |||||
| Essent Group | 48,198 | 2,553,048 | ||||||
| Evans Bancorp | 3,214 | 82,246 | ||||||
| F&G Annuities & Life | 9,291 | 351,386 | ||||||
| Farmers & Merchants Bancorp | 5,753 | 117,936 | ||||||
| Farmers National Banc | 26,060 | 308,290 | ||||||
| FB Financial | 16,236 | 595,049 | ||||||
| Federal Agricultural Mortgage, Cl C | 4,167 | 775,604 | ||||||
| Fidelity D&D Bancorp | 2,505 | 113,727 | ||||||
| Finance of America, Cl A * | 1 | — | ||||||
| Financial Institutions | 6,762 | 116,442 | ||||||
| First Bancorp | 4,511 | 99,603 | ||||||
| First Bancorp | 18,476 | 561,855 | ||||||
| First Bancshares | 14,102 | 337,602 | ||||||
| First Bank | 9,381 | 109,570 | ||||||
| First Busey | 23,199 | 518,266 | ||||||
| First Business Financial Services | 3,314 | 109,594 | ||||||
| First Commonwealth Financial | 45,252 | 596,874 | ||||||
| First Community | 4,513 | 74,600 | ||||||
| First Community Bankshares | 8,409 | 279,011 | ||||||
| First Financial | 5,459 | 198,762 | ||||||
| First Financial Bancorp | 42,416 | 937,818 | ||||||
| First Financial Bankshares | 59,915 | 1,771,087 | ||||||
| First Foundation | 22,630 | 124,012 | ||||||
| First Interstate BancSystem, Cl A | 42,437 | 1,133,068 | ||||||
| First Merchants | 27,826 | 929,945 | ||||||
| First Mid Bancshares | 10,183 | 315,266 | ||||||
| First of Long Island | 9,890 | 93,658 | ||||||
| First Western Financial * | 3,278 | 54,644 | ||||||
| FirstCash Holdings | 17,116 | 1,933,766 | ||||||
| Five Star Bancorp | 5,503 | 118,975 | ||||||
| Flushing Financial | 12,626 | 139,139 | ||||||
| Flywire * | 49,749 | 1,019,855 | ||||||
| Forge Global Holdings * | 1 | 2 | ||||||
| Franklin BSP Realty Trust ‡ | 36,251 | 452,775 | ||||||
| FS Bancorp | 3,659 | 114,051 | ||||||
| Fulton Financial | 73,258 | 1,212,420 | ||||||
| FVCBankcorp * | 6,185 | 71,189 | ||||||
| GCM Grosvenor | 18,122 | 171,072 | ||||||
The accompanying notes are an integral part of the financial statements.
43
![]()
| Schedule of Investments | April 30, 2024 (Unaudited) |
Global X Russell 2000 Covered Call ETF
| Shares | Value | |||||||
| COMMON STOCK — continued | ||||||||
| Financials — continued | ||||||||
| Genworth Financial, Cl A * | 230,453 | $ | 1,366,586 | |||||
| German American Bancorp | 12,885 | 408,841 | ||||||
| Glacier Bancorp | 51,200 | 1,852,416 | ||||||
| GoHealth, Cl A * | 2,899 | 29,193 | ||||||
| Goosehead Insurance, Cl A * | 9,834 | 559,653 | ||||||
| Granite Point Mortgage Trust ‡ | 22,093 | 94,779 | ||||||
| Great Southern Bancorp | 4,301 | 221,071 | ||||||
| Green Dot, Cl A * | 22,238 | 194,583 | ||||||
| Greene County Bancorp | 2,958 | 87,024 | ||||||
| Greenlight Capital Re, Cl A * | 10,860 | 131,623 | ||||||
| Guaranty Bancshares | 3,591 | 103,169 | ||||||
| Hamilton Lane, Cl A | 18,641 | 2,082,573 | ||||||
| Hancock Whitney | 39,074 | 1,773,569 | ||||||
| Hanmi Financial | 13,221 | 202,281 | ||||||
| Hannon Armstrong Sustainable Infrastructure Capital | 48,854 | 1,221,839 | ||||||
| HarborOne Bancorp | 19,208 | 194,577 | ||||||
| HBT Financial | 6,145 | 113,406 | ||||||
| HCI Group | 2,957 | 337,630 | ||||||
| Heartland Financial USA | 19,032 | 801,438 | ||||||
| Heritage Commerce | 25,369 | 201,430 | ||||||
| Heritage Financial | 14,909 | 264,486 | ||||||
| Hilltop Holdings | 26,220 | 767,197 | ||||||
| Hingham Institution For Savings | 821 | 138,667 | ||||||
| Hippo Holdings * | 7,508 | 160,596 | ||||||
| Home Bancorp | 3,282 | 114,870 | ||||||
| Home BancShares | 86,675 | 2,052,464 | ||||||
| HomeStreet | 8,313 | 101,834 | ||||||
| HomeTrust Bancshares | 7,271 | 186,865 | ||||||
| Hope Bancorp | 49,806 | 499,056 | ||||||
| Horace Mann Educators | 18,558 | 684,048 | ||||||
| Horizon Bancorp | 18,124 | 208,064 | ||||||
| I3 Verticals, Cl A * | 10,335 | 234,708 | ||||||
| Independent Bank | 8,963 | 222,372 | ||||||
| Independent Bank | 21,216 | 1,065,892 | ||||||
| Independent Bank Group | 16,531 | 615,614 | ||||||
| International Bancshares | 24,938 | 1,387,800 | ||||||
| International Money Express * | 15,167 | 306,828 | ||||||
| Invesco Mortgage Capital ‡ | 24,251 | 207,346 | ||||||
The accompanying notes are an integral part of the financial statements.
44
![]()
| Schedule of Investments | April 30, 2024 (Unaudited) |
Global X Russell 2000 Covered Call ETF
| Shares | Value | |||||||
| COMMON STOCK — continued | ||||||||
| Financials — continued | ||||||||
| Investors Title | 596 | $ | 95,616 | |||||
| Jackson Financial, Cl A | 38,970 | 2,662,430 | ||||||
| James River Group Holdings | 15,808 | 140,533 | ||||||
| John Marshall Bancorp | 4,789 | 79,114 | ||||||
| Kearny Financial | 26,640 | 143,856 | ||||||
| KKR Real Estate Finance Trust ‡ | 26,071 | 245,328 | ||||||
| Ladder Capital, Cl A ‡ | 50,987 | 547,091 | ||||||
| Lakeland Bancorp | 28,522 | 347,683 | ||||||
| Lakeland Financial | 11,506 | 676,208 | ||||||
| LCNB | 6,130 | 86,433 | ||||||
| Lemonade * | 22,820 | 393,189 | ||||||
| LendingClub * | 47,903 | 360,231 | ||||||
| LendingTree * | 4,894 | 236,233 | ||||||
| Live Oak Bancshares | 15,679 | 506,745 | ||||||
| Macatawa Bank | 10,860 | 152,040 | ||||||
| Maiden Holdings * | 1 | 2 | ||||||
| MainStreet Bancshares | 4,093 | 62,500 | ||||||
| MarketWise | 1 | 2 | ||||||
| Marqeta, Cl A * | 220,625 | 1,224,469 | ||||||
| MBIA | 22,614 | 142,242 | ||||||
| Mercantile Bank | 6,846 | 247,004 | ||||||
| Merchants Bancorp | 7,342 | 296,103 | ||||||
| Mercury General | 12,545 | 655,602 | ||||||
| Metrocity Bankshares | 8,352 | 191,929 | ||||||
| Metropolitan Bank Holding * | 4,886 | 193,974 | ||||||
| MFA Financial ‡ | 44,422 | 470,429 | ||||||
| Mid Penn Bancorp | 6,345 | 128,359 | ||||||
| Middlefield Banc | 4,281 | 91,913 | ||||||
| Midland States Bancorp | 9,259 | 202,772 | ||||||
| MidWestOne Financial Group | 6,321 | 127,495 | ||||||
| Moelis, Cl A | 30,563 | 1,500,032 | ||||||
| Mr Cooper Group * | 30,724 | 2,371,893 | ||||||
| MVB Financial | 4,562 | 81,979 | ||||||
| National Bank Holdings, Cl A | 16,923 | 553,890 | ||||||
| National Bankshares | 3,252 | 87,186 | ||||||
| National Western Life Group, Cl A | 1,332 | 651,108 | ||||||
| Navient | 46,486 | 698,220 | ||||||
| NBT Bancorp | 25,274 | 884,843 | ||||||
| Nelnet, Cl A | 6,939 | 653,515 | ||||||
The accompanying notes are an integral part of the financial statements.
45
![]()
| Schedule of Investments | April 30, 2024 (Unaudited) |
Global X Russell 2000 Covered Call ETF
| Shares | Value | |||||||
| COMMON STOCK — continued | ||||||||
| Financials — continued | ||||||||
| NerdWallet, Cl A * | 15,407 | $ | 193,666 | |||||
| New York Mortgage Trust ‡ | 40,000 | 274,000 | ||||||
| NewtekOne | 11,641 | 125,606 | ||||||
| Nexpoint Real Estate Finance ‡ | 3,263 | 42,288 | ||||||
| NI Holdings * | 4,022 | 59,807 | ||||||
| Nicolet Bankshares | 5,794 | 443,415 | ||||||
| NMI Holdings, Cl A * | 36,949 | 1,140,246 | ||||||
| Northeast Bank | 3,095 | 160,073 | ||||||
| Northeast Community Bancorp | 7,448 | 117,529 | ||||||
| Northfield Bancorp | 18,276 | 152,422 | ||||||
| Northrim BanCorp | 2,985 | 142,683 | ||||||
| Northwest Bancshares | 57,372 | 608,143 | ||||||
| Norwood Financial | 3,961 | 95,420 | ||||||
| Oak Valley Bancorp | 3,855 | 93,098 | ||||||
| OceanFirst Financial | 26,597 | 392,572 | ||||||
| Ocwen Financial * | 3,603 | 84,094 | ||||||
| Old National Bancorp | 148,145 | 2,450,318 | ||||||
| Old Second Bancorp | 18,785 | 257,355 | ||||||
| Open Lending, Cl A * | 61,177 | 312,003 | ||||||
| OppFi | 1 | 3 | ||||||
| Orange County Bancorp | 2,905 | 125,525 | ||||||
| Orchid Island Capital, Cl A ‡ | 24,079 | 200,578 | ||||||
| Origin Bancorp | 13,566 | 402,910 | ||||||
| Orrstown Financial Services | 4,899 | 128,452 | ||||||
| Oscar Health, Cl A * | 71,519 | 1,242,285 | ||||||
| P10, Cl A | 20,931 | 148,610 | ||||||
| Pacific Premier Bancorp | 44,249 | 951,354 | ||||||
| Palomar Holdings * | 11,135 | 875,990 | ||||||
| Park National | 6,540 | 861,383 | ||||||
| Parke Bancorp | 4,251 | 69,971 | ||||||
| Pathward Financial | 12,570 | 633,151 | ||||||
| Payoneer Global * | 119,283 | 589,258 | ||||||
| Paysafe * | 12,055 | 171,422 | ||||||
| Paysign * | 1 | 5 | ||||||
| PCB Bancorp | 4,859 | 70,747 | ||||||
| Peapack-Gladstone Financial | 7,668 | 171,610 | ||||||
| Penns Woods Bancorp | 3,858 | 67,438 | ||||||
| PennyMac Financial Services | 12,726 | 1,089,855 | ||||||
| PennyMac Mortgage Investment Trust ‡ | 40,947 | 567,116 | ||||||
The accompanying notes are an integral part of the financial statements.
46
![]()
| Schedule of Investments | April 30, 2024 (Unaudited) |
Global X Russell 2000 Covered Call ETF
| Shares | Value | |||||||
| COMMON STOCK — continued | ||||||||
| Financials — continued | ||||||||
| Peoples Bancorp | 16,943 | $ | 492,025 | |||||
| Peoples Financial Services | 3,065 | 116,072 | ||||||
| Perella Weinberg Partners, Cl A | 19,276 | 287,598 | ||||||
| Pioneer Bancorp * | 4,887 | 43,274 | ||||||
| Piper Sandler | 8,032 | 1,572,585 | ||||||
| PJT Partners | 10,683 | 1,009,437 | ||||||
| Plumas Bancorp | 3,022 | 106,254 | ||||||
| Ponce Financial Group * | 11,579 | 93,095 | ||||||
| PRA Group * | 17,980 | 427,744 | ||||||
| Preferred Bank | 6,151 | 465,569 | ||||||
| Premier Financial | 15,476 | 299,925 | ||||||
| Primis Financial | 9,604 | 93,351 | ||||||
| Princeton Bancorp | 3,059 | 89,170 | ||||||
| Priority Technology Holdings * | 5,567 | 17,870 | ||||||
| ProAssurance | 23,090 | 308,482 | ||||||
| PROG Holdings | 23,836 | 792,309 | ||||||
| Provident Financial Services | 33,488 | 491,604 | ||||||
| QCR Holdings | 7,571 | 416,102 | ||||||
| Radian Group | 75,251 | 2,247,747 | ||||||
| RBB Bancorp | 7,742 | 137,498 | ||||||
| Ready Capital ‡ | 72,417 | 616,993 | ||||||
| Red River Bancshares | 2,285 | 103,305 | ||||||
| Redwood Trust ‡ | 47,751 | 264,063 | ||||||
| Regional Management | 3,423 | 86,294 | ||||||
| Remitly Global * | 60,543 | 1,079,482 | ||||||
| Renasant | 25,202 | 732,370 | ||||||
| Repay Holdings, Cl A * | 35,838 | 364,472 | ||||||
| Republic Bancorp, Cl A | 4,109 | 208,408 | ||||||
| S&T Bancorp | 17,805 | 536,821 | ||||||
| Safety Insurance Group | 6,693 | 532,562 | ||||||
| Sandy Spring Bancorp | 20,104 | 411,127 | ||||||
| Seacoast Banking Corp of Florida | 38,031 | 877,375 | ||||||
| Security National Financial, Cl A * | 8,209 | 54,015 | ||||||
| Selective Insurance Group | 27,333 | 2,778,399 | ||||||
| Selectquote * | 1 | 2 | ||||||
| ServisFirst Bancshares | 23,809 | 1,403,779 | ||||||
| Shore Bancshares | 14,407 | 149,112 | ||||||
| Sierra Bancorp | 6,202 | 122,924 | ||||||
| Silvercrest Asset Management Group, Cl A | 4,027 | 58,996 | ||||||
The accompanying notes are an integral part of the financial statements.
47
![]()
| Schedule of Investments | April 30, 2024 (Unaudited) |
Global X Russell 2000 Covered Call ETF
| Shares | Value | |||||||
| COMMON STOCK — continued | ||||||||
| Financials — continued | ||||||||
| Simmons First National, Cl A | 55,729 | $ | 952,409 | |||||
| Skyward Specialty Insurance Group * | 17,171 | 599,611 | ||||||
| SmartFinancial | 7,421 | 152,502 | ||||||
| South Plains Financial | 5,648 | 146,396 | ||||||
| Southern First Bancshares * | 3,392 | 87,581 | ||||||
| Southern Missouri Bancorp | 4,004 | 160,560 | ||||||
| Southern States Bancshares | 4,349 | 105,115 | ||||||
| Southside Bancshares | 13,245 | 353,112 | ||||||
| SouthState | 34,658 | 2,623,611 | ||||||
| Stellar Bancorp | 23,471 | 521,056 | ||||||
| StepStone Group, Cl A | 24,644 | 888,909 | ||||||
| Sterling Bancorp * | 7,108 | 33,621 | ||||||
| Stewart Information Services | 12,236 | 758,754 | ||||||
| Stock Yards Bancorp | 12,573 | 560,127 | ||||||
| StoneX Group * | 12,064 | 875,846 | ||||||
| Summit Financial Group | 4,937 | 130,682 | ||||||
| SWK Holdings * | 1,528 | 26,496 | ||||||
| Texas Capital Bancshares * | 21,744 | 1,248,106 | ||||||
| Third Coast Bancshares * | 5,446 | 105,761 | ||||||
| Timberland Bancorp | 4,218 | 102,919 | ||||||
| Tiptree | 10,880 | 173,318 | ||||||
| Tompkins Financial | 6,121 | 269,202 | ||||||
| Towne Bank | 31,596 | 817,389 | ||||||
| TPG RE Finance Trust ‡ | 29,673 | 217,503 | ||||||
| TriCo Bancshares | 14,223 | 494,534 | ||||||
| Triumph Financial * | 10,156 | 714,576 | ||||||
| Trupanion * | 18,120 | 407,700 | ||||||
| TrustCo Bank NY | 8,177 | 217,672 | ||||||
| Trustmark | 27,802 | 822,939 | ||||||
| Two Harbors Investment ‡ | 52,146 | 658,604 | ||||||
| UMB Financial | 20,244 | 1,612,637 | ||||||
| United Bankshares | 59,453 | 1,929,844 | ||||||
| United Community Banks | 52,593 | 1,326,921 | ||||||
| United Fire Group | 9,153 | 202,190 | ||||||
| Unity Bancorp | 3,454 | 92,982 | ||||||
| Universal Insurance Holdings | 11,233 | 219,268 | ||||||
| Univest Financial | 12,532 | 261,543 | ||||||
| Upstart Holdings * | 32,393 | 716,857 | ||||||
| USCB Financial Holdings | 4,444 | 49,506 | ||||||
The accompanying notes are an integral part of the financial statements.
48
![]()
| Schedule of Investments | April 30, 2024 (Unaudited) |
Global X Russell 2000 Covered Call ETF
| Shares | Value | |||||||
| COMMON STOCK — continued | ||||||||
| Financials — continued | ||||||||
| Valley National Bancorp | 194,383 | $ | 1,362,625 | |||||
| Value Line | 400 | 14,480 | ||||||
| Velocity Financial * | 3,631 | 62,272 | ||||||
| Veritex Holdings | 23,934 | 466,234 | ||||||
| Victory Capital Holdings, Cl A | 12,899 | 656,043 | ||||||
| Virginia National Bankshares | 2,801 | 79,016 | ||||||
| Virtus Investment Partners | 3,167 | 694,586 | ||||||
| WaFd | 31,623 | 856,667 | ||||||
| Walker & Dunlop | 14,579 | 1,335,874 | ||||||
| Washington Trust Bancorp | 7,398 | 188,353 | ||||||
| Waterstone Financial | 9,316 | 105,643 | ||||||
| WesBanco | 26,336 | 711,072 | ||||||
| West BanCorp | 7,091 | 115,300 | ||||||
| Westamerica BanCorp | 11,867 | 552,409 | ||||||
| WisdomTree | 62,123 | 552,895 | ||||||
| World Acceptance * | 1,811 | 249,139 | ||||||
| WSFS Financial | 27,880 | 1,191,312 | ||||||
| 175,741,880 | ||||||||
| Health Care — 11.6% | ||||||||
| 23andMe Holding, Cl A * | 1 | — | ||||||
| 2seventy bio * | 1 | 5 | ||||||
| 4D Molecular Therapeutics * | 17,635 | 422,006 | ||||||
| 89bio * | 38,301 | 325,942 | ||||||
| Aadi Bioscience * | 1 | 2 | ||||||
| ACADIA Pharmaceuticals * | 57,936 | 968,111 | ||||||
| Accolade * | 30,766 | 234,745 | ||||||
| Accuray * | 1 | 2 | ||||||
| ACELYRIN * | 14,608 | 61,061 | ||||||
| Aclaris Therapeutics * | 1 | 1 | ||||||
| Acrivon Therapeutics * | 3,889 | 35,351 | ||||||
| Actinium Pharmaceuticals * | 14,285 | 109,994 | ||||||
| AdaptHealth, Cl A * | 43,065 | 424,190 | ||||||
| Adaptive Biotechnologies * | 1 | 3 | ||||||
| Addus HomeCare * | 7,244 | 696,511 | ||||||
| Adicet Bio * | 1 | 1 | ||||||
| ADMA Biologics * | 91,204 | 594,650 | ||||||
| Aerovate Therapeutics * | 4,920 | 98,449 | ||||||
| Agenus * | 1 | 12 | ||||||
The accompanying notes are an integral part of the financial statements.
49
![]()
| Schedule of Investments | April 30, 2024 (Unaudited) |
Global X Russell 2000 Covered Call ETF
| Shares | Value | |||||||
| COMMON STOCK — continued | ||||||||
| Health Care — continued | ||||||||
| Agiliti * | 13,210 | $ | 134,081 | |||||
| Agios Pharmaceuticals * | 24,765 | 804,862 | ||||||
| AirSculpt Technologies * | 5,495 | 30,277 | ||||||
| Akero Therapeutics * | 29,026 | 577,327 | ||||||
| Akoya Biosciences * | 7,038 | 26,885 | ||||||
| Aldeyra Therapeutics * | 1 | 4 | ||||||
| Alector * | 26,855 | 136,423 | ||||||
| Alignment Healthcare * | 40,576 | 208,966 | ||||||
| Alkermes * | 75,345 | 1,848,966 | ||||||
| Allakos * | 1 | 1 | ||||||
| Allogene Therapeutics * | 1 | 3 | ||||||
| Allovir * | 1 | 1 | ||||||
| Alphatec Holdings * | 41,770 | 527,137 | ||||||
| Alpine Immune Sciences * | 17,839 | 1,152,221 | ||||||
| Altimmune * | 23,933 | 156,761 | ||||||
| ALX Oncology Holdings * | 9,458 | 160,975 | ||||||
| American Well, Cl A * | 1 | 1 | ||||||
| Amicus Therapeutics * | 126,348 | 1,262,217 | ||||||
| AMN Healthcare Services * | 19,671 | 1,179,867 | ||||||
| Amneal Pharmaceuticals * | 55,205 | 333,990 | ||||||
| Amphastar Pharmaceuticals * | 17,233 | 710,861 | ||||||
| Amylyx Pharmaceuticals * | 1 | 2 | ||||||
| AnaptysBio * | 8,602 | 209,373 | ||||||
| Anavex Life Sciences * | 32,172 | 117,428 | ||||||
| AngioDynamics * | 17,028 | 98,592 | ||||||
| ANI Pharmaceuticals * | 7,134 | 470,844 | ||||||
| Anika Therapeutics * | 6,621 | 171,418 | ||||||
| Annexon * | 20,670 | 94,048 | ||||||
| Apogee Therapeutics * | 18,710 | 941,113 | ||||||
| Arbutus Biopharma * | 1 | 3 | ||||||
| Arcellx * | 17,339 | 867,297 | ||||||
| Arcturus Therapeutics Holdings * | 13,049 | 333,663 | ||||||
| Arcus Biosciences * | 24,521 | 373,455 | ||||||
| Arcutis Biotherapeutics * | 35,816 | 297,989 | ||||||
| Ardelyx * | 99,757 | 638,445 | ||||||
| ArriVent Biopharma * | 4,446 | 73,448 | ||||||
| Arrowhead Pharmaceuticals * | 52,445 | 1,186,306 | ||||||
| ARS Pharmaceuticals * | 14,137 | 122,992 | ||||||
| Artivion * | 17,628 | 345,861 | ||||||
The accompanying notes are an integral part of the financial statements.
50
![]()
| Schedule of Investments | April 30, 2024 (Unaudited) |
Global X Russell 2000 Covered Call ETF
| Shares | Value | |||||||
| COMMON STOCK — continued | ||||||||
| Health Care — continued | ||||||||
| Arvinas * | 21,898 | $ | 695,699 | |||||
| Assertio Holdings * | 1 | 1 | ||||||
| Astrana Health * | 19,553 | 726,394 | ||||||
| Astria Therapeutics * | 24,695 | 226,700 | ||||||
| Atara Biotherapeutics * | 1 | 1 | ||||||
| Atea Pharmaceuticals * | 1 | 4 | ||||||
| ATI Physical Therapy * | 1 | 4 | ||||||
| AtriCure * | 21,237 | 512,236 | ||||||
| Atrion | 891 | 377,151 | ||||||
| Aura Biosciences * | 12,405 | 91,797 | ||||||
| Avanos Medical * | 20,668 | 373,677 | ||||||
| Aveanna Healthcare Holdings * | 1 | 2 | ||||||
| Avid Bioservices * | 27,782 | 211,977 | ||||||
| Avidity Biosciences * | 33,675 | 812,578 | ||||||
| Avista Public Acquisition II, Cl W * | 35,001 | 155,404 | ||||||
| Avita Medical * | 12,416 | 104,294 | ||||||
| Axogen * | 18,401 | 117,950 | ||||||
| Axonics * | 22,963 | 1,528,647 | ||||||
| Axsome Therapeutics * | 16,781 | 1,237,767 | ||||||
| Beam Therapeutics * | 32,947 | 699,135 | ||||||
| Beyond Air * | 1 | 1 | ||||||
| BioAtla * | 1 | 2 | ||||||
| BioCryst Pharmaceuticals * | 84,528 | 349,101 | ||||||
| Biohaven * | 30,847 | 1,196,864 | ||||||
| BioLife Solutions * | 15,622 | 274,010 | ||||||
| Biomea Fusion * | 9,448 | 101,472 | ||||||
| Biote, Cl A * | 9,681 | 53,342 | ||||||
| BioVie, Cl A * | 1 | — | ||||||
| Bioxcel Therapeutics * | 1 | 3 | ||||||
| Bluebird Bio * | 1 | 1 | ||||||
| Blueprint Medicines * | 28,145 | 2,570,764 | ||||||
| Bridgebio Pharma * | 52,029 | 1,332,983 | ||||||
| Bright Green * | 1 | — | ||||||
| BrightSpring Health Services * | 24,390 | 260,729 | ||||||
| Brookdale Senior Living * | 80,973 | 549,807 | ||||||
| Butterfly Network * | 1 | 1 | ||||||
| Cabaletta Bio * | 15,493 | 164,923 | ||||||
| Cara Therapeutics * | 1 | 1 | ||||||
| CareDx * | 21,596 | 167,585 | ||||||
The accompanying notes are an integral part of the financial statements.
51
![]()
| Schedule of Investments | April 30, 2024 (Unaudited) |
Global X Russell 2000 Covered Call ETF
| Shares | Value | |||||||
| COMMON STOCK — continued | ||||||||
| Health Care — continued | ||||||||
| CareMax * | 1,200 | $ | 4,284 | |||||
| Cargo Therapeutics * | 9,723 | 185,709 | ||||||
| Caribou Biosciences * | 37,076 | 134,586 | ||||||
| Carisma Therapeutics * | 1 | 2 | ||||||
| Cassava Sciences * | 17,893 | 396,330 | ||||||
| Castle Biosciences * | 10,917 | 230,240 | ||||||
| Catalyst Pharmaceuticals * | 52,085 | 783,879 | ||||||
| Celcuity * | 9,505 | 149,894 | ||||||
| Celldex Therapeutics * | 28,105 | 1,051,689 | ||||||
| Century Therapeutics * | 1 | 3 | ||||||
| Cerevel Therapeutics Holdings * | 31,545 | 1,347,287 | ||||||
| Cerus * | 1 | 2 | ||||||
| CG oncology * | 10,518 | 422,718 | ||||||
| Citius Pharmaceuticals * | 1 | 1 | ||||||
| ClearPoint Neuro * | 13,378 | 72,643 | ||||||
| Codexis * | 1 | 3 | ||||||
| Cogent Biosciences * | 36,487 | 237,165 | ||||||
| Coherus Biosciences * | 1 | 2 | ||||||
| Collegium Pharmaceutical * | 15,899 | 587,150 | ||||||
| Community Health Systems * | 1 | 3 | ||||||
| Compass Therapeutics * | 1 | 1 | ||||||
| CONMED | 14,007 | 952,196 | ||||||
| Corcept Therapeutics * | 37,726 | 879,770 | ||||||
| CorMedix * | 23,751 | 124,812 | ||||||
| CorVel * | 4,001 | 955,639 | ||||||
| Crinetics Pharmaceuticals * | 29,232 | 1,280,946 | ||||||
| Cross Country Healthcare * | 15,769 | 277,534 | ||||||
| CryoPort * | 19,468 | 315,187 | ||||||
| Cue Biopharma * | 1 | 2 | ||||||
| Cullinan Therapeutics * | 13,067 | 352,940 | ||||||
| Cutera * | 1 | 2 | ||||||
| CVRx * | 6,447 | 99,993 | ||||||
| Cytek Biosciences * | 49,053 | 294,809 | ||||||
| Cytokinetics * | 43,817 | 2,686,858 | ||||||
| Day One Biopharmaceuticals * | 33,901 | 579,707 | ||||||
| Deciphera Pharmaceuticals * | 24,382 | 616,133 | ||||||
| Definitive Healthcare, Cl A * | 22,108 | 153,430 | ||||||
| Denali Therapeutics * | 53,719 | 829,421 | ||||||
| Design Therapeutics * | 1 | 4 | ||||||
The accompanying notes are an integral part of the financial statements.
52
![]()
| Schedule of Investments | April 30, 2024 (Unaudited) | |
| Global X Russell 2000 Covered Call ETF | ||
| Shares | Value | |||||||
| COMMON STOCK — continued | ||||||||
| Health Care — continued | ||||||||
| Disc Medicine, Cl A * | 4,093 | $ | 113,949 | |||||
| DocGo * | 37,175 | 125,651 | ||||||
| Dynavax Technologies * | 65,491 | 744,633 | ||||||
| Dyne Therapeutics * | 27,773 | 702,935 | ||||||
| Eagle Pharmaceuticals * | 4,884 | 19,976 | ||||||
| Edgewise Therapeutics * | 27,629 | 495,664 | ||||||
| Editas Medicine, Cl A * | 37,010 | 192,822 | ||||||
| Embecta | 25,000 | 253,250 | ||||||
| Emergent BioSolutions * | 1 | 2 | ||||||
| Enanta Pharmaceuticals * | 9,220 | 126,683 | ||||||
| Enhabit * | 23,979 | 241,948 | ||||||
| Enliven Therapeutics * | 11,276 | 196,090 | ||||||
| Ensign Group | 24,814 | 2,936,985 | ||||||
| Entrada Therapeutics * | 10,874 | 128,857 | ||||||
| Erasca * | 1 | 2 | ||||||
| Evolent Health, Cl A * | 50,059 | 1,388,637 | ||||||
| Evolus * | 18,629 | 219,263 | ||||||
| Eyenovia * | 1 | 1 | ||||||
| EyePoint Pharmaceuticals * | 14,702 | 258,755 | ||||||
| Fate Therapeutics * | 38,381 | 151,605 | ||||||
| FibroGen * | 1 | 1 | ||||||
| Foghorn Therapeutics * | 8,145 | 44,472 | ||||||
| Fulgent Genetics * | 9,317 | 189,601 | ||||||
| Genelux * | 8,772 | 27,281 | ||||||
| Generation Bio * | 1 | 3 | ||||||
| Geron * | 1 | 4 | ||||||
| Glaukos * | 21,092 | 2,024,832 | ||||||
| Gritstone bio * | 1 | 1 | ||||||
| Guardant Health * | 51,927 | 934,686 | ||||||
| Haemonetics * | 22,874 | 2,103,264 | ||||||
| Halozyme Therapeutics * | 60,171 | 2,292,515 | ||||||
| Harmony Biosciences Holdings * | 15,100 | 466,741 | ||||||
| Harrow * | 12,628 | 128,679 | ||||||
| Harvard Bioscience * | 20,973 | 80,117 | ||||||
| Health Catalyst * | 25,818 | 160,588 | ||||||
| HealthEquity * | 38,149 | 3,010,338 | ||||||
| HealthStream | 10,872 | 280,171 | ||||||
| Heron Therapeutics * | 1 | 2 | ||||||
| HilleVax * | 12,012 | 158,558 | ||||||
The accompanying notes are an integral part of the financial statements.
53
![]()
| Schedule of Investments | April 30, 2024 (Unaudited) | |
| Global X Russell 2000 Covered Call ETF | ||
| Shares | Value | |||||||
| COMMON STOCK — continued | ||||||||
| Health Care — continued | ||||||||
| Hims & Hers Health * | 54,999 | $ | 689,137 | |||||
| Humacyte * | 1 | 4 | ||||||
| Ideaya Biosciences * | 34,153 | 1,388,319 | ||||||
| IGM Biosciences * | 4,241 | 40,841 | ||||||
| Ikena Oncology * | 1 | 1 | ||||||
| Immuneering, Cl A * | 1 | 1 | ||||||
| ImmunityBio * | 60,060 | 479,879 | ||||||
| Immunovant * | 24,787 | 680,155 | ||||||
| Inari Medical * | 24,958 | 931,932 | ||||||
| InfuSystem Holdings * | 10,267 | 77,105 | ||||||
| Inhibrx * | 15,798 | 537,764 | ||||||
| Inmode * | 35,301 | 606,824 | ||||||
| Innovage Holding * | 13,867 | 49,228 | ||||||
| Innoviva * | 27,317 | 412,760 | ||||||
| Inogen * | 9,588 | 65,198 | ||||||
| Inozyme Pharma * | 1 | 4 | ||||||
| Insmed * | 62,399 | 1,542,503 | ||||||
| Integer Holdings * | 15,363 | 1,714,972 | ||||||
| Intellia Therapeutics * | 40,111 | 858,375 | ||||||
| Intra-Cellular Therapies * | 43,226 | 3,104,059 | ||||||
| Iovance Biotherapeutics * | 109,078 | 1,284,939 | ||||||
| iRadimed | 3,438 | 139,617 | ||||||
| iRhythm Technologies * | 14,183 | 1,554,173 | ||||||
| Ironwood Pharmaceuticals, Cl A * | 62,368 | 483,352 | ||||||
| iTeos Therapeutics * | 10,236 | 109,935 | ||||||
| Janux Therapeutics * | 7,432 | 423,624 | ||||||
| Joint * | 6,430 | 76,774 | ||||||
| KalVista Pharmaceuticals * | 9,401 | 106,701 | ||||||
| Karyopharm Therapeutics * | 1 | 1 | ||||||
| Keros Therapeutics * | 14,927 | 841,734 | ||||||
| Kezar Life Sciences * | 1 | 1 | ||||||
| Kiniksa Pharmaceuticals, Cl A * | 15,634 | 292,668 | ||||||
| Kodiak Sciences * | 1 | 3 | ||||||
| KORU Medical Systems * | 1 | 2 | ||||||
| Krystal Biotech * | 9,919 | 1,518,797 | ||||||
| Kura Oncology * | 32,116 | 630,116 | ||||||
| Kymera Therapeutics * | 17,463 | 587,106 | ||||||
| Lantheus Holdings * | 30,888 | 2,055,288 | ||||||
| Larimar Therapeutics * | 1 | 7 | ||||||
The accompanying notes are an integral part of the financial statements.
54
![]()
| Schedule of Investments | April 30, 2024 (Unaudited) | |
| Global X Russell 2000 Covered Call ETF | ||
| Shares | Value | |||||||
| COMMON STOCK — continued | ||||||||
| Health Care — continued | ||||||||
| LeMaitre Vascular | 9,042 | $ | 585,922 | |||||
| LENZ Therapeutics | 1 | 16 | ||||||
| Lexeo Therapeutics * | 4,637 | 57,731 | ||||||
| Lexicon Pharmaceuticals * | 1 | 2 | ||||||
| LifeStance Health Group * | 49,051 | 303,135 | ||||||
| Ligand Pharmaceuticals * | 7,989 | 558,351 | ||||||
| Lineage Cell Therapeutics * | 1 | 1 | ||||||
| Liquidia * | 19,771 | 254,057 | ||||||
| LivaNova * | 25,058 | 1,396,984 | ||||||
| Longboard Pharmaceuticals * | 9,578 | 204,011 | ||||||
| Lyell Immunopharma * | 1 | 2 | ||||||
| MacroGenics * | 44,563 | 658,641 | ||||||
| Madrigal Pharmaceuticals * | 6,696 | 1,366,118 | ||||||
| MannKind * | 102,986 | 423,272 | ||||||
| Marinus Pharmaceuticals * | 1 | 1 | ||||||
| MaxCyte * | 1 | 4 | ||||||
| MeiraGTx Holdings * | 12,489 | 60,946 | ||||||
| Merit Medical Systems * | 26,502 | 1,963,798 | ||||||
| Merrimack Pharmaceuticals * | 6,417 | 94,587 | ||||||
| Mersana Therapeutics * | 1 | 3 | ||||||
| Mesa Laboratories | 2,260 | 239,741 | ||||||
| MiMedx Group * | 49,107 | 302,499 | ||||||
| Mineralys Therapeutics * | 5,236 | 64,141 | ||||||
| Mirum Pharmaceuticals * | 11,793 | 296,122 | ||||||
| ModivCare * | 5,796 | 136,032 | ||||||
| Monte Rosa Therapeutics * | 11,946 | 63,553 | ||||||
| Morphic Holding * | 16,733 | 456,309 | ||||||
| Multiplan * | 1 | 1 | ||||||
| Mural Oncology * | 7,382 | 27,313 | ||||||
| Myriad Genetics * | 36,754 | 719,276 | ||||||
| National HealthCare | 5,589 | 507,872 | ||||||
| National Research | 6,647 | 227,660 | ||||||
| Nautilus Biotechnology, Cl A * | 1 | 3 | ||||||
| Neogen * | 98,392 | 1,213,173 | ||||||
| NeoGenomics * | 63,547 | 884,574 | ||||||
| Neumora Therapeutics * | 6,779 | 61,621 | ||||||
| Nevro * | 15,004 | 158,742 | ||||||
| Nkarta * | 1 | 7 | ||||||
| Novavax * | 41,465 | 179,543 | ||||||
The accompanying notes are an integral part of the financial statements.
55
![]()
| Schedule of Investments | April 30, 2024 (Unaudited) | |
| Global X Russell 2000 Covered Call ETF | ||
| Shares | Value | |||||||
| COMMON STOCK — continued | ||||||||
| Health Care — continued | ||||||||
| Nurix Therapeutics * | 23,065 | $ | 277,241 | |||||
| Nuvalent, Cl A * | 12,042 | 829,453 | ||||||
| Nuvation Bio * | 1 | 3 | ||||||
| Nuvectis Pharma * | 4,274 | 25,986 | ||||||
| Ocean Biomedical * | 1 | 1 | ||||||
| Ocular Therapeutix * | 55,812 | 264,549 | ||||||
| Olema Pharmaceuticals * | 14,584 | 148,319 | ||||||
| Omega Therapeutics * | 1 | 2 | ||||||
| Omeros * | 1 | 3 | ||||||
| Omnicell * | 20,997 | 562,930 | ||||||
| OPKO Health * | 1 | 1 | ||||||
| OptimizeRx * | 7,556 | 77,071 | ||||||
| Optinose * | 1 | 1 | ||||||
| Option Care Health * | 77,132 | 2,305,475 | ||||||
| OraSure Technologies * | 39,618 | 209,579 | ||||||
| Orchestra BioMed Holdings * | 4,591 | 20,246 | ||||||
| Organogenesis Holdings, Cl A * | 1 | 2 | ||||||
| ORIC Pharmaceuticals * | 20,681 | 182,613 | ||||||
| Orthofix Medical * | 15,206 | 197,678 | ||||||
| OrthoPediatrics * | 7,024 | 208,121 | ||||||
| Outset Medical * | 1 | 3 | ||||||
| Ovid therapeutics * | 1 | 3 | ||||||
| Owens & Minor * | 33,799 | 836,187 | ||||||
| P3 Health Partners * | 1 | 1 | ||||||
| Pacific Biosciences of California * | 1 | 2 | ||||||
| Pacira BioSciences * | 20,814 | 546,368 | ||||||
| Paragon 28 * | 21,994 | 202,785 | ||||||
| Patterson | 39,075 | 995,240 | ||||||
| PDS Biotechnology * | 51,576 | 172,780 | ||||||
| Pediatrix Medical Group * | 35,983 | 319,169 | ||||||
| Pennant Group * | 13,060 | 273,085 | ||||||
| PepGen * | 6,927 | 85,064 | ||||||
| PetIQ, Cl A * | 12,030 | 196,330 | ||||||
| Phathom Pharmaceuticals * | 12,207 | 110,229 | ||||||
| Phibro Animal Health, Cl A | 8,983 | 150,016 | ||||||
| Phreesia * | 24,137 | 500,601 | ||||||
| Pliant Therapeutics * | 25,868 | 305,760 | ||||||
| PMV Pharmaceuticals * | 1 | 2 | ||||||
| Poseida Therapeutics, Cl A * | 1 | 2 | ||||||
The accompanying notes are an integral part of the financial statements.
56
![]()
| Schedule of Investments | April 30, 2024 (Unaudited) | |
| Global X Russell 2000 Covered Call ETF | ||
| Shares | Value | |||||||
| COMMON STOCK — continued | ||||||||
| Health Care — continued | ||||||||
| Precigen * | 1 | $ | 1 | |||||
| Prelude Therapeutics * | 1 | 4 | ||||||
| Prestige Consumer Healthcare * | 22,932 | 1,645,600 | ||||||
| Prime Medicine * | 18,871 | 92,845 | ||||||
| Privia Health Group * | 51,212 | 942,301 | ||||||
| PROCEPT BioRobotics * | 18,308 | 969,958 | ||||||
| Progyny * | 35,351 | 1,133,353 | ||||||
| ProKidney, Cl A * | 1 | 2 | ||||||
| Protagonist Therapeutics * | 25,990 | 652,609 | ||||||
| Protalix BioTherapeutics * | 1 | 1 | ||||||
| PTC Therapeutics * | 32,309 | 1,038,734 | ||||||
| Pulmonx * | 14,391 | 109,516 | ||||||
| Pulse Biosciences * | 10,571 | 77,908 | ||||||
| Quanterix * | 16,471 | 265,513 | ||||||
| Quantum-Si * | 1 | 2 | ||||||
| Quipt Home Medical * | 21,844 | 78,638 | ||||||
| RadNet * | 26,995 | 1,309,258 | ||||||
| Rallybio * | 1 | 2 | ||||||
| RAPT Therapeutics * | 16,631 | 128,059 | ||||||
| Recursion Pharmaceuticals, Cl A * | 66,042 | 516,448 | ||||||
| REGENXBIO * | 18,736 | 287,598 | ||||||
| Relay Therapeutics * | 37,002 | 241,253 | ||||||
| Reneo Pharmaceuticals * | 1 | 2 | ||||||
| Replimune Group * | 22,969 | 145,853 | ||||||
| Revance Therapeutics * | 35,831 | 129,350 | ||||||
| REVOLUTION Medicines * | 65,341 | 2,435,912 | ||||||
| Rhythm Pharmaceuticals * | 23,827 | 947,362 | ||||||
| Rigel Pharmaceuticals * | 1 | 1 | ||||||
| Rocket Pharmaceuticals * | 27,945 | 601,376 | ||||||
| RxSight * | 13,580 | 707,925 | ||||||
| Sage Therapeutics * | 24,928 | 347,496 | ||||||
| Sagimet Biosciences, Cl A * | 2,284 | 8,908 | ||||||
| Sana Biotechnology * | 43,454 | 391,086 | ||||||
| Sanara Medtech * | 2,228 | 70,940 | ||||||
| Sangamo Therapeutics * | 1 | 1 | ||||||
| Savara * | 1 | 5 | ||||||
| Scholar Rock Holding * | 25,515 | 374,305 | ||||||
| Schrodinger * | 24,519 | 597,773 | ||||||
| scPharmaceuticals * | 14,884 | 66,531 | ||||||
The accompanying notes are an integral part of the financial statements.
57
![]()
| Schedule of Investments | April 30, 2024 (Unaudited) | |
| Global X Russell 2000 Covered Call ETF | ||
| Shares | Value | |||||||
| COMMON STOCK — continued | ||||||||
| Health Care — continued | ||||||||
| Seer, Cl A * | 1 | $ | 2 | |||||
| Select Medical Holdings | 47,310 | 1,342,185 | ||||||
| Semler Scientific * | 3,071 | 78,403 | ||||||
| Seres Therapeutics * | 1 | 1 | ||||||
| Sharecare * | 1 | 1 | ||||||
| SI-BONE * | 18,176 | 259,190 | ||||||
| SIGA Technologies | 19,751 | 173,414 | ||||||
| Sight Sciences * | 1 | 6 | ||||||
| Silk Road Medical * | 16,826 | 327,097 | ||||||
| Simulations Plus | 7,315 | 331,735 | ||||||
| SpringWorks Therapeutics * | 30,343 | 1,416,715 | ||||||
| STAAR Surgical * | 22,679 | 1,042,327 | ||||||
| Stoke Therapeutics * | 9,461 | 104,355 | ||||||
| Summit Therapeutics * | 1 | 4 | ||||||
| Supernus Pharmaceuticals * | 22,445 | 675,595 | ||||||
| Surgery Partners * | 34,139 | 851,768 | ||||||
| Surmodics * | 6,393 | 164,236 | ||||||
| Sutro Biopharma * | 1 | 3 | ||||||
| Syndax Pharmaceuticals * | 41,423 | 875,268 | ||||||
| Tactile Systems Technology * | 16,846 | 231,969 | ||||||
| Tango Therapeutics * | 19,290 | 148,533 | ||||||
| Taro Pharmaceutical Industries * | 4,170 | 177,142 | ||||||
| Tarsus Pharmaceuticals * | 14,399 | 452,561 | ||||||
| Tela Bio * | 9,097 | 40,982 | ||||||
| Tenaya Therapeutics * | 1 | 5 | ||||||
| Terns Pharmaceuticals * | 39,136 | 197,637 | ||||||
| TG Therapeutics * | 63,047 | 861,222 | ||||||
| Theravance Biopharma * | 29,858 | 252,002 | ||||||
| Third Harmonic Bio * | 8,591 | 95,704 | ||||||
| TransMedics Group * | 14,940 | 1,406,302 | ||||||
| Travere Therapeutics * | 29,936 | 165,546 | ||||||
| Treace Medical Concepts * | 20,725 | 214,918 | ||||||
| Trevi Therapeutics * | 1 | 3 | ||||||
| TruBridge * | 6,264 | 49,486 | ||||||
| Turnstone Biologics * | 1 | 3 | ||||||
| Twist Bioscience * | 25,987 | 811,574 | ||||||
| Tyra Biosciences * | 6,382 | 109,132 | ||||||
| UFP Technologies * | 3,412 | 702,667 | ||||||
| UroGen Pharma * | 12,466 | 172,280 | ||||||
The accompanying notes are an integral part of the financial statements.
58
![]()
| Schedule of Investments | April 30, 2024 (Unaudited) | |
| Global X Russell 2000 Covered Call ETF | ||
| Shares | Value | |||||||
| COMMON STOCK — continued | ||||||||
| Health Care — continued | ||||||||
| US Physical Therapy | 6,684 | $ | 678,493 | |||||
| Utah Medical Products | 1,629 | 107,840 | ||||||
| Vanda Pharmaceuticals * | 26,160 | 124,522 | ||||||
| Varex Imaging * | 17,737 | 288,226 | ||||||
| Vaxcyte * | 47,440 | 2,872,492 | ||||||
| Vaxxinity, Cl A * | 1 | — | ||||||
| Ventyx Biosciences * | 1 | 4 | ||||||
| Vera Therapeutics, Cl A * | 21,192 | 837,296 | ||||||
| Veracyte * | 32,752 | 640,957 | ||||||
| Vericel * | 21,320 | 977,948 | ||||||
| Verrica Pharmaceuticals * | 47,963 | 334,062 | ||||||
| Verve Therapeutics * | 23,834 | 143,242 | ||||||
| Vicarious Surgical, Cl A * | 1 | — | ||||||
| Viemed Healthcare * | 17,377 | 142,318 | ||||||
| Vigil Neuroscience * | 1 | 3 | ||||||
| Viking Therapeutics * | 46,491 | 3,699,754 | ||||||
| Vir Biotechnology * | 37,659 | 318,595 | ||||||
| Viridian Therapeutics * | 20,792 | 275,702 | ||||||
| Vor BioPharma * | 1 | 2 | ||||||
| Voyager Therapeutics * | 15,812 | 123,650 | ||||||
| WaVe Life Sciences * | 33,050 | 162,937 | ||||||
| X4 Pharmaceuticals * | 1 | 1 | ||||||
| Xencor * | 26,414 | 553,109 | ||||||
| Xeris Biopharma Holdings * | 1 | 2 | ||||||
| XOMA * | 4,438 | 112,459 | ||||||
| Y-mAbs Therapeutics * | 25,001 | 380,265 | ||||||
| Zentalis Pharmaceuticals * | 26,545 | 293,588 | ||||||
| Zevra Therapeutics * | 19,072 | 87,350 | ||||||
| Zimvie * | 11,856 | 180,211 | ||||||
| Zymeworks * | 26,210 | 224,882 | ||||||
| Zynex * | 9,231 | 101,264 | ||||||
| 161,120,822 | ||||||||
| Industrials — 14.0% | ||||||||
| 374Water * | 1 | 1 | ||||||
| 3D Systems * | 56,355 | 188,789 | ||||||
| AAON | 31,319 | 2,946,805 | ||||||
| AAR * | 16,272 | 1,125,046 | ||||||
| ABM Industries | 30,136 | 1,316,943 | ||||||
The accompanying notes are an integral part of the financial statements.
59
![]()
| Schedule of Investments | April 30, 2024 (Unaudited) | |
| Global X Russell 2000 Covered Call ETF | ||
| Shares | Value | |||||||
| COMMON STOCK — continued | ||||||||
| Industrials — continued | ||||||||
| ACCO Brands | 38,553 | $ | 185,825 | |||||
| ACV Auctions, Cl A * | 57,811 | 1,008,802 | ||||||
| AeroVironment * | 12,299 | 1,965,257 | ||||||
| AerSale * | 11,619 | 82,843 | ||||||
| Air Transport Services Group * | 25,156 | 322,500 | ||||||
| Alamo Group | 4,801 | 933,218 | ||||||
| Albany International, Cl A | 14,642 | 1,167,699 | ||||||
| Alight, Cl A * | 191,140 | 1,724,083 | ||||||
| Allegiant Travel | 7,053 | 384,812 | ||||||
| Allient | 6,218 | 182,747 | ||||||
| Alta Equipment Group | 9,163 | 101,801 | ||||||
| Ameresco, Cl A * | 14,350 | 300,345 | ||||||
| American Woodmark * | 7,584 | 698,335 | ||||||
| Amprius Technologies * | 1 | 2 | ||||||
| API Group * | 94,953 | 3,662,337 | ||||||
| Apogee Enterprises | 10,237 | 632,442 | ||||||
| Applied Industrial Technologies | 17,518 | 3,210,173 | ||||||
| ArcBest | 11,263 | 1,249,179 | ||||||
| Archer Aviation, Cl A * | 68,121 | 264,309 | ||||||
| Arcosa | 22,544 | 1,713,795 | ||||||
| Argan | 6,449 | 388,617 | ||||||
| Aris Water Solutions, Cl A | 16,967 | 238,047 | ||||||
| Array Technologies * | 68,835 | 849,424 | ||||||
| Astec Industries | 10,147 | 424,145 | ||||||
| Astronics * | 11,672 | 195,739 | ||||||
| Asure Software * | 10,178 | 75,215 | ||||||
| Atkore | 18,653 | 3,269,871 | ||||||
| Atmus Filtration Technologies * | 38,137 | 1,155,170 | ||||||
| AZZ | 11,079 | 793,589 | ||||||
| Babcock & Wilcox Enterprises * | 1 | 1 | ||||||
| Barnes Group | 21,839 | 758,250 | ||||||
| Barrett Business Services | 3,154 | 383,211 | ||||||
| Beacon Roofing Supply * | 28,662 | 2,824,067 | ||||||
| BlackSky Technology * | 1 | 1 | ||||||
| Blade Air Mobility * | 1 | 3 | ||||||
| Blink Charging * | 1 | 3 | ||||||
| Bloom Energy, Cl A * | 86,026 | 957,469 | ||||||
| Blue Bird * | 11,472 | 378,060 | ||||||
| BlueLinx Holdings * | 3,990 | 437,583 | ||||||
The accompanying notes are an integral part of the financial statements.
60
![]()
| Schedule of Investments | April 30, 2024 (Unaudited) | |
| Global X Russell 2000 Covered Call ETF | ||
| Shares | Value | |||||||
| COMMON STOCK — continued | ||||||||
| Industrials — continued | ||||||||
| Boise Cascade | 19,696 | $ | 2,605,190 | |||||
| Bowman Consulting Group, Cl A * | 5,142 | 167,064 | ||||||
| BrightView Holdings * | 19,038 | 214,177 | ||||||
| Brink’s | 21,420 | 1,873,393 | ||||||
| Cadre Holdings | 9,385 | 312,990 | ||||||
| Casella Waste Systems, Cl A * | 25,772 | 2,329,789 | ||||||
| CBIZ * | 22,158 | 1,577,206 | ||||||
| CECO Environmental * | 14,745 | 318,787 | ||||||
| Chart Industries * | 19,564 | 2,818,390 | ||||||
| Columbus McKinnon | 12,775 | 527,224 | ||||||
| Comfort Systems USA | 16,090 | 4,978,407 | ||||||
| Commercial Vehicle Group * | 16,390 | 98,504 | ||||||
| CompX International | 1,017 | 32,025 | ||||||
| Concrete Pumping Holdings * | 11,797 | 78,450 | ||||||
| Conduent * | 1 | 3 | ||||||
| Construction Partners, Cl A * | 18,933 | 977,700 | ||||||
| CoreCivic * | 49,413 | 736,254 | ||||||
| Covenant Logistics Group, Cl A | 5,292 | 239,145 | ||||||
| CRA International | 3,063 | 444,411 | ||||||
| CSG Systems International | 15,134 | 714,930 | ||||||
| CSW Industrials | 7,056 | 1,676,647 | ||||||
| Custom Truck One Source * | 24,435 | 121,931 | ||||||
| Deluxe | 19,878 | 392,590 | ||||||
| Desktop Metal, Cl A * | 1 | 1 | ||||||
| Distribution Solutions Group * | 4,674 | 154,102 | ||||||
| DNOW * | 47,435 | 669,308 | ||||||
| Douglas Dynamics | 10,408 | 235,637 | ||||||
| Dragonfly Energy Holdings * | 1 | 1 | ||||||
| Ducommun * | 6,658 | 360,131 | ||||||
| DXP Enterprises * | 7,228 | 352,437 | ||||||
| Dycom Industries * | 13,142 | 1,840,143 | ||||||
| Encore Wire | 8,230 | 2,299,133 | ||||||
| Energy Recovery * | 25,432 | 378,937 | ||||||
| Energy Vault Holdings * | 1 | 1 | ||||||
| Enerpac Tool Group, Cl A | 25,913 | 923,280 | ||||||
| EnerSys | 18,878 | 1,707,515 | ||||||
| Ennis | 11,172 | 222,323 | ||||||
| Enovix * | 61,758 | 386,605 | ||||||
| Enpro | 9,686 | 1,454,159 | ||||||
The accompanying notes are an integral part of the financial statements.
61
![]()
| Schedule of Investments | April 30, 2024 (Unaudited) | |
| Global X Russell 2000 Covered Call ETF | ||
| Shares | Value | |||||||
| COMMON STOCK — continued | ||||||||
| Industrials — continued | ||||||||
| Enviri * | 32,410 | $ | 252,150 | |||||
| Eos Energy Enterprises * | 1 | 1 | ||||||
| ESCO Technologies | 11,529 | 1,169,617 | ||||||
| ESS Tech * | 1 | 1 | ||||||
| Eve Holding * | 10,020 | 54,008 | ||||||
| EVI Industries | 3,107 | 63,756 | ||||||
| ExlService Holdings * | 73,706 | 2,137,474 | ||||||
| Exponent | 23,110 | 2,124,040 | ||||||
| Federal Signal | 27,462 | 2,232,661 | ||||||
| First Advantage | 25,204 | 410,825 | ||||||
| FiscalNote Holdings * | 1 | 1 | ||||||
| Fluence Energy, Cl A * | 26,564 | 473,902 | ||||||
| Fluor * | 64,494 | 2,601,043 | ||||||
| Forrester Research * | 5,000 | 90,950 | ||||||
| Forward Air | 11,700 | 257,634 | ||||||
| Franklin Covey * | 5,441 | 211,873 | ||||||
| Franklin Electric | 21,121 | 2,033,319 | ||||||
| Frontier Group Holdings * | 16,222 | 97,981 | ||||||
| FTAI Aviation | 45,389 | 3,186,762 | ||||||
| FTAI Infrastructure | 44,838 | 324,627 | ||||||
| FTC Solar * | 1 | — | ||||||
| FuelCell Energy * | 1 | 1 | ||||||
| GATX | 16,138 | 1,974,646 | ||||||
| Genco Shipping & Trading | 18,945 | 404,286 | ||||||
| Gencor Industries * | 6,096 | 103,449 | ||||||
| GEO Group * | 52,803 | 784,653 | ||||||
| Gibraltar Industries * | 14,069 | 1,005,371 | ||||||
| Global Industrial | 5,678 | 218,660 | ||||||
| GMS * | 18,563 | 1,717,449 | ||||||
| Gorman-Rupp | 10,536 | 349,479 | ||||||
| GrafTech International | 1 | 2 | ||||||
| Granite Construction | 20,280 | 1,125,540 | ||||||
| Great Lakes Dredge & Dock * | 28,107 | 185,506 | ||||||
| Greenbrier | 13,618 | 672,593 | ||||||
| Griffon | 21,335 | 1,397,869 | ||||||
| H&E Equipment Services | 14,456 | 698,080 | ||||||
| Hawaiian Holdings * | 21,780 | 276,606 | ||||||
| Healthcare Services Group * | 31,957 | 339,383 | ||||||
| Heartland Express | 20,219 | 200,977 | ||||||
The accompanying notes are an integral part of the financial statements.
62
![]()
| Schedule of Investments | April 30, 2024 (Unaudited) | |
| Global X Russell 2000 Covered Call ETF | ||
| Shares | Value | |||||||
| COMMON STOCK — continued | ||||||||
| Industrials — continued | ||||||||
| Heidrick & Struggles International | 9,172 | $ | 270,391 | |||||
| Helios Technologies | 15,187 | 684,934 | ||||||
| Herc Holdings | 12,907 | 1,846,088 | ||||||
| Hillenbrand | 31,428 | 1,499,744 | ||||||
| Hillman Solutions * | 87,900 | 840,324 | ||||||
| HireQuest | 10,871 | 139,366 | ||||||
| HireRight Holdings * | 9,061 | 129,572 | ||||||
| HNI | 21,056 | 883,299 | ||||||
| Hub Group, Cl A | 28,816 | 1,158,980 | ||||||
| Hudson Technologies * | 20,735 | 205,691 | ||||||
| Huron Consulting Group * | 9,216 | 859,300 | ||||||
| Hyliion Holdings * | 1 | 1 | ||||||
| Hyster-Yale Materials Handling | 4,864 | 284,884 | ||||||
| IBEX Holdings * | 4,114 | 53,893 | ||||||
| ICF International | 8,668 | 1,250,706 | ||||||
| IES Holdings * | 4,002 | 540,750 | ||||||
| Innodata * | 13,030 | 76,095 | ||||||
| INNOVATE * | 1 | 1 | ||||||
| Insperity | 17,368 | 1,787,688 | ||||||
| Insteel Industries | 8,645 | 277,504 | ||||||
| Interface, Cl A | 27,420 | 419,252 | ||||||
| Janus International Group * | 37,320 | 537,781 | ||||||
| JELD-WEN Holding * | 38,292 | 784,986 | ||||||
| JetBlue Airways * | 148,031 | 840,816 | ||||||
| Joby Aviation * | 125,888 | 635,734 | ||||||
| John Bean Technologies | 14,695 | 1,309,178 | ||||||
| Kadant | 5,755 | 1,575,661 | ||||||
| Karat Packaging | 2,468 | 66,883 | ||||||
| Kelly Services, Cl A | 15,165 | 347,885 | ||||||
| Kennametal | 36,768 | 865,151 | ||||||
| Kforce | 8,855 | 546,885 | ||||||
| Korn Ferry | 23,748 | 1,441,979 | ||||||
| Kratos Defense & Security Solutions * | 66,391 | 1,183,088 | ||||||
| LanzaTech Global * | 1 | 2 | ||||||
| Legalzoom.com * | 62,721 | 749,516 | ||||||
| Leonardo DRS * | 31,118 | 669,659 | ||||||
| Limbach Holdings * | 5,032 | 228,101 | ||||||
| Lindsay | 5,052 | 586,790 | ||||||
| Liquidity Services * | 10,657 | 183,940 | ||||||
The accompanying notes are an integral part of the financial statements.
63
![]()
| Schedule of Investments | April 30, 2024 (Unaudited) | |
| Global X Russell 2000 Covered Call ETF | ||
| Shares | Value | |||||||
| COMMON STOCK — continued | ||||||||
| Industrials — continued | ||||||||
| LSI Industries | 13,278 | $ | 193,859 | |||||
| Manitowoc * | 15,417 | 186,546 | ||||||
| Marten Transport | 26,495 | 448,295 | ||||||
| Masonite International * | 9,960 | 1,320,198 | ||||||
| Masterbrand * | 58,972 | 983,063 | ||||||
| Matson | 17,367 | 1,871,815 | ||||||
| Matthews International, Cl A | 13,233 | 357,026 | ||||||
| Maximus | 27,730 | 2,226,164 | ||||||
| Mayville Engineering * | 6,468 | 89,000 | ||||||
| McGrath RentCorp | 12,126 | 1,293,359 | ||||||
| Microvast Holdings * | 1 | — | ||||||
| Miller Industries | 4,955 | 241,358 | ||||||
| MillerKnoll | 35,492 | 902,562 | ||||||
| Mistras Group * | 12,261 | 107,284 | ||||||
| Montrose Environmental Group * | 12,805 | 555,993 | ||||||
| Moog, Cl A | 12,894 | 2,051,049 | ||||||
| MRC Global * | 35,535 | 399,058 | ||||||
| Mueller Industries | 51,230 | 2,859,659 | ||||||
| Mueller Water Products, Cl A | 70,619 | 1,118,605 | ||||||
| MYR Group * | 7,647 | 1,271,314 | ||||||
| National Presto Industries | 2,302 | 188,741 | ||||||
| NEXTracker, Cl A * | 57,346 | 2,453,835 | ||||||
| Nikola * | 1 | 1 | ||||||
| NL Industries | 3,258 | 26,748 | ||||||
| Northwest Pipe *(A) | 4,289 | 135,747 | ||||||
| NuScale Power * | 1 | 6 | ||||||
| NV5 Global * | 6,371 | 594,032 | ||||||
| Omega Flex | 1,477 | 97,866 | ||||||
| OPENLANE * | 51,286 | 881,093 | ||||||
| PAM Transportation Services * | 3,245 | 55,587 | ||||||
| Pangaea Logistics Solutions | 19,278 | 138,802 | ||||||
| Park Aerospace | 8,145 | 116,229 | ||||||
| Park-Ohio Holdings | 4,962 | 126,680 | ||||||
| Parsons * | 18,592 | 1,459,658 | ||||||
| Performant Financial * | 1 | 3 | ||||||
| Pitney Bowes | 1 | 4 | ||||||
| Planet Labs PBC * | 1 | 2 | ||||||
| Powell Industries | 4,181 | 597,883 | ||||||
| Preformed Line Products | 1,339 | 162,059 | ||||||
The accompanying notes are an integral part of the financial statements.
64
![]()
| Schedule of Investments | April 30, 2024 (Unaudited) | |
| Global X Russell 2000 Covered Call ETF | ||
| Shares | Value | |||||||
| COMMON STOCK — continued | ||||||||
| Industrials — continued | ||||||||
| Primoris Services | 23,904 | $ | 1,113,926 | |||||
| Proto Labs * | 11,886 | 362,285 | ||||||
| Quad | 13,714 | 61,576 | ||||||
| Quanex Building Products | 15,126 | 502,486 | ||||||
| Radiant Logistics * | 15,950 | 78,793 | ||||||
| Redwire * | 1 | 4 | ||||||
| Resideo Technologies * | 65,940 | 1,287,808 | ||||||
| Resources Connection | 13,731 | 151,728 | ||||||
| REV Group | 14,491 | 316,773 | ||||||
| Rocket Lab USA * | 126,379 | 475,185 | ||||||
| Rush Enterprises, Cl A | 28,552 | 1,254,004 | ||||||
| Rush Enterprises, Cl B | 4,381 | 179,227 | ||||||
| RXO * | 52,904 | 1,000,415 | ||||||
| SES AI * | 1 | 2 | ||||||
| Shoals Technologies Group, Cl A * | 76,228 | 644,127 | ||||||
| Shyft Group | 14,946 | 162,612 | ||||||
| Simpson Manufacturing | 19,688 | 3,423,546 | ||||||
| Skillsoft * | 4,196 | 30,169 | ||||||
| SkyWest * | 21,369 | 1,560,578 | ||||||
| SKYX Platforms * | 1 | 1 | ||||||
| Southland Holdings * | 4,176 | 18,291 | ||||||
| SP Plus * | 9,931 | 507,077 | ||||||
| Spirit Airlines | 49,391 | 174,350 | ||||||
| SPX Technologies * | 20,664 | 2,517,082 | ||||||
| Standex International | 5,311 | 918,166 | ||||||
| Steelcase, Cl A | 41,710 | 501,771 | ||||||
| Stem * | 1 | 2 | ||||||
| Sterling Check * | 19,579 | 296,230 | ||||||
| Sterling Infrastructure * | 13,794 | 1,401,470 | ||||||
| Sun Country Airlines Holdings * | 20,133 | 267,970 | ||||||
| SunPower, Cl A * | 1 | 2 | ||||||
| Tennant | 8,448 | 984,023 | ||||||
| Terex | 30,791 | 1,725,836 | ||||||
| Terran Orbital * | 1 | 1 | ||||||
| Thermon Group Holdings * | 15,586 | 497,661 | ||||||
| Titan International * | 21,947 | 241,856 | ||||||
| Titan Machinery * | 9,529 | 212,116 | ||||||
| TPI Composites * | 1 | 3 | ||||||
| Transcat * | 3,507 | 376,547 | ||||||
The accompanying notes are an integral part of the financial statements.
65
![]()
| Schedule of Investments | April 30, 2024 (Unaudited) | |
| Global X Russell 2000 Covered Call ETF | ||
| Shares | Value | |||||||
| COMMON STOCK — continued | ||||||||
| Industrials — continued | ||||||||
| TriNet Group | 17,169 | $ | 1,723,253 | |||||
| Trinity Industries | 37,001 | 962,766 | ||||||
| Triumph Group * | 27,685 | 369,872 | ||||||
| TrueBlue * | 14,853 | 154,768 | ||||||
| TTEC Holdings | 8,333 | 60,664 | ||||||
| Tutor Perini * | 17,003 | 282,760 | ||||||
| UFP Industries | 27,575 | 3,107,702 | ||||||
| UniFirst | 6,828 | 1,093,368 | ||||||
| Universal Logistics Holdings | 3,432 | 153,342 | ||||||
| Upwork * | 57,503 | 672,785 | ||||||
| V2X * | 5,145 | 249,944 | ||||||
| Velo3D * | 1 | — | ||||||
| Verra Mobility, Cl A * | 63,779 | 1,503,909 | ||||||
| Viad * | 9,377 | 323,319 | ||||||
| Vicor * | 10,187 | 329,855 | ||||||
| Virgin Galactic Holdings * | 1 | 1 | ||||||
| VSE | 7,034 | 549,144 | ||||||
| Wabash National | 21,091 | 487,413 | ||||||
| Watts Water Technologies, Cl A | 12,461 | 2,473,010 | ||||||
| Werner Enterprises | 29,301 | 1,002,094 | ||||||
| Willdan Group * | 5,110 | 144,051 | ||||||
| Willis Lease Finance * | 1,765 | 85,797 | ||||||
| Xometry, Cl A * | 15,010 | 268,229 | ||||||
| Zurn Elkay Water Solutions | 67,221 | 2,102,673 | ||||||
| 194,512,747 | ||||||||
| Information Technology — 11.6% | ||||||||
| 8x8 * | 1 | 2 | ||||||
| 908 Devices * | 11,175 | 63,697 | ||||||
| A10 Networks | 34,100 | 445,346 | ||||||
| ACI Worldwide * | 49,474 | 1,687,063 | ||||||
| ACM Research, Cl A * | 22,050 | 562,716 | ||||||
| Adeia | 47,789 | 470,244 | ||||||
| ADTRAN Holdings | 34,934 | 153,011 | ||||||
| Advanced Energy Industries | 17,477 | 1,674,996 | ||||||
| Aehr Test Systems * | 11,914 | 142,730 | ||||||
| Agilysys * | 8,973 | 745,208 | ||||||
| Akoustis Technologies * | 1 | 1 | ||||||
| Alarm.com Holdings * | 22,463 | 1,493,789 | ||||||
The accompanying notes are an integral part of the financial statements.
66
![]()
| Schedule of Investments | April 30, 2024 (Unaudited) | |
| Global X Russell 2000 Covered Call ETF | ||
| Shares | Value | |||||||
| COMMON STOCK — continued | ||||||||
| Information Technology — continued | ||||||||
| Alkami Technology * | 17,685 | $ | 425,678 | |||||
| Alpha & Omega Semiconductor * | 10,376 | 226,923 | ||||||
| Altair Engineering, Cl A * | 24,472 | 1,968,772 | ||||||
| Ambarella * | 17,668 | 812,198 | ||||||
| American Software, Cl A | 17,436 | 176,278 | ||||||
| Amkor Technology | 50,807 | 1,643,606 | ||||||
| Amplitude, Cl A * | 33,514 | 328,102 | ||||||
| Appfolio, Cl A * | 8,887 | 2,015,394 | ||||||
| Appian, Cl A * | 18,734 | 701,401 | ||||||
| Applied Digital * | 1 | 3 | ||||||
| Arlo Technologies * | 38,625 | 478,177 | ||||||
| Asana, Cl A * | 36,243 | 538,933 | ||||||
| ASGN * | 22,277 | 2,148,617 | ||||||
| Atomera * | 9,743 | 45,208 | ||||||
| Aurora Innovation, Cl A * | 1 | 3 | ||||||
| AvePoint * | 71,041 | 551,989 | ||||||
| Aviat Networks * | 4,982 | 166,648 | ||||||
| Axcelis Technologies * | 15,044 | 1,557,355 | ||||||
| Badger Meter | 13,584 | 2,484,785 | ||||||
| Bel Fuse, Cl B | 4,995 | 293,306 | ||||||
| Belden | 19,877 | 1,615,404 | ||||||
| Benchmark Electronics | 15,810 | 477,620 | ||||||
| BigBear.ai Holdings * | 1 | 2 | ||||||
| BigCommerce Holdings * | 30,074 | 170,219 | ||||||
| Blackbaud * | 21,352 | 1,663,748 | ||||||
| BlackLine * | 26,257 | 1,524,219 | ||||||
| Box, Cl A * | 63,875 | 1,662,028 | ||||||
| Braze, Cl A * | 23,831 | 998,519 | ||||||
| Brightcove * | 1 | 2 | ||||||
| C3.ai, Cl A * | 36,782 | 828,698 | ||||||
| Calix * | 27,111 | 751,788 | ||||||
| Cambium Networks * | 5,073 | 17,197 | ||||||
| Cerence * | 18,060 | 164,527 | ||||||
| CEVA * | 10,762 | 218,146 | ||||||
| Cipher Mining * | 1 | 4 | ||||||
| Cleanspark * | 87,232 | 1,428,860 | ||||||
| Clear Secure, Cl A | 37,585 | 656,610 | ||||||
| Clearfield * | 5,859 | 176,473 | ||||||
| Climb Global Solutions | 2,289 | 147,549 | ||||||
The accompanying notes are an integral part of the financial statements.
67
![]()
| Schedule of Investments | April 30, 2024 (Unaudited) | |
| Global X Russell 2000 Covered Call ETF | ||
| Shares | Value | |||||||
| COMMON STOCK — continued | ||||||||
| Information Technology — continued | ||||||||
| Cohu * | 21,314 | $ | 646,240 | |||||
| CommScope Holding * | 1 | 1 | ||||||
| CommVault Systems * | 19,839 | 2,032,902 | ||||||
| CompoSecure, Cl A * | 3,243 | 22,539 | ||||||
| Comtech Telecommunications * | 1 | 2 | ||||||
| Consensus Cloud Solutions * | 9,121 | 106,168 | ||||||
| CoreCard * | 4,063 | 48,675 | ||||||
| Corsair Gaming * | 21,337 | 236,841 | ||||||
| Couchbase * | 15,239 | 367,869 | ||||||
| CPI Card Group * | 2,815 | 48,559 | ||||||
| Credo Technology Group Holding * | 57,793 | 1,032,761 | ||||||
| CS Disco * | 9,381 | 70,827 | ||||||
| CTS | 14,312 | 654,774 | ||||||
| CXApp * | 1 | 3 | ||||||
| Daily Journal * | 1,117 | 374,418 | ||||||
| Daktronics * | 20,802 | 196,579 | ||||||
| Digi International * | 16,135 | 494,699 | ||||||
| Digimarc * | 6,600 | 139,524 | ||||||
| Digital Turbine * | 1 | 2 | ||||||
| DigitalOcean Holdings * | 32,291 | 1,061,082 | ||||||
| Diodes * | 20,707 | 1,511,818 | ||||||
| Domo, Cl B * | 13,879 | 104,509 | ||||||
| DZS * | 1 | 1 | ||||||
| E2open Parent Holdings * | 1 | 5 | ||||||
| Eastman Kodak * | 19,992 | 89,964 | ||||||
| eGain * | 8,688 | 53,952 | ||||||
| Enfusion, Cl A * | 13,916 | 129,558 | ||||||
| Envestnet * | 24,320 | 1,509,542 | ||||||
| ePlus * | 12,123 | 932,016 | ||||||
| Everbridge * | 18,681 | 649,165 | ||||||
| EverCommerce * | 11,639 | 104,751 | ||||||
| Evolv Technologies Holdings * | 53,199 | 208,008 | ||||||
| Expensify, Cl A * | 1 | 2 | ||||||
| Extreme Networks * | 62,219 | 696,853 | ||||||
| FARO Technologies * | 7,967 | 149,381 | ||||||
| Fastly, Cl A * | 62,068 | 785,160 | ||||||
| FormFactor * | 35,640 | 1,589,188 | ||||||
| Freshworks, Cl A * | 73,685 | 1,315,277 | ||||||
| Grid Dynamics Holdings * | 22,933 | 224,055 | ||||||
The accompanying notes are an integral part of the financial statements.
68
![]()
| Schedule of Investments | April 30, 2024 (Unaudited) | |
| Global X Russell 2000 Covered Call ETF | ||
| Shares | Value | |||||||
| COMMON STOCK — continued | ||||||||
| Information Technology — continued | ||||||||
| Hackett Group | 11,682 | $ | 253,383 | |||||
| Harmonic * | 49,665 | 533,402 | ||||||
| Ichor Holdings * | 13,117 | 508,677 | ||||||
| Immersion | 16,991 | 123,525 | ||||||
| Impinj * | 10,370 | 1,652,771 | ||||||
| Infinera * | 90,371 | 435,588 | ||||||
| Information Services Group | 14,756 | 49,728 | ||||||
| Insight Enterprises * | 14,260 | 2,603,448 | ||||||
| Instructure Holdings * | 10,142 | 194,016 | ||||||
| Intapp * | 22,557 | 697,462 | ||||||
| InterDigital | 13,103 | 1,293,659 | ||||||
| inTEST * | 5,620 | 63,337 | ||||||
| Intevac * | 17,403 | 73,615 | ||||||
| IonQ * | 72,938 | 623,620 | ||||||
| Iteris * | 24,043 | 107,713 | ||||||
| Itron * | 21,046 | 1,938,758 | ||||||
| Jamf Holding * | 31,902 | 621,132 | ||||||
| Kaltura * | 1 | 1 | ||||||
| Kimball Electronics * | 10,579 | 221,418 | ||||||
| Knowles * | 40,947 | 648,191 | ||||||
| KVH Industries * | 10,540 | 50,592 | ||||||
| Lightwave Logic * | 46,256 | 176,698 | ||||||
| LivePerson * | 1 | 1 | ||||||
| LiveRamp Holdings * | 30,209 | 970,011 | ||||||
| Luna Innovations * | 16,509 | 34,009 | ||||||
| MACOM Technology Solutions Holdings * | 24,972 | 2,545,895 | ||||||
| Marathon Digital Holdings * | 106,675 | 1,713,201 | ||||||
| Matterport * | 1 | 5 | ||||||
| Maxeon Solar Technologies * | 1 | 2 | ||||||
| MaxLinear, Cl A * | 35,132 | 730,394 | ||||||
| MeridianLink * | 11,819 | 197,141 | ||||||
| Methode Electronics | 15,615 | 190,347 | ||||||
| MicroStrategy, Cl A * | 6,722 | 7,159,132 | ||||||
| MicroVision * | 1 | 1 | ||||||
| Mirion Technologies, Cl A * | 90,717 | 986,094 | ||||||
| Mitek Systems * | 17,749 | 224,170 | ||||||
| Model N * | 17,130 | 507,905 | ||||||
| N-able * | 31,448 | 385,552 | ||||||
| Napco Security Technologies | 14,473 | 589,051 | ||||||
The accompanying notes are an integral part of the financial statements.
69
![]()
| Schedule of Investments | April 30, 2024 (Unaudited) | |
| Global X Russell 2000 Covered Call ETF | ||
| Shares | Value | |||||||
| COMMON STOCK — continued | ||||||||
| Information Technology — continued | ||||||||
| Navitas Semiconductor, Cl A * | 47,419 | $ | 205,324 | |||||
| NETGEAR * | 12,489 | 184,587 | ||||||
| NetScout Systems * | 31,156 | 600,065 | ||||||
| NextNav * | 1 | 9 | ||||||
| nLight * | 21,409 | 243,849 | ||||||
| Novanta * | 16,291 | 2,549,542 | ||||||
| NVE | 2,336 | 190,150 | ||||||
| Olo, Cl A * | 45,630 | 219,024 | ||||||
| ON24 | 17,331 | 114,211 | ||||||
| OneSpan * | 19,473 | 210,698 | ||||||
| Onto Innovation * | 22,633 | 4,198,195 | ||||||
| Ooma * | 10,025 | 70,777 | ||||||
| OSI Systems * | 7,225 | 949,654 | ||||||
| PagerDuty * | 41,521 | 828,759 | ||||||
| PAR Technology * | 12,379 | 523,384 | ||||||
| PC Connection | 5,435 | 336,807 | ||||||
| PDF Solutions * | 14,355 | 431,798 | ||||||
| Perficient * | 16,015 | 756,869 | ||||||
| Photronics * | 27,905 | 764,876 | ||||||
| Plexus * | 12,740 | 1,286,867 | ||||||
| Power Integrations | 25,937 | 1,730,517 | ||||||
| PowerSchool Holdings, Cl A * | 25,754 | 446,059 | ||||||
| Presto Automation * | 1 | — | ||||||
| Progress Software | 21,279 | 1,060,120 | ||||||
| PROS Holdings * | 20,395 | 667,936 | ||||||
| Q2 Holdings * | 26,645 | 1,369,287 | ||||||
| Qualys * | 16,811 | 2,755,491 | ||||||
| Rackspace Technology * | 1 | 2 | ||||||
| Rambus * | 50,119 | 2,747,524 | ||||||
| Rapid7 * | 27,454 | 1,229,939 | ||||||
| Red Violet * | 5,177 | 86,870 | ||||||
| Ribbon Communications * | 1 | 3 | ||||||
| Richardson Electronics | 6,540 | 68,866 | ||||||
| Rimini Street * | 1 | 3 | ||||||
| Riot Platforms * | 92,389 | 934,053 | ||||||
| Rogers * | 8,314 | 990,114 | ||||||
| Sanmina * | 26,208 | 1,590,039 | ||||||
| ScanSource * | 11,361 | 472,845 | ||||||
| SEMrush Holdings, Cl A * | 16,387 | 200,577 | ||||||
The accompanying notes are an integral part of the financial statements.
70
![]()
| Schedule of Investments | April 30, 2024 (Unaudited) | |
| Global X Russell 2000 Covered Call ETF | ||
| Shares | Value | |||||||
| COMMON STOCK — continued | ||||||||
| Information Technology — continued | ||||||||
| Semtech * | 29,129 | $ | 1,095,833 | |||||
| Silicon Laboratories * | 14,325 | 1,740,344 | ||||||
| SiTime * | 7,829 | 697,720 | ||||||
| SkyWater Technology * | 8,716 | 89,426 | ||||||
| SMART Global Holdings * | 22,034 | 402,561 | ||||||
| SmartRent, Cl A * | 1 | 2 | ||||||
| SolarWinds | 22,927 | 252,656 | ||||||
| SoundHound AI, Cl A * | 62,537 | 265,157 | ||||||
| SoundThinking * | 3,947 | 52,732 | ||||||
| Sprinklr, Cl A * | 46,864 | 547,840 | ||||||
| Sprout Social, Cl A * | 22,319 | 1,125,994 | ||||||
| SPS Commerce * | 16,658 | 2,896,326 | ||||||
| Squarespace, Cl A * | 24,391 | 850,270 | ||||||
| Super Micro Computer * | 23,202 | 19,925,878 | ||||||
| Synaptics * | 17,955 | 1,615,232 | ||||||
| Tenable Holdings * | 51,568 | 2,319,013 | ||||||
| Terawulf * | 1 | 2 | ||||||
| Thoughtworks Holding * | 1 | 2 | ||||||
| Transphorm * | 1 | 5 | ||||||
| TTM Technologies * | 47,176 | 704,338 | ||||||
| Tucows, Cl A * | 4,255 | 75,186 | ||||||
| Turtle Beach * | 6,960 | 98,136 | ||||||
| Ultra Clean Holdings * | 20,343 | 850,948 | ||||||
| Unisys * | 30,111 | 163,503 | ||||||
| Varonis Systems, Cl B * | 49,846 | 2,180,763 | ||||||
| Veeco Instruments * | 23,216 | 820,453 | ||||||
| Verint Systems * | 28,348 | 858,377 | ||||||
| Veritone * | 1 | 3 | ||||||
| Viant Technology, Cl A * | 5,227 | 45,945 | ||||||
| Viavi Solutions * | 99,736 | 787,914 | ||||||
| Vishay Intertechnology | 59,336 | 1,373,035 | ||||||
| Vishay Precision Group * | 5,452 | 179,916 | ||||||
| Vuzix * | 1 | 1 | ||||||
| Weave Communications * | 18,813 | 201,111 | ||||||
| Workiva, Cl A * | 22,280 | 1,755,664 | ||||||
| Xerox Holdings | 53,247 | 707,653 | ||||||
| Xperi * | 17,793 | 187,004 | ||||||
| Yext * | 47,751 | 262,153 | ||||||
| Zeta Global Holdings, Cl A * | 61,566 | 760,956 | ||||||
The accompanying notes are an integral part of the financial statements.
71
![]()
| Schedule of Investments | April 30, 2024 (Unaudited) | |
| Global X Russell 2000 Covered Call ETF | ||
| Shares | Value | |||||||
| COMMON STOCK — continued | ||||||||
| Information Technology — continued | ||||||||
| Zuora, Cl A * | 55,764 | $ | 549,833 | |||||
| 160,650,682 | ||||||||
| Materials — 3.6% | ||||||||
| 5E Advanced Materials * | 1 | 1 | ||||||
| AdvanSix | 11,842 | 299,129 | ||||||
| Alpha Metallurgical Resources | 5,754 | 1,882,248 | ||||||
| American Vanguard | 12,698 | 144,630 | ||||||
| Arch Resources | 8,232 | 1,307,077 | ||||||
| Aspen Aerogels * | 23,052 | 360,994 | ||||||
| ATI * | 58,670 | 3,502,599 | ||||||
| Avient | 41,125 | 1,744,522 | ||||||
| Balchem | 14,805 | 2,093,131 | ||||||
| Cabot | 25,610 | 2,336,400 | ||||||
| Carpenter Technology | 22,146 | 1,897,912 | ||||||
| Century Aluminum * | 23,105 | 400,872 | ||||||
| Clearwater Paper * | 7,738 | 348,520 | ||||||
| Coeur Mining * | 1 | 5 | ||||||
| Commercial Metals | 53,321 | 2,865,471 | ||||||
| Compass Minerals International | 15,731 | 195,851 | ||||||
| Constellium, Cl A * | 58,617 | 1,154,169 | ||||||
| Contango ORE * | 3,643 | 76,029 | ||||||
| Core Molding Technologies * | 4,496 | 81,018 | ||||||
| Dakota Gold * | 1 | 3 | ||||||
| Danimer Scientific * | 1 | 1 | ||||||
| Ecovyst * | 42,014 | 396,192 | ||||||
| Glatfelter * | 1 | 1 | ||||||
| Greif, Cl A | 11,092 | 679,718 | ||||||
| Greif, Cl B | 2,562 | 160,074 | ||||||
| Hawkins | 8,851 | 670,640 | ||||||
| Haynes International | 5,769 | 347,005 | ||||||
| HB Fuller | 24,763 | 1,850,044 | ||||||
| Hecla Mining | 282,436 | 1,335,922 | ||||||
| Ingevity * | 16,683 | 853,169 | ||||||
| Innospec | 11,551 | 1,386,120 | ||||||
| Intrepid Potash * | 4,844 | 97,461 | ||||||
| Ivanhoe Electric * | 27,524 | 277,992 | ||||||
| Kaiser Aluminum | 7,315 | 661,934 | ||||||
| Knife River * | 25,724 | 2,011,360 | ||||||
The accompanying notes are an integral part of the financial statements.
72
![]()
| Schedule of Investments | April 30, 2024 (Unaudited) | |
| Global X Russell 2000 Covered Call ETF | ||
| Shares | Value | |||||||
| COMMON STOCK — continued | ||||||||
| Materials — continued | ||||||||
| Koppers Holdings | 8,967 | $ | 459,828 | |||||
| Kronos Worldwide | 9,880 | 113,126 | ||||||
| LSB Industries * | 31,613 | 294,001 | ||||||
| Materion | 9,246 | 1,062,735 | ||||||
| Mativ Holdings | 24,875 | 454,217 | ||||||
| Metallus * | 19,789 | 406,862 | ||||||
| Minerals Technologies | 14,652 | 1,067,984 | ||||||
| Myers Industries | 16,698 | 365,686 | ||||||
| O-I Glass, Cl I * | 69,946 | 1,046,392 | ||||||
| Olympic Steel | 4,560 | 289,879 | ||||||
| Origin Materials * | 1 | 1 | ||||||
| Pactiv Evergreen | 17,919 | 273,086 | ||||||
| Perimeter Solutions * | 68,392 | 478,744 | ||||||
| Perpetua Resources * | 1 | 5 | ||||||
| Piedmont Lithium * | 8,891 | 108,915 | ||||||
| PureCycle Technologies * | 58,498 | 273,186 | ||||||
| Quaker Chemical | 6,369 | 1,188,010 | ||||||
| Radius Recycling, Cl A | 11,925 | 207,733 | ||||||
| Ramaco Resources, Cl A | 9,303 | 145,871 | ||||||
| Ramaco Resources, Cl B | 1,860 | 20,665 | ||||||
| Ranpak Holdings, Cl A * | 16,427 | 118,931 | ||||||
| Rayonier Advanced Materials * | 1 | 4 | ||||||
| Ryerson Holding | 12,110 | 345,741 | ||||||
| Sensient Technologies | 19,546 | 1,431,158 | ||||||
| Stepan | 9,829 | 815,709 | ||||||
| Summit Materials, Cl A * | 54,111 | 2,104,918 | ||||||
| SunCoke Energy | 37,622 | 387,883 | ||||||
| Sylvamo | 17,159 | 1,072,438 | ||||||
| Tredegar | 14,086 | 89,869 | ||||||
| TriMas | 18,403 | 478,294 | ||||||
| Trinseo | 16,171 | 42,206 | ||||||
| Tronox Holdings, Cl A | 53,309 | 905,720 | ||||||
| United States Lime & Minerals | 1,086 | 336,660 | ||||||
| Valhi | 1,238 | 18,285 | ||||||
| Warrior Met Coal | 23,940 | 1,636,299 | ||||||
| Worthington Steel | 13,943 | 429,305 | ||||||
| 49,888,560 | ||||||||
The accompanying notes are an integral part of the financial statements.
73
![]()
| Schedule of Investments | April 30, 2024 (Unaudited) | |
| Global X Russell 2000 Covered Call ETF | ||
| Shares | Value | |||||||
| COMMON STOCK — continued | ||||||||
| Real Estate — 4.5% | ||||||||
| Acadia Realty Trust ‡ | 41,706 | $ | 720,680 | |||||
| Alexander & Baldwin ‡ | 32,372 | 533,167 | ||||||
| Alexander’s ‡ | 1,086 | 229,754 | ||||||
| Alpine Income Property Trust ‡ | 7,199 | 107,481 | ||||||
| American Assets Trust ‡ | 21,805 | 465,537 | ||||||
| American Realty Investors * | 597 | 8,227 | ||||||
| Anywhere Real Estate * | 47,614 | 231,404 | ||||||
| Apartment Investment and Management, Cl A ‡ * | 66,238 | 529,904 | ||||||
| Apple Hospitality REIT ‡ | 98,056 | 1,447,307 | ||||||
| Armada Hoffler Properties ‡ | 30,142 | 317,094 | ||||||
| Braemar Hotels & Resorts ‡ | 1 | 3 | ||||||
| Brandywine Realty Trust ‡ | 69,877 | 317,242 | ||||||
| Broadstone Net Lease, Cl A ‡ | 83,754 | 1,219,458 | ||||||
| BRT Apartments ‡ | 5,411 | 97,073 | ||||||
| CareTrust REIT ‡ | 54,254 | 1,341,159 | ||||||
| CBL & Associates Properties ‡ | 12,411 | 269,939 | ||||||
| Centerspace ‡ | 6,943 | 466,917 | ||||||
| Chatham Lodging Trust ‡ | 20,787 | 190,617 | ||||||
| City Office REIT ‡ | 17,733 | 82,636 | ||||||
| Clipper Realty ‡ | 4,887 | 20,525 | ||||||
| Community Healthcare Trust ‡ | 12,727 | 337,647 | ||||||
| Compass, Cl A * | 1 | 3 | ||||||
| COPT Defense Properties ‡ | 52,034 | 1,247,255 | ||||||
| CTO Realty Growth ‡ | 10,684 | 185,367 | ||||||
| Cushman & Wakefield * | 74,772 | 721,550 | ||||||
| DiamondRock Hospitality ‡ | 94,674 | 842,599 | ||||||
| DigitalBridge Group | 73,588 | 1,209,787 | ||||||
| Diversified Healthcare Trust ‡ | 1 | 2 | ||||||
| Douglas Elliman | 1 | 1 | ||||||
| Douglas Emmett ‡ | 76,594 | 1,050,104 | ||||||
| Easterly Government Properties, Cl A ‡ | 42,331 | 494,849 | ||||||
| Elme Communities ‡ | 38,221 | 579,430 | ||||||
| Empire State Realty Trust, Cl A ‡ | 58,337 | 530,867 | ||||||
| Equity Commonwealth ‡ * | 45,930 | 859,810 | ||||||
| Essential Properties Realty Trust ‡ | 73,081 | 1,924,954 | ||||||
| eXp World Holdings | 30,921 | 307,973 | ||||||
| Farmland Partners ‡ | 23,223 | 249,879 | ||||||
| Forestar Group * | 8,462 | 262,237 | ||||||
The accompanying notes are an integral part of the financial statements.
74
![]()
| Schedule of Investments | April 30, 2024 (Unaudited) | |
| Global X Russell 2000 Covered Call ETF | ||
| Shares | Value | |||||||
| COMMON STOCK — continued | ||||||||
| Real Estate — continued | ||||||||
| Four Corners Property Trust ‡ | 41,177 | $ | 965,601 | |||||
| FRP Holdings * | 5,904 | 178,950 | ||||||
| Getty Realty ‡ | 21,756 | 589,588 | ||||||
| Gladstone Commercial ‡ | 16,943 | 226,528 | ||||||
| Gladstone Land ‡ | 13,603 | 172,486 | ||||||
| Global Medical REIT ‡ | 28,630 | 232,189 | ||||||
| Global Net Lease ‡ | 87,626 | 609,001 | ||||||
| Hudson Pacific Properties ‡ | 66,013 | 382,875 | ||||||
| Independence Realty Trust ‡ | 107,442 | 1,694,360 | ||||||
| Innovative Industrial Properties, Cl A ‡ | 12,573 | 1,300,048 | ||||||
| InvenTrust Properties ‡ | 31,019 | 786,021 | ||||||
| JBG SMITH Properties ‡ | 50,735 | 761,532 | ||||||
| Kennedy-Wilson Holdings | 53,880 | 462,829 | ||||||
| Kite Realty Group Trust ‡ | 98,460 | 2,146,428 | ||||||
| LTC Properties ‡ | 18,740 | 620,294 | ||||||
| LXP Industrial Trust ‡ | 129,633 | 1,082,436 | ||||||
| Macerich ‡ | 98,284 | 1,352,388 | ||||||
| Marcus & Millichap | 11,849 | 375,258 | ||||||
| Maui Land & Pineapple * | 4,821 | 93,913 | ||||||
| National Health Investors ‡ | 19,010 | 1,198,771 | ||||||
| NETSTREIT ‡ | 34,802 | 586,414 | ||||||
| Newmark Group, Cl A | 66,614 | 637,496 | ||||||
| NexPoint Diversified Real Estate Trust ‡(B) | 16,203 | 96,894 | ||||||
| NexPoint Residential Trust ‡ | 10,323 | 353,459 | ||||||
| Office Properties Income Trust ‡ | 1 | 2 | ||||||
| One Liberty Properties ‡ | 7,069 | 161,951 | ||||||
| Opendoor Technologies * | 1 | 2 | ||||||
| Orion Office REIT ‡ | 23,633 | 73,735 | ||||||
| Outfront Media ‡ | 66,440 | 1,053,738 | ||||||
| Paramount Group ‡ | 76,766 | 356,194 | ||||||
| Peakstone Realty Trust ‡ | 20,467 | 285,924 | ||||||
| Pebblebrook Hotel Trust ‡ | 57,218 | 831,378 | ||||||
| Phillips Edison ‡ | 53,933 | 1,763,609 | ||||||
| Piedmont Office Realty Trust, Cl A ‡ | 55,597 | 383,063 | ||||||
| Plymouth Industrial REIT ‡ | 21,009 | 438,668 | ||||||
| Postal Realty Trust, Cl A ‡ | 7,799 | 108,016 | ||||||
| PotlatchDeltic ‡ | 36,109 | 1,444,721 | ||||||
| RE/MAX Holdings, Cl A | 8,170 | 57,353 | ||||||
| Redfin * | 42,897 | 240,652 | ||||||
The accompanying notes are an integral part of the financial statements.
75
![]()
| Schedule of Investments | April 30, 2024 (Unaudited) | |
| Global X Russell 2000 Covered Call ETF | ||
| Shares | Value | |||||||
| COMMON STOCK — continued | ||||||||
| Real Estate — continued | ||||||||
| Retail Opportunity Investments ‡ | 55,421 | $ | 680,016 | |||||
| RLJ Lodging Trust ‡ | 69,770 | 767,470 | ||||||
| RMR Group, Cl A | 6,799 | 161,272 | ||||||
| Ryman Hospitality Properties ‡ | 26,228 | 2,766,529 | ||||||
| Sabra Health Care REIT ‡ | 104,222 | 1,450,770 | ||||||
| Safehold ‡ | 22,200 | 404,928 | ||||||
| Saul Centers ‡ | 5,238 | 190,716 | ||||||
| Service Properties Trust ‡ | 74,245 | 455,122 | ||||||
| SITE Centers ‡ | 86,001 | 1,160,153 | ||||||
| SL Green Realty ‡ | 29,848 | 1,487,326 | ||||||
| St. Joe | 15,510 | 887,172 | ||||||
| Star Holdings * | 8,885 | 105,643 | ||||||
| Stratus Properties * | 2,367 | 53,684 | ||||||
| Summit Hotel Properties ‡ | 42,897 | 257,811 | ||||||
| Sunstone Hotel Investors ‡ | 91,604 | 934,361 | ||||||
| Tanger ‡ | 47,363 | 1,342,741 | ||||||
| Tejon Ranch * | 9,310 | 156,222 | ||||||
| Terreno Realty ‡ | 44,301 | 2,407,759 | ||||||
| Transcontinental Realty Investors * | 700 | 20,055 | ||||||
| UMH Properties ‡ | 27,308 | 434,743 | ||||||
| Uniti Group ‡ | 100,452 | 577,599 | ||||||
| Universal Health Realty Income Trust ‡ | 5,622 | 202,561 | ||||||
| Urban Edge Properties ‡ | 51,731 | 865,460 | ||||||
| Veris Residential ‡ | 37,541 | 540,966 | ||||||
| Whitestone REIT, Cl B ‡ | 21,896 | 251,804 | ||||||
| Xenia Hotels & Resorts ‡ | 50,014 | 693,694 | ||||||
| 62,761,780 | ||||||||
| Utilities — 2.0% | ||||||||
| ALLETE | 26,890 | 1,592,426 | ||||||
| Altus Power, Cl A * | 42,422 | 155,689 | ||||||
| American States Water | 17,279 | 1,224,044 | ||||||
| Artesian Resources, Cl A | 4,269 | 149,330 | ||||||
| Avista | 37,156 | 1,336,873 | ||||||
| Black Hills | 30,952 | 1,699,265 | ||||||
| Cadiz * | 1 | 2 | ||||||
| California Water Service Group | 27,393 | 1,345,544 | ||||||
| Chesapeake Utilities | 9,787 | 1,036,150 | ||||||
| Consolidated Water | 7,585 | 193,038 | ||||||
The accompanying notes are an integral part of the financial statements.
76
![]()
| Schedule of Investments | April 30, 2024 (Unaudited) | |
| Global X Russell 2000 Covered Call ETF | ||
| Shares | Value | |||||||
| COMMON STOCK — continued | ||||||||
| Utilities — continued | ||||||||
| Genie Energy, Cl B | 10,363 | $ | 158,450 | |||||
| Global Water Resources | 5,430 | 66,463 | ||||||
| MGE Energy | 16,863 | 1,320,710 | ||||||
| Middlesex Water | 8,021 | 406,825 | ||||||
| Montauk Renewables * | 27,801 | 100,084 | ||||||
| New Jersey Resources | 44,427 | 1,941,016 | ||||||
| Northwest Natural Holding | 16,657 | 635,465 | ||||||
| Northwestern Energy Group | 27,527 | 1,388,462 | ||||||
| ONE Gas | 25,033 | 1,615,129 | ||||||
| Ormat Technologies | 24,308 | 1,551,580 | ||||||
| Otter Tail | 18,993 | 1,621,242 | ||||||
| PNM Resources | 39,256 | 1,454,827 | ||||||
| Portland General Electric | 47,308 | 2,045,125 | ||||||
| Pure Cycle * | 8,145 | 77,703 | ||||||
| RGC Resources | 4,567 | 94,171 | ||||||
| SJW Group | 14,372 | 782,555 | ||||||
| Southwest Gas Holdings | 29,224 | 2,180,695 | ||||||
| Spire | 24,324 | 1,502,980 | ||||||
| Sunnova Energy International * | 42,615 | 179,409 | ||||||
| Unitil | 7,036 | 358,414 | ||||||
| York Water | 6,592 | 234,082 | ||||||
| 28,447,748 | ||||||||
| TOTAL UNITED STATES | 1,092,438,469 | |||||||
| TOTAL COMMON STOCK (Cost $1,037,713,432) | 1,123,893,686 | |||||||
| EXCHANGE TRADED FUND — 21.7% (C) | ||||||||
| Vanguard Russell 2000 ETF | 3,804,233 | 301,143,084 | ||||||
| TOTAL EXCHANGE TRADED FUND (Cost $284,254,083) | 301,143,084 | |||||||
| Number of Rights | ||||||||
| RIGHTS(B) — 0.0% | ||||||||
| United States — 0.0% | ||||||||
| Cartesian Therapeutics CVR# *(B)(D) | 1 | — | ||||||
| CinCor Pharma# *(D) | 15,984 | 48,911 | ||||||
| Jounce Therapeutics# *(D) | 1 | — | ||||||
| Novartis CVR# *(D) | 26,043 | 10,157 | ||||||
The accompanying notes are an integral part of the financial statements.
77
![]()
| Schedule of Investments | April 30, 2024 (Unaudited) | |
| Global X Russell 2000 Covered Call ETF | ||
| Number of Rights | Value | |||||||
| RIGHTS — continued | ||||||||
| OmniAb CVR# *(D) | 2,421 | $ | 49 | |||||
| OmniAb CVR# *(D) | 2,421 | 48 | ||||||
| Rain Oncology CVR# *(D) | 1 | — | ||||||
| TOTAL RIGHTS (Cost $–) | 59,165 | |||||||
| TOTAL INVESTMENTS — 102.6% (Cost $1,321,967,515) | $ | 1,425,095,935 | ||||||
| WRITTEN OPTIONS— (2.8)% (Premiums Received $(35,752,274)) | $ | (38,460,015 | ) | |||||
Percentages are based on Net Assets of $1,388,733,454.
A list of the exchange traded option contracts held by the Fund at April 30, 2024, is as follows:
| Description | Number of Contracts | Notional Amount | Exercise Price | Expiration Date | Value | |||||||||||
| WRITTEN OPTIONS — (2.8)% | ||||||||||||||||
| Call Options | ||||||||||||||||
| Russell 2000 Index | (7,209) | $ | (1,422,988,835 | ) | $ | 1,950 | 05/17/24 | $ | (38,460,015 | ) | ||||||
| * | Non-income producing security. |
| ‡ | Real Estate Investment Trust |
| # | Expiration date not available. |
| (A) | Affiliated investment. |
| (B) | All or a portion of these securities has been segregated as collateral for options contracts. The Fair Value of the securities pledged as collateral is $1,256. |
| (C) | For financial information on the Vanguard Russell 2000 ETF, please go to the Securities Exchange Commission’s website at http://www.sec.gov. |
| (D) | Level 3 security in accordance with fair value hierarchy. |
The accompanying notes are an integral part of the financial statements.
78
![]()
| Schedule of Investments | April 30, 2024 (Unaudited) | |
| Global X Russell 2000 Covered Call ETF | ||
The following is a summary of the level of inputs used as of April 30, 2024, in valuing the Fund’s investments and other financial instruments carried at value:
| Investments in Securities | Level 1 | Level 2 | Level 3(1) | Total | ||||||||||||
| Common Stock | $ | 1,123,893,686 | $ | — | $ | — | $ | 1,123,893,686 | ||||||||
| Exchange Traded Fund | 301,143,084 | — | — | 301,143,084 | ||||||||||||
| Rights | — | — | 59,165 | 59,165 | ||||||||||||
| Total Investments in Securities | $ | 1,425,036,770 | $ | — | $ | 59,165 | $ | 1,425,095,935 | ||||||||
| Other Financial Instruments | Level 1 | Level 2 | Level 3 | Total | ||||||||||||
| Written Options | $ | (38,460,015 | ) | $ | — | $ | — | $ | (38,460,015 | ) | ||||||
| Total Other Financial Instruments | $ | (38,460,015 | ) | $ | — | $ | — | $ | (38,460,015 | ) | ||||||
| (1) | A reconciliation of Level 3 investments and disclosures of significant unobservable inputs are presented when the Fund has a significant amount of Level 3 investments at the end of the period in relation to Net Assets. Management has concluded that Level 3 investments are not material in relation to Net Assets. |
The following is a summary of the transactions with affiliates for the period ended April 30, 2024:
| Value 10/31/2023 | Purchases at Cost | Proceeds from Sales | Change in Unrealized Appreciation (Depreciation) | Realized Gain (Loss) | Value 4/30/2024 | Income | Capital Gains | |||||||||||||||||||||||
| Centrus Energy, Cl A | ||||||||||||||||||||||||||||||
| $ | 358,329 | $ | — | $ | — | $ | (68,466) | $ | — | $ | 289,863 | $ | — | $ | — | |||||||||||||||
| Energy Fuels | ||||||||||||||||||||||||||||||
| 511,871 | 54,729 | — | (200,296) | — | 366,304 | — | — | |||||||||||||||||||||||
| Northwest Pipe | ||||||||||||||||||||||||||||||
| 116,918 | — | — | 18,829 | — | 135,747 | — | — | |||||||||||||||||||||||
| Uranium Energy | ||||||||||||||||||||||||||||||
| 970,719 | 105,077 | — | 129,254 | — | 1,205,050 | — | — | |||||||||||||||||||||||
| Totals: | ||||||||||||||||||||||||||||||
| $ | 1,957,837 | $ | 159,806 | $ | — | $ | (120,679 | ) | $ | – | $ | 1,996,964 | $ | — | $ | — | ||||||||||||||
Amounts designated as “—” are $0 or have been rounded to $0.
See “Glossary” for abbreviations.
The accompanying notes are an integral part of the financial statements.
79
![]()
| Schedule of Investments | April 30, 2024 (Unaudited) |
| Global X Nasdaq 100® Covered Call & Growth ETF | |
Sector Weightings †:
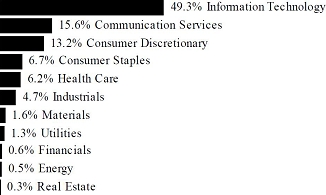
† Sector weightings percentages are based on the total market value of investments. Total investments do not include derivatives such as options, futures contracts, forward contracts, and swap contracts, if applicable.
| Shares | Value | |||||||
| COMMON STOCK — 101.2% | ||||||||
| BRAZIL — 0.6% | ||||||||
| Consumer Discretionary — 0.6% | ||||||||
| MercadoLibre * | 441 | $ | 643,287 | |||||
| CHINA — 1.1% | ||||||||
| Consumer Discretionary — 0.6% | ||||||||
| PDD Holdings ADR * | 5,860 | 733,555 | ||||||
| Information Technology — 0.5% | ||||||||
| NXP Semiconductors | 2,262 | 579,502 | ||||||
| TOTAL CHINA | 1,313,057 | |||||||
| NETHERLANDS — 0.6% | ||||||||
| Information Technology — 0.6% | ||||||||
| ASML Holding, Cl G | 752 | 656,097 | ||||||
| UNITED KINGDOM — 0.6% | ||||||||
| Consumer Staples — 0.3% | ||||||||
| Coca-Cola Europacific Partners (A) | 3,937 | 283,543 | ||||||
The accompanying notes are an integral part of the financial statements.
80
![]()
| Schedule of Investments | April 30, 2024 (Unaudited) |
| Global X Nasdaq 100® Covered Call & Growth ETF | |
| Shares | Value | |||||||
| COMMON STOCK — continued | ||||||||
| Health Care — 0.3% | ||||||||
| AstraZeneca ADR | 5,039 | $ | 382,359 | |||||
| TOTAL UNITED KINGDOM | 665,902 | |||||||
| UNITED STATES — 98.3% | ||||||||
| Communication Services — 15.8% | ||||||||
| Alphabet, Cl A *(A) | 20,012 | 3,257,553 | ||||||
| Alphabet, Cl C *(A) | 19,258 | 3,170,637 | ||||||
| Charter Communications, Cl A * | 1,279 | 327,347 | ||||||
| Comcast, Cl A | 34,771 | 1,325,123 | ||||||
| Electronic Arts | 2,331 | 295,617 | ||||||
| Meta Platforms, Cl A (A) | 11,886 | 5,113,001 | ||||||
| Netflix *(A) | 3,797 | 2,090,780 | ||||||
| Sirius XM Holdings | 33,196 | 97,596 | ||||||
| Take-Two Interactive Software * | 1,466 | 209,360 | ||||||
| T-Mobile US | 10,415 | 1,709,831 | ||||||
| Trade Desk, Cl A * | 3,904 | 323,446 | ||||||
| Warner Bros Discovery * | 21,243 | 156,349 | ||||||
| 18,076,640 | ||||||||
| Consumer Discretionary — 12.3% | ||||||||
| Airbnb, Cl A * | 3,815 | 604,945 | ||||||
| Amazon.com *(A) | 35,271 | 6,172,425 | ||||||
| Booking Holdings | 301 | 1,039,061 | ||||||
| DoorDash, Cl A * | 3,311 | 427,980 | ||||||
| Lululemon Athletica * | 1,062 | 382,957 | ||||||
| Marriott International, Cl A | 2,544 | 600,715 | ||||||
| O’Reilly Automotive * | 514 | 520,816 | ||||||
| Ross Stores | 2,950 | 382,172 | ||||||
| Starbucks | 9,942 | 879,768 | ||||||
| Tesla *(A) | 16,373 | 3,000,843 | ||||||
| 14,011,682 | ||||||||
| Consumer Staples — 6.5% | ||||||||
| Costco Wholesale (A) | 3,892 | 2,813,527 | ||||||
| Dollar Tree * | 1,903 | 225,030 | ||||||
| Keurig Dr Pepper | 12,238 | 412,420 | ||||||
| Kraft Heinz | 10,723 | 414,015 | ||||||
| Mondelez International, Cl A | 11,822 | 850,475 | ||||||
| Monster Beverage * | 9,114 | 487,143 | ||||||
The accompanying notes are an integral part of the financial statements.
81
![]()
| Schedule of Investments | April 30, 2024 (Unaudited) |
| Global X Nasdaq 100® Covered Call & Growth ETF | |
| Shares | Value | |||||||
| COMMON STOCK — continued | ||||||||
| Consumer Staples — continued | ||||||||
| PepsiCo | 12,058 | $ | 2,121,123 | |||||
| Walgreens Boots Alliance | 7,508 | 133,117 | ||||||
| 7,456,850 | ||||||||
| Energy — 0.5% | ||||||||
| Baker Hughes, Cl A | 8,797 | 286,958 | ||||||
| Diamondback Energy | 1,563 | 314,366 | ||||||
| 601,324 | ||||||||
| Financials — 0.6% | ||||||||
| PayPal Holdings * | 9,319 | 632,946 | ||||||
| Health Care — 5.9% | ||||||||
| Amgen | 4,703 | 1,288,340 | ||||||
| Biogen * | 1,263 | 271,318 | ||||||
| Dexcom * | 3,389 | 431,725 | ||||||
| GE HealthCare Technologies | 3,941 | 300,462 | ||||||
| Gilead Sciences | 10,933 | 712,832 | ||||||
| IDEXX Laboratories * | 724 | 356,758 | ||||||
| Illumina * | 1,389 | 170,916 | ||||||
| Intuitive Surgical * | 3,093 | 1,146,328 | ||||||
| Moderna * | 3,305 | 364,574 | ||||||
| Regeneron Pharmaceuticals * | 946 | 842,564 | ||||||
| Vertex Pharmaceuticals * | 2,266 | 890,107 | ||||||
| 6,775,924 | ||||||||
| Industrials — 4.7% | ||||||||
| Automatic Data Processing | 3,606 | 872,255 | ||||||
| Cintas | 890 | 585,923 | ||||||
| Copart * | 8,413 | 456,910 | ||||||
| CSX | 17,041 | 566,102 | ||||||
| Fastenal | 4,956 | 336,711 | ||||||
| Honeywell International | 5,725 | 1,103,379 | ||||||
| Old Dominion Freight Line | 1,885 | 342,523 | ||||||
| PACCAR | 4,559 | 483,756 | ||||||
| Paychex | 3,160 | 375,440 | ||||||
| Verisk Analytics, Cl A | 1,265 | 275,719 | ||||||
| 5,398,718 | ||||||||
The accompanying notes are an integral part of the financial statements.
82
![]()
| Schedule of Investments | April 30, 2024 (Unaudited) |
| Global X Nasdaq 100® Covered Call & Growth ETF | |
| Shares | Value | |||||||
| COMMON STOCK — continued | ||||||||
| Information Technology — 48.8% | ||||||||
| Adobe * | 3,965 | $ | 1,835,121 | |||||
| Advanced Micro Devices *(A) | 14,174 | 2,244,878 | ||||||
| Analog Devices | 4,354 | 873,456 | ||||||
| ANSYS * | 760 | 246,909 | ||||||
| Apple (A) | 52,430 | 8,930,402 | ||||||
| Applied Materials (A) | 7,292 | 1,448,556 | ||||||
| Atlassian, Cl A * | 1,387 | 238,980 | ||||||
| Autodesk * | 1,864 | 396,752 | ||||||
| Broadcom (A) | 4,063 | 5,282,997 | ||||||
| Cadence Design Systems * | 2,386 | 657,653 | ||||||
| CDW | 1,172 | 283,460 | ||||||
| Cisco Systems | 35,527 | 1,669,058 | ||||||
| Cognizant Technology Solutions, Cl A | 4,341 | 285,117 | ||||||
| Crowdstrike Holdings, Cl A * | 1,995 | 583,617 | ||||||
| Datadog, Cl A * | 2,646 | 332,073 | ||||||
| Fortinet * | 6,680 | 422,042 | ||||||
| GLOBALFOUNDRIES * | 4,776 | 233,451 | ||||||
| Intel | 37,104 | 1,130,559 | ||||||
| Intuit | 2,456 | 1,536,523 | ||||||
| KLA | 1,187 | 818,187 | ||||||
| Lam Research | 1,151 | 1,029,466 | ||||||
| Marvell Technology | 7,511 | 495,050 | ||||||
| Microchip Technology | 4,695 | 431,846 | ||||||
| Micron Technology | 9,686 | 1,094,131 | ||||||
| Microsoft (A) | 25,228 | 9,822,017 | ||||||
| MongoDB, Cl A * | 623 | 227,507 | ||||||
| NVIDIA (A) | 8,489 | 7,334,666 | ||||||
| ON Semiconductor * | 3,731 | 261,767 | ||||||
| Palo Alto Networks * | 2,836 | 824,964 | ||||||
| QUALCOMM | 9,792 | 1,624,003 | ||||||
| Roper Technologies | 930 | 475,658 | ||||||
| Synopsys * | 1,329 | 705,154 | ||||||
| Texas Instruments | 7,978 | 1,407,479 | ||||||
| Workday, Cl A * | 1,837 | 449,569 | ||||||
| Zscaler * | 1,290 | 223,093 | ||||||
| 55,856,161 | ||||||||
The accompanying notes are an integral part of the financial statements.
83
![]()
| Schedule of Investments | April 30, 2024 (Unaudited) |
| Global X Nasdaq 100® Covered Call & Growth ETF | |
| Shares | Value | |||||||
| COMMON STOCK — continued | ||||||||
| Materials — 1.6% | ||||||||
| Linde PLC | 4,226 | $ | 1,863,497 | |||||
| Real Estate — 0.3% | ||||||||
| CoStar Group * | 3,569 | 326,671 | ||||||
| Utilities — 1.3% | ||||||||
| American Electric Power (A) | 4,606 | 396,254 | ||||||
| Constellation Energy | 2,768 | 514,682 | ||||||
| Exelon | 8,710 | 327,322 | ||||||
| Xcel Energy | 4,814 | 258,656 | ||||||
| 1,496,914 | ||||||||
| TOTAL UNITED STATES | 112,497,327 | |||||||
| TOTAL COMMON STOCK (Cost $94,190,014) | 115,775,670 | |||||||
| TOTAL INVESTMENTS — 101.2% (Cost $94,190,014) | $ | 115,775,670 | ||||||
| WRITTEN OPTIONS— (1.3)% (Premiums Received $(1,205,140)) | $ | (1,475,760 | ) | |||||
Percentages are based on Net Assets of $114,421,902.
A list of the exchange traded option contracts held by the Fund at April 30, 2024, is as follows:
| Description | Number of Contracts | Notional Amount | Exercise Price | Expiration Date | Value | |||||||||||||||
| WRITTEN OPTIONS — (1.3)% | ||||||||||||||||||||
| Call Options | ||||||||||||||||||||
| Nasdaq-100 | (33 | ) | $ | (57,554,277 | ) | $ | 17,250 | 05/17/24 | $ | (1,475,760 | ) | |||||||||
| * | Non-income producing security. |
| (A) | All or a portion of these securities has been segregated as collateral for options contracts. The Fair Value of the securities pledged as collateral is $58,143,682. |
The accompanying notes are an integral part of the financial statements.
84
![]()
| Schedule of Investments | April 30, 2024 (Unaudited) |
| Global X Nasdaq 100® Covered Call & Growth ETF | |
The following is a summary of the level of inputs used as of April 30, 2024, in valuing the Fund’s investments and other financial instruments carried at value:
| Investments in Securities | Level 1 | Level 2 | Level 3 | Total | ||||||||||||
| Common Stock | $ | 115,775,670 | $ | — | $ | — | $ | 115,775,670 | ||||||||
| Total Investments in Securities | $ | 115,775,670 | $ | — | $ | — | $ | 115,775,670 | ||||||||
| Other Financial Instruments | Level 1 | Level 2 | Level 3 | Total | ||||||||||||
| Written Options | $ | (1,475,760 | ) | $ | — | $ | — | $ | (1,475,760 | ) | ||||||
| Total Other Financial Instruments | $ | (1,475,760 | ) | $ | — | $ | — | $ | (1,475,760 | ) | ||||||
Amounts designated as “—” are $0 or have been rounded to $0.
See “Glossary” for abbreviations.
The accompanying notes are an integral part of the financial statements.
85
![]()
| Schedule of Investments | April 30, 2024 (Unaudited) |
Global X S&P 500® Covered Call & Growth ETF
Sector Weightings †:

† Sector weightings percentages are based on the total market value of investments. Total investments do not include derivatives such as options, futures contracts, forward contracts, and swap contracts, if applicable.
| Shares | Value | |||||||
| COMMON STOCK — 100.8% | ||||||||
| CHINA — 0.2% | ||||||||
| Information Technology — 0.2% | ||||||||
| NXP Semiconductors (A) | 408 | $ | 104,526 | |||||
| UNITED STATES — 100.6% | ||||||||
| Communication Services — 9.2% | ||||||||
| Alphabet, Cl A *(A) | 9,468 | 1,541,201 | ||||||
| Alphabet, Cl C *(A) | 7,931 | 1,305,760 | ||||||
| AT&T (A) | 11,352 | 191,735 | ||||||
| Charter Communications, Cl A *(A) | 161 | 41,206 | ||||||
| Comcast, Cl A (A) | 6,387 | 243,409 | ||||||
| Electronic Arts (A) | 395 | 50,094 | ||||||
| Fox, Cl A (A) | 483 | 14,978 | ||||||
| Fox, Cl B (A) | 233 | 6,683 | ||||||
| Interpublic Group (A) | 693 | 21,095 | ||||||
| Live Nation Entertainment *(A) | 230 | 20,449 | ||||||
| Match Group *(A) | 480 | 14,794 | ||||||
| Meta Platforms, Cl A (A) | 3,533 | 1,519,791 | ||||||
| Netflix *(A) | 701 | 385,999 | ||||||
| News, Cl A (A) | 693 | 16,493 | ||||||
| News, Cl B (A) | 231 | 5,669 | ||||||
| Omnicom Group (A) | 323 | 29,987 | ||||||
The accompanying notes are an integral part of the financial statements.
86
![]()
| Schedule of Investments | April 30, 2024 (Unaudited) |
Global X S&P 500® Covered Call & Growth ETF
| Shares | Value | |||||||
| COMMON STOCK — continued | ||||||||
| Communication Services — continued | ||||||||
| Paramount Global, Cl B (A) | 878 | $ | 10,000 | |||||
| Take-Two Interactive Software *(A) | 245 | 34,989 | ||||||
| T-Mobile US (A) | 861 | 141,350 | ||||||
| Verizon Communications (A) | 6,686 | 264,030 | ||||||
| Walt Disney (A) | 2,914 | 323,745 | ||||||
| Warner Bros Discovery *(A) | 3,373 | 24,825 | ||||||
| 6,208,282 | ||||||||
| Consumer Discretionary — 10.4% | ||||||||
| Airbnb, Cl A *(A) | 701 | 111,158 | ||||||
| Amazon.com *(A) | 14,669 | 2,567,075 | ||||||
| Aptiv *(A) | 463 | 32,873 | ||||||
| AutoZone *(A) | 27 | 79,823 | ||||||
| Bath & Body Works (A) | 292 | 13,263 | ||||||
| Best Buy (A) | 345 | 25,406 | ||||||
| Booking Holdings (A) | 57 | 196,766 | ||||||
| BorgWarner (A) | 457 | 14,976 | ||||||
| Caesars Entertainment *(A) | 392 | 14,041 | ||||||
| CarMax *(A) | 295 | 20,051 | ||||||
| Carnival *(A) | 1,653 | 24,497 | ||||||
| Chipotle Mexican Grill, Cl A *(A) | 45 | 142,182 | ||||||
| Darden Restaurants (A) | 201 | 30,835 | ||||||
| Deckers Outdoor * | 39 | 31,920 | ||||||
| Domino’s Pizza (A) | 57 | 30,168 | ||||||
| DR Horton (A) | 474 | 67,540 | ||||||
| eBay (A) | 772 | 39,789 | ||||||
| Etsy *(A) | 228 | 15,657 | ||||||
| Expedia Group *(A) | 206 | 27,734 | ||||||
| Ford Motor (A) | 6,357 | 77,238 | ||||||
| Garmin (A) | 226 | 32,650 | ||||||
| General Motors (A) | 1,776 | 79,085 | ||||||
| Genuine Parts (A) | 225 | 35,372 | ||||||
| Hasbro (A) | 232 | 14,222 | ||||||
| Hilton Worldwide Holdings (A) | 417 | 82,266 | ||||||
| Home Depot (A) | 1,595 | 533,081 | ||||||
| Las Vegas Sands (A) | 581 | 25,773 | ||||||
| Lennar, Cl A (A) | 404 | 61,255 | ||||||
| LKQ (A) | 464 | 20,012 | ||||||
| Lowe’s (A) | 917 | 209,067 | ||||||
The accompanying notes are an integral part of the financial statements.
87
![]()
| Schedule of Investments | April 30, 2024 (Unaudited) |
Global X S&P 500® Covered Call & Growth ETF
| Shares | Value | |||||||
| COMMON STOCK — continued | ||||||||
| Consumer Discretionary — continued | ||||||||
| Lululemon Athletica *(A) | 185 | $ | 66,711 | |||||
| Marriott International, Cl A (A) | 390 | 92,091 | ||||||
| McDonald’s (A) | 1,155 | 315,361 | ||||||
| MGM Resorts International *(A) | 405 | 15,973 | ||||||
| Mohawk Industries *(A) | 69 | 7,957 | ||||||
| NIKE, Cl B (A) | 1,949 | 179,815 | ||||||
| Norwegian Cruise Line Holdings *(A) | 683 | 12,922 | ||||||
| NVR *(A) | 5 | 37,194 | ||||||
| O’Reilly Automotive *(A) | 91 | 92,207 | ||||||
| Pool (A) | 63 | 22,839 | ||||||
| PulteGroup (A) | 370 | 41,225 | ||||||
| Ralph Lauren, Cl A (A) | 48 | 7,855 | ||||||
| Ross Stores (A) | 535 | 69,309 | ||||||
| Royal Caribbean Cruises *(A) | 400 | 55,852 | ||||||
| Starbucks (A) | 1,812 | 160,344 | ||||||
| Tapestry (A) | 363 | 14,491 | ||||||
| Tesla *(A) | 4,466 | 818,529 | ||||||
| TJX (A) | 1,815 | 170,773 | ||||||
| Tractor Supply (A) | 169 | 46,151 | ||||||
| Ulta Beauty *(A) | 75 | 30,363 | ||||||
| Wynn Resorts (A) | 143 | 13,106 | ||||||
| Yum! Brands (A) | 444 | 62,715 | ||||||
| 6,989,558 | ||||||||
| Consumer Staples — 6.2% | ||||||||
| Altria Group (A) | 2,874 | 125,910 | ||||||
| Archer-Daniels-Midland (A) | 831 | 48,747 | ||||||
| Brown-Forman, Cl B (A) | 297 | 14,211 | ||||||
| Bunge Global (A) | 263 | 26,763 | ||||||
| Campbell Soup (A) | 383 | 17,507 | ||||||
| Church & Dwight (A) | 408 | 44,019 | ||||||
| Clorox (A) | 180 | 26,617 | ||||||
| Coca-Cola (A) | 6,197 | 382,789 | ||||||
| Colgate-Palmolive (A) | 1,307 | 120,139 | ||||||
| Conagra Brands (A) | 791 | 24,347 | ||||||
| Constellation Brands, Cl A (A) | 261 | 66,153 | ||||||
| Costco Wholesale (A) | 717 | 518,319 | ||||||
| Dollar General (A) | 339 | 47,185 | ||||||
| Dollar Tree *(A) | 334 | 39,496 | ||||||
The accompanying notes are an integral part of the financial statements.
88
![]()
| Schedule of Investments | April 30, 2024 (Unaudited) |
Global X S&P 500® Covered Call & Growth ETF
| Shares | Value | |||||||
| COMMON STOCK — continued | ||||||||
| Consumer Staples — continued | ||||||||
| Estee Lauder, Cl A (A) | 364 | $ | 53,402 | |||||
| General Mills (A) | 866 | 61,018 | ||||||
| Hershey (A) | 233 | 45,183 | ||||||
| Hormel Foods (A) | 464 | 16,500 | ||||||
| J M Smucker (A) | 195 | 22,396 | ||||||
| Kellanova (A) | 462 | 26,731 | ||||||
| Kenvue (A) | 2,783 | 52,376 | ||||||
| Keurig Dr Pepper (A) | 1,615 | 54,426 | ||||||
| Kimberly-Clark (A) | 545 | 74,409 | ||||||
| Kraft Heinz (A) | 1,288 | 49,730 | ||||||
| Kroger (A) | 1,096 | 60,697 | ||||||
| Lamb Weston Holdings (A) | 233 | 19,418 | ||||||
| McCormick (A) | 383 | 29,131 | ||||||
| Molson Coors Beverage, Cl B (A) | 320 | 18,323 | ||||||
| Mondelez International, Cl A (A) | 2,111 | 151,865 | ||||||
| Monster Beverage *(A) | 1,186 | 63,392 | ||||||
| PepsiCo (A) | 2,192 | 385,595 | ||||||
| Philip Morris International (A) | 2,468 | 234,312 | ||||||
| Procter & Gamble (A) | 3,757 | 613,142 | ||||||
| Sysco (A) | 795 | 59,084 | ||||||
| Target (A) | 747 | 120,252 | ||||||
| Tyson Foods, Cl A (A) | 517 | 31,356 | ||||||
| Walgreens Boots Alliance (A) | 1,282 | 22,730 | ||||||
| Walmart (A) | 6,819 | 404,708 | ||||||
| 4,172,378 | ||||||||
| Energy — 4.1% | ||||||||
| APA (A) | 508 | 15,971 | ||||||
| Baker Hughes, Cl A (A) | 1,555 | 50,724 | ||||||
| Chevron (A) | 2,804 | 452,201 | ||||||
| ConocoPhillips (A) | 1,902 | 238,929 | ||||||
| Coterra Energy (A) | 1,157 | 31,656 | ||||||
| Devon Energy (A) | 1,075 | 55,018 | ||||||
| Diamondback Energy (A) | 281 | 56,518 | ||||||
| EOG Resources (A) | 931 | 123,013 | ||||||
| EQT (A) | 768 | 30,789 | ||||||
| Exxon Mobil (A) | 6,396 | 756,455 | ||||||
| Halliburton (A) | 1,467 | 54,968 | ||||||
| Hess (A) | 433 | 68,193 | ||||||
The accompanying notes are an integral part of the financial statements.
89
![]()
| Schedule of Investments | April 30, 2024 (Unaudited) |
Global X S&P 500® Covered Call & Growth ETF
| Shares | Value | |||||||
| COMMON STOCK — continued | ||||||||
| Energy — continued | ||||||||
| Kinder Morgan (A) | 3,119 | $ | 57,015 | |||||
| Marathon Oil (A) | 914 | 24,541 | ||||||
| Marathon Petroleum (A) | 598 | 108,669 | ||||||
| Occidental Petroleum (A) | 1,082 | 71,563 | ||||||
| ONEOK (A) | 913 | 72,237 | ||||||
| Phillips 66 (A) | 694 | 99,388 | ||||||
| Pioneer Natural Resources (A) | 365 | 98,302 | ||||||
| Schlumberger (A) | 2,310 | 109,679 | ||||||
| Targa Resources (A) | 348 | 39,693 | ||||||
| Valero Energy (A) | 533 | 85,211 | ||||||
| Williams (A) | 1,904 | 73,037 | ||||||
| 2,773,770 | ||||||||
| Financials — 13.2% | ||||||||
| Aflac (A) | 830 | 69,430 | ||||||
| Allstate (A) | 413 | 70,235 | ||||||
| American Express (A) | 927 | 216,946 | ||||||
| American International Group (A) | 1,103 | 83,067 | ||||||
| Ameriprise Financial (A) | 161 | 66,298 | ||||||
| Aon PLC, Cl A (A) | 314 | 88,551 | ||||||
| Arch Capital Group *(A) | 562 | 52,569 | ||||||
| Arthur J Gallagher (A) | 344 | 80,733 | ||||||
| Assurant (A) | 65 | 11,336 | ||||||
| Bank of America (A) | 10,966 | 405,852 | ||||||
| Bank of New York Mellon (A) | 1,181 | 66,715 | ||||||
| Berkshire Hathaway, Cl B *(A) | 2,907 | 1,153,294 | ||||||
| BlackRock, Cl A (A) | 222 | 167,530 | ||||||
| Blackstone (A) | 1,126 | 131,303 | ||||||
| Brown & Brown (A) | 351 | 28,621 | ||||||
| Capital One Financial (A) | 597 | 85,628 | ||||||
| Cboe Global Markets (A) | 152 | 27,535 | ||||||
| Charles Schwab (A) | 2,415 | 178,589 | ||||||
| Chubb (A) | 648 | 161,119 | ||||||
| Cincinnati Financial (A) | 263 | 30,426 | ||||||
| Citigroup (A) | 3,034 | 186,075 | ||||||
| Citizens Financial Group (A) | 672 | 22,922 | ||||||
| CME Group, Cl A (A) | 583 | 122,220 | ||||||
| Comerica (A) | 231 | 11,589 | ||||||
| Corpay * | 129 | 38,976 | ||||||
The accompanying notes are an integral part of the financial statements.
90
![]()
| Schedule of Investments | April 30, 2024 (Unaudited) |
Global X S&P 500® Covered Call & Growth ETF
| Shares | Value | |||||||
| COMMON STOCK — continued | ||||||||
| Financials — continued | ||||||||
| Discover Financial Services (A) | 376 | $ | 47,650 | |||||
| Everest Group (A) | 76 | 27,847 | ||||||
| FactSet Research Systems (A) | 58 | 24,180 | ||||||
| Fidelity National Information Services (A) | 990 | 67,241 | ||||||
| Fifth Third Bancorp (A) | 1,011 | 36,861 | ||||||
| Fiserv *(A) | 950 | 145,037 | ||||||
| Franklin Resources (A) | 462 | 10,552 | ||||||
| Global Payments (A) | 407 | 49,967 | ||||||
| Globe Life (A) | 143 | 10,892 | ||||||
| Goldman Sachs Group (A) | 516 | 220,182 | ||||||
| Hartford Financial Services Group (A) | 511 | 49,511 | ||||||
| Huntington Bancshares (A) | 2,320 | 31,250 | ||||||
| Intercontinental Exchange (A) | 905 | 116,528 | ||||||
| Invesco (A) | 751 | 10,642 | ||||||
| Jack Henry & Associates (A) | 120 | 19,523 | ||||||
| JPMorgan Chase (A) | 4,613 | 884,497 | ||||||
| KeyCorp (A) | 1,406 | 20,373 | ||||||
| Loews (A) | 302 | 22,695 | ||||||
| M&T Bank (A) | 255 | 36,819 | ||||||
| MarketAxess Holdings (A) | 61 | 12,206 | ||||||
| Marsh & McLennan (A) | 799 | 159,345 | ||||||
| Mastercard, Cl A (A) | 1,331 | 600,547 | ||||||
| MetLife (A) | 975 | 69,303 | ||||||
| Moody’s (A) | 255 | 94,434 | ||||||
| Morgan Stanley (A) | 1,967 | 178,682 | ||||||
| MSCI, Cl A (A) | 120 | 55,895 | ||||||
| Nasdaq (A) | 600 | 35,910 | ||||||
| Northern Trust (A) | 313 | 25,788 | ||||||
| PayPal Holdings *(A) | 1,668 | 113,291 | ||||||
| PNC Financial Services Group (A) | 631 | 96,707 | ||||||
| Principal Financial Group (A) | 343 | 27,145 | ||||||
| Progressive (A) | 940 | 195,755 | ||||||
| Prudential Financial (A) | 557 | 61,537 | ||||||
| Raymond James Financial (A) | 309 | 37,698 | ||||||
| Regions Financial (A) | 1,619 | 31,198 | ||||||
| S&P Global (A) | 514 | 213,737 | ||||||
| State Street (A) | 497 | 36,028 | ||||||
| Synchrony Financial (A) | 693 | 30,478 | ||||||
| T Rowe Price Group (A) | 333 | 36,487 | ||||||
The accompanying notes are an integral part of the financial statements.
91
![]()
| Schedule of Investments | April 30, 2024 (Unaudited) |
Global X S&P 500® Covered Call & Growth ETF
| Shares | Value | |||||||
| COMMON STOCK — continued | ||||||||
| Financials — continued | ||||||||
| Travelers (A) | 362 | $ | 76,802 | |||||
| Truist Financial (A) | 2,117 | 79,493 | ||||||
| US Bancorp (A) | 2,483 | 100,884 | ||||||
| Visa, Cl A (A) | 2,549 | 684,687 | ||||||
| W R Berkley (A) | 352 | 27,093 | ||||||
| Wells Fargo (A) | 5,778 | 342,751 | ||||||
| Willis Towers Watson (A) | 162 | 40,685 | ||||||
| 8,854,372 | ||||||||
| Health Care — 12.4% | ||||||||
| Abbott Laboratories (A) | 2,762 | 292,689 | ||||||
| AbbVie (A) | 2,813 | 457,506 | ||||||
| Agilent Technologies (A) | 458 | 62,764 | ||||||
| Align Technology *(A) | 111 | 31,344 | ||||||
| Amgen (A) | 852 | 233,397 | ||||||
| Baxter International (A) | 817 | 32,982 | ||||||
| Becton Dickinson (A) | 458 | 107,447 | ||||||
| Biogen *(A) | 226 | 48,549 | ||||||
| Bio-Rad Laboratories, Cl A *(A) | 34 | 9,171 | ||||||
| Bio-Techne (A) | 245 | 15,486 | ||||||
| Boston Scientific *(A) | 2,348 | 168,751 | ||||||
| Bristol-Myers Squibb (A) | 3,263 | 143,376 | ||||||
| Cardinal Health (A) | 395 | 40,701 | ||||||
| Catalent *(A) | 296 | 16,532 | ||||||
| Cencora (A) | 270 | 64,543 | ||||||
| Centene *(A) | 831 | 60,713 | ||||||
| Charles River Laboratories International *(A) | 81 | 18,549 | ||||||
| Cigna Group (A) | 470 | 167,809 | ||||||
| Cooper | 301 | 26,807 | ||||||
| CVS Health (A) | 1,972 | 133,524 | ||||||
| Danaher (A) | 1,071 | 264,130 | ||||||
| DaVita *(A) | 68 | 9,453 | ||||||
| Dexcom *(A) | 605 | 77,071 | ||||||
| Edwards Lifesciences *(A) | 984 | 83,315 | ||||||
| Elevance Health (A) | 375 | 198,218 | ||||||
| Eli Lilly (A) | 1,283 | 1,002,151 | ||||||
| GE HealthCare Technologies (A) | 661 | 50,395 | ||||||
| Gilead Sciences (A) | 1,950 | 127,140 | ||||||
| HCA Healthcare (A) | 317 | 98,213 | ||||||
The accompanying notes are an integral part of the financial statements.
92
![]()
| Schedule of Investments | April 30, 2024 (Unaudited) |
Global X S&P 500® Covered Call & Growth ETF
| Shares | Value | |||||||
| COMMON STOCK — continued | ||||||||
| Health Care — continued | ||||||||
| Henry Schein *(A) | 233 | $ | 16,142 | |||||
| Hologic *(A) | 415 | 31,445 | ||||||
| Humana (A) | 200 | 60,418 | ||||||
| IDEXX Laboratories *(A) | 130 | 64,059 | ||||||
| Illumina *(A) | 272 | 33,470 | ||||||
| Incyte *(A) | 320 | 16,656 | ||||||
| Insulet *(A) | 136 | 23,384 | ||||||
| Intuitive Surgical *(A) | 558 | 206,806 | ||||||
| IQVIA Holdings *(A) | 294 | 68,140 | ||||||
| Johnson & Johnson (A) | 3,841 | 555,370 | ||||||
| Laboratory Corp of America Holdings (A) | 122 | 24,567 | ||||||
| McKesson (A) | 210 | 112,814 | ||||||
| Medtronic PLC (A) | 2,159 | 173,238 | ||||||
| Merck (A) | 4,042 | 522,307 | ||||||
| Mettler-Toledo International *(A) | 33 | 40,580 | ||||||
| Moderna *(A) | 544 | 60,009 | ||||||
| Molina Healthcare *(A) | 94 | 32,157 | ||||||
| Pfizer (A) | 8,976 | 229,965 | ||||||
| Quest Diagnostics (A) | 165 | 22,800 | ||||||
| Regeneron Pharmaceuticals *(A) | 170 | 151,412 | ||||||
| ResMed (A) | 237 | 50,716 | ||||||
| Revvity (A) | 229 | 23,466 | ||||||
| Solventum * | 225 | 14,627 | ||||||
| STERIS (A) | 167 | 34,162 | ||||||
| Stryker (A) | 535 | 180,028 | ||||||
| Teleflex (A) | 75 | 15,656 | ||||||
| Thermo Fisher Scientific (A) | 617 | 350,900 | ||||||
| UnitedHealth Group (A) | 1,490 | 720,713 | ||||||
| Universal Health Services, Cl B (A) | 91 | 15,509 | ||||||
| Vertex Pharmaceuticals *(A) | 404 | 158,695 | ||||||
| Viatris (A) | 1,912 | 22,122 | ||||||
| Waters *(A) | 96 | 29,668 | ||||||
| West Pharmaceutical Services (A) | 122 | 43,613 | ||||||
| Zimmer Biomet Holdings (A) | 334 | 40,174 | ||||||
| Zoetis, Cl A (A) | 739 | 117,678 | ||||||
| 8,306,192 | ||||||||
| Industrials — 8.9% | ||||||||
| 3M (A) | 901 | 86,956 | ||||||
The accompanying notes are an integral part of the financial statements.
93
![]()
| Schedule of Investments | April 30, 2024 (Unaudited) |
Global X S&P 500® Covered Call & Growth ETF
| Shares | Value | |||||||
| COMMON STOCK — continued | ||||||||
| Industrials — continued | ||||||||
| A O Smith (A) | 231 | $ | 19,136 | |||||
| Allegion (A) | 138 | 16,775 | ||||||
| American Airlines Group *(A) | 1,144 | 15,455 | ||||||
| AMETEK (A) | 363 | 63,402 | ||||||
| Automatic Data Processing (A) | 653 | 157,954 | ||||||
| Axon Enterprise *(A) | 114 | 35,757 | ||||||
| Boeing *(A) | 903 | 151,560 | ||||||
| Broadridge Financial Solutions (A) | 201 | 38,875 | ||||||
| Builders FirstSource * | 182 | 33,273 | ||||||
| Carrier Global (A) | 1,318 | 81,044 | ||||||
| Caterpillar (A) | 827 | 276,689 | ||||||
| CH Robinson Worldwide (A) | 152 | 10,792 | ||||||
| Cintas (A) | 137 | 90,193 | ||||||
| Copart *(A) | 1,390 | 75,491 | ||||||
| CSX (A) | 3,124 | 103,779 | ||||||
| Cummins (A) | 222 | 62,713 | ||||||
| Dayforce *(A) | 266 | 16,324 | ||||||
| Deere (A) | 408 | 159,695 | ||||||
| Delta Air Lines (A) | 971 | 48,618 | ||||||
| Dover (A) | 208 | 37,294 | ||||||
| Eaton (A) | 653 | 207,824 | ||||||
| Emerson Electric (A) | 902 | 97,218 | ||||||
| Equifax (A) | 206 | 45,359 | ||||||
| Expeditors International of Washington (A) | 213 | 23,709 | ||||||
| Fastenal (A) | 956 | 64,951 | ||||||
| FedEx (A) | 372 | 97,382 | ||||||
| Fortive (A) | 589 | 44,334 | ||||||
| GE Vernova * | 433 | 66,556 | ||||||
| Generac Holdings *(A) | 84 | 11,421 | ||||||
| General Dynamics (A) | 363 | 104,214 | ||||||
| General Electric (A) | 1,733 | 280,434 | ||||||
| Honeywell International (A) | 1,049 | 202,174 | ||||||
| Howmet Aerospace (A) | 606 | 40,451 | ||||||
| Hubbell, Cl B (A) | 82 | 30,383 | ||||||
| Huntington Ingalls Industries (A) | 63 | 17,447 | ||||||
| IDEX (A) | 129 | 28,439 | ||||||
| Illinois Tool Works (A) | 436 | 106,432 | ||||||
| Ingersoll Rand (A) | 633 | 59,072 | ||||||
| Jacobs Solutions (A) | 202 | 28,993 | ||||||
The accompanying notes are an integral part of the financial statements.
94
![]()
| Schedule of Investments | April 30, 2024 (Unaudited) |
Global X S&P 500® Covered Call & Growth ETF
| Shares | Value | |||||||
| COMMON STOCK — continued | ||||||||
| Industrials — continued | ||||||||
| JB Hunt Transport Services (A) | 114 | $ | 18,533 | |||||
| Johnson Controls International (A) | 1,066 | 69,365 | ||||||
| L3Harris Technologies (A) | 309 | 66,142 | ||||||
| Leidos Holdings (A) | 231 | 32,391 | ||||||
| Lockheed Martin (A) | 338 | 157,146 | ||||||
| Masco (A) | 343 | 23,478 | ||||||
| Nordson (A) | 86 | 22,204 | ||||||
| Norfolk Southern (A) | 362 | 83,376 | ||||||
| Northrop Grumman (A) | 226 | 109,617 | ||||||
| Old Dominion Freight Line (A) | 302 | 54,876 | ||||||
| Otis Worldwide (A) | 635 | 57,912 | ||||||
| PACCAR (A) | 849 | 90,087 | ||||||
| Parker-Hannifin (A) | 203 | 110,617 | ||||||
| Paychex (A) | 535 | 63,563 | ||||||
| Paycom Software (A) | 78 | 14,662 | ||||||
| Pentair (A) | 281 | 22,224 | ||||||
| Quanta Services (A) | 236 | 61,020 | ||||||
| Republic Services, Cl A (A) | 326 | 62,494 | ||||||
| Robert Half (A) | 179 | 12,376 | ||||||
| Rockwell Automation (A) | 173 | 46,876 | ||||||
| Rollins (A) | 459 | 20,453 | ||||||
| RTX (A) | 2,165 | 219,791 | ||||||
| Snap-On (A) | 85 | 22,777 | ||||||
| Southwest Airlines (A) | 914 | 23,709 | ||||||
| Stanley Black & Decker (A) | 257 | 23,490 | ||||||
| Textron (A) | 293 | 24,785 | ||||||
| Trane Technologies (A) | 358 | 113,608 | ||||||
| TransDigm Group (A) | 91 | 113,571 | ||||||
| Uber Technologies * | 3,316 | 219,751 | ||||||
| Union Pacific (A) | 968 | 229,571 | ||||||
| United Airlines Holdings *(A) | 533 | 27,428 | ||||||
| United Parcel Service, Cl B (A) | 1,147 | 169,160 | ||||||
| United Rentals (A) | 104 | 69,471 | ||||||
| Veralto (A) | 365 | 34,193 | ||||||
| Verisk Analytics, Cl A (A) | 242 | 52,746 | ||||||
| Waste Management (A) | 594 | 123,564 | ||||||
| Westinghouse Air Brake Technologies (A) | 305 | 49,129 | ||||||
| WW Grainger (A) | 68 | 62,652 | ||||||
The accompanying notes are an integral part of the financial statements.
95
![]()
| Schedule of Investments | April 30, 2024 (Unaudited) |
Global X S&P 500® Covered Call & Growth ETF
| Shares | Value | |||||||
| COMMON STOCK — continued | ||||||||
| Industrials — continued | ||||||||
| Xylem (A) | 402 | $ | 52,541 | |||||
| 5,969,917 | ||||||||
| Information Technology — 29.2% | ||||||||
| Accenture, Cl A (A) | 998 | 300,308 | ||||||
| Adobe *(A) | 725 | 335,552 | ||||||
| Advanced Micro Devices *(A) | 2,574 | 407,670 | ||||||
| Akamai Technologies *(A) | 244 | 24,627 | ||||||
| Amphenol, Cl A (A) | 943 | 113,886 | ||||||
| Analog Devices (A) | 778 | 156,075 | ||||||
| ANSYS *(A) | 152 | 49,382 | ||||||
| Apple (A) | 23,281 | 3,965,453 | ||||||
| Applied Materials (A) | 1,331 | 264,403 | ||||||
| Arista Networks *(A) | 399 | 102,367 | ||||||
| Autodesk *(A) | 335 | 71,305 | ||||||
| Broadcom (A) | 708 | 920,591 | ||||||
| Cadence Design Systems *(A) | 441 | 121,553 | ||||||
| CDW (A) | 209 | 50,549 | ||||||
| Cisco Systems (A) | 6,446 | 302,833 | ||||||
| Cognizant Technology Solutions, Cl A (A) | 813 | 53,398 | ||||||
| Corning (A) | 1,158 | 38,654 | ||||||
| Enphase Energy *(A) | 209 | 22,731 | ||||||
| EPAM Systems *(A) | 93 | 21,879 | ||||||
| F5 *(A) | 96 | 15,870 | ||||||
| Fair Isaac *(A) | 38 | 43,066 | ||||||
| First Solar *(A) | 176 | 31,029 | ||||||
| Fortinet *(A) | 1,022 | 64,570 | ||||||
| Gartner *(A) | 129 | 53,224 | ||||||
| Gen Digital (A) | 800 | 16,112 | ||||||
| Hewlett Packard Enterprise (A) | 2,161 | 36,737 | ||||||
| HP (A) | 1,459 | 40,983 | ||||||
| Intel (A) | 6,707 | 204,362 | ||||||
| International Business Machines (A) | 1,451 | 241,156 | ||||||
| Intuit (A) | 446 | 279,026 | ||||||
| Jabil | 185 | 21,712 | ||||||
| Juniper Networks (A) | 569 | 19,813 | ||||||
| Keysight Technologies *(A) | 262 | 38,760 | ||||||
| KLA (A) | 217 | 149,576 | ||||||
| Lam Research (A) | 210 | 187,826 | ||||||
The accompanying notes are an integral part of the financial statements.
96
![]()
| Schedule of Investments | April 30, 2024 (Unaudited) |
Global X S&P 500® Covered Call & Growth ETF
| Shares | Value | |||||||
| COMMON STOCK — continued | ||||||||
| Information Technology — continued | ||||||||
| Microchip Technology (A) | 870 | $ | 80,023 | |||||
| Micron Technology (A) | 1,794 | 202,650 | ||||||
| Microsoft (A) | 11,915 | 4,638,867 | ||||||
| Monolithic Power Systems (A) | 74 | 49,530 | ||||||
| Motorola Solutions (A) | 260 | 88,179 | ||||||
| NetApp (A) | 359 | 36,693 | ||||||
| NVIDIA (A) | 3,963 | 3,424,111 | ||||||
| ON Semiconductor *(A) | 707 | 49,603 | ||||||
| Oracle (A) | 2,528 | 287,560 | ||||||
| Palo Alto Networks *(A) | 492 | 143,118 | ||||||
| PTC *(A) | 195 | 34,601 | ||||||
| Qorvo *(A) | 128 | 14,955 | ||||||
| QUALCOMM (A) | 1,772 | 293,886 | ||||||
| Roper Technologies (A) | 171 | 87,460 | ||||||
| Salesforce (A) | 1,552 | 417,395 | ||||||
| Seagate Technology Holdings (A) | 285 | 24,484 | ||||||
| ServiceNow *(A) | 329 | 228,106 | ||||||
| Skyworks Solutions (A) | 278 | 29,632 | ||||||
| Super Micro Computer * | 82 | 70,422 | ||||||
| Synopsys *(A) | 247 | 131,056 | ||||||
| TE Connectivity (A) | 489 | 69,184 | ||||||
| Teledyne Technologies *(A) | 76 | 28,992 | ||||||
| Teradyne (A) | 231 | 26,870 | ||||||
| Texas Instruments (A) | 1,442 | 254,398 | ||||||
| Trimble *(A) | 377 | 22,646 | ||||||
| Tyler Technologies *(A) | 67 | 30,924 | ||||||
| VeriSign *(A) | 156 | 26,439 | ||||||
| Western Digital *(A) | 473 | 33,503 | ||||||
| Zebra Technologies, Cl A *(A) | 83 | 26,108 | ||||||
| 19,618,433 | ||||||||
| Materials — 2.4% | ||||||||
| Air Products & Chemicals (A) | 357 | 84,373 | ||||||
| Albemarle (A) | 211 | 25,385 | ||||||
| Amcor (A) | 2,406 | 21,510 | ||||||
| Avery Dennison (A) | 136 | 29,550 | ||||||
| Ball (A) | 555 | 38,611 | ||||||
| Celanese, Cl A (A) | 158 | 24,270 | ||||||
| CF Industries Holdings (A) | 317 | 25,034 | ||||||
The accompanying notes are an integral part of the financial statements.
97
![]()
| Schedule of Investments | April 30, 2024 (Unaudited) |
Global X S&P 500® Covered Call & Growth ETF
| Shares | Value | |||||||
| COMMON STOCK — continued | ||||||||
| Materials — continued | ||||||||
| Corteva (A) | 1,103 | $ | 59,705 | |||||
| Dow (A) | 1,098 | 62,476 | ||||||
| DuPont de Nemours (A) | 662 | 47,995 | ||||||
| Eastman Chemical (A) | 157 | 14,827 | ||||||
| Ecolab (A) | 401 | 90,686 | ||||||
| FMC (A) | 231 | 13,631 | ||||||
| Freeport-McMoRan (A) | 2,228 | 111,266 | ||||||
| International Flavors & Fragrances (A) | 377 | 31,913 | ||||||
| International Paper (A) | 515 | 17,994 | ||||||
| Linde PLC (A) | 770 | 339,539 | ||||||
| LyondellBasell Industries, Cl A (A) | 396 | 39,588 | ||||||
| Martin Marietta Materials (A) | 95 | 55,772 | ||||||
| Mosaic (A) | 525 | 16,480 | ||||||
| Newmont (A) | 1,876 | 76,241 | ||||||
| Nucor (A) | 382 | 64,379 | ||||||
| Packaging Corp of America (A) | 152 | 26,293 | ||||||
| PPG Industries (A) | 369 | 47,601 | ||||||
| Sherwin-Williams (A) | 381 | 114,151 | ||||||
| Steel Dynamics (A) | 224 | 29,147 | ||||||
| Vulcan Materials (A) | 215 | 55,391 | ||||||
| Westrock (A) | 463 | 22,206 | ||||||
| 1,586,014 | ||||||||
| Real Estate — 2.2% | ||||||||
| Alexandria Real Estate Equities ‡(A) | 258 | 29,894 | ||||||
| American Tower ‡(A) | 757 | 129,871 | ||||||
| AvalonBay Communities ‡(A) | 216 | 40,947 | ||||||
| Boston Properties ‡(A) | 232 | 14,358 | ||||||
| Camden Property Trust ‡(A) | 174 | 17,344 | ||||||
| CBRE Group, Cl A *(A) | 472 | 41,012 | ||||||
| CoStar Group *(A) | 638 | 58,396 | ||||||
| Crown Castle ‡(A) | 681 | 63,864 | ||||||
| Digital Realty Trust ‡(A) | 474 | 65,782 | ||||||
| Equinix ‡(A) | 150 | 106,667 | ||||||
| Equity Residential ‡(A) | 580 | 37,352 | ||||||
| Essex Property Trust ‡(A) | 103 | 25,364 | ||||||
| Extra Space Storage ‡(A) | 316 | 42,432 | ||||||
| Federal Realty Investment Trust ‡(A) | 117 | 12,188 | ||||||
| Healthpeak Properties ‡(A) | 934 | 17,382 | ||||||
The accompanying notes are an integral part of the financial statements.
98
![]()
| Schedule of Investments | April 30, 2024 (Unaudited) |
Global X S&P 500® Covered Call & Growth ETF
| Shares | Value | |||||||
| COMMON STOCK — continued | ||||||||
| Real Estate — continued | ||||||||
| Host Hotels & Resorts ‡(A) | 988 | $ | 18,644 | |||||
| Invitation Homes ‡(A) | 923 | 31,567 | ||||||
| Iron Mountain ‡(A) | 432 | 33,489 | ||||||
| Kimco Realty ‡(A) | 1,102 | 20,530 | ||||||
| Mid-America Apartment Communities ‡(A) | 209 | 27,170 | ||||||
| ProLogis ‡(A) | 1,465 | 149,503 | ||||||
| Public Storage ‡(A) | 264 | 68,495 | ||||||
| Realty Income ‡(A) | 1,320 | 70,673 | ||||||
| Regency Centers ‡(A) | 233 | 13,798 | ||||||
| SBA Communications, Cl A ‡(A) | 167 | 31,082 | ||||||
| Simon Property Group ‡(A) | 511 | 71,811 | ||||||
| UDR ‡(A) | 537 | 20,449 | ||||||
| Ventas ‡(A) | 691 | 30,597 | ||||||
| VICI Properties, Cl A ‡(A) | 1,635 | 46,679 | ||||||
| Welltower ‡(A) | 851 | 81,083 | ||||||
| Weyerhaeuser ‡(A) | 1,227 | 37,019 | ||||||
| 1,455,442 | ||||||||
| Utilities — 2.4% | ||||||||
| AES (A) | 1,248 | 22,339 | ||||||
| Alliant Energy (A) | 461 | 22,958 | ||||||
| Ameren (A) | 460 | 33,980 | ||||||
| American Electric Power (A) | 877 | 75,448 | ||||||
| American Water Works (A) | 317 | 38,775 | ||||||
| Atmos Energy (A) | 252 | 29,711 | ||||||
| CenterPoint Energy (A) | 960 | 27,974 | ||||||
| CMS Energy (A) | 513 | 31,093 | ||||||
| Consolidated Edison (A) | 554 | 52,298 | ||||||
| Constellation Energy (A) | 499 | 92,784 | ||||||
| Dominion Energy (A) | 1,310 | 66,784 | ||||||
| DTE Energy (A) | 353 | 38,943 | ||||||
| Duke Energy (A) | 1,234 | 121,253 | ||||||
| Edison International (A) | 580 | 41,215 | ||||||
| Entergy (A) | 316 | 33,708 | ||||||
| Evergy (A) | 373 | 19,564 | ||||||
| Eversource Energy (A) | 503 | 30,492 | ||||||
| Exelon (A) | 1,554 | 58,399 | ||||||
| FirstEnergy (A) | 758 | 29,062 | ||||||
| NextEra Energy (A) | 3,255 | 217,987 | ||||||
The accompanying notes are an integral part of the financial statements.
99
![]()
| Schedule of Investments | April 30, 2024 (Unaudited) |
Global X S&P 500® Covered Call & Growth ETF
| Shares | Value | |||||||
| COMMON STOCK — continued | ||||||||
| Utilities — continued | ||||||||
| NiSource (A) | 694 | $ | 19,335 | |||||
| NRG Energy (A) | 320 | 23,254 | ||||||
| PG&E (A) | 3,373 | 57,712 | ||||||
| Pinnacle West Capital (A) | 229 | 16,866 | ||||||
| PPL (A) | 1,242 | 34,105 | ||||||
| Public Service Enterprise Group (A) | 835 | 57,682 | ||||||
| Sempra (A) | 1,017 | 72,848 | ||||||
| Southern (A) | 1,771 | 130,169 | ||||||
| WEC Energy Group (A) | 510 | 42,146 | ||||||
| Xcel Energy (A) | 870 | 46,745 | ||||||
| 1,585,629 | ||||||||
| TOTAL UNITED STATES | 67,519,987 | |||||||
| TOTAL COMMON STOCK (Cost $61,036,298) | 67,624,513 | |||||||
| TOTAL INVESTMENTS — 100.8% (Cost $61,036,298) | $ | 67,624,513 | ||||||
| WRITTEN OPTIONS— (0.9)% (Premiums Received $(569,017)) | $ | (605,680 | ) | |||||
| Percentages are based on Net Assets of $67,082,863. | ||||||||
A list of the exchange traded option contracts held by the Fund at April 30, 2024, is as follows:
| Description | Number of Contracts | Notional Amount | Exercise Price | Expiration Date | Value | |||||||||||
| WRITTEN OPTIONS — (0.9)% | ||||||||||||||||
| Call Options | ||||||||||||||||
| S&P 500 Index | (67) | $ | (33,739,123 | ) | $ | 5,005 | 05/17/24 | $ | (605,680 | ) | ||||||
| * | Non-income producing security. |
| ‡ | Real Estate Investment Trust |
| (A) | All or a portion of these securities has been segregated as collateral for options contracts. The Fair Value of the securities pledged as collateral is $35,174,718. |
The accompanying notes are an integral part of the financial statements.
100
![]()
| Schedule of Investments | April 30, 2024 (Unaudited) |
Global X S&P 500® Covered Call & Growth ETF
The following is a summary of the level of inputs used as of April 30, 2024, in valuing the Fund’s investments and other financial instruments carried at value:
| Investments in Securities | Level 1 | Level 2 | Level 3 | Total | ||||||||||||
| Common Stock | $ | 67,624,513 | $ | — | $ | — | $ | 67,624,513 | ||||||||
| Total Investments in Securities | $ | 67,624,513 | $ | — | $ | — | $ | 67,624,513 | ||||||||
| Other Financial Instruments | Level 1 | Level 2 | Level 3 | Total | ||||||||||||
| Written Options | $ | (605,680 | ) | $ | — | $ | — | $ | (605,680 | ) | ||||||
| Total Other Financial Instruments | $ | (605,680 | ) | $ | — | $ | — | $ | (605,680 | ) | ||||||
Amounts designated as “—” are $0 or have been rounded to $0.
See “Glossary” for abbreviations.
The accompanying notes are an integral part of the financial statements.
101
![]()
| Schedule of Investments | April 30, 2024 (Unaudited) |
Global X NASDAQ 100® Risk Managed Income ETF
Sector Weightings †:
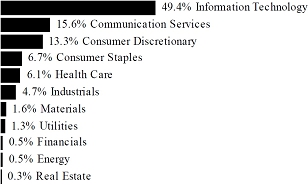
† Sector weightings percentages are based on the total market value of investments. Total investments do not include derivatives such as options, futures contracts, forward contracts, and swap contracts, if applicable.
| Shares | Value | |||||||
| COMMON STOCK(A) — 102.5% | ||||||||
| BRAZIL — 0.6% | ||||||||
| Consumer Discretionary — 0.6% | ||||||||
| MercadoLibre * | 52 | $ | 75,852 | |||||
| CHINA — 1.2% | ||||||||
| Consumer Discretionary — 0.7% | ||||||||
| PDD Holdings ADR * | 678 | 84,872 | ||||||
| Information Technology — 0.5% | ||||||||
| NXP Semiconductors | 259 | 66,353 | ||||||
| TOTAL CHINA | 151,225 | |||||||
| NETHERLANDS — 0.6% | ||||||||
| Information Technology — 0.6% | ||||||||
| ASML Holding, Cl G | 87 | 75,905 | ||||||
| UNITED KINGDOM — 0.6% | ||||||||
| Consumer Staples — 0.3% | ||||||||
| Coca-Cola Europacific Partners | 455 | 32,769 | ||||||
The accompanying notes are an integral part of the financial statements.
102
![]()
| Schedule of Investments | April 30, 2024 (Unaudited) |
Global X NASDAQ 100® Risk Managed Income ETF
| Shares | Value | |||||||
| COMMON STOCK — continued | ||||||||
| Health Care — 0.3% | ||||||||
| AstraZeneca ADR | 595 | $ | 45,149 | |||||
| TOTAL UNITED KINGDOM | 77,918 | |||||||
| UNITED STATES — 99.5% | ||||||||
| Communication Services — 16.0% | ||||||||
| Alphabet, Cl A * | 2,316 | 376,998 | ||||||
| Alphabet, Cl C * | 2,229 | 366,982 | ||||||
| Charter Communications, Cl A * | 146 | 37,367 | ||||||
| Comcast, Cl A | 4,020 | 153,202 | ||||||
| Electronic Arts | 265 | 33,607 | ||||||
| Meta Platforms, Cl A | 1,376 | 591,914 | ||||||
| Netflix * | 440 | 242,282 | ||||||
| Sirius XM Holdings | 3,772 | 11,090 | ||||||
| Take-Two Interactive Software * | 176 | 25,135 | ||||||
| T-Mobile US | 1,203 | 197,496 | ||||||
| Trade Desk, Cl A * | 455 | 37,697 | ||||||
| Warner Bros Discovery * | 2,471 | 18,187 | ||||||
| 2,091,957 | ||||||||
| Consumer Discretionary — 12.4% | ||||||||
| Airbnb, Cl A * | 446 | 70,722 | ||||||
| Amazon.com * | 4,081 | 714,175 | ||||||
| Booking Holdings | 34 | 117,369 | ||||||
| DoorDash, Cl A * | 379 | 48,989 | ||||||
| Lululemon Athletica * | 123 | 44,354 | ||||||
| Marriott International, Cl A | 291 | 68,714 | ||||||
| O’Reilly Automotive * | 60 | 60,796 | ||||||
| Ross Stores | 343 | 44,436 | ||||||
| Starbucks | 1,148 | 101,586 | ||||||
| Tesla * | 1,893 | 346,949 | ||||||
| 1,618,090 | ||||||||
| Consumer Staples — 6.6% | ||||||||
| Costco Wholesale | 451 | 326,028 | ||||||
| Dollar Tree * | 222 | 26,252 | ||||||
| Keurig Dr Pepper | 1,423 | 47,955 | ||||||
| Kraft Heinz | 1,214 | 46,873 | ||||||
| Mondelez International, Cl A | 1,366 | 98,270 | ||||||
| Monster Beverage * | 1,063 | 56,817 | ||||||
The accompanying notes are an integral part of the financial statements.
103
![]()
| Schedule of Investments | April 30, 2024 (Unaudited) |
Global X NASDAQ 100® Risk Managed Income ETF
| Shares | Value | |||||||
| COMMON STOCK — continued | ||||||||
| Consumer Staples — continued | ||||||||
| PepsiCo | 1,395 | $ | 245,394 | |||||
| Walgreens Boots Alliance | 849 | 15,053 | ||||||
| 862,642 | ||||||||
| Energy — 0.5% | ||||||||
| Baker Hughes, Cl A | 1,021 | 33,305 | ||||||
| Diamondback Energy | 177 | 35,600 | ||||||
| 68,905 | ||||||||
| Financials — 0.6% | ||||||||
| PayPal Holdings * | 1,076 | 73,082 | ||||||
| Health Care — 6.0% | ||||||||
| Amgen | 544 | 149,023 | ||||||
| Biogen * | 148 | 31,793 | ||||||
| Dexcom * | 393 | 50,064 | ||||||
| GE HealthCare Technologies | 464 | 35,375 | ||||||
| Gilead Sciences | 1,262 | 82,282 | ||||||
| IDEXX Laboratories * | 83 | 40,899 | ||||||
| Illumina * | 157 | 19,319 | ||||||
| Intuitive Surgical * | 356 | 131,941 | ||||||
| Moderna * | 382 | 42,139 | ||||||
| Regeneron Pharmaceuticals * | 109 | 97,082 | ||||||
| Vertex Pharmaceuticals * | 261 | 102,524 | ||||||
| 782,441 | ||||||||
| Industrials — 4.8% | ||||||||
| Automatic Data Processing | 416 | 100,626 | ||||||
| Cintas | 101 | 66,492 | ||||||
| Copart * | 981 | 53,278 | ||||||
| CSX | 1,967 | 65,344 | ||||||
| Fastenal | 582 | 39,541 | ||||||
| Honeywell International | 660 | 127,202 | ||||||
| Old Dominion Freight Line | 222 | 40,340 | ||||||
| PACCAR | 535 | 56,769 | ||||||
| Paychex | 370 | 43,960 | ||||||
| Verisk Analytics, Cl A | 148 | 32,258 | ||||||
| 625,810 | ||||||||
The accompanying notes are an integral part of the financial statements.
104
![]()
| Schedule of Investments | April 30, 2024 (Unaudited) |
Global X NASDAQ 100® Risk Managed Income ETF
| Shares | Value | |||||||
| COMMON STOCK — continued | ||||||||
| Information Technology — 49.4% | ||||||||
| Adobe * | 459 | $ | 212,439 | |||||
| Advanced Micro Devices * | 1,639 | 259,585 | ||||||
| Analog Devices | 498 | 99,904 | ||||||
| ANSYS * | 87 | 28,264 | ||||||
| Apple | 6,069 | 1,033,733 | ||||||
| Applied Materials | 843 | 167,462 | ||||||
| Atlassian, Cl A * | 157 | 27,051 | ||||||
| Autodesk * | 219 | 46,614 | ||||||
| Broadcom | 470 | 611,127 | ||||||
| Cadence Design Systems * | 275 | 75,798 | ||||||
| CDW | 138 | 33,377 | ||||||
| Cisco Systems | 4,108 | 192,994 | ||||||
| Cognizant Technology Solutions, Cl A | 510 | 33,497 | ||||||
| Crowdstrike Holdings, Cl A * | 229 | 66,992 | ||||||
| Datadog, Cl A * | 308 | 38,654 | ||||||
| Fortinet * | 765 | 48,333 | ||||||
| GLOBALFOUNDRIES * | 545 | 26,640 | ||||||
| Intel | 4,288 | 130,655 | ||||||
| Intuit | 285 | 178,302 | ||||||
| KLA | 137 | 94,433 | ||||||
| Lam Research | 133 | 118,956 | ||||||
| Marvell Technology | 879 | 57,935 | ||||||
| Microchip Technology | 551 | 50,681 | ||||||
| Micron Technology | 1,119 | 126,402 | ||||||
| Microsoft | 2,919 | 1,136,454 | ||||||
| MongoDB, Cl A * | 73 | 26,658 | ||||||
| NVIDIA | 983 | 849,332 | ||||||
| ON Semiconductor * | 440 | 30,870 | ||||||
| Palo Alto Networks * | 327 | 95,121 | ||||||
| QUALCOMM | 1,133 | 187,908 | ||||||
| Roper Technologies | 108 | 55,238 | ||||||
| Synopsys * | 155 | 82,241 | ||||||
| Texas Instruments | 923 | 162,836 | ||||||
| Workday, Cl A * | 210 | 51,393 | ||||||
| Zscaler * | 151 | 26,114 | ||||||
| 6,463,993 | ||||||||
The accompanying notes are an integral part of the financial statements.
105
![]()
| Schedule of Investments | April 30, 2024 (Unaudited) |
Global X NASDAQ 100® Risk Managed Income ETF
| Shares | Value | |||||||
| COMMON STOCK — continued | ||||||||
| Materials — 1.6% | ||||||||
| Linde PLC | 488 | $ | 215,188 | |||||
| Real Estate — 0.3% | ||||||||
| CoStar Group * | 413 | 37,802 | ||||||
| Utilities — 1.3% | ||||||||
| American Electric Power | 536 | 46,112 | ||||||
| Constellation Energy | 317 | 58,943 | ||||||
| Exelon | 1,012 | 38,031 | ||||||
| Xcel Energy | 560 | 30,089 | ||||||
| 173,175 | ||||||||
| TOTAL UNITED STATES | 13,013,085 | |||||||
| TOTAL COMMON STOCK (Cost $11,209,597) | 13,393,985 | |||||||
| PURCHASED OPTIONS — 0.2% (Cost $104,832) | 29,817 | |||||||
| TOTAL INVESTMENTS — 102.7% (Cost $11,314,429) | $ | 13,423,802 | ||||||
| WRITTEN OPTIONS— (2.8)% (Premiums Received $(301,018)) | $ | (368,920 | ) | |||||
Percentages are based on Net Assets of $13,073,510.
The accompanying notes are an integral part of the financial statements.
106
![]()
| Schedule of Investments | April 30, 2024 (Unaudited) |
Global X NASDAQ 100® Risk Managed Income ETF
A list of the exchange traded option contracts held by the Fund at April 30, 2024, is as follows:
| Description | Number of Contracts | Notional Amount | Exercise Price | Expiration Date | Value | |||||||||||||
| PURCHASED OPTIONS — 0.2% | ||||||||||||||||||
| Put Options | ||||||||||||||||||
| Nasdaq-100 | 6 | $ | 10,464,414 | $ | 16,375 | 05/17/24 | $ | 21,360 | ||||||||||
| Nasdaq-100® Reduced-Value Index | 8 | 2,790,512 | 3,270 | 05/17/24 | 8,457 | |||||||||||||
| Total Purchased Options | $ | 13,254,926 | $ | 29,817 | ||||||||||||||
| WRITTEN OPTIONS — (2.8)% | ||||||||||||||||||
| Call Options | ||||||||||||||||||
| Nasdaq-100 | (6 | ) | $ | (10,464,414 | ) | $ | 17,250 | 05/17/24 | $ | (268,320 | ) | |||||||
| Nasdaq-100® Reduced-Value Index | (8 | ) | (2,790,512 | ) | 3,400 | 05/17/24 | (100,600 | ) | ||||||||||
| Total Written Options | $ | (13,254,926 | ) | $ | (368,920 | ) | ||||||||||||
| * | Non-income producing security. |
| (A) | All or a portion of these securities has been segregated as collateral for options contracts. The Fair Value of the securities pledged as collateral is $13,301,874. |
The following is a summary of the level of inputs used as of April 30, 2024, in valuing the Fund’s investments and other financial instruments carried at value:
| Investments in Securities | Level 1 | Level 2 | Level 3 | Total | ||||||||||||
| Common Stock | $ | 13,393,985 | $ | — | $ | — | $ | 13,393,985 | ||||||||
| Purchased Options | 29,817 | — | — | 29,817 | ||||||||||||
| Total Investments in Securities | $ | 13,423,802 | $ | — | $ | — | $ | 13,423,802 | ||||||||
| Other Financial Instruments | Level 1 | Level 2 | Level 3 | Total | ||||||||||||
| Written Options | $ | (368,920 | ) | $ | — | $ | — | $ | (368,920 | ) | ||||||
| Total Other Financial Instruments | $ | (368,920 | ) | $ | — | $ | — | $ | (368,920 | ) | ||||||
Amounts designated as “—” are $0 or have been rounded to $0.
See “Glossary” for abbreviations.
The accompanying notes are an integral part of the financial statements.
107
![]()
| Schedule of Investments | April 30, 2024 (Unaudited) |
| Global X S&P 500® Risk Managed Income ETF | |
Sector Weightings †:
![]()
† Sector weightings percentages are based on the total market value of investments. Total investments do not include derivatives such as options, futures contracts, forward contracts, and swap contracts, if applicable.
| Shares | Value | |||||||
| COMMON STOCK(A) — 101.6% | ||||||||
| CHINA — 0.2% | ||||||||
| Information Technology — 0.2% | ||||||||
| NXP Semiconductors | 201 | $ | 51,494 | |||||
| UNITED STATES — 101.4% | ||||||||
| Communication Services — 9.3% | ||||||||
| Alphabet, Cl A * | 4,741 | 771,740 | ||||||
| Alphabet, Cl C * | 3,975 | 654,444 | ||||||
| AT&T | 5,782 | 97,658 | ||||||
| Charter Communications, Cl A * | 75 | 19,196 | ||||||
| Comcast, Cl A | 3,162 | 120,504 | ||||||
| Electronic Arts | 205 | 25,998 | ||||||
| Fox, Cl A | 206 | 6,388 | ||||||
| Fox, Cl B | 107 | 3,069 | ||||||
| Interpublic Group | 326 | 9,923 | ||||||
| Live Nation Entertainment * | 105 | 9,336 | ||||||
| Match Group * | 229 | 7,058 | ||||||
| Meta Platforms, Cl A | 1,770 | 761,401 | ||||||
| Netflix * | 347 | 191,072 | ||||||
| News, Cl A | 355 | 8,449 | ||||||
| News, Cl B | 99 | 2,429 | ||||||
The accompanying notes are an integral part of the financial statements.
108
![]()
| Schedule of Investments | April 30, 2024 (Unaudited) |
| Global X S&P 500® Risk Managed Income ETF | |
| Shares | Value | |||||||
| COMMON STOCK — continued | ||||||||
| Communication Services — continued | ||||||||
| Omnicom Group | 168 | $ | 15,597 | |||||
| Paramount Global, Cl B | 370 | 4,214 | ||||||
| Take-Two Interactive Software * | 128 | 18,280 | ||||||
| T-Mobile US | 413 | 67,802 | ||||||
| Verizon Communications | 3,407 | 134,542 | ||||||
| Walt Disney | 1,480 | 164,428 | ||||||
| Warner Bros Discovery * | 1,907 | 14,036 | ||||||
| 3,107,564 | ||||||||
| Consumer Discretionary — 10.5% | ||||||||
| Airbnb, Cl A * | 350 | 55,500 | ||||||
| Amazon.com * | 7,365 | 1,288,875 | ||||||
| Aptiv * | 233 | 16,543 | ||||||
| AutoZone * | 14 | 41,390 | ||||||
| Bath & Body Works | 210 | 9,538 | ||||||
| Best Buy | 172 | 12,666 | ||||||
| Booking Holdings | 28 | 96,657 | ||||||
| BorgWarner | 197 | 6,456 | ||||||
| Caesars Entertainment * | 198 | 7,092 | ||||||
| CarMax * | 146 | 9,924 | ||||||
| Carnival * | 855 | 12,671 | ||||||
| Chipotle Mexican Grill, Cl A * | 22 | 69,511 | ||||||
| Darden Restaurants | 93 | 14,267 | ||||||
| Deckers Outdoor * | 18 | 14,732 | ||||||
| Domino’s Pizza | 24 | 12,703 | ||||||
| DR Horton | 233 | 33,200 | ||||||
| eBay | 390 | 20,101 | ||||||
| Etsy * | 112 | 7,691 | ||||||
| Expedia Group * | 99 | 13,328 | ||||||
| Ford Motor | 3,197 | 38,844 | ||||||
| Garmin | 137 | 19,792 | ||||||
| General Motors | 896 | 39,899 | ||||||
| Genuine Parts | 113 | 17,765 | ||||||
| Hasbro | 120 | 7,356 | ||||||
| Hilton Worldwide Holdings | 195 | 38,470 | ||||||
| Home Depot | 794 | 265,371 | ||||||
| Las Vegas Sands | 308 | 13,663 | ||||||
| Lennar, Cl A | 195 | 29,566 | ||||||
| LKQ | 222 | 9,575 | ||||||
The accompanying notes are an integral part of the financial statements.
109
![]()
| Schedule of Investments | April 30, 2024 (Unaudited) |
| Global X S&P 500® Risk Managed Income ETF | |
| Shares | Value | |||||||
| COMMON STOCK — continued | ||||||||
| Consumer Discretionary — continued | ||||||||
| Lowe’s | 473 | $ | 107,839 | |||||
| Lululemon Athletica * | 99 | 35,699 | ||||||
| Marriott International, Cl A | 198 | 46,754 | ||||||
| McDonald’s | 584 | 159,455 | ||||||
| MGM Resorts International * | 226 | 8,913 | ||||||
| Mohawk Industries * | 41 | 4,728 | ||||||
| NIKE, Cl B | 988 | 91,153 | ||||||
| Norwegian Cruise Line Holdings * | 347 | 6,565 | ||||||
| NVR * | 3 | 22,317 | ||||||
| O’Reilly Automotive * | 48 | 48,636 | ||||||
| Pool | 27 | 9,788 | ||||||
| PulteGroup | 183 | 20,390 | ||||||
| Ralph Lauren, Cl A | 31 | 5,073 | ||||||
| Ross Stores | 278 | 36,015 | ||||||
| Royal Caribbean Cruises * | 198 | 27,647 | ||||||
| Starbucks | 920 | 81,411 | ||||||
| Tapestry | 187 | 7,465 | ||||||
| Tesla * | 2,233 | 409,264 | ||||||
| TJX | 922 | 86,751 | ||||||
| Tractor Supply | 87 | 23,758 | ||||||
| Ulta Beauty * | 35 | 14,169 | ||||||
| Wynn Resorts | 76 | 6,965 | ||||||
| Yum! Brands | 233 | 32,911 | ||||||
| 3,516,812 | ||||||||
| Consumer Staples — 6.3% | ||||||||
| Altria Group | 1,422 | 62,298 | ||||||
| Archer-Daniels-Midland | 428 | 25,106 | ||||||
| Brown-Forman, Cl B | 159 | 7,608 | ||||||
| Bunge Global | 131 | 13,331 | ||||||
| Campbell Soup | 161 | 7,359 | ||||||
| Church & Dwight | 206 | 22,225 | ||||||
| Clorox | 102 | 15,083 | ||||||
| Coca-Cola | 3,164 | 195,440 | ||||||
| Colgate-Palmolive | 666 | 61,219 | ||||||
| Conagra Brands | 401 | 12,343 | ||||||
| Constellation Brands, Cl A | 133 | 33,710 | ||||||
| Costco Wholesale | 356 | 257,352 | ||||||
| Dollar General | 168 | 23,384 | ||||||
The accompanying notes are an integral part of the financial statements.
110
![]()
| Schedule of Investments | April 30, 2024 (Unaudited) |
| Global X S&P 500® Risk Managed Income ETF | |
| Shares | Value | |||||||
| COMMON STOCK — continued | ||||||||
| Consumer Staples — continued | ||||||||
| Dollar Tree * | 163 | $ | 19,275 | |||||
| Estee Lauder, Cl A | 197 | 28,902 | ||||||
| General Mills | 442 | 31,143 | ||||||
| Hershey | 117 | 22,689 | ||||||
| Hormel Foods | 238 | 8,463 | ||||||
| J M Smucker | 86 | 9,877 | ||||||
| Kellanova | 213 | 12,324 | ||||||
| Kenvue | 1,367 | 25,727 | ||||||
| Keurig Dr Pepper | 802 | 27,027 | ||||||
| Kimberly-Clark | 276 | 37,682 | ||||||
| Kraft Heinz | 608 | 23,475 | ||||||
| Kroger | 560 | 31,013 | ||||||
| Lamb Weston Holdings | 107 | 8,917 | ||||||
| McCormick | 209 | 15,897 | ||||||
| Molson Coors Beverage, Cl B | 160 | 9,162 | ||||||
| Mondelez International, Cl A | 1,096 | 78,846 | ||||||
| Monster Beverage * | 583 | 31,161 | ||||||
| PepsiCo | 1,113 | 195,788 | ||||||
| Philip Morris International | 1,256 | 119,245 | ||||||
| Procter & Gamble | 1,891 | 308,611 | ||||||
| Sysco | 383 | 28,465 | ||||||
| Target | 370 | 59,563 | ||||||
| Tyson Foods, Cl A | 242 | 14,677 | ||||||
| Walgreens Boots Alliance | 597 | 10,585 | ||||||
| Walmart | 3,462 | 205,470 | ||||||
| 2,100,442 | ||||||||
| Energy — 4.1% | ||||||||
| APA | 256 | 8,049 | ||||||
| Baker Hughes, Cl A | 800 | 26,096 | ||||||
| Chevron | 1,390 | 224,165 | ||||||
| ConocoPhillips | 955 | 119,967 | ||||||
| Coterra Energy | 631 | 17,264 | ||||||
| Devon Energy | 490 | 25,078 | ||||||
| Diamondback Energy | 144 | 28,963 | ||||||
| EOG Resources | 474 | 62,630 | ||||||
| EQT | 349 | 13,991 | ||||||
| Exxon Mobil | 3,188 | 377,045 | ||||||
| Halliburton | 682 | 25,555 | ||||||
The accompanying notes are an integral part of the financial statements.
111
![]()
| Schedule of Investments | April 30, 2024 (Unaudited) |
| Global X S&P 500® Risk Managed Income ETF | |
| Shares | Value | |||||||
| COMMON STOCK — continued | ||||||||
| Energy — continued | ||||||||
| Hess | 230 | $ | 36,223 | |||||
| Kinder Morgan | 1,534 | 28,042 | ||||||
| Marathon Oil | 497 | 13,344 | ||||||
| Marathon Petroleum | 293 | 53,244 | ||||||
| Occidental Petroleum | 509 | 33,665 | ||||||
| ONEOK | 456 | 36,079 | ||||||
| Phillips 66 | 339 | 48,548 | ||||||
| Pioneer Natural Resources | 182 | 49,016 | ||||||
| Schlumberger | 1,147 | 54,460 | ||||||
| Targa Resources | 189 | 21,557 | ||||||
| Valero Energy | 287 | 45,883 | ||||||
| Williams | 940 | 36,058 | ||||||
| 1,384,922 | ||||||||
| Financials — 13.3% | ||||||||
| Aflac | 428 | 35,802 | ||||||
| Allstate | 219 | 37,243 | ||||||
| American Express | 458 | 107,186 | ||||||
| American International Group | 562 | 42,324 | ||||||
| Ameriprise Financial | 81 | 33,355 | ||||||
| Aon PLC, Cl A | 162 | 45,686 | ||||||
| Arch Capital Group * | 300 | 28,062 | ||||||
| Arthur J Gallagher | 173 | 40,601 | ||||||
| Assurant | 35 | 6,104 | ||||||
| Bank of America | 5,586 | 206,738 | ||||||
| Bank of New York Mellon | 611 | 34,515 | ||||||
| Berkshire Hathaway, Cl B * | 1,471 | 583,590 | ||||||
| BlackRock, Cl A | 114 | 86,029 | ||||||
| Blackstone | 570 | 66,468 | ||||||
| Brown & Brown | 198 | 16,145 | ||||||
| Capital One Financial | 309 | 44,320 | ||||||
| Cboe Global Markets | 86 | 15,579 | ||||||
| Charles Schwab | 1,205 | 89,110 | ||||||
| Chubb | 332 | 82,549 | ||||||
| Cincinnati Financial | 138 | 15,965 | ||||||
| Citigroup | 1,551 | 95,123 | ||||||
| Citizens Financial Group | 416 | 14,190 | ||||||
| CME Group, Cl A | 295 | 61,844 | ||||||
| Comerica | 117 | 5,870 | ||||||
The accompanying notes are an integral part of the financial statements.
112
![]()
| Schedule of Investments | April 30, 2024 (Unaudited) |
| Global X S&P 500® Risk Managed Income ETF | |
| Shares | Value | |||||||
| COMMON STOCK — continued | ||||||||
| Financials — continued | ||||||||
| Corpay * | 51 | $ | 15,409 | |||||
| Discover Financial Services | 188 | 23,825 | ||||||
| Everest Group | 32 | 11,725 | ||||||
| FactSet Research Systems | 28 | 11,673 | ||||||
| Fidelity National Information Services | 461 | 31,311 | ||||||
| Fifth Third Bancorp | 513 | 18,704 | ||||||
| Fiserv * | 488 | 74,503 | ||||||
| Franklin Resources | 255 | 5,824 | ||||||
| Global Payments | 216 | 26,518 | ||||||
| Globe Life | 58 | 4,418 | ||||||
| Goldman Sachs Group | 257 | 109,664 | ||||||
| Hartford Financial Services Group | 253 | 24,513 | ||||||
| Huntington Bancshares | 1,283 | 17,282 | ||||||
| Intercontinental Exchange | 467 | 60,131 | ||||||
| Invesco | 367 | 5,200 | ||||||
| Jack Henry & Associates | 52 | 8,460 | ||||||
| JPMorgan Chase | 2,321 | 445,029 | ||||||
| KeyCorp | 788 | 11,418 | ||||||
| Loews | 159 | 11,949 | ||||||
| M&T Bank | 132 | 19,059 | ||||||
| MarketAxess Holdings | 29 | 5,803 | ||||||
| Marsh & McLennan | 395 | 78,775 | ||||||
| Mastercard, Cl A | 664 | 299,597 | ||||||
| MetLife | 503 | 35,753 | ||||||
| Moody’s | 130 | 48,143 | ||||||
| Morgan Stanley | 1,025 | 93,111 | ||||||
| MSCI, Cl A | 65 | 30,276 | ||||||
| Nasdaq | 299 | 17,895 | ||||||
| Northern Trust | 177 | 14,583 | ||||||
| PayPal Holdings * | 867 | 58,887 | ||||||
| PNC Financial Services Group | 332 | 50,882 | ||||||
| Principal Financial Group | 194 | 15,353 | ||||||
| Progressive | 478 | 99,544 | ||||||
| Prudential Financial | 282 | 31,155 | ||||||
| Raymond James Financial | 162 | 19,764 | ||||||
| Regions Financial | 774 | 14,915 | ||||||
| S&P Global | 255 | 106,037 | ||||||
| State Street | 252 | 18,267 | ||||||
| Synchrony Financial | 349 | 15,349 | ||||||
The accompanying notes are an integral part of the financial statements.
113
![]()
| Schedule of Investments | April 30, 2024 (Unaudited) |
| Global X S&P 500® Risk Managed Income ETF | |
| Shares | Value | |||||||
| COMMON STOCK — continued | ||||||||
| Financials — continued | ||||||||
| T Rowe Price Group | 188 | $ | 20,599 | |||||
| Travelers | 182 | 38,613 | ||||||
| Truist Financial | 1,037 | 38,939 | ||||||
| US Bancorp | 1,249 | 50,747 | ||||||
| Visa, Cl A | 1,268 | 340,597 | ||||||
| W R Berkley | 174 | 13,393 | ||||||
| Wells Fargo | 2,874 | 170,486 | ||||||
| Willis Towers Watson | 75 | 18,836 | ||||||
| 4,477,312 | ||||||||
| Health Care — 12.5% | ||||||||
| Abbott Laboratories | 1,410 | 149,418 | ||||||
| AbbVie | 1,415 | 230,136 | ||||||
| Agilent Technologies | 243 | 33,301 | ||||||
| Align Technology * | 53 | 14,966 | ||||||
| Amgen | 427 | 116,972 | ||||||
| Baxter International | 418 | 16,875 | ||||||
| Becton Dickinson | 224 | 52,550 | ||||||
| Biogen * | 124 | 26,638 | ||||||
| Bio-Rad Laboratories, Cl A * | 16 | 4,316 | ||||||
| Bio-Techne | 147 | 9,292 | ||||||
| Boston Scientific * | 1,187 | 85,310 | ||||||
| Bristol-Myers Squibb | 1,640 | 72,062 | ||||||
| Cardinal Health | 184 | 18,959 | ||||||
| Catalent * | 153 | 8,545 | ||||||
| Cencora | 136 | 32,511 | ||||||
| Centene * | 419 | 30,612 | ||||||
| Charles River Laboratories International * | 34 | 7,786 | ||||||
| Cigna Group | 231 | 82,476 | ||||||
| Cooper | 165 | 14,695 | ||||||
| CVS Health | 1,000 | 67,710 | ||||||
| Danaher | 533 | 131,448 | ||||||
| DaVita * | 43 | 5,977 | ||||||
| Dexcom * | 312 | 39,746 | ||||||
| Edwards Lifesciences * | 489 | 41,404 | ||||||
| Elevance Health | 189 | 99,902 | ||||||
| Eli Lilly | 644 | 503,028 | ||||||
| GE HealthCare Technologies | 336 | 25,617 | ||||||
| Gilead Sciences | 1,010 | 65,852 | ||||||
The accompanying notes are an integral part of the financial statements.
114
![]()
| Schedule of Investments | April 30, 2024 (Unaudited) |
| Global X S&P 500® Risk Managed Income ETF | |
| Shares | Value | |||||||
| COMMON STOCK — continued | ||||||||
| Health Care — continued | ||||||||
| HCA Healthcare | 164 | $ | 50,810 | |||||
| Henry Schein * | 124 | 8,591 | ||||||
| Hologic * | 171 | 12,957 | ||||||
| Humana | 105 | 31,719 | ||||||
| IDEXX Laboratories * | 61 | 30,058 | ||||||
| Illumina * | 141 | 17,350 | ||||||
| Incyte * | 158 | 8,224 | ||||||
| Insulet * | 54 | 9,285 | ||||||
| Intuitive Surgical * | 291 | 107,850 | ||||||
| IQVIA Holdings * | 149 | 34,534 | ||||||
| Johnson & Johnson | 1,932 | 279,348 | ||||||
| Laboratory Corp of America Holdings | 65 | 13,089 | ||||||
| McKesson | 107 | 57,481 | ||||||
| Medtronic PLC | 1,075 | 86,258 | ||||||
| Merck | 2,042 | 263,867 | ||||||
| Mettler-Toledo International * | 16 | 19,675 | ||||||
| Moderna * | 260 | 28,681 | ||||||
| Molina Healthcare * | 43 | 14,710 | ||||||
| Pfizer | 4,572 | 117,135 | ||||||
| Quest Diagnostics | 101 | 13,956 | ||||||
| Regeneron Pharmaceuticals * | 86 | 76,597 | ||||||
| ResMed | 115 | 24,609 | ||||||
| Revvity | 114 | 11,681 | ||||||
| Solventum * | 104 | 6,761 | ||||||
| STERIS | 75 | 15,342 | ||||||
| Stryker | 280 | 94,220 | ||||||
| Teleflex | 32 | 6,680 | ||||||
| Thermo Fisher Scientific | 311 | 176,872 | ||||||
| UnitedHealth Group | 741 | 358,422 | ||||||
| Universal Health Services, Cl B | 46 | 7,840 | ||||||
| Vertex Pharmaceuticals * | 206 | 80,919 | ||||||
| Viatris | 1,013 | 11,720 | ||||||
| Waters * | 46 | 14,216 | ||||||
| West Pharmaceutical Services | 52 | 18,589 | ||||||
| Zimmer Biomet Holdings | 178 | 21,410 | ||||||
| Zoetis, Cl A | �� | 369 | 58,759 | |||||
| 4,178,319 | ||||||||
The accompanying notes are an integral part of the financial statements.
115
![]()
| Schedule of Investments | April 30, 2024 (Unaudited) |
| Global X S&P 500® Risk Managed Income ETF | |
| Shares | Value | |||||||
| COMMON STOCK — continued | ||||||||
| Industrials — 9.0% | ||||||||
| 3M | 440 | $ | 42,464 | |||||
| A O Smith | 116 | 9,609 | ||||||
| Allegion | 57 | 6,929 | ||||||
| American Airlines Group * | 556 | 7,512 | ||||||
| AMETEK | 183 | 31,963 | ||||||
| Automatic Data Processing | 334 | 80,791 | ||||||
| Axon Enterprise * | 51 | 15,997 | ||||||
| Boeing * | 466 | 78,213 | ||||||
| Broadridge Financial Solutions | 93 | 17,987 | ||||||
| Builders FirstSource * | 104 | 19,013 | ||||||
| Carrier Global | 652 | 40,091 | ||||||
| Caterpillar | 409 | 136,839 | ||||||
| CH Robinson Worldwide | 117 | 8,307 | ||||||
| Cintas | 64 | 42,134 | ||||||
| Copart * | 697 | 37,854 | ||||||
| CSX | 1,590 | 52,820 | ||||||
| Cummins | 118 | 33,334 | ||||||
| Dayforce * | 141 | 8,653 | ||||||
| Deere | 205 | 80,239 | ||||||
| Delta Air Lines | 546 | 27,338 | ||||||
| Dover | 115 | 20,620 | ||||||
| Eaton | 326 | 103,753 | ||||||
| Emerson Electric | 464 | 50,010 | ||||||
| Equifax | 104 | 22,900 | ||||||
| Expeditors International of Washington | 109 | 12,133 | ||||||
| Fastenal | 447 | 30,369 | ||||||
| FedEx | 185 | 48,429 | ||||||
| Fortive | 283 | 21,301 | ||||||
| GE Vernova * | 208 | 31,972 | ||||||
| Generac Holdings * | 43 | 5,846 | ||||||
| General Dynamics | 181 | 51,963 | ||||||
| General Electric | 883 | 142,887 | ||||||
| Honeywell International | 534 | 102,918 | ||||||
| Howmet Aerospace | 336 | 22,428 | ||||||
| Hubbell, Cl B | 40 | 14,821 | ||||||
| Huntington Ingalls Industries | 27 | 7,477 | ||||||
| IDEX | 59 | 13,007 | ||||||
| Illinois Tool Works | 217 | 52,972 | ||||||
| Ingersoll Rand | 324 | 30,236 | ||||||
The accompanying notes are an integral part of the financial statements.
116
![]()
| Schedule of Investments | April 30, 2024 (Unaudited) |
| Global X S&P 500® Risk Managed Income ETF | |
| Shares | Value | |||||||
| COMMON STOCK — continued | ||||||||
| Industrials — continued | ||||||||
| Jacobs Solutions | 116 | $ | 16,649 | |||||
| JB Hunt Transport Services | 60 | 9,754 | ||||||
| Johnson Controls International | 574 | 37,350 | ||||||
| L3Harris Technologies | 148 | 31,679 | ||||||
| Leidos Holdings | 111 | 15,564 | ||||||
| Lockheed Martin | 171 | 79,503 | ||||||
| Masco | 187 | 12,800 | ||||||
| Nordson | 36 | 9,295 | ||||||
| Norfolk Southern | 181 | 41,688 | ||||||
| Northrop Grumman | 119 | 57,719 | ||||||
| Old Dominion Freight Line | 144 | 26,166 | ||||||
| Otis Worldwide | 315 | 28,728 | ||||||
| PACCAR | 407 | 43,187 | ||||||
| Parker-Hannifin | 110 | 59,940 | ||||||
| Paychex | 249 | 29,584 | ||||||
| Paycom Software | 38 | 7,143 | ||||||
| Pentair | 143 | 11,310 | ||||||
| Quanta Services | 120 | 31,027 | ||||||
| Republic Services, Cl A | 158 | 30,289 | ||||||
| Robert Half | 88 | 6,084 | ||||||
| Rockwell Automation | 92 | 24,928 | ||||||
| Rollins | 210 | 9,358 | ||||||
| RTX | 1,055 | 107,104 | ||||||
| Snap-On | 36 | 9,647 | ||||||
| Southwest Airlines | 468 | 12,140 | ||||||
| Stanley Black & Decker | 139 | 12,705 | ||||||
| Textron | 167 | 14,127 | ||||||
| Trane Technologies | 185 | 58,708 | ||||||
| TransDigm Group | 45 | 56,161 | ||||||
| Uber Technologies * | 1,663 | 110,207 | ||||||
| Union Pacific | 497 | 117,869 | ||||||
| United Airlines Holdings * | 293 | 15,078 | ||||||
| United Parcel Service, Cl B | 580 | 85,538 | ||||||
| United Rentals | 51 | 34,068 | ||||||
| Veralto | 185 | 17,331 | ||||||
| Verisk Analytics, Cl A | 120 | 26,155 | ||||||
| Waste Management | 300 | 62,406 | ||||||
| Westinghouse Air Brake Technologies | 156 | 25,128 | ||||||
| WW Grainger | 33 | 30,405 | ||||||
The accompanying notes are an integral part of the financial statements.
117
![]()
| Schedule of Investments | April 30, 2024 (Unaudited) |
| Global X S&P 500® Risk Managed Income ETF | |
| Shares | Value | |||||||
| COMMON STOCK — continued | ||||||||
| Industrials — continued | ||||||||
| Xylem | 202 | $ | 26,401 | |||||
| 3,005,052 | ||||||||
| Information Technology — 29.4% | ||||||||
| Accenture, Cl A | 503 | 151,358 | ||||||
| Adobe * | 361 | 167,082 | ||||||
| Advanced Micro Devices * | 1,292 | 204,627 | ||||||
| Akamai Technologies * | 134 | 13,525 | ||||||
| Amphenol, Cl A | 485 | 58,573 | ||||||
| Analog Devices | 390 | 78,238 | ||||||
| ANSYS * | 64 | 20,792 | ||||||
| Apple | 11,726 | 1,997,290 | ||||||
| Applied Materials | 666 | 132,301 | ||||||
| Arista Networks * | 202 | 51,825 | ||||||
| Autodesk * | 172 | 36,610 | ||||||
| Broadcom | 354 | 460,296 | ||||||
| Cadence Design Systems * | 216 | 59,536 | ||||||
| CDW | 112 | 27,088 | ||||||
| Cisco Systems | 3,280 | 154,094 | ||||||
| Cognizant Technology Solutions, Cl A | 391 | 25,681 | ||||||
| Corning | 655 | 21,864 | ||||||
| Enphase Energy * | 109 | 11,855 | ||||||
| EPAM Systems * | 45 | 10,587 | ||||||
| F5 * | 41 | 6,778 | ||||||
| Fair Isaac * | 18 | 20,400 | ||||||
| First Solar * | 87 | 15,338 | ||||||
| Fortinet * | 495 | 31,274 | ||||||
| Gartner * | 56 | 23,105 | ||||||
| Gen Digital | 487 | 9,808 | ||||||
| Hewlett Packard Enterprise | 1,090 | 18,530 | ||||||
| HP | 737 | 20,702 | ||||||
| Intel | 3,417 | 104,116 | ||||||
| International Business Machines | 738 | 122,656 | ||||||
| Intuit | 223 | 139,513 | ||||||
| Jabil | 104 | 12,205 | ||||||
| Juniper Networks | 262 | 9,123 | ||||||
| Keysight Technologies * | 143 | 21,155 | ||||||
| KLA | 111 | 76,511 | ||||||
| Lam Research | 108 | 96,596 | ||||||
The accompanying notes are an integral part of the financial statements.
118
![]()
| Schedule of Investments | April 30, 2024 (Unaudited) |
| Global X S&P 500® Risk Managed Income ETF | |
| Shares | Value | |||||||
| COMMON STOCK — continued | ||||||||
| Information Technology — continued | ||||||||
| Microchip Technology | 425 | $ | 39,091 | |||||
| Micron Technology | 886 | 100,083 | ||||||
| Microsoft | 6,005 | 2,337,927 | ||||||
| Monolithic Power Systems | 34 | 22,757 | ||||||
| Motorola Solutions | 132 | 44,768 | ||||||
| NetApp | 154 | 15,740 | ||||||
| NVIDIA | 1,995 | 1,723,720 | ||||||
| ON Semiconductor * | 342 | 23,995 | ||||||
| Oracle | 1,285 | 146,169 | ||||||
| Palo Alto Networks * | 245 | 71,268 | ||||||
| PTC * | 93 | 16,502 | ||||||
| Qorvo * | 73 | 8,529 | ||||||
| QUALCOMM | 902 | 149,597 | ||||||
| Roper Technologies | 87 | 44,497 | ||||||
| Salesforce | 772 | 207,622 | ||||||
| Seagate Technology Holdings | 165 | 14,175 | ||||||
| ServiceNow * | 167 | 115,786 | ||||||
| Skyworks Solutions | 140 | 14,923 | ||||||
| Super Micro Computer * | 42 | 36,070 | ||||||
| Synopsys * | 127 | 67,385 | ||||||
| TE Connectivity | 242 | 34,238 | ||||||
| Teledyne Technologies * | 35 | 13,352 | ||||||
| Teradyne | 136 | 15,819 | ||||||
| Texas Instruments | 734 | 129,492 | ||||||
| Trimble * | 204 | 12,254 | ||||||
| Tyler Technologies * | 31 | 14,308 | ||||||
| VeriSign * | 69 | 11,694 | ||||||
| Western Digital * | 278 | 19,691 | ||||||
| Zebra Technologies, Cl A * | 36 | 11,324 | ||||||
| 9,873,808 | ||||||||
| Materials — 2.4% | ||||||||
| Air Products & Chemicals | 178 | 42,069 | ||||||
| Albemarle | 98 | 11,790 | ||||||
| Amcor | 1,282 | 11,461 | ||||||
| Avery Dennison | 64 | 13,906 | ||||||
| Ball | 255 | 17,740 | ||||||
| Celanese, Cl A | 81 | 12,442 | ||||||
| CF Industries Holdings | 163 | 12,872 | ||||||
The accompanying notes are an integral part of the financial statements.
119
![]()
| Schedule of Investments | April 30, 2024 (Unaudited) |
| Global X S&P 500® Risk Managed Income ETF | |
| Shares | Value | |||||||
| COMMON STOCK — continued | ||||||||
| Materials — continued | ||||||||
| Corteva | 557 | $ | 30,150 | |||||
| Dow | 589 | 33,514 | ||||||
| DuPont de Nemours | 338 | 24,505 | ||||||
| Eastman Chemical | 112 | 10,577 | ||||||
| Ecolab | 201 | 45,456 | ||||||
| FMC | 119 | 7,022 | ||||||
| Freeport-McMoRan | 1,147 | 57,281 | ||||||
| International Flavors & Fragrances | 220 | 18,623 | ||||||
| International Paper | 298 | 10,412 | ||||||
| Linde PLC | 391 | 172,415 | ||||||
| LyondellBasell Industries, Cl A | 213 | 21,294 | ||||||
| Martin Marietta Materials | 46 | 27,005 | ||||||
| Mosaic | 273 | 8,570 | ||||||
| Newmont | 970 | 39,421 | ||||||
| Nucor | 194 | 32,695 | ||||||
| Packaging Corp of America | 65 | 11,244 | ||||||
| PPG Industries | 200 | 25,800 | ||||||
| Sherwin-Williams | 188 | 56,327 | ||||||
| Steel Dynamics | 116 | 15,094 | ||||||
| Vulcan Materials | 111 | 28,597 | ||||||
| Westrock | 213 | 10,216 | ||||||
| 808,498 | ||||||||
| Real Estate — 2.2% | ||||||||
| Alexandria Real Estate Equities ‡ | 139 | 16,106 | ||||||
| American Tower ‡ | 374 | 64,163 | ||||||
| AvalonBay Communities ‡ | 110 | 20,853 | ||||||
| Boston Properties ‡ | 130 | 8,046 | ||||||
| Camden Property Trust ‡ | 87 | 8,672 | ||||||
| CBRE Group, Cl A * | 222 | 19,290 | ||||||
| CoStar Group * | 326 | 29,839 | ||||||
| Crown Castle ‡ | 337 | 31,604 | ||||||
| Digital Realty Trust ‡ | 247 | 34,279 | ||||||
| Equinix ‡ | 76 | 54,044 | ||||||
| Equity Residential ‡ | 301 | 19,384 | ||||||
| Essex Property Trust ‡ | 50 | 12,312 | ||||||
| Extra Space Storage ‡ | 180 | 24,170 | ||||||
| Federal Realty Investment Trust ‡ | 50 | 5,209 | ||||||
| Healthpeak Properties ‡ | 567 | 10,552 | ||||||
The accompanying notes are an integral part of the financial statements.
120
![]()
| Schedule of Investments | April 30, 2024 (Unaudited) |
| Global X S&P 500® Risk Managed Income ETF | |
| Shares | Value | |||||||
| COMMON STOCK — continued | ||||||||
| Real Estate — continued | ||||||||
| Host Hotels & Resorts ‡ | 583 | $ | 11,001 | |||||
| Invitation Homes ‡ | 496 | 16,963 | ||||||
| Iron Mountain ‡ | 250 | 19,380 | ||||||
| Kimco Realty ‡ | 578 | 10,768 | ||||||
| Mid-America Apartment Communities ‡ | 109 | 14,170 | ||||||
| ProLogis ‡ | 745 | 76,027 | ||||||
| Public Storage ‡ | 136 | 35,285 | ||||||
| Realty Income ‡ | 668 | 35,765 | ||||||
| Regency Centers ‡ | 140 | 8,291 | ||||||
| SBA Communications, Cl A ‡ | 88 | 16,379 | ||||||
| Simon Property Group ‡ | 254 | 35,695 | ||||||
| UDR ‡ | 248 | 9,444 | ||||||
| Ventas ‡ | 342 | 15,144 | ||||||
| VICI Properties, Cl A ‡ | 882 | 25,181 | ||||||
| Welltower ‡ | 441 | 42,018 | ||||||
| Weyerhaeuser ‡ | 622 | 18,766 | ||||||
| 748,800 | ||||||||
| Utilities — 2.4% | ||||||||
| AES | 551 | 9,863 | ||||||
| Alliant Energy | 208 | 10,358 | ||||||
| Ameren | 216 | 15,956 | ||||||
| American Electric Power | 413 | 35,530 | ||||||
| American Water Works | 167 | 20,427 | ||||||
| Atmos Energy | 136 | 16,034 | ||||||
| CenterPoint Energy | 537 | 15,648 | ||||||
| CMS Energy | 250 | 15,152 | ||||||
| Consolidated Edison | 279 | 26,338 | ||||||
| Constellation Energy | 248 | 46,113 | ||||||
| Dominion Energy | 668 | 34,055 | ||||||
| DTE Energy | 175 | 19,306 | ||||||
| Duke Energy | 618 | 60,725 | ||||||
| Edison International | 330 | 23,450 | ||||||
| Entergy | 179 | 19,094 | ||||||
| Evergy | 193 | 10,123 | ||||||
| Eversource Energy | 272 | 16,489 | ||||||
| Exelon | 787 | 29,575 | ||||||
| FirstEnergy | 424 | 16,256 | ||||||
| NextEra Energy | 1,654 | 110,768 | ||||||
The accompanying notes are an integral part of the financial statements.
121
![]()
| Schedule of Investments | April 30, 2024 (Unaudited) |
| Global X S&P 500® Risk Managed Income ETF | |
| Shares | Value | |||||||
| COMMON STOCK — continued | ||||||||
| Utilities — continued | ||||||||
| NiSource | 353 | $ | 9,835 | |||||
| NRG Energy | 190 | 13,807 | ||||||
| PG&E | 1,813 | 31,020 | ||||||
| Pinnacle West Capital | 107 | 7,881 | ||||||
| PPL | 624 | 17,135 | ||||||
| Public Service Enterprise Group | 420 | 29,014 | ||||||
| Sempra | 490 | 35,099 | ||||||
| Southern | 878 | 64,533 | ||||||
| WEC Energy Group | 241 | 19,916 | ||||||
| Xcel Energy | 435 | 23,373 | ||||||
| 802,873 | ||||||||
| TOTAL UNITED STATES | 34,004,402 | |||||||
| TOTAL COMMON STOCK (Cost $28,839,190) | 34,055,896 | |||||||
| PURCHASED OPTIONS — 0.1% (Cost $171,304) | 42,591 | |||||||
| TOTAL INVESTMENTS — 101.7% (Cost $29,010,494) | $ | 34,098,487 | ||||||
| WRITTEN OPTIONS— (1.8)% (Premiums Received $(578,927)) | $ | (611,338 | ) | |||||
| Percentages are based on Net Assets of $33,535,957. | ||||||||
The accompanying notes are an integral part of the financial statements.
122
![]()
| Schedule of Investments | April 30, 2024 (Unaudited) |
| Global X S&P 500® Risk Managed Income ETF | |
A list of the exchange traded option contracts held by the Fund at April 30, 2024, is as follows:
| Description | Number of Contracts | Notional Amount | Exercise Price | Expiration Date | Value | |||||||||||
| PURCHASED OPTIONS — 0.1% | ||||||||||||||||
| Put Options | ||||||||||||||||
| Mini-SPX Index | 6 | $ | 302,142 | $ | 475 | 05/17/24 | $ | 381 | ||||||||
| S&P 500 Index | 67 | 33,739,123 | 4,755 | 05/17/24 | 42,210 | |||||||||||
| Total Purchased Options | $ | 34,041,265 | $ | 42,591 | ||||||||||||
| WRITTEN OPTIONS — (1.8)% | ||||||||||||||||
| Call Options | ||||||||||||||||
| Mini-SPX Index | (6) | $ | (302,142 | ) | $ | 500 | 05/17/24 | $ | (5,658 | ) | ||||||
| S&P 500 Index | (67) | (33,739,123 | ) | 5,005 | 05/17/24 | (605,680 | ) | |||||||||
| Total Written Options | $ | (34,041,265 | ) | $ | (611,338 | ) | ||||||||||
| * | Non-income producing security. |
| ‡ | Real Estate Investment Trust |
| (A) | All or a portion of these securities has been segregated as collateral for options contracts. The Fair Value of the securities pledged as collateral is $34,048,819. |
The following is a summary of the level of inputs used as of April 30, 2024, in valuing the Fund’s investments and other financial instruments carried at value:
| Investments in Securities | Level 1 | Level 2 | Level 3 | Total | ||||||||||||
| Common Stock | $ | 34,055,896 | $ | — | $ | — | $ | 34,055,896 | ||||||||
| Purchased Options | 42,591 | — | — | 42,591 | ||||||||||||
| Total Investments in Securities | $ | 34,098,487 | $ | — | $ | — | $ | 34,098,487 | ||||||||
| Other Financial Instruments | Level 1 | Level 2 | Level 3 | Total | ||||||||||||
| Written Options | $ | (611,338 | ) | $ | — | $ | — | $ | (611,338 | ) | ||||||
| Total Other Financial Instruments | $ | (611,338 | ) | $ | — | $ | — | $ | (611,338 | ) | ||||||
Amounts designated as “—” are $0 or have been rounded to $0.
See “Glossary” for abbreviations.
The accompanying notes are an integral part of the financial statements.
123
![]()
| Schedule of Investments | April 30, 2024 (Unaudited) |
| Global X Dow 30® Covered Call ETF | |
Sector Weightings †:
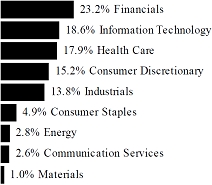
† Sector weightings percentages are based on the total market value of investments. Total investments do not include derivatives such as options, futures contracts, forward contracts, and swap contracts, if applicable.
| Shares | Value | |||||||
| COMMON STOCK — 100.9% | ||||||||
| UNITED STATES — 100.9% | ||||||||
| Communication Services — 2.6% | ||||||||
| Verizon Communications | 14,616 | $ | 577,186 | |||||
| Walt Disney | 14,616 | 1,623,838 | ||||||
| 2,201,024 | ||||||||
| Consumer Discretionary — 15.3% | ||||||||
| Amazon.com * | 14,616 | 2,557,800 | ||||||
| Home Depot | 14,616 | 4,884,959 | ||||||
| McDonald’s | 14,616 | 3,990,753 | ||||||
| NIKE, Cl B | 14,616 | 1,348,472 | ||||||
| 12,781,984 | ||||||||
| Consumer Staples — 5.0% | ||||||||
| Coca-Cola | 14,616 | 902,831 | ||||||
| Procter & Gamble | 14,616 | 2,385,331 | ||||||
| Walmart | 14,614 | 867,341 | ||||||
| 4,155,503 | ||||||||
| Energy — 2.8% | ||||||||
| Chevron | 14,616 | 2,357,122 | ||||||
The accompanying notes are an integral part of the financial statements.
124
![]()
| Schedule of Investments | April 30, 2024 (Unaudited) |
| Global X Dow 30® Covered Call ETF | |
| Shares | Value | |||||||
| COMMON STOCK — continued | ||||||||
| Financials — 23.4% | ||||||||
| American Express | 14,616 | $ | 3,420,582 | |||||
| Goldman Sachs Group | 14,616 | 6,236,793 | ||||||
| JPMorgan Chase | 14,616 | 2,802,472 | ||||||
| Travelers | 14,616 | 3,100,931 | ||||||
| Visa, Cl A | 14,616 | 3,926,004 | ||||||
| 19,486,782 | ||||||||
| Health Care — 18.1% | ||||||||
| Amgen | 14,616 | 4,003,907 | ||||||
| Johnson & Johnson | 14,616 | 2,113,327 | ||||||
| Merck | 14,616 | 1,888,680 | ||||||
| UnitedHealth Group | 14,616 | 7,069,759 | ||||||
| 15,075,673 | ||||||||
| Industrials — 13.9% | ||||||||
| 3M | 14,616 | 1,410,590 | ||||||
| Boeing * | 14,616 | 2,453,150 | ||||||
| Caterpillar | 14,616 | 4,890,075 | ||||||
| Honeywell International | 14,616 | 2,816,942 | ||||||
| 11,570,757 | ||||||||
| Information Technology — 18.8% | ||||||||
| Apple | 14,616 | 2,489,543 | ||||||
| Cisco Systems | 14,616 | 686,660 | ||||||
| Intel | 14,616 | 445,350 | ||||||
| International Business Machines | 14,616 | 2,429,179 | ||||||
| Microsoft | 14,616 | 5,690,447 | ||||||
| Salesforce | 14,616 | 3,930,827 | ||||||
| 15,672,006 | ||||||||
| Materials — 1.0% | ||||||||
| Dow | 14,616 | 831,650 | ||||||
| TOTAL UNITED STATES | 84,132,501 | |||||||
| TOTAL COMMON STOCK (Cost $72,759,116) | 84,132,501 | |||||||
| TOTAL INVESTMENTS — 100.9% (Cost $72,759,116) | $ | 84,132,501 | ||||||
The accompanying notes are an integral part of the financial statements.
125
![]()
| Schedule of Investments | April 30, 2024 (Unaudited) |
| Global X Dow 30® Covered Call ETF | |
| Value | ||||
| WRITTEN OPTIONS— (1.0)% | ||||
| (Premiums Received $(1,320,778)) | $ | (834,000 | ) | |
Percentages are based on Net Assets of $83,344,142.
A list of the exchange traded option contracts held by the Fund at April 30, 2024, is as follows:
| Description | Number of Contracts | Notional Amount | Exercise Price | Expiration Date | Value | |||||||||||
| WRITTEN OPTIONS — (1.0)% | ||||||||||||||||
| Call Options | ||||||||||||||||
| Dow Jones Industrial Average | (2,224) | $ | (84,102,784 | ) | $ | 380 | 05/17/24 | $ | (834,000 | ) | ||||||
| * | Non-income producing security. |
The following is a summary of the level of inputs used as of April 30, 2024, in valuing the Fund’s investments and other financial instruments carried at value:
| Investments in Securities | Level 1 | Level 2 | Level 3 | Total | ||||||||||||
| Common Stock | $ | 84,132,501 | $ | — | $ | — | $ | 84,132,501 | ||||||||
| Total Investments in Securities | $ | 84,132,501 | $ | — | $ | — | $ | 84,132,501 | ||||||||
| Other Financial Instruments | Level 1 | Level 2 | Level 3 | Total | ||||||||||||
| Written Options | $ | (834,000 | ) | $ | — | $ | — | $ | (834,000 | ) | ||||||
| Total Other Financial Instruments | $ | (834,000 | ) | $ | — | $ | — | $ | (834,000 | ) | ||||||
Amounts designated as “—” are $0 or have been rounded to $0.
See “Glossary” for abbreviations.
The accompanying notes are an integral part of the financial statements.
126
![]()
| Schedule of Investments | April 30, 2024 (Unaudited) |
| Global X Russell 2000 Covered Call & Growth ETF | |
Sector Weightings †:

† Sector weightings percentages are based on the total market value of investments. Total investments do not include derivatives such as options, futures contracts, forward contracts, and swap contracts, if applicable.
| Shares | Value | |||||||
| EXCHANGE TRADED FUND — 101.2% (A) | ||||||||
| Vanguard Russell 2000 ETF (B) | 97,296 | $ | 7,701,951 | |||||
| TOTAL EXCHANGE TRADED FUND (Cost $7,004,621) | 7,701,951 | |||||||
| TOTAL INVESTMENTS — 101.2% (Cost $7,004,621) | $ | 7,701,951 | ||||||
| WRITTEN OPTIONS— (1.4)% (Premiums Received $(96,478)) | $ | (104,068 | ) | |||||
Percentages are based on Net Assets of $7,608,084.
A list of the exchange traded option contracts held by the Fund at April 30, 2024, is as follows:
| Description | Number of Contracts | Notional Amount | Exercise Price | Expiration Date | Value | |||||||||||
| WRITTEN OPTIONS — (1.4)% | ||||||||||||||||
| Call Options | ||||||||||||||||
| Cboe Mini-Russell 2000 Index | (5) | $ | (98,695 | ) | $ | 195 | 05/17/24 | $ | (2,703 | ) | ||||||
| Russell 2000 Index | (19) | (3,750,422 | ) | 1,950 | 05/17/24 | (101,365 | ) | |||||||||
| Total Written Options | $ | (3,849,117 | ) | $ | (104,068 | ) | ||||||||||
| (A) | For financial information on the Vanguard Russell 2000 ETF, please go to the Securities Exchange Commission’s website at http://www.sec.gov. |
| (B) | All or a portion of these securities has been segregated as collateral for options contracts. The Fair Value of the securities pledged as collateral is $6,912,884. |
The accompanying notes are an integral part of the financial statements.
127
![]()
| Schedule of Investments | April 30, 2024 (Unaudited) |
| Global X Russell 2000 Covered Call & Growth ETF | |
The following is a summary of the level of inputs used as of April 30, 2024, in valuing the Fund’s investments and other financial instruments carried at value:
| Investments in Securities | Level 1 | Level 2 | Level 3 | Total | ||||||||||||
| Exchange Traded Fund | $ | 7,701,951 | $ | — | $ | — | $ | 7,701,951 | ||||||||
| Total Investments in Securities | $ | 7,701,951 | $ | — | $ | — | $ | 7,701,951 | ||||||||
| Other Financial Instruments | Level 1 | Level 2 | Level 3 | Total | ||||||||||||
| Written Options | $ | (104,068 | ) | $ | — | $ | — | $ | (104,068 | ) | ||||||
| Total Other Financial Instruments | $ | (104,068 | ) | $ | — | $ | — | $ | (104,068 | ) | ||||||
Amounts designated as “—” are $0 or have been rounded to $0.
See “Glossary” for abbreviations.
The accompanying notes are an integral part of the financial statements.
128
![]()
| Schedule of Investments | April 30, 2024 (Unaudited) |
| Global X Financials Covered Call & Growth ETF | |
Sector Weightings †:

† Sector weightings percentages are based on the total market value of investments. Total investments do not include derivatives such as options, futures contracts, forward contracts, and swap contracts, if applicable.
| Shares | Value | |||||||
| EXCHANGE TRADED FUND — 54.2% | ||||||||
| Financial Select Sector SPDR Fund (A) | 34,375 | $ | 1,387,375 | |||||
| TOTAL EXCHANGE TRADED FUND (Cost $1,234,805) | 1,387,375 | |||||||
| COMMON STOCK — 46.8% | ||||||||
| UNITED STATES — 46.8% | ||||||||
| Financials — 46.8% | ||||||||
| Aflac | 115 | 9,620 | ||||||
| Allstate | 56 | 9,523 | ||||||
| American Express | 123 | 28,786 | ||||||
| American International Group | 152 | 11,447 | ||||||
| Ameriprise Financial | 22 | 9,059 | ||||||
| Aon PLC, Cl A | 43 | 12,126 | ||||||
| Arch Capital Group * | 80 | 7,483 | ||||||
| Arthur J Gallagher | 46 | 10,796 | ||||||
| Assurant | 12 | 2,093 | ||||||
| Bank of America | 1,488 | 55,071 | ||||||
| Bank of New York Mellon | 167 | 9,434 | ||||||
| Berkshire Hathaway, Cl B * | 393 | 155,915 | ||||||
| BlackRock, Cl A | 30 | 22,639 | ||||||
| Blackstone | 153 | 17,841 | ||||||
| Brown & Brown | 53 | 4,322 | ||||||
| Capital One Financial | 81 | 11,618 | ||||||
| Cboe Global Markets | 24 | 4,348 | ||||||
| Charles Schwab | 321 | 23,738 | ||||||
| Chubb | 88 | 21,880 | ||||||
| Cincinnati Financial | 36 | 4,165 | ||||||
| Citigroup | 412 | 25,268 | ||||||
| Citizens Financial Group | 103 | 3,513 | ||||||
| CME Group, Cl A | 77 | 16,142 | ||||||
The accompanying notes are an integral part of the financial statements.
129
![]()
| Schedule of Investments | April 30, 2024 (Unaudited) |
| Global X Financials Covered Call & Growth ETF | |
| Shares | Value | |||||||
| COMMON STOCK — continued | ||||||||
| Financials — continued | ||||||||
| Comerica | 29 | $ | 1,455 | |||||
| Corpay * | 16 | 4,834 | ||||||
| Discover Financial Services | 53 | 6,717 | ||||||
| Everest Group | 9 | 3,298 | ||||||
| FactSet Research Systems | 8 | 3,335 | ||||||
| Fidelity National Information Services | 129 | 8,762 | ||||||
| Fifth Third Bancorp | 155 | 5,651 | ||||||
| Fiserv * | 129 | 19,694 | ||||||
| Franklin Resources | 64 | 1,462 | ||||||
| Global Payments | 56 | 6,875 | ||||||
| Globe Life | 18 | 1,371 | ||||||
| Goldman Sachs Group | 70 | 29,870 | ||||||
| Hartford Financial Services Group | 64 | 6,201 | ||||||
| Huntington Bancshares | 325 | 4,378 | ||||||
| Intercontinental Exchange | 123 | 15,838 | ||||||
| Invesco | 102 | 1,445 | ||||||
| Jack Henry & Associates | 16 | 2,603 | ||||||
| JPMorgan Chase | 624 | 119,646 | ||||||
| KeyCorp | 207 | 2,999 | ||||||
| Loews | 38 | 2,856 | ||||||
| M&T Bank | 37 | 5,342 | ||||||
| MarketAxess Holdings | 9 | 1,801 | ||||||
| Marsh & McLennan | 106 | 21,140 | ||||||
| Mastercard, Cl A | 177 | 79,862 | ||||||
| MetLife | 135 | 9,596 | ||||||
| Moody’s | 34 | 12,591 | ||||||
| Morgan Stanley | 269 | 24,436 | ||||||
| MSCI, Cl A | 17 | 7,918 | ||||||
| Nasdaq | 72 | 4,309 | ||||||
| Northern Trust | 43 | 3,543 | ||||||
| PayPal Holdings * | 233 | 15,825 | ||||||
| PNC Financial Services Group | 86 | 13,180 | ||||||
| Principal Financial Group | 46 | 3,641 | ||||||
| Progressive | 126 | 26,240 | ||||||
| Prudential Financial | 77 | 8,507 | ||||||
| Raymond James Financial | 42 | 5,124 | ||||||
| Regions Financial | 211 | 4,066 | ||||||
| S&P Global | 70 | 29,108 | ||||||
| State Street | 65 | 4,712 | ||||||
The accompanying notes are an integral part of the financial statements.
130
![]()
| Schedule of Investments | April 30, 2024 (Unaudited) |
| Global X Financials Covered Call & Growth ETF | |
| Shares | Value | |||||||
| COMMON STOCK — continued | ||||||||
| Financials — continued | ||||||||
| Synchrony Financial | 86 | $ | 3,782 | |||||
| T Rowe Price Group | 47 | 5,150 | ||||||
| Travelers | 49 | 10,396 | ||||||
| Truist Financial | 288 | 10,814 | ||||||
| US Bancorp | 334 | 13,570 | ||||||
| Visa, Cl A | 341 | 91,596 | ||||||
| W R Berkley | 46 | 3,541 | ||||||
| Wells Fargo | 772 | 45,795 | ||||||
| Willis Towers Watson PLC | 22 | 5,525 | ||||||
| TOTAL UNITED STATES | 1,197,227 | |||||||
| TOTAL COMMON STOCK (Cost $1,030,872) | 1,197,227 | |||||||
| TOTAL INVESTMENTS — 101.0% (Cost $2,265,677) | $ | 2,584,602 | ||||||
| WRITTEN OPTIONS— (1.0)% (Premiums Received $(23,543)) | $ | (26,881 | ) | |||||
Percentages are based on Net Assets of $2,560,257.
A list of the exchange traded option contracts held by the Fund at April 30, 2024, is as follows:
| Description | Number of Contracts | Notional Amount | Exercise Price | Expiration Date | Value | |||||||||||
| WRITTEN OPTIONS — (1.0)% | ||||||||||||||||
| Call Options | ||||||||||||||||
| The Financial Select Sector SPDR® Fund | (320) | $ | (1,291,520 | ) | $ | 40 | 05/17/24 | $ | (26,881 | ) | ||||||
| * | Non-income producing security. |
| (A) | All or a portion of these securities has been segregated as collateral for options contracts. The Fair Value of the securities pledged as collateral is $1,291,520. |
The accompanying notes are an integral part of the financial statements.
131
![]()
| Schedule of Investments | April 30, 2024 (Unaudited) |
| Global X Financials Covered Call & Growth ETF | |
The following is a summary of the level of inputs used as of April 30, 2024, in valuing the Fund’s investments and other financial instruments carried at value:
| Investments in Securities | Level 1 | Level 2 | Level 3 | Total | ||||||||||||
| Exchange Traded Fund | $ | 1,387,375 | $ | — | $ | — | $ | 1,387,375 | ||||||||
| Common Stock | 1,197,227 | — | — | 1,197,227 | ||||||||||||
| Total Investments in Securities | $ | 2,584,602 | $ | — | $ | — | $ | 2,584,602 | ||||||||
| Other Financial Instruments | Level 1 | Level 2 | Level 3 | Total | ||||||||||||
| Written Options | $ | (26,881 | ) | $ | — | $ | — | $ | (26,881 | ) | ||||||
| Total Other Financial Instruments | $ | (26,881 | ) | $ | — | $ | — | $ | (26,881 | ) | ||||||
Amounts designated as “—” are $0 or have been rounded to $0.
See “Glossary” for abbreviations.
The accompanying notes are an integral part of the financial statements.
132
![]()
| Schedule of Investments | April 30, 2024 (Unaudited) |
Global X Health Care Covered Call & Growth ETF
Sector Weightings †:

† Sector weightings percentages are based on the total market value of investments. Total investments do not include derivatives such as options, futures contracts, forward contracts, and swap contracts, if applicable.
| Shares | Value | |||||||
| EXCHANGE TRADED FUND — 54.6% | ||||||||
| Health Care Select Sector SPDR Fund (A) | 10,598 | $ | 1,487,218 | |||||
| TOTAL EXCHANGE TRADED FUND (Cost $1,424,941) | 1,487,218 | |||||||
| COMMON STOCK — 46.2% | ||||||||
| UNITED STATES — 46.2% | ||||||||
| Health Care — 46.2% | ||||||||
| Abbott Laboratories | 420 | 44,507 | ||||||
| AbbVie | 428 | 69,610 | ||||||
| Agilent Technologies | 71 | 9,730 | ||||||
| Align Technology * | 17 | 4,800 | ||||||
| Amgen | 130 | 35,612 | ||||||
| Baxter International | 122 | 4,925 | ||||||
| Becton Dickinson | 70 | 16,422 | ||||||
| Biogen * | 35 | 7,519 | ||||||
| Bio-Rad Laboratories, Cl A * | 5 | 1,349 | ||||||
| Bio-Techne | 38 | 2,402 | ||||||
| Boston Scientific * | 355 | 25,514 | ||||||
| Bristol-Myers Squibb | 491 | 21,575 | ||||||
| Cardinal Health | 60 | 6,182 | ||||||
| Catalent * | 44 | 2,457 | ||||||
| Cencora | 40 | 9,562 | ||||||
| Centene * | 129 | 9,425 | ||||||
| Charles River Laboratories International * | 12 | 2,748 | ||||||
| Cigna Group | 71 | 25,350 | ||||||
| Cooper | 48 | 4,275 | ||||||
| CVS Health | 311 | 21,058 | ||||||
| Danaher | 159 | 39,213 | ||||||
| DaVita * | 11 | 1,529 | ||||||
| Dexcom * | 94 | 11,975 | ||||||
The accompanying notes are an integral part of the financial statements.
133
![]()
| Schedule of Investments | April 30, 2024 (Unaudited) |
Global X Health Care Covered Call & Growth ETF
| Shares | Value | |||||||
| COMMON STOCK — continued | ||||||||
| Health Care — continued | ||||||||
| Edwards Lifesciences * | 147 | $ | 12,446 | |||||
| Elevance Health | 57 | 30,129 | ||||||
| Eli Lilly | 193 | 150,752 | ||||||
| GE HealthCare Technologies | 95 | 7,243 | ||||||
| Gilead Sciences | 302 | 19,690 | ||||||
| HCA Healthcare | 48 | 14,871 | ||||||
| Henry Schein * | 32 | 2,217 | ||||||
| Hologic * | 59 | 4,470 | ||||||
| Humana | 30 | 9,063 | ||||||
| IDEXX Laboratories * | 20 | 9,855 | ||||||
| Illumina * | 38 | 4,676 | ||||||
| Incyte * | 44 | 2,290 | ||||||
| Insulet * | 17 | 2,923 | ||||||
| Intuitive Surgical * | 85 | 31,503 | ||||||
| IQVIA Holdings * | 44 | 10,198 | ||||||
| Johnson & Johnson | 583 | 84,296 | ||||||
| Laboratory Corp of America Holdings | 21 | 4,229 | ||||||
| McKesson | 32 | 17,191 | ||||||
| Medtronic PLC | 322 | 25,837 | ||||||
| Merck | 614 | 79,341 | ||||||
| Mettler-Toledo International * | 5 | 6,149 | ||||||
| Moderna * | 80 | 8,825 | ||||||
| Molina Healthcare * | 14 | 4,789 | ||||||
| Pfizer | 1,368 | 35,048 | ||||||
| Quest Diagnostics | 27 | 3,731 | ||||||
| Regeneron Pharmaceuticals * | 26 | 23,157 | ||||||
| ResMed | 36 | 7,704 | ||||||
| Revvity | 30 | 3,074 | ||||||
| Solventum * | 33 | 2,145 | ||||||
| STERIS PLC | 24 | 4,909 | ||||||
| Stryker | 82 | 27,593 | ||||||
| Teleflex | 11 | 2,296 | ||||||
| Thermo Fisher Scientific | 94 | 53,460 | ||||||
| UnitedHealth Group | 224 | 108,349 | ||||||
| Universal Health Services, Cl B | 15 | 2,556 | ||||||
| Vertex Pharmaceuticals * | 62 | 24,354 | ||||||
| Viatris | 291 | 3,367 | ||||||
| Waters * | 14 | 4,327 | ||||||
| West Pharmaceutical Services | 18 | 6,435 | ||||||
The accompanying notes are an integral part of the financial statements.
134
![]()
| Schedule of Investments | April 30, 2024 (Unaudited) |
Global X Health Care Covered Call & Growth ETF
| Shares | Value | |||||||
| COMMON STOCK — continued | ||||||||
| Health Care — continued | ||||||||
| Zimmer Biomet Holdings | 51 | $ | 6,134 | |||||
| Zoetis, Cl A | 111 | 17,676 | ||||||
| TOTAL UNITED STATES | 1,257,037 | |||||||
| TOTAL COMMON STOCK (Cost $1,211,337) | 1,257,037 | |||||||
| TOTAL INVESTMENTS — 100.8% (Cost $2,636,278) | $ | 2,744,255 | ||||||
| WRITTEN OPTIONS— (0.9)% (Premiums Received $(21,851)) | $ | (25,530 | ) | |||||
Percentages are based on Net Assets of $2,721,214.
A list of the exchange traded option contracts held by the Fund at April 30, 2024, is as follows:
| Description | Number of Contracts | Notional Amount | Exercise Price | Expiration Date | Value | |||||||||||
| WRITTEN OPTIONS — (0.9)% | ||||||||||||||||
| Call Options | ||||||||||||||||
| The Health Care Select Sector SPDR® Fund | (98) | $ | (1,375,234 | ) | $ | 139 | 05/17/24 | $ | (25,530 | ) | ||||||
| * | Non-income producing security. |
| (A) | All or a portion of these securities has been segregated as collateral for options contracts. The Fair Value of the securities pledged as collateral is $1,375,234. |
The accompanying notes are an integral part of the financial statements.
135
![]()
| Schedule of Investments | April 30, 2024 (Unaudited) |
Global X Health Care Covered Call & Growth ETF
The following is a summary of the level of inputs used as of April 30, 2024, in valuing the Fund's investments and other financial instruments carried at value:
| Investments in Securities | Level 1 | Level 2 | Level 3 | Total | ||||||||||||
| Exchange Traded Fund | $ | 1,487,218 | $ | — | $ | — | $ | 1,487,218 | ||||||||
| Common Stock | 1,257,037 | — | — | 1,257,037 | ||||||||||||
| Total Investments in Securities | $ | 2,744,255 | $ | — | $ | — | $ | 2,744,255 | ||||||||
| Other Financial Instruments | Level 1 | Level 2 | Level 3 | Total | ||||||||||||
| Written Options | $ | (25,530 | ) | $ | — | $ | — | $ | (25,530 | ) | ||||||
| Total Other Financial Instruments | $ | (25,530 | ) | $ | — | $ | — | $ | (25,530 | ) | ||||||
Amounts designated as “—” are $0 or have been rounded to $0.
See “Glossary” for abbreviations.
The accompanying notes are an integral part of the financial statements.
136
![]()
| Schedule of Investments | April 30, 2024 (Unaudited) |
Global X Information Technology Covered Call & Growth ETF
Sector Weightings †:

† Sector weightings percentages are based on the total market value of investments. Total investments do not include derivatives such as options, futures contracts, forward contracts, and swap contracts, if applicable.
| Shares | Value | |||||||
| EXCHANGE TRADED FUND — 55.5% | ||||||||
| Technology Select Sector SPDR Fund (A) | 18,779 | $ | 3,685,754 | |||||
| TOTAL EXCHANGE TRADED FUND (Cost $3,366,288) | 3,685,754 | |||||||
| COMMON STOCK — 45.3% | ||||||||
| CHINA — 0.3% | ||||||||
| Information Technology — 0.3% | ||||||||
| NXP Semiconductors | 86 | 22,033 | ||||||
| UNITED STATES — 45.0% | ||||||||
| Information Technology — 45.0% | ||||||||
| Accenture PLC, Cl A | 211 | 63,492 | ||||||
| Adobe * | 153 | 70,813 | ||||||
| Advanced Micro Devices * | 546 | 86,476 | ||||||
| Akamai Technologies * | 47 | 4,744 | ||||||
| Amphenol, Cl A | 203 | 24,516 | ||||||
| Analog Devices | 166 | 33,301 | ||||||
| ANSYS * | 31 | 10,071 | ||||||
| Apple | 3,616 | 615,913 | ||||||
| Applied Materials | 281 | 55,821 | ||||||
| Arista Networks * | 85 | 21,808 | ||||||
| Autodesk * | 73 | 15,538 | ||||||
| Broadcom | 110 | 143,030 | ||||||
| Cadence Design Systems * | 93 | 25,634 | ||||||
| CDW | 44 | 10,642 | ||||||
| Cisco Systems | 1,373 | 64,504 | ||||||
| Cognizant Technology Solutions, Cl A | 157 | 10,312 | ||||||
| Corning | 253 | 8,445 | ||||||
| Enphase Energy * | 44 | 4,785 | ||||||
| EPAM Systems * | 20 | 4,705 | ||||||
The accompanying notes are an integral part of the financial statements.
137
![]()
| Schedule of Investments | April 30, 2024 (Unaudited) |
Global X Information Technology Covered Call & Growth ETF
| Shares | Value | |||||||
| COMMON STOCK — continued | ||||||||
| Information Technology — continued | ||||||||
| F5 * | 20 | $ | 3,306 | |||||
| Fair Isaac * | 10 | 11,333 | ||||||
| First Solar * | 38 | 6,699 | ||||||
| Fortinet * | 211 | 13,331 | ||||||
| Gartner * | 27 | 11,140 | ||||||
| Gen Digital | 175 | 3,525 | ||||||
| Hewlett Packard Enterprise | 423 | 7,191 | ||||||
| HP | 284 | 7,978 | ||||||
| Intel | 1,430 | 43,572 | ||||||
| International Business Machines | 310 | 51,522 | ||||||
| Intuit | 96 | 60,060 | ||||||
| Jabil | 42 | 4,929 | ||||||
| Juniper Networks | 105 | 3,656 | ||||||
| Keysight Technologies * | 61 | 9,024 | ||||||
| KLA | 46 | 31,707 | ||||||
| Lam Research | 44 | 39,354 | ||||||
| Microchip Technology | 177 | 16,281 | ||||||
| Micron Technology | 370 | 41,795 | ||||||
| Microsoft | 1,748 | 680,549 | ||||||
| Monolithic Power Systems | 15 | 10,040 | ||||||
| Motorola Solutions | 54 | 18,314 | ||||||
| NetApp | 67 | 6,848 | ||||||
| NVIDIA | 161 | 139,107 | ||||||
| ON Semiconductor * | 133 | 9,331 | ||||||
| Oracle | 537 | 61,084 | ||||||
| Palo Alto Networks * | 105 | 30,543 | ||||||
| PTC * | 41 | 7,275 | ||||||
| Qorvo * | 34 | 3,973 | ||||||
| QUALCOMM | 378 | 62,691 | ||||||
| Roper Technologies | 35 | 17,901 | ||||||
| Salesforce | 327 | 87,943 | ||||||
| Seagate Technology Holdings | 64 | 5,498 | ||||||
| ServiceNow * | 70 | 48,533 | ||||||
| Skyworks Solutions | 49 | 5,223 | ||||||
| Super Micro Computer * | 16 | 13,741 | ||||||
| Synopsys * | 53 | 28,121 | ||||||
| TE Connectivity | 105 | 14,855 | ||||||
| Teledyne Technologies * | 15 | 5,722 | ||||||
| Teradyne | 47 | 5,467 | ||||||
The accompanying notes are an integral part of the financial statements.
138
![]()
| Schedule of Investments | April 30, 2024 (Unaudited) |
Global X Information Technology Covered Call & Growth ETF
| Shares | Value | |||||||
| COMMON STOCK — continued | ||||||||
| Information Technology — continued | ||||||||
| Texas Instruments | 307 | $ | 54,161 | |||||
| Trimble * | 83 | 4,986 | ||||||
| Tyler Technologies * | 13 | 6,000 | ||||||
| VeriSign * | 31 | 5,254 | ||||||
| Western Digital * | 107 | 7,579 | ||||||
| Zebra Technologies, Cl A * | 19 | 5,977 | ||||||
| TOTAL UNITED STATES | 2,987,669 | |||||||
| TOTAL COMMON STOCK (Cost $2,762,516) | 3,009,702 | |||||||
| TOTAL INVESTMENTS — 100.8% (Cost $6,128,804) | $ | 6,695,456 | ||||||
| WRITTEN OPTIONS— (0.9)% (Premiums Received $(89,599)) | $ | (60,708 | ) | |||||
Percentages are based on Net Assets of $6,640,748.
A list of the exchange traded option contracts held by the Fund at April 30, 2024, is as follows:
| Description | Number of Contracts | Notional Amount | Exercise Price | Expiration Date | Value | |||||||||||
| WRITTEN OPTIONS — (0.9)% | ||||||||||||||||
| Call Options | ||||||||||||||||
| The Technology Select Sector SPDR® Fund | (171 | ) | $ | (3,356,217 | ) | $ | 197 | 05/17/24 | $ | (60,708 | ) | |||||
| * | Non-income producing security. |
| (A) | All or a portion of these securities has been segregated as collateral for options contracts. The Fair Value of the securities pledged as collateral is $3,964,654. |
The accompanying notes are an integral part of the financial statements.
139
![]()
| Schedule of Investments | April 30, 2024 (Unaudited) |
Global X Information Technology Covered Call & Growth ETF
The following is a summary of the level of inputs used as of April 30, 2024, in valuing the Fund's investments and other financial instruments carried at value:
| Investments in Securities | Level 1 | Level 2 | Level 3 | Total | ||||||||||||
| Exchange Traded Fund | $ | 3,685,754 | $ | — | $ | — | $ | 3,685,754 | ||||||||
| Common Stock | 3,009,702 | — | — | 3,009,702 | ||||||||||||
| Total Investments in Securities | $ | 6,695,456 | $ | — | $ | — | $ | 6,695,456 | ||||||||
| Other Financial Instruments | Level 1 | Level 2 | Level 3 | Total | ||||||||||||
| Written Options | $ | (60,708 | ) | $ | — | $ | — | $ | (60,708 | ) | ||||||
| Total Other Financial Instruments | $ | (60,708 | ) | $ | — | $ | — | $ | (60,708 | ) | ||||||
Amounts designated as “—” are $0 or have been rounded to $0.
See “Glossary” for abbreviations.
The accompanying notes are an integral part of the financial statements.
140
![]()
| Schedule of Investments | April 30, 2024 (Unaudited) |
Global X Nasdaq 100 ESG Covered Call ETF
Sector Weightings †:

† Sector weightings percentages are based on the total market value of investments. Total investments do not include derivatives such as options, futures contracts, forward contracts, and swap contracts, if applicable.
| Shares | Value | |||||||
| COMMON STOCK(A) — 102.3% | ||||||||
| BRAZIL — 0.5% | ||||||||
| Consumer Discretionary — 0.5% | ||||||||
| MercadoLibre * | 8 | $ | 11,670 | |||||
| CHINA — 0.9% | ||||||||
| Consumer Discretionary — 0.4% | ||||||||
| PDD Holdings ADR * | 66 | 8,262 | ||||||
| Information Technology — 0.5% | ||||||||
| NXP Semiconductors | 48 | 12,297 | ||||||
| TOTAL CHINA | 20,559 | |||||||
| NETHERLANDS — 0.9% | ||||||||
| Information Technology — 0.9% | ||||||||
| ASML Holding, Cl G | 24 | 20,939 | ||||||
| UNITED KINGDOM — 0.6% | ||||||||
| Consumer Staples — 0.3% | ||||||||
| Coca-Cola Europacific Partners | 101 | 7,274 | ||||||
The accompanying notes are an integral part of the financial statements.
141
![]()
| Schedule of Investments | April 30, 2024 (Unaudited) |
Global X Nasdaq 100 ESG Covered Call ETF
| Shares | Value | |||||||
| COMMON STOCK — continued | ||||||||
| Health Care — 0.3% | ||||||||
| AstraZeneca ADR | 93 | $ | 7,057 | |||||
| TOTAL UNITED KINGDOM | 14,331 | |||||||
| UNITED STATES — 99.4% | ||||||||
| Communication Services — 12.0% | ||||||||
| Alphabet, Cl A * | 341 | 55,508 | ||||||
| Alphabet, Cl C * | 328 | 54,002 | ||||||
| Charter Communications, Cl A * | 21 | 5,375 | ||||||
| Comcast, Cl A | 620 | 23,628 | ||||||
| Electronic Arts | 66 | 8,370 | ||||||
| Meta Platforms, Cl A | 81 | 34,844 | ||||||
| Netflix * | 96 | 52,861 | ||||||
| Sirius XM Holdings | 818 | 2,405 | ||||||
| Take-Two Interactive Software * | 37 | 5,284 | ||||||
| T-Mobile US | 169 | 27,745 | ||||||
| Trade Desk, Cl A * | 72 | 5,965 | ||||||
| Warner Bros Discovery * | 434 | 3,194 | ||||||
| 279,181 | ||||||||
| Consumer Discretionary — 9.1% | ||||||||
| Airbnb, Cl A * | 63 | 9,990 | ||||||
| Amazon.com * | 355 | 62,125 | ||||||
| Booking Holdings | 7 | 24,164 | ||||||
| DoorDash, Cl A * | 63 | 8,143 | ||||||
| Lululemon Athletica * | 26 | 9,376 | ||||||
| Marriott International, Cl A | 48 | 11,334 | ||||||
| O’Reilly Automotive * | 16 | 16,212 | ||||||
| Ross Stores | 68 | 8,809 | ||||||
| Starbucks | 171 | 15,132 | ||||||
| Tesla * | 259 | 47,470 | ||||||
| 212,755 | ||||||||
| Consumer Staples — 5.1% | ||||||||
| Costco Wholesale | 57 | 41,205 | ||||||
| Dollar Tree * | 39 | 4,612 | ||||||
| Keurig Dr Pepper | 207 | 6,976 | ||||||
| Kraft Heinz | 68 | 2,625 | ||||||
| Mondelez International, Cl A | 217 | 15,611 | ||||||
| Monster Beverage * | 71 | 3,795 | ||||||
The accompanying notes are an integral part of the financial statements.
142
![]()
| Schedule of Investments | April 30, 2024 (Unaudited) |
Global X Nasdaq 100 ESG Covered Call ETF
| Shares | Value | |||||||
| COMMON STOCK — continued | ||||||||
| Consumer Staples — continued | ||||||||
| PepsiCo | 232 | $ | 40,811 | |||||
| Walgreens Boots Alliance | 183 | 3,245 | ||||||
| 118,880 | ||||||||
| Financials — 0.6% | ||||||||
| PayPal Holdings * | 219 | 14,874 | ||||||
| Health Care — 5.6% | ||||||||
| Amgen | 82 | 22,463 | ||||||
| Biogen * | 23 | 4,941 | ||||||
| Dexcom * | 62 | 7,898 | ||||||
| GE HealthCare Technologies | 36 | 2,745 | ||||||
| Gilead Sciences | 198 | 12,910 | ||||||
| IDEXX Laboratories * | 17 | 8,377 | ||||||
| Illumina * | 30 | 3,692 | ||||||
| Intuitive Surgical * | 62 | 22,978 | ||||||
| Moderna * | 65 | 7,170 | ||||||
| Regeneron Pharmaceuticals * | 23 | 20,485 | ||||||
| Vertex Pharmaceuticals * | 41 | 16,105 | ||||||
| 129,764 | ||||||||
| Industrials — 4.2% | ||||||||
| Automatic Data Processing | 100 | 24,189 | ||||||
| Cintas | 22 | 14,484 | ||||||
| Copart * | 213 | 11,568 | ||||||
| CSX | 326 | 10,830 | ||||||
| Fastenal | 79 | 5,367 | ||||||
| Old Dominion Freight Line | 48 | 8,722 | ||||||
| PACCAR | 75 | 7,958 | ||||||
| Paychex | 78 | 9,267 | ||||||
| Verisk Analytics, Cl A | 29 | 6,321 | ||||||
| 98,706 | ||||||||
| Information Technology — 59.8% | ||||||||
| Adobe * | 108 | 49,986 | ||||||
| Advanced Micro Devices * | 380 | 60,184 | ||||||
| ANSYS * | 19 | 6,173 | ||||||
| Apple | 1,277 | 217,511 | ||||||
| Applied Materials | 212 | 42,114 | ||||||
The accompanying notes are an integral part of the financial statements.
143
![]()
| Schedule of Investments | April 30, 2024 (Unaudited) |
Global X Nasdaq 100 ESG Covered Call ETF
| Shares | Value | |||||||
| COMMON STOCK — continued | ||||||||
| Information Technology — continued | ||||||||
| Atlassian, Cl A * | 30 | $ | 5,169 | |||||
| Autodesk * | 46 | 9,791 | ||||||
| Broadcom | 87 | 113,124 | ||||||
| Cadence Design Systems * | 72 | 19,845 | ||||||
| CDW | 38 | 9,191 | ||||||
| Cisco Systems | 995 | 46,745 | ||||||
| Cognizant Technology Solutions, Cl A | 112 | 7,356 | ||||||
| Crowdstrike Holdings, Cl A * | 46 | 13,457 | ||||||
| Datadog, Cl A * | 66 | 8,283 | ||||||
| Fortinet * | 149 | 9,414 | ||||||
| GLOBALFOUNDRIES * | 123 | 6,012 | ||||||
| Intel | 822 | 25,046 | ||||||
| Intuit | 58 | 36,286 | ||||||
| KLA | 29 | 19,989 | ||||||
| Lam Research | 33 | 29,516 | ||||||
| Marvell Technology | 185 | 12,193 | ||||||
| Microchip Technology | 50 | 4,599 | ||||||
| Micron Technology | 206 | 23,270 | ||||||
| Microsoft | 668 | 260,072 | ||||||
| MongoDB, Cl A * | 14 | 5,113 | ||||||
| NVIDIA | 241 | 208,229 | ||||||
| ON Semiconductor * | 68 | 4,771 | ||||||
| Palo Alto Networks * | 78 | 22,689 | ||||||
| QUALCOMM | 256 | 42,458 | ||||||
| Roper Technologies | 19 | 9,718 | ||||||
| Synopsys * | 36 | 19,101 | ||||||
| Texas Instruments | 163 | 28,756 | ||||||
| Workday, Cl A * | 44 | 10,768 | ||||||
| Zscaler * | 30 | 5,188 | ||||||
| 1,392,117 | ||||||||
| Materials — 2.5% | ||||||||
| Linde PLC | 130 | 57,325 | ||||||
| Real Estate — 0.3% | ||||||||
| CoStar Group * | 71 | 6,499 | ||||||
The accompanying notes are an integral part of the financial statements.
144
![]()
| Schedule of Investments | April 30, 2024 (Unaudited) |
Global X Nasdaq 100 ESG Covered Call ETF
| Shares | Value | |||||||
| COMMON STOCK — continued | ||||||||
| Utilities — 0.2% | ||||||||
| Exelon | 153 | $ | 5,750 | |||||
| TOTAL UNITED STATES | 2,315,851 | |||||||
| TOTAL COMMON STOCK (Cost $1,964,242) | 2,383,350 | |||||||
| TOTAL INVESTMENTS — 102.3% (Cost $1,964,242) | $ | 2,383,350 | ||||||
| WRITTEN OPTIONS— (2.5)% (Premiums Received $(48,404)) | $ | (57,295 | ) | |||||
| Percentages are based on Net Assets of $2,329,808. | ||||||||
A list of the exchange traded option contracts held by the Fund at April 30, 2024, is as follows:
| Description | Number of Contracts | Notional Amount | Exercise Price | Expiration Date | Value | |||||||||||
| WRITTEN OPTIONS — (2.5)% | ||||||||||||||||
| Call Options | ||||||||||||||||
| Nasdaq-100 | (1) | $ | (1,744,069 | ) | $ | 17,250 | 05/17/24 | $ | (44,720 | ) | ||||||
| Nasdaq-100® Reduced-Value Index | (1) | (348,814 | ) | 3,400 | 05/17/24 | (12,575 | ) | |||||||||
| Total Written Options | $ | (2,092,883 | ) | $ | (57,295 | ) | ||||||||||
| * | Non-income producing security. |
| (A) | All or a portion of these securities has been segregated as collateral for options contracts. The Fair Value of the securities pledged as collateral is $2,134,617. |
The accompanying notes are an integral part of the financial statements.
145
![]()
| Schedule of Investments | April 30, 2024 (Unaudited) |
Global X Nasdaq 100 ESG Covered Call ETF
The following is a summary of the level of inputs used as of April 30, 2024, in valuing the Fund’s investments and other financial instruments carried at value:
| Investments in Securities | Level 1 | Level 2 | Level 3 | Total | ||||||||||||
| Common Stock | $ | 2,383,350 | $ | — | $ | — | $ | 2,383,350 | ||||||||
| Total Investments in Securities | $ | 2,383,350 | $ | — | $ | — | $ | 2,383,350 | ||||||||
| Other Financial Instruments | Level 1 | Level 2 | Level 3 | Total | ||||||||||||
| Written Options | $ | (57,295 | ) | $ | — | $ | — | $ | (57,295 | ) | ||||||
| Total Other Financial Instruments | $ | (57,295 | ) | $ | — | $ | — | $ | (57,295 | ) | ||||||
Amounts designated as “—” are $0 or have been rounded to $0.
See “Glossary” for abbreviations.
The accompanying notes are an integral part of the financial statements.
146
![]()
| Schedule of Investments | April 30, 2024 (Unaudited) |
Global X S&P 500 ESG Covered Call ETF
Sector Weightings †:
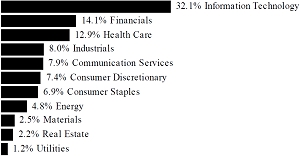
† Sector weightings percentages are based on the total market value of investments. Total investments do not include derivatives such as options, futures contracts, forward contracts, and swap contracts, if applicable.
| Shares | Value | |||||||
| COMMON STOCK(A) — 101.6% | ||||||||
| UNITED STATES — 101.6% | ||||||||
| Communication Services — 8.1% | ||||||||
| Alphabet, Cl A * | 250 | $ | 40,695 | |||||
| Alphabet, Cl C * | 209 | 34,410 | ||||||
| AT&T | 307 | 5,185 | ||||||
| Comcast, Cl A | 163 | 6,212 | ||||||
| Electronic Arts | 10 | 1,268 | ||||||
| Interpublic Group | 17 | 517 | ||||||
| News, Cl A | 17 | 404 | ||||||
| News, Cl B | 1 | 24 | ||||||
| Omnicom Group | 7 | 650 | ||||||
| Paramount Global, Cl B | 25 | 285 | ||||||
| Take-Two Interactive Software * | 7 | 1,000 | ||||||
| T-Mobile US | 23 | 3,776 | ||||||
| Walt Disney | 76 | 8,444 | ||||||
| 102,870 | ||||||||
| Consumer Discretionary — 7.5% | ||||||||
| Aptiv PLC * | 11 | 781 | ||||||
| Bath & Body Works | 11 | 500 | ||||||
| Best Buy | 6 | 442 | ||||||
| BorgWarner | 10 | 328 | ||||||
The accompanying notes are an integral part of the financial statements.
147
![]()
| Schedule of Investments | April 30, 2024 (Unaudited) |
Global X S&P 500 ESG Covered Call ETF
| Shares | Value | |||||||
| COMMON STOCK — continued | ||||||||
| Consumer Discretionary — continued | ||||||||
| Caesars Entertainment * | 10 | $ | 358 | |||||
| CarMax * | 8 | 544 | ||||||
| Carnival * | 47 | 697 | ||||||
| Chipotle Mexican Grill, Cl A * | 1 | 3,160 | ||||||
| Deckers Outdoor * | 1 | 819 | ||||||
| DR Horton | 13 | 1,852 | ||||||
| eBay | 23 | 1,185 | ||||||
| Etsy * | 5 | 343 | ||||||
| Expedia Group * | 6 | 808 | ||||||
| General Motors | 47 | 2,093 | ||||||
| Genuine Parts | 6 | 943 | ||||||
| Hasbro | 5 | 307 | ||||||
| Hilton Worldwide Holdings | 10 | 1,973 | ||||||
| Home Depot | 42 | 14,037 | ||||||
| Las Vegas Sands | 15 | 665 | ||||||
| LKQ | 13 | 561 | ||||||
| Lowe’s | 24 | 5,472 | ||||||
| Lululemon Athletica * | 5 | 1,803 | ||||||
| Marriott International, Cl A | 10 | 2,361 | ||||||
| McDonald’s | 30 | 8,191 | ||||||
| MGM Resorts International * | 12 | 473 | ||||||
| Mohawk Industries * | 2 | 231 | ||||||
| NIKE, Cl B | 50 | 4,613 | ||||||
| Norwegian Cruise Line Holdings * | 18 | 341 | ||||||
| Pool | 2 | 725 | ||||||
| PulteGroup | 8 | 891 | ||||||
| Ralph Lauren, Cl A | 2 | 327 | ||||||
| Ross Stores | 15 | 1,943 | ||||||
| Royal Caribbean Cruises * | 10 | 1,396 | ||||||
| Starbucks | 46 | 4,071 | ||||||
| Tapestry | 10 | 399 | ||||||
| Tesla * | 118 | 21,627 | ||||||
| TJX | 48 | 4,516 | ||||||
| Tractor Supply | 5 | 1,365 | ||||||
| Ulta Beauty * | 2 | 810 | ||||||
| Wynn Resorts | 5 | 458 | ||||||
| Yum! Brands | 11 | 1,554 | ||||||
| 95,963 | ||||||||
The accompanying notes are an integral part of the financial statements.
148
![]()
| Schedule of Investments | April 30, 2024 (Unaudited) |
Global X S&P 500 ESG Covered Call ETF
| Shares | Value | |||||||
| COMMON STOCK — continued | ||||||||
| Consumer Staples — 6.9% | ||||||||
| Archer-Daniels-Midland | 22 | $ | 1,290 | |||||
| Campbell Soup | 7 | 320 | ||||||
| Coca-Cola | 166 | 10,254 | ||||||
| Colgate-Palmolive | 33 | 3,033 | ||||||
| Conagra Brands | 20 | 616 | ||||||
| Costco Wholesale | 19 | 13,735 | ||||||
| Estee Lauder, Cl A | 9 | 1,320 | ||||||
| General Mills | 22 | 1,550 | ||||||
| Hershey | 6 | 1,164 | ||||||
| Hormel Foods | 14 | 498 | ||||||
| J M Smucker | 5 | 574 | ||||||
| Kellanova | 12 | 694 | ||||||
| Keurig Dr Pepper | 46 | 1,550 | ||||||
| Kraft Heinz | 34 | 1,313 | ||||||
| Kroger | 27 | 1,495 | ||||||
| Lamb Weston Holdings | 7 | 583 | ||||||
| McCormick | 11 | 837 | ||||||
| Molson Coors Beverage, Cl B | 6 | 344 | ||||||
| Mondelez International, Cl A | 55 | 3,957 | ||||||
| PepsiCo | 59 | 10,379 | ||||||
| Procter & Gamble | 100 | 16,320 | ||||||
| Sysco | 20 | 1,486 | ||||||
| Target | 20 | 3,220 | ||||||
| Tyson Foods, Cl A | 13 | 788 | ||||||
| Walgreens Boots Alliance | 31 | 550 | ||||||
| Walmart | 182 | 10,802 | ||||||
| 88,672 | ||||||||
| Energy — 4.8% | ||||||||
| Baker Hughes, Cl A | 41 | 1,337 | ||||||
| Chevron | 74 | 11,934 | ||||||
| Devon Energy | 28 | 1,433 | ||||||
| Diamondback Energy | 8 | 1,609 | ||||||
| EQT | 18 | 722 | ||||||
| Exxon Mobil | 169 | 19,988 | ||||||
| Halliburton | 36 | 1,349 | ||||||
| Hess | 11 | 1,732 | ||||||
| Kinder Morgan | 83 | 1,517 | ||||||
| Marathon Petroleum | 15 | 2,726 | ||||||
The accompanying notes are an integral part of the financial statements.
149
![]()
| Schedule of Investments | April 30, 2024 (Unaudited) |
Global X S&P 500 ESG Covered Call ETF
| Shares | Value | |||||||
| COMMON STOCK — continued | ||||||||
| Energy — continued | ||||||||
| Occidental Petroleum | 29 | $ | 1,918 | |||||
| ONEOK | 25 | 1,978 | ||||||
| Phillips 66 | 18 | 2,578 | ||||||
| Pioneer Natural Resources | 10 | 2,693 | ||||||
| Schlumberger | 62 | 2,944 | ||||||
| Targa Resources | 10 | 1,141 | ||||||
| Valero Energy | 15 | 2,398 | ||||||
| Williams | 48 | 1,841 | ||||||
| 61,838 | ||||||||
| Financials — 14.4% | ||||||||
| Aflac | 21 | 1,757 | ||||||
| Allstate | 11 | 1,871 | ||||||
| American Express | 24 | 5,617 | ||||||
| American International Group | 28 | 2,109 | ||||||
| Ameriprise Financial | 4 | 1,647 | ||||||
| Aon PLC, Cl A | 9 | 2,538 | ||||||
| Arch Capital Group * | 15 | 1,403 | ||||||
| Arthur J Gallagher | 9 | 2,112 | ||||||
| Assurant | 2 | 349 | ||||||
| Bank of America | 293 | 10,844 | ||||||
| Bank of New York Mellon | 31 | 1,751 | ||||||
| BlackRock, Cl A | 6 | 4,528 | ||||||
| Capital One Financial | 16 | 2,295 | ||||||
| Cboe Global Markets | 4 | 725 | ||||||
| Charles Schwab | 61 | 4,511 | ||||||
| Chubb | 17 | 4,227 | ||||||
| Citigroup | 82 | 5,029 | ||||||
| Citizens Financial Group | 22 | 750 | ||||||
| CME Group, Cl A | 15 | 3,145 | ||||||
| Comerica | 7 | 351 | ||||||
| Corpay * | 3 | 906 | ||||||
| Discover Financial Services | 11 | 1,394 | ||||||
| Everest Group | 2 | 733 | ||||||
| FactSet Research Systems | 2 | 834 | ||||||
| Fidelity National Information Services | 23 | 1,562 | ||||||
| Fifth Third Bancorp | 28 | 1,021 | ||||||
| Fiserv * | 26 | 3,969 | ||||||
| Franklin Resources | 14 | 320 | ||||||
The accompanying notes are an integral part of the financial statements.
150
![]()
| Schedule of Investments | April 30, 2024 (Unaudited) |
Global X S&P 500 ESG Covered Call ETF
| Shares | Value | |||||||
| COMMON STOCK — continued | ||||||||
| Financials — continued | ||||||||
| Global Payments | 12 | $ | 1,473 | |||||
| Globe Life | 3 | 228 | ||||||
| Goldman Sachs Group | 14 | 5,974 | ||||||
| Hartford Financial Services Group | 12 | 1,163 | ||||||
| Huntington Bancshares | 66 | 889 | ||||||
| Intercontinental Exchange | 24 | 3,090 | ||||||
| Invesco | 18 | 255 | ||||||
| Jack Henry & Associates | 3 | 488 | ||||||
| JPMorgan Chase | 123 | 23,584 | ||||||
| KeyCorp | 44 | 637 | ||||||
| M&T Bank | 7 | 1,011 | ||||||
| MarketAxess Holdings | 2 | 400 | ||||||
| Marsh & McLennan | 21 | 4,188 | ||||||
| Mastercard, Cl A | 35 | 15,792 | ||||||
| MetLife | 26 | 1,848 | ||||||
| Moody’s | 7 | 2,592 | ||||||
| Morgan Stanley | 52 | 4,724 | ||||||
| MSCI, Cl A | 3 | 1,397 | ||||||
| Nasdaq | 16 | 958 | ||||||
| Northern Trust | 8 | 659 | ||||||
| PayPal Holdings * | 44 | 2,988 | ||||||
| PNC Financial Services Group | 16 | 2,452 | ||||||
| Principal Financial Group | 9 | 712 | ||||||
| Prudential Financial | 14 | 1,547 | ||||||
| Raymond James Financial | 8 | 976 | ||||||
| Regions Financial | 36 | 694 | ||||||
| S&P Global | 14 | 5,822 | ||||||
| State Street | 12 | 870 | ||||||
| Synchrony Financial | 19 | 836 | ||||||
| T Rowe Price Group | 9 | 986 | ||||||
| Travelers | 9 | 1,909 | ||||||
| Truist Financial | 52 | 1,953 | ||||||
| US Bancorp | 67 | 2,722 | ||||||
| Visa, Cl A | 67 | 17,997 | ||||||
| Willis Towers Watson PLC | 4 | 1,005 | ||||||
| 183,117 | ||||||||
| Health Care — 13.1% | ||||||||
| Abbott Laboratories | 74 | 7,842 | ||||||
The accompanying notes are an integral part of the financial statements.
151
![]()
| Schedule of Investments | April 30, 2024 (Unaudited) |
Global X S&P 500 ESG Covered Call ETF
| Shares | Value | |||||||
| COMMON STOCK — continued | ||||||||
| Health Care — continued | ||||||||
| AbbVie | 75 | $ | 12,198 | |||||
| Agilent Technologies | 12 | 1,645 | ||||||
| Amgen | 22 | 6,027 | ||||||
| Baxter International | 23 | 929 | ||||||
| Becton Dickinson | 12 | 2,815 | ||||||
| Biogen * | 6 | 1,289 | ||||||
| Bio-Rad Laboratories, Cl A * | 1 | 270 | ||||||
| Boston Scientific * | 61 | 4,384 | ||||||
| Bristol-Myers Squibb | 84 | 3,691 | ||||||
| Cardinal Health | 10 | 1,030 | ||||||
| Cencora | 7 | 1,673 | ||||||
| Centene * | 23 | 1,680 | ||||||
| Charles River Laboratories International * | 2 | 458 | ||||||
| Cigna Group | 12 | 4,284 | ||||||
| CVS Health | 52 | 3,521 | ||||||
| Danaher | 28 | 6,905 | ||||||
| DaVita * | 2 | 278 | ||||||
| Edwards Lifesciences * | 24 | 2,032 | ||||||
| Elevance Health | 10 | 5,286 | ||||||
| Eli Lilly | 34 | 26,557 | ||||||
| Gilead Sciences | 51 | 3,325 | ||||||
| Hologic * | 11 | 833 | ||||||
| Humana | 5 | 1,510 | ||||||
| IDEXX Laboratories * | 4 | 1,971 | ||||||
| Illumina * | 6 | 738 | ||||||
| Incyte * | 9 | 468 | ||||||
| Medtronic PLC | 57 | 4,574 | ||||||
| Merck | 108 | 13,956 | ||||||
| Mettler-Toledo International * | 1 | 1,230 | ||||||
| Moderna * | 13 | 1,434 | ||||||
| Pfizer | 242 | 6,200 | ||||||
| Quest Diagnostics | 5 | 691 | ||||||
| Regeneron Pharmaceuticals * | 4 | 3,563 | ||||||
| ResMed | 7 | 1,498 | ||||||
| Revvity | 6 | 615 | ||||||
| Stryker | 15 | 5,048 | ||||||
| Teleflex | 2 | 418 | ||||||
| UnitedHealth Group | 39 | 18,864 | ||||||
| Waters * | 3 | 927 | ||||||
The accompanying notes are an integral part of the financial statements.
152
![]()
| Schedule of Investments | April 30, 2024 (Unaudited) |
Global X S&P 500 ESG Covered Call ETF
| Shares | Value | |||||||
| COMMON STOCK — continued | ||||||||
| Health Care — continued | ||||||||
| Zimmer Biomet Holdings | 8 | $ | 962 | |||||
| Zoetis, Cl A | 20 | 3,185 | ||||||
| 166,804 | ||||||||
| Industrials — 8.1% | ||||||||
| Allegion PLC | 4 | 486 | ||||||
| American Airlines Group * | 30 | 405 | ||||||
| AMETEK | 10 | 1,747 | ||||||
| Automatic Data Processing | 17 | 4,112 | ||||||
| Axon Enterprise * | 3 | 941 | ||||||
| Broadridge Financial Solutions | 5 | 967 | ||||||
| Carrier Global | 33 | 2,029 | ||||||
| Caterpillar | 21 | 7,026 | ||||||
| CH Robinson Worldwide | 6 | 426 | ||||||
| Cintas | 4 | 2,633 | ||||||
| CSX | 80 | 2,658 | ||||||
| Cummins | 6 | 1,695 | ||||||
| Dayforce * | 8 | 491 | ||||||
| Deere | 11 | 4,306 | ||||||
| Delta Air Lines | 28 | 1,402 | ||||||
| Dover | 6 | 1,076 | ||||||
| Eaton PLC | 17 | 5,410 | ||||||
| Emerson Electric | 23 | 2,479 | ||||||
| Fortive | 13 | 979 | ||||||
| General Electric | 46 | 7,444 | ||||||
| Hubbell, Cl B | 2 | 741 | ||||||
| IDEX | 3 | 661 | ||||||
| Illinois Tool Works | 11 | 2,685 | ||||||
| Ingersoll Rand | 16 | 1,493 | ||||||
| JB Hunt Transport Services | 3 | 488 | ||||||
| Johnson Controls International | 28 | 1,822 | ||||||
| Masco | 10 | 684 | ||||||
| Norfolk Southern | 9 | 2,073 | ||||||
| Otis Worldwide | 17 | 1,550 | ||||||
| PACCAR | 22 | 2,334 | ||||||
| Parker-Hannifin | 6 | 3,269 | ||||||
| Paychex | 13 | 1,545 | ||||||
| Pentair PLC | 7 | 554 | ||||||
| Quanta Services | 6 | 1,551 | ||||||
The accompanying notes are an integral part of the financial statements.
153
![]()
| Schedule of Investments | April 30, 2024 (Unaudited) |
Global X S&P 500 ESG Covered Call ETF
| Shares | Value | |||||||
| COMMON STOCK — continued | ||||||||
| Industrials — continued | ||||||||
| Republic Services, Cl A | 9 | $ | 1,725 | |||||
| Robert Half | 5 | 346 | ||||||
| Rockwell Automation | 5 | 1,355 | ||||||
| Stanley Black & Decker | 6 | 548 | ||||||
| Trane Technologies PLC | 9 | 2,856 | ||||||
| Uber Technologies * | 88 | 5,832 | ||||||
| Union Pacific | 25 | 5,929 | ||||||
| United Parcel Service, Cl B | 29 | 4,277 | ||||||
| United Rentals | 3 | 2,004 | ||||||
| Verisk Analytics, Cl A | 6 | 1,308 | ||||||
| Waste Management | 15 | 3,120 | ||||||
| Westinghouse Air Brake Technologies | 7 | 1,128 | ||||||
| WW Grainger | 2 | 1,843 | ||||||
| Xylem | 10 | 1,307 | ||||||
| 103,740 | ||||||||
| Information Technology — 32.6% | ||||||||
| Accenture PLC, Cl A | 27 | 8,125 | ||||||
| Adobe * | 19 | 8,794 | ||||||
| Advanced Micro Devices * | 69 | 10,928 | ||||||
| Akamai Technologies * | 7 | 706 | ||||||
| Apple | 615 | 104,753 | ||||||
| Applied Materials | 36 | 7,151 | ||||||
| Autodesk * | 9 | 1,916 | ||||||
| Cisco Systems | 173 | 8,128 | ||||||
| Hewlett Packard Enterprise | 55 | 935 | ||||||
| HP | 39 | 1,095 | ||||||
| Intel | 181 | 5,515 | ||||||
| International Business Machines | 39 | 6,482 | ||||||
| KLA | 6 | 4,136 | ||||||
| Lam Research | 6 | 5,366 | ||||||
| Micron Technology | 46 | 5,196 | ||||||
| Microsoft | 315 | 122,639 | ||||||
| NVIDIA | 105 | 90,722 | ||||||
| ON Semiconductor * | 17 | 1,193 | ||||||
| QUALCOMM | 48 | 7,961 | ||||||
| Salesforce | 41 | 11,027 | ||||||
| TE Connectivity | 13 | 1,839 | ||||||
The accompanying notes are an integral part of the financial statements.
154
![]()
| Schedule of Investments | April 30, 2024 (Unaudited) |
Global X S&P 500 ESG Covered Call ETF
| Shares | Value | |||||||
| COMMON STOCK — continued | ||||||||
| Information Technology — continued | ||||||||
| Western Digital * | 15 | $ | 1,062 | |||||
| 415,669 | ||||||||
| Materials — 2.6% | ||||||||
| Air Products & Chemicals | 9 | 2,127 | ||||||
| Albemarle | 5 | 602 | ||||||
| Amcor PLC | 65 | 581 | ||||||
| Avery Dennison | 4 | 869 | ||||||
| Ball | 12 | 835 | ||||||
| CF Industries Holdings | 6 | 474 | ||||||
| Corteva | 27 | 1,461 | ||||||
| Dow | 29 | 1,650 | ||||||
| Ecolab | 11 | 2,488 | ||||||
| FMC | 5 | 295 | ||||||
| Freeport-McMoRan | 62 | 3,096 | ||||||
| International Flavors & Fragrances | 10 | 846 | ||||||
| Linde PLC | 21 | 9,260 | ||||||
| LyondellBasell Industries, Cl A | 10 | 1,000 | ||||||
| Mosaic | 15 | 471 | ||||||
| Newmont | 48 | 1,951 | ||||||
| PPG Industries | 10 | 1,290 | ||||||
| Sherwin-Williams | 10 | 2,996 | ||||||
| Westrock | 11 | 528 | ||||||
| 32,820 | ||||||||
| Real Estate — 2.3% | ||||||||
| Alexandria Real Estate Equities ‡ | 6 | 695 | ||||||
| American Tower ‡ | 19 | 3,260 | ||||||
| AvalonBay Communities ‡ | 6 | 1,137 | ||||||
| Boston Properties ‡ | 5 | 310 | ||||||
| CBRE Group, Cl A * | 12 | 1,043 | ||||||
| CoStar Group * | 18 | 1,648 | ||||||
| Digital Realty Trust ‡ | 12 | 1,665 | ||||||
| Equinix ‡ | 4 | 2,845 | ||||||
| Equity Residential ‡ | 14 | 902 | ||||||
| Extra Space Storage ‡ | 8 | 1,074 | ||||||
| Federal Realty Investment Trust ‡ | 2 | 208 | ||||||
| Healthpeak Properties ‡ | 24 | 447 | ||||||
| Host Hotels & Resorts ‡ | 30 | 566 | ||||||
The accompanying notes are an integral part of the financial statements.
155
![]()
| Schedule of Investments | April 30, 2024 (Unaudited) |
Global X S&P 500 ESG Covered Call ETF
| Shares | Value | |||||||
| COMMON STOCK — continued | ||||||||
| Real Estate — continued | ||||||||
| Iron Mountain ‡ | 12 | $ | 930 | |||||
| Kimco Realty ‡ | 27 | 503 | ||||||
| ProLogis ‡ | 40 | 4,082 | ||||||
| Public Storage ‡ | 7 | 1,816 | ||||||
| Regency Centers ‡ | 7 | 415 | ||||||
| SBA Communications, Cl A ‡ | 5 | 931 | ||||||
| UDR ‡ | 15 | 571 | ||||||
| Ventas ‡ | 19 | 841 | ||||||
| Welltower ‡ | 23 | 2,191 | ||||||
| Weyerhaeuser ‡ | 32 | 965 | ||||||
| 29,045 | ||||||||
| Utilities — 1.2% | ||||||||
| American Water Works | 7 | 856 | ||||||
| Consolidated Edison | 15 | 1,416 | ||||||
| Edison International | 16 | 1,137 | ||||||
| Entergy | 8 | 853 | ||||||
| Eversource Energy | 15 | 909 | ||||||
| Exelon | 39 | 1,466 | ||||||
| NextEra Energy | 85 | 5,692 | ||||||
| Public Service Enterprise Group | 21 | 1,451 | ||||||
| Sempra | 25 | 1,791 | ||||||
| 15,571 | ||||||||
| TOTAL UNITED STATES | 1,296,109 | |||||||
| TOTAL COMMON STOCK (Cost $1,144,397) | 1,296,109 | |||||||
| TOTAL INVESTMENTS — 101.6% (Cost $1,144,397) | $ | 1,296,109 | ||||||
| WRITTEN OPTIONS— (1.6)% (Premiums Received $(15,675)) | $ | (20,160 | ) | |||||
| Percentages are based on Net Assets of $1,275,953. | ||||||||
The accompanying notes are an integral part of the financial statements.
156
![]()
| Schedule of Investments | April 30, 2024 (Unaudited) |
Global X S&P 500 ESG Covered Call ETF
A list of the exchange traded option contracts held by the Fund at April 30, 2024, is as follows:
| Description | Number of Contracts | Notional Amount | Exercise Price | Expiration Date | Value | |||||||||||
| WRITTEN OPTIONS — (1.6)% | ||||||||||||||||
| Call Options | ||||||||||||||||
| S&P 500 ESG Index | (28) | $ | (1,250,676 | ) | $ | 445 | 05/17/24 | $ | (20,160 | ) | ||||||
| * | Non-income producing security. |
| ‡ | Real Estate Investment Trust |
| (A) | All or a portion of these securities has been segregated as collateral for options contracts. The Fair Value of the securities pledged as collateral is $1,266,169. |
The following is a summary of the level of inputs used as of April 30, 2024, in valuing the Fund’s investments and other financial instruments carried at value:
| Investments in Securities | Level 1 | Level 2 | Level 3 | Total | ||||||||||||
| Common Stock | $ | 1,296,109 | $ | — | $ | — | $ | 1,296,109 | ||||||||
| Total Investments in Securities | $ | 1,296,109 | $ | — | $ | — | $ | 1,296,109 | ||||||||
| Other Financial Instruments | Level 1 | Level 2 | Level 3 | Total | ||||||||||||
| Written Options | $ | (20,160 | ) | $ | — | $ | — | $ | (20,160 | ) | ||||||
| Total Other Financial Instruments | $ | (20,160 | ) | $ | — | $ | — | $ | (20,160 | ) | ||||||
Amounts designated as “—” are $0 or have been rounded to $0.
See “Glossary” for abbreviations.
The accompanying notes are an integral part of the financial statements.
157
![]()
| Schedule of Investments | April 30, 2024 (Unaudited) |
Global X Dow 30® Covered Call & Growth ETF
Sector Weightings †:
![]()
† Sector weightings percentages are based on the total market value of investments. Total investments do not include derivatives such as options, futures contracts, forward contracts, and swap contracts, if applicable.
| Shares | Value | |||||||
| COMMON STOCK(A) — 100.5% | ||||||||
| UNITED STATES — 100.5% | ||||||||
| Communication Services — 2.6% | ||||||||
| Verizon Communications | 467 | $ | 18,442 | |||||
| Walt Disney | 467 | 51,883 | ||||||
| 70,325 | ||||||||
| Consumer Discretionary — 15.3% | ||||||||
| Amazon.com * | 467 | 81,725 | ||||||
| Home Depot | 467 | 156,081 | ||||||
| McDonald’s | 467 | 127,510 | ||||||
| NIKE, Cl B | 467 | 43,085 | ||||||
| 408,401 | ||||||||
| Consumer Staples — 5.0% | ||||||||
| Coca-Cola | 467 | 28,847 | ||||||
| Procter & Gamble | 467 | 76,214 | ||||||
| Walmart | 467 | 27,716 | ||||||
| 132,777 | ||||||||
| Energy — 2.8% | ||||||||
| Chevron | 467 | 75,313 | ||||||
The accompanying notes are an integral part of the financial statements.
158
![]()
| Schedule of Investments | April 30, 2024 (Unaudited) |
Global X Dow 30® Covered Call & Growth ETF
| Shares | Value | |||||||
| COMMON STOCK — continued | ||||||||
| Financials — 23.3% | ||||||||
| American Express | 467 | $ | 109,292 | |||||
| Goldman Sachs Group | 467 | 199,273 | ||||||
| JPMorgan Chase | 467 | 89,543 | ||||||
| Travelers | 467 | 99,079 | ||||||
| Visa, Cl A | 467 | 125,441 | ||||||
| 622,628 | ||||||||
| Health Care — 18.0% | ||||||||
| Amgen | 467 | 127,930 | ||||||
| Johnson & Johnson | 467 | 67,523 | ||||||
| Merck | 467 | 60,346 | ||||||
| UnitedHealth Group | 467 | 225,888 | ||||||
| 481,687 | ||||||||
| Industrials — 13.8% | ||||||||
| 3M | 467 | 45,070 | ||||||
| Boeing * | 467 | 78,382 | ||||||
| Caterpillar | 467 | 156,244 | ||||||
| Honeywell International | 467 | 90,005 | ||||||
| 369,701 | ||||||||
| Information Technology — 18.7% | ||||||||
| Apple | 467 | 79,544 | ||||||
| Cisco Systems | 467 | 21,940 | ||||||
| Intel | 467 | 14,230 | ||||||
| International Business Machines | 467 | 77,615 | ||||||
| Microsoft | 467 | 181,817 | ||||||
| Salesforce | 467 | 125,595 | ||||||
| 500,741 | ||||||||
| Materials — 1.0% | ||||||||
| Dow | 467 | 26,572 | ||||||
| TOTAL UNITED STATES | 2,688,145 | |||||||
| TOTAL COMMON STOCK (Cost $2,522,370) | 2,688,145 | |||||||
| TOTAL INVESTMENTS — 100.5% (Cost $2,522,370) | $ | 2,688,145 | ||||||
The accompanying notes are an integral part of the financial statements.
159
![]()
| Schedule of Investments | April 30, 2024 (Unaudited) |
Global X Dow 30® Covered Call & Growth ETF
| Value | ||||
| WRITTEN OPTIONS— (0.5)% (Premiums Received $(20,789)) | $ | (13,125 | ) | |
| Percentages are based on Net Assets of $2,675,732. | ||||
A list of the exchange traded option contracts held by the Fund at April 30, 2024, is as follows:
| Description | Number of Contracts | Notional Amount | Exercise Price | Expiration Date | Value | |||||||||||
| WRITTEN OPTIONS — (0.5)% | ||||||||||||||||
| Call Options | ||||||||||||||||
| Dow Jones Industrial Average | (35) | $ | (1,323,560 | ) | $ | 380 | 05/17/24 | $ | (13,125 | ) | ||||||
| * | Non-income producing security. |
| (A) | All or a portion of these securities has been segregated as collateral for options contracts. The Fair Value of the securities pledged as collateral is $2,567,293. |
The following is a summary of the level of inputs used as of April 30, 2024, in valuing the Fund’s investments and other financial instruments carried at value:
| Investments in Securities | Level 1 | Level 2 | Level 3 | Total | ||||||||||||
| Common Stock | $ | 2,688,145 | $ | — | $ | — | $ | 2,688,145 | ||||||||
| Total Investments in Securities | $ | 2,688,145 | $ | — | $ | — | $ | 2,688,145 | ||||||||
| Other Financial Instruments | Level 1 | Level 2 | Level 3 | Total | ||||||||||||
| Written Options | $ | (13,125 | ) | $ | — | $ | — | $ | (13,125 | ) | ||||||
| Total Other Financial Instruments | $ | (13,125 | ) | $ | — | $ | — | $ | (13,125 | ) | ||||||
Amounts designated as “—” are $0 or have been rounded to $0.
See “Glossary” for abbreviations.
The accompanying notes are an integral part of the financial statements.
160
![]()
| Schedule of Investments | April 30, 2024 (Unaudited) |
Global X MSCI Emerging Markets Covered Call ETF
Sector Weightings †:

† Sector weightings percentages are based on the total market value of investments. Total investments do not include derivatives such as options, futures contracts, forward contracts, and swap contracts, if applicable.
| Shares | Value | |||||||
| EXCHANGE TRADED FUND(A) — 103.6% | ||||||||
| iShares Core MSCI Emerging Markets ETF (A) | 39,300 | $ | 2,029,845 | |||||
| TOTAL EXCHANGE TRADED FUND (Cost $1,926,482) | 2,029,845 | |||||||
| TOTAL INVESTMENTS — 103.6% (Cost $1,926,482) | $ | 2,029,845 | ||||||
| WRITTEN OPTIONS— (4.0)% (Premiums Received $(47,293)) | $ | (77,561 | ) | |||||
| Percentages are based on Net Assets of $1,958,457. | ||||||||
A list of the exchange traded option contracts held by the Fund at April 30, 2024, is as follows:
| Description | Number of Contracts | Notional Amount | Exercise Price | Expiration Date | Value | |||||||||||
| WRITTEN OPTIONS — (4.0)% | ||||||||||||||||
| Call Options | ||||||||||||||||
| iShares Core MSCI Emerging Markets ETF | (392) | $ | (2,024,680 | ) | $ | 50 | 05/17/24 | $ | (77,561 | ) | ||||||
| (A) | All or a portion of these securities has been segregated as collateral for options contracts. The Fair Value of the securities pledged as collateral is $2,024,680. |
The accompanying notes are an integral part of the financial statements.
161
![]()
| Schedule of Investments | April 30, 2024 (Unaudited) |
Global X MSCI Emerging Markets Covered Call ETF
The following is a summary of the level of inputs used as of April 30, 2024, in valuing the Fund’s investments and other financial instruments carried at value:
| Investments in Securities | Level 1 | Level 2 | Level 3 | Total | ||||||||||||
| Exchange Traded Fund | $ | 2,029,845 | $ | — | $ | — | $ | 2,029,845 | ||||||||
| Total Investments in Securities | $ | 2,029,845 | $ | — | $ | — | $ | 2,029,845 | ||||||||
| Other Financial Instruments | Level 1 | Level 2 | Level 3 | Total | ||||||||||||
| Written Options | $ | (77,561 | ) | $ | — | $ | — | $ | (77,561 | ) | ||||||
| Total Other Financial Instruments | $ | (77,561 | ) | $ | — | $ | — | $ | (77,561 | ) | ||||||
Amounts designated as “—” are $0 or have been rounded to $0.
See “Glossary” for abbreviations.
The accompanying notes are an integral part of the financial statements.
162
![]()
| Schedule of Investments | April 30, 2024 (Unaudited) |
Glossary (abbreviations used in preceding Schedule of Investments):
Fund Abbreviations
ADR — American Depositary Receipt
Cl — Class
ETF — Exchange-Traded Fund
REIT — Real Estate Investment Trust
S&P — Standard & Poor’s
SPDR — Standard & Poor’s Depository Receipt
163
![]()
Statements of Assets and Liabilities
April 30, 2024 (Unaudited)
| Global X S&P 500® Covered Call ETF | Global X NASDAQ 100® Covered Call ETF | Global X Russell 2000 Covered Call ETF | Global X Nasdaq 100® Covered Call & Growth ETF | |||||||||||||
| Assets: | ||||||||||||||||
| Cost of Investments | $ | 2,241,081,989 | $ | 5,696,253,281 | $ | 1,320,105,460 | $ | 94,190,014 | ||||||||
| Cost of Affiliated Investments | — | — | 1,862,055 | — | ||||||||||||
| Investments, at Value | $ | 2,835,215,498 | $ | 8,149,639,128 | $ | 1,423,098,971 | $ | 115,775,670 | ||||||||
| Affiliated Investments, at Value | — | — | 1,996,964 | — | ||||||||||||
| Cash | 3,184,935 | 10,086,164 | 2,411,828 | 154,490 | ||||||||||||
| Dividend, Interest, and Securities Lending Income Receivable | 1,683,370 | 578,669 | 347,903 | 8,200 | ||||||||||||
| Reclaim Receivable | 23,354 | — | 7,635 | — | ||||||||||||
| Receivable for Capital Shares Sold | — | 11,299,181 | 2,445,240 | — | ||||||||||||
| Receivable for Investment Securities Sold | — | 268,797 | 64,024 | — | ||||||||||||
| Total Assets | 2,840,107,157 | 8,171,871,939 | 1,430,372,565 | 115,938,360 | ||||||||||||
| Liabilities: | ||||||||||||||||
| Options Written at Value (Premiums received $48,030,031, $170,088,337, $35,752,274 and $1,205,140, respectively) | 50,895,200 | 208,931,840 | 38,460,015 | 1,475,760 | ||||||||||||
| Payable due to Investment Adviser | 1,393,621 | 3,963,808 | 665,370 | 40,698 | ||||||||||||
| Payable for Investment Securities Purchased | — | 11,479,424 | 2,513,726 | — | ||||||||||||
| Total Liabilities | 52,288,821 | 224,375,072 | 41,639,111 | 1,516,458 | ||||||||||||
| Net Assets | $ | 2,787,818,336 | $ | 7,947,496,867 | $ | 1,388,733,454 | $ | 114,421,902 | ||||||||
| Net Assets Consist of: | ||||||||||||||||
| Paid-in Capital | $ | 2,777,887,654 | $ | 8,053,804,661 | $ | 1,659,384,614 | $ | 105,247,664 | ||||||||
| Total Distributable Earnings (Accumulated Losses) | 9,930,682 | (106,307,794 | ) | (270,651,160 | ) | 9,174,238 | ||||||||||
| Net Assets | $ | 2,787,818,336 | $ | 7,947,496,867 | $ | 1,388,733,454 | $ | 114,421,902 | ||||||||
| Outstanding Shares of Beneficial Interest (unlimited authorization — no par value) | 69,940,000 | 457,190,000 | 85,190,000 | 3,890,000 | ||||||||||||
| Net Asset Value, Offering and Redemption Price Per Share | $39.86 | $17.38 | $16.30 | $29.41 | ||||||||||||
The accompanying notes are an integral part of the financial statements.
164
![]()
Statements of Assets and Liabilities
April 30, 2024 (Unaudited)
| Global X S&P 500® Covered Call & Growth ETF | Global X NASDAQ 100® Risk Managed Income ETF | Global X S&P 500® Risk Managed Income ETF | Global X Dow 30® Covered Call ETF | |||||||||||||
| Assets: | ||||||||||||||||
| Cost of Investments | $ | 61,036,298 | $ | 11,314,429 | $ | 29,010,494 | $ | 72,759,116 | ||||||||
| Investments, at Value | $ | 67,624,513 | $ | 13,423,802 | $ | 34,098,487 | $ | 84,132,501 | ||||||||
| Cash | 47,309 | 24,084 | 44,962 | 36,336 | ||||||||||||
| Dividend, Interest, and Securities Lending Income Receivable | 40,865 | 933 | 20,288 | 52,731 | ||||||||||||
| Reclaim Receivable | 509 | — | 159 | — | ||||||||||||
| Receivable for Capital Shares Sold | — | — | — | 442,144 | ||||||||||||
| Receivable for Investment Securities Sold | — | — | — | 4,454 | ||||||||||||
| Total Assets | 67,713,196 | 13,448,819 | 34,163,896 | 84,668,166 | ||||||||||||
| Liabilities: | ||||||||||||||||
| Options Written at Value (Premiums received $569,017, $301,018, $578,927 and $1,320,778, respectively) | 605,680 | 368,920 | 611,338 | 834,000 | ||||||||||||
| Payable due to Investment Adviser | 24,653 | 6,389 | 16,601 | 41,040 | ||||||||||||
| Payable for Investment Securities Purchased | — | — | — | 448,984 | ||||||||||||
| Total Liabilities | 630,333 | 375,309 | 627,939 | 1,324,024 | ||||||||||||
| Net Assets | $ | 67,082,863 | $ | 13,073,510 | $ | 33,535,957 | $ | 83,344,142 | ||||||||
| Net Assets Consist of: | ||||||||||||||||
| Paid-in Capital | $ | 61,969,185 | $ | 15,317,445 | $ | 37,045,469 | $ | 78,961,739 | ||||||||
| Total Distributable Earnings (Accumulated Losses) | 5,113,678 | (2,243,935 | ) | (3,509,512 | ) | 4,382,403 | ||||||||||
| Net Assets | $ | 67,082,863 | $ | 13,073,510 | $ | 33,535,957 | $ | 83,344,142 | ||||||||
| Outstanding Shares of Beneficial Interest (unlimited authorization — no par value) | 2,290,000 | 780,000 | 1,790,000 | 3,770,000 | ||||||||||||
| Net Asset Value, Offering and Redemption Price Per Share | $29.29 | $16.76 | $18.74 | $22.11 | ||||||||||||
The accompanying notes are an integral part of the financial statements.
165
![]()
Statements of Assets and Liabilities
April 30, 2024 (Unaudited)
| Global X Russell 2000 Covered Call & Growth ETF | Global X Financials Covered Call & Growth ETF | Global X Health Care Covered Call & Growth ETF | Global X Information Technology Covered Call & Growth ETF | |||||||||||||
| Assets: | ||||||||||||||||
| Cost of Investments | $ | 7,004,621 | $ | 2,265,677 | $ | 2,636,278 | $ | 6,128,804 | ||||||||
| Investments, at Value | $ | 7,701,951 | $ | 2,584,602 | $ | 2,744,255 | $ | 6,695,456 | ||||||||
| Cash | 12,326 | 2,780 | 2,265 | 8,985 | ||||||||||||
| Receivable for Investment Securities Sold | — | — | — | 1,218,945 | ||||||||||||
| Dividend, Interest, and Securities Lending Income Receivable | — | 908 | 1,452 | 249 | ||||||||||||
| Reclaim Receivable | — | 6 | — | 62 | ||||||||||||
| Total Assets | 7,714,277 | 2,588,296 | 2,747,972 | 7,923,697 | ||||||||||||
| Liabilities: | ||||||||||||||||
| Options Written at Value (Premiums received $96,478, $23,543, $21,851 and $89,599, respectively) | 104,068 | 26,881 | 25,530 | 60,708 | ||||||||||||
| Payable due to Investment Adviser | 2,125 | 1,158 | 1,228 | 3,606 | ||||||||||||
| Payable for Investment Securities Purchased | — | — | — | 11,192 | ||||||||||||
| Payable for Capital Shares Redeemed | — | — | — | 1,207,443 | ||||||||||||
| Total Liabilities | 106,193 | 28,039 | 26,758 | 1,282,949 | ||||||||||||
| Net Assets | $ | 7,608,084 | $ | 2,560,257 | $ | 2,721,214 | $ | 6,640,748 | ||||||||
| Net Assets Consist of: | ||||||||||||||||
| Paid-in Capital | $ | 6,991,610 | $ | 2,445,667 | $ | 2,767,218 | $ | 6,302,665 | ||||||||
| Total Distributable Earnings (Accumulated Losses) | 616,474 | 114,590 | (46,004 | ) | 338,083 | |||||||||||
| Net Assets | $ | 7,608,084 | $ | 2,560,257 | $ | 2,721,214 | $ | 6,640,748 | ||||||||
| Outstanding Shares of Beneficial Interest (unlimited authorization — no par value) | 310,000 | 100,000 | 110,000 | 220,000 | ||||||||||||
| Net Asset Value, Offering and Redemption Price Per Share | $24.54 | $25.60 | $24.74 | $30.19 | ||||||||||||
The accompanying notes are an integral part of the financial statements.
166
![]()
Statements of Assets and Liabilities
April 30, 2024 (Unaudited)
| Global X NASDAQ 100 ESG Covered Call ETF | Global X S&P 500 ESG Covered Call ETF | Global X Dow 30® Covered Call & Growth ETF | Global X MSCI Emerging Markets Covered Call ETF | |||||||||||||
| Assets: | ||||||||||||||||
| Cost of Investments | $ | 1,964,242 | $ | 1,144,397 | $ | 2,522,370 | $ | 1,926,482 | ||||||||
| Investments, at Value | $ | 2,383,350 | $ | 1,296,109 | $ | 2,688,145 | $ | 2,029,845 | ||||||||
| Cash | 4,774 | 941 | — | 6,902 | ||||||||||||
| Dividend, Interest, and Securities Lending Income Receivable | 147 | 851 | 1,706 | — | ||||||||||||
| Receivable for Investment Securities Sold | — | 160,276 | — | — | ||||||||||||
| Total Assets | 2,388,271 | 1,458,177 | 2,689,851 | 2,036,747 | ||||||||||||
| Liabilities: | ||||||||||||||||
| Options Written at Value (Premiums received $48,404, $15,675, $20,789 and $47,293, respectively) | 57,295 | 20,160 | 13,125 | 77,561 | ||||||||||||
| Payable due to Investment Adviser | 1,168 | 634 | 966 | 729 | ||||||||||||
| Payable for Investment Securities Purchased | — | 161,430 | — | — | ||||||||||||
| Due to Custodian | — | — | 28 | — | ||||||||||||
| Total Liabilities | 58,463 | 182,224 | 14,119 | 78,290 | ||||||||||||
| Net Assets | $ | 2,329,808 | $ | 1,275,953 | $ | 2,675,732 | $ | 1,958,457 | ||||||||
| Net Assets Consist of: | ||||||||||||||||
| Paid-in Capital | $ | 2,175,798 | $ | 1,114,957 | $ | 2,567,169 | $ | 1,996,779 | ||||||||
| Total Distributable Earnings (Accumulated Losses) | 154,010 | 160,996 | 108,563 | (38,322 | ) | |||||||||||
| Net Assets | $ | 2,329,808 | $ | 1,275,953 | $ | 2,675,732 | $ | 1,958,457 | ||||||||
| Outstanding Shares of Beneficial Interest (unlimited authorization — no par value) | 90,000 | 50,000 | 100,000 | 80,000 | ||||||||||||
| Net Asset Value, Offering and Redemption Price Per Share | $25.89 | $25.52 | $26.76 | $24.48 | ||||||||||||
The accompanying notes are an integral part of the financial statements.
167
![]()
For the period ended April 30, 2024 (Unaudited)
| Global X S&P 500® Covered Call ETF | Global X NASDAQ 100® Covered Call ETF | Global X Russell 2000 Covered Call ETF | Global X Nasdaq 100® Covered Call & Growth ETF | |||||||||||||
| Investment Income: | ||||||||||||||||
| Dividend Income | $ | 21,729,948 | $ | 39,696,573 | $ | 9,257,318 | $ | 551,063 | ||||||||
| Interest Income | 190,726 | 740,633 | 123,077 | 7,053 | ||||||||||||
| Less: Foreign Taxes Withheld | 4,861 | (88,458 | ) | (12,999 | ) | (1,249 | ) | |||||||||
| Total Investment Income | 21,925,535 | 40,348,748 | 9,367,396 | 556,867 | ||||||||||||
| Expenses: | ||||||||||||||||
| Supervision and Administration Fees(1) | 8,384,240 | 23,580,117 | 4,220,305 | 316,378 | ||||||||||||
| Custodian Fees(2) | 8,264 | 1,684 | 18,667 | 25 | ||||||||||||
| Total Expenses | 8,392,504 | 23,581,801 | 4,238,972 | 316,403 | ||||||||||||
| Waiver of Supervision and Administration Fees | – | – | (171,109 | ) | – | |||||||||||
| Net Expenses | 8,392,504 | 23,581,801 | 4,067,863 | 316,403 | ||||||||||||
| Net Investment Income | 13,533,031 | 16,766,947 | 5,299,533 | 240,464 | ||||||||||||
| Net Realized Gain (Loss) on: | ||||||||||||||||
| Investments(3) | 59,660,523 | 306,018,613 | 21,608,481 | 3,204,483 | ||||||||||||
| Written Options | (251,792,963 | ) | (563,734,264 | ) | (139,179,246 | ) | (3,797,458 | ) | ||||||||
| Net Realized Gain (Loss) | (192,132,440 | ) | (257,715,651 | ) | (117,570,765 | ) | (592,975 | ) | ||||||||
| Net Change in Unrealized Appreciation (Depreciation) on: | ||||||||||||||||
| Investments | 467,093,625 | 1,211,817,685 | 243,083,967 | 17,680,804 | ||||||||||||
| Affiliated Investments | — | — | (120,679 | ) | — | |||||||||||
| Written Options | (38,815,183 | ) | (156,928,662 | ) | (27,322,566 | ) | (1,048,324 | ) | ||||||||
| Net Change in Unrealized Appreciation (Depreciation) | 428,278,442 | 1,054,889,023 | 215,640,722 | 16,632,480 | ||||||||||||
| Net Realized and Unrealized Gain (Loss) | 236,146,002 | 797,173,372 | 98,069,957 | 16,039,505 | ||||||||||||
| Net Increase in Net Assets Resulting from Operations | $ | 249,679,033 | $ | 813,940,319 | $ | 103,369,490 | $ | 16,279,969 | ||||||||
| (1) | The Supervision and Administration fees includes fees paid by the Funds for the investment advisory services provided by the Adviser. (See Note 3 in Notes to Financial Statements.) |
| (2) | See Note 2 in the Notes to Financial Statements. |
| (3) | Includes realized gains (losses) as a result of in-kind redemptions. (See Note 4 in Notes to Financial Statements.) |
The accompanying notes are an integral part of the financial statements.
168
![]()
Statements of Operations
For the period ended April 30, 2024 (Unaudited)
| Global X S&P 500® Covered Call & Growth ETF | Global X NASDAQ 100® Risk Managed Income ETF | Global X S&P 500® Risk Managed Income ETF | Global X Dow 30® Covered Call ETF | |||||||||||||
| Investment Income: | ||||||||||||||||
| Dividend Income | $ | 500,383 | $ | 60,488 | $ | 232,990 | $ | 861,428 | ||||||||
| Interest Income | 2,370 | 1,082 | 2,635 | — | ||||||||||||
| Less: Foreign Taxes Withheld | (177 | ) | (138 | ) | (58 | ) | — | |||||||||
| Total Investment Income | 502,576 | 61,432 | 235,567 | 861,428 | ||||||||||||
| Expenses: | ||||||||||||||||
| Supervision and Administration Fees(1) | 186,638 | 36,150 | 90,902 | 249,254 | ||||||||||||
| Custodian Fees(2) | 80 | 388 | 345 | 40 | ||||||||||||
| Total Expenses | 186,718 | 36,538 | 91,247 | 249,294 | ||||||||||||
| Net Investment Income | 315,858 | 24,894 | 144,320 | 612,134 | ||||||||||||
| Net Realized Gain (Loss) on: | ||||||||||||||||
| Investments(3) | 1,559,066 | 109,169 | (828 | ) | 1,339,156 | |||||||||||
| Purchased Options | — | (379,508 | ) | (541,857 | ) | — | ||||||||||
| Written Options | (2,786,469 | ) | (862,687 | ) | (2,475,144 | ) | (5,287,852 | ) | ||||||||
| Net Realized Gain (Loss) | (1,227,403 | ) | (1,133,026 | ) | (3,017,829 | ) | (3,948,696 | ) | ||||||||
| Net Change in Unrealized Appreciation (Depreciation) on: | ||||||||||||||||
| Investments | 10,211,310 | 2,163,188 | 5,274,893 | 10,015,092 | ||||||||||||
| Purchased Options | — | (40,951 | ) | (51,559 | ) | — | ||||||||||
| Written Options | (426,067 | ) | (246,256 | ) | (374,762 | ) | 621,076 | |||||||||
| Net Change in Unrealized Appreciation (Depreciation) | 9,785,243 | 1,875,981 | 4,848,572 | 10,636,168 | ||||||||||||
| Net Realized and Unrealized Gain (Loss) | 8,557,840 | 742,955 | 1,830,743 | 6,687,472 | ||||||||||||
| Net Increase in Net Assets Resulting from Operations | $ | 8,873,698 | $ | 767,849 | $ | 1,975,063 | $ | 7,299,606 | ||||||||
| (1) | The Supervision and Administration fees includes fees paid by the Funds for the investment advisory services provided by the Adviser. (See Note 3 in Notes to Financial Statements.) |
| (2) | See Note 2 in the Notes to Financial Statements. |
| (3) | Includes realized gains (losses) as a result of in-kind redemptions. (See Note 4 in Notes to Financial Statements.) |
The accompanying notes are an integral part of the financial statements.
169
![]()
Statements of Operations
For the period ended April 30, 2024 (Unaudited)
| Global X Russell 2000 Covered Call & Growth ETF | Global X Financials Covered Call & Growth ETF | Global X Health Care Covered Call & Growth ETF | Global X Information Technology Covered Call & Growth ETF | |||||||||||||
| Investment Income: | ||||||||||||||||
| Dividend Income | $ | 73,553 | $ | 22,256 | $ | 22,779 | $ | 18,614 | ||||||||
| Interest Income | 707 | 129 | 232 | 621 | ||||||||||||
| Less: Foreign Taxes Withheld | — | — | — | (18 | ) | |||||||||||
| Total Investment Income | 74,260 | 22,385 | 23,011 | 19,217 | ||||||||||||
| Expenses: | ||||||||||||||||
| Supervision and Administration Fees(1) | 26,222 | 7,435 | 8,194 | 15,242 | ||||||||||||
| Custodian Fees(2) | 12 | — | — | — | ||||||||||||
| Total Expenses | 26,234 | 7,435 | 8,194 | 15,242 | ||||||||||||
| Waiver of Supervision and Administration Fees | (4,607 | ) | (667 | ) | (752 | ) | (1,397 | ) | ||||||||
| Net Expenses | 21,627 | 6,768 | 7,442 | 13,845 | ||||||||||||
| Net Investment Income | 52,633 | 15,617 | 15,569 | 5,372 | ||||||||||||
| Net Realized Gain (Loss) on: | ||||||||||||||||
| Investments(3) | 837,414 | 57,972 | 3,521 | 465,002 | ||||||||||||
| Written Options | (571,110 | ) | (146,643 | ) | (51,629 | ) | (123,829 | ) | ||||||||
| Net Realized Gain (Loss) | 266,304 | (88,671 | ) | (48,108 | ) | 341,173 | ||||||||||
| Net Change in Unrealized Appreciation (Depreciation) on: | ||||||||||||||||
| Investments | 992,760 | 481,764 | 321,335 | 22,742 | ||||||||||||
| Written Options | (48,087 | ) | (21,822 | ) | (21,907 | ) | (1,156 | ) | ||||||||
| Foreign Currency Translations | (1 | ) | — | — | — | |||||||||||
| Net Change in Unrealized Appreciation (Depreciation) | 944,672 | 459,942 | 299,428 | 21,586 | ||||||||||||
| Net Realized and Unrealized Gain (Loss) | 1,210,976 | 371,271 | 251,320 | 362,759 | ||||||||||||
| Net Increase in Net Assets Resulting from Operations | $ | 1,263,609 | $ | 386,888 | $ | 266,889 | $ | 368,131 | ||||||||
| (1) | The Supervision and Administration fees includes fees paid by the Funds for the investment advisory services provided by the Adviser. (See Note 3 in Notes to Financial Statements.) |
| (2) | See Note 2 in the Notes to Financial Statements. |
| (3) | Includes realized gains (losses) as a result of in-kind redemptions. (See Note 4 in Notes to Financial Statements.) |
The accompanying notes are an integral part of the financial statements.
170
![]()
Statements of Operations
For the period ended April 30, 2024 (Unaudited)
| Global X NASDAQ 100 ESG Covered Call ETF | Global X S&P 500 ESG Covered Call ETF | Global X Dow 30® Covered Call & Growth ETF | Global X MSCI Emerging Markets Covered Call ETF (1) | |||||||||||||
| Investment Income: | ||||||||||||||||
| Dividend Income | $ | 11,368 | $ | 14,143 | $ | 27,114 | $ | 24,495 | ||||||||
| Interest Income | 228 | 121 | 115 | 136 | ||||||||||||
| Less: Foreign Taxes Withheld | (35 | ) | (5 | ) | — | — | ||||||||||
| Total Investment Income | 11,561 | 14,259 | 27,229 | 24,631 | ||||||||||||
| Expenses: | ||||||||||||||||
| Supervision and Administration Fees(2) | 7,583 | 5,707 | 7,581 | 4,520 | ||||||||||||
| Custodian Fees(3) | 38 | 27 | 9 | — | ||||||||||||
| Total Expenses | 7,621 | 5,734 | 7,590 | 4,520 | ||||||||||||
| Waiver of Supervision and Administration Fees | – | – | – | (691 | ) | |||||||||||
| Net Expenses | 7,621 | 5,734 | 7,590 | 3,829 | ||||||||||||
| Net Investment Income | 3,940 | 8,525 | 19,639 | 20,802 | ||||||||||||
| Net Realized Gain (Loss) on: | ||||||||||||||||
| Investments(4) | 234,234 | 296,636 | 5,922 | 3,476 | ||||||||||||
| Written Options | (224,806 | ) | (176,102 | ) | (79,415 | ) | (44,907 | ) | ||||||||
| Net Realized Gain (Loss) | 9,428 | 120,534 | (73,493 | ) | (41,431 | ) | ||||||||||
| Net Change in Unrealized Appreciation (Depreciation) on: | ||||||||||||||||
| Investments | 299,821 | 122,515 | 340,452 | 103,363 | ||||||||||||
| Written Options | (41,594 | ) | (27,542 | ) | 9,508 | (30,268 | ) | |||||||||
| Net Change in Unrealized Appreciation (Depreciation) | 258,227 | 94,973 | 349,960 | 73,095 | ||||||||||||
| Net Realized and Unrealized Gain (Loss) | 267,655 | 215,507 | 276,467 | 31,664 | ||||||||||||
| Net Increase in Net Assets Resulting from Operations | $ | 271,595 | $ | 224,032 | $ | 296,106 | $ | 52,466 | ||||||||
| (1) | The Fund commenced operations on November 7, 2023. |
| (2) | The Supervision and Administration fees includes fees paid by the Funds for the investment advisory services provided by the Adviser. (See Note 3 in Notes to Financial Statements.) |
| (3) | See Note 2 in the Notes to Financial Statements. |
| (4) | Includes realized gains (losses) as a result of in-kind redemptions. (See Note 4 in Notes to Financial Statements.) |
The accompanying notes are an integral part of the financial statements.
171
![]()
Statements of Changes in Net Assets
| Global X S&P 500® Covered Call ETF | Global X NASDAQ 100® Covered Call ETF | |||||||||||||||
| Period Ended April 30, 2024 (Unaudited) | Year Ended October 31, 2023 | Period Ended April 30, 2024 (Unaudited) | Year Ended October 31, 2023 | |||||||||||||
| Operations: | ||||||||||||||||
| Net Investment Income | $ | 13,533,031 | $ | 27,392,869 | $ | 16,766,947 | $ | 22,396,738 | ||||||||
| Net Realized Gain (Loss) | (192,132,440 | ) | (233,680,467 | ) | (257,715,651 | ) | (991,313,251 | ) | ||||||||
| Net Change in Unrealized Appreciation (Depreciation) | 428,278,442 | 340,702,585 | 1,054,889,023 | 1,973,695,038 | ||||||||||||
| Net Increase in Net Assets Resulting from Operations | 249,679,033 | 134,414,987 | 813,940,319 | 1,004,778,525 | ||||||||||||
| Distributions: | (129,191,120 | ) | (8,585,958 | ) | (465,618,470 | ) | — | |||||||||
| Return of Capital: | — | (269,122,735 | ) | — | (875,982,507 | ) | ||||||||||
| Capital Share Transactions: | ||||||||||||||||
| Issued | 53,905,890 | 1,162,324,728 | 302,054,743 | 1,525,390,555 | ||||||||||||
| Redeemed | (191,781,295 | ) | (148,370,274 | ) | (224,093,124 | ) | (530,621,484 | ) | ||||||||
| Increase (Decrease) in Net Assets from Capital Share Transactions | (137,875,405 | ) | 1,013,954,454 | 77,961,619 | 994,769,071 | |||||||||||
| Total Increase (Decrease) in Net Assets | (17,387,492 | ) | 870,660,748 | 426,283,468 | 1,123,565,089 | |||||||||||
| Net Assets: | ||||||||||||||||
| Beginning of Year/Period | 2,805,205,828 | 1,934,545,080 | 7,521,213,399 | 6,397,648,310 | ||||||||||||
| End of Year/Period | $ | 2,787,818,336 | $ | 2,805,205,828 | $ | 7,947,496,867 | $ | 7,521,213,399 | ||||||||
| Share Transactions: | ||||||||||||||||
| Issued | 1,340,000 | 28,790,000 | 17,110,000 | 88,410,000 | ||||||||||||
| Redeemed | (4,880,000 | ) | (3,670,000 | ) | (12,930,000 | ) | (31,540,000 | ) | ||||||||
| Net Increase (Decrease) in Shares Outstanding from Share Transactions | (3,540,000 | ) | 25,120,000 | 4,180,000 | 56,870,000 | |||||||||||
The accompanying notes are an integral part of the financial statements.
172
![]()
Statements of Changes in Net Assets
| Global X Russell 2000 Covered Call ETF | Global X Nasdaq 100® Covered Call & Growth ETF | |||||||||||||||
| Period Ended April 30, 2024 (Unaudited) | Year Ended October 31, 2023 | Period Ended April 30, 2024 (Unaudited) | Year Ended October 31, 2023 | |||||||||||||
| Operations: | ||||||||||||||||
| Net Investment Income | $ | 5,299,533 | $ | 15,090,879 | $ | 240,464 | $ | 216,859 | ||||||||
| Net Realized Gain (Loss) | (117,570,765 | ) | (69,751,640 | ) | (592,975 | ) | (7,451,747 | ) | ||||||||
| Net Change in Unrealized Appreciation (Depreciation) | 215,640,722 | (56,574,026 | ) | 16,632,480 | 20,210,906 | |||||||||||
| Net Increase (Decrease) in Net Assets Resulting from Operations | 103,369,490 | (111,234,787 | ) | 16,279,969 | 12,976,018 | |||||||||||
| Distributions: | (84,604,511 | ) | (2,455,329 | ) | (3,308,010 | ) | — | |||||||||
| Return of Capital: | — | (170,194,451 | ) | — | (4,776,529 | ) | ||||||||||
| Capital Share Transactions: | ||||||||||||||||
| Issued | 92,254,414 | 488,673,691 | 10,467,783 | 38,046,832 | ||||||||||||
| Redeemed | (128,323,684 | ) | (140,992,543 | ) | (11,196,527 | ) | (5,172,322 | ) | ||||||||
| Increase (Decrease) in Net Assets from Capital Share Transactions | (36,069,270 | ) | 347,681,148 | (728,744 | ) | 32,874,510 | ||||||||||
| Total Increase (Decrease) in Net Assets | (17,304,291 | ) | 63,796,581 | 12,243,215 | 41,073,999 | |||||||||||
| Net Assets: | ||||||||||||||||
| Beginning of Year/Period | 1,406,037,745 | 1,342,241,164 | 102,178,687 | 61,104,688 | ||||||||||||
| End of Year/Period | $ | 1,388,733,454 | $ | 1,406,037,745 | $ | 114,421,902 | $ | 102,178,687 | ||||||||
| Share Transactions: | ||||||||||||||||
| Issued | 5,590,000 | 26,620,000 | 360,000 | 1,430,000 | ||||||||||||
| Redeemed | (7,730,000 | ) | (7,940,000 | ) | (390,000 | ) | (190,000 | ) | ||||||||
| Net Increase (Decrease) in Shares Outstanding from Share Transactions | (2,140,000 | ) | 18,680,000 | (30,000 | ) | 1,240,000 | ||||||||||
The accompanying notes are an integral part of the financial statements.
173
![]()
Statements of Changes in Net Assets
| Global X S&P 500® Covered Call & Growth ETF | Global X NASDAQ 100® Risk Managed Income ETF | |||||||||||||||
| Period Ended April 30, 2024 (Unaudited) | Year Ended October 31, 2023 | Period Ended April 30, 2024 (Unaudited) | Year Ended October 31, 2023 | |||||||||||||
| Operations: | ||||||||||||||||
| Net Investment Income | $ | 315,858 | $ | 562,614 | $ | 24,894 | $ | 29,997 | ||||||||
| Net Realized Gain (Loss) | (1,227,403 | ) | 108,169 | (1,133,026 | ) | (3,412,973 | ) | |||||||||
| Net Change in Unrealized Appreciation (Depreciation) | 9,785,243 | 2,932,803 | 1,875,981 | 3,554,002 | ||||||||||||
| Net Increase in Net Assets Resulting from Operations | 8,873,698 | 3,603,586 | 767,849 | 171,026 | ||||||||||||
| Distributions: | (1,492,498 | ) | (376,487 | ) | (726,311 | ) | — | |||||||||
| Return of Capital: | — | (2,498,448 | ) | — | (1,196,718 | ) | ||||||||||
| Capital Share Transactions: | ||||||||||||||||
| Issued | 8,091,024 | 37,732,859 | 2,069,101 | 4,456,197 | ||||||||||||
| Redeemed | (9,395,695 | ) | (18,965,715 | ) | (849,701 | ) | (2,337,483 | ) | ||||||||
| Increase (Decrease) in Net Assets from Capital Share Transactions | (1,304,671 | ) | 18,767,144 | 1,219,400 | 2,118,714 | |||||||||||
| Total Increase in Net Assets | 6,076,529 | 19,495,795 | 1,260,938 | 1,093,022 | ||||||||||||
| Net Assets: | ||||||||||||||||
| Beginning of Year/Period | 61,006,334 | 41,510,539 | 11,812,572 | 10,719,550 | ||||||||||||
| End of Year/Period | $ | 67,082,863 | $ | 61,006,334 | $ | 13,073,510 | $ | 11,812,572 | ||||||||
| Share Transactions: | ||||||||||||||||
| Issued | 280,000 | 1,400,000 | 120,000 | 250,000 | ||||||||||||
| Redeemed | (330,000 | ) | (690,000 | ) | (50,000 | ) | (130,000 | ) | ||||||||
| Net Increase (Decrease) in Shares Outstanding from Share Transactions | (50,000 | ) | 710,000 | 70,000 | 120,000 | |||||||||||
The accompanying notes are an integral part of the financial statements.
174
![]()
Statements of Changes in Net Assets
| Global X S&P 500® Risk Managed Income ETF | Global X Dow 30® Covered Call ETF | |||||||||||||||
| Period Ended April 30, 2024 (Unaudited) | Year Ended October 31, 2023 | Period Ended April 30, 2024 (Unaudited) | Year Ended October 31, 2023 | |||||||||||||
| Operations: | ||||||||||||||||
| Net Investment Income | $ | 144,320 | $ | 281,161 | $ | 612,134 | $ | 1,105,670 | ||||||||
| Net Realized Gain (Loss) | (3,017,829 | ) | (4,960,159 | ) | (3,948,696 | ) | (922,155 | ) | ||||||||
| Net Change in Unrealized Appreciation (Depreciation) | 4,848,572 | 4,368,747 | 10,636,168 | 1,596,622 | ||||||||||||
| Net Increase (Decrease) in Net Assets Resulting from Operations | 1,975,063 | (310,251 | ) | 7,299,606 | 1,780,137 | |||||||||||
| Distributions: | (1,833,274 | ) | (41,006 | ) | (2,622,919 | ) | (609,561 | ) | ||||||||
| Return of Capital: | — | (3,063,982 | ) | — | (4,969,158 | ) | ||||||||||
| Capital Share Transactions: | ||||||||||||||||
| Issued | 7,432,208 | 8,369,780 | 4,846,526 | 40,828,893 | ||||||||||||
| Redeemed | (1,135,851 | ) | (2,490,395 | ) | (5,126,222 | ) | (11,067,750 | ) | ||||||||
| Increase (Decrease) in Net Assets from Capital Share Transactions | 6,296,357 | 5,879,385 | (279,696 | ) | 29,761,143 | |||||||||||
| Total Increase in Net Assets | 6,438,146 | 2,464,146 | 4,396,991 | 25,962,561 | ||||||||||||
| Net Assets: | ||||||||||||||||
| Beginning of Year/Period | 27,097,811 | 24,633,665 | 78,947,151 | 52,984,590 | ||||||||||||
| End of Year/Period | $ | 33,535,957 | $ | 27,097,811 | $ | 83,344,142 | $ | 78,947,151 | ||||||||
| Share Transactions: | ||||||||||||||||
| Issued | 390,000 | 410,000 | 220,000 | 1,870,000 | ||||||||||||
| Redeemed | (60,000 | ) | (120,000 | ) | (230,000 | ) | (510,000 | ) | ||||||||
| Net Increase (Decrease) in Shares Outstanding from Share Transactions | 330,000 | 290,000 | (10,000 | ) | 1,360,000 | |||||||||||
The accompanying notes are an integral part of the financial statements.
175
![]()
Statements of Changes in Net Assets
| Global X Russell 2000 Covered Call & Growth ETF | Global X Financials Covered Call & Growth ETF | |||||||||||||||
| Period Ended April 30, 2024 (Unaudited) | Year Ended October 31, 2023 | Period Ended April 30, 2024 (Unaudited) | Period Ended October 31, 2023(1) | |||||||||||||
| Operations: | ||||||||||||||||
| Net Investment Income | $ | 52,633 | $ | 35,277 | $ | 15,617 | $ | 34,690 | ||||||||
| Net Realized Gain (Loss) | 266,304 | (20,374 | ) | (88,671 | ) | (21,236 | ) | |||||||||
| Net Change in Unrealized Appreciation (Depreciation) | 944,672 | (309,458 | ) | 459,942 | (144,355 | ) | ||||||||||
| Net Increase (Decrease) in Net Assets Resulting from Operations | 1,263,609 | (294,555 | ) | 386,888 | (130,901 | ) | ||||||||||
| Distributions: | (317,304 | ) | (103,467 | ) | (56,410 | ) | (84,987 | ) | ||||||||
| Return of Capital: | — | (152,549 | ) | — | (42,333 | ) | ||||||||||
| Capital Share Transactions: | ||||||||||||||||
| Issued | 4,734,879 | 6,907,493 | 252,735 | 2,488,000 | ||||||||||||
| Redeemed | (6,352,511 | ) | (735,702 | ) | (252,735 | ) | — | |||||||||
| Increase (Decrease) in Net Assets from Capital Share Transactions | (1,617,632 | ) | 6,171,791 | — | 2,488,000 | |||||||||||
| Total Increase (Decrease) in Net Assets | (671,327 | ) | 5,621,220 | 330,478 | 2,229,779 | |||||||||||
| Net Assets: | ||||||||||||||||
| Beginning of Year/Period | 8,279,411 | 2,658,191 | 2,229,779 | — | ||||||||||||
| End of Year/Period | $ | 7,608,084 | $ | 8,279,411 | $ | 2,560,257 | $ | 2,229,779 | ||||||||
| Share Transactions: | ||||||||||||||||
| Issued | 200,000 | 300,000 | 10,000 | 100,000 | ||||||||||||
| Redeemed | (260,000 | ) | (30,000 | ) | (10,000 | ) | — | |||||||||
| Net Increase (Decrease) in Shares Outstanding from Share Transactions | (60,000 | ) | 270,000 | — | 100,000 | |||||||||||
| (1) | The Fund commenced operations on November 21, 2022. |
The accompanying notes are an integral part of the financial statements.
176
![]()
Statements of Changes in Net Assets
| Global X Health Care Covered Call & Growth ETF | Global X Information Technology Covered Call & Growth ETF | |||||||||||||||
| Period Ended April 30, 2024 (Unaudited) | Period Ended October 31, 2023(1) | Period Ended April 30, 2024 (Unaudited) | Period Ended October 31, 2023(1) | |||||||||||||
| Operations: | ||||||||||||||||
| Net Investment Income | $ | 15,569 | $ | 28,309 | $ | 5,372 | $ | 11,876 | ||||||||
| Net Realized Gain (Loss) | (48,108 | ) | 110,750 | 341,173 | (36,039 | ) | ||||||||||
| Net Change in Unrealized Appreciation (Depreciation) | 299,428 | (195,130 | ) | 21,586 | 573,957 | |||||||||||
| Net Increase (Decrease) in Net Assets Resulting from Operations | 266,889 | (56,071 | ) | 368,131 | 549,794 | |||||||||||
| Distributions: | (122,316 | ) | (122,360 | ) | (413,621 | ) | (166,221 | ) | ||||||||
| Capital Share Transactions: | ||||||||||||||||
| Issued | — | 3,251,236 | 4,430,280 | 3,079,828 | ||||||||||||
| Redeemed | — | (496,164 | ) | (1,207,443 | ) | — | ||||||||||
| Increase in Net Assets from Capital Share Transactions | — | 2,755,072 | 3,222,837 | 3,079,828 | ||||||||||||
| Total Increase in Net Assets | 144,573 | 2,576,641 | 3,177,347 | 3,463,401 | ||||||||||||
| Net Assets: | ||||||||||||||||
| Beginning of Year/Period | 2,576,641 | — | 3,463,401 | — | ||||||||||||
| End of Year/Period | $ | 2,721,214 | $ | 2,576,641 | $ | 6,640,748 | $ | 3,463,401 | ||||||||
| Share Transactions: | ||||||||||||||||
| Issued | — | 130,000 | 140,000 | 120,000 | ||||||||||||
| Redeemed | — | (20,000 | ) | (40,000 | ) | — | ||||||||||
| Net Increase in Shares Outstanding from Share Transactions | — | 110,000 | 100,000 | 120,000 | ||||||||||||
| (1) | The Fund commenced operations on November 21, 2022. |
The accompanying notes are an integral part of the financial statements.
177
![]()
Statements of Changes in Net Assets
| Global X NASDAQ 100 ESG Covered Call ETF | Global X S&P 500 ESG Covered Call ETF | |||||||||||||||
| Period Ended April 30, 2024 (Unaudited) | Period Ended October 31, 2023(1) | Period Ended April 30, 2024 (Unaudited) | Period Ended October 31, 2023(1) | |||||||||||||
| Operations: | ||||||||||||||||
| Net Investment Income | $ | 3,940 | $ | 3,724 | $ | 8,525 | $ | 17,271 | ||||||||
| Net Realized Gain (Loss) | 9,428 | 81,924 | 120,534 | (24,567 | ) | |||||||||||
| Net Change in Unrealized Appreciation (Depreciation) | 258,227 | 151,990 | 94,973 | 52,254 | ||||||||||||
| Net Increase in Net Assets Resulting from Operations | 271,595 | 237,638 | 224,032 | 44,958 | ||||||||||||
| Distributions: | (149,083 | ) | (206,140 | ) | (63,034 | ) | (44,960 | ) | ||||||||
| Return of Capital: | — | — | — | (86,314 | ) | |||||||||||
| Capital Share Transactions: | ||||||||||||||||
| Issued | 261,278 | 3,683,183 | — | 3,427,824 | ||||||||||||
| Redeemed | (531,480 | ) | (1,237,183 | ) | (1,263,730 | ) | (962,823 | ) | ||||||||
| Increase (Decrease) in Net Assets from Capital Share Transactions | (270,202 | ) | 2,446,000 | (1,263,730 | ) | 2,465,001 | ||||||||||
| Total Increase (Decrease) in Net Assets | (147,690 | ) | 2,477,498 | (1,102,732 | ) | 2,378,685 | ||||||||||
| Net Assets: | ||||||||||||||||
| Beginning of Year/Period | 2,477,498 | — | 2,378,685 | — | ||||||||||||
| End of Year/Period | $ | 2,329,808 | $ | 2,477,498 | $ | 1,275,953 | $ | 2,378,685 | ||||||||
| Share Transactions: | ||||||||||||||||
| Issued | 10,000 | 150,000 | — | 140,000 | ||||||||||||
| Redeemed | (20,000 | ) | (50,000 | ) | (50,000 | ) | (40,000 | ) | ||||||||
| Net Increase (Decrease) in Shares Outstanding from Share Transactions | (10,000 | ) | 100,000 | (50,000 | ) | 100,000 | ||||||||||
| (1) | The Fund commenced operations on February 21, 2023. |
The accompanying notes are an integral part of the financial statements.
178
![]()
Statements of Changes in Net Assets
| Global X Dow 30® Covered Call & Growth ETF | Global X MSCI Emerging Markets Covered Call ETF | |||||||||||
| Period Ended April 30, 2024 (Unaudited) | Period Ended October 31, 2023(1) | Period Ended April 30, 2024(2) (Unaudited) | ||||||||||
| Operations: | ||||||||||||
| Net Investment Income | $ | 19,639 | $ | 9,566 | $ | 20,802 | ||||||
| Net Realized Gain (Loss) | (73,493 | ) | 29,838 | (41,431 | ) | |||||||
| Net Change in Unrealized Appreciation (Depreciation) | 349,960 | (176,521 | ) | 73,095 | ||||||||
| Net Increase (Decrease) in Net Assets Resulting from Operations | 296,106 | (137,117 | ) | 52,466 | ||||||||
| Distributions: | (40,860 | ) | (9,566 | ) | (90,788 | ) | ||||||
| Return of Capital: | — | (13,830 | ) | — | ||||||||
| Capital Share Transactions: | ||||||||||||
| Issued | — | 2,580,999 | 3,242,858 | |||||||||
| Redeemed | — | — | (1,246,079 | ) | ||||||||
| Increase in Net Assets from Capital Share Transactions | — | 2,580,999 | 1,996,779 | |||||||||
| Total Increase in Net Assets | 255,246 | 2,420,486 | 1,958,457 | |||||||||
| Net Assets: | ||||||||||||
| Beginning of Period | 2,420,486 | — | — | |||||||||
| End of Period | $ | 2,675,732 | $ | 2,420,486 | $ | 1,958,457 | ||||||
| Share Transactions: | ||||||||||||
| Issued | — | 100,000 | 130,000 | |||||||||
| Redeemed | — | — | (50,000 | ) | ||||||||
| Net Increase in Shares Outstanding from Share Transactions | — | 100,000 | 80,000 | |||||||||
| (1) | The Fund commenced operations on July 25, 2023. |
| (2) | The Fund commenced operations on November 7, 2023. |
The accompanying notes are an integral part of the financial statements.
179
![]()
| Selected Per Share Data & Ratios |
| For a Share Outstanding Throughout the Period |
| Net Asset Value, Beginning of Period ($) | Net Investment Income ($)* | Net Realized and Unrealized Gain (Loss) on Investments ($) | Total from Operations ($) | Distribution from Net Investment Income ($) | Distribution from Capital Gains ($) | Return of Capital ($) | ||||||||||||||||||||||
| Global X S&P 500® Covered Call ETF (1) | ||||||||||||||||||||||||||||
| 2024 (Unaudited) | 38.18 | 0.19 | 3.32 | 3.51 | (1.83 | ) | — | — | ||||||||||||||||||||
| 2023 | 40.00 | 0.43 | 2.13 | 2.56 | (0.14 | ) | — | (4.24 | ) | |||||||||||||||||||
| 2022 | 50.37 | 0.45 | (5.50 | ) | (5.05 | ) | (1.05 | ) | (0.11 | ) | (4.16 | ) | ||||||||||||||||
| 2021 | 42.45 | 0.39 | 12.14 | 12.53 | (4.61 | ) | — | — | ||||||||||||||||||||
| 2020 | 49.39 | 0.56 | (4.17 | ) | (3.61 | ) | (0.58 | ) | — | (2.75 | ) | |||||||||||||||||
| 2019 | 48.56 | 0.56 | 3.30 | 3.86 | (2.27 | ) | (0.39 | ) | (0.37 | ) | ||||||||||||||||||
| Global X NASDAQ 100® Covered Call ETF (1) | ||||||||||||||||||||||||||||
| 2024 (Unaudited) | 16.60 | 0.04 | 1.77 | 1.81 | (1.03 | ) | — | — | ||||||||||||||||||||
| 2023 | 16.15 | 0.05 | 2.44 | 2.49 | — | — | (2.04 | ) | ||||||||||||||||||||
| 2022 | 22.82 | 0.05 | (4.13 | ) | (4.08 | ) | (0.24 | ) | (0.50 | ) | (1.85 | ) | ||||||||||||||||
| 2021 | 20.65 | 0.02 | 4.73 | 4.75 | (2.58 | ) | — | — | ||||||||||||||||||||
| 2020 | 23.10 | 0.06 | (0.06 | ) | — | (0.06 | ) | — | (2.39 | ) | ||||||||||||||||||
| 2019 | 23.45 | 0.06 | 1.95 | 2.01 | (1.83 | ) | — | (0.53 | ) | |||||||||||||||||||
| Global X Russell 2000 Covered Call ETF | ||||||||||||||||||||||||||||
| 2024 (Unaudited) | 16.10 | 0.06 | 1.13 | 1.19 | (0.99 | ) | — | — | ||||||||||||||||||||
| 2023 | 19.55 | 0.19 | (1.47 | ) | (1.28 | ) | (0.03 | ) | — | (2.14 | ) | |||||||||||||||||
| 2022 | 25.18 | 0.19 | (3.10 | ) | (2.91 | ) | (0.44 | ) | (0.31 | ) | (1.97 | ) | ||||||||||||||||
| 2021 | 20.45 | 0.13 | 7.50 | 7.63 | (2.90 | ) | — | — | ||||||||||||||||||||
| 2020 | 25.24 | 0.12 | (2.51 | ) | (2.39 | ) | (0.11 | ) | (0.17 | ) | (2.12 | ) | ||||||||||||||||
| 2019(6) | 25.00 | 0.09 | 1.37 | 1.46 | (1.22 | ) | — | — | ||||||||||||||||||||
| * | Per share data calculated using average shares method. |
| ** | Total Return is for the period indicated and has not been annualized. The return shown does not reflect the deduction of taxes that a shareholder would pay on Fund distributions or the redemption of Fund shares. |
| † | Annualized. |
| †† | Portfolio turnover rate is for the period indicated and periods of less than one year have not been annualized. Excludes effect of in-kind transfers. |
| (1) | The financial statements include the financial information of the Predecessor Funds through December 21, 2018 (See Note 1 in Notes to Financial Statements). As a result of the Reorganization, the Fund assumed the performance and accounting history of the Predecessor Fund. Accordingly, performance figures for the Fund for periods prior to the date of the Reorganization represent the performance of the Predecessor Fund. |
| (2) | Excluding broker fees on written options, the ratio of expenses to average net assets would have been 0.64% and 0.65% for the year ended October 31, 2020 and year ended October 31, 2019, respectively. The ratio of Expenses to Average Net Assets includes the effect of a waiver. If these offsets were excluded, the ratio would have been 0.64% and 0.65% for the year ended October 31, 2020 and year ended October 31, 2019. |
| (3) | Excluding broker fees on written options, the ratio of expenses to average net assets would have been 0.60% and 0.60% for the year ended October 31, 2020 and October 31, 2019, respectively. The ratio of Expenses to Average Net Assets includes the effect of a waiver. If these offsets were excluded, the ratio would have been 0.60% and 0.60% for the year ended October 31, 2020 and year ended October 31, 2019. |
| (4) | The ratio of Expenses to Average Net Assets includes the effect of a waiver due to acquired fund fees and expenses. The ratio to Average Net Assets does not include acquired fund fees and expenses of the underlying investments, if applicable. If these offsets were excluded, the ratio would have been 0.60%, 0.60%, 0.60%, 0.68% and 0.97% for the year ended October 31, 2023 to the year ended October 31, 2019, respectively. |
The accompanying notes are an integral part of the financial statements.
180
![]()
Financial Highlights
| Total from Distributions ($) | Net Asset Value, End of Period ($) | Total Return (%)** | Net Assets, End of Period ($)(000) | Ratio of Expenses to Average Net Assets (%) | Ratio of Net Investment Income to Average Net Assets (%) | Portfolio Turnover (%)†† | ||||||||||||||||||||
| (1.83 | ) | 39.86 | 9.32 | 2,787,818 | 0.60 | † | 0.97 | † | 1.62 | |||||||||||||||||
| (4.38 | ) | 38.18 | 6.45 | 2,805,206 | 0.60 | 1.07 | 7.90 | |||||||||||||||||||
| (5.32 | ) | 40.00 | (10.72 | ) | 1,934,545 | 0.60 | 1.00 | 15.60 | ||||||||||||||||||
| (4.61 | ) | 50.37 | 30.67 | 669,855 | 0.60 | 0.80 | 4.84 | |||||||||||||||||||
| (3.33 | ) | 42.45 | (7.42 | ) | 103,992 | 0.71 | (2) | 1.22 | 7.29 | |||||||||||||||||
| (3.03 | ) | 49.39 | 8.40 | 133,353 | 0.87 | (2) | 1.16 | 3.92 | ||||||||||||||||||
| (1.03 | ) | 17.38 | 11.07 | 7,947,497 | 0.60 | † | 0.43 | † | 13.02 | |||||||||||||||||
| (2.04 | ) | 16.60 | 15.91 | 7,521,213 | 0.61 | 0.31 | 38.93 | |||||||||||||||||||
| (2.59 | ) | 16.15 | (19.18 | ) | 6,397,648 | 0.60 | 0.25 | 31.11 | ||||||||||||||||||
| (2.58 | ) | 22.82 | 23.89 | 5,036,215 | 0.60 | 0.11 | 19.99 | |||||||||||||||||||
| (2.45 | ) | 20.65 | 0.21 | 1,325,642 | 0.67 | (3) | 0.27 | 27.87 | ||||||||||||||||||
| (2.36 | ) | 23.10 | 9.39 | 768,036 | 0.85 | (3) | 0.26 | 11.82 | ||||||||||||||||||
| (0.99 | ) | 16.30 | 7.52 | 1,388,733 | 0.58 | † | 0.75 | † | 7.15 | |||||||||||||||||
| (2.17 | ) | 16.10 | (7.18 | ) | 1,406,038 | 0.57 | (4) | 1.04 | 19.24 | |||||||||||||||||
| (2.72 | ) | 19.55 | (12.18 | ) | 1,342,241 | 0.55 | (4)(5) | 0.86 | 186.48 | |||||||||||||||||
| (2.90 | ) | 25.18 | 38.82 | 554,446 | 0.50 | (4) | 0.53 | 8.94 | ||||||||||||||||||
| (2.40 | ) | 20.45 | (9.18 | ) | 21,475 | 0.56 | (4) | 0.68 | 11.16 | |||||||||||||||||
| (1.22 | ) | 25.24 | 5.99 | 8,833 | 0.82 | †(4) | 0.68 | † | 5.82 | |||||||||||||||||
| (5) | Includes fees charged by the Fund custodian that were reimbursed by the custodian to the Fund subsequent to the reporting period. Excluding these fees, the ratio to average net assets would have been 0.54%. |
| (6) | The Fund commenced operations on April 17, 2019. |
Amounts designated as “—” are either $0 or have been rounded to $0.
The accompanying notes are an integral part of the financial statements.
181
![]()
Financial Highlights
| Selected Per Share Data & Ratios |
| For a Share Outstanding Throughout the Period |
| Net Asset Value, Beginning of Period ($) | Net Investment Income (Loss) ($)* | Net Realized and Unrealized Gain (Loss) on Investments ($) | Total from Operations ($) | Distribution from Net Investment Income ($) | Distribution from Capital Gains ($) | Return of Capital ($) | ||||||||||||||||||||||
| Global X Nasdaq 100® Covered Call & Growth ETF | ||||||||||||||||||||||||||||
| 2024 (Unaudited) | 26.07 | 0.06 | 4.16 | 4.22 | (0.88 | ) | — | — | ||||||||||||||||||||
| 2023 | 22.80 | 0.07 | 4.73 | 4.80 | — | — | (1.53 | ) | ||||||||||||||||||||
| 2022 | 33.09 | 0.06 | (7.29 | ) | (7.23 | ) | (0.20 | ) | (1.60 | ) | (1.26 | ) | ||||||||||||||||
| 2021 | 26.27 | 0.02 | 8.56 | 8.58 | (1.76 | ) | — | — | ||||||||||||||||||||
| 2020(2) | 26.30 | — | 0.11 | 0.11 | — | — | (0.14 | ) | ||||||||||||||||||||
| Global X S&P 500® Covered Call & Growth ETF | ||||||||||||||||||||||||||||
| 2024 (Unaudited) | 26.07 | 0.14 | 3.74 | 3.88 | (0.66 | ) | — | — | ||||||||||||||||||||
| 2023 | 25.47 | 0.28 | 1.75 | 2.03 | (0.19 | ) | — | (1.24 | ) | |||||||||||||||||||
| 2022 | 31.83 | 0.27 | (4.03 | ) | (3.76 | ) | (0.42 | ) | (1.10 | ) | (1.08 | ) | ||||||||||||||||
| 2021 | 24.69 | 0.22 | 8.29 | 8.51 | (1.37 | ) | — | — | ||||||||||||||||||||
| 2020(2) | 25.22 | 0.02 | (0.41 | ) | (0.39 | ) | (0.02 | ) | — | (0.12 | ) | |||||||||||||||||
| Global X NASDAQ 100® Risk Managed Income ETF | ||||||||||||||||||||||||||||
| 2024 (Unaudited) | 16.64 | 0.04 | 1.11 | 1.15 | (1.03 | ) | — | — | ||||||||||||||||||||
| 2023 | 18.17 | 0.05 | 0.58 | 0.63 | — | — | (2.16 | ) | ||||||||||||||||||||
| 2022 | 24.12 | 0.04 | (4.04 | ) | (4.00 | ) | (0.25 | ) | — | (1.70 | ) | |||||||||||||||||
| 2021(4) | 24.60 | (0.01 | ) | (0.16 | ) | (0.17 | ) | — | — | (0.31 | ) | |||||||||||||||||
| * | Per share data calculated using average shares method. |
| ** | Total Return is for the period indicated and has not been annualized. The return shown does not reflect the deduction of taxes that a shareholder would pay on Fund distributions or the redemption of Fund shares. |
| † | Annualized. |
| †† | Portfolio turnover rate is for the period indicated and periods of less than one year have not been annualized. Excludes effect of in-kind transfers. |
| (1) | Includes fees charged by the Fund custodian that were reimbursed by the custodian to the Fund subsequent to the reporting period. Excluding these fees, the ratio to average net assets would have been 0.60%. |
| (2) | The Fund commenced operations on September 18, 2020. |
| (3) | Includes fees charged by the Fund custodian that were reimbursed by the custodian to the Fund subsequent to the reporting period. Excluding these fees, the ratio to average net assets would have been 0.60% and 0.61%. |
| (4) | The Fund commenced operations on August 25, 2021. |
Amounts designated as “—” are either $0 or have been rounded to $0.
The accompanying notes are an integral part of the financial statements.
182
![]()
Financial Highlights
| Total from Distributions ($) | Net Asset Value, End of Period ($) | Total Return (%)** | Net Assets, End of Period ($)(000) | Ratio of Expenses to Average Net Assets (%) | Ratio of Net Investment Income (Loss) to Average Net Assets (%) | Portfolio Turnover (%)†† | ||||||||||||||||||||
| (0.88 | ) | 29.41 | 16.23 | 114,422 | 0.57 | † | 0.43 | † | 10.43 | |||||||||||||||||
| (1.53 | ) | 26.07 | 21.43 | 102,179 | 0.60 | 0.27 | 28.03 | |||||||||||||||||||
| (3.06 | ) | 22.80 | (23.57 | ) | 61,105 | 0.61 | (1) | 0.23 | 18.12 | |||||||||||||||||
| (1.76 | ) | 33.09 | 33.42 | 44,671 | 0.60 | 0.06 | 11.21 | |||||||||||||||||||
| (0.14 | ) | 26.27 | 0.40 | 6,568 | 0.60 | † | (0.10 | )† | 1.65 | |||||||||||||||||
| (0.66 | ) | 29.29 | 14.95 | 67,083 | 0.57 | † | 0.97 | † | 1.25 | |||||||||||||||||
| (1.43 | ) | 26.07 | 8.01 | 61,006 | 0.60 | 1.05 | 5.25 | |||||||||||||||||||
| (2.60 | ) | 25.47 | (12.63 | ) | 41,511 | 0.61 | (1) | 0.94 | 9.36 | |||||||||||||||||
| (1.37 | ) | 31.83 | 35.18 | 35,018 | 0.60 | 0.74 | 12.17 | |||||||||||||||||||
| (0.14 | ) | 24.69 | (1.60 | ) | 3,704 | 0.60 | † | 0.75 | † | 0.75 | ||||||||||||||||
| (1.03 | ) | 16.76 | 6.96 | 13,074 | 0.61 | † | 0.41 | † | 6.35 | |||||||||||||||||
| (2.16 | ) | 16.64 | 3.42 | 11,813 | 0.61 | (3) | 0.30 | 22.73 | ||||||||||||||||||
| (1.95 | ) | 18.17 | (17.24 | ) | 10,720 | 0.62 | (3) | 0.19 | 27.40 | |||||||||||||||||
| (0.31 | ) | 24.12 | (0.69 | ) | 4,341 | 0.60 | † | (0.15 | )† | 2.16 | ||||||||||||||||
The accompanying notes are an integral part of the financial statements.
183
![]()
Financial Highlights
| Selected Per Share Data & Ratios |
| For a Share Outstanding Throughout the Period |
| Net Asset Value, Beginning of Period ($) | Net Investment Income (Loss) ($)* | Net Realized and Unrealized Gain (Loss) on Investments ($) | Total from Operations ($) | Distribution from Net Investment Income ($) | Distribution from Capital Gains ($) | Return of Capital ($) | ||||||||||||||||||||||
| Global X S&P 500® Risk Managed Income ETF | ||||||||||||||||||||||||||||
| 2024 (Unaudited) | 18.56 | 0.09 | 1.23 | 1.32 | (1.14 | ) | — | — | ||||||||||||||||||||
| 2023 | 21.05 | 0.22 | (0.29 | ) | (0.07 | ) | (0.03 | ) | — | (2.39 | ) | |||||||||||||||||
| 2022 | 26.83 | 0.23 | (3.38 | ) | (3.15 | ) | (0.52 | ) | (0.07 | ) | (2.04 | ) | ||||||||||||||||
| 2021(2) | 26.77 | 0.03 | 0.39 | 0.42 | (0.36 | ) | — | — | ||||||||||||||||||||
| Global X Dow 30® Covered Call ETF | ||||||||||||||||||||||||||||
| 2024 (Unaudited) | 20.89 | 0.16 | 1.75 | 1.91 | (0.69 | ) | — | — | ||||||||||||||||||||
| 2023 | 21.89 | 0.34 | 0.38 | 0.72 | (0.18 | ) | — | (1.54 | ) | |||||||||||||||||||
| 2022(3) | 24.13 | 0.22 | (0.86 | ) | (0.64 | ) | (0.64 | ) | — | (0.96 | ) | |||||||||||||||||
| Global X Russell 2000 Covered Call & Growth ETF | ||||||||||||||||||||||||||||
| 2024 (Unaudited) | 22.38 | 0.14 | 2.88 | 3.02 | (0.86 | ) | — | — | ||||||||||||||||||||
| 2023 | 26.58 | 0.28 | (2.31 | ) | (2.03 | ) | (0.17 | ) | (0.82 | ) | (1.18 | ) | ||||||||||||||||
| 2022(6) | 25.90 | (0.01 | ) | 0.82 | 0.81 | (0.13 | ) | — | — | |||||||||||||||||||
| * | Per share data calculated using average shares method. |
| ** | Total Return is for the period indicated and has not been annualized. The return shown does not reflect the deduction of taxes that a shareholder would pay on Fund distributions or the redemption of Fund shares. |
| † | Annualized. |
| †† | Portfolio turnover rate is for the period indicated and periods of less than one year have not been annualized. Excludes effect of in-kind transfers. |
| (1) | Includes fees charged by the Fund custodian that were reimbursed by the custodian to the Fund subsequent to the reporting period. Excluding these fees, the ratio to average net assets would have been 0.61%. |
| (2) | The Fund commenced operations on August 25, 2021. |
| (3) | The Fund commenced operations on February 23, 2022. |
| (4) | Includes fees charged by the Fund custodian that were reimbursed by the custodian to the Fund subsequent to the reporting period. Excluding these fees, the ratio to average net assets would have been 0.60%. |
| (5) | The ratio of Expenses to Average Net Assets includes the effect of a waiver due to acquired fund fees and expenses. The ratio to Average Net Assets does not include acquired fund fees and expenses of the underlying investments, if applicable. If these offsets were excluded, the ratio would have been 0.60% and 0.60% for the year ended October 31, 2023 and the year ended October 31, 2022, respectively. |
| (6) | The Fund commenced operations on October 4, 2022. |
Amounts designated as “—” are either $0 or have been rounded to $0.
The accompanying notes are an integral part of the financial statements.
184
![]()
Financial Highlights
| Total from Distributions ($) | Net Asset Value, End of Period ($) | Total Return (%)** | Net Assets, End of Period ($)(000) | Ratio of Expenses to Average Net Assets (%) | Ratio of Net Investment Income (Loss) to Average Net Assets (%) | Portfolio Turnover (%)†† | ||||||||||||||||||||
| (1.14 | ) | 18.74 | 7.22 | 33,536 | 0.60 | † | 0.95 | † | 1.01 | |||||||||||||||||
| (2.42 | ) | 18.56 | (0.61 | ) | 27,098 | 0.60 | 1.08 | 4.85 | ||||||||||||||||||
| (2.63 | ) | 21.05 | (12.39 | ) | 24,634 | 0.63 | (1) | 0.97 | 21.62 | |||||||||||||||||
| (0.36 | ) | 26.83 | 1.60 | 5,902 | 0.60 | † | 0.57 | † | 7.08 | |||||||||||||||||
| (0.69 | ) | 22.11 | 9.21 | 83,344 | 0.60 | † | 1.47 | † | 4.89 | |||||||||||||||||
| (1.72 | ) | 20.89 | 3.30 | 78,947 | 0.60 | 1.55 | 6.67 | |||||||||||||||||||
| (1.60 | ) | 21.89 | (2.77 | ) | 52,985 | 0.61 | †(4) | 1.42 | † | 8.82 | ||||||||||||||||
| (0.86 | ) | 24.54 | 3.05 | 7,608 | 0.48 | † | 1.16 | † | 13.54 | |||||||||||||||||
| (2.17 | ) | 22.38 | (8.16 | ) | 8,279 | 0.50 | (5) | 1.11 | 5.48 | |||||||||||||||||
| (0.13 | ) | 26.58 | 3.14 | 2,658 | 0.50 | †(5) | (0.50 | )† | — | |||||||||||||||||
The accompanying notes are an integral part of the financial statements.
185
![]()
Financial Highlights
| Selected Per Share Data & Ratios |
| For a Share Outstanding Throughout the Period |
| Net Asset Value, Beginning of Period ($) | Net Investment Income ($)* | Net Realized and Unrealized Gain (Loss) on Investments ($) | Total from Operations ($) | Distribution from Net Investment Income ($) | Distribution from Capital Gains ($) | Return of Capital ($) | ||||||||||||||||||||||
| Global X Financials Covered Call & Growth ETF | ||||||||||||||||||||||||||||
| 2024 (Unaudited) | 22.30 | 0.16 | 3.70 | 3.86 | (0.56 | ) | — | — | ||||||||||||||||||||
| 2023(1) | 24.88 | 0.35 | (1.66 | ) | (1.31 | ) | (0.85 | ) | — | (0.42 | ) | |||||||||||||||||
| Global X Health Care Covered Call & Growth ETF | ||||||||||||||||||||||||||||
| 2024 (Unaudited) | 23.42 | 0.14 | 2.29 | 2.43 | (0.52 | ) | (0.59 | ) | — | |||||||||||||||||||
| 2023(1) | 25.06 | 0.27 | (0.75 | ) | (0.48 | ) | (1.16 | ) | — | — | ||||||||||||||||||
| Global X Information Technology Covered Call & Growth ETF | ||||||||||||||||||||||||||||
| 2024 (Unaudited) | 28.86 | 0.03 | 4.21 | 4.24 | (1.96 | ) | (0.95 | ) | — | |||||||||||||||||||
| 2023(1) | 24.74 | 0.11 | 5.55 | 5.66 | (1.54 | ) | — | — | ||||||||||||||||||||
| * | Per share data calculated using average shares method. |
| ** | Total Return is for the period indicated and has not been annualized. The return shown does not reflect the deduction of taxes that a shareholder would pay on Fund distributions or the redemption of Fund shares. |
| † | Annualized. |
| †† | Portfolio turnover rate is for the period indicated and periods of less than one year have not been annualized. Excludes effect of in-kind transfers. |
| (1) | The Fund commenced operations on November 21, 2022. |
| (2) | The ratio of Expenses to Average Net Assets includes the effect of a waiver due to acquired fund fees and expenses. The ratio to Average Net Assets does not include acquired fund fees and expenses of the underlying investments, if applicable. If these offsets were excluded, the ratio would have been 0.60% for the year ended October 31, 2023. |
Amounts designated as “—” are either $0 or have been rounded to $0.
The accompanying notes are an integral part of the financial statements.
186
![]()
Financial Highlights
| Total from Distributions ($) | Net Asset Value, End of Period ($) | Total Return (%)** | Net Assets, End of Period ($)(000) | Ratio of Expenses to Average Net Assets (%) | Ratio of Net Investment Income to Average Net Assets (%) | Portfolio Turnover (%)†† | ||||||||||||||||||||
| (0.56 | ) | 25.60 | 17.41 | 2,560 | 0.55 | † | 1.26 | † | 1.44 | |||||||||||||||||
| (1.27 | ) | 22.30 | (5.40 | ) | 2,230 | 0.54 | †(2) | 1.55 | † | 16.45 | ||||||||||||||||
| (1.11 | ) | 24.74 | 10.46 | 2,721 | 0.55 | † | 1.14 | † | 1.42 | |||||||||||||||||
| (1.16 | ) | 23.42 | (2.05 | ) | 2,577 | 0.55 | †(2) | 1.16 | † | 6.85 | ||||||||||||||||
| (2.91 | ) | 30.19 | 14.84 | 6,641 | 0.55 | † | 0.21 | † | 4.11 | |||||||||||||||||
| (1.54 | ) | 28.86 | 23.27 | 3,463 | 0.55 | †(2) | 0.42 | † | 13.93 | |||||||||||||||||
The accompanying notes are an integral part of the financial statements.
187
![]()
Financial Highlights
| Selected Per Share Data & Ratios |
| For a Share Outstanding Throughout the Period |
| Net Asset Value, Beginning of Period ($) | Net Investment Income ($)* | Net Realized and Unrealized Gain (Loss) on Investments ($) | Total from Operations ($) | Distribution from Net Investment Income ($) | Distribution from Capital Gains ($) | Return of Capital ($) | ||||||||||||||||||||||
| Global X NASDAQ 100 ESG Covered Call ETF | ||||||||||||||||||||||||||||
| 2024 (Unaudited) | 24.77 | 0.04 | 2.61 | 2.65 | (1.22 | ) | (0.31 | ) | — | |||||||||||||||||||
| 2023(1) | 24.46 | 0.04 | 2.33 | 2.37 | (2.06 | ) | — | — | ||||||||||||||||||||
| Global X S&P 500 ESG Covered Call ETF | ||||||||||||||||||||||||||||
| 2024 (Unaudited) | 23.79 | 0.11 | 2.46 | 2.57 | (0.84 | ) | — | — | ||||||||||||||||||||
| 2023(1) | 24.65 | 0.17 | 0.28 | 0.45 | (0.45 | ) | — | (0.86 | ) | |||||||||||||||||||
| Global X Dow 30® Covered Call & Growth ETF | ||||||||||||||||||||||||||||
| 2024 (Unaudited) | 24.20 | 0.20 | 2.77 | 2.97 | (0.41 | ) | — | — | ||||||||||||||||||||
| 2023(2) | 25.81 | 0.10 | (1.48 | ) | (1.38 | ) | (0.09 | ) | — | (0.14 | ) | |||||||||||||||||
| * | Per share data calculated using average shares method. |
| ** | Total Return is for the period indicated and has not been annualized. The return shown does not reflect the deduction of taxes that a shareholder would pay on Fund distributions or the redemption of Fund shares. |
| † | Annualized. |
| †† | Portfolio turnover rate is for the period indicated and periods of less than one year have not been annualized. Excludes effect of in-kind transfers. |
| (1) | The Fund commenced operations on February 21, 2023. |
| (2) | The Fund commenced operations on July 25, 2023. |
Amounts designated as “—” are either $0 or have been rounded to $0.
The accompanying notes are an integral part of the financial statements.
188
![]()
Financial Highlights
| Total from Distributions ($) | Net Asset Value, End of Period ($) | Total Return (%)** | Net Assets, End of Period ($)(000) | Ratio of Expenses to Average Net Assets (%) | Ratio of Net Investment Income to Average Net Assets (%) | Portfolio Turnover (%)†† | ||||||||||||||||||||
| (1.53 | ) | 25.89 | 10.85 | 2,330 | 0.60 | † | 0.31 | † | 12.67 | |||||||||||||||||
| (2.06 | ) | 24.77 | 9.67 | 2,478 | 0.61 | † | 0.21 | † | 11.82 | |||||||||||||||||
| (0.84 | ) | 25.52 | 10.89 | 1,276 | 0.60 | † | 0.90 | † | 10.27 | |||||||||||||||||
| (1.31 | ) | 23.79 | 1.79 | 2,379 | 0.60 | † | 1.00 | † | 13.87 | |||||||||||||||||
| (0.41 | ) | 26.76 | 12.28 | 2,676 | 0.57 | † | 1.48 | † | 4.57 | |||||||||||||||||
| (0.23 | ) | 24.20 | (5.35 | ) | 2,421 | 0.60 | † | 1.43 | † | 0.21 | ||||||||||||||||
The accompanying notes are an integral part of the financial statements.
189
![]()
Financial Highlights
| Selected Per Share Data & Ratios |
| For a Share Outstanding Throughout the Period |
| Net Asset Value, Beginning of Period ($) | Net Investment Income ($)* | Net Realized and Unrealized Gain on Investments ($) | Total from Operations ($) | Distribution from Net Investment Income ($) | Distribution from Capital Gains ($) | Return of Capital ($) | ||||||||||||||||||||||
| Global X MSCI Emerging Markets Covered Call ETF | ||||||||||||||||||||||||||||
| 2024 (Unaudited)(1) | 25.01 | 0.33 | 0.53 | 0.86 | (1.39 | ) | — | — | ||||||||||||||||||||
| * | Per share data calculated using average shares method. |
| ** | Total Return is for the period indicated and has not been annualized. The return shown does not reflect the deduction of taxes that a shareholder would pay on Fund distributions or the redemption of Fund shares. |
| † | Annualized. |
| †† | Portfolio turnover rate is for the period indicated and periods of less than one year have not been annualized. Excludes effect of in-kind transfers. |
| (1) | The Fund commenced operations on November 7, 2023. |
Amounts designated as “—” are either $0 or have been rounded to $0.
The accompanying notes are an integral part of the financial statements.
190
![]()
Financial Highlights
| Total from Distributions ($) | Net Asset Value, End of Period ($) | Total Return (%)** | Net Assets, End of Period ($)(000) | Ratio of Expenses to Average Net Assets (%) | Ratio of Net Investment Income to Average Net Assets (%) | Portfolio Turnover (%)†† | ||||||||||||||||||||
| (1.39 | ) | 24.48 | 3.57 | 1,958 | 0.51 | † | 2.76 | † | 3.17 | |||||||||||||||||
The accompanying notes are an integral part of the financial statements.
191
![]()
April 30, 2024 (Unaudited)
1. ORGANIZATION
The Global X Funds (the “Trust”) is a Delaware statutory trust formed on March 6, 2008. The Trust is registered under the Investment Company Act of 1940 (the “1940 Act”), as amended, as an open-end management investment company. As of April 30, 2024, the Trust had ninety-seven portfolios, ninety-one of which were operational. The financial statements herein and the related notes pertain to the Global X S&P 500® Covered Call ETF, Global X NASDAQ 100® Covered Call ETF, Global X Russell 2000 Covered Call ETF, Global X Nasdaq 100® Covered Call & Growth ETF, Global X S&P 500® Covered Call & Growth ETF, Global X NASDAQ 100® Risk Managed Income ETF, Global X S&P 500® Risk Managed Income ETF, Global X Dow 30® Covered Call ETF, Global X Russell 2000 Covered Call & Growth ETF, Global X Financials Covered Call & Growth ETF, Global X Health Care Covered Call & Growth ETF, Global X Information Technology Covered Call & Growth ETF, Global X Nasdaq 100 ESG Covered Call ETF, Global X S&P 500 ESG Covered Call ETF, Global X Dow 30® Covered Call & Growth ETF and Global X MSCI Emerging Markets Covered Call ETF (each a “Fund”, collectively, the “Funds”).
Each Fund (except the Global X Russell 2000 Covered Call ETF, Global X Dow 30® Covered Call ETF, Global X S&P 500® Covered Call ETF, Global X S&P 500® Covered Call & Growth ETF and Global X S&P 500® Risk Managed Income ETF) has elected non-diversified status under the 1940 Act
Global X Financials Covered Call & Growth ETF commenced operations on November 21, 2022.
Global X Health Care Covered Call & Growth ETF commenced operations on November 21, 2022.
Global X Information Technology Covered Call & Growth ETF commenced operations on November 21, 2022.
Global X Nasdaq 100 ESG Covered Call ETF commenced operations on February 21, 2023.
Global X S&P 500 ESG Covered Call ETF commenced operations on February 21, 2023.
Global X Dow 30® Covered Call & Growth ETF commenced operations on July 25, 2023.
Global X MSCI Emerging Markets Covered Call ETF commenced operations on November 7, 2023.
On December 24, 2018, the shareholders of the Horizons NASDAQ 100® Covered Call ETF and Horizons S&P 500® Covered Call ETF (each, a “Predecessor Fund” and together, the “Predecessor Funds”) approved a proposed agreement and plan of reorganization (the “Reorganization”) that provided for (a) the transfer of all the assets and assumption of certain of the liabilities of each Predecessor Fund to the Global X Nasdaq 100® Covered
192
![]()
Notes to Financial Statements (Continued)
April 30, 2024 (Unaudited)
1. ORGANIZATION (continued)
Call ETF and the Global X S&P 500® Covered Call ETF (together, the “Successor Funds”), respectively; (b) the issuance of shares of the Successor Fund to the shareholders of the corresponding Predecessor Fund; and (c) the liquidation and termination of the Predecessor Funds. The effective date of the Reorganization of each Predecessor Fund was December 24, 2018. The Successor Funds had no operations prior to the Reorganization. The Predecessor Funds had substantially similar investment objectives, investment strategies, policies and restrictions as those of the Successor Funds. The financial highlights include the financial information of the Predecessor Funds through December 21, 2018.
2. SIGNIFICANT ACCOUNTING POLICIES
The following is a summary of the significant accounting policies followed by the Funds:
USE OF ESTIMATES – The Funds are investment companies that apply the accounting and reporting guidance issued in Topic 946 by the U.S. Financial Accounting Standards Board. The preparation of financial statements in conformity with U.S. generally accepted accounting principles (“U.S. GAAP”) requires management to make estimates and assumptions that affect the reported amounts of assets and liabilities and disclosure of contingent assets and liabilities at the date of the financial statements and the reported amounts of increases and decreases in net assets from operations during the reporting period. Actual results could materially differ from those estimates.
RETURN OF CAPITAL ESTIMATES – Distributions received by the Funds from underlying master limited partnership (“MLP”) and real estate investment trust (“REIT”) investments generally are comprised of income and return of capital. The Funds record investment income and return of capital based on estimates made at the time such distributions are received. Such estimates are based on historical information available from the MLPs, REITs and other industry sources. These estimates may subsequently be revised based on information received from the MLPs and REITs after their tax reporting periods are concluded.
MLPs – Certain Funds may invest in MLPs. MLPs are publicly traded partnerships engaged in the transportation, storage and processing of minerals and natural resources. By confining their operations to these specific activities, their interests, or units, are able to trade on public securities exchanges exactly like the shares of a corporation, without entity level taxation. To qualify as an MLP and to not be taxed as a corporation, a partnership must receive at least 90% of its income from qualifying sources as set forth in Section 7704(d) of the Internal Revenue Code of 1986, as amended (the “Code”). These qualifying sources include natural resource-based activities such as the processing, transportation and storage of mineral or natural resources. MLPs generally have two classes of owners: the general partner and limited partners. The general partner of an MLP is typically owned by a major energy company, an investment fund, the direct management of the MLP, or is an
193
![]()
Notes to Financial Statements (Continued)
April 30, 2024 (Unaudited)
2. SIGNIFICANT ACCOUNTING POLICIES (continued)
entity owned by one or more of such parties. The general partner may be structured as a private or publicly traded corporation or other entity.
The general partner typically controls the operations and management of the MLP through an up to 2% equity interest in the MLP plus, in many cases, ownership of common units and subordinated units.
Limited partners typically own the remainder of the partnership through ownership of common units, and have a limited role in the partnership’s operations and management. MLPs are typically structured such that common units and general partner interests have first priority to receive quarterly cash distributions up to an established minimum amount (“minimum quarterly distributions” or “MQD”). Common and general partner interests also accrue arrearages in distributions to the extent the MQD is not paid. Once common and general partner interests have been paid, subordinated units receive distributions of up to the MQD; however, subordinated units do not accrue arrearages. Distributable cash in excess of the MQD is paid to both common and subordinated units and is distributed to both common and subordinated units generally on a pro rata basis. The general partner is also eligible to receive incentive distributions if the general partner operates the business in a manner which results in distributions paid per common unit surpassing specified target levels. As the general partner increases cash distributions to the limited partners, the general partner receives an increasingly higher percentage of the incremental cash distributions.
SECURITY VALUATION - Securities listed on a securities exchange, market or automated quotation system for which quotations are readily available (except for securities traded on the NASDAQ Stock Market (“NASDAQ”)), including securities traded over the counter, are valued at the last quoted sale price on the primary exchange or market (foreign or domestic) on which they are traded (or at approximately 4:00 pm Eastern Time if a security’s primary exchange is normally open at that time), or, if there is no such reported sale, at the most recent mean between the quoted bid and asked prices, which approximates fair value (absent both bid and asked prices on such exchange, the bid price may be used).
For securities traded on NASDAQ, the NASDAQ Official Closing Price will be used. The prices for foreign securities are reported in local currency and converted to U.S. dollars using currency exchange rates as of the reporting date. The exchange rates used by the Trust for valuation are captured as of the New York or London close each day.
Options traded on an exchange will be valued at the mean of the bid and ask quotations for the current day at the close of the market. If either the bid or the ask is not available, the last closing price will be used.
Securities for which market prices are not “readily available” are valued in accordance with fair value procedures (the “Fair Value Procedures”) established by Global X Management Company LLC, the Funds’ investment adviser (the “Adviser”), and approved by the Funds’
194
![]()
Notes to Financial Statements (Continued)
April 30, 2024 (Unaudited)
2. SIGNIFICANT ACCOUNTING POLICIES (continued)
Board of Trustees (the “Board”). Pursuant to Rule 2a-5 under the 1940 Act, the Board has designated the Adviser as the “valuation designee” to determine the fair value of securities and other instruments for which no readily available market quotations are available. The Fair Value Procedures are implemented through a fair value committee (the “Committee”) of the Adviser. Some of the more common reasons that may necessitate that a security be valued using the Fair Value Procedures include: the security’s trading has been halted or suspended; the security has been de-listed from its primary trading exchange; the security’s primary trading market is temporarily closed at a time when, under normal conditions, it would be open; the security has not been traded for an extended period of time; the security’s primary pricing source is not able or willing to provide a price; or trading of the security is subject to local government-imposed restrictions. In addition, the Funds may fair value a security if an event that may materially affect the value of the Funds’ security that is traded outside the United States (a “Significant Event”) has occurred between the time of the security’s last close and the time that each Fund calculates its net asset value (“NAV”). A Significant Event may relate to a single issuer or to an entire market sector. Events that may be Significant Events include: government actions, natural disasters, armed conflict, acts of terrorism and significant market fluctuations. If the Adviser becomes aware of a Significant Event that has occurred with respect to a security or group of securities after the closing of the exchange or market on which the security or securities principally trade, but before the time at which the Funds calculate their NAV, it may request that a Committee meeting be called. When a security is valued in accordance with the Fair Value Procedures, the Committee will determine the value after taking into consideration all relevant information reasonably available to the Committee.
If available, debt securities are priced based upon valuations provided by independent, third-party pricing agents. Such values generally reflect the last reported sales price if the security is actively traded. The third-party pricing agents may also value debt securities at an evaluated bid price by employing methodologies that utilize actual market transactions, broker-supplied valuations, or other methodologies designed to identify the market value for such securities. Debt obligations with remaining maturities of sixty days or less will be valued at their market value. Prices for most securities held by the Funds are provided daily by recognized independent pricing agents. If a security price cannot be obtained from an independent, third-party pricing agent, the Funds seek to obtain a bid price from at least one independent broker.
In accordance with the authoritative guidance on fair value measurements and disclosure under U.S. GAAP, the Funds disclose the fair value of their investments in a hierarchy that prioritizes the inputs to valuation techniques used to measure the fair value. The objective of a fair value measurement is to determine the price that would be received upon the sale of an asset or paid to transfer a liability in an orderly transaction between market participants at the measurement date (an exit price). Accordingly, the fair value hierarchy gives the highest priority to quoted prices (unadjusted) in active markets for identical assets
195
![]()
Notes to Financial Statements (Continued)
April 30, 2024 (Unaudited)
2. SIGNIFICANT ACCOUNTING POLICIES (continued)
or liabilities (Level 1) and the lowest priority to unobservable inputs (Level 3). The three levels of the fair value hierarchy are described below:
Level 1 – Unadjusted quoted prices in active markets for identical, unrestricted assets or liabilities that the Funds have the ability to access at the measurement date
Level 2 – Other significant observable inputs (including quoted prices in non-active markets, quoted prices for similar investments, fair value of investments for which the Funds have the ability to fully redeem tranches at NAV as of the measurement date or within the near term, and short-term investments valued at amortized cost)
Level 3 – Significant unobservable inputs (including the Funds’ own assumptions in determining the fair value of investments, and fair value of investments for which the Funds do not have the ability to fully redeem tranches at NAV as of the measurement date or within the near term)
Investments are classified within the level of the lowest significant input considered in determining fair value. Investments classified within Level 3 whose fair value measurement considers several inputs may include Level 1 or Level 2 inputs as components of the overall fair value measurement. For details of the investment classification, reference the Schedule of Investments.
The unobservable inputs used to determine fair value of Level 3 assets may have similar or diverging impacts on valuation. Significant increases and decreases in these inputs in isolation and interrelationships between those inputs could result in significantly higher or lower fair value measurement.
DUE TO/FROM BROKERS – Due to/from brokers includes cash and collateral balances with the Funds’ clearing brokers or counterparties as of April 30, 2024. The Funds continuously monitor the credit standing of each broker or counterparty with whom they conduct business. In the event a broker or counterparty is unable to fulfill its obligations, the Funds would be subject to counterparty credit risk.
REPURCHASE AGREEMENTS - Securities pledged as collateral for repurchase agreements by BNP Paribas are held by Brown Brothers Harriman & Co. (“BBH”) or The Bank of New York Mellon (“BNY Mellon”), as appropriate, in their roles as Custodian to respective Funds (each, a “Custodian” and together, the “Custodians”), and are designated as being held on each Fund’s behalf by the Custodian under a book-entry system. Each Fund monitors the adequacy of the collateral on a daily basis and can require the seller to
196
![]()
Notes to Financial Statements (Continued)
April 30, 2024 (Unaudited)
2. SIGNIFICANT ACCOUNTING POLICIES (continued)
provide additional collateral in the event the market value of the securities pledged falls below the carrying value of the repurchase agreement, including accrued interest.
It is the Funds’ policy to only enter into repurchase agreements with banks and other financial institutions which are deemed by the Adviser to be creditworthy. The Funds bear the risk of loss in the event that the counterparty to a repurchase agreement defaults on its obligations and the Funds are prevented from exercising their rights to dispose of the underlying securities received as collateral. For financial statement purposes, the Funds record the securities lending collateral (included in repurchase agreements, at value or restricted cash) as an asset and the obligation to return securities lending collateral as a liability on the Statements of Assets and Liabilities.
Repurchase agreements are entered into by the Funds under Master Repurchase Agreements (“MRA”) which permit the Funds, under certain circumstances, including an event of default (such as bankruptcy or insolvency), to offset payables and/or receivables under the MRA with collateral held and/or posted to the counterparty and create one single net payment due to or from the Funds.
FEDERAL INCOME TAXES – It is each Fund’s intention to qualify, or continue to qualify, as a regulated investment company for Federal income tax purposes by complying with the appropriate provisions of Subchapter M of the Code. Accordingly, no provisions for Federal income taxes have been made in the financial statements except as described below.
The Funds evaluate tax positions taken or expected to be taken in the course of preparing the Funds’ tax returns to determine whether it is “more-likely-than-not” (i.e., greater than 50 percent) that each tax position will be sustained upon examination by a taxing authority based on the technical merits of the position. Tax positions not deemed to meet the more-likely-than-not threshold are recorded as a tax benefit or expense in the current year. The Funds did not record any tax positions in the current period; however, management’s conclusions regarding tax positions may be subject to review and adjustment at a later date based on factors including, but not limited to, examination by tax authorities (i.e., the last three tax year ends, as applicable), and on-going analysis of and changes to tax laws and regulations, and interpretations thereof.
If a Fund has foreign tax filings that have not been made, the tax years that remain subject to examination may date back to the inception of the Fund.
As of and during the reporting period ended April 30, 2024, the Funds did not have a liability for any unrecognized tax benefits. The Funds recognize interest and penalties, if any, related to unrecognized tax benefits as an income tax expense on the Statements of Operations. During the reporting period, the Funds did not incur any interest or penalties.
197
![]()
Notes to Financial Statements (Continued)
April 30, 2024 (Unaudited)
2. SIGNIFICANT ACCOUNTING POLICIES (continued)
SECURITY TRANSACTIONS AND INVESTMENT INCOME – Security transactions are accounted for on the trade date for financial reporting purposes. Costs used in determining realized gains and losses on the sale of investment securities are based on specific identification. Dividend income is recorded on the ex-dividend date. Interest income is recognized on the accrual basis from the settlement date. Amortization of premiums and accretion of discounts is included in interest income.
FOREIGN CURRENCY TRANSACTIONS AND TRANSLATION – The books and records of the Funds are maintained in U.S. dollars. Investment securities and other assets and liabilities denominated in a foreign currency are translated into U.S. dollars on the date of valuation. Purchases and sales of investment securities, income and expenses are translated into U.S. dollars at the relevant rates of exchange prevailing on the respective dates of such transactions. The Funds do not isolate that portion of realized or unrealized gains and losses resulting from changes in the foreign exchange rate from fluctuations arising from changes in the market prices of the securities. These gains and losses are included in net realized and unrealized gains and losses on investments on the Statements of Operations. Net realized and unrealized gains and losses on foreign currency transactions and translations represent net foreign exchange gains or losses from foreign currency spot contracts, disposition of foreign currencies, currency gains or losses realized between trade and settlement dates on securities transactions and the difference between the amount of the investment income and foreign withholding taxes recorded on the Funds’ books and the U.S. dollar equivalent amounts actually received or paid.
DIVIDENDS AND DISTRIBUTIONS TO SHAREHOLDERS – The Funds distribute their net investment income on a pro rata basis. Any net investment income and net realized capital gains are distributed at least annually. All distributions are recorded on the ex-dividend date.
INVESTMENTS IN REITs – With respect to the Funds, dividend income is recorded based on the income included in distributions received from REIT investments using published REIT reclassifications, including some management estimates when actual amounts are not available. Distributions received in excess of these estimated amounts are recorded as a reduction of the cost of investments or reclassified to capital gains. The actual amounts of income, return of capital, and capital gains are only determined by each REIT after its fiscal year end, and may differ from the estimated amounts.
CREATION UNITS – The Funds issue and redeem their shares (“Shares”) on a continuous basis at net asset value (“NAV”) and only in large blocks of 10,000 Shares, referred to as “Creation Units”. Purchasers of Creation Units (“Authorized Participants”) at NAV must pay a standard creation transaction fee per transaction. The fee is a single charge and will be the same regardless of the number of Creation Units purchased by an Authorized Participant on the same day.
198
![]()
Notes to Financial Statements (Continued)
April 30, 2024 (Unaudited)
2. SIGNIFICANT ACCOUNTING POLICIES (continued)
An Authorized Participant who holds Creation Units and wishes to redeem at NAV would also pay a standard redemption fee per transaction to the Fund’s Custodian, on the date of such redemption, regardless of the number of Creation Units redeemed that day.
If a Creation Unit is purchased or redeemed for cash, an additional variable fee may be charged. The following table discloses Creation Unit breakdown:
| Creation Unit Shares | Creation Fee | Value at April 30, 2024 | Redemption Fee | |||||||||||||
| Global X S&P 500® Covered Call ETF | 10,000 | $ | 1,700 | $ | 398,600 | $ | 1,700 | |||||||||
| Global X NASDAQ 100® Covered Call ETF | 10,000 | 300 | 173,800 | 300 | ||||||||||||
| Global X Russell 2000 Covered Call ETF | 10,000 | 250 | 163,000 | 250 | ||||||||||||
| Global X Nasdaq 100® Covered Call & Growth ETF | 10,000 | 250 | 294,100 | 250 | ||||||||||||
| Global X S&P 500® Covered Call & Growth ETF | 10,000 | 800 | 292,900 | 800 | ||||||||||||
| Global X NASDAQ 100® Risk Managed Income ETF | 10,000 | 250 | 167,600 | 250 | ||||||||||||
| Global X S&P 500® Risk Managed Income ETF | 10,000 | 800 | 187,400 | 800 | ||||||||||||
| Global X Dow 30® Covered Call ETF | 10,000 | 250 | 221,100 | 250 | ||||||||||||
| Global X Russell 2000 Covered Call & Growth ETF | 10,000 | 250 | 245,400 | 250 | ||||||||||||
| Global X Financials Covered Call & Growth ETF | 10,000 | 250 | 256,000 | 250 | ||||||||||||
| Global X Health Care Covered Call & Growth ETF | 10,000 | 250 | 247,400 | 250 | ||||||||||||
| Global X Information Technology Covered Call & Growth ETF | 10,000 | 250 | 301,900 | 250 | ||||||||||||
| Global X NASDAQ 100 ESG Covered Call ETF | 10,000 | 250 | 258,900 | 250 | ||||||||||||
| Global X S&P 500 ESG Covered Call ETF | 10,000 | 500 | 255,200 | 500 | ||||||||||||
| Global X Dow 30® Covered Call & Growth ETF | 10,000 | 250 | 267,600 | 250 | ||||||||||||
| Global X MSCI Emerging Markets Covered Call ETF | 10,000 | 50 | 244,800 | 50 | ||||||||||||
CASH OVERDRAFT CHARGES – Per the terms of an agreement with BBH, if a Fund for which BBH is Custodian has a cash overdraft on a given day, it will be assessed an overdraft charge equal to the applicable BBH Base Rate plus 2.00%. Per the terms of an agreement with BNY Mellon, if a Fund for which BNY Mellon is Custodian has a cash overdraft, it will be charged interest at a rate then charged by BNY Mellon to its institutional custody clients in the relevant currency. Cash overdraft charges are included in custodian fees on the Statements of Operations.
199
![]()
Notes to Financial Statements (Continued)
April 30, 2024 (Unaudited)
2. SIGNIFICANT ACCOUNTING POLICIES (continued)
OPTIONS/SWAPTIONS WRITING/PURCHASING – To the extent consistent with their investment policies, certain Funds may either purchase or write options.
When a Fund purchases an option, the premium paid by it is recorded as an asset of the Fund. When a Fund writes an option, an amount equal to the net premium (the premium less the commission) received by the Fund is included in the liability section of the Fund’s Statement of Assets and Liabilities as a deferred credit. The amount of this asset or deferred credit will be subsequently marked-to-market to reflect the current value of the option purchased or written. The current value of the traded option is the last sale price or, in the absence of a sale, the current bid price. If an option purchased by a Fund expires unexercised, the Fund realizes a loss equal to the premium paid. If a Fund enters into a closing sale transaction on an option purchased by it, the Fund will realize a gain if the premium received by the Fund on the closing transaction is more than the premium paid to purchase the option, or a loss if it is less. If an option written by a Fund expires on the stipulated expiration date or if a Fund enters into a closing purchase transaction, it will realize a gain (or loss if the cost of a closing purchase transaction exceeds the net premium received when the option is sold) and the deferred credit related to such option will be eliminated. If an option written by a Fund is exercised, the proceeds of the sale will be increased by the net premium originally received and the Fund will realize a gain or loss.
Risks may arise from an imperfect correlation between the change in market value of the securities held and the prices of options relating to the securities purchased or sold and from possible lack of a liquid secondary market for an option. The maximum exposure to loss for any purchased option is limited to the premium initially paid for the option. Written uncovered call options subject a Fund to unlimited risk of loss. Written covered call options limit the upside potential of a security above the strike price. Written put options expose a Fund to risk of loss if the value of the security declines below the strike price.
The Global X S&P 500® Covered Call ETF, Global X NASDAQ 100® Covered Call ETF, Global X Russell 2000 Covered Call ETF, Global X Nasdaq 100® Covered Call & Growth ETF, Global X S&P 500® Covered Call & Growth ETF, Global X NASDAQ 100® Risk Managed Income ETF, Global X S&P 500® Risk Managed Income ETF, Global X Dow 30® Covered Call ETF, Global X Russell 2000 Covered Call & Growth ETF, Global X Financials Covered Call & Growth ETF, Global X Health Care Covered Call & Growth ETF, Global X Information Technology Covered Call & Growth ETF, Global X Nasdaq 100 ESG Covered Call ETF, Global X S&P 500 ESG Covered Call ETF, Global X Dow 30® Covered Call & Growth ETF and Global X MSCI Emerging Markets Covered Call ETF may write covered call and/or put options that correspond to their respective reference index. By writing a covered call option, a Fund, in exchange for the premium, foregoes the opportunity for capital appreciation above the strike price should the market price of the underlying security increase. Conversely, by writing a put option, the Fund, in exchange for the premium, accepts the risk of having to purchase a security at a fixed strike price
200
![]()
Notes to Financial Statements (Continued)
April 30, 2024 (Unaudited)
2. SIGNIFICANT ACCOUNTING POLICIES (continued)
even should the price of the underlying security decrease, exposing the Fund to downside risk in the underlying security.
When the written option expires, is terminated or is sold, a Fund will record a gain or loss. The net realized gain or loss on options contracts is reflected in the Statements of Operations and the net unrealized gains/(losses) are included as a component of the net change in unrealized appreciation/(depreciation) on options contracts in the Statements of Operations.
3. RELATED PARTIES AND SERVICE PROVIDER TRANSACTIONS
On July 2, 2018, the Adviser consummated a transaction pursuant to which it became an indirect, wholly-owned subsidiary of Mirae Asset Global Investments Co., Ltd. (“Mirae”). In this manner, the Adviser is ultimately controlled by Mirae.
The Adviser serves as the investment adviser and the administrator for the Funds. Subject to the supervision of the Board, the Adviser is responsible for managing the investment activities of the Funds and the Funds’ business affairs and other administrative matters and provides, or causes to be furnished, all supervisory, administrative and other services reasonably necessary for the operation of the Funds, including certain distribution services (provided pursuant to a separate distribution agreement), certain shareholder and distribution-related services (provided pursuant to a separate Rule 12b-1 Plan and related agreements) and investment advisory services (provided pursuant to a separate Investment Advisory Agreement), under what is essentially an “all-in” fee structure.
For the Adviser’s service to the respective Funds, under a supervision and administration agreement (the “Supervision and Administration Agreement”), each Fund pays a monthly fee to the Adviser at the annual rate below (stated as a percentage of the average daily net assets of the Fund) (“Supervision and Administration Fee”). In addition, the Funds bear other expenses, directly and indirectly, that are not covered by the Supervision and Administration Agreement, which may vary and affect the total expense ratios of the Funds, such as taxes, brokerage fees, commissions, certain custodian fees, acquired fund fees, and other transaction expenses, interest expenses and extraordinary expenses (such as litigation and indemnification expenses).
The following table discloses supervision and administration fees payable pursuant to the Supervision and Administration Agreement:
| Supervision and Administration Fee | ||
| Global X S&P 500® Covered Call ETF | 0.60% | |
| Global X NASDAQ 100® Covered Call ETF | 0.60% | |
| Global X Russell 2000 Covered Call ETF(1) | 0.60% | |
| Global X NASDAQ 100® Covered Call & Growth ETF(2) | 0.35% |
201
![]()
Notes to Financial Statements (Continued)
April 30, 2024 (Unaudited)
3. RELATED PARTIES AND SERVICE PROVIDER TRANSACTIONS (continued)
| Global X S&P 500® Covered Call & Growth ETF(3) | 0.35% | |
| Global X NASDAQ 100® Risk Managed Income ETF | 0.60% | |
| Global X S&P 500® Risk Managed Income ETF | 0.60% | |
| Global X Dow 30® Covered Call ETF | 0.60% | |
| Global X Russell 2000 Covered Call & Growth ETF(4) | 0.35% | |
| Global X Financials Covered Call & Growth ETF(5) | 0.60% | |
| Global X Health Care Covered Call & Growth ETF(6) | 0.60% | |
| Global X Information Technology Covered Call & Growth ETF(7) | 0.60% | |
| Global X Nasdaq 100 ESG Covered Call ETF | 0.60% | |
| Global X S&P 500 ESG Covered Call ETF | 0.60% | |
| Global X Dow 30® Covered Call & Growth ETF(8) | 0.35% | |
| Global X MSCI Emerging Markets Covered Call ETF(9) | 0.60% |
(1) Pursuant to an Expense Limitation Agreement, the Adviser has contractually agreed to reimburse or waive fees and/or limit expenses for the Global X Russell 2000 Covered Call ETF to the extent necessary to assure that the operating expenses of the Global X Russell 2000 Covered Call ETF (exclusive of taxes, brokerage fees, commissions, and other transaction expenses, interest, and extraordinary expenses (such as litigation and indemnification expenses)) will not exceed 0.60% of the average daily net assets of the Global X Russell 2000 Covered Call ETF per year until at least March 1, 2025.
(2) Effective April 11, 2024, the Supervision and Administration Fee for the Global X NASDAQ 100® Covered Call & Growth ETF was reduced to 0.35%. Prior to that, the Fund was subject to a Supervision and Administration Fee of 0.60%.
(3) Effective April 11, 2024, the Supervision and Administration Fee for the Global X S&P 500® Covered Call & Growth ETF was reduced to 0.35%. Prior to that, the Fund was subject to a Supervision and Administration Fee of 0.60%.
(4) Effective April 11, 2024, the Supervision and Administration Fee for the Global X Russell 2000 Covered Call & Growth ETF was reduced to 0.35%. Prior to that, the Fund was subject to a Supervision and Administration Fee of 0.60%.
(5) Pursuant to an Expense Limitation Agreement, the Adviser has contractually agreed to reimburse or waive fees and/or limit expenses for the Global X Financials Covered Call & Growth ETF to the extent necessary to assure that the operating expenses of the Global X Financials Covered Call & Growth ETF (exclusive of taxes, brokerage fees, commissions, and other transaction expenses, interest and extraordinary expenses (such as litigation and indemnification expenses)) will not exceed 0.60% of the average daily net assets of the Global X Financials Covered Call & Growth ETF per year until at least March 1, 2025.
(6) Pursuant to an Expense Limitation Agreement, the Adviser has contractually agreed to reimburse or waive fees and/or limit expenses for the Global X Health Care Covered Call & Growth ETF to the extent necessary to assure that the operating expenses of the Global X Health Care Covered Call & Growth ETF (exclusive of taxes, brokerage fees, commissions, and other transaction expenses, interest and extraordinary expenses (such as litigation and indemnification expenses)) will not exceed 0.60%
202
![]()
Notes to Financial Statements (Continued)
April 30, 2024 (Unaudited)
3. RELATED PARTIES AND SERVICE PROVIDER TRANSACTIONS (continued)
of the average daily net assets of the Global X Health Care Covered Call & Growth ETF per year until at least March 1, 2025.
(7) Pursuant to an Expense Limitation Agreement, the Adviser has contractually agreed to reimburse or waive fees and/or limit expenses for the Global X Information Technology Covered Call & Growth ETF to the extent necessary to assure that the operating expenses of the Global X Information Technology Covered Call & Growth ETF (exclusive of taxes, brokerage fees, commissions, and other transaction expenses, interest and extraordinary expenses (such as litigation and indemnification expenses)) will not exceed 0.60% of the average daily net assets of the Global X Information Technology Covered Call & Growth ETF per year until at least March 1, 2025.
(8) Effective April 11, 2024, the Supervision and Administration Fee for the Global X Dow 30® Covered Call & Growth ETF was reduced to 0.35%. Prior to that, the Fund was subject to a Supervision and Administration Fee of 0.60%.
(9) Pursuant to an Expense Limitation Agreement, the Adviser has contractually agreed to reimburse or waive fees and/or limit expenses for the Global X MSCI Emerging Markets Covered Call ETF to the extent necessary to assure that the operating expenses of the Global X MSCI Emerging Markets Covered Call ETF (exclusive of taxes, brokerage fees, commissions, and other transaction expenses, interest, and extraordinary expenses (such as litigation and indemnification expenses)) will not exceed 0.60% of the average daily net assets of the Global X MSCI Emerging Markets Covered Call ETF per year until at least March 1, 2025.
SEI Investments Global Funds Services (“SEIGFS”) serves as sub-administrator to the Funds. As sub-administrator, SEIGFS provides the Funds with all required general administrative services, including, without limitation: office space, equipment, and personnel; clerical and general back office services; bookkeeping, internal accounting and secretarial services; the calculation of NAV; and assistance with the preparation and filing of reports, registration statements, proxy statements, and other materials required to be filed or furnished by the Funds under federal and state securities laws. As compensation for these services, SEIGFS receives certain out-of-pocket costs, transaction fees, and asset-based fees which are accrued daily and paid monthly by the Adviser.
SEI Investments Distribution Co. (“SIDCO”) serves as the Funds’ underwriter and distributor of Creation Units pursuant to a distribution agreement (the “Distribution Agreement”). SIDCO has no obligation to sell any specific quantity of Shares of the Funds.
SIDCO bears the following costs and expenses relating to the distribution of Shares: (i) the costs of processing and maintaining records of creations of Creation Units; (ii) all costs of maintaining the records required of a registered broker/dealer; (iii) the expenses of maintaining its registration or qualification as a dealer or broker under federal or state laws; (iv) filing fees; and (v) all other expenses incurred in connection with the distribution services as contemplated in the Distribution Agreement. SIDCO receives no fee from the Funds for its distribution services under the Distribution Agreement, rather, the Adviser compensates SIDCO for certain expenses, out-of-pocket costs, and transaction fees.
203
![]()
Notes to Financial Statements (Continued)
April 30, 2024 (Unaudited)
3. RELATED PARTIES AND SERVICE PROVIDER TRANSACTIONS (continued)
BBH serves as custodian and transfer agent of the Global X S&P 500® Covered Call ETF, Global X NASDAQ 100® Covered Call ETF and Global X Russell 2000 Covered Call ETF. For the Funds for which it serves as custodian, BBH has agreed to (i) make receipts and disbursements of money on behalf of the Funds; (ii) collect and receive all income and other payments and distributions on account of the Funds’ portfolio investments; (iii) respond to correspondence from shareholders, security brokers and others relating to its duties; and (iv) make periodic reports to the Funds concerning the Funds’ operations. BBH does not exercise any supervisory function over the purchase and sale of securities. As compensation for these services, BBH receives certain out-of-pocket costs, transaction fees and asset-based fees which are accrued daily and paid monthly by the Adviser from its fees. For the funds which it serves as transfer agent, BBH has agreed to (i) issue and redeem Shares of each Fund; (ii) make dividend and other distributions to shareholders of each Fund; (iii) respond to correspondence by shareholders and others relating to its duties; (iv) maintain shareholder accounts; and (v) make periodic reports to the Funds. As compensation for these services, BBH receives certain out-of-pocket costs, transaction fees and asset-based fees which are accrued daily and paid monthly by the Adviser from its fees.
For all Funds other than the Global X S&P 500® Covered Call ETF, Global X NASDAQ 100® Covered Call ETF and Global X Russell 2000 Covered Call ETF, BNY Mellon serves as custodian and transfer agent to the Trust on behalf of the Funds. As custodian, BNY Mellon may appoint domestic and foreign sub-custodians and use depositories from time to time to hold securities and other instruments purchased by the Trust in foreign countries and to hold cash and currencies for the Trust on behalf of the Funds. Under its transfer agency agreement with the Trust, BNY Mellon has undertaken with the Trust to provide the following services with respect to the Funds for which it serves as transfer agent: (i) perform and facilitate the performance of purchases and redemptions of Creation Units, (ii) prepare and transmit by means of Depository Trust Company’s book-entry system payments for dividends and distributions on or with respect to the Shares declared by the Trust on behalf of the Funds, as applicable, (iii) prepare and deliver reports, information and documents as specified in the transfer agency agreement, (iv) perform the customary services of a transfer agent and dividend disbursing agent, and (v) render certain other miscellaneous services as specified in the transfer agency agreement or as otherwise agreed upon.
The custodian, transfer agent and securities lending agent for the Global X Nasdaq 100® Covered Call & Growth ETF and Global X S&P 500® Covered Call & Growth ETF transitioned from BBH to BNY Mellon on or about November 8, 2023.
204
![]()
Notes to Financial Statements (Continued)
April 30, 2024 (Unaudited)
4. INVESTMENT TRANSACTIONS
For the period ended April 30, 2024, the purchases and sales of investments in securities, excluding in-kind transactions, long-term U.S. Government and short-term securities were:
| Purchases | Sales and Maturities | |||||||
| Global X S&P 500® Covered Call ETF | $ | 46,186,754 | $ | 426,243,474 | ||||
| Global X NASDAQ 100® Covered Call ETF | 1,044,122,740 | 2,099,408,674 | ||||||
| Global X Russell 2000 Covered Call ETF | 103,502,350 | 323,640,313 | ||||||
| Global X Nasdaq 100® Covered Call & Growth ETF | 11,571,176 | 18,666,644 | ||||||
| Global X S&P 500® Covered Call & Growth ETF | 818,267 | 4,897,576 | ||||||
| Global X NASDAQ 100® Risk Managed Income ETF | 786,170 | 2,752,995 | ||||||
| Global X S&P 500® Risk Managed Income ETF | 312,017 | 5,085,755 | ||||||
| Global X Dow 30® Covered Call ETF | 4,119,196 | 11,175,858 | ||||||
| Global X Russell 2000 Covered Call & Growth ETF | 278,296 | 1,115,402 | ||||||
| Global X Financials Covered Call & Growth ETF | 36,040 | 227,731 | ||||||
| Global X Health Care Covered Call & Growth ETF | 38,925 | 197,211 | ||||||
| Global X Information Technology Covered Call & Growth ETF | 211,873 | 719,553 | ||||||
| Global X NASDAQ 100 ESG Covered Call ETF | 320,918 | 695,432 | ||||||
| Global X S&P 500 ESG Covered Call ETF | 192,360 | 420,698 | ||||||
| Global X Dow 30® Covered Call & Growth ETF | 121,620 | 212,090 | ||||||
| Global X MSCI Emerging Markets Covered Call ETF | 53,212 | 171,792 | ||||||
During the period ended April 30, 2024, there were no purchases or sales of long-term U.S. Government securities for the Funds.
For the period ended April 30, 2024, in-kind transactions associated with creations and redemptions were:
| Purchases | Sales | Realized Gain/(Loss) | ||||||||||
| Global X S&P 500® Covered Call ETF | $ | 54,893,125 | $ | 194,155,108 | $ | 56,167,268 | ||||||
| Global X NASDAQ 100® Covered Call ETF | 305,517,697 | 227,477,476 | 119,103,882 | |||||||||
| Global X Russell 2000 Covered Call ETF | 93,919,150 | 132,116,552 | 14,813,908 | |||||||||
| Global X Nasdaq 100® Covered Call & Growth ETF | 10,533,180 | 11,285,656 | 3,770,128 | |||||||||
| Global X S&P 500® Covered Call & Growth ETF | 8,095,237 | 9,381,038 | 2,078,366 | |||||||||
| Global X NASDAQ 100® Risk Managed Income ETF | 2,104,182 | 895,682 | 264,510 | |||||||||
| Global X S&P 500® Risk Managed Income ETF | 7,447,441 | 1,113,077 | 336,593 | |||||||||
| Global X Dow 30® Covered Call ETF | 4,939,905 | 5,179,944 | 1,251,082 | |||||||||
| Global X Russell 2000 Covered Call & Growth ETF | 4,797,585 | 6,405,957 | 844,902 | |||||||||
| Global X Financials Covered Call & Growth ETF | 251,618 | 251,618 | 42,579 | |||||||||
| Global X Health Care Covered Call & Growth ETF | – | – | – | |||||||||
| Global X Information Technology Covered Call & Growth ETF | 4,460,019 | 1,218,945 | 399,320 | |||||||||
| Global X NASDAQ 100 ESG Covered Call ETF | 266,895 | 546,756 | 179,216 | |||||||||
| Global X S&P 500 ESG Covered Call ETF | – | 1,282,973 | 253,246 | |||||||||
| Global X Dow 30® Covered Call & Growth ETF | – | – | – | |||||||||
| Global X MSCI Emerging Markets Covered Call ETF | 3,281,191 | 1,239,605 | – | |||||||||
205
![]()
Notes to Financial Statements (Continued)
April 30, 2024 (Unaudited)
5. DERIVATIVE TRANSACTIONS
The following tables show the derivatives categorized by underlying risk exposure.
The fair value of derivative instruments as of April 30, 2024 was as follows:
| Asset Derivatives | Liability Derivatives | |||||||||||
| Statements of Assets | Statements of Assets | |||||||||||
| and Liability Location | Fair Value | and Liability Location | Fair Value | |||||||||
| Derivatives not accounted for as hedging instruments: | ||||||||||||
| Global X S&P 500® Covered Call ETF | ||||||||||||
| Equity contracts | Investments purchased, at value | $ | – | Equity contracts | Options written, at value | $ | 50,895,200 | |||||
| Total Derivatives not accounted for as hedging instruments | $ | – | $ | 50,895,200 | ||||||||
| Asset Derivatives | Liability Derivatives | |||||||||||
| Statements of Assets | Statements of Assets | |||||||||||
| and Liability Location | Fair Value | and Liability Location | Fair Value | |||||||||
| Derivatives not accounted for as hedging instruments: | ||||||||||||
| Global X NASDAQ 100® Covered Call ETF | ||||||||||||
| Equity contracts | Investments purchased, at value | $ | – | Equity contracts | Options written, at value | $ | 208,931,840 | |||||
| Total Derivatives not accounted for as hedging instruments | $ | – | $ | 208,931,840 | ||||||||
| Asset Derivatives | Liability Derivatives | |||||||||||
| Statements of Assets | Statements of Assets | |||||||||||
| and Liability Location | Fair Value | and Liability Location | Fair Value | |||||||||
| Derivatives not accounted for as hedging instruments: | ||||||||||||
| Global X Russell 2000 Covered Call ETF | ||||||||||||
| Equity contracts | Investments purchased, at value | $ | – | Equity contracts | Options written, at value | $ | 38,460,015 | |||||
| Total Derivatives not accounted for as hedging instruments | $ | – | $ | 38,460,015 | ||||||||
| Asset Derivatives | Liability Derivatives | |||||||||||
| Statements of Assets | Statements of Assets | |||||||||||
| and Liability Location | Fair Value | and Liability Location | Fair Value | |||||||||
| Derivatives not accounted for as hedging instruments: | ||||||||||||
| Global X Nasdaq 100® Covered Call & Growth ETF | ||||||||||||
| Equity contracts | Investments purchased, at value | $ | – | Equity contracts | Options written, at value | $ | 1,475,760 | |||||
| Total Derivatives not accounted for as hedging instruments | $ | – | $ | 1,475,760 | ||||||||
206
![]()
Notes to Financial Statements (Continued)
April 30, 2024 (Unaudited)
5. DERIVATIVE TRANSACTIONS (continued)
| Asset Derivatives | Liability Derivatives | |||||||||||
| Statements of Assets | Statements of Assets | |||||||||||
| and Liability Location | Fair Value | and Liability Location | Fair Value | |||||||||
| Derivatives not accounted for as hedging instruments: | ||||||||||||
| Global X S&P 500® Covered Call & Growth ETF | ||||||||||||
| Equity contracts | Investments purchased, at value | $ | – | Equity contracts | Options written, at value | $ | 605,680 | |||||
| Total Derivatives not accounted for as hedging instruments | $ | – | $ | 605,680 | ||||||||
| Asset Derivatives | Liability Derivatives | |||||||||||
| Statements of Assets | Statements of Assets | |||||||||||
| and Liability Location | Fair Value | and Liability Location | Fair Value | |||||||||
| Derivatives not accounted for as hedging instruments: | ||||||||||||
| Global X NASDAQ 100® Risk Managed Income ETF | ||||||||||||
| Equity contracts | Investments purchased, at value | $ | 29,817 | Equity contracts | Options written, at value | $ | 368,920 | |||||
| Total Derivatives not accounted for as hedging instruments | $ | 29,817 | $ | 368,920 | ||||||||
| Asset Derivatives | Liability Derivatives | |||||||||||
| Statements of Assets | Statements of Assets | |||||||||||
| and Liability Location | Fair Value | and Liability Location | Fair Value | |||||||||
| Derivatives not accounted for as hedging instruments: | ||||||||||||
| Global X S&P 500® Risk Managed Income ETF | ||||||||||||
| Equity contracts | Investments purchased, at value | $ | 42,591 | Equity contracts | Options written, at value | $ | 611,338 | |||||
| Total Derivatives not accounted for as hedging instruments | $ | 42,591 | $ | 611,338 | ||||||||
| Asset Derivatives | Liability Derivatives | |||||||||||
| Statements of Assets | Statements of Assets | |||||||||||
| and Liability Location | Fair Value | and Liability Location | Fair Value | |||||||||
| Derivatives not accounted for as hedging instruments: | ||||||||||||
| Global X Dow 30® Covered Call ETF | ||||||||||||
| Equity contracts | Investments purchased, at value | $ | – | Equity contracts | Options written, at value | $ | 834,000 | |||||
| Total Derivatives not accounted for as hedging instruments | $ | – | $ | 834,000 | ||||||||
207
![]()
Notes to Financial Statements (Continued)
April 30, 2024 (Unaudited)
5. DERIVATIVE TRANSACTIONS (continued)
| Asset Derivatives | Liability Derivatives | |||||||||||
| Statements of Assets | Statements of Assets | |||||||||||
| and Liability Location | Fair Value | and Liability Location | Fair Value | |||||||||
| Derivatives not accounted for as hedging instruments: | ||||||||||||
| Global X Russell 2000 Covered Call & Growth ETF | ||||||||||||
| Equity contracts | Investments purchased, at value | $ | – | Equity contracts | Options written, at value | $ | 104,068 | |||||
| Total Derivatives not accounted for as hedging instruments | $ | – | $ | 104,068 | ||||||||
| Asset Derivatives | Liability Derivatives | |||||||||||
| Statements of Assets | Statements of Assets | |||||||||||
| and Liability Location | Fair Value | and Liability Location | Fair Value | |||||||||
| Derivatives not accounted for as hedging instruments: | ||||||||||||
| Global X Financials Covered Call & Growth ETF | ||||||||||||
| Equity contracts | Investments purchased, at value | $ | – | Equity contracts | Options written, at value | $ | 26,881 | |||||
| Total Derivatives not accounted for as hedging instruments | $ | – | $ | 26,881 | ||||||||
| Asset Derivatives | Liability Derivatives | |||||||||||
| Statements of Assets | Statements of Assets | |||||||||||
| and Liability Location | Fair Value | and Liability Location | Fair Value | |||||||||
| Derivatives not accounted for as hedging instruments: | ||||||||||||
| Global X Health Care Covered Call & Growth ETF | ||||||||||||
| Equity contracts | Investments purchased, at value | $ | – | Equity contracts | Options written, at value | $ | 25,530 | |||||
| Total Derivatives not accounted for as hedging instruments | $ | – | $ | 25,530 | ||||||||
| Asset Derivatives | Liability Derivatives | |||||||||||
| Statements of Assets | Statements of Assets | |||||||||||
| and Liability Location | Fair Value | and Liability Location | Fair Value | |||||||||
| Derivatives not accounted for as hedging instruments: | ||||||||||||
| Global X Information Technology Covered Call & Growth ETF | ||||||||||||
| Equity contracts | Investments purchased, at value | $ | – | Equity contracts | Options written, at value | $ | 60,708 | |||||
| Total Derivatives not accounted for as hedging instruments | $ | – | $ | 60,708 | ||||||||
208
![]()
Notes to Financial Statements (Continued)
April 30, 2024 (Unaudited)
5. DERIVATIVE TRANSACTIONS (continued)
| Asset Derivatives | Liability Derivatives | |||||||||||
| Statements of Assets | Statements of Assets | |||||||||||
| and Liability Location | Fair Value | and Liability Location | Fair Value | |||||||||
| Derivatives not accounted for as hedging instruments: | ||||||||||||
| Global X NASDAQ 100 ESG Covered Call ETF | ||||||||||||
| Equity contracts | Investments purchased, at value | $ | – | Equity contracts | Options written, at value | $ | 57,295 | |||||
| Total Derivatives not accounted for as hedging instruments | $ | – | $ | 57,295 | ||||||||
| Asset Derivatives | Liability Derivatives | |||||||||||
| Statements of Assets | Statements of Assets | |||||||||||
| and Liability Location | Fair Value | and Liability Location | Fair Value | |||||||||
| Derivatives not accounted for as hedging instruments: | ||||||||||||
| Global X S&P 500 ESG Covered Call ETF | ||||||||||||
| Equity contracts | Investments purchased, at value | $ | – | Equity contracts | Options written, at value | $ | 20,160 | |||||
| Total Derivatives not accounted for as hedging instruments | $ | – | $ | 20,160 | ||||||||
| Asset Derivatives | Liability Derivatives | |||||||||||
| Statements of Assets | Statements of Assets | |||||||||||
| and Liability Location | Fair Value | and Liability Location | Fair Value | |||||||||
| Derivatives not accounted for as hedging instruments: | ||||||||||||
| Global X Dow 30® Covered Call & Growth ETF | ||||||||||||
| Equity contracts | Investments purchased, at value | $ | – | Equity contracts | Options written, at value | $ | 13,125 | |||||
| Total Derivatives not accounted for as hedging instruments | $ | – | $ | 13,125 | ||||||||
| Asset Derivatives | Liability Derivatives | |||||||||||
| Statements of Assets | Statements of Assets | |||||||||||
| and Liability Location | Fair Value | and Liability Location | Fair Value | |||||||||
| Derivatives not accounted for as hedging instruments: | ||||||||||||
| Global X MSCI Emerging Markets Covered Call ETF | ||||||||||||
| Equity contracts | Investments purchased, at value | $ | – | Equity contracts | Options written, at value | $ | 77,561 | |||||
| Total Derivatives not accounted for as hedging instruments | $ | – | $ | 77,561 | ||||||||
The effect of derivative instruments on the Statements of Operations for the period ended April 30, 2024:
Amount of realized gain or (loss) on derivatives recognized in income:
209
![]()
Notes to Financial Statements (Continued)
April 30, 2024 (Unaudited)
5. DERIVATIVE TRANSACTIONS (continued)
| Purchased Options | Written Options | |||||||
| Global X S&P 500® Covered Call ETF | ||||||||
| Equity contracts | $ | — | $ | (251,792,963 | ) | |||
| Global X NASDAQ 100® Covered Call ETF | ||||||||
| Equity contracts | $ | — | $ | (563,734,264 | ) | |||
| Global X Russell 2000 Covered Call ETF | ||||||||
| Equity contracts | $ | — | $ | (139,179,246 | ) | |||
| Global X Nasdaq 100® Covered Call & Growth ETF | ||||||||
| Equity contracts | $ | — | $ | (3,797,458 | ) | |||
| Global X S&P 500® Covered Call & Growth ETF | ||||||||
| Equity contracts | $ | — | $ | (2,786,469 | ) | |||
| Global X NASDAQ 100® Risk Managed Income ETF | ||||||||
| Equity contracts | $ | (379,508 | ) | $ | (862,687 | ) | ||
| Global X S&P 500® Risk Managed Income ETF | ||||||||
| Equity contracts | $ | (541,857 | ) | $ | (2,475,144 | ) | ||
| Global X Dow 30® Covered Call ETF | ||||||||
| Equity contracts | $ | — | $ | (5,287,852 | ) | |||
| Global X Russell 2000 Covered Call & Growth ETF | ||||||||
| Equity contracts | $ | — | $ | (571,110 | ) | |||
| Global X Financials Covered Call & Growth ETF | ||||||||
| Equity contracts | $ | — | $ | (146,643 | ) | |||
| Global X Health Care Covered Call & Growth ETF | ||||||||
| Equity contracts | $ | — | $ | (51,629 | ) | |||
| Global X Information Technology Covered Call & Growth ETF | ||||||||
| Equity contracts | $ | — | $ | (123,829 | ) | |||
| Global X NASDAQ 100 ESG Covered Call ETF | ||||||||
| Equity contracts | $ | — | $ | (224,806 | ) | |||
| Global X S&P 500 ESG Covered Call ETF | ||||||||
| Equity contracts | $ | — | $ | (176,102 | ) | |||
| Global X Dow 30® Covered Call & Growth ETF | ||||||||
| Equity contracts | $ | — | $ | (79,415 | ) | |||
| Global X MSCI Emerging Markets Covered Call ETF | ||||||||
| Equity contracts | $ | — | $ | (44,907 | ) | |||
210
![]()
Notes to Financial Statements (Continued)
April 30, 2024 (Unaudited)
5. DERIVATIVE TRANSACTIONS (continued)
Change in unrealized appreciation or (depreciation) on derivatives recognized in income:
| Purchased Options | Written Options | |||||||
| Global X S&P 500® Covered Call ETF | ||||||||
| Equity contracts | $ | — | $ | (38,815,183 | ) | |||
| Global X NASDAQ 100® Covered Call ETF | ||||||||
| Equity contracts | $ | — | $ | (156,928,662 | ) | |||
| Global X Russell 2000 Covered Call ETF | ||||||||
| Equity contracts | $ | — | $ | (27,322,566 | ) | |||
| Global X Nasdaq 100® Covered Call & Growth ETF | ||||||||
| Equity contracts | $ | — | $ | (1,048,324 | ) | |||
| Global X S&P 500® Covered Call & Growth ETF | ||||||||
| Equity contracts | $ | — | $ | (426,067 | ) | |||
| Global X NASDAQ 100® Risk Managed Income ETF | ||||||||
| Equity contracts | $ | (40,951 | ) | $ | (246,256 | ) | ||
| Global X S&P 500® Risk Managed Income ETF | ||||||||
| Equity contracts | $ | (51,559 | ) | $ | (374,762 | ) | ||
| Global X Dow 30® Covered Call ETF | ||||||||
| Equity contracts | $ | — | $ | 621,076 | ||||
| Global X Russell 2000 Covered Call & Growth ETF | ||||||||
| Equity contracts | $ | — | $ | (48,087 | ) | |||
| Global X Financials Covered Call & Growth ETF | ||||||||
| Equity contracts | $ | — | $ | (21,822 | ) | |||
| Global X Health Care Covered Call & Growth ETF | ||||||||
| Equity contracts | $ | — | $ | (21,907 | ) | |||
| Global X Information Technology Covered Call & Growth ETF | ||||||||
| Equity contracts | $ | — | $ | (1,156 | ) | |||
| Global X NASDAQ 100 ESG Covered Call ETF | ||||||||
| Equity contracts | $ | — | $ | (41,594 | ) | |||
| Global X S&P 500 ESG Covered Call ETF | ||||||||
| Equity contracts | $ | — | $ | (27,542 | ) | |||
| Global X Dow 30® Covered Call & Growth ETF | ||||||||
| Equity contracts | $ | — | $ | 9,508 | ||||
211
![]()
Notes to Financial Statements (Continued)
April 30, 2024 (Unaudited)
5. DERIVATIVE TRANSACTIONS (continued)
| Purchased Options | Written Options | |||||||
| Global X MSCI Emerging Markets Covered Call ETF | ||||||||
| Equity contracts | $ | — | $ | (30,268 | ) | |||
The following table discloses the average monthly balances of the Funds’ options activity during the period ended April 30, 2024:
| Short Avg | Long Avg | |||||||
| Global X S&P 500® Covered Call ETF | $ | (42,933,741 | ) | $ | - | |||
| Global X NASDAQ 100® Covered Call ETF | (164,378,339 | ) | - | |||||
| Global X Russell 2000 Covered Call ETF | (33,812,401 | ) | - | |||||
| Global X Nasdaq 100® Covered Call & Growth ETF | (1,124,463 | ) | - | |||||
| Global X S&P 500® Covered Call & Growth ETF | (496,612 | ) | - | |||||
| Global X NASDAQ 100® Risk Managed Income ETF | (261,244 | ) | 62,532 | |||||
| Global X S&P 500® Risk Managed Income ETF | (475,922 | ) | 88,882 | |||||
| Global X Dow 30® Covered Call ETF | (877,712 | ) | - | |||||
| Global X Russell 2000 Covered Call & Growth ETF | (107,511 | ) | - | |||||
| Global X Financials Covered Call & Growth ETF | (18,758 | ) | - | |||||
| Global X Health Care Covered Call & Growth ETF | (21,635 | ) | - | |||||
| Global X Information Technology Covered Call & Growth ETF | (60,133 | ) | - | |||||
| Global X Nasdaq 100 ESG Covered Call ETF | (46,983 | ) | - | |||||
| Global X S&P 500 ESG Covered Call ETF | (19,027 | ) | - | |||||
| Global X Dow 30® Covered Call & Growth ETF | (13,614 | ) | - | |||||
| Global X MSCI Emerging Markets Covered Call ETF | (31,841 | ) | - | |||||
6. TAX INFORMATION
The following tax disclosures are representative as of October 31, 2023. Accordingly, the disclosures are for informational use by shareholders and are subject to change attributable to activity through the end of the tax year ending December 31, 2023.
The amount and character of income and capital gain distributions to be paid, if any, are determined in accordance with Federal income tax regulations, which may differ from U.S. GAAP. As a result, net investment income (loss) and net realized gain (loss) on investment transactions for a reporting period may differ significantly from distributions during such period. These book/tax differences may be temporary or permanent. To the extent these differences are permanent in nature, they are charged or credited to distributable earnings (loss) or paid-in capital, as appropriate, in the period that the differences arise.
The tax character of dividends and distributions declared during the periods ended October 31, 2023 and October 31, 2022 were as follows:
| Global X Funds | Ordinary Income | Long-Term Capital Gain | Return of Capital | Totals | ||||||||||||
| Global X S&P 500® Covered Call ETF | ||||||||||||||||
| 2023 | $ | 8,585,958 | $ | – | $ | 269,122,735 | $ | 277,708,693 | ||||||||
212
![]()
Notes to Financial Statements (Continued)
April 30, 2024 (Unaudited)
6. TAX INFORMATION (continued)
| Global X Funds | Ordinary Income | Long-Term Capital Gain | Return of Capital | Totals | ||||||||||||
| 2022 | 35,714,783 | – | 133,893,882 | 169,608,665 | ||||||||||||
| Global X NASDAQ 100® Covered Call ETF | ||||||||||||||||
| 2023 | $ | – | $ | – | $ | 875,982,507 | $ | 875,982,507 | ||||||||
| 2022 | 211,906,795 | – | 642,111,562 | 854,018,357 | ||||||||||||
| Global X Russell 2000 Covered Call ETF | ||||||||||||||||
| 2023 | $ | 2,455,329 | $ | – | $ | 170,194,451 | $ | 172,649,780 | ||||||||
| 2022 | 32,998,311 | – | 105,055,357 | 138,053,668 | ||||||||||||
| Global X Nasdaq 100® Covered Call & Growth ETF | ||||||||||||||||
| 2023 | $ | – | $ | – | $ | 4,776,529 | $ | 4,776,529 | ||||||||
| 2022 | 3,262,405 | – | 2,741,520 | 6,003,925 | ||||||||||||
| Global X S&P 500® Covered Call & Growth ETF | ||||||||||||||||
| 2023 | $ | 376,487 | $ | – | $ | 2,498,448 | $ | 2,874,935 | ||||||||
| 2022 | 1,862,038 | 3,646 | 1,465,030 | 3,330,714 | ||||||||||||
| Global X NASDAQ 100® Risk Managed Income ETF | ||||||||||||||||
| 2023 | $ | – | $ | – | $ | 1,196,718 | $ | 1,196,718 | ||||||||
| 2022 | 128,024 | – | 869,114 | 997,138 | ||||||||||||
| Global X S&P 500® Risk Managed Income ETF | ||||||||||||||||
| 2023 | $ | 41,006 | $ | – | $ | 3,063,982 | $ | 3,104,988 | ||||||||
| 2022 | 472,058 | – | 1,738,194 | 2,210,252 | ||||||||||||
| Global X Dow 30® Covered Call ETF | ||||||||||||||||
| 2023 | $ | 609,561 | $ | – | $ | 4,969,158 | $ | 5,578,719 | ||||||||
| 2022 | 734,788 | – | 1,115,840 | 1,850,628 | ||||||||||||
| Global X Russell 2000 Covered Call & Growth ETF | ||||||||||||||||
| 2023 | $ | 101,250 | $ | 2,217 | $ | 152,549 | $ | 256,016 | ||||||||
| 2022 | 12,860 | – | – | 12,860 | ||||||||||||
| Global X Financials Covered Call & Growth ETF | ||||||||||||||||
| 2023 | $ | 84,987 | $ | – | $ | 42,333 | $ | 127,320 | ||||||||
| Global X Health Care Covered Call & Growth ETF | ||||||||||||||||
| 2023 | $ | 122,360 | $ | – | $ | – | $ | 122,360 | ||||||||
| Global X Information Technology Covered Call & Growth ETF | ||||||||||||||||
| 2023 | $ | 166,221 | $ | – | $ | – | $ | 166,221 | ||||||||
| Global X NASDAQ 100 ESG Covered Call ETF | ||||||||||||||||
| 2023 | $ | 206,140 | $ | – | $ | – | $ | 206,140 | ||||||||
| Global X S&P 500 ESG Covered Call ETF | ||||||||||||||||
| 2023 | $ | 44,960 | $ | – | $ | 86,314 | $ | 131,274 | ||||||||
| Global X Dow 30® Covered Call & Growth ETF | ||||||||||||||||
| 2023 | $ | 9,566 | $ | – | $ | 13,830 | $ | 23,396 | ||||||||
As of October 31, 2023, the components of tax basis distributable earnings (accumulated losses) were as follows:
213
![]()
Notes to Financial Statements (Continued)
April 30, 2024 (Unaudited)
6. TAX INFORMATION (continued)
| Global X Funds | ||||||||||||||||
| Global X S&P 500® Covered Call ETF | Global X NASDAQ 100® Covered Call ETF | Global X Russell 2000 Covered Call ETF | Global X Nasdaq 100® Covered Call & Growth ETF | |||||||||||||
| Capital Loss Carryforwards | $ | (110,562,611 | ) | $ | (454,629,649 | ) | $ | (289,416,145 | ) | $ | (3,797,720 | ) | ||||
| Unrealized Depreciation on Investments and Foreign Currency | (1 | ) | – | – | – | |||||||||||
| Other Temporary Differences | 5,381 | 6 | 6 | (1 | ) | |||||||||||
| Total Accumulated Losses | $ | (110,557,231 | ) | $ | (454,629,643 | ) | $ | (289,416,139 | ) | $ | (3,797,721 | ) | ||||
| Global X Funds | ||||||||||||||||
| Global X S&P 500® Covered Call & Growth ETF | Global X NASDAQ 100® Risk Managed Income ETF | Global X S&P 500® Risk Managed Income ETF | Global X Dow 30® Covered Call ETF | |||||||||||||
| Capital Loss Carryforwards | $ | (2,267,522 | ) | $ | (2,285,474 | ) | $ | (3,651,301 | ) | $ | (294,284 | ) | ||||
| Other Temporary Differences | – | 1 | – | – | ||||||||||||
| Total Accumulated Losses | $ | (2,267,522 | ) | $ | (2,285,473 | ) | $ | (3,651,301 | ) | $ | (294,284 | ) | ||||
| Global X Funds | ||||||||||||||||
| Global X Russell 2000 Covered Call & Growth ETF | Global X Financials Covered Call & Growth ETF | Global X Health Care Covered Call & Growth ETF | Global X Information Technology Covered Call & Growth ETF | |||||||||||||
| Undistributed Ordinary Income | $ | – | $ | – | $ | 64,863 | $ | 123,784 | ||||||||
| Capital Loss Carryforwards | (329,834 | ) | – | – | – | |||||||||||
| Unrealized Appreciation (Depreciation) on Investments and Foreign Currency | – | (215,889 | ) | (255,440 | ) | 259,788 | ||||||||||
| Other Temporary Differences | 3 | 1 | – | 1 | ||||||||||||
| Total Distributable Earnings (Accumulated Losses) | $ | (329,831 | ) | $ | (215,888 | ) | $ | (190,577 | ) | $ | 383,573 | |||||
| Global X Funds | ||||||||||||||||
| Global X NASDAQ 100 ESG Covered Call ETF | Global X S&P 500 ESG Covered Call ETF | Global X Dow 30® Covered Call & Growth ETF | ||||||||||||||
| Undistributed Ordinary Income | $ | 31,264 | $ | – | $ | – | ||||||||||
| Undistributed Long-Term Capital Gain | 235 | – | – | |||||||||||||
| Capital Loss Carryforwards | – | – | (146,683 | ) | ||||||||||||
| Other Temporary Differences | (1 | ) | (2 | ) | – | |||||||||||
| Total Distributable Earnings (Accumulated Losses) | $ | 31,498 | $ | (2 | ) | $ | (146,683 | ) | ||||||||
For taxable years beginning after December 22, 2010, a Registered Investment Company within the meaning of the 1940 Act is permitted to carry forward net capital losses to offset capital gains realized in later years, and the losses carried forward retain their original
214
![]()
Notes to Financial Statements (Continued)
April 30, 2024 (Unaudited)
6. TAX INFORMATION (continued)
character as either long-term or short-term losses. Losses carried forward under these provisions are as follows:
| Short-Term Loss | Long-Term Loss | Total | ||||||||||
| Global X S&P 500® Covered Call ETF(1) | $ | – | $ | 110,562,611 | $ | 110,562,611 | ||||||
| Global X NASDAQ 100® Covered Call ETF(2) | – | 454,629,649 | 454,629,649 | |||||||||
| Global X Russell 2000 Covered Call ETF(3) | 115,766,458 | 173,649,687 | 289,416,145 | |||||||||
| Global X Nasdaq 100® Covered Call & Growth ETF(4) | – | 3,797,720 | 3,797,720 | |||||||||
| Global X S&P 500® Covered Call & Growth ETF(5) | – | 2,267,522 | 2,267,522 | |||||||||
| Global X NASDAQ 100® Risk Managed Income ETF(6) | 748,175 | 1,537,299 | 2,285,474 | |||||||||
| Global X S&P 500® Risk Managed Income ETF(7) | 1,460,937 | 2,190,364 | 3,651,301 | |||||||||
| Global X Dow 30® Covered Call ETF | 50,267 | 244,017 | 294,284 | |||||||||
| Global X Russell 2000 Covered Call & Growth ETF | 131,934 | 197,900 | 329,834 | |||||||||
| Global X Dow 30® Covered Call & Growth ETF | 58,673 | 88,010 | 146,683 | |||||||||
(1) The prior year ending balances of $96,805,692 (ST) and $145,227,280 (LT) (not presented herein), have been revised to correct for an error in the accounting for the mixed straddle election. The “as revised” balances (also not presented herein) are $86,965,261 (ST) and $130,466,633 (LT). Additionally, the same error resulted in Accumulated Losses and Paid in Capital, as presented on the Statement of Assets and Liabilities as of October 31, 2022, being understated and overstated, respectively, by an equal and offsetting amount totaling $24,601,078. Management has determined that the impact of these errors are not material to the prior year financial statements.
(2) The prior year ending balances of $656,016,216 (ST) and $984,024,325 (LT) (not presented herein), have been revised to correct for an error in the accounting for the mixed straddle election. The “as revised” balances (also not presented herein) are $574,804,574 (ST) and $862,206,861 (LT). Additionally, the same error resulted in Accumulated Losses and Paid in Capital, as presented on the Statement of Assets and Liabilities as of October 31, 2022, being understated and overstated, respectively, by an equal and offsetting amount totaling $203,029,105. Management has determined that the impact of these errors are not material to the prior year financial statements.
(3) The prior year ending balances of $66,140,478 (ST) and $99,210,716 (LT) (not presented herein), have been revised to correct for an error in the accounting for the mixed straddle election. The “as revised” balances (also not presented herein) are $65,115,657 (ST) and $97,673,485 (LT). Additionally, the same error resulted in Accumulated Losses and Paid in Capital, as presented on the Statement of Assets and Liabilities as of October 31, 2022, being understated and overstated, respectively, by an equal and offsetting amount totaling $2,562,052. Management has determined that the impact of these errors are not material to the prior year financial statements.
(4) The prior year ending balances of $7,919,707 (ST) and $11,879,561 (LT) (not presented herein), have been revised to correct for an error in the accounting for the mixed straddle election. The “as revised” balances (also not presented herein) are $6,622,752 (ST) and $9,934,128 (LT). Additionally, the same error resulted in Accumulated Losses and Paid in Capital, as presented on the Statement of
215
![]()
Notes to Financial Statements (Continued)
April 30, 2024 (Unaudited)
6. TAX INFORMATION (continued)
Assets and Liabilities as of October 31, 2022, being understated and overstated, respectively, by an equal and offsetting amount totaling $3,242,388. Management has determined that the impact of these errors are not material to the prior year financial statements.
(5) The prior year ending balances of $2,881,662 (ST) and $4,323,051 (LT) (not presented herein), have been revised to correct for an error in the accounting for the mixed straddle election. The “as revised” balances (also not presented herein) are $2,121,596 (ST) and $3,182,952 (LT). Additionally, the same error resulted in Accumulated Losses and Paid in Capital, as presented on the Statement of Assets and Liabilities as of October 31, 2022, being understated and overstated, respectively, by an equal and offsetting amount totaling $1,900,165. Management has determined that the impact of these errors are not material to the prior year financial statements.
(6) The prior year ending balances of $918,195 (ST) and $1,377,293 (LT) (not presented herein), have been revised to correct for an error in the accounting for the mixed straddle election. The “as revised” balances (also not presented herein) are $970,602 (ST) and $1,455,902 (LT). Additionally, the same error resulted in Accumulated Losses and Paid in Capital, as presented on the Statement of Assets and Liabilities as of October 31, 2022, being understated and overstated, respectively, by an equal and offsetting amount totaling $131,015. Management has determined that the impact of these errors are not material to the prior year financial statements.
(7) The prior year ending balances of $1,478,770 (ST) and $2,218,198 (LT) (not presented herein), have been revised to correct for an error in the accounting for the mixed straddle election. The “as revised” balances (also not presented herein) are $1,223,164 (ST) and $1,834,789 (LT). Additionally, the same error resulted in Accumulated Losses and Paid in Capital, as presented on the Statement of Assets and Liabilities as of October 31, 2022, being understated and overstated, respectively, by an equal and offsetting amount totaling $639,015. Management has determined that the impact of these errors are not material to the prior year financial statements.
The Federal tax cost basis of investments and aggregate gross unrealized appreciation and depreciation on investments held by the Funds at April 30, 2024 were as follows:
| Global X Funds | Federal Tax Cost | Aggregated Gross Unrealized Appreciation | Aggregated Gross Unrealized Depreciation | Net Unrealized Appreciation | ||||||||||||
| Global X S&P 500® Covered Call ETF | $ | 2,241,081,989 | $ | 676,338,310 | $ | (82,204,801 | ) | $ | 594,133,509 | |||||||
| Global X NASDAQ 100® Covered Call ETF | 5,696,253,281 | 2,554,636,977 | (101,251,130 | ) | 2,453,385,847 | |||||||||||
| Global X Russell 2000 Covered Call ETF | 1,321,967,515 | 263,744,067 | (160,615,647 | ) | 103,128,420 | |||||||||||
| Global X Nasdaq 100® Covered Call & Growth ETF | 94,190,014 | 25,096,691 | (3,511,035 | ) | 21,585,656 | |||||||||||
| Global X S&P 500® Covered Call & Growth ETF | 61,036,298 | 10,246,012 | (3,657,797 | ) | 6,588,215 | |||||||||||
| Global X NASDAQ 100® Risk Managed Income ETF | 11,314,429 | 2,643,413 | (534,040 | ) | 2,109,373 | |||||||||||
216
![]()
Notes to Financial Statements (Continued)
April 30, 2024 (Unaudited)
6. TAX INFORMATION (continued)
| Global X Funds | Federal Tax Cost | Aggregated Gross Unrealized Appreciation | Aggregated Gross Unrealized Depreciation | Net Unrealized Appreciation | ||||||||||||
| Global X S&P 500® Risk Managed Income ETF | $ | 29,010,494 | $ | 6,365,629 | $ | (1,277,636 | ) | $ | 5,087,993 | |||||||
| Global X Dow 30® Covered Call ETF | 72,759,116 | 12,461,475 | (1,088,090 | ) | 11,373,385 | |||||||||||
| Global X Russell 2000 Covered Call & Growth ETF | 7,004,621 | 697,330 | – | 697,330 | ||||||||||||
| Global X Financials Covered Call & Growth ETF | 2,265,677 | 337,179 | (18,254 | ) | 318,925 | |||||||||||
| Global X Health Care Covered Call & Growth ETF | 2,636,278 | 227,282 | (119,305 | ) | 107,977 | |||||||||||
| Global X Information Technology Covered Call & Growth ETF | 6,128,804 | 603,803 | (37,151 | ) | 566,652 | |||||||||||
| Global X NASDAQ 100 ESG Covered Call ETF | 1,964,242 | 474,755 | (55,647 | ) | 419,108 | |||||||||||
| Global X S&P 500 ESG Covered Call ETF | 1,144,397 | 191,829 | (40,117 | ) | 151,712 | |||||||||||
| Global X Dow 30® Covered Call & Growth ETF | 2,522,370 | 252,636 | (86,861 | ) | 165,775 | |||||||||||
| Global X MSCI Emerging Markets Covered Call ETF | 1,926,482 | 103,363 | – | 103,363 | ||||||||||||
The preceding differences between book and tax cost are primarily due to mark-to-market treatment of passive foreign investment companies, mixed straddles, MLP adjustments, wash sales, late year loss deferrals and differences due to preferred debt securities.
7. CONCENTRATION OF RISKS
The Funds invest in securities of foreign issuers in various countries. These investments may involve certain considerations and risks not typically associated with investments in the United States as a result of, among other factors, the possibility of future political and economic developments, the level of governmental supervision and regulation of securities markets in the respective countries.
The securities markets of emerging market countries are less liquid, subject to greater price volatility, and have a smaller market capitalization than the U.S. securities markets. In certain countries, there may be fewer publicly traded securities and the market may be dominated by a few issuers or sectors. Issuers and securities markets in such countries are not subject to as extensive and frequent accounting, financial and other reporting requirements or as comprehensive government regulations as are issuers and securities markets in the United States. In particular, the assets and profits appearing on the financial statements of emerging market country issuers may not reflect their financial position or results of operations in the same manner as financial statements for U.S. issuers.
217
![]()
Notes to Financial Statements (Continued)
April 30, 2024 (Unaudited)
7. CONCENTRATION OF RISKS (continued)
Substantially less information may be publicly available about emerging market country issuers than is available about issuers in the United States.
The Funds may be subject to taxes imposed by countries in which they invest. Such taxes are generally based on either income, gains earned or repatriated. The Funds accrue and apply such taxes to net investment income, net realized gains and net unrealized gains as income and/or capital gains are earned.
Except for the Global X Russell 2000 Covered Call ETF, the Global X Russell 2000 Covered Call & Growth ETF, the Global X Financials Covered Call & Growth ETF, the Global X Health Care Covered Call & Growth ETF, the Global X Information Technology Covered Call & Growth ETF and the Global X MSCI Emerging Markets Covered Call ETF, which use a representative sampling strategy, the Funds use a replication strategy. A replication strategy is an indexing strategy that involves investing in the securities of an underlying index in approximately the same proportions as in the underlying index. A representative sampling strategy is an indexing strategy that involves investing in a representative sample of securities (including indirect investments through underlying ETFs) that collectively has an investment profile similar to an underlying index in terms of key risk factors, performance attributes and other characteristics. Each Fund may utilize a representative sampling strategy with respect to its underlying index when a replication strategy might be detrimental to its shareholders, such as when there are practical difficulties or substantial costs involved in compiling a portfolio of equity securities to follow their underlying index, or, in certain instances, when securities in the underlying index become temporarily illiquid, unavailable or less liquid, or due to legal restrictions (such as diversification requirements that apply to a Fund but not the underlying index).
Certain Funds may invest in commodity related securities, which are susceptible to fluctuations in certain commodity markets. Any negative changes in commodity markets could have a great impact on those securities.
Certain Funds may have investments in financial instruments that utilize the London Interbank Offered Rate (“LIBOR”) as the reference or benchmark rate for variable interest rate calculations. LIBOR was intended to measure the rate generally at which banks can lend and borrow from one another in the relevant currency on an unsecured basis. The UK Financial Conduct Authority (“FCA”), the regulator that oversees LIBOR, announced that the majority of LIBOR rates would cease to be published or would no longer be representative on January 1, 2022. The publication of most LIBOR rates ceased at the end of 2021, and the remaining USD LIBOR rates ceased to be published after June 2023.There remains uncertainty and risks relating to the continuing LIBOR transition and its effects on the Funds and the instruments in which the Funds invest. There can be no assurance that the composition or characteristics of any alternative reference rates (“ARRs”) or financial instruments in which the Funds invest that utilize ARRs will be similar to or produce
218
![]()
Notes to Financial Statements (Concluded)
April 30, 2024 (Unaudited)
7. CONCENTRATION OF RISKS (continued)
the same value or economic equivalence as LIBOR or that these instruments will have the same volume or liquidity. Additionally, there remains uncertainty and risks relating to certain “legacy” USD LIBOR instruments that were issued or entered into before December 31, 2021 and the process by which a replacement interest rate will be identified and implemented into these instruments when USD LIBOR is ultimately discontinued. On December 16, 2022, the Federal Reserve Board adopted regulations implementing the Adjustable Interest Rate Act. The regulations provide a statutory fallback mechanism to replace LIBOR, by identifying benchmark rates based on the Secured Overnight Financing Rate (“SOFR”) that replaced LIBOR in certain financial contracts after June 30, 2023. These regulations apply only to contracts governed by U.S. law, among other limitations. The Funds may have instruments linked to other interbank offered rates that may also cease to be published in the future. The effects of such uncertainty and risks in “legacy” USD LIBOR instruments held by the Funds could result in losses to the Funds.
Please refer to each Fund’s prospectus and statement of additional information (“SAI”) for a more complete description of risks.
8. CONTRACTUAL OBLIGATION
The Funds enter into contracts in the normal course of business that contain a variety of indemnifications. The Funds’ maximum exposure under these contracts is unknown; however, the Funds have not had prior gains or losses pursuant to these contracts. Management has reviewed the Funds’ existing contracts and expects the risk of loss to be remote.
Pursuant to the Trust’s organizational documents, the Trustees of the Trust and the Trust’s officers are indemnified against certain liabilities that may arise out of the performance of their duties.
9. SUBSEQUENT EVENTS
The Funds have been evaluated by management regarding the need for additional disclosures and/or adjustments resulting from subsequent events. Based on this evaluation, no additional adjustments were required to the financial statements.
219
![]()
Disclosure of Fund Expenses (Unaudited)
ETFs (such as the Funds) have operating expenses. As a shareholder of an ETF, your investment is affected by these ongoing costs, which include (among others) costs for ETF management, administrative services, brokerage fees, and shareholder reports like this one. It is important for you to understand the impact of these costs on your investment returns. In addition, a shareholder is responsible for brokerage fees as a result of the shareholder’s investment in a Fund.
Operating expenses such as these are deducted from a Fund’s gross income and directly reduce your final investment returns. These expenses are expressed as a percentage of the Fund’s average net assets; this percentage is known as the Fund’s expense ratio.
The following examples use the expense ratio and are intended to help you understand the ongoing costs (in dollars) of investing in a Fund and to compare these costs with those of other funds. The examples are based on an investment of $1,000 made at the beginning of the period shown and held for the entire period from (November 1, 2023 through April 30, 2024).
The table on the next page illustrates the Funds’ costs in two ways:
Actual Fund Return. This section helps you to estimate the actual expenses that your Fund incurred over the period. The “Expenses Paid During Period” column shows the actual dollar expense cost incurred by a $1,000 investment in the Fund, and the “Ending Account Value” number is derived from deducting that expense cost from the Fund’s gross investment return.
You can use this information, together with the actual amount you invested in a Fund, to estimate the expenses you paid over that period. Simply divide your actual account value by $1,000 to arrive at a ratio (for example, an $8,600 account value divided by $1,000 = 8.6), then multiply that ratio by the number shown for your Fund under “Expenses Paid During Period.”
Hypothetical 5% Return. This section helps you compare your Fund’s costs with those of other funds. It assumes that the Fund had an annual 5% return before expenses during the year, but that the expense ratio (Column 3) for the period is unchanged. This example is useful in making comparisons because the Securities and Exchange Commission requires all funds to make this 5% calculation. You can assess your Fund’s comparative cost by comparing the hypothetical result for your Fund in the “Expenses Paid During Period” column with those that appear in the same charts in the shareholder reports for other funds.
NOTE: Because the return is set at 5% for comparison purposes — NOT your Fund’s actual return — the account values shown may not apply to your specific investment.
220
![]()
Disclosure of Fund Expenses (Unaudited) (Continued)
| Beginning Account Value 11/1/2023 | Ending Account Value 4/30/2024 | Annualized Expense Ratios | Expenses Paid During Period(1) | |||||||||||||
| Global X S&P 500® Covered Call ETF | ||||||||||||||||
| Actual Fund Return | $ | 1,000.00 | $ | 1,093.20 | 0.60 | % | $ | 3.12 | ||||||||
| Hypothetical 5% Return | 1,000.00 | 1,021.88 | 0.60 | 3.02 | ||||||||||||
| Global X NASDAQ 100® Covered Call ETF | ||||||||||||||||
| Actual Fund Return | $ | 1,000.00 | $ | 1,110.70 | 0.60 | % | $ | 3.15 | ||||||||
| Hypothetical 5% Return | 1,000.00 | 1,021.88 | 0.60 | 3.02 | ||||||||||||
| Global X Russell 2000 Covered Call ETF | ||||||||||||||||
| Actual Fund Return | $ | 1,000.00 | $ | 1,075.20 | 0.58 | % | $ | 2.99 | ||||||||
| Hypothetical 5% Return | 1,000.00 | 1,021.98 | 0.58 | 2.92 | ||||||||||||
| Global X Nasdaq 100® Covered Call & Growth ETF | ||||||||||||||||
| Actual Fund Return | $ | 1,000.00 | $ | 1,162.30 | 0.57 | % | $ | 3.06 | ||||||||
| Hypothetical 5% Return | 1,000.00 | 1,022.03 | 0.57 | 2.87 | ||||||||||||
| Global X S&P 500® Covered Call & Growth ETF | ||||||||||||||||
| Actual Fund Return | $ | 1,000.00 | $ | 1,149.50 | 0.57 | % | $ | 3.05 | ||||||||
| Hypothetical 5% Return | 1,000.00 | 1,022.03 | 0.57 | 2.87 | ||||||||||||
| Global X NASDAQ 100® Risk Managed Income ETF | ||||||||||||||||
| Actual Fund Return | $ | 1,000.00 | $ | 1,069.60 | 0.61 | % | $ | 3.14 | ||||||||
| Hypothetical 5% Return | 1,000.00 | 1,021.83 | 0.61 | 3.07 | ||||||||||||
| Global X S&P 500® Risk Managed Income ETF | ||||||||||||||||
| Actual Fund Return | $ | 1,000.00 | $ | 1,072.20 | 0.60 | % | $ | 3.09 | ||||||||
| Hypothetical 5% Return | 1,000.00 | 1,021.88 | 0.60 | 3.02 | ||||||||||||
| Global X Dow 30® Covered Call ETF | ||||||||||||||||
| Actual Fund Return | $ | 1,000.00 | $ | 1,092.10 | 0.60 | % | $ | 3.12 | ||||||||
| Hypothetical 5% Return | 1,000.00 | 1,021.88 | 0.60 | 3.02 | ||||||||||||
| Global X Russell 2000 Covered Call & Growth ETF | ||||||||||||||||
| Actual Fund Return | $ | 1,000.00 | $ | 1,135.40 | 0.48 | % | $ | 2.55 | ||||||||
| Hypothetical 5% Return | 1,000.00 | 1,022.48 | 0.48 | 2.41 | ||||||||||||
| Global X Financials Covered Call & Growth ETF | ||||||||||||||||
| Actual Fund Return | $ | 1,000.00 | $ | 1,174.10 | 0.55 | % | $ | 2.97 | ||||||||
| Hypothetical 5% Return | 1,000.00 | 1,022.13 | 0.55 | 2.77 | ||||||||||||
221
![]()
Disclosure of Fund Expenses (Unaudited) (Concluded)
| Beginning Account Value 11/1/2023 | Ending Account Value 4/30/2024 | Annualized Expense Ratios | Expenses Paid During Period(1) | |||||||||||||
| Global X Health Care Covered Call & Growth ETF | ||||||||||||||||
| Actual Fund Return | $ | 1,000.00 | $ | 1,104.60 | 0.55 | % | $ | 2.88 | ||||||||
| Hypothetical 5% Return | 1,000.00 | 1,022.13 | 0.55 | 2.77 | ||||||||||||
| Global X Information Technology Covered Call & Growth ETF | ||||||||||||||||
| Actual Fund Return | $ | 1,000.00 | $ | 1,148.40 | 0.55 | % | $ | 2.94 | ||||||||
| Hypothetical 5% Return | 1,000.00 | 1,022.13 | 0.55 | 2.77 | ||||||||||||
| Global X NASDAQ 100 ESG Covered Call ETF | ||||||||||||||||
| Actual Fund Return | $ | 1,000.00 | $ | 1,108.50 | 0.60 | % | $ | 3.15 | ||||||||
| Hypothetical 5% Return | 1,000.00 | 1,021.88 | 0.60 | 3.02 | ||||||||||||
| Global X S&P 500 ESG Covered Call ETF | ||||||||||||||||
| Actual Fund Return | $ | 1,000.00 | $ | 1,108.90 | 0.60 | % | $ | 3.15 | ||||||||
| Hypothetical 5% Return | 1,000.00 | 1,021.88 | 0.60 | 3.02 | ||||||||||||
| Global X Dow 30® Covered Call & Growth ETF | ||||||||||||||||
| Actual Fund Return | $ | 1,000.00 | $ | 1,122.80 | 0.57 | % | $ | 3.01 | ||||||||
| Hypothetical 5% Return | 1,000.00 | 1,022.03 | 0.57 | 2.87 | ||||||||||||
| Global X MSCI Emerging Markets Covered Call ETF* | ||||||||||||||||
| Actual Fund Return | $ | 1,000.00 | $ | 1,035.70 | 0.51 | % | $ | 2.48 | (2) | |||||||
| Hypothetical 5% Return | 1,000.00 | 1,021.47 | 0.51 | 2.46 | ||||||||||||
| (1) | Expenses are equal to the Fund’s annualized expense ratio multiplied by the average account value over the period, multiplied by 182/366 (to reflect the one-half year period). |
| (2) | Expenses are equal to the Fund’s annualized expense ratio multiplied by the average account value over the period, multiplied by 175/366 (to reflect the one-half year period). |
| * | The Fund commenced operations on 11/7/2023. |
222
![]()
Approval of Investment Advisory Agreement (Unaudited)
Section 15(c) of the Investment Company Act of 1940, as amended (“1940 Act”), requires that the board of trustees of an exchange-traded fund (“ETF”), including a majority of those trustees who are not “interested persons” of the ETF, as defined in the 1940 Act (“Independent Trustees”), consider on an initial basis and periodically thereafter (as required by the 1940 Act), at an in person meeting called for such purpose, the terms of each ETF’s investment advisory agreement and whether to approve entering into, or renewing, each agreement.
At a Board meeting of the Global X Funds (the “Trust”) held on November 11, 2022 (the “New Fund Board Meeting”), the Board of Trustees (the “Board”) (including the Trust’s Independent Trustees, voting separately) considered and unanimously approved (i) the initial Investment Advisory Agreement (the “New Investment Advisory Agreement”) for the Global X MSCI Emerging Markets Covered Call ETF (the “New Fund”); and (ii) the initial Supervision and Administration Agreement ("New Supervision and Administration Agreement"), each between the Trust, on behalf of the New Fund, and Global X Management. The New Investment Advisory Agreement and New Supervision and Administration Agreement are referred to collectively as the “New Fund Agreements.”
At a Board meeting of the Trust held on November 16, 2023, called for such purpose, the Board (including the Trust’s Independent Trustees, voting separately) considered and unanimously approved the continuation of (i) the Investment Advisory Agreement and the New Investment Advisory Agreement, as applicable (the “Renewal Investment Advisory Agreement”) for each Fund included in this Semi-Annual Report (each, a “Renewal Fund” and together, the “ Renewal Funds”); and (ii) the Supervision and Administration Agreement (“Renewal Supervision and Administration Agreement”), each between the Trust, on behalf of each Renewal Fund, and Global X Management. The Renewal Investment Advisory Agreement and the Renewal Supervision and Administration Agreement are referred to herein as the “Renewal Agreements.”
In advance of the November 11, 2022 and November 16, 2023 Board meetings, the Board (including the Trust’s Independent Trustees) and the Independent Trustees’ independent legal counsel requested (in writing) detailed information from Global X Management in connection with the Board’s consideration of the Renewal Agreements and New Fund Agreements, and received and reviewed written responses from Global X Management, as well as supporting materials relating to those requests for information. Subsequent to the receipt of that information for the November 16, 2023 Board meeting, the Independent Trustees requested additional information regarding certain changes in senior management of Global X Management, which was provided to them in advance of the Board meeting.
At the November 16, 2023 Board meeting, the Board approved the Renewal Agreements, for the period ending February 29, 2024, in order to ensure continuity of management of the Renewal Funds. However, the Independent Trustees also determined to postpone a vote on the renewal of the Renewal Agreements for a full annual period in order to provide the Independent Trustees with the opportunity to further consider certain changes in Global X Management’s senior leadership, which occurred approximately contemporaneously
223
![]()
Approval of Investment Advisory Agreement (Unaudited) (Continued)
with the Board’s consideration of the Renewal Agreements, and in order to permit Global X Management to confirm certain information provided in advance of the November 16, 2023 Board meeting. Global X Management subsequently provided additional information to the Board in advance of a second meeting called for the purpose of considering the extension of the Renewal Agreements for a full year. At a Board meeting of the Trust held on December 21, 2023, the Trust’s Board, which was comprised entirely of Independent Trustees, unanimously approved the continuation of the Renewal Agreements for an aggregate one-year period ending November 30, 2024.
In the course of their consideration of the Renewal Agreements and New Fund Agreements, the Trust’s Independent Trustees were advised by their independent legal counsel and, in addition to meetings with management of Global X Management, the Independent Trustees met separately in executive sessions with their counsel.
NEW FUND AGREEMENTS
In determining to approve the New Fund Agreements for the New Fund, the Board considered a variety of factors, including the factors discussed in greater detail below.
Nature, Extent and Quality of Services
With respect to this factor, the Board considered:
| • | the terms of the New Fund Agreements and the range of services proposed to be provided to the New Fund in accordance with the New Fund Agreements; |
| • | Global X Management’s key personnel and the portfolio managers who would provide investment advisory, supervision and administrative services to the New Fund; |
| • | Global X Management’s responsibilities under the New Fund Agreements to, among other things, (i) manage the investment operations of the New Fund and the composition of the New Fund’s assets, including the purchase, retention and disposition of its holdings, (ii) provide quarterly reports to the Trust’s officers and the Board and other reports as the Board deems necessary or appropriate, (iii) vote proxies, exercise consents, and exercise all other rights appertaining to securities and assets held by the New Fund, (iv) select broker-dealers to execute portfolio transactions for the New Fund when necessary, (v) assist in the preparation and filing of reports and proxy statements (if any) to the shareholders of the New Fund, and the periodic updating of the registration statements, prospectuses, statements of additional information, and other reports and documents for the New Fund that are required to be filed by the Trust with the U.S. Securities and Exchange Commission (“SEC”) and other regulatory or governmental bodies, and (vi) monitor anticipated purchases and redemptions of the shares (including Creation Units) of the New Fund by shareholders and new investors; |
| • | the nature, extent and quality of all of the services (including advisory, administrative and compliance services) that are proposed to be provided by Global X Management |
224
![]()
Approval of Investment Advisory Agreement (Unaudited) (Continued)
| or made available to the New Fund; and | |
| • | the quality of Global X Management’s resources and personnel that would be made available to the New Fund, including Global X Management’s experience and the professional qualifications of Global X Management’s key personnel. |
Based on these considerations, the Board concluded, at the New Fund Board Meeting, that it was satisfied with the nature, extent and quality of the services proposed to be provided to the New Fund by Global X Management.
Performance
The Board determined that, because the New Fund had not yet begun investment operations as of the date of the New Fund Board Meeting, meaningful data relating to the investment performance of the New Fund was not available and, therefore, could not be a factor in approving the New Fund Agreements.
Cost of Services and Profitability
With respect to this factor, the Board considered:
| • | Global X Management’s expected costs to provide investment management, supervision and administrative and related services to the New Fund; |
| • | the management fee (including the proposed investment advisory fee) (“Management Fee”) that was proposed to be borne by the New Fund under each respective New Fund Agreement for the various investment advisory, supervisory and administrative services that the New Fund requires under a unitary fee structure (including the types of fees and expenses that are not included within the unitary fee and would be borne by the New Fund); and |
| • | the expected profitability to Global X Management, if any, from all of the services proposed to be provided to the New Fund by Global X Management and all aspects of the relationship between Global X Management and the New Fund. |
Based on these considerations, the Board concluded that the proposed Management Fee to be paid by the New Fund to Global X Management, in light of the nature, extent and quality of the services to be provided, was reasonable and in the best interests of the New Fund’s shareholders.
Comparison of Fees and Services
With respect to this factor, the Board considered:
| • | comparative information with respect to the proposed Management Fee to be paid to Global X Management by the New Fund. In connection with this consideration, Global X Management provided the Board with comparative expense data for the New Fund, including fees and expenses paid by unaffiliated similar specialized and/ |
225
![]()
Approval of Investment Advisory Agreement (Unaudited) (Continued)
| or focused ETFs, and/or other similar registered funds. The Board considered that the proposed Management Fee for the New Fund was below the average and median of the New Fund’s peer group; | |
| • | the structure of the proposed unitary Management Fee (which includes as one component the proposed investment advisory fee for the New Fund) and the expected total expense ratios for the New Fund. In this regard, the Board took into consideration that the purpose of adopting a unitary Management Fee structure for the New Fund was to create a simple, all-inclusive fee that would provide a level of predictability with respect to the overall expense ratio (i.e., the total fees) of the New Fund and that the proposed Management Fee for the New Fund was set at a competitive level to make the New Fund viable in the marketplace; and |
| • | that, under the proposed unified Management Fee structure, Global X Management would be responsible for most ordinary expenses of the New Fund, including the costs of various third-party services required by the New Fund, including investment advisory, administrative, audit, certain custody, portfolio accounting, legal, transfer agency and printing costs, but that the New Fund would bear other expenses not covered under the proposed all-inclusive Management Fee, such as taxes, brokerage fees, commissions, and other transaction expenses, interest expenses, and extraordinary expenses. |
Based on these considerations, the Board concluded, at the New Fund Board Meeting, that the services to be received and the fees to be charged under the applicable New Fund Agreements were reasonable on a comparative basis.
Economies of Scale
With respect to this factor, the Board considered:
| • | the extent to which economies of scale would be realized as the New Fund grew and whether the proposed unitary Management Fee for the New Fund reflected these economies of scale; |
| • | the significant investment of time, personnel and other resources that Global X Management intends to make in the New Fund in order to seek to assure that the New Fund is attractive to investors; and |
| • | that the proposed unitary Management Fee would provide a high level of certainty as to the total level of expenses for the New Fund and its shareholders. |
Based on these considerations, the Board concluded, at the New Fund Board Meeting, that the proposed unitary Management Fee for the New Fund appropriately addressed economies of scale.
226
![]()
Approval of Investment Advisory Agreement (Unaudited) (Continued)
Other Benefits
In considering the New Fund Agreements, in addition to the factors discussed above, the Board considered other benefits that may be realized by Global X Management as a result of its relationships with the New Fund. As a result, the Board concluded that, in the case of the New Fund, in the exercise of the Board’s business judgement, all information the Board considered supported approval of the New Fund Agreements.
Conclusion
After full consideration of the factors above, as well as other factors that were instructive in their consideration, the Board, including all of the Trust’s Independent Trustees voting separately, concluded, in the exercise of its business judgement, that the New Fund Agreements were fair and reasonable and in the best interest of the New Fund.
In reaching this decision, the Board did not assign relative weights to the factors above nor did the Board deem any one factor or group of them to be controlling in and of themselves. Each member of the Board may have assigned different weights to the various factors.
RENEWAL AGREEMENTS
In determining to approve the continuation of the Renewal Agreements for the Renewal Funds, the Board considered a variety of factors, including the factors discussed in greater detail below.
Nature, Extent and Quality of Services
With respect to this factor, the Board considered:
| • | the terms of the Renewal Agreements and the range of services that would continue to be provided to each Renewal Fund in accordance with the Renewal Agreements; |
| • | Global X Management’s key personnel and the portfolio managers who would continue to provide investment advisory, supervision and administrative services to each Renewal Fund. In considering the key personnel, the Board considered the departures of certain key executives of Global X Management and their replacements, and the plan for identifying a permanent replacement for Global X Management’s chief executive officer; |
| • | Global X Management’s responsibilities under the Renewal Agreements, among other things, to: (i) manage the investment operations of the Renewal Funds and the composition of the Renewal Funds’ assets, including the purchase, retention and disposition of their holdings, (ii) provide quarterly reports to the Trust’s officers and the Board and other reports as the Board deems necessary or appropriate, (iii) vote proxies, exercise consents, and exercise all other rights relating to securities and assets held by the Renewal Funds, (iv) select broker-dealers to execute portfolio transactions for the Renewal Funds when necessary, (v) assist in the preparation and filing of |
227
![]()
Approval of Investment Advisory Agreement (Unaudited) (Continued)
| reports and proxy statements (if any) to the shareholders of the Renewal Funds, and the periodic updating of the registration statement, prospectuses, statements of additional information, and other reports and documents for the Renewal Funds that are required to be filed by the Trust with the SEC and other regulatory and governmental bodies, and (vi) monitor anticipated purchases and redemptions of the shares (including Creation Units) of the Renewal Funds by shareholders and new investors; | |
| • | the nature, extent and quality of all of the services (including advisory, administrative and compliance services) that have been provided by Global X Management or made available to the Renewal Funds; and |
| • | the quality of Global X Management’s resources and personnel that would continue to be made available to the Renewal Funds, including Global X Management’s experience and the professional qualifications of Global X Management’s key personnel. In evaluating key personnel, the Board considered the qualifications of Global X Management’s chief operating officer and interim chief executive officer, and considered Global X Management’s plans for hiring a permanent chief executive officer. |
Based on these considerations, the Board concluded that it was satisfied with the nature, extent and quality of the services provided to the Renewal Funds by Global X Management.
Performance
The Board considered the performance of each Renewal Fund. They examined the performance of the Renewal Funds for the one-year, three-year, five-year and since inception periods, as applicable. Also, the Board considered the total return and investments performance of the Renewal Funds relative to (i) the performance of unaffiliated comparable ETFs and/or other registered funds, which performance information is publicly available from such registered funds, as well as other third party sources; and (ii) the performance of pertinent indexes. The Board considered instances of under-performance and overperformance with respect to the competitor funds. The Board also considered the Renewal Funds’ tracking against their underlying indexes in absolute terms, and in the case of passively managed ETFs, considered their tracking against their underlying indexes.
Based on these considerations and comparisons, the Board concluded that the investment performance of the Renewal Funds did not adversely affect the Board’s approval of the continuance of the Renewal Agreements.
Cost of Services and Profitability
The Board considered Global X Management’s cost to provide investment management, supervision and administrative and related services to the Renewal Funds. In this regard, the Board considered the management fee (“Management Fee”) that has been borne or is expected to be borne by the Renewal Funds under the Renewal Agreements for the various investment advisory, supervisory and administrative services that the Renewal Funds
228
![]()
Approval of Investment Advisory Agreement (Unaudited) (Continued)
require under a unitary fee structure (including the types of fees and expenses that are not included within the unitary fee and would be borne by the Renewal Funds).
In addition, the Board considered expected profitability to Global X Management, as applicable, from all services provided or expected to be provided to the Renewal Funds and all aspects of Global X Management’s relationship with the Renewal Funds. In connection with these considerations, Global X Management provided the Board with financial information regarding its operations and the services provided to the Renewal Funds and discussed with the Board its current and expected, as applicable, profitability with respect to the Renewal Funds.
Based on these considerations, the Board concluded that the Management Fee rate paid by the Renewal Funds to Global X Management, in light of the nature, extent and quality of the services provided, was reasonable and in the best interests of the Renewal Funds’ shareholders.
Comparison of Fees and Services
With respect to this factor, the Board considered:
| • | comparative information with respect to the Management Fee paid to Global X Management by the Renewal Funds. In connection with this consideration, Global X Management provided the Board with comparative expense data for the Renewal Funds, including fees and expenses paid by unaffiliated similar specialized and/or focused ETFs and/or other comparable registered funds. The Board considered the Global X Management’s detailed explanation of the fee structures of any Renewal Fund that was above the average or median for its peer group; |
| • | the structure of the unitary Management Fee (which includes as one component the investment advisory fee for the Renewal Funds) and the current total expense ratios for the Renewal Funds. In this regard, the Board took into consideration that the purpose of adopting a unitary Management Fee structure for the Renewal Funds was to create a simple, all-inclusive fee that would provide a level of predictability with respect to the overall expense ratio (i.e., the total fees) of the Renewal Funds and that the proposed Management Fees for the Renewal Funds were set at a competitive levels to make the Renewal Funds viable in the marketplace; and |
| • | that, under the unified Management Fee structure, Global X Management is responsible for most ordinary expenses of the Renewal Funds, including the costs of various third-party services required by the Renewal Funds, including investment advisory, administrative, audit, certain custody, portfolio accounting, legal, transfer agency and printing costs, but that the Renewal Funds would bear other expenses not covered under the proposed all-inclusive Management Fee, such as taxes, brokerage fees, commissions, and other transaction expenses, interest expenses, and |
229
![]()
Approval of Investment Advisory Agreement (Unaudited) (Concluded)
| extraordinary expenses. |
Based on these considerations, the Board concluded that the services received and the fees charged under the Renewal Agreements were reasonable on a comparative basis.
Economies of Scale
With respect to this factor, the Board considered:
| • | the extent to which economies of scale would be realized as the Renewal Funds grow and whether the unitary Management Fee for the Renewal Funds reflected these economies of scale; |
| • | the significant investment of time, personnel and other resources that Global X Management has made and intends to continue to make in the Renewal Funds in order to seek to assure that the Renewal Funds are attractive to investors; and |
| • | that the unitary Management Fee would provide a high level of certainty as to the total level of expenses for the Renewal Funds and their shareholders. |
Based on these considerations, the Board concluded that the unitary Management Fee for the Renewal Funds appropriately addressed economies of scale.
Other Benefits
In considering the Renewal Agreements, in addition to the factors above, the Board considered any other benefits realized by Global X Management as a result of its relationships with the Renewal Funds and concluded that, in the exercise of the Board’s business judgement, all information the Board considered supported approval of the continuation of the Renewal Agreements.
Conclusion
After full consideration of the factors above, as well as other factors that were instructive in its consideration, the Board, including all of the Trust’s Independent Trustees voting separately, concluded, in the exercise of its business judgement, that the Renewal Agreements were fair and reasonable and in the best interest of each Renewal Fund.
In reaching this decision, the Board did not assign relative weights to the factors above nor did the Board deem any one factor or group of them to be controlling in and of themselves. Each member of the Board may have assigned different weights to the various factors.
230
![]()
Supplemental Information (unaudited)
NAV is the price per Share at which the Funds issue and redeem Shares. It is calculated in accordance with the standard formula for valuing mutual fund shares. The “Market Price” of a Fund generally is determined using the midpoint between the highest bid and the lowest offer on the stock exchange on which the Shares of the Fund are listed for trading, as of the time that the Fund’s NAV is calculated. A Fund’s Market Price may be at, above or below its NAV. The NAV of a Fund will fluctuate with changes in the market value of the Fund’s holdings. The Market Price of a Fund will fluctuate in accordance with changes in its NAV, as well as market supply and demand.
Premiums or discounts are the differences (expressed as a percentage) between the NAV and Market Price of a Fund on a given day, generally at the time NAV is calculated. A premium is the amount that a Fund is trading above the reported NAV, expressed as a percentage of the NAV. A discount is the amount that a Fund is trading below the reported NAV, expressed as a percentage of the NAV.
Further information regarding premiums and discounts is available on the Funds’ website at www.globalxetfs.com.
231
![]()
Notes
232
![]()
Notes
233
![]()
Notes
234
![]()
605 3rd Avenue, 43rd Floor
New York, NY 10158
1-888-493-8631
www.globalxetfs.com
Investment Adviser and Administrator:
Global X Management Company LLC
605 3rd Avenue, 43rd Floor
New York, NY 10158
Distributor:
SEI Investments Distribution Co.
One Freedom Valley Drive
Oaks, PA 19456
Sub-Administrator:
SEI Investments Global Funds Services
One Freedom Valley Drive
Oaks, PA 19456
Counsel for Global X Funds and the Independent Trustees:
Stradley Ronon Stevens & Young, LLP
2000 K Street, N.W.
Suite 700
Washington, DC 20006
Custodians and Transfer Agents:
Brown Brothers Harriman & Co.
40 Water Street
Boston, MA 02109
The Bank of New York Mellon
240 Greenwich Street
New York, NY 10286
Independent Registered Public Accounting Firm:
PricewaterhouseCoopers LLP
Two Commerce Square
Suite 1800
2001 Market Street
Philadelphia, PA 19103
This information must be preceded or accompanied by a current prospectus for the Funds described.
GLX-SA-012-0100
(b) Not applicable.
Item 2. Code of Ethics.
Not applicable for semi-annual report.
Item 3. Audit Committee Financial Expert.
Not applicable for semi-annual report.
Item 4. Principal Accountant Fees and Services.
Not applicable for semi-annual report.
Item 5. Audit Committee of Listed Registrants.
Not applicable for semi-annual report.
Item 6. Investments.
Schedule of Investments is included as part of the report to shareholders filed under Item 1 of this form.
Item 7. Disclosure of Proxy Voting Policies and Procedures for Closed-End Management Investment Companies.
Not applicable to open-end management investment companies.
Item 8. Portfolio Managers of Closed-End Management Investment Companies.
Not applicable to open-end management investment companies.
Item 9. Purchases of Equity Securities by Closed-End Management Investment Company and Affiliated Purchasers.
Not applicable to open-end management investment companies.
Item 10. Submission of Matters to a Vote of Security Holders.
There have been no material changes to the procedures by which shareholders may recommend nominees to the registrant’s board of directors.
Item 11. Controls and Procedures.
(a) The certifying officers, whose certifications are included herewith, have evaluated the registrant’s disclosure controls and procedures within 90 days of the filing date of this report. In their opinion, based on their evaluation, the registrant’s disclosure controls and procedures are adequately designed, and are operating effectively to ensure, that information required to be disclosed by the registrant in the reports it files or submits under the Securities Exchange Act of 1934 is recorded, processed, summarized and reported within the time periods specified in the Securities and Exchange Commission’s rules and forms.
(b) There were no significant changes in the registrant’s internal control over financial reporting that occurred during the period covered by this report that has materially affected, or is reasonably likely to materially affect, the registrant’s internal control over financial reporting.
Item 12. Disclosure of Securities Lending Activities for Closed-End Management Investment Companies.
Not applicable to open-end management investment companies.
Item 18. Recovery of Erroneously Awarded Compensation.
(a) Not applicable.
(b) Not applicable.
Item 19. Exhibits.
(a)(1) Not applicable.
(a)(2) Not applicable.
SIGNATURES
Pursuant to the requirements of the Securities Exchange Act of 1934 and the Investment Company Act of 1940, the registrant has duly caused this report to be signed on its behalf by the undersigned, thereunto duly authorized.
| (Registrant) | Global X Funds |
| By (Signature and Title) | /s/ Ryan O’Connor |
| Ryan O’Connor Principal Executive Officer |
Date: July 8, 2024
Pursuant to the requirements of the Securities Exchange Act of 1934 and the Investment Company Act of 1940, this report has been signed below by the following persons on behalf of the registrant and in the capacities and on the dates indicated.
| By (Signature and Title) | /s/ Ryan O’Connor |
| Ryan O’Connor Principal Executive Officer |
Date: July 8, 2024
| By (Signature and Title) | /s/ Eric Olsen |
| Eric Olsen Principal Financial Officer |
Date: July 8, 2024