united states
securities and exchange commission
washington, d.c. 20549
form n-csr
certified shareholder report of registered management
investment companies
Investment Company Act file number 811-22208
Valued Advisers Trust
(Exact name of registrant as specified in charter)
Ultimus Fund Solutions, LLC 225 Pictoria Drive, Suite 450 Cincinnati, OH 45246
(Address of principal executive offices) (Zip code)
Ultimus Fund Solutions, LLC
Attn: Zachary Richmond
225 Pictoria Drive, Suite 450
Cincinnati, OH 45246
(Name and address of agent for service)
Registrant's telephone number, including area code: 513-587-3400
Date of fiscal year end: 5/31
Date of reporting period: 11/30/2022
Item 1. Reports to Stockholders.
(a)
BFS Equity Fund
SEMI-ANNUAL REPORT
November 30, 2022

185 Asylum Street • City Place II • Hartford, CT 06103 • (855) 575-2430
BFS Equity Fund
Performance Review
November 30, 2022 - (Unaudited)
The total return of the BFS Equity Fund (the “Fund”) for the six-month period ended November 30, 2022 was -0.32%, which was slightly better than S&P 500® Index (“S&P 500”) total return of -0.40%. For the same period, the Fund’s return of -0.32% trailed the total return of the Dow Jones Industrial Average, which was +6.05%.
Key Contributors to Relative Results
| 1. | The Fund’s new position in Deere & Co. contributed significantly to performance during the period. |
| 2. | The Fund’s position in Costco was a major contributor to performance during the period. |
| 3. | The Fund’s significant holdings in treasury bills and cash reserves helped the Fund outperform the S&P 500 during the period. |
Key Detractors to Relative Results
| 1. | The Fund’s position in Meta Platforms in the Communications Services sector detracted from performance relative to this sector in the S&P 500. |
| 2. | The Fund’s overweight in the Materials sector, owning a major gold producing stock, detracted from performance in this sector. |
FUND INFORMATION
November 30, 2022
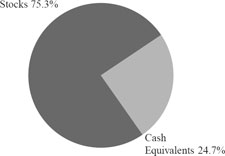
ASSET ALLOCATION
(as a percentage of net assets)
| TEN LARGEST HOLDINGS (%) | FUND | |
| ConocoPhillips | 5.3 | |
| Microsoft | 4.9 | |
| Apple | 4.8 | |
| UnitedHealth Group | 4.7 | |
| Alphabet, Inc. Class A | 4.3 | |
| Sherwin-Williams | 3.2 | |
| Thermo Fisher Scientific | 3.0 | |
| Costco | 2.9 | |
| IQVIA Holdings | 2.8 | |
| Home Depot | 2.8 |
| SECTOR | ||||
| DIVERSIFICATION (%) | FUND | S&P 500 | ||
| Cash Equivalents | 24.7 | 0.0 | ||
| Healthcare | 17.7 | 15.2 | ||
| Information Technology | 16.2 | 26.4 | ||
| Consumer Discretionary | 8.3 | 10.4 | ||
| Industrials | 6.5 | 8.4 | ||
| Energy | 6.4 | 5.1 | ||
| Materials | 5.5 | 2.7 | ||
| Communication Services | 5.2 | 7.5 | ||
| Financials | 4.9 | 11.6 | ||
| Consumer Staples | 4.6 | 7.0 | ||
| Real Estate | 0.0 | 2.7 | ||
| Utilities | 0.0 | 3.0 |
1
BFS Equity Fund
Performance Review (continued)
November 30, 2022 - (Unaudited)
Availability of Portfolio Schedules
The Fund files its complete schedule of portfolio holdings with the Securities and Exchange Commission (“SEC”) for the first and third quarters of each fiscal year as an exhibit to its reports on Form N-PORT. The Fund’s Form N-PORT reports are available on the SEC’s website at http://www. sec.gov and on the Fund’s website at www.bfsfunds.com.
2
Investment Results (Unaudited)
Average Annual Total Returns* as of November 30, 2022
| Since Inception | ||||||||
| Six Months | One Year | Five year | (November 8, 2013) | |||||
| BFS Equity Fund | (0.32)% | (12.89)% | 8.55% | 9.12% | ||||
| S&P 500® Index(a) | (0.40)% | (9.21)% | 10.98% | 11.77% | ||||
| Dow Jones Industrial Average(b) | 6.05% | 2.48% | 9.71% | 11.62% |
Total annual fund operating expenses, as disclosed in the BFS Equity Fund’s (the “Fund”) prospectus dated September 28, 2022 were 1.41% of average daily net assets (1.25% after fee waivers/expense reimbursements by Bradley, Foster & Sargent, Inc. (the “Adviser”)). The Adviser has contractually agreed to waive or limit its fees and to assume other expenses of the Fund until September 30, 2023, so that Total Annual Fund Operating Expenses does not exceed 1.00%. This contractual arrangement may only be terminated by mutual consent of the Adviser and the Board of Trustees of the Valued Advisers Trust (the “Trust”), and it will automatically terminate upon the termination of the investment advisory agreement between the Trust and the Adviser. This operating expense limitation does not apply to: (i) interest, (ii) taxes, (iii) brokerage commissions, (iv) other expenditures which are capitalized in accordance with generally accepted accounting principles, (v) other extraordinary expenses not incurred in the ordinary course of the Fund’s business, (vi) dividend expense on short sales, (vii) expenses incurred under a plan of distribution under Rule 12b-1, and (viii) expenses that the Fund has incurred but did not actually pay because of an expense offset or brokerage/service arrangements, if applicable, in any fiscal year. The operating expense limitation also excludes any “Acquired Fund Fees and Expenses,” which are the expenses indirectly incurred by the Fund as a result of investing in money market funds or other investment companies, including exchange-traded funds, that have their own expenses. Each waiver or reimbursement of an expense by the Adviser is subject to repayment by the Fund within the three years following the date of such waiver or reimbursement, provided that the Fund is able to make the repayment without exceeding the expense limitation in place at the time of the waiver or reimbursement and the expense limitation in place at the time of the repayment.
The performance quoted represents past performance, which does not guarantee future results. The investment return and principal value of an investment will fluctuate so that an investor’s shares, when redeemed, may be worth more or less than their original cost. The returns shown do not reflect deduction of taxes that a shareholder would pay on Fund distributions or the redemption of Fund shares. The Fund’s investment objectives, strategies, risks, charges and expenses must be considered carefully before investing. The prospectus contains this and other important information about the Fund and may be obtained by calling (855) 575-2430. Current performance of the Fund may be lower or higher than the performance quoted.
| * | Average annual total returns reflect any change in price per share and assume the reinvestment of all distributions. The Fund’s returns reflect any fee reductions during the applicable periods. If such fee reductions had not occurred, the quoted performance would have been lower. Total returns from periods less than one year are not annualized. |
| (a) | The S&P 500® Index is a widely recognized unmanaged index of equity prices and is representative of a broader market and range of securities than is found in the Fund’s portfolio. The index is an unmanaged benchmark that assumes reinvestment of all distributions and excludes the effect of taxes and fees. Individuals cannot invest directly in this index; however, an individual can invest in exchange-traded funds or other investment vehicles that attempt to track the performance of a benchmark index. |
| (b) | The Dow Jones Industrial Average® is a widely recognized unmanaged index of equity prices and is representative of a narrower market and range of securities than is found in the Fund’s portfolio. The index is an unmanaged benchmark that assumes reinvestment of all distributions and excludes the effect of taxes and fees. Individuals cannot invest directly in this index; however, an individual can invest in exchange-traded funds or other investment vehicles that attempt to track the performance of a benchmark index. |
The Fund is distributed by Ultimus Fund Distributors, LLC, Member FINRA/SIPC.
3
| BFS Equity Fund |
| Schedule of Investments |
| November 30, 2022 - (Unaudited) |
| COMMON STOCKS — 75.30% | Shares | Fair Value | ||||||
| Aerospace & Defense — 4.10% | ||||||||
| Northrop Grumman Corp. | 2,000 | $ | 1,066,580 | |||||
| Raytheon Technologies Corp. | 8,500 | 839,120 | ||||||
| 1,905,700 | ||||||||
| Banking — 2.23% | ||||||||
| JPMorgan Chase & Co. | 7,500 | 1,036,350 | ||||||
| Beverages — 1.60% | ||||||||
| PepsiCo, Inc. | 4,000 | 742,040 | ||||||
| Biotech & Pharmaceuticals — 3.59% | ||||||||
| AbbVie, Inc. | 7,500 | 1,208,850 | ||||||
| Zoetis, Inc., Class A | 3,000 | 462,420 | ||||||
| 1,671,270 | ||||||||
| Cable & Satellite — 0.39% | ||||||||
| Comcast Corp., Class A | 5,000 | 183,200 | ||||||
| Chemicals — 3.86% | ||||||||
| Ecolab, Inc. | 2,000 | 299,660 | ||||||
| Sherwin-Williams Co. (The) | 6,000 | 1,495,080 | ||||||
| 1,794,740 | ||||||||
| E-Commerce Discretionary — 1.87% | ||||||||
| Amazon.com, Inc.(a) | 9,000 | 868,860 | ||||||
| Health Care Facilities & Services — 7.52% | ||||||||
| IQVIA Holdings, Inc.(a) | 6,000 | 1,308,120 | ||||||
| UnitedHealth Group, Inc. | 4,000 | 2,191,040 | ||||||
| 3,499,160 | ||||||||
| Home Construction — 0.92% | ||||||||
| D.R. Horton, Inc. | 5,000 | 430,000 | ||||||
| Insurance — 1.86% | ||||||||
| Marsh & McLennan Cos., Inc. | 5,000 | 865,900 | ||||||
| Internet Media & Services — 4.85% | ||||||||
| Alphabet, Inc., Class A(a) | 20,000 | 2,019,800 | ||||||
| Meta Platforms, Inc., Class A(a) | 2,000 | 236,200 | ||||||
| 2,256,000 | ||||||||
| Machinery — 2.37% | ||||||||
| Deere & Co. | 2,500 | 1,102,500 | ||||||
| Medical Equipment & Devices — 6.62% | ||||||||
| Danaher Corp. | 4,000 | 1,093,640 | ||||||
| Stryker Corp. | 2,500 | 584,725 | ||||||
| Thermo Fisher Scientific, Inc. | 2,500 | 1,400,550 | ||||||
| 3,078,915 | ||||||||
| Metals & Mining — 1.60% | ||||||||
| Agnico Eagle Mines Ltd. | 7,500 | 377,775 | ||||||
| Franco-Nevada Corp. | 2,500 | 365,300 | ||||||
| 743,075 | ||||||||
| Oil & Gas Producers — 5.31% | ||||||||
| ConocoPhillips | 20,000 | 2,470,200 | ||||||
See accompanying notes which are an integral part of these financial statements.
4
| BFS Equity Fund |
| Schedule of Investments (continued) |
| November 30, 2022 - (Unaudited) |
| COMMON STOCKS — 75.30% - continued | Shares | Fair Value | ||||||
| Oil & Gas Services & Equipment — 1.11% | ||||||||
| Schlumberger Ltd. | 10,000 | $ | 515,500 | |||||
| Retail - Consumer Staples — 2.89% | ||||||||
| Costco Wholesale Corp. | 2,500 | 1,348,125 | ||||||
| Retail - Discretionary — 5.53% | ||||||||
| Home Depot, Inc. (The) | 4,000 | 1,295,960 | ||||||
| Lowe’s Cos., Inc. | 6,000 | 1,275,300 | ||||||
| 2,571,260 | ||||||||
| Software — 7.46% | ||||||||
| Adobe, Inc.(a) | 2,000 | 689,860 | ||||||
| Microsoft Corp. | 9,000 | 2,296,260 | ||||||
| SS&C Technologies Holdings, Inc. | 9,000 | 483,840 | ||||||
| 3,469,960 | ||||||||
| Specialty Finance — 0.85% | ||||||||
| American Express Co. | 2,500 | 393,975 | ||||||
| Technology Hardware — 4.77% | ||||||||
| Apple, Inc. | 15,000 | 2,220,450 | ||||||
| Technology Services — 4.00% | ||||||||
| Automatic Data Processing, Inc. | 3,000 | 792,420 | ||||||
| MasterCard, Inc., Class A | 3,000 | 1,069,200 | ||||||
| 1,861,620 | ||||||||
| Total Common Stocks (Cost $18,448,206) | 35,028,800 | |||||||
| Principal | ||||||||
| U.S. GOVERNMENT & AGENCIES — 22.16% | Amount | |||||||
| United States Treasury Bill, 3.03%, 2/16/2023(b) | $ | 1,000,000 | 991,210 | |||||
| United States Treasury Bill, 3.48%, 3/9/2023(b) | 1,500,000 | 1,482,689 | ||||||
| United States Treasury Bill, 3.97%, 4/6/2023(b) | 2,000,000 | 1,970,886 | ||||||
| United States Treasury Bill, 4.45%, 5/11/2023(b) | 5,000,000 | 4,899,837 | ||||||
| United States Treasury Note, 0.13%, 8/31/2023 | 1,000,000 | 966,246 | ||||||
| Total U.S. Government & Agencies (Cost $10,326,345) | 10,310,868 | |||||||
| MONEY MARKET FUNDS - 2.43% | Shares | |||||||
| Fidelity Investments Money Market Government Portfolio, Institutional Class, 3.60%(c) | 1,129,990 | 1,129,990 | ||||||
| Total Money Market Funds (Cost $1,129,990) | 1,129,990 | |||||||
| Total Investments — 99.89% | ||||||||
| (Cost $29,904,541) | 46,469,658 | |||||||
| Other Assets in Excess of Liabilities — 0.11% | 49,874 | |||||||
| NET ASSETS — 100.00% | $ | 46,519,532 | ||||||
| (a) | Non-income producing security. |
| (b) | The rate shown represents effective yield at time of purchase. |
| (c) | Rate disclosed is the seven day effective yield as of November 30, 2022. |
See accompanying notes which are an integral part of these financial statements.
5
| BFS Equity Fund |
| Statement of Assets and Liabilities |
| November 30, 2022 - (Unaudited) |
| Assets | ||||
| Investments in securities at fair value (cost $29,904,541) (Note 3) | $ | 46,469,658 | ||
| Receivable for fund shares sold | 52,316 | |||
| Dividends and interest receivable | 46,256 | |||
| Prepaid expenses | 21,233 | |||
| Total Assets | 46,589,463 | |||
| Liabilities | ||||
| Payable for fund shares redeemed | 4,500 | |||
| Payable to Adviser (Note 4) | 20,129 | |||
| Payable to Administrator (Note 4) | 7,049 | |||
| Distribution (12b-1) fees accrued (Note 4) | 18,559 | |||
| Other accrued expenses | 19,694 | |||
| Total Liabilities | 69,931 | |||
| Net Assets | $ | 46,519,532 | ||
| Net Assets consist of: | ||||
| Paid-in capital | $ | 30,220,293 | ||
| Accumulated earnings | 16,299,239 | |||
| Net Assets | $ | 46,519,532 | ||
| Shares outstanding (unlimited number of shares authorized, no par value) | 2,520,167 | |||
| Net asset value, offering and redemption price per share (Note 2) | $ | 18.46 | ||
See accompanying notes which are an integral part of these financial statements.
6
| BFS Equity Fund |
| Statement of Operations |
| For the six months ended November 30, 2022 (Unaudited) |
| Investment Income | ||||
| Dividend income (net of foreign taxes withheld of $1,020) | $ | 274,197 | ||
| Interest income | 95,248 | |||
| Total investment income | 369,445 | |||
| Expenses | ||||
| Investment Adviser fees (Note 4) | 169,564 | |||
| Distribution (12b-1) fees (Note 4) | 56,521 | |||
| Administration and compliance services fees (Note 4) | 19,960 | |||
| Registration expenses | 13,007 | |||
| Fund accounting fees (Note 4) | 12,926 | |||
| Legal fees | 9,512 | |||
| Transfer agent fees (Note 4) | 9,284 | |||
| Audit and tax preparation fees | 9,264 | |||
| Printing and postage expenses | 5,419 | |||
| Trustee fees | 3,916 | |||
| Custodian fees | 2,172 | |||
| Insurance expenses | 1,594 | |||
| Miscellaneous | 17,051 | |||
| Total expenses | 330,190 | |||
| Fees contractually waived by Adviser (Note 4) | (47,629 | ) | ||
| Net operating expenses | 282,561 | |||
| Net investment income | 86,884 | |||
| Net Realized and Change in Unrealized Gain (Loss) on Investments | ||||
| Net realized loss on: | ||||
| Investment securities transactions | (763,358 | ) | ||
| Net change in unrealized appreciation on investments | 496,663 | |||
| Net realized and change in unrealized loss on investments | (266,695 | ) | ||
| Net decrease in net assets resulting from operations | $ | (179,811 | ) | |
See accompanying notes which are an integral part of these financial statements.
7
| BFS Equity Fund |
| Statements of Changes in Net Assets |
| For the Six Months | ||||||||
| Ended November | For the Year Ended | |||||||
| 30, 2022 | May 31, 2022 | |||||||
| (Unaudited) | ||||||||
| Increase (Decrease) in Net Assets due to: | ||||||||
| Operations | ||||||||
| Net investment income (loss) | $ | 86,884 | $ | (67,221 | ) | |||
| Net realized gain (loss) on investment securities transactions | (763,358 | ) | 1,088,978 | |||||
| Net change in unrealized appreciation (depreciation) on investments | 496,663 | (3,327,716 | ) | |||||
| Net decrease in net assets resulting from operations | (179,811 | ) | (2,305,959 | ) | ||||
| Distributions to Shareholders from Earnings (Note 2) | — | (4,932,792 | ) | |||||
| Capital Transactions | ||||||||
| Proceeds from shares sold | 1,387,836 | 4,636,535 | ||||||
| Reinvestment of distributions | — | 3,969,021 | ||||||
| Amount paid for shares redeemed | (1,454,854 | ) | (3,381,233 | ) | ||||
| Net increase (decrease) in net assets resulting from capital transactions | (67,018 | ) | 5,224,323 | |||||
| Total Decrease in Net Assets | (246,829 | ) | (2,014,428 | ) | ||||
| Net Assets | ||||||||
| Beginning of period | 46,766,361 | 48,780,789 | ||||||
| End of period | $ | 46,519,532 | $ | 46,766,361 | ||||
| Share Transactions | ||||||||
| Shares sold | 77,939 | 212,101 | ||||||
| Shares issued in reinvestment of distributions | — | 186,866 | ||||||
| Shares redeemed | (82,273 | ) | (158,072 | ) | ||||
| Net increase (decrease) in shares outstanding | (4,334 | ) | 240,895 | |||||
See accompanying notes which are an integral part of these financial statements.
8
| BFS Equity Fund |
| Financial Highlights |
(For a share outstanding during each period)
| For the Six | For the Years Ended May 31, | |||||||||||||||||||||||
| Months | ||||||||||||||||||||||||
| Ended | ||||||||||||||||||||||||
| November | ||||||||||||||||||||||||
| 30, 2022 | ||||||||||||||||||||||||
| (Unaudited) | 2022 | 2021 | 2020 | 2019 | 2018 | |||||||||||||||||||
| Selected Per Share Data: | ||||||||||||||||||||||||
| Net asset value, beginning of period | $ | 18.52 | $ | 21.36 | $ | 16.10 | $ | 15.40 | $ | 14.96 | $ | 13.01 | ||||||||||||
| Income from investment operations: | ||||||||||||||||||||||||
| Net investment income (loss) | 0.03 | (0.03 | ) | (0.02 | ) | 0.03 | 0.04 | 0.04 | ||||||||||||||||
| Net realized and unrealized gain/(loss) on investments | (0.09 | ) | (0.71 | ) | 5.57 | 0.97 | 0.90 | 1.96 | ||||||||||||||||
| Total from investment operations | (0.06 | ) | (0.74 | ) | 5.55 | 1.00 | 0.94 | 2.00 | ||||||||||||||||
| Less distributions to shareholders from: | ||||||||||||||||||||||||
| Net investment income | — | — | — | (0.03 | ) | (0.04 | ) | (0.04 | ) | |||||||||||||||
| Net realized gains | — | (2.10 | ) | (0.29 | ) | (0.27 | ) | (0.46 | ) | (0.01 | ) | |||||||||||||
| Total distributions | — | (2.10 | ) | (0.29 | ) | (0.30 | ) | (0.50 | ) | (0.05 | ) | |||||||||||||
| Net asset value, end of period | $ | 18.46 | $ | 18.52 | $ | 21.36 | $ | 16.10 | $ | 15.40 | $ | 14.96 | ||||||||||||
| Total Return(a) | (0.32 | )% (b) | (4.71 | )% | 34.68 | % | 6.32 | % | 6.84 | % | 15.36 | % | ||||||||||||
| Ratios and Supplemental Data: | ||||||||||||||||||||||||
| Net assets, end of period (000 omitted) | $ | 46,520 | $ | 46,766 | $ | 48,781 | $ | 38,864 | $ | 35,960 | $ | 31,750 | ||||||||||||
| Ratio of net expenses to average net assets | 1.25 | % (c) | 1.25 | % | 1.25 | % | 1.25 | % | 1.25 | % | 1.25 | % | ||||||||||||
| Ratio of expenses to average net assets before waiver and reimbursement | 1.46 | % (c) | 1.41 | % | 1.46 | % | 1.52 | % | 1.57 | % | 1.65 | % | ||||||||||||
| Ratio of net investment income (loss) to average net assets | 0.38 | % (c) | (0.13 | )% | (0.12 | )% | 0.21 | % | 0.28 | % | 0.26 | % | ||||||||||||
| Portfolio turnover rate | 11.68 | % (b) | 61.08 | % | 68.77 | % | 49.27 | % | 38.71 | % | 38.17 | % | ||||||||||||
| (a) | Total return represents the rate that the investor would have earned or lost on an investment in the Fund, assuming reinvestment of distributions. |
| (b) | Not annualized. |
| (c) | Annualized. |
See accompanying notes which are an integral part of these financial statements.
9
| BFS Equity Fund |
| Notes to the Financial Statements |
| November 30, 2022 - (Unaudited) |
NOTE 1. ORGANIZATION
The BFS Equity Fund (the “Fund”) is registered under the Investment Company Act of 1940, as amended (“1940 Act”), as an open-end diversified series of Valued Advisers Trust (the “Trust”) and commenced operations on November 8, 2013. The Trust is a management investment company established under the laws of Delaware by an Agreement and Declaration of Trust dated June 13, 2008 (the “Trust Agreement”). The Trust Agreement permits the Board of Trustees (the “Board” or the “Trustees”) to issue an unlimited number of shares of beneficial interest of separate series without par value. The Fund is one of a series of funds authorized by the Board. The Fund’s investment adviser is Bradley, Foster & Sargent, Inc. (the “Adviser”). The investment objective of the Fund is long-term appreciation through growth of principal and income.
NOTE 2. SIGNIFICANT ACCOUNTING POLICIES
The Fund is an investment company and follows accounting and reporting guidance under Financial Accounting Standards Board Accounting Standards Codification (“ASC”) Topic 946, “Financial Services-Investment Companies”. The following is a summary of significant accounting policies followed by the Fund in the preparation of its financial statements. These policies are in conformity with generally accepted accounting principles in the United States of America (“GAAP”).
Estimates – The preparation of financial statements in conformity with GAAP requires management to make estimates and assumptions that affect the reported amounts of assets and liabilities and disclosure of contingent assets and liabilities at the date of the financial statements and the reported amounts of increases and decreases in net assets from operations during the reporting period. Actual results could differ from those estimates.
Federal Income Taxes – The Fund makes no provision for federal income or excise tax. The Fund has qualified and intends to qualify each year as a regulated investment company (“RIC”) under subchapter M of the Internal Revenue Code of 1986, as amended, by complying with the requirements applicable to RICs and by distributing substantially all of its taxable income. The Fund also intends to distribute sufficient net investment income and net realized capital gains, if any, so that it will not be subject to excise tax on undistributed income and gains. If the required amount of net investment income or gains is not distributed, the Fund could incur a tax expense.
As of and during the six months ended November 30, 2022, the Fund did not have any liabilities for any unrecognized tax benefits. The Fund recognizes interest and penalties, if any, related to unrecognized tax benefits as income tax expense on the Statement of Operations when incurred. During the six months ended November 30, 2022, the Fund did not incur any interest or penalties. Management of the Fund has reviewed tax positions
10
| BFS Equity Fund |
| Notes to the Financial Statements (continued) |
| November 30, 2022 - (Unaudited) |
taken in tax years that remain subject to examination by all major tax jurisdictions, including federal (i.e., the last three tax year ends and the interim tax period since then, as applicable). Management believes that there is no tax liability resulting from unrecognized tax benefits related to uncertain tax positions taken.
Expenses – Expenses incurred by the Trust that do not relate to a specific fund of the Trust are allocated to the individual funds based on each fund’s relative net assets or another appropriate basis (as determined by the Board).
Security Transactions and Related Income – The Fund follows industry practice and records security transactions on the trade date for financial reporting purposes. For financial statement and income tax purposes, the specific identification method is used for determining capital gains or losses. Dividend income is recorded on the ex-dividend date and interest income is recorded on an accrual basis. Discounts and premiums on securities purchased are accreted or amortized using the effective interest method. Dividend income from real estate investment trusts (REITs) and distributions from limited partnerships are recognized on the ex-date. The calendar year end classification of distributions received from REITs during the fiscal year are reported subsequent to year end; accordingly, the Fund estimates the character of REIT distributions based on the most recent information available. Income or loss from Limited Partnerships is reclassified among the components of net assets upon receipt of Schedules K-1 (Form 1065). Non-cash income, if any, is recorded at the fair market value of the securities received. Withholding taxes on foreign dividends, if any, have been provided for in accordance with the Fund’s understanding of the applicable country’s tax rules and rates.
Foreign Currency Translation – The accounting records of the Fund are maintained in U.S. dollars. Foreign currency amounts are translated into U.S. dollars at the current rate of exchange each business day to determine the value of investments, and other assets and liabilities. Purchases and sales of foreign securities, and income and expenses, are translated at the prevailing rate of exchange on the respective date of these transactions. The Fund does not isolate that portion of the results of operations resulting from changes in foreign exchange rates on investments from fluctuation arising from changes in market prices of securities held. These fluctuations are included with the unrealized gain or loss from investments. Reported net realized foreign exchange gains or losses arise from sales of foreign currencies, currency gains or losses realized between the trade and settlement dates on securities transactions, and the difference between the amounts of dividends, interest, and foreign withholding taxes recorded on the Fund’s books and the U.S. dollar equivalent of the amounts actually received or paid. Net unrealized foreign exchange gains and losses arise from changes in the fair values of assets and liabilities, other than investments in securities at period end, resulting from changes in exchange rates.
11
| BFS Equity Fund |
| Notes to the Financial Statements (continued) |
| November 30, 2022 - (Unaudited) |
Dividends and Distributions – The Fund intends to distribute its net investment income and net realized long-term and short-term capital gains, if any, at least annually. Dividends and distributions to shareholders, which are determined in accordance with income tax regulations, are recorded on the ex-dividend date. The treatment for financial reporting purposes of distributions made to shareholders during the period from net investment income or net realized capital gains may differ from their ultimate treatment for federal income tax purposes. These differences are caused primarily by differences in the timing of the recognition of certain components of income, expense or realized capital gain for federal income tax purposes. Where such differences are permanent in nature, they are reclassified among the components of net assets based on their ultimate characterization for federal income tax purposes. Any such reclassifications will have no effect on net assets, results of operations or net asset value (“NAV”) per share of the Fund.
Share Valuation – The NAV is calculated each day the New York Stock Exchange (the “NYSE”) is open by dividing the total value of the Fund’s assets, less liabilities, by the number of shares outstanding for the Fund.
NOTE 3. SECURITIES VALUATION AND FAIR VALUE MEASUREMENTS
The Fund values its portfolio securities at fair value as of the close of regular trading on the NYSE (normally 4:00 p.m. Eastern time) on each business day the NYSE is open for business. Fair value is defined as the price that the Fund would receive upon selling an investment in a timely transaction to an independent buyer in the principal or most advantageous market of the investment. GAAP establishes a three-tier hierarchy to maximize the use of observable market data and minimize the use of unobservable inputs and to establish classification of fair value measurements for disclosure purposes.
Inputs refer broadly to the assumptions that market participants would use in pricing the asset or liability, including assumptions about risk (the risk inherent in a particular valuation technique used to measure fair value including a pricing model and/or the risk inherent in the inputs to the valuation technique). Inputs may be observable or unobservable. Observable inputs are inputs that reflect the assumptions market participants would use in pricing the asset or liability developed based on market data obtained and available from sources independent of the reporting entity. Unobservable inputs are inputs that reflect the reporting entity’s own assumptions about the assumptions market participants would use in pricing the asset or liability developed based on the best information available in the circumstances.
Various inputs are used in determining the value of the Fund’s investments. These inputs are summarized in the three broad levels listed below.
12
| BFS Equity Fund |
| Notes to the Financial Statements (continued) |
| November 30, 2022 - (Unaudited) |
| ● | Level 1 – unadjusted quoted prices in active markets for identical investments and/or registered investment companies where the value per share is determined and published and is the basis for current transactions for identical assets or liabilities at the valuation date |
| ● | Level 2 – other significant observable inputs (including, but not limited to, quoted prices for an identical security in an inactive market, quoted prices for similar securities, interest rates, prepayment speeds, credit risk, etc.) |
| ● | Level 3 – significant unobservable inputs (including the Fund’s own assumptions in determining fair value of investments based on the best information available) |
The inputs used to measure fair value may fall into different levels of the fair value hierarchy. In such cases, for disclosure purposes, the level in the fair value hierarchy which is reported is determined based on the lowest level input that is significant to the fair value measurement in its entirety.
Debt securities are valued by using the mean between the closing bid and ask prices provided by a pricing service. If the closing bid and ask prices are not readily available, the pricing service may provide a price determined by a matrix pricing method. Matrix pricing is a mathematical technique used to value fixed income securities without relying exclusively on quoted prices. Matrix pricing takes into consideration recent transactions, yield, liquidity, risk, credit quality, coupon, maturity, type of issue and any other factors or market data the pricing service deems relevant for the actual security being priced and for other securities with similar characteristics. These securities will generally be categorized as Level 2 securities. If the Adviser decides that a price provided by the pricing service does not accurately reflect the fair value of the securities or when prices are not readily available from a pricing service, securities are valued at fair value as determined by the Adviser, in conformity with guidelines adopted by and subject to review of the Board. These securities will generally be categorized as Level 3 securities.
Equity securities that are traded on any stock exchange are generally valued at the last quoted sale price on the security’s primary exchange. Lacking a last sale price, an exchange-traded security is generally valued at its last bid price. Securities traded in the NASDAQ over-the-counter market are generally valued at the NASDAQ Official Closing Price. When using the market quotations and when the market is considered active, the security is classified as a Level 1 security. In the event that market quotations are not readily available or are considered unreliable due to market or other events, securities are valued in good faith by the Adviser as “valuation designee” under the oversight of the Board. The Adviser has adopted written policies and procedures for valuing securities and other assets in circumstances where market quotes are not readily available. In the event that market quotes are not readily available, and the security or asset cannot be
13
| BFS Equity Fund |
| Notes to the Financial Statements (continued) |
| November 30, 2022 - (Unaudited) |
valued pursuant to one of the valuation methods, the value of the security or asset will be determined in good faith by the Adviser pursuant to its policies and procedures. On a quarterly basis, the Adviser’s fair valuation determinations will be reviewed by the Board. Under these policies, the securities will be classified as Level 2 or 3 within the fair value hierarchy, depending on the inputs used.
Investments in mutual funds, including money market mutual funds, are generally priced at the ending NAV. These securities are categorized as Level 1 securities.
The following is a summary of the inputs used to value the Fund’s investments as of November 30, 2022:
| Valuation Inputs | ||||||||||||||||
| Assets | Level 1 | Level 2 | Level 3 | Total | ||||||||||||
| Common Stocks (a) | $ | 35,028,800 | $ | — | $ | — | $ | 35,028,800 | ||||||||
| U.S. Government & Agencies | — | 10,310,868 | — | 10,310,868 | ||||||||||||
| Money Market Funds | 1,129,990 | — | — | 1,129,990 | ||||||||||||
| Total | $ | 36,158,790 | $ | 10,310,868 | $ | — | $ | 46,469,658 | ||||||||
| (a) | Refer to Schedule of Investments for industry classifications. |
The Fund did not hold any investments at the end of the reporting period for which significant unobservable inputs (Level 3) were used in determining fair value; therefore, no reconciliation of Level 3 securities is included for this reporting period.
NOTE 4. FEES AND OTHER TRANSACTIONS WITH AFFILIATES AND OTHER SERVICE PROVIDERS
Under the terms of the investment advisory agreement on behalf of the Fund, the Adviser manages the Fund’s investments subject to oversight of the Board. As compensation for its services, the Fund pays the Adviser a fee, computed and accrued daily and paid monthly, at an annual rate of 0.75% of the average daily net assets of the Fund.
The Adviser has contractually agreed to waive or limit its management fee and/or reimburse certain operating expenses until September 30, 2023, but only to the extent necessary so that the Fund’s net expenses, excluding brokerage fees and commissions, borrowing costs (such as interest and dividend expenses on securities sold short), taxes, extraordinary expenses, fees and expenses paid under a distribution plan adopted pursuant to Rule 12b-1 fees and indirect expenses (such as “acquired funds fees and expenses”) do not exceed 1.00%.
Each waiver or reimbursement of an expense by the Adviser is subject to repayment by the Fund within the three years following the date of such waiver or reimbursement, provided that the Fund is able to make the repayment without exceeding the expense limitation in place at the time of the waiver or reimbursement and the expense limitation in place
14
| BFS Equity Fund |
| Notes to the Financial Statements (continued) |
| November 30, 2022 - (Unaudited) |
at the time of the repayment. This contractual arrangement may only be terminated by mutual consent of the Adviser and the Board, and it will automatically terminate upon the termination of the investment advisory agreement between the Trust and the Adviser. For the six months ended November 30, 2022, the Adviser waived fees of $47,629.
The amounts subject to repayment by the Fund, pursuant to the aforementioned conditions, are as follows:
| Recoverable Through | ||||
| May 31, 2023 | $ | 55,470 | ||
| May 31, 2024 | 93,387 | |||
| May 31, 2025 | 83,599 | |||
| November 30, 2025 | 47,629 |
The Trust retains Ultimus Fund Solutions, LLC (“Ultimus” or “Administrator”) to provide the Fund with administration, fund accounting and transfer agent services, including all regulatory reporting.
Northern Lights Compliance Services, LLC (“NLCS”), an affiliate of Ultimus, provides a Chief Compliance Officer to the Trust, as well as related compliance services, pursuant to a consulting agreement between NLCS and the Trust. Under the terms of such agreement, NLCS receives fees from the Fund.
The officers and one trustee of the Trust are members of management and/or employees of the Administrator or of NLCS, and are not paid by the Trust for services to the Fund. Ultimus Fund Distributors, LLC (the “Distributor”) acts as the distributor of the Fund’s shares. The Distributor is a wholly-owned subsidiary of Ultimus. There were no payments made to the Distributor by the Fund for the six months ended November 30, 2022.
The Fund has adopted a Distribution Plan (the “Plan”) pursuant to Rule 12b-1 under the 1940 Act. The Plan provides that the Fund will pay the Distributor and/or any registered securities dealer, financial institution or any other person (the “Recipient”) a shareholder servicing fee of 0.25% of the average daily net assets of the Fund in connection with the promotion and distribution of the Fund’s shares or the provision of shareholder support services to shareholders, including, but not necessarily limited to, advertising, compensation to underwriters, dealers and selling personnel, the printing and mailing of prospectuses to other than current Fund shareholders, the printing and mailing of sales literature and servicing shareholder accounts (“12b-1 fees”). The Fund or Distributor may pay all or a portion of these fees to any Recipient who renders assistance in distributing or promoting the sale of shares, or who provides certain shareholder services, pursuant to a written agreement.
15
| BFS Equity Fund |
| Notes to the Financial Statements (continued) |
| November 30, 2022 - (Unaudited) |
NOTE 5. PURCHASES AND SALES OF SECURITIES
For the six months ended November 30, 2022, purchases and sales of investment securities, other than short-term investments, were $4,060,507 and $5,763,936, respectively.
There were no purchases or sales of long-term U.S. government obligations during the six months ended November 30, 2022.
NOTE 6. FEDERAL TAX INFORMATION
At November 30, 2022, the net unrealized appreciation (depreciation) and tax cost of investments for tax purposes was as follows:
| Gross unrealized appreciation | $ | 16,769,208 | ||
| Gross unrealized depreciation | (260,447 | ) | ||
| Net unrealized appreciation on investments | $ | 16,508,761 | ||
| Tax cost of investments | $ | 29,960,897 |
At November 30, 2022, the difference between book basis and tax basis unrealized appreciation (depreciation) is attributable to the tax deferral of losses on wash sales.
The tax character of distributions paid for the fiscal year ended May 31, 2022, the Fund’s most recent fiscal year end, was as follows:
| Distributions paid from: | ||||
| Ordinary income(a) | $ | 1,733,996 | ||
| Long-term capital gains | 3,198,796 | |||
| Total distributions paid | $ | 4,932,792 |
| (a) | Short-term capital gain distributions are treated as ordinary income for tax purposes. |
At May 31, 2022, the components of accumulated earnings (deficit) on a tax basis were as follows:
| Undistributed long-term capital gains | $ | 506,201 | ||
| Accumulated capital and other losses | (39,249 | ) | ||
| Unrealized appreciation (depreciation) | 16,012,098 | |||
| Total | $ | 16,479,050 |
Certain qualified late year ordinary losses incurred after December 31, and within the current taxable year, are deemed to arise on the first business day of the Fund’s following taxable year. For the tax year ended May 31, 2022, the Fund deferred Qualified Late Year Ordinary Losses in the amount of $39,249.
16
| BFS Equity Fund |
| Notes to the Financial Statements (continued) |
| November 30, 2022 - (Unaudited) |
NOTE 7. COMMITMENTS AND CONTINGENCIES
The Trust indemnifies its officers and Trustees for certain liabilities that may arise from their performance of their duties to the Trust or the Fund. Additionally, in the normal course of business, the Trust enters into contracts that contain a variety of representations and warranties which provide general indemnifications. The Trust’s maximum exposure under these arrangements is unknown, as this would involve future claims that may be made against the Trust that have not yet occurred.
NOTE 8. SUBSEQUENT EVENTS
Management of the Fund has evaluated the need for disclosures and/or adjustments resulting from subsequent events through the date at which these financial statements were issued. Based upon this evaluation, management has determined there were no items requiring adjustment of the financial statements or additional disclosure.
17
| Liquidity Risk Management Program (Unaudited) |
Valued Advisers Trust has adopted and implemented a written liquidity risk management program as required by Rule 22e-4 (the “Liquidity Rule”) under the 1940 Act. The program is reasonably designed to assess and manage the Fund’s liquidity risk, taking into consideration, among other factors, the Fund’s investment strategy and the liquidity of its portfolio investments during normal and reasonably foreseeable stressed conditions; its short and long-term cash flow projections; and its cash holdings and access to other funding sources. The Board of Trustees approved the appointment of a Liquidity Administrator Committee, which includes representatives from Bradley, Foster & Sargent, Inc., the Fund’s investment adviser, and Ultimus Fund Solutions, LLC, the Fund’s Administrator. The Liquidity Administrator Committee is responsible for the program’s administration and oversight and for reporting to the Board on at least an annual basis regarding the program’s operation and effectiveness. The Liquidity Administrator Committee updated its assessment of the Fund’s liquidity risk profile, considering additional data gathered during the period June 1, 2021 through May 31, 2022 (the “Review Period”) and the adequacy and effectiveness of the liquidity risk management program’s operations during the Review Period in order to prepare a written report for the Board of Trustees (the “Report”) for consideration at its meeting held on September 7, 2022. The Report noted that during the Review Period the Fund did not experience unusual stress or disruption to its operations related to purchase and redemption activity. It further noted that during the Review Period the Fund held adequate levels of cash and highly liquid investments to meet shareholder redemption activities in accordance with applicable requirements. The Report concluded that (i) the Trust’s liquidity risk management program is reasonably designed to prevent violations of the Liquidity Rule and (ii) the Trust’s liquidity risk management program had been effectively implemented during the Review Period.
18
| Summary of Fund Expenses (Unaudited) |
As a shareholder of the Fund, you incur two types of costs: (1) transaction and (2) ongoing costs, including management fees and other Fund expenses. These examples are intended to help you understand your ongoing costs (in dollars) of investing in the Fund and to compare these costs with the ongoing costs of investing in other funds. The example is based on an investment of $1,000 invested at the beginning of the period and held for the entire period from June 1, 2022 through November 30, 2022.
Actual Expenses
The first line of the table below provides information about actual account values and actual expenses. You may use the information in this line, together with the amount you invested, to estimate the expenses that you paid over the period. Simply divide your account value by $1,000 (for example, an $8,600 account value divided by $1,000 = 8.6), then multiply the result by the number in the first line under the heading “Expenses Paid During Period” to estimate the expenses you paid on your account during this period.
Hypothetical Example for Comparison Purposes
The second line of the table below provides information about hypothetical account values and hypothetical expenses based on the Fund’s actual expense ratio and an assumed rate of return of 5% per year before expenses, which is not the Fund’s actual return. The hypothetical account values and expenses may not be used to estimate the actual ending account balance or expenses you paid for the period. You may use this information to compare the ongoing costs of investing in the Fund and other funds. To do so, compare this 5% hypothetical example with the 5% hypothetical examples that appear in the shareholder reports of other funds.
Expenses shown in the table are meant to highlight your ongoing costs only and do not reflect any transactional costs. Therefore, the second line of the table below is useful in comparing ongoing costs only and will not help you determine the relative total costs of owning different funds. In addition, if transaction costs were included, your costs would have been higher.
| Beginning | Ending | |||||||||||||
| Account | Account | Expenses | ||||||||||||
| Value | Value | Paid | Annualized | |||||||||||
| June 1, | November | During | Expense | |||||||||||
| 2022 | 30, 2022 | Period(a) | Ratio | |||||||||||
| Actual | $ | 1,000.00 | $ | 996.80 | $ | 6.26 | 1.25% | |||||||
| Hypothetical(b) | $ | 1,000.00 | $ | 1,018.80 | $ | 6.33 | 1.25% | |||||||
| (a) | Expenses are equal to the Fund’s annualized expense ratio, multiplied by the average account value over the period, multiplied by 183/365 (to reflect the one-half year period). |
| (b) | Hypothetical assumes 5% annual return before expenses. |
19
Privacy Policy
| FACTS | WHAT DOES BFS EQUITY FUND (THE “FUND”) DO WITH YOUR PERSONAL INFORMATION? | |
| Why? | Financial companies choose how they share your personal information. Federal law gives consumers the right to limit some but not all sharing. Federal law also requires us to tell you how we collect, share, and protect your personal information. Please read this notice carefully to understand what we do. | |
| What? | The types of personal information we collect and share depend on the product or service you have with us. This information can include:
■ Social Security number
■ account balances and account transactions
■ transaction or loss history and purchase history
■ checking account information and wire transfer instructions
When you are no longer our customer, we continue to share your information as described in this notice. | |
| How? | All financial companies need to share customers’ personal information to run their everyday business. In the section below, we list the reasons financial companies can share their customers’ personal information; the reasons the Fund chooses to share; and whether you can limit this sharing. | |
| Reasons we can share your personal information | Does the Fund share? | |
For our everyday business purposes — such as to process your transactions, maintain your account(s), respond to court orders and legal investigations, or report to credit bureaus | Yes | |
For our marketing purposes — to offer our products and services to you | No | |
| For joint marketing with other financial companies | No | |
For our affiliates’ everyday business purposes – information about your transactions and experiences | No | |
For our affiliates’ everyday business purposes – information about your creditworthiness | No | |
| For nonaffiliates to market to you | No | |
| Questions? | Call (855) 575-2430 | |
20
| Who we are | |
| Who is providing this notice? | BFS Equity Fund Ultimus Fund Distributors, LLC (Distributor) Ultimus Fund Solutions, LLC (Administrator) |
| What we do | |
| How does the Fund protect my personal information? | To protect your personal information from unauthorized access and use, we use security measures that comply with federal law. These measures include computer safeguards and secured files and buildings. Our service providers are held accountable for adhering to strict policies and procedures to prevent any misuse of your nonpublic personal information. |
| How does the Fund collect my personal information? | We collect your personal information, for example, when you
■ open an account or deposit money
■ buy securities from us or sell securities to us
■ make deposits or withdrawals from your account
■ give us your account information
■ make a wire transfer
■ tell us who receives the money
■ tell us where to send the money
■ show your government-issued ID
■ show your driver’s license |
| Why can’t I limit all sharing? | Federal law gives you the right to limit only
■ sharing for affiliates’ everyday business purposes — information about your creditworthiness
■ affiliates from using your information to market to you
■ sharing for nonaffiliates to market to you
State laws and individual companies may give you additional rights to limit sharing. |
| Definitions | |
| Affiliates | Companies related by common ownership or control. They can be financial and nonfinancial companies.
■ Bradley, Foster & Sargent, Inc., the investment adviser to the Fund, could be deemed to be an affiliate. |
| Nonaffiliates | Companies not related by common ownership or control. They can be financial and nonfinancial companies.
■ The Fund does not share your personal information with nonaffiliates so they can market to you. |
| Joint marketing | A formal agreement between nonaffiliated financial companies that together market financial products or services to you.
■ The Fund does not jointly market. |
21
Proxy Voting
A description of the policies and procedures that the Fund uses to determine how to vote proxies relating to portfolio securities and information regarding how the Fund voted those proxies during the most recent twelve month period ended June 30, are available (1) without charge upon request by calling the Fund at (855) 575-2430 and (2) in Fund documents filed with the SEC on the SEC’s website at www.sec.gov.
| TRUSTEES Andrea N. Mullins, Chairperson Ira P. Cohen Mark J. Seger | INDEPENDENT REGISTERED PUBLIC ACCOUNTING FIRM Cohen & Company, Ltd. 1350 Euclid Avenue, Suite 800 Cleveland, OH 44115 |
| OFFICERS Matthew J. Miller, Principal Executive Officer and President Zachary P. Richmond, Principal Financial Officer and Treasurer N. Lynn Bowley, Chief Compliance Officer Carol J. Highsmith, Vice President and Secretary | LEGAL COUNSEL Troutman Pepper Hamilton Sanders LLP 3000 Two Logan Square 18th and Arch Streets Philadelphia, PA 19103 |
| INVESTMENT ADVISER Bradley, Foster & Sargent, Inc. 185 Asylum Street, City Place II Hartford, CT 06103 | CUSTODIAN Huntington National Bank 41 South High Street Columbus, OH 43215 |
| DISTRIBUTOR Ultimus Fund Distributors, LLC 225 Pictoria Drive, Suite 450 Cincinnati, OH 45246 | ADMINISTRATOR, TRANSFER AGENT AND FUND ACCOUNTANT Ultimus Fund Solutions, LLC 225 Pictoria Drive, Suite 450 Cincinnati, OH 45246 |
This report is intended only for the information of shareholders or those who have received the Fund’s prospectus which contains information about the Fund’s management fee and expenses. Please read the prospectus carefully before investing.
Distributed by Ultimus Fund Distributors, LLC, Member FINRA/SIPC
BFS-SAR-22
LS Opportunity Fund
Management’s Discussion of Fund Performance
November 30, 2022 - (Unaudited)
To Shareholders of the LS Opportunity Fund,
Long Short Advisors, LLC, the adviser of the LS Opportunity Fund (“LSOFX” or the “Fund”), focuses on investing in undiscovered, boutique investment strategies not readily available to the everyday investor. Our mutual fund gives investors access to investment strategies through a mutual fund format that provides daily liquidity, low initial investment minimums, more portfolio transparency, lower fees, and access to what we believe are some of the best investment and hedge fund managers in the business.
The characteristics that we look for in a manager include the following:
| ● | Track Record: a long-term proven track record |
| ● | Capacity Constrained: managers willing to close to new investors before they get too big |
| ● | Skin in the Game: managers that have a significant amount of their own money in the strategy |
| ● | Undiscovered: managers not readily available to everyday investors |
Prospector Partners, LLC (“Prospector Partners”), based in Guilford, CT, is the sub-adviser of the Fund. Prospector Partners has a long/short hedge fund track record that spans 25 years with a substantially similar investment objective to LSOFX and brings its experience to the Fund in a daily liquid mutual fund format with a goal of downside protection and a consistency of returns.
The Fund aims to generate long-term capital appreciation by investing in both individual company long and short positions within a portfolio consisting of primarily publicly-traded common stock, with less net exposure than that of the stock market in general. Through extensive research, risk management, no leverage in the long book, and a targeted net exposure range of 50%-80%, the Fund strives to preserve capital while consistently delivering solid risk adjusted returns and managing volatility. For additional information, please visit our website at www.longshortadvisors.com.
Management’s Discussion of Fund Performance and Positioning
Performance
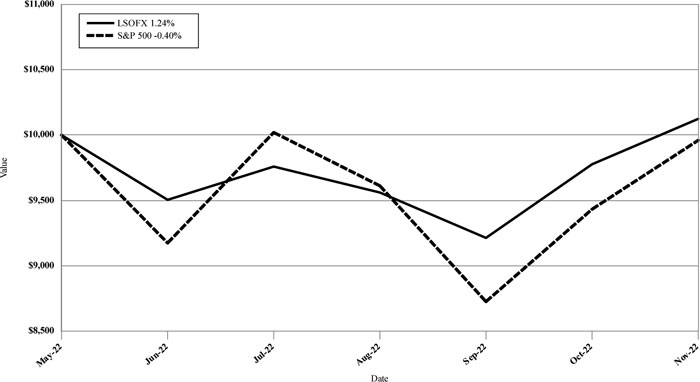
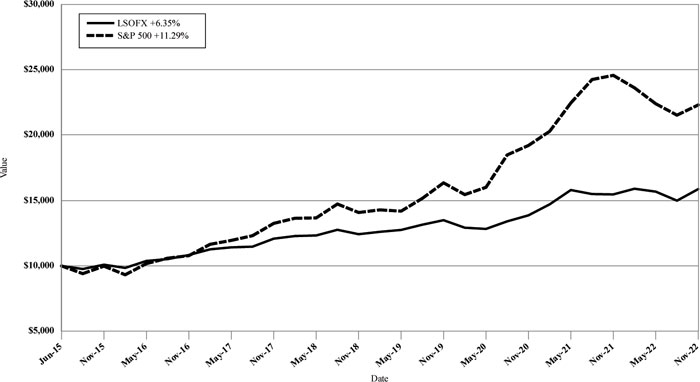
For the six-month period ended November 30, 2022 (the “Period”) the LS Opportunity Fund returned 1.24%, while the S&P 500® Index (“S&P 500”) returned -0.40%.
1
LS Opportunity Fund
Management’s Discussion of Fund Performance (continued)
November 30, 2022 - (Unaudited)
Performance of LSOFX and S&P 500
During the Six Months Ended November 30, 2022
Current Market Environment
According to ESPN major league baseball (MLB) analyst, Doug Glanville, MLB instituted the “warning track” in 1949. This came after a Brooklyn Dodgers outfielder named Pete Reiser repeatedly crashed into the outfield wall, and continually injured himself. For non-baseball fans: the warning track is a strip of material averaging 15 feet wide, which serves to warn outfielders intently focused on catching a fly ball that they are dangerously close to colliding into the wall. While we are unsure if Federal Reserve Chairman Jerome Powell is a fan of our national pastime, or has been to an MLB park for that matter, we would strongly suggest he heed the metaphorical warning track in front of him. With his sights set on “catching” high inflation, and not stopping until he does, he risks slamming into the wall…only to have inflation continue its descent into the bleachers beyond him.
Given the market response to Powell’s September 21st press conference, it seems clear we are not alone in this concern. After that day’s Federal Reserve meeting, where the central bank raised interest rates by 0.75% for an unprecedented third consecutive time, Powell indicated that he did not think inflation could cool without a significant increase in the unemployment rate and stated the Federal Reserve is “strongly committed to bringing inflation back down to our 2% goal.” This hawkishness, and apparent unwillingness to
2
LS Opportunity Fund
Management’s Discussion of Fund Performance (continued)
November 30, 2022 - (Unaudited)
slow interest rate hikes while the ramifications of an unprecedented tightening play out, caused a sharp decline in both stocks and bonds on fears the Federal Reserve will overshoot the mark and lead the economy into a severe recession. As seen in the chart below, in a very short time span, real interest rates have risen over 400 basis points, an extremely restrictive move. Meanwhile, housing prices have fallen significantly in recent months, other asset prices such as the stock market have also lost a tremendous amount of value, and consumer sentiment has nosedived - factors likely to lead to a continued slowdown in the economy and inflation.
Market Yield on U.S. Treasury Securities at 5-Year Constant Maturity, Quoted on an Investment Basis, Inflation-Indexed
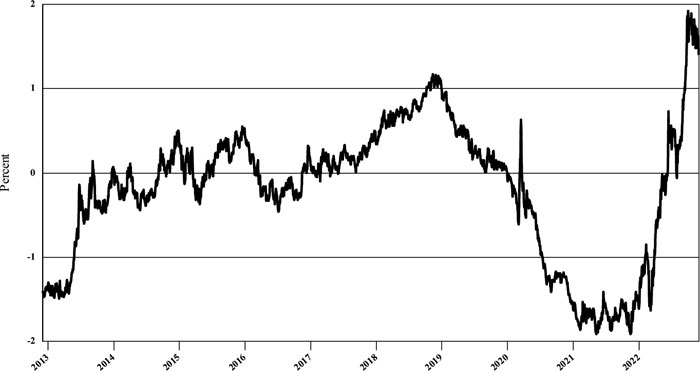
Source: Board of Governers of the Federal Reserve System (US)
Much as we felt the Federal Reserve was behind the curve over a year ago, and that inflation would prove to be more than transitory, we now find ourselves concerned the central bank is myopically focused on lagging indicators and in danger of causing severe damage to the economy. Inflation doesn’t turn on a dime, and patience would be prudent. Indeed, the Wall Street Journal recently pointed out that money supply growth (as measured by M2 money) has been a near perfect predictor of future inflation with a 13-month lag (see chart below). Just as the massive fiscal response to the COVID-19 pandemic led to a historic
3
LS Opportunity Fund
Management’s Discussion of Fund Performance (continued)
November 30, 2022 - (Unaudited)
rise in money supply, and inflation thereafter, the normalization of M2 should also lead to a cooling in inflation…but this takes time.
Against this backdrop of pronounced market volatility, historic moves in interest rates and currencies (e.g., the U.S. dollar is at historic highs against the British pound), as well as various fiscal and monetary responses from world governments, fears of a “Lehman-style collapse” routinely percolate through the market. Recently, for example, the United Kingdom (“UK”) entered into a series of questionable moves as the then newly appointed Prime Minister Liz Truss announced unfunded tax cuts – an action which added fuel to the selloff in UK bonds and a sharp decline in the British pound. This led the Bank of England to step in with quantitative easing to try to stem the slide in the long-term gilt market (a selloff that reportedly was imperiling pension funds met with margin calls). Counterintuitively, this all came at a time when the UK, much like the U.S., is tightening policy by raising interest rates in an effort to stem inflation. Soon after this series of events, reports surfaced that investment banks were also facing losses related to the pound and UK bonds and rumors of Credit Suisse Group’s demise made their rounds.
While we are unsure how the Credit Suisse Group situation will ultimately play out, we are more confident that volatility will persist in the near term. Markets are on edge – searching for any sign that the Federal Reserve is nearing a dovish pivot and reacting harshly to any piece of news indicating the economy or job market is running hotter than expected. It increasingly feels like we are at a crossroads, where the Federal Reserve could either slow the pace of tightening and observe the impacts of the substantive actions already taken, or continue their current aggressive stance, risking a deep recession. As often happens during bear markets, the vast majority of stocks are declining, and correlations amongst them have increased – this creates opportunities for active managers. That said, owning high-quality companies with solid balance sheets and reliable cash flows makes sense now more than ever. After all, “in order to finish first, you must first finish.”
Insurance Industry Update
Our hearts go out to those who have recently felt the devastating impacts from Hurricanes Fiona and Ian. Given these events are likely to have a material effect on the property-casualty insurance industry, where we maintain significant exposure, an update seems warranted. We also maintain an overweight position to the life insurers, and thus offer updated thoughts on that sector below as well. In short, we find the fundamental backdrop for insurance names to be constructive, particularly relative to other sectors in this volatile environment.
4
LS Opportunity Fund
Management’s Discussion of Fund Performance (continued)
November 30, 2022 - (Unaudited)
The property-casualty insurance industry has pricing power today. Insurance companies have been increasing prices for most lines of insurance for several years now. Those increases are the result of several factors, including meaningful catastrophe losses, and the reemergence of both social and physical inflation. We have seen some of the benefits of these actions, particularly in revenues and margins, but expect to see additional benefit as the compounding effect of years of rate increases are recognized. Additionally, the significant increase in interest rates this year affords the ability to accelerate investment income growth, an important factor to returns long forgotten by investors during the era of “lower for longer” interest rates. The combination of improved underwriting margins and net investment income should produce relatively impressive results.
Hurricane Ian is likely to be a historically relevant insurance event. Early estimates of insurance industry losses range from $42B - $74B, a level of losses that will create much turmoil in the Florida market and likely accelerate recent pricing trends in the catastrophe reinsurance market. We maintain positions in several companies likely to benefit from these outcomes, and have recently increased our positions in insurance brokers – who will benefit from resultant price increases yet do not have the balance sheet risk of the underwriters.
The life insurance industry has been significantly impacted by the COVID era. Mortality claims have exceeded actuarial assumptions through much of the period and the difficult investment environment has pressured a significant source of income for the industry. Fortunately, vaccines and therapies have had an important impact on mortality, and recent results indicate that a more “normal” environment may be upon us. We cannot help but also wonder if mortality losses have been “pulled forward” – i.e., might mortality now be better than assumed for a period of time? Earnings and cash flow expectations do not appear to reflect this hypothesis. As is the case with property-casualty insurance companies, life insurers have been forced to operate in a “lower for longer” interest rate world for a long time, pressuring both income statements and balance sheets; the significant improvement in yield environment will accrue to life insurers’ financials over time, but the valuation attributed to the space may improve more quickly.
Lastly, the life insurance industry will soon be incorporating new GAAP accounting for long-duration products. Companies have started to give some guidance for the impact in 2023 and beyond, but much remains unknown. It is worth noting the accounting changes do not affect the economics or cash flows of the business; however, the change in accounting seems likely to shine a light on those products with favorable attributes, specifically, traditional life insurance. Our attention has long been on companies that focus
5
LS Opportunity Fund
Management’s Discussion of Fund Performance (continued)
November 30, 2022 - (Unaudited)
on these products, as we find the predictability of cash flows, lower operating leverage, and reduced balance sheet risks associated with those products to offer more attractive investment opportunities. We maintain significant positions in this sector.
Outlook
Equity and bond market declines have been pronounced. The Federal Reserve has aggressively raised interest rates in an effort to lower inflation, and equity and bond markets are likely to remain volatile until investors sense the Federal Reserve is about to pivot to a less restrictive stance. The U.S. and rest of the world continue to manage the impacts of high inflation, Russia’s invasion of Ukraine, and China’s “zero-COVID” policy. In our assessment, markets reflect a reasonably high probability of recession.
Employment remains strong. Supply/demand imbalances in the labor market bode well for the health of the consumer given full employment and the prospect for further wage gains, which partially mitigates the impact of inflation on the consumer. We expect continued pressure on housing prices as a result of higher interest rates and affordability concerns. However, the shortage of housing after over a decade of underinvestment following the Great Financial Crisis should prevent a disastrous decline in home prices. Lower-income consumers have been most impacted by the current inflationary environment, but consumer balance sheets remain generally healthy for the majority of Americans, and consumer credit quality remains strong at the moment. COVID mortality has improved and related pent-up demand is impacting many areas of the economy. These are reasons to believe a recession could be less significant than the previous two recessionary periods.
Following years of lower interest rates helping to drive ever-higher growth-stock valuations, we feel value investing is ripe for a period of outperformance. Further, given the recent market correction, we are finding opportunities to invest in quality businesses with solid balance sheets and cash flows, whose share prices have detached from our assessment of the fundamentals. The bargains inherent in the portfolio should attract acquirers and other investors over time.
Steadfast, we remain committed to making you money while aiming to protect your wealth.
6
LS Opportunity Fund
Management’s Discussion of Fund Performance (continued)
November 30, 2022 - (Unaudited)
Performance Since Prospector Partners Became Sub-Adviser of LSOFX
(June 2015 - November 2022)
Long Book
Top Positions
At the period’s end, the Fund contained 68 long positions in the portfolio representing companies with what management believes represents long-term value and favorable characteristics such as a discount to private market value, attractive free cash flow yields, and strong balance sheets. The Fund’s top 10 long positions represented approximately 30% of the portfolio and included Arthur J. Gallagher & Co. (AJG), Berkshire Hathaway, Inc. – Class B (BRK/B), Brown & Brown, Inc. (BRO), Cigna Corp. (CI), Federated Hermes, Inc. – Class B (FHI), Globe Life, Inc. (GL), Merck & Co (MRK), Pioneer Natural Resources Co. (PXD), Progressive Corp. (The) (PGR), and Schlumberger Ltd. (SLB).
Short Book
Top Positions
The Fund’s short book at Period’s end contained 34 individual companies that have business model challenges, excessive valuations, and/or potential balance sheet issues. The Fund’s top 10 short positions represented approximately 16% of the portfolio.
7
LS Opportunity Fund
Management’s Discussion of Fund Performance (continued)
November 30, 2022 - (Unaudited)
Final Thoughts from Long Short Advisors, LLC
Prospector Partners took over the management of the LS Opportunity Fund at the end of May 2015. We at Long Short Advisors believe Prospector Partners has done well in delivering on their objective of positive returns with significantly less volatility than the S&P 500 equity market. This was through an exceedingly challenging environment for Value style investors. Having worked with the team at Prospector Partners for nearly 20 years in various capacities, we are extremely encouraged by their focus on the opportunities they are seeing on both the long and short side of the portfolio. It is our feeling that there is no bad time to invest with Prospector Partners in this core long/short strategy. However, we do also feel there can be great times. As we look ahead, we are encouraged by their positioning to capitalize on economic recovery, reflation, normalized interest rates and a resurgence of value relative to growth. Thank you for your consideration and we look forward to working for you in 2023 and beyond.
Investment in shares of a long/short equity fund have the potential for significant risk and volatility. A short equity strategy can diminish returns in a rising market as well as having the potential for unlimited losses. These types of funds typically have a high portfolio turnover that could increase transaction costs and cause short-term capital gains to be realized.
The performance data quoted represents past performance; past performance does not guarantee future results. The investment return and principal value of an investment in the Fund will fluctuate so that an investor’s shares, when redeemed, may be worth more or less than their original cost. Current performance of the Fund may be lower or higher than the performance quoted. The Fund’s returns reflect any fee reductions during the applicable periods. If such fee reductions had not occurred, the quoted performance would have been lower. For performance current to the most recent month end, call (877) 336-6763.
8
Investment Results (Unaudited)
Average Annual Total Returns(a) as of November 30, 2022
| Six | Ten | |||
| Months | One Year | Five Year | Year | |
| LS Opportunity Fund | 1.24% | 2.63% | 5.61% | 6.79% |
| S&P 500® Index(b) | -0.40% | -9.21% | 10.98% | 13.34% |
Total annual operating expenses, as disclosed in the LS Opportunity Fund’s (the “Fund”) prospectus dated September 28, 2022, were 2.92% of average daily net assets (2.89% after fee waivers and expense reimbursements by Long Short Advisors, LLC (the “Adviser”)). The Adviser has entered into an expense limitation agreement, pursuant to which it will waive its fees and/or reimburse other expenses of the Fund until September 30, 2023, so that Total Annual Fund Operating Expenses does not exceed 1.95%. This operating expense limitation does not apply to borrowing costs such as interest and dividends on securities sold short, taxes, brokerage commissions, other expenditures which are capitalized in accordance with generally accepted accounting principles, other extraordinary expenses not incurred in the ordinary course of the Fund’s business, expenses incurred under a Rule 12b-1 plan of distribution, “acquired fund fees and expenses,” and expenses that the Fund has incurred but did not actually pay because of an expense offset arrangement. Each fee waiver or reimbursement of an expense by the Adviser is subject to repayment by the Fund within the three years following the date of such waiver or reimbursement, provided that the Fund is able to make the repayment without exceeding the expense limitation in place at the time of the waiver or reimbursement and the expense limitation in place at the time of the repayment. This agreement may only be terminated by mutual consent of the Adviser and the Board of Trustees.
The performance quoted represents past performance, which does not guarantee future results. The investment return and principal value of an investment will fluctuate so that an investor’s shares, when redeemed, may be worth more or less than their original cost. The returns shown do not reflect deduction of taxes that a shareholder would pay on Fund distributions or the redemption of Fund shares. Prior to May 28, 2015, the Fund’s performance was attributable to a previous sub-adviser. The Fund’s investment objectives, risks, charges and expenses must be considered carefully before investing. The prospectus contains this and other important information about the Fund and may be obtained by calling (877) 336-6763. Please read it carefully before investing. Current performance of the Fund may be lower or higher than the performance quoted. Performance data current to the most recent month end may be obtained by calling (877) 336-6763.
| (a) | Average annual total returns reflect any change in price per share and assume the reinvestment of all distributions, if any. The Fund’s returns reflect any fee reductions during the applicable periods. If such fee reductions had not occurred, the quoted performance would have been lower. Total returns for periods one year or less are not annualized. |
| (b) | The S&P 500® Index is a widely recognized unmanaged index of equity prices and is representative of a broader market and range of securities than is found in the Fund’s portfolio. The index is an unmanaged benchmark that assumes reinvestment of all distributions and excludes the effect of taxes and fees. Individuals cannot invest directly in this index; however, an individual can invest in exchange-traded funds or other investment vehicles that attempt to track the performance of a benchmark index. |
The Fund is distributed by Ultimus Fund Distributors, LLC, Member FINRA/SIPC.
9
Fund Holdings (Unaudited)
November 30, 2022 - (Unaudited)
Sector Exposure
(Based on Net Assets)
| Long | Short | Gross | Net | |||||||||||||
| Communication Services | 0.82 | % | 0.00 | % | 0.82 | % | 0.82 | % | ||||||||
| Consumer Discretionary | 5.17 | % | -4.78 | % | 9.95 | % | 0.39 | % | ||||||||
| Consumer Staples | 6.06 | % | -5.50 | % | 11.56 | % | 0.56 | % | ||||||||
| Energy | 6.82 | % | -1.50 | % | 8.32 | % | 5.32 | % | ||||||||
| Financials | 46.10 | % | -16.49 | % | 62.59 | % | 29.61 | % | ||||||||
| Health Care | 10.11 | % | -1.64 | % | 11.75 | % | 8.47 | % | ||||||||
| Industrials | 11.25 | % | -2.36 | % | 13.61 | % | 8.89 | % | ||||||||
| Information Technology | 5.71 | % | -0.98 | % | 6.69 | % | 4.73 | % | ||||||||
| Materials | 3.30 | % | 0.00 | % | 3.30 | % | 3.30 | % | ||||||||
| Real Estate | 1.20 | % | 0.00 | % | 1.20 | % | 1.20 | % | ||||||||
| Exchange-Traded Funds | 0.86 | % | -2.91 | % | 3.77 | % | -2.05 | % | ||||||||
| Total Sector Exposure | 97.40 | % | -36.16 | % | 133.56 | % | 61.24 | % | ||||||||
| Call Options Purchased | 0.26 | % | 0.00 | % | 0.26 | % | 0.26 | % | ||||||||
| Call Options Written | 0.00 | % | -0.21 | % | -0.21 | % | -0.21 | % | ||||||||
| Money Market Funds | 2.56 | % | 0.00 | % | 2.56 | % | 2.56 | % | ||||||||
The LS Opportunity Fund seeks to generate long-term capital appreciation by investing in both long and short positions within a portfolio consisting of primarily publicly-traded common stock, with less net exposure than that of the stock market in general.
Availability of Portfolio Schedules (Unaudited)
The Fund files its complete schedule of portfolio holdings with the Securities and Exchange Commission (the “SEC”) for the first and third quarters of each fiscal year as an exhibit to its reports on Form N-PORT. The Fund’s Form N-PORT reports are available on the SEC’s website at http:// www.sec.gov and on the Fund’s website at http://www.longshortadvisors.com.
10
| LS Opportunity Fund |
| Schedule of Investments |
| November 30, 2022 (Unaudited) |
| COMMON STOCKS - LONG - DOMESTIC — 86.53% | Shares | Fair Value | ||||||
| Communication Services — 0.82% | ||||||||
| Alphabet, Inc., Class A(a) | 2,700 | $ | 272,673 | |||||
| Alphabet, Inc., Class C(a) | 8,100 | 821,745 | ||||||
| 1,094,418 | ||||||||
| Consumer Discretionary — 5.17% | ||||||||
| Darden Restaurants, Inc.(b) | 12,200 | 1,793,278 | ||||||
| eBay, Inc.(b) | 22,625 | 1,028,080 | ||||||
| Expedia Group, Inc.(a) | 9,350 | 998,954 | ||||||
| Home Depot, Inc. (The)(b) | 6,275 | 2,033,037 | ||||||
| Texas Roadhouse, Inc. | 10,400 | 1,032,928 | ||||||
| 6,886,277 | ||||||||
| Consumer Staples — 4.99% | ||||||||
| Church & Dwight Co., Inc.(b) | 24,900 | 2,038,563 | ||||||
| Colgate-Palmolive Co. | 8,650 | 670,202 | ||||||
| Mondelez International, Inc., Class A(b) | 29,800 | 2,014,778 | ||||||
| Procter & Gamble Co. (The) | 12,910 | 1,925,656 | ||||||
| 6,649,199 | ||||||||
| Energy — 6.82% | ||||||||
| Hess Corp. | 10,500 | 1,511,055 | ||||||
| Pioneer Natural Resources Co.(b) | 15,899 | 3,752,005 | ||||||
| Schlumberger Ltd.(b) | 73,875 | 3,808,256 | ||||||
| 9,071,316 | ||||||||
| Financials — 40.37% | ||||||||
| Arthur J. Gallagher & Co.(b) | 19,825 | 3,947,356 | ||||||
| Berkshire Hathaway, Inc., Class B(a) (b) | 20,195 | 6,434,127 | ||||||
| Brown & Brown, Inc.(b) | 58,325 | 3,475,587 | ||||||
| Cboe Global Markets, Inc.(b) | 14,125 | 1,791,615 | ||||||
| Citigroup, Inc.(b) | 15,825 | 766,088 | ||||||
| Comerica, Inc.(b) | 33,900 | 2,431,986 | ||||||
| Federated Hermes, Inc., Class B(b) | 79,950 | 3,034,902 | ||||||
| Globe Life, Inc.(b) | 34,375 | 4,123,625 | ||||||
| KeyCorp(b) | 113,600 | 2,136,816 | ||||||
| Markel Corp.(a) | 1,200 | 1,589,808 | ||||||
| Marsh & McLennan Cos., Inc. | 6,650 | 1,151,647 | ||||||
| Pinnacle Financial Partners, Inc. | 20,025 | 1,679,897 | ||||||
| PJT Partners, Inc., Class A(b) | 14,900 | 1,147,449 | ||||||
| PNC Financial Services Group, Inc. (The)(b) | 10,110 | 1,701,109 | ||||||
| Primerica, Inc.(b) | 11,450 | 1,706,393 | ||||||
| Progressive Corp. (The)(b) | 32,875 | 4,344,431 | ||||||
| SouthState Corp. | 14,750 | 1,295,788 | ||||||
| State Street Corp.(b) | 28,200 | 2,246,694 | ||||||
| Synovus Financial Corp.(b) | 42,600 | 1,794,738 | ||||||
| U.S. Bancorp(b) | 57,800 | 2,623,542 | ||||||
| Voya Financial, Inc.(b) | 40,250 | 2,655,695 | ||||||
| W.R. Berkley Corp.(b) | 21,770 | 1,660,615 | ||||||
| 53,739,908 | ||||||||
| Health Care — 8.54% | ||||||||
| Abbott Laboratories(b) | 7,500 | 806,850 | ||||||
See accompanying notes which are an integral part of these financial statements.
11
| LS Opportunity Fund |
| Schedule of Investments (continued) |
| November 30, 2022 (Unaudited) |
| COMMON STOCKS - LONG - DOMESTIC — 86.53% - continued | Shares | Fair Value | ||||||
| Health Care — 8.54% - continued | ||||||||
| Cigna Corp.(b) | 9,370 | $ | 3,081,699 | |||||
| Johnson & Johnson(b) | 10,844 | 1,930,232 | ||||||
| Merck & Co., Inc.(b) | 32,810 | 3,613,037 | ||||||
| Pfizer, Inc.(b) | 38,475 | 1,928,752 | ||||||
| 11,360,570 | ||||||||
| Industrials — 10.15% | ||||||||
| Carrier Global Corp.(b) | 48,085 | 2,131,127 | ||||||
| Eaton Corp. PLC(b) | 14,850 | 2,427,232 | ||||||
| General Dynamics Corp.(b) | 8,365 | 2,111,243 | ||||||
| Leidos Holdings, Inc.(b) | 24,500 | 2,678,585 | ||||||
| Otis Worldwide Corp.(b) | 19,930 | 1,556,334 | ||||||
| Raytheon Technologies Corp.(b) | 14,210 | 1,402,811 | ||||||
| Sensata Technologies Holding PLC | 26,775 | 1,207,552 | ||||||
| 13,514,884 | ||||||||
| Information Technology — 5.71% | ||||||||
| Fidelity National Information Services, Inc. | 10,150 | 736,687 | ||||||
| Littelfuse, Inc.(b) | 4,640 | 1,143,760 | ||||||
| Microsoft Corp.(b) | 5,640 | 1,438,990 | ||||||
| Oracle Corp.(b) | 22,625 | 1,878,554 | ||||||
| Paychex, Inc.(b) | 9,650 | 1,196,889 | ||||||
| PayPal Holdings, Inc.(a) (b) | 9,075 | 711,571 | ||||||
| Zebra Technologies Corp., Class A(a) | 1,850 | 500,018 | ||||||
| 7,606,469 | ||||||||
| Materials — 2.76% | ||||||||
| Axalta Coating Systems Ltd.(a) | 25,400 | 681,736 | ||||||
| Newmont Goldcorp Corp. | 12,095 | 574,150 | ||||||
| PPG Industries, Inc.(b) | 17,900 | 2,420,438 | ||||||
| 3,676,324 | ||||||||
| Real Estate — 1.20% | ||||||||
| Howard Hughes Corp. (The)(a) (b) | 21,420 | 1,596,647 | ||||||
| Total Common Stocks - Long - Domestic (Cost $95,411,260) | 115,196,012 | |||||||
| COMMON STOCKS - LONG - INTERNATIONAL — 10.01% | ||||||||
| Consumer Staples — 1.07% | ||||||||
| Nestle S.A. | 11,950 | 1,418,644 | ||||||
| Financials — 5.73% | ||||||||
| Everest Re Group Ltd. | 6,335 | 2,140,850 | ||||||
| Fairfax Financial Holdings Ltd. | 3,920 | 2,246,762 | ||||||
| First BanCorp. | 100,350 | 1,543,383 | ||||||
| RenaissanceRe Holdings Ltd.(b) | 8,955 | 1,691,689 | ||||||
| 7,622,684 | ||||||||
| Health Care — 1.57% | ||||||||
| Medtronic PLC(b) | 26,450 | 2,090,608 | ||||||
See accompanying notes which are an integral part of these financial statements.
12
| LS Opportunity Fund |
| Schedule of Investments (continued) |
| November 30, 2022 (Unaudited) |
| COMMON STOCKS - LONG - INTERNATIONAL — 10.01% - continued | ||||||||
| Industrials — 1.10% | ||||||||
| Pentair PLC | 31,975 | $ | 1,463,496 | |||||
| Materials — 0.54% | ||||||||
| Agnico Eagle Mines Ltd.(b) | 14,232 | 716,866 | ||||||
| Total Common Stocks - Long - International | ||||||||
| (Cost $12,562,433) | 13,312,298 | |||||||
| EXCHANGE-TRADED FUNDS — 0.86% | ||||||||
| Aberdeen Standard Physical Platinum Shares ETF(a) (b) | 11,985 | 1,148,522 | ||||||
| Total Exchange-Traded Funds (Cost $1,165,166) | 1,148,522 |
| Number of | Notional | Exercise | Expiration | |||||||||||||
| Description | Contracts | Amount | Price | Date | Fair Value | |||||||||||
| CALL OPTIONS PURCHASED — 0.26% | ||||||||||||||||
| Citigroup, Inc.(b) | 267 | $ | 1,292,547 | $ | 55.00 | 12/16/2022 | $ | 667 | ||||||||
| Darden Restaurants, Inc.(b) | 34 | 499,766 | 135.00 | 1/20/2023 | 51,000 | |||||||||||
| Eaton Corp. PLC(b) | 45 | 735,525 | 140.00 | 1/20/2023 | 112,950 | |||||||||||
| Home Depot, Inc. (The)(b) | 108 | 3,499,092 | 320.00 | 1/20/2023 | 176,310 | |||||||||||
| Total Call Options Purchased (Cost $158,937) | 340,927 | |||||||||||||||
| MONEY MARKET FUNDS — 2.56% | ||||||||||||||||
| Invesco Treasury Portfolio, Institutional Class, 3.76%(c) | 3,406,143 | 3,406,143 | ||||||||||||||
| Total Money Market Funds (Cost $3,406,143) | 3,406,143 | |||||||||||||||
| Total Investments — 100.22% | ||||||||||||||||
| (Cost $112,703,939) | 133,403,902 | |||||||||||||||
| Liabilities in Excess of Other Assets — (0.22)% | (287,512 | ) | ||||||||||||||
| NET ASSETS — 100.00% | $ | 133,116,390 | ||||||||||||||
| (a) | Non-income producing security. |
| (b) | All or a portion of the security is held as collateral for securities sold short. The fair value of this collateral on November 30, 2022 was $71,246,020. |
| (c) | Rate disclosed is the seven day effective yield as of November 30, 2022. |
ETF - Exchange-Traded Fund
See accompanying notes which are an integral part of these financial statements.
13
| LS Opportunity Fund |
| Schedule of Securities Sold Short |
| November 30, 2022 (Unaudited) |
| COMMON STOCKS - SHORT - DOMESTIC - (28.78)% | Shares | Fair Value | ||||||
| Consumer Discretionary - (4.78)% | ||||||||
| Dollar Tree, Inc.(a) | (11,200 | ) | $ | (1,683,248 | ) | |||
| Lowe’s Cos., Inc. | (6,870 | ) | (1,460,218 | ) | ||||
| McDonald’s Corp. | (4,550 | ) | (1,241,195 | ) | ||||
| Service Corp. International | (27,650 | ) | (1,975,593 | ) | ||||
| (6,360,254 | ) | |||||||
| Consumer Staples - (5.50)% | ||||||||
| Campbell Soup Co. | (25,300 | ) | (1,357,851 | ) | ||||
| Edgewell Personal Care Co. | (23,700 | ) | (1,024,077 | ) | ||||
| Hershey Co. (The) | (5,225 | ) | (1,228,763 | ) | ||||
| Kellogg Co. | (16,325 | ) | (1,190,909 | ) | ||||
| Kimberly-Clark Corp. | (18,560 | ) | (2,517,293 | ) | ||||
| (7,318,893 | ) | |||||||
| Energy - (1.50)% | ||||||||
| Chevron Corp. | (10,900 | ) | (1,998,079 | ) | ||||
| Financials - (12.02)% | ||||||||
| Affiliated Managers Group, Inc. | (4,100 | ) | (657,722 | ) | ||||
| Berkshire Hills Bancorp, Inc. | (22,200 | ) | (692,196 | ) | ||||
| Byline Bancorp, Inc. | (25,900 | ) | (590,261 | ) | ||||
| CNO Financial Group, Inc. | (66,250 | ) | (1,555,550 | ) | ||||
| Community Bank System, Inc. | (15,025 | ) | (978,728 | ) | ||||
| Dime Community Bancshares, Inc. | (20,525 | ) | (732,127 | ) | ||||
| Goldman Sachs Group, Inc. (The) | (4,350 | ) | (1,679,752 | ) | ||||
| Hanover Insurance Group, Inc. | (7,300 | ) | (1,075,290 | ) | ||||
| Horace Mann Educators Corp. | (24,800 | ) | (957,032 | ) | ||||
| Independent Bank Corp. | (8,300 | ) | (751,316 | ) | ||||
| M&T Bank Corp. | (7,793 | ) | (1,324,966 | ) | ||||
| Prudential Financial, Inc. | (11,959 | ) | (1,291,931 | ) | ||||
| Selective Insurance Group, Inc. | (11,050 | ) | (1,062,126 | ) | ||||
| Truist Financial Corp. | (43,300 | ) | (2,026,873 | ) | ||||
| Washington Trust Bancorp, Inc. | (12,500 | ) | (622,000 | ) | ||||
| (15,997,870 | ) | |||||||
| Health Care - (1.64)% | ||||||||
| Boston Scientific Corp. (a) | (20,600 | ) | (932,562 | ) | ||||
| CVS Health Corp. | (12,325 | ) | (1,255,671 | ) | ||||
| (2,188,233 | ) | |||||||
| Industrials - (2.36)% | ||||||||
| Cross Country Healthcare, Inc.(a) | (19,800 | ) | (708,444 | ) | ||||
| Lockheed Martin Corp. | (1,350 | ) | (655,006 | ) | ||||
| Snap-on, Inc. | (7,425 | ) | (1,786,455 | ) | ||||
| (3,149,905 | ) | |||||||
| Information Technology - (0.98)% | ||||||||
| Amphenol Corp., Class A | (8,150 | ) | (655,505 | ) | ||||
| Apple, Inc. | (4,375 | ) | (647,631 | ) | ||||
| (1,303,136 | ) | |||||||
| TOTAL COMMON STOCKS - SHORT - DOMESTIC (Proceeds Received $36,954,888) | (38,316,370 | ) | ||||||
See accompanying notes which are an integral part of these financial statements.
14
| LS Opportunity Fund |
| Schedule of Securities Sold Short (continued) |
| November 30, 2022 (Unaudited) |
| COMMON STOCKS - SHORT - INTERNATIONAL - (4.47)% | Shares | Fair Value | ||||||
| Financials - (4.47)% | ||||||||
| Commonwealth Bank of Australia | (42,755 | ) | $ | (3,130,298 | ) | |||
| Swiss Re AG | (31,700 | ) | (2,821,276 | ) | ||||
| (5,951,574 | ) | |||||||
| TOTAL COMMON STOCKS - SHORT - INTERNATIONAL (Proceeds Received $5,334,847) | (5,951,574 | ) | ||||||
| EXCHANGE-TRADED FUNDS - (2.91)% | ||||||||
| Vanguard Energy ETF | (30,300 | ) | (3,867,189 | ) | ||||
| TOTAL EXCHANGE-TRADED FUNDS (Proceeds Received $3,291,298) | (3,867,189 | ) | ||||||
| TOTAL SECURITIES SOLD SHORT - (36.16)% (Proceeds Received $45,581,033) | $ | (48,135,133 | ) | |||||
| (a) | Non-dividend expense producing security. |
ETF - Exchange-Traded Fund
The sectors shown on the schedule of investments and schedule of securities sold short are based on the Global Industry Classification Standard, or GICS® (“GICS”). The GICS was developed by and/ or is the exclusive property of MSCI, Inc. and Standard & Poor’s Financial Services LLC (“S&P”). GICS is a service mark of MSCI, Inc. and S&P and has been licensed for use by Ultimus Fund Solutions, LLC.
See accompanying notes which are an integral part of these financial statements.
15
| LS Opportunity Fund |
| Schedule of Written Options |
| November 30, 2022 - (Unaudited) |
| Number of | Notional | Exercise | Expiration | |||||||||||||
| Description | Contracts | Amount | Price | Date | Fair Value | |||||||||||
| CALL OPTIONS WRITTEN - (0.21)% | ||||||||||||||||
| Cboe Global Markets, Inc. | (89) | $ | (1,128,876 | ) | $ | 140.00 | 1/19/2024 | $ | (90,780 | ) | ||||||
| Darden Restaurants, Inc. | (17) | (249,883 | ) | 140.00 | 1/20/2023 | (19,125 | ) | |||||||||
| Darden Restaurants, Inc. | (17) | (249,883 | ) | 145.00 | 1/20/2023 | (13,685 | ) | |||||||||
| Eaton Corp. PLC | (34) | (555,730 | ) | 155.00 | 1/20/2023 | (40,970 | ) | |||||||||
| Home Depot, Inc. (The) | (53) | (1,717,147 | ) | 330.00 | 1/20/2023 | (57,770 | ) | |||||||||
| Texas Roadhouse, Inc. | (48) | (476,736 | ) | 100.00 | 1/20/2023 | (21,120 | ) | |||||||||
| Texas Roadhouse, Inc. | (36) | (357,552 | ) | 100.00 | 6/16/2023 | (37,440 | ) | |||||||||
| Total Call Options Written (Premiums Received $256,033) | $ | (280,890 | ) | |||||||||||||
See accompanying notes which are an integral part of these financial statements.
16
| LS Opportunity Fund |
| Statement of Assets and Liabilities |
| November 30, 2022 - (Unaudited) |
| Assets | ||||
| Investments in securities, at fair value (cost $112,703,939) (Note 3) | $ | 133,403,902 | ||
| Deposits at broker for securities sold short (Note 2) | 47,612,487 | |||
| Receivable for fund shares sold | 225,005 | |||
| Receivable for investments sold | 841,023 | |||
| Dividends receivable | 266,947 | |||
| Tax reclaims receivable | 22,573 | |||
| Prepaid expenses | 14,963 | |||
| Total Assets | 182,386,900 | |||
| Liabilities | ||||
| Investments in securities sold short, at fair value (proceeds received $45,581,033) (Note 2) | 48,135,133 | |||
| Options written, at fair value (premium received $256,033) | 280,890 | |||
| Payable for fund shares redeemed | 82,955 | |||
| Payable for investments purchased | 427,427 | |||
| Dividend expense payable on short positions | 121,477 | |||
| Payable to Adviser (Note 4) | 180,526 | |||
| Payable to Administrator (Note 4) | 15,251 | |||
| Other accrued expenses | 26,851 | |||
| Total Liabilities | 49,270,510 | |||
| Net Assets | $ | 133,116,390 | ||
| Net Assets consist of: | ||||
| Paid-in capital | $ | 111,121,243 | ||
| Accumulated earnings | 21,995,147 | |||
| Net Assets | $ | 133,116,390 | ||
| Shares outstanding (unlimited number of shares authorized, no par value) | 8,134,888 | |||
| Net asset value, offering and redemption price per share (Note 2) | $ | 16.36 |
See accompanying notes which are an integral part of these financial statements.
17
| LS Opportunity Fund |
| Statement of Operations |
| For the six months ended November 30, 2022 - (Unaudited) |
| Investment Income | ||||
| Dividend income (net of foreign taxes withheld of $6,171) | $ | 1,359,371 | ||
| Interest income | 303,508 | |||
| Total investment income | 1,662,879 | |||
| Expenses | ||||
| Investment Adviser fees (Note 4) | 1,103,832 | |||
| Dividend expense on securities sold short (Note 2) | 609,707 | |||
| Administration fees (Note 4) | 50,650 | |||
| Short sale and interest expense | 30,966 | |||
| Fund accounting fees (Note 4) | 21,944 | |||
| Registration expenses | 14,989 | |||
| Custodian fees | 9,909 | |||
| Audit and tax preparation expenses | 9,777 | |||
| Legal fees | 9,504 | |||
| Transfer agent fees (Note 4) | 9,119 | |||
| Printing and postage expenses | 7,361 | |||
| Compliance services fees (Note 4) | 6,017 | |||
| Trustee expenses | 3,903 | |||
| Miscellaneous | 18,986 | |||
| Total expenses | 1,906,664 | |||
| Fees waived by Adviser (Note 4) | (36,450 | ) | ||
| Net operating expenses | 1,870,214 | |||
| Net investment loss | (207,335 | ) | ||
| Net Realized and Change in Unrealized Gain (Loss) on Investments | ||||
| Net realized gain (loss) on: | ||||
| Investment securities | 547,671 | |||
| Securities sold short | (1,543,562 | ) | ||
| Written options | 7,195 | |||
| Purchased options | 126,899 | |||
| Foreign currency | 540 | |||
| Change in unrealized appreciation (depreciation) on: | ||||
| Investment securities | 2,624,043 | |||
| Securities sold short | (786,490 | ) | ||
| Written options | (24,857 | ) | ||
| Purchased options | 181,990 | |||
| Foreign currency translations | 126 | |||
| Net realized and change in unrealized gain on investments | 1,133,555 | |||
| Net increase in net assets resulting from operations | $ | 926,220 |
See accompanying notes which are an integral part of these financial statements.
18
| LS Opportunity Fund |
| Statements of Changes in Net Assets |
| For the Six | ||||||||
| Months Ended | For the Year | |||||||
| November 30, | Ended May 31, | |||||||
| 2022 | 2022 | |||||||
| (Unaudited) | ||||||||
| Increase (Decrease) in Net Assets due to: | ||||||||
| Operations | ||||||||
| Net investment loss | $ | (207,335 | ) | $ | (1,381,226 | ) | ||
| Net realized gain (loss) on investment transactions | (861,257 | ) | 6,603,355 | |||||
| Change in unrealized appreciation (depreciation) on investments | 1,994,812 | (6,441,025 | ) | |||||
| Net increase (decrease) in net assets resulting from operations | 926,220 | (1,218,896 | ) | |||||
| Distributions to Shareholders from Earnings (Note 2) | — | (5,931,433 | ) | |||||
| Capital Transactions | ||||||||
| Proceeds from shares sold | 12,466,455 | 38,556,706 | ||||||
| Reinvestment of distributions | — | 5,523,480 | ||||||
| Amount paid for shares redeemed | (19,720,838 | ) | (29,908,811 | ) | ||||
| Net increase (decrease) in net assets resulting from capital transactions | (7,254,383 | ) | 14,171,375 | |||||
| Total Increase (Decrease) in Net Assets | (6,328,163 | ) | 7,021,046 | |||||
| Net Assets | ||||||||
| Beginning of period | 139,444,553 | 132,423,507 | ||||||
| End of period | $ | 133,116,390 | $ | 139,444,553 | ||||
| Share Transactions | ||||||||
| Shares sold | 794,256 | 2,335,149 | ||||||
| Shares issued in reinvestment of distributions | — | 340,116 | ||||||
| Shares redeemed | (1,287,538 | ) | (1,831,152 | ) | ||||
| Net increase (decrease) in shares outstanding | (493,282 | ) | 844,113 | |||||
See accompanying notes which are an integral part of these financial statements.
19
| LS Opportunity Fund |
| Financial Highlights |
| (For a share outstanding during each period) |
| For the Six | For the Years Ended May 31, | |||||||||||||||||||||||
| Months | ||||||||||||||||||||||||
| Ended | ||||||||||||||||||||||||
| November | ||||||||||||||||||||||||
| 30, 2022 | ||||||||||||||||||||||||
| (Unaudited) | 2022 | 2021 | 2020 | 2019 | 2018 | |||||||||||||||||||
| Selected Per Share Data: | ||||||||||||||||||||||||
| Net asset value, beginning of period | $ | 16.16 | $ | 17.01 | $ | 13.99 | $ | 14.07 | $ | 13.96 | $ | 13.44 | ||||||||||||
| Investment operations: | ||||||||||||||||||||||||
| Net investment loss | (0.03 | ) | (0.15 | ) | (0.13 | ) | (0.07 | ) | (0.01 | ) | (0.08 | ) | ||||||||||||
| Net realized and unrealized gain on investments | 0.23 | 0.02 | 3.35 | 0.17 | (a) | 0.47 | 1.14 | |||||||||||||||||
| Total from investment operations | 0.20 | (0.13 | ) | 3.22 | 0.10 | 0.46 | 1.06 | |||||||||||||||||
| Less distributions to shareholders from: | ||||||||||||||||||||||||
| Net realized gains | — | (0.72 | ) | (0.20 | ) | (0.18 | ) | (0.35 | ) | (0.54 | ) | |||||||||||||
| Net asset value, end of period | $ | 16.36 | $ | 16.16 | $ | 17.01 | $ | 13.99 | $ | 14.07 | $ | 13.96 | ||||||||||||
| Total Return(b) | 1.24 | % (c) | (0.77 | )% | 23.17 | % | 0.62 | % | 3.44 | % | 7.95 | % | ||||||||||||
| Ratios and Supplemental Data: | ||||||||||||||||||||||||
| Net assets, end of period (000 omitted) | $ | 133,116 | $ | 139,445 | $ | 132,424 | $ | 82,695 | $ | 68,753 | $ | 49,958 | ||||||||||||
| Ratio of net expenses to average net assets (d) | 2.97 | % (e) | 2.87 | % | 2.71 | % | 2.84 | % | 2.89 | % | 2.97 | % | ||||||||||||
| Ratio of expenses to average net assets before waiver and reimbursement(d) | 3.02 | % (e) | 2.90 | % | 2.78 | % | 2.97 | % | 3.11 | % | 3.33 | % | ||||||||||||
| Ratio of net investment loss to average net assets | (0.33 | )% (e) | (1.00 | )% | (1.04 | )% | (0.52 | )% | (0.15 | )% | (0.82 | )% | ||||||||||||
| Portfolio turnover rate | 27.16 | % (c) | 55.37 | % | 69.69 | % | 69.47 | % | 40.31 | % | 55.31 | % | ||||||||||||
| (a) | The amount shown for a share outstanding throughout the year does not accord with the change in aggregate gains and losses in the portfolio of securities during the year due to the timing of sales and purchases of fund shares in relation to fluctuating market values during the year. |
| (b) | Total return represents the rate that the investor would have earned or lost on an investment in the Fund, assuming reinvestment of distributions. |
| (c) | Not annualized. |
| (d) | Includes dividend and interest expense of 1.02% for the six months ended November 30, 2022 and 0.92%, 0.76%, 0.89%, 0.94% and 1.02% for the fiscal years ended May 31, 2022, 2021, 2020, 2019 and 2018, respectively. |
| (e) | Annualized. |
See accompanying notes which are an integral part of these financial statements.
20
| LS Opportunity Fund |
| Notes to the Financial Statements |
| November 30, 2022 - (Unaudited) |
NOTE 1. ORGANIZATION
The LS Opportunity Fund (the “Fund”) is registered under the Investment Company Act of 1940, as amended (“1940 Act”), as an open-end, diversified series of Valued Advisers Trust (the “Trust”). The Trust is a management investment company established under the laws of Delaware by an Agreement and Declaration of Trust dated June 13, 2008 (the “Trust Agreement”). The Trust Agreement permits the Board of Trustees (the “Board” or the “Trustees”) to issue an unlimited number of shares of beneficial interest of separate series without par value. The Fund is one of a series of funds authorized by the Board. The Fund’s investment adviser is Long Short Advisors, LLC (the “Adviser”). The Adviser has retained Prospector Partners, LLC (the “Sub-Adviser”) to serve as the sub-adviser to provide portfolio management and related services to the Fund. The Sub-Adviser receives a fee from the Adviser (not the Fund) for these services. The investment objective of the Fund is to generate long-term capital appreciation by investing in both long and short positions within a portfolio consisting of primarily publicly-traded common stock, with less net exposure than that of the stock market in general.
NOTE 2. SIGNIFICANT ACCOUNTING POLICIES
The Fund is an investment company and follows accounting and reporting guidance under Financial Accounting Standards Board Accounting Standards Codification (“ASC”) Topic 946, “Financial Services-Investment Companies”. The following is a summary of significant accounting policies followed by the Fund in the preparation of its financial statements. These policies are in conformity with generally accepted accounting principles in the United States of America (“GAAP”).
Estimates – The preparation of financial statements in conformity with GAAP requires management to make estimates and assumptions that affect the reported amounts of assets and liabilities and disclosure of contingent assets and liabilities at the date of the financial statements and the reported amounts of increases and decreases in net assets from operations during the reporting period. Actual results could differ from those estimates.
Federal Income Taxes – The Fund makes no provision for federal income or excise tax. The Fund has qualified and intends to qualify each year as a regulated investment company (“RIC”) under subchapter M of the Internal Revenue Code of 1986, as amended, by complying with the requirements applicable to RICs and by distributing substantially all of its taxable income. The Fund also intends to distribute sufficient net investment income and net realized capital gains, if any, so that it will not be subject to excise tax on undistributed income and gains. If the required amount of net investment income or gains is not distributed, the Fund could incur a tax expense.
21
| LS Opportunity Fund |
| Notes to the Financial Statements (continued) |
| November 30, 2022 - (Unaudited) |
As of and during the six months ended November 30, 2022, the Fund did not have any liabilities for any unrecognized tax benefits. The Fund recognizes interest and penalties, if any, related to unrecognized tax benefits as income tax expense on the Statement of Operations when incurred. During the six months ended November 30, 2022, the Fund did not incur any interest or penalties. Management of the Fund has reviewed tax positions taken in tax years that remain subject to examination by all major tax jurisdictions, including federal (i.e., the last three tax year ends and the interim tax period since then, as applicable). Management believes that there is no tax liability resulting from unrecognized tax benefits related to uncertain tax positions taken.
Expenses – Expenses incurred by the Trust that do not relate to a specific fund of the Trust are allocated to the individual funds based on each fund’s relative net assets or another appropriate basis (as determined by the Board).
Security Transactions and Related Income – The Fund follows industry practice and records security transactions on the trade date for financial reporting purposes. For financial statement and income tax purposes, the specific identification method is used for determining capital gains or losses. Dividend income and dividend expense are recorded on the ex-dividend date and interest income is recorded on an accrual basis. Dividend income from real estate investment trusts (REITs) and distributions from limited partnerships are recognized on the ex-date. The calendar year end classification of distributions received from REITs during the fiscal year are reported subsequent to year end; accordingly, the Fund estimates the character of REIT distributions based on the most recent information available. Income or loss from Limited Partnerships is reclassified among the components of net assets upon receipt of Schedules K-1 (Form 1065). Non-cash income, if any, is recorded at the fair market value of the securities received. Withholding taxes on foreign dividends, if any, have been provided for in accordance with the Fund’s understanding of the applicable country’s tax rules and rates.
Foreign Currency Translation – Foreign currency amounts are translated into U.S. dollars as follows: (i) assets and liabilities at the rate of exchange at the end of the respective period; and (ii) purchases and sales of securities and income and expenses at the rate of exchange prevailing on the dates of such transactions. The portion of the results of operations arising from changes in the exchange rates and the portion due to fluctuations arising from changes in the market prices of securities are not isolated. Such fluctuations are included with the net realized and unrealized gain or loss on investments.
The Fund may enter into transactions to purchase or sell foreign currencies to protect the U.S. dollar value of its underlying portfolio securities against the effect of possible adverse movements in foreign exchange rates. Principal risks associated with such transactions include the movement in value of the foreign currency relative to the U.S. dollar and the
22
| LS Opportunity Fund |
| Notes to the Financial Statements (continued) |
| November 30, 2022 - (Unaudited) |
ability of the counterparty to meet its obligations. Reported net realized foreign exchange gains or losses arise from sales of foreign currencies, currency gains or losses realized between the trade and settlement dates on securities transactions, and the difference between the amounts of dividends, interest, and foreign withholding taxes recorded on the company’s books and the U.S. dollar equivalent of the amounts actually received or paid. These instruments involve market risk, credit risk, or both in excess of the amount that would be recognized in the Statement of Assets and Liabilities. Risks arise from the possible inability of counterparties to meet the terms of their contracts and from movement in currency and securities values and interest rates.
Dividends and Distributions – The Fund intends to distribute its net investment income and net realized long-term and short-term capital gains, if any, at least annually. Dividends and distributions to shareholders, which are determined in accordance with income tax regulations, are recorded on the ex-dividend date. The treatment for financial reporting purposes of distributions made to shareholders during the period from net investment income or net realized capital gains may differ from their ultimate treatment for federal income tax purposes. These differences are caused primarily by differences in the timing of the recognition of certain components of income, expense or realized capital gain for federal income tax purposes. Where such differences are permanent in nature, they are reclassified among the components of net assets based on their ultimate characterization for federal income tax purposes. Any such reclassifications will have no effect on net assets, results of operations or net asset value (“NAV”) per share of the Fund.
Share Valuation – The NAV is calculated each day the New York Stock Exchange (the “NYSE”) is open by dividing the total value of the Fund’s assets, less liabilities, by the number of shares outstanding for the Fund.
Short Sales – The Fund may make short sales as part of its overall portfolio management strategies or to offset a potential decline in value of a security. The Fund may engage in short sales with respect to various types of securities, including exchange-traded funds (ETFs). A short sale involves the sale of a security that is borrowed from a broker or other institution to complete the sale. The Fund may engage in short sales with respect to securities it owns, as well as securities that it does not own. Short sales expose the Fund to the risk that it will be required to acquire, convert or exchange securities to replace the borrowed securities (also known as “covering” the short position) at a time when the securities sold short have appreciated in value, thus resulting in a loss to the Fund. The amount of loss may exceed the proceeds received in a short sale. The Fund’s investment performance may also suffer if the Fund is required to close out a short position earlier than it had intended. The Fund must segregate assets determined to be liquid in accordance with procedures established by the Board, or otherwise cover its position in a permissible manner. The Fund will be required to pledge liquid assets to the broker in order to secure
23
| LS Opportunity Fund |
| Notes to the Financial Statements (continued) |
| November 30, 2022 - (Unaudited) |
its performance on short sales. As a result, the assets pledged may not be available to meet the Fund’s needs for immediate cash or other liquidity. In addition, the Fund may be subject to expenses related to short sales that are not typically associated with investing in securities directly, such as costs of borrowing and margin account maintenance costs associated with the Fund’s open short positions. These types of short sales expenses are sometimes referred to as the “negative cost of carry,” and will reduce the Fund’s potential return on a short sale. The amount of restricted cash or cash equivalents held at the broker as collateral for securities sold short was $47,612,487 as of November 30, 2022.
Dividend expenses on securities sold short and borrowing costs are not covered under the Adviser’s expense limitation agreement with the Fund and, therefore, these expenses will be borne by the shareholders of the Fund.
Purchasing Call Options – The Fund may purchase call options. As the holder of a call option, the Fund has the right to purchase the underlying security at the exercise price at any time during the option period. The Fund may enter into closing sale transactions with respect to such options, exercise them or permit them to expire. The Fund may also purchase call options on relevant stock indexes. Call options may also be purchased by the Fund for the purpose of acquiring the underlying securities for its portfolio. Utilized in this fashion, the purchase of call options enables the Fund to acquire the securities at the exercise price of the call option plus the premium paid. At times the net cost of acquiring securities in this manner may be less than the cost of acquiring the securities directly. This technique may also be useful to the Fund in purchasing a large block of securities that would be more difficult to acquire by direct market purchases. So long as it holds such a call option rather than the underlying security itself, the Fund is partially protected from any unexpected decline in the market price of the underlying security and in such event could allow the call option to expire, incurring a loss only to the extent of the premium paid for the option.
Purchasing Put Options – The Fund may purchase put options. As the holder of a put option, the Fund has the right to sell the underlying security at the exercise price at any time during the option period. The Fund may enter into closing sale transactions with respect to such options, exercise them or permit them to expire. The Fund may purchase a put option on an owned underlying security (a “protective put”) as a defensive technique to protect against an anticipated decline in the value of the security. Such hedge protection is provided only during the life of the put option when the Fund, as the holder of the put option, is able to sell the underlying security at the put exercise price regardless of any decline in the underlying security’s market price. The Fund may also purchase put options at a time when it does not own the underlying security. By purchasing put options on a security it does not own, the Fund seeks to benefit from a decline in the market price of the underlying security. If the put option is not sold when it has remaining value, and if
24
| LS Opportunity Fund |
| Notes to the Financial Statements (continued) |
| November 30, 2022 - (Unaudited) |
the market price of the underlying security remains equal to or greater than the exercise price during the life of the put option, the Fund will lose its entire premium paid for the put option. In order for the purchase of a put option to be profitable, the market price of the underlying security must decline sufficiently below the exercise price to cover the premium and transaction costs.
Writing Options – The Fund may write covered call options on equity securities that the Fund is eligible to purchase to extend a holding period to obtain long-term capital gain treatment, to earn premium income, to assure a definite price for a security it has considered selling, or to close out options previously purchased. The Fund may write covered call options if, immediately thereafter, not more than 30% of its net assets would be committed to such transactions. A call option gives the holder (buyer) the right to purchase a security at a specified price (the exercise price) at any time until a certain date (the expiration date). A call option is “covered” if the Fund owns the underlying security subject to the call option at all times during the option period. When the Fund writes a covered call option, it maintains a segregated account with its custodian, cash, or liquid portfolio securities in an amount not less than the exercise price at all times while the option is outstanding.
The Fund may write covered put options on equity securities and futures contracts that the Fund is eligible to purchase to earn premium income or to assure a definite price for a security if it is considering acquiring the security at a lower price than the current market price or to close out options previously purchased. The Fund may not write a put option if, immediately thereafter, more than 25% of its net assets would be committed to such transactions. A put option gives the holder of the option the right to sell, and the writer has the obligation to buy, the underlying security at the exercise price at any time during the option period. The operation of put options in other respects is substantially identical to that of call options. When the Fund writes a covered put option, it maintains in a segregated account with its custodian cash or liquid portfolio securities in an amount not less than the exercise price at all times while the put option is outstanding.
Foreign Currency Exchange Contracts – The Fund may engage in foreign currency exchange transactions. The value of the Fund’s portfolio securities that are invested in non-U.S. dollar denominated instruments as measured in U.S. dollars may be affected favorably or unfavorably by changes in foreign currency exchange rates, and the Fund may incur costs in connection with conversions between various currencies. The Fund will conduct its foreign currency exchange transactions either on a spot (i.e., cash) basis at the spot rate prevailing in the foreign currency exchange market or through forward foreign currency exchange contracts, to purchase or sell foreign currencies. A forward foreign currency exchange contract involves an obligation to purchase or sell a specific currency at a future date, which may be any fixed number of days from the date of the contract agreed upon by the parties, at a price set at the time of the contract. These contracts are traded
25
| LS Opportunity Fund |
| Notes to the Financial Statements (continued) |
| November 30, 2022 - (Unaudited) |
directly between currency traders (usually large commercial banks) and their customers. The Fund will not, however, hold foreign currency except in connection with the purchase and sale of foreign portfolio securities. The Fund did not transact in forward foreign currency exchange contracts during the six months ended November 30, 2022.
Derivative Transactions – The following tables identify the location and fair value of derivative instruments on the Statement of Assets and Liabilities as of November 30, 2022 and the effect of derivative instruments on the Statement of Operations for the six months ended November 30, 2022.
As of November 30, 2022:
| Location of Derivatives on Statement of Assets and Liabilities | ||||||||
| Derivatives | Asset Derivatives | Liability Derivatives | Fair Value | |||||
| Equity Price Risk: | ||||||||
| Options Purchased | Investments in securities, at fair value | $ | 340,927 | |||||
| Options Written | Options written,at fair value | (280,890 | ) | |||||
For the six months ended November 30, 2022:
| Change in Unrealized | ||||||||||
| Location of Gain (Loss) on | Realized Gain | Appreciation | ||||||||
| Derivatives on Statement of | (Loss) on | (Depreciation) on | ||||||||
| Derivatives | Operations | Derivatives | Derivatives | |||||||
| Equity Price Risk: | ||||||||||
| Options Purchased | Net realized gain and change in unrealized appreciation (depreciation) on purchased options | $ | 126,899 | $ | 181,990 | |||||
| Options Written | Net realized gain and change in unrealized appreciation (depreciation) on written options | 7,195 | (24,857 | ) | ||||||
The following summarizes the average ending monthly fair value of derivatives outstanding during the six months ended November 30, 2022:
| Average Ending Monthly | ||||
| Derivatives | Fair Value(a) | |||
| Options Purchased | $ | 292,072 | ||
| Options Written | (170,099 | ) | ||
| (a) | Average based on the 5 months during the period that had activity |
26
| LS Opportunity Fund |
| Notes to the Financial Statements (continued) |
| November 30, 2022 - (Unaudited) |
The following table provides a summary of offsetting financial liabilities and derivatives and the effect of derivative instruments on the Statement of Assets and Liabilities as of November 30, 2022:
| Gross Amounts Not Offset | ||||||||||||||||||||||||
| in Statements of Assets and | ||||||||||||||||||||||||
| Liabilities | ||||||||||||||||||||||||
| Net Amounts | ||||||||||||||||||||||||
| Gross Amounts | of Liabilities | |||||||||||||||||||||||
| Offset in | Presented in | |||||||||||||||||||||||
| Gross Amounts | Statement of | Statement of | ||||||||||||||||||||||
| of Recognized | Assets and | Assets and | Financial | Collateral | Net | |||||||||||||||||||
| Liabilities | liabilities | Liabilities | Instruments | Pledged | Amount | |||||||||||||||||||
| Written Options | $ | 280,890 | $ | — | $ | 280,890 | $ | (280,890 | ) | $ | — | $ | — | |||||||||||
Other – The Securities and Exchange Commission (“SEC”) adopted Rule 18f-4 under the 1940 Act which, effective August 19, 2022, regulates the use of derivatives for certain funds registered under the 1940 Act (“Rule 18f-4”). The Fund has adopted a Rule 18f-4 Policy which provides, among other things, that unless a Fund qualifies as a “limited derivatives user” as defined in Rule 18f-4, the Fund is required to establish and maintain a comprehensive derivatives risk management program, subject to oversight by the Board, to appoint a derivatives risk manager, to comply with certain value-at-risk based leverage limits and to provide additional disclosure both publicly and to the SEC regarding its derivatives positions. If a Fund qualifies as a limited derivatives user, Rule 18f-4 requires the Fund to have policies and procedures to manage its aggregate derivatives risk.
NOTE 3. SECURITIES VALUATION AND FAIR VALUE MEASUREMENTS
The Fund values its portfolio securities at fair value as of the close of regular trading on the NYSE (normally 4:00 p.m. Eastern time) on each business day the NYSE is open for business. Fair value is defined as the price that the Fund would receive upon selling an investment in a timely transaction to an independent buyer in the principal or most advantageous market of the investment. GAAP establishes a three-tier hierarchy to maximize the use of observable market data and minimize the use of unobservable inputs and to establish classification of fair value measurements for disclosure purposes.
Inputs refer broadly to the assumptions that market participants would use in pricing the asset or liability, including assumptions about risk (the risk inherent in a particular valuation technique used to measure fair value including a pricing model and/or the risk inherent in the inputs to the valuation technique). Inputs may be observable or unobservable. Observable inputs are inputs that reflect the assumptions market participants would use in pricing the asset or liability developed based on market data obtained and available from sources independent of the reporting entity. Unobservable inputs are inputs that reflect the
27
| LS Opportunity Fund |
| Notes to the Financial Statements (continued) |
| November 30, 2022 - (Unaudited) |
reporting entity’s own assumptions about the assumptions market participants would use in pricing the asset or liability developed based on the best information available in the circumstances.
Various inputs are used in determining the value of the Fund’s investments. These inputs are summarized in the three broad levels listed below.
| ● | Level 1 – unadjusted quoted prices in active markets for identical investments and/or registered investment companies where the value per share is determined and published and is the basis for current transactions for identical assets or liabilities at the valuation date |
| ● | Level 2 – other significant observable inputs (including, but not limited to, quoted prices for an identical security in an inactive market, quoted prices for similar securities, interest rates, prepayment speeds, credit risk, etc.) |
| ● | Level 3 – significant unobservable inputs (including the Fund’s own assumptions in determining fair value of investments based on the best information available) |
The inputs used to measure fair value may fall into different levels of the fair value hierarchy. In such cases, for disclosure purposes, the level in the fair value hierarchy which is reported is determined based on the lowest level input that is significant to the fair value measurement in its entirety.
Equity securities that are traded on any stock exchange are generally valued at the last quoted sale price on the security’s primary exchange. Lacking a last sale price, an exchange-traded security is generally valued at its last bid price, except in the case of a security sold short, in which case the last ask price is utilized. Securities traded in the NASDAQ over-the-counter market are generally valued at the NASDAQ Official Closing Price. When using the market quotations and when the market is considered active, the security is classified as a Level 1 security. In the event that market quotations are not readily available or are considered unreliable due to market or other events, securities are valued in good faith by the Adviser as “valuation designee” under the oversight of the Board. The Adviser has adopted written policies and procedures for valuing securities and other assets in circumstances where market quotes are not readily available. In the event that market quotes are not readily available, and the security or asset cannot be valued pursuant to one of the valuation methods, the value of the security or asset will be determined in good faith by the Adviser pursuant to its policies and procedures. On a quarterly basis, the Adviser’s fair valuation determinations will be reviewed by the Board.. Under these policies, the securities will be classified as Level 2 or 3 within the fair value hierarchy, depending on the inputs used.
28
| LS Opportunity Fund |
| Notes to the Financial Statements (continued) |
| November 30, 2022 - (Unaudited) |
Investments in mutual funds, including money market mutual funds, are generally priced at the ending NAV. These securities are categorized as Level 1 securities.
Exchange-traded options on securities and indices purchased or sold by the Fund generally will be valued at the mean of the last bid and ask prices. If there is no such reported ask on the valuation date, purchased options are valued at the most recent bid price. If there is no such reported bid on the valuation date, written options are valued at the most recent ask price. On the last business day of each month, the Cboe Options Exchange (“Cboe”) conducts special end-of-month non-trading closing rotations for the sole purpose of determining the fair value of the S&P 500 Index (SPX) option series. For month end valuations of SPX, the Cboe adjusted price will be used if the special end-of-month non-trading closing rotation fair value price differs from the price provided at market close. Options will generally be categorized as Level 2 securities.
Equity securities that are traded on any stock exchange are generally valued at the last quoted sale price on the security’s primary exchange. Lacking a last sale price, an exchange-traded security is generally valued at its last bid price. Securities traded in the NASDAQ over-the-counter market are generally valued at the NASDAQ Official Closing Price. When using the market quotations and when the market is considered active, the security is classified as a Level 1 security. In the event that market quotations are not readily available or are considered unreliable due to market or other events, securities are valued in good faith by the Adviser as “valuation designee” under the oversight of the Board. The Adviser has adopted written policies and procedures for valuing securities and other assets in circumstances where market quotes are not readily available. In the event that market quotes are not readily available, and the security or asset cannot be valued pursuant to one of the valuation methods, the value of the security or asset will be determined in good faith by the Adviser pursuant to its policies and procedures. On a quarterly basis, the Adviser’s fair valuation determinations will be reviewed by the Board. Under these policies, the securities will be classified as Level 2 or 3 within the fair value hierarchy, depending on the inputs used.
29
| LS Opportunity Fund |
| Notes to the Financial Statements (continued) |
| November 30, 2022 - (Unaudited) |
The following is a summary of the inputs used to value the Fund’s investments as of November 30, 2022:
| Valuation Inputs | ||||||||||||||||
| Assets | Level 1 | Level 2 | Level 3 | Total | ||||||||||||
| Common Stocks -Long- Domestic (a) | $ | 115,196,012 | $ | — | $ | — | $ | 115,196,012 | ||||||||
| Common Stocks -Long- International (a) | 13,312,298 | — | — | 13,312,298 | ||||||||||||
| Exchange-Traded Funds | 1,148,522 | — | — | 1,148,522 | ||||||||||||
| Call Options Purchased | — | 340,927 | — | 340,927 | ||||||||||||
| Money Market Funds | 3,406,143 | — | — | 3,406,143 | ||||||||||||
| Total | $ | 133,062,975 | $ | 340,927 | $ | — | $ | 133,403,902 | ||||||||
| (a) | Refer to Schedule of Investments for sector classifications. |
| Valuation Inputs | ||||||||||||||||
| Liabilities | Level 1 | Level 2 | Level 3 | Total | ||||||||||||
| Common Stocks- Short- Domestic(a) | $ | (38,316,370 | ) | $ | — | $ | — | $ | (38,316,370 | ) | ||||||
| Common Stocks- Short- International(a) | (5,951,574 | ) | — | — | (5,951,574 | ) | ||||||||||
| Exchange-Traded Funds | (3,867,189 | ) | — | — | (3,867,190 | ) | ||||||||||
| Call Options Written | (21,120 | ) | (259,770 | ) | — | (280,889 | ) | |||||||||
| Total | $ | (48,156,253 | ) | $ | (259,770 | ) | $ | — | $ | (48,416,023 | ) | |||||
| (a) | Refer to Schedule of Securities Sold Short for sector classifications. |
The Fund did not hold any investments at the end of the reporting period for which significant unobservable inputs (Level 3) were used in determining fair value; therefore, no reconciliation of Level 3 securities is included for this reporting period.
NOTE 4. FEES AND OTHER TRANSACTIONS WITH AFFILIATES AND OTHER SERVICE PROVIDERS
The Adviser, under the terms of the management agreement (the “Agreement”), manages the Fund’s investments. As compensation for its management services, the Fund pays the Adviser a fee, computed and accrued daily and paid monthly, at an annual rate of 1.75% of the Fund’s average daily net assets.
The Adviser has contractually agreed to waive its management fee and/or reimburse certain Fund operating expenses, but only to the extent necessary so that the Fund’s net expenses (excluding borrowing costs such as interest and dividends on securities sold short, taxes, brokerage commissions, other expenditures which are capitalized in accordance with generally accepted accounting principles, other extraordinary expenses not incurred in the ordinary course of the Fund’s business, expenses incurred under a Rule 12b-1 plan of distribution, “acquired fund fees and expenses” (i.e., investment companies in which the
30
| LS Opportunity Fund |
| Notes to the Financial Statements (continued) |
| November 30, 2022 - (Unaudited) |
Fund may invest), and expenses that the Fund has incurred but did not actually pay because of an expense offset arrangement) do not exceed 1.95% of the average daily net assets of the Fund.
Each fee waiver or expense reimbursement by the Adviser is subject to repayment by the Fund within the three years following the date on which the fee waiver or expense reimbursement occurred, provided that the Fund is able to make the repayment without exceeding the expense limitation that is in effect at the time of the repayment or at the time of the fee waiver or expense reimbursement, whichever is lower. The contractual agreement is in effect through September 30, 2023. The expense cap may not be terminated prior to this date except by mutual consent of the Adviser and the Board. The amounts subject to repayment by the Fund, pursuant to the aforementioned conditions, are as follows:
| Recoverable Through | ||||
| May 31, 2023 | $ | 61,809 | ||
| May 31, 2024 | 81,080 | |||
| May 31, 2025 | 47,098 | |||
| November 30, 2025 | 36,450 |
The Trust retains Ultimus Fund Solutions, LLC (“Ultimus” or the “Administrator”) to provide the Fund with administration, fund accounting and transfer agent services, including all regulatory reporting.
Northern Lights Compliance Services, LLC (“NLCS”), an affiliate of Ultimus, provides a Chief Compliance Officer to the Trust, as well as related compliance services, pursuant to a consulting agreement between NLCS and the Trust. Under the terms of such agreement, NLCS receives fees from the Fund.
The officers and one trustee of the Trust are members of management and/or employees of the Administrator or of NLCS, and are not paid by the Trust for services to the Fund. Ultimus Fund Distributors, LLC (the “Distributor”) acts as the distributor of the Fund’s shares. The Distributor is a wholly-owned subsidiary of Ultimus. There were no payments made to the Distributor by the Fund for the six months ended November 30, 2022.
NOTE 5. PURCHASES AND SALES OF SECURITIES
For the six months ended November 30, 2022, purchases and sales of investment securities, including written options, short sales and covers, other than short-term investments, were $44,383,008 and $52,520,468, respectively.
There were no purchases or sales of long-term U.S. government obligations during the six months ended November 30, 2022.
31
| LS Opportunity Fund |
| Notes to the Financial Statements (continued) |
| November 30, 2022 - (Unaudited) |
NOTE 6. FEDERAL TAX INFORMATION
At November 30, 2022, the net unrealized appreciation (depreciation) and tax cost of investments and securities sold short, including written options, for tax purposes was as follows:
| Gross unrealized appreciation | $ | 22,446,522 | ||
| Gross unrealized depreciation | (5,274,229 | ) | ||
| Net unrealized appreciation on investments | $ | 17,172,293 | ||
| Tax cost of investments | $ | 67,815,586 |
The difference between book basis and tax basis unrealized appreciation is attributable primarily to the tax deferral of losses on wash sales, grantor trust adjustments and return of capital distributions from underlying investments.
The tax character of distributions paid for the fiscal year ended May 31, 2022, the Fund’s most recent fiscal year end, was as follows:
| Distributions paid from:(a) | ||||
| Ordinary income | $ | — | ||
| Long-term capital gains | 5,931,433 | |||
| Total distributions paid | $ | 5,931,433 |
| (a) | Short-term capital gain distributions are treated as ordinary income for tax purposes. |
At May 31, 2022, the components of accumulated earnings (deficit) on a tax basis were as follows:
| Undistributed long-term capital gains | $ | 6,590,288 | ||
| Accumulated capital and other losses | (698,160 | ) | ||
| Unrealized appreciation on investments | 15,176,799 | |||
| Total accumulated earnings | $ | 21,068,927 |
Certain qualified late year ordinary losses incurred after December 31, and within the current taxable year, are deemed to arise on the first business day of the Fund’s following taxable year. For the tax year ended May 31, 2022, the Fund deferred Qualified Late Year Ordinary Losses in the amount of $695,084.
NOTE 7. SECTOR RISK
If the Fund has significant investments in the securities of issuers within a particular sector, any development affecting that sector will have a greater impact on the value of the net assets of the Fund than would be the case if the Fund did not have significant investments in that sector. In addition, this may increase the risk of loss in the Fund and increase the
32
| LS Opportunity Fund |
| Notes to the Financial Statements (continued) |
| November 30, 2022 - (Unaudited) |
volatility of the Fund’s NAV per share. For instance, economic or market factors, regulatory changes or other developments may negatively impact all companies in a particular sector, and therefore the value of the Fund’s portfolio will be adversely affected. As of November 30, 2022, the Fund had 29.61% of the net long/short value of its net assets invested in stocks within the Financials sector.
NOTE 8. COMMITMENTS AND CONTINGENCIES
The Trust indemnifies its officers and Trustees for certain liabilities that may arise from their performance of their duties to the Trust or the Fund. Additionally, in the normal course of business, the Trust enters into contracts that contain a variety of representations and warranties which provide general indemnifications. The Trust’s maximum exposure under these arrangements is unknown, as this would involve future claims that may be made against the Trust that have not yet occurred.
NOTE 9. SUBSEQUENT EVENTS
Management of the Fund has evaluated the need for disclosures and/or adjustments resulting from subsequent events through the date at which these financial statements were issued. Based upon this evaluation, management has determined there were no items requiring adjustment of the financial statements or additional disclosure.
33
| Liquidity Risk Management Program (Unaudited) |
Valued Advisers Trust has adopted and implemented a written liquidity risk management program as required by Rule 22e-4 (the “Liquidity Rule”) under the 1940 Act. The program is reasonably designed to assess and manage the Fund’s liquidity risk, taking into consideration, among other factors, the Fund’s investment strategy and the liquidity of its portfolio investments during normal and reasonably foreseeable stressed conditions; its short and long-term cash flow projections; and its cash holdings and access to other funding sources. The Board of Trustees approved the appointment of a Liquidity Administrator Committee, which includes representatives from Long Short Advisors, LLC, the Fund’s investment adviser, and Ultimus Fund Solutions, LLC, the Fund’s Administrator. The Liquidity Administrator Committee is responsible for the program’s administration and oversight and for reporting to the Board on at least an annual basis regarding the program’s operation and effectiveness. The Liquidity Administrator Committee updated its assessment of the Fund’s liquidity risk profile, considering additional data gathered during the period June 1, 2021 through May 31, 2022 (the “Review Period”) and the adequacy and effectiveness of the liquidity risk management program’s operations during the Review Period in order to prepare a written report for the Board of Trustees (the “Report”) for consideration at its meeting held on September 7, 2022. The Report noted that during the Review Period the Fund did not experience unusual stress or disruption to its operations related to purchase and redemption activity. It further noted that during the Review Period the Fund held adequate levels of cash and highly liquid investments to meet shareholder redemption activities in accordance with applicable requirements. The Report concluded that (i) the Trust’s liquidity risk management program is reasonably designed to prevent violations of the Liquidity Rule and (ii) the Trust’s liquidity risk management program had been effectively implemented during the Review Period.
34
| Summary of Fund Expenses (Unaudited) |
As a shareholder of the Fund, you incur two types of costs: (1) transaction and (2) ongoing costs, including management fees and other Fund expenses. These examples are intended to help you understand your ongoing costs (in dollars) of investing in the Fund and to compare these costs with the ongoing costs of investing in other funds. The example is based on an investment of $1,000 invested at the beginning of the period and held for the entire period from June 1, 2022 through November 30, 2022.
Actual Expenses
The first line of the table below provides information about actual account values and actual expenses. You may use the information in this line, together with the amount you invested, to estimate the expenses that you paid over the period. Simply divide your account value by $1,000 (for example, an $8,600 account value divided by $1,000 = 8.6), then multiply the result by the number in the first line under the heading “Expenses Paid During Period” to estimate the expenses you paid on your account during this period.
Hypothetical Example for Comparison Purposes
The second line of the table below provides information about hypothetical account values and hypothetical expenses based on the Fund’s actual expense ratio and an assumed rate of return of 5% per year before expenses, which is not the Fund’s actual return. The hypothetical account values and expenses may not be used to estimate the actual ending account balance or expenses you paid for the period. You may use this information to compare the ongoing costs of investing in the Fund and other funds. To do so, compare this 5% hypothetical example with the 5% hypothetical examples that appear in the shareholder reports of other funds.
Expenses shown in the table are meant to highlight your ongoing costs only and do not reflect any transactional costs. Therefore, the second line of the table below is useful in comparing ongoing costs only and will not help you determine the relative total costs of owning different funds. In addition, if transaction costs were included, your costs would have been higher.
| Beginning | Ending | |||||||||||||
| Account | Account | Expenses | ||||||||||||
| Value | Value | Paid | Annualized | |||||||||||
| June 1, | November | During | Expense | |||||||||||
| 2022 | 30, 2022 | Period(a) | Ratio | |||||||||||
| Actual | $ | 1,000.00 | $ | 1,012.40 | $ | 14.96 | 2.97% | |||||||
| Hypothetical(b) | $ | 1,000.00 | $ | 1,010.20 | $ | 14.95 | 2.97% | |||||||
| (a) | Expenses are equal to the Fund’s annualized expense ratio, multiplied by the average account value over the period, multiplied by 183/365 (to reflect the one-half year period). |
| (b) | Hypothetical assumes 5% annual return before expenses. |
35
Privacy Policy
| FACTS | WHAT DOES LS OPPORTUNITY FUND (THE “FUND”) DO WITH YOUR PERSONAL INFORMATION? | |
| Why? | Financial companies choose how they share your personal information. Federal law gives consumers the right to limit some but not all sharing. Federal law also requires us to tell you how we collect, share, and protect your personal information. Please read this notice carefully to understand what we do. | |
| What? | The types of personal information we collect and share depend on the product or service you have with us. This information can include:
■ Social Security number
■ account balances and account transactions
■ transaction or loss history and purchase history
■ checking account information and wire transfer instructions
When you are no longer our customer, we continue to share your information as described in this notice. | |
| How? | All financial companies need to share customers’ personal information to run their everyday business. In the section below, we list the reasons financial companies can share their customers’ personal information; the reasons the Fund chooses to share; and whether you can limit this sharing. | |
| Reasons we can share your personal information | Does the Fund share? | |
For our everyday business purposes — such as to process your transactions, maintain your account(s), respond to court orders and legal investigations, or report to credit bureaus | Yes | |
For our marketing purposes — to offer our products and services to you | No | |
| For joint marketing with other financial companies | No | |
For our affiliates’ everyday business purposes — information about your transactions and experiences | No | |
For our affiliates’ everyday business purposes — information about your creditworthiness | No | |
| For nonaffiliates to market to you | No | |
| Questions? | Call (877) 336-6763 | |
36
| Who we are | |
| Who is providing this notice? | LS Opportunity Fund Ultimus Fund Distributors, LLC (Distributor) Ultimus Fund Solutions, LLC (Administrator) |
| What we do | |
| How does the Fund protect my personal information? | To protect your personal information from unauthorized access and use, we use security measures that comply with federal law. These measures include computer safeguards and secured files and buildings. Our service providers are held accountable for adhering to strict policies and procedures to prevent any misuse of your nonpublic personal information. |
| How does the Fund collect my personal information? | We collect your personal information, for example, when you
■ open an account or deposit money
■ buy securities from us or sell securities to us
■ make deposits or withdrawals from your account
■ give us your account information
■ make a wire transfer
■ tell us who receives the money
■ tell us where to send the money
■ show your government-issued ID
■ show your driver’s license |
| Why can’t I limit all sharing? | Federal law gives you the right to limit only
■ sharing for affiliates’ everyday business purposes — information about your creditworthiness
■ affiliates from using your information to market to you
■ sharing for nonaffiliates to market to you
State laws and individual companies may give you additional rights to limit sharing. |
| Definitions | |
| Affiliates | Companies related by common ownership or control. They can be financial and nonfinancial companies.
■ Long Short Advisors, LLC, the investment adviser to the Fund, could be deemed to be an affiliate. |
| Nonaffiliates | Companies not related by common ownership or control. They can be financial and nonfinancial companies.
■ The Fund does not share your personal information with nonaffiliates so they can market to you. |
| Joint marketing | A formal agreement between nonaffiliated financial companies that together market financial products or services to you.
■ The Fund does not jointly market. |
37
Proxy Voting
A description of the policies and procedures that the Fund uses to determine how to vote proxies relating to portfolio securities and information regarding how the Fund voted those proxies during the most recent twelve month period ended June 30, are available (1) without charge upon request by calling the Fund at (877) 336-6763 and (2) in Fund documents filed with the SEC on the SEC’s website at www.sec.gov.
| TRUSTEES Andrea N. Mullins, Chairperson Ira P. Cohen Mark J. Seger | INDEPENDENT REGISTERED PUBLIC ACCOUNTING FIRM Cohen & Company, Ltd. 1350 Euclid Avenue, Suite 800 Cleveland, OH 44115 |
| OFFICERS Matthew J. Miller, Principal Executive Officer and President Zachary P. Richmond, Principal Financial Officer and Treasurer N. Lynn Bowley, Chief Compliance Officer Carol J. Highsmith, Vice President and Secretary | LEGAL COUNSEL Troutman Pepper Hamilton Sanders LLP 3000 Two Logan Square 18th and Arch Streets Philadelphia, PA 19103 |
| INVESTMENT ADVISER Long Short Advisors, LLC 3330 Fairchild Gardens Avenue, Suite 30428 Palm Beach Gardens, FL 33420 | CUSTODIAN U.S. Bank, N.A. 425 Walnut Street Cincinnati, OH 45202 |
| DISTRIBUTOR Ultimus Fund Distributors, LLC 225 Pictoria Drive, Suite 450 Cincinnati, OH 45246 | ADMINISTRATOR, TRANSFER AGENT AND FUND ACCOUNTANT Ultimus Fund Solutions, LLC 225 Pictoria Drive, Suite 450 Cincinnati, OH 45246 |
This report is intended only for the information of shareholders or those who have received the Fund’s prospectus which contains information about the Fund’s management fee and expenses. Please read the prospectus carefully before investing.
Distributed by Ultimus Fund Distributors, LLC, Member FINRA/SIPC
LS-SAR-22
(b) Not Applicable
Item 2. Code of Ethics. NOT APPLICABLE – disclosed with annual report
Item 3. Audit Committee Financial Expert. NOT APPLICABLE – disclosed with annual report
Item 4. Principal Accountant Fees and Services. NOT APPLICABLE – disclosed with annual report
Item 5. Audit Committee of Listed Companies. NOT APPLICABLE – applies to listed companies only
Item 6. Schedule of Investments. Schedules filed with Item 1.
Item 7. Disclosure of Proxy Voting Policies and Procedures for Closed-End Management Investment Companies. NOT APPLICABLE – applies to closed-end funds only
Item 8. Portfolio Managers of Closed-End Investment Companies. NOT APPLICABLE – applies to closed-end funds only
Item 9. Purchases of Equity Securities by Closed-End Management Investment Company and Affiliated Purchasers. NOT APPLICABLE – applies to closed-end funds only
Item 10. Submission of Matters to a Vote of Security Holders.
The guidelines applicable to shareholders desiring to submit recommendations for nominees to the Registrant's board of trustees are contained in the statement of additional information of the Trust with respect to the Fund(s) for which this Form N-CSR is being filed.
Item 11. Controls and Procedures.
(a) Based on their evaluation of the registrant’s disclosure controls and procedures (as defined in Rule 30a-3(c) under the Investment Company Act of 1940, as amended (the “Act”)) as of a date within 90 days of the filing date of this report, the registrant’s principal executive officer and principal financial officer have concluded that such disclosure controls and procedures are reasonably designed and are operating effectively to ensure that material information relating to the registrant is made known to them by others within those entities, particularly during the period in which this report is being prepared, and that the information required in filings on Form N-CSR is recorded, processed, summarized, and reported on a timely basis.
(b) There were no changes in the registrant’s internal control over financial reporting (as defined in Rule 30a-3(d) under the Investment Company Act of 1940) that occurred during the period covered by this report that have materially affected, or are reasonably likely to materially affect, the registrant’s internal control over financial reporting.
Item 12. Disclosure of Securities Lending Activities for Closed-End Management Investment Companies. NOT APPLICABLE – applies to closed-end funds only
Item 13. Exhibits.
(a) (1) NOT APPLICABLE – disclosed with annual report
(3) Not Applicable
Pursuant to the requirements of the Securities Exchange Act of 1934 and the Investment Company Act of 1940, the registrant has duly caused this report to be signed on its behalf by the undersigned, thereunto duly authorized.
(Registrant) Valued Advisers Trust
By /s/ Matthew J. Miller
Matthew J. Miller, President and Principal Executive Officer
Date 2/2/2023
Pursuant to the requirements of the Securities Exchange Act of 1934 and the Investment Company Act of 1940, this report has been signed below by the following persons on behalf of the registrant and in the capacities and on the dates indicated.
By /s/ Matthew J. Miller
Matthew J. Miller, President and Principal Executive Officer
Date 2/2/2023
By /s/ Zachary P. Richmond
Zachary P. Richmond, Treasurer and Principal Financial Officer
Date 2/2/2023