UNITED STATES
SECURITIES AND EXCHANGE COMMISSION
Washington, D.C. 20549
FORM N-CSR
Certified Shareholder Report of
Registered Management Investment Companies
Investment Company Act File Number: 811-22215
International Growth and Income Fund
(Exact Name of Registrant as Specified in Charter)
6455 Irvine Center Drive
Irvine, California 92618
(Address of Principal Executive Offices)
Registrant's telephone number, including area code: (949) 975-5000
Date of fiscal year end: June 30
Date of reporting period: June 30, 2020
Hong T. Le
International Growth and Income Fund
6455 Irvine Center Drive
Irvine, California 92618
(Name and Address of Agent for Service)
ITEM 1 – Reports to Stockholders
International Growth and
Annual report |
![]()
Pursues growth and
income opportunities
across international
markets
Beginning January 1, 2021, as permitted by regulations adopted by the U.S. Securities and Exchange Commission, we intend to no longer mail paper copies of the fund’s shareholder reports, unless specifically requested from American Funds or your financial intermediary, such as a broker-dealer or bank. Instead, the reports will be made available on the Capital Group website (capitalgroup.com); you will be notified by mail and provided with a website link to access the report each time a report is posted. If you have already elected to receive shareholder reports electronically, you will not be affected by this change and do not need to take any action. If you prefer to receive shareholder reports and other communications electronically, you may update your mailing preferences with your financial intermediary, or enroll in e-delivery at capitalgroup.com (for accounts held directly with the fund).
You may elect to receive paper copies of all future reports free of charge. If you invest through a financial intermediary, you may contact your financial intermediary to request that you continue to receive paper copies of your shareholder reports. If you invest directly with the fund, you may inform American Funds that you wish to continue receiving paper copies of your shareholder reports by contacting us at (800) 421-4225. Your election to receive paper reports will apply to all funds held with American Funds or through your financial intermediary.
International Growth and Income Fund seeks to provide you with long-term growth of capital while providing current income.
This fund is one of more than 40 offered by Capital Group, home of American Funds, one of the nation’s largest mutual fund families. For nearly 90 years, Capital Group has invested with a long-term focus based on thorough research and attention to risk.
Fund results shown in this report, unless otherwise indicated, are for Class A shares at net asset value. If a sales charge (maximum 5.75%) had been deducted, the results would have been lower. Results are for past periods and are not predictive of results for future periods. Current and future results may be lower or higher than those shown. Prices and returns will vary, so investors may lose money. Investing for short periods makes losses more likely. For current information and month-end results, visit capitalgroup.com.
See page 4 for Class A share results with relevant sales charges deducted. For other share class results, visit capitalgroup.com and americanfundsretirement.com.
Investment results assume all distributions are reinvested and reflect applicable fees and expenses. When applicable, investment results reflect fee waivers, without which results would have been lower. Visit capitalgroup.com for more information.
The fund’s 30-day yield for Class A shares as of July 31, 2020, reflecting the 5.75% maximum sales charge and calculated in accordance with the U.S. Securities and Exchange Commission formula, was 1.69%.
Investing outside the United States may be subject to risks, such as currency fluctuations, periods of illiquidity and price volatility. These risks may be heightened in connection with investments in developing countries. Refer to the fund prospectus and the Risk Factors section of this report for more information on these and other risks associated with investing in the fund.
Investments are not FDIC-insured, nor are they deposits of or guaranteed by a bank or any other entity, so they may lose value.
| Contents | |
| 1 | Letter to investors |
| 4 | The value of a long-term perspective |
| 5 | Summary investment portfolio |
| 8 | Financial statements |
| 26 | Board of trustees and other officers |
International equity markets declined during the fund’s fiscal year as the coronavirus pandemic brought the long-running global economic expansion to an abrupt halt.
Against a backdrop of extreme market volatility, the fund recorded a 5.56% decline for the 12 months ended June 30, 2020. This total return includes quarterly dividend payments totaling about 62 cents a share for the period.
The fund’s result trailed the 4.80% loss registered by its primary benchmark, the MSCI ACWI (All Country World Index) ex USA, which reflects the returns of more than 40 developed- and developing-country stock markets. The index is unmanaged and, therefore, has no expenses. We are disappointed with the fund’s results in both absolute and relative terms. In part, the disappointing returns reflect a market that has rewarded growth-oriented investments over established dividend-paying companies — and U.S.-domiciled growth companies, in particular — for an extended period. These trends were further amplified by the coronavirus pandemic. That said, we hold true to our belief that that the fund’s focus on companies in non-U.S. markets that pay meaningful dividends can benefit investors over the long term. Returns for longer time frames are shown below.
An encouraging start, then a global slowdown
International equities moved higher in the first half of the fiscal year, lifted by a de-escalation of the U.S.-China trade war and aggressive measures taken by major central banks to bolster wavering economic growth. By March, however, the coronavirus outbreak brought the global economy to a virtual standstill as
Results at a glance
For periods ended June 30, 2020, with all distributions reinvested
| Cumulative total returns | Average annual total returns | |||||||||||||||
| 1 year | 5 years | 10 years | Lifetime (since 10/1/08) | |||||||||||||
| International Growth and Income Fund (Class A shares) | –5.56 | % | 1.56 | % | 5.49 | % | 5.47 | % | ||||||||
| MSCI ACWI ex USA* | –4.80 | 2.26 | 4.97 | 3.95 | ||||||||||||
| * | The market index is unmanaged and, therefore, has no expenses. Investors cannot invest directly in an index. |
| International Growth and Income Fund | 1 |
governments around the world ordered people to stay home and avoid all non-essential activities. Most stock markets plummeted.
Central banks and national leaders responded with unprecedented monetary and fiscal stimulus measures in an attempt to lessen the severity of an expected global recession. Equity markets enjoyed a resurgence in the closing months of the fiscal year, as some countries appeared to contain the spread of the virus and investors looked forward to an economic rebound.
Most sectors lost ground. Energy stocks suffered the steepest losses of the period, as oil prices plummeted amid evaporating demand and a price war between Russia and Saudi Arabia. The declines were tempered by a rally late in the fiscal year as oil prices jumped on the easing of travel restrictions and OPEC production cuts. Financials also declined sharply as a number of banks said they would suspend dividend payments to conserve capital.
Notable exceptions to the downward trend were the information technology and health care sectors. Shares of companies engaged in streaming, networking and food delivery soared as consumers under stay-at-home orders turned to the internet for shopping and entertainment. Select drug makers benefited from increased demand for coronavirus test kits and investor optimism for potential treatments to fight COVID-19, the disease caused by the coronavirus. In general, growth stocks outpaced value stocks.
Inside the portfolio
The fund received some of its strongest contributions from select holdings in the information technology sector. Taiwan Semiconductor Manufacturing (TSMC), the fund’s largest investment, and Dutch semiconductor equipment maker ASML soared as the pandemic accelerated digital activity and highlighted the need for infrastructure and technology upgrades to support that activity.
While the fund’s exposure to the financial sector produced an overall negative return, the sector was a top contributor in relative terms thanks to strong stock selection and an underweight position in banks. Select holdings recorded solid gains, including EQT, the Swedish global alternative asset manager. However, shares of Asian life insurer AIA Group, the fund’s eighth-largest investment, declined amid political unrest in Hong Kong.
Investments in consumer companies were mixed. Evolution Gaming, a leading maker of B2B live casino systems, soared more than 200% during the period. However, Chinese e-commerce platform company Alibaba lost ground. Among holdings in the consumer discretionary sector, casino operators Wynn Macau (–22.45%), the fund’s tenth-largest position, and MGM China Holdings (–23.54%) both fell sharply amid rising concerns about the impact of a slowing China economy and the simmering U.S.-China trade dispute.
Stock selection in the industrials sector hurt the fund’s results. Shares of Airbus fell 49.81% as the European aircraft manufacturer faced a sharp drop in orders from its primary customers in the commercial airline industry as passenger traffic plummeted.
Elsewhere among the fund’s top 10 positions, British drug maker AstraZeneca and Italian utility Enel both posted double-digit gains.
Looking ahead
Many of the challenges investors face today are well known. What remains unknown is the full impact of the coronavirus outbreak. As of this writing the number of cases in the United States and some other countries was surging. First and foremost, our thoughts are with the people who have fallen ill or whose lives have been otherwise affected by this terrible pandemic. We look forward to the day when the virus has been contained, economies are fully operational and life gets back to some sense of normalcy. Until a vaccine or effective therapies are developed to treat the virus, any signs of economic recovery could be tentative.
That said, the world has faced deadly outbreaks before — from SARS in 2003, to swine flu in 2009, to Ebola in 2014. Investment professionals who help manage this fund lived and worked in Hong Kong during the SARS outbreak. At the time it was widely believed that few would ever get on an airplane again. But eventually the outbreak was suppressed and normal life resumed. We are hopeful the coronavirus will follow a similar path.
For much of the last five years, those companies paying higher dividends have trailed companies paying little or
| 2 | International Growth and Income Fund |
no dividends by a considerable margin. Likewise, most international markets have trailed the U.S. market. The areas that have lagged are precisely where this fund looks for investment opportunity. While these trends appear to have been amplified by the pandemic, we do not expect them to continue indefinitely.
As a result of this bifurcation, we believe we are finding many opportunities to invest in strong, established businesses in markets around the world with compelling valuations. We also firmly believe that with our patient approach, global research effort and conviction in dividend-focused investing in international markets, we can withstand bouts of volatility and generate long-term value for our shareholders.
We thank you for your continued support of International Growth and Income Fund, and we look forward to reporting back to you in six months.
Cordially,

Andrew B. Suzman
Co-President

Steven T. Watson
Co-President
August 12, 2020
For current information about the fund, visit capitalgroup.com.
| International Growth and Income Fund | 3 |
The value of a long-term perspective
How a hypothetical $10,000 investment has grown (for the period October 1, 2008, to June 30, 2020, with dividends reinvested)
Fund results shown are for Class A shares and reflect deduction of the maximum sales charge of 5.75% on the $10,000 investment.1 Thus, the net amount invested was $9,425. Results are for past periods and are not predictive of results for future periods. Current and future results may be lower or higher than those shown. Prices and returns will vary, so investors may lose money. Investing for short periods makes losses more likely. For current information and month-end results, visit capitalgroup.com.
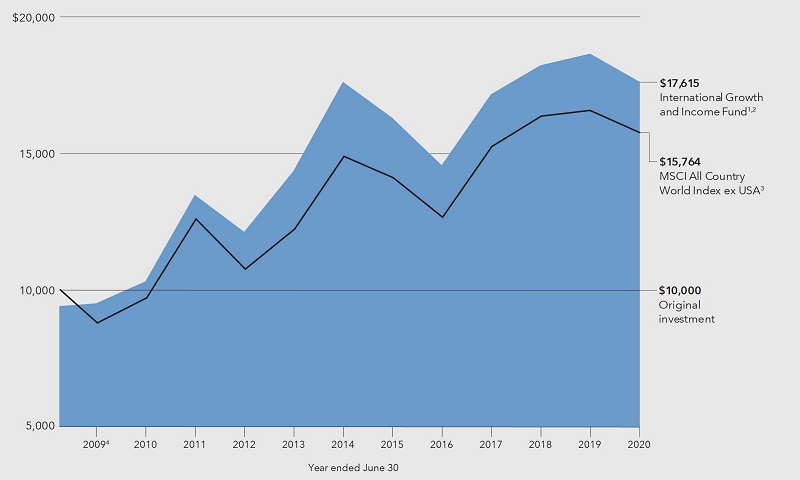
| 1 | As outlined in the prospectus, the sales charge is reduced for accounts (and aggregated investments) of $25,000 or more and is eliminated for purchases of $1 million or more. There is no sales charge on dividends or capital gain distributions that are reinvested in additional shares. |
| 2 | All results are calculated with dividends and capital gains reinvested. |
| 3 | Source: MSCI. The market index is unmanaged and, therefore, has no expenses. The index reflects dividends net of withholding taxes. Investors cannot invest directly in an index. |
| 4 | For the period October 1, 2008 (when the fund began operations), through June 30, 2009. |
Average annual total returns based on a $1,000 investment (for periods ended June 30, 2020)*
| 1 year | 5 years | 10 years | ||||
| Class A shares | –11.00% | 0.36% | 4.86% |
| * | Assumes reinvestment of all distributions and payment of the maximum 5.75% sales charge. |
The total annual fund operating expense ratio is 0.92% for Class A shares as of the prospectus dated September 1, 2020 (unaudited).
Investment results assume all distributions are reinvested and reflect applicable fees and expenses. When applicable, investment results reflect fee waivers, without which results would have been lower. Visit capitalgroup.com for more information.
| 4 | International Growth and Income Fund |
Summary investment portfolio June 30, 2020
| Industry sector diversification | Percent of net assets |

| Country diversification by domicile | Percent of net assets | |||
| Euro zone* | 23.99 | % | ||
| United Kingdom | 15.49 | |||
| Japan | 7.65 | |||
| China | 6.52 | |||
| Switzerland | 6.36 | |||
| Hong Kong | 5.49 | |||
| Taiwan | 4.43 | |||
| United States | 4.18 | |||
| Canada | 3.49 | |||
| Other countries | 18.20 | |||
| Short-term securities & other assets less liabilities | 4.20 | |||
| * | Countries using the euro as a common currency; those represented in the fund’s portfolio are Belgium, Finland, France, Germany, Greece, Ireland, Italy, the Netherlands, Portugal and Spain. |
| Common stocks 93.09% | Shares | Value (000) | ||||||
| Financials 17.38% | ||||||||
| AIA Group Ltd.1 | 27,092,200 | $ | 252,149 | |||||
| EQT AB1 | 8,243,555 | 147,601 | ||||||
| Ping An Insurance (Group) Co. of China, Ltd., Class H1 | 14,489,000 | 144,702 | ||||||
| Zurich Insurance Group AG1 | 403,766 | 142,193 | ||||||
| Euronext NV1 | 1,352,998 | 135,498 | ||||||
| Toronto-Dominion Bank (CAD denominated) | 2,651,424 | 118,334 | ||||||
| Prudential PLC1 | 7,079,356 | 106,613 | ||||||
| HDFC Bank Ltd.1 | 7,184,091 | 102,406 | ||||||
| Sberbank of Russia PJSC (ADR)1,2 | 8,829,392 | 100,310 | ||||||
| AXA SA1,2 | 4,601,330 | 96,026 | ||||||
| Other securities | 1,404,720 | |||||||
| 2,750,552 | ||||||||
| Information technology 12.16% | ||||||||
| Taiwan Semiconductor Manufacturing Company, Ltd.1 | 55,568,506 | 588,028 | ||||||
| ASML Holding NV1 | 966,781 | 354,401 | ||||||
| Tokyo Electron Ltd.1 | 797,500 | 195,716 | ||||||
| SAP SE1 | 721,346 | 100,408 | ||||||
| Other securities | 685,193 | |||||||
| 1,923,746 | ||||||||
| Consumer staples 10.65% | ||||||||
| British American Tobacco PLC1 | 11,811,525 | 453,816 | ||||||
| Nestlé SA1 | 2,327,188 | 257,097 | ||||||
| Philip Morris International Inc. | 2,561,607 | 179,466 | ||||||
| Pernod Ricard SA1 | 849,054 | 133,445 | ||||||
| Associated British Foods PLC1 | 4,723,677 | 111,938 | ||||||
| Anheuser-Busch InBev SA/NV1 | 2,198,641 | 108,364 | ||||||
| Kweichow Moutai Co., Ltd., Class A1 | 467,763 | 96,805 | ||||||
| Other securities | 343,773 | |||||||
| 1,684,704 | ||||||||
| Consumer discretionary 10.49% | ||||||||
| Wynn Macau, Ltd.1 | 109,053,200 | 189,455 | ||||||
| LVMH Moët Hennessy-Louis Vuitton SE1 | 309,298 | 135,472 | ||||||
| Evolution Gaming Group AB1 | 2,241,311 | 133,487 | ||||||
| Alibaba Group Holding Ltd.1,2 | 4,838,000 | 130,736 | ||||||
| Other securities | 1,070,349 | |||||||
| 1,659,499 | ||||||||
| International Growth and Income Fund | 5 |
| Common stocks (continued) | Shares | Value (000) | ||||||
| Health care 9.41% | ||||||||
| AstraZeneca PLC1 | 4,225,206 | $ | 440,463 | |||||
| Sanofi1 | 1,774,692 | 180,555 | ||||||
| Novartis AG1 | 1,650,846 | 143,443 | ||||||
| Novo Nordisk A/S, Class B1 | 1,673,486 | 108,293 | ||||||
| Koninklijke Philips NV (EUR denominated)1,2 | 2,294,490 | 106,847 | ||||||
| Other securities | 509,263 | |||||||
| 1,488,864 | ||||||||
| Industrials 7.63% | ||||||||
| Airbus SE, non-registered shares1,2 | 2,265,965 | 161,243 | ||||||
| BAE Systems PLC1 | 25,255,891 | 151,065 | ||||||
| SMC Corp.1 | 231,400 | 118,107 | ||||||
| Other securities | 777,465 | |||||||
| 1,207,880 | ||||||||
| Utilities 6.29% | ||||||||
| Enel SpA1 | 41,152,645 | 354,537 | ||||||
| Ørsted AS1 | 1,233,237 | 142,229 | ||||||
| Engie SA1,2 | 7,619,174 | 94,046 | ||||||
| Other securities | 404,169 | |||||||
| 994,981 | ||||||||
| Communication services 6.08% | ||||||||
| Koninklijke KPN NV1 | 60,056,826 | 159,066 | ||||||
| Vodafone Group PLC1 | 97,007,427 | 154,684 | ||||||
| Nintendo Co., Ltd.1 | 300,800 | 133,846 | ||||||
| Tencent Holdings Ltd.1 | 1,674,700 | 107,572 | ||||||
| Other securities | 407,288 | |||||||
| 962,456 | ||||||||
| Energy 5.15% | ||||||||
| LUKOIL Oil Co. PJSC (ADR)1 | 1,604,193 | 118,912 | ||||||
| Gazprom PJSC (ADR)1 | 20,184,915 | 108,711 | ||||||
| TC Energy Corp. (CAD denominated) | 2,401,400 | 102,594 | ||||||
| Other securities | 484,288 | |||||||
| 814,505 | ||||||||
| Materials 5.04% | ||||||||
| Vale SA, ordinary nominative | 11,137,000 | 114,522 | ||||||
| Vale SA, ordinary nominative (ADR) | 2,495,000 | 25,723 | ||||||
| Linde PLC | 608,500 | 129,069 | ||||||
| Koninklijke DSM NV1 | 844,477 | 116,726 | ||||||
| Other securities | 412,264 | |||||||
| 798,304 | ||||||||
| Real estate 2.81% | ||||||||
| Longfor Group Holdings Ltd.1 | 25,035,000 | 119,243 | ||||||
| CK Asset Holdings Ltd.1 | 17,128,244 | 101,853 | ||||||
| Other securities | 223,023 | |||||||
| 444,119 | ||||||||
| Total common stocks (cost: $13,161,873,000) | 14,729,610 | |||||||
| Preferred securities 2.71% | ||||||||
| Information technology 1.64% | ||||||||
| Samsung Electronics Co., Ltd., nonvoting preferred shares1 | 6,662,535 | 260,187 | ||||||
| 260,187 | ||||||||
| Other 1.07% | ||||||||
| Other securities | 168,182 | |||||||
| Total preferred securities (cost: $437,475,000) | 428,369 | |||||||
| 6 | International Growth and Income Fund |
| Short-term securities 4.14% | Shares | Value (000) | ||||||
| Money market investments 4.14% | ||||||||
| Capital Group Central Cash Fund 0.18%3 | 6,550,781 | $ | 655,144 | |||||
| Total short-term securities (cost: $655,042,000) | 655,144 | |||||||
| Total investment securities 99.94% (cost: $14,254,390,000) | 15,813,123 | |||||||
| Other assets less liabilities 0.06% | 9,330 | |||||||
| Net assets 100.00% | $ | 15,822,453 | ||||||
This summary investment portfolio is designed to streamline the report and help investors better focus on the fund’s principal holdings. See the inside back cover for details on how to obtain a complete schedule of portfolio holdings.
“Other securities” includes all issues that are not disclosed separately in the summary investment portfolio.
| 1 | Valued under fair value procedures adopted by authority of the board of trustees. The total value of all such securities, including those in “Other securities,” was $13,167,799,000, which represented 83.22% of the net assets of the fund. This entire amount relates to certain securities trading outside the U.S. whose values were adjusted as a result of significant market movements following the close of local trading. |
| 2 | Security did not produce income during the last 12 months. |
| 3 | Rate represents the seven-day yield at 6/30/2020. |
Key to abbreviations
ADR = American Depositary Receipts
CAD = Canadian dollars
EUR = Euros
See notes to financial statements.
| International Growth and Income Fund | 7 |
| Statement of assets and liabilities | |
| at June 30, 2020 | (dollars in thousands) |
| Assets: | ||||||||
| Investment securities in unaffiliated issuers, at value (cost: $14,254,390) | $ | 15,813,123 | ||||||
| Cash | 1,119 | |||||||
| Cash denominated in currencies other than U.S. dollars (cost: $9,696) | 9,688 | |||||||
| Receivables for: | ||||||||
| Sales of investments | $ | 6,520 | ||||||
| Sales of fund’s shares | 12,267 | |||||||
| Dividends and interest | 56,002 | 74,789 | ||||||
| 15,898,719 | ||||||||
| Liabilities: | ||||||||
| Payables for: | ||||||||
| Purchases of investments | 49,925 | |||||||
| Repurchases of fund’s shares | 12,564 | |||||||
| Investment advisory services | 6,181 | |||||||
| Services provided by related parties | 1,708 | |||||||
| Trustees’ deferred compensation | 2,387 | |||||||
| Other | 3,501 | 76,266 | ||||||
| Net assets at June 30, 2020 | $ | 15,822,453 | ||||||
| Net assets consist of: | ||||||||
| Capital paid in on shares of beneficial interest | $ | 15,678,974 | ||||||
| Total distributable earnings | 143,479 | |||||||
| Net assets at June 30, 2020 | $ | 15,822,453 | ||||||
(dollars and shares in thousands, except per-share amounts)
Shares of beneficial interest issued and outstanding (no stated par value) —
unlimited shares authorized (514,511 total shares outstanding)
| Net assets | Shares outstanding | Net asset value per share | ||||||||||
| Class A | $ | 3,998,983 | 129,997 | $ | 30.76 | |||||||
| Class C | 146,462 | 4,769 | 30.71 | |||||||||
| Class T | 10 | — | * | 30.75 | ||||||||
| Class F-1 | 200,895 | 6,523 | 30.80 | |||||||||
| Class F-2 | 2,454,914 | 79,791 | 30.77 | |||||||||
| Class F-3 | 3,554,352 | 115,630 | 30.74 | |||||||||
| Class 529-A | 132,807 | 4,323 | 30.72 | |||||||||
| Class 529-C | 19,967 | 653 | 30.59 | |||||||||
| Class 529-E | 4,513 | 147 | 30.73 | |||||||||
| Class 529-T | 11 | — | * | 30.75 | ||||||||
| Class 529-F-1 | 21,601 | 702 | 30.76 | |||||||||
| Class R-1 | 2,685 | 87 | 30.71 | |||||||||
| Class R-2 | 47,334 | 1,546 | 30.61 | |||||||||
| Class R-2E | 35,049 | 1,146 | 30.60 | |||||||||
| Class R-3 | 77,573 | 2,527 | 30.70 | |||||||||
| Class R-4 | 63,510 | 2,066 | 30.74 | |||||||||
| Class R-5E | 13,687 | 446 | 30.72 | |||||||||
| Class R-5 | 31,705 | 1,025 | 30.92 | |||||||||
| Class R-6 | 5,016,395 | 163,133 | 30.75 | |||||||||
| * | Amount less than one thousand. |
See notes to financial statements.
| 8 | International Growth and Income Fund |
| Statement of operations | |
| for the year ended June 30, 2020 | (dollars in thousands) |
| Investment income: | ||||||||
| Income: | ||||||||
| Dividends (net of non-U.S. taxes of $34,082) | $ | 418,264 | ||||||
| Interest | 53 | $ | 418,317 | |||||
| Fees and expenses*: | ||||||||
| Investment advisory services | 72,983 | |||||||
| Distribution services | 15,178 | |||||||
| Transfer agent services | 10,335 | |||||||
| Administrative services | 4,589 | |||||||
| Reports to shareholders | 565 | |||||||
| Registration statement and prospectus | 532 | |||||||
| Trustees’ compensation | 410 | |||||||
| Auditing and legal | 175 | |||||||
| Custodian | 3,074 | |||||||
| Other | 169 | 108,010 | ||||||
| Net investment income | 310,307 | |||||||
| Net realized loss and unrealized depreciation: | ||||||||
| Net realized (loss) gain on: | ||||||||
| Investments in unaffiliated issuers | (520,100 | ) | ||||||
| In-kind redemptions | 2,303 | |||||||
| Currency transactions | (4,540 | ) | (522,337 | ) | ||||
| Net unrealized depreciation on: | ||||||||
| Investments in unaffiliated issuers | (570,292 | ) | ||||||
| Currency translations | (1,920 | ) | (572,212 | ) | ||||
| Net realized loss and unrealized depreciation | (1,094,549 | ) | ||||||
| Net decrease in net assets resulting from operations | $ | (784,242 | ) |
| * | Additional information related to class-specific fees and expenses is included in the notes to financial statements. |
| Statements of changes in net assets | |
| (dollars in thousands) |
| Year ended June 30, | ||||||||
| 2020 | 2019 | |||||||
| Operations: | ||||||||
| Net investment income | $ | 310,307 | $ | 372,555 | ||||
| Net realized loss | (522,337 | ) | (56,078 | ) | ||||
| Net unrealized (depreciation) appreciation | (572,212 | ) | 87,851 | |||||
| Net (decrease) increase in net assets resulting from operations | (784,242 | ) | 404,328 | |||||
| Distributions paid to shareholders | (327,783 | ) | (372,258 | ) | ||||
| Net capital share transactions | 1,585,951 | 1,067,604 | ||||||
| Total increase in net assets | 473,926 | 1,099,674 | ||||||
| Net assets: | ||||||||
| Beginning of year | 15,348,527 | 14,248,853 | ||||||
| End of year | $ | 15,822,453 | $ | 15,348,527 | ||||
See notes to financial statements.
| International Growth and Income Fund | 9 |
Notes to financial statements
1. Organization
International Growth and Income Fund (the “fund”) is registered under the Investment Company Act of 1940 as an open-end, diversified management investment company. The fund seeks to provide long-term growth of capital while providing current income.
The fund has 19 share classes consisting of six retail share classes (Classes A, C, T, F-1, F-2 and F-3), five 529 college savings plan share classes (Classes 529-A, 529-C, 529-E, 529-T and 529-F-1) and eight retirement plan share classes (Classes R-1, R-2, R-2E, R-3, R-4, R-5E, R-5 and R-6). The 529 college savings plan share classes can be used to save for college education. The retirement plan share classes are generally offered only through eligible employer-sponsored retirement plans. The fund’s share classes are described further in the following table:
| Share class | Initial sales charge | Contingent deferred sales charge upon redemption | Conversion feature | ||||
| Classes A and 529-A | Up to 5.75%1 | None (except 1% for certain redemptions within 18 months of purchase without an initial sales charge) | None | ||||
| Class C | None | 1% for redemptions within one year of purchase | Class C converts to Class F-1 after 10 years2 | ||||
| Class 529-C | None | 1% for redemptions within one year of purchase | Class 529-C converts to Class 529-A after 10 years3 | ||||
| Class 529-E | None | None | None | ||||
| Classes T and 529-T4 | Up to 2.50% | None | None | ||||
| Classes F-1, F-2, F-3 and 529-F-1 | None | None | None | ||||
| Classes R-1, R-2, R-2E, R-3, R-4, R-5E, R-5 and R-6 | None | None | None |
| 1 | Up to 3.50% for Class 529-A shares purchased on or after June 30, 2020. |
| 2 | Effective June 30, 2020, Class C converts to Class A after 8 years. |
| 3 | Effective June 30, 2020, Class 529-C converts to Class 529-A after 5 years. |
| 4 | Class T and 529-T shares are not available for purchase. |
Holders of all share classes have equal pro rata rights to the assets, dividends and liquidation proceeds of the fund. Each share class has identical voting rights, except for the exclusive right to vote on matters affecting only its class. Share classes have different fees and expenses (“class-specific fees and expenses”), primarily due to different arrangements for distribution, transfer agent and administrative services. Differences in class-specific fees and expenses will result in differences in net investment income and, therefore, the payment of different per-share dividends by each share class.
2. Significant accounting policies
The fund is an investment company that applies the accounting and reporting guidance issued in Topic 946 by the U.S. Financial Accounting Standards Board. The fund’s financial statements have been prepared to comply with U.S. generally accepted accounting principles (“U.S. GAAP”). These principles require the fund’s investment adviser to make estimates and assumptions that affect reported amounts and disclosures. Actual results could differ from those estimates. Subsequent events, if any, have been evaluated through the date of issuance in the preparation of the financial statements. The fund follows the significant accounting policies described in this section, as well as the valuation policies described in the next section on valuation.
Security transactions and related investment income — Security transactions are recorded by the fund as of the date the trades are executed with brokers. Realized gains and losses from security transactions are determined based on the specific identified cost of the securities. In the event a security is purchased with a delayed payment date, the fund will segregate liquid assets sufficient to meet its payment obligations. Dividend income is recognized on the ex-dividend date and interest income is recognized on an accrual basis. Market discounts, premiums and original issue discounts on fixed-income securities are amortized daily over the expected life of the security.
Class allocations — Income, fees and expenses (other than class-specific fees and expenses), realized gains and losses and unrealized appreciation and depreciation are allocated daily among the various share classes based on their relative net assets. Class-specific fees and expenses, such as distribution, transfer agent and administrative services, are charged directly to the respective share class.
Distributions paid to shareholders — Income dividends and capital gain distributions are recorded on the ex-dividend date.
| 10 | International Growth and Income Fund |
Currency translation — Assets and liabilities, including investment securities, denominated in currencies other than U.S. dollars are translated into U.S. dollars at the exchange rates supplied by one or more pricing vendors on the valuation date. Purchases and sales of investment securities and income and expenses are translated into U.S. dollars at the exchange rates on the dates of such transactions. The effects of changes in exchange rates on investment securities are included with the net realized gain or loss and net unrealized appreciation or depreciation on investments in the fund’s statement of operations. The realized gain or loss and unrealized appreciation or depreciation resulting from all other transactions denominated in currencies other than U.S. dollars are disclosed separately.
In-kind redemptions — The fund normally redeems shares in cash; however, under certain conditions and circumstances, payment of the redemption price wholly or partly with portfolio securities or other fund assets may be permitted. A redemption of shares in-kind is based upon the closing value of the shares being redeemed as of the trade date. Realized gains/losses resulting from redemptions of shares in-kind are reflected separately in the fund’s statement of operations.
3. Valuation
Capital Research and Management Company (“CRMC”), the fund’s investment adviser, values the fund’s investments at fair value as defined by U.S. GAAP. The net asset value of each share class of the fund is generally determined as of approximately 4:00 p.m. New York time each day the New York Stock Exchange is open.
Methods and inputs — The fund’s investment adviser uses the following methods and inputs to establish the fair value of the fund’s assets and liabilities. Use of particular methods and inputs may vary over time based on availability and relevance as market and economic conditions evolve.
Equity securities are generally valued at the official closing price of, or the last reported sale price on, the exchange or market on which such securities are traded, as of the close of business on the day the securities are being valued or, lacking any sales, at the last available bid price. Prices for each security are taken from the principal exchange or market on which the security trades.
Fixed-income securities, including short-term securities, are generally valued at prices obtained from one or more pricing vendors. Vendors value such securities based on one or more of the inputs described in the following table. The table provides examples of inputs that are commonly relevant for valuing particular classes of fixed-income securities in which the fund is authorized to invest. However, these classifications are not exclusive, and any of the inputs may be used to value any other class of fixed-income security.
| Fixed-income class | Examples of standard inputs | |
| All | Benchmark yields, transactions, bids, offers, quotations from dealers and trading systems, new issues, spreads and other relationships observed in the markets among comparable securities; and proprietary pricing models such as yield measures calculated using factors such as cash flows, financial or collateral performance and other reference data (collectively referred to as “standard inputs”) | |
| Corporate bonds & notes; convertible securities | Standard inputs and underlying equity of the issuer | |
| Bonds & notes of governments & government agencies | Standard inputs and interest rate volatilities | |
| Mortgage-backed; asset-backed obligations | Standard inputs and cash flows, prepayment information, default rates, delinquency and loss assumptions, collateral characteristics, credit enhancements and specific deal information |
When the fund’s investment adviser deems it appropriate to do so (such as when vendor prices are unavailable or deemed to be not representative), fixed-income securities will be valued in good faith at the mean quoted bid and ask prices that are reasonably and timely available (or bid prices, if ask prices are not available) or at prices for securities of comparable maturity, quality and type.
Securities with both fixed-income and equity characteristics, or equity securities traded principally among fixed-income dealers, are generally valued in the manner described for either equity or fixed-income securities, depending on which method is deemed most appropriate by the fund’s investment adviser. The Capital Group Central Cash Fund (“CCF”), a fund within the Capital Group Central Fund Series (“Central Funds”), is valued based upon a floating net asset value, which fluctuates with changes in the value of CCF’s portfolio securities. The underlying securities are valued based on the policies and procedures in CCF’s statement of additional information.
| International Growth and Income Fund | 11 |
Securities and other assets for which representative market quotations are not readily available or are considered unreliable by the fund’s investment adviser are fair valued as determined in good faith under fair valuation guidelines adopted by authority of the fund’s board of trustees as further described. The investment adviser follows fair valuation guidelines, consistent with U.S. Securities and Exchange Commission rules and guidance, to consider relevant principles and factors when making fair value determinations. The investment adviser considers relevant indications of value that are reasonably and timely available to it in determining the fair value to be assigned to a particular security, such as the type and cost of the security; contractual or legal restrictions on resale of the security; relevant financial or business developments of the issuer; actively traded similar or related securities; conversion or exchange rights on the security; related corporate actions; significant events occurring after the close of trading in the security; and changes in overall market conditions. In addition, the closing prices of equity securities that trade in markets outside U.S. time zones may be adjusted to reflect significant events that occur after the close of local trading but before the net asset value of each share class of the fund is determined. Fair valuations and valuations of investments that are not actively trading involve judgment and may differ materially from valuations that would have been used had greater market activity occurred.
Processes and structure — The fund’s board of trustees has delegated authority to the fund’s investment adviser to make fair value determinations, subject to board oversight. The investment adviser has established a Joint Fair Valuation Committee (the “Fair Valuation Committee”) to administer, implement and oversee the fair valuation process, and to make fair value decisions. The Fair Valuation Committee regularly reviews its own fair value decisions, as well as decisions made under its standing instructions to the investment adviser’s valuation teams. The Fair Valuation Committee reviews changes in fair value measurements from period to period and may, as deemed appropriate, update the fair valuation guidelines to better reflect the results of back testing and address new or evolving issues. The Fair Valuation Committee reports any changes to the fair valuation guidelines to the board of trustees. The fund’s board and audit committee also regularly review reports that describe fair value determinations and methods.
The fund’s investment adviser has also established a Fixed-Income Pricing Review Group to administer and oversee the fixed-income valuation process, including the use of fixed-income pricing vendors. This group regularly reviews pricing vendor information and market data. Pricing decisions, processes and controls over security valuation are also subject to additional internal reviews, including an annual control self-evaluation program facilitated by the investment adviser’s compliance group.
Classifications — The fund’s investment adviser classifies the fund’s assets and liabilities into three levels based on the inputs used to value the assets or liabilities. Level 1 values are based on quoted prices in active markets for identical securities. Level 2 values are based on significant observable market inputs, such as quoted prices for similar securities and quoted prices in inactive markets. Certain securities trading outside the U.S. may transfer between Level 1 and Level 2 due to valuation adjustments resulting from significant market movements following the close of local trading. Level 3 values are based on significant unobservable inputs that reflect the investment adviser’s determination of assumptions that market participants might reasonably use in valuing the securities. The valuation levels are not necessarily an indication of the risk or liquidity associated with the underlying investment. For example, U.S. government securities are reflected as Level 2 because the inputs used to determine fair value may not always be quoted prices in an active market. The following table presents the fund’s valuation levels as of June 30, 2020 (dollars in thousands):
| Investment securities | ||||||||||||||||
| Level 1 | Level 2 | Level 3 | Total | |||||||||||||
| Assets: | ||||||||||||||||
| Common stocks: | ||||||||||||||||
| Financials | $ | 405,628 | $ | 2,344,924 | $ | — | $ | 2,750,552 | ||||||||
| Information technology | 171,732 | 1,752,014 | — | 1,923,746 | ||||||||||||
| Consumer staples | 179,466 | 1,505,238 | — | 1,684,704 | ||||||||||||
| Consumer discretionary | 39,714 | 1,619,785 | — | 1,659,499 | ||||||||||||
| Health care | 77,120 | 1,411,744 | — | 1,488,864 | ||||||||||||
| Industrials | 126,218 | 1,081,662 | — | 1,207,880 | ||||||||||||
| Utilities | 72,041 | 922,940 | — | 994,981 | ||||||||||||
| Communication services | 142,042 | 820,414 | — | 962,456 | ||||||||||||
| Energy | 266,104 | 548,401 | — | 814,505 | ||||||||||||
| Materials | 409,577 | 388,727 | — | 798,304 | ||||||||||||
| Real estate | 28,086 | 416,033 | — | 444,119 | ||||||||||||
| Preferred securities | 72,452 | 355,917 | — | 428,369 | ||||||||||||
| Short-term securities | 655,144 | — | — | 655,144 | ||||||||||||
| Total | $ | 2,645,324 | $ | 13,167,799 | $ | — | $ | 15,813,123 | ||||||||
| 12 | International Growth and Income Fund |
4. Risk factors
Investing in the fund may involve certain risks including, but not limited to, those described below.
Market conditions — The prices of, and the income generated by, the common stocks and other securities held by the fund may decline — sometimes rapidly or unpredictably — due to various factors, including events or conditions affecting the general economy or particular industries; overall market changes; local, regional or global political, social or economic instability; governmental, governmental agency or central bank responses to economic conditions; and currency exchange rate, interest rate and commodity price fluctuations.
Economies and financial markets throughout the world are highly interconnected. Economic, financial or political events, trading and tariff arrangements, wars, terrorism, cybersecurity events, natural disasters, public health emergencies (such as the spread of infectious disease) and other circumstances in one country or region could have impacts on global economies or markets. As a result, whether or not the fund invests in securities of issuers located in or with significant exposure to the countries affected, the value and liquidity of the fund’s investments may be negatively affected by developments in other countries and regions.
Issuer risks — The prices of, and the income generated by, securities held by the fund may decline in response to various factors directly related to the issuers of such securities, including reduced demand for an issuer’s goods or services, poor management performance, major litigation related to the issuer, changes in government regulations affecting the issuer or its competitive environment and strategic initiatives such as mergers, acquisitions or dispositions and the market response to any such initiatives.
Investing outside the U.S. — Securities of issuers domiciled outside the U.S., or with significant operations or revenues outside the U.S., may lose value because of adverse political, social, economic or market developments (including social instability, regional conflicts, terrorism and war) in the countries or regions in which the issuers operate or generate revenue. These securities may also lose value due to changes in foreign currency exchange rates against the U.S. dollar and/or currencies of other countries. Issuers of these securities may be more susceptible to actions of foreign governments, such as nationalization, currency blockage or the imposition of price controls or punitive taxes, each of which could adversely impact the value of these securities. Securities markets in certain countries may be more volatile and/or less liquid than those in the U.S. Investments outside the U.S. may also be subject to different accounting practices and different regulatory, legal and reporting standards and practices, and may be more difficult to value, than those in the U.S. In addition, the value of investments outside the U.S. may be reduced by foreign taxes, including foreign withholding taxes on interest and dividends. Further, there may be increased risks of delayed settlement of securities purchased or sold by the fund. The risks of investing outside the U.S. may be heightened in connection with investments in emerging markets.
Investing in emerging markets — Investing in emerging markets may involve risks in addition to and greater than those generally associated with investing in the securities markets of developed countries. For instance, emerging market countries may have less developed legal and accounting systems than those in developed countries. The governments of these countries may be less stable and more likely to impose capital controls, nationalize a company or industry, place restrictions on foreign ownership and on withdrawing sale proceeds of securities from the country, and/or impose punitive taxes that could adversely affect the prices of securities. In addition, the economies of these countries may be dependent on relatively few industries that are more susceptible to local and global changes. Securities markets in these countries can also be relatively small and have substantially lower trading volumes. As a result, securities issued in these countries may be more volatile and less liquid, and may be more difficult to value, than securities issued in countries with more developed economies and/or markets. Less certainty with respect to security valuations may lead to additional challenges and risks in calculating the fund’s net asset value. Additionally, emerging markets are more likely to experience problems with the clearing and settling of trades and the holding of securities by banks, agents and depositories that are less established than those in developed countries.
Investing in growth-oriented stocks — Growth-oriented common stocks and other equity-type securities (such as preferred stocks, convertible preferred stocks and convertible bonds) may involve larger price swings and greater potential for loss than other types of investments. These risks may be even greater in the case of smaller capitalization stocks.
Investing in income-oriented stocks — The value of the fund’s securities and income provided by the fund may be reduced by changes in the dividend policies of, and the capital resources available for dividend payments at, the companies in which the fund invests.
| International Growth and Income Fund | 13 |
Management — The investment adviser to the fund actively manages the fund’s investments. Consequently, the fund is subject to the risk that the methods and analyses, including models, tools and data, employed by the investment adviser in this process may be flawed or incorrect and may not produce the desired results. This could cause the fund to lose value or its investment results to lag relevant benchmarks or other funds with similar objectives. Your investment in the fund is not a bank deposit and is not insured or guaranteed by the Federal Deposit Insurance Corporation or any other governmental agency, entity or person. You should consider how this fund fits into your overall investment program.
5. Taxation and distributions
Federal income taxation — The fund complies with the requirements under Subchapter M of the Internal Revenue Code applicable to mutual funds and intends to distribute substantially all of its net taxable income and net capital gains each year. The fund is not subject to income taxes to the extent such distributions are made. Therefore, no federal income tax provision is required.
As of and during the year ended June 30, 2020, the fund did not have a liability for any unrecognized tax benefits. The fund recognizes interest and penalties, if any, related to unrecognized tax benefits as income tax expense in the statement of operations. During the period, the fund did not incur any significant interest or penalties.
The fund’s tax returns are not subject to examination by federal, state and, if applicable, non-U.S. tax authorities after the expiration of each jurisdiction’s statute of limitations, which is generally three years after the date of filing but can be extended in certain jurisdictions.
Non-U.S. taxation — Dividend and interest income are recorded net of non-U.S. taxes paid. The fund may file withholding tax reclaims in certain jurisdictions to recover a portion of amounts previously withheld. As a result of rulings from European courts, the fund filed for additional reclaims related to prior years. These reclaims are recorded when the amount is known and there are no significant uncertainties on collectability. Gains realized by the fund on the sale of securities in certain countries, if any, may be subject to non-U.S. taxes. If applicable, the fund records an estimated deferred tax liability based on unrealized gains to provide for potential non-U.S. taxes payable upon the sale of these securities.
Distributions — Distributions paid to shareholders are based on net investment income and net realized gains determined on a tax basis, which may differ from net investment income and net realized gains for financial reporting purposes. These differences are due primarily to different treatment for items such as currency gains and losses; short-term capital gains and losses; capital losses related to sales of certain securities within 30 days of purchase; unrealized appreciation of certain investments in securities outside the U.S.; deferred expenses; cost of investments sold; net capital losses and income on certain investments. The fiscal year in which amounts are distributed may differ from the year in which the net investment income and net realized gains are recorded by the fund for financial reporting purposes.
During the year ended June 30, 2020, the fund reclassified $2,235,000 from total distributable earnings to capital paid in on shares of beneficial interest to align financial reporting with tax reporting.
As of June 30, 2020, the tax basis components of distributable earnings, unrealized appreciation (depreciation) and cost of investments were as follows (dollars in thousands):
| Undistributed ordinary income | $ | 24,096 | ||
| Capital loss carryforward* | (1,361,183 | ) | ||
| Gross unrealized appreciation on investments | 3,034,602 | |||
| Gross unrealized depreciation on investments | (1,551,294 | ) | ||
| Net unrealized appreciation on investments | 1,483,308 | |||
| Cost of investments | 14,329,815 |
| * | The capital loss carryforward will be used to offset any capital gains realized by the fund in future years. The fund will not make distributions from capital gains while a capital loss carryforward remains. |
| 14 | International Growth and Income Fund |
Tax-basis distributions paid to shareholders from ordinary income were as follows (dollars in thousands):
| Year ended June 30 | ||||||||
| Share class | 2020 | 2019 | ||||||
| Class A | $ | 85,271 | $ | 110,623 | ||||
| Class C | 2,022 | 3,407 | ||||||
| Class T | — | † | — | † | ||||
| Class F-1 | 3,880 | 4,852 | ||||||
| Class F-2 | 59,452 | 71,597 | ||||||
| Class F-3 | 63,879 | 68,104 | ||||||
| Class 529-A | 2,676 | 3,338 | ||||||
| Class 529-C | 252 | 415 | ||||||
| Class 529-E | 82 | 108 | ||||||
| Class 529-T | — | † | — | † | ||||
| Class 529-F-1 | 462 | 508 | ||||||
| Class R-1 | 34 | 51 | ||||||
| Class R-2 | 605 | 868 | ||||||
| Class R-2E | 276 | 76 | ||||||
| Class R-3 | 1,132 | 1,328 | ||||||
| Class R-4 | 1,261 | 1,591 | ||||||
| Class R-5E | 239 | 110 | ||||||
| Class R-5 | 635 | 688 | ||||||
| Class R-6 | 105,625 | 104,594 | ||||||
| Total | $ | 327,783 | $ | 372,258 | ||||
| † | Amount less than one thousand. |
6. Fees and transactions with related parties
CRMC, the fund’s investment adviser, is the parent company of American Funds Distributors®, Inc. (“AFD”), the principal underwriter of the fund’s shares, and American Funds Service Company® (“AFS”), the fund’s transfer agent. CRMC, AFD and AFS are considered related parties to the fund.
Investment advisory services — The fund has an investment advisory and service agreement with CRMC that provides for monthly fees accrued daily. These fees are based on a series of decreasing annual rates beginning with 0.690% on the first $500 million of daily net assets and decreasing to 0.440% on such assets in excess of $17 billion. For the year ended June 30, 2020, the investment advisory services fee was $72,983,000, which was equivalent to an annualized rate of 0.477% of average daily net assets.
Class-specific fees and expenses — Expenses that are specific to individual share classes are accrued directly to the respective share class. The principal class-specific fees and expenses are further described below:
Distribution services — The fund has plans of distribution for all share classes, except Class F-2, F-3, R-5E, R-5 and R-6 shares. Under the plans, the board of trustees approves certain categories of expenses that are used to finance activities primarily intended to sell fund shares and service existing accounts. The plans provide for payments, based on an annualized percentage of average daily net assets, ranging from 0.30% to 1.00% as noted in this section. In some cases, the board of trustees has limited the amounts that may be paid to less than the maximum allowed by the plans. All share classes with a plan may use up to 0.25% of average daily net assets to pay service fees, or to compensate AFD for paying service fees, to firms that have entered into agreements with AFD to provide certain shareholder services. The remaining amounts available to be paid under each plan are paid to dealers to compensate them for their sales activities.
| Share class | Currently approved limits | Plan limits | |||||||
| Class A | 0.30 | % | 0.30 | % | |||||
| Class 529-A | 0.30 | 0.50 | |||||||
| Classes C, 529-C and R-1 | 1.00 | 1.00 | |||||||
| Class R-2 | 0.75 | 1.00 | |||||||
| Class R-2E | 0.60 | 0.85 | |||||||
| Classes 529-E and R-3 | 0.50 | 0.75 | |||||||
| Classes T, F-1, 529-T, 529-F-1 and R-4 | 0.25 | 0.50 | |||||||
| International Growth and Income Fund | 15 |
For Class A and 529-A shares, distribution-related expenses include the reimbursement of dealer and wholesaler commissions paid by AFD for certain shares sold without a sales charge. These share classes reimburse AFD for amounts billed within the prior 15 months but only to the extent that the overall annual expense limits are not exceeded. As of June 30, 2020, there were no unreimbursed expenses subject to reimbursement for Class A or 529-A shares.
Transfer agent services — The fund has a shareholder services agreement with AFS under which the fund compensates AFS for providing transfer agent services to each of the fund’s share classes. These services include recordkeeping, shareholder communications and transaction processing. In addition, the fund reimburses AFS for amounts paid to third parties for performing transfer agent services on behalf of fund shareholders.
Administrative services — The fund has an administrative services agreement with CRMC under which the fund compensates CRMC for providing administrative services to all share classes. Administrative services are provided by CRMC and its affiliates to help assist third parties providing non-distribution services to fund shareholders. These services include providing in-depth information on the fund and market developments that impact fund investments. Administrative services also include, but are not limited to, coordinating, monitoring and overseeing third parties that provide services to fund shareholders. The agreement provides the fund the ability to charge an administrative services fee at the annual rate of 0.05% of the daily net assets attributable to each share class of the fund. Currently the fund pays CRMC an administrative services fee at the annual rate of 0.03% of daily net assets attributable to each share class of the fund for CRMC’s provision of administrative services.
529 plan services — Each 529 share class is subject to service fees to compensate the Virginia College Savings Plan (“Virginia529”) for its oversight and administration of the CollegeAmerica 529 college savings plan. The fee is based on the combined net assets invested in Class 529 and ABLE shares of the American Funds. Class ABLE shares are offered on other American Funds by Virginia529 through ABLEAmerica®, a tax-advantaged savings program for individuals with disabilities. Prior to January 1, 2020, the quarterly fee was based on a series of decreasing annual rates beginning with 0.10% on the first $20 billion of the combined net assets invested in the American Funds and decreasing to 0.03% on such assets in excess of $100 billion. Effective January 1, 2020, the quarterly fee was amended to a series of decreasing annual rates beginning with 0.09% on the first $20 billion of the combined net assets invested in the American Funds and decreasing to 0.03% on such assets in excess of $100 billion. The fee for any given calendar quarter is accrued and calculated on the basis of the average net assets of Class 529 and ABLE shares of the American Funds for the last month of the prior calendar quarter. The fee is included in other expenses in the fund’s statement of operations. Virginia529 is not considered a related party to the fund.
For the year ended June 30, 2020, class-specific expenses under the agreements were as follows (dollars in thousands):
| Share class | Distribution services | Transfer agent services | Administrative services | 529 plan services | |||||||||||||
| Class A | $11,333 | $5,612 | $1,341 | Not applicable | |||||||||||||
| Class C | 1,757 | 224 | 53 | Not applicable | |||||||||||||
| Class T | — | — | * | — | * | Not applicable | |||||||||||
| Class F-1 | 503 | 272 | 61 | Not applicable | |||||||||||||
| Class F-2 | Not applicable | 3,311 | 824 | Not applicable | |||||||||||||
| Class F-3 | Not applicable | 245 | 804 | Not applicable | |||||||||||||
| Class 529-A | 324 | 164 | 43 | $90 | |||||||||||||
| Class 529-C | 219 | 27 | 7 | 15 | |||||||||||||
| Class 529-E | 24 | 2 | 1 | 3 | |||||||||||||
| Class 529-T | — | — | * | — | * | — | * | ||||||||||
| Class 529-F-1 | — | 25 | 6 | 14 | |||||||||||||
| Class R-1 | 27 | 4 | 1 | Not applicable | |||||||||||||
| Class R-2 | 382 | 187 | 15 | Not applicable | |||||||||||||
| Class R-2E | 99 | 30 | 5 | Not applicable | |||||||||||||
| Class R-3 | 347 | 113 | 21 | Not applicable | |||||||||||||
| Class R-4 | 163 | 71 | 20 | Not applicable | |||||||||||||
| Class R-5E | Not applicable | 17 | 3 | Not applicable | |||||||||||||
| Class R-5 | Not applicable | 13 | 8 | Not applicable | |||||||||||||
| Class R-6 | Not applicable | 18 | 1,376 | Not applicable | |||||||||||||
| Total class-specific expenses | $15,178 | $10,335 | $4,589 | $122 | |||||||||||||
| * | Amount less than one thousand. |
Trustees’ deferred compensation — Trustees who are unaffiliated with CRMC may elect to defer the cash payment of part or all of their compensation. These deferred amounts, which remain as liabilities of the fund, are treated as if invested in shares of the fund or other American Funds. These amounts represent general, unsecured liabilities of the fund and vary according to the total returns of the
| 16 | International Growth and Income Fund |
selected funds. Trustees’ compensation of $410,000 in the fund’s statement of operations reflects $379,000 in current fees (either paid in cash or deferred) and a net increase of $31,000 in the value of the deferred amounts.
Affiliated officers and trustees — Officers and certain trustees of the fund are or may be considered to be affiliated with CRMC, AFD and AFS. No affiliated officers or trustees received any compensation directly from the fund.
Investment in CCF — The fund holds shares of CCF, an institutional prime money market fund managed by CRMC. CCF invests in high-quality, short-term money market instruments. CCF is used as the primary investment vehicle for the fund’s short-term investments. CCF shares are only available for purchase by CRMC, its affiliates, and other funds managed by CRMC or its affiliates, and are not available to the public. CRMC does not receive an investment advisory services fee from CCF.
Security transactions with related funds — The fund purchased securities from, and sold securities to, other funds managed by CRMC (or funds managed by certain affiliates of CRMC) under procedures adopted by the fund’s board of trustees. The funds involved in such transactions are considered related by virtue of having a common investment adviser (or affiliated investment advisers), common trustees and/or common officers. Each transaction was executed at the current market price of the security and no brokerage commissions or fees were paid in accordance with Rule 17a-7 of the 1940 Act. During the year ended June 30, 2020, the fund engaged in such purchase and sale transactions with related funds in the amounts of $356,111,000 and $129,417,000, respectively, which generated $26,187,000 of net realized losses from such sales.
Interfund lending — Pursuant to an exemptive order issued by the SEC, the fund, along with other CRMC-managed funds (or funds managed by certain affiliates of CRMC), may participate in an interfund lending program. The program provides an alternate credit facility that permits the funds to lend or borrow cash for temporary purposes directly to or from one another, subject to the conditions of the exemptive order. The fund did not lend or borrow cash through the interfund lending program at any time during the year ended June 30, 2020.
7. Capital share transactions
Capital share transactions in the fund were as follows (dollars and shares in thousands):
| Reinvestments of | Net (decrease) | |||||||||||||||||||||||||||||||
| Sales | distributions | Repurchases | increase | |||||||||||||||||||||||||||||
| Share class | Amount | Shares | Amount | Shares | Amount | Shares | Amount | Shares | ||||||||||||||||||||||||
| Year ended June 30, 2020 | ||||||||||||||||||||||||||||||||
| Class A | $ | 408,806 | 12,866 | $ | 83,607 | 2,697 | $ | (853,994 | ) | (27,840 | ) | $ | (361,581 | ) | (12,277 | ) | ||||||||||||||||
| Class C | 15,054 | 470 | 1,997 | 63 | (62,051 | ) | (1,945 | ) | (45,000 | ) | (1,412 | ) | ||||||||||||||||||||
| Class T | — | — | — | — | — | — | — | — | ||||||||||||||||||||||||
| Class F-1 | 82,477 | 2,587 | 3,774 | 122 | (76,457 | ) | (2,422 | ) | 9,794 | 287 | ||||||||||||||||||||||
| Class F-2 | 764,174 | 24,931 | 57,649 | 1,861 | (1,043,349 | ) | (33,610 | ) | (221,526 | ) | (6,818 | ) | ||||||||||||||||||||
| Class F-3 | 1,814,631 | 59,225 | 63,464 | 2,061 | (751,437 | ) | (24,424 | ) | 1,126,658 | 36,862 | ||||||||||||||||||||||
| Class 529-A | 18,472 | 564 | 2,674 | 86 | (25,482 | ) | (791 | ) | (4,336 | ) | (141 | ) | ||||||||||||||||||||
| Class 529-C | 3,048 | 95 | 252 | 8 | (7,289 | ) | (225 | ) | (3,989 | ) | (122 | ) | ||||||||||||||||||||
| Class 529-E | 578 | 18 | 82 | 3 | (998 | ) | (31 | ) | (338 | ) | (10 | ) | ||||||||||||||||||||
| Class 529-T | — | — | — | † | — | † | — | — | — | † | — | † | ||||||||||||||||||||
| Class 529-F-1 | 5,929 | 178 | 462 | 15 | (4,636 | ) | (142 | ) | 1,755 | 51 | ||||||||||||||||||||||
| Class R-1 | 603 | 19 | 33 | 1 | (912 | ) | (29 | ) | (276 | ) | (9 | ) | ||||||||||||||||||||
| Class R-2 | 12,852 | 401 | 605 | 19 | (15,879 | ) | (502 | ) | (2,422 | ) | (82 | ) | ||||||||||||||||||||
| Class R-2E | 37,189 | 1,091 | 276 | 10 | (2,793 | ) | (91 | ) | 34,672 | 1,010 | ||||||||||||||||||||||
| Class R-3 | 43,679 | 1,314 | 1,128 | 37 | (25,867 | ) | (812 | ) | 18,940 | 539 | ||||||||||||||||||||||
| Class R-4 | 19,201 | 601 | 1,260 | 41 | (19,006 | ) | (594 | ) | 1,455 | 48 | ||||||||||||||||||||||
| Class R-5E | 13,370 | 407 | 239 | 8 | (3,693 | ) | (127 | ) | 9,916 | 288 | ||||||||||||||||||||||
| Class R-5 | 22,317 | 653 | 519 | 17 | (10,447 | ) | (349 | ) | 12,389 | 321 | ||||||||||||||||||||||
| Class R-6 | 1,104,318 | 36,739 | 105,596 | 3,439 | (200,074 | ) | (6,067 | ) | 1,009,840 | 34,111 | ||||||||||||||||||||||
| Total net increase (decrease) | $ | 4,366,698 | 142,159 | $ | 323,617 | 10,488 | $ | (3,104,364 | ) | (100,001 | ) | $ | 1,585,951 | 52,646 | ||||||||||||||||||
See next page for footnotes.
| International Growth and Income Fund | 17 |
| Reinvestments of | Net (decrease) | |||||||||||||||||||||||||||||||
| Sales* | distributions | Repurchases* | increase | |||||||||||||||||||||||||||||
| Share class | Amount | Shares | Amount | Shares | Amount | Shares | Amount | Shares | ||||||||||||||||||||||||
| Year ended June 30, 2019 | ||||||||||||||||||||||||||||||||
| Class A | $ | 579,986 | 18,568 | $ | 108,562 | 3,343 | $ | (872,139 | ) | (27,666 | ) | $ | (183,591 | ) | (5,755 | ) | ||||||||||||||||
| Class C | 21,918 | 701 | 3,369 | 103 | (68,599 | ) | (2,173 | ) | (43,312 | ) | (1,369 | ) | ||||||||||||||||||||
| Class T | — | — | — | — | — | — | — | — | ||||||||||||||||||||||||
| Class F-1 | 56,701 | 1,780 | 4,775 | 147 | (103,493 | ) | (3,217 | ) | (42,017 | ) | (1,290 | ) | ||||||||||||||||||||
| Class F-2 | 863,819 | 27,527 | 69,585 | 2,147 | (778,266 | ) | (24,684 | ) | 155,138 | 4,990 | ||||||||||||||||||||||
| Class F-3 | 756,735 | 23,405 | 66,261 | 2,048 | (507,969 | ) | (16,023 | ) | 315,027 | 9,430 | ||||||||||||||||||||||
| Class 529-A | 18,884 | 594 | 3,337 | 103 | (26,550 | ) | (834 | ) | (4,329 | ) | (137 | ) | ||||||||||||||||||||
| Class 529-C | 3,742 | 118 | 414 | 13 | (7,619 | ) | (241 | ) | (3,463 | ) | (110 | ) | ||||||||||||||||||||
| Class 529-E | 931 | 30 | 108 | 3 | (1,143 | ) | (36 | ) | (104 | ) | (3 | ) | ||||||||||||||||||||
| Class 529-T | — | — | — | † | — | † | — | — | — | † | — | † | ||||||||||||||||||||
| Class 529-F-1 | 6,759 | 217 | 508 | 16 | (4,315 | ) | (137 | ) | 2,952 | 96 | ||||||||||||||||||||||
| Class R-1 | 502 | 16 | 51 | 1 | (960 | ) | (30 | ) | (407 | ) | (13 | ) | ||||||||||||||||||||
| Class R-2 | 13,005 | 411 | 868 | 27 | (16,634 | ) | (526 | ) | (2,761 | ) | (88 | ) | ||||||||||||||||||||
| Class R-2E | 2,032 | 67 | 76 | 2 | (906 | ) | (29 | ) | 1,202 | 40 | ||||||||||||||||||||||
| Class R-3 | 15,480 | 486 | 1,324 | 41 | (20,472 | ) | (642 | ) | (3,668 | ) | (115 | ) | ||||||||||||||||||||
| Class R-4 | 13,484 | 424 | 1,589 | 49 | (30,833 | ) | (981 | ) | (15,760 | ) | (508 | ) | ||||||||||||||||||||
| Class R-5E | 5,237 | 161 | 110 | 3 | (920 | ) | (29 | ) | 4,427 | 135 | ||||||||||||||||||||||
| Class R-5 | 3,579 | 111 | 687 | 21 | (14,206 | ) | (444 | ) | (9,940 | ) | (312 | ) | ||||||||||||||||||||
| Class R-6 | 923,714 | 29,046 | 104,547 | 3,230 | (130,051 | ) | (4,016 | ) | 898,210 | 28,260 | ||||||||||||||||||||||
| Total net increase (decrease) | $ | 3,286,508 | 103,662 | $ | 366,171 | 11,297 | $ | (2,585,075 | ) | (81,708 | ) | $ | 1,067,604 | 33,251 | ||||||||||||||||||
| * | Includes exchanges between share classes of the fund. |
| † | Amount less than one thousand. |
8. Investment transactions
The fund made purchases and sales of investment securities, excluding short-term securities and U.S. government obligations, if any, of $6,895,742,000 and $5,016,104,000, respectively, during the year ended June 30, 2020.
| 18 | International Growth and Income Fund |
Financial highlights
| (Loss) income from investment operations1 | ||||||||||||||||||||||||||||||||||||||||
| Period ended | Net asset value, beginning of period | Net investment income | Net (losses) gains on securities (both realized and unrealized) | Total from investment operations | Dividends (from net investment income) | Net asset value, end of period | Total return2 | Net assets, end of period (in millions) | Ratio of expenses to average net assets3 | Ratio of net income to average net assets | ||||||||||||||||||||||||||||||
| Class A: | ||||||||||||||||||||||||||||||||||||||||
| 6/30/2020 | $ | 33.23 | $ | .58 | $ | (2.43 | ) | $ | (1.85 | ) | $ | (.62 | ) | $ | 30.76 | (5.56 | )% | $ | 3,999 | .92 | % | 1.80 | % | |||||||||||||||||
| 6/30/2019 | 33.25 | .77 | (.02 | ) | .75 | (.77 | ) | 33.23 | 2.34 | 4,728 | .91 | 2.41 | ||||||||||||||||||||||||||||
| 6/30/2018 | 32.03 | .77 | 1.23 | 2.00 | (.78 | ) | 33.25 | 6.18 | 4,922 | .90 | 2.23 | |||||||||||||||||||||||||||||
| 6/30/2017 | 27.81 | .63 | 4.27 | 4.90 | (.68 | ) | 32.03 | 17.80 | 4,700 | .92 | 2.11 | |||||||||||||||||||||||||||||
| 6/30/2016 | 31.99 | .73 | (4.11 | ) | (3.38 | ) | (.80 | ) | 27.81 | (10.62 | ) | 4,432 | .91 | 2.52 | ||||||||||||||||||||||||||
| Class C: | ||||||||||||||||||||||||||||||||||||||||
| 6/30/2020 | 33.16 | .34 | (2.42 | ) | (2.08 | ) | (.37 | ) | 30.71 | (6.29 | ) | 146 | 1.66 | 1.06 | ||||||||||||||||||||||||||
| 6/30/2019 | 33.16 | .50 | .02 | .52 | (.52 | ) | 33.16 | 1.59 | 205 | 1.69 | 1.58 | |||||||||||||||||||||||||||||
| 6/30/2018 | 31.95 | .49 | 1.23 | 1.72 | (.51 | ) | 33.16 | 5.35 | 250 | 1.69 | 1.43 | |||||||||||||||||||||||||||||
| 6/30/2017 | 27.74 | .38 | 4.27 | 4.65 | (.44 | ) | 31.95 | 16.83 | 255 | 1.72 | 1.28 | |||||||||||||||||||||||||||||
| 6/30/2016 | 31.91 | .48 | (4.08 | ) | (3.60 | ) | (.57 | ) | 27.74 | (11.35 | ) | 263 | 1.72 | 1.68 | ||||||||||||||||||||||||||
| Class T: | ||||||||||||||||||||||||||||||||||||||||
| 6/30/2020 | 33.23 | .67 | (2.44 | ) | (1.77 | ) | (.71 | ) | 30.75 | (5.33 | )4 | — | 5 | .66 | 4 | 2.07 | 4 | |||||||||||||||||||||||
| 6/30/2019 | 33.24 | .85 | (.01 | ) | .84 | (.85 | ) | 33.23 | 2.61 | 4 | — | 5 | .67 | 4 | 2.66 | 4 | ||||||||||||||||||||||||
| 6/30/2018 | 32.03 | .84 | 1.22 | 2.06 | (.85 | ) | 33.24 | 6.40 | 4 | — | 5 | .69 | 4 | 2.44 | 4 | |||||||||||||||||||||||||
| 6/30/20176,7 | 30.40 | .29 | 1.65 | 1.94 | (.31 | ) | 32.03 | 6.37 | 4,8 | — | 5 | .16 | 4,8 | .93 | 4,8 | |||||||||||||||||||||||||
| Class F-1: | ||||||||||||||||||||||||||||||||||||||||
| 6/30/2020 | 33.27 | .59 | (2.44 | ) | (1.85 | ) | (.62 | ) | 30.80 | (5.55 | ) | 201 | .92 | 1.81 | ||||||||||||||||||||||||||
| 6/30/2019 | 33.29 | .76 | (.02 | ) | .74 | (.76 | ) | 33.27 | 2.29 | 207 | .95 | 2.36 | ||||||||||||||||||||||||||||
| 6/30/2018 | 32.06 | .74 | 1.25 | 1.99 | (.76 | ) | 33.29 | 6.16 | 250 | .94 | 2.15 | |||||||||||||||||||||||||||||
| 6/30/2017 | 27.80 | .57 | 4.32 | 4.89 | (.63 | ) | 32.06 | 17.73 | 362 | .97 | 1.93 | |||||||||||||||||||||||||||||
| 6/30/2016 | 31.98 | .61 | (4.00 | ) | (3.39 | ) | (.79 | ) | 27.80 | (10.68 | ) | 768 | .96 | 2.11 | ||||||||||||||||||||||||||
| Class F-2: | ||||||||||||||||||||||||||||||||||||||||
| 6/30/2020 | 33.25 | .67 | (2.44 | ) | (1.77 | ) | (.71 | ) | 30.77 | (5.33 | ) | 2,455 | .66 | 2.06 | ||||||||||||||||||||||||||
| 6/30/2019 | 33.26 | .85 | (.01 | ) | .84 | (.85 | ) | 33.25 | 2.61 | 2,879 | .68 | 2.67 | ||||||||||||||||||||||||||||
| 6/30/2018 | 32.05 | .85 | 1.22 | 2.07 | (.86 | ) | 33.26 | 6.41 | 2,715 | .68 | 2.46 | |||||||||||||||||||||||||||||
| 6/30/2017 | 27.82 | .65 | 4.32 | 4.97 | (.74 | ) | 32.05 | 18.04 | 2,444 | .70 | 2.22 | |||||||||||||||||||||||||||||
| 6/30/2016 | 32.00 | .87 | (4.19 | ) | (3.32 | ) | (.86 | ) | 27.82 | (10.43 | ) | 3,024 | .70 | 3.02 | ||||||||||||||||||||||||||
| Class F-3: | ||||||||||||||||||||||||||||||||||||||||
| 6/30/2020 | 33.22 | .71 | (2.45 | ) | (1.74 | ) | (.74 | ) | 30.74 | (5.22 | ) | 3,554 | .55 | 2.20 | ||||||||||||||||||||||||||
| 6/30/2019 | 33.23 | .88 | (.01 | ) | .87 | (.88 | ) | 33.22 | 2.71 | 2,617 | .58 | 2.77 | ||||||||||||||||||||||||||||
| 6/30/2018 | 32.02 | .89 | 1.21 | 2.10 | (.89 | ) | 33.23 | 6.53 | 2,304 | .58 | 2.59 | |||||||||||||||||||||||||||||
| 6/30/20176,9 | 29.42 | .64 | 2.41 | 3.05 | (.45 | ) | 32.02 | 10.40 | 8 | 1,825 | .25 | 8 | 1.99 | 8 | ||||||||||||||||||||||||||
| Class 529-A: | ||||||||||||||||||||||||||||||||||||||||
| 6/30/2020 | 33.19 | .58 | (2.44 | ) | (1.86 | ) | (.61 | ) | 30.72 | (5.59 | ) | 133 | .95 | 1.78 | ||||||||||||||||||||||||||
| 6/30/2019 | 33.20 | .75 | (.01 | ) | .74 | (.75 | ) | 33.19 | 2.30 | 148 | .97 | 2.36 | ||||||||||||||||||||||||||||
| 6/30/2018 | 31.99 | .76 | 1.21 | 1.97 | (.76 | ) | 33.20 | 6.10 | 153 | .95 | 2.20 | |||||||||||||||||||||||||||||
| 6/30/2017 | 27.78 | .61 | 4.26 | 4.87 | (.66 | ) | 31.99 | 17.71 | 136 | .99 | 2.07 | |||||||||||||||||||||||||||||
| 6/30/2016 | 31.96 | .70 | (4.10 | ) | (3.40 | ) | (.78 | ) | 27.78 | (10.71 | ) | 118 | 1.00 | 2.45 | ||||||||||||||||||||||||||
See end of table for footnotes.
| International Growth and Income Fund | 19 |
Financial highlights (continued)
| (Loss) income from investment operations1 | ||||||||||||||||||||||||||||||||||||||||
| Period ended | Net asset value, beginning of period | Net investment income | Net (losses) gains on securities (both realized and unrealized) | Total from investment operations | Dividends (from net investment income) | Net asset value, end of period | Total return2 | Net assets, end of period (in millions) | Ratio of expenses to average net assets3 | Ratio of net income to average net assets | ||||||||||||||||||||||||||||||
| Class 529-C: | ||||||||||||||||||||||||||||||||||||||||
| 6/30/2020 | $ | 33.03 | $ | .33 | $ | (2.41 | ) | $ | (2.08 | ) | $ | (.36 | ) | $ | 30.59 | (6.30 | )% | $ | 20 | 1.69 | % | 1.03 | % | |||||||||||||||||
| 6/30/2019 | 33.05 | .49 | — | 10 | .49 | (.51 | ) | 33.03 | 1.51 | 26 | 1.73 | 1.55 | ||||||||||||||||||||||||||||
| 6/30/2018 | 31.83 | .46 | 1.24 | 1.70 | (.48 | ) | 33.05 | 5.33 | 29 | 1.74 | 1.35 | |||||||||||||||||||||||||||||
| 6/30/2017 | 27.64 | .38 | 4.24 | 4.62 | (.43 | ) | 31.83 | 16.79 | 32 | 1.77 | 1.28 | |||||||||||||||||||||||||||||
| 6/30/2016 | 31.81 | .47 | (4.09 | ) | (3.62 | ) | (.55 | ) | 27.64 | (11.44 | ) | 29 | 1.79 | 1.64 | ||||||||||||||||||||||||||
| Class 529-E: | ||||||||||||||||||||||||||||||||||||||||
| 6/30/2020 | 33.19 | .51 | (2.42 | ) | (1.91 | ) | (.55 | ) | 30.73 | (5.76 | ) | 4 | 1.14 | 1.59 | ||||||||||||||||||||||||||
| 6/30/2019 | 33.21 | .69 | (.02 | ) | .67 | (.69 | ) | 33.19 | 2.07 | 5 | 1.17 | 2.17 | ||||||||||||||||||||||||||||
| 6/30/2018 | 31.99 | .68 | 1.23 | 1.91 | (.69 | ) | 33.21 | 5.93 | 5 | 1.17 | 1.98 | |||||||||||||||||||||||||||||
| 6/30/2017 | 27.78 | .56 | 4.25 | 4.81 | (.60 | ) | 31.99 | 17.45 | 5 | 1.19 | 1.88 | |||||||||||||||||||||||||||||
| 6/30/2016 | 31.96 | .62 | (4.09 | ) | (3.47 | ) | (.71 | ) | 27.78 | (10.92 | ) | 4 | 1.22 | 2.17 | ||||||||||||||||||||||||||
| Class 529-T: | ||||||||||||||||||||||||||||||||||||||||
| 6/30/2020 | 33.23 | .65 | (2.44 | ) | (1.79 | ) | (.69 | ) | 30.75 | (5.39 | )4 | — | 5 | .71 | 4 | 2.01 | 4 | |||||||||||||||||||||||
| 6/30/2019 | 33.24 | .83 | (.01 | ) | .82 | (.83 | ) | 33.23 | 2.54 | 4 | — | 5 | .74 | 4 | 2.59 | 4 | ||||||||||||||||||||||||
| 6/30/2018 | 32.03 | .83 | 1.22 | 2.05 | (.84 | ) | 33.24 | 6.36 | 4 | — | 5 | .73 | 4 | 2.40 | 4 | |||||||||||||||||||||||||
| 6/30/20176,7 | 30.40 | .29 | 1.64 | 1.93 | (.30 | ) | 32.03 | 6.36 | 4,8 | — | 5 | .17 | 4,8 | .92 | 4,8 | |||||||||||||||||||||||||
| Class 529-F-1: | ||||||||||||||||||||||||||||||||||||||||
| 6/30/2020 | 33.24 | .65 | (2.44 | ) | (1.79 | ) | (.69 | ) | 30.76 | (5.39 | ) | 22 | .72 | 2.02 | ||||||||||||||||||||||||||
| 6/30/2019 | 33.25 | .84 | (.02 | ) | .82 | (.83 | ) | 33.24 | 2.54 | 22 | .74 | 2.62 | ||||||||||||||||||||||||||||
| 6/30/2018 | 32.04 | .84 | 1.21 | 2.05 | (.84 | ) | 33.25 | 6.36 | 18 | .74 | 2.43 | |||||||||||||||||||||||||||||
| 6/30/2017 | 27.81 | .69 | 4.26 | 4.95 | (.72 | ) | 32.04 | 17.98 | 15 | .77 | 2.32 | |||||||||||||||||||||||||||||
| 6/30/2016 | 32.00 | .79 | (4.14 | ) | (3.35 | ) | (.84 | ) | 27.81 | (10.55 | ) | 11 | .79 | 2.73 | ||||||||||||||||||||||||||
| Class R-1: | ||||||||||||||||||||||||||||||||||||||||
| 6/30/2020 | 33.16 | .36 | (2.42 | ) | (2.06 | ) | (.39 | ) | 30.71 | (6.24 | )4 | 3 | 1.63 | 4 | 1.11 | 4 | ||||||||||||||||||||||||
| 6/30/2019 | 33.16 | .52 | .01 | .53 | (.53 | ) | 33.16 | 1.62 | 4 | 3 | 1.65 | 4 | 1.62 | 4 | ||||||||||||||||||||||||||
| 6/30/2018 | 31.95 | .49 | 1.24 | 1.73 | (.52 | ) | 33.16 | 5.38 | 4 | 4 | 1.65 | 4 | 1.42 | 4 | ||||||||||||||||||||||||||
| 6/30/2017 | 27.74 | .32 | 4.34 | 4.66 | (.45 | ) | 31.95 | 16.90 | 5 | 1.66 | 1.09 | |||||||||||||||||||||||||||||
| 6/30/2016 | 31.91 | .52 | (4.09 | ) | (3.57 | ) | (.60 | ) | 27.74 | (11.25 | )4 | 10 | 1.59 | 4 | 1.80 | 4 | ||||||||||||||||||||||||
| Class R-2: | ||||||||||||||||||||||||||||||||||||||||
| 6/30/2020 | 33.06 | .34 | (2.41 | ) | (2.07 | ) | (.38 | ) | 30.61 | (6.27 | ) | 47 | 1.66 | 1.07 | ||||||||||||||||||||||||||
| 6/30/2019 | 33.07 | .52 | — | 10 | .52 | (.53 | ) | 33.06 | 1.60 | 54 | 1.67 | 1.64 | ||||||||||||||||||||||||||||
| 6/30/2018 | 31.87 | .50 | 1.22 | 1.72 | (.52 | ) | 33.07 | 5.38 | 57 | 1.66 | 1.46 | |||||||||||||||||||||||||||||
| 6/30/2017 | 27.68 | .40 | 4.25 | 4.65 | (.46 | ) | 31.87 | 16.89 | 54 | 1.68 | 1.37 | |||||||||||||||||||||||||||||
| 6/30/2016 | 31.85 | .48 | (4.10 | ) | (3.62 | ) | (.55 | ) | 27.68 | (11.42 | ) | 47 | 1.79 | 1.66 | ||||||||||||||||||||||||||
| Class R-2E: | ||||||||||||||||||||||||||||||||||||||||
| 6/30/2020 | 33.09 | .51 | (2.48 | ) | (1.97 | ) | (.52 | ) | 30.60 | (5.95 | ) | 35 | 1.32 | 1.72 | ||||||||||||||||||||||||||
| 6/30/2019 | 33.12 | .67 | (.07 | ) | .60 | (.63 | ) | 33.09 | 1.85 | 5 | 1.39 | 2.09 | ||||||||||||||||||||||||||||
| 6/30/2018 | 31.92 | .61 | 1.22 | 1.83 | (.63 | ) | 33.12 | 5.69 | 3 | 1.38 | 1.79 | |||||||||||||||||||||||||||||
| 6/30/2017 | 27.74 | .59 | 4.16 | 4.75 | (.57 | ) | 31.92 | 17.24 | 2 | 1.40 | 1.98 | |||||||||||||||||||||||||||||
| 6/30/2016 | 31.96 | .87 | (4.35 | ) | (3.48 | ) | (.74 | ) | 27.74 | (10.97 | ) | — | 5 | 1.38 | 3.19 | |||||||||||||||||||||||||
| 20 | International Growth and Income Fund |
| (Loss) income from investment operations1 | ||||||||||||||||||||||||||||||||||||||||
| Period ended | Net asset value, beginning of period | Net investment income | Net (losses) gains on securities (both realized and unrealized) | Total from investment operations | Dividends (from net investment income) | Net asset value, end of period | Total return2 | Net assets, end of period (in millions) | Ratio of expenses to average net assets3 | Ratio of net income to average net assets | ||||||||||||||||||||||||||||||
| Class R-3: | ||||||||||||||||||||||||||||||||||||||||
| 6/30/2020 | $ | 33.17 | $ | .50 | $ | (2.44 | ) | $ | (1.94 | ) | $ | (.53 | ) | $ | 30.70 | (5.84 | )% | $ | 78 | 1.20 | % | 1.57 | % | |||||||||||||||||
| 6/30/2019 | 33.18 | .67 | (.01 | ) | .66 | (.67 | ) | 33.17 | 2.04 | 66 | 1.23 | 2.09 | ||||||||||||||||||||||||||||
| 6/30/2018 | 31.97 | .65 | 1.23 | 1.88 | (.67 | ) | 33.18 | 5.85 | 70 | 1.22 | 1.89 | |||||||||||||||||||||||||||||
| 6/30/2017 | 27.76 | .53 | 4.27 | 4.80 | (.59 | ) | 31.97 | 17.40 | 66 | 1.25 | 1.80 | |||||||||||||||||||||||||||||
| 6/30/2016 | 31.94 | .64 | (4.12 | ) | (3.48 | ) | (.70 | ) | 27.76 | (10.95 | ) | 60 | 1.25 | 2.22 | ||||||||||||||||||||||||||
| Class R-4: | ||||||||||||||||||||||||||||||||||||||||
| 6/30/2020 | 33.21 | .59 | (2.43 | ) | (1.84 | ) | (.63 | ) | 30.74 | (5.54 | ) | 63 | .90 | 1.84 | ||||||||||||||||||||||||||
| 6/30/2019 | 33.22 | .75 | — | 10 | .75 | (.76 | ) | 33.21 | 2.33 | 67 | .92 | 2.33 | ||||||||||||||||||||||||||||
| 6/30/2018 | 32.01 | .75 | 1.23 | 1.98 | (.77 | ) | 33.22 | 6.16 | 84 | .92 | 2.18 | |||||||||||||||||||||||||||||
| 6/30/2017 | 27.79 | .63 | 4.27 | 4.90 | (.68 | ) | 32.01 | 17.77 | 87 | .94 | 2.13 | |||||||||||||||||||||||||||||
| 6/30/2016 | 31.98 | .73 | (4.12 | ) | (3.39 | ) | (.80 | ) | 27.79 | (10.67 | ) | 74 | .93 | 2.54 | ||||||||||||||||||||||||||
| Class R-5E: | ||||||||||||||||||||||||||||||||||||||||
| 6/30/2020 | 33.20 | .66 | (2.44 | ) | (1.78 | ) | (.70 | ) | 30.72 | (5.35 | ) | 14 | .69 | 2.07 | ||||||||||||||||||||||||||
| 6/30/2019 | 33.22 | .93 | (.11 | ) | .82 | (.84 | ) | 33.20 | 2.56 | 5 | .71 | 2.92 | ||||||||||||||||||||||||||||
| 6/30/2018 | 32.01 | 1.02 | 1.03 | 2.05 | (.84 | ) | 33.22 | 6.36 | 1 | .71 | 2.96 | |||||||||||||||||||||||||||||
| 6/30/2017 | 27.79 | .97 | 3.98 | 4.95 | (.73 | ) | 32.01 | 17.97 | — | 5 | .71 | 3.19 | ||||||||||||||||||||||||||||
| 6/30/20166,11 | 29.43 | .54 | (1.61 | ) | (1.07 | ) | (.57 | ) | 27.79 | (3.68 | )8 | — | 5 | .78 | 12 | 3.16 | 12 | |||||||||||||||||||||||
| Class R-5: | �� | |||||||||||||||||||||||||||||||||||||||
| 6/30/2020 | 33.41 | .71 | (2.47 | ) | (1.76 | ) | (.73 | ) | 30.92 | (5.25 | ) | 32 | .58 | 2.20 | ||||||||||||||||||||||||||
| 6/30/2019 | 33.42 | .84 | .01 | .85 | (.86 | ) | 33.41 | 2.64 | 24 | .62 | 2.60 | |||||||||||||||||||||||||||||
| 6/30/2018 | 32.20 | .88 | 1.22 | 2.10 | (.88 | ) | 33.42 | 6.48 | 34 | .62 | 2.52 | |||||||||||||||||||||||||||||
| 6/30/2017 | 27.95 | .73 | 4.29 | 5.02 | (.77 | ) | 32.20 | 18.13 | 33 | .63 | 2.46 | |||||||||||||||||||||||||||||
| 6/30/2016 | 32.15 | .82 | (4.14 | ) | (3.32 | ) | (.88 | ) | 27.95 | (10.39 | ) | 26 | .63 | 2.85 | ||||||||||||||||||||||||||
| Class R-6: | ||||||||||||||||||||||||||||||||||||||||
| 6/30/2020 | 33.23 | .71 | (2.44 | ) | (1.73 | ) | (.75 | ) | 30.75 | (5.21 | ) | 5,016 | .54 | 2.21 | ||||||||||||||||||||||||||
| 6/30/2019 | 33.24 | .91 | (.04 | ) | .87 | (.88 | ) | 33.23 | 2.71 | 4,288 | .57 | 2.84 | ||||||||||||||||||||||||||||
| 6/30/2018 | 32.03 | .90 | 1.21 | 2.11 | (.90 | ) | 33.24 | 6.54 | 3,350 | .57 | 2.62 | |||||||||||||||||||||||||||||
| 6/30/2017 | 27.81 | .76 | 4.24 | 5.00 | (.78 | ) | 32.03 | 18.17 | 2,519 | .58 | 2.56 | |||||||||||||||||||||||||||||
| 6/30/2016 | 31.99 | .85 | (4.13 | ) | (3.28 | ) | (.90 | ) | 27.81 | (10.33 | ) | 1,657 | .58 | 2.98 | ||||||||||||||||||||||||||
| Year ended June 30, | ||||||||||||||||||||
| 2020 | 2019 | 2018 | 2017 | 2016 | ||||||||||||||||
| Portfolio turnover rate for all share classes13 | 35 | % | 35 | % | 27 | % | 37 | % | 37 | % | ||||||||||
| 1 | Based on average shares outstanding. |
| 2 | Total returns exclude any applicable sales charges, including contingent deferred sales charges. |
| 3 | Ratios do not include expenses of any Central Funds. The fund indirectly bears its proportionate share of the expenses of any Central Funds. |
| 4 | All or a significant portion of assets in this class consisted of seed capital invested by CRMC and/or its affiliates. Fees for distribution services are not charged or accrued on these seed capital assets. If such fees were paid by the fund on seed capital assets, fund expenses would have been higher and net income and total return would have been lower. |
| 5 | Amount less than $1 million. |
| 6 | Based on operations for a period that is less than a full year. |
| 7 | Class T and 529-T shares began investment operations on April 7, 2017. |
| 8 | Not annualized. |
| 9 | Class F-3 shares began investment operations on January 27, 2017. |
| 10 | Amount less than $.01. |
| 11 | Class R-5E shares began investment operations on November 20, 2015. |
| 12 | Annualized. |
| 13 | Rates do not include the fund’s portfolio activity with respect to any Central Funds. |
See notes to financial statements.
| International Growth and Income Fund | 21 |
Report of Independent Registered Public Accounting Firm
To the Shareholders and Board of Trustees of International Growth and Income Fund:
Opinion on the Financial Statements and Financial Highlights
We have audited the accompanying statement of assets and liabilities of International Growth and Income Fund (the “Fund”), including the summary investment portfolio, as of June 30, 2020, the related statement of operations for the year then ended, the statements of changes in net assets for each of the two years in the period then ended, the financial highlights for each of the five years in the period then ended, and the related notes. In our opinion, the financial statements and financial highlights present fairly, in all material respects, the financial position of the Fund as of June 30, 2020, and the results of its operations for the year then ended, the changes in its net assets for each of the two years in the period then ended, and the financial highlights for each of the five years in the period then ended, in conformity with accounting principles generally accepted in the United States of America.
Basis for Opinion
These financial statements and financial highlights are the responsibility of the Fund’s management. Our responsibility is to express an opinion on the Fund’s financial statements and financial highlights based on our audits. We are a public accounting firm registered with the Public Company Accounting Oversight Board (United States) (PCAOB) and are required to be independent with respect to the Fund in accordance with the U.S. federal securities laws and the applicable rules and regulations of the Securities and Exchange Commission and the PCAOB.
We conducted our audits in accordance with the standards of the PCAOB. Those standards require that we plan and perform the audit to obtain reasonable assurance about whether the financial statements and financial highlights are free of material misstatement, whether due to error or fraud. The Fund is not required to have, nor were we engaged to perform, an audit of its internal control over financial reporting. As part of our audits we are required to obtain an understanding of internal control over financial reporting but not for the purpose of expressing an opinion on the effectiveness of the Fund’s internal control over financial reporting. Accordingly, we express no such opinion.
Our audits included performing procedures to assess the risks of material misstatement of the financial statements and financial highlights, whether due to error or fraud, and performing procedures that respond to those risks. Such procedures included examining, on a test basis, evidence regarding the amounts and disclosures in the financial statements and financial highlights. Our audits also included evaluating the accounting principles used and significant estimates made by management, as well as evaluating the overall presentation of the financial statements and financial highlights. Our procedures included confirmation of securities owned as of June 30, 2020, by correspondence with the custodian and brokers; when replies were not received from brokers, we performed other auditing procedures. We believe that our audits provide a reasonable basis for our opinion.
Deloitte & Touche LLP
Costa Mesa, California
August 12, 2020
We have served as the auditor of one or more American Funds investment companies since 1956.
| 22 | International Growth and Income Fund |
| Expense example | unaudited |
As a fund shareholder, you incur two types of costs: (1) transaction costs, such as initial sales charges on purchase payments and contingent deferred sales charges on redemptions (loads), and (2) ongoing costs, including management fees, distribution and service (12b-1) fees, and other expenses. This example is intended to help you understand your ongoing costs (in dollars) of investing in the fund so you can compare these costs with the ongoing costs of investing in other mutual funds. The example is based on an investment of $1,000 invested at the beginning of the period and held for the entire six-month period (January 1, 2020, through June 30, 2020).
Actual expenses:
The first line of each share class in the table on the following page provides information about actual account values and actual expenses. You may use the information in this line, together with the amount you invested, to estimate the expenses that you paid over the period. Simply divide your account value by $1,000 (for example, an $8,600 account value divided by $1,000 = 8.6), then multiply the result by the number in the first line under the heading titled “Expenses paid during period” to estimate the expenses you paid on your account during this period.
Hypothetical example for comparison purposes:
The second line of each share class in the table on the following page provides information about hypothetical account values and hypothetical expenses based on the actual expense ratio for the share class and an assumed rate of return of 5.00% per year before expenses, which is not the actual return of the share class. The hypothetical account values and expenses may not be used to estimate the actual ending account balance or expenses you paid for the period. You may use this information to compare the ongoing costs of investing in the fund and other funds. To do so, compare this 5.00% hypothetical example with the 5.00% hypothetical examples that appear in the shareholder reports of the other funds.
Notes:
Retirement plan participants may be subject to certain fees charged by the plan sponsor, and Class F-1, F-2, F-3 and 529-F-1 shareholders may be subject to fees charged by financial intermediaries, typically ranging from 0.75% to 1.50% of assets annually depending on services offered. You can estimate the impact of these fees by adding the amount of the fees to the total estimated expenses you paid on your account during the period as calculated above. In addition, your ending account value would be lower by the amount of these fees.
Note that the expenses shown in the table on the following page are meant to highlight your ongoing costs only and do not reflect any transactional costs, such as sales charges (loads). Therefore, the second line of each share class in the table is useful in comparing ongoing costs only and will not help you determine the relative total costs of owning different funds. In addition, if these transactional costs were included, your costs would have been higher.
| International Growth and Income Fund | 23 |
| Beginning account value 1/1/2020 | Ending account value 6/30/2020 | Expenses paid during period* | Annualized expense ratio | |||||||||||||
| Class A – actual return | $ | 1,000.00 | $ | 857.31 | $ | 4.25 | .92 | % | ||||||||
| Class A – assumed 5% return | 1,000.00 | 1,020.29 | 4.62 | .92 | ||||||||||||
| Class C – actual return | 1,000.00 | 854.23 | 7.61 | 1.65 | ||||||||||||
| Class C – assumed 5% return | 1,000.00 | 1,016.66 | 8.27 | 1.65 | ||||||||||||
| Class T – actual return | 1,000.00 | 858.60 | 3.00 | .65 | ||||||||||||
| Class T – assumed 5% return | 1,000.00 | 1,021.63 | 3.27 | .65 | ||||||||||||
| Class F-1 – actual return | 1,000.00 | 857.56 | 4.25 | .92 | ||||||||||||
| Class F-1 – assumed 5% return | 1,000.00 | 1,020.29 | 4.62 | .92 | ||||||||||||
| Class F-2 – actual return | 1,000.00 | 858.70 | 3.00 | .65 | ||||||||||||
| Class F-2 – assumed 5% return | 1,000.00 | 1,021.63 | 3.27 | .65 | ||||||||||||
| Class F-3 – actual return | 1,000.00 | 859.18 | 2.50 | .54 | ||||||||||||
| Class F-3 – assumed 5% return | 1,000.00 | 1,022.18 | 2.72 | .54 | ||||||||||||
| Class 529-A – actual return | 1,000.00 | 857.33 | 4.34 | .94 | ||||||||||||
| Class 529-A – assumed 5% return | 1,000.00 | 1,020.19 | 4.72 | .94 | ||||||||||||
| Class 529-C – actual return | 1,000.00 | 854.16 | 7.74 | 1.68 | ||||||||||||
| Class 529-C – assumed 5% return | 1,000.00 | 1,016.51 | 8.42 | 1.68 | ||||||||||||
| Class 529-E – actual return | 1,000.00 | 856.63 | 5.22 | 1.13 | ||||||||||||
| Class 529-E – assumed 5% return | 1,000.00 | 1,019.24 | 5.67 | 1.13 | ||||||||||||
| Class 529-T – actual return | 1,000.00 | 858.32 | 3.28 | .71 | ||||||||||||
| Class 529-T – assumed 5% return | 1,000.00 | 1,021.33 | 3.57 | .71 | ||||||||||||
| Class 529-F-1 – actual return | 1,000.00 | 858.36 | 3.28 | .71 | ||||||||||||
| Class 529-F-1 – assumed 5% return | 1,000.00 | 1,021.33 | 3.57 | .71 | ||||||||||||
| Class R-1 – actual return | 1,000.00 | 854.38 | 7.52 | 1.63 | ||||||||||||
| Class R-1 – assumed 5% return | 1,000.00 | 1,016.76 | 8.17 | 1.63 | ||||||||||||
| Class R-2 – actual return | 1,000.00 | 854.29 | 7.61 | 1.65 | ||||||||||||
| Class R-2 – assumed 5% return | 1,000.00 | 1,016.66 | 8.27 | 1.65 | ||||||||||||
| Class R-2E – actual return | 1,000.00 | 855.94 | 6.09 | 1.32 | ||||||||||||
| Class R-2E – assumed 5% return | 1,000.00 | 1,018.30 | 6.62 | 1.32 | ||||||||||||
| Class R-3 – actual return | 1,000.00 | 856.41 | 5.49 | 1.19 | ||||||||||||
| Class R-3 – assumed 5% return | 1,000.00 | 1,018.95 | 5.97 | 1.19 | ||||||||||||
| Class R-4 – actual return | 1,000.00 | 857.62 | 4.11 | .89 | ||||||||||||
| Class R-4 – assumed 5% return | 1,000.00 | 1,020.44 | 4.47 | .89 | ||||||||||||
| Class R-5E – actual return | 1,000.00 | 858.35 | 3.19 | .69 | ||||||||||||
| Class R-5E – assumed 5% return | 1,000.00 | 1,021.43 | 3.47 | .69 | ||||||||||||
| Class R-5 – actual return | 1,000.00 | 858.99 | 2.63 | .57 | ||||||||||||
| Class R-5 – assumed 5% return | 1,000.00 | 1,022.03 | 2.87 | .57 | ||||||||||||
| Class R-6 – actual return | 1,000.00 | 859.25 | 2.45 | .53 | ||||||||||||
| Class R-6 – assumed 5% return | 1,000.00 | 1,022.23 | 2.66 | .53 | ||||||||||||
| * | The “expenses paid during period” are equal to the “annualized expense ratio,” multiplied by the average account value over the period, multiplied by the number of days in the period, and divided by 366 (to reflect the one-half year period). |
| 24 | International Growth and Income Fund |
| Tax information | unaudited |
We are required to advise you of the federal tax status of certain distributions received by shareholders during the fiscal year. The fund hereby designates the following amounts for the fund’s fiscal year ended June 30, 2020:
| Foreign taxes | $0.07 per share |
| Foreign source income | $0.89 per share |
| Qualified dividend income | 100% |
| Corporate dividends received deduction | $16,967,000 |
| U.S. government income that may be exempt from state taxation | $4,198,000 |
Individual shareholders should refer to their Form 1099 or other tax information, which will be mailed in January 2021, to determine the calendar year amounts to be included on their 2020 tax returns. Shareholders should consult their tax advisors.
| International Growth and Income Fund | 25 |
Board of trustees and other officers
Independent trustees1
| Name and year of birth | Year first elected a trustee of the fund2 | Principal occupation(s) during past five years | Number of portfolios in fund complex overseen by trustee3 | Other directorships4 held by trustee | ||||
| William H. Baribault, 1945 | 2012 | Chairman of the Board and CEO, Oakwood Advisors (private investment and consulting); former CEO and President, Richard Nixon Foundation | 89 | General Finance Corporation | ||||
| Michael C. Camuñez, 1969 | 2019 | President and CEO, Monarch Global Strategies LLC, previously ManattJones Global Strategies (international consulting); former Assistant Secretary of Commerce, U.S. Department of Commerce | 4 | Edison International/Southern California Edison | ||||
| Vanessa C. L. Chang, 1952 | 2012 | Former Director, EL & EL Investments (real estate) | 16 | Edison International; Sykes Enterprises; Transocean Ltd. | ||||
| Linda Griego, 1947 | 2012 | Former President and CEO, Griego Enterprises, Inc. (business management company) | 7 | ViacomCBS Inc. | ||||
| Leonade D. Jones, 1947 | 2008 | Retired; former Treasurer, The Washington Post Company (retired 1996) | 10 | None | ||||
| William D. Jones, 1955 | 2008 | Real estate developer/owner, President and CEO, CityLink Investment Corporation (acquires, develops and manages real estate ventures in urban communities) and for the former City Scene Management Company (provided commercial asset management services) | 17 | Sempra Energy | ||||
| James J. Postl, 1946 Chairman of the Board (Independent and Non-Executive) | 2008 | Retired; former President and CEO, Pennzoil-Quaker State Company (automotive products and services) (retired 2002) | 4 | None | ||||
| Josette Sheeran, 1954 | 2019 | President and CEO, Asia Society; United Nations Special Envoy for Haiti | 7 | None | ||||
| Margaret Spellings, 1957 | 2012 | President and CEO, Texas2036; former President, Margaret Spellings & Company (public policy and and strategic consulting); former President, The University of North Carolina; former President, George W. Bush Foundation | 90 | None | ||||
| Isaac Stein, 1946 | 2008 | Private investor; former President, Waverley Associates (private investment fund); Chairman Emeritus of the Board of Trustees, Stanford University | 4 | None |
Interested trustees5,6
| Name, year of birth and position with fund | Year first elected a trustee or officer of the fund2 | Principal occupation(s) during past five years and positions held with affiliated entities or the principal underwriter of the fund | Number of portfolios in fund complex overseen by trustee3 | Other directorships4 held by trustee | ||||
| Hilda L. Applbaum, 1961 | 2019 | Partner — Capital World Investors, Capital Research and Management Company; Director, The Capital Group Companies, Inc.7 | 4 | None | ||||
| Gregory D. Johnson, 1963 | 2019 | Partner — Capital World Investors, Capital Research and Management Company; Partner — Capital World Investors, Capital Bank and Trust Company7; Director, Capital Research and Management Company | 4 | None |
The fund’s statement of additional information includes further details about fund trustees and is available without charge upon request by calling American Funds Service Company at (800) 421-4225 or by visiting the Capital Group website at capitalgroup.com. The address for all trustees and officers of the fund is 333 South Hope Street, Los Angeles, CA 90071, Attention: Secretary.
| 26 | International Growth and Income Fund |
Other officers6
| Name, year of birth and position with fund | Year first elected an officer of the fund2 | Principal occupation(s) during past five years and positions held with affiliated entities or the principal underwriter of the fund | ||
| Andrew B. Suzman, 1967 Co-President | 2008 | Partner — Capital World Investors, Capital Research and Management Company; Partner — Capital World Investors, Capital Bank and Trust Company7 | ||
| Steven T. Watson, 1955 Co-President | 2008 | Partner — Capital International Investors, Capital International, Inc.7; Director, Capital International, Inc.7 | ||
| Donald Rolfe, 1972 Executive Vice President | 2012 | Senior Vice President and Senior Counsel — Fund Business Management Group, Capital Research and Management Company; Secretary, Capital Research and Management Company | ||
| Michael Cohen, 1961 Senior Vice President | 2019 | Partner — Capital World Investors, Capital Bank and Trust Company7; Partner — Capital World Investors, Capital Research Company7; Chairman and Senior Vice President, Capital International Limited7; Director, Capital Research and Management Company | ||
| Patrice Collette, 1967 Senior Vice President | 2015 | Partner — Capital World Investors, Capital International, Inc.7 | ||
| Paul Flynn, 1966 Senior Vice President | 2020 | Partner — Capital World Investors, Capital International Sàrl7 | ||
| Leo Hee, 1971 Senior Vice President | 2019 | Partner — Capital World Investors, Capital International, Inc.7 | ||
| Jason B. Smith, 1972 Senior Vice President | 2015 | Partner — Capital World Investors, Capital Research and Management Company | ||
| Lisa Thompson, 1965 Senior Vice President | 2020 | Partner — Capital International Investors, Capital Research and Management Company; Partner — Capital International Investors, Capital Bank and Trust Company7; Director, Capital Research and Management Company | ||
| Michael W. Stockton, 1967 Secretary | 2014 | Senior Vice President — Fund Business Management Group, Capital Research and Management Company | ||
| Hong T. Le, 1978 Treasurer | 2016 | Vice President — Investment Operations, Capital Research and Management Company | ||
| Courtney R. Taylor, 1975 Assistant Secretary | 2018 | Assistant Vice President — Fund Business Management Group, Capital Research and Management Company | ||
| Sandra Chuon, 1972 Assistant Treasurer | 2019 | Assistant Vice President — Investment Operations, Capital Research and Management Company | ||
| Brian C. Janssen, 1972 Assistant Treasurer | 2016 | Vice President — Investment Operations, Capital Research and Management Company |
| 1 | The term independent trustee refers to a trustee who is not an “interested person” of the fund within the meaning of the Investment Company Act of 1940. |
| 2 | Trustees and officers of the fund serve until their resignation, removal or retirement. |
| 3 | Funds managed by Capital Research and Management Company or its affiliates. |
| 4 | This includes all directorships/trusteeships (other than those in the American Funds or other funds managed by Capital Research and Management Company or its affiliates) that are held by each trustee as a trustee or director of a public company or a registered investment company. |
| 5 | The term interested trustee refers to a trustee who is an “interested person” within the meaning of the Investment Company Act of 1940, on the basis of their affiliation with the fund’s investment adviser, Capital Research and Management Company, or affiliated entities (including the fund’s principal underwriter). |
| 6 | All of the trustees and/or officers listed, with the exception of Patrice Collette and Jason B. Smith, are officers and/or directors/trustees of one or more of the other funds for which Capital Research and Management Company serves as investment adviser. |
| 7 | Company affiliated with Capital Research and Management Company. |
| International Growth and Income Fund | 27 |
Office of the fund
6455 Irvine Center Drive
Irvine, CA 92618-4518
Investment adviser
Capital Research and Management Company
333 South Hope Street
Los Angeles, CA 90071-1406
Transfer agent for shareholder accounts
American Funds Service Company
(Write to the address near you.)
P.O. Box 6007
Indianapolis, IN 46206-6007
P.O. Box 2280
Norfolk, VA 23501-2280
Custodian of assets
JPMorgan Chase Bank
270 Park Avenue
New York, NY 10017-2070
Counsel
Morgan, Lewis & Bockius LLP
One Federal Street
Boston, MA 02110-1726
Independent registered public accounting firm
Deloitte & Touche LLP
695 Town Center Drive
Suite 1000
Costa Mesa, CA 92626-7188
Principal underwriter
American Funds Distributors, Inc.
333 South Hope Street
Los Angeles, CA 90071-1406
| 28 | International Growth and Income Fund |
Investors should carefully consider investment objectives, risks, charges and expenses. This and other important information is contained in the fund prospectus and summary prospectus, which can be obtained from your financial professional and should be read carefully before investing. You may also call American Funds Service Company (AFS) at (800) 421-4225 or visit the Capital Group website at capitalgroup.com.
“American Funds Proxy Voting Procedures and Principles” — which describes how we vote proxies relating to portfolio securities — is available on our website or upon request by calling AFS. The fund files its proxy voting record with the U.S. Securities and Exchange Commission (SEC) for the 12 months ended June 30 by August 31. The proxy voting record is available free of charge on the SEC website at sec.gov and on our website.
A complete June 30, 2020, portfolio of International Growth and Income Fund’s investments is available free of charge by calling AFS or visiting the SEC website (where it is part of Form N-CSR).
International Growth and Income Fund files a complete list of its portfolio holdings with the SEC for the first and third quarters of each fiscal year on Form NPORT-P. This filing is available free of charge on the SEC website. Additionally, the list of portfolio holdings is available by calling AFS.
This report is for the information of shareholders of International Growth and Income Fund, but it also may be used as sales literature when preceded or accompanied by the current prospectus or summary prospectus, which gives details about charges, expenses, investment objectives and operating policies of the fund. If used as sales material after September 30, 2020, this report must be accompanied by an American Funds statistical update for the most recently completed calendar quarter.
MSCI has not approved, reviewed or produced this report, makes no express or implied warranties or representations and is not liable whatsoever for any data in the report. You may not redistribute the MSCI data or use it as a basis for other indices or investment products.
American Funds Distributors, Inc., member FINRA.
The Capital Advantage®
Since 1931, Capital Group, home of American Funds, has helped investors pursue long-term investment success. Our consistent approach — in combination with The Capital SystemSM — has resulted in superior outcomes.
| Aligned with investor success | |
| We base our decisions on a long-term perspective, which we believe aligns our goals with the interests of our clients. Our portfolio managers average 28 years of investment industry experience, including 22 years at our company, reflecting a career commitment to our long-term approach.1 | |
| The Capital System | |
| The Capital System combines individual accountability with teamwork. Funds using The Capital System are divided into portions that are managed independently by investment professionals with diverse backgrounds, ages and investment approaches. An extensive global research effort is the backbone of our system. | |
| American Funds’ superior outcomes | |
| Equity funds have beaten their Lipper peer indexes in 92% of 10-year periods and 99% of 20-year periods.2 Fixed income funds have helped investors achieve diversification through attention to correlation between bonds and equities.3 Fund management fees have been among the lowest in the industry.4 |
| 1 | Investment industry experience as of December 31, 2019. | |
| 2 | Based on Class F-2 share results for rolling periods through December 31, 2019. Periods covered are the shorter of the fund’s lifetime or since the comparable Lipper index inception date (except Capital Income Builder and SMALLCAP World Fund, for which the Lipper average was used). Expenses differ for each share class, so results will vary. | |
| 3 | Based on Class F-2 share results as of December 31, 2019. Fifteen of the 17 fixed income American Funds that have been in existence for the three-year period showed a three-year correlation below 0.2. Standard & Poor’s 500 Composite Index was used as an equity market proxy. Correlation based on monthly total returns. Correlation is a statistical measure of how two securities move in relation to each other. A correlation ranges from –1 to 1. A positive correlation close to 1 implies that as one security moves, either up or down, the other security will move in “lockstep,” in the same direction. A negative correlation close to –1 indicates that the securities have moved in the opposite direction. | |
| 4 | On average, our management fees were in the lowest quintile 65% of the time, based on the 20-year period ended December 31, 2019, versus comparable Lipper categories, excluding funds of funds. |
Class F-2 shares were first offered on August 1, 2008. Class F-2 share results prior to the date of first sale are hypothetical based on the results of the original share class of the fund without a sales charge, adjusted for typical estimated expenses. Results for certain funds with an inception date after August 1, 2008, also include hypothetical returns because those funds’ Class F-2 shares sold after the funds’ date of first offering. Please see capitalgroup.com for more information on specific expense adjustments and the actual dates of first sale.
All Capital Group trademarks mentioned are owned by The Capital Group Companies, Inc., an affiliated company or fund. All other company and product names mentioned are the property of their respective companies.

ITEM 2 – Code of Ethics
The Registrant has adopted a Code of Ethics that applies to its Principal Executive Officer and Principal Financial Officer. The Registrant undertakes to provide to any person without charge, upon request, a copy of the Code of Ethics. Such request can be made by calling 800/421-4225 or to the Secretary of the Registrant, 6455 Irvine Center Drive, Irvine, California 92618.
ITEM 3 – Audit Committee Financial Expert
The Registrant’s board has determined that Vanessa C. L. Chang, a member of the Registrant’s audit committee, is an “audit committee financial expert” and "independent," as such terms are defined in this Item. This designation will not increase the designee’s duties, obligations or liability as compared to his or her duties, obligations and liability as a member of the audit committee and of the board, nor will it reduce the responsibility of the other audit committee members. There may be other individuals who, through education or experience, would qualify as "audit committee financial experts" if the board had designated them as such. Most importantly, the board believes each member of the audit committee contributes significantly to the effective oversight of the Registrant’s financial statements and condition.
| ITEM 4 – Principal Accountant Fees and Services | IGI | |
| Registrant: | ||
| a) Audit Fees: | ||
| Audit | 2019 | 3,000 |
| 2020 | 106,000 | |
| b) Audit-Related Fees: | ||
| 2019 | 3,000 | |
| 2020 | 3,000 | |
| c) Tax Fees: | ||
| 2019 | 14,000 | |
| 2020 | 17,000 | |
| The tax fees consist of professional services relating to the preparation of the Registrant’s tax returns. | ||
| d) All Other Fees: | ||
| 2019 | None | |
| 2020 | None | |
| Adviser and affiliates (includes only fees for non-audit services billed to the adviser and affiliates for engagements that relate directly to the operations and financial reporting of the Registrant and were subject to the pre-approval policies described below): | ||
| a) Audit Fees: | ||
| Not Applicable | ||
| b) Audit-Related Fees: | ||
| 2019 | 1,238,000 | |
| 2020 | 1,887,000 | |
| The audit-related fees consist of assurance and related services relating to the examination of the Registrant’s transfer agent, principal underwriter and investment adviser conducted in accordance with Statement on Standards for Attestation Engagements Number 18 issued by the American Institute of Certified Public Accountants. | ||
| c) Tax Fees: |
| 2019 | 10,000 | |
| 2020 | 83,000 | |
| The tax fees consist of consulting services relating to the Registrant’s investments. | ||
| d) All Other Fees: | ||
| 2019 | None | |
| 2020 | 2,000 | |
| The other fees consist of subscription services related to an accounting research tool. | ||
| All audit and permissible non-audit services that the Registrant’s audit committee considers compatible with maintaining the independent registered public accounting firm’s independence are required to be pre-approved by the committee. The pre-approval requirement will extend to all non-audit services provided to the Registrant, the investment adviser, and any entity controlling, controlled by, or under common control with the investment adviser that provides ongoing services to the Registrant, if the engagement relates directly to the operations and financial reporting of the Registrant. The committee will not delegate its responsibility to pre-approve these services to the investment adviser. The committee may delegate to one or more committee members the authority to review and pre-approve audit and permissible non-audit services. Actions taken under any such delegation will be reported to the full committee at its next meeting. The pre-approval requirement is waived with respect to non-audit services if certain conditions are met. The pre-approval requirement was not waived for any of the non-audit services listed above provided to the Registrant, adviser and affiliates. | ||
| Aggregate non-audit fees paid to the Registrant’s auditors, including fees for all services billed to the Registrant, adviser and affiliates that provide ongoing services to the Registrant, were $1,268,000 for fiscal year 2019 and $1,991,000 for fiscal year 2020. The non-audit services represented by these amounts were brought to the attention of the committee and considered to be compatible with maintaining the auditors’ independence. |
ITEM 5 – Audit Committee of Listed Registrants
Not applicable to this Registrant, insofar as the Registrant is not a listed issuer as defined in Rule 10A-3 under the Securities Exchange Act of 1934.
ITEM 6 – Schedule of Investments

International Growth and Income FundSM
Investment portfolio
June 30, 2020
| Common stocks 93.09% Financials 17.38% | Shares | Value (000) |
| AIA Group Ltd.1 | 27,092,200 | $252,149 |
| EQT AB1 | 8,243,555 | 147,601 |
| Ping An Insurance (Group) Co. of China, Ltd., Class H1 | 14,489,000 | 144,702 |
| Zurich Insurance Group AG1 | 403,766 | 142,193 |
| Euronext NV1 | 1,352,998 | 135,498 |
| Toronto-Dominion Bank (CAD denominated) | 2,651,424 | 118,334 |
| Prudential PLC1 | 7,079,356 | 106,613 |
| HDFC Bank Ltd.1 | 7,184,091 | 102,406 |
| Sberbank of Russia PJSC (ADR)1,2 | 8,829,392 | 100,310 |
| AXA SA1,2 | 4,601,330 | 96,026 |
| B3 SA - Brasil, Bolsa, Balcao | 9,080,000 | 91,984 |
| Hong Kong Exchanges and Clearing Ltd.1 | 1,799,000 | 76,671 |
| UBS Group AG1 | 6,564,686 | 75,419 |
| Partners Group Holding AG1 | 81,679 | 73,964 |
| Deutsche Boerse AG1 | 371,301 | 67,112 |
| HDFC Life Insurance Company Ltd.1,2 | 8,185,000 | 59,610 |
| Hiscox Ltd.1 | 5,963,994 | 58,217 |
| London Stock Exchange Group PLC1 | 557,896 | 57,711 |
| Aviva PLC1 | 16,994,815 | 57,513 |
| Kotak Mahindra Bank Ltd.1 | 2,755,000 | 49,717 |
| UniCredit SpA1,2 | 4,960,623 | 45,541 |
| Société Générale1,2 | 2,709,923 | 45,085 |
| Moscow Exchange MICEX-RTS PJSC1 | 26,198,788 | 41,657 |
| Barclays PLC1 | 28,651,272 | 40,535 |
| Tokio Marine Holdings, Inc.1 | 927,400 | 40,403 |
| Fairfax Financial Holdings Ltd., subordinate voting shares | 127,953 | 39,531 |
| Macquarie Group Ltd.1 | 472,707 | 38,910 |
| Banco Bilbao Vizcaya Argentaria, SA1 | 10,933,066 | 37,554 |
| Intercontinental Exchange, Inc. | 409,746 | 37,533 |
| FinecoBank SpA1,2 | 2,260,000 | 30,454 |
| Banco Santander, SA1 | 11,587,930 | 28,257 |
| Brookfield Asset Management Inc., Class A (CAD denominated) | 848,475 | 27,924 |
| ORIX Corp.1 | 2,198,600 | 27,109 |
| AIB Group PLC1,2 | 21,132,781 | 26,338 |
| Bank of Nova Scotia (CAD denominated) | 609,623 | 25,227 |
| M&G PLC1 | 11,818,986 | 24,499 |
| Swedbank AB, Class A1,2 | 1,796,281 | 22,990 |
| BB Seguridade Participações SA | 4,565,000 | 22,892 |
| DNB ASA1,2 | 1,587,215 | 21,001 |
| Resona Holdings, Inc.1 | 5,870,300 | 20,031 |
| TMX Group Ltd. | 201,775 | 19,950 |
| Lloyds Banking Group PLC1 | 49,155,000 | 18,962 |
| Discovery Ltd.1 | 3,080,877 | 18,550 |
| Credicorp Ltd. | 137,000 | 18,313 |
| Investor AB, Class B1 | 258,000 | 13,595 |
International Growth and Income Fund — Page 1 of 7
| Common stocks (continued) Financials (continued) | Shares | Value (000) |
| ICICI Bank Ltd. (ADR) | 424,138 | $3,940 |
| Piraeus Bank SA1,2 | 12,070 | 21 |
| 2,750,552 | ||
| Information technology 12.16% | ||
| Taiwan Semiconductor Manufacturing Company, Ltd.1 | 55,568,506 | 588,028 |
| ASML Holding NV1 | 966,781 | 354,401 |
| Tokyo Electron Ltd.1 | 797,500 | 195,716 |
| SAP SE1 | 721,346 | 100,408 |
| Broadcom Inc. | 291,221 | 91,912 |
| Edenred SA1 | 1,990,804 | 86,972 |
| PagSeguro Digital Ltd., Class A2 | 1,999,702 | 70,669 |
| Keyence Corp.1 | 159,000 | 66,386 |
| TDK Corp.1 | 658,500 | 65,280 |
| Vanguard International Semiconductor Corp.1 | 23,116,250 | 60,840 |
| Temenos AG1 | 306,810 | 47,570 |
| Nokia Corp.1 | 8,345,949 | 36,550 |
| Logitech International SA1 | 513,682 | 33,494 |
| MediaTek Inc.1 | 1,428,000 | 27,940 |
| NetEase, Inc.1 | 1,409,100 | 24,290 |
| Largan Precision Co., Ltd.1 | 169,000 | 23,322 |
| Murata Manufacturing Co., Ltd.1 | 345,800 | 20,262 |
| AAC Technologies Holdings Inc.1 | 2,446,000 | 14,976 |
| Infosys Ltd. (ADR) | 947,300 | 9,151 |
| Capita PLC1,2 | 7,382,450 | 4,027 |
| Nemetschek SE1 | 22,624 | 1,552 |
| 1,923,746 | ||
| Consumer staples 10.65% | ||
| British American Tobacco PLC1 | 11,811,525 | 453,816 |
| Nestlé SA1 | 2,327,188 | 257,097 |
| Philip Morris International Inc. | 2,561,607 | 179,466 |
| Pernod Ricard SA1 | 849,054 | 133,445 |
| Associated British Foods PLC1 | 4,723,677 | 111,938 |
| Anheuser-Busch InBev SA/NV1 | 2,198,641 | 108,364 |
| Kweichow Moutai Co., Ltd., Class A1 | 467,763 | 96,805 |
| Carlsberg A/S, Class B1 | 671,105 | 88,653 |
| Japan Tobacco Inc.1 | 4,074,300 | 75,594 |
| Unilever PLC1 | 1,392,205 | 75,064 |
| Bakkafrost P/F1,2 | 441,027 | 27,781 |
| Reckitt Benckiser Group PLC1 | 244,767 | 22,526 |
| Unilever NV (EUR denominated)1 | 400,080 | 21,218 |
| Mowi ASA1 | 917,432 | 17,437 |
| Danone SA1,2 | 224,313 | 15,500 |
| 1,684,704 | ||
| Consumer discretionary 10.49% | ||
| Wynn Macau, Ltd.1 | 109,053,200 | 189,455 |
| LVMH Moët Hennessy-Louis Vuitton SE1 | 309,298 | 135,472 |
| Evolution Gaming Group AB1 | 2,241,311 | 133,487 |
| Alibaba Group Holding Ltd.1,2 | 4,838,000 | 130,736 |
| Midea Group Co., Ltd., Class A1 | 10,792,366 | 91,294 |
| Renault SA1,2 | 3,390,000 | 85,809 |
| Ocado Group PLC1,2 | 2,701,900 | 67,829 |
| Naspers Ltd., Class N1 | 363,275 | 66,272 |
International Growth and Income Fund — Page 2 of 7
| Common stocks (continued) Consumer discretionary (continued) | Shares | Value (000) |
| Valeo SA, non-registered shares1 | 2,412,261 | $63,187 |
| adidas AG1,2 | 238,000 | 62,266 |
| Gree Electric Appliances, Inc. of Zhuhai, Class A1 | 7,430,145 | 59,733 |
| Sands China Ltd.1 | 15,145,600 | 59,268 |
| Sony Corp.1 | 789,500 | 54,066 |
| Peugeot SA1,2 | 3,215,039 | 52,188 |
| Cie. Financière Richemont SA, Class A1 | 763,173 | 48,598 |
| InterContinental Hotels Group PLC1 | 1,077,963 | 47,779 |
| MGM China Holdings, Ltd.1 | 35,750,800 | 46,473 |
| Paltac Corp.1 | 983,400 | 45,095 |
| Restaurant Brands International Inc. (CAD denominated) | 729,672 | 39,714 |
| Prosus NV1,2 | 363,275 | 33,716 |
| OPAP SA1 | 3,040,167 | 28,958 |
| HUGO BOSS AG1 | 710,014 | 21,439 |
| Barratt Developments PLC1 | 3,337,000 | 20,469 |
| Li Ning Co. Ltd.1 | 6,259,548 | 19,898 |
| Sodexo SA1 | 281,826 | 19,037 |
| Galaxy Entertainment Group Ltd.1 | 2,503,000 | 16,995 |
| Accor SA1,2 | 376,419 | 10,213 |
| Industria de Diseño Textil, SA1 | 380,234 | 10,053 |
| 1,659,499 | ||
| Health care 9.41% | ||
| AstraZeneca PLC1 | 4,225,206 | 440,463 |
| Sanofi1 | 1,774,692 | 180,555 |
| Novartis AG1 | 1,650,846 | 143,443 |
| Novo Nordisk A/S, Class B1 | 1,673,486 | 108,293 |
| Koninklijke Philips NV (EUR denominated)1,2 | 2,294,490 | 106,847 |
| GlaxoSmithKline PLC1 | 4,354,761 | 88,236 |
| Fisher & Paykel Healthcare Corp. Ltd.1 | 3,713,702 | 85,880 |
| Bayer AG1 | 964,357 | 70,783 |
| HOYA Corp.1 | 689,600 | 66,040 |
| Hypera SA, ordinary nominative | 6,398,800 | 39,183 |
| Coloplast A/S, Class B1 | 195,879 | 30,367 |
| Shionogi & Co., Ltd.1 | 470,200 | 29,434 |
| ORPEA Group, non-registered shares1 | 205,000 | 23,678 |
| Hutchison China MediTech Ltd. (ADR)2 | 817,655 | 22,551 |
| Takeda Pharmaceutical Company, Ltd.1 | 579,600 | 20,686 |
| Mettler-Toledo International Inc.2 | 19,100 | 15,386 |
| Roche Holding AG, nonvoting, non-registered shares1 | 25,300 | 8,760 |
| Galapagos NV1,2 | 42,171 | 8,279 |
| 1,488,864 | ||
| Industrials 7.63% | ||
| Airbus SE, non-registered shares1,2 | 2,265,965 | 161,243 |
| BAE Systems PLC1 | 25,255,891 | 151,065 |
| SMC Corp.1 | 231,400 | 118,107 |
| ABB Ltd1 | 3,393,872 | 76,286 |
| Safran SA1,2 | 762,351 | 76,260 |
| Rheinmetall AG1 | 790,016 | 68,328 |
| CCR SA, ordinary nominative | 22,941,700 | 61,171 |
| Meggitt PLC1 | 15,351,644 | 55,885 |
| Ryanair Holdings PLC (ADR)2 | 833,813 | 55,315 |
| AB Volvo, Class B1,2 | 3,119,400 | 48,761 |
| Alliance Global Group, Inc.1,2 | 350,520,000 | 47,998 |
International Growth and Income Fund — Page 3 of 7
| Common stocks (continued) Industrials (continued) | Shares | Value (000) |
| Kone OYJ, Class B1 | 674,641 | $46,359 |
| Cathay Pacific Airways Ltd.1 | 44,863,000 | 43,420 |
| ASSA ABLOY AB, Class B1 | 1,961,786 | 39,832 |
| VAT Group AG1 | 176,200 | 32,124 |
| Bunzl PLC1 | 946,248 | 25,370 |
| Experian PLC1 | 614,000 | 21,416 |
| MTU Aero Engines AG1,2 | 102,515 | 17,717 |
| Epiroc AB, Class B1 | 613,320 | 7,491 |
| Epiroc AB, Class A1 | 583,481 | 7,260 |
| Geberit AG1 | 23,180 | 11,589 |
| Aeroflot - Russian Airlines PJSC1 | 9,680,000 | 11,122 |
| Canadian National Railway Company (CAD denominated) | 110,000 | 9,732 |
| International Consolidated Airlines Group SA (CDI)1 | 3,098,083 | 8,506 |
| JGC Holdings Corp.1 | 524,698 | 5,523 |
| 1,207,880 | ||
| Utilities 6.29% | ||
| Enel SpA1 | 41,152,645 | 354,537 |
| Ørsted AS1 | 1,233,237 | 142,229 |
| Engie SA1,2 | 7,619,174 | 94,046 |
| SSE PLC1 | 5,030,313 | 84,932 |
| National Grid PLC1 | 5,844,800 | 71,571 |
| Brookfield Infrastructure Partners LP | 1,683,664 | 69,289 |
| Guangdong Investment Ltd.1 | 31,308,000 | 53,741 |
| Iberdrola, SA, non-registered shares1 | 4,477,836 | 51,864 |
| China Gas Holdings Ltd.1 | 16,822,400 | 51,804 |
| Hong Kong and China Gas Co. Ltd.1 | 6,426,000 | 9,937 |
| ENN Energy Holdings Ltd.1 | 737,200 | 8,279 |
| Brookfield Infrastructure Corp., Class A, subordinate voting shares | 60,407 | 2,752 |
| 994,981 | ||
| Communication services 6.08% | ||
| Koninklijke KPN NV1 | 60,056,826 | 159,066 |
| Vodafone Group PLC1 | 97,007,427 | 154,684 |
| Nintendo Co., Ltd.1 | 300,800 | 133,846 |
| Tencent Holdings Ltd.1 | 1,674,700 | 107,572 |
| América Móvil, SAB de CV, Series L (ADR) | 5,582,794 | 70,846 |
| SoftBank Corp.1 | 4,911,000 | 62,509 |
| KT Corp. (ADR) | 3,279,892 | 31,946 |
| KT Corp.1 | 956,370 | 18,864 |
| Ubisoft Entertainment SA1,2 | 495,000 | 40,768 |
| Shaw Communications Inc., Class B, nonvoting shares | 2,406,783 | 39,250 |
| Perusahaan Perseroan (Persero) Telekomunikasi Indonesia Tbk PT, Class B1 | 159,025,000 | 33,976 |
| Bharti Infratel Ltd.1 | 11,108,993 | 32,627 |
| BT Group PLC1 | 22,013,301 | 31,070 |
| HKBN Ltd.1 | 13,981,500 | 24,480 |
| Nippon Telegraph and Telephone Corp.1 | 499,000 | 11,617 |
| China Tower Corp. Ltd., Class H1 | 52,746,000 | 9,335 |
| 962,456 | ||
| Energy 5.15% | ||
| LUKOIL Oil Co. PJSC (ADR)1 | 1,604,193 | 118,912 |
| Gazprom PJSC (ADR)1 | 20,184,915 | 108,711 |
| TC Energy Corp. (CAD denominated) | 2,401,400 | 102,594 |
| TOTAL SA1 | 2,457,552 | 93,607 |
International Growth and Income Fund — Page 4 of 7
| Common stocks (continued) Energy (continued) | Shares | Value (000) |
| Royal Dutch Shell PLC, Class B1 | 4,736,716 | $71,677 |
| Royal Dutch Shell PLC, Class B (ADR) | 179,889 | 5,478 |
| Royal Dutch Shell PLC, Class A (GBP denominated)1 | 102,910 | 1,637 |
| Schlumberger Ltd. | 3,972,479 | 73,054 |
| INPEX Corp.1 | 11,193,300 | 69,297 |
| Inter Pipeline Ltd. | 5,098,845 | 47,473 |
| Enbridge Inc. (CAD denominated) | 1,233,437 | 37,505 |
| Galp Energia, SGPS, SA, Class B1 | 2,302,157 | 26,593 |
| Rosneft Oil Company PJSC (GDR)1 | 4,321,939 | 21,680 |
| Reliance Industries Ltd.1 | 859,046 | 19,415 |
| Neste Oyj1 | 432,000 | 16,872 |
| 814,505 | ||
| Materials 5.04% | ||
| Vale SA, ordinary nominative | 11,137,000 | 114,522 |
| Vale SA, ordinary nominative (ADR) | 2,495,000 | 25,723 |
| Linde PLC | 608,500 | 129,069 |
| Koninklijke DSM NV1 | 844,477 | 116,726 |
| Rio Tinto PLC1 | 1,411,865 | 79,446 |
| Asahi Kasei Corp.1 | 8,076,700 | 65,620 |
| AngloGold Ashanti Ltd. (ADR) | 2,000,700 | 59,001 |
| LafargeHolcim Ltd.1 | 784,862 | 34,328 |
| LyondellBasell Industries NV | 513,558 | 33,751 |
| Alrosa PJSC1 | 25,367,616 | 22,972 |
| Barrick Gold Corp. (GBP denominated) | 796,147 | 21,423 |
| Air Liquide SA, non-registered shares1 | 131,450 | 18,940 |
| Wheaton Precious Metals Corp. (CAD denominated) | 425,424 | 18,711 |
| Fortescue Metals Group Ltd.1 | 1,918,813 | 18,411 |
| Shin-Etsu Chemical Co., Ltd.1 | 116,700 | 13,642 |
| Sika AG1 | 49,905 | 9,592 |
| Givaudan SA1 | 2,433 | 9,050 |
| Nutrien Ltd. (CAD denominated) | 118,801 | 3,817 |
| Gerdau SA (ADR) | 1,202,700 | 3,560 |
| 798,304 | ||
| Real estate 2.81% | ||
| Longfor Group Holdings Ltd.1 | 25,035,000 | 119,243 |
| CK Asset Holdings Ltd.1 | 17,128,244 | 101,853 |
| China Overseas Land & Investment Ltd.1 | 25,837,500 | 78,026 |
| Link Real Estate Investment Trust REIT1 | 6,156,326 | 50,234 |
| Vonovia SE1,2 | 559,654 | 34,283 |
| Brookfield Property Partners LP | 2,839,843 | 28,086 |
| Unibail-Rodamco-Westfield REIT, non-registered shares1 | 470,006 | 26,437 |
| Central Pattana PCL, foreign registered1 | 3,723,700 | 5,957 |
| 444,119 | ||
| Total common stocks (cost: $13,161,873,000) | 14,729,610 | |
| Preferred securities 2.71% Information technology 1.64% | ||
| Samsung Electronics Co., Ltd., nonvoting preferred shares1 | 6,662,535 | 260,187 |
International Growth and Income Fund — Page 5 of 7
| Preferred securities (continued) Consumer discretionary 0.52% | Shares | Value (000) |
| Hyundai Motor Co., Series 2, preferred shares1 | 943,537 | $45,063 |
| Volkswagen AG, nonvoting preferred shares1,2 | 243,797 | 36,869 |
| 81,932 | ||
| Materials 0.30% | ||
| Gerdau SA, preferred nominative | 15,996,900 | 47,095 |
| Financials 0.16% | ||
| Banco Bradesco SA, preferred nominative | 6,661,490 | 25,357 |
| Health care 0.09% | ||
| Sartorius AG, nonvoting preferred, non-registered shares1 | 42,000 | 13,798 |
| Total preferred securities (cost: $437,475,000) | 428,369 | |
| Short-term securities 4.14% Money market investments 4.14% | ||
| Capital Group Central Cash Fund 0.18%3 | 6,550,781 | 655,144 |
| Total short-term securities (cost: $655,042,000) | 655,144 | |
| Total investment securities 99.94% (cost: $14,254,390,000) | 15,813,123 | |
| Other assets less liabilities 0.06% | 9,330 | |
| Net assets 100.00% | $15,822,453 |
| 1 | Valued under fair value procedures adopted by authority of the board of trustees. The total value of all such securities was $13,167,799,000, which represented 83.22% of the net assets of the fund. This entire amount relates to certain securities trading outside the U.S. whose values were adjusted as a result of significant market movements following the close of local trading. |
| 2 | Security did not produce income during the last 12 months. |
| 3 | Rate represents the seven-day yield at 6/30/2020. |
International Growth and Income Fund — Page 6 of 7
| Key to abbreviations |
| ADR = American Depositary Receipts |
| CAD = Canadian dollars |
| CDI = CREST Depository Interest |
| EUR = Euros |
| GBP = British pounds |
| GDR = Global Depositary Receipts |
Additional financial disclosures are included in the fund’s current shareholder report and should be read in conjunction with this report.
Investments are not FDIC-insured, nor are they deposits of or guaranteed by a bank or any other entity, so they may lose value.
Investors should carefully consider investment objectives, risks, charges and expenses. This and other important information is contained in the fund prospectus and summary prospectus, which can be obtained from your financial professional and should be read carefully before investing. You may also call American Funds Service Company (AFS) at (800) 421-4225 or visit the Capital Group website at capitalgroup.com.
All Capital Group trademarks mentioned are owned by The Capital Group Companies, Inc., an affiliated company or fund. All other company and product names mentioned are the property of their respective companies.
American Funds Distributors, Inc., member FINRA.
© 2020 Capital Group. All rights reserved.
| MFGEFP4-034-0820O-S78137 | International Growth and Income Fund — Page 7 of 7 |
REPORT OF INDEPENDENT REGISTERED PUBLIC ACCOUNTING FIRM ON INVESTMENT PORTFOLIO
To the Shareholders and Board of Trustees of International Growth and Income Fund:
Opinion on the Investment Portfolio
We have audited the accompanying investment portfolio of International Growth and Income Fund (the “Fund”), as of June 30, 2020, and the related notes (“investment portfolio”) (included in Item 6 of this Form N-CSR). In our opinion, the investment portfolio presents fairly, in all material respects, the investments in securities of the Fund as of June 30, 2020, in conformity with accounting principles generally accepted in the United States of America.
Basis for Opinion
The investment portfolio is the responsibility of the Fund’s management. Our responsibility is to express an opinion on the investment portfolio based on our audit. We are a public accounting firm registered with the Public Company Accounting Oversight Board (United States) (PCAOB) and are required to be independent with respect to the Fund in accordance with the U.S. federal securities laws and the applicable rules and regulations of the Securities and Exchange Commission and the PCAOB.
We conducted our audit in accordance with the standards of the PCAOB. Those standards require that we plan and perform the audit to obtain reasonable assurance about whether the investment portfolio is free of material misstatement, whether due to error or fraud. The Fund is not required to have, nor were we engaged to perform, an audit of its internal control over financial reporting. As part of our audit we are required to obtain an understanding of internal control over financial reporting but not for the purpose of expressing an opinion on the effectiveness of the Fund's internal control over financial reporting. Accordingly, we express no such opinion.
Our audit included performing procedures to assess the risks of material misstatement of the investment portfolio, whether due to error or fraud, and performing procedures that respond to those risks. Such procedures included examining, on a test basis, evidence regarding the amounts and disclosures in the investment portfolio. Our audit also included evaluating the accounting principles used and significant estimates made by management, as well as evaluating the overall presentation of the investment portfolio. We believe that our audit provides a reasonable basis for our opinion.

Costa Mesa, California
August 12, 2020
We have served as the auditor of one or more American Funds investment companies since 1956.
ITEM 7 – Disclosure of Proxy Voting Policies and Procedures for Closed-End Management Investment Companies
Not applicable to this Registrant, insofar as the Registrant is not a closed-end management investment company.
ITEM 8 – Portfolio Managers of Closed-End Management Investment Companies
Not applicable to this Registrant, insofar as the Registrant is not a closed-end management investment company.
ITEM 9 – Purchases of Equity Securities by Closed-End Management Investment Company and Affiliated Purchasers
Not applicable to this Registrant, insofar as the Registrant is not a closed-end management investment company.
ITEM 10 – Submission of Matters to a Vote of Security Holders
There have been no material changes to the procedures by which shareholders may recommend nominees to the Registrant’s board of trustees since the Registrant last submitted a proxy statement to its shareholders. The procedures are as follows. The Registrant has a nominating and governance committee comprised solely of persons who are not considered ‘‘interested persons’’ of the Registrant within the meaning of the Investment Company Act of 1940, as amended. The committee periodically reviews such issues as the board’s composition, responsibilities, committees, compensation and other relevant issues, and recommends any appropriate changes to the full board of trustees. While the committee normally is able to identify from its own resources an ample number of qualified candidates, it will consider shareholder suggestions of persons to be considered as nominees to fill future vacancies on the board. Such suggestions must be sent in writing to the nominating and governance committee of the Registrant, c/o the Registrant’s Secretary, and must be accompanied by complete biographical and occupational data on the prospective nominee, along with a written consent of the prospective nominee for consideration of his or her name by the nominating and governance committee.
ITEM 11 – Controls and Procedures
| (a) | The Registrant’s Principal Executive Officer and Principal Financial Officer have concluded, based on their evaluation of the Registrant’s disclosure controls and procedures (as such term is defined in Rule 30a-3 under the Investment Company Act of 1940), that such controls and procedures are adequate and reasonably designed to achieve the purposes described in paragraph (c) of such rule. |
| (b) | There were no changes in the Registrant’s internal controls over financial reporting (as defined in Rule 30a-3(d) under the Investment Company Act of 1940) that occurred during the Registrant’s semi-annual period covered by this report that has materially affected, or is reasonably likely to materially affect, the Registrant’s internal control over financial reporting.
|
ITEM 12 – Exhibits
| (a)(1) | The Code of Ethics that is the subject of the disclosure required by Item 2 is attached as an exhibit hereto. |
| (a)(2) | The certifications required by Rule 30a-2 of the Investment Company Act of 1940 and Sections 302 and 906 of the Sarbanes-Oxley Act of 2002 are attached as exhibits hereto. |
SIGNATURES
Pursuant to the requirements of the Securities Exchange Act of 1934 and the Investment Company Act of 1940, the Registrant has duly caused this report to be signed on its behalf by the undersigned, thereunto duly authorized.
| INTERNATIONAL GROWTH AND INCOME FUND | |
| By __/s/ Donald H. Rolfe________________ | |
Donald H. Rolfe, Executive Vice President and Principal Executive Officer | |
| Date: August 31, 2020 |
Pursuant to the requirements of the Securities Exchange Act of 1934 and the Investment Company Act of 1940, this report has been signed below by the following persons on behalf of the Registrant and in the capacities and on the dates indicated.
| By _ /s/ Donald H. Rolfe_____________ |
Donald H. Rolfe, Executive Vice President and Principal Executive Officer |
| Date: August 31, 2020 |
| By ___/s/ Hong T. Le__________________ |
Hong T. Le, Treasurer and Principal Financial Officer |
| Date: August 31, 2020 |