Filed Pursuant to Rule 424(b)(3)
Registration No. 333-153135
SUPPLEMENT NO. 15
DATED MARCH 13, 2013
TO THE PROSPECTUS DATED APRIL 25, 2012
OF BLUEROCK MULTIFAMILY GROWTH REIT, INC.
This Supplement No. 15 supplements, and should be read in conjunction with, the prospectus of Bluerock Multifamily Growth REIT, Inc., formerly known as Bluerock Enhanced Multifamily Trust, Inc. (the “Company”) dated April 25, 2012, and Cumulative Supplement No. 14 dated February 1, 2013. Unless otherwise defined in this Supplement No. 15, capitalized terms used have the same meanings as set forth in the prospectus. The purpose of this Supplement No. 15 is to disclose the following:
| · | the status and extension of our initial public offering through the registration of our follow-on offering; |
| · | the declaration of distributions for the second quarter of 2013;
| |
| · | the change of our corporate name to Bluerock Multifamily Growth REIT, Inc. from Bluerock Enhanced Multifamily Trust, Inc. |
| · | the appointment of Dr. Randy I. Anderson as our Chief Executive Officer and the Chief Executive Officer of our advisor on February 26, 2013 at the recommendation of R. Ramin Kamfar, the Chairman of our Board of Directors, who stepped down as our Chief Executive Officer and the Chief Executive Officer of our advisor effective February 26, 2013;
| |
| · | the adoption by our Board of Directors of certain changes in our investment objectives and policies to focus more on growth and capital appreciation opportunities, remove investments in real estate-related investments from our investment strategies and focus our real estate investments in four demographically attractive regions;
| |
| · | the adoption by our Board of Directors of a revised liquidity event policy focused on a portfolio sale to an institutional investor or public REIT, which we intend to pursue in a shorter period of time following the termination of our offering stage;
| |
| · | the rebranding of our advisor’s Enhanced Multifamily strategy as our advisor’s Valuation Creation strategy;
| |
| · | an updated Estimated Use of Proceeds table reflecting the elimination of the advisor’ origination fee in connection with the removal of real estate-related assets from our investment strategy;
| |
| · | the increase in the maximum available amount under our working capital line of credit with affiliates of our advisor to $13.5 million from $12.5 million, and the extension of the maturity date to October 2, 2013 from April 2, 2013;
| |
| · | the amendment of our Advisory Agreement to provide that the advisor and the Company have agreed to waive the internalization fee payable to our advisor in connection with any internalization transaction in which our company becomes self-administered and to eliminate the origination fee payable to our advisor, and related changes to the management compensation information in the prospectus;
| |
| · | an update with respect to our joint venture strategy and use of regional operating partners; and
| |
| · | an update of the Multifamily Market Overview contained in the prospectus to reflect more current information on the current state of the multifamily housing market and past and expected future trends. |
OPERATING INFORMATION
Status of our Initial Public Offering
We commenced our initial public offering on October 15, 2009, pursuant to which we are offering up to $1,000,000,000 in shares of our common stock in a primary offering at $10.00 per share. We are also offering up to $285,000,000 in shares of our common stock under our distribution reinvestment plan (“DRP”) at an initial price of $9.50 per share.
As of March 5, 2013, we had accepted aggregate gross offering proceeds of $21.7 million related to the sale of 2,243,227 shares of common stock, exclusive of DRP shares. Solicitations are not currently being made to, nor subscriptions accepted from, residents of Pennsylvania, Kansas, West Virginia or Ohio.
On September 20, 2012, we filed a registration statement on Form S-11 with the U.S. Securities and Exchange Commission, or the SEC, to register 50,000,000 shares of our common stock (exclusive of shares to be sold pursuant to the Company’s distribution reinvestment program) at a price of $10.00 per share (subject to certain volume discounts described in the prospectus), for maximum aggregate gross offering proceeds of $500.0 million, pursuant to a follow-on offering to this offering (the “Follow-On Offering”). As permitted by Rule 415 under the Securities Act, we will now continue this offering until the earlier of April 13, 2013 or the date the SEC declares the registration statement for the Follow-On Offering effective.
Distribution Declaration
On March 4, 2013, our Board of Directors authorized distributions payable to the stockholders of record each day for April 1, 2013 through June 30, 2013. Distributions payable to each stockholder of record will be paid on or before the 15th day of the following month. The declared distributions equal a daily amount of $0.00191781 per share of common stock. If this rate were paid each day for a 365-day period, it would equal a 7% annualized rate based on a purchase price of $10.00 per share. A portion of each distribution may constitute a return of capital for tax purposes. There is no assurance that we will continue to declare distributions or at this rate.
Change of Corporate Name
Effective February 22, 2013, the Company changed its name from Bluerock Enhanced Multifamily Trust, Inc. to Bluerock Multifamily Growth REIT, Inc. The name change was effected pursuant to an amendment to the charter of the Company (the “Charter Amendment”), which was filed with the Maryland State Department of Assessments and Taxation on February 22, 2013. The Charter Amendment was duly approved by at least a majority of the Board of Directors of the Company, and was made without action by the stockholders of the Company pursuant to Section 2-605(a)(1) of the Maryland General Corporation Law.
All references to Bluerock Enhanced Multifamily Trust, Inc. in the prospectus are hereby changed to refer to Bluerock Multifamily Growth REIT, Inc.
Appointment of Chief Executive Officer
On February 26, 2013, the Board of Directors of the Company appointed Randy I. Anderson, Ph.D., age 45, to serve as the Chief Executive Officer of the Company, at the recommendation of R. Ramin Kamfar, the Chairman of the Board of the Company. Dr. Anderson was also appointed Chief Executive Officer of our advisor effective February 26, 2013, who replaces Mr. Kamfar in that role. Dr. Anderson was appointed Chief Executive Officer of the Company to serve in such capacity, effective February 26, 2013, until his successor is elected and qualifies or until his earlier death, resignation or removal. The appointment of Dr. Anderson as the Chief Executive Officer of the Company was not made pursuant to any arrangement or understanding between him and any other person.In connection with Dr. Anderson’s appointment to Chief Executive Officer, R. Ramin Kamfar has stepped down as Chief Executive Officer of the Company effective February 26, 2013, but will remain in his position as the Chairman of the Board of the Company and will remain available to and assist Dr. Anderson in his role of Chief Executive Officer as needed. Mr. Kamfar’s stepping down as Chief Executive Officer was not the result of any disagreements with the Company on any matters relating to the Company’s operations, policies or practices.
| 2 |
Changes in Investment Objectives and Policies
On February 26, 2013, the Board of Directors of the Company authorized and approved the implementation by the Company of changes to the Company’s investment objectives and policies and its policy to provide liquidity to stockholders.
Class A Multifamily Allocation. The Company intends to allocate approximately 55% of its portfolio to investments in acquiring and developing well-located, primarily Class A apartment properties with strong and stable cash flows, typically located in our demographically attractive target regions with relatively high expectations of rent growth. As appropriate, the Company intends to implement the advisor’s property enhancement strategy (now referred to as its “Value Creation” strategy) at these properties. This category of investments previously represented 50% of the Company’s target investment allocation.
Value Added Residential Allocation. The Company also intends to allocate approximately 45% of its portfolio to investments in well-located residential properties that offer a significant potential for short-term capital appreciation through repositioning, renovation or redevelopment. In addition, the Company will seek to acquire properties available at opportunistic prices from distressed or time-constrained sellers in need of liquidity. As appropriate, the Company intends to implement the advisor’s Value Creation strategy at these properties as well. This category of investments previously represented 30% of the Company’s target investment allocation.
No Real Estate-Related Investments Allocation. The Company no longer intends to invest in real estate-related investments, such as first and second mortgages, subordinated, bridge and other loans, debt and other securities related to or secured by real estate assets, and common and preferred equity, including securities of other REITs and real estate companies. This category of investments previously represented 20% of the Company’s target investment allocation. Excluded from this group are joint venture investments in which the Company exercises some control.
Geographic Focus. Although the Company intends to diversify its portfolio by geographic location, the Company expects to focus on four demographically attractive regions that have growing populations and job growth that correlate with increased rental rates and occupancy. These regions include: Florida/Georgia; Tennessee; North/South Carolina; and Texas. Within these states, the Company will seek to focus on submarkets where its sponsor’s regional partners have established relationships, transaction history, market knowledge and potential access to ‘‘off-market’’ investments, as well as an ability to direct property management and leasing operations efficiently.
Changes in Liquidity Event Policy. The Company intends to pursue a transaction providing liquidity for its stockholders, with a focus on a portfolio sale to an institutional investor or public REIT, in a shorter period of time after the completion of our offering stage. The Company’s previous liquidity event policy was to complete a transaction providing liquidity for stockholders within four to six years from the completion of its offering stage, subject to the provisions of its charter discussed below. The Company will consider its offering stage complete when it is no longer publicly offering equity securities through an offering and has not done so for one year. A liquidity event could include (1) the sale of all or substantially all of the Company’s assets either on a portfolio basis or individually followed by a liquidation, (2) a merger or another transaction approved by its board of directors in which the Company’s stockholders will receive cash and/or shares of a publicly traded company or (3) a listing of the Company’s shares on a national securities exchange. The Company cannot predict the exact date by which it will complete a liquidity event, as market conditions and other factors could cause it to delay a liquidity event. The sale of all, or substantially all, of the Company’s assets as well as liquidation would require the affirmative vote of a majority of our then outstanding shares of common stock.
| 3 |
If the Company does not begin the process of listing its shares of common stock on a national securities exchange by the end of six years from the completion of its offering stage, or have not otherwise completed a liquidity event by such date, the Company’s charter requires that it seek stockholder approval of the liquidation of the Company, unless a majority of the board of directors, including a majority of independent directors, determines that liquidation is not then in the best interests of the Company’s stockholders. If a majority of the Company’s board of directors, including a majority of independent directors, determines that liquidation is not then in the best interests of the Company’s stockholders, its charter requires that a majority of the board of directors, including a majority of independent directors, revisit the issue of liquidation at least annually. Further postponement of listing or stockholder action regarding liquidation would only be permitted if a majority of the Company’s board of directors, including a majority of independent directors, again determined that liquidation would not be in the best interest of the Company’s stockholders. If the Company sought and failed to obtain stockholder approval of the Company’s liquidation, the Company’s charter would not require the Company to list or liquidate, and the Company could continue to operate as before. If the Company sought and obtained stockholder approval of a liquidation, the Company would begin an orderly sale of its properties and other assets.
Even if the Company decides to liquidate, the Company is under no obligation to conclude the liquidation within a set time because the timing of the sale of its assets will depend on real estate and financial markets, economic conditions of the areas in which the properties are located, and federal income tax effects on stockholders that may prevail in the future. After commencing a liquidation, the Company would continue in existence until all properties and other assets are liquidated.
PROSPECTUS UPDATES
The advisor has rebranded its Enhanced Multifamily strategy as the “Valuation Creation” strategy. All references in the prospectus to “Enhanced Multifamily” are hereby changed to refer to “Valuation Creation.”
The Company’s Estimated Use of Proceeds as set forth in the prospectus is amended as follows to reflect the removal of the origination fee:
ESTIMATED USE OF PROCEEDS
The table below sets forth our estimated use of proceeds from this offering assuming we sell (1) $1,000,000,000 in shares, the maximum offering amount, in the primary offering and no shares pursuant to our distribution reinvestment plan and (2) $1,000,000,000 in shares, the maximum offering amount, in the primary offering and $285,000,000 in shares, the maximum amount available pursuant to our distribution reinvestment plan. Shares of our common stock will be sold at $10.00 per share in the primary offering and at $9.50 per share pursuant to the distribution reinvestment plan. We reserve the right to reallocate shares of our common stock between the primary offering and the distribution reinvestment plan.
Many of the amounts set forth below represent management’s best estimate since they cannot be precisely calculated at this time. Depending primarily upon the number of shares we sell in this offering, we estimate that between approximately 88.40% (assuming all shares available under our distribution reinvestment plan are sold) and approximately 85.89% (assuming no shares available under our distribution reinvestment plan are sold) of our gross offering proceeds will be available for investments. On a per share basis, the funds available for investment would be $8.84 and $8.59 for shares sold at $10.00 per share. We will use the remainder of the offering proceeds to pay offering expenses, including selling commissions and the dealer manager fee, and, upon investment in properties, to pay a fee to our advisor for its services in connection with the selection and acquisition of our real estate investments. We expect to use the net proceeds from the sale of shares under our distribution reinvestment plan for general corporate purposes, including, but not limited to, the repurchase of shares under our share repurchase plan; capital expenditures, tenant improvement costs and leasing costs related to our investments in real estate properties; reserves required by any financings of our investments in real estate properties; investments in real estate properties, which would include payment of acquisition fees to our advisor; and the repayment of debt. We cannot predict with any certainty how much, if any, distribution reinvestment plan proceeds will be available for specific purposes. To the extent proceeds from our distribution reinvestment plan are used for investments in real estate properties, sales under our distribution reinvestment plan will result in greater fee income for our advisor because of acquisition and other fees.
During the early stages of our operations until the proceeds of this offering are invested in real estate investments, we have funded and expect to continue to fund distributions from the proceeds of this offering and borrowings. Until such time as cash flows from operations and other sources of cash are sufficient to fund such distribution payments, if ever, we will have used less than 88.40% of the gross proceeds in this offering for investment in real estate (including the payment of acquisition expenses). Our organizational documents do not limit the amount of distributions we can fund from sources other than from operating cash flow.
| 4 |
| Maximum Offering (Not Including Distribution Reinvestment Plan) | Maximum Offering (Including Distribution Reinvestment Plan) | |||||||||||||||
| Amount | Percent | Amount | Percent | |||||||||||||
| Gross Offering Proceeds | $ | 1,000,000,000 | 100.00 | % | $ | 1,285,000,000 | 100.00 | % | ||||||||
| Selling Commissions(1) | 70,000,000 | 7.00 | % | 70,000,000 | 5.45 | % | ||||||||||
| Dealer Manager Fee(1) | 26,000,000 | 2.60 | % | 26,000,000 | 2.02 | % | ||||||||||
| Additional Underwriting Expenses(2)(3) | 956,234 | 0.10 | % | 956,234 | 0.07 | % | ||||||||||
| Issuer Organization and Offering Costs(3)(4) | 16,019,306 | 1.60 | % | 16,019,306 | 1.25 | % | ||||||||||
| Acquisition Fees(5) | 25,430,942 | 2.54 | % | 32,555,942 | 2.53 | % | ||||||||||
| Acquisition Expenses(5) | 2,655,000 | 0.27 | % | 3,510,000 | 0.27 | % | ||||||||||
| Amount Available for Investment | $ | 858,938,518 | 85.89 | % | $ | 1,135,958,518 | 88.41 | % | ||||||||
| (1) | No selling commissions or dealer manager fees are payable on shares sold under the distribution reinvestment plan. | |
| (2) | Includes: (a) amounts used to reimburse our dealer manager for actual costs incurred by its FINRA-registered personnel for travel, meals and lodging to attend retail seminars sponsored by participating broker-dealers; (b) sponsorship fees for seminars sponsored by participating broker-dealers; (c) amounts used to reimburse broker-dealers, including our dealer manager, for the actual costs incurred by their FINRA-registered personnel for travel, meals and lodging in connection with attendingbona fide training and education meetings hosted by our advisor or its affiliates; (d) legal fees allocated to our dealer manager; and (e) certain promotional items. The maximum amount of underwriting compensation that we may pay in connection with this offering is 10.0% of gross proceeds of our primary offering. See “Plan of Distribution.” | |
| (3) | Our advisor or its affiliates may advance, and we will reimburse, underwriting expenses (other than selling commissions and the dealer manager fee) and issuer organization and offering costs incurred on our behalf, but only to the extent that such reimbursements do not exceed actual expenses incurred by our advisor or its affiliates and would not cause the cumulative selling commissions, dealer manager fee, additional underwriting expenses and issuer organization and offering expenses paid by us to exceed 15.0% of the gross proceeds of our primary offering as of the date of the reimbursement. | |
| (4) | Includes all issuer organization and offering expenses to be paid by us in connection with the offering, including our legal, accounting, printing, mailing, technology, filing fees, charges of our escrow agent and transfer agent, charges of our advisor for administrative services related to the issuance of shares in the offering and amounts to reimburse costs in connection with preparing supplemental sales materials and reimbursements for actual costs incurred for travel, meals and lodging by employees of our advisor and its affiliates to attend retail seminars hosted by broker-dealers orbona fide training and education meetings hosted by our advisor or its affiliates. We expect that our issuer organization and offering expenses will represent a lower percentage of the gross proceeds of our primary offering as the amount of proceeds we raise in the primary offering increases. In the table above, we have assumed that all issuer organization and offering expenses will constitute approximately 1.6% of gross proceeds from our primary offering if we raise the maximum offering amount. | |
| (5) | For purposes of this table, we have assumed that no debt financing is used to acquire properties or other investments. However, we intend to leverage our investments with debt. As of February 25, 2013, we had incurred approximately $3,755,331 in acquisition fees. The estimated acquisition fees to be paid if we sell the Maximum Offering Amount represents the acquisition fees incurred as of February 25, 2013, plus the estimated amount of acquisition fees to be incurred on the remaining proceeds of this Offering. |
| 5 |
Update of Multifamily Market Overview
The Multifamily Market Overview contained in the prospectus is hereby replaced in its entirety with the following:
MULTIFAMILY MARKET OVERVIEW
General
The multifamily market is large and growing. According to US Census data provided by the National Multi Housing Council (“NMHC”), there were approximately 17.8 million apartment residences (in structures with 5 or more units) in the United States in 2012 with a value of approximately $2.2 trillion, compared to 15 million apartment units in 1990 with an estimated value of $585 billion.
According to the NMHC, renters could make up one-half of all new households this decade comprising upwards of 7 million new renter households. Changes in population growth, demographics, societal preferences, environmental concerns, mobility, flexibility, and convenience are creating unprecedented demand for apartments. The NMHC cites apartments as both an economically smart choice for communities and households and an environmentally sustainable choice.
According to the Joint Center for Housing Studies of Harvard University State of the Nation’s Housing 2012 report (the “JCHS Harvard Report”), the rental market continues to be the bright spot in the housing sector. The number of renters surged by 5.1 million in the 2000s, the largest decade-long increase in the postwar era. In addition, rental markets have yet to benefit fully from the presence of the large-scale echo-boom generation. The JCHS Harvard Report posits that once the economy recovers and the echo boomers increasingly strike out on their own, rental markets will receive another significant lift. The growth in renter households is being driven by several groups including the traditional source of young, minority, and lower-income households, but also non-traditional groups such as middle-aged, white, married, and moderate income groups. In addition, this shift is also being driven by two underlying trends: 1) the rising number of renters who have deferred purchasing a home, and 2) the rising number of owners who have switched back to renting. The number of rental households climbed by 1 million in 2011 alone, the largest annual increase since the early 1980s. This increase was fueled to a great extent by 25-34 year olds.

Source: U.S. Census Bureau, John Burns Real Estate Consulting, 2012
| 6 |
The increase in rental households continues to be supported by declines in the homeownership rate. The JCHS Harvard Report notes that the 65.4% homeownership rate for the fourth quarter of 2012 is the lowest level since the first quarter of 1997 and that the persistent decline reflects both the high level of foreclosures and the slowdown of households moving into homeownership. It also concludes that with upward of two million foreclosures still in process and a rising number of households choosing to rent, further declines in the homeownership rate lie ahead. Tight credit conditions amid uncertainty in the mortgage market are dampening the recovery in the housing market.
Apartments serve the lifestyle needs of a diverse group of community residents. With a relatively low cost per resident ratio due to their high density nature, apartments are better able to provide the amenities that attract upper income households. Many households are drawn to the lack of maintenance and ability to relocate inexpensively that multifamily housing provides. Using well planned designs and monitoring systems, apartments are also able to provide security and crime prevention for their residents. Finally, an apartment property’s proximity to employment centers, public transportation and other neighborhood services offers renters a location advantage not available in single-family developments.
According to Morgan Stanley’s Housing Market Insight report in July 2011 (the “Morgan Stanley Report”), “the combination of falling home prices, limited mortgage credit, continued liquidations, and better rental options is fundamentally changing the way Americans live.” Several key factors may in fact make it even harder to buy a home including mortgage reform, continued home price declines and long workout periods for distressed homes. The Morgan Stanley Report concludes that this change is only beginning and the U.S. will become a renter society for many years to come.
The JCHS Harvard Report concludes that barring a dramatic bounce back in homeownership, renter household growth should remain strong for some time. In the near term, larger shares of younger households are opting to rent while foreclosures are forcing many older households out of homeownership and into the rental market. But even as the economic recovery gains traction and homeownership rates level off, rental demand should get a boost from higher household formations among the echo boomers.
Employment/Household Formation Forecast
After growing from 2003-2007, U.S. non-farm employment declined in 2008 and 2009 during the Great Recession. 2010 saw a reversal of this trend with 1,022,000 net new jobs added. Further, the economy added approximately 2 million net new jobs in both 2011 and 2012. As the U.S. approaches a more stabilized economic recovery, job growth is expected to increase. The Bureau of Labor Statistics estimates 0.7% annual job growth through 2020 resulting in 20.5 million new jobs.
The improvement in employment growth is expected to facilitate new household creation. According to US Census data, the number of U.S. households experienced a rare decline in 2008 due to significant “doubling-up” and adult-aged children moving in with their parents. However, 2010 marked a major reversal as more households were formed than in any year since 2005. Long-term household growth is expected to accelerate due to trends in population growth and immigration, including future household formations by echo boomers. The chart below shows historical data and 5 year projections of this age group (“Echo Boomer Renter Population”).
Demand for multifamily is highly correlated to job and household growth. According to Axiometrics, a leading multifamily research firm, for every 1,000 jobs created there is net new demand for up to 177 apartment units. The chart below, from Property and Portfolio Research, illustrates this correlation.
| 7 |

Source: Property and Portfolio Research
Job creation is also likely to spur apartment demand due to pent-up demand emanating from recession conditions. According to Ron Witten, founder of apartment market advisory firm, Witten Advisors, pent-up demand for apartments could total 500,000 units. Witten’s estimates are based on the hiccup rate in household formations during the recession, a shortfall which he estimates at about 1.7 million households. During the recession, the number of households under the age of 35 declined despite a rise in the number of people in that age bracket. This “doubling up” phenomenon referenced above was the source of the pent-up demand.
Further, the multifamily market is subject to the basic forces of supply and demand as outlined below:
Demand Overview
Demographic forces are indicating strong growth for multifamily demand in the foreseeable future due to a variety of factors, including the following:
| • | Increasing Number of Echo Boomers. According to the JCHS Harvard Report, at 84.7 million strong, the echo boomer generation is already larger than the baby-boomer generation at similar ages and is likely to grow even larger as new immigrants arrive. The oldest of the echo boomers, who turned 25 in 2010, are only now beginning to form their own households. This large cohort will be the primary driver of new household formations over the next two decades. |
| 8 |
Echo Boomer Renter Population

| Source: Marcus and Millichap, 2012 National Apartment Market Report ** Projections |
| • | Propensity of Echo Boomers to Rent Longer. In their US Real Estate Strategic Outlook, RREEF, a leading institutional asset management firm, indicates that echo boomers have “less of a propensity for homeownership than previous generations.” Thus, as they become renters, they are likely to remain renters much longer than previous generations, thereby increasing the overall rate of renter households. According to the NMHC, since more young adult households are renting and postponing buying homes, it is expected that rental demand will surge in the coming decade as more echo boomers enter the workforce and seek places to live. Growing economic insecurity regarding employment prospects, the need to adapt to the fast-paced knowledge-based economy, and the freedom to pursue economic opportunities wherever they present themselves also provide demand for the relatively short-term financial obligations of renting. | ||
| • | Increase in Baby Boomer Decision to Rent vs. Purchase. The NMHC also projects that additional demand for apartments will be generated by the baby boomers. As the echo boomer children leave home, their empty nester parents are also expected to become renters, as they seek to simplify their lifestyle, reduce home maintenance obligations and shed home ownership chores. |
| • | Immigration. According to projections developed by the Pew Research Center in a February 2008 report titled U.S. Population Projections: 2005-2050, 82% of the population increase from 2005-2050, which is approximately 117 million people, will be from immigrants and their U.S.-born descendants. 67 million will be the immigrants themselves and 50 million will be their U.S. born children and grandchildren. According to a November 2007 report by Marcus and Millichap’s National Multi-Housing Group entitled “Multifamily Investment: the Continued Case for Optimism,” approximately 85% of immigrants are expected to rent, compared with 32% of U.S. residents overall. In addition, immigrants on average rent apartments for about eight to ten years, a much longer period than non-immigrants. |
| 9 |
| • | Home Ownership Crisis. The resilient fundamentals of the national apartment market are being further bolstered by the rapidly growing number of individuals losing their homes in foreclosure or being forced to sell because they can no longer afford their mortgages. According to a report by RealtyTrac, Inc., a third-party company that maintains one of the largest foreclosure activity databases for the U.S., foreclosure filings for 1.84 million U.S. properties were reported in 2012. It is expected that many of these individuals will enter the renter market as “renters-by-necessity” and will stay renters for the foreseeable future. Additionally, the number of renters exiting apartments to purchase single-family homes has decreased dramatically as loans for first-time home buyers become increasingly scarce and qualifying standards become increasingly challenging. Diminishing home equity values have also quelled the desire of renters to purchase single-family homes. Further, according to John Burns Real Estate Consulting, the U.S. homeownership rate is projected to continue falling to 62.1% by 2015. The average household includes more than two people meaning roughly 8 million extra residents could be moving into rentals over the next four years. |
Percentage of U.S. Homeownership

Source: U.S. Census Bureau, John Burns Real Estate Consulting
| • | Change in Demographics of Typical Households. A demographic shakeup in the traditional American household will also likely boost apartment demand. According to the NMHC, in 1955, married couples with children made up 44% of all households. Today, they constitute just 20% and the rate continues to decline. In fact, the NMHC projects 86% of household growth between 2000 and 2040 will be those without children. They also project the fastest growing population segments in the next decade to be young adults in their 20s and empty nesters in their 50s, those most likely to seek options other than single family homes. | |
| • | Increased Population. By 2025, the U.S. will have over 41 million more people than in 2012 according to the U.S. Census Bureau. |
Supply Overview
Projections of additions to supply in the short-term are generally based on permitting and construction activity, while longer term projections are based on economics, construction cost, land availability and demand.
| 10 |
Research from the National Association of Real Estate Investment Trusts (NAREIT) analysis shows that construction of multifamily units plunged to a nearly 20-year low during the Great Recession, creating a supply shortfall.
United States Census Bureau data indicate that in 2011 multifamily construction began on 167,300 units in buildings with five or more units, up from 97,300 in 2009. In 2012, multifamily starts increased to 233,400 for those same building types. While multifamily construction has been increasing, it is still below the roughly 340,000 starts averaged each year in the decade prior to the downturn. Further, according to data from the U.S. Census Bureau, U.S. multifamily starts have a shortfall of approximately 500,000 units from 2008-2011 compared to the 2000-2008 average. The NMHC projects that the U.S. will need approximately 300,000 units constructed each year moving forward while 2011 only delivered 129,900 units and 2012 only delivered 158,100 units.
Supply: Multifamily Construction near 20-Year Lows
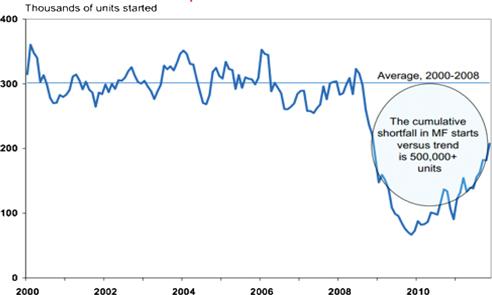
Source: U.S. Census Bureau data.
Supply-Demand Imbalance
NAREIT concludes that a dearth of new apartment construction coupled with a record level of pent-up demand for apartment space has created an approximately 2.5 million unit supply-demand imbalance in apartment inventory. Further, NAREIT reports that it will take several years to bring enough new apartment stock to the market to meet the pent-up demand. It estimates that the 2.5 million unit imbalance is comprised of 2 million households in pent-up demand and a 500,000 unit shortfall that would have had to exist just to meet normal population growth over the last 4 years. For example, during 2011-12, an average of only 144,000 new multifamily units were completed versus the prior 10-year average of approximately 300,000 annually (source: U.S. Census Bureau).
Data from REIS, Inc. a leading commercial real estate research firm, confirms the U.S. is experiencing a supply-demand imbalance as a result of the increased demand and lack of construction which the Company expects will maintain high occupancy levels, increase rental rates, and potentially drive increasing values for apartment holdings. Specifically, REIS, Inc. shows a fourth quarter 2012 national vacancy rate of 4.5% and projects that rate to decline to 4.3% in 2013 and remain below 5% through 2017. REIS also projects new multifamily completions of 648,440 units from 2013-2017, and net absorption of 598,420 units during the same time period.
| 11 |

Source: REIS, Inc., Q4 2012
Update of Investment Strategy, Objectives and Policies
The Our Target Portfolio subsection in the Investment Strategy, Objectives and Policies section contained in the prospectus is hereby replaced in its entirety with the following:
Our Target Portfolio
We intend to achieve our investment objectives by acquiring a diverse portfolio of real estate investments. We plan to diversify our portfolio by investment type, size, property location and risk with the goal of attaining a portfolio that will generate attractive returns for our investors with the potential for capital appreciation, including opportunities that we believe may result in a 1.5x to 2.5x (i.e., 50% to 150%) return on initial equity investment. Our targeted portfolio allocation is as follows:
| · | Class A Multifamily Allocation. The Company intends to allocate approximately 55% of its portfolio to investments in acquiring and developing well-located, primarily Class A apartment properties with strong and stable cash flows, typically located in our demographically attractive target regions with relatively high expectations of rent growth. As appropriate, the Company intends to implement the advisor’s property enhancement strategy (now referred to as its “Value Creation” strategy) at these properties. This category of investments previously represented 50% of the Company’s target investment allocation. |
| · | Value Added Residential Allocation. The Company also intends to allocate approximately 45% of its portfolio to investments in well-located residential properties that offer a significant potential for short-term capital appreciation through repositioning, renovation or redevelopment. In addition, the Company will seek to acquire properties available at opportunistic prices from distressed or time-constrained sellers in need of liquidity. As appropriate, the Company intends to implement the advisor’s Value Creation strategy at these properties as well. This category of investments previously represented 30% of the Company’s target investment allocation. |
| 12 |
| · | No Real Estate-Related Investments Allocation. The Company no longer intends to invest in real estate-related investments, such as first and second mortgages, subordinated, bridge and other loans, debt and other securities related to or secured by real estate assets, and common and preferred equity, including securities of other REITs and real estate companies. This category of investments previously represented 20% of the Company’s target investment allocation. Excluded from this group are joint venture investments in which the Company exercises some control. |
Although the above outlines our target portfolio, we may make adjustments based on, among other things, prevailing real estate market conditions and the availability of attractive investment opportunities. We will not forego an attractive investment because it does not fit within our targeted asset class or portfolio composition. We may use the proceeds of this offering to purchase or invest in any type of real estate which we determine is in the best interest of our stockholders, subject to the provisions of our charter which limit certain types of investments.
We believe the probability of meeting our investment objectives will be maximized through the careful selection and underwriting of assets. When considering an investment, we will generally evaluate the following:
| • | the performance and risk characteristics of that investment; |
| • | how that investment will fit within our target portfolio objectives; and |
| • | the expected returns of that investment on a risk-adjusted basis, relative to other investment alternatives. |
As such, our actual portfolio composition may vary substantially from the target portfolio described above.
We will typically hold fee title or a long-term leasehold estate in the properties we acquire through our joint ventures. However, subject to any required approvals and maintaining our qualification as a REIT, we may also invest in or acquire entities that own and operate assets that meet our investment objectives. We will consider doing so if we believe it more efficient to acquire an entity that already owns assets meeting our investment objectives than to acquire such assets directly. Also, we may enter into one or more joint ventures, tenant-in-common investments or other co-ownership arrangements for the acquisition, development or improvement of properties with third parties or affiliates of our advisor, including other present and future real estate programs sponsored by affiliates of our advisor.
The Our Target Markets subsection in the Investment Strategy, Objectives and Policies section contained in the prospectus is hereby deleted in its entirety and replaced with the following:
Focused Target Regions
Although we intend to diversify our portfolio by geographic location, we expect to focus on four demographically attractive regions which we believe provide high potential for attractive returns. These regions include: Florida/Georgia; Tennessee; North/South Carolina; and Texas. Within these states, we will seek to focus on submarkets where our sponsor’s regional partners, or Bluerock Regional Partners, have established relationships, transaction history, market knowledge and potential access to ‘‘off-market’’ investments, as well as an ability to direct property management and leasing operations efficiently. Our preferred target markets have the following distinct characteristics:
| · | Strong Economic Drivers. Economic base characterized by growth industries and jobs of the future such as health care and technology leading to short and long-term employment growth, relatively low housing affordability, and low rent to income ratios allowing for significant future rent increases. |
| · | Favorable Business Climate. Regulatory conditions that attract, retain, and foster job growth and new business development including lower tax rates and right to work states. |
| · | Robust Infrastructure. Key fixtures such as technology centers, major colleges and universities, and modern transportation facilities and networks. |
| 13 |
| · | Renter Demographics. The presence of a young, educated workforce with a high population of renters by choice. |
| · | High Quality of Life. Areas with abundant recreation, leisure, cultural, and entertainment options and plentiful social opportunities including ample recreation, open space, vibrant downtowns, which foster population retention and growth. |
We will review and may periodically adjust our target markets in response to changing market conditions and to maintain a diverse portfolio. Our initial target cities are reflected in the map below:

Economic and real estate market conditions vary widely within each region and submarket, and we intend to spread our portfolio investments both across these regions and among the submarkets within these regions.
A new Exit Strategy subsection is added to the Investment Strategy, Objectives and Policies section contained in the prospectus as follows:
Exit Strategy
We intend to pursue a transaction providing liquidity for our stockholders within a shorter period of time after the completion of our offering stage, which includes our follow-on offering. We believe building a focused portfolio in our target regions could make us an attractive acquisition target for a number of institutional investors, including several publicly traded REITs which have significant footprints in such regions. We will explore the sale of our assets as a focused portfolio, which we believe could maximize value for our stockholders by capturing a portfolio premium. In addition, we will explore a portfolio sale of our assets to a public REIT, which may allow us to capture a public market premium that exists when such REITs are trading above their net asset values.
| 14 |
The Investments in and Originating Real Estate-Related Investments subsection in the Investment Strategy, Objectives and Policies section contained in the prospectus is hereby deleted in its entirety and replaced with the following:
Investments in and Originating Real Estate-Related Investments
We do not intend to invest in or originate first and second mortgages, subordinated, bridge and other real estate-related loans, debt securities related to or secured by real estate assets, or common and preferred equity securities, including equity securities of other REITs or real estate companies. Excluded from this category are joint venture investments in which we exercise some control. Although we do not intend to make such investments, our charter does not limit the amount of gross offering proceeds that we may apply to loan investments. Our charter also does not place any limit or restriction on the percentage of our assets that may be invested in any type of loan or in any single loan, or the types of properties subject to mortgages or other loans in which we could invest.
The Network of Operating Partners subsection in the Investment Strategy, Objectives and Policies section contained in the prospectus is hereby amended by adding the following in front of the existing disclosure in that section:
We will invest primarily through joint ventures with Bluerock Regional Partners. Bluerock Regional Partners are generally leading regional apartment owner / operators that bring extensive ‘insider knowledge’ and a track record of success in markets in our target regions, and which invest capital alongside us as ‘skin in the game’. Notwithstanding the investments of Bluerock Regional Partners, we expect to maintain substantial control over strategic decision-making in these ventures.
Our joint venture strategy allows us to draw on the collective market knowledge, including potentially proprietary deal flow of some of the leading apartment owner / operators in the nation, which we believe will enable us to generate above market returns on our investment. Each Bluerock Regional Partner, as part of their ongoing business, is actively involved in the process of utilizing its network of deal flow and knowledge of the region to access, select and underwrite what they believe are the most attractive deals available to them. As part of the acquisition process, Bluerock performs its own review and underwriting of select deals in the various regions, and compares their risk / reward characteristics across Bluerock Regional Partners to then choose the most appropriate opportunities for our company. We believe that our investors should benefit from this “double underwriting” process which is designed to further mitigate risk through expert local knowledge, along with comparison of opportunities across multiple regions.
To date, Bluerock Regional Partners have included some of the leading apartment owner/operators in the nation, including:
| · | Archstone is one of the country’s preeminent apartment managers, owners and developers and is ranked the 8th largest apartment manager in the United States by the National Multi-Housing Counsel, with approximately 78,000 units under management and acquisitions totaling more than $16 billion since 1995. |
| · | Bell Partners is a diversified real estate investment and management company. Investing capital on behalf of individual and institutional investors. Bell is ranked as the 10th largest apartment manager in the United States by the National Multi-Housing Counsel, with approximately 65,000 units under management and with a portfolio valued at more than $5 billion. |
| · | Village Green is an award-winning, national manager of multifamily residential communities. They rank as the 28th largest apartment manager in the United States by the National Multi-Housing Counsel, with 39,500 units under management. |
| · | The Lynd Company is ranked as the 34th largest national apartment manager in the United States by the National Multi-Housing Counsel, with approximately 33,000 units under management and over $1 billion in multifamily investments. |
| 15 |
All rankings provided by the National Multi Housing Council, 2012.
Bluerock Regional Partners currently provide access to more than 150 markets in 28 states with more than 235,000 units under management, including more than 88,000 units under management within our Focused Target Regions.
The Borrowing Policies subsection of the section of the prospectus entitled “Investment Strategy, Objectives and Policies” is amended to add the following disclosure:
Amendment of Our Working Capital Line of Credit
On October 2, 2012, the Company entered into a working capital line of credit provided by Bluerock Special Opportunity + Income Fund II, LLC (“SOIF II”) and Bluerock Special Opportunity + Income Fund III, LLC (“SOIF III,” and together with SOIF II, the “SOIFs”), pursuant to which the Company may borrow up to $12.5 million (such amount, the “Commitment Amount,” and such line of credit, the “SOIF LOC”). The SOIF LOC had an initial term of six (6) months (the “Initial Term”), an initial maturity date of April 2, 2013 (the “Maturity Date”), and was prepayable without penalty. The SOIF LOC was to bear interest compounding monthly at a rate of 30-day LIBOR + 6.00%, subject to a minimum rate of 7.50%, annualized for three months, and thereafter to bear interest compounding monthly at a rate of 30-day LIBOR + 6.00%, subject to a minimum rate of 8.50% for the remainder of the Initial Term. Interest on the SOIF LOC is paid on a current basis from cash flow distributed to the Company from its real estate assets, and is secured by a pledge of the Company’s unencumbered real estate assets, including those of its wholly owned subsidiaries.
Pursuant to the terms of the SOIF LOC, the Company is entitled to extend the Maturity Date in its sole and absolute discretion, with at least five (5) days’ prior written notice to the SOIFs, for an additional six (6) month period upon the same interest rate as provided in the SOIF LOC, but based upon the 30-Day LIBOR Rate available April 2, 2013.
On March 4, 2013, the Company and the SOIFs agreed to amend the SOIF LOC, to increase the Commitment Amount from $12.5 million to $13.5 million, and to extend the Initial Term by six (6) months to October 2, 2013 (such amendment, the “SOIF LOC Amendment”). All other terms of the SOIF LOC remain unchanged and as previously disclosed in the Company’s Current Report on Form 8-K filed with the Securities and Exchange Commission on October 9, 2012.
In accordance with the requirements of the Company’s charter, the SOIF LOC Amendment was reviewed and approved by a majority of the Board of Directors (including a majority of the independent directors) as being fair, competitive, and commercially reasonable and no less favorable to the Company than loans between unaffiliated parties under the same circumstances. As of March 5, 2013 (unaudited), the Company had a balance on the SOIF LOC of $11,879,018.
| 16 |
The Our Executive Officers and Directors subsection of the prospectus entitled “Management” is amended to add the following biography:
Randy I. Anderson, Chief Executive Officer. Dr. Anderson serves as our Chief Executive Officer and the Chief Executive Officer of our advisor, beginning February 2013. Dr. Anderson also serves as the President of Bluerock Real Estate, L.L.C., which he joined in April 2012. Previously, Dr. Anderson was a founding partner of Franklin Square Capital Partners, which is a sponsor of alternative investment products, from March 2007 to December 2009. Prior to Franklin Square, Dr. Anderson served as the Chief Economist and a Division President for CNL Real Estate Advisors, which is a private investment management firm providing global real estate and alternative investment opportunities, from June 2005 to March 2007, as the Chief Economist and Director of Research for the Marcus and Millichap Company, which is a national commercial real estate brokerage firm specializing in real estate investment services, from June 2002 to June 2005 where he served on the Investment Committee, and as Vice President of Research at Prudential Real Estate Advisors, which is the real estate investment management business of Prudential Financial, Inc., from January 2001 to June 2002. Dr. Anderson also served as the Howard Phillips Eminent Scholar Chair and Professor of Real Estate at the University of Central Florida where he directs the research and education institute until December 2012. He is the current editor of the Journal of Real Estate Portfolio Management, was awarded the Counselors of Real Estate designation, named a Kinnard Young Scholar by the American Real Estate Society, and named both a NAIOP Research Foundation Distinguished Fellow and a Homer Hoyt Institute Fellow. Dr. Anderson received his B.A. degree in Finance from North Central College in 1991 as a Presidential Scholar and holds a Ph.D. in Finance as a Presidential Fellow from the University of Alabama, where he graduated with highest distinction in 1996.
The Advisory Agreement subsection of the section of the prospectus entitled “Management” is amended to add the following disclosure:
Amendment of Advisory Agreement
On February 26, 2013, pursuant to a resolution approved by the Company’s Board of Directors, including its independent directors, the Company and the Company’s advisor agreed to amend the Second Amended and Restated Advisory Agreement (the “Amended Advisory Agreement”) to eliminate the payment of any internalization fee or origination fees in connection with investments in loans, payable to the advisor.
Pursuant to the terms of the Amended Advisory Agreement, the Company was required to pay consideration to the advisor, based on the valuation of the advisor as determined by an independent investment banking firm (the “Internalization Fee”), in the event the Company elected to become a self-administered REIT by merging with the advisor so as to internalize the management functions performed by the advisor. Upon the recommendation of the advisor, the Company and the advisor agreed that it was in the best interests of the Company and its investors to eliminate the payment of the Internalization Fee.
Pursuant to the terms of the Amended Advisory Agreement, an origination fee (the “Origination Fee”) was to be paid by the Company to the advisor as compensation for the advisor’s investigation, selection, sourcing, due diligence and acquisition or origination of real estate-related loans. The Origination Fee for each such acquisition or origination was to be equal to 1.75% of the greater of (i) the amount funded by the Company to originate each real estate-related loan, or (ii) the purchase price of any real estate-related loan that the Company acquired, including third-party expenses. The Company no longer intends to invest in or originate real estate-related loans, and therefore the Company and the advisor have agreed to amend the Amended Advisory Agreement to reflect that no Origination Fee is payable by the Company to the advisor.
| 17 |
The tables set forth in the sections of the prospectus entitled “Compensation to Our Advisor and Its Affiliates” in the Prospectus Summary and “Management Compensation” are amended to reflect the removal of the origination fee.
| Estimated Amount if | |||||
| Description of Fee | Calculation of Fee | Maximum Sold | |||
| Acquisition and Development Stage | |||||
| Acquisition Fees | For its services in connection with the selection, due diligence and acquisition of a property or investment, our advisor will receive an acquisition fee equal to 2.50% of the purchase price. The purchase price of a property or investment shall equal the amount paid or allocated to the purchase, development, construction or improvement of a property, inclusive of expenses related thereto, and the amount of debt associated with such real property or investment. The purchase price allocable for a joint venture investment shall equal the product of (1) the purchase price of the underlying property and (2) our ownership percentage in, or percentage of capital provided to, the joint venture.
| $32,555,942 (assuming no debt)/ $118,957,777 (assuming leverage of 75% of cost). | |||
Operating Stage
| |||||
| Reimbursable Expenses | We reimburse our advisor or its affiliates for all reasonable and actually incurred expenses in connection with the services provided to us, including related personnel, rent, utilities and information technology costs. We will not reimburse for personnel costs in connection with services for which our advisor receives acquisition, asset management or disposition fees.
| Actual amounts to be paid depend upon expenses paid or incurred and therefore cannot be determined now.
| |||
| 18 |