Table of Contents
☐ | REGISTRATION STATEMENT PURSUANT TO SECTION 12(b) OR (g) OF THE SECURITIES EXCHANGE ACT OF 1934 |
☒ | ANNUAL REPORT PURSUANT TO SECTION 13 OR 15(d) OF THE SECURITIES EXCHANGE ACT OF 1934 |
☐ | TRANSITION REPORT PURSUANT TO SECTION 13 OR 15(d) OF THE SECURITIES EXCHANGE ACT OF 1934 |
☐ | SHELL COMPANY REPORT PURSUANT TO SECTION 13 OR 15(d) OF THE SECURITIES EXCHANGE ACT OF 1934 |
Title of each class | Trading Symbol(s) | Name of each exchange on which registered | ||
American Depositary Shares, each representing one share of Common Stock | KB | New York Stock Exchange | ||
| Common Stock, par value ₩5,000 per share | KB | New York Stock Exchange * |
☐ U.S. GAAP | ☒ International Financial Reporting Standards as issued by the International Accounting Standards Board | ☐ | Other |
| Auditor Name: KPMG Samjong Accounting Corp. | Auditor Location: Seoul, Korea | Auditor Firm ID: 01357 |
Table of Contents
TABLE OF CONTENTS
| PRESENTATION OF FINANCIAL AND OTHER INFORMATION | 1 | |||||||
| FORWARD-LOOKING STATEMENTS | 2 | |||||||
Item 1. | 3 | |||||||
Item 2. | 3 | |||||||
Item 3. | 3 | |||||||
Item 3.A. | 3 | |||||||
Item 3.B. | 3 | |||||||
Item 3.C. | 3 | |||||||
Item 3.D. | 3 | |||||||
Item 4. | 32 | |||||||
Item 4.A. | 33 | |||||||
Item 4.B. | 34 | |||||||
Item 4.C. | 106 | |||||||
Item 4.D. | 108 | |||||||
Item 4A. | 109 | |||||||
Item 5. | 109 | |||||||
Item 5.A. | 109 | |||||||
Item 5.B. | 146 | |||||||
Item 5.C. | 151 | |||||||
Item 5.D. | 151 | |||||||
Item 5.E. | 151 | |||||||
Item 6. | 151 | |||||||
Item 6.A. | 151 | |||||||
Item 6.B. | 158 | |||||||
Item 6.C. | 159 | |||||||
Item 6.D. | 161 | |||||||
Item 6.E. | 162 | |||||||
Item 6.F. | Disclosure of a Registrant’s Action to Recover Erroneously Awarded Compensation | 164 | ||||||
Item 7. | 164 | |||||||
Item 7.A. | 164 | |||||||
Item 7.B. | 164 | |||||||
Item 7.C. | 165 | |||||||
Item 8. | 165 | |||||||
Item 8.A. | 165 | |||||||
Item 8.B. | 172 | |||||||
i
Table of Contents
Item 9. | 172 | |||||||
Item 9.A. | 172 | |||||||
Item 9.B. | 174 | |||||||
Item 9.C. | 175 | |||||||
Item 9.D. | 175 | |||||||
Item 9.E. | 175 | |||||||
Item 9.F. | 175 | |||||||
Item 10. | 175 | |||||||
Item 10.A. | 175 | |||||||
Item 10.B. | 175 | |||||||
Item 10.C. | 182 | |||||||
Item 10.D. | 182 | |||||||
Item 10.E. | 183 | |||||||
Item 10.F. | 189 | |||||||
Item 10.G. | 189 | |||||||
Item 10.H. | 189 | |||||||
Item 10.I. | 189 | |||||||
Item 10.J. | 189 | |||||||
Item 11. | 189 | |||||||
Item 12. | 211 | |||||||
Item 13. | 212 | |||||||
Item 14. | MATERIAL MODIFICATIONS TO THE RIGHTS OF SECURITY HOLDERS AND USE OF PROCEEDS | 212 | ||||||
Item 15. | 212 | |||||||
Item 16. | 213 | |||||||
Item 16A. | 213 | |||||||
Item 16B. | 213 | |||||||
Item 16C. | 214 | |||||||
Item 16D. | EXEMPTIONS FROM THE LISTING STANDARDS FOR AUDIT COMMITTEES | 214 | ||||||
Item 16E. | PURCHASE OF EQUITY SECURITIES BY THE ISSUER AND AFFILIATED PURCHASERS | 215 | ||||||
Item 16F. | CHANGE IN REGISTRANT’S CERTIFYING ACCOUNTANT | 215 | ||||||
Item 16G. | 216 | |||||||
Item 16H. | 217 | |||||||
Item 16I. | DISCLOSURE REGARDING FOREIGN JURISDICTIONS THAT PREVENT INSPECTIONS | 217 | ||||||
ii
Table of Contents
Table of Contents
PRESENTATION OF FINANCIAL AND OTHER INFORMATION
The financial statements included in this annual report are prepared in accordance with International Financial Reporting Standards, or IFRS, as issued by the International Accounting Standards Board, or IASB. As such, we make an explicit and unreserved statement of compliance with IFRS as issued by the IASB with respect to our consolidated financial statements as of December 31, 2021 and 2022 and for the years ended December 31, 2020, 2021 and 2022 included in this annual report. Unless indicated otherwise, the financial information in this annual report as of and for the years ended December 31, 2020, 2021 and 2022 has been prepared in accordance with IFRS as issued by the IASB, which is not comparable to information prepared in accordance with generally accepted accounting principles in the United States, or U.S. GAAP.
Unless expressly stated otherwise, all financial data included in this annual report are presented on a consolidated basis.
In this annual report:
| • | references to “we,” “us” or “KB Financial Group” are to KB Financial Group Inc. and, unless the context otherwise requires, its subsidiaries; |
| • | references to “Korea” are to the Republic of Korea; |
| • | references to the “government” are to the government of the Republic of Korea; |
| • | references to “Won” or “₩” are to the currency of Korea; and |
| • | references to “U.S. dollars,” “$” or “US$” are to United States dollars. |
Discrepancies between totals and the sums of the amounts contained in any table may be a result of rounding.
For your convenience, this annual report contains translations of Won amounts into U.S. dollars at the noon buying rate of the Federal Reserve Bank of New York for Won in effect on December 31, 2022, which was ₩1,260.2 = US$1.00.
1
Table of Contents
FORWARD-LOOKING STATEMENTS
The U.S. Securities and Exchange Commission encourages companies to disclose forward-looking information so that investors can better understand a company’s future prospects and make informed investment decisions. This annual report contains forward-looking statements.
Words and phrases such as “aim,” “anticipate,” “assume,” “believe,” “contemplate,” “continue,” “estimate,” “expect,” “future,” “goal,” “intend,” “may,” “objective,” “plan,” “positioned,” “predict,” “project,” “risk,” “seek to,” “shall,” “should,” “will likely result,” “will pursue,” “plan” and words and terms of similar substance used in connection with any discussion of future operating or financial performance or our expectations, plans, projections or business prospects identify forward-looking statements. In particular, the statements under the headings “Item 3.D. Risk Factors,” “Item 5. Operating and Financial Review and Prospects” and “Item 4.B. Business Overview” regarding our financial condition and other future events or prospects are forward-looking statements. All forward-looking statements are management’s present expectations of future events and are subject to a number of factors and uncertainties that could cause actual results to differ materially from those described in the forward-looking statements.
In addition to the risks related to our business discussed under “Item 3.D. Risk Factors,” other factors could cause actual results to differ materially from those described in the forward-looking statements. These factors include, but are not limited to:
| • | our ability to successfully implement our strategy; |
| • | future levels of non-performing loans; |
| • | our growth and expansion; |
| • | the adequacy of allowances for credit and investment losses; |
| • | technological changes; |
| • | interest rates; |
| • | investment income; |
| • | availability of funding and liquidity; |
| • | cash flow projections; |
| • | our exposure to market risks; and |
| • | adverse market and regulatory conditions. |
By their nature, certain disclosures relating to these and other risks are only estimates and could be materially different from what actually occurs in the future. As a result, actual future gains, losses or impact on our income or results of operations could materially differ from those that have been estimated. For example, revenues could decrease, costs could increase, capital costs could increase, capital investment could be delayed and anticipated improvements in performance might not be fully realized.
In addition, other factors that could cause actual results to differ materially from those estimated by the forward-looking statements contained in this annual report could include, but are not limited to:
| • | the occurrence of severe health epidemics (including the COVID-19 pandemic) in Korea or other parts of the world; |
| • | general economic and political conditions in Korea or other countries that have an impact on our business activities or investments; |
| • | the monetary and interest rate policies of Korea; |
2
Table of Contents
| • | inflation or deflation; |
| • | unanticipated volatility in interest rates; |
| • | foreign exchange rates; |
| • | prices and yields of equity and debt securities; |
| • | the performance of the financial markets in Korea and globally; |
| • | changes in domestic and foreign laws, regulations and taxes; |
| • | changes in competition and the pricing environments in Korea; and |
| • | regional or general changes in asset valuations. |
For further discussion of the factors that could cause actual results to differ, see the discussion under “Item 3.D. Risk Factors” contained in this annual report. We caution you not to place undue reliance on the forward-looking statements, which speak only as of the date of this annual report. Except as required by law, we are not under any obligation, and expressly disclaim any obligation, to update or alter any forward-looking statements, whether as a result of new information, future events or otherwise.
All subsequent forward-looking statements attributable to us or any person acting on our behalf are expressly qualified in their entirety by the cautionary statements contained or referred to in this annual report.
| Item 1. | IDENTITY OF DIRECTORS, SENIOR MANAGEMENT AND ADVISERS |
Not applicable.
| Item 2. | OFFER STATISTICS AND EXPECTED TIMETABLE |
Not applicable.
| Item 3. | KEY INFORMATION |
| Item 3.A. | [Reserved] |
| Item 3.B. | Capitalization and Indebtedness |
Not applicable.
| Item 3.C. | Reasons for the Offer and Use of Proceeds |
Not applicable.
| Item 3.D. | Risk Factors |
Risks relating to our retail credit portfolio
Future changes in market conditions as well as other factors may lead to increases in delinquency levels of our retail loan portfolio.
For most of the recent past, consumer debt has increased significantly in Korea, although the rate of such increase has slowed in the past year due to rising interest rate levels. Our portfolio of retail loans, including mortgage and home equity loans, increased from ₩166,307 billion as of December 31, 2019 to ₩182,437 billion
3
Table of Contents
as of December 31, 2020 and ₩191,641 billion as of December 31, 2021, although it decreased to ₩186,939 billion as of December 31, 2022. As of December 31, 2022, our domestic retail loans represented 42.4% of our total lending. Within our retail loan portfolio, the outstanding balance of other consumer loans, which unlike mortgage or home equity loans are often unsecured and therefore tend to carry a higher credit risk, increased from ₩59,596 billion as of December 31, 2019 to ₩65,997 billion as of December 31, 2022; as a percentage of total outstanding retail loans, such balance decreased from 35.8% as of December 31, 2019 to 35.3% as of December 31, 2022. Our retail lending business, which generally offers higher margins than other lending activities, has contributed significantly to our interest income and profitability in recent years.
The growth of our retail loan portfolio in most of the recent past, together with fluctuating economic conditions in Korea and globally in recent years, especially in light of the COVID-19 pandemic, as well as the high level of consumer debt and rising interest rate levels, may lead to increases in delinquency levels and a deterioration in asset quality. The amount of our non-performing retail loans (defined as those loans that are past due by 90 days or more) was ₩376 billion as of December 31, 2019, ₩306 billion as of December 31, 2020, ₩259 billion as of December 31, 2021 and ₩311 billion as of December 31, 2022. Higher delinquencies in our retail loan portfolio in the future will require us to increase our loan loss provisions and charge-offs, which in turn will adversely affect our financial condition and results of operations.
Our large exposure to consumer debt means that we are exposed to changes in economic conditions affecting Korean consumers. Accordingly, economic difficulties in Korea that hurt consumers could result in a deterioration in the credit quality of our retail loan and credit card portfolios. For example, the debilitating impact of the COVID-19 pandemic on Korea’s economy has disrupted the business, activities and operations of consumers, which in turn has resulted in, and in the future could result in, a significant decrease in the number of financial transactions or the inability of our customers to meet existing payment or other obligations to us. See “Other risks relating to our business—The COVID-19 pandemic and any possible recurrence of other types of widespread infectious diseases may adversely affect our business, financial condition or results of operations.” In addition, a rise in unemployment, an increase in interest rates or a decline in real estate prices in Korea could adversely affect the ability of consumers to make payments and increase the likelihood of potential defaults, while reducing demand for retail loans and credit card spending. See “Risks relating to Korea—Unfavorable financial and economic developments in Korea may have an adverse effect on us.” Despite our efforts to minimize our risk as a result of such exposure, there is no assurance that we will be able to prevent significant credit quality deterioration in our retail loan portfolio.
In addition, we are exposed to changes in regulations and policies on retail lending by the Korean government, which may adopt measures to restrict retail lending or encourage financial institutions to provide financial support to certain types of retail borrowers. From the second half of 2016 to 2021, the Korean government introduced various measures to tighten regulations on mortgage and other lending and housing subscription in response to the rapid growth in consumer debt and concerns over speculative investments in real estate in certain areas. The Korean government has since begun to reverse some of these measures by introducing a number of policy measures that seek to sustain housing prices and activity levels in the Korean real estate market, in light of an overall decrease in housing prices over the course of 2022. A continued decrease in housing prices, together with the high level of consumer debt and higher interest rate levels, could result in declines in consumer spending and reduced economic growth, which may lead to an increase in the delinquency level of our retail loan portfolio.
Under a pre-workout program established by the Credit Counseling and Recovery Service, a public service organization that provides debt adjustment services to low-income families in Korea, a number of Korean banks, including us, have provided individual borrowers with outstanding short-term debt in default with maturity extensions and/or interest reductions since April 2009. Such borrowers must have total loans of ₩1.5 billion or less (consisting of no more than ₩500 million of unsecured loans and ₩1 billion of secured loans) from one or more financial institutions, be in arrears on their payments for more than one day but less than 90 days, and either have an income in excess of the minimum cost of living or be deemed by the Credit Counseling and Recovery
4
Table of Contents
Service to have the ability to repay their loans. In addition, in March 2015 and September 2019, in response to increasing levels of consumer debt and amid concerns over the debt-servicing capacity of retail borrowers if interest rates were to rise, the Korean government launched, and requested Korean banks to participate in, mortgage loan refinancing programs aimed at reducing the payment burden on and improving the asset quality of outstanding mortgage loans. Under such refinancing programs, qualified retail borrowers were able to convert their outstanding non-amortizing floating-rate mortgage loans from Korean commercial banks (including us) into amortizing fixed-rate mortgage loans with lower interest rates. Our participation in such refinancing programs may lead to a decrease in our interest income on our outstanding mortgage loans, as well as in our overall net interest margin. Moreover, our participation in such initiatives led by the Korean government to provide financial support to retail borrowers may lead us to offer credit terms for such borrowers that we would not generally offer, which may have an adverse effect on our results of operations and financial condition.
Our credit card operations may generate losses in the future, which could hurt our financial condition and results of operations.
With respect to our credit card portfolio, our delinquency ratio (which represents the ratio of amounts that are overdue by 30 days or more to total outstanding balances) was 1.06% as of December 31, 2020, which decreased to 0.91% as of December 31, 2021 but increased to 1.01% as of December 31, 2022. In line with industry practice, we have restructured a portion of delinquent credit card account balances (defined as balances overdue by 30 days or more) as loans. As of December 31, 2022, these restructured loans outstanding amounted to ₩117 billion. Because these loans are not treated as being delinquent at the time of conversion or for a period of time thereafter, our delinquency ratios may not fully reflect all delinquent amounts relating to our outstanding loans. Including all restructured loans, outstanding balances overdue by 30 days or more accounted for 1.4% of our credit card receivables (including credit card loans) as of December 31, 2022. Delinquencies may increase in 2023 and in the future as a result of, among other things, adverse economic conditions in Korea, increases in interest rates, additional government regulations or the inability of Korean consumers to manage increased household debt.
Despite our continuing efforts to sustain and improve our credit card asset quality and performance, we may experience increased delinquencies or deterioration of the asset quality of our credit card portfolio, which would require us to increase our loan loss provisions and charge-offs and adversely affect our overall financial condition and results of operations.
Risks relating to our small- and medium-sized enterprise loan portfolio
We have significant exposure to small- and medium-sized enterprises, and any financial difficulties experienced by these customers may result in a deterioration of our asset quality and have an adverse impact on us.
One of our core businesses is lending to small- and medium-sized enterprises (as defined under “Item 4.B. Business Overview—Corporate Banking—Small- and Medium-sized Enterprise Banking”). Our loans to small- and medium-sized enterprises increased from ₩112,487 billion as of December 31, 2019 to ₩149,068 billion as of December 31, 2022. During that period, non-performing loans (defined as those loans that are past due by 90 days or more) to small- and medium-sized enterprises decreased from ₩204 billion as of December 31, 2019 to ₩162 billion as of December 31, 2020 and ₩102 billion as of December 31, 2021, but increased to ₩123 billion as of December 31, 2022. The non-performing loan ratio for such loans decreased from 0.2% as of December 31, 2019 to 0.1% as of December 31, 2020, 2021 and 2022. However, our non-performing loans and non-performing loan ratio may increase in 2023. According to data compiled by the Financial Supervisory Service, the delinquency ratio for Won-currency loans by Korean commercial banks to small- and medium-sized enterprises was 0.3% as of December 31, 2022. The delinquency ratio for Won-currency loans to small- and medium-sized enterprise is calculated as the ratio of (1) the outstanding balance of such loans in respect of which either principal or interest payments are overdue by one month or more to (2) the aggregate outstanding balance
5
Table of Contents
of such loans. Our delinquency ratio for such Won currency loans decreased from 0.2% as of December 31, 2019 to 0.1% as of December 31, 2022. However, our delinquency ratio for such Won currency loans may increase in 2023.
The Korean government has historically introduced policies and initiatives intended to encourage Korean banks to provide financial support to small- and medium-sized enterprise borrowers. For example, the Financial Services Commission implemented a swift financial assistance program for small- and medium-sized enterprise borrowers in January 2017. Financial institutions participating in such program, including us, have provided financial assistance (including in the form of new loans, extension of maturity on existing obligations and provision of lower interest rates) to small- and medium-sized enterprise borrowers that are experiencing temporary liquidity crises but have a credit rating exceeding a certain threshold. The overall prospects for the Korean economy in 2023 and beyond remain uncertain, and the Korean government may extend or renew existing or past policies and initiatives or introduce new policies or initiatives to encourage Korean banks to provide financial support to small- and medium-sized enterprises. In particular, the COVID-19 pandemic affecting many countries worldwide, including Korea, has prompted the Korean government to implement various emergency aid initiatives involving Korean banks, including Kookmin Bank, to provide liquidity assistance to small- and medium-sized enterprise borrowers. See “Other risks relating to our business—The COVID-19 pandemic and any possible recurrence of other types of widespread infectious diseases may adversely affect our business, financial condition or results of operations.” Such initiatives include the provision of new loans to borrowers with low credit ratings, extension of maturity dates for existing loans and suspension of interest payment obligations for an extended period of time. Our participation in such government-led initiatives may lead us to extend credit to small- and medium-sized enterprise borrowers that we would not otherwise lend to, or offer terms for such credit that we would not otherwise offer, in the absence of such initiatives. Furthermore, there is no guarantee that the financial condition and liquidity position of our small- and medium-sized enterprise borrowers benefiting from such initiatives will improve sufficiently for them to service their debt on a timely basis, or at all. Accordingly, increases in our exposure to small- and medium-sized enterprise borrowers resulting from such government-led initiatives may have a material adverse effect on our financial condition and results of operations.
A substantial part of our small- and medium-sized enterprise lending comprises loans to “small office/home office” customers, or SOHOs. SOHOs, which we currently define to include sole proprietorships and individual business interests, are usually dependent on a limited number of suppliers or customers. SOHOs tend to be affected to a greater extent than larger corporate borrowers by fluctuations in the Korean economy. In addition, SOHOs often maintain less sophisticated financial records than other corporate borrowers. Although we continue to make efforts to improve our internally developed credit rating systems to rate potential borrowers, particularly with respect to SOHOs, and intend to manage our exposure to these borrowers closely in order to prevent any deterioration in the asset quality of our loans to this segment, we may not be able to do so as intended.
In addition, many small- and medium-sized enterprises have close business relationships with the largest Korean commercial conglomerates, known as “chaebols”, primarily as suppliers. Any difficulties encountered by those chaebols would likely hurt the liquidity and financial condition of related small- and medium-sized enterprises, including those to which we have exposure, also resulting in an impairment of their ability to repay loans.
In recent years, we have taken measures which sought to stem rising delinquencies in our loans to small- and medium-sized enterprises, including through strengthening of the review of loan applications and closer monitoring of the post-loan performance of small- and medium-sized enterprise borrowers in industry sectors that are relatively more sensitive to downturns in the economy and have shown higher delinquency ratios, such as shipping, construction, lodging, retail and wholesale, restaurants and real estate. Despite such efforts, however, there is no assurance that delinquency levels of our loans to small- and medium-sized enterprises will not rise in the future. In particular, financial difficulties experienced by small- and medium-sized enterprises as a result of, among other things, adverse economic conditions in Korea and globally, could have an adverse impact on the
6
Table of Contents
ability of small- and medium-sized enterprises to make payments on our loans. For example, the COVID-19 pandemic has had a significant adverse impact on the Korean and global economy, which in turn has subjected, and could continue to subject, small- and medium-sized enterprises to disruptions in supply chains, a decline in sales and/or deterioration in financial conditions. In addition, aggressive marketing and competition among banks to lend to this segment may lead to a deterioration in the asset quality of our loans to this segment in the future. Any such deterioration would result in increased charge-offs and higher provisioning and reduced interest and fee income from this segment, which would have an adverse impact on our financial condition and results of operations.
We have exposure to Korean construction, shipbuilding and shipping companies, and financial difficulties of these companies may have an adverse impact on us.
As of December 31, 2022, we had loans outstanding to construction (most of which are small- and medium-sized enterprises), shipbuilding and shipping companies in the amount of ₩5,984 billion, ₩583 billion and ₩212 billion, or 1.36%, 0.13% and 0.05% of our total loans, respectively. We also have other exposures to Korean construction, shipbuilding and shipping companies, including in the form of guarantees extended on behalf of such companies and debt and equity securities of such companies held by us. In the case of construction companies, such exposures include guarantees provided to us by general contractors with respect to financing extended by us for residential and commercial real estate development projects. In the case of shipbuilding companies, such exposures include refund guarantees extended by us on behalf of shipbuilding companies to cover their obligation to return a portion of the ship order contract amount to customers in the event of performance delays or defaults under shipbuilding contracts.
The construction industry in Korea has undergone significant fluctuations in recent years. Following a period of growth from 2015 to 2018, the construction industry had stagnated from 2019 to 2020, caused mainly by the uncertainty resulting from the Korean government’s strengthening of mortgage and other lending regulations to control the increasing real property prices, as well as temporary suspensions in construction projects due to the COVID-19 pandemic. After a brief period of recovery, the construction industry has experienced a rapid downturn starting in the second half of 2022, caused by a rise in interest rates and the resulting decline in demand for residential property throughout Korea, adverse changes in the price and availability of construction materials due to disruptions in global supply chains caused by, among others, the ongoing invasion of Ukraine by Russia, and financing difficulties faced by construction companies as investors became reluctant to invest in real estate. The shipbuilding industry in Korea has remained relatively stable despite the global downturn of the industry in recent years, mainly due to a large increase in the number of orders for liquefied natural gas carriers. The prospects for this industry currently remain uncertain, however, given the slowdown in the global economy and a rise in shipbuilding costs and resulting prices. In the case of shipping companies in Korea, the COVID-19 pandemic and the ensuing global lockdown caused a severe downturn in the industry in 2020. Although the industry subsequently showed signs of recovery from the pandemic as the levels of consumer spending and global trade began to rise, the industry has again entered a downturn starting in the second quarter of 2022 resulting from a decrease in shipping volume and an increase in the supply of ships. The shipping industry continues to face difficulties arising from, among others, a deteriorating global economy, a decrease in shipping volume and the strengthening of international shipping regulations.
The allowances that we have established against our credit exposures to Korean construction, shipbuilding and shipping companies may not be sufficient to cover all future losses arising from such exposures. If the asset quality of our exposures to such companies declines further, we may incur substantial additional provisions (including in connection with restructurings of such companies) and charge-offs, which could adversely impact our results of operations and financial condition. See “—Risks relating to our large corporate loan portfolio—We have exposure to large corporate borrowers that are currently or may in the future be put in restructuring, and we may suffer losses as a result of additional loan loss provisions being required and/or the adoption of restructuring plans with which we do not agree.” Furthermore, although a portion of our credit exposures to construction, shipbuilding and shipping companies are secured by collateral, such collateral may not be sufficient to cover
7
Table of Contents
uncollectible amounts in respect of such credit exposures. See “—Other risks relating to our business—A decline in the value of the collateral securing our loans and our inability to realize full collateral value may adversely affect our credit portfolio.”
Risks relating to our financial holding company structure and strategy
We may not succeed in implementing our strategy to take advantage of, or fail to realize the anticipated benefits of, our financial holding company structure.
One of our principal strategies is to take advantage of our financial holding company structure to become a comprehensive financial services provider capable of offering a full range of products and services to our large existing base of retail and corporate banking customers. The continued implementation of these plans may require additional investments of capital, infrastructure, human resources and management attention. This strategy entails certain risks, including the possibility that we may face significant competition from other financial holding companies and more specialized financial institutions in particular segments. If our strategy does not succeed, we may incur losses on our investments and our results of operations and financial condition may suffer.
Furthermore, our success under a financial holding company structure depends on our ability to realize the anticipated synergies, growth opportunities and cost savings from coordinating the businesses of our various subsidiaries. Although we have been integrating certain aspects of our subsidiaries’ operations into our financial holding company structure, our subsidiaries will generally continue to operate as independent entities with separate management and staff and our ability to direct our subsidiaries’ day-to-day operations may be limited. Some of our major acquisitions include the following:
| • | In March 2014, we acquired 52.02% of the outstanding shares of KB Capital Co., Ltd. (formerly named Woori Financial Co., Ltd.), a publicly listed Korean consumer finance company, from Woori Finance Holdings Co., Ltd. for ₩280 billion. We conducted a tender offer in May 2017, through which we acquired 5,949,300 shares of KB Capital at ₩27,500 per share, increasing our shareholding in KB Capital to 79.70%. We subsequently acquired the remaining outstanding shares of KB Capital in exchange for 2,269,057 shares of common stock of our company through a comprehensive stock swap effected in July 2017, as a result of which KB Capital became a wholly-owned subsidiary. |
| • | In June 2015, we acquired 19.47% of the outstanding shares of KB Insurance Co., Ltd. (formerly named LIG Insurance Co., Ltd.), a publicly listed Korean non-life insurance company, from a group of individual shareholders for ₩651 billion. In November 2015, we increased our shareholding in KB Insurance to 33.29% by acquiring its treasury shares for ₩231 billion, and in December 2016, we further increased our shareholding in KB Insurance to 39.81% by purchasing new shares of KB Insurance for ₩171 billion in a rights offering. Through a tender offer conducted in May 2017, we acquired 36,237,649 shares of KB Insurance at ₩33,000 per share, increasing our shareholding to 94.30%. We subsequently effected a comprehensive stock swap in July 2017 to acquire the remaining outstanding shares of KB Insurance in exchange for 2,170,943 shares of common stock of our company, as a result of which KB Insurance became a wholly-owned subsidiary. |
| • | In May 2016, we acquired 22.56% of the outstanding shares of Hyundai Securities Co., Ltd., a publicly listed Korean securities firm, from Hyundai Merchant Marine Co., Ltd. and other shareholders for ₩1,242 billion, and further increased our shareholding in Hyundai Securities to 29.62% in June 2016 by acquiring treasury shares of Hyundai Securities for ₩107 billion. In October 2016, we effected a comprehensive stock swap of the outstanding shares of Hyundai Securities for 31,759,844 newly issued shares of common stock of our company, as a result of which Hyundai Securities became a wholly-owned subsidiary. Following such transaction, we merged an existing subsidiary, KB Investment & Securities, with and into Hyundai Securities in December 2016 and changed the name of the surviving entity to KB Securities Co., Ltd. |
8
Table of Contents
| • | In August 2020, we acquired all of the outstanding shares of The Prudential Life Insurance Company of Korea, Ltd. (“Prudential Life Insurance”), a provider of life insurance services in Korea, from Prudential Financial, Inc. for ₩2.3 trillion, as a result of which Prudential Life Insurance became a wholly-owned subsidiary. In January 2023, in order to maximize the synergy effects in our life insurance operations, we merged an existing wholly-owned subsidiary, KB Life Insurance Co., Ltd. (the “Former KB Life Insurance”), with and into Prudential Life Insurance, which had been renamed KB Life Insurance Co., Ltd. in December 2022 shortly before the merger and became the surviving entity (“KB Life Insurance”). |
See “Item 5.A. Operating Results—Overview—Acquisitions.”
We may continue to increase our equity interest in our subsidiaries or investees and may also consider acquiring or merging with other financial institutions to achieve more balanced growth and further diversify our revenue base. For example, as part of our continued efforts to expand our businesses abroad, in particular in Southeast Asia, we acquired a 70% stake in PRASAC Microfinance Institution Plc., or PRASAC, a provider of microfinance and deposit-taking services in Cambodia, through Kookmin Bank, in April 2020. Subsequently, in October 2021, we acquired the remaining 30% interest in PRASAC, which increased our ownership of PRASAC to 100%. In addition, through a series of acquisitions from July 2018 to September 2020, we obtained a 67% interest in PT Bank Bukopin TBK of Indonesia, or Bank Bukopin, through Kookmin Bank, and changed its name to PT Bank KB Bukopin, Tbk in February 2021. The integration of our new subsidiaries’ or investees’ separate businesses and operations, as well as those of any companies we may acquire or merge with in the future, under our financial holding company structure could require a significant amount of time, financial resources and management attention. Moreover, that process could disrupt our operations (including our risk management operations) or information technology systems, reduce employee morale, produce unintended inconsistencies in our standards, controls, procedures or policies, and affect our relationships with customers and our ability to retain key personnel. The realization of the anticipated benefits of our financial holding company structure and any mergers or acquisitions we decide to pursue may be blocked, delayed or reduced as a result of many factors, some of which may be outside our control. These factors include:
| • | difficulties in integrating the diverse activities and operations of our subsidiaries or investees or any companies we may merge with or acquire, including risk management operations and information technology systems, personnel, policies and procedures; |
| • | difficulties in reorganizing or reducing overlapping personnel, branches, networks and administrative functions; |
| • | restrictions under the Financial Holding Company Act and other regulations on transactions between a financial holding company and, or among, its subsidiaries; |
| • | unforeseen contingent risks, including lack of required capital resources, increased tax liabilities or restrictions in our overseas operations, relating to our financial holding company structure; |
| • | unexpected business disruptions; |
| • | failure to attract, develop and retain personnel with necessary expertise; |
| • | loss of customers; and |
| • | labor unrest. |
Accordingly, we may not be able to realize the anticipated benefits of our financial holding company structure, and our business, results of operations and financial condition may suffer as a result.
We depend on limited forms of funding to fund our operations at the holding company level.
We are a financial holding company with no significant assets other than the shares of our subsidiaries. Our primary sources of funding and liquidity are dividends from our subsidiaries, direct borrowings and issuances of
9
Table of Contents
equity or debt securities at the holding company level. In addition, as a financial holding company, we are required to meet certain minimum financial ratios under Korean law, including with respect to liquidity, leverage and capital adequacy. Our ability to meet our obligations to our direct creditors and employees and our other liquidity needs and regulatory requirements at the holding company level depends on timely and adequate distributions from our subsidiaries and our ability to sell our securities or obtain credit from our lenders.
The ability of our subsidiaries to pay dividends to us depends on their financial condition and operating results. In the future, our subsidiaries may enter into agreements, such as credit agreements with lenders or indentures relating to high-yield or subordinated debt instruments, that impose restrictions on their ability to make distributions to us, and the terms of future obligations and the operation of Korean law could prevent our subsidiaries from making sufficient distributions to us to allow us to make payments on our outstanding obligations. See “—As a financial holding company, we depend on receiving dividends from our subsidiaries to pay dividends on our common stock.” Any delay in receipt of or shortfall in payments to us from our subsidiaries could result in our inability to meet our liquidity needs and regulatory requirements, including minimum liquidity and capital adequacy ratios, and may disrupt our operations at the holding company level.
In addition, creditors of our subsidiaries will generally have claims that are prior to any claims of our creditors with respect to their assets. Furthermore, our inability to sell our securities or obtain funds from our lenders on favorable terms, or at all, could also result in our inability to meet our liquidity needs and regulatory requirements and may disrupt our operations at the holding company level.
As a financial holding company, we depend on receiving dividends from our subsidiaries to pay dividends on our common stock.
Since our principal assets at the holding company level are the shares of our subsidiaries, our ability to pay dividends on our common stock largely depends on dividend payments from those subsidiaries. Those dividend payments are subject to the Korean Commercial Code, the Bank Act and regulatory limitations, generally based on capital levels and retained earnings, imposed by the various regulatory agencies with authority over those entities. For example:
| • | under the Korean Commercial Code, dividends may only be paid out of distributable income, an amount which is calculated by subtracting the aggregate amount of a company’s paid-in capital and certain mandatory legal reserves as well as certain unrealized profits from its net assets, in each case as of the end of the prior fiscal period; |
| • | under the Bank Act, a bank also must credit at least 10% of its net profit to a legal reserve each time it pays dividends on distributable income until that reserve equals the amount of its total paid-in capital; and |
| • | under the Bank Act and the requirements of the Financial Services Commission, if a bank fails to meet its required capital adequacy ratio or otherwise becomes subject to management improvement measures imposed by the Financial Services Commission, then the Financial Services Commission may restrict the declaration and payment of dividends by that bank. |
Our subsidiaries may not continue to meet the applicable legal and regulatory requirements for the payment of dividends in the future. If they fail to do so, they may stop paying or reduce the amount of the dividends they pay to us, which would have an adverse effect on our ability to pay dividends on our common stock.
Although increasing our fee income is an important part of our strategy, we may not be able to do so.
We have historically relied on interest income as our primary revenue source. While we have developed new sources of fee income as part of our business strategy, our ability to increase our fee income and thereby reduce our dependence on interest income will be affected by the extent to which our customers generally accept
10
Table of Contents
the concept of fee-based services. Historically, customers in Korea have generally been reluctant to pay fees in return for value-added financial services, and their continued reluctance to do so will adversely affect the implementation of our strategy to increase our fee income. Furthermore, the fees that we charge to customers are subject to regulation by Korean financial regulatory authorities, which may seek to implement regulations or measures that may also have an adverse impact on our ability to achieve this aspect of our strategy.
We may suffer customer attrition or our net interest margin may decrease as a result of government regulations or our competition strategy.
We have pursued a strategy of enhancing our margins by maintaining relatively low interest rates on our deposit products while charging relatively higher interest rates on loans. We may need to adjust such strategy, however, in order to comply with stricter government regulations, which would also require us to pursue a more effective competition strategy in order to minimize customer attrition.
For example, the successive increases in interest rates in Korea from August 2021 to the first quarter of 2023 has led to a significant increase in the net interest spreads (the difference between the average yield on interest-earning assets and the average cost of interest-bearing liabilities) reported by many Korean banks, including Kookmin Bank, as the rise in interest rates for loans have generally outpaced the rise in interest rates for deposit products. See “—Significant increases in interest rates could decrease the value of our debt securities portfolio and raise our funding costs while reducing loan demand and the repayment ability of our borrowers, which, as a result, could adversely affect us.” In response to widespread public outcry against such increase in net interest spreads and the high levels of profits realized by Korean banks, the Korean government and the Financial Services Commission have recently announced that they intend to impose stricter regulations on Korean banks, including Kookmin Bank, to reduce such net interest spreads and pursue measures to increase competition among financial institutions in Korea. Such regulations could force us to compete to a greater extent based on interest rates, which could lead to a decrease in our net interest margins. In addition, if other banks and financial institutions adopt a strategy of expanding market share through interest rate competition, we may suffer customer attrition due to rate sensitivity. See “—Competition in the Korean financial industry is intense, and we may lose market share and experience declining margins as a result.”
Although it is not possible to predict what, if any, new regulations will ultimately be imposed on Kookmin Bank and the financial industry, such regulations could reduce our profit margins, limit our operational flexibility and increase competition, which, in turn, could have a materially adverse effect on our results of operations and financial condition.
Risks relating to competition
Competition in the Korean financial industry is intense, and we may lose market share and experience declining margins as a result.
Competition in the Korean financial industry has been and is likely to remain intense. Some of the financial institutions that we compete with have longer operating histories as financial holding companies, greater financial resources or more specialized capabilities than us and our subsidiaries. In the retail and small- and medium-sized enterprise lending business, which has been our traditional core business, competition has increased significantly and is expected to increase further. Most Korean banks have been focusing on retail customers and small- and medium-sized enterprises in recent years, although they have begun to generally increase their exposure to large corporate borrowers. In addition, the profitability of our retail lending and credit card operations may decline as a result of growing market saturation in the retail lending and credit card segments, increased interest rate competition, pressure to lower the fee rates applicable to our credit cards (particularly merchant fee rates) and higher marketing expenses. Intense and increasing competition has made and continues to make it more difficult for us to secure retail, credit card and small- and medium-sized customers with the credit quality and on credit terms necessary to achieve our business objectives in a commercially acceptable manner.
11
Table of Contents
Furthermore, the introduction of Internet-only banks in Korea has led to an increase in competition in the Korean banking industry. Internet-only banks operate without branches and conduct most of their operations through electronic means, which enables them to minimize costs and offer customers higher interest rates on deposits or lower lending rates. In April 2017, Kbank, the first Internet-only bank in Korea, commenced operations. Kakao Bank, another Internet-only bank, in which Kookmin Bank held a 4.9% equity interest as of December 31, 2022, commenced operations in July 2017. Most recently, Toss Bank, another Internet-only bank, commenced operations in October 2021.
In the Korean insurance industry, there has been downward pressure in recent years on margins of insurance products as some of our competitors have sought to obtain or maintain market share by reducing margins and increasing marketing efforts. As the Korean non-life insurance and life insurance sectors continue to mature, they may experience a slowdown in growth as well as a stagnation in market penetration. Due to these and other factors, we believe that competition in the Korean insurance industry will likely remain intense in the future. Sustained or increased competition may lead to decreases in the market share and profitability of our non-life insurance and life insurance businesses.
In addition, we believe that regulatory reforms and the general modernization of business practices in Korea will lead to increased competition among financial institutions in Korea. In the second half of 2015, the Korean government implemented measures to facilitate bank account portability of retail customers by requiring commercial banks to establish systems that allow retail customers to easily switch their bank accounts at one commercial bank to another and automatically transfer the automatic payment settings of their former accounts to the new ones. Such measures have further intensified competition among financial institutions in Korea. Moreover, in March 2016, the Financial Services Commission introduced an individual savings account scheme in Korea, which enables individuals to efficiently manage a wide range of retail investment vehicles, including cash deposits, funds and securities investment products, from a single integrated account with one financial institution and offers tax benefits on investment returns. Since the scheme backed by the Korean government allows only one individual savings account per person, financial institutions have been competing to retain existing customers and attract new customers since the launch of the individual savings account scheme. Over 30 financial institutions, including banks, securities companies and insurance companies, have registered with the Financial Services Commission to sell their individual savings account products and competition among these financial institutions is expected to remain intense. More recently, in August 2020, amendments to the Credit Information Use and Protection Act established the framework for MyData services in Korea, which allow the collection of customers’ personal credit information from credit information providers/users or public institutions upon the customer’s request and subject to compliance requirements, so that customers may access such collected personal credit information in whole or in part. As of December 31, 2022, the Financial Services Commission had granted licenses to 64 companies to operate as MyData service providers, 23 of which were fintech firms, and competition between traditional financial institutions and fintech firms is expected to intensify, particularly with respect to asset management services. MyData services are currently offered through several channels including KB Star Banking, our mobile banking application, KB Pay, our credit card services application and KB M-able, our securities trading application. In order to further boost competition in the Korean banking industry, the relevant regulatory authorities in Korea are also planning to introduce various measures to lower the barriers to entry for certain financial institutions. See “—We may suffer customer attrition or our net interest margin may decrease as a result of government regulations or our competition strategy.”
Moreover, a number of significant mergers and acquisitions in the financial industry have taken place in Korea in recent years, including Hana Financial Group’s acquisition of a controlling interest in Korea Exchange Bank in 2012 and the subsequent merger of Hana Bank into Korea Exchange Bank in 2015. In addition, as part of the Korean government’s plans to privatize Woori Finance Holdings Co., Ltd. (the former financial holding company of Woori Bank), certain subsidiaries of Woori Finance Holdings were sold to other financial institutions and Woori Finance Holdings itself was merged into Woori Bank in 2014, which established a new financial holding company, Woori Financial Group Inc., in January 2019. In the insurance sector, China’s Anbang Insurance Group acquired controlling interests in Tong Yang Life Insurance Co., Ltd. and Allianz Life
12
Table of Contents
Insurance Korea Co., Ltd. in 2015 and 2016, respectively, while Mirae Asset Life Insurance Co., Ltd. acquired PCA Life Insurance Co., Ltd. in 2017. Meanwhile, Orange Life Insurance, Ltd. (formerly known as ING Life Insurance Korea, Ltd.) became a wholly-owned subsidiary of Shinhan Financial Group following the acquisition of equity interests by Shinhan Financial Group in February 2019 and January 2020, and subsequently merged with and into Shinhan Life Insurance Co., Ltd. in July 2021. In the securities sector, in 2016, Mirae Asset Securities Co., Ltd. acquired a 43% interest in KDB Daewoo Securities Co., Ltd., which subsequently merged with and into Mirae Asset Securities to create Mirae Asset Daewoo Securities Co., Ltd., one of the largest securities companies in Korea in terms of capital.
We expect that consolidation in the Korean financial industry will continue. The financial institutions resulting from such consolidation may, by virtue of their increased size and business scope, provide significantly greater competition for us. We also believe that foreign financial institutions, many of which have greater experience and resources than we do, may seek to compete with us in providing financial products and services either by themselves or in partnership with existing Korean financial institutions. Increased competition and continuing consolidation may lead to decreased margins, resulting in a material adverse impact on our future profitability. Accordingly, our results of operations and financial condition may suffer as a result of increasing competition in the Korean financial industry.
Risks relating to our large corporate loan portfolio
We have exposure to chaebols, and, as a result, financial difficulties of chaebols may have an adverse impact on us.
Of our 20 largest corporate exposures (including loans, debt and equity securities and guarantees and acceptances) as of December 31, 2022, eleven were to companies that were members of the 32 largest highly-indebted business groups among chaebols in Korea designated as such by the Financial Supervisory Service based on their outstanding exposures. As of that date, the total amount of our exposures to 32 of such largest highly-indebted business groups among chaebols was ₩39,535 billion, or 6.2% of our total exposures. If the credit quality of our exposures to chaebols declines as a result of financial difficulties they experience or for other reasons, we could require substantial additional loan loss provisions, which would hurt our results of operations and financial condition.
We cannot assure you that the allowances we have established against these exposures will be sufficient to cover all future losses arising from these exposures. In addition, with respect to those companies that are in or in the future enter into workout or liquidation proceedings, we may not be able to make any recoveries against such companies. We may, therefore, experience future losses with respect to those loans.
We have exposure to large corporate borrowers that are currently or may in the future be put in restructuring, and we may suffer losses as a result of additional loan loss provisions being required and/or the adoption of restructuring plans with which we do not agree.
As of December 31, 2022, our loans and guarantees to large corporate borrowers that were in workout, restructuring or rehabilitation amounted to ₩41 billion, or 0.01% of our total loans and guarantees, most of which was classified as impaired. As of the same date, our allowances for credit losses on these loans and guarantees amounted to ₩40 billion, or 97.6% of these loans and guarantees. These allowances may not be sufficient to cover all future losses arising from our exposure to these companies. Furthermore, we have other exposure to such companies, in the form of debt and equity securities of such companies held by us (including equity securities we acquired as a result of debt-to-equity conversions). Our exposures as of December 31, 2022 with respect to such securities of large corporate borrowers in workout, restructuring or rehabilitation amounted to less than ₩1 billion, or less than 0.01% of our total debt securities and equity securities, but may increase in the future. In addition, in the case of borrowers that are or become subject to workout or restructuring, we may be forced to restructure our credits pursuant to restructuring plans approved by other creditor financial institutions of the borrower, or to dispose of our credits to other creditors on unfavorable terms.
13
Table of Contents
In particular, as of December 31, 2022, we had ₩558 billion of outstanding exposures, comprising ₩111 billion of loans, ₩0 billion of debt securities, ₩20 billion of equity securities and ₩427 billion of guarantees (mainly in the form of refund guarantees relating to shipbuilding contracts), to Daewoo Shipbuilding & Marine Engineering Co., Ltd., or DSME, which has been pursuing a voluntary restructuring program. In April 2017, the creditors of DSME agreed on a plan to provide additional financial support to DSME in connection with its voluntary restructuring program, under which the Korea Development Bank and the Export-Import Bank of Korea would provide ₩2.9 trillion of new loans to DSME, on the condition that DSME’s other creditors and bondholders agree to a ₩2.9 trillion debt-to-equity swap. The financial support plan requires the Korean commercial bank creditors of DSME (including us) to swap 80% of our outstanding unsecured loans into equity of DSME and extend the maturity of the remaining loans for a period of five years. The financial support plan, which is currently scheduled to expire in December 2023, also requires DSME’s creditors (including us) to provide additional refund guarantees in connection with future shipbuilding contracts of DSME. The implementation of the financial support plan for DSME has required and may continue to require us to increase our loan loss provisions and recognize write-offs and impairment losses with respect to our exposures to DSME and may therefore have a material adverse impact on our results of operations and financial condition. In December 2022, Hanwha Group agreed to acquire newly issued shares of DSME for approximately ₩2 trillion, following which Hanwha Group is expected to become DSME’s largest shareholder with a 49.3% equity stake. The consummation of the acquisition currently remains subject to various conditions, including regulatory approval from a number of relevant jurisdictions. The creditors of DSME are expected to extend the financial support plan by another five years if such acquisition is completed before December 31, 2023.
A large portion of our credit exposure is concentrated in a relatively small number of large corporate borrowers, which increases the risk of our corporate credit portfolio.
As of December 31, 2022, our loans and guarantees to our 20 largest borrowers totaled ₩12,613 billion and accounted for 2.8% of our total loans and guarantees. As of that date, our single largest corporate credit exposure was to The Korea Securities Finance Corporation, to which we had outstanding debt securities of ₩4,532 billion and an additional exposure of ₩83 billion in the form of equity securities. Any deterioration in the financial condition of The Korea Securities Finance Corporation or our other large corporate borrowers may require us to record substantial additional provisions and charge-offs and may have a material adverse impact on our results of operations and financial condition.
Risks relating to our insurance operations
Our profitability may be adversely affected if actual benefits and claims amounts on our in-force insurance policies exceed the amounts that we have reserved, or we increase the amount of reserves due to a change in our underlying assumptions.
We operate our insurance business through KB Insurance Co., Ltd., our non-life insurance subsidiary which became a consolidated subsidiary in May 2017, and KB Life Insurance, which was formed in January 2023 through a merger of our existing life insurance subsidiaries, the Former KB Life Insurance and Prudential Life Insurance. With respect to our insurance operations, we establish and carry, as a liability, policy reserves based on the greater of statutory reserves and actuarial estimates of how much we will need to pay for future benefits and claims on our in-force non-life insurance and life insurance policies. The profitability of our insurance operations depends significantly upon the extent to which our actual claims results are consistent with the assumptions used in setting the prices for our insurance products and establishing the liabilities in our financial statements for our obligations for future insurance policy benefits and claims. We establish the liabilities for obligations for future insurance policy benefits and claims based on the expected payout of benefits, calculated through the use of assumptions for investment returns, mortality, morbidity, expenses and persistency, as well as certain macroeconomic factors such as inflation. We also use methods to analyze loss trends with respect to certain risk assumptions relating to natural disasters. These assumptions are based on our previous experience and published data from third party industry sources, as well as judgments made by our management. These
14
Table of Contents
assumptions and estimates may deviate from our actual experience due to various factors that are beyond our control, including as a result of unexpected changes in the scope of coverage by the Korean national health insurance program and advancements in health care that result in increased life expectancy and early detection of diseases, as well as re-interpretations of our insurance policy terms by Korean regulators or courts. In addition, the occurrence of unexpected catastrophic events in Korea, including pandemics or natural or man-made disasters, may result in claims that significantly exceed our expectations. As a result, we cannot determine with precision the ultimate amounts that we will pay for, or the timing of payment of, actual benefits and claims or whether the assets supporting the insurance policy liabilities will grow to the level we assume prior to payment of benefits or claims. These amounts may vary from the estimated amounts, particularly when those payments may not occur until well into the future.
We evaluate the adequacy of our insurance policy liabilities periodically based on changes in the assumptions used to determine our best estimates of claims, expenses, persistency rates and interest rates, as well as based on our actual policy benefits and claims results. To the extent that trends in actual claims results are less favorable than our underlying assumptions used in establishing these liabilities, and our total insurance policy liabilities are considered to be inadequate to meet our future contractual obligations as and when they arise, we could be required to increase our liabilities. We record increases in our insurance policy liabilities as expenses in the period in which the liabilities are established or re-evaluated. If actual benefits and claims amounts exceed the amounts that we have reserved, or we increase the amount of insurance policy liabilities due to a change in our underlying assumptions, it could have a material adverse effect on our results of operations and financial condition.
Our insurance subsidiaries may be required to raise additional capital or reduce their growth or business scale if their risk-based capital adequacy ratio deteriorates or the applicable capital requirements change in the future.
Pursuant to the risk-based capital adequacy requirements implemented by the Financial Services Commission, insurance companies in Korea are required to maintain a statutory ratio of available regulatory capital to risk-weighted assets of not less than 100% on a consolidated basis. Furthermore, the Financial Supervisory Service had previously recommended that insurance companies maintain a risk-based capital adequacy ratio of not less than 150%, and its former administrative guidelines had required insurance companies failing to maintain such recommended 150% ratio to submit a capital increase plan. Although the Financial Supervisory Service has since withdrawn such administrative guidelines, we believe that a risk-based capital adequacy ratio of not less than 150% is still considered standard in the Korean insurance industry. Risk-based capital adequacy requirements require insurance companies to hold adequate capital to cover their exposures to interest rate risk, market risk, credit risk and operational risk as well as insurance risk by reflecting such risks in their calculation of risk-weighted assets. As of December 31, 2022, KB Insurance, Prudential Life Insurance and the Former KB Life Insurance had a risk-based capital adequacy ratio of 171.66%, 248.37% and 130.48%, respectively.
On January 1, 2023, the Financial Supervisory Service introduced the Korean-Insurance Capital Standard, or K-ICS, a new regulatory solvency regime for insurance companies based on the International Capital Standard developed by the International Association of Insurance Supervisors, which is similar in substance to the Solvency II Directive of the European Union. The Solvency II Directive, which has been in effect in the European Union since January 1, 2016, is a comprehensive program of regulatory requirements for insurance companies, covering authorization, corporate governance, supervisory reporting, public disclosure and risk assessment and management, as well as solvency. Under K-ICS, insurance contract liabilities are expected to be measured based on market value, rather than book value, at the time of the computation of available capital. K-ICS has also introduced new risk subcategories, including those related to termination, business expenses, longevity, catastrophes and asset concentration, to be considered at the time of the computation of required capital. It is expected that these changes, among others, would require a number of insurance companies in Korea with a large portfolio of high guaranteed rate of return products to obtain additional capital to meet their capital
15
Table of Contents
adequacy requirements. However, the Financial Supervisory Service has allowed for a gradual deduction from available capital and a gradual recognition of risks in relation to required capital, for up to ten years. In order to ease the burden on insurance companies, corrective measures will be withheld for up to five years even if the solvency ratio under K-ICS is less than 100%, if the risk-based capital adequacy ratio exceeds 100%. See “Item 4.B. Business Overview—Supervision and Regulation—Principal Regulations Applicable to Insurance Companies—Capital Adequacy.”
There is no guarantee that our insurance subsidiaries will not be required to raise additional capital to sustain their risk-based capital adequacy ratio above the required level in connection with the implementation of K-ICS. Any material deterioration in the risk-based capital adequacy ratio of our insurance subsidiaries, as a result of the implementation of K-ICS or otherwise, could change their customers’ or business counterparties’ perception of their financial health, which in turn could adversely affect their business and profitability. Furthermore, if they grow rapidly or if their asset quality deteriorates in the future, our insurance subsidiaries may be required to raise additional capital, which we may need to provide in whole or in part, to meet their capital adequacy requirements. If we or our insurance subsidiaries are not able to raise any required additional capital, we may be forced to reduce the growth or scale of our insurance operations.
Changes in accounting standards for insurance contracts and their implementation could adversely impact our reported results of operations and financial condition and their comparability with those from prior periods.
In response to a lack of comparability in the global insurance industry stemming from variations in accounting policies being applied, in May 2017, the IASB issued IFRS 17, a new IFRS accounting standard for insurance contracts to supersede IFRS 4 with an effective date of January 1, 2021, which was subsequently deferred to January 1, 2022 and again to January 1, 2023. With IFRS 17 currently in effect, we expect compliance with such revised accounting standards to significantly affect the way in which we and other operators of insurance businesses in Korea account for insurance policies, annuity contracts and financial instruments and how our financial statements are presented.
IFRS 17 has introduced a fundamentally different approach to previous accounting policies under IFRS 4 in terms of both liability measurement and profit recognition. Under IFRS 17, insurance contract liabilities are no longer calculated based on historical or past assumptions and are now based on the present value of future insurance cash flows using a discount rate reflecting current interest rates and the characteristics of the insurance contracts, with a risk adjustment and deferral of up-front profits. Among other effects, this may result in an increase in the level of the liabilities of our insurance subsidiaries, which would lead to a decrease in the balance of their available capital, which in turn may lower their risk-based capital adequacy ratio, depending on the solvency regime applicable at the time. In addition, under IFRS 17, certain parts of premium income from insurance contracts will be recognized over the coverage period in proportion to the value of expected coverage and other services that the insurer will provide over such period, rather than recognized at the time of receipt of premium payments, and the investment component of an insurance contract (which refers to amounts to be repaid to policyholders even if the insured event does not occur) will be disaggregated and excluded from premium income. Such changes to revenue recognition methodology will likely have the effect of, among other things, reducing the reported revenue from our insurance operations in our financial statements.
Given the complexity of IFRS 17 and the significant amount of time and resources required to adopt IFRS 17 accounting, we have been investing in information technology systems and processes designed to enhance our financial analysis and impact assessment with respect to our insurance operations. We have also taken other measures to reduce the amount of our statutorily required capital under IFRS 17, including developing new products with improved capital efficiency and strengthening our asset-liability management and our monitoring of interest rate risk. Potential challenges that we have faced, and may continue to face, in terms of implementation of IFRS 17 include:
| • | interpretation of the requirements and potential operational difficulties when applying such requirements; |
16
Table of Contents
| • | data collection, storage and analysis; |
| • | integration of existing systems and processes with new actuarial systems; |
| • | increased finance, actuarial and risk management coordination; |
| • | implementation of new business strategies in preparation for IFRS 17, including adjusting the duration of interest-earning assets and interest-bearing liabilities and our asset-liability management policies within our insurance operations; |
| • | impact of the transition to a new Korean regulatory solvency regime, which was implemented on January 1, 2023; and |
| • | changes to other aspects of our insurance business, such as product design, remuneration policies and business planning. |
The effect of changes required to our accounting policies as a result of implementing IFRS 17 is currently uncertain, but these changes can be expected to, among other things, alter the timing of IFRS profit recognition. The implementation of IFRS 17, as well as any other new or revised insurance accounting standards we are required to adopt in the future, could result in significant costs and may have a material adverse effect on our business and our reported results of operations and financial condition.
Other risks relating to our business
The COVID-19 pandemic and any possible recurrence of other types of widespread infectious diseases may adversely affect our business, financial condition or results of operations.
COVID-19, an infectious disease caused by severe acute respiratory syndrome coronavirus 2, has spread globally and was declared a “pandemic” by the World Health Organization in March 2020. The COVID-19 pandemic has materially and adversely affected the global economy and financial markets as well as disrupted our business operations.
Risks associated with a prolonged COVID-19 pandemic or other types of widespread infectious diseases include:
| • | an increase in defaults on loan payments from our customers that are particularly affected by the COVID-19 pandemic (such as those in the transportation, food and beverage, hotel, leisure and shipping industries and certain sectors of the manufacturing industry), who may not be able to meet payment obligations, which may lead to an increase in delinquency ratios and a deterioration in asset quality (see “Item 4.B. Business Overview—Assets and Liabilities—Loan Portfolio—Loan Concentration by Industry”); |
| • | depreciation of the Won against major foreign currencies, which in turn may increase our cost in servicing our foreign currency denominated debt and result in foreign exchange losses; |
| • | disruption in the normal operations of our business resulting from contraction of infectious diseases by our employees, which may necessitate our employees to be quarantined and/or our offices to be temporarily shut down; |
| • | disruption resulting from the necessity for social distancing, including, for example, temporary arrangements for employees to work remotely, which may lead to a reduction in labor productivity; and |
| • | impairments in the fair value of our investments in companies that may be adversely affected by the pandemic. |
It is not possible to predict the duration or the full magnitude of the overall harm that may result from COVID-19 in the long term. In the event that COVID-19 or other types of widespread infectious diseases cannot be effectively and timely contained, our business, financial condition and results of operations will likely suffer.
17
Table of Contents
Unfavorable changes in the global financial markets could adversely affect our results of operations and financial condition.
The overall prospects for the Korean and global economy in 2023 and beyond remain uncertain. In recent years, the global financial markets have experienced significant volatility as a result of, among other things:
| • | the occurrence of severe health epidemics, including the COVID-19 pandemic; |
| • | hostilities, political or social tensions involving Russia (including the invasion of Ukraine by Russia and ensuing actions that the United States and other countries have taken or may take in the future, such as the imposition of sanctions against Russia) and the resulting adverse effects on the global supply of oil and other natural resources and the global financial markets; |
| • | interest rate fluctuations as well as perceived or actual changes in policy rates by, or other monetary and fiscal policies set forth by, the U.S. Federal Reserve and other central banks; |
| • | a rise in inflation rates and volatility in stock markets and exchange rates worldwide; |
| • | adverse developments in the global financial markets and industry, including difficulties faced by several banks in the United States and Europe; |
| • | a deterioration in economic and trade relations between the United States and its major trading partners, including China; |
| • | financial and social difficulties affecting many countries worldwide, in particular in Latin America and Europe; |
| • | escalations in trade protectionism globally and geopolitical tensions in East Asia and the Middle East; |
| • | the slowdown of economic growth in China and other major emerging market economies; and |
| • | political and social instability in various countries in the Middle East, including Iran, Syria and Iraq. |
In light of the high level of interdependence of the global economy, unfavorable changes in the global financial markets, including as a result of any of the foregoing developments, could have a material adverse effect on the Korean economy and financial markets, and in turn on our business, financial condition and results of operations.
We are also exposed to adverse changes and volatility in the global and Korean financial markets as a result of our liabilities and assets denominated in foreign currencies and our holdings of trading and investment securities, including structured products. The value of the Won relative to major foreign currencies in general and the U.S. dollar in particular has fluctuated widely in recent years and has been subject to significant volatility as a result of the COVID-19 pandemic, the invasion of Ukraine by Russia and the ensuing sanctions against Russia and, more recently, the widening difference in policy rates between the United States and Korea. A depreciation of the Won will increase our cost in Won of servicing our foreign currency-denominated debt, while continued exchange rate volatility may also result in foreign exchange losses for us. Furthermore, as a result of the deterioration in global and Korean economic conditions, there has been downward pressure on securities prices, including the stock prices of Korean and foreign companies in which we hold an interest. Such developments have resulted in and may lead to further trading and valuation losses on our trading and investment securities portfolio as well as impairment losses on our investments accounted for under the equity method.
Adverse developments affecting the financial services industry, such as actual events or concerns involving liquidity, could adversely affect our results of operations and financial condition.
In early 2023, difficulties at several banks in the United States and Europe have caused uncertainty for financial services companies, in particular the banking sector, and fear of instability in the global financial system generally, including in Korea. Such difficulties were caused, among others, by rising levels of inflation rates and rapid increases in interest rates, which have led to declines in the values of previously issued
18
Table of Contents
government securities held by such banks. Although the relevant financial authorities have intervened directly and indirectly in notable cases, there is a risk that other financial institutions could face difficulties, including from contagion disconnected from market fundamentals or for other reasons, and it is unclear what steps regulators would take, if any, in the event of further bank difficulties or continuing (or increasing) market distress. Many financial institutions have experienced volatile stock prices and significant losses in their equity value, and there is concern that depositors have withdrawn, or could withdraw in the future, significant sums from their accounts at these institutions. Any negative perceptions resulting from such developments concerning the soundness of savings banks, Internet-only banks or the banking system generally in Korea could impact where customers choose to maintain deposits, which could lead certain banks in Korea to experience closure or other significant distress. In such event, the Korean government has in the past and may in the future require us, as one of the largest financial holding companies in Korea, to intervene, which could strain our resources, divert our management’s attention and have an adverse impact on our results of operations and financial condition.
Actual events involving limited liquidity, defaults, non-performance or other adverse developments that affect the financial services industry generally or financial institutions, transactional counterparties or other companies in the financial services industry, or concerns or rumors about any events of these kinds or other similar risks, may in the future lead to market-wide liquidity problems or increase our risk in various dealings with our counterparties, among others. If, as a result of such developments, any parties with whom we conduct business are unable to access their deposits with a distressed financial institution or any of their other funds loaned to such distressed financial institution, including through financial instruments or lending arrangements, such parties’ credit quality, ability to pay their obligations to us, or to enter into new commercial arrangements requiring additional payments to us could be adversely affected. In addition, our ability to access funding sources and other arrangements in amounts adequate to finance or capitalize our current and projected future business operations could also be affected by such disruptions or instability in the financial services industry or financial markets. Furthermore, we could be impacted by current or future negative perceptions and expectations about the prospects for the financial services industry, which could worsen over time and result in downward pressure on, and continued or accelerated volatility of, bank securities. Any of these developments resulting from the general instability of the financial services industry could materially adversely impact our results of operations and financial condition.
Our business may be materially and adversely affected by legal claims and regulatory actions against us.
We are subject to the risk of legal claims and regulatory actions in the ordinary course of our business, which may expose us to substantial monetary damages and legal costs, injunctive relief, criminal and civil penalties, sanctions against our management and employees and regulatory restrictions on our operations, as well as significant reputational harm. See “Item 8A. Consolidated Statements and Other Financial Information—Legal Proceedings.”
We are unable to predict the outcome of the legal claims and regulatory actions in which we are involved, and the scope of the claims or actions or the total amount in dispute in such matters may increase. Furthermore, adverse final determinations, decisions or resolutions in such matters could encourage other parties to bring related claims and actions against us. Accordingly, the outcome of current and future legal claims and regulatory actions, particularly those for which it is difficult to assess the maximum potential exposure or the ultimate adverse impact with any degree of certainty, may materially and adversely impact our business, reputation, results of operations and financial condition.
Our risk management system may not be effective in mitigating risk and loss, including operational risk.
We seek to monitor and manage our risk exposure through a group-wide risk management platform, encompassing a multi-layered risk management governance structure, reporting and monitoring systems, early warning systems, credit risk management systems for our banking operations and other risk management infrastructure, using a variety of risk management strategies and techniques. See “Item 11. Quantitative and
19
Table of Contents
Qualitative Disclosures about Market Risk.” However, such risk management strategies and techniques employed by us and the judgments that accompany their application cannot anticipate the economic and financial outcome in all market environments, and many of our risk management strategies and techniques have a basis in historical market behavior that may limit the effectiveness of such strategies and techniques in times of significant market stress or other unforeseen circumstances. Furthermore, our risk management strategies may not be effective in a difficult or less liquid market environment, as other market participants may be attempting to use the same or similar strategies as us to deal with such market conditions. In such circumstances, it may be difficult for us to reduce our risk positions due to the activity of such other market participants.
We also seek to identify and manage our exposure to operational risk, which we define broadly to include all financial and non-financial risks, other than credit risk, market risk, interest rate risk and liquidity risk, that may arise from our operations that could negatively impact our capital, including the risk of loss resulting from inadequate or failed internal processes, people and systems or from external events as defined under Basel II. In addition to our internal audits and inspections, the Financial Supervisory Service conducts general annual audits of our operations, as well as special audits and investigations as the need arises on particular aspects of our operations, such as risk management, internal control, credit monitoring and liquidity. In the ordinary course of these audits or investigations, the Financial Supervisory Service routinely issues warning notices where it determines that a regulated financial institution or such institution’s employees have failed to comply with the applicable laws or rules, regulations and guidelines of the Financial Supervisory Service. We have in the past received, and expect in the future to receive, such notices, and we have taken and will continue to take appropriate actions in response to such notices. While we intend to fully cooperate with the Financial Supervisory Service in its audits and investigations and take any remedial measures as necessary, no assurance can be given that these remedial measures would be sufficient to prevent similar or more adverse operational risks from materializing.
We may suffer losses due to employee misconduct.
Our businesses are exposed to risk from potential non-compliance by our employees with policies or regulations, employee misconduct or negligence and fraud, which could result in civil, regulatory or criminal investigations, litigations and charges, regulatory sanctions and reputational or financial harm. For example, in January 2023, we discovered through internal investigations that an employee of Kookmin Bank had misappropriated an aggregate of ₩14.9 billion between May 2021 and December 2022. We have reported such incident to the Financial Supervisory Service, which began investigations in January 2023. As of the date of this annual report, the Financial Supervisory Service has not released the results of such investigation. There can be no assurance that we will be able to fully recoup any financial losses that we may have sustained as a result of any employee misconduct. Furthermore, it is not always possible to deter or fully prevent employee misconduct and the precautions we take to prevent and detect such activity may not always be fully effective. Accordingly, there can be no assurance that employee misconduct will not occur again in the future.
Uncertainties regarding the transition away from the London Interbank Offered Rate, or LIBOR, or any other interest rate benchmark could have adverse consequences for market participants, including us.
The ICE Benchmark Administration, the administrator of LIBOR, ceased publication of short-term U.S. dollar LIBOR settings and all non-U.S. dollar LIBOR settings on a representative basis after December 31, 2021, with plans to cease publication of all other U.S. dollar LIBOR settings after June 30, 2023.
Given the extensive use of LIBOR across financial markets, the transition away from LIBOR presents various risks and challenges to financial markets and institutions, including us, and in particular, Kookmin Bank, our banking subsidiary. As a commercial bank, Kookmin Bank used various financial products that referenced LIBOR, including, among others, commercial loans, deposits, borrowings and debentures. Kookmin Bank had also entered into derivatives contracts in order to address the needs of its corporate clients to hedge their risk
20
Table of Contents
exposure as well as the need to hedge its own risk exposure that results from such client contracts. In February 2020, Kookmin Bank assembled a task force team in order to assess, identify, monitor and manage risks that may arise from the transition away from LIBOR, and to date, has substantively completed such transition, with a strategy in place for the remainder of such transactions that involve LIBOR settings that expire in 2023. LIBOR has not been used in any of Kookmin Bank’s new agreements since May 2022.
The ongoing transition away from LIBOR or any other interest rate benchmark could result in increased financial, operational, legal, reputational and/or compliance risks. For example, a significant challenge in our benchmark transition has been managing the impact of the LIBOR transition on the contractual mechanics of LIBOR-based financial instruments and contracts that mature after the announced deadlines. Certain of the remaining instruments and contracts do not provide for alternative reference rates, and even if such instruments and contracts provide for alternative reference rates, such alternative reference rates are likely to differ from the prior benchmark rates and may require us to pay interest at higher rates on the related obligations, which could adversely impact our interest expense, results of operations and cash flows. For information on our remaining financial instruments that reference LIBOR, see Notes 4.4.2 and 9.6 of the notes to our consolidated financial statements included elsewhere in this annual report. While there are a number of international working groups focused on transition plans and the provision of fallback contract language that seek to minimize market disruption, replacement of LIBOR or any other benchmark, such as the Secured Overnight Financing Rate, or SOFR, with a new benchmark rate could adversely impact the value of and return on existing instruments and contracts. Moreover, replacement of LIBOR or other benchmark rates could result in market dislocations and have other adverse consequences for market participants, including the potential for increased costs, and litigation risks stemming from potential disputes with customers and counterparties regarding the interpretation and enforceability of fallback contract language in the LIBOR-based financial instruments and contracts.
We are generally subject to Korean corporate governance and disclosure standards, which may differ from those in other countries.
Companies in Korea, including us, are subject to corporate governance standards applicable to Korean public companies which may differ in some respects from standards applicable in other countries, including the United States. As a reporting company registered with the U.S. Securities and Exchange Commission and listed on the New York Stock Exchange, we are subject to certain corporate governance standards as mandated by the Sarbanes-Oxley Act of 2002. However, foreign private issuers, including us, are exempt from certain corporate governance requirements under the Sarbanes-Oxley Act or under the rules of the New York Stock Exchange. There may also be less publicly available information about Korean companies, such as us, than is regularly made available by public or non-public companies in other countries. Such differences in corporate governance standards and less public information could result in corporate governance practices or disclosures that are perceived as less than satisfactory by investors in certain countries.
A decline in the value of the collateral securing our loans and our inability to realize full collateral value may adversely affect our credit portfolio.
A substantial portion of our loans is secured by real estate, the values of which have fluctuated significantly in recent years. Although it is our general policy to lend up to 40% to 88% of the appraised value of collateral (except in certain regulated areas designated by the Korean government where we generally limit our lending to between 10% and 60% of the appraised value of collateral) and to periodically re-appraise our collateral, a downturn in the real estate market in Korea, which most recently commenced in 2022, may result in declines in the value of the collateral securing our mortgage and home equity loans. If collateral values decline in the future, they may not be sufficient to cover uncollectible amounts in respect of our secured loans. Any future declines in the value of the real estate or other collateral securing our loans, or our inability to obtain additional collateral in the event of such declines, could result in a deterioration in our asset quality and may require us to take additional loan loss provisions.
21
Table of Contents
In Korea, foreclosure on collateral generally requires a written petition to a court. An application, when made, may be subject to delays and administrative requirements that may result in a decrease in the value realized with respect to such collateral. We cannot guarantee that we will be able to realize the full value on our collateral as a result of, among other factors, delays in foreclosure proceedings and defects in the perfection of our security interest in collateral. Our failure to recover the expected value of collateral could expose us to losses.
The secondary market for corporate bonds in Korea is not fully developed, and, as a result, we may not be able to realize the full book value of debt securities we hold at the time of any sale of such securities.
As of December 31, 2022, we held debt securities issued by Korean companies and financial institutions (other than those issued by the Bank of Korea, the Korea Development Bank, Korea Housing Finance Corporation, Industrial Bank of Korea and the Export-Import Bank of Korea, which are government-owned or -controlled enterprises or financial institutions) with a total carrying amount of ₩51,325 billion in our trading and investment securities portfolio. The market value of these securities could decline significantly due to various factors, including future increases in interest rates or a deterioration in the financial and economic condition of any particular issuer or of Korea in general. Any of these factors individually or a combination of these factors would require us to write down the fair value of these debt securities, resulting in impairment losses. Because the secondary market for corporate bonds in Korea is not fully developed, the market value of many of these securities as reflected on our statements of financial position is determined by references to suggested prices posted by Korean rating agencies or the Korea Financial Investment Association. These valuations, however, may differ significantly from the actual value that we could realize in the event we elect to sell these securities. As a result, we may not be able to realize the full book value at the time of any such sale of these securities and thus may incur losses.
We may be required to make transfers from our general banking operations to cover shortfalls in our guaranteed trust accounts, which could have an adverse effect on our results of operations.
We manage a number of money trust accounts through Kookmin Bank, our banking subsidiary. Under Korean law, trust account assets of a bank are required to be segregated from the assets of that bank’s general banking operations. Those assets are not available to satisfy the claims of a bank’s depositors or other creditors of its general banking operations. For some of the trust accounts we manage, we have guaranteed either the principal amount of the investor’s investment or the principal and a fixed rate of interest.
If, at any time, the income from our guaranteed trust accounts is not sufficient to pay any guaranteed amount, we will have to cover the shortfall first from the special reserves maintained in these trust accounts, then from our fees from such trust accounts and finally from funds transferred from our general banking operations. As of December 31, 2022, we had ₩115 billion of special reserves in respect of trust accounts for which we provided guarantees of principal. There was no transfer from general banking operations to cover deficiencies in guaranteed trust accounts in 2020, 2021 and 2022. However, we may be required to make transfers from our general banking operations to cover shortfalls, if any, in our guaranteed trust accounts in the future. Such transfers may adversely impact our results of operations.
Our operations have been, and will continue to be, subject to increasing and continually evolving cyber security and other technological risks.
With the proliferation of new technologies and the increasing use of the Internet and mobile devices to conduct financial transactions, our operations as a large financial institution have been, and will continue to be, subject to an increasing risk of cyber incidents relating to these activities, the nature of which is continually evolving. Our computer systems, software and networks are subject to cyber incidents, such as disruptions, delays or other difficulties from our information technology system, computer viruses or other malicious codes, loss or destruction of data (including confidential client information), unauthorized access, account takeover attempts and cyber attacks. A significant portion of our daily operations relies on our information technology
22
Table of Contents
systems, including customer service, billing, the secure processing, storage and transmission of confidential and other information as well as the timely monitoring of a large number of complex transactions. Although we have made substantial and continual investments to build systems and defenses to address cyber security and other technological risks, there is no guarantee that such measures or any other measures can provide adequate security. In addition, because methods used to cause cyber attacks change frequently or, in some cases, are not recognized until launched, we may be unable to implement effective preventive measures or proactively address these methods. Furthermore, these cyber threats may arise from human error, accidental technological failure and third parties with whom we do business. Although we maintain insurance coverage that may cover certain aspects of cyber risks, such insurance coverage may be insufficient to cover all losses. If we were to be subject to a cyber incident, it could result in the disclosure of confidential client information, damage to our reputation with our customers and in the market, customer dissatisfaction, additional costs to us, regulatory penalties, exposure to litigation and other financial losses to both us and our customers, which could have an adverse effect on our business and results of operations.
Risks relating to liquidity and capital management
Our funding is highly dependent on short-term deposits, which dependence may adversely affect our operations.
We meet a significant amount of our funding requirements through short-term funding sources, which consist primarily of customer deposits. As of December 31, 2022, approximately 95.5% of our deposits had maturities of one year or less or were payable on demand. In the past, a substantial proportion of our customer deposits have been rolled over upon maturity. We cannot guarantee, however, that depositors will continue to roll over their deposits in the future. In the event that a substantial number of our short-term deposit customers withdraw their funds or fail to roll over their deposits as higher-yielding investment opportunities emerge, our liquidity position could be adversely affected. We may also be required to seek more expensive sources of short-term and long-term funding to finance our operations. See “Item 5.B. Liquidity and Capital Resources—Financial Condition—Liquidity.”
We may be required to raise additional capital if our capital adequacy ratio deteriorates or the applicable capital requirements change in the future, but we may not be able to do so on favorable terms or at all.
Under the capital adequacy requirements of the Financial Services Commission, as of December 31, 2022, both we and Kookmin Bank, our banking subsidiary, were required to maintain a total minimum common equity Tier I capital adequacy ratio of 8.0%, Tier I capital adequacy ratio of 9.5% and combined Tier I and Tier II capital adequacy ratio of 11.5%, on a consolidated basis (including applicable additional capital buffers and requirements as described below). As of December 31, 2022, our common equity Tier I capital, Tier I capital and combined Tier I and Tier II capital adequacy ratios were 13.24%, 14.86% and 16.16%, respectively, and Kookmin Bank’s common equity Tier I capital, Tier I capital and combined Tier I and Tier II capital adequacy ratios were 14.50%, 14.92% and 17.46%, respectively, all of which exceeded the minimum levels required by the Financial Services Commission. However, our capital base and capital adequacy ratios may deteriorate in the future if our results of operations or financial condition deteriorates for any reason, including as a result of a deterioration in the asset quality of our retail loans (including credit card balances) and loans to small- and medium-sized enterprises, or if we are not able to deploy our funding into suitably low-risk assets.
The current capital adequacy requirements of the Financial Services Commission are derived from a new set of bank capital measures, referred to as Basel III, which the Basel Committee on Banking Supervision initially introduced in 2009 and began phasing in starting from 2013. Commencing in July 2013, the Financial Services Commission promulgated a series of amended regulations implementing Basel III, pursuant to which Korean banks and bank holding companies were required to maintain a minimum ratio of common equity Tier I capital to risk-weighted assets of 3.5% and Tier I capital to risk-weighted assets of 4.5% from December 1, 2013, which minimum ratios were increased to 4.0% and 5.5%, respectively, from January 1, 2014 and increased further to
23
Table of Contents
4.5% and 6.0%, respectively, from January 1, 2015. The amended regulations also require an additional capital conservation buffer of 2.5% from January 2019, as well as a potential counter-cyclical capital buffer of up to 2.5%, which is determined on a quarterly basis by the Financial Services Commission and may be fully or partially enforced in 2023. Furthermore, we and Kookmin Bank were each designated as a domestic systemically important bank holding company and a domestic systemically important bank, respectively, for 2022 by the Financial Services Commission and were subject to an additional capital requirement of 1.0% in 2022. In July 2022, we and Kookmin Bank were each again designated as a domestic systemically important bank holding company and a domestic systemically important bank, respectively, for 2023, which would again subject us to an additional capital requirement of 1.0% in 2023. All such requirements are in addition to the pre-existing requirement for minimum ratios of Tier I and Tier II capital (less any capital deductions) to risk-weighted assets set forth above. The implementation of Basel III in Korea may have a significant effect on the capital requirements of Korean financial institutions, including us. See “Item 4.B. Business Overview—Supervision and Regulation—Principal Regulations Applicable to Financial Holding Companies—Capital Adequacy” and “—Principal Regulations Applicable to Banks—Capital Adequacy.”
We may be required to obtain additional capital in the future in order to remain in compliance with more stringent capital adequacy and other regulatory requirements. However, we may not be able to obtain additional capital on favorable terms, or at all. Our ability to obtain additional capital at any time may be constrained to the extent that banks or other financial institutions in Korea or from other countries are seeking to raise capital at the same time. To the extent that we fail to comply with applicable capital adequacy ratios or other regulatory requirements in the future, Korean regulatory authorities may impose penalties on us ranging from a warning to suspension or revocation of our banking license.
Significant increases in interest rates could decrease the value of our debt securities portfolio and raise our funding costs while reducing loan demand and the repayment ability of our borrowers, which, as a result, could adversely affect us.
Interest rates in Korea have been subject to significant fluctuations in recent years. After the Bank of Korea reduced its policy rate to 1.50% in 2015 and again to 1.25% in June 2016 amid deflationary concerns and interest rate cuts by central banks around the world, it increased its policy rate to 1.50% in November 2017 and 1.75% in November 2018 in light of improved growth prospects in Korea and rising interest rate levels globally. However, the Bank of Korea again lowered its policy rate to 1.50% in July 2019 and to 1.25% in October 2019 in order to address the sluggishness of the global and domestic economy. Subsequently, the Bank of Korea further lowered its policy rate to 0.75% in March 2020 and to 0.50% in May 2020 in response to deteriorating economic conditions resulting from the COVID-19 pandemic. However, as the economy began to show signs of recovery from the COVID-19 pandemic starting from the second half of 2021, the Bank of Korea gradually raised its policy rate to pre-pandemic levels of 1.25% from August 2021 through January 2022. More recently, in response to rising levels of household debt and inflation in Korea as well as globally, the Bank of Korea raised its policy rate further to 1.50% in April 2022, 1.75% in May 2022, 2.25% in July 2022, 2.50% in August 2022, 3.00% in October 2022, 3.25% in November 2022 and 3.50% in January 2023. All else being equal, increases in interest rates in the future could lead to a decline in the value of our portfolio of debt securities, which generally pay interest based on a fixed rate. A sustained increase in interest rates will also raise our funding costs, while reducing loan demand, especially among retail borrowers. Rising interest rates may therefore require us to re-balance our asset portfolio and our liabilities in order to minimize the risk of potential mismatches and maintain our profitability.
In addition, rising interest rate levels may adversely affect the Korean economy and the financial condition of our corporate and retail borrowers, including holders of our credit cards, which in turn may lead to a deterioration in our credit portfolio. In particular, since most of our retail and corporate loans bear interest at rates that adjust periodically based on prevailing market rates, a sustained increase in interest rate levels will increase the interest costs of our retail and corporate borrowers and could adversely affect their ability to make payments on their outstanding loans.
24
Table of Contents
Furthermore, in periods of increasing interest rates, the yields on the general account assets of our insurance subsidiaries may not be sufficient to fund the higher floating interest credit rates necessary to keep their interest-sensitive insurance products competitive. They may therefore have to accept a lower spread and thus lower profitability or face a decline in sales and greater attrition among their existing policyholders. In addition, in periods of increasing interest rates, the value of the debt securities and other general account assets of our insurance subsidiaries may decline, resulting in lower unrealized gains within other comprehensive income in their total equity, which in turn would lower their available capital and their risk-based capital adequacy ratio. Moreover, surrenders and withdrawals of insurance policies may increase as policyholders seek to buy products with perceived higher returns. This process may lead to a cash outflow from our insurance subsidiaries. Such cash outflows may require them to sell their investment assets at a time when the prices of those assets are lower because of the increase in market interest rates, which may result in investment losses.
Risks relating to government regulation and policy
Strengthening of consumer protection laws applicable to financial institutions could adversely affect our operations.
As a financial service provider, we are subject to a variety of regulations in Korea that are designed to protect financial consumers. In recent years, in light of heightened public concern regarding privacy issues, the Korean government has placed greater emphasis on the protection of personal information by financial institutions and has implemented a number of measures to enhance consumer protection, including considerable restrictions on the transfer or provision of personal information by financial institutions to their affiliates or holding company. Under the Personal Information Protection Act, financial institutions, as personal information managers, may not collect, store, maintain, utilize or provide resident registration numbers of their customers, unless other laws or regulations specifically require or permit the management of resident registration numbers. In addition, under the Use and Protection of Credit Information Act, a financial institution has a higher duty to protect all information that it collects from its customers and is required to treat such information as credit information. There are considerable restrictions on the transfer or provision of the information by financial institutions to their affiliates or holding company. Quintuple damages may be imposed on a financial institution for leakage of such information. Furthermore, under the Electronic Financial Transaction Act, a financial institution is primarily responsible for compensating its customers harmed by a cyber security breach affecting the financial institution even if the breach is not directly attributable to the financial institution.
Under the Financial Consumer Protection Act, which was enacted in March 2020, we, as a financial instrument distributor, are subject to heightened investor protection measures, including stricter distribution guidelines, improved financial dispute resolution procedures, increased liability for customer losses and newly imposed penalty surcharges. Following the enactment of the Financial Consumer Protection Act, financial regulators have published subordinate regulations to such Act, including the Enforcement Decree, Supervisory Regulations and Enforcement Rules to the Supervisory Regulations governing consumer protection within the financial industry.
These and other measures that may be implemented by the Korean government to strengthen consumer protection laws applicable to financial institutions may limit our operational flexibility and cause us to incur significant additional compliance costs, as well as subject us to increased potential liability to our customers, which could adversely affect our business and performance.
The Korean government may promote lending and financial support by the Korean financial industry to certain types of borrowers as a matter of policy, which financial institutions, including us, may decide to follow.
Through its policies and recommendations, the Korean government has promoted and, as a matter of policy, may continue to attempt to promote lending by the Korean financial industry to particular types of borrowers. For
25
Table of Contents
example, the Korean government has in the past provided and may continue to provide policy loans, which encourage lending to particular types of borrowers. It has generally done this by identifying sectors of the economy it wishes to promote and making low interest funding available to financial institutions that may voluntarily choose to lend to these sectors. All loans or credits we choose to make pursuant to such policy loans would be subject to review in accordance with our credit approval procedures. However, the availability of policy loans may influence us to lend to certain sectors or in a manner in which we otherwise would not in the absence of such loans from the government.
In the past, the Korean government has also announced policies under which financial institutions in Korea are encouraged to provide financial support to particular sectors. For example, in light of the deteriorating financial condition and liquidity position of small- and medium-sized enterprises in Korea and adverse conditions in the Korean economy affecting such enterprises, the Korean government had temporarily introduced measures in April 2020 intended to encourage Korean banks to provide financial support to small- and medium-sized enterprise and retail borrowers, including guidelines for Korean banks to extend loan terms and defer interest payments with respect to small- and medium-sized enterprises and SOHOs affected by the COVID-19 pandemic. See “—Risks relating to our small- and medium-sized enterprise loan portfolio—We have significant exposure to small- and medium-sized enterprises, and any financial difficulties experienced by these customers may result in a deterioration of our asset quality and have an adverse impact on us.” and “—Risks relating to our retail credit portfolio—Future changes in market conditions as well as other factors may lead to increases in delinquency levels of our retail loan portfolio.” The Korean government may in the future request financial institutions in Korea, including us, to make investments in or provide other forms of financial support to particular sectors of the Korean economy as a matter of policy, which financial institutions, including us, may decide to accept. We may incur costs or losses as a result of providing such financial support.
The Financial Services Commission may impose burdensome measures on us if it deems us or one of our subsidiaries to be financially unsound.
If the Financial Services Commission deems our financial condition or the financial condition of our subsidiaries to be unsound, or if we or our subsidiaries fail to meet applicable regulatory standards, such as minimum capital adequacy and liquidity ratios, the Financial Services Commission may order or recommend, among other things:
| • | capital increases or reductions; |
| • | stock cancellations or consolidations; |
| • | transfers of businesses; |
| • | sale of assets; |
| • | closures of subsidiaries or branch offices; |
| • | mergers with other financial institutions; and |
| • | suspensions of a part of our business operations. |
If any of these measures is imposed on us by the Financial Services Commission, they could hurt our business, results of operations and financial condition. In addition, if the Financial Services Commission orders us to partially or completely reduce our capital, you may lose part or all of your investment.
Risks relating to Korea
Escalations in tensions with North Korea could have an adverse effect on us and the market value of our ADSs.
Relations between Korea and North Korea have been tense throughout Korea’s modern history. The level of tension between the two Koreas has fluctuated and may increase abruptly as a result of current and future events.
26
Table of Contents
In particular, there have been heightened security concerns in recent years stemming from North Korea’s nuclear weapon and ballistic missile programs as well as its hostile military actions against Korea. Some of the significant incidents in recent years include the following:
| • | North Korea renounced its obligations under the Nuclear Non-Proliferation Treaty in January 2003 and conducted six rounds of nuclear tests since October 2006, including claimed detonations of hydrogen bombs, which are more powerful than plutonium bombs, and warheads that can be mounted on ballistic missiles. Over the years, North Korea has also conducted a series of ballistic missile tests, including missiles launched from submarines and intercontinental ballistic missiles that it claims can reach the United States mainland. North Korea has increased the frequency of its missile tests in 2022, firing over 60 ballistic missiles, including eight intercontinental ballistic missiles. In response, the Korean government has repeatedly condemned the provocations and flagrant violations of relevant United Nations Security Council resolutions. In February 2016, the government also closed the inter-Korea Gaesong Industrial Complex in response to North Korea’s fourth nuclear test in January 2016. Internationally, the United Nations Security Council has passed a series of resolutions condemning North Korea’s actions and significantly expanding the scope of sanctions applicable to North Korea, most recently in December 2017 in response to North Korea’s intercontinental ballistic missile test in November 2017. Over the years, the United States and the European Union have also expanded their sanctions applicable to North Korea. |
| • | In March 2010, a Korean naval vessel was destroyed by an underwater explosion, killing many of the crewmen on board. The Korean government formally accused North Korea of causing the sinking, while North Korea denied responsibility. Moreover, in November 2010, North Korea fired more than one hundred artillery shells that hit Korea’s Yeonpyeong Island near the Northern Limit Line, which acts as the de facto maritime boundary between Korea and North Korea on the west coast of the Korean peninsula, causing casualties and significant property damage. The Korean government condemned North Korea for the attack and vowed stern retaliation should there be further provocation. |
North Korea’s economy also faces severe challenges, which may further aggravate social and political pressures within North Korea. Although bilateral summit meetings were held between Korea and North Korea in April, May and September 2018 and between North Korea and the United States in June 2018, February 2019 and June 2019, there can be no assurance that the level of tensions affecting the Korean peninsula will not escalate in the future. Any increase in tensions, which may occur, for example, if North Korea experiences a leadership crisis, high-level contacts between Korea and North Korea or between the United States and North Korea break down or military hostilities occur, could have a material adverse effect on the Korean economy and on our business, financial condition and results of operations and the market value of our common stock and American depositary shares, or ADSs.
Unfavorable financial and economic developments in Korea may have an adverse effect on us.
We are incorporated in Korea, and substantially all of our operations are located in Korea. As a result, we are subject to political, economic, legal and regulatory risks specific to Korea, and our performance and successful fulfillment of our operational strategies are dependent to a large extent on the overall Korean economy. The economic indicators in Korea in recent years have shown mixed signs of deterioration and recovery. Following a period of deterioration due to the debilitating effects of the COVID-19 pandemic on the Korean economy as well as on the economies of Korea’s major trading partners in 2020, the overall Korean economy has shown some signs of recovery in 2021. See “Other risks relating to our business—The COVID-19 pandemic and any possible recurrence of other types of widespread infectious diseases may adversely affect our business, financial condition or results of operations.” However, the Korean economy in 2022 was characterized by high levels of uncertainty resulting from high inflation rates, a rise in interest rates and a depreciation of the Won against the U.S. dollar. As a result, future growth of the Korean economy is subject to many factors beyond our control, including developments in the global economy.
27
Table of Contents
In recent years, adverse conditions and volatility in the worldwide financial markets, fluctuations in oil and commodity prices and the increasing weakness of the global economy, among others due to the COVID-19 pandemic and more recently due to Russia’s invasion of Ukraine and ensuing sanctions against Russia, have contributed to the uncertainty of global economic prospects in general and have adversely affected, and may continue to adversely affect, the Korean economy. See “Other risks relating to our business—Unfavorable changes in the global financial markets could adversely affect our results of operations and financial condition.” The value of the Won relative to major foreign currencies has fluctuated significantly and, as a result of deteriorating global and Korean economic conditions, there recently has been significant volatility in the stock prices of Korean companies. Further declines in the Korea Composite Stock Price Index, or the KOSPI, and large amounts of sales of Korean securities by foreign investors and subsequent repatriation of the proceeds of such sales may adversely affect the value of the Won, the foreign currency reserves held by financial institutions in Korea, and the ability of Korean companies to raise capital. Any future deterioration of the Korean or global economy could adversely affect our business, financial condition and results of operations.
Developments that could have an adverse impact on Korea’s economy include:
| • | declines in consumer confidence and a slowdown in consumer spending in the Korean or global economy; |
| • | the occurrence of severe health pandemics, such as the COVID-19 pandemic, or other severe health epidemics in Korea or other parts of the world, such as the Middle East Respiratory Syndrome outbreak in Korea in 2015; |
| • | deterioration in economic or diplomatic relations between Korea and its trading partners or allies, including deterioration resulting from territorial or trade disputes or disagreements in foreign policy; |
| • | adverse conditions or developments in the economies of countries and regions that are important export markets for Korea, such as China, the United States, Europe and Japan, or in emerging market economies in Asia or elsewhere, including as a result of deteriorating economic and trade relations between the United States and China and increased uncertainties resulting from the United Kingdom’s exit from the European Union; |
| • | adverse changes or volatility in foreign currency reserve levels, commodity prices (including oil prices), exchange rates (including fluctuation of the U.S. dollar, Euro or Japanese Yen exchange rates or revaluation of the Chinese Renminbi), interest rates, inflation rates or stock markets; |
| • | hostilities, political or social tensions involving Russia (including the invasion of Ukraine by Russia and ensuing actions that the United States and other countries have taken or may take in the future) and the resulting adverse effects on the global supply of oil and other natural resources and the global financial markets; |
| • | increased sovereign default risks in select countries and the resulting adverse effects on the global financial markets; |
| • | a continuing rise in the level of household debt and increasing delinquencies and credit defaults by retail and small- and medium-sized enterprise borrowers in Korea; |
| • | a deterioration in the financial condition or performance of small- and medium-sized enterprises and other companies in Korea due to the Korean government’s policies to increase minimum wages and limit working hours of employees; |
| • | investigations of large Korean business groups and their senior management for possible misconduct; |
| • | social and labor unrest; |
| • | substantial changes in the market prices of Korean real estate; |
| • | a decrease in tax revenues or a substantial increase in the Korean government’s expenditures for fiscal stimulus measures, unemployment compensation and other economic and social programs, particularly |
28
Table of Contents
in light of the Korean government’s ongoing efforts to provide emergency relief payments to households and emergency loans to corporations in need of funding due to the COVID-19 pandemic, which, together, may lead to an increased government budget deficit; |
| • | financial problems or lack of progress in the restructuring of chaebols, other large troubled companies (including those in the construction, shipbuilding and shipping sectors) and their suppliers or the financial sector; |
| • | loss of investor confidence arising from corporate accounting irregularities or corporate governance issues at certain chaebols; |
| • | increases in social expenditures to support an aging population in Korea or decreases in economic productivity due to the declining population size in Korea; |
| • | the economic impact of any pending or future free trade agreements or of any changes to existing free trade agreements; |
| • | geo-political uncertainty and the risk of further attacks by terrorist groups around the world; |
| • | natural or man-made disasters that have a significant adverse economic or other impact on Korea or its major trading partners; |
| • | political uncertainty or increasing strife among or within political parties in Korea; |
| • | hostilities or political or social tensions involving oil-producing countries in the Middle East (including a potential escalation of hostilities between the United States and Iran) and Northern Africa and any material disruption in the global supply of oil or sudden increase in the price of oil; |
| • | increased reliance on exports to service foreign currency borrowings, which could cause friction with Korea’s trading partners; |
| • | an increase in the level of tensions or an outbreak of hostilities between North Korea and Korea or the United States; and |
| • | changes in financial regulations in Korea. |
Labor unrest in Korea may adversely affect our operations.
Economic difficulties in Korea or increases in corporate reorganizations and bankruptcies could result in layoffs and higher unemployment. Such developments could lead to social unrest and substantially increase government expenditures for unemployment compensation and other costs for social programs. According to statistics from the Korea National Statistical Office, the unemployment rate decreased from 4.0% in 2020 to 3.6% in 2021 and 2.9% in 2022. Increases in unemployment and any resulting labor unrest in the future could adversely affect our operations, as well as the operations of many of our customers and their ability to repay their loans, and could adversely affect the financial condition of Korean companies in general, depressing the price of their securities. These developments would likely have an adverse effect on our financial condition and results of operations.
Risks relating to our common stock and ADSs
We or our major stockholders may sell shares of our common stock or ADSs in the future, and these and other sales may adversely affect the market price of our common stock and ADSs and may dilute your investment and relative ownership in us.
We have no current plans for any public offerings of our common stock, ADSs or securities exchangeable for or convertible into such securities. However, it is possible that we may decide to offer or sell such securities in the future. In addition, our major stockholder, the Korean National Pension Service, held approximately 7.95% of our total issued common stock as of December 31, 2022, which it may sell at any time.
29
Table of Contents
Any future offerings or sales by us of our common stock or ADSs or securities exchangeable for or convertible into such securities, significant sales of our common stock by a major stockholder, or the public perception that an offering or sales may occur, could have an adverse effect on the market price of our common stock and ADSs. Furthermore, any offerings by us in the future of any such securities could have a dilutive impact on your investment and relative ownership interest in us.
Ownership of our common stock is restricted under Korean law.
Under the Financial Holding Company Act, a single stockholder, together with its affiliates, is generally prohibited from owning more than 10.0% of the issued and outstanding shares of voting stock of a bank holding company such as us that controls a nationwide bank, with the exception of certain stockholders that are non-financial business group companies, whose applicable limit has been reduced from 9.0% to 4.0% pursuant to an amendment of the Financial Holding Company Act which became effective from February 14, 2014. To the extent that the total number of shares of our common stock (including those represented by ADSs) that a holder and its affiliates own exceeds the applicable limits, that holder will not be entitled to exercise the voting rights for the excess shares, and the Financial Services Commission may order that holder to dispose of the excess shares within a period of up to six months. Failure to comply with such an order would result in an administrative fine of up to 0.03% of the book value of such shares per day until the date of disposal. Non-financial business group companies can no longer acquire more than 4.0% of the issued and outstanding shares of voting stock of a bank holding company pursuant to the amended Financial Holding Company Act, which grants an exception for non-financial business group companies which, at the time of the enactment of the amended provisions, held more than 4.0% of the shares thereof with the approval of the Financial Services Commission before the amendment. See “Item 4.B. Business Overview—Supervision and Regulation—Principal Regulations Applicable to Financial Holding Companies—Restrictions on Ownership of a Financial Holding Company.”
A holder of our ADSs may not be able to exercise dissent and appraisal rights unless it has withdrawn the underlying shares of our common stock and become our direct stockholder.
In some limited circumstances, including the transfer of the whole or any significant part of our business and the merger or consolidation of us with another company, dissenting stockholders have the right to require us to purchase their shares under Korean law. However, holders of our ADSs will not be able to exercise such dissent and appraisal rights if the depositary refuses to do so on their behalf. Our deposit agreement does not require the depositary to take any action in respect of exercising dissent and appraisal rights. In such a situation, holders of our ADSs must withdraw the underlying common stock from the ADS facility (and incur charges relating to that withdrawal) and become our direct stockholder prior to the record date of the stockholders’ meeting at which the relevant transaction is to be approved, in order to exercise dissent and appraisal rights.
A holder of our ADSs may be limited in its ability to deposit or withdraw common stock.
Under the terms of our deposit agreement, holders of common stock may deposit such stock with the depositary’s custodian in Korea and obtain ADSs, and holders of ADSs may surrender ADSs to the depositary and receive common stock. However, to the extent that a deposit of common stock exceeds the difference between:
| (1) | the aggregate number of common shares we have deposited or we have consented to allow to be deposited for the issuance of ADSs (including deposits in connection with offerings of ADSs and stock dividends or other distributions relating to ADSs); and |
| (2) | the number of shares of common stock on deposit with the custodian for the benefit of the depositary at the time of such proposed deposit, |
such common stock will not be accepted for deposit unless:
| (A) | our consent with respect to such deposit has been obtained; or |
| (B) | such consent is no longer required under Korean laws and regulations. |
30
Table of Contents
Under the terms of the deposit agreement, no consent is required if the shares of common stock are obtained through a dividend, free distribution, rights offering or reclassification of such stock. We have consented, under the terms of the deposit agreement, to any deposit to the extent that, after the deposit, the number of deposited shares does not exceed such number of shares as we determine from time to time (which number shall at no time be less than 100,000,000 shares), unless the deposit would be prohibited by applicable laws or ownership restrictions or violate our articles of incorporation. We might not consent to the deposit of any additional common stock. As a result, if a holder surrenders ADSs and withdraws common stock, it may not be able to deposit the stock again to obtain ADSs.
A holder of our ADSs will not have preemptive rights in some circumstances.
The Korean Commercial Code and our articles of incorporation require us, with some exceptions, to offer stockholders the right to subscribe for new shares of our common stock in proportion to their existing shareholding ratio whenever new shares are issued. If we offer any rights to subscribe for additional shares of our common stock or any rights of any other nature, to the extent practicable, the depositary may make the rights available to holders of our ADSs or dispose of the rights on behalf of such holders and make the net proceeds available to such holders. The depositary, however, is not required to make available to holders any rights to purchase any additional shares of our common stock unless it timely receives evidence satisfactory to it from us that it may lawfully do so and:
| • | a registration statement filed by us under the U.S. Securities Act of 1933, as amended, is in effect with respect to those shares; or |
| • | the offering and sale of those shares is exempt from or is not subject to the registration requirements of the Securities Act. |
Similarly, holders of our common stock located in the United States may not exercise any such rights they receive absent registration or an exemption from the registration requirements under the Securities Act.
We are under no obligation to file any registration statement with the U.S. Securities and Exchange Commission or to endeavor to cause such a registration statement to be declared effective. Moreover, we may not be able to establish an exemption from registration under the Securities Act. Accordingly, a holder of our ADSs may be unable to participate in our rights offerings and may experience dilution in its holdings. If a registration statement is required for a holder of our ADSs to exercise preemptive rights but is not filed by us or is not declared effective, the holder will not be able to exercise its preemptive rights for additional ADSs and it will suffer dilution of its equity interest in us. If the depositary is unable to sell rights that are not exercised or not distributed or if the sale is not lawful or practicable, it will allow the rights to lapse, in which case the holder will receive no value for these rights.
Dividend payments and the amount a holder of our ADSs may realize upon a sale of its ADSs will be affected by fluctuations in the exchange rate between the U.S. dollar and the Won.
Our common stock is listed on the KRX KOSPI Market of the Korea Exchange and quoted and traded in Won. Cash dividends, if any, in respect of the shares represented by the ADSs will be paid to the depositary in Won and then converted by the depositary into U.S. dollars, subject to certain conditions. Accordingly, fluctuations in the exchange rate between the Won and the U.S. dollar will affect, among other things, the amounts a holder of our ADSs will receive from the depositary in respect of dividends, the U.S. dollar value of the proceeds that it would receive upon sale in Korea of the shares of our common stock obtained upon surrender of ADSs and the secondary market price of ADSs. Such fluctuations will also affect the U.S. dollar value of dividends and sales proceeds received by holders of our common stock.
31
Table of Contents
The market value of an investment in our ADSs may fluctuate due to the volatility of the Korean securities market.
Our common stock is listed on the KRX KOSPI Market, which has a smaller market capitalization and is more volatile than the securities markets in the United States and many European countries. The market value of ADSs may fluctuate in response to the fluctuation of the trading price of shares of our common stock on the KRX KOSPI Market. The KRX KOSPI Market has experienced substantial fluctuations in the prices and volumes of sales of listed securities and the KRX KOSPI Market has prescribed a fixed range in which share prices are permitted to move on a daily basis. The KOSPI was 2,523.5 on April 24, 2023. There is no guarantee that the stock prices of Korean companies will not decline again in the future. Like other securities markets, including those in developed markets, the Korean securities market has experienced problems including market manipulation, insider trading and settlement failures. The recurrence of these or similar problems could have a material adverse effect on the market price and liquidity of the securities of Korean companies, including our common stock and ADSs, in both the domestic and the international markets.
The Korean government has the potential ability to exert substantial influence over many aspects of the private sector business community, and in the past has exerted that influence from time to time. For example, the Korean government has promoted mergers to reduce what it considers excess capacity in a particular industry and has also encouraged private companies to publicly offer their securities. Similar actions in the future could have the effect of depressing or boosting the Korean securities market, whether or not intended to do so. Accordingly, actions by the government, or the perception that such actions are taking place, may take place or has ceased, may cause sudden movements in the market prices of the securities of Korean companies in the future, which may affect the market price and liquidity of our common stock and ADSs.
If the Korean government deems that emergency circumstances are likely to occur, it may restrict holders of our ADSs and the depositary from converting and remitting dividends and other amounts in U.S. dollars.
If the Korean government deems that certain emergency circumstances, including, but not limited to, severe and sudden changes in domestic or overseas economic circumstances, extreme difficulty in stabilizing the balance of payments or implementing currency exchange rate and other macroeconomic policies, have occurred or are likely to occur, it may impose certain restrictions provided for under the Foreign Exchange Transaction Act, including the suspension of payments or requiring prior approval from governmental authorities for any transaction. See “Item 10.D. Exchange Controls—General.”
A holder of our ADSs may not be able to enforce a judgment of a foreign court against us.
We are a corporation with limited liability organized under the laws of Korea. Substantially all of our directors and officers and other persons named in this document reside in Korea, and all or a significant portion of the assets of our directors and officers and other persons named in this document and substantially all of our assets are located in Korea. As a result, it may not be possible for holders of our ADSs to effect service of process within the United States, or to enforce against them or us in the United States judgments obtained in United States courts based on the civil liability provisions of the federal securities laws of the United States. There is doubt as to the enforceability in Korea, either in original actions or in actions for enforcement of judgments of United States courts, of civil liabilities predicated on the United States federal securities laws.
| Item 4. | INFORMATION ON THE COMPANY |
For certain of the information required by subpart 1400 of Regulation S-K not included in this Item 4, see “Item 8.A. Consolidated Statements and Other Financial Information.”
32
Table of Contents
| Item 4.A. | History and Development of the Company |
Overview
We were established as a new financial holding company on September 29, 2008 pursuant to a “comprehensive stock transfer” under Korean law, whereby holders of the common stock of Kookmin Bank and certain of its subsidiaries transferred all of their shares to us in return for shares of our common stock. We were established pursuant to the Financial Holding Company Act, which was enacted in October 2000 and which, together with associated regulations and a related Enforcement Decree, has enabled banks and other financial institutions, including insurance companies, investment trust companies, credit card companies and securities companies, to be organized and managed under the auspices of a single financial holding company.
Our legal and commercial name is KB Financial Group Inc. Our registered office and principal executive offices are located at 26, Gukjegeumyung-ro 8-gil, Yeongdeungpo-gu, Seoul 07331, Korea. Our telephone number is +82-2-2073-7114. Our agent in the United States, Kookmin Bank, New York Branch, is located at 565 Fifth Avenue, 24th Floor, New York, NY 10017. Its telephone number is (212) 697-6100. The address of our English website is https://www.kbfg.com/Eng/index.jsp.
The U.S. Securities and Exchange Commission maintains a website (http://www.sec.gov), which contains reports, proxy and information statements and other information regarding issuers that file electronically with the U.S. Securities and Exchange Commission.
History of the Former Kookmin Bank
The former Kookmin Bank was established by the Korean government in 1963 under its original name of Citizens National Bank under the Citizens National Bank Act of Korea with majority government ownership. Under this Act, we were limited to providing banking services to the general public and to small- and medium-sized enterprises. In September 1994, we completed our initial public offering in Korea and listed our shares on the KRX KOSPI Market.
In January 1995, the Citizens National Bank Act of Korea was repealed and replaced by the Repeal Act of the Citizens National Bank Act. Our status was changed from a specialized bank to a nationwide commercial bank and in February 1995, we changed our name to Kookmin Bank. The Repeal Act allowed us to engage in lending to large businesses.
History of H&CB
H&CB was established by the Korean government in 1967 under the name Korea Housing Finance Corporation. In 1969, Korea Housing Finance Corporation became the Korea Housing Bank pursuant to the Korea Housing Bank Act. H&CB was originally established to provide low and middle income households with long-term, low-interest mortgages in order to help them purchase their own homes, and to promote the increase of housing supply in Korea by providing low-interest housing loans to construction companies. Until 1997 when the Korea Housing Bank Act was repealed, H&CB was the only entity in Korea allowed to provide mortgage loans with a term of longer than ten years. H&CB also had the exclusive ability to offer housing-related deposit accounts offering preferential rights to subscribe for newly-built apartments.
Merger of the Former Kookmin Bank and H&CB
Effective November 1, 2001, the former Kookmin Bank and H&CB merged into a new entity named Kookmin Bank. This merger resulted in Kookmin Bank becoming the largest commercial bank in Korea. Kookmin Bank’s ADSs were listed on the New York Stock Exchange on November 1, 2001 and its common shares were listed on the KRX KOSPI Market on November 9, 2001.
33
Table of Contents
Establishment of KB Financial Group
We were established on September 29, 2008 pursuant to a “comprehensive stock transfer” under Article 360-15 of the Korean Commercial Code, whereby holders of the common stock of Kookmin Bank and certain of its subsidiaries transferred all of their shares to us, a new financial holding company, and in return received shares of our common stock. In the stock transfer, each holder of one share of Kookmin Bank common stock received one share of our common stock, par value ₩5,000 per share. Holders of Kookmin Bank ADSs and global depositary shares, each of which represented one share of Kookmin Bank common stock, received one of our ADSs for every ADS or global depositary share they owned. In addition, holders of the common stock of certain of Kookmin Bank’s subsidiaries transferred all of their shares to us and, as consideration for such transferred shares, received shares of our common stock in accordance with the specified stock transfer ratio applicable to each such subsidiary. Following the completion of the stock transfer, Kookmin Bank and these subsidiaries—KB Investment & Securities Co., Ltd., KB Asset Management Co., Ltd., KB Real Estate Trust Co., Ltd., KB Investment Co., Ltd., KB Futures Co., Ltd., KB Credit Information Co., Ltd., and KB Data Systems Co., Ltd.—became our wholly-owned subsidiaries.
The purpose of the stock transfer and our establishment as a financial holding company was to reorganize the different businesses of Kookmin Bank and its subsidiaries under a holding company structure, the adoption of which we believed would:
| • | assist us in creating an integrated system that facilitates the sharing of customer information and the development of integrated products and services by the different businesses within our subsidiaries; |
| • | assist us in expanding our business scope to include new types of business with higher profit margins; |
| • | enhance our ability to pursue strategic investments or reorganizations by way of mergers, acquisitions, spin-offs or other means; |
| • | maximize our management efficiency; and |
| • | further enhance our capacity to expand our overseas operations. |
Following the stock transfer, our common stock was listed on the KRX KOSPI Market on October 10, 2008 and our ADSs were listed on the New York Stock Exchange on September 29, 2008.
| Item 4.B. | Business Overview |
Business
We are one of the largest financial holding companies in Korea, in terms of consolidated total assets, and our operations include Kookmin Bank, one of the leading commercial banks in Korea. Our subsidiaries collectively engage in a broad range of businesses, including commercial banking, credit cards, asset management, non-life and life insurance, capital markets activities and international banking and finance. As of December 31, 2022, we had consolidated total assets of ₩701 trillion, consolidated total deposits of ₩389 trillion and consolidated total equity of ₩50 trillion.
As part of our commercial banking activities, we provide credit and related financial services to individuals and small- and medium-sized enterprises and, to a lesser extent, to large corporate customers. We also provide a full range of deposit products and related services to both individuals and enterprises of all sizes. We provide these services predominantly through Kookmin Bank.
By their nature, our core consumer and small- and medium-sized enterprise operations place a high premium on customer access and convenience. Our combined banking network of 856 branches as of December 31, 2022, one of the most extensive in Korea, provides a solid foundation for our business and is a major source of our competitive strength. This network provides us with a large, stable and cost effective funding
34
Table of Contents
source, enables us to provide our customers convenient access and gives us the ability to provide the customer attention and service essential to conducting our business, particularly in an increasingly competitive environment. Our branch network is further enhanced by automated banking machines and fixed-line, smartphone and Internet banking. As of December 31, 2022, we had a customer base of approximately 37.1 million retail customers, which represented over one-half of the Korean population.
The following table sets forth the principal components of our lending business as of the dates indicated. As of December 31, 2022, retail loans and credit card loans and receivables accounted for 47.5% of our total loan portfolio:
| As of December 31, | ||||||||||||||||
| 2021 | 2022 | |||||||||||||||
| (in billions of Won, except percentages) | ||||||||||||||||
Retail | ||||||||||||||||
Mortgage and home equity(1) | ₩ | 120,418 | 28.6 | % | ₩ | 120,942 | 27.4 | % | ||||||||
Other consumer(2) | 71,223 | 16.9 | 65,997 | 15.0 | ||||||||||||
|
|
|
|
|
|
|
| |||||||||
Total retail | 191,641 | 45.5 | 186,939 | 42.4 | ||||||||||||
|
|
|
|
|
|
|
| |||||||||
Credit card | 20,768 | 4.9 | 22,562 | 5.1 | ||||||||||||
Corporate | 183,522 | 43.5 | 199,432 | 45.3 | ||||||||||||
Foreign | 25,654 | 6.1 | 31,756 | 7.2 | ||||||||||||
|
|
|
|
|
|
|
| |||||||||
Total loans | ₩ | 421,585 | 100.0 | % | ₩ | 440,689 | 100.0 | % | ||||||||
|
|
|
|
|
|
|
| |||||||||
| (1) | Includes ₩7,644 billion and ₩5,408 billion of overdraft loans secured by real estate in connection with home equity loans as of December 31, 2021 and 2022, respectively. |
| (2) | Includes ₩10,956 billion and ₩10,241 billion of overdraft loans as of December 31, 2021 and 2022, respectively. |
We provide a full range of personal lending products and retail banking services to individual customers, including mortgage loans. We are the largest private sector mortgage lender in Korea.
Lending to small- and medium-sized enterprises is the single largest component of our non-retail credit portfolio] and represents a widely diversified exposure to a broad spectrum of the Korean corporate community, both by type of lending and type of customer, with one of the categories being collateralized loans to SOHO customers that are among the smallest of the small- and medium-sized enterprises. The volume of our loans to small- and medium-sized enterprises requires a customer-oriented approach that is facilitated by our large and geographically diverse branch network.
With respect to large corporate customers, we continue to seek to maintain and expand quality relationships by providing them with an increasing range of fee-related services.
Strategy
Our strategic focus is to become a world-class financial group that ranks among the leaders of the financial industry in Asia and globally. We plan to continue to solidify our market position as Korea’s leading financial group, enhance our ability to provide comprehensive financial services to our retail and corporate customers and strengthen our overseas operating platform and network. In addition, we continually strive to achieve our goal of creating “a happier life and a better world” through a customer-centric management philosophy. We believe our strong market position in the commercial banking area in Korea is an important competitive advantage, which will enable us to compete more effectively based on convenient delivery, product breadth and differentiation, and service quality while focusing on our profitability.
35
Table of Contents
The key elements of our strategy are as follows:
Providing comprehensive financial services and maximizing synergies among our subsidiaries through our financial holding company structure
We believe the Korean financial services market has been undergoing and will continue to undergo significant change, resulting from, among other things, fluctuations in the Korean and global economy and the evolving social landscape in Korea, including the acceleration of population aging in Korea, the prevalence of smartphone usage, developments in digital and mobile technologies and the ensuing trend toward high-tech “smart banking” in the banking sector. In the context of such changes, we plan to become a comprehensive financial services provider capable of offering a full range of products and services to our large existing base of retail and corporate customers, as well as a global firm that can effectively compete with leading international financial institutions. To that end, we are continuing to implement specific initiatives including the enhancement of our group-wide integrated customer relationship management system to facilitate the sharing of customer information in accordance with applicable laws and the integration of various customer loyalty programs among our subsidiaries.
We believe our financial holding company structure gives us a competitive advantage over commercial banks and unaffiliated financial services providers by:
| • | allowing us to offer a more extensive range of financial products and services; |
| • | enabling us to share customer information, which is not permitted outside a financial holding company structure, thereby enhancing our risk management capabilities; |
| • | enhancing our ability to reduce costs in areas such as back-office processing and procurement; and |
| • | enabling us to raise and manage capital on a centralized basis. |
Identifying, targeting and marketing to attractive customer segments and providing superior customer value and service to such segments
In recent years, rather than focusing on developing products and services to satisfy the overall needs of the general population, we have increasingly targeted specific market segments in Korea that we expect to generate superior growth and profitability. We will continue to implement a targeted marketing approach that seeks to identify the most attractive customer segments and to develop strategies to build market share in those segments. In particular, we intend to increase our “wallet share” of existing high net worth customers by using our advanced customer relationship management technology to better identify and meet the needs of our most creditworthy customers, on whom we intend to concentrate our marketing efforts. For example, as part of this strategy, we operate a “priority customer” program called KB Star Club through five of our subsidiaries, Kookmin Bank, KB Securities, KB Insurance, KB Kookmin Card and KB Life Insurance. We select and classify KB Star Club customers based on their transaction history with the five entities and provide such customers with preferential treatment in various areas, including interest rates and transaction fees, depending upon how they are classified. We also provide private banking services, including wealth management services through our exclusive brand “Gold & Wise,” to increase our share of the priority customer market and in turn increase our profitability and strengthen our position in retail banking.
We are also focusing on attracting and retaining creditworthy customers by offering more differentiated fee-based products and services that are tailored to meet their specific needs. The development and marketing of our products and services are, in part, driven by customer segmentation to ensure that we meet the needs of each customer segment. For instance, we continue to develop hybrid financial products with enhanced features, including various deposit products and investment products, for which consumer demand has increased in recent years. We are also focusing on addressing the needs of our customers by providing the highest-quality products and services and developing an open-architecture strategy, which allows us to sell such products through one of
36
Table of Contents
the largest branch networks in Korea. In short, we aim to offer our customers a convenient one-stop financial services destination where they can meet their traditional retail and corporate banking requirements, as well as find a broad array of fee-based products and services tailored to address more specific financial needs, including in investment banking, securities brokerage, insurance and wealth management. We believe such differentiated, comprehensive services and cross-selling will not only enhance customer loyalty but also increase profitability.
One of our key customer-related strategies continues to be creating greater value and better service for our customers. We intend to continue improving our customer service, including through:
| • | Improved customer relationship management technology. Management has devoted substantial resources toward development of our customer relationship management system, which is designed to provide our employees with the information needed to continually improve the level of service and incentives offered to our preferred customers. Our integrated customer relationship system allows for better customer management and streamlines our customer reward system. We have also developed state-of-the-art call centers, smartphone applications and online Internet capabilities to provide shorter response times to customers seeking information or to execute transactions. Our goals are to continually focus on improving customer service to satisfy our customers’ needs through continuing efforts to deliver new and improved services and to upgrade our customer relationship management system to provide the best possible service to our customers in the future. |
| • | Enhanced distribution channels. We also believe we can improve customer retention and usage rates by increasing the range of products and services we offer and by developing a differentiated, multi-channel distribution network, including branches, ATMs, call centers, smartphone banking and Internet banking. We believe that our leading market position in the commercial banking area in Korea gives us a competitive advantage in developing and enhancing our distribution capabilities. |
Focusing on expanding and improving credit quality in our corporate lending business and increasing market share in the corporate financial services market
We plan to focus on corporate lending as one of our core businesses through attracting top-tier corporate customers and providing customized and distinctive products and services to build our position as a leading service provider in the Korean corporate financial market. To increase our market share in providing financial services to the corporate market, we intend to:
| • | promote a more balanced and strengthened portfolio with respect to our corporate business by developing our large corporate customer base and utilizing our improved credit management operations to better evaluate new large corporate and small- and medium-sized enterprise customers; |
| • | develop and sell more varied corporate financial products, consisting of transactional banking products which provide higher margin and less risk; |
| • | generate more fee income from large corporate customers through business-to-business transactions, foreign exchange transactions and derivative and other investment products, as well as investment banking services; |
| • | strengthen our marketing system based on our accumulated expertise in order to attract top-tier corporate customers; |
| • | focus on enhancing our channel network in order to provide the best service by strengthening our corporate customer management; and |
| • | further develop and train our core professionals with respect to this market, including through programs such as the “Career Development Path.” |
Strengthening internal risk management capabilities
We believe that ensuring strong asset quality through effective credit risk management is critical to maintaining stable growth and profitability and risk management will continue to be one of our key focus areas.
37
Table of Contents
One of our highest priorities is to improve our asset quality and more effectively price our lending products to take into account inherent credit risk in our portfolio. Our goal is to maintain the soundness of our credit portfolio, profitability and capital base. To this end, we intend to continue to strengthen our internal risk management capabilities by tightening our underwriting and management policies and improving our internal compliance policies. To accomplish this objective, we have undertaken the following initiatives:
| • | Strengthening underwriting procedures with advanced credit scoring techniques. We have centralized our credit management operations into our Credit Management and Analysis Group. Through such centralization, we aim to enhance our credit management expertise and improve our system of checks-and-balances with respect to our credit portfolio. We have also improved our ability to evaluate the credit of our small- and medium-sized enterprise customers through assigning experienced credit officers to our regional credit offices. We also require the same officer to evaluate, review and monitor the outstanding loans and other credits with respect to a customer, which we believe enhances the expertise and improves the efficiency and accountability of such officer, while enabling us to maintain a consistent credit policy. We have also, as a general matter, implemented enhanced credit analysis and scoring techniques, which we believe will enable us to make better-informed decisions about the credit we extend and improve our ability to respond more quickly to incipient credit problems. We are also focusing on enhancing our asset quality through improvement of our early monitoring systems and collection procedures. |
| • | Improving our internal compliance policy and ensuring strict application in our daily operations. We have improved our monitoring capabilities with respect to our internal compliance by providing training and educational programs to our management and employees. We have also implemented strict compliance policies to maintain the integrity of our risk management system. |
Cultivating a performance-based, customer-oriented culture that emphasizes market best practices
We believe a strong and dedicated workforce is critical to our ability to offer our customers the highest quality financial services and is integral to our goal of maintaining our position as one of Korea’s leading financial services providers. In the past, we have dedicated significant resources to develop and train our core professionals, and we intend to continue to enhance the productivity of our employees, including by regularly sponsoring in-house training and educational programs. We have also been seeking to cultivate a performance-based culture to create a work environment where members of our staff are incentivized to maximize their potential and in which our employees are directly rewarded for superior performance. We intend to maintain a professional workforce whose high quality of customer service reflects our goal to achieve and maintain global best practice standards in all areas of operations.
Retail Banking
Due to Kookmin Bank’s history and development as a retail bank and the know-how and expertise we have acquired from our activities in that market, retail banking has been and will continue to remain one of our core businesses. Our retail banking activities consist primarily of lending and deposit-taking.
38
Table of Contents
Lending Activities
We offer various loan products that target different segments of the population, with features tailored to each segment’s financial profile and other characteristics. The following table sets forth the balances and the percentage of our total retail lending represented by the categories of our retail loans as of the dates indicated:
| As of December 31, | ||||||||||||||||
| 2021 | 2022 | |||||||||||||||
| (in billions of Won, except percentages) | ||||||||||||||||
Retail: | ||||||||||||||||
Mortgage and home equity loans | ₩ | 120,418 | 62.8 | % | ₩ | 120,942 | 64.7 | % | ||||||||
Other consumer loans(1) | 71,223 | 37.2 | 65,997 | 35.3 | ||||||||||||
|
|
|
|
|
|
|
| |||||||||
Total | ₩ | 191,641 | 100.0 | % | ₩ | 186,939 | 100.0 | % | ||||||||
|
|
|
|
|
|
|
| |||||||||
| (1) | Excludes credit card loans, but includes overdraft loans. |
Our retail loans consist of:
| • | Mortgage loans, which are loans made to customers to finance home purchases, construction, improvements or rentals; and home equity loans, which are loans made to our customers secured by their homes to ensure loan repayment. We also provide overdraft loans in connection with our home equity loans. |
| • | Other consumer loans, which are loans made to customers for any purpose (other than mortgage and home equity loans). These include overdraft loans, which are loans extended to customers to cover insufficient funds when they withdraw funds from their demand deposit accounts with us in excess of the amount in such accounts up to a limit established by us. |
For secured loans, including mortgage and home equity loans, our policy is to lend up to 100% of the adjusted collateral value (except in areas of high speculation designated by the government where we generally limit our lending to between 10% and 60% of the appraised value of collateral) minus the value of any lien or other security interests that are prior to our security interest. In calculating the adjusted collateral value for real estate, we use the appraisal value of the collateral multiplied by a factor, generally between 40% to 88% (10% to 70% in the case of mortgage and home equity loans). This factor varies depending upon the location and use of the real estate and is established in part by taking into account court-supervised auction prices for nearby properties.
A borrower’s eligibility for our mortgage loans depends on the value of the mortgage property, the appropriateness of the use of proceeds and the borrower’s creditworthiness. A borrower’s eligibility for home equity loans is determined by the borrower’s credit and the value of the property, while the borrower’s eligibility for other consumer loans is primarily determined by the borrower’s credit. If the borrower’s credit deteriorates, it may be difficult for us to recover the loan. As a result, we review the borrower’s creditworthiness, collateral value, credit scoring and third party guarantees when evaluating a borrower. In addition, to reduce the interest rate of a loan or to qualify for a loan, a borrower may provide collateral, deposits or guarantees from third parties.
Mortgage and Home Equity Lending
The housing finance market in Korea is divided into public sector and private sector lending. In the public sector, two government entities, the National Housing and Urban Fund and the National Agricultural Cooperative Federation, are responsible for most of the mortgage lending.
Private sector mortgage and home equity lending in Korea has expanded substantially in recent years. We provide customers with a number of mortgage and home equity loan products that have flexible features,
39
Table of Contents
including terms, repayment schedules, amounts and eligibility for loans, and we offer interest rates on a commercial basis. The maximum term of mortgage loans is 40 years and the majority of our mortgage loans have long-term maturities, which may be renewed. Non-amortizing home equity loans have a maturity of one to five years and home equity loans subject to amortization of principal may have a maximum term of up to 35 years. As of December 31, 2022, we had ₩26,267 billion of amortizing home equity loans, representing 96.2% of our total home equity loans, and ₩1,026 billion of non-amortizing home equity loans, representing 3.8% of our total home equity loans. Any customer is eligible for a mortgage or an individual home equity loan regardless of whether it participates in one of our housing related savings programs and so long as that customer is not barred by regulation from obtaining a loan because of bad credit history. However, customers with whom we frequently transact business and provide us with significant revenue receive preferential interest rates on loans.
As of December 31, 2022, 49.6% of our mortgage loans were secured by residential property which is the subject of the loan, 25.7% of our mortgage loans were guaranteed by the Housing Finance Credit Guarantee Fund, a government housing-related entity, and the remaining 24.7% of our mortgage loans, contrary to general practices in the United States, were unsecured (although the use of proceeds from these loans is restricted to financing of home purchases and some of these loans are guaranteed by a third party). One reason that a relatively high percentage of our mortgage loans are unsecured is that we, along with other Korean banks, provide advance loans to borrowers for the down payment of new housing (particularly apartments) that is in the process of being built. Once construction is completed, which may take several years, these mortgage loans become secured by the new housing purchased by these borrowers. For the year ended December 31, 2022, the average initial loan-to-value ratio of our mortgage loans, which is a measure of the amount of loan exposure to the appraised value of the security collateralizing the loan, was approximately 39.7%. There are three reasons that our loan-to-value ratio is relatively lower (as is the case with other Korean banks) compared to similar ratios in other countries, such as the United States. The first reason is that housing prices are high in Korea relative to average income, so most people cannot afford to borrow an amount equal to the entire value of their collateral and make interest payments on such an amount. The second reason relates to the “jeonsae” system, through which people provide a key money deposit while residing in the property prior to its purchase. At the time of purchase, most people use the key money deposit as part of their payment and borrow the remaining amount from Korean banks, which results in a loan that will be for an amount smaller than the appraised value of the property for collateral and assessment purposes. The third reason is that Korean banks discount the appraised value of the borrower’s property for collateral and assessment purposes so that a portion of the appraised value is reserved in order to provide recourse to a renter who lives at the borrower’s property. This is in the event that the borrower’s property is seized by a creditor, and the renter is no longer able to reside at that property. See “Item 3.D. Risk Factors—Other risks relating to our business—A decline in the value of the collateral securing our loans and our inability to realize full collateral value may adversely affect our credit portfolio.”
The following table sets forth our unsecured and secured mortgage loans and home equity loans as of December 31, 2021 and 2022, based on their loan classification categories under IFRS and our internal credit ratings for loans (which are described in Note 4.2.4 of the notes to our consolidated financial statements):
| As of December 31, 2021 | ||||||||||||||||||||||||||||||||
| Stage 1 | Stage 2 | Stage 3 | Total | |||||||||||||||||||||||||||||
| Grade 1 | Grade 2 | Grade 3 | Grade 4 | Grade 5 | ||||||||||||||||||||||||||||
| (in billions of Won) | ||||||||||||||||||||||||||||||||
Mortgage: | ||||||||||||||||||||||||||||||||
Secured(1) | ₩ | 83,737 | ₩ | 1,299 | ₩ | 110 | ₩ | 4 | ₩ | 3 | ₩ | 6,225 | ₩ | 134 | ₩ | 91,512 | ||||||||||||||||
Unsecured | 1,341 | 6 | — | — | — | 31 | 3 | 1,381 | ||||||||||||||||||||||||
Home Equity: | ||||||||||||||||||||||||||||||||
Secured | 24,868 | 732 | 166 | 11 | 1 | 1,671 | 71 | 27,520 | ||||||||||||||||||||||||
Unsecured | 4 | — | 1 | — | — | — | — | 5 | ||||||||||||||||||||||||
|
|
|
|
|
|
|
|
|
|
|
|
|
|
|
| |||||||||||||||||
Total | ₩ | 109,950 | ₩ | 2,037 | ₩ | 277 | ₩ | 15 | ₩ | 4 | ₩ | 7,927 | ₩ | 208 | ₩ | 120,418 | ||||||||||||||||
|
|
|
|
|
|
|
|
|
|
|
|
|
|
|
| |||||||||||||||||
40
Table of Contents
| As of December 31, 2022 | ||||||||||||||||||||||||||||||||
| Stage 1 | Stage 2 | Stage 3 | Total | |||||||||||||||||||||||||||||
| Grade 1 | Grade 2 | Grade 3 | Grade 4 | Grade 5 | ||||||||||||||||||||||||||||
| (in billions of Won) | ||||||||||||||||||||||||||||||||
Mortgage: | ||||||||||||||||||||||||||||||||
Secured(1) | ₩ | 83,611 | ₩ | 1,457 | ₩ | 125 | ₩ | 28 | ₩ | 9 | ₩ | 5,900 | ₩ | 167 | ₩ | 91,297 | ||||||||||||||||
Unsecured | 2,306 | 11 | — | — | — | 32 | 3 | 2,352 | ||||||||||||||||||||||||
Home Equity: | ||||||||||||||||||||||||||||||||
Secured | 24,656 | 750 | 102 | 44 | 3 | 1,661 | 77 | 27,293 | ||||||||||||||||||||||||
Unsecured | — | — | — | — | — | — | — | — | ||||||||||||||||||||||||
|
|
|
|
|
|
|
|
|
|
|
|
|
|
|
| |||||||||||||||||
Total | ₩ | 110,573 | ₩ | 2,218 | ₩ | 227 | ₩ | 72 | ₩ | 12 | ₩ | 7,593 | ₩ | 247 | ₩ | 120,942 | ||||||||||||||||
|
|
|
|
|
|
|
|
|
|
|
|
|
|
|
| |||||||||||||||||
| (1) | Includes advance loans guaranteed by the Housing Finance Credit Guarantee Fund to borrowers for the down payment of new housing that is in the process of being built. |
Our home equity loan portfolio includes loans that are in a second lien position. In addition to the underwriting procedures we perform when we issue home equity loans in general, we perform additional underwriting procedures with respect to home equity loans secured by a second lien to assess and confirm the value and status of any loans secured by security interests on the collateral which would be prior to our security interest under the second lien home equity loan. Under regulations implemented by the Financial Supervisory Service, our home equity loans are subject to maximum loan-to-value ratios (i.e., the ratio of the aggregate principal amount of loans, including first and second lien loans, secured by a particular item of collateral to the appraised value of such collateral) of between 10% and 70%. As such, for home equity loans, we do not lend more than an amount equal to the adjusted collateral value (i.e., the collateral value as discounted by the required loan-to-value ratio) minus the value of any loans secured by security interests on the collateral that are prior to our security interest. Accordingly, in order to ascertain the value of loans secured by security interests on the collateral which would be prior to our security interest and to confirm the status of such loans, we perform additional underwriting procedures including a review of the relevant title and security interest registration documents and bank documents and certificates regarding such loans. In addition, for purposes of calculating debt-to-income ratios applicable to loans secured by certain types of housing under regulations implemented by the Financial Supervisory Service (see “—Supervision and Regulation—Principal Regulations Applicable to Banks—Regulations Relating to Retail Household Loans”), which we apply on a nationwide basis for our home equity loans, we perform additional adjustments in our debt-to-income ratio calculations with respect to second lien home equity loans to account for the value of loans secured by security interests on the collateral that are prior to our security interest.
Following the issuance of a home equity loan, we make use of the Korea Credit Information Services’ database of delinquent borrowers to generally monitor the compliance of our borrowers with their other loan obligations, including the compliance of our second lien borrowers with their first lien loans. If a borrower in Korea is past due on payments of interest or principal for more than three months on any of its outstanding loans to Korean financial institutions (including mortgage, home equity, other consumer and credit card loans), such borrower is registered on the Korea Credit Information Services’ database of delinquent borrowers, which we monitor on a daily basis. The information disclosed by such database, which includes the outstanding loan amount which is past due, the identity of the delinquent borrower and the name of the applicable lending institution for such loan, provides an early warning about such borrower to our loan officers at the branch level, who then closely monitor our outstanding loans to such delinquent borrower and take appropriate preventive and remedial measures (including requiring such borrower to provide additional collateral) as necessary. Upon the occurrence of a default in the first lien position, we treat the second lien home equity loan as part of our potential problem loans or non-performing loans. More specifically, upon learning of the occurrence of a default in the first lien position, we examine our second lien home equity loan to determine whether the loan should be re-classified as “precautionary,” “substandard” or “doubtful” according to the asset classification guidelines of the Financial Services Commission. Assuming that such second lien home equity loan is not delinquent, if the outstanding principal amount of the relevant first lien loan is less than ₩15 million, we classify the entire amount of the second lien home equity loan as “precautionary” and closely monitor it as a loan that may
41
Table of Contents
potentially become problematic. If the outstanding principal amount of the relevant first lien loan is ₩15 million or more or the borrower is undergoing, or preparing to undergo, foreclosure proceedings with respect to the underlying collateral, we classify the estimated recoverable amount of the second lien home equity loan as “substandard” and the rest of such loan amount as “doubtful.”
Pricing. The interest rates on our retail mortgage loans are generally based on a periodic floating rate (which is based on a base rate determined for three-month, six-month or twelve-month periods using our Market Opportunity Rate system, which reflects our internal cost of funding, further adjusted to account for our expenses related to lending). Our interest rates also incorporate a margin based among other things on the type of security, the credit score of the borrower and the estimated loss on the security. We can adjust the price to reflect the borrower’s current and/or expected future contribution to us. The applicable interest rate is determined at the time of the loan. If a loan is terminated prior to its maturity, the borrower is obligated to pay us an early termination fee of approximately 1.2% to 1.4% of the loan amount in addition to the accrued interest.
The interest rates on our home equity loans are determined on the same basis as our retail mortgage loans.
As of December 31, 2022, the Market Opportunity Rate was 4.03% for a three-month period, 4.40% for a six-month period and 4.41% for a twelve-month period.
Other Consumer Loans
Other consumer loans are primarily unsecured. However, such loans may be secured by real estate, deposits or securities. As of December 31, 2022, approximately ₩38,700 billion, or 58.6% of our consumer loans (other than mortgage and home equity loans) were unsecured loans (although some of these loans were guaranteed by a third party). Overdraft loans are also classified as other consumer loans, are primarily unsecured and generally have an initial maturity of one year, which is typically extended automatically on an annual basis and may be extended up to a maximum of five years. The amount of overdraft loans as of December 31, 2022 was approximately ₩10,241 billion.
Pricing. The interest rates on our other consumer loans (including overdraft loans) are determined on the same basis as on our mortgage and home equity loans, except that, for unsecured loans, the borrower’s credit score as determined during our loan approval process is also taken into account. See “Item 11. Quantitative and Qualitative Disclosures about Market Risk—Credit Risk Management.”
Deposit-taking Activities
Due to our extensive nationwide network of branches, together with our long history of development and our resulting know-how and expertise, as of December 31, 2022, we had the largest number of retail customers and retail deposits among Korean commercial banks. The balance of our deposits from retail customers was ₩221,429 billion and ₩229,891 billion as of December 31, 2021 and 2022, respectively, which constituted 59.5% and 59.1%, respectively, of the balance of our total deposits.
We offer many deposit products that target different segments of our retail customer base, with features tailored to each segment’s financial profile, characteristics and needs, including:
| • | Demand deposits, which either do not accrue interest or accrue interest at a lower rate than time deposits. Demand deposits allow the customer to deposit and withdraw funds at any time and, if they are interest bearing, accrue interest at a variable rate depending on the amount of deposit. Retail and corporate demand deposits constituted 38.3% of our total deposits as of December 31, 2022 and paid average interest of 0.25% for 2022. |
| • | Time deposits, which generally require the customer to maintain a deposit for a fixed term, during which the deposit accrues interest at a fixed rate or a variable rate based on the KOSPI, or to deposit |
42
Table of Contents
specified amounts on an installment basis. If the amount of the deposit is withdrawn prior to the end of the fixed term, the customer will be paid a lower interest rate than that originally offered. The term for time deposits typically ranges from one month to three years, and the term for installment savings deposits ranges from six months to five years. Retail and corporate time deposits constituted 48.7% of our total deposits as of December 31, 2022 and paid average interest of 2.11% for 2022. Most installment savings deposits offer fixed interest rates. |
| • | Certificates of deposit, the maturities of which typically range from 30 days to 730 days with a required minimum deposit of ₩10 million. Interest rates on certificates of deposit are determined based on the length of the deposit and prevailing market rates. Our certificates of deposit are sold at a discount to their face value, reflecting the interest payable on the certificates of deposit. |
| • | Foreign currency deposits, which are available to Korean and foreign residents, non-residents and overseas immigrants. We offer foreign currency demand deposits and time deposits as well as checking accounts in 11 currencies. Foreign currency demand deposits, which accrue interest at a variable rate, allow customers to deposit and withdraw funds at any time. Foreign currency time deposits generally require customers to maintain the deposit for a fixed term, during which the deposit accrues interest at a fixed rate. If the funds in a foreign currency time deposit are withdrawn prior to the end of the fixed term, the customer will be paid a lower interest rate than that originally offered. |
We offer varying interest rates on our deposit products depending upon average funding costs, the rate of return on our interest-earning assets and the interest rates offered by other commercial banks.
We also offer comprehensive savings deposits for housing subscription, which are monthly installment savings deposits that provide the holder with preferential rights to subscribe for both public and private housing under the Housing Act. This law is the basic law setting forth various measures supporting the purchase of houses and the supply of such houses by construction companies. These deposits require monthly installments of ₩20,000 to ₩500,000 and accrue interest at variable rates depending on the term. An eligible account holder with ₩70 million or less in annual salary income may also claim a tax deduction for 40% of its annual installment amounts, subject to a maximum deductible amount, in its income tax return for the year under the Special Tax Treatment Control Law.
In 2002, after significant research and planning, we launched private banking operations at Kookmin Bank’s headquarters. Shortly thereafter, we launched a comprehensive strategy with respect to customers with higher net worth, which included staffing appropriate representatives, marketing aggressively, establishing IT systems, selecting appropriate branch locations and readying such branches with the necessary facilities to service such customers. As of December 31, 2022, we operated 23 main private banking centers through Kookmin Bank.
The Monetary Policy Board of the Bank of Korea, or the Monetary Policy Board, imposes a reserve requirement on Won currency deposits of commercial banks based generally on the type of deposit instrument. The reserve requirement is currently up to 7%. See “—Supervision and Regulation—Principal Regulations Applicable to Banks—Liquidity.”
The Depositor Protection Act provides for a deposit insurance system where the Korea Deposit Insurance Corporation guarantees to depositors the repayment of their eligible bank deposits. The deposit insurance system insures up to a total of ₩50 million per depositor per bank. See “—Supervision and Regulation—Principal Regulations Applicable to Banks—Deposit Insurance System.”
Credit Cards
Credit cards are another of our core retail products. We issue most of our credit cards under the “KB Kookmin Card” brand. Our credit card business is operated by our subsidiary, KB Kookmin Card Co., Ltd.
43
Table of Contents
The following table sets forth certain data relating to our credit card operations, on a non-consolidated basis, as of the dates and for the periods indicated:
| As of and for the Year Ended December 31, | ||||||||||||
| 2020 | 2021 | 2022 | ||||||||||
| (in billions of Won, except number of holders, accounts and percentages) | ||||||||||||
Number of credit cardholders (at year end) (thousands) | ||||||||||||
General accounts | 10,586 | 10,879 | 11,493 | |||||||||
Corporate accounts | 550 | 554 | 611 | |||||||||
|
|
|
|
|
| |||||||
Total | 11,136 | 11,433 | 12,104 | |||||||||
|
|
|
|
|
| |||||||
Number of merchants (at year end) (thousands) | 2,743 | 2,856 | 2,924 | |||||||||
Active ratio (at year end)(1) | 90.4 | % | 90.8 | % | 90.2 | % | ||||||
Credit card fees | ||||||||||||
Merchant fees(2) | ₩ | 1,302 | ₩ | 1,420 | ₩ | 1,423 | ||||||
Installment and cash advance fees | 475 | 463 | 541 | |||||||||
Annual membership fees | 157 | 169 | 182 | |||||||||
Other fees | 982 | 1,015 | 1,094 | |||||||||
|
|
|
|
|
| |||||||
Total | ₩ | 2,916 | ₩ | 3,067 | ₩ | 3,240 | ||||||
|
|
|
|
|
| |||||||
Charge volume(3) | ||||||||||||
General purchase | ₩ | 81,328 | ₩ | 91,313 | ₩ | 105,479 | ||||||
Installment purchase | 19,321 | 20,417 | 22,174 | |||||||||
Cash advance | 8,591 | 8,891 | 9,424 | |||||||||
Card loan(4) | 7,184 | 7,248 | 7,178 | |||||||||
|
|
|
|
|
| |||||||
Total | ₩ | 116,424 | ₩ | 127,869 | ₩ | 144,255 | ||||||
|
|
|
|
|
| |||||||
Outstanding balance (at year end) | ||||||||||||
General purchase | ₩ | 6,732 | ₩ | 7,987 | ₩ | 8,611 | ||||||
Installment purchase | 5,360 | 5,842 | 6,565 | |||||||||
Cash advance | 1,054 | 1,153 | 1,237 | |||||||||
Card loan(4) | 5,623 | 5,821 | 6,249 | |||||||||
|
|
|
|
|
| |||||||
Total | ₩ | 18,769 | ₩ | 20,803 | ₩ | 22,662 | ||||||
|
|
|
|
|
| |||||||
Average outstanding balances | ||||||||||||
General purchase | ₩ | 6,841 | ₩ | 7,455 | ₩ | 8,631 | ||||||
Installment purchase | 5,198 | 5,503 | 6,161 | |||||||||
Cash advance | 1,098 | 1,081 | 1,155 | |||||||||
Card loan(4) | 5,440 | 5,846 | 6,146 | |||||||||
|
|
|
|
|
| |||||||
Total | ₩ | 18,577 | ₩ | 19,885 | ₩ | 22,093 | ||||||
|
|
|
|
|
| |||||||
Delinquency ratios (at year end)(5) | ||||||||||||
From 1 month to 3 months | 0.50 | % | 0.45 | % | 0.62 | % | ||||||
From 3 months to 6 months | 0.46 | 0.38 | 0.36 | |||||||||
Over 6 months | 0.10 | 0.07 | 0.03 | |||||||||
|
|
|
|
|
| |||||||
Total | 1.06 | % | 0.91 | % | 1.01 | % | ||||||
|
|
|
|
|
| |||||||
Non-performing loan ratio | 0.55 | % | 0.47 | % | 0.40 | % | ||||||
Write-offs (gross) | ₩ | 501 | ₩ | 422 | ₩ | 444 | ||||||
Recoveries(6) | 137 | 136 | 123 | |||||||||
|
|
|
|
|
| |||||||
Net write-offs | ₩ | 364 | ₩ | 286 | ₩ | 321 | ||||||
|
|
|
|
|
| |||||||
Gross write-off ratio(7) | 2.70 | % | 2.10 | % | 1.99 | % | ||||||
Net write-off ratio(8) | 1.96 | % | 1.42 | % | 1.44 | % | ||||||
| (1) | The active ratio represents the ratio of accounts used at least once within the last six months to total accounts as of year-end. |
| (2) | Merchant fees consist of maintenance fees and costs associated with prepayment by us (on behalf of customers) of sales proceeds to merchants, processing fees relating to sales and membership applications, costs relating to the management of delinquencies and recoveries, provision for loan losses, general variable expenses and other fixed costs that are charged to our member merchants. We |
44
Table of Contents
| typically charge our member merchants fees that range from 0.5% to 2.3%. We offer discounts for member merchants that are small- and medium-sized enterprises pursuant to applicable laws. |
| (3) | Represents the aggregate cumulative amount charged during the year. |
| (4) | Card loans consist of loans that are provided on an unsecured basis to cardholders upon prior agreement. Payment on such a loan can be due either in one payment or in installments after a fixed period, in the case of principal payments, and will be due in installments, in the case of interest payments. |
| (5) | Represents ratio of credit card balances overdue by one month or more to outstanding balance. In line with industry practice, we have restructured a portion of delinquent credit card account balances as loans. As of December 31, 2021 and 2022, these restructured loans amounted to ₩112 billion and ₩117 billion, respectively. Because these restructured loans are not treated as being delinquent at the time of conversion or for a period of time thereafter, our delinquency ratios may not fully reflect all delinquent amounts relating to our outstanding balances. |
| (6) | Does not include proceeds that we received from sales of our non-performing loans that were written off. |
| (7) | Represents the ratio of gross write-offs for the year to average outstanding balance for the year. Our charge-off policy is generally to write off balances which have been overdue for four payment cycles or more or which have been classified as expected loss. |
| (8) | Represents the ratio of net write-offs for the year to average outstanding balances for the year. Our charge-off policy is generally to write off balances which have been overdue for four payment cycles or more or which have been classified as expected loss. |
In contrast to the system in the United States and many other countries, where most credit cards are revolving cards that allow outstanding amounts to be rolled over from month to month so long as a required minimum percentage is repaid, credit cardholders in Korea are generally required to pay for their purchases within approximately 14 to 44 days of purchase depending on their payment cycle. However, we also offer revolving payment plans to individuals that allow outstanding amounts to be rolled over to subsequent payment periods. Delinquent accounts (defined as amounts overdue for one day or more) are charged penalty interest and closely monitored. For installment purchases, we charge interest on unpaid installments at rates that vary according to the individual cardholder’s membership level, which is based on, among others, transaction history, the length of the cardholder’s relationship with us and contribution to our profitability.
We are committed to continuing to enhance our credit card business by strengthening our risk management and maximizing our operational efficiency. In addition, we believe that our extensive branch network, brand recognition and overall size will enable us to cross-sell products such as credit cards to our existing and new customers.
To promote our credit card business, we offer services targeted to various financial profiles and customer requirements and are concentrating on:
| • | strengthening cross-sales to existing customers and offering integrated financial services; |
| • | offering cards that provide additional benefits such as frequent flyer miles and reward program points that can be redeemed by the customer for complementary services, prizes and cash; |
| • | offering platinum cards, VVIP cards and other prime members’ cards, which have a higher credit limit and provide additional services in return for a higher fee; |
| • | acquiring new customers through strategic alliances and cross-marketing with retailers; |
| • | encouraging increased use of credit cards by existing customers through special offers for frequent users; |
| • | introducing new features such as travel services and insurance through alliance partners; and |
| • | developing fraud detection and security systems to prevent the misuse of credit cards. |
As of December 31, 2022, we had approximately 12.1 million credit cardholders. Of the credit cards outstanding, approximately 90.2% were active, meaning that they had been used at least once during the previous six months.
Our card revenues consist principally of cash advance fees, merchant fees, credit card installment fees, interest income from credit card loans, annual fees paid by cardholders, interest and fees on late payments and, with respect to revolving payment plans we offer, interest and fees relating to revolving balances.
45
Table of Contents
Under non-exclusive license agreements with overseas financial services corporations, we also issue MasterCard, Visa, American Express, JCB and China UnionPay credit cards.
We issue debit cards and charge merchants commissions in the amount of approximately 1.0% of the amounts purchased using a debit card. We also issue “check cards,” which are similar to debit cards except that “check cards” are accepted by all merchants that accept credit cards, and charge merchants commissions that typically range from 0.25% to 1.50%. Much like debit cards, check card purchases are also debited directly from customers’ accounts with us.
Corporate Banking
We lend to and take deposits from small- and medium-sized enterprises and, to a lesser extent, large corporate customers. Kookmin Bank, our banking subsidiary, had 432,172 small- and medium-sized enterprise borrowers and 1,896 large corporate borrowers for Won-currency loans as of December 31, 2022. For 2022, we received fee revenue from cash management services offered to corporate customers, which include “firm-banking” services such as inter-account transfers, transfers of funds from various branches and agencies of a company (such as insurance premium payments) to the account of the headquarters of such company and transfers of funds from various customers of a company to the main account of such company, in the amount of ₩114.5 billion. Of our branch network as of December 31, 2022, we had two branches that primarily handled large corporate banking.
The following table sets forth the balances and the percentage of our total corporate lending represented by our small- and medium-sized enterprise business loans and our large corporate business loans as of the dates indicated, estimated based on our internal classifications of corporate borrowers:
| As of December 31, | ||||||||||||||||
| 2021 | 2022 | |||||||||||||||
| (in billions of Won, except percentages) | ||||||||||||||||
Corporate: | ||||||||||||||||
Small- and medium-sized enterprise loans | ₩ | 136,587 | 80.3 | % | ₩ | 147,012 | 80.2 | % | ||||||||
Large corporate loans | 33,592 | 19.7 | 36,364 | 19.8 | ||||||||||||
|
|
|
|
|
|
|
| |||||||||
Total | ₩ | 170,179 | 100.0 | % | ₩ | 183,376 | 100.0 | % | ||||||||
|
|
|
|
|
|
|
| |||||||||
On the deposit-taking side, we currently offer our corporate customers several types of corporate deposits. Our corporate deposit products can be divided into two general categories: (1) demand deposits that have no restrictions on deposits or withdrawals, but which offer a relatively low interest rate; and (2) deposits from which withdrawals are restricted for a period of time, but offer higher interest rates. We also offer installment savings deposits, certificates of deposit and repurchase instruments. We offer varying interest rates on deposit products depending upon the rate of return on our income-earning assets, average funding costs and interest rates offered by other nationwide commercial banks.
The total amount of deposits from our corporate customers amounted to ₩151,006 billion as of December 31, 2022, or 38.8% of our total deposits.
Small- and Medium-sized Enterprise Banking
Our small- and medium-sized enterprise banking business has traditionally been and will remain one of our core businesses because of both our historical development and our accumulated expertise. We believe that we possess the necessary elements to succeed in the small- and medium-sized enterprise market, including our extensive branch network, our credit rating system for credit approval, our marketing capabilities (which we believe have provided us with significant brand loyalty) and our ability to take advantage of economies of scale.
46
Table of Contents
We use the term “small- and medium-sized enterprises” as defined in the Framework Act on Small and Medium Enterprises and related regulations. Under the Framework Act on Small and Medium Enterprises and related regulations, an enterprise must meet each of the following criteria in order to meet the definition of a small- and medium-sized enterprise: (i) total assets at the end of the immediately preceding fiscal year must be less than ₩500 billion, (ii) the average or annual sales revenue standards as prescribed by the Enforcement Decree of the Framework Act on Small and Medium Enterprises that are applicable to the enterprise’s primary business must be met and (iii) the standards of management independence as prescribed by the Enforcement Decree of the Framework Act on Small and Medium Enterprises must be met. However, pursuant to an amendment to the Framework Act on Small and Medium Enterprises, which has become effective in June 2020, an enterprise that qualifies as a small- and medium-sized enterprise pursuant to the above definition shall no longer be considered a small- and medium-sized enterprise if it is incorporated into, or is deemed to be incorporated into, a business group subject to certain disclosure requirements under the Monopoly Regulation and Fair Trade Act. Moreover, certified social enterprises (as defined in the Social Enterprise Promotion Act) and cooperatives and federations of cooperatives (each as defined in the Framework Act on Cooperatives, the Consumer Cooperatives Act and the Small and Medium Enterprise Cooperatives Act) that satisfy the requirements prescribed by the Framework Act on Small and Medium Enterprises may also qualify as small- and medium-sized enterprises.
Lending Activities
Our principal loan products for our small- and medium-sized enterprise customers are working capital loans and facilities loans. Working capital loans are provided to finance working capital requirements and include notes discounted and trade financing. Facilities loans are provided to finance the purchase of equipment and the establishment of manufacturing assembly plants. As of December 31, 2022, working capital loans and facilities loans accounted for 48.9% and 51.1%, respectively, of our total small- and medium-sized enterprise loans. As of December 31, 2022, Kookmin Bank, our banking subsidiary, had 432,172 small- and medium-sized enterprise customers on the lending side.
Loans to small- and medium-sized enterprises may be secured by real estate or deposits or may be unsecured. As of December 31, 2022, secured loans and guaranteed loans accounted for, in the aggregate, 82.7% of our small- and medium-sized enterprise loans. Among the secured loans, 97.8% were secured by real estate and 2.2% were secured by deposits or securities. Working capital loans generally have a maturity of one year, but may be extended for additional terms of up to one year in length for an aggregate term of five years. Facilities loans have a maximum maturity of 15 years.
When evaluating the extension of working capital loans, we review the corporate customer’s creditworthiness and capability to generate cash. Furthermore, we take credit guaranty letters from other financial institutions and use time deposits that the borrower has with us as collateral, and may require additional collateral.
The value of any collateral is defined using a formula that takes into account the appraised value of the property, any prior liens or other claims against the property and an adjustment factor based on a number of considerations including, with respect to property, the value of any nearby property sold in a court-supervised auction during the previous five years. We revalue any collateral on a periodic basis (generally every year) or if a trigger event occurs with respect to the loan in question.
We also offer mortgage loans to home builders or developers who build or sell single- or multi-family housing units, principally apartment buildings. Many of these builders and developers are categorized as small- and medium-sized enterprises. We offer a variety of such mortgage loans, including loans to purchase property or finance the construction of housing units and loans to contractors used for working capital purposes. Such mortgage loans subject us to the risk that the housing units will not be sold. As a result, we review the probability of the sale of the housing unit when evaluating the extension of a loan. We also review the borrower’s
47
Table of Contents
creditworthiness and the adequacy of the intended use of proceeds. Furthermore, we take a lien on the land on which the housing unit is to be constructed as collateral. If the collateral is not sufficient to cover the loan, we also take a guarantee from the Housing Finance Credit Guarantee Fund as security.
A substantial number of our small- and medium-sized enterprise customers are SOHOs, which we currently define to include sole proprietorships and individual business interests. With respect to SOHOs, we apply credit risk evaluation models, which not only use quantitative analysis related to a customer’s accounts, personal credit and financial information and due amounts but also require our credit officers to perform a qualitative analysis of each potential SOHO customer. With respect to SOHO loans in excess of ₩1 billion, our credit risk evaluation model also includes a quantitative analysis of the financial statements of the underlying business. We generally lend to SOHOs on a secured basis, although a small portion of our SOHO exposures are unsecured.
Pricing
We establish the price for our corporate loan products based principally on transaction risk, our cost of funding and market considerations. Transaction risk is measured by such factors as the credit rating assigned to a particular borrower, the size of the borrower and the value and type of collateral. Our loans are priced based on the Market Opportunity Rate system, which is a periodic floating rate system that takes into account the current market interest rate. For the Market Opportunity Rate as of December 31, 2022, see “—Retail Banking—Lending Activities—Mortgage and Home Equity Lending—Pricing.”
While we generally utilize the Market Opportunity Rate system, depending on the price and other terms set by competing banks for similar borrowers, we may adjust the interest rate we charge to compete more effectively with other banks.
Large Corporate Banking
Large corporate customers include all companies that are not small- and medium-sized enterprise customers. Kookmin Bank’s articles of incorporation provide that financial services to large corporate customers must be no more than 40% of the total amount of our Won-denominated loans. Our business focus with respect to large corporate banking is to selectively increase the proportion of high quality large corporate customers. Specifically, we are carrying out various initiatives to improve our customer relationship with large corporate customers and have been seeking to expand our service offerings to this segment.
Lending Activities
Our principal loan products for our large corporate customers are working capital loans and facilities loans. As of December 31, 2022, working capital loans and facilities loans accounted for 77.6% and 22.4%, respectively, of our total large corporate loans. We also offer mortgage loans to large corporate clients who build or sell single- or multi-family housing units, as described above under “—Small- and Medium-sized Enterprise Banking—Lending Activities.”
As of December 31, 2022, secured loans and guaranteed loans accounted for, in the aggregate, 39.3% of our large corporate loans. Among the secured loans, 71.1% were secured by real estate and 28.9% were secured by deposits or securities. Working capital loans generally have a maturity of one year, but may be extended for additional terms ranging from three months to one year in length for an aggregate term of five years. Facilities loans have a maximum maturity of 15 years.
In our unsecured lending to large corporate customers, a critical consideration in our policy regarding the extension of such unsecured loans is the borrower’s creditworthiness. We assign each borrower a credit rating based on the judgment of our experts or scores calculated using the appropriate credit rating system, taking into account both financial factors and non-financial factors (such as our perception of a borrower’s reliability,
48
Table of Contents
management and operational risk and risk relating to the borrower’s industry). The credit ratings, along with such factors, are key determinants in our lending to large corporate customers. Large corporate customers generally have higher credit ratings due to their higher repayment capability compared to other types of borrowers, such as small- and medium-sized enterprise borrowers. In addition, large corporate borrowers generally are affected to a lesser extent than small- and medium-sized enterprise borrowers by fluctuations in the Korean economy and also maintain more sophisticated financial records. As of December 31, 2022, 92.4% of our large corporate customers had credit ratings of BBB- or above according to the internal credit rating system of Kookmin Bank, compared to 83.9% of our small- and medium-sized enterprise customers. A credit rating of BBB- is assigned to customers whose ability to repay the principal and interest on their outstanding loans is determined by us to be generally satisfactory but nonetheless subject to adverse effects under unfavorable economic conditions or during downturns in the business environment. Based on our internal analysis of historical data, we believe that the probability of default for loans extended to large corporate customers with a credit rating of BBB- or above is between 0.00% and 2.26%.
We monitor the credit status of large corporate borrowers and collect information to adjust our ratings appropriately. We also manage and monitor our large corporate customers through a dedicated Corporate Banking Branch and Kookmin Bank’s Large Corporate Business Department. In addition, Kookmin Bank’s Credit Risk Department manages the exposures to each large corporate customer and conducts in-depth analysis of various economic and industry-related risks that are relevant to large corporate customers.
As of December 31, 2022, in terms of our outstanding loan balance, 29.1% was extended to borrowers in the financial industry, 26.8% of our large corporate loans was extended to borrowers in the manufacturing industry, and 22.7% was extended to borrowers in the service industry.
Pricing
We determine pricing of our large corporate loans in the same way as we determine the pricing of our small- and medium-sized enterprise loans. See “—Small- and Medium-sized Enterprise Banking—Pricing” above. As of December 31, 2022, the Market Opportunity Rate, which is utilized in pricing loans offered by us, was the same for our large corporate loans as for our small- and medium-sized enterprise loans.
Capital Markets Activities and International Banking/Finance
Through our capital markets operations, we invest and trade in debt and equity securities and, to a lesser extent, engage in derivatives and asset securitization transactions and make call loans. We also provide investment banking and securities brokerage services.
Securities Investment and Trading
We invest in and trade securities for our own account in order to maintain adequate sources of liquidity and to generate interest and dividend income and capital gains. As of December 31, 2021 and 2022, our investment portfolio, which consists primarily of financial assets at amortized cost and financial assets at fair value through other comprehensive income and our trading portfolio had a combined total carrying amount of ₩170,523 billion and ₩181,287 billion (including the investment and trading portfolios of our insurance operations) and represented 25.7% and 25.9% of our total assets, respectively.
Our trading and investment portfolios consist primarily of Korean treasury securities and debt securities issued by Korean government agencies, local governments or certain government-invested enterprises and debt securities issued by financial institutions. As of December 31, 2021 and 2022, we held debt securities with a total carrying amount of ₩163,739 billion and ₩175,693 billion, respectively, of which:
| • | financial assets at amortized cost accounted for ₩44,476 billion and ₩58,295 billion, or 27.2% and 33.2%, respectively; |
49
Table of Contents
| • | debt securities at fair value through other comprehensive income accounted for ₩56,260 billion and ₩55,610 billion, or 34.4% and 31.7%, respectively; and |
| • | debt securities at fair value through profit or loss accounted for ₩63,003 billion and ₩61,788 billion, or 38.4% and 35.1%, respectively. |
Of these amounts, debt securities issued by the Korean government and government agencies as of December 31, 2021 and 2022 amounted to:
| • | ₩21,448 billion and ₩23,180 billion, or 48.2% and 39.8%, respectively, of our financial assets at amortized cost; |
| • | ₩14,317 billion and ₩15,974 billion, or 25.4% and 28.7%, respectively, of our financial assets at fair value through other comprehensive income; and |
| • | ₩8,294 billion and ₩8,406 billion, or 13.2% and 13.6%, respectively, of our debt securities at fair value through profit or loss. |
From time to time we also purchase equity securities for our securities portfolios. Our equity securities consist primarily of marketable beneficiary certificates and equities listed on the KRX KOSPI Market, the KRX KOSDAQ Market or the KRX KONEX Market. As of December 31, 2021 and 2022:
| • | equity securities at fair value through other comprehensive income had a carrying amount of ₩3,803 billion and ₩2,326 billion, or 6.3% and 4.0%, respectively, of our securities at fair value through other comprehensive income portfolio; and |
| • | equity securities at fair value through profit or loss had a carrying amount of ₩2,419 billion and ₩2,495 billion, or 3.7% and 3.9%, respectively, of our securities at fair value through profit or loss portfolio. |
Our trading portfolio also includes derivative-linked securities, the underlying assets of which were linked to, among other things, interest rates, exchange rates, stock price indices or credit risks. As of December 31, 2021 and 2022, derivative-linked securities in our trading portfolio had a carrying amount of ₩1,543 billion and ₩1,714 billion, or 2.4% and 2.7% of our trading portfolio, respectively. See “—Derivatives Trading.”
50
Table of Contents
The following tables show, as of the dates indicated, the unrealized gains and losses on financial assets at fair value through other comprehensive income and financial assets at amortized cost within our investment portfolio, and the amortized cost and fair value of the portfolio by type of financial asset:
| As of December 31, 2021 | ||||||||||||||||
| Amortized Cost(7) | Net Unrealized Gain and Loss(8) | Loss Allowance for Expected Credit Losses(9) | Fair Value | |||||||||||||
| (in billions of Won) | ||||||||||||||||
Financial assets at fair value through other comprehensive income: | ||||||||||||||||
Debt securities | ||||||||||||||||
Korean treasury securities and government agencies | ₩ | 15,316 | ₩ | (999 | ) | ₩ | — | ₩ | 14,317 | |||||||
Financial institutions(1) | 22,022 | (89 | ) | 4 | 21,929 | |||||||||||
Corporate(2) | 19,350 | (356 | ) | 8 | 18,986 | |||||||||||
Asset-backed securities(3) | �� | 1,000 | (4 | ) | — | 996 | ||||||||||
Others | 30 | 1 | — | 31 | ||||||||||||
|
|
|
|
|
|
|
| |||||||||
Subtotal | 57,718 | (1,447 | ) | 12 | 56,259 | |||||||||||
Equity securities | 912 | 2,891 | — | 3,803 | ||||||||||||
|
|
|
|
|
|
|
| |||||||||
Total financial assets at fair value through other comprehensive income | ₩ | 58,630 | ₩ | 1,444 | ₩ | 12 | ₩ | 60,062 | ||||||||
|
|
|
|
|
|
|
| |||||||||
Financial assets at amortized cost: | ||||||||||||||||
Korean treasury securities and government agencies | ₩ | 21,448 | ₩ | (66 | ) | ₩ | — | ₩ | 21,382 | |||||||
Financial institutions(4) | 3,851 | 4 | 1 | 3,854 | ||||||||||||
Corporate(5) | 12,246 | 104 | 1 | 12,349 | ||||||||||||
Asset-backed securities(6) | 6,900 | (101 | ) | 2 | 6,797 | |||||||||||
Others | 31 | (2 | ) | — | 29 | |||||||||||
|
|
|
|
|
|
|
| |||||||||
Total financial assets at amortized cost | ₩ | 44,476 | ₩ | (61 | ) | ₩ | 4 | ₩ | 44,411 | |||||||
|
|
|
|
|
|
|
| |||||||||
| As of December 31, 2022 | ||||||||||||||||
| Amortized Cost(7) | Net Unrealized Gain and Loss(8) | Loss Allowance for Expected Credit Losses(9) | Fair Value | |||||||||||||
| (in billions of Won) | ||||||||||||||||
Financial assets at fair value through other comprehensive income: | ||||||||||||||||
Debt securities | ||||||||||||||||
Korean treasury securities and government agencies | ₩ | 18,785 | ₩ | (2,811 | ) | ₩ | — | ₩ | 15,974 | |||||||
Financial institutions(1) | 21,050 | (415 | ) | 3 | 20,632 | |||||||||||
Corporate(2) | 19,651 | (1,364 | ) | 5 | 18,282 | |||||||||||
Asset-backed securities(3) | 452 | (15 | ) | — | 437 | |||||||||||
Others | 283 | 2 | — | 285 | ||||||||||||
|
|
|
|
|
|
|
| |||||||||
Subtotal | 60,221 | (4,603 | ) | 8 | 55,610 | |||||||||||
Equity securities | 1,103 | 1,223 | — | 2,326 | ||||||||||||
|
|
|
|
|
|
|
| |||||||||
Total financial assets at fair value through other comprehensive income | ₩ | 61,324 | ₩ | (3,380 | ) | ₩ | 8 | ₩ | 57,936 | |||||||
|
|
|
|
|
|
|
| |||||||||
Financial assets at amortized cost: | ||||||||||||||||
Korean treasury securities and government agencies | ₩ | 23,180 | ₩ | (1,430 | ) | ₩ | — | ₩ | 21,750 | |||||||
Financial institutions(4) | 11,325 | (247 | ) | 2 | 11,076 | |||||||||||
Corporate(5) | 15,770 | (1,695 | ) | 1 | 14,074 | |||||||||||
Asset-backed securities(6) | 7,655 | (620 | ) | 3 | 7,032 | |||||||||||
Others | 364 | (4 | ) | — | 360 | |||||||||||
|
|
|
|
|
|
|
| |||||||||
Total financial assets at amortized cost | ₩ | 58,294 | ₩ | (3,996 | ) | ₩ | 6 | ₩ | 54,292 | |||||||
|
|
|
|
|
|
|
| |||||||||
51
Table of Contents
| (1) | Includes debt securities issued by the Bank of Korea, the Korea Development Bank, Industrial Bank of Korea and the Export-Import Bank of Korea in the aggregate amount of ₩15,634 billion as of December 31, 2021 and ₩14,618 billion as of December 31, 2022. These financial institutions are owned or controlled by the Korean government. |
| (2) | Includes debt securities issued by the Korea Development Bank, Korea Housing Finance Corporation and the Export-Import Bank of Korea in the aggregate amount of ₩737 billion as of December 31, 2021 and debt securities issued by the Korea Development Bank and Korea Housing Finance Corporation in the aggregate amount of ₩637 billion as of December 31, 2022. These entities are owned or controlled by the Korean government. |
| (3) | Includes mortgage-backed securities issued by Korea Housing Finance Corporation, which have residential mortgage loans as underlying assets, in the amount of ₩963 billion as of December 31, 2021 and ₩406 billion as of December 31, 2022. Korea Housing Finance Corporation is owned by the Korean government. |
| (4) | Includes debt securities issued by the Bank of Korea, the Korea Development Bank, Industrial Bank of Korea and the Export-Import Bank of Korea in the aggregate amount of ₩2,530 billion as of December 31, 2021 and ₩4,856 billion as of December 31, 2022. These financial institutions are owned or controlled by the Korean government. |
| (5) | Includes debt securities issued by Korea Housing Finance Corporation and the Korea Development Bank in the aggregate amount of ₩1,057 billion as of December 31, 2021 and ₩1,814 billion as of December 31, 2022. These entities are owned or controlled by the Korean government. |
| (6) | Includes mortgage-backed securities issued by Korea Housing Finance Corporation, which have residential mortgage loans as underlying assets, in the amount of ₩6,796 billion as of December 31, 2021 and ₩7,269 billion as of December 31, 2022. Korea Housing Finance Corporation is owned by the Korean government. |
| (7) | Gross carrying amount before adjusting for loss allowance for expected credit losses in accordance with IFRS 9. |
| (8) | Net unrealized gain and loss after adjusting for loss allowance for expected credit losses in accordance with IFRS 9. |
| (9) | Loss allowance for expected credit losses in accordance with IFRS 9. |
Derivatives Trading
We engage in derivatives trading, including on behalf of our customers. Our trading volume increased from ₩469,477 billion in 2020 to ₩549,312 billion in 2021 and ₩612,302 billion in 2022. Our net trading revenue from derivatives for the year ended December 31, 2020, 2021 and 2022 was ₩323 billion, ₩204 billion and ₩178 billion, respectively.
We provide and trade a range of derivatives products, including:
| • | interest rate swaps and options, relating to interest rate risks; |
| • | cross-currency swaps, forwards and options relating to foreign exchange risks; and |
| • | stock price index options linked to the KOSPI index. |
Our derivatives operations focus on addressing the needs of our corporate clients to hedge their risk exposure and the need to hedge our risk exposure that results from such client contracts. We also engage in derivatives trading activities to hedge the interest rate and foreign currency risk exposures that arise from our own assets and liabilities. In addition, we engage in proprietary trading of derivatives within our regulated open position limits.
52
Table of Contents
The following shows the estimated fair value of our derivatives as of December 31, 2021 and 2022:
| As of December 31, | ||||||||||||||||
| 2021 | 2022 | |||||||||||||||
| Estimated Fair Value Assets | Estimated Fair Value Liabilities | Estimated Fair Value Assets | Estimated Fair Value Liabilities | |||||||||||||
| (in billions of Won) | ||||||||||||||||
Foreign exchange derivatives(1) | ₩ | 2,436 | ₩ | 2,403 | ₩ | 6,520 | ₩ | 6,672 | ||||||||
Interest rate derivatives(1) | 813 | 773 | 2,265 | 1,560 | ||||||||||||
Equity derivatives | 433 | 381 | 584 | 941 | ||||||||||||
Credit derivatives | 19 | 7 | 33 | 17 | ||||||||||||
Commodity derivatives | — | — | 3 | 2 | ||||||||||||
Others | 21 | 118 | 42 | 314 | ||||||||||||
|
|
|
|
|
|
|
| |||||||||
Total | ₩ | 3,722 | ₩ | 3,682 | ₩ | 9,447 | ₩ | 9,506 | ||||||||
|
|
|
|
|
|
|
| |||||||||
| (1) | Includes those for trading purposes and hedging purposes. |
The following table shows certain information related to our derivatives designated as fair value hedges for the years ended December 31, 2021 and 2022:
| Year Ended December 31, | ||||||||||||||||||||||||
| 2021 | 2022 | |||||||||||||||||||||||
| Hedging Instruments | Hedged Item | Ineffective Portion | Hedging Instruments | Hedged Item | Ineffective Portion | |||||||||||||||||||
| (in billions of Won) | ||||||||||||||||||||||||
Foreign exchange derivatives | ₩ | (175 | ) | ₩ | 181 | ₩ | 6 | ₩ | (129 | ) | ₩ | 151 | ₩ | 22 | ||||||||||
Interest rate derivatives | (13 | ) | 8 | (5 | ) | 28 | (29 | ) | (1 | ) | ||||||||||||||
|
|
|
|
|
|
|
|
|
|
|
| |||||||||||||
Total | ₩ | (188 | ) | ₩ | 189 | ₩ | 1 | ₩ | (101 | ) | ₩ | 122 | ₩ | 21 | ||||||||||
|
|
|
|
|
|
|
|
|
|
|
| |||||||||||||
The following table shows certain information related to our derivatives designated as cash flow hedges for the years ended December 31, 2021 and 2022:
| Year Ended December 31, | ||||||||||||||||||||||||
| 2021 | 2022 | |||||||||||||||||||||||
| Hedging Instruments | Effective Portion | Ineffective Portion | Hedging Instruments | Effective Portion | Ineffective Portion | |||||||||||||||||||
| (in billions of Won) | ||||||||||||||||||||||||
Foreign exchange derivatives | ₩ | 60 | ₩ | 59 | ₩ | 1 | ₩ | (6 | ) | ₩ | (6 | ) | ₩ | — | ||||||||||
Interest rate derivatives | 36 | 36 | — | 76 | 77 | (1 | ) | |||||||||||||||||
|
|
|
|
|
|
|
|
|
|
|
| |||||||||||||
Total | ₩ | 96 | ₩ | 95 | ₩ | 1 | ₩ | 70 | ₩ | 71 | ₩ | (1 | ) | |||||||||||
|
|
|
|
|
|
|
|
|
|
|
| |||||||||||||
53
Table of Contents
The following table shows certain information related to financial instruments designated as net investment hedges in foreign operations for the years ended December 31, 2021 and 2022:
| Year Ended December 31, | ||||||||||||||||||||||||
| 2021 | 2022 | |||||||||||||||||||||||
| Hedging instruments | Effective Portion | Ineffective Portion | Hedging instruments | Effective Portion | Ineffective Portion | |||||||||||||||||||
| (in billions of Won) | ||||||||||||||||||||||||
Foreign exchange derivatives(1) | ₩ | (89 | ) | ₩ | (89 | ) | ₩ | — | ₩ | (104 | ) | ₩ | (104 | ) | ₩ | — | ||||||||
|
|
|
|
|
|
|
|
|
|
|
| |||||||||||||
Total | ₩ | (89 | ) | ₩ | (89 | ) | ₩ | — | ₩ | (104 | ) | ₩ | (104 | ) | ₩ | — | ||||||||
|
|
|
|
|
|
|
|
|
|
|
| |||||||||||||
| (1) | Includes the gain (loss) on a non-derivative instrument designated as a hedging instrument. |
Asset Securitization Transactions
We are active in the Korean asset-backed securities market. Based on our diverse experience with respect to product development and management capabilities relating to asset securitization, we offer customers a wide range of financial products and participate in various asset securitization transactions, including through our subsidiary KB Securities, to reinforce our position as a leading financial services provider with respect to the asset securitization market. We were involved in asset securitization transactions with an initial aggregate issue amount of ₩9,495 billion in 2020, ₩9,677 billion in 2021 and ₩6,013 billion in 2022, a significant portion of which were public offerings of asset-backed securities.
Call Loans
We make call loans and borrow call money in the short-term money market. Call loans are defined as short-term lending among banks and financial institutions either in Won or in foreign currencies with maturities of 90 days or less. Typically, call loans have maturities of one day. As of December 31, 2022 we had made call loans of ₩6,416 billion and borrowed call money of ₩4,154 billion, compared to ₩5,773 billion and ₩1,678 billion, respectively, as of December 31, 2021.
Investment Banking
We have focused on selectively expanding our investment banking activities in order to increase our fee income and diversify our revenue base. We provide investment banking services primarily through KB Securities and Kookmin Bank. Our principal investment banking services include:
| • | securities underwriting; |
| • | financing and financial advisory services for mergers and acquisitions; |
| • | project finance and financial advisory services for social overhead capital projects such as highway, port, power, water and sewage projects; |
| • | financing and financial advisory services for real estate development projects; and |
| • | structured finance. |
In May 2016, we acquired 22.56% of the outstanding shares of Hyundai Securities Co., Ltd., a publicly listed Korean securities firm, and further increased our shareholding in Hyundai Securities to 29.62% in June 2016 by acquiring treasury shares of Hyundai Securities. In October 2016, we effected a comprehensive stock swap of the outstanding shares of Hyundai Securities for newly issued shares of our company, as a result of which Hyundai Securities became a wholly-owned subsidiary. Following such transaction, we merged our existing subsidiary, KB Investment & Securities, with and into Hyundai Securities in December 2016 and changed the name of the surviving entity to KB Securities. Through the acquisition of Hyundai Securities and the creation of an integrated securities firm, we sought to strengthen our investment banking and securities brokerage capabilities, as well as to achieve economies of scale.
54
Table of Contents
In 2022, we generated net investment banking income of ₩970 billion, consisting of ₩204 billion of net interest income and ₩766 billion of net non-interest income.
Securities Brokerage
We provide securities brokerage services through KB Securities. Our activities include provision of brokerage services to our retail and corporate customers relating to a wide range of investment products, including stocks, futures, options, equity- and derivative-linked securities and debt instruments, as well as provision of prime brokerage services to hedge funds. In addition, we offer self-directed brokerage services through KB Securities’ online and smartphone brokerage platforms.
As of December 31, 2022, KB Securities operated a brokerage network consisting of 104 branches and sub-branches in Korea. In 2022, KB Securities generated commission income of ₩422 billion through its securities brokerage activities.
International Banking and Finance
We engage in various international banking and finance activities, including foreign exchange services and derivatives dealing, import and export-related services, offshore lending, syndicated loans, foreign currency securities investment and non-life insurance. These services are provided primarily to our domestic customers and overseas subsidiaries and affiliates of Korean corporations and, to a limited extent, to local companies and individuals. We also raise foreign currency funds through our international banking and finance operations.
The table below sets forth certain information regarding our foreign currency assets and borrowings:
| As of December 31, | ||||||||
| 2021 | 2022 | |||||||
| (in millions of US$) | ||||||||
Total foreign currency assets | US$ | 59,424 | US$ | 65,457 | ||||
|
|
|
| |||||
Foreign currency borrowings: | ||||||||
Borrowings | 16,122 | 18,968 | ||||||
Debentures | 7,183 | 8,590 | ||||||
|
|
|
| |||||
Total borrowings | US$ | 23,305 | US$ | 27,558 | ||||
|
|
|
| |||||
55
Table of Contents
The table below sets forth our overseas subsidiaries, branches and representative and liaison offices in operation as of December 31, 2022:
Business Unit(1) | Location | |||
Subsidiaries (23) | ||||
Kookmin Bank Cambodia PLC (including seven branches) | Cambodia | |||
Kookmin Bank (China) Ltd. (including five branches) | China | |||
KB Microfinance Myanmar Co., Ltd. (including 23 branches) | Myanmar | |||
PRASAC Microfinance Institution Plc. (including 182 branches) | Cambodia | |||
PT Bank KB Bukopin, Tbk (including 275 branches) | Indonesia | |||
KB Bank Myanmar Ltd. | Myanmar | |||
KBFG Securities America Inc. | United States | |||
KB Securities Hong Kong Ltd. | Hong Kong | |||
KB Securities Vietnam Joint Stock Company (including three branches) | Vietnam | |||
KB FINA Joint Stock Company | Vietnam | |||
PT KB Valbury Sekuritas (including 15 branches) | Indonesia | |||
KBFG Insurance (China) Co., Ltd. (including one branch) | China | |||
PT. Kookmin Best Insurance Indonesia (including two branches) | Indonesia | |||
Leading Insurance Services, Inc. | United States | |||
KB Daehan Specialized Bank PLC. (including four branches) | Cambodia | |||
PT. KB Finansia Multi Finance (including 134 branches) | Indonesia | |||
KB J Capital Co., Ltd. | Thailand | |||
i-Finance Leasing Plc. (including four branches) | Cambodia | |||
KB Asset Management Singapore Pte. Ltd. | Singapore | |||
KBAM Shanghai Advisory Services Co., Ltd. | China | |||
KB KOLAO Leasing Co., Ltd. (including one branch) | Laos | |||
PT Sunindo Kookmin Best Finance (including one branch) | Indonesia | |||
PT KB Data Systems Indonesia | Indonesia | |||
Branches (10) | ||||
Kookmin Bank, Tokyo Branch | Japan | |||
Kookmin Bank, Auckland Branch | New Zealand | |||
Kookmin Bank, New York Branch | United States | |||
Kookmin Bank, London Branch | United Kingdom | |||
Kookmin Bank, Ho Chi Minh City Branch | Vietnam | |||
Kookmin Bank, Hanoi Branch | Vietnam | |||
Kookmin Bank, Hong Kong Branch | Hong Kong | |||
Kookmin Bank, Gurugram Branch | India | |||
Kookmin Bank, Singapore Branch | Singapore | |||
Kookmin Best Insurance Co., Ltd. U.S. Branch | United States | |||
Representative and Liaison Offices (5) | ||||
KB Securities Shanghai Representative Office | China | |||
KB Insurance, Hanoi Liaison Office | Vietnam | |||
KB Insurance, Ho Chi Minh City Liaison Office | Vietnam | |||
KB Kookmin Card, Yangon Representative Office | Myanmar | |||
KB Asset Management, Ho Chi Minh City Representative Office | Vietnam | |||
| (1) | Does not include subsidiaries and branches in liquidation or dissolution. |
Trustee and Custodian Services Relating to Investment Trusts and Other Functions
We act as a trustee for 107 financial investment companies with a collective investment license, which invest in investment assets using funds raised by the sale of beneficiary certificates of investment trusts to
56
Table of Contents
investors. We also act as custodian for 274 financial institutions and as fund administrator for 138 financial institutions with respect to various investments, as well as acting as settlement agent in connection with such services. We receive a fee for acting in these capacities and generally perform the following functions:
| • | holding assets for the benefit of the investment trusts or institutional investors; |
| • | receiving and making payments in respect of such investments; |
| • | acting as settlement agent in respect of such investments on behalf of the investment trust or institutional investors, in the domestic and overseas markets; |
| • | providing reports on assets held in custody; |
| • | providing certain foreign exchange services for overseas investment and foreign investors; and |
| • | providing fund-related administration and accounting services. |
For the year ended December 31, 2022, our fee income from our trustee and custodian services was ₩36 billion and revenue collected as a result of administration of the underlying investments was ₩21 billion.
Other Businesses
Trust Account Management Services
Money Trust Management Services
We provide trust account management services for both specified money trusts and unspecified money trusts. We receive fees for our trust account management services consisting of basic fees that are based upon a percentage of either the net asset value of the assets or the principal under management and, for certain types of trust account operations, performance fees that are based upon the performance of the trust account operations. In 2022, our basic money trust fees ranged from 0.1% to 2.0% of total assets under management depending on the type of trust account. We also charge performance fees with respect to certain types of trust account products. We receive penalty payments when customers terminate their trust accounts prior to the original contract maturity.
We currently provide trust account management services for 20 types of money trusts. The maturities of the money trusts we manage vary by the type of the trust. Approximately 2.8% of our money trusts also provide periodic payments of dividends which are added to the assets held in such trusts and not distributed.
Under Korean law, the assets of our trust accounts are segregated from our banking account assets and are not available to satisfy the claims of any of our potential creditors. We are, however, permitted to deposit surplus funds generated by trust assets into our banking accounts in certain circumstances as set forth under the Financial Investment Services and Capital Markets Act and the regulations thereunder.
As of December 31, 2022, the total balance of our money trusts was ₩67,345 billion (as calculated in accordance with Statement of Korea Accounting Standard No. 5004, Trust Accounts, and the Enforcement Regulations of Financial Investment Services under the Financial Investment Services and Capital Markets Act, which we refer to as an “SKAS basis”). As for unspecified money trust accounts, we have investment discretion over all money trusts, which are pooled and managed jointly for each type of trust account. Specified money trust accounts are established on behalf of individual customers who direct our investment of trust assets.
57
Table of Contents
The following table shows the balances of our money trusts by type as of the dates indicated. Under IFRS, we consolidate trust accounts for which we guarantee both the repayment of the principal amount and a fixed rate of interest as well as trust accounts for which we guarantee only the repayment of the principal amount.
| As of December 31, | ||||||||
| 2021 | 2022 | |||||||
| (in billions of Won) | ||||||||
Principal and interest guaranteed trusts(1) | ₩ | 0.1 | ₩ | 0.1 | ||||
Principal guaranteed trusts(1) | 3,874 | 3,741 | ||||||
Performance trusts(1)(2) | 55,549 | 63,604 | ||||||
|
|
|
| |||||
Total | ₩ | 59,423 | ₩ | 67,345 | ||||
|
|
|
| |||||
| (1) | Calculated on an SKAS basis. |
| (2) | Trusts which are primarily non-guaranteed. |
The balance of our money trusts increased 13.3% between December 31, 2021 and December 31, 2022. As of December 31, 2022, the trust assets we managed consisted principally of securities investments and loans from the trust accounts. As of December 31, 2022, on an SKAS basis, our trust accounts had invested in securities in the aggregate amount of ₩28,528 billion, of which ₩19,423 billion was debt securities and derivative-linked securities. Securities investments consist of government-related debt securities, corporate debt securities, including bonds and commercial paper, equity securities, derivative-linked securities and other securities. Loans made by our trust account operations are similar in type to the loans made by our bank account operations. As of December 31, 2022, on an SKAS basis, our trust accounts had made loans in the principal amount of ₩322 billion (excluding loans from the trust accounts to our banking accounts of ₩2,099 billion), which accounted for 0.5% of our money trust assets. Loans by our money trusts are subject to the same credit approval process as loans from our banking accounts. As of December 31, 2022, substantially all loans from our money trust accounts were collateralized or guaranteed.
Our money trust accounts also invest, to a lesser extent, in equity securities, including beneficiary certificates issued by financial investment companies with a collective investment license. On an SKAS basis, as of December 31, 2022, equity securities in our money trust accounts amounted to ₩9,109 billion, which accounted for 13.2% of our total money trust assets. Of this amount, ₩8,977 billion was from specified money trusts and ₩132 billion was from unspecified money trusts.
If the income from a money trust for which we provide a guarantee is less than the amount of the payments we have guaranteed, we will need to pay the amount of the shortfall with funds from special reserves maintained with respect to trust accounts followed by basic fees from that money trust and funds from our general banking operations. In 2020, 2021 and 2022, we made no payment from our banking accounts to cover shortfalls in our guaranteed trusts. On an SKAS basis, we derived trust fees with regard to trust account management services (including those fees related to property trust management services) of ₩216 billion in 2020, ₩281 billion in 2021 and ₩176 billion in 2022.
Property Trust Management Services
We also offer property trust management services, where we manage non-monetary assets in return for a fee. Non-monetary assets include mostly securities, but can also include other liquid receivables and real estate. Under these arrangements, we render custodial services for the property in question and collect fee income in return.
In 2022, our basic property trust fees ranged from 0.001% to 0.3% of total assets under management depending on the type of trust accounts. On an SKAS basis, as of December 31, 2022, the aggregate balance of our property trusts was ₩12,025 billion, compared to ₩12,146 billion as of December 31, 2021.
Under IFRS, the property trusts are not consolidated within our financial statements.
58
Table of Contents
Investment Trust Management
Through KB Asset Management and KB Securities, we offer investment trust products to customers and manage the funds invested by them in investment trusts. As of December 31, 2022, KB Asset Management and KB Securities had an aggregate of ₩82,000 billion of investment trust assets under management.
Insurance
Non-Life Insurance
In June 2015, we acquired a 19.47% stake in KB Insurance Co., Ltd. (formerly named LIG Insurance Co., Ltd.), a publicly listed Korean non-life insurance company. In November 2015 and December 2016, we increased our shareholding in KB Insurance to 33.29% and 39.81%, respectively. Through a tender offer conducted in May 2017, we acquired 36,237,649 shares of KB Insurance at ₩33,000 per share, increasing our shareholding to 94.30%. We subsequently effected a comprehensive stock swap in July 2017 to acquire the remaining shares of KB Insurance in exchange for 2,170,943 shares of common stock of our company, as a result of which KB Insurance became a wholly-owned subsidiary. KB Insurance offers a variety of non-life insurance products, including principally the following:
| • | Long-term insurance products. Long-term insurance products are sold to retail customers and provide protection against various types of losses, with specified coverage periods of at least three years and ranging up to 30 years or ending at specified ages. Unlike general property and casualty insurance products, which usually have a coverage period of one year or less and only have pure protection features, substantially all long-term insurance policies in Korea also have an integrated savings feature. KB Insurance offers a broad range of long-term insurance products covering the policyholder’s injuries, illnesses, long-term care, disabilities, accidents, property losses or other events. |
| • | Automobile insurance products. Automobile insurance products are sold to both retail and institutional customers and generally provide coverage for the following types of losses resulting from the policyholder’s ownership or use of an insured automobile: (i) liability to third parties for bodily injuries or death as well as damage to automobiles or other personal property; and (ii) the policyholder’s own bodily injuries and automobile damage or theft. KB Insurance’s automobile insurance policies typically have a coverage period of one year or less. |
| • | General property and casualty insurance products. General property and casualty insurance products are sold to institutional customers and include the following: (i) fire and allied lines insurance policies, providing protective coverage for damage to buildings and facilities and their contents against fire, flood, storm, lightening, explosion, theft and other risks; (ii) marine insurance policies, providing protective coverage for damage to marine vessels and their cargo; and (iii) specialty insurance policies, which cover various other types of specified risks faced by businesses, including liabilities and business interruption. |
59
Table of Contents
The following table sets forth certain information regarding the operations of KB Insurance, on a standalone basis, as of the dates or for the periods indicated:
| As of or for the Year Ended December 31, | ||||||||||||
| 2020 | 2021 | 2022 | ||||||||||
| (in billions of Won, except as otherwise indicated) | ||||||||||||
Total policies in force (in thousands) | 17,525 | 18,522 | 19,579 | |||||||||
Number of new policies sold (in thousands) | 10,535 | 10,604 | 10,818 | |||||||||
Gross direct written premiums(1) | ₩ | 10,975 | ₩ | 11,524 | ₩ | 12,233 | ||||||
Long-term insurance | 7,017 | 7,233 | 7,841 | |||||||||
Automobile insurance | 2,611 | 2,668 | 2,816 | |||||||||
General property and casualty insurance | 1,074 | 1,167 | 1,292 | |||||||||
Other | 273 | 456 | 285 | |||||||||
Net earned premiums(2) | ₩ | 9,577 | ₩ | 10,298 | ₩ | 10,889 | ||||||
Loss ratio(3) | 85.50 | % | 84.95 | % | 82.51 | % | ||||||
Risk-based capital adequacy ratio(4) | 174.76 | % | 179.39 | % | 171.66 | % | ||||||
| (1) | The amount of direct written premiums recognized in a specified period in respect of policies in force during such period, on a standalone basis. |
| (2) | The sum of (i) gross direct written premiums for the specified period, (ii) reinsurance premium income for such period, (iii) return of surrender refunds for such period and (iv) total unearned premiums deferred from the previous period, less the sum of (x) reinsurance expenses for the specified period, (y) surrender refunds for such period and (z) total unearned premiums deferred to the next period, on a standalone basis. |
| (3) | The ratio of (i) total claims paid for the specified period to (ii) net earned premiums for such period, on a standalone basis. |
| (4) | Calculated in accordance with the applicable requirements of the Financial Supervisory Service. See “—Regulation and Supervision—Principal Regulations Applicable to Insurance Companies—Capital Adequacy.” |
KB Insurance operates a multi-channel distribution platform in Korea, comprising agencies (which are independent insurance brokerage companies), a network of financial consultants, bancassurance arrangements with commercial banks and other financial institutions, direct marketing channels (including home shopping television networks and the Internet) and a corporate sales force.
As of December 31, 2022, KB Insurance had ₩33,529 billion of general account investment assets on a standalone basis, of which domestic debt securities, loans, beneficiary certificates, domestic equity securities and overseas securities accounted for 39.0%, 24.4%, 19.9%, 0.3% and 10.2%, respectively.
Life Insurance
In January 2023, in order to maximize the synergy effects in our life insurance operations, we merged the Former KB Life Insurance with and into Prudential Life Insurance, and the surviving entity is called KB Life Insurance Co., Ltd. Through KB Life Insurance, we offer a variety of individual and group life insurance products, including annuities, savings insurance, variable life insurance, whole life insurance and term life insurance as well as health insurance. We utilize our multi-channel distribution platforms to market these products, which includes sales through agencies, financial consultants, telemarketers and bancassurance arrangements with commercial banks and other financial institutions.
Prior to the merger, the Former KB Life Insurance generated gross premiums (not including separate account premiums) of ₩1,476 billion in 2020, ₩1,838 billion in 2021 and ₩2,014 billion in 2022, each on a standalone basis. As of December 31, 2022, the Former KB Life Insurance had ₩8,106 billion of general account investment assets on a standalone basis, of which domestic debt securities, beneficiary certificates, loans, domestic equity securities and overseas securities accounted for 50.4%, 19.3%, 19.1%, 0.0% and 11.2%, respectively. As of such date, the Former KB Life Insurance’s risk-based capital adequacy ratio was 130.48%.
Prior to the merger, Prudential Life Insurance, a wholly-owned subsidiary which we had acquired from Prudential Financial, Inc. for ₩2.3 trillion in August 2020, generated gross premiums (not including separate
60
Table of Contents
account premiums) of ₩451 billion in 2020 (excluding such amount for the period before Prudential Life Insurance became our consolidated subsidiary), ₩1,351 billion in 2021 and ₩1,507 billion in 2022, each on a standalone basis. As of December 31, 2022, Prudential Life Insurance had ₩17,524 billion of general account investment assets on a standalone basis, of which domestic debt securities, beneficiary certificates, loans, domestic equity securities and overseas securities accounted for 86.8%, 3.7%, 6.0%, 0.6% and 2.9%, respectively. As of such date, Prudential Life Insurance’s risk-based capital adequacy ratio was 248.37%.
For further information regarding our insurance-related assets and liabilities, see Note 38 of the notes to our consolidated financial statements included elsewhere in this annual report.
Bancassurance
Through the bancassurance operations of Kookmin Bank, we offer insurance products of other institutions to retail customers in Korea. We currently market a wide range of bancassurance products and seek to generate additional fee-based revenues by expanding our offering of these products.
Currently, our bancassurance business has alliances with 22 life insurance companies (including our subsidiary, KB Life Insurance) and 11 non-life insurance companies (including our subsidiary, KB Insurance) and offers 62 different products through our branch network. These products are composed of 55 types of life insurance policies, such as annuities, savings insurance and variable life insurance, and 7 types of non-life insurance products. In 2022, our commission income from our bancassurance business amounted to ₩131.1 billion.
Consumer Finance
We provide consumer finance services through KB Capital Co., Ltd. We acquired 52.02% of the outstanding shares of KB Capital (formerly known as Woori Financial Co., Ltd.) in March 2014 for ₩280 billion. We conducted a tender offer in May 2017, through which we acquired 5,949,300 shares of KB Capital at ₩27,500 per share, increasing our shareholding in KB Capital to 79.70%. We subsequently acquired the remaining outstanding shares of KB Capital in exchange for 2,269,057 shares of common stock of our company through a comprehensive stock swap effected in July 2017, as a result of which KB Capital became a wholly-owned subsidiary. KB Capital provides leasing services and installment finance services for various products, including automobiles, heavy machineries and medical equipment, as well as microlending services. We expect KB Capital to continue to expand our customer base by providing a variety of non-banking financial services to retail customers, as well as synergies through coordinated business operations with our other subsidiaries, including Kookmin Bank.
Management of the National Housing and Urban Fund
The National Housing and Urban Fund is a government fund that provides financial support to low-income households in Korea by providing mortgage financing and construction loans for projects to build small-sized housing. The operations of the National Housing and Urban Fund include providing and managing National Housing and Urban Fund loans, issuing National Housing and Urban Fund bonds and collecting subscription savings deposits.
In February 2013, the Ministry of Land, Infrastructure and Transport (formerly the Ministry of Land, Transport and Maritime Affairs) designated us as one of the managers of the National Housing and Urban Fund. In 2022, we received total fees of ₩29 billion for managing the National Housing and Urban Fund, compared to ₩33 billion in 2021 and ₩35 billion in 2020.
The financial accounting for the National Housing and Urban Fund is entirely separate from our financial accounting, and the non-performing loans and loan losses of the National Housing and Urban Fund, in general,
61
Table of Contents
do not impact our financial condition. Regulations and guidelines for managing the National Housing and Urban Fund are issued by the Minister of Land, Infrastructure and Transport pursuant to the Housing and Urban Fund Act.
Distribution Channels
Banking Branch Network
As of December 31, 2022, Kookmin Bank operated a network of 856 branches and sub-branches in Korea, which was one of the largest branch networks among Korean commercial banks. An extensive branch network is important to attracting and maintaining retail customers, who use branches extensively and value convenience. We believe that our extensive branch network in Korea and retail customer base provide us with a source of stable and relatively low cost funding. Approximately 37.7% of our branches and sub-branches are located in Seoul, and approximately 20.7% of our branches are located in the six next largest cities. The following table presents the geographical distribution of our branch network in Korea as of December 31, 2022:
Area | Number of Branches | Percentage | ||||||
Seoul | 323 | 37.7 | % | |||||
Six largest cities (other than Seoul) | 177 | 20.7 | ||||||
Other | 356 | 41.6 | ||||||
|
|
|
| |||||
Total | 856 | 100.0 | % | |||||
|
|
|
| |||||
In addition, we have continued to implement the specialization of our branch functions. Of our branch network as of December 31, 2022, we had two branches that primarily handled large corporate banking.
In order to support our branch network, we have established an extensive network of ATMs, which are located in branches and in unmanned outlets known as “autobanks.” As of December 31, 2022, we had 4,563 ATMs.
We have actively promoted the use of these distribution outlets in order to provide convenient service to customers, as well as to maximize the marketing and sales functions at the branch level, reduce employee costs and improve profitability. The aggregate number of transactions conducted using our ATMs amounted to approximately 295 million in 2020, 251 million in 2021 and 224 million in 2022.
Other Banking Channels
The following table sets forth information, for the periods indicated, on the number of users and transactions of the other banking channels for our retail and corporate banking customers, which are discussed below:
| For the Year Ended December 31, | ||||||||||||
| 2020 | 2021 | 2022 | ||||||||||
Internet banking: | ||||||||||||
Number of users(1) | 25,313,463 | 26,415,723 | 27,711,718 | |||||||||
Number of transactions (thousands)(2) | 14,794,331 | 18,941,829 | 4,827,755 | |||||||||
Phone banking: | ||||||||||||
Number of users(3) | 5,073,346 | 5,076,733 | 5,076,895 | |||||||||
Number of transactions (thousands)(2) | 76,595 | 62,835 | 51,594 | |||||||||
Smartphone banking: | ||||||||||||
Number of users(4) | 16,681,329 | 17,930,859 | 19,584,887 | |||||||||
Number of transactions (thousands)(2) | 13,811,431 | 20,828,944 | 21,741,324 | |||||||||
62
Table of Contents
| (1) | Number of users is defined as the total cumulative number of retail and corporate customers who have registered through our branch offices to use our Internet banking services. |
| (2) | Number of transactions includes balance and transaction inquiries, fund transfers and other transactions. |
| (3) | Number of users is defined as the total cumulative number of retail and corporate customers who have registered through our branch offices to use our phone banking services. |
| (4) | Number of users is defined as the total cumulative number of retail customers who have registered through our branch offices, or the customers’ smartphones, to use our smartphone banking services. |
Internet Banking
Our goal is to consolidate our position as a market leader in online banking. Our Internet banking services currently include:
| • | basic banking services, including fund transfers, balance and transaction inquiries, pre-set automatic transfers, product inquiries, online bill and tax payments and foreign exchange services; |
| • | investment services, including opening deposit accounts and investing in funds; |
| • | processing of loan applications; |
| • | electronic certification services, which permit users to authenticate their identity and transactions on a confidential basis through digital signatures; and |
| • | wealth management and advisory services, including financial planning and real estate information services. |
Phone Banking
We offer a variety of phone banking services, including inter-account fund transfers, balance and transaction inquiries, customer service inquiries and bill payments. We also have call centers, which we primarily use to:
| • | advise clients with respect to deposits, loans and credit cards and to provide our customers a way to report any emergencies with respect to their accounts; |
| • | allow our customers to conduct transactions with respect to their accounts, such as balance and transfer inquiries, transfers or payments and opening accounts; and |
| • | conduct telemarketing to our customers or potential customers to advertise products or services. |
Smartphone Banking
“KB Star Banking,” our mobile banking application for smartphones, allows our customers the flexibility to conduct a variety of financial transactions, including balance and transaction inquiries, fund transfers and asset management, anywhere at any time. It is also intended to act as a hub for all of our finance services, including securities transactions and insurance, by providing our customers with access to the key services offered by a number of our subsidiaries, such as KB Securities and KB Insurance. Our smartphone banking services currently include:
| • | basic banking services, including fund transfers, balance and transaction inquiries, bill payments and foreign exchange services; |
| • | investment services, including investing in savings deposits that are designed specifically for and offered to smartphone banking customers; and |
| • | processing of loan applications and bancassurance services. |
We also continue to develop innovative mobile applications that cater to specific customer needs and lifestyles. For example, we offer “Liiv Next,” a finance platform that provides easy-to-use banking services such
63
Table of Contents
as wire transfers and electronic payments as well as a variety of non-banking services such as games and quizzes to our younger “Generation Z” customers. We also offer a range of other mobile applications, including “Liiv Talk Talk,” our mobile peer-to-peer payment and messaging application, “Liiv M,” a mobile virtual network operator (MVNO) that offers a fusion of finance and mobile services and “KB Real Estate,” our new cloud-based real estate application that provides various information on real properties. We also offer MyData services through several channels including KB Star Banking, our mobile banking application, and KB Pay, a MyData-based platform operated by KB Kookmin Card.
Other Channels
We provide cash management services, which include automatic transfers, connection services to other financial institutions, real-time firm banking, automatic fund concentration and transmittal of trading information.
Distribution Channels for Other Services
Through our non-banking subsidiaries, we operate a network of dedicated branches and other distribution channels through which our customers can access credit card, securities brokerage, insurance and consumer finance products and services. The following table sets forth information regarding the number and geographical distribution of the branches in Korea operated by KB Kookmin Card, KB Securities and KB Insurance as of December 31, 2022:
Area | KB Kookmin Card | KB Securities | KB Insurance | |||||||||
Seoul | 7 | 40 | 58 | |||||||||
Six largest cities (other than Seoul) | 8 | 21 | 67 | |||||||||
Other | 11 | 43 | 136 | |||||||||
|
|
|
|
|
| |||||||
Total | 26 | 104 | 261 | |||||||||
|
|
|
|
|
| |||||||
Our other non-banking subsidiaries also operate a number of branches in Seoul and other areas. We also provide credit card, securities brokerage, insurance and consumer finance services through dedicated call centers, smartphone applications and Internet websites operated by KB Kookmin Card, KB Securities, KB Insurance, KB Life Insurance and KB Capital.
Competition
We compete principally with other financial holding companies and nationwide commercial banks, as well as regional banks, development banks, specialized banks and branches of foreign banks operating in Korea. We also compete with other types of financial institutions in Korea, including savings institutions (such as mutual savings and finance companies and credit unions and credit cooperatives), investment institutions (such as merchant banking corporations), life insurance companies, non-life insurance companies, securities companies and other financial investment companies.
Competition in the domestic banking industry is generally based on the types and quality of the products and services offered, including the size and location of retail networks, the level of automation and interest rates charged and paid. Competition has increased significantly in our traditional core businesses, retail banking, small- and medium-sized enterprise banking and credit card lending, contributing to some extent to the asset quality deterioration in retail and small- and medium-sized loans. As a result, our margins on lending activities may decrease in the future.
Furthermore, the introduction of Internet-only banks in Korea has led to an increase in competition in the Korean banking industry. Internet-only banks operate without branches and conduct most of their operations
64
Table of Contents
through electronic means, which enables them to minimize cost and offer customers higher interest rates on deposits or lower lending rates. In April 2017, Kbank, the first Internet-only bank in Korea, commenced operations. Kakao Bank, another Internet-only bank, in which Kookmin Bank held a 4.9% equity interest as of December 31, 2022, commenced operations in July 2017. Most recently, Toss Bank, another Internet-only bank, commenced operations in October 2021.
In the Korean insurance industry, competition is based on a number of factors, including brand recognition, service, product features and pricing, investment performance and perceived financial strength. There has been downward pressure in recent years on margins of insurance products as some of our competitors have sought to obtain or maintain market share by reducing margins and increasing marketing efforts. As the Korean non-life insurance and life insurance sectors continue to mature, they may experience a slowdown in growth as well as a stagnation in market penetration. Due to these and other factors, we believe that competition in the Korean insurance industry will likely remain intense in the future.
In addition, general regulatory reforms in the Korean financial industry have increased competition among banks and other financial institutions in Korea. As the reform of the financial sector continues, foreign financial institutions, some with greater resources than us, have entered, and may continue to enter, the Korean market either by themselves or in partnership with existing Korean financial institutions and compete with us in providing financial and related services.
Moreover, the Korean financial industry is undergoing significant consolidation. The number of nationwide commercial banks in Korea has decreased from 16 as of December 31, 1997, to six as of December 31, 2022. A number of significant mergers and acquisitions in the financial industry have taken place in Korea in recent years, including Hana Financial Group’s acquisition of a controlling interest in Korea Exchange Bank in 2012 and the subsequent merger of Hana Bank into Korea Exchange Bank in 2015. In addition, as part of the Korean government’s plans to privatize Woori Finance Holdings Co., Ltd. (the former financial holding company of Woori Bank), certain subsidiaries of Woori Finance Holdings were sold to other financial institutions and Woori Finance Holdings itself was merged into Woori Bank in 2014, which established a new financial holding company, Woori Financial Group Inc., in January 2019. In the insurance sector, China’s Anbang Insurance Group acquired controlling interests in Tong Yang Life Insurance Co., Ltd. and Allianz Life Insurance Korea Co., Ltd. in 2015 and 2016, respectively, while Mirae Asset Life Insurance Co., Ltd. acquired PCA Life Insurance Co., Ltd. in 2017. Meanwhile, Orange Life Insurance, Ltd. (formerly known as ING Life Insurance Korea, Ltd.) became a wholly-owned subsidiary of Shinhan Financial Group following the acquisition of equity interests by Shinhan Financial Group in February 2019 and January 2020, and subsequently merged with and into Shinhan Life Insurance Co., Ltd. in July 2021. In the securities sector, in 2016, Mirae Asset Securities Co., Ltd. acquired a 43% interest in KDB Daewoo Securities Co., Ltd., which subsequently merged with and into Mirae Asset Securities to create Mirae Asset Daewoo Securities Co., Ltd., one of the largest securities companies in Korea in terms of capital. We expect that consolidation in the Korean financial industry will continue. The financial institutions resulting from such consolidation may, by virtue of their increased size and business scope, provide significantly greater competition for us. We intend to review potential acquisition opportunities as they arise. We cannot guarantee that we will not be involved in any future mergers or acquisitions.
Information Technology
We regularly implement various IT system-related initiatives and upgrades at the group and subsidiary level. We believe that continual improvement of our IT systems is crucial in supporting our operations and management and providing high-quality customer service. Accordingly, we continue to upgrade and improve our systems through various activities, including projects to develop next generation banking systems for Kookmin Bank, further strengthen system security and timely develop and implement various new IT systems and services (including group-wide software) that support our business operations and risk management activities.
Our mainframe-based banking and credit card IT systems are designed to ensure continuity of services even where there is a failure of the host data center due to a natural disaster or other accidents by utilizing backup
65
Table of Contents
systems in disaster recovery data centers. In addition, through the implementation of Parallel Sysplex, a “multi-CPU system,” our bank and credit card systems are designed and operated to be able to process transactions without material interruption in the event of CPU failure. From 2019 to 2020, we implemented a next-generation credit card IT system that applies an enhanced platform to ensure greater flexibility and versatility, as well as a banking IT system designed to promote digital transformation and innovation in our IT infrastructure. In addition, we implemented new technologies, including Multi Channel Integration and Enterprise Application Integration systems, to standardize our IT system and better manage IT system operational risk.
The integrity of our IT systems, and their ability to withstand potential catastrophic events (such as natural calamities and internal system failures), are crucial to our continuing operations. We currently test our disaster recovery systems on a quarterly basis using a new disaster recovery system that has been implemented to ensure the continuity of our operations. For additional information, see “Item 11. Quantitative and Qualitative Disclosures about Market Risk—Operational Risk Management.”
In 2022, we spent approximately ₩869 billion for our IT system implementation and operations, including expenses related to the construction of new IT systems, implementation of hardware and software technologies and other new systems, as well as related labor costs.
As of December 31, 2022, we employed a total of 2,316 full-time employees in our IT operations.
Assets and Liabilities
The tables below set out selected financial highlights regarding our operations and our assets and liabilities. Except as otherwise indicated, amounts as of and for the years ended December 31, 2020, 2021 and 2022 are presented on a consolidated basis under IFRS.
Certain information with respect to our loan portfolio and the asset quality of our loans is presented below on a basis consistent with certain requirements of the Financial Services Commission applicable to Korean financial institutions, which differs (as described below where applicable) from the presentation of such information in our financial statements prepared in accordance with IFRS, as we believe that such alternative presentation allows us to provide additional details regarding our loan portfolio and the asset quality of our loans which would be helpful to our investors.
Loan Portfolio
As of December 31, 2022, our total loan portfolio was ₩440,689 billion compared to ₩421,585 billion as of December 31, 2021. As of December 31, 2022, 89.6% of our total loans were Won-denominated loans compared to 91.1% as of December 31, 2021.
66
Table of Contents
Loan Types
The following table presents loans by type as of the dates indicated. Except where we specify otherwise, all loan amounts stated below are before deduction of allowances for loan losses. Total loans reflect our loan portfolio, including past due amounts.
| As of December 31, | ||||||||
| 2021 | 2022 | |||||||
| (in billions of Won) | ||||||||
Domestic: | ||||||||
Corporate | ||||||||
Small- and medium-sized enterprise | ₩ | 138,627 | ₩ | 149,068 | ||||
Large corporate(1) | 44,895 | 50,364 | ||||||
Retail | ||||||||
Mortgage and home equity | 120,418 | 120,942 | ||||||
Other consumer | 71,223 | 65,997 | ||||||
Credit cards | 20,768 | 22,562 | ||||||
|
|
|
| |||||
Total domestic | 395,931 | 408,933 | ||||||
Foreign | 25,654 | 31,756 | ||||||
|
|
|
| |||||
Total gross loans | ₩ | 421,585 | ₩ | 440,689 | ||||
|
|
|
| |||||
| (1) | Large corporate loans include ₩703 billion and ₩1,306 billion of loans to the Korean government and government related agencies (including the Korea Deposit Insurance Corporation) as of December 31, 2021 and 2022, respectively. |
Loan Concentrations
On a consolidated basis, our exposure to any single person (including an individual or an entity) or any single borrower (any single person together with any individual and/or entity that shares the same credit risk with such person) is limited by law to 20% and 25%, respectively, of our “net aggregate equity capital,” as defined under the Enforcement Decree of the Financial Holding Company Act. See “—Supervision and Regulation—Principal Regulations Applicable to Financial Holding Companies—Financial Exposure to Any Individual Customer and Major Investor.” In addition, Kookmin Bank’s exposure to any single person or any single borrower is limited by the Bank Act to 20% and 25%, respectively, of its total Tier I and Tier II capital.
Loan Concentration by Industry
The following table presents the aggregate balance of our domestic and foreign corporate loans, by industry concentration, as of December 31, 2021 and 2022:
| As of December 31, | ||||||||||||||||
| 2021 | 2022 | |||||||||||||||
Industry | Amount | % | Amount | % | ||||||||||||
| (in billions of Won, except percentages) | ||||||||||||||||
Services | ₩ | 86,916 | 42.4 | % | ₩ | 98,204 | 43.5 | % | ||||||||
Manufacturing | 48,974 | 23.9 | 53,165 | 23.5 | ||||||||||||
Wholesale and retail | 26,850 | 13.1 | 29,653 | 13.1 | ||||||||||||
Financial institutions | 21,911 | 10.7 | 23,177 | 10.3 | ||||||||||||
Construction | 5,654 | 2.8 | 6,846 | 3.0 | ||||||||||||
Public sector | 2,071 | 1.0 | 1,903 | 0.8 | ||||||||||||
Others | 12,477 | 6.1 | 12,847 | 5.7 | ||||||||||||
|
|
|
|
|
|
|
| |||||||||
Total | ₩ | 204,853 | 100.0 | % | ₩ | 225,795 | 100.0 | % | ||||||||
|
|
|
|
|
|
|
| |||||||||
67
Table of Contents
Maturity Analysis
We typically roll over our working capital loans and unsecured consumer loans (other than those payable in installments) after we conduct our normal loan review in accordance with our loan review procedures. Working capital loans may generally be extended on an annual basis for an aggregate term of five years and unsecured consumer loans may generally be extended for another term of up to 12 months for an aggregate term of 10 years.
The following table sets out the scheduled maturities (time remaining until maturity) of our loan portfolio as of December 31, 2022. The amounts disclosed are before deduction of allowances for loan losses:
| 1 Year or Less | Over 1 Year But Not More Than 5 Years | Over 5 Years But Not More Than 15 Years | Over 15 Years | Total | ||||||||||||||||
| (in billions of Won) | ||||||||||||||||||||
Domestic: | ||||||||||||||||||||
Corporate | ||||||||||||||||||||
Small- and medium-sized enterprises | ₩ | 105,244 | ₩ | 36,811 | ₩ | 5,241 | ₩ | 1,772 | ₩ | 149,068 | ||||||||||
Large corporate | 30,558 | 14,840 | 3,318 | 1,648 | 50,364 | |||||||||||||||
|
|
|
|
|
|
|
|
|
| |||||||||||
Total corporate | 135,802 | 51,651 | 8,559 | 3,420 | 199,432 | |||||||||||||||
Retail | ||||||||||||||||||||
Mortgage and home equity | 20,898 | 20,859 | 7,536 | 71,649 | 120,942 | |||||||||||||||
Other consumer | 39,307 | 15,720 | 3,836 | 7,134 | 65,997 | |||||||||||||||
|
|
|
|
|
|
|
|
|
| |||||||||||
Total retail | 60,205 | 36,579 | 11,372 | 78,783 | 186,939 | |||||||||||||||
Credit cards | 18,669 | 3,707 | 186 | — | 22,562 | |||||||||||||||
|
|
|
|
|
|
|
|
|
| |||||||||||
Total domestic | 214,676 | 91,937 | 20,117 | 82,203 | 408,933 | |||||||||||||||
Foreign: | 11,799 | 12,176 | 7,503 | 278 | 31,756 | |||||||||||||||
|
|
|
|
|
|
|
|
|
| |||||||||||
Total | ₩ | 226,475 | ₩ | 104,113 | ₩ | 27,620 | ₩ | 82,481 | ₩ | 440,689 | ||||||||||
|
|
|
|
|
|
|
|
|
| |||||||||||
Interest Rate Sensitivity
The following table shows, as of December 31, 2022, the total amount of loans due after one year, which have fixed interest rates and variable or adjustable interest rates:
| Fixed Rate(1) | Variable or adjustable rates(2) | Total | ||||||||||
| (in billions of Won) | ||||||||||||
Domestic: | ||||||||||||
Corporate | ||||||||||||
Small- and medium-sized enterprises | ₩ | 20,933 | ₩ | 22,892 | ₩ | 43,825 | ||||||
Large corporate | 9,957 | 9,849 | 19,806 | |||||||||
|
|
|
|
|
| |||||||
Total corporate | 30,890 | 32,741 | 63,631 | |||||||||
Retail | ||||||||||||
Mortgage and home equity | 9,478 | 90,568 | 100,046 | |||||||||
Other consumer | 10,595 | 16,093 | 26,688 | |||||||||
|
|
|
|
|
| |||||||
Total retail | 20,073 | 106,661 | 126,734 | |||||||||
Credit cards | 3,893 | — | 3,893 | |||||||||
Total domestic | 54,856 | 139,402 | 194,258 | |||||||||
|
|
|
|
|
| |||||||
Foreign: | 12,082 | 7,875 | 19,957 | |||||||||
|
|
|
|
|
| |||||||
Total | ₩ | 66,938 | ₩ | 147,277 | ₩ | 214,215 | ||||||
|
|
|
|
|
| |||||||
| (1) | Fixed rate loans are loans for which the interest rate is fixed for the entire term. |
| (2) | Variable or adjustable rate loans are loans for which the interest rate is not fixed for the entire term. |
68
Table of Contents
For additional information regarding our management of interest rate risk, see “Item 11. Quantitative and Qualitative Disclosures about Market Risk—Market Risk Management—Market Risk Management for Non-Trading Activities.”
Credit Exposures to Companies in Workout, Restructuring or Rehabilitation
Workout is a voluntary procedure through which we, together with the borrower and its other creditors, seek to restore the borrower’s financial stability and viability. Previously, workouts were regulated under a series of Corporate Restructuring Promotion Acts, which expired on June 30, 2018. In September 2018, the National Assembly of Korea adopted a new Corporate Restructuring Promotion Act, which became effective in October 2018 and is scheduled to expire in October 2023. Under the new Corporate Restructuring Promotion Act, creditors of a financially troubled borrower may participate in a creditors’ committee, which is authorized to prohibit such creditors from exercising their rights against the borrower, commence workout procedures and approve or make revisions to a reorganization plan prepared by the lead creditor bank, the borrower and external experts. The composition of the creditors’ committee is determined at the initial meeting of the committee by the approval of creditors holding not less than 75% of the borrower’s total outstanding debt held by creditors who were notified of the initial meeting of the committee. Although creditors that are not financial institutions or hold less than 1% of the total outstanding debt of the borrower need not be notified of the initial meeting of the creditors’ committee, if such creditors wish to participate, they may not be excluded. Any decision of the creditors’ committee requires the approval of creditors holding not less than 75% of the total outstanding debt of the borrower. However, if a single creditor holds 75% or more of the borrower’s total outstanding debt held by the creditors comprising the creditors’ committee, any decision of the creditors’ committee requires the approval of not less than 40% of the total number of creditors (including such single creditor) comprising the committee. An additional approval of creditors holding not less than 75% of the secured debt is required with respect to the borrower’s debt restructuring. Once approved, any decision made by the creditors’ committee is binding on all creditors of the borrower, with the exception of those creditors that were excluded by a resolution of the committee at its initial meeting and those who exercised their right to request that their claims be purchased. Creditors that voted against commencement of workout, approval or revision of the reorganization plan, debt restructuring, granting of new credit, extension of the joint management process or other resolutions of the committee have the right to request the creditors that voted in favor of such matters to purchase their claims at a mutually agreed price. In the event that the parties are not able to agree on the terms of purchase, a coordination committee consisting of experts would determine the terms. The creditors that oppose a decision made by the coordination committee may request a court to change such decision.
Upon approval of the workout plan, a credit exposure is initially classified as precautionary or lower and thereafter cannot be classified higher than precautionary with limited exceptions. If a corporate borrower is in workout, restructuring or rehabilitation, we take the status of the borrower into account in valuing our loans to and collateral from that borrower for purposes of establishing our allowances for credit losses.
Korean law also provides for corporate rehabilitation proceedings, which are court-supervised procedures to rehabilitate an insolvent company. Under these procedures, a restructuring plan is adopted at a meeting of interested parties, including creditors of the company. Such restructuring plan is subject to court approval.
A portion of our loans to and debt securities of corporate customers are currently in workout, restructuring or rehabilitation. As of December 31, 2022, ₩170 billion or 0.03% of our total loans were in workout, restructuring or rehabilitation. This included ₩41 billion of loans to large corporate borrowers and ₩129 billion of loans to small- and medium-sized enterprises.
69
Table of Contents
Provisioning Policy
Under IFRS 9 Financial Instruments, or IFRS 9, we establish allowances for credit losses based on expected credit losses instead of incurred losses by assessing changes in expected credit losses and recognizing such changes as impairment loss (or reversal of impairment loss) in profit or loss. According to the three stages of credit risk deterioration under IFRS 9, the allowance required to be established with respect to a loan or receivable since its initial recognition is (i) the amount of the expected 12-month credit loss for stage 1 loans or receivables and (ii) the expected lifetime credit loss for stages 2 and 3 loans or receivables.
If additions or changes to the allowances for loan losses are required, then we record a provision for loan losses, which is included in impairment losses on credit loss and treated as a charge against current income. Credit exposures that we deem to be uncollectible, including actual loan losses, net of recoveries of previously charged-off amounts, are charged directly against the allowances for loan losses.
We generally consider the following loans to be impaired loans:
| • | loans that are past due by 90 days or more; |
| • | loans that are subject to legal proceedings related to collection; |
| • | loans to a borrower that has received a warning from the Korea Credit Information Services indicating that such borrower has exhibited difficulties in making timely payments of principal and interest; |
| • | loans to corporate borrowers that are rated C or D according to Kookmin Bank’s internal credit ratings for large companies or small-and medium-sized enterprises; |
| • | loans for which account-specific provisions have been made resulting from a significant perceived decline in credit quality; and |
| • | loans with respect to which the amount of principal and interest payable has been materially decreased due to restructuring. |
We regularly evaluate the adequacy of the overall allowances for loan losses and we believe that the allowances for loan losses reflect our best estimate of probable loan losses as of each balance sheet date.
Non-Performing Loans
Non-performing loans are defined as loans that are past due by 90 days or more. These loans are generally classified as “substandard” or below. For further information on the classification of non-performing loans under Korean regulatory requirements, see “—Regulatory Reserve for Credit Losses” below.
The following table shows, as of the dates indicated, certain details of our total non-performing loan portfolio:
| As of December 31, | ||||||||
| 2021 | 2022 | |||||||
| (in billions of Won, except percentages) | ||||||||
Total non-performing loans | ₩ | 1,458 | ₩ | 1,918 | ||||
As a percentage of total loans | 0.4 | % | 0.4 | % | ||||
70
Table of Contents
Analysis of Non-Performing Loans
The following table sets forth, as of the dates indicated, our total non-performing loans by type of borrower:
| As of December 31, | ||||||||||||||||
| 2021 | 2022 | |||||||||||||||
| Amount | % | Amount | % | |||||||||||||
| (in billions of Won, except percentages) | ||||||||||||||||
Domestic: | ||||||||||||||||
Corporate | ||||||||||||||||
Small- and medium sized enterprise | ₩ | 102 | 7.0 | % | ₩ | 123 | 6.4 | % | ||||||||
Large corporate | 100 | 6.9 | 51 | 2.7 | ||||||||||||
|
|
|
|
|
|
|
| |||||||||
Total corporate | 202 | 13.9 | 174 | 9.1 | ||||||||||||
Retail | ||||||||||||||||
Mortgage and home equity | 102 | 7.0 | 134 | 7.0 | ||||||||||||
Other consumer | 157 | 10.8 | 177 | 9.2 | ||||||||||||
|
|
|
|
|
|
|
| |||||||||
Total retail | 259 | 17.8 | 311 | 16.2 | ||||||||||||
Credit cards | 97 | 6.7 | 91 | 4.7 | ||||||||||||
|
|
|
|
|
|
|
| |||||||||
Total domestic | 558 | 38.4 | 576 | 30.0 | ||||||||||||
Foreign: | 900 | 61.6 | 1,342 | 70.0 | ||||||||||||
|
|
|
|
|
|
|
| |||||||||
Total non-performing loans | ₩ | 1,458 | 100.0 | % | ₩ | 1,918 | 100.0 | % | ||||||||
|
|
|
|
|
|
|
| |||||||||
Top 20 Non-Performing Loans
As of December 31, 2022, our 20 largest non-performing loans accounted for 13.8% of our total non-performing loan portfolio. The following table shows, as of December 31, 2022, certain information regarding our 20 largest non-performing loans:
Industry | Gross Principal Outstanding | Allowances for Loan Losses(1) | ||||||||
| (in billions of Won) | ||||||||||
Borrower A | Others | ₩ | 63 | ₩ | 18 | |||||
Borrower B | Wholesale and retail | 24 | 17 | |||||||
Borrower C | Construction | 20 | 2 | |||||||
Borrower D | Construction | 20 | 10 | |||||||
Borrower E | Public sector | 18 | 13 | |||||||
Borrower F | Others | 18 | 17 | |||||||
Borrower G | Services | 15 | 4 | |||||||
Borrower H | Wholesale and retail | 13 | 13 | |||||||
Borrower I | Construction | 12 | 10 | |||||||
Borrower J | Others | 10 | — | |||||||
Borrower K | Services | 8 | 1 | |||||||
Borrower L | Services | 6 | 2 | |||||||
Borrower M | Construction | 6 | 2 | |||||||
Borrower N | Wholesale and retail | 5 | 5 | |||||||
Borrower O | Manufacturing | 5 | 2 | |||||||
Borrower P | Others | 5 | 4 | |||||||
Borrower Q | Others | 4 | 4 | |||||||
Borrower R | Services | 4 | 1 | |||||||
Borrower S | Services | 4 | 1 | |||||||
Borrower T | Wholesale and retail | 4 | 3 | |||||||
|
|
|
| |||||||
Total | ₩ | 264 | ₩ | 129 | ||||||
|
|
|
| |||||||
| (1) | If the estimated recovery value of collateral for a non-performing loan is sufficient compared to the outstanding loan balance, we record no allowances for loan losses for such non-performing loan. |
71
Table of Contents
Non-Performing Loan Strategy
One of our primary objectives is to prevent our loans from becoming non-performing. Through our corporate credit rating systems, we believe that we have reduced our risks relating to future non-performing loans. Our credit rating systems are designed to prevent our loan officers from extending new loans to borrowers with high credit risks based on the borrower’s credit rating. Our early warning system is designed to bring any sudden increase in a borrower’s credit risk to the attention of our loan officers, who then closely monitor such loans. See “Item 11. Quantitative and Qualitative Disclosures about Market Risk—Credit Risk Management—Credit Review and Monitoring.”
Notwithstanding the above, if a loan becomes non-performing, an officer at the branch level responsible for monitoring non-performing loans will commence a due diligence review of the borrower’s assets, send a notice either demanding payment or stating that we will take legal action and prepare for legal action.
At the same time, we also initiate our non-performing loan management process, which begins with:
| • | identifying loans subject to a proposed sale by assessing the estimated losses from such sale based on the estimated recovery value of collateral, if any, for such non-performing loans; |
| • | identifying loans subject to charge-off based on the estimated recovery value of collateral, if any, for such non-performing loans and the estimated rate of recovery of unsecured loans; and |
| • | on a limited basis, identifying corporate loans subject to normalization efforts based on the cash-flow situation of the borrower. |
Once the details of a non-performing loan are identified, we pursue early solutions for recovery. While the overall process is the responsibility of Kookmin Bank’s Credit Division, actual recovery efforts on non-performing loans are handled at the operating branch level.
In addition, we use the services of our wholly-owned loan collection subsidiary, KB Credit Information Co., Ltd., which receives payments from recoveries made on charged-off loans and certain loans that are overdue for over three months (28 days on average in the case of credit card loans). KB Credit Information has approximately 126 employees, including legal experts and management employees. The fees that it receives are based on the amounts of non-performing and charged-off loans that are recovered. In 2020, 2021 and 2022, the amount recovered was ₩302 billion, ₩257 billion and ₩238 billion, respectively.
Methods for resolving non-performing loans include the following:
| • | non-performing loans are managed by the operating branches of Kookmin Bank until such loans are charged off; |
| • | a demand note is dispatched by mail if payment is generally one month past due; |
| • | calls and visits are made by Kookmin Bank’s operating branches to customers encouraging them to make payments; |
| • | borrowers who are past due on payments of interest and principal are registered on the Korea Credit Information Services’ database of non-performing loans; |
| • | for unsecured loans other than credit card loans, the loans are transferred to KB Credit Information for collection on a case-by-case basis; |
| • | for secured loans, actions to enforce or protect the security interests (including foreclosure and auction of the collateral) are commenced within five months of such loans becoming past due; and |
| • | charged-off loans are given to KB Credit Information for collection, except for loans where the cost of collection exceeds the possible recovery or where the statute of limitations for collection has expired. |
72
Table of Contents
In addition, credit card loans that are in arrears for over 28 days on average are transferred to KB Credit Information for collection.
If a loan becomes non-performing, it is managed by an operating branch of Kookmin Bank until such loan is charged off. However, in order to promote speedy recovery on loans subject to foreclosures and litigation, our policy is to permit the branch responsible for handling these loans to request one of Kookmin Bank’s regional head offices for assistance with litigation proceedings and proceedings related to foreclosure and auction of the collateral.
In addition to making efforts to collect on these non-performing loans, we also undertake measures to reduce the level of our non-performing loans, which include:
| • | selling our non-performing loans to third parties, including the Korea Asset Management Corporation; and |
| • | entering into asset securitization transactions with respect to our non-performing loans. |
We generally expect to suffer a partial loss on loans that we sell or securitize, to the extent such sales and securitizations are recognized under IFRS as sale transactions.
Regulatory Reserve for Credit Losses
If our allowances for credit losses are deemed insufficient for regulatory purposes, we are required to compensate for the difference by recording a regulatory reserve for credit losses, which is segregated within our retained earnings. Regulatory reserve for credit losses are not available for distribution to shareholders as dividends. The level of regulatory reserve for credit losses required to be recorded is equal to the amount by which our allowances for credit losses under IFRS are less than the greater of (x) the amount of expected loss calculated using the internal ratings-based approach under Basel III and as approved by the Financial Supervisory Service and (y) the required amount of credit loss reserve calculated based on standards prescribed by the Financial Services Commission. As of December 31, 2022, our regulatory reserve for credit losses was ₩4,356 billion.
The following tables set forth the Financial Services Commission’s guidelines for the classification of loans and the minimum percentages of the outstanding principal amount of the relevant loans or balances that the credit loss reserve must cover:
Loan Classification | Loan Characteristics | |
Normal | Loans extended to customers that, based on our consideration of their business, financial position and future cash flows, do not raise concerns regarding their ability to repay the loans. | |
Precautionary | Loans extended to customers that (i) based on our consideration of their business, financial position and future cash flows, show potential risks with respect to their ability to repay the loans, although showing no immediate default risk or (ii) are in arrears for one month or more but less than three months. | |
Substandard | (i) Loans extended to customers that, based on our consideration of their business, financial position and future cash flows, are judged to have incurred considerable default risks as their ability to repay has deteriorated; or
(ii) the portion that we expect to collect of total loans (a) extended to customers that have been in arrears for three months or more, (b) extended to customers that have incurred serious default risks due to the occurrence of, among other things, final refusal to pay their debt instruments, entry into liquidation or bankruptcy proceedings or closure of their businesses, or (c) extended to customers who have outstanding loans that are classified as “doubtful” or “estimated loss.” | |
73
Table of Contents
Loan Classification | Loan Characteristics | |
Doubtful | Loans exceeding the amount that we expect to collect of total loans to customers that:
(i) based on our consideration of their business, financial position and future cash flows, have incurred serious default risks due to noticeable deterioration in their ability to repay; or
(ii) have been in arrears for three months or more but less than 12 months. | |
Estimated loss | Loans exceeding the amount that we expect to collect of total loans to customers that:
(i) based on our consideration of their business, financial position and future cash flows, are judged to be accounted as a loss because the inability to repay became certain due to serious deterioration in their ability to repay;
(ii) have been in arrears for 12 months or more; or
(iii) have incurred serious risks of default in repayment due to the occurrence of, among other things, final refusal to pay their debt instruments, liquidation or bankruptcy proceedings or closure of their business. | |
Loan Classifications | Corporate(1) | Consumer | Credit Card Balances(2) | Credit Card Loans(3) | ||||||||||||
Normal | 0.85% or above | 1% or above | 1.1% or above | 2.5% or above | ||||||||||||
Precautionary | 7% or above | 10% or above | 40% or above | 50% or above | ||||||||||||
Substandard | 20% or above | 20% or above | 60% or above | 65% or above | ||||||||||||
Doubtful | 50% or above | 55% or above | 75% or above | 75% or above | ||||||||||||
Estimated loss | 100% | 100% | 100% | 100% | ||||||||||||
| (1) | Subject to certain exceptions pursuant to the Banking Industry Supervision Regulations of Korea. |
| (2) | Applicable for credit card balances from general purchases. |
| (3) | Applicable for cash advances, card loans and revolving credit card assets. |
Loan Charge-Offs
Basic Principles
We attempt to minimize loans to be charged off by adhering to a sound credit approval process based on credit risk analysis prior to extending loans and a systematic management of outstanding loans. However, if charge-offs are necessary, we charge off loans subject to our charge-off policy at an early stage in order to maximize accounting transparency, to minimize any waste of resources in managing loans which have a low probability of being collected and to reduce our non-performing loan ratio.
Loans To Be Charged Off
Loans are charged off if they are deemed to be uncollectible by falling under any of the following categories:
| • | loans for which collection is not foreseeable due to insolvency, bankruptcy, compulsory execution, disorganization, dissolution or the shutting down of the business of the debtor; |
| • | loans for which collection is not foreseeable due to the death or disappearance of the debtor; |
| • | loans for which expenses of collection exceed the collectable amount; |
| • | loans on which collection is not possible through legal or any other means; |
| • | payments in arrears in respect of credit cards that have been overdue for a period of six months or more and have been classified as expected loss (excluding instances where there has been partial payment of the overdue balance, where a related balance is not overdue or where a charge off is not possible due to Korean regulations); and |
74
Table of Contents
| • | the portion of loans classified as “estimated loss,” net of any recovery from collateral, which is deemed to be uncollectible. |
Procedure for Charge-off Approval
In order to charge off corporate loans, an application for a charge-off must be submitted to Kookmin Bank’s Credit Management Department promptly after the corporate loan is classified as estimated loss or deemed uncollectible. The Credit Management Department refers the charge-off application to Kookmin Bank’s Audit Department for their review to ensure compliance with our internal procedures for charge-offs. Then, the Credit Management Department, after reviewing the application to confirm that it meets relevant requirements, seeks an approval from the Financial Supervisory Service for our charge-offs, which is typically granted. Once we receive approval from the Financial Supervisory Service, we must also obtain approval from our senior management to charge off those loans.
With respect to credit card balances and unsecured retail loans, we follow a different process to determine which credit card balances and unsecured retail loans should be charged off, based on the length of time those loans or balances are past due. We charge off unsecured retail loans deemed to be uncollectible and credit card balances which have been overdue for a period of six months or more or which have been deemed to be uncollectible under IFRS.
Treatment of Loans Charged Off
Once loans are charged off, we classify them as charged-off loans and remove them from our balance sheet. These loans are managed based on a different set of procedures. We continue our collection efforts in respect of these loans, including through our subsidiary, KB Credit Information, although loans may be charged off before we begin collection efforts in some circumstances.
If a collateralized loan is overdue, we will, typically within one year from the time that such loan became overdue (or after a longer period in certain circumstances), petition a court to foreclose and sell the collateral through a court-supervised auction. If a debtor ultimately fails to repay and the court grants its approval for foreclosure, we will sell the collateral, net of expenses incurred from the auction.
75
Table of Contents
Net Charge-Offs
The following table presents our net charge-offs for each of the years indicated:
| For the Year Ended December 31, | ||||||||||||||||||||||||||||||||||||
| 2020 | 2021 | 2022 | ||||||||||||||||||||||||||||||||||
| Average Loans | Net Charge- Offs | Net Charge- Offs/ Average Loans | Average Loans | Net Charge- Offs | Net Charge- Offs/ Average Loans | Average Loans | Net Charge- Offs | Net Charge- Offs/Average Loans | ||||||||||||||||||||||||||||
| (in billions of Won, except percentages) | ||||||||||||||||||||||||||||||||||||
Domestic: | ||||||||||||||||||||||||||||||||||||
Corporate | ||||||||||||||||||||||||||||||||||||
Small- and medium sized enterprise | ₩ | 121,376 | ₩ | (9 | ) | 0.0 | % | ₩ | 129,410 | ₩ | (11 | ) | 0.0 | % | ₩ | 148,198 | ₩ | (3 | ) | 0.0 | % | |||||||||||||||
Large corporate | 37,132 | 102 | 0.3 | 39,458 | 100 | 0.3 | 48,974 | 72 | 0.1 | |||||||||||||||||||||||||||
|
|
|
|
|
|
|
|
|
|
|
| |||||||||||||||||||||||||
Total corporate | 158,508 | 93 | 0.1 | 168,868 | 89 | 0.1 | 197,172 | 69 | 0.0 | |||||||||||||||||||||||||||
Retail | ||||||||||||||||||||||||||||||||||||
Mortgage and home equity | 110,447 | (3 | ) | 0.0 | 116,102 | (28 | ) | 0.0 | 119,039 | (9 | ) | 0.0 | ||||||||||||||||||||||||
Other consumer | 64,220 | 328 | 0.5 | 71,587 | 234 | 0.3 | 69,789 | 204 | 0.3 | |||||||||||||||||||||||||||
|
|
|
|
|
|
|
|
|
|
|
| |||||||||||||||||||||||||
Total retail | 174,667 | 325 | 0.2 | 187,689 | 206 | 0.1 | 188,828 | 195 | 0.1 | |||||||||||||||||||||||||||
Credit cards | 18,586 | 366 | 2.0 | 19,923 | 289 | 1.5 | 22,103 | 327 | 1.5 | |||||||||||||||||||||||||||
Total domestic | 351,761 | 784 | 0.2 | 376,480 | 584 | 0.2 | 408,103 | 591 | 0.1 | |||||||||||||||||||||||||||
|
|
|
|
|
|
|
|
|
|
|
| |||||||||||||||||||||||||
Foreign: | 14,683 | 121 | 0.8 | 22,580 | 120 | 0.5 | 32,309 | 509 | 1.6 | |||||||||||||||||||||||||||
|
|
|
|
|
|
|
|
|
|
|
| |||||||||||||||||||||||||
Total | ₩ | 366,444 | ₩ | 905 | 0.2 | % | ₩ | 399,060 | ₩ | 704 | 0.2 | % | ₩ | 440,412 | ₩ | 1,100 | 0.2 | % | ||||||||||||||||||
|
|
|
|
|
|
|
|
|
|
|
| |||||||||||||||||||||||||
Investment Portfolio
Investment Policy
We invest in and trade Won-denominated and, to a lesser extent, foreign currency-denominated securities for our own account to:
| • | maintain the stability and diversification of our assets; |
| • | maintain adequate sources of back-up liquidity to match our funding requirements; and |
| • | supplement income from our core lending activities. |
We also invest in and trade such securities as part of the general account investments of our insurance subsidiaries that support their insurance policy liabilities. In making securities investments, we take into account a number of factors, including macroeconomic trends, industry analysis, credit evaluation and maturity in determining whether to make particular investments in securities.
Our investments in securities are also subject to a number of guidelines, including limitations prescribed under the Financial Holding Company Act and the Bank Act. Under these regulations, a bank holding company may not own (i) more than 5% of the total issued and outstanding shares of another finance-related company, (ii) any shares of its affiliates, other than its direct or indirect subsidiaries or (iii) any shares of a non-finance-related company. In addition, Kookmin Bank must limit its investments in equity securities and debt securities with a redemption period of over three years (other than government bonds, the Monetary Stabilization Bonds issued by the Bank of Korea, among others) to 100.0% of its total Tier I and Tier II capital amount (less any capital deductions). Generally, Kookmin Bank is also prohibited from acquiring more than 15.0% of the shares with voting rights issued by any other corporation subject to certain exceptions. Pursuant to the Bank Act, a bank and its trust accounts are prohibited from acquiring the shares of a major shareholder (for the definition of
76
Table of Contents
“major shareholder,” see “—Supervision and Regulation—Principal Regulations Applicable to Banks—Financial Exposure to Any Individual Customer and Major Shareholder”) of that bank in excess of an amount equal to 1% of the sum of the bank’s Tier I and Tier II capital (less any capital deductions). Further information on the regulatory environment governing our investment activities is set out in “—Supervision and Regulation—Principal Regulations Applicable to Financial Holding Companies—Liquidity,” “—Supervision and Regulation—Principal Regulations Applicable to Financial Holding Companies—Restrictions on Shareholdings in Other Companies,” “—Supervision and Regulation—Principal Regulations Applicable to Banks—Liquidity” and “—Supervision and Regulation—Principal Regulations Applicable to Banks—Restrictions on Shareholdings in Other Companies.”
The following table sets out the definitions of the three categories of securities we hold:
Category | Classification | |
Financial assets at fair value through profit or loss | Financial assets that are either classified as held for trading, designated by us at fair value through profit or loss upon initial recognition or required to be mandatorily measured at fair value through profit or loss. | |
Financial assets at fair value through other comprehensive income | Debt instruments held with a business model whose objective is achieved by both collecting contractual cash flows and selling financial assets, and are consistent with representing solely payments of principal and interest on the principal amount outstanding; or
Equity instruments not held for trading with the objective of generating a profit from short-term fluctuations in price or dealers’ margin, designated as financial assets at fair value through other comprehensive income. | |
Financial assets at amortized cost | Financial assets held with a business model whose objective is to hold assets in order to collect contractual cash flows, and are consistent with representing solely payments of principal and interest on the principal amount outstanding. | |
We also hold limited balances of venture capital securities, non-marketable and restricted equity securities and derivative instruments.
77
Table of Contents
Maturity Analysis
The following table categorizes our debt securities by maturity and weighted average yield as of December 31, 2022:
| Within 1 Year | Weighted Average Yield(1) | Over 1 But within 5 Years | Weighted Average Yield(1) | Over 5 But within 10 Years | Weighted Average Yield(1) | Over 10 Years | Weighted Average Yield(1) | Total | Weighted Average Yield(1) | |||||||||||||||||||||||||||||||
| (in billions of Won, except percentages) | ||||||||||||||||||||||||||||||||||||||||
Financial assets at fair value through other comprehensive income: | ||||||||||||||||||||||||||||||||||||||||
Korean treasury securities and government agencies | ₩ | 6,368 | 1.60 | % | ₩ | 5,327 | 2.14 | % | ₩ | 666 | 3.24 | % | ₩ | 3,613 | 2.40 | % | ₩ | 15,974 | 2.03 | % | ||||||||||||||||||||
Debt securities issued by financial institutions | 10,923 | 2.08 | 9,383 | 2.22 | 186 | 2.65 | 140 | 3.19 | 20,632 | 2.16 | ||||||||||||||||||||||||||||||
Corporate debt securities | 5,000 | 2.18 | 10,952 | 2.27 | 1,419 | 3.15 | 911 | 3.35 | 18,282 | 2.37 | ||||||||||||||||||||||||||||||
Asset-backed securities | 290 | 1.79 | 68 | 3.29 | 50 | 3.45 | 29 | 1.67 | 437 | 2.20 | ||||||||||||||||||||||||||||||
|
|
|
|
|
|
|
|
|
| |||||||||||||||||||||||||||||||
Total | ₩ | 22,581 | 1.96 | % | ₩ | 25,730 | 2.23 | % | ₩ | 2,321 | 3.14 | % | ₩ | 4,693 | 2.61 | % | ₩ | 55,325 | 2.19 | % | ||||||||||||||||||||
|
|
|
|
|
|
|
|
|
| |||||||||||||||||||||||||||||||
Financial assets at amortized cost: | ||||||||||||||||||||||||||||||||||||||||
Korean treasury securities and government agencies | ₩ | 1,166 | 2.55 | % | ₩ | 5,515 | 1.84 | % | ₩ | 6,883 | 3.33 | % | ₩ | 9,616 | 1.73 | % | ₩ | 23,180 | 2.27 | % | ||||||||||||||||||||
Debt securities issued by financial institutions | 5,682 | 2.23 | 4,704 | 2.98 | 363 | 6.29 | 577 | 4.04 | 11,326 | 2.76 | ||||||||||||||||||||||||||||||
Corporate debt securities | 1,824 | 2.31 | 7,845 | 2.34 | 1,906 | 2.20 | 4,195 | 2.99 | 15,770 | 2.49 | ||||||||||||||||||||||||||||||
Asset-backed securities | 531 | 5.01 | 4,934 | 2.02 | 2,052 | 2.00 | 138 | 2.49 | 7,655 | 2.23 | ||||||||||||||||||||||||||||||
|
|
|
|
|
|
|
|
|
| |||||||||||||||||||||||||||||||
Total | ₩ | 9,203 | 2.44 | % | ₩ | 22,998 | 2.28 | % | ₩ | 11,204 | 2.99 | % | ₩ | 14,526 | 2.20 | % | ₩ | 57,931 | 2.42 | % | ||||||||||||||||||||
|
|
|
|
|
|
|
|
|
| |||||||||||||||||||||||||||||||
Total | ₩ | 31,784 | 2.10 | % | ₩ | 48,728 | 2.25 | % | ₩ | 13,525 | 3.02 | % | ₩ | 19,219 | 2.30 | % | ₩ | 113,256 | 2.31 | % | ||||||||||||||||||||
|
|
|
|
|
|
|
|
|
| |||||||||||||||||||||||||||||||
| (1) | The weighted average yield for the portfolio represents the yield to maturity for each individual security, weighted using its carrying amount (which is the amortized cost in the case of financial assets at amortized cost and the fair value in the case of financial assets at fair value through other comprehensive income). |
Funding
We obtain funding for our lending activities from a variety of sources, both domestic and foreign. Our principal source of funding is customer deposits. In addition, we acquire funding through long-term borrowings (comprising debentures and borrowings), short-term borrowings, including borrowings from the Bank of Korea, and call money.
Our primary funding strategy has been to achieve low-cost funding by increasing the average balances of low-cost retail deposits, in particular demand deposits and time deposits. We also have focused our marketing efforts on higher net worth individuals, who account for a significant portion of the assets in our retail deposit base. Customer deposits accounted for 74.9% of total funding as of December 31, 2021 and 73.5% of total funding as of December 31, 2022.
78
Table of Contents
Our borrowings consist of issuances of debentures and borrowings from financial institutions, the Korean government and government-affiliated funds. The majority of our borrowings is long-term, with maturities ranging from one year to 15 years.
Deposits
Although the majority of our deposits are short-term, it has been our experience that the majority of our depositors generally roll over their deposits at maturity, providing us with a stable source of funding.
The following table shows the average balances of our deposits and the average rates paid on our deposits for the periods indicated:
| 2020 | 2021 | 2022 | ||||||||||||||||||||||
| Average Balance(1) | Average Rate Paid | Average Balance(1) | Average Rate Paid | Average Balance(1) | Average Rate Paid | |||||||||||||||||||
| (in billions of Won, except percentages) | ||||||||||||||||||||||||
Demand deposits: | ||||||||||||||||||||||||
Non-interest bearing | ₩ | 4,533 | — | ₩ | 5,263 | — | ₩ | 5,427 | — | |||||||||||||||
Interest bearing | 149,141 | 0.18 | % | 180,936 | 0.15 | % | 182,468 | 0.25 | % | |||||||||||||||
Time deposits | 166,275 | 1.56 | 158,795 | 1.20 | 187,934 | 2.11 | ||||||||||||||||||
Certificates of deposit | 3,636 | 1.38 | 3,618 | 0.86 | 5,511 | 2.36 | ||||||||||||||||||
|
|
|
|
|
|
|
|
|
|
|
| |||||||||||||
Average total deposits | ₩ | 323,585 | 0.91 | % | ₩ | 348,612 | 0.65 | % | ₩ | 381,340 | 1.21 | % | ||||||||||||
|
|
|
|
|
|
|
|
|
|
|
| |||||||||||||
| (1) | Average balances are based on daily balances for our banking, credit card and securities operations and monthly or quarterly balances for our other operations. |
For a description of our retail deposit products, see “—Business—Retail Banking—Deposit-Taking Activities.”
Uninsured deposits, including uninsured time deposits, are not subject to Korean regulatory reporting requirements. Notwithstanding the foregoing, the Depositor Protection Act provides insurance for certain deposits of banks in Korea through a deposit insurance system. See “—Supervision and Regulation—Principal Regulations Applicable to Banks—Deposit Insurance System.” Other than the maximum ₩50 million per individual or entity for deposits and interest in a single financial institution insured by the Korea Deposit Insurance Corporation in accordance with the foregoing, all deposits are uninsured. Although the Depositor Protection Act provides insurance for the deposits at our foreign branches, to the extent those deposits are recognized by the Korea Deposit Insurance Corporation to also be protected by the deposit insurance systems of the countries where such foreign branches are located, such deposits are not protected by the Korea Deposit Insurance Corporation under the Depositor Protection Act.
The insured status of deposits in our foreign branches, the amount of which we do not consider to be material as of the date of this annual report, are determined based on the individual insurance limits enacted within local regulations, and are thus subject to differing national deposit insurance regimes.
Our total uninsured deposits, including uninsured deposits at our foreign branches, amounted to ₩313,969 billion, ₩343,002 billion and ₩299,356 billion as of December 31, 2020, 2021 and 2022, respectively.
79
Table of Contents
Uninsured Time Deposits
The following table presents the remaining maturities of our uninsured time deposits, including uninsured time deposits at our foreign subsidiaries, as of December 31, 2022:
| As of December 31, 2022 | ||||
| (in billions of Won) | ||||
Maturing within three months | ₩ | 111,721 | ||
After three but within six months | 33,696 | |||
After six but within 12 months | 79,050 | |||
After 12 months | 9,625 | |||
|
| |||
Total | ₩ | 234,092 | ||
|
| |||
Supervision and Regulation
Principal Regulations Applicable to Financial Holding Companies
General
The Financial Holding Company Act, last amended on January 1, 2023, regulates Korean financial holding companies and their subsidiaries. The entities that regulate and supervise Korean financial holding companies and their subsidiaries are the Financial Services Commission and the Financial Supervisory Service.
The Financial Services Commission exerts direct control over financial holding companies pursuant to the Financial Holding Company Act. Among other things, the Financial Services Commission approves the establishment of financial holding companies, issues regulations on the capital adequacy of financial holding companies and their subsidiaries, and drafts regulations relating to the supervision of financial holding companies.
Following the instructions and directives of the Financial Services Commission, the Financial Supervisory Service supervises and examines financial holding companies and their subsidiaries. In particular, the Financial Supervisory Service sets requirements relating to Korean financial holding companies’ liquidity and capital adequacy ratios and establishes reporting requirements within the authority delegated under the Financial Services Commission regulations. Financial holding companies must submit quarterly reports to the Financial Supervisory Service discussing business performance, financial status and other matters identified in the Enforcement Decree of the Financial Holding Company Act.
Under the Financial Holding Company Act, a financial holding company is a company which primarily engages in controlling its subsidiaries by holding equity stakes in them equal in aggregate to at least 50% of the financial holding company’s aggregate assets based on its balance sheet as of the end of the immediately preceding fiscal year. A company is required to obtain approval from the Financial Services Commission to become a financial holding company.
A financial holding company may engage only in controlling the management of its subsidiaries, as well as certain ancillary activities including:
| • | financially supporting its direct and indirect subsidiaries; |
| • | raising capital necessary for investment in its subsidiaries or providing financial support to its direct and indirect subsidiaries; |
| • | supporting the business of its direct and indirect subsidiaries, including the development and marketing of financial products; |
80
Table of Contents
| • | providing data processing, legal, accounting and other resources and services that have been commissioned by its direct and indirect subsidiaries so as to support their operations; and |
| • | any other businesses exempted from authorization, permission or approval under the applicable laws and regulations. |
The Financial Holding Company Act requires every financial holding company (other than a financial holding company that is controlled by another financial holding company) and its subsidiaries to obtain prior approval from the Financial Services Commission before acquiring control of another company or to file a report with the Financial Services Commission within 30 days thereafter in certain cases (including acquiring control of another financial company whose assets are less than ₩100 billion as of the end of the immediately preceding fiscal year). In addition, the Financial Services Commission must grant permission to liquidate or to merge with any other company before the liquidation or merger. A financial holding company must report to the Financial Services Commission when certain events, including the following, occur:
| • | when the largest shareholder changes; |
| • | in the case of a bank holding company, when a major investor changes; |
| • | when the shareholding of the controlling shareholder (i.e., the “largest shareholder” or a “principal shareholder,” each as defined in the Financial Holding Company Act) or a person who has a “special relationship” with such controlling shareholder (as defined in the Enforcement Decree of the Financial Holding Company Act) changes by 1% or more of the total issued and outstanding voting shares of the financial holding company; |
| • | when it changes its corporate name; |
| • | when there is a cause for its dissolution; and |
| • | when it or its subsidiaries cease to control any of their respective direct or indirect subsidiaries by disposing of their shares of such direct or indirect subsidiary. |
Capital Adequacy
The Financial Holding Company Act does not provide for a minimum paid-in capital requirement related to financial holding companies. However, all financial holding companies are required to maintain a specified level of solvency. In addition, with respect to the allocation of net profit earned in a fiscal term, a financial holding company must set aside in its legal reserve an amount equal to at least 10% of its net income after tax each time it pays dividends on its net profits earned until its legal reserve reaches at least the aggregate amount of its paid-in capital.
A bank holding company, which is a financial holding company controlling banks or other financial institutions conducting banking business as prescribed in the Financial Holding Company Act, is required to maintain a total minimum consolidated capital adequacy ratio of 11.5% (including applicable additional capital buffers and requirements as described below) as of January 1, 2019. “Consolidated capital adequacy ratio” is defined as the ratio of equity capital as a percentage of risk-weighted assets on a consolidated basis, determined in accordance with the Financial Services Commission requirements that have been formulated based on Bank of International Settlements (or BIS) standards. “Equity capital,” as applicable to bank holding companies, is defined as the sum of common equity Tier I capital, additional Tier I capital and Tier II capital less any deductible items, each as defined under the Regulation on the Supervision of Financial Holding Companies. “Risk-weighted assets” is defined as the sum of credit risk-weighted assets and market risk-weighted assets.
Pursuant to regulations promulgated by the Financial Services Commission commencing in 2013 to implement Basel III, Korean bank holding companies were required to maintain a minimum ratio of common equity Tier I capital to risk-weighted assets of 3.5% and Tier I capital to risk-weighted assets of 4.5% from
81
Table of Contents
December 1, 2013, which minimum ratios were increased to 4.0% and 5.5%, respectively, from January 1, 2014 and increased further to 4.5% and 6.0%, respectively, from January 1, 2015. The amended regulations also require an additional capital conservation buffer of 2.5% in 2022 and 2023, as well as a potential counter-cyclical capital buffer of up to 2.5%, which is determined on a quarterly basis by the Financial Services Commission and may be fully or partially enforced in 2023. Furthermore, we and Kookmin Bank were each designated as a domestic systemically important bank holding company and a domestic systemically important bank, respectively, for 2022 by the Financial Services Commission and were subject to an additional capital requirement of 1.0% in 2022. In July 2022, we and Kookmin Bank were each again designated as a domestic systemically important bank holding company and a domestic systemically important bank, respectively, for 2023, which would again subject us to an additional capital requirement of 1.0% in 2023. All such requirements are in addition to the pre-existing requirement for a minimum ratio of Tier I and Tier II capital (less any capital deductions) to risk-weighted assets set forth above.
Liquidity
All financial holding companies are required to match the maturities of their assets and liabilities on a non-consolidated basis in accordance with the Financial Holding Company Act in order to ensure liquidity. Financial holding companies must:
| • | maintain a Won liquidity ratio (defined as Won assets due within one month, including marketable securities, divided by Won liabilities due within one month) of not less than 100% on a non-consolidated basis; |
| • | maintain a foreign currency liquidity ratio (defined as foreign currency liquid assets due within three months divided by foreign currency liabilities due within three months) of not less than 80% on a non-consolidated basis (except that such requirement is not applicable to a financial holding company whose foreign currency liabilities constitute less than 1% of its total assets); |
| • | maintain a maturity mismatch ratio for foreign currency assets and liabilities due within seven days (defined as foreign currency assets due within seven days less foreign currency liabilities due within seven days, divided by total foreign currency assets) of 0% or more on a non-consolidated basis (except that such requirement is not applicable to a financial holding company whose foreign currency liabilities constitute less than 1% of its total assets); |
| • | maintain a maturity mismatch ratio for foreign currency liabilities and assets due within a month (defined as foreign currency liabilities due within a month less foreign currency assets due within a month, divided by total foreign currency assets) of 10% or less on a non-consolidated basis (except that such requirement is not applicable to a financial holding company whose foreign currency liabilities constitute less than 1% of its total assets); and |
| • | make quarterly reports regarding their Won liquidity and foreign currency liquidity to the Financial Supervisory Service. |
Financial Exposure to Any Individual Customer and Major Investor
Subject to certain exceptions, the aggregate credit (as defined in the Financial Holding Company Act, the Bank Act, the Financial Investment Services and Capital Markets Act, the Insurance Business Act, the Mutual Savings Bank Act and the Specialized Credit Financial Business Act, respectively) of a financial holding company and its direct and indirect subsidiaries that are banks, merchant banks, financial investment companies, insurance companies, savings banks or specialized credit financial business companies (which we refer to as “Financial Holding Company Total Credit”) to a single group of companies that belong to the same conglomerate as defined in the Monopoly Regulations and Fair Trade Act will not be permitted to exceed 25% of net aggregate equity capital (as defined below).
82
Table of Contents
“Net aggregate equity capital” is defined under the Enforcement Decree of the Financial Holding Company Act as the sum of:
| (1) | in case of a financial holding company, the capital amount as defined in Article 24-3(7), Item 2 of the Enforcement Decree of the Financial Holding Company Act; |
| (2) | in case of a bank, the capital amount as defined in Article 2(1), Item 5 of the Bank Act; |
| (3) | in case of a merchant bank, the capital amount as defined in Article 342(1) of the Financial Investment Services and Capital Markets Act; and |
| (4) | in case of a financial investment company, the capital amount as defined in Article 37(3) of the Enforcement Decree of the Financial Investment Services and Capital Markets Act; |
| (5) | in case of an insurance company, the capital amount as defined in Article 2, Item 15 of the Insurance Business Act; |
| (6) | in case of a savings bank, the capital amount as defined in Article 2, Item 4 of the Mutual Savings Bank Act; and |
| (7) | in case of a specialized credit financial business company, the capital amount as defined in Article 2, Item 19 of the Specialized Credit Financial Business Act; |
less the sum of:
| (1) | the amount of shares of direct and indirect subsidiaries held by the financial holding company; |
| (2) | the amount of shares that are cross-held by each direct and indirect subsidiary that is a bank, merchant bank, financial investment company, insurance company, savings bank or specialized credit financial business company; and |
| (3) | the amount of shares of a financial holding company held by such direct and indirect subsidiaries that are banks, merchant banks, financial investment companies, insurance companies, savings banks or specialized credit financial business companies. |
The Financial Holding Company Total Credit to a single individual or judicial person may not exceed 20% of the net aggregate equity capital. In addition, the Financial Holding Company Total Credit to a shareholder holding (together with the persons who have a “special relationship” with the shareholder, as defined in the Enforcement Decree of the Financial Holding Company Act) in aggregate more than 10% of the total issued and outstanding voting shares of a financial holding company generally may not exceed the lesser of (x) 25% of the net aggregate equity capital and (y) the amount of the equity capital of the financial holding company multiplied by the shareholding ratio of the shareholder (together with the persons who have a special relationship with the shareholder).
Further, the total sum of credits (as defined in the Financial Holding Company Act, the Bank Act, the Financial Investment Services and Capital Markets Act, the Insurance Business Act, the Mutual Savings Bank Act and the Specialized Credit Financial Business Act, respectively) of a bank holding company and its direct and indirect subsidiaries that are banks, merchant banks, financial investment companies, insurance companies, savings banks or specialized credit financial business companies as applicable (“Bank Holding Company Total Credit”) extended to a “major investor” (as defined below) (together with the persons who have a special relationship with that major investor) will not be permitted to exceed the lesser of (x) 25% of the net aggregate equity capital and (y) the amount of the equity capital of the bank holding company multiplied by the shareholding ratio of the major investor, except for certain cases.
“Major investor” is defined as:
| • | a shareholder holding (together with persons who have a special relationship with that shareholder) in excess of 10% (or in the case of a bank holding company controlling regional banks only, 15%) in the aggregate of the bank holding company’s total issued and outstanding voting shares; or |
83
Table of Contents
| • | a shareholder holding (together with persons who have a special relationship with that shareholder) more than 4% in the aggregate of the total issued and outstanding voting shares of the bank holding company controlling nationwide banks, where the shareholder is the largest shareholder or has actual control over the major business affairs of the bank holding company through, for example, appointment and dismissal of the officers pursuant to the Enforcement Decree of the Financial Holding Company Act. |
In addition, the total sum of the Bank Holding Company Total Credit granted to all of a bank holding company’s major investor must not exceed 25% of the bank holding company’s net aggregate equity capital. Furthermore, any bank holding company that, together with its direct and indirect subsidiaries, intends to extend credit to the bank holding company’s major investor in an amount equal to or exceeding the lesser of (x) the amount equivalent to 0.1% of the net aggregate equity capital and (y) ₩5 billion, in any single transaction, must obtain prior unanimous board resolutions and then, immediately after providing the credit, must file a report to the Financial Services Commission and publicly disclose the filing of the report.
Restrictions on Transactions Among Direct and Indirect Subsidiaries and Financial Holding Company
Generally, a direct or indirect subsidiary of a financial holding company may not extend credits (excluding the amount of corporate credit card payments issued by a direct or indirect subsidiary of a financial holding company that is engaged in the banking business) to that financial holding company. In addition, a direct or indirect subsidiary of a financial holding company may not extend credits (excluding the amount of corporate credit card payments issued by a direct or indirect subsidiary of a financial holding company that is engaged in the banking business) to other direct or indirect subsidiaries of the financial holding company in excess of 10% of its capital amount on an individual basis or to those subsidiaries in excess of 20% of its capital amount on an aggregate basis. The subsidiary extending the credit must also obtain an adequate level of collateral depending on the type of such collateral from the other subsidiaries unless the credit is otherwise approved by the Financial Services Commission. The adequate level of collateral for each type of collateral is as follows:
| (1) | for deposits and installment savings, obligations of the Korean government or the Bank of Korea, obligations guaranteed by the Korean government or the Bank of Korea, obligations secured by securities issued or guaranteed by the Korean government or the Bank of Korea, 100% of the credit extended; |
| (2) | for obligations of municipal governments under the Local Autonomy Act, local public enterprise under the Local Public Enterprises Act and investment institutions and other quasi-investment institutions under the Basic Act on the Management of Government-Invested Institution or for obligations guaranteed by, or secured by the securities issued or guaranteed by, the aforementioned entities pursuant to the relevant regulations, 110% of the credit extended; and |
| (3) | for any property other than those set forth in paragraphs (1) and (2) above, 130% of the credit extended. |
Subject to certain exceptions, a direct or indirect subsidiary of a financial holding company is prohibited from owning the shares of any other direct or indirect subsidiaries (other than those directly controlled by that direct or indirect subsidiary) under the common control of the financial holding company.
Subject to certain exceptions, a direct or indirect subsidiary of a financial holding company is also prohibited from owning the shares of the financial holding company controlling that direct or indirect subsidiary. The transfer of certain assets classified as precautionary or below between a financial holding company and its direct or indirect subsidiary or between the direct and indirect subsidiaries of a financial holding company is prohibited except for:
| (1) | transfers to a special purpose company, or entrustment with a trust company, for an asset-backed securitization transaction under the Asset-Backed Securitization Act; |
84
Table of Contents
| (2) | transfers to a mortgage-backed securities issuance company for a mortgage securitization transaction; |
| (3) | transfers or in-kind contributions to a corporate restructuring vehicle under the Corporate Restructuring Investment Companies Act; and |
| (4) | transfers to a corporate restructuring company under the Industry Promotion Act. |
Disclosure of Management Performance
For the purpose of protecting the depositors and investors in the direct or indirect subsidiaries of financial holding companies, the Financial Services Commission requires financial holding companies to disclose certain material matters including:
| (1) | financial condition and profit and loss of the financial holding company and its direct and indirect subsidiaries; |
| (2) | fund-raising by the financial holding company and its direct and indirect subsidiaries and the appropriation of such funds; |
| (3) | any sanctions levied on the financial holding company and its direct and indirect subsidiaries under the Financial Holding Company Act or any corrective measures or sanctions under the Law on Improvement of Structure of Financial Industry; and |
| (4) | occurrence of any non-performing assets or financial incident that may have a material adverse effect, or any other event as prescribed in the applicable regulations. |
Restrictions on Shareholdings in Other Companies
Generally, a financial holding company may not own (i) more than 5% of the total issued and outstanding shares of another finance-related company, (ii) any shares of its affiliates, other than its direct or indirect subsidiaries or (iii) any shares of a non-finance-related company.
Restrictions on Shareholdings by Direct and Indirect Subsidiaries
Generally, a direct subsidiary of a financial holding company may not control any other company other than, as an indirect subsidiary of the financial holding company:
| • | financial institutions established in foreign jurisdictions that are relevant to the business of the direct subsidiary; |
| • | certain financial institutions that are relevant to the business of the direct subsidiary, which are engaged in any business that the direct subsidiary may conduct without any licenses or permits; |
| • | certain financial institutions whose business is related to the business of the direct subsidiary as described by the Enforcement Decree of the Financial Holding Company Act (for example, a bank subsidiary may control only credit information companies, credit card companies and financial investment companies with a dealing, brokerage, collective investment, investment advice, discretionary investment management and/or trust license); |
| • | certain financial institutions whose business is related to the financial business as prescribed by the Ordinance of the Prime Minister; and |
| • | certain companies which are not financial institutions but whose business is related to the financial business of the financial holding company as prescribed by the Enforcement Decree of the Financial Holding Company Act (for example, a finance-related research company or a finance-related information technology company). |
Acquisition of such indirect subsidiaries by direct subsidiaries of a financial holding company requires prior permission from the Financial Services Commission or the submission of a report to the Financial Services
85
Table of Contents
Commission, depending on the types of the indirect subsidiaries and the amount of total assets of the indirect subsidiaries.
Subject to certain exceptions, an indirect subsidiary of a financial holding company may not control any other company. If an indirect subsidiary of a financial holding company had control over another company at the time it became such an indirect subsidiary, the indirect subsidiary is required to dispose of its interest in the other company within two years from such time.
Restrictions on Transactions between a Bank Holding Company and its Major Investor
A bank holding company and its direct and indirect subsidiaries may not acquire (including through their respective trust accounts) shares issued by the bank holding company’s major investor in excess of 1% of the net aggregate equity capital (as defined above). In addition, if those entities intend to acquire shares issued by that major investor in any single transaction equal to or exceeding the lesser of (x) the amount equivalent to 0.1% of the net aggregate equity capital and (y) ₩5 billion, that entity must obtain prior unanimous board resolutions and then, immediately after the acquisition, file a report to the Financial Services Commission and publicly disclose the filing of the report.
Restrictions on Ownership of a Financial Holding Company
Under the Financial Holding Company Act, a financial institution generally may not control a financial holding company. In addition, any single shareholder and persons who have a special relationship with that shareholder may acquire beneficial ownership of up to 10% of the total issued and outstanding shares with voting rights of a bank holding company that controls nationwide banks or 15% of the total issued and outstanding shares with voting rights of a bank holding company that controls only regional banks, subject to certain exceptions. Among others, the Korean government and the Korea Deposit Insurance Corporation are not subject to this limit. “Non-financial business group companies” (as defined below), however, may not acquire the beneficial ownership of shares of a bank holding company controlling nationwide banks in excess of 4% of that bank holding company’s outstanding voting shares unless they obtain the approval of the Financial Services Commission and agree not to exercise voting rights in respect of shares in excess of the 4% limit, in which case they may acquire beneficial ownership of up to 10%. Any other person (whether a Korean national or a foreign investor) may acquire no more than 10% of total voting shares issued and outstanding of a bank holding company controlling nationwide banks unless they obtain approval from the Financial Services Commission in each instance where the total holding will exceed 10% (or 15% in the case of a bank holding company controlling only regional banks), 25% or 33% of the total voting shares issued and outstanding of that bank holding company controlling nationwide banks.
Furthermore, in the case where a person (including Korean and foreign investors, but excluding certain persons prescribed under the Enforcement Decree of the Financial Holding Company Act) (i) acquires in excess of 4% of the total issued and outstanding voting shares of any bank holding company (other than a bank holding company controlling only regional banks), (ii) becomes the largest shareholder of such bank holding company in which such person has acquired in excess of 4% of the total issued and outstanding voting shares, (iii) changes its shareholding in such bank holding company, in which it has acquired in excess of 4% of the total issued and outstanding voting shares, by 1% or more of the total issued and outstanding voting shares of such bank holding company or (iv) is a private equity fund or an investment purpose company holding in excess of 4% of the total outstanding voting shares of a bank holding company and changes its members or shareholders, such person must file a report on such change with the Financial Services Commission (x) in case of (i) and (iii), by the last day of the month immediately following the month in which such change occurred, or (y) in case of (ii) and (iv), within ten days after the end of the month in which such change occurred.
“Non-financial business group companies” as defined under the Financial Holding Company Act include:
| (1) | any same shareholder group where the aggregate net assets of all non-financial business companies belonging to that group equals or exceeds 25% of the aggregate net assets of all members of that group; |
86
Table of Contents
| (2) | any same shareholder group where the aggregate assets of all non-financial business companies belonging to that group equals or exceeds ₩2 trillion; |
| (3) | any mutual fund where a same shareholder group identified in (1) or (2) above beneficially owns and/or exercises the voting rights of more than 4% of the total issued and outstanding voting shares of that mutual fund; |
| (4) | any private equity fund (a) where a person falling under any of items (1) through (3) above is a limited partner holding not less than 10% of the total amount of contributions to the private equity fund, or (b) where a person falling under any of items (1) through (3) above is a general partner, or (c) where the total equity of the private equity fund acquired by each affiliate belonging to several enterprise groups subject to the limitation on mutual investment is 30% or more of the total amount of contributions to the private equity fund; or |
| (5) | the investment purpose company concerned, where a private equity fund falling under item (4) above acquires or holds stocks in excess of 4% of the stock or equity of such company or exercises de facto control over significant managerial matters of such company through appointment or dismissal of executives or in any other manner. |
Sharing of Customer Information among Financial Holding Company and its Subsidiaries
Under the Act on Use and Protection of Credit Information, any individual customer’s credit information may be disclosed only after obtaining consent in writing or otherwise to use that information. In addition, under the Act on Real Name Financial Transactions and Confidentiality, an individual working at a financial institution may not provide or reveal information or data concerning the contents of financial transactions to other persons unless such individual receives a request or consent in writing from the holder of a title deed, except under certain exceptions stipulated in the Act. Under the Financial Holding Company Act, a financial holding company and its direct and indirect subsidiaries, however, may share certain credit information of individual customers among themselves for internal management purposes outlined in the Enforcement Decree of the Financial Holding Company Act (such as credit risk management, internal control and customer analysis), without the customers’ written consent, subject to the methods and procedures for provision of such information set forth therein. A subsidiary financial investment company with a dealing and/or brokerage license of a financial holding company may provide that financial holding company and its other direct and indirect subsidiaries information relating to the aggregate amount of cash or securities that a customer of the financial investment company with a dealing and/or brokerage license has deposited, for internal management purposes outlined in the Enforcement Decree of the Financial Holding Company Act, subject to the methods and procedures for provision of such information set forth therein. Certain amendments to the Financial Holding Company Act, which became effective on November 29, 2014, limit the scope of credit information that may be shared without the customers’ prior consent and require certain procedures for provision of customer information as prescribed by the Financial Services Commission. Beginning on November 29, 2014, notice must be given to customers at least once a year regarding (i) the provider of customer information, (ii) the recipient of customer information, (iii) the purpose of providing the information and (iv) the categories of the information provided.
Principal Regulations Applicable to Banks
The banking system in Korea is governed by the Bank Act and the Bank of Korea Act of 1950, as amended (the “Bank of Korea Act”). In addition, Korean banks are subject to the regulations and supervision of the Bank of Korea, the Monetary Policy Board of the Bank of Korea, the Financial Services Commission and its executive body, the Financial Supervisory Service.
The Bank of Korea, established in June 1950 under the Bank of Korea Act, performs the customary functions of a central bank. It seeks to contribute to the sound development of the national economy by price stabilization through establishing and implementing efficient monetary and credit policies with a focus on financial stability. The Bank of Korea acts under instructions of the Monetary Policy Board, the supreme policy-making body of the Bank of Korea.
87
Table of Contents
Under the Bank of Korea Act, the Monetary Policy Board’s primary responsibilities are to formulate monetary and credit policies and to determine the operations, management and administration of the Bank of Korea.
The Financial Services Commission, established in April 1998, regulates commercial banks pursuant to the Bank Act, including establishing guidelines on capital adequacy of commercial banks, and promulgates regulations relating to supervision of banks. Furthermore, the Financial Services Commission regulates market entry into the banking business.
The Financial Supervisory Service, established in January 1999, is subject to the instructions and directives of the Financial Services Commission and carries out supervision and examination of commercial banks. In particular, the Financial Supervisory Service sets requirements both for the prudent control of liquidity and for capital adequacy and establishes reporting requirements pursuant to the authority delegated to it under the Financial Services Commission regulations, pursuant to which banks are required to submit annual reports on financial performance and shareholdings, regular reports on management strategy and non-performing loans, including write-offs, and management of problem companies and plans for the settlement of bad loans.
Under the Bank Act, approval to commence a commercial banking business or a long-term financing business must be obtained from the Financial Services Commission. Commercial banking business is defined as the lending of funds acquired predominantly from the acceptance of demand deposits for a period not exceeding one year or subject to the limitation established by the Financial Services Commission, for a period between one year and three years. Long-term financing business is defined as the lending, for periods in excess of one year, of funds acquired predominantly from paid-in capital, reserves or other retained earnings, the acceptance of time deposits with maturities of at least one year, or the issuance of debentures or other bonds. A bank wishing to enter into any business other than commercial banking and long-term financing businesses must file a report to the Financial Services Commission. For businesses that are subject to a license or approval requirement under applicable laws, such as approval to commence a trust business under the Financial Investment Services and Capital Markets Act, such report must be filed concurrently with a relevant license or approval application to the Financial Services Commission. In addition, approval to merge with any other banking institution, to liquidate, spin off or close a banking business or to transfer all or a part of a business must be obtained from the Financial Services Commission.
If the Financial Services Commission deems a bank’s financial condition to be unsound or if a bank fails to meet the applicable capital adequacy ratio set forth under Korean law, the Financial Services Commission may order:
| • | admonitions or warnings with respect to the bank or its officers; |
| • | capital increases or reductions; |
| • | assignments of contractual rights and obligations relating to financial transactions; |
| • | a suspension of performance by its officers of their duties and the appointment of receivers; |
| • | disposals of property holdings or closures of subsidiaries or branch offices or downsizing; |
| • | stock cancelations or consolidations; |
| • | mergers with other financial institutions; |
| • | acquisition of such bank by a third party; and |
| • | suspensions of a part or all of its business operations for not more than six months. |
Capital Adequacy
The Bank Act requires nationwide banks, such as us, to maintain a minimum paid-in capital of ₩100 billion and regional banks to maintain a minimum paid-in capital of ₩25 billion. All banks, including foreign bank
88
Table of Contents
branches in Korea, are also required to maintain a prescribed solvency position. A bank must also set aside in its legal reserve an amount equal to at least 10% of the net income after tax each time it pays dividends on net profits earned until its legal reserve reaches at least the aggregate amount of its paid-in capital.
Under the Regulation on the Supervision of the Banking Business, the capital of a bank is divided into two categories, Tier I and Tier II capital. Tier I capital (core capital) consists of (i) common equity Tier I capital, including paid-in capital, capital surplus and retained earnings related to common equity and accumulated other comprehensive gains and losses, and (ii) additional Tier I capital, including paid-in capital and capital surplus from the issuance of additional Tier I capital, hybrid capital instruments and other capital securities which meet the standards prescribed by the governor of the Financial Supervisory Service under relevant regulations. Tier II capital (supplementary capital) consists of, among other things, capital and capital surplus from the issuance of Tier II capital, allowances for loan losses on loans classified as “normal” or “precautionary,” subordinated debt and other capital securities which meet the standards prescribed by the governor of the Financial Supervisory Service under Article 26(2) of the Regulation on the Supervision of the Banking Business.
All banks must meet minimum ratios of Tier I and Tier II capital (less any capital deductions) to risk-weighted assets, determined in accordance with Financial Services Commission requirements that have been formulated based on BIS standards. These requirements were adopted and became effective in 1996, and were amended effective January 1, 2008 upon the implementation by the Financial Supervisory Service of Basel II. Under such requirements, all domestic banks and foreign bank branches are required to meet a minimum ratio of Tier I and Tier II capital (less any capital deductions) to risk-weighted assets. Commencing in July 2013, the Financial Services Commission promulgated a series of amended regulations implementing Basel III, pursuant to which Korean banks and bank holding companies were required to maintain a minimum ratio of common equity Tier I capital to risk-weighted assets of 3.5% and Tier I capital to risk-weighted assets of 4.5% from December 1, 2013, which minimum ratios were increased to 4.0% and 5.5%, respectively, from January 1, 2014 and increased further to 4.5% and 6.0%, respectively, from January 1, 2015. The amended regulations also require an additional capital conservation buffer of 2.5% in 2022 and 2023, as well as a potential counter-cyclical capital buffer of up to 2.5%, which is determined on a quarterly basis by the Financial Services Commission and may be fully or partially enforced in 2023. Furthermore, we and Kookmin Bank were each designated as a domestic systemically important bank holding company and a domestic systemically important bank, respectively, for 2022 by the Financial Services Commission and were subject to an additional capital requirement of 1.0% in 2022. In July 2022, we and Kookmin Bank were each again designated as a domestic systemically important bank holding company and a domestic systemically important bank, respectively, for 2023, which would again subject us to an additional capital requirement of 1.0% in 2023. All such requirements are in addition to the pre-existing requirement for a minimum ratio of Tier I and Tier II capital (less any capital deductions) to risk-weighted assets set forth above.
Under the Detailed Regulation on the Supervision of the Banking Business, the following risk-weight ratios must be applied by Korean banks in respect of home mortgage loans:
| (1) | for those banks which adopted a standardized approach for calculating credit risk capital requirements, a risk-weight ratio between 20% and 150% for home equity loans, depending on the loan-to-value ratio and risk profile of the loan; and |
| (2) | for those banks which adopted an internal ratings-based approach for calculating credit risk capital requirements, a risk-weight ratio calculated with reference to the probability of default, loss given default and exposure at default, each as defined under the Detailed Regulation on the Supervision of the Banking Business. |
Liquidity
All banks are required to ensure adequate liquidity by matching the maturities of their assets and liabilities in accordance with the Regulation on the Supervision of the Banking Business. Banks may not invest an amount
89
Table of Contents
exceeding 100% of their Tier I and Tier II capital (less any capital deductions) in equity securities and certain other securities with a redemption period of over three years. This stipulation does not apply to Korean government bonds, Monetary Stabilization Bonds issued by the Bank of Korea or debentures and stocks referred to in items 1 and 2, respectively, of paragraph (6) of Article 11 of the Act on the Structural Improvement of the Financial Industry. The Financial Services Commission uses the liquidity coverage ratio (described below) as the principal liquidity risk management measure, and currently requires each Korean bank to:
| • | maintain a liquidity coverage ratio (defined as the ratio of highly liquid assets to total net cash outflows over a 30-day period) of not less than 100%, which was temporarily reduced to 92.5% until June 2023 in response to the COVID-19 pandemic; |
| • | maintain a foreign currency liquidity coverage ratio of not less than 80%; and |
| • | submit monthly reports with respect to the maintenance of these ratios. |
The Monetary Policy Board of the Bank of Korea is empowered to fix and alter minimum reserve requirements that banks must maintain against their deposit liabilities. The current minimum reserve ratios are:
| • | 7% of average balances for Won currency demand deposits outstanding; |
| • | 0% of average balances for Won currency employee asset establishment savings deposits, employee long-term savings deposits, employee house purchase savings deposits, long-term house purchase savings deposits, household long-term savings deposits and employee preferential savings deposits outstanding (with respect to employee-related deposits and household long-term savings deposits, only if such deposits were made prior to February 28, 2013); and |
| • | 2% of average balances for Won currency time deposits, installment savings deposits, mutual installments, housing installments and certificates of deposit outstanding. |
For foreign currency deposit liabilities, a 2% minimum reserve ratio is applied to time deposits with a maturity of one month or longer, certificates of deposit with a maturity of 30 days or longer and savings deposits with a maturity of six months or longer and a 7% minimum reserve ratio is applied to other deposits. A 1% minimum reserve ratio applies to deposits in offshore accounts, immigrant accounts and resident accounts opened by financial institutions (excluding bank holding companies) and the Export-Import Bank of Korea, as well as foreign currency certificates of deposit held by account holders of such offshore accounts, immigrant accounts and resident accounts opened by financial institutions (excluding bank holding companies) and the Export-Import Bank of Korea.
Furthermore, under the Regulation on the Supervision of the Banking Business, Kookmin Bank is required to maintain a minimum “mid- to long-term foreign exchange funding ratio” of 100%. “Mid-to long term foreign exchange funding ratio” refers to the ratio of (1) the total outstanding amount of foreign exchange borrowing with a maturity of more than one year to (2) the total outstanding amount of foreign exchange lending with a maturity of one year or more.
Net Stable Funding Ratio and Leverage Ratio Requirements
The Financial Services Commission has implemented the Regulation on Supervision of the Banking Business that impose certain liquidity- and leverage-related ratio requirements on banks in Korea, in accordance with Basel III. Pursuant to such Regulation, each Korean bank is required to:
| • | maintain a net stable funding ratio (defined as the ratio of the available amount of stable funding to the required amount of stable funding) of not less than 100%, where (i) the available amount of stable funding generally refers to the portion of liabilities and capital expected to be reliable over a one-year time horizon and (ii) the required amount of stable funding generally refers to the amount of stable funding that is required to be maintained based on the liquidity characteristics, residual maturities and off-balance sheet exposures of the bank’s assets, each as calculated in accordance with the Detailed Regulation on the Supervision of the Banking Business; |
90
Table of Contents
| • | maintain a leverage ratio (defined as the ratio of core capital to total exposures) of not less than 3%, where (i) the core capital includes paid-in capital, capital surplus, retained earnings and hybrid Tier I capital instruments and (ii) total exposures include on-balance sheet exposures, derivative exposures, securities financing transaction exposures and off-balance sheet exposures, each as calculated in accordance with the Detailed Regulation on the Supervision of the Banking Business; and |
| • | submit monthly reports with respect to the maintenance of these ratios. |
Financial Exposure to Any Individual Customer or Major Shareholder
Under the Bank Act, subject to certain exceptions, the sum of large exposures by a bank—in other words, the total sum of its credits to single individuals, juridical persons or business groups that exceed 10% of the sum of Tier I and Tier II capital (less any capital deductions)—generally must not exceed five times the sum of Tier I and Tier II capital (less any capital deductions). In addition, subject to certain exceptions, banks generally may not extend credit (including loans, guarantees, purchases of securities (extended for financial support) and any other transactions that directly or indirectly create credit risk) in excess of 20% of the sum of Tier I and Tier II capital (less any capital deductions) to a single individual or juridical person, or grant credit in excess of 25% of the sum of Tier I and Tier II capital (less any capital deductions) to a single group of companies as defined in the Monopoly Regulations and Fair Trade Act.
The Bank Act also provides for certain restrictions on extending credits to a major shareholder. A “major shareholder” is defined as:
| • | a shareholder holding (together with persons who have a special relationship with that shareholder) in excess of 10% (or 15% in the case of regional banks) in the aggregate of the bank’s total issued and outstanding voting shares; or |
| • | a shareholder holding (together with persons who have a special relationship with such shareholder) in excess of 4% in the aggregate of the bank’s (excluding regional banks) total issued and outstanding voting shares of a bank (excluding shares subject to the shareholding restrictions on “non-financial business group companies” as described below), where such shareholder is the largest shareholder or has actual control over the major business affairs of the bank through, for example, appointment and dismissal of the officers as prescribed by the Enforcement Decree of the Bank Act. Non-financial business group companies primarily consist of: (i) any single shareholding group whose non-financial company assets comprise no less than 25% of its aggregate net assets; (ii) any single shareholding group whose non-financial company assets comprise no less than ₩2 trillion in aggregate; or (iii) any investment company under the Financial Investment Services and Capital Markets Act of which any single shareholding group identified in (i) or (ii) above, owns more than 4% of the total issued and outstanding shares. |
Under these restrictions, banks may not extend credits to a major shareholder (together with persons who have a special relationship with that shareholder) in an amount greater than the lesser of (x) 25% of the sum of the bank’s Tier I and Tier II capital (less any capital deductions) and (y) the relevant major shareholder’s shareholding ratio multiplied by the sum of the bank’s Tier I and Tier II capital (less any capital deductions). In addition, the total sum of credits granted to all major shareholders must not exceed 25% of the bank’s Tier I and Tier II capital (less any capital deductions).
Interest Rates
Korean banks generally depend on deposits as their primary funding source. Under the Act on Registration of Credit Business, Etc. and Protection of Finance Users and the regulations thereunder, interest rates on loans made by registered banks in Korea may not exceed 20% per annum, commencing July 2021. Historically, interest rates on deposits and lending were regulated by the Monetary Policy Board. There are no controls on deposit interest rates in Korea, except for the prohibition on interest payments on current account deposits.
91
Table of Contents
Lending to Small- and Medium-sized Enterprises
In order to obtain funding from the Bank of Korea at concessionary rates for their small- and medium-sized enterprise loans, banks are required to allocate a certain minimum percentage of any quarterly increase in their Won currency lending to small- and medium-sized enterprises. Currently, this minimum percentage is 45% in the case of nationwide banks and 60% in the case of regional banks. If a bank does not comply with this requirement, the Bank of Korea may:
| • | require the bank to prepay all or a portion of funds provided to that bank in support of loans to small- and medium-sized enterprises; or |
| • | lower the bank’s credit limit. |
Disclosure of Management Performance
For the purpose of protecting depositors and investors in commercial banks, the Financial Services Commission requires commercial banks to publicly disclose certain material matters, including:
| • | the financial condition and profit and loss of the bank and its subsidiaries; |
| • | fundraising by the bank and the appropriation of such funds; |
| • | any sanctions levied on the bank under the Bank Act or any corrective measures or sanctions under the Act on the Structural Improvement of the Financial Industry; and |
| • | the occurrence of any of the following events or any other event as prescribed by the applicable regulations, that have damaged or are likely to damage the soundness of the bank’s management, except as may otherwise have been disclosed by a bank or its financial holding company listed on the KRX KOSPI Market in accordance with the Financial Investment Services and Capital Markets Act,: |
| (i) | loans bearing no profit made to a single business group in an amount exceeding 10% of the sum of the bank’s Tier I and Tier II capital (less any capital deductions) as of the end of the previous month (where the loan exposure to that borrower is calculated pursuant to the criteria under the Detailed Regulation on the Supervision of the Banking Business), unless the loan exposure to that group is not more than ₩4 billion; and |
| (ii) | any loss due to court judgments or similar decisions in civil proceedings in an amount exceeding 1% of the sum of the bank’s Tier I and Tier II capital (less any capital deductions) as of the end of the previous month, unless the loss is not more than ₩1 billion. |
Restrictions on Lending
Pursuant to the Bank Act and its sub-regulations, a commercial bank may not provide:
| • | loans secured by a pledge of the bank’s own shares, whether direct or indirect; |
| • | loans to enable a natural or juridical person to buy the shares issued by the bank, whether direct or indirect; |
| • | loans to any of the bank’s officers or employees, other than de minimis loans of up to (i) ₩20 million in the case of a general loan, (ii) ₩50 million in the case of a general loan plus a housing loan or (iii) ₩60 million in the aggregate for general loans, housing loans and loans to pay damages arising from wrongful acts of employees in financial transactions; |
| • | credit (including loans) secured by a pledge of the equity securities of its subsidiary corporation or to enable a natural or juridical person to buy shares of the bank’s subsidiary corporation; or |
| • | loans to any officers or employees of the bank’s subsidiary corporation, other than general loans of up to ₩20 million or general and housing loans of up to ₩50 million in the aggregate. |
92
Table of Contents
Regulations Relating to Retail Household Loans
The Financial Services Commission has implemented a number of changes in recent years to the regulations relating to retail household lending by banks. Under the currently applicable regulations:
| • | as to any new loans secured by housing (including apartments) located nationwide, the loan-to-value ratio (the aggregate principal amount of loans secured by such collateral over the appraised value of the collateral) should not exceed 70%; |
| • | as to any new loans secured by housing (including apartments) located in “excessive investment,” “high speculation” or “adjustment target” areas, in each case as designated by the government, the loan-to-value ratio should not exceed 50%, except that such maximum loan-to-value ratio shall be 70% for low-income households that (i) have a combined annual income of no more than ₩90 million, (ii) do not currently own any housing and (iii) are using the loan to purchase low-price housing valued at no more than ₩900 million (or ₩800 million in the case of adjustment target areas as designated by the Minister of Land, Infrastructure and Transport); |
| • | as to any new loans secured by housing (including apartments) located nationwide to be extended to a household that already owns one or more houses, the maximum loan-to-value ratio must be adjusted to 10% lower than the applicable loan-to-value ratio described above; |
| • | as to any new loans secured by housing (including apartments) located in excessive investment, high speculation or adjustment target areas, in each case as designated by the government, extended to a household that already owns one or more houses, the maximum loan-to-value ratio shall be 30%; |
| • | as to any new loans secured by housing (including apartments) located in excessive investment, high speculation or adjustment target areas, in each case as designated by the government, the borrower’s debt-to-income ratio (calculated as (1) the aggregate annual total payment amount of (x) the principal of and interest on loans secured by such housing and existing mortgage and home equity loans and (y) the interest on other borrowings of the borrower over (2) the borrower’s annual income) should not exceed 40%, except that such maximum debt-to-income ratio is 60% for (i) low-income households that (x) have an annual income of less than ₩90 million, (y) do not currently own any housing, (z) are using the loan to purchase low-price housing valued at ₩900 million or less (₩800 million or less in the case of adjustment target areas) and (ii) first-time homebuyers; and |
| • | as to any new loans extended to a household that already has a total loan amount exceeding ₩100 million (including the loan application amount, or in the case of a revolving loan, based on the revolving amount) or has already obtained a loan secured by high priced housing (including apartments) located in excessive investment, high speculation or adjustment target areas, in each case as designated by the government, where the price exceeds ₩600 million, the borrower’s debt-service-ratio (calculated as (1) the aggregate annual total payment amount of the principal of and interest on financial liabilities, including the loans secured by such high-priced housing, divided by (2) the borrower’s annual income) should not exceed 40% unless otherwise specified by the applicable regulations. |
Restrictions on Investments in Property
A bank may not invest in the following securities in excess of 100% of the sum of the bank’s Tier I and Tier II capital (less any capital deductions):
| �� | • | debt securities (within the meaning of paragraph (3) of Article 4 of the Financial Investment Services and Capital Markets Act) the maturity of which exceeds three years, but excluding government bonds, monetary stabilization bonds issued by the Bank of Korea and bonds within the meaning of item 2, paragraph (6) of Article 11 of the Act on the Structural Improvement of the Financial Industry; |
| • | equity securities, but excluding securities within the meaning of item 1, paragraph (6) of Article 11 of the Act on the Structural Improvement of the Financial Industry; |
93
Table of Contents
| • | derivatives-linked securities (within the meaning of paragraph (7) of Article 4 of the Financial Investment Services and Capital Markets Act) the maturity of which exceeds three years; and |
| • | beneficiary certificates, investment contracts and depositary receipts (within the meaning of paragraph (2) of Article 4 of the Financial Investment Services and Capital Markets Act) the maturity of which exceeds three years. |
A bank may possess real estate property only to the extent necessary to conduct its business. The aggregate value of such property may not exceed 60% of the sum of the bank’s Tier I and Tier II capital (less any capital deductions). Any property that a bank acquires by exercising its rights as a secured party, or which a bank is prohibited from acquiring under the Bank Act, must be disposed of within three years, unless otherwise specified by the regulations thereunder.
Restrictions on Shareholdings in Other Companies
Under the Bank Act, a bank may not own more than 15% of the shares outstanding with voting rights of another corporation, except where, among other reasons:
| • | that corporation engages in a category of financial businesses set forth by the Financial Services Commission; or |
| • | the acquisition of such shares by the bank is necessary for the corporate restructuring of such corporation and is approved by the Financial Services Commission. |
In the above exceptional cases, the total investment in corporations in which the bank owns more than 15% of the outstanding shares with voting rights may not exceed (i) 20% of the sum of Tier I and Tier II capital (less any capital deductions) or (ii) 30% of the sum of Tier I and Tier II capital (less any capital deductions) where the acquisition satisfies the requirements determined by the Financial Services Commission.
The Bank Act provides that a bank using its bank accounts and its trust accounts is not permitted to acquire the equity securities issued by the major shareholder of such bank in excess of an amount equal to 1% of the sum of Tier I and Tier II capital (less any capital deductions).
Restrictions on Bank Ownership
Under the Bank Act, a single shareholder and persons who have a special relationship with that shareholder generally may acquire beneficial ownership of no more than 10% of a nationwide bank’s total issued and outstanding shares with voting rights and no more than 15% of a regional bank’s total issued and outstanding shares with voting rights. The Korean government, the Korea Deposit Insurance Corporation and bank holding companies qualifying under the Financial Holding Company Act are not subject to this limit. Pursuant to the Bank Act, non-financial business group companies may not acquire beneficial ownership of shares of a nationwide bank in excess of 4% (or 15% in the case of a regional bank) of that bank’s outstanding voting shares, unless they satisfy certain requirements set forth by the Enforcement Decree of the Bank Act, obtain the approval of the Financial Services Commission and agree not to exercise voting rights in respect of shares in excess of the 4% limit (or the 15% limit in the case of a regional bank), in which case they may acquire beneficial ownership of up to 10% of a nationwide bank’s outstanding voting shares. The Bank Act grants an exception for non-financial business group companies which, at the time of the enactment of the amended provisions, held more than 4% of the shares of a bank.
In addition, if a foreign investor, as defined in the Foreign Investment Promotion Act, owns in excess of 4% of a nationwide bank’s outstanding voting shares, non-financial business group companies may acquire beneficial ownership of up to 10% (or 15% in the case of a regional bank) of that bank’s outstanding voting shares, and in excess of 10% (or 15% in the case of a regional bank), 25% or 33% of that bank’s outstanding
94
Table of Contents
voting shares with the approval of the Financial Services Commission in each instance, up to the number of shares owned by the foreign investor. Any other person (whether a Korean national or a foreign investor), with the exception of non-financial business group companies described above, may acquire no more than 10% of a nationwide bank’s total voting shares issued and outstanding, unless they obtain approval from the Financial Services Commission in each instance where the total holding will exceed 10% (or 15% in the case of regional banks), 25% or 33% of the bank’s total voting shares issued and outstanding provided that, in addition to the foregoing threshold shareholding ratios, the Financial Services Commission may, at its discretion, designate a separate and additional threshold shareholding ratio.
Deposit Insurance System
The Depositor Protection Act provides insurance for certain deposits of banks in Korea through a deposit insurance system. Under the Depositor Protection Act, all banks governed by the Bank Act are required to pay an insurance premium to the Korea Deposit Insurance Corporation on a quarterly basis and the rate is determined under the Enforcement Decree to the Depositor Protection Act. If the Korea Deposit Insurance Corporation makes a payment on an insured amount, it will acquire the depositors’ claims with respect to that payment amount. The Korea Deposit Insurance Corporation insures a maximum of ₩50 million per individual for deposits and interest in a single financial institution, regardless of when the deposits were made and the size of the deposits.
Restrictions on Foreign Exchange Position
Under the Foreign Exchange Transaction Act of Korea, each of a bank’s net overpurchased and oversold positions may not exceed 50% of its shareholder’s equity as of the end of the prior month.
Laws and Regulations Governing Other Business Activities
A bank must register with the Ministry of Economy and Finance to enter the foreign exchange business, which is governed by the Foreign Exchange Transaction Act of Korea. A bank must obtain the permission of the Financial Services Commission to enter the securities business, which is governed by regulations under the Financial Investment Services and Capital Markets Act. Under these laws, a bank may engage in the foreign exchange business, securities repurchase business, governmental/public bond underwriting business and governmental bond dealing business, among others.
Trust Business
A bank must obtain approval from the Financial Services Commission to engage in trust businesses. The Trust Act and the Financial Investment Services and Capital Markets Act govern the trust activities of banks, and they are subject to various legal and accounting procedures and requirements, including the following:
| • | under the Trust Act, assets accepted in trust by a bank in Korea must be segregated from other assets in the accounts of that bank; and |
| • | depositors and other general creditors cannot obtain or assert claims against the assets comprising the trust accounts in the event the bank is liquidated or wound-up. |
The bank must make a special reserve of 25% or more of fees from each unspecified money trust account for which a bank guarantees the principal amount and a fixed rate of interest until the total reserve for that account equals 5% of the trust amount.
Under the Financial Investment Services and Capital Markets Act, a bank with a trust business license (such as Kookmin Bank) is permitted to offer both specified money trust account products and unspecified money trust account products. However, pursuant to guidelines from regulatory authorities that discourage the sale of unspecified money trust account products, sales of such products have generally been suspended.
95
Table of Contents
Credit Card Business
General
In order to enter the credit card business, a company must obtain a license from the Financial Services Commission. Credit card businesses are governed by the Specialized Credit Financial Business Act, which sets forth specific requirements with respect to the credit card business as well as generally prohibiting unsound business practices relating to the credit card business which may infringe on the rights of credit card holders or negatively affect the soundness of the credit card industry. Credit card companies, including our wholly-owned subsidiary, KB Kookmin Card Co., Ltd., are regulated by the Financial Services Commission and the Financial Supervisory Service.
Disclosure and Reports
Under the Specialized Credit Financial Business Act and the regulations thereunder, a credit card company is required to disclose on a periodic and on-going basis certain material matters and events. In addition, a credit card company must submit periodic reports with respect to its results of operations to the Governor of the Financial Supervisory Service, in accordance with the guidelines of the Financial Supervisory Service.
Restrictions on Funding
Under the Specialized Credit Financial Business Act and the regulations thereunder, a credit card company must ensure that its total assets do not exceed an amount equal to eight times its equity capital and that the ratio of its adjusted equity capital to its adjusted total assets is not less than 8.0%. However, if a credit card company is unable to comply with such limit upon the occurrence of unavoidable events, such as drastic changes in the domestic and global financial markets, such limit may be adjusted through a resolution of the Financial Services Commission.
Risk of Loss Due to Lost, Stolen, Forged or Altered Credit Cards
Under the Specialized Credit Financial Business Act, a credit card company is liable for any loss arising from the unauthorized use of credit cards or debit cards after it has received notice from the holder of the loss or theft of the card. A credit card company is also responsible for any losses resulting from the use of forged or altered credit cards, debit cards and pre-paid cards. A credit card company may, however, transfer all or part of this latter risk of loss to holders of credit card in the event of willful misconduct or gross negligence by holders of credit card if the terms and conditions of the agreement entered between the credit card company and members of such cards specifically provide for that transfer.
For these purposes, disclosure of a customer’s password that is made intentionally or through gross negligence, or the transfer of or giving as collateral of the credit card or debit card, is considered willful misconduct or gross negligence. However, a disclosure of a cardholder’s password that is made under irresistible force or threat to cardholder or his/her relatives’ life or health will not be deemed as willful misconduct or negligence of the cardholder.
Each credit card company must institute appropriate measures to fulfill these obligations, such as establishing provisions, purchasing insurance or joining a cooperative association.
Pursuant to the Enforcement Decree to Specialized Credit Financial Business Act, a credit card company will be liable for any losses arising from loss or theft of a credit card (which was not from the holder’s willful misconduct or negligence) during the period beginning 60 days before the notice by the holder to the credit card company.
Pursuant to the Specialized Credit Financial Business Act, the Financial Services Commission may either restrict the limit or take other necessary measures against the credit card company with respect to such matters as
96
Table of Contents
the maximum limits on the amount per credit card, details of credit card terms and conditions, management of credit card merchants and collection of claims, including the following:
| • | maximum limits for cash advances on credit cards; |
| • | use restrictions on debit cards with respect to per day or per transaction usage; |
| • | aggregate issuance limits and maximum limits on the amount per card on pre-paid cards; and |
| • | other matters prescribed by the Enforcement Decree to the Specialized Credit Financial Business Act. |
Lending Ratio in Ancillary Business
Pursuant to the Enforcement Decree to the Specialized Credit Financial Business Act, a credit card company must maintain an aggregate quarterly average outstanding lending balance to credit cardholders (including cash advances and credit card loans, but excluding restructured loans) no greater than the sum of (i) its aggregate quarterly average outstanding credit card balance arising from the purchase of goods and services and (ii) the aggregate quarterly debit card transaction volume.
Issuance of New Cards and Solicitation of New Cardholders
The Enforcement Decree to the Specialized Credit Financial Business Act establishes the conditions under which a credit card company may issue new cards and solicit new members. New credit cards may be issued only to the following persons:
| • | persons who are at least 19 years old when they apply for a credit card; |
| • | persons whose capability to pay bills as they come due has been verified using standards established by the credit card company; and |
| • | in the case of minors who are 18 years old, persons who submit documents evidencing employment as of the date of the credit card application, such as an employment certificate, or persons for whom the issuance of a credit card is necessitated by governmental policies, such as financial aid. |
In addition, a credit card company may not solicit credit card members by:
| • | providing economic benefits or promising to provide economic benefits in excess of 10% of the annual credit card fee (in the case of credit cards with annual fees that are less than the average of the annual fees charged by major credit cards in Korea, the annual fee will be deemed to be equal to such average annual fee) in connection with issuing a credit card; provided, however, that providing economic benefits or promising to provide economic benefits not exceeding the amount of the annual credit card fee to an applicant that becomes a credit card member through an online platform is permissible; |
| • | soliciting applicants on roads, public places or along corridors used by the general public; |
| • | soliciting applicants through visits, except those visits made upon prior consent and visits to a business area; |
| • | soliciting applicants through the Internet without verifying whether the applicant is who he or she purports to be, by means of a digital signature (limited, however, to cases where it can be confirmed that the applicant is the person in question by using identifiable information) under the Digital Signature Act; and |
| • | soliciting applicants through pyramid sales methods. |
Compliance Rules on Collection of Receivable Claims
Pursuant to Supervisory Regulation on the Specialized Credit Financial Business, a credit card company may not:
| • | exert violence or threaten violence; |
97
Table of Contents
| • | inform a related party (a guarantor of the debtor, blood relative or fiancé(e) of the debtor, a person living in the same household as the debtor or a person working in the same workplace as the debtor) of the debtor’s obligations without just cause; |
| • | provide false information relating to the debtor’s obligation to the debtor or his or her related parties; |
| • | threaten to sue or sue the debtor for fraud despite lack of affirmative evidence to establish that the debtor has submitted forged or false documentation with respect to his or her ability to make payment; |
| • | visit or telephone the debtor during late evening hours (between the hours of 9:00 p.m. and 8:00 a.m.); and |
| • | utilize other uncustomary methods to collect the receivables that interfere with the privacy or the peace in the workplace of the debtor or his or her related parties. |
Principal Regulations Applicable to Insurance Companies
General
Under the Insurance Business Act, a company seeking to engage in the insurance business in Korea is required to obtain business authorizations and licenses from the Financial Services Commission, and such company is required to comply with the Insurance Business Act and the regulations thereunder. These rules and regulations cover, among other things: (i) the requirements for obtaining business authorizations and licenses to operate an insurance company; (ii) the scope of business an insurance company may undertake; (iii) the operations of an insurance company, including its asset management activities; (iv) the methods of insurance solicitation; (v) the supervision of the insurance business; and (vi) the disciplinary actions for violation of the Insurance Business Act, which may include revocation of a license, imprisonment, suspension of operations, fines, surcharges and penalties.
The Financial Services Commission has the authority to oversee matters involving licenses necessary for, and supervision of, the operation of an insurance business. Pursuant to the Regulation on Supervision of Insurance Business and the Regulation on Corporate Governance of Financial Companies, the Financial Services Commission sets forth detailed criteria for obtaining the authorization necessary to engage in the insurance business, as well as various comprehensive standards required to be met by an insurance company. The Financial Services Commission entrusts the Financial Supervisory Service with certain matters pursuant to the Regulation on Supervision of Insurance Business, as specified under the Detailed Enforcement Regulations on Insurance Supervision.
Since an insurance company falls within the scope of a financial institution under the Act on the Structural Improvement of the Financial Industry, special provisions thereunder apply to an insurance company in the event (i) it merges with, or converts into, another financial institution, (ii) it becomes bankrupt or insolvent or is dissolved or (iii) members of its business group acquire shares of another company in excess of a certain percentage. In addition, an insurance company that offers and sells investment-type insurance products, such as variable insurance products, and manages assets under special accounts for variable insurance policies is deemed a financial investment company under the Financial Investment Services and Capital Markets Act. Such insurance company is subject to certain provisions under the Financial Investment Services and Capital Markets Act, such as regulations on the control of conflicts of interest as well as the establishment and maintenance of firewalls for asset management of special accounts related to variable insurance policies. In addition, pursuant to the Foreign Exchange Transactions Act, an insurance company is required to obtain prior approval from the Ministry of Economy and Finance, the Bank of Korea, the Financial Supervisory Service or a foreign exchange bank and may be required to file periodic reports if the company engages in any of the following: (a) a transaction involving a foreign currency; (b) a transaction with a non-resident involving either the Won or a foreign currency; (c) a transaction that requires an outgoing overseas payment; (d) a transaction that requires receipt of an overseas payment; and (e) any other transaction prescribed under the Foreign Exchange Transactions Act. Furthermore, an insurance company is required to comply with the Act on the Corporate Governance of Financial Companies.
98
Table of Contents
Scope of Business of Insurance Companies
Under the Insurance Business Act, an insurance company is prohibited from concurrently operating a life insurance business and a non-life insurance business (including property, marine and cargo and liability insurance), provided that an insurance company may concurrently operate a “type three” insurance business (including casualty, disease and health care insurance) and provide reinsurance to other insurance companies. However, limited cross-selling of life insurance and non-life insurance products by insurance sales agents working for life insurance or non-life insurance companies in Korea is permitted by the Financial Services Commission.
Upon approval by the Financial Services Commission, a life insurance company may operate (i) a life insurance business, (ii) a pension insurance (including retirement insurance) business and (iii) type three insurance businesses, while a non-life insurance company may operate (i) various types of non-life insurance businesses (including property, marine and cargo, automobile, guarantee, reinsurance and certain other enumerated non-life insurance as designated under the Enforcement Decree of the Insurance Business Act as well as liability insurance) and (ii) type three insurance businesses.
Both life insurance and non-life insurance companies may also operate certain financial businesses and incidental businesses designated under the Enforcement Decree of the Insurance Business Act.
Requirements Relating to Insurance Solicitation
The Insurance Business Act limits entities that may engage in insurance solicitation to insurance sales agents, insurance agencies (including those of financial institutions), insurance brokers and officers and employees of an insurance company. Any person or entity wishing to act as an insurance sales agent, insurance agency (including those of financial institutions) or insurance broker must register with the Financial Services Commission and report promptly to the Financial Services Commission the occurrence of certain changes prescribed under the Insurance Business Act.
Insurance brochures used for insurance solicitation must clearly specify the terms required under the Insurance Business Act in an easy-to-understand manner. Where an insurance company or any person engaging in insurance solicitation persuades an ordinary policyholder to enter into an insurance contract, it must explain to such ordinary policyholder about certain critical matters of the insurance contract prescribed by the Financial Consumer Protection Act, including details of insurance products, insurance premiums (including mutual aid premiums), procedures for payment of insurance proceeds (including mutual aid) and grounds for restricting the payment and coverage scope in a manner the policyholder can easily understand.
Where an insurance company or any person engaging in insurance solicitation advertises an insurance product, it must include the details of such insurance product in such advertisement as prescribed under the Financial Consumer Protection Act and must not engage in any act which, among other things, may lead to a misunderstanding that such insurance product would provide a large amount of insurance proceeds by emphasizing selective terms and conditions of such product or introducing cases where a large amount of insurance proceeds were paid.
In connection with the execution or solicitation of an insurance contract, any person engaging in insurance solicitation must not engage in any act prohibited under the Insurance Business Act and the Financial Consumer Protection Act, including acts of providing a policyholder with false information regarding an insurance product and acts intended to interrupt or prevent a policyholder (including interested parties prescribed by the Enforcement Decree of the Financial Consumer Protection Act) from notifying an insurance company of an important matter relevant to an insurance policy.
Any person engaging in insurance solicitation is prohibited from providing special benefits (including, but not limited to, cash over a certain amount and discounts on insurance premiums) in connection with the
99
Table of Contents
execution of an insurance contract unless such special benefits are stipulated in the underlying documents for such insurance product. In addition, an insurance company is prohibited from entrusting any person other than those who are eligible under the Insurance Business Act to engage in insurance solicitation or paying any compensation to any ineligible persons for his or her insurance solicitation. The Insurance Business Act and the Financial Consumer Protection Act also prescribe in detail certain practices that insurance agencies of financial institutions are restricted from engaging in, including, but not limited to:
| • | forcing entry into contracts on financial products against the will of the policyholder using a position of advantage; and |
| • | including insurance premiums in loan transactions without the prior consent of the borrower. |
The Insurance Business Act permits insurance sales agents working for life insurance companies to cross-sell non-life insurance products of one non-life insurance company, and insurance sales agents working for non-life insurance companies are correspondingly permitted to cross-sell the life insurance products of one life insurance company.
Capital Adequacy
Pursuant to the risk-based capital adequacy requirements implemented by the Financial Services Commission, insurance companies in Korea are required to maintain a statutory ratio of available regulatory capital to risk-weighted assets of not less than 100% on a consolidated basis (although a risk-based capital adequacy ratio of not less than 150% is still considered standard in the Korean insurance industry). Risk based capital adequacy requirements require insurance companies to hold adequate capital to cover their exposures to interest rate risk, market risk, credit risk and operational risk as well as insurance risk by reflecting such risks in their calculation of risk-weighted assets. The statutory risk-based capital adequacy ratio for insurance companies is computed by dividing available capital by required capital. Available capital of an insurance company is computed as the sum of, among other things, capital stock, reserve for policyholder dividends and bad debt allowance after deducting, among other things, deferred acquisition costs, goodwill, and prepaid expenses. Required capital is computed based on the sum of (i) the square root of the sum of the squares of (w) insurance risk amounts, (x) interest rate risk amounts, (y) credit risk amounts and (z) market risk amounts, and (ii) the operating risk amounts, with each risk amount being calculated in accordance with the detailed criteria set forth under the Regulation on Supervision of Insurance Business and the Detailed Enforcement Regulations on Insurance Supervision.
On January 1, 2023, the Financial Supervisory Service introduced K-ICS, a new regulatory solvency regime for insurance companies based on the International Capital Standard developed by the International Association of Insurance Supervisors, which is similar in substance to the Solvency II Directive of the European Union. The Solvency II Directive, which has been in effect in the European Union since January 1, 2016, is a comprehensive program of regulatory requirements for insurance companies, covering authorization, corporate governance, supervisory reporting, public disclosure and risk assessment and management, as well as solvency. Under K-ICS, insurance contract liabilities are expected to be measured based on market value, rather than book value, at the time of the computation of available capital. K-ICS has also introduced new risk subcategories, including those related to termination, business expenses, longevity, catastrophes and asset concentration, to be considered at the time of the computation of required capital. It is expected that these changes, among others, would require a number of insurance companies in Korea with a large portfolio of high guaranteed rate of return products to obtain additional capital to meet their capital adequacy requirements. However, the Financial Supervisory Service has allowed for a gradual deduction from available capital and a gradual recognition of risks in relation to required capital, for up to ten years. In order to ease the burden on insurance companies, corrective measures will be withheld for up to five years even if the solvency ratio under K-ICS is less than 100%, if the risk-based capital adequacy ratio exceeds 100%.
100
Table of Contents
Regulations on Class Actions Regarding Securities
The Law on Class Actions Regarding Securities was enacted as of January 20, 2004 and last amended on May 28, 2013. The Law on Class Actions Regarding Securities governs class actions suits instituted by one or more representative plaintiff(s) on behalf of 50 or more persons who claim to have been damaged in a capital markets transaction involving securities issued by a listed company in Korea.
Applicable causes of action with respect to such suits include:
| • | claims for damages caused by misleading information contained in a securities statement; |
| • | claims for damages caused by the filing of a misleading business report, semi-annual report, or quarterly report; |
| • | claims for damages caused by insider trading or market manipulation; and |
| • | claims instituted against auditors for damages caused by accounting irregularities. |
Any such class action may be instituted upon approval from the presiding court and the outcome of such class action will have a binding effect on all potential plaintiffs who have not joined the action, with the exception of those who have filed an opt out notice with such court.
Financial Investment Services and Capital Markets Act
The Financial Investment Services and Capital Markets Act, which became effective in February 2009, regulates and governs the financial investment business in Korea. The entities that regulate and supervise financial investment companies are the Financial Services Commission, the Financial Supervisory Service and the Securities and Futures Commission.
Under the Financial Investment Services and Capital Markets Act, a company must obtain a license from the Financial Services Commission to commence a financial investment business such as a brokerage business, a dealing business or an underwriting business, or register with the Financial Services Commission to commence a financial investment business such as an investment advisory business or a discretionary investment management business. A bank is permitted to engage in certain types of financial investment business as specified under the Enforcement Decree of the Bank Act. Prior to commencing a financial investment business, a bank must file a report with the Financial Services Commission and apply for a license pursuant to the Financial Investment Services and Capital Markets Act.
Consolidation of Capital Markets-Related Laws
Prior to the effectiveness of the Financial Investment Services and Capital Markets Act, there were separate laws regulating various types of financial institutions depending on the type of financial institution (for example, securities companies, futures companies, trust business companies and asset management companies) and subjecting financial institutions to different licensing and ongoing regulatory requirements (for example, the Korean Securities Exchange Act, the Futures Business Act and the Indirect Investment Asset Management Business Act). By applying one uniform set of rules to the same financial business having the same economic function, the Financial Investment Services and Capital Markets Act attempts to improve and address issues caused by the previous regulatory system under which the same economic function relating to capital markets-related businesses are governed by multiple regulations. To this end, the Financial Investment Services and Capital Markets Act categorizes capital markets-related businesses into six different functions, as follows:
| • | dealing, trading and underwriting of “financial investment products” (as defined below); |
| • | brokerage of financial investment products; |
| • | establishment of collective investment schemes and the management thereof; |
101
Table of Contents
| • | investment advice; |
| • | discretionary investment management; and |
| • | trusts (together with the five businesses set forth above, the “Financial Investment Businesses”). |
Accordingly, all financial businesses relating to financial investment products have been reclassified as one or more of the Financial Investment Businesses described above, and financial institutions are subject to the regulations applicable to their relevant Financial Investment Businesses, regardless of the type of the financial institution. For example, under the Financial Investment Services and Capital Markets Act, derivative businesses conducted by former securities companies and future companies will be subject to the same regulations.
Banking and insurance businesses are not subject to the Financial Investment Services and Capital Markets Act and will continue to be regulated under separate laws. However, they may become subject to the Financial Investment Services and Capital Markets Act if their activities involve any financial investment businesses requiring a license pursuant to the Financial Investment Services and Capital Markets Act.
Comprehensive Definition of Financial Investment Products
In an effort to encompass the various types of securities and derivative products available in the capital markets, the Financial Investment Services and Capital Markets Act sets forth a comprehensive term “financial investment products,” defined to mean all financial products with a risk of loss in the invested amount (in contrast to “deposits,” which are financial products for which the invested amount is protected or preserved). Financial investment products are classified into two major categories: (i) “securities” (financial investment products in which the risk of loss is limited to the invested amount) and (ii) “derivatives” (financial investment products in which the risk of loss may exceed the invested amount). As a result of the general and broad definition of financial investment products, a variety of financial products may be defined as a financial investment product, which would enable Financial Investment Companies (defined below) to handle a broader range of financial products. Under the Financial Investment Services and Capital Markets Act, entities formerly licensed as securities companies, asset management companies, futures companies and other entities engaging in any Financial Investment Business are classified as “Financial Investment Companies.”
New License System and the Conversion of Existing Licenses
Under the Financial Investment Services and Capital Markets Act, Financial Investment Companies are able to choose the type of Financial Investment Business in which to engage (through a “check the box” method set forth in the relevant license application), by specifying the desired (i) Financial Investment Business, (ii) financial investment product and (iii) target customers to which financial investment products may be sold or distributed (that is, general investors or professional investors). Licenses will be issued under the specific business sub-categories described in the foregoing sentence. For example, it would be possible for a Financial Investment Company to obtain a license to engage in the Financial Investment Business of (i) dealing (ii) over the counter derivatives products (iii) only with sophisticated investors.
Financial institutions that engage in business activities constituting a Financial Investment Business are required to take certain steps, such as renewal of their license or registration, in order to continue engaging in such business activities. Financial institutions that are not licensed Financial Investment Companies are not permitted to engage in any Financial Investment Business.
Expanded Business Scope of Financial Investment Companies
Under the previous regulatory regime in Korea, it was difficult for a financial institution to explore a new line of business or expand upon its existing line of business. For example, previously a financial institution licensed as a securities company generally was not permitted to engage in the asset management business. In
102
Table of Contents
contrast, under the Financial Investment Services and Capital Markets Act, pursuant to the integration of its current businesses involving financial investment products into a single Financial Investment Business, a licensed Financial Investment Company is permitted to engage in all types of Financial Investment Businesses, subject to satisfying relevant regulations (for example, maintaining an adequate “Chinese Wall,” to the extent required). As to incidental businesses (that is, a financial related business which is not a Financial Investment Business), the Financial Investment Services and Capital Markets Act generally allows a Financial Investment Company to freely engage in such incidental businesses by shifting away from the previous positive-list system towards a more comprehensive system. In addition, a Financial Investment Company is permitted to (i) outsource marketing activities by contracting “introducing brokers” that are individuals but not employees of the Financial Investment Company, (ii) engage in foreign exchange businesses related to their Financial Investment Business and (iii) participate in the settlement network, pursuant to an agreement among the settlement network participants.
Improvement in Investor Protection Mechanism
While the Financial Investment Services and Capital Markets Act widens the scope of financial businesses in which financial institutions are permitted to engage, a more rigorous investor-protection mechanism is also imposed upon Financial Investment Companies dealing in financial investment products. The Financial Investment Services and Capital Markets Act distinguishes general investors from sophisticated investors and provides new or enhanced protections to general investors. For instance, the Financial Investment Services and Capital Markets Act expressly provides for a strict know-your-customer rule for general investors and imposes an obligation that Financial Investment Companies should market financial investment products suitable to each general investor, using written explanatory materials. Under the Financial Investment Services and Capital Markets Act, a Financial Investment Company could be liable if a general investor proves (i) damage or losses relating to such general investor’s investment in financial investment products solicited by such Financial Investment Company and (ii) the absence of the requisite written explanatory materials, without having to prove fault or causation. With respect to conflicts of interest between Financial Investment Companies and investors, the Financial Investment Services and Capital Markets Act expressly requires (i) disclosure of any conflict of interest to investors and (ii) mitigation of conflicts of interest to a comfortable level or abstention from the relevant transaction.
Other Changes to Securities / Fund Regulations
The Financial Investment Services and Capital Markets Act changed various securities regulations including those relating to public disclosure, insider trading and proxy contests, which were previously governed by the Korean Securities Exchange Act. For example, the 5% and 10% reporting obligations under the Korean Securities Exchange Act have become more stringent. The Indirect Investment and Asset Management Business Act strictly limited the kind of vehicles that could be utilized under a collective investment scheme, restricting the range of potential vehicles to trusts and corporations, and the type of funds that can be used for investments. However, under the Financial Investment Services and Capital Markets Act, these restrictions have been significantly liberalized, permitting all vehicles that may be created under Korean law, such as limited liability companies or partnerships, to be used for the purpose of collective investments and allowing investment funds to be more flexible as to their investments.
Act on the Corporate Governance of Financial Companies
The Act on the Corporate Governance of Financial Companies, which became effective on August 1, 2016, was enacted to address the need for strengthened regulations on corporate governance of financial institutions and to serve as a uniform set of regulations on corporate governance matters applicable to financial institutions across a variety of industry sectors. It contains several key measures, including (i) eligibility requirements for officers of financial institutions and standards for determining whether officers of financial institutions may hold concurrent positions in other companies, (ii) standards for composition and operation of the board of directors of
103
Table of Contents
financial institutions, (iii) standards for establishment, composition and operation of various committees of the board of directors of financial institutions, (iv) regulations on internal control and risk management, (v) requirements and procedures for the approval of a change of major shareholders and (vi) special regulations to protect the rights of minority shareholders of financial institutions.
Financial Consumer Protection Act
The Financial Consumer Protection Act became effective on March 25, 2021, and certain provisions relating to internal control under such Act have become effective on September 25, 2021. The Financial Consumer Protection Act aims to enhance measures to protect financial consumers and to establish a sound market order in the financial product sales and advisory businesses. The Financial Consumer Protection Act consolidates existing regulations relating to the sale of financial products and consumer protection stipulated in other laws governing the financial sector, such as the Financial Investment Services and Capital Markets Act, the Banking Act and the Insurance Business Act, and applies to the financial industry on a cross-sectoral basis.
Application of the Financial Consumer Protection Act
All financial products that are classified as (i) deposits, (ii) loans, (iii) investment products or (iv) insurance products are subject to the Financial Consumer Protection Act. These four types of products encompass most of the products covered by the Bank Act, the Financial Investment Services and Capital Markets Act and the Insurance Business Act. Financial products offered by credit unions, peer-to-peer (P2P) lending firms and registered credit service providers are also regulated by the Financial Consumer Protection Act.
Six Principles Regulating Selling Activities
The Financial Consumer Protection Act consolidates previously scattered regulations regarding financial business operations into six uniform standards that cover the following: (i) suitability, (ii) appropriateness, (iii) duty to explain, (iv) unfair sales practices, (v) improper solicitation and (vi) advertisements. Among these six principles, suitability, appropriateness and duty to explain apply only to “general financial consumers,” although “professional financial consumers” may elect to be treated as “general financial consumers,” in which case all six principles would apply to them.
Internal Control Requirements for Consumer Protection
The Financial Consumer Protection Act requires sellers of financial products to have adequate internal control standards to protect consumers. The Enforcement Decree to the Financial Consumer Protection Act sets forth details of certain of the internal control standards as follows:
| • | Establishment of the authority and responsibilities of the decision maker, such as the representative director or a director, in the implementation of internal control measures; |
| • | Development of an organizational structure and designation of personnel responsible for consumer protection matters, including the establishment of a financial consumer protection committee; |
| • | Implementation of (i) inter-departmental consultation procedures for the development and sale of financial products, (ii) processes for internal deliberations and the incorporation of opinions from independent third party advisors, (iii) standards for vetting advertisements, (iv) mandatory training requirements for officers and employees and implementation of qualification requirements, (v) standards for the prevention of conflicts of interest, (vi) proper management of confidential information, and (vii) disclosure obligations when potential harm to consumers arises; and |
| • | Establishment of standards for performance-based compensation of officers and employees in charge of sales of financial products. |
104
Table of Contents
Right to Withdraw Subscriptions and Right to Terminate Contracts
Under the Financial Consumer Protection Act, consumers have the right to withdraw subscriptions, allowing them to receive a refund during a statutory cooling-off period following the execution of the relevant subscription agreement. This right generally applies to all types of financial products with the exception of deposits, although in the case of investment products, the right to withdraw applies only to highly complex funds and trusts. Consumers also have the right to terminate a contract if the sellers violate the Financial Consumer Protection Act in relation to the sales process. The right to terminate contracts applies to long-term contracts but such right must be exercised within one year from the time that the customer becomes aware that the financial product was sold in violation of the regulatory requirements.
Punitive Penalty Surcharges
In case of a violation of the principles regarding the duty to explain, unfair sales practices, improper solicitation and advertisements, sellers are subject to a punitive penalty of up to half the “amount that is the purpose of the contract” (which would be the deposit amount in case of deposit products, loan amount in case of loan products, investment amount in case of investment products, and insurance premium in case of insurance products), depending on the severity of the violation of the Financial Consumer Protection Act.
Environment, Social Responsibility and Corporate Governance
As part of our mission to become a “financial service delivering changes,” we are committed to a management philosophy focused on issues relating to the environment, social responsibility and corporate governance (“ESG”). Our ESG strategy is to focus on internalizing ESG values across all of our business operations by developing a climate change risk management system, an inclusive society and a transparent corporate governance structure.
We have also developed the “KB Green Wave 2030” program to fulfill our responsibility as a leading financial group and to become a more trusted company to our stakeholders. Under this program, we plan to increase the total value of our ESG-related products, investments and loans to ₩50 trillion by 2030. In addition, we have established a group-wide carbon neutrality program called “KB Net Zero S.T.A.R.” to effectively respond to the problems posed by climate change. Pursuant to the program, we intend to reduce the level of our own carbon emissions by 42% by 2030 to achieve carbon neutrality by 2040 and to reduce the level of carbon emissions of our asset portfolio companies by 33% by 2030 to achieve carbon neutrality by 2050. Moreover, we have established the “KB Diversity 2027” program, which is our mid- to long-term plan aimed at achieving our diversity goals and cultivating a more inclusive culture. The program includes specific goals to promote diversity, such as increasing the hiring levels of people from diverse backgrounds, including people with disabilities, veterans, people from multicultural families and basic livelihood security recipients, to 15%, as well as increasing the ratio of female leaders to 20% and female core professionals to 30%, by 2027.
Since 2011, we have published a group-wide sustainability report on our website on an annual basis.
105
Table of Contents
| Item 4.C. | Organizational Structure |
The following chart provides an overview of our structure, including our significant subsidiaries and our ownership of such subsidiaries as of March 31, 2023:
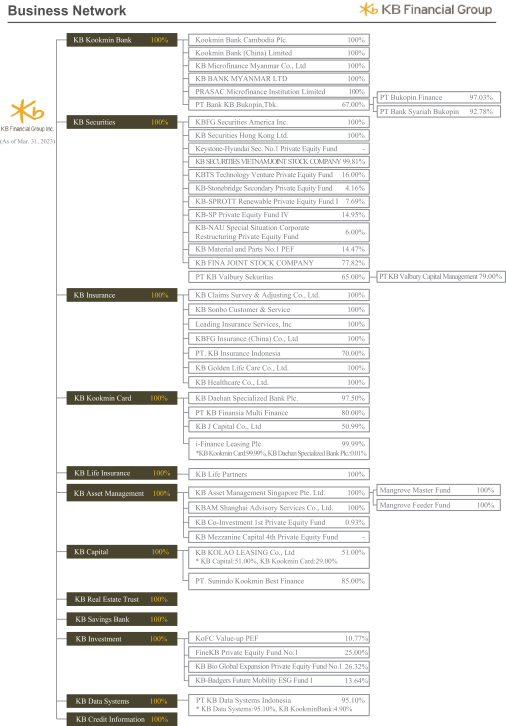
106
Table of Contents
Our largest subsidiary is Kookmin Bank, the assets of which represented approximately 73.8% of our total assets as of December 31, 2022. The following table provides summary information for our operating subsidiaries that are consolidated in our consolidated financial statements as of and for the year ended December 31, 2022, including their consolidated total assets, operating revenue, profit (loss) and total equity:
Subsidiaries | Total Assets | Operating Revenue | Profit (Loss) | Total Equity | ||||||||||||
| (in millions of Won) | ||||||||||||||||
Kookmin Bank | ₩ | 517,769,512 | ₩ | 49,436,046 | ₩ | 2,996,015 | ₩ | 33,723,259 | ||||||||
KB Securities Co., Ltd. | 53,824,246 | 14,264,399 | 187,784 | 5,877,313 | ||||||||||||
KB Insurance Co., Ltd. | 42,736,747 | 14,959,264 | 557,680 | 3,339,580 | ||||||||||||
KB Kookmin Card Co., Ltd. | 29,721,017 | 3,694,352 | 378,592 | 4,722,802 | ||||||||||||
KB Life Insurance Co., Ltd. (prior to the merger). | 10,136,909 | 2,907,001 | (64,045 | ) | 86,617 | |||||||||||
Prudential Life Insurance Company of Korea, Ltd. (prior to the merger) | 24,710,078 | 2,255,418 | 250,308 | 1,662,477 | ||||||||||||
KB Asset Management Co., Ltd. | 369,488 | 233,293 | 59,345 | 266,518 | ||||||||||||
KB Capital Co., Ltd. | 16,053,026 | 1,906,694 | 217,139 | 2,106,226 | ||||||||||||
KB Savings Bank Co., Ltd. | 3,138,543 | 191,337 | 21,814 | 283,994 | ||||||||||||
KB Real Estate Trust Co., Ltd. | 518,980 | 152,686 | 67,723 | 405,536 | ||||||||||||
KB Investment Co., Ltd. | 1,378,550 | 161,210 | 4,807 | 270,286 | ||||||||||||
KB Credit Information Co., Ltd. | 42,219 | 36,469 | 484 | 17,296 | ||||||||||||
KB Data Systems Co., Ltd. | 63,645 | 233,320 | 3,162 | 23,075 | ||||||||||||
Further information regarding our subsidiaries is provided below:
| • | Kookmin Bank was established in Korea in 2001 as a result of the merger of the former Kookmin Bank (established in 1963) and H&CB (established in 1967). Kookmin Bank provides a wide range of banking and other financial services to individuals, small- and medium-sized enterprises and large corporations in Korea. As of December 31, 2022, Kookmin Bank was one of the largest commercial banks in Korea based upon total assets (including loans) and deposits. As of December 31, 2022, Kookmin Bank had approximately 32.9 million customers, with 856 branches nationwide. |
| • | KB Securities Co., Ltd., formerly known as Hyundai Securities Co., Ltd., was established in Korea in 1962 to provide various securities brokerage and investment banking services. In 2016, we acquired 100% of the outstanding shares of Hyundai Securities, merged another subsidiary, KB Investment & Securities Co., Ltd., with and into Hyundai Securities and changed the name of the surviving entity to KB Securities Co., Ltd. |
| • | KB Insurance Co., Ltd., formerly known as LIG Insurance Co., Ltd., was established in Korea in January 1959 to provide non-life insurance products. KB Insurance became our wholly-owned subsidiary in July 2017 after a series of stock purchases, a tender offer and a comprehensive stock swap. |
| • | KB Kookmin Card Co., Ltd. was established in March 2011 as a separate entity upon the completion of a horizontal spin-off of Kookmin Bank’s credit card business, to provide credit card services. |
| • | KB Life Insurance Co., Ltd. (prior to the merger) was established in Korea in April 2004 to provide life insurance and wealth management products primarily through our branch network. It merged with and into Prudential Life Insurance in January 2023 to form KB Life Insurance Co., Ltd. |
| • | Prudential Life Insurance Company of Korea, Ltd. (prior to the merger), formerly a subsidiary of Prudential Financial, Inc., a U.S.-based provider of insurance, investment management and other financial products and services, was established in Korea in 1989. In August 2020, we acquired all of the outstanding shares of Prudential Life Insurance from Prudential Financial, Inc. for ₩2.3 trillion, as a result of which Prudential Life Insurance became a wholly-owned subsidiary. In January 2023, the Former KB Life Insurance merged with and into Prudential Life Insurance to form KB Life Insurance Co., Ltd. |
107
Table of Contents
| • | KB Asset Management Co., Ltd. was established in Korea in April 1988 as a subsidiary of Citizens Investment Trust Company to provide investment advisory services. |
| • | KB Capital Co., Ltd., which provides leasing services and installment finance services, was formerly known as Woori Financial Co., Ltd. and was acquired by us in March 2014. KB Capital became our wholly-owned subsidiary in July 2017 after a tender offer followed by a comprehensive stock swap. |
| • | KB Savings Bank Co., Ltd. was established in Korea in January 2012 to provide small-loan finance services. KB Savings Bank was established in connection with our purchase of assets and assumption of liabilities of Jeil Savings Bank in January 2012. We acquired Yehansoul Savings Bank, which provided small-loan finance services, in September 2013 and merged it with KB Savings Bank in January 2014, with KB Savings Bank as the surviving entity. |
| • | KB Real Estate Trust Co., Ltd. was established in Korea in December 1996 to provide real estate development and brokerage services by managing trusts related to the real estate industry. |
| • | KB Investment Co., Ltd. was established in Korea in March 1990 to invest in and finance small- and medium-sized enterprises. |
| • | KB Credit Information Co., Ltd. was established in Korea in October 1999 to collect delinquent loans and to check credit history. |
| • | KB Data Systems Co., Ltd. was established in Korea in September 1991 to provide software services to us and other financial institutions. |
| Item 4.D. | Property, Plants and Equipment |
Our registered office and corporate headquarters are located at 26, Gukjegeumyung-ro 8-gil, Yeongdeungpo-gu, Seoul 07331, Korea. The following table presents information regarding certain of our properties in Korea:
Type of facility/building | Location | Area (square meters) | ||||
Registered office and corporate headquarters and Kookmin Bank headquarters #1 | 26, Gukjegeumyung-ro 8-gil Yeongdeungpo-gu, Seoul 07331 | 5,354 | ||||
Kookmin Bank headquarters #2 | 141, Uisadang-daero, Yeongdeungpo-gu, Seoul 07332 | 4,727 | ||||
KB Kookmin Card headquarters building | Jongno-gu, Seoul | 3,923 | ||||
Kookmin Bank training institute | Ilsan | 207,560 | ||||
Kookmin Bank training institute | Daecheon | 4,158 | ||||
Kookmin Bank training institute | Sokcho | 15,559 | ||||
Kookmin Bank training institute | Cheonan | 196,649 | ||||
Kookmin Bank IT center | Gangseo-gu, Seoul | 13,116 | ||||
Kookmin Bank IT center | Yeouido, Seoul | 5,928 | ||||
Kookmin Bank IT center | Yeouido, Seoul | 2,006 | ||||
Kookmin Bank IT center | Gimpo | 13,144 | ||||
Kookmin Bank support center | Seongbuk-gu, Seoul | 9,939 | ||||
KB Securities training institute | Kiheung-gu, Yongin | 64,600 | ||||
In August 2020, we completed the construction of a second headquarters building for Kookmin Bank in Yeouido, Seoul. Our total capital expenditure for its construction amounted to approximately ₩356.5 billion.
As of December 31, 2022, we had a countrywide network of 856 banking branches and sub-branches, as well as ten branches and sub-branches and seven representative offices for our other operations including our credit card, securities brokerage, insurance and consumer finance businesses. Approximately one-fifth of these
108
Table of Contents
facilities are housed in buildings owned by us, while the remaining branches are leased properties. See “Item 4.B. Business Overview—Capital Markets Activities and International Banking/Finance—International Banking/Finance” for a list of our overseas subsidiaries, branches and representative and liaison offices in operation as of December 31, 2022. Kookmin Bank, Gurgaon Representative Office in India converted to Kookmin Bank, Gurugram Branch in February 2019 and Kookmin Bank, Hanoi Representative Office was liquidated in September 2020. In December 2020, we established KB Bank Myanmar Ltd., a subsidiary, in Myanmar, and in January 2022, we established Kookmin Bank, Singapore Branch in Singapore. Kookmin Bank, Yangon Representative Office was liquidated in February 2023. Lease terms are generally from two to three years and seldom exceed five years. We do not own any material properties outside of Korea.
The net carrying amount of all the properties owned by us at December 31, 2022 was ₩3,998 billion.
| Item 4A. | UNRESOLVED STAFF COMMENTS |
We do not have any unresolved comments from the U.S. Securities and Exchange Commission staff regarding our periodic reports under the Securities Exchange Act of 1934, as amended, or the Exchange Act.
| Item 5. | OPERATING AND FINANCIAL REVIEW AND PROSPECTS |
| Item 5.A. | Operating Results |
Overview
The following discussion is based on our consolidated financial statements, which have been prepared in accordance with IFRS as issued by the IASB. The consolidated financial statements include the accounts of subsidiaries over which substantive control is exercised through majority ownership of voting stock and/or other means. Investments in jointly controlled entities and associates (which are companies over which we have the ability to exercise significant influence) are accounted for by the equity method of accounting.
Trends in the Korean Economy
Our financial position and results of operations have been and will continue to be significantly affected by financial and economic conditions in Korea. In recent years, commercial banks, consumer finance companies and other financial institutions in Korea have made significant investments and engaged in aggressive marketing in retail lending (including mortgage and home equity loans), leading to substantially increased competition in this segment. From the second half of 2016 to 2021, the Korean government introduced various measures to tighten regulations on mortgage and other lending and housing subscription in response to the rapid growth in consumer debt and concerns over speculative investments in real estate in certain areas. Although the Korean government has begun to reverse some of these measures by introducing a number of policy measures that seek to sustain housing prices and activity levels in the Korean real estate market over the course of 2022, the impact of such policy measures is not yet clear. A decrease in housing prices, together with the high level of consumer debt and deteriorating domestic and global economic conditions, could result in declines in consumer spending and reduced economic growth, which may lead to increases in delinquency levels of our portfolio of retail loans. Our portfolio of retail loans decreased from ₩191,641 billion as of December 31, 2021 to ₩186,939 billion as of December 31, 2022. In 2022, we recorded charge-offs of ₩336 billion and provision for credit losses of ₩551 billion in respect of our retail loan portfolio, compared to charge-offs of ₩411 billion and provision for credit losses of ₩461 billion in 2021 and charge-offs of ₩461 billion and provision for credit losses of ₩421 billion in 2020. See “Item 3.D. Risk Factors—Risks relating to our retail credit portfolio.”
Our loans to small- and medium-sized enterprises increased from ₩138,627 billion as of December 31, 2021 to ₩149,068 billion as of December 31, 2022. Substantial growth in lending in Korea to small- and medium-sized enterprises in recent years, and financial difficulties experienced by such enterprises as a result of, among other things, adverse changes in economic conditions in Korea and globally (such as the COVID-19
109
Table of Contents
pandemic), may lead to increasing delinquencies and a deterioration in overall asset quality in the credit exposures of Korean banks to small- and medium-sized enterprises. In 2022, we recorded charge-offs of ₩7 billion in respect of our loans to small- and medium-sized enterprises, compared to charge-offs of ₩8 billion in 2021 and ₩14 billion in 2020. See “Item 3.D. Risk Factors—Risks relating to our small- and medium-sized enterprise loan portfolio—We have significant exposure to small- and medium-sized enterprises, and any financial difficulties experienced by these customers may result in a deterioration of our asset quality and have an adverse impact on us.”
The Korean economy is closely tied to, and is affected by developments in, the global economy. The overall prospects for the Korean and global economy in 2023 and beyond remain uncertain. In recent years, the global financial markets have experienced significant volatility as a result of, among other things:
| • | the occurrence of severe health pandemics, such as the global outbreak of the COVID-19 pandemic; |
| • | hostilities, political or social tensions involving Russia (including the invasion of Ukraine by Russia and ensuing actions that the United States and other countries have taken or may take in the future) and the resulting adverse effects on the global supply of oil and other natural resources and the global financial markets; |
| • | interest rate fluctuations as well as perceived or actual changes in policy rates by, or other monetary and fiscal policies set forth by, the U.S. Federal Reserve and other central banks; |
| • | a rise in inflation rates and volatility in stock markets and exchange rates worldwide; |
| • | financial and social difficulties affecting many countries worldwide, in particular in Latin America and Europe; |
| • | a deterioration in economic and trade relations between the United States and its major trading partners, including China; |
| • | escalations in trade protectionism globally and geopolitical tensions in East Asia and the Middle East; |
| • | the slowdown of economic growth in China and other major emerging market economies; |
| • | increased uncertainties in the global financial markets and industry, including difficulties faced by several banks in the United States and Europe; and |
| • | political and social instability in various countries in the Middle East, including Iran, Syria, Iraq and Yemen. |
In light of the high level of interdependence of the global economy, unfavorable changes in the global financial markets, including as a result of any of the foregoing developments, could have a material adverse effect on the Korean economy and financial markets, and in turn on our business, financial condition and results of operations. For example, in recent years, the COVID-19 pandemic has led to significant global economic and financial disruptions, including an adverse impact on international trade and business activities, sharp declines and significant volatility in the financial markets as well as decreases in interest rates worldwide. See “Item 3.D. Risk Factors— Other risks relating to our business— The COVID-19 pandemic and any possible recurrence of other types of widespread infectious diseases may adversely affect our business, financial condition or results of operations.”
In addition, the interest rates on our interest-earning assets and interest-bearing liabilities, and therefore our net interest income, are affected by The Bank of Korea’s policy rates. The Bank of Korea lowered its policy rate to 1.5% from 1.75% in July 2019 and to 1.25% in October 2019 to address the sluggishness of the global and domestic economy. In March 2020, The Bank of Korea further lowered its policy rate to 0.75%, which was further lowered to 0.5% in May 2020, in response to deteriorating economic conditions resulting from the COVID-19 pandemic. However, as the economy began to show signs of recovery from the COVID-19 pandemic starting from the second half of 2021, The Bank of Korea gradually raised its policy rate to pre-pandemic levels of 1.25% from August 2021 through January 2022. More recently, in response to rising levels of household debt and inflation in Korea as well as globally, The Bank of Korea raised its policy rate further to 1.50% in
110
Table of Contents
April 2022, 1.75% in May 2022, 2.25% in July 2022, 2.50% in August 2022, 3.00% in October 2022, 3.25% in November 2022 and 3.50% in January 2023.
We are also exposed to adverse changes and volatility in the global and Korean financial markets as a result of our liabilities and assets denominated in foreign currencies and our holdings of trading and investment securities, including structured products. The value of the Won relative to major foreign currencies in general and the U.S. dollar in particular has fluctuated widely in recent years and has been subject to significant volatility as a result of the COVID-19 pandemic, the invasion of Ukraine by Russia and the ensuing sanctions against Russia and, more recently, the widening difference in policy rates between the United States and Korea, among others. A depreciation of the Won will increase our cost in Won of servicing our foreign currency-denominated borrowings, while continued exchange rate volatility may also result in foreign exchange losses for us. Furthermore, as a result of the deterioration in global and Korean economic, social and political conditions, there has been downward pressure on securities prices, including the stock prices of Korean and foreign companies in which we hold an interest. Such developments have resulted in and may lead to further trading and valuation losses on our trading and investment securities portfolio as well as impairment losses on our investments accounted for under the equity method.
As a result of the volatile conditions on the Korean and global economies and financial markets, as well as factors such as fluctuations in oil and commodity prices, high inflation rates, difficulties faced by several banks in the United States and Europe, interest and exchange rate fluctuations, higher unemployment, lower consumer confidence, stock market volatility, changes in fiscal and monetary policies and continued tensions with North Korea, the economic outlook for the financial services sector in Korea in 2023 and for the foreseeable future remains highly uncertain.
Acquisitions
In recent years, we have engaged in a number of acquisitions, which have affected, and may continue to affect, our results of operations and their comparability from period to period.
In August 2020, we acquired all of the outstanding shares of Prudential Life Insurance, which we then subsequently merged with the Former KB Life Insurance in January 2023 to form KB Life Insurance.
Changes in Securities Values, Exchange Rates and Interest Rates
Fluctuations of exchange rates, interest rates and stock prices affect, among other things, the demand for our products and services, the value of and rate of return on our assets, the availability and cost of funding and the financial condition of our customers. The following table shows, for the dates indicated, the stock price index of all equities listed on the KRX KOSPI Market as published in the KOSPI, the Won to U.S. dollar exchange rates and benchmark Won borrowing interest rates.
| June 29, 2018 | Dec. 31, 2018 | June 28, 2019 | Dec. 31, 2019 | June 30, 2020 | Dec. 31, 2020 | June 30, 2021 | Dec. 31, 2021 | June 30, 2022 | Dec. 31, 2022 | |||||||||||||||||||||||||||||||
KOSPI | 2,326.13 | 2,041.04 | (4) | 2,130.62 | 2,197.67 | (5) | 2,108.33 | 2,873.47 | (6) | 3,296.68 | 2,977.65 | (7) | 2,332.64 | 2,236.40 | (8) | |||||||||||||||||||||||||
W/US$ exchange rates(1) | ₩ | 1,111.8 | ₩ | 1,112.9 | ₩ | 1,156.8 | ₩ | 1,157.8 | ₩ | 1,200.7 | ₩ | 1,088.0 | ₩ | 1,130.4 | ₩ | 1,188.6 | ₩ | 1,299.0 | ₩ | 1,260.2 | ||||||||||||||||||||
Corporate bond rates(2) | 2.93 | % | 2.58 | % | 1.98 | % | 1.99 | % | 1.78 | % | 1.70 | % | 1.99 | % | 2.54 | % | 4.50 | % | 5.47 | % | ||||||||||||||||||||
Treasury bond rates(3) | 2.12 | % | 1.82 | % | 1.47 | % | 1.36 | % | 0.85 | % | 0.97 | % | 1.45 | % | 1.80 | % | 3.55 | % | 3.73 | % | ||||||||||||||||||||
| (1) | Represents the noon buying rate on the dates indicated. |
| (2) | Measured by the yield on three-year Korean corporate bonds rated as A+ by the Korean credit rating agencies. |
| (3) | Measured by the yield on three-year treasury bonds issued by the Ministry of Economy and Finance of Korea. |
| (4) | As of December 28, 2018, the last day of trading for the KRX KOSPI Market in 2018. |
| (5) | As of December 30, 2019, the last day of trading for the KRX KOSPI Market in 2019. |
| (6) | As of December 30, 2020, the last day of trading for the KRX KOSPI Market in 2020. |
| (7) | As of December 30, 2021, the last day of trading for the KRX KOSPI Market in 2021. |
| (8) | As of December 29, 2022, the last day of trading for the KRX KOSPI Market in 2022. |
111
Table of Contents
Results of Operations
Net Interest Income
The following table shows, for the periods indicated, the principal components of our net interest income:
| Year Ended December 31, | Percentage Change | |||||||||||||||||||
| 2020 | 2021 | 2022 | 2021/2020 | 2022/2021 | ||||||||||||||||
| (in billions of Won, except percentages) | (%) | |||||||||||||||||||
Interest income | ||||||||||||||||||||
Due from financial institutions measured at amortized cost(1) | ₩ | 92 | ₩ | 66 | ₩ | 158 | (28.3 | ) | 139.4 | |||||||||||
Financial instruments at fair value through profit or loss(2) | 659 | 590 | 876 | (10.5 | ) | 48.5 | ||||||||||||||
Loans(3) | 12,380 | 12,999 | 17,543 | 5.0 | 35.0 | |||||||||||||||
Financial investments (debt securities)(4) | 1,355 | 1,557 | 2,211 | 14.9 | 42.0 | |||||||||||||||
|
|
|
|
|
| |||||||||||||||
Total interest income | 14,486 | 15,211 | 20,789 | 5.0 | 36.7 | |||||||||||||||
|
|
|
|
|
| |||||||||||||||
Interest expense | ||||||||||||||||||||
Deposits | 2,917 | 2,218 | 4,536 | (24.0 | ) | 104.5 | ||||||||||||||
Borrowings(5) | 661 | 593 | 1,498 | (10.3 | ) | 152.6 | ||||||||||||||
Debentures | 1,186 | 1,170 | 1,641 | (1.3 | ) | 40.3 | ||||||||||||||
|
|
|
|
|
| |||||||||||||||
Total interest expense | 4,764 | 3,981 | 7,676 | (16.4 | ) | 92.8 | ||||||||||||||
|
|
|
|
|
| |||||||||||||||
Net interest income | ₩ | 9,722 | ₩ | 11,230 | ₩ | 13,113 | 15.5 | 16.8 | ||||||||||||
|
|
|
|
|
| |||||||||||||||
Net interest margin(6) | 1.99 | % | 2.07 | % | 2.23 | % | ||||||||||||||
| (1) | Consists of cash and interest-earning deposits in other banks. |
| (2) | Consists of deposits, loans and securities at fair value through profit or loss. For information on interest income arising from such financial instruments, see Note 28 of the notes to our consolidated financial statements included elsewhere in this annual report. |
| (3) | Consists of loans measured at amortized cost and others. For information on interest income arising from such loans, see Note 28 of the notes to our consolidated financial statements included elsewhere in this annual report. |
| (4) | Consists of securities measured at fair value through other comprehensive income and at amortized cost and loans at fair value through other comprehensive income. For information on interest income arising from such financial instruments, see Note 28 of the notes to our consolidated financial statements included elsewhere in this annual report. |
| (5) | Consists of borrowings and others. For information on interest expense arising from such borrowings, see Note 28 of the notes to our consolidated financial statements included elsewhere in this annual report. |
| (6) | The ratio of net interest income to average interest-earning assets. See “Item 8.A. Consolidated Statements and Other Financial Information—Profitability ratios and other data.” |
Comparison of 2022 to 2021
Interest income. Interest income increased 36.7% from ₩15,211 billion in 2021 to ₩20,789 billion in 2022, primarily as a result of a 35.0% increase in interest on loans, the effect of which was enhanced by a 42.0% increase in interest on financial investments and a 48.5% increase in interest on financial instruments at fair value through profit or loss. The average yields on our interest-earning assets increased by 72 basis points from 2.81% in 2021 to 3.53% in 2022, which reflected the higher overall level of interest rates prevailing in Korea in 2022 compared to 2021, as discussed above in “—Overview—Trends in the Korean Economy.” The effect of such increase was enhanced by an 8.8% increase in the average volume of our interest-earning assets from ₩541,287 billion in 2021 to ₩588,860 billion in 2022, principally due to growth in our loan portfolio and, to a lesser extent, our financial investments portfolio.
112
Table of Contents
The 35.0% increase in interest on loans from ₩12,999 billion in 2021 to ₩17,543 billion in 2022 was primarily the result of:
| • | a 75 basis point increase in the average yields on corporate loans from 2.67% in 2021 to 3.42% in 2022, which was enhanced by a 16.8% increase in the average volume of such loans from ₩168,868 billion in 2021 to ₩197,172 billion in 2022; |
| • | a 43.1% increase in the average volume of foreign-currency loans from ₩22,580 billion in 2021 to ₩32,309 billion in 2022, which was enhanced by a 109 basis point increase in the average yields on such loans from 5.15% in 2021 to 6.24% in 2022; |
| • | a 101 basis point increase in the average yields on other consumer loans from 4.08% in 2021 to 5.09% in 2022, which was partially offset by a 2.5% decrease in the average volume of such loans from ₩71,587 billion in 2021 to ₩69,789 billion in 2022; and |
| • | a 49 basis point increase in the average yields on mortgage loans from 2.52% in 2021 to 3.01% in 2022, which was enhanced by a 3.4% increase in the average volume of such loans from ₩88,769 billion in 2021 to ₩91,781 billion in 2022. |
The average yields on corporate, foreign-currency, other consumer and mortgage loans increased mainly due to the increase in the general level of interest rates in Korea and globally in 2022 compared to 2021. The increases in the average volumes of corporate, foreign-currency and mortgage loans were attributable primarily to an increase in demand for such loans in light of the increasing uncertainty in the Korean and global financial markets in 2022 compared to 2021. The decrease in the average volume of other consumer loans was primarily due to an increase in interest rates applicable to these loans, which led to a decrease in demand for such loans. Overall, the average yields on our loans increased by 72 basis points from 3.26% in 2021 to 3.98% in 2022, while the average volume of our loans increased 10.4% from ₩399,060 billion in 2021 to ₩440,412 billion in 2022.
Our financial investments portfolio consists of securities and loans measured at fair value through other comprehensive income and securities measured at amortized cost, including debt securities issued by government-owned or -controlled enterprises or financial institutions and debt securities issued by Korean banks and other financial institutions. The 42.0% increase in interest on financial investments from ₩1,557 billion in 2021 to ₩2,211 billion in 2022 was the result of a 49 basis point increase in the average yields on financial investments from 1.60% in 2021 to 2.09% in 2022, which was enhanced by an 8.9% increase in the average volume of financial investments from ₩97,296 billion in 2021 to ₩105,980 billion in 2022. The increase in the average yields on financial investments mainly reflected the increase in the general level of interest rates in Korea and globally in 2022 compared to 2021. The increase in average volume of financial investments was primarily due to an increase in our purchases of government and public bonds as well as corporate bonds.
The 48.5% increase in interest on financial instruments at fair value through profit or loss from ₩590 billion in 2021 to ₩876 billion in 2022 was primarily due to a 134 basis point increase in the average yields on such financial instruments from 1.86% in 2021 to 3.20% in 2022, which was partially offset by a 13.6% decrease in the average volume of such financial instruments from ₩31,670 billion in 2021 to ₩27,371 billion in 2022. The increase in average yields on such financial instruments mainly reflected the increase in the general level of interest rates in Korea and globally in 2022 compared to 2021. The decrease in the average volume of such financial instruments mainly reflected a decrease in our purchases of government and public bonds as well as corporate bonds.
Interest expense. Interest expense increased 92.8% from ₩3,981 billion in 2021 to ₩7,676 billion in 2022 due to a 104.5% increase in interest expense on deposits and, to lesser extents, a 152.6% increase in interest expense on borrowings and a 40.3% increase in interest expense on debentures. The average cost of interest-bearing liabilities increased by 64 basis points from 0.84% in 2021 to 1.48% in 2022, which was driven mainly by the increase in the general level of interest rates in Korea and globally in 2022 compared to 2021. The effect of this increase was enhanced by a 10.2% increase in the average volume of our interest-bearing liabilities from
113
Table of Contents
₩472,015 billion in 2021 to ₩519,930 billion in 2022, which reflected increases in the average volumes of deposits and, to lesser extents, borrowings and debentures.
The 104.5% increase in interest expense on deposits from ₩2,218 billion in 2021 to ₩4,536 billion in 2022 was primarily due to a 91 basis point increase in the average cost of time deposits from 1.20% in 2021 to 2.11% in 2022, which was enhanced by an 18.4% increase in the average volume of such deposits from ₩158,795 billion in 2021 to ₩187,934 billion in 2022. The increase in the average cost of such deposits was principally due to the increase in the general level of interest rates in Korea and globally in 2022 compared to 2021. The increase in the average volume of such deposits mainly reflected customers’ increasing demand for such products in light of the higher general level of interest rates in Korea and the increase in the volatility of the financial markets in 2022 compared to 2021. Overall, the average cost of our deposits increased by 56 basis points from 0.65% in 2021 to 1.21% in 2022, while the average volume of our deposits increased 9.5% from ₩343,349 billion in 2021 to ₩375,913 billion in 2022.
The 152.6% increase in interest expense on borrowings from ₩593 billion in 2021 to ₩1,498 billion in 2022 was principally attributable to a 109 basis point increase in the average cost of borrowings from 0.94% in 2021 to 2.03% in 2022, which was enhanced by a 17.5% increase in the average volume of borrowings from ₩62,907 billion in 2021 to ₩73,885 billion in 2022. The increase in the average cost of borrowings mainly reflected the increase in the general level of interest rates in Korea and globally in 2022 compared to 2021, while the increase in the average volume of borrowings was primarily due to our increased use of borrowings to meet our funding needs.
The 40.3% increase in interest expense on debentures from ₩1,170 billion in 2021 to ₩1,641 billion in 2022 was primarily due to a 56 basis point increase in the average cost of debentures from 1.78% in 2021 to 2.34% in 2022, which was enhanced by a 6.7% increase in the average volume of debentures from ₩65,759 billion in 2021 to ₩70,132 billion in 2022. The increase in the average cost of debentures mainly reflected the increase in the general level of interest rates in Korea and globally in 2022 compared to 2021, while the increase in the average volume of debentures was principally due to our increased use of debentures to meet our funding needs.
Net interest margin. Net interest margin represents the ratio of net interest income to average interest-earning assets. Our overall net interest margin increased from 2.07% in 2021 to 2.23% in 2022, as a 16.8% increase in our net interest income from ₩11,230 billion in 2021 to ₩13,113 billion in 2022 outpaced an 8.8% increase in the average volume of our interest-earnings assets from ₩541,287 billion in 2021 to ₩588,860 billion in 2022. The amount of increase in interest income outpaced the amount of increase in interest expense, resulting in an increase in net interest income. The growth in average interest-earning assets was more than offset by a 10.2% increase in average interest-bearing liabilities from ₩472,015 billion in 2021 to ₩519,930 billion in 2022. Our net interest spread, which represents the difference between the average yield on our interest-earning assets and the average cost of our interest-bearing liabilities, increased from 1.97% in 2021 to 2.05% in 2022. The increase in our net interest spread reflected a larger increase in the average yield on interest-earning assets compared to the increase in the average cost of interest-bearing liabilities between the two periods, primarily as interest rates on interest-earning assets adjusted earlier than those on interest-bearing liabilities in the context of a higher interest rate environment in 2022 compared to 2021.
Comparison of 2021 to 2020
Interest income. Interest income increased 5.0% from ₩14,486 billion in 2020 to ₩15,211 billion in 2021, primarily as a result of a 5.0% increase in interest on loans and a 14.9% increase in interest on financial investments, the effect of which was partially offset by a 10.5% decrease in interest on financial instruments at fair value through profit or loss. The average volume of our interest-earning assets increased 10.7% from ₩489,043 billion in 2020 to ₩541,287 billion in 2021, principally due to growth in our loan portfolio and, to a lesser extent, our financial investments portfolio. The effect of such increase was partially offset by a 15 basis point decrease in the average yields on our interest-earning assets from 2.96% in 2020 to 2.81% in 2021, which
114
Table of Contents
reflected the lower overall level of interest rates prevailing in Korea in 2021 compared to 2020, as discussed above in “—Overview—Trends in the Korean Economy.”
The 5.0% increase in interest on loans from ₩12,380 billion in 2020 to ₩12,999 billion in 2021 was primarily the result of:
| • | a 53.8% increase in the average volume of foreign-currency loans from ₩14,683 billion in 2020 to ₩22,580 billion in 2021, which was partially offset by a 36 basis point decrease in the average yields on such loans from 5.51% in 2020 to 5.15% in 2021; |
| • | an 11.5% increase in the average volume of other consumer loans from ₩64,220 billion in 2020 to ₩71,587 billion in 2021, which was partially offset by a 3 basis point decrease in the average yields on such loans from 4.11% in 2020 to 4.08% in 2021; and |
| • | a 7.3% increase in the average volume of mortgage loans from ₩82,765 billion in 2020 to ₩88,769 billion in 2021, which was partially offset by a 9 basis point decrease in the average yields on such loans from 2.61% in 2020 to 2.52% in 2021; |
which were partially offset by:
| • | a 19 basis point decrease in the average yields on home equity loans from 2.84% in 2020 to 2.65% in 2021, which was enhanced by a 1.3% decrease in the average volume of such loans from ₩27,682 billion in 2020 to ₩27,333 billion in 2021; and |
| • | a 20 basis point decrease in the average yields on corporate loans from 2.87% in 2020 to 2.67% in 2021, which was partially offset by a 6.5% increase in the average volume of such loans from ₩158,508 billion in 2020 to ₩168,868 billion in 2021. |
The increases in the average volumes of foreign-currency, other consumer, mortgage and corporate loans were attributable primarily to an increase in demand from borrowers in need of financing in light of the ongoing COVID-19 pandemic as well as the low interest environment in 2021. The decrease in the average volume of home equity loans was mainly the result of increased government regulations applicable to such loans, which led to a decrease in demand for such loans. The decreases in the average yields on foreign-currency, other consumer, corporate, home equity and mortgage loans mainly reflected the lower overall level of interest rates prevailing in Korea in 2021 compared to 2020. Overall, the average volume of our loans increased 8.9% from ₩366,444 billion in 2020 to ₩399,060 billion in 2021, while the average yields on our loans decreased by 12 basis points from 3.38% in 2020 to 3.26% in 2021.
The 14.9% increase in interest on financial investments from ₩1,355 billion in 2020 to ₩1,557 billion in 2021 was the result of a 21.5% increase in the average volume of financial investments from ₩80,087 billion in 2020 to ₩97,296 billion in 2021, which was partially offset by a 9 basis point decrease in the average yields on financial investments from 1.69% in 2020 to 1.60% in 2021. The increase in the average volume of financial investments was primarily due to an increase in our purchases of government and public bonds as well as corporate bonds. The decrease in average yields on financial investments mainly reflected the lower overall level of interest rates prevailing in Korea in 2021 compared to 2020.
The 10.5% decrease in interest on financial instruments at fair value through profit or loss from ₩659 billion in 2020 to ₩590 billion in 2021 was primarily due to a 32 basis point decrease in the average yields on such financial instruments from 2.18% in 2020 to 1.86% in 2021, which was partially offset by a 4.8% increase in the average volume of such financial instruments from ₩30,232 billion in 2020 to ₩31,670 billion in 2021. The decrease in average yields on such financial instruments mainly reflected the lower overall level of interest rates prevailing in Korea in 2021 compared to 2020. The increase in the average volume of such financial instruments mainly reflected the increased purchases of corporate bonds and other debt securities.
Interest expense. Interest expense decreased 16.4% from ₩4,764 billion in 2020 to ₩3,981 billion in 2021 due to a 24.0% decrease in interest expense on deposits and, to a lesser extent, a 10.3% decrease in interest
115
Table of Contents
expense on borrowings and a 1.3% decrease in interest expense on debentures. The average cost of interest-bearing liabilities decreased by 26 basis points from 1.10% in 2020 to 0.84% in 2021, which was driven mainly by the lower overall level of interest rates prevailing in Korea in 2021 compared to 2020. The effect of this decrease was partially offset by a 9.3% increase in the average volume of our interest-bearing liabilities from ₩431,765 billion in 2020 to ₩472,015 billion in 2021, which reflected increases in the average volumes of deposits and, to a lesser extent, borrowings and debentures.
The 24.0% decrease in interest expense on deposits from ₩2,917 billion in 2020 to ₩2,218 billion in 2021 was primarily due to a 36 basis point decrease in the average cost of time deposits from 1.56% in 2020 to 1.20% in 2021, which was enhanced by a 4.5% decrease in the average volume of such deposits from ₩166,275 billion in 2020 to ₩158,795 billion in 2021. The decrease in the average cost of such deposits was principally due to the lower overall level of interest rates prevailing in Korea in 2021 compared to 2020. The decrease in the average volume of such deposits mainly reflected a decrease in customers’ demand for such deposits in light of the low interest rate environment in Korea. Overall, the average cost of our deposits decreased by 26 basis points from 0.91% in 2020 to 0.65% in 2021, while the average volume of our deposits increased 7.6% from ₩319,052 billion in 2020 to ₩343,349 billion in 2021.
The 10.3% decrease in interest expense on borrowings from ₩661 billion in 2020 to ₩593 billion in 2021 was principally attributable to a 30 basis point decrease in the average cost of borrowings from 1.24% in 2020 to 0.94% in 2021, which was partially offset by a 17.9% increase in the average volume of borrowings from ₩53,334 billion in 2020 to ₩62,907 billion in 2021. The decrease in the average cost of borrowings mainly reflected the lower overall level of interest rates prevailing in Korea in 2021 compared to 2020, while the increase in the average volume of borrowings was primarily due to our increased use of borrowings to meet our funding needs in light of the lower interest rate environment in Korea.
The 1.3% decrease in interest expense on debentures from ₩1,186 billion in 2020 to ₩1,170 billion in 2021 was primarily due to a 22 basis point decrease in the average cost of debentures from 2.00% in 2020 to 1.78% in 2021, which was mostly offset by a 10.7% increase in the average volume of debentures from ₩59,379 billion in 2020 to ₩65,759 billion in 2021. The decrease in the average cost of debentures mainly reflected the lower overall level of interest rates prevailing in Korea in 2021 compared to 2020, while the increase in the average volume of debentures was principally due to our increased use of debentures to meet our funding needs in light of the lower interest rate environment in Korea.
Net interest margin. Our overall net interest margin increased from 1.99% in 2020 to 2.07% in 2021, as a 15.5% increase in our net interest income from ₩9,722 billion in 2020 to ₩11,230 billion in 2021 outpaced a 10.7% increase in the average volume of our interest-earnings assets from ₩489,043 billion in 2020 to ₩541,287 billion in 2021. The increase in interest income was enhanced by a decrease in interest expense, resulting in an increase in net interest income. The growth in average interest-earning assets was largely offset by a 9.3% increase in average interest-bearing liabilities from ₩431,765 billion in 2020 to ₩472,015 billion in 2021. Our net interest spread increased from 1.86% in 2020 to 1.97% in 2021. The increase in our net interest spread reflected a larger decrease in the average cost of interest-bearing liabilities compared to the decrease in the average yield on interest-earning assets between the two periods, primarily due to the earlier adjustment of interest rates on interest-earning assets compared to interest rates on interest-bearing liabilities as interest rates began to rise again in the second half of 2021.
Provision for Credit Losses
Provision for credit losses includes provision for credit losses of loans, provision for credit losses of unused loan commitments, provision for credit losses of acceptances and guarantees, provision for credit losses of financial guarantee contracts and provision for credit losses of other financial assets, in each case net of reversal of provisions. For a discussion of our credit losses provisioning policy, see “Item 4.B. Business Overview—Assets and Liabilities—Loan Portfolio—Provisioning Policy.”
116
Table of Contents
In accordance with the guidelines of the Financial Supervisory Service, if our allowances and provisions for credit losses are deemed insufficient for regulatory purposes, we compensate for the difference by recording a regulatory reserve for credit losses, which is segregated within retained earnings. See “Item 4.B. Business Overview—Assets and Liabilities—Loan Portfolio—Regulatory Reserve for Credit Losses” and Note 27.5 of the notes to our consolidated financial statements included elsewhere in this annual report.
Comparison of 2022 to 2021
Our provision for credit losses increased 54.9% from ₩1,185 billion in 2021 to ₩1,836 billion in 2022, primarily due to an increase in provision for credit losses of loans.
Our provision for credit losses of loans increased 62.1% from ₩1,089 billion in 2021 to ₩1,765 billion in 2022, mainly due to increases in provision for credit losses in respect of our corporate loans and our retail loans. Such increases mainly reflected our provisioning policy pursuant to which we preemptively accounted for a potential increase in credit losses that could result from a deterioration in the overall asset quality of our loan portfolios, due to an increasing likelihood of default by borrowers in light of the rising interest rate levels and a general slowdown in the economy in Korea, and to a lesser extent, increases in the volumes of such loans. Such increases were offset in part by a decrease in provision for credit losses in respect of our credit card receivables, which resulted from an improvement in the overall asset quality of such receivables. Our loan write-offs increased 38.8% from ₩1,092 billion in 2021 to ₩1,516 billion in 2022, due to increases in write-offs of corporate loans and, to lesser extents, credit card receivables and retail loans.
Comparison of 2021 to 2020
Our provision for credit losses increased 13.6% from ₩1,043 billion in 2020 to ₩1,185 billion in 2021, primarily due to an increase in provision for credit losses of loans and a change in provision (reversal) for credit losses of acceptances and guarantees, the effect of which was partially offset by a decrease in provision for credit losses of unused loan commitments.
Our provision for credit losses of loans increased 15.7% from ₩941 billion in 2020 to ₩1,089 billion in 2021, mainly due to increases in provision for credit losses in respect of our corporate loans and, to a lesser extent, our credit card receivables. Such increases mainly reflected our provisioning policy pursuant to which we preemptively accounted for a potential increase in expected credit losses that could result from a deterioration in the overall asset quality of our loan portfolios due to COVID-19, as well as an increase in the volumes of such corporate and credit card loans. Such increases were offset in part by a decrease in provision for credit losses in respect of our retail loans, which resulted from an improvement in the overall asset quality of our retail loans. Our loan write-offs decreased 15.0% from ₩1,285 billion in 2020 to ₩1,092 billion in 2021, due to decreases in write-offs of corporate loans and, to a lesser extent, credit card receivables and retail loans.
Our provision for credit losses of acceptances and guarantees and unused loan commitments decreased 15.8% from ₩76 billion in 2020 to ₩64 billion in 2021, primarily due to an improvement in the overall credit quality of our acceptances and guarantees and unused loan commitments in 2021.
Allowances for Credit Losses of Loans
We establish allowances for credit losses of loans with respect to loans to absorb such losses. We assess individually significant loans on a case-by-case basis and other loans on a collective basis.
117
Table of Contents
Corporate Loans. The following table shows, for the periods indicated, certain information regarding our impaired corporate loans:
| As of December 31, | ||||||||||||
| 2020 | 2021 | 2022 | ||||||||||
| (%) | ||||||||||||
Impaired corporate loans as a percentage of total corporate loans | 1.2 | 1.1 | 0.9 | |||||||||
Allowances for credit losses for corporate loans as a percentage of total corporate loans | 0.9 | 0.9 | 0.9 | |||||||||
Allowances for credit losses for corporate loans as a percentage of impaired corporate loans | 76.4 | 87.3 | 98.5 | |||||||||
Net charge-offs of corporate loans as a percentage of total corporate loans | 0.1 | 0.1 | 0.2 | |||||||||
During 2022, impaired corporate loans as a percentage of total corporate loans decreased due to a decrease in our impaired corporate loans, which mainly reflected an improvement in the overall credit quality of our corporate loans, as well as an increase in our total corporate loans. Allowances for credit losses for corporate loans as a percentage of total corporate loans remained stable, as our allowances for credit losses for corporate loans and our total corporate loans increased. Allowances for credit losses for corporate loans as a percentage of impaired corporate loans increased due to an increase in allowances for credit losses for corporate loans and the decrease in impaired corporate loans.
During 2021, impaired corporate loans as a percentage of total corporate loans decreased due to a decrease in our impaired corporate loans, which mainly reflected an improvement in the overall credit quality of our corporate loans, as well as an increase in our total corporate loans. Allowances for credit losses for corporate loans as a percentage of total corporate loans remained stable, as our allowances for credit losses for corporate loans and our total corporate loans increased. Allowances for credit losses for corporate loans as a percentage of impaired corporate loans increased due to an increase in allowances for credit losses for corporate loans and the decrease in impaired corporate loans.
Retail Loans. The following table shows, for the periods indicated, certain information regarding our impaired retail loans:
| As of December 31, | ||||||||||||
| 2020 | 2021 | 2022 | ||||||||||
| (%) | ||||||||||||
Impaired retail loans as a percentage of total retail loans | 0.4 | 0.4 | 0.5 | |||||||||
Allowances for credit losses for retail loans as a percentage of total retail loans | 0.5 | 0.5 | 0.7 | |||||||||
Allowances for credit losses for retail loans as a percentage of impaired retail loans | 124.4 | 125.9 | 142.2 | |||||||||
Net charge-offs of retail loans as a percentage of total retail loans | 0.2 | 0.1 | 0.2 | |||||||||
During 2022, impaired retail loans as a percentage of total retail loans increased due to an increase in our impaired retail loans, which mainly reflected a deterioration in the overall asset quality of our retail loan portfolio, as well as a decrease in the amount of our total retail loans. Allowances for credit losses for retail loans as a percentage of total retail loans increased, as our allowances for credit losses for retail loans increased while our total retail loans decreased. Allowances for credit losses for retail loans as a percentage of impaired retail loans also increased during 2022, reflecting a rate of increase in allowances for credit losses for retail loans that outpaced the rate of increase in the amount of impaired retail loans.
During 2021, impaired retail loans and allowances for credit losses for retail loans, each as a percentage of total retail loans, remained stable, as our impaired retail loans, allowances for credit losses for retail loans and our total retail loans all increased. Allowances for credit losses for retail loans as a percentage of impaired retail loans increased slightly during 2021, reflecting a rate of increase in allowances for credit losses for retail loans that outpaced the rate of increase in the amount of impaired retail loans.
118
Table of Contents
Credit Card Balances. The following table shows, for the periods indicated, certain information regarding our impaired credit card balances:
| As of December 31, | ||||||||||||
| 2020 | 2021 | 2022 | ||||||||||
| (%) | ||||||||||||
Impaired credit card balances as a percentage of total credit card balances | 2.7 | 2.5 | 2.6 | |||||||||
Allowances for credit losses for credit card balances as a percentage of total credit card balances | 3.7 | 3.8 | 3.7 | |||||||||
Allowances for credit losses for credit card balances as a percentage of impaired credit card balances | 138.5 | 150.2 | 140.8 | |||||||||
Net charge-offs as a percentage of total credit card balances | 2.0 | 1.5 | 1.5 | |||||||||
During 2022, impaired credit card balances as a percentage of total credit card balances increased as the rate of increase in the amount of our impaired credit card balances outpaced the rate of increase in the amount of our total credit card balances. Allowances for credit losses for credit card balances as a percentage of both total credit card balances and impaired credit card balances decreased during 2022, as the rate of increase in the amount of our allowances for credit losses for credit card balances was outpaced by the rates of increases of both our total credit card balances and our impaired credit card balances.
During 2021, impaired credit card balances as a percentage of total credit card balances decreased as the rate of increase in the amount of our impaired credit card balances was outpaced by the rate of increase in the amount of our total credit card balances. Allowances for credit losses for credit card balances as a percentage of both total credit card balances and impaired credit card balances increased during 2021, as the rate of increase in the amount of our allowances for credit losses for credit card balances outpaced the rates of increases of both our total credit card balances and our impaired credit card balances.
Net Fee and Commission Income
The following table shows, for the periods indicated, the components of our net fee and commission income:
| Year Ended December 31, | Percentage Change | |||||||||||||||||||
| 2020 | 2021 | 2022 | 2021/2020 | 2022/2021 | ||||||||||||||||
| (in billions of Won) | (%) | |||||||||||||||||||
Fee and commission income | ₩ | 4,527 | ₩ | 5,324 | ₩ | 5,122 | 17.6 | (3.8 | ) | |||||||||||
Fee and commission expense | (1,568 | ) | (1,698 | ) | (1,800 | ) | 8.3 | 6.0 | ||||||||||||
|
|
|
|
|
| |||||||||||||||
Net fee and commission income | ₩ | 2,959 | ₩ | 3,626 | ₩ | 3,322 | 22.5 | (8.4 | ) | |||||||||||
|
|
|
|
|
| |||||||||||||||
Comparison of 2022 to 2021
Our net fee and commission income decreased 8.4% from ₩3,626 billion in 2021 to ₩3,322 billion in 2022, due to a 3.8% decrease in fee and commission income from ₩5,324 billion in 2021 to ₩5,122 billion in 2022, which was enhanced by a 6.0% increase in fee and commission expense from ₩1,698 billion in 2021 to ₩1,800 billion in 2022.
The 3.8% decrease in fee and commission income was primarily due to a 28.7% decrease in commissions received on securities business from ₩881 billion in 2021 to ₩628 billion in 2022 and a 17.6% decrease in trust and other fiduciary fees received from ₩409 billion in 2021 to ₩337 billion in 2022, the effects of which were offset in part by an 11.9% increase in lease fees received from ₩898 billion in 2021 to ₩1,005 billion in 2022. The decrease in commissions received on securities business was mainly due to a decrease in the volume of commission-generating securities instruments sold by KB Securities and the decrease in trust and other fiduciary fees received was primarily due to a decrease in our sales of money trust products, while the increase in lease fees was primarily attributable to an increase in automobile lease fees received by KB Capital.
119
Table of Contents
The 6.0% increase in fee and commission expense was principally attributable to a 12.1% increase in other fees paid from ₩506 billion in 2021 to ₩567 billion in 2022 and a 21.9% increase in outsourcing related fees paid from ₩210 billion in 2021 to ₩256 billion in 2022. The increase in other fees paid was primarily due to increases in miscellaneous other fees paid in Korean Won and securitization fees paid, while the increase in outsourcing related fees paid was primarily due to increases in miscellaneous other outsourcing related fees paid and consulting fees paid.
Comparison of 2021 to 2020
Our net fee and commission income increased 22.5% from ₩2,959 billion in 2020 to ₩3,626 billion in 2021, due to a 17.6% increase in fee and commission income from ₩4,527 billion in 2020 to ₩5,324 billion in 2021, which was offset in part by an 8.3% increase in fee and commission expense from ₩1,568 billion in 2020 to ₩1,698 billion in 2021.
The 17.6% increase in fee and commission income was primarily due to a 41.2% increase in lease fees received from ₩636 billion in 2020 to ₩898 billion in 2021, a 10.8% increase in credit and debit card related fees received from ₩1,378 billion in 2020 to ₩1,527 billion in 2021 and a 44.8% increase in other fees received from ₩315 billion in 2020 to ₩456 billion in 2021. The increase in lease fees received was principally as a result of an increase in automobile lease fees received by KB Capital, the increase in credit and debit card related fees received was primarily attributable to an increase in the volume of credit and debit card transactions in light of the COVID-19 pandemic and the increase in other fees received mainly reflected an increase in investment finance-related commissions received.
The 8.3% increase in fee and commission expense was principally attributable to a 32.8% increase in other fees paid from ₩381 billion in 2020 to ₩506 billion in 2021, primarily due to increases in other miscellaneous fees paid by KB Kookmin Card and KB Securities.
Net Insurance Income
The following table shows, for the periods indicated, the components of our net insurance income:
| Year Ended December 31, | Percentage Change | |||||||||||||||||||
| 2020 | 2021 | 2022 | 2021/2020 | 2022/2021 | ||||||||||||||||
| (in billions of Won) | (%) | |||||||||||||||||||
Insurance income | ₩ | 14,387 | ₩ | 16,108 | ₩ | 17,137 | 12.0 | 6.4 | ||||||||||||
Insurance expense | (14,087 | ) | (15,551 | ) | (16,440 | ) | 10.4 | 5.7 | ||||||||||||
|
|
|
|
|
| |||||||||||||||
Net insurance income | ₩ | 300 | ₩ | 557 | ₩ | 697 | 85.7 | 25.1 | ||||||||||||
|
|
|
|
|
| |||||||||||||||
Comparison of 2022 to 2021
Our net insurance income increased 25.1% from ₩557 billion in 2021 to ₩697 billion in 2022, due to a 6.4% increase in insurance income from ₩16,108 billion in 2021 to ₩17,137 billion in 2022, which was in large part offset by a 5.7% increase in insurance expense from ₩15,551 billion in 2021 to ₩16,440 billion in 2022.
The increase in insurance income was mainly due to a 7.4% increase in premium income from ₩14,684 billion in 2021 to ₩15,766 billion in 2022, which was offset in part by a decrease in income from changes in reinsurance assets from ₩135 billion in 2021 to nil in 2022. The increase in premium income was principally due to an increase in the number of new insurance products sold by the Former KB Life Insurance, Prudential Life Insurance and KB Insurance. The decrease in income from changes in reinsurance assets was mainly due to a decrease in the volume of reinsurance assets of KB Insurance.
The increase in insurance expense was principally attributable to a 37.8% increase in refunds of surrender value paid from ₩4,032 billion in 2021 to ₩5,556 billion in 2022, which was enhanced by a 9.5% increase in insurance claims paid from ₩5,778 billion in 2021 to ₩6,325 billion in 2022 and a 24.4% increase in
120
Table of Contents
amortization of deferred acquisition costs from ₩819 billion in 2021 to ₩1,019 billion in 2022. Such increases were offset in part by a 62.1% decrease in provisions for policy reserves from ₩2,762 billion in 2021 to ₩1,046 billion in 2022. The increases in refunds of surrender value and insurance claims paid mainly reflected an increase in the accumulated number of insurance products sold by the Former KB Life Insurance, Prudential Life Insurance and KB Insurance, and the increase in amortization of deferred acquisition costs mainly reflected an increase in depreciable acquisition costs due to the sale of new insurance products. The decrease in provisions for policy reserves was mainly due to a decrease in our sales of savings-type insurance policies.
Comparison of 2021 to 2020
Our net insurance income increased 85.7% from ₩300 billion in 2020 to ₩557 billion in 2021, due to a 12.0% increase in insurance income from ₩14,387 billion in 2020 to ₩16,108 billion in 2021, which was offset in part by a 10.4% increase in insurance expense from ₩14,087 billion in 2020 to ₩15,551 billion in 2021.
The increase in insurance income was mainly due to a 14.1% increase in premium income from ₩12,873 billion in 2020 to ₩14,684 billion in 2021, which was offset in part by a decrease in income from changes in reinsurance assets from ₩468 billion in 2020 to ₩135 billion in 2021. The increase in premium income was principally due to an increase in the number of new insurance products sold by the Former KB Life Insurance and KB Insurance, as well as the full-year effect of the addition of Prudential Life Insurance as a consolidated subsidiary in August 2020. The decrease in income from changes in reinsurance assets was mainly due to an increase in income from a reinsurance claim in connection with a major fire in 2020, which was not repeated in 2021.
The increase in insurance expense was principally attributable to a 22.7% increase in refunds of surrender value paid from ₩3,286 billion in 2020 to ₩4,032 billion in 2021, which was enhanced by a 9.7% increase in insurance claims paid from ₩5,265 billion in 2020 to ₩5,778 billion in 2021. Such increases were mainly due to an increase in the accumulated number of insurance products sold by the Former KB Life Insurance and KB Insurance, as well as the full-year effect of the addition of Prudential Life Insurance as a consolidated subsidiary in August 2020.
Net Gains on Financial Instruments at Fair Value through Profit or Loss
The following table shows, for the periods indicated, the components of our net gains on financial instruments at fair value through profit or loss:
| Year Ended December 31, | Percentage Change | |||||||||||||||||||
| 2020 | 2021 | 2022 | 2021/2020 | 2022/2021 | ||||||||||||||||
| (in billions of Won) | (%) | |||||||||||||||||||
Net gains (losses) on financial assets at fair value through profit or loss | ₩ | 1,302 | ₩ | 831 | ₩ | (740 | ) | (36.2 | ) | N/M | (1) | |||||||||
Net gains on derivatives held for trading | 323 | 204 | 178 | (36.8 | ) | (12.7 | ) | |||||||||||||
Net gains (losses) on financial liabilities at fair value through profit or loss | (125 | ) | (8 | ) | 51 | (93.6 | ) | N/M | (1) | |||||||||||
Net gains (losses) on financial instruments designated at fair value through profit or loss | (489 | ) | (31 | ) | 758 | (93.7 | ) | N/M | (1) | |||||||||||
|
|
|
|
|
| |||||||||||||||
Net gains on financial instruments at fair value through profit or loss | ₩ | 1,011 | ₩ | 995 | ₩ | 247 | (1.6 | ) | (75.2 | ) | ||||||||||
|
|
|
|
|
| |||||||||||||||
| (1) | “N/M” means not meaningful. |
121
Table of Contents
Comparison of 2022 to 2021
Our net gains on financial instruments at fair value through profit or loss decreased 75.2% from ₩995 billion in 2021 to ₩247 billion in 2022. Such decrease was primarily attributable to a change in our net gains (losses) on financial assets at fair value through profit or loss from net gains in 2021 to net losses in 2022, the effect of which was offset in part by a change in our net gains (losses) on financial instruments designated at fair value through profit or loss from net losses in 2021 to net gains in 2022.
| • | Our net gains (losses) on financial assets at fair value through profit or loss changed from net gains of ₩831 billion in 2021 to net losses of ₩740 billion in 2022, due to a change in net gains (losses) on debt securities held for trading from net gains of ₩523 billion in 2021 to net losses of ₩688 billion in 2022, which was enhanced by a change in net gains (losses) on equity securities held for trading from net gains of ₩307 billion in 2021 to net losses of ₩51 billion in 2022. |
| • | Our net gains (losses) on financial instruments designated at fair value through profit or loss changed from net losses of ₩31 billion in 2021 to net gains of ₩758 billion in 2022. Such change was primarily attributable to a 90.2% increase in gains on financial liabilities designated at fair value through profit or loss from ₩624 billion in 2021 to ₩1,187 billion in 2022, which was enhanced by a 34.5% decrease in losses on financial liabilities designated at fair value through profit or loss from ₩655 billion in 2021 to ₩429 billion in 2022. |
Comparison of 2021 to 2020
Our net gains on financial instruments at fair value through profit or loss decreased 1.6% from ₩1,011 billion in 2020 to ₩995 billion in 2021. Such decrease was primarily attributable to decreases in net gains on financial assets at fair value through profit or loss and net gains on derivatives held for trading, the effects of which were mostly offset by substantial decreases in net losses on financial instruments designated at fair value through profit or loss and net losses on financial liabilities at fair value through profit or loss.
| • | Our net gains on financial assets at fair value through profit or loss decreased 36.2% from ₩1,302 billion in 2020 to ₩831 billion in 2021, due to a 48.8% decrease in net gains on debt securities held for trading from ₩1,021 billion in 2020 to ₩523 billion in 2021, which was slightly offset by a 9.3% increase in net gains on equity securities held for trading from ₩281 billion in 2020 to ₩307 billion in 2021. |
| • | Our net gains on derivatives held for trading decreased 36.8% from ₩323 billion in 2020 to ₩204 billion in 2021, primarily due to a change from net gains on stock or stock index derivatives held for trading of ₩250 billion in 2020 to net losses on such derivatives of ₩1 billion in 2021, which was enhanced by a 51.4% decrease in net gains on currency derivatives held for trading from ₩144 billion in 2020 to ₩70 billion in 2021. Such effect was partially offset by a change from net losses on interest rate derivatives held for trading of ₩55 billion in 2020 to net gains on such derivatives of ₩151 billion in 2021. |
| • | Our net losses on financial instruments designated at fair value through profit or loss decreased 93.7% from ₩489 billion in 2020 to ₩31 billion in 2021 as a result of a decrease in net losses on financial liabilities designated at fair value through profit or loss. Such decrease was primarily attributable to a 42.7% decrease in losses on financial liabilities designated at fair value through profit or loss from ₩1,143 billion in 2020 to ₩655 billion in 2021. |
| • | Our net losses on financial liabilities at fair value through profit or loss decreased 93.6% from ₩125 billion in 2020 to ₩8 billion in 2021 as a result of a 47.1% decrease in losses on financial liabilities at fair value through profit or loss from ₩153 billion in 2020 to ₩81 billion in 2021 and a 160.7% increase in gains on financial liabilities at fair value through profit or loss from ₩28 billion in 2020 to ₩73 billion in 2021. |
122
Table of Contents
For further information regarding our net gains on financial instruments at fair value through profit or loss, see Note 30 of the notes to our consolidated financial statements included elsewhere in this annual report.
General and Administrative Expenses
The following table shows, for the periods indicated, the components of our general and administrative expenses:
| Year Ended December 31, | Percentage Change | |||||||||||||||||||
| 2020 | 2021 | 2022 | 2021/2020 | 2022/2021 | ||||||||||||||||
| (in billions of Won) | (%) | |||||||||||||||||||
Expenses related to employees | ₩ | 4,325 | ₩ | 4,635 | ₩ | 4,733 | 7.2 | 2.1 | ||||||||||||
Depreciation and amortization | 875 | 851 | 879 | (2.7 | ) | 3.3 | ||||||||||||||
Other general and administrative expenses | 1,615 | 1,715 | 1,926 | 6.2 | 12.3 | |||||||||||||||
|
|
|
|
|
| |||||||||||||||
General and administrative expenses | ₩ | 6,815 | ₩ | 7,201 | ₩ | 7,538 | 5.7 | 4.7 | ||||||||||||
|
|
|
|
|
| |||||||||||||||
Comparison of 2022 to 2021
Our general and administrative expenses increased 4.7% from ₩7,201 billion in 2021 to ₩7,538 billion in 2022, primarily as a result of a 12.3% increase in other general and administrative expenses from ₩1,715 billion in 2021 to ₩1,926 billion in 2022, which was enhanced by a 2.1% increase in expenses related to employees from ₩4,635 billion in 2021 to ₩4,733 billion in 2022.
The increase in other general and administrative expenses was attributable mainly to a 26.0% increase in electronic data processing expenses from ₩315 billion in 2021 to ₩397 billion in 2022, a 16.0% increase in taxes and dues paid from ₩268 billion in 2021 to ₩311 billion in 2022 and a 10.6% increase in miscellaneous expenses from ₩321 billion in 2021 to ₩355 billion in 2022.
The increase in expenses related to employees was attributable mainly to a 2.1% increase in salaries from ₩3,007 billion in 2021 to ₩3,071 billion in 2022 and a 6.6% increase in other employee benefits from ₩928 billion in 2021 to ₩989 billion in 2022, which was offset in part by a 43.1% decrease in share-based payments from ₩102 billion in 2021 to ₩58 billion in 2022. The increase in salaries paid was primarily attributable to a general increase in the salaries paid to employees, while the increase in other employee benefits mainly reflected increases in short-term employee benefits. The decrease in share-based payments was primarily due to a decrease in our share price.
Comparison of 2021 to 2020
Our general and administrative expenses increased 5.7% from ₩6,815 billion in 2020 to ₩7,201 billion in 2021, primarily as a result of a 7.2% increase in expenses related to employees from ₩4,325 billion in 2020 to ₩4,635 billion in 2021, which was enhanced by a 6.2% increase in other general and administrative expenses from ₩1,615 billion in 2020 to ₩1,715 billion in 2021 and slightly offset by a 2.7% decrease in depreciation and amortization expenses from ₩875 billion in 2020 to ₩851 billion in 2021.
The increase in expenses related to employees was attributable mainly to a 7.8% increase in salaries from ₩2,789 billion in 2020 to ₩3,007 billion in 2021, which was primarily due to the full-year effect of the increase in the number of employees in connection with the addition of PRASAC and Bank Bukopin as consolidated subsidiaries of Kookmin Bank in April and September 2020, respectively. Such increase was enhanced by a 6.5% increase in other employee benefits from ₩871 billion in 2020 to ₩928 billion in 2021, which was primarily
123
Table of Contents
driven by an increase in performance-based compensation paid to our employees in 2021, and a 108.2% increase in share-based payments from ₩49 billion in 2020 to ₩102 billion in 2021, which was primarily due to an increase in our share price.
The increase in other general and administrative expenses was attributable mainly to a 12.1% increase in electronic data processing expenses from ₩281 billion in 2020 to ₩315 billion in 2021 and an 8.4% increase in miscellaneous expenses from ₩296 billion in 2020 to ₩321 billion in 2021. Such increases were enhanced by an 8.8% increase in service fees from ₩239 billion in 2020 to ₩260 billion in 2021 and a 65.6% increase in repairs and maintenance expenses from ₩32 billion in 2020 to ₩53 billion in 2021. Such increases were partially offset by an 11.4% decrease in advertising expenses from ₩237 billion in 2020 to ₩210 billion in 2021.
Net Other Operating Expenses
The following table shows, for the periods indicated, the components of our net other operating expenses:
| Year Ended December 31, | Percentage Change | |||||||||||||||||||
| 2020 | 2021 | 2022 | 2021/2020 | 2022/2021 | ||||||||||||||||
| (in billions of Won) | (%) | |||||||||||||||||||
Other operating income | ₩ | 4,757 | ₩ | 4,929 | ₩ | 13,017 | 3.6 | 164.1 | ||||||||||||
Other operating expenses | (6,257 | ) | (6,853 | ) | (15,382 | ) | 9.5 | 124.5 | ||||||||||||
|
|
|
|
|
| |||||||||||||||
Net other operating expenses | ₩ | (1,500 | ) | ₩ | (1,924 | ) | ₩ | (2,366 | ) | 28.3 | 23.0 | |||||||||
|
|
|
|
|
| |||||||||||||||
Comparison of 2022 to 2021
Our net other operating expenses increased 23.0% from ₩1,924 billion in 2021 to ₩2,366 billion in 2022, as a 124.5% increase in other operating expenses from ₩6,853 billion in 2021 to ₩15,382 billion in 2022 outpaced a 164.1% increase in other operating income from ₩4,929 billion in 2021 to ₩13,017 billion in 2022.
Other operating expenses include principally losses on foreign exchange transactions, losses related to financial assets at amortized cost, losses related to financial instruments at fair value through other comprehensive income and miscellaneous other operating expenses. The 124.5% increase in other operating expenses was mainly the result of a 212.9% increase in losses on foreign exchange transactions from ₩3,571 billion in 2021 to ₩11,173 billion in 2022, which was enhanced by a 41.7% increase in miscellaneous other operating expenses from ₩1,626 billion in 2021 to ₩2,304 billion in 2022. The increase in losses on foreign exchange transactions, which was primarily due to higher exchange rate volatility, was more than offset by an increase in gains on foreign exchange transactions, which is recorded as part of other operating income. On a net basis, our net gains on foreign exchange transactions increased 11.4% from ₩307 billion in 2021 to ₩342 billion in 2022. The increase in miscellaneous other operating expenses was mainly due to an increase in losses on risk hedging related to debt instruments and interest rate swaps.
Other operating income includes principally gains on foreign exchange transactions, gains on financial assets at amortized cost, gains on financial instruments at fair value through other comprehensive income and miscellaneous other operating income. The 164.1% increase in other operating income was primarily attributable to a 196.9% increase in gains on foreign exchange transactions from ₩3,878 billion in 2021 to ₩11,515 billion in 2022, which was enhanced by an 80.0% increase in miscellaneous other operating income from ₩754 billion in 2021 to ₩1,357 billion in 2022. The increase in gains on foreign exchange transactions, which was mainly the result of increased exchange rate volatility, was mostly offset by an increase in losses on foreign exchange transactions, which is recorded as part of other operating expenses, as discussed above. The increase in miscellaneous other operating income was mainly due to an increase in gains on risk hedging related to debt instruments and interest rate swaps.
124
Table of Contents
Comparison of 2021 to 2020
Our net other operating expenses increased 28.3% from ₩1,500 billion in 2020 to ₩1,924 billion in 2021, as a 9.5% increase in other operating expenses from ₩6,257 billion in 2020 to ₩6,853 billion in 2021 outpaced a 3.6% increase in other operating income from ₩4,757 billion in 2020 to ₩4,929 billion in 2021.
The 9.5% increase in other operating expenses was mainly the result of a significant increase in losses on financial instruments at fair value through other comprehensive income from ₩19 billion in 2020 to ₩225 billion in 2021, a 42.2% increase in depreciation expenses of operating lease assets from ₩424 billion in 2020 to ₩603 billion in 2021 and a 7.7% increase in miscellaneous other operating expenses from ₩1,510 billion in 2020 to ₩1,626 billion in 2021. The increase in losses on financial instruments at fair value through other comprehensive income was primarily due to an increase in losses relating to the disposal of government and public bonds. The increase in depreciation expenses of operating lease assets mainly reflected an increase in automobile lease assets of KB Capital.
The 3.6% increase in other operating income was primarily attributable to a 6.7% increase in gains on foreign exchange transactions from ₩3,635 billion in 2020 to ₩3,878 billion in 2021, which was enhanced by a 27.4% increase in miscellaneous other operating income from ₩592 billion in 2020 to ₩754 billion in 2021. Such increases were offset in part by a 58.4% decrease in gains on financial instruments at fair value through other comprehensive income from ₩305 billion in 2020 to ₩127 billion in 2021. The increase in gains on foreign exchange transactions, which was mainly the result of increased exchange rate volatility, was partially offset by an increase in losses on foreign exchange transactions, which is recorded as part of other operating expenses. On a net basis, our net gains on foreign exchange transactions increased 195.2% from ₩104 billion in 2020 to ₩307 billion in 2021.
For further information regarding our net other operating expenses, see Note 31 of the notes to our consolidated financial statements included elsewhere in this annual report.
Net Non-operating Income
The following table shows, for the periods indicated, the components of our net non-operating income:
| Year Ended December 31, | Percentage Change | |||||||||||||||||||
| 2020 | 2021 | 2022 | 2021/2020 | 2022/2021 | ||||||||||||||||
| (in billions of Won) | (%) | |||||||||||||||||||
Share of profit (loss) of associates and joint ventures | ₩ | (44 | ) | ₩ | 94 | ₩ | (29 | ) | N/M | (1) | N/M | (1) | ||||||||
Net other non-operating income (expenses) | 189 | (110 | ) | 186 | N/M | (1) | N/M | (1) | ||||||||||||
|
|
|
|
|
| |||||||||||||||
Net non-operating income (expenses) | ₩ | 146 | ₩ | (16 | ) | ₩ | 157 | N/M | (1) | N/M | (1) | |||||||||
|
|
|
|
|
| |||||||||||||||
| (1) | “N/M” means not meaningful. |
Comparison of 2022 to 2021
Our net non-operating income (expenses) changed from net expenses of ₩16 billion in 2021 to a net income of ₩157 billion in 2022, primarily as a result of a change in net other non-operating income (expenses) from net expenses of ₩110 billion in 2021 to a net income of ₩186 billion in 2022, which was partially offset by a change in share of profit (loss) of associates and joint ventures from a net profit of ₩94 billion in 2021 to a net loss of ₩29 billion in 2022.
The change in net other non-operating income (expenses) from net expenses to a net income was attributable to a 272.0% increase in other non-operating income from ₩125 billion in 2021 to ₩465 billion in
125
Table of Contents
2022, which was partially offset by a 19.1% increase in other non-operating expenses from ₩235 billion in 2021 to ₩280 billion in 2022. The increase in other non-operating income was mainly due to a 250.6% increase in miscellaneous other non-operating income from ₩81 billion in 2021 to ₩284 billion in 2022, which primarily reflected an increase in gains on disposal of assets held for sale, as well as a significant increase in gains on disposal of property and equipment from ₩9 billion in 2021 to ₩155 billion in 2022, which was primarily due to an increase in gains on disposal of investment properties. The increase in other non-operating expenses was mainly due to a 50.4% increase in miscellaneous other non-operating expenses from ₩117 billion in 2021 to ₩176 billion in 2022.
The change in share of profit (loss) of associates and joint ventures from a net profit to a net loss was primarily due to a decrease in profit of equity-method investees of Kookmin Bank.
Comparison of 2021 to 2020
Our net non-operating income (expenses) changed from a net income of ₩146 billion in 2020 to net expenses of ₩16 billion in 2021, primarily as a result of a change in net other non-operating income (expenses) from a net income of ₩189 billion in 2020 to net expenses of ₩110 billion in 2021, which was partially offset by a change in share of profit (loss) of associates and joint ventures from a net loss of ₩44 billion in 2020 to a net profit of ₩94 billion in 2021.
The change in net other non-operating income (expenses) from a net income to net expenses was attributable to a 73.2% decrease in other non-operating income from ₩466 billion in 2020 to ₩125 billion in 2021, which was partially offset by a 15.2% decrease in other non-operating expenses from ₩277 billion in 2020 to ₩235 billion in 2021. The decrease in other non-operating income was mainly due to gains on bargain purchase of ₩145 billion recognized in 2020 resulting from the acquisition of Prudential Life Insurance, which was not repeated in 2021, as well as a 91.9% decrease in gains on disposal of property and equipment from ₩111 billion in 2020 to ₩9 billion in 2021, primarily due to a decrease in gains on disposal of investment property held by our consolidated funds. Such decrease was enhanced by a 69.0% decrease in rental income from ₩113 billion in 2020 to ₩35 billion in 2021, primarily due to a decrease in our holdings of investment property that generated rental income. The decrease in other non-operating expenses primarily reflected an 18.8% decrease in miscellaneous other expenses from ₩144 billion in 2020 to ₩117 billion in 2021.
The change in share of profit (loss) of associates and joint ventures from a net loss to a net profit was primarily due to an increase in profit of equity-method investees of Kookmin Bank.
Income Tax Expense
Our income tax expense is calculated by adding or subtracting changes in deferred income tax liabilities and assets to income tax amounts payable for the period. Deferred income tax assets are recognized for deductible temporary differences, unused tax losses and unused tax credits, while deferred income tax liabilities are recognized for taxable temporary differences. Temporary differences are those between the carrying values of assets and liabilities for financial reporting purposes and their respective tax bases. Deferred income tax assets, including unused tax losses and credits, are recognized only to the extent it is probable that sufficient taxable profit will be available against which such deferred income tax assets can be utilized.
Comparison of 2022 to 2021
Income tax expense decreased 4.4% from ₩1,697 billion in 2021 to ₩1,622 billion in 2022, primarily due to a 4.7% decrease in profit before income tax from ₩6,082 billion in 2021 to ₩5,796 billion in 2022, which was enhanced by an increase in income tax refunds for taxes of prior years from ₩14 billion in 2021 to ₩138 billion in 2022. Such effects were offset in part by an increase in temporary differences for which no deferred tax is recognized from ₩5 billion in 2021 to ₩136 billion in 2022. Our effective tax rate was 28.0% in 2022 compared to 27.9% in 2021.
126
Table of Contents
Comparison of 2021 to 2020
Income tax expense increased 34.3% from ₩1,264 billion in 2020 to ₩1,697 billion in 2021, primarily due to a 45.5% increase in income tax payable from ₩1,086 billion in 2020 to ₩1,580 billion in 2021, which was partially offset by a 34.3% decrease in changes in deferred income tax assets and liabilities from ₩327 billion in 2020 to ₩215 billion in 2021 and a 38.3% decrease in income tax recognized directly in equity and others from ₩149 billion in 2020 to ₩92 billion in 2021. The increase in income tax payable was due to a 43.0% increase in current income tax expense from ₩1,099 billion in 2020 to ₩1,572 billion in 2021, which resulted primarily from the increase in our profit before income tax. The decrease in income tax recognized directly in equity and others was primarily attributable to a change in gains or losses on hedging instruments of net investments in foreign operations from net losses of ₩25 billion in 2020 to net gains of ₩26 billion in 2021. Our effective tax rate was 27.9% in 2021 compared to 26.5% in 2020.
See Note 34 of the notes to our consolidated financial statements included elsewhere in this annual report.
Profit for the Year
Comparison of 2022 to 2021
As a result of the factors described above, our profit for the year decreased 4.8% from ₩4,384 billion in 2021 to ₩4,173 billion in 2022.
Comparison of 2021 to 2020
As a result of the factors described above, our profit for the year increased 24.7% from ₩3,516 billion in 2020 to ₩4,384 billion in 2021.
Results by Principal Business Segment
We compile and analyze financial information for our business segments based upon segment information used by our management for the purposes of resource allocation and performance evaluation. We are organized into seven major business segments: retail banking operations, corporate banking operations, other banking operations, credit card operations, securities operations, life insurance operations and non-life insurance operations.
The following table shows, for the periods indicated, our results of operations by segment:
| Profit (Loss)(1) for the Year Ended December 31, | Total Net Operating Revenues (Expenses)(2) for the Year Ended December 31, | |||||||||||||||||||||||
| 2020 | 2021 | 2022 | 2020 | 2021 | 2022 | |||||||||||||||||||
| (in billions of Won) | ||||||||||||||||||||||||
Retail banking operations | ₩ | 421 | ₩ | 577 | ₩ | 1,576 | ₩ | 2,919 | ₩ | 2,958 | ₩ | 4,473 | ||||||||||||
Corporate banking operations | 918 | 1,021 | 1,502 | 2,834 | 3,590 | 4,982 | ||||||||||||||||||
Other banking operations | 980 | 940 | (350 | ) | 1,798 | 1,585 | (188 | ) | ||||||||||||||||
Credit card operations | 324 | 421 | 383 | 1,538 | 1,774 | 1,781 | ||||||||||||||||||
Securities operations | 426 | 594 | 189 | 1,448 | 1,676 | 1,127 | ||||||||||||||||||
Life insurance operations | 33 | 290 | 186 | 237 | 631 | 502 | ||||||||||||||||||
Non-life insurance operations | 177 | 302 | 558 | 1,027 | 1,286 | 1,424 | ||||||||||||||||||
Other | 406 | 332 | 347 | 691 | 984 | 913 | ||||||||||||||||||
|
|
|
|
|
|
|
|
|
|
|
| |||||||||||||
Total(3) | ₩ | 3,686 | ₩ | 4,477 | ₩ | 4,392 | ₩ | 12,492 | ₩ | 14,484 | ₩ | 15,013 | ||||||||||||
|
|
|
|
|
|
|
|
|
|
|
| |||||||||||||
127
Table of Contents
| (1) | After deduction of income tax allocated to each segment. See Note 5 of the notes to our consolidated financial statements. |
| (2) | Represents net operating revenue (expenses) from external customers. See Note 5 of the notes to our consolidated financial statements. |
| (3) | Prior to adjustments for consolidation, inter-segment transactions and certain differences in classification under our management reporting system. |
Our other banking operations, which include treasury activities, provide funding to our retail banking operations and corporate banking operations and receive funds procured through the financing activities of such segments, such as deposit-taking activities. When our retail banking operations or corporate banking operations engage in an investing activity, such as lending, the relevant amount is recognized as an inter-segment borrowing from the other banking operations. When our retail banking operations or corporate banking operations engage in a financing activity, such as deposit-taking, the relevant amount is recognized as an inter-segment lending to the other banking operations (or as a reduction in inter-segment borrowings from the other banking operations). Generally, for our retail banking operations, the amounts procured from financing activities are greater than the amounts used in investing activities, whereas for our corporate banking operations, the amounts used in investing activities are greater than the amounts procured from financing activities. The cost of borrowing from the other banking operations is calculated by multiplying the average balance of the amounts used in investing activities by the applicable internal funding rate on such inter-segment borrowings, whereas the income from lending to the other banking operations is calculated by multiplying the average balance of the amounts procured from financing activities by the applicable internal funding rate on such inter-segment lendings. The applicable internal funding rates on inter-segment borrowings tend to be generally higher than the applicable internal funding rates on inter-segment lendings, primarily due to the difference in the maturity structure of interest rates on the amounts used in investing activities and the amounts procured from financing activities. The cost of borrowing from the other banking operations is offset by the income from lending to the other banking operations, and the difference is recorded as expenses related to inter-segment borrowings, within net other operating expenses, for our retail banking operations and corporate banking operations, while a corresponding amount is recorded as income from inter-segment lending, within net other operating income, for our other banking operations.
Retail Banking Operations
This segment consists of retail banking services provided by Kookmin Bank. The following table shows, for the periods indicated, our income statement data for this segment:
| Year Ended December 31, | Percentage Change | |||||||||||||||||||
| 2020 | 2021 | 2022 | 2021/2020 | 2022/2021 | ||||||||||||||||
| (in billions of Won) | (%) | |||||||||||||||||||
Income statement data | ||||||||||||||||||||
Interest income | ₩ | 4,520 | ₩ | 4,438 | ₩ | 5,764 | (1.8 | ) | 29.9 | |||||||||||
Interest expense | (1,341 | ) | (896 | ) | (1,827 | ) | (33.2 | ) | 103.9 | |||||||||||
Net fee and commission income | 407 | 392 | 261 | (3.7 | ) | (33.4 | ) | |||||||||||||
Net other operating income (expenses) | (666 | ) | (975 | ) | 275 | 46.4 | N/M | (1) | ||||||||||||
General and administrative expenses | (2,073 | ) | (2,037 | ) | (2,093 | ) | (1.7 | ) | 2.7 | |||||||||||
Provision for credit losses | (265 | ) | (126 | ) | (282 | ) | (52.5 | ) | 123.8 | |||||||||||
|
|
|
|
|
| |||||||||||||||
Profit before income tax expense | 581 | 795 | 2,098 | 36.8 | 163.9 | |||||||||||||||
Income tax expense | (160 | ) | (219 | ) | (522 | ) | 36.9 | 138.4 | ||||||||||||
|
|
|
|
|
| |||||||||||||||
Profit for the year | ₩ | 421 | ₩ | 577 | ₩ | 1,576 | 37.1 | 173.1 | ||||||||||||
|
|
|
|
|
| |||||||||||||||
| (1) | “N/M” means not meaningful. |
128
Table of Contents
Comparison of 2022 to 2021
Our profit before income tax expense for this segment increased 163.9% from ₩795 billion in 2021 to ₩2,098 billion in 2022.
Interest income from our retail banking operations increased 29.9% from ₩4,438 billion in 2021 to ₩5,764 billion in 2022. This increase was mainly due to increases in the average yields on other consumer loans, mortgage loans and home equity loans. Such increase was enhanced by an increase in the average volume of mortgage loans but offset in part by a decrease in the average volume of other consumer loans.
Interest expense for this segment increased 103.9% from ₩896 billion in 2021 to ₩1,827 billion in 2022. Our largest and most important funding source is deposits from retail customers, which represent more than half of our total deposits. The increase in interest expense for this segment was mainly due to increases in the average costs on time deposits and demand deposits, the effects of which were enhanced by increases in the average volumes of time deposits and certificates of deposit.
Net fee and commission income attributable to this segment decreased 33.4% from ₩392 billion in 2021 to ₩261 billion in 2022, mainly due to decreases in trust fees for specified money trusts.
Net other operating income (expenses) attributable to this segment changed from net expenses of ₩975 billion in 2021 to net income of ₩275 billion in 2022, primarily due to a decrease in expenses related to inter-segment borrowings.
General and administrative expenses attributable to this segment increased 2.7% from ₩2,037 billion in 2021 to ₩2,093 billion in 2022, primarily due to an increase in common general and administrative expenses allocated to the retail banking segment, which was partially offset by decreases in expenses related to employee benefits and depreciation expenses.
Provision for credit losses increased 123.8% from ₩126 billion in 2021 to ₩282 billion in 2022, mainly due to increases in provision for credit losses of retail loans and unused retail loan commitments, reflecting a deterioration in asset quality of our retail loan portfolio resulting from an increasing likelihood of default by borrowers in light of the rising interest rate levels and a general slowdown in the economy in Korea.
Comparison of 2021 to 2020
Our profit before income tax expense for this segment increased 36.8% from ₩581 billion in 2020 to ₩795 billion in 2021.
Interest income from our retail banking operations decreased 1.8% from ₩4,520 billion in 2020 to ₩4,438 billion in 2021. This decrease was mainly due to decreases in the average yields on mortgage loans, other consumer loans and home equity loans, the effects of which were partially offset by increases in the average volumes of mortgage loans and other consumer loans from 2020 to 2021.
Interest expense for this segment decreased 33.2% from ₩1,341 billion in 2020 to ₩896 billion in 2021. Our largest and most important funding source is deposits from retail customers, which represent more than half of our total deposits. The decrease in interest expense for this segment was mainly due to decreases in the average costs on demand deposits, time deposits and certificates of deposit, the effects of which were enhanced by decreases in the average volumes of time deposits and certificates of deposit and partially offset by an increase in the average volume of demand deposits.
Net fee and commission income attributable to this segment decreased 3.7% from ₩407 billion in 2020 to ₩392 billion in 2021, mainly due to an increase in common fee and commission-related expenses allocated to the retail banking segment.
129
Table of Contents
Net other operating expenses attributable to this segment increased 46.4% from ₩666 billion in 2020 to ₩975 billion in 2021, mainly as a result of an increase in expenses related to inter-segment borrowings and a decrease in gains on sale of loans measured at amortized cost.
General and administrative expenses attributable to this segment decreased 1.7% from ₩2,073 billion in 2020 to ₩2,037 billion in 2021, primarily due to decreases in expenses related to employees and depreciation expenses, which were offset in part by an increase in common general and administrative expenses allocated to the retail banking segment.
Provision for credit losses decreased 52.5% from ₩265 billion in 2020 to ₩126 billion in 2021, mainly due to decreases in provision for credit losses of retail loans and unused retail loan commitments, reflecting an improvement in asset quality of our retail loan portfolio resulting from government policies in support of borrowers adversely impacted by the COVID-19 pandemic in 2021.
Corporate Banking Operations
This segment consists of corporate banking services provided by Kookmin Bank. The following table shows, for the periods indicated, our income statement data for this segment:
| Year Ended December 31, | Percentage Change | |||||||||||||||||||
| 2020 | 2021 | 2022 | 2021/2020 | 2022/2021 | ||||||||||||||||
| (in billions of Won) | (%) | |||||||||||||||||||
Income statement data | ||||||||||||||||||||
Interest income | ₩ | 4,900 | ₩ | 5,318 | ₩ | 7,831 | 8.5 | 47.3 | ||||||||||||
Interest expense | (1,662 | ) | (1,515 | ) | (3,111 | ) | (8.8 | ) | 105.3 | |||||||||||
Net fee and commission income | 363 | 391 | 386 | 7.7 | (1.3 | ) | ||||||||||||||
Net gains (losses) on financial instruments at fair value through profit or loss | (52 | ) | 29 | 74 | N/M | (1) | 155.2 | |||||||||||||
Net other operating expenses | (537 | ) | (598 | ) | (182 | ) | 11.4 | (69.6 | ) | |||||||||||
General and administrative expenses | (1,555 | ) | (1,832 | ) | (1,972 | ) | 17.8 | 7.6 | ||||||||||||
Provision for credit losses | (204 | ) | (393 | ) | (778 | ) | 92.6 | 98.0 | ||||||||||||
Net other non-operating income (expenses) | 5 | (9 | ) | (13 | ) | N/M | (1) | 44.4 | ||||||||||||
|
|
|
|
|
| |||||||||||||||
Profit before income tax expense | 1,258 | 1,390 | 2,234 | 10.5 | 60.7 | |||||||||||||||
Income tax expense | (340 | ) | (369 | ) | (732 | ) | 8.5 | 98.4 | ||||||||||||
|
|
|
|
|
| |||||||||||||||
Profit for the year | ₩ | 918 | ₩ | 1,021 | ₩ | 1,502 | 11.2 | 47.1 | ||||||||||||
|
|
|
|
|
| |||||||||||||||
| (1) | “N/M” means not meaningful. |
Comparison of 2022 to 2021
Our profit before income tax expense for this segment increased 60.7% from ₩1,390 billion in 2021 to ₩2,234 billion in 2022.
Interest income from our corporate banking operations increased 47.3% from ₩5,318 billion in 2021 to ₩7,831 billion in 2022. This increase was primarily due to an increase in the average yields on corporate loans of Kookmin Bank, which was enhanced by an increase in the average volume of such loans.
Interest expense for this segment increased 105.3% from ₩1,515 billion in 2021 to ₩3,111 billion in 2022. This increase was principally due to an increase in the average cost of deposits held by corporate customers of Kookmin Bank, which was enhanced by an increase in the average volume of such deposits.
130
Table of Contents
Net fee and commission income attributable to this segment decreased 1.3% from ₩391 billion in 2021 to ₩386 billion in 2022, primarily due to a decrease in investment finance fees received, which was offset in part by an increase in foreign currency transaction fees received.
Net gains on financial instruments at fair value through profit or loss attributable to this segment increased 155.2% from ₩29 billion in 2021 to ₩74 billion in 2022, principally as a result of increases in net gains on currency-related derivatives held by Kookmin Bank’s foreign subsidiaries and net gains on fair value hedges.
Net other operating expenses attributable to this segment decreased 69.6% from ₩598 billion in 2021 to ₩182 billion in 2022, mainly as a result of a decrease in expenses related to inter-segment borrowings, which was offset in part by an increase in losses on sales of loans of Bank Bukopin, a foreign subsidiary of Kookmin Bank.
General and administrative expenses attributable to this segment increased 7.6% from ₩1,832 billion in 2021 to ₩1,972 billion in 2022, principally due to an increase in common administrative expenses allocated to the corporate banking segment.
Provision for credit losses attributable to this segment increased 98.0% from ₩393 billion in 2021 to ₩778 billion in 2022, due mainly to an increase in provisions for credit losses of foreign-currency loans of Kookmin Bank’s foreign subsidiaries, due to a deterioration in the credit quality of such loans.
Net other non-operating expenses attributable to this segment increased 44.4% from ₩9 billion in 2021 to ₩13 billion in 2022, mainly attributable to regulatory fines paid by one of Kookmin Bank’s foreign branches, which was offset in part by an increase in miscellaneous other non-operating expenses of Bank Bukopin, a foreign subsidiary of Kookmin Bank.
Comparison of 2021 to 2020
Our profit before income tax expense for this segment increased 10.5% from ₩1,258 billion in 2020 to ₩1,390 billion in 2021.
Interest income from our corporate banking operations increased 8.5% from ₩4,900 billion in 2020 to ₩5,318 billion in 2021. This increase was primarily due to the full-year effect of the addition of PRASAC and Bank Bukopin as consolidated subsidiaries of Kookmin Bank in April and September 2020, respectively. Such effect was enhanced by an increase in the average volume of corporate loans of Kookmin Bank, which was partially offset by a decrease the average yields on such loans from 2020 to 2021.
Interest expense for this segment decreased 8.8% from ₩1,662 billion in 2020 to ₩1,515 billion in 2021. This decrease was principally due to a decrease in the average cost of deposits held by corporate customers of Kookmin Bank from 2020 to 2021, which was partially offset by an increase in the average volume of such deposits and the full-year effect of the addition of PRASAC and Bank Bukopin, which became consolidated subsidiaries of Kookmin Bank in April and September 2020, respectively.
Net fee and commission income attributable to this segment increased 7.7% from ₩363 billion in 2020 to ₩391 billion in 2021, primarily due to increases in trust and other fiduciary fees received and foreign currency-related fees received.
Net gains (losses) on financial instruments at fair value through profit or loss attributable to this segment changed from net losses of ₩52 billion in 2020 to net gains of ₩29 billion in 2021, principally as a result of an increase in net gains on currency-related derivatives held by Kookmin Bank’s foreign subsidiaries.
Net other operating expenses attributable to this segment increased 11.4% from ₩537 billion in 2020 to ₩598 billion in 2021, mainly as a result of an increase in losses on foreign exchange transactions of Kookmin Bank’s foreign subsidiaries.
131
Table of Contents
General and administrative expenses attributable to this segment increased 17.8% from ₩1,555 billion in 2020 to ₩1,832 billion in 2021, principally due to an increase in salary expenses resulting from the full-year effect of the additions of PRASAC and Bank Bukopin as consolidated subsidiaries of Kookmin Bank in April and September 2020, respectively, the effects of which were enhanced by an increase in common administrative expenses allocated to the corporate banking segment.
Provision for credit losses attributable to this segment increased 92.6% from ₩204 billion in 2020 to ₩393 billion in 2021, due mainly to an increase in provision for credit losses of foreign-currency loans of Bank Bukopin, which was added as a consolidated subsidiary of Kookmin Bank in September 2020.
Net other non-operating income (expenses) attributable to this segment changed from a net income of ₩5 billion in 2020 to net expenses of ₩9 billion in 2021, mainly due to a decrease in net other non-operating income of Bank Bukopin, which became a consolidated subsidiary of Kookmin Bank in September 2020.
Other Banking Operations
This segment primarily consists of Kookmin Bank’s banking operations other than retail and corporate banking operations, including treasury activities and Kookmin Bank’s “back office” administrative operations. The following table shows, for the periods indicated, our income statement data for this segment:
| Year Ended December 31, | Percentage Change | |||||||||||||||||||
| 2020 | 2021 | 2022 | 2021/2020 | 2022/2021 | ||||||||||||||||
| (in billions of Won) | (%) | |||||||||||||||||||
Income statement data | ||||||||||||||||||||
Interest income | ₩ | 1,037 | ₩ | 919 | ₩ | 1,763 | (11.4 | ) | 91.8 | |||||||||||
Interest expense | (698 | ) | (534 | ) | (1,130 | ) | (23.5 | ) | 111.6 | |||||||||||
Net fee and commission income | 298 | 405 | 449 | 35.9 | 10.9 | |||||||||||||||
Net gains on financial instruments at fair value through profit or loss | 297 | 313 | 137 | 5.4 | (56.2 | ) | ||||||||||||||
Net other operating income (expenses) | 973 | 754 | (1,037 | ) | (22.5 | ) | N/M | (1) | ||||||||||||
General and administrative expenses | (574 | ) | (534 | ) | (633 | ) | (7.0 | ) | 18.5 | |||||||||||
Provision for credit losses | (15 | ) | (4 | ) | (61 | ) | (73.3 | ) | N/M | (1) | ||||||||||
Share of profit (loss) of associates and joint ventures | (48 | ) | 57 | 13 | N/M | (1) | (77.2 | ) | ||||||||||||
Net other non-operating income (expenses) | 23 | (70 | ) | (25 | ) | N/M | (1) | (64.3 | ) | |||||||||||
|
|
|
|
|
| |||||||||||||||
Profit (loss) before income tax expense | 1,293 | 1,306 | (523 | ) | 1.0 | N/M | (1) | |||||||||||||
Income tax benefit (expense) | (313 | ) | (366 | ) | 173 | 16.9 | N/M | (1) | ||||||||||||
|
|
|
|
|
| |||||||||||||||
Profit (Loss) for the year | ₩ | 980 | ₩ | 940 | ₩ | (350 | ) | (4.1 | ) | N/M | (1) | |||||||||
|
|
|
|
|
| |||||||||||||||
| (1) | “N/M” means not meaningful. |
Comparison of 2022 to 2021
Our profit (loss) before income tax expense for this segment changed from a profit of ₩1,306 billion in 2021 to a loss of ₩523 billion in 2022.
132
Table of Contents
Interest income from our other banking operations increased 91.8% from ₩919 billion in 2021 to ₩1,763 billion in 2022, mainly due to increases in the average yields on other banking loans and debt securities in this segment, which were enhanced by increases in the average volumes of such loans and securities.
Interest expense for this segment increased 111.6% from ₩534 billion in 2021 to ₩1,130 billion in 2022, primarily due to increases in the average costs of deposits, borrowings and debentures in this segment, which were enhanced by increases in the average volumes of such deposits, borrowings and debentures.
Net fee and commission income attributable to this segment increased 10.9% from ₩405 billion in 2021 to ₩449 billion in 2022, mainly due to an increase in net fee and commission income from our funds and trusts in this segment.
Net gains on financial instruments at fair value through profit or loss attributable to this segment decreased 56.2% from ₩313 billion in 2021 to ₩137 billion in 2022, principally as a result of a decrease in net gains on financial instruments at fair value through profit or loss attributable to our funds and trusts in this segment.
Net other operating income (expenses) attributable to this segment changed from a net income of ₩754 billion in 2021 to net expenses of ₩1,037 billion in 2022, mainly as a result of an increase in net expenses related to inter-segment borrowings.
General and administrative expenses attributable to this segment increased 18.5% from ₩534 billion in 2021 to ₩633 billion in 2022, primarily due to an increase in salary expenses.
Provision for credit losses attributable to this segment increased from ₩4 billion in 2021 to ₩61 billion in 2022, due mainly to an increase in provisions for credit losses of loans in foreign currencies held by one of our consolidated subsidiaries.
Share of profit of associates and joint ventures attributable to this segment decreased 77.2% from ₩57 billion in 2021 to ₩13 billion in 2022, principally as a result of a decrease in profits of equity-method investees of Kookmin Bank.
Net other non-operating expenses attributable to this segment decreased 64.3% from ₩70 billion in 2021 to ₩25 billion in 2022, primarily due to an increase in dividend income from equity-method investments.
Comparison of 2021 to 2020
Our profit before income tax expense for this segment increased 1.0% from ₩1,293 billion in 2020 to ₩1,306 billion in 2021.
Interest income from our other banking operations decreased 11.4% from ₩1,037 billion in 2020 to ₩919 billion in 2021, mainly due to decreases in the average yields on other banking loans and debt securities in this segment from 2020 to 2021, which were offset in part by increases in the average volumes of such loans and securities.
Interest expense for this segment decreased 23.5% from ₩698 billion in 2020 to ₩534 billion in 2021, primarily due to decreases in the average costs of deposits, borrowings and debentures in this segment, which were partially offset by increases in the average volumes of deposits, borrowings and debentures.
Net fee and commission income attributable to this segment increased 35.9% from ₩298 billion in 2020 to ₩405 billion in 2021, mainly due to an increase in net fee and commission income from our funds and trusts in this segment.
133
Table of Contents
Net gains on financial instruments at fair value through profit or loss attributable to this segment increased 5.4% from ₩297 billion in 2020 to ₩313 billion in 2021, principally as a result of increases in net gains on derivatives held for trading and other financial instruments, which were partially offset by a decrease in net gains on financial instruments including debt and equity securities.
Net other operating income attributable to this segment decreased 22.5% from ₩973 billion in 2020 to ₩754 billion in 2021, mainly as a result of a decrease in net gains on foreign exchange transactions.
General and administrative expenses attributable to this segment decreased 7.0% from ₩574 billion in 2020 to ₩534 billion in 2021, primarily due to a decrease in common administrative expenses allocated to this segment, which was partially offset by increases in sales promotion expenses and advertising expenses.
Provision for credit losses attributable to this segment decreased from ₩15 billion in 2020 to ₩4 billion in 2021, due mainly to decreases in provision for credit losses of foreign-currency loans in this segment.
Share of profit (loss) of associates and joint ventures attributable to this segment changed from a net loss of ₩48 billion in 2020 to a net profit of ₩57 billion in 2021, principally as a result of an increase in gains on disposal of investments in associates and joint ventures in 2021.
Net other non-operating income (expenses) attributable to this segment changed from a net income of ₩23 billion in 2020 to net expenses of ₩70 billion in 2021, primarily due to a decrease in gains on disposal of investment property, which was partially offset by an increase in dividend income from investments in associates and joint ventures.
Credit Card Operations
This segment consists of credit card activities conducted by KB Kookmin Card. The following table shows, for the periods indicated, our income statement data for this segment:
| Year Ended December 31, | Percentage Change | |||||||||||||||||||
| 2020 | 2021 | 2022 | 2021/2020 | 2022/2021 | ||||||||||||||||
| (in billions of Won) | (%) | |||||||||||||||||||
Income statement data | ||||||||||||||||||||
Interest income | ₩ | 1,632 | ₩ | 1,768 | ₩ | 1,984 | 8.3 | 12.2 | ||||||||||||
Interest expense | (366 | ) | (377 | ) | (510 | ) | 3.0 | 35.3 | ||||||||||||
Net fee and commission income | 400 | 546 | 520 | 36.5 | (4.8 | ) | ||||||||||||||
Net insurance income | 13 | 12 | 11 | (7.7 | ) | (8.3 | ) | |||||||||||||
Net gains on financial instruments at fair value through profit or loss | 6 | 3 | 2 | (50.0 | ) | (33.3 | ) | |||||||||||||
Net other operating expenses | (331 | ) | (336 | ) | (375 | ) | 1.5 | 11.6 | ||||||||||||
General and administrative expenses | (515 | ) | (578 | ) | (597 | ) | 12.2 | 3.3 | ||||||||||||
Provision for credit losses | (396 | ) | (465 | ) | (500 | ) | 17.4 | 7.5 | ||||||||||||
Share of profit of associates and joint ventures | 1 | 1 | 2 | 0.0 | 100.0 | |||||||||||||||
Net other non-operating expenses | (6 | ) | (7 | ) | (7 | ) | 16.7 | 0.0 | ||||||||||||
|
|
|
|
|
| |||||||||||||||
Profit before income tax expense | 438 | 566 | 527 | 29.2 | (6.9 | ) | ||||||||||||||
Income tax expense | (114 | ) | (145 | ) | (144 | ) | 27.2 | (0.7 | ) | |||||||||||
|
|
|
|
|
| |||||||||||||||
Profit for the year | ₩ | 324 | ₩ | 421 | ₩ | 383 | 29.9 | (9.0 | ) | |||||||||||
|
|
|
|
|
| |||||||||||||||
134
Table of Contents
Comparison of 2022 to 2021
Our profit before income tax expense for this segment decreased 6.9% from ₩566 billion in 2021 to ₩527 billion in 2022.
Interest income from our credit card operations increased 12.2% from ₩1,768 billion in 2021 to ₩1,984 billion in 2022. This increase was primarily due to an increase in the average volume of credit card receivables, which was offset in part by a decrease in the average yields on such receivables.
Interest expense for this segment increased 35.3% from ₩377 billion in 2021 to ₩510 billion in 2022. This increase was primarily due to increases in the average costs of debentures and borrowings issued by KB Kookmin Card, which were enhanced by increases in the average volumes of such debentures and borrowings.
Net fee and commission income attributable to this segment decreased 4.8% from ₩546 billion in 2021 to ₩520 billion in 2022, mainly due to a decrease in commissions related to payment gateways received, which was offset in part by a decrease in credit card commissions paid in Korean Won.
Net insurance income attributable to this segment decreased 8.3% from ₩12 billion in 2021 to ₩11 billion in 2022, which was primarily caused by a decrease in the number of customers using related services.
Net gains on financial instruments at fair value through profit or loss attributable to this segment decreased 33.3% from ₩3 billion in 2021 to ₩2 billion in 2022, primarily due to a decrease in gains on valuation of equity securities.
Net other operating expenses attributable to this segment increased 11.6% from ₩336 billion in 2021 to ₩375 billion in 2022, due to a decrease in gains on sales of loans measured at amortized cost and an increase in credit card reward program-related expenses.
General and administrative expenses attributable to this segment increased 3.3% from ₩578 billion in 2021 to ₩597 billion in 2022, mainly due to increases in salary expenses and software depreciation expenses.
Provision for credit losses attributable to this segment increased 7.5% from ₩465 billion in 2021 to ₩500 billion in 2022, mainly due to increases in provision for credit losses of card loans and installment loans.
Share of profit of associates and joint ventures attributable to this segment increased 100.0% from ₩1 billion in 2021 to ₩2 billion in 2022, primarily due to an increase in gains on valuation of equity-method investees.
Net other non-operating expenses attributable to this segment remained stable at ₩7 billion in 2021 and 2022.
Comparison of 2021 to 2020
Our profit before income tax expense for this segment increased 29.2% from ₩438 billion in 2020 to ₩566 billion in 2021.
Interest income from our credit card operations increased 8.3% from ₩1,632 billion in 2020 to ₩1,768 billion in 2021. This increase was primarily due to an increase in the average volume of credit card receivables, which was offset in part by a decrease in the average yields on such receivables.
Interest expense for this segment increased 3.0% from ₩366 billion in 2020 to ₩377 billion in 2021. This increase was primarily due to increases in the average volumes of debentures and borrowings issued by KB Kookmin Card, which were partially offset by decreases in the average costs of such debentures and borrowings.
135
Table of Contents
Net fee and commission income attributable to this segment increased 36.5% from ₩400 billion in 2020 to ₩546 billion in 2021, mainly due to increases in commissions relating to payment gateways received and decreases in credit card commissions paid and other fees paid in Korean Won.
Net insurance income attributable to this segment decreased 7.7% from ₩13 billion in 2020 to ₩12 billion in 2021, which was primarily caused by a decrease in the number of new customers using related services.
Net gains on financial instruments at fair value through profit or loss attributable to this segment decreased 50.0% from ₩6 billion in 2020 to ₩3 billion in 2021, primarily due to decreases in dividend income from equity securities and, to a lesser extent, gains on disposal of investment trust beneficiary certificates.
Net other operating expenses attributable to this segment increased 1.5% from ₩331 billion in 2020 to ₩336 billion in 2021, primarily due to an increase in membership reward program-related expenses, which were offset in part by an increase in net gains on sale of loans at amortized cost.
General and administrative expenses attributable to this segment increased 12.2% from ₩515 billion in 2020 to ₩578 billion in 2021, mainly due to an increase in salary and employee benefit expenses in this segment.
Provision for credit losses attributable to this segment increased 17.4% from ₩396 billion in 2020 to ₩465 billion in 2021, mainly due to increases in provision for card loans and foreign-currency loans.
Share of profit of associates and joint ventures attributable to this segment remained stable at ₩1 billion in 2020 and 2021.
Net other non-operating expenses attributable to this segment increased 16.7% from ₩6 billion in 2020 to ₩7 billion in 2021.
Securities Operations
This segment consists primarily of securities brokerage, investment banking, securities investment and trading and other capital markets activities conducted by KB Securities, including its predecessor entities. The following table shows, for the periods indicated, our income statement data for this segment:
| Year Ended December 31, | Percentage Change | |||||||||||||||||||
| 2020 | 2021 | 2022 | 2021/2020 | 2022/2021 | ||||||||||||||||
| (in billions of Won) | (%) | |||||||||||||||||||
Income statement data | ||||||||||||||||||||
Interest income | ₩ | 820 | ₩ | 825 | ₩ | 1,157 | 0.6 | 40.2 | ||||||||||||
Interest expense | (310 | ) | (268 | ) | (618 | ) | (13.5 | ) | 130.6 | |||||||||||
Net fee and commission income | 917 | 1,015 | 785 | 10.7 | (22.7 | ) | ||||||||||||||
Net gains (losses) from financial instruments at fair value through profit or loss | 118 | 123 | (211 | ) | 4.2 | N/M | (1) | |||||||||||||
Net other operating expenses | (103 | ) | (7 | ) | (24 | ) | (93.2 | ) | 242.9 | |||||||||||
General and administrative expenses | (845 | ) | (855 | ) | (822 | ) | 1.2 | (3.9 | ) | |||||||||||
Provision for credit losses | (24 | ) | (18 | ) | (28 | ) | (25.0 | ) | 55.6 | |||||||||||
Share of profit of associates and joint ventures | 4 | 14 | 3 | 250.0 | (78.6 | ) | ||||||||||||||
Net other non-operating income (expenses) | 4 | (18 | ) | 13 | N/M | (1) | N/M | (1) | ||||||||||||
|
|
|
|
|
| |||||||||||||||
Profit before income tax expense | 582 | 810 | 253 | 39.2 | (68.8 | ) | ||||||||||||||
Income tax expense | (156 | ) | (215 | ) | (64 | ) | 37.8 | (70.2 | ) | |||||||||||
|
|
|
|
|
| |||||||||||||||
Profit for the year | ₩ | 426 | ₩ | 594 | ₩ | 189 | 39.4 | (68.2 | ) | |||||||||||
|
|
|
|
|
| |||||||||||||||
| (1) | “N/M” means not meaningful. |
136
Table of Contents
Comparison of 2022 to 2021
Our profit before income tax expense for this segment decreased 68.8% from ₩810 billion in 2021 to ₩253 billion in 2022.
Interest income from this segment increased 40.2% from ₩825 billion in 2021 to ₩1,157 billion in 2022, primarily due to increases in the average yields on deposits and other interest-earning assets held by KB Securities, which were enhanced by increases in the average volumes of such financial assets.
Interest expense for this segment increased 130.6% from ₩268 billion in 2021 to ₩618 billion in 2022, principally as a result of increases in the average costs on bonds sold under repurchase agreements, borrowings and debentures, which were enhanced by increases in the average volumes of borrowings and debentures, but partially offset by a decrease in the average volume of bonds sold under repurchase agreements.
Net fee and commission income attributable to this segment decreased 22.7% from ₩1,015 billion in 2021 to ₩785 billion in 2022, primarily due to a decrease in securities brokerage commissions received, resulting from a decrease in the volume of activity in the Korean securities trading market in 2022.
Net gains (losses) on financial instruments at fair value through profit or loss attributable to this segment changed from net gains of ₩123 billion in 2021 to net losses of ₩211 billion in 2022, principally due to increases in net losses on sales and valuations of debt instruments.
Net other operating expenses attributable to this segment increased 242.9% from ₩7 billion in 2021 to ₩24 billion in 2022, primarily due to an increase in net losses on foreign currency valuation with respect to foreign currency-denominated assets and liabilities, mainly as a result of a depreciation of the Korean Won against other foreign currencies.
General and administrative expenses attributable to this segment decreased 3.9% from ₩855 billion in 2021 to ₩822 billion in 2022, primarily due to a decrease in salaries paid, which was partially offset by increases in depreciation and amortization expenses and other administrative expenses.
Provision for credit losses increased 55.6% from ₩18 billion in 2021 to ₩28 billion in 2022, primarily due to increases in provision for credit losses of loans and other financial assets.
Share of profit of associates and joint ventures attributable to this segment decreased 78.6% from ₩14 billion in 2021 to ₩3 billion in 2022, mainly due to a decrease in gains on disposal of investments in associates and joint ventures and an increase in losses on valuation of equity-method investees.
Net other non-operating income (expenses) attributable to this segment changed from net expenses of ₩18 billion in 2021 to net income of ₩13 billion in 2022, mainly due to an increase in miscellaneous other non-operating income, which was partially offset by an increase in miscellaneous other non-operating expenses.
Comparison of 2021 to 2020
Our profit before income tax expense for this segment increased 39.2% from ₩582 billion in 2020 to ₩810 billion in 2021.
Interest income from this segment increased 0.6% from ₩820 billion in 2020 to ₩825 billion in 2021, primarily due to increases in the average volumes of deposits and other interest-earning assets held by KB Securities, which were partially offset by decreases in the average yields on such financial assets.
Interest expense for this segment decreased 13.5% from ₩310 billion in 2020 to ₩268 billion in 2021, principally as a result of decreases in the average costs of bonds sold under repurchase agreements, borrowings and debentures, which were partially offset by increases in the average volumes of borrowings and bonds sold under repurchase agreements.
137
Table of Contents
Net fee and commission income attributable to this segment increased 10.7% from ₩917 billion in 2020 to ₩1,015 billion in 2021, primarily due to increases in securities brokerage commissions received and consulting fees received.
Net gains on financial instruments at fair value through profit or loss attributable to this segment increased 4.2% from ₩118 billion in 2020 to ₩123 billion in 2021, principally due to a decrease in losses on derivative-linked securities at fair value through profit or loss, which was partially offset by a decrease in gains related to derivatives.
Net other operating expenses attributable to this segment decreased 93.2% from ₩103 billion in 2020 to ₩7 billion in 2021, primarily due to a decrease in net losses on foreign currency transactions with respect to foreign currency-denominated assets and liabilities, mainly as a result of increased exchange rate volatility.
General and administrative expenses attributable to this segment increased 1.2% from ₩845 billion in 2020 to ₩855 billion in 2021, primarily due to increases in salaries paid, which were partially offset by decreases in depreciation and amortization expenses and other administrative expenses.
Provision for credit losses decreased 25.0% from ₩24 billion in 2020 to ₩18 billion in 2021, primarily due to a decrease in provision for credit losses of other financial assets, which was partially offset by an increase in provision for credit losses of loans.
Share of profit of associates and joint ventures attributable to this segment increased more than two-fold from ₩4 billion in 2020 to ₩14 billion in 2021, mainly due to an increase in gains on disposal of investments in associates and joint ventures, which was partially offset by a decrease in profit of associates and joint ventures.
Net other non-operating income (expenses) attributable to this segment changed from a net income of ₩4 billion in 2020 to net expenses of ₩18 billion in 2021, mainly due to decreases in gains on disposal of investment property and rental income, which were offset in part by a decrease in other non-operating expenses.
138
Table of Contents
Life Insurance Operations
This segment consists of the life insurance operations of the Former KB Life Insurance and Prudential Life Insurance, which merged into KB Life Insurance in January 2023. The following table shows, for the periods indicated, our income statement data for this segment:
| Year Ended December 31, | Percentage Change | |||||||||||||||||||
| 2020 | 2021 | 2022 | 2021/2020 | 2022/2021 | ||||||||||||||||
| (in billions of Won) | (%) | |||||||||||||||||||
Income statement data | ||||||||||||||||||||
Interest income | ₩ | 261 | ₩ | 524 | ₩ | 566 | 100.8 | 8.0 | ||||||||||||
Interest expense | — | (4 | ) | (11 | ) | N/A | (1) | 175.0 | ||||||||||||
Net fee and commission expense | (18 | ) | (27 | ) | (39 | ) | 50.0 | % | 44.4 | |||||||||||
Net insurance income (expenses) | (91 | ) | 57 | 39 | N/M | (2) | (31.6 | ) | ||||||||||||
Net gains on financial instruments at fair value through profit or loss | 71 | 137 | 67 | 93.0 | (51.1 | ) | ||||||||||||||
Net other operating income (expenses) | 5 | (63 | ) | (150 | ) | N/M | (2) | 138.1 | ||||||||||||
General and administrative expenses | (152 | ) | (203 | ) | (225 | ) | 33.6 | 10.8 | ||||||||||||
Reversal of provision for credit losses | — | 2 | 1 | N/A | (1) | (50.0 | ) | |||||||||||||
Net other non-operating income (expenses) | (16 | ) | (0 | ) | (0 | ) | (100.0 | ) | N/A | (1) | ||||||||||
|
|
|
|
|
| |||||||||||||||
Profit before income tax expense | 60 | 422 | 248 | 603.3 | (41.2 | ) | ||||||||||||||
Income tax expense(3) | (27 | ) | (133 | ) | (62 | ) | 392.6 | (53.4 | ) | |||||||||||
|
|
|
|
|
| |||||||||||||||
Profit for the year | ₩ | 33 | ₩ | 290 | ₩ | 186 | 778.8 | (35.9 | ) | |||||||||||
|
|
|
|
|
| |||||||||||||||
| (1) | “N/A” means not applicable. |
| (2) | “N/M” means not meaningful. |
| (3) | Represents income tax attributable to the Former KB Life Insurance and Prudential Life Insurance from August 2020. |
Comparison of 2022 to 2021
Our profit before income tax expense for this segment decreased 41.2% from ₩422 billion in 2021 to ₩248 billion in 2022.
Interest income from this segment increased 8.0% from ₩524 billion in 2021 to ₩566 billion in 2022, primarily due to increases in the interest income on government and public bonds, debentures and insurance policy loans held by Prudential Life Insurance.
Interest expense for this segment increased 175.0% from ₩4 billion in 2021 to ₩11 billion in 2022, principally due to the Former KB Life Insurance’s issuance of new bonds sold under repurchase agreements.
Net fee and commission expense attributable to this segment increased 44.4% from ₩27 billion in 2021 to ₩39 billion in 2022, primarily due to increases in miscellaneous other service fees paid and consulting fees paid.
Net insurance income attributable to this segment decreased 31.6% from ₩57 billion in 2021 to ₩39 billion in 2022, mainly due to increases in the Former KB Life Insurance’s expenses related to refunds of surrender value and other insurance expenses, the effects of which were offset in large part by an increase in insurance premium income received by the Former KB Life Insurance.
Net gains on financial instruments at fair value through profit or loss attributable to this segment decreased 51.1% from ₩137 billion in 2021 to ₩67 billion in 2022, primarily due to an increase in losses on valuations of investment trust beneficiary certificates and a decrease in gains on sales of equity securities.
Net other operating expenses attributable to this segment increased 138.1% from ₩63 billion in 2021 to ₩150 billion in 2022, principally due to a decrease in gains on valuation of foreign currency-denominated assets and liabilities, and an increase in losses on currency forward contracts held by Prudential Life Insurance.
139
Table of Contents
General and administrative expenses attributable to this segment increased 10.8% from ₩203 billion in 2021 to ₩225 billion in 2022, primarily due to increases in the IT expenses and advertising expenses of Prudential Life Insurance.
Reversal of provisions for credit losses decreased 50.0% from ₩2 billion in 2021 to ₩1 billion in 2022, mainly due to a decrease in reversal of provisions for credit losses relating to loans in Korean Won.
Comparison of 2021 to 2020
Our profit before income tax expense for this segment increased 603.3% from ₩60 billion in 2020 to ₩422 billion in 2021.
Interest income from this segment increased 100.8% from ₩261 billion in 2020 to ₩524 billion in 2021, primarily due to the additional interest income attributable to the full-year effect of the addition of Prudential Life Insurance as a consolidated subsidiary in August 2020.
Interest expense for this segment increased from nil in 2020 to ₩4 billion in 2021, principally due to interest expense incurred by the Former KB Life Insurance in connection with its issuance of long-term financial debentures in Korean Won in 2021.
Net fee and commission expense attributable to this segment increased 50.0% from ₩18 billion in 2020 to ₩27 billion in 2021, primarily due to increases in trading activity-related fees paid and outsourcing-related fees paid.
Net insurance income (expenses) attributable to this segment changed from net expenses of ₩91 billion in 2020 to a net income of ₩57 billion in 2021, mainly due to the full-year effect of the addition of Prudential Life Insurance as a consolidated subsidiary in August 2020, as well as an increase in life insurance income from the Former KB Life Insurance. Such increases were offset in part by an increase in insurance expenses, which was mainly due to an increase in the Former KB Life Insurance’s insurance expenses and the full-year effect of the addition of Prudential Life Insurance as a consolidated subsidiary in August 2020, as discussed above.
Net gains on financial instruments at fair value through profit or loss attributable to this segment increased 93.0% from ₩71 billion in 2020 to ₩137 billion in 2021, primarily due to the full-year effect of the addition of Prudential Life Insurance as a consolidated subsidiary in August 2020, which consisted mostly of increases in gains on sale of equity securities and dividend income, as well as an increase in dividends received from investment trust beneficiary certificates held by the Former KB Life Insurance.
Net other operating income (expenses) attributable to this segment changed from a net income of ₩5 billion in 2020 to net expenses of ₩63 billion in 2021, principally due to the full-year effect of the addition of Prudential Life Insurance as a consolidated subsidiary in August 2020, which consisted mostly of increases in losses on disposal of debt securities at fair value through other comprehensive income and decreases in gains on disposal of debt securities at fair value through other comprehensive income.
General and administrative expenses attributable to this segment increased 33.6% from ₩152 billion in 2020 to ₩203 billion in 2021, primarily due to the full-year effect of the addition of Prudential Life Insurance as a consolidated subsidiary in August 2020, which consisted mostly of increases in other expenses, depreciation expenses and salary expenses in this segment.
Reversal of credit losses increased from nil in 2020 to ₩2 billion in 2021, mainly due to an increase in reversal of credit losses relating to loans in Korean Won.
Net other non-operating expenses decreased from ₩16 billion in 2020 to nil in 2021, primarily due to the provision for legal proceedings of the Former KB Life Insurance relating to a dispute over the payment of annuities in 2020, which were not repeated in 2021.
140
Table of Contents
Non-Life Insurance Operations
This segment consists of the non-life insurance operations of KB Insurance. The following table shows, for the periods indicated, our income statement data for this segment:
| Year Ended December 31, | Percentage Change | |||||||||||||||||||
| 2020 | 2021 | 2022 | 2021/2020 | 2022/2021 | ||||||||||||||||
| (in billions of Won) | (%) | |||||||||||||||||||
Income statement data | ||||||||||||||||||||
Interest income | ₩ | 617 | ₩ | 635 | ₩ | 718 | 2.9 | 13.1 | ||||||||||||
Interest expense | (1 | ) | (10 | ) | (24 | ) | N/M | (1) | 140.0 | |||||||||||
Net fee and commission expense | (171 | ) | (173 | ) | (190 | ) | 1.2 | 9.8 | ||||||||||||
Net insurance income | 377 | 493 | 655 | 30.8 | 32.9 | |||||||||||||||
Net gains on financial instruments at fair value through profit or loss | 259 | 370 | 340 | 42.9 | (8.1 | ) | ||||||||||||||
Net other operating expenses | (48 | ) | (82 | ) | (104 | ) | 70.8 | 26.8 | ||||||||||||
General and administrative expenses | (811 | ) | (834 | ) | (849 | ) | 2.8 | 1.8 | ||||||||||||
Reversal of (provision for) credit losses | 8 | (5 | ) | (6 | ) | (162.5 | ) | 20.0 | ||||||||||||
Net other non-operating income | 16 | 17 | 190 | 6.3 | N/M | (1) | ||||||||||||||
|
|
|
|
|
| |||||||||||||||
Profit before income tax expense | 246 | 411 | 730 | 67.1 | 77.6 | |||||||||||||||
Income tax expense | (69 | ) | (109 | ) | (172 | ) | 58.0 | 57.8 | ||||||||||||
|
|
|
|
|
| |||||||||||||||
Profit for the year | ₩ | 177 | ₩ | 302 | ₩ | 558 | 70.6 | 84.8 | ||||||||||||
|
|
|
|
|
| |||||||||||||||
| (1) | “N/M” means not meaningful. |
Comparison of 2022 to 2021
Our profit before income tax expense for this segment increased 77.6% from ₩411 billion in 2021 to ₩730 billion in 2022.
Interest income attributable to this segment increased 13.1% from ₩635 billion in 2021 to ₩718 billion in 2022, primarily due to an increase in interest income earned on government and public bonds, insurance policy loans and other loans.
Interest expense attributable to this segment increased 140.0% from ₩10 billion in 2021 to ₩24 billion in 2022, primarily due to interest expense incurred by KB Insurance in connection with its issuance of subordinated debentures in 2022.
Net fee and commission expense attributable to this segment increased 9.8% from ₩173 billion in 2021 to ₩190 billion in 2022, mainly due to increases in external service fees paid and miscellaneous other fees paid in Korean Won, the effects of which were offset in part by an increase in miscellaneous other fees received.
Net insurance income attributable to this segment increased 32.9% from ₩493 billion in 2021 to ₩655 billion in 2022, primarily due to an increase in insurance income, mainly reflecting an increase in insurance premium income, which was offset in part by an increase in insurance expenses, mainly reflecting increases in refunds of surrender value and insurance claims paid.
Net gains on financial instruments at fair value through profit or loss attributable to this segment decreased 8.1% from ₩370 billion in 2021 to ₩340 billion in 2022, primarily as a result of decreases in net gains on beneficiary certificates and net gains on other foreign currency securities, the effects of which were offset in part by an increase in net gains on currency forward contracts.
Net other operating expenses attributable to this segment increased 26.8% from ₩82 billion in 2021 to ₩104 billion in 2022, due to an increase in other operating expenses, mainly reflecting an increase in losses on
141
Table of Contents
currency swap transactions, which was offset in part by an increase in other operating income, which mainly reflected an increase in miscellaneous other operating income.
General and administrative expenses attributable to this segment increased 1.8% from ₩834 billion in 2021 to ₩849 billion in 2022, principally due to increases in salaries paid.
Provisions for credit losses attributable to this segment increased 20.0% from ₩5 billion in 2021 to ₩6 billion in 2022, primarily due to an increase in provisions for credit losses of loans, the effect of which was mostly offset by an increase in reversals of provisions for credit losses of other financial assets.
Net other non-operating income attributable to this segment increased significantly from ₩17 billion in 2021 to ₩190 billion in 2022, principally due to an increase in gains on disposal of investment property.
Comparison of 2021 to 2020
Our profit before income tax expense for this segment increased 67.1% from ₩246 billion in 2020 to ₩411 billion in 2021.
Interest income attributable to this segment increased 2.9% from ₩617 billion in 2020 to ₩635 billion in 2021, primarily due to an increase in interest income earned on government and public bonds held by KB Insurance. Interest expense attributable to this segment increased significantly from ₩1 billion in 2020 to ₩10 billion in 2021, principally due to interest expense incurred by KB Insurance in connection with its issuance of subordinated fixed rate debentures in 2021.
Net fee and commission expense attributable to this segment increased 1.2% from ₩171 billion in 2020 to ₩173 billion in 2021, mainly due to increases in other fees paid in Korean Won and other outsourcing-related fees paid, which were offset in part by decreases in consulting fees paid and foreign currency-denominated fees paid.
Net insurance income attributable to this segment increased 30.8% from ₩377 billion in 2020 to ₩493 billion in 2021, primarily due to increases in insurance premium income and reinsurance income, which were offset in part by an increase in insurance expenses, mainly reflecting increases in insurance claims paid and refunds of surrender value.
Net gains on financial instruments at fair value through profit or loss attributable to this segment increased 42.9% from ₩259 billion in 2020 to ₩370 billion in 2021, primarily as a result of an increase in net gains on beneficiary certificates at fair value through profit or loss, which was offset in part by a decrease in gains on currency-related derivatives.
Net other operating expenses attributable to this segment increased 70.8% from ₩48 billion in 2020 to ₩82 billion in 2021, due mainly to an increase in losses on disposal of debt securities at fair value through other comprehensive income and a decrease in gains on disposal of debt securities at fair value through other comprehensive income, which were offset in part by an increase in gains on fair value hedges.
General and administrative expenses attributable to this segment increased 2.8% from ₩811 billion in 2020 to ₩834 billion in 2021, principally due to increases in employee compensation and retirement benefits, which were partially offset by decreases in other employee benefits and advertising expenses.
Reversal of (provision for) credit losses changed from a reversal of ₩8 billion in 2020 to provision of ₩5 billion in 2021, primarily due to increases in provision for credit losses of other financial assets and foreign-currency loans.
142
Table of Contents
Net other non-operating income attributable to this segment increased 6.3% from ₩16 billion in 2020 to ₩17 billion in 2021, principally due to an increase in gains on disposal of property and equipment, which was offset in part by an increase in management fees paid in connection with investment property.
Other
“Other” includes the operations of our holding company and all of our subsidiaries that were consolidated under IFRS as issued by the IASB as of December 31, 2022 except Kookmin Bank, KB Kookmin Card, KB Securities, the Former KB Life Insurance, KB Insurance and Prudential Life Insurance, including principally KB Asset Management, KB Real Estate Trust, KB Investment, KB Credit Information, KB Data System, KB Savings Bank and KB Capital. The following table shows, for the periods indicated, our income statement data for this segment:
| Year Ended December 31, | Percentage Change | |||||||||||||||||||
| 2020 | 2021 | 2022 | 2021/2020 | 2022/2021 | ||||||||||||||||
| (in billions of Won) | (%) | |||||||||||||||||||
Income statement data | ||||||||||||||||||||
Interest income | ₩ | 727 | ₩ | 817 | ₩ | 1,065 | 12.4 | 30.4 | ||||||||||||
Interest expense | (412 | ) | (405 | ) | (505 | ) | (1.7) | 24.7 | ||||||||||||
Net fee and commission income | 776 | 1,069 | 1,145 | 37.8 | 7.1 | |||||||||||||||
Net gains on financial instruments at fair value through profit or loss | 397 | 184 | 22 | (53.7 | ) | (88.0 | ) | |||||||||||||
Net other operating expenses | (472 | ) | (583 | ) | (608 | ) | 23.5 | 4.3 | ||||||||||||
General and administrative expenses | (406 | ) | (438 | ) | (467 | ) | 7.9 | 6.6 | ||||||||||||
Provision for credit losses | (148 | ) | (176 | ) | (178 | ) | 18.9 | 1.1 | ||||||||||||
Share of profit (loss) of associates and joint ventures | 1 | 9 | (8 | ) | N/M | (1) | N/M | (1) | ||||||||||||
Net other non-operating income (expenses) | 41 | 2 | (5 | ) | (95.1) | N/M | (1) | |||||||||||||
|
|
|
|
|
| |||||||||||||||
Profit before income tax expense | 504 | 480 | 461 | (4.8) | (4.0 | ) | ||||||||||||||
Income tax expense(2) | (97 | ) | (148 | ) | (113 | ) | 52.6 | (23.6 | ) | |||||||||||
|
|
|
|
|
| |||||||||||||||
Profit for the year | ₩ | 406 | ₩ | 332 | ₩ | 347 | (18.2) | 4.5 | ||||||||||||
|
|
|
|
|
| |||||||||||||||
| (1) | “N/M” means not meaningful. |
| (2) | Represents income tax attributable to our holding company and all of our subsidiaries that were consolidated under IFRS as issued by the IASB except Kookmin Bank, KB Kookmin Card, KB Securities (including its predecessor entities), the Former KB Life Insurance, KB Insurance and Prudential Life Insurance. |
Comparison of 2022 to 2021
Our profit before income tax expense for this segment decreased 4.0% from ₩480 billion in 2021 to ₩461 billion in 2022.
Interest income attributable to this segment increased 30.4% from ₩817 billion in 2021 to ₩1,065 billion in 2022. This increase was primarily due to increases in the average volumes of loans of KB Capital and, to a lesser extent, KB Savings Bank.
Interest expense attributable to this segment increased 24.7% from ₩405 billion in 2021 to ₩505 billion in 2022, mainly due to an increase in the average volume of deposits of KB Savings Bank and an increase in the average yields of debentures of KB Capital.
Net fee and commission income attributable to this segment increased 7.1% from ₩1,069 billion in 2021 to ₩1,145 billion in 2022, principally reflecting increases in lease and rental fees received by KB Capital and, to a lesser extent, an increase in the operating lease fees received by our consolidated funds, which were offset in part by an increase in other service fees paid by our consolidated funds.
143
Table of Contents
Net gains on financial instruments at fair value through profit or loss attributable to this segment decreased 88.0% from ₩184 billion in 2021 to ₩22 billion in 2022, primarily as a result of decreases in gains on valuation of foreign equity securities of KB Investment, gains on sales of equity securities of KB Investment and gains on valuations of debt securities of our consolidated funds.
Net other operating expenses attributable to this segment increased 4.3% from ₩583 billion in 2021 to ₩608 billion in 2022, which mainly reflected a decrease in gains on sales of loans measured at amortized cost of KB Capital.
General and administrative expenses attributable to this segment increased 6.6% from ₩438 billion in 2021 to ₩467 billion in 2022, principally due to an increase in the salary expenses of our holding company, KB Asset Management, KB Real Estate Trust and KB Capital.
Provision for credit losses increased 1.1% from ₩176 billion in 2021 to ₩178 billion in 2022, primarily due to an increase in provisions for credit losses of loans in Korean Won of KB Capital, which was offset in part by a reversal of provisions for credit losses of debentures of our holding company.
Share of profit (loss) of associates and joint ventures attributable to this segment changed from a profit of ₩9 billion in 2021 to a loss of ₩8 billion in 2022, mainly reflecting an increase in valuation losses on equity-method investments, and a decrease in valuation gains on equity-method investments, of KB Investment.
Net other non-operating income (expenses) attributable to this segment changed from a net income of ₩2 billion in 2021 to a net expense of ₩5 billion in 2022, principally reflecting a decrease in other non-operating income of KB Capital and an increase in other non-operating expenses of our consolidated funds.
Comparison of 2021 to 2020
Our profit before income tax expense for this segment decreased 4.8% from ₩504 billion in 2020 to ₩480 billion in 2021.
Interest income attributable to this segment increased 12.4% from ₩727 billion in 2020 to ₩817 billion in 2021. This increase was primarily due to increases in the average volumes of loans of KB Capital and, to a lesser extent, KB Savings Bank.
Interest expense attributable to this segment decreased 1.7% from ₩412 billion in 2020 to ₩405 billion in 2021, mainly due to a decrease in the average volume of debentures of our holding company on a separate basis, which was enhanced by a decrease in the average yields of debentures of KB Capital.
Net fee and commission income attributable to this segment increased 37.8% from ₩776 billion in 2020 to ₩1,069 billion in 2021, principally reflecting increases in lease and rental fees received by KB Capital and, to a lesser extent, an increase in the operating lease fees received by our consolidated funds, which were offset in part by increases in other fees paid by KB Capital and our holding company.
Net gains on financial instruments at fair value through profit or loss attributable to this segment decreased 53.7% from ₩397 billion in 2020 to ₩184 billion in 2021, primarily as a result of a decrease in gains on valuations of debt securities of our consolidated funds.
Net other operating expenses attributable to this segment increased 23.5% from ₩472 billion in 2020 to ₩583 billion in 2021, which mainly reflected an increase in depreciation and amortization expenses with respect to leased assets of KB Capital, which were partially offset by gains on valuations of foreign currency-denominated loans held by our consolidated funds.
144
Table of Contents
General and administrative expenses attributable to this segment increased 7.9% from ₩406 billion in 2020 to ₩438 billion in 2021, principally due to an increase in the salary expenses of our holding company, KB Asset Management, KB Real Estate Trust and KB Capital, which was enhanced by an increase in advertisement expenses of KB Capital and fees and commissions paid by our holding company and KB Asset Management.
Provision for credit losses increased 18.9% from ₩148 billion in 2020 to ₩176 billion in 2021, primarily due to an increase in provision for credit losses of private placement bonds of our consolidated funds and a decrease in reversal of credit losses of loans in Korean Won of our consolidated funds, which were enhanced by an increase in provision for credit losses of other financial assets of KB Real Estate Trust.
Share of profit of associates and joint ventures attributable to this segment increased eight-fold from ₩1 billion in 2020 to ₩9 billion in 2021, mainly reflecting an increase in valuation gains on equity-method investments of KB Investment.
Net other non-operating income attributable to this segment decreased 95.1% from ₩41 billion in 2020 to ₩2 billion in 2021, principally reflecting a decrease in the rental income of our consolidated funds.
145
Table of Contents
| Item 5.B. | Liquidity and Capital Resources |
Financial Condition
Assets
The following table sets forth, as of the dates indicated, the principal components of our assets:
| As of December 31, | Percentage Change | |||||||||||
| 2021 | 2022 | 2022/2021 | ||||||||||
| (in billions of Won) | (%) | |||||||||||
Cash and due from financial institutions | ₩ | 31,009 | ₩ | 32,063 | 3.4 | |||||||
Financial assets at fair value through profit or loss | 66,006 | 64,935 | (1.6 | ) | ||||||||
Derivative financial assets | 3,721 | 9,446 | 153.9 | |||||||||
Financial investments | 104,848 | 116,589 | 11.2 | |||||||||
Loans measured at amortized cost: | ||||||||||||
Loans to banks | 8,325 | 9,750 | 17.1 | |||||||||
|
|
|
| |||||||||
Loans to customers other than banks: | ||||||||||||
Loans in Korean Won | 346,954 | 358,521 | 3.3 | |||||||||
Loans in foreign currencies | 24,856 | 30,720 | 23.6 | |||||||||
Domestic import usance bills | 3,311 | 4,499 | 35.9 | |||||||||
Off-shore funding loans | 1,065 | 908 | (14.7 | ) | ||||||||
Call loans | 902 | 119 | (86.8 | ) | ||||||||
Bills bought in Korean Won | 2 | 286 | N/M | (1) | ||||||||
Bills bought in foreign currencies | 2,001 | 1,781 | (11.0 | ) | ||||||||
Guarantee payments under acceptances and guarantees | 21 | 18 | (14.3 | ) | ||||||||
Credit card receivables in Korean Won | 20,766 | 22,562 | 8.6 | |||||||||
Credit card receivables in foreign currencies | 58 | 47 | (19.0 | ) | ||||||||
Bonds purchased under repurchase agreements | 4,855 | 3,029 | (37.6 | ) | ||||||||
Privately placed bonds | 759 | 854 | 12.5 | |||||||||
Factored receivables | 1 | 0 | (100.0 | ) | ||||||||
Lease receivables | 1,292 | 1,134 | (12.2 | ) | ||||||||
Loans for installment credit | 6,416 | 6,458 | 0.7 | |||||||||
|
|
|
| |||||||||
Total loans to customers other than banks | 413,259 | 430,937 | 4.3 | |||||||||
Less: | ||||||||||||
Allowances for credit losses | (3,684 | ) | (4,157 | ) | 12.8 | |||||||
|
|
|
| |||||||||
Total loans measured at amortized cost, net | 417,900 | 436,531 | 4.5 | |||||||||
Property and equipment | 5,240 | 4,991 | (4.8 | ) | ||||||||
Other assets(2) | 35,171 | 36,615 | 4.1 | |||||||||
|
|
|
| |||||||||
Total assets | ₩ | 663,896 | ₩ | 701,171 | 5.6 | |||||||
|
|
|
| |||||||||
| (1) | “N/M” means not meaningful. |
| (2) | Includes investments in associates and joint ventures, investment properties, intangible assets, net defined benefit assets, current income tax assets, deferred income tax assets, assets held for sale, assets of a disposal group held for sale and miscellaneous other assets. |
For further information on our assets, see “Item 4.B. Business Overview—Assets and Liabilities.”
Our total assets increased 5.6% from ₩663,896 billion as of December 31, 2021 to ₩701,171 billion as of December 31, 2022, principally due to a 4.5% increase in loans from ₩417,900 billion as of December 31, 2021 to ₩436,531 billion as of December 31, 2022, an 11.2% increase in financial investments from ₩104,848 billion as of December 31, 2021 to ₩116,589 billion as of December 31, 2022 and a 153.9% increase in derivative financial assets from ₩3,721 billion as of December 31, 2021 to ₩9,446 billion as of December 31, 2022. The increase in loans was mainly due to increases in loans in Korean Won and, to a lesser extent, loans in foreign currencies. The increase in financial investments was primarily attributable to an increase in our debt securities measured at amortized cost. The increase in derivative financial assets was primarily due to an increase in finance- and insurance-related derivative financial assets.
146
Table of Contents
Liabilities and Equity
The following table sets forth, as of the dates indicated, the principal components of our liabilities and our equity:
| As of December 31, | Percentage Change | |||||||||||
| 2021 | 2022 | 2022/2021 | ||||||||||
| (in billions of Won) | (%) | |||||||||||
Liabilities: | ||||||||||||
Financial liabilities at fair value through profit or loss | ₩ | 12,089 | ₩ | 12,272 | 1.5 | |||||||
Deposits | 372,024 | 388,888 | 4.5 | |||||||||
Borrowings | 56,912 | 71,717 | 26.0 | |||||||||
Debentures | 67,430 | 68,698 | 1.9 | |||||||||
Provisions | 809 | 969 | 19.8 | |||||||||
Insurance liabilities | 57,166 | 58,230 | 1.9 | |||||||||
Other liabilities(1) | 49,172 | 50,753 | 3.2 | |||||||||
|
|
|
| |||||||||
Total liabilities | 615,602 | 651,528 | 5.8 | |||||||||
|
|
|
| |||||||||
Equity: | ||||||||||||
Share capital | 2,091 | 2,091 | 0.0 | |||||||||
Hybrid securities | 2,838 | 4,434 | 56.2 | |||||||||
Capital surplus | 16,940 | 16,941 | 0.0 | |||||||||
Accumulated other comprehensive income (loss) | 1,047 | (2,713 | ) | N/M | (2) | |||||||
Accumulated other comprehensive income relating to assets of a disposal group held for sale | 8 | — | N/A | (3) | ||||||||
Retained earnings | 25,673 | 28,447 | 10.8 | |||||||||
Treasury shares | (1,136 | ) | (836 | ) | (26.4 | ) | ||||||
|
|
|
| |||||||||
Equity attributable to shareholders of the Parent Company | 47,461 | 48,363 | 1.9 | |||||||||
Non-controlling interests | 833 | 1,280 | 53.7 | |||||||||
|
|
|
| |||||||||
Total equity | 48,294 | 49,643 | 2.8 | |||||||||
|
|
|
| |||||||||
Total liabilities and equity | ₩ | 663,896 | ₩ | 701,171 | 5.6 | |||||||
|
|
|
| |||||||||
| (1) | Includes derivative financial liabilities, current income tax liabilities, deferred income tax liabilities, net defined benefit liabilities and miscellaneous other liabilities. |
| (2) | “N/M” means not meaningful. |
| (3) | “N/A” means not applicable. |
Our total liabilities increased 5.8% from ₩615,602 billion as of December 31, 2021 to ₩651,528 billion as of December 31, 2022. The increase was primarily due to a 4.5% increase in deposits from ₩372,024 billion as of December 31, 2021 to ₩388,888 billion as of December 31, 2022, and a 26.0% increase in borrowings from ₩56,912 billion as of December 31, 2021 to ₩71,717 billion as of December 31, 2022. Our deposits increased mainly as a result of an increase in time deposits, which was in large part offset by a decrease in demand deposits. Our increase in borrowings was primarily attributable to an increase in general borrowings.
Our total equity increased 2.8% from ₩48,294 billion as of December 31, 2021 to ₩49,643 billion as of December 31, 2022. This increase mainly resulted from increases in our retained earnings and issuances of hybrid securities, the effects of which were partially offset by a change in our accumulated other comprehensive income (loss) from an income in 2021 to a loss in 2022.
Liquidity
Our primary source of funding has historically been and continues to be deposits. Deposits amounted to ₩372,024 billion and ₩388,888 billion as of December 31, 2021 and 2022, which represented approximately
147
Table of Contents
74.9% and 73.5% of our total funding, respectively. We have been able to use customer deposits to finance our operations generally, including meeting a portion of our liquidity requirements. Although the majority of deposits are short-term, it has been our experience that the majority of our depositors generally roll over their deposits at maturity, thus providing us with a stable source of funding. However, in the event that a substantial number of our depositors do not roll over their deposits or otherwise decide to withdraw their deposited funds, we would need to place increased reliance on alternative sources of funding, some of which may be more expensive than customer deposits, in order to finance our operations. See “Item 3.D. Risk Factors—Risks relating to liquidity and capital management—Our funding is highly dependent on short-term deposits, which dependence may adversely affect our operations.” In particular, we may increase our utilization of alternative funding sources such as short-term borrowings and cash and cash equivalents (including funds from maturing loans), as well as liquidating our positions in financial assets and using the proceeds to fund parts of our operations, as necessary.
We also obtain funding through debentures and borrowings to meet our liquidity needs. Debentures represented 13.6% and 13.0% of our total funding as of December 31, 2021 and 2022, respectively. Borrowings represented 11.5% and 13.5% of our total funding as of December 31, 2021 and 2022, respectively. For further information on our sources of funding, see “Item 4.B. Business Overview—Assets and Liabilities—Funding.”
The Financial Services Commission of Korea requires each financial holding company in Korea to maintain specific Won and foreign currency liquidity ratios and each bank in Korea to maintain a liquidity coverage ratio and a foreign currency liquidity coverage ratio. These ratios require us and Kookmin Bank to keep the ratio of liquid assets to liquid liabilities above certain minimum levels. For a description of these requirements, see “Item 4.B. Business Overview—Supervision and Regulation—Principal Regulations Applicable to Financial Holding Companies—Liquidity” and “Item 4.B. Business Overview—Supervision and Regulation—Principal Regulations Applicable to Banks—Liquidity.”
We are exposed to liquidity risk arising from withdrawals of deposits, payments of insurance contract claims and refunds, and maturities of our debentures and borrowings, as well as the need to fund our lending, trading and investment activities (including our capital expenditures) and the management of our trading positions. The goal of liquidity management is for us to be able, even under adverse conditions, to meet all of our liability repayments on time and fund all investment opportunities. For an explanation of how we manage our liquidity risk, see “Item 11. Quantitative and Qualitative Disclosures about Market Risk—Liquidity Risk Management.” From time to time, we engage in the purchase and/or cancellation of our own equity securities, as part of our efforts to generate additional shareholder value. For example, from February 8, 2023 to March 29, 2023, we engaged in a series of open-market transactions to purchase a total of 5,385,996 of our shares of common stock at an average price of ₩50,454 per share for an aggregate amount of ₩271.7 billion, followed by the cancellation of such shares in their entirety.
We are a financial holding company, and substantially all of our operations are in our subsidiaries. Accordingly, we rely on distributions from our subsidiaries (as well as associates), direct borrowings and issuances of debt and equity securities to fund our liquidity obligations at the holding company level. We received aggregate dividends of ₩1,573 billion, ₩1,618 billion and ₩1,871 billion from our subsidiaries and associates in 2020, 2021 and 2022, respectively. See “Item 3.D. Risk Factors—Risks relating to our financial holding company structure and strategy.”
148
Table of Contents
Asset Encumbrance
Part of our future funding and collateral needs are supported by assets readily available and unrestricted. The following table sets forth our assets that are available and those that are encumbered and not available to support our future funding and collateral needs as of December 31, 2022.
| December 31, 2022 | ||||||||||||||||
| Unencumbered Assets | ||||||||||||||||
| Assets | Encumbered Asset (1) | Readily Available (2) | Other | |||||||||||||
| (in billions of Won) | ||||||||||||||||
On-balance sheet | ||||||||||||||||
Cash and due from financial institutions | ₩ | 32,063 | ₩ | 3,165 | ₩ | 27,190 | ₩ | 1,708 | ||||||||
Financial assets at fair value through profit or loss | 64,935 | 12,602 | 18,542 | 33,791 | ||||||||||||
Derivative financial assets | 9,446 | — | 9,446 | |||||||||||||
Loans measured at amortized cost | 436,531 | 16,579 | — | 419,952 | ||||||||||||
Financial investments | 116,589 | 26,936 | 45,076 | 44,577 | ||||||||||||
Investments in associates and joint ventures | 683 | — | — | 683 | ||||||||||||
Property and equipment | 4,991 | — | — | 4,991 | ||||||||||||
Investment property | 3,148 | 807 | — | 2,341 | ||||||||||||
Intangible assets | 3,200 | — | — | 3,200 | ||||||||||||
Net defined benefit assets | 479 | — | — | 479 | ||||||||||||
Current income tax assets | 205 | — | — | 205 | ||||||||||||
Deferred income tax assets | 251 | — | — | 251 | ||||||||||||
Assets held for sale | 212 | — | — | 212 | ||||||||||||
Assets of a disposal group held for sale | — | — | — | — | ||||||||||||
Other assets | 28,438 | 992 | — | 27,446 | ||||||||||||
|
|
|
|
|
|
|
| |||||||||
Total on-balance sheet | ₩ | 701,171 | ₩ | 61,081 | ₩ | 90,808 | ₩ | 549,282 | ||||||||
|
|
|
|
|
|
|
| |||||||||
Off-balance sheet | ||||||||||||||||
Fair value of securities accepted as collateral | ₩ | 3,344 | ₩ | — | ₩ | 3,344 | ₩ | — | ||||||||
|
|
|
|
|
|
|
| |||||||||
Total off-balance sheet | ₩ | 3,344 | ₩ | — | ₩ | 3,344 | ₩ | — | ||||||||
|
|
|
|
|
|
|
| |||||||||
| (1) | Represents assets that have been pledged as collateral against an existing liability or are otherwise restricted in their use to secure funding. |
| (2) | Represents those on- and off-balance sheet assets that are not otherwise encumbered, and which are in freely transferable form. |
Commitments and Guarantees
The following table sets forth our commitments and guarantees as of December 31, 2022. These commitments and guarantees are not included within our consolidated statements of financial position.
| Payments Due by Period | ||||||||||||||||||||
| Total | 1 Year or Less | 1-3 Years | 3-5 Years | More Than 5 Years | ||||||||||||||||
| (in billions of Won) | ||||||||||||||||||||
Financial guarantees(1) | ₩ | 7,345 | ₩ | 2,728 | ₩ | 4,532 | ₩ | 28 | ₩ | 57 | ||||||||||
Confirmed acceptances and guarantees | 7,855 | 4,658 | 2,906 | 262 | 29 | |||||||||||||||
Commitments | 189,120 | 138,800 | 8,157 | 2,905 | 39,258 | |||||||||||||||
|
|
|
|
|
|
|
|
|
| |||||||||||
Total | ₩ | 204,320 | ₩ | 146,186 | ₩ | 15,595 | ₩ | 3,195 | ₩ | 39,344 | ||||||||||
|
|
|
|
|
|
|
|
|
| |||||||||||
| (1) | Includes ₩6,555 billion of irrevocable commitments to provide contingent liquidity credit lines to special purpose entities for which we serve as the administrator. See Note 40 of the notes to our consolidated financial statements. |
149
Table of Contents
Capital Adequacy
Kookmin Bank is subject to capital adequacy requirements of the Financial Services Commission applicable to Korean banks. The requirements applicable commencing in December 2013 pursuant to amended Financial Services Commission regulations promulgated in July 2013 were formulated based on Basel III, which was first introduced by the Basel Committee on Banking Supervision, Bank for International Settlements in December 2009. Under the amended Financial Services Commission regulations, all banks in Korea are required to maintain certain minimum ratios of common equity Tier I capital, total Tier I capital and total Tier I and Tier II capital to risk-weighted assets. See “Item 4.B. Business Overview—Supervision and Regulation—Principal Regulations Applicable to Banks—Capital Adequacy.”
As of December 31, 2022, Kookmin Bank’s total Tier I and Tier II capital adequacy ratio was 17.46%.
The following table sets forth a summary of Kookmin Bank’s capital and capital adequacy ratios as of December 31, 2021 and 2022, based on applicable regulatory reporting standards.
| As of December 31, | ||||||||
| 2021 | 2022 | |||||||
| (in billions of Won, except percentages) | ||||||||
Tier I capital: | ₩ | 30,491 | ₩ | 30,963 | ||||
Common equity Tier I capital | 29,917 | 30,089 | ||||||
Paid-in capital | 2,022 | 2,022 | ||||||
Capital reserves | 5,025 | 5,025 | ||||||
Retained earnings | 23,661 | 25,834 | ||||||
Non-controlling interests in consolidated subsidiaries | — | — | ||||||
Others | (791 | ) | (2,792 | ) | ||||
Additional Tier I capital | 575 | 874 | ||||||
Tier II capital: | 5,081 | 5,270 | ||||||
Revaluation reserves | — | — | ||||||
Allowances for credit losses(1) | 595 | 886 | ||||||
Hybrid debt | — | — | ||||||
Subordinated debt | 4,486 | 4,384 | ||||||
Valuation gain on financial investments | — | — | ||||||
Others | — | — | ||||||
|
|
|
| |||||
Total core and supplementary capital | 35,572 | 36,233 | ||||||
Risk-weighted assets | 203,569 | 207,558 | ||||||
Credit risk: | 181,149 | 182,294 | ||||||
Market risk | 10,833 | 12,611 | ||||||
Operational risk | 11,587 | 12,653 | ||||||
Total Tier I and Tier II capital adequacy ratio | 17.47 | % | 17.46 | % | ||||
Tier I capital adequacy ratio | 14.98 | % | 14.92 | % | ||||
Common equity Tier I capital adequacy ratio | 14.70 | % | 14.50 | % | ||||
Tier II capital adequacy ratio | 2.50 | % | 2.54 | % | ||||
| (1) | Under the standardized approach, allowances for credit losses in respect of credits classified as normal or precautionary are used to calculate Tier II capital only to the extent they represent up to 1.25% of credit risk-weighted assets. Under the internal ratings-based approach, allowances for credit losses, less estimated losses, are used to calculate Tier II capital only to the extent they represent up to 0.6% of credit risk-weighted assets. |
In addition, we, as a bank holding company, are required to maintain certain minimum capital adequacy ratios pursuant to applicable regulations of the Financial Services Commission. See “Item 4.B. Business Overview—Supervision and Regulation—Principal Regulations Applicable to Financial Holding Companies—Capital Adequacy.”
150
Table of Contents
The following table sets forth a summary of our consolidated capital adequacy ratio as of December 31, 2021 and 2022, based on applicable regulatory reporting standards.
| As of December 31, | ||||||||
| 2021 | 2022 | |||||||
| (in billions of Won) | ||||||||
Tier I capital | ||||||||
Common equity Tier I capital | ₩ | 39,144 | ₩ | 40,104 | ||||
Additional Tier I capital | 3,161 | 4,928 | ||||||
|
|
|
| |||||
Total Tier I capital | ₩ | 42,305 | ₩ | 45,032 | ||||
Tier II capital | 3,577 | 3,938 | ||||||
|
|
|
| |||||
Risk-weighted assets | ₩ | 290,914 | ₩ | 302,968 | ||||
|
|
|
| |||||
Total Tier I and Tier II capital adequacy ratio | 15.77 | % | 16.16 | % | ||||
Tier I capital adequacy ratio | 14.54 | % | 14.86 | % | ||||
Common equity Tier I capital adequacy ratio | 13.46 | % | 13.24 | % | ||||
Tier II capital adequacy ratio | 1.23 | % | 1.30 | % | ||||
Recent Accounting Pronouncements
See Note 2.1 of the notes to our consolidated financial statements for a description of other recent accounting pronouncements under IFRS as issued by the IASB that have been issued but are not yet effective.
| Item 5.C. | Research and Development, Patents and Licenses, etc. |
Not applicable.
| Item 5.D. | Trend Information |
These matters are discussed under Item 5.A. and Item 5.B. above where relevant.
| Item 5.E. | Critical Accounting Estimates |
Not applicable.
| Item 6. | DIRECTORS, SENIOR MANAGEMENT AND EMPLOYEES |
| Item 6.A. | Directors and Senior Management |
Board of Directors
Our board of directors, currently consisting of one executive director, one non-standing director and seven non-executive directors], has the ultimate responsibility for the management of our affairs.
Our articles of incorporation provide that:
| • | we may have no more than 30 directors; |
| • | the number of executive directors must be less than 50% of the total number of directors; and |
| • | we have five or more non-executive directors. |
The term of office for each director is renewable and is subject to the Korean Commercial Code, the Act on the Corporate Governance of Financial Companies and related regulations.
151
Table of Contents
Our board of directors meets on a regular basis to discuss and resolve material corporate matters. Additional extraordinary meetings may also be convened at the request of any director or any committee that serves under the board of directors.
The names and positions of our directors are set forth below. The business address of all of the directors is our registered office at 26, Gukjegeumyung-ro 8-gil, Yeongdeungpo-gu, Seoul 07331, Korea.
Executive Director
The table below identifies our executive director as of the date of this annual report:
Name | Date of Birth | Position | Director Since | End of Term | ||||
Jong Kyoo Yoon | October 13, 1955 | Chairman and Chief Executive Officer | November 21, 2014 | November 20, 2023 |
Our executive director does not have any significant activities outside KB Financial Group.
Jong Kyoo Yoon is our chairman and chief executive officer. He has been an executive director since November 2014. He previously served as the president and chief executive officer of Kookmin Bank, our deputy president, chief finance officer and chief risk management officer, a senior advisor of Kim & Chang, a senior executive vice president, chief financial officer and chief strategic officer of Kookmin Bank and a senior partner of Samil PricewaterhouseCoopers. Mr. Yoon received a B.A. in business administration from Sungkyunkwan University, an M.B.A. from Seoul National University and a Ph.D. in business administration from Sungkyunkwan University.
Non-standing Director
The table below identifies our non-standing director as of the date of this annual report:
Name | Date of Birth | Position | Director Since | End of Term | ||||
Jae Keun Lee | May 27, 1966 | Non-standing director; President and Chief Executive Officer of Kookmin Bank | March 25, 2022 | Annual general meeting of shareholders in 2024 |
Jae Keun Lee has been a non-standing director since March 2022. He currently serves as the president and chief executive officer of Kookmin Bank. Mr. Lee previously served as a senior executive vice president of the sales group and a senior managing director of the strategy and finance planning group at Kookmin Bank, as well as our chief finance officer. Mr. Lee received a B.A. in mathematics and an M.A. in economics from Sogang University, and an M.B.A. in financial engineering from the Korea Advanced Institute of Science and Technology.
Non-executive Directors
Our non-executive directors are selected based on the candidates’ knowledge and experience in diverse areas, such as finance, business management, accounting, laws and regulations, finance and risk management, ESG and consumer protection and digital and information technology. All seven non-executive directors below were nominated by our Non-executive Director Nominating Committee and approved by our shareholders.
152
Table of Contents
The table below identifies our non-executive directors as of the date of this annual report:
Name | Date of Birth | Position | Director Since | Date Term Ends(1) | ||||
Kyung Ho Kim | December 21, 1954 | Chairman of the Board and Non-executive Director | March 27, 2019 | March 23, 2024 | ||||
Seon-joo Kwon | November 12, 1956 | Non-executive Director | March 20, 2020 | March 23, 2024 | ||||
Whajoon Cho | February 24, 1957 | Non-executive Director | March 24, 2023 | March 23, 2025 | ||||
Gyutaeg Oh | February 20, 1959 | Non-executive Director | March 20, 2020 | March 23, 2024 | ||||
Jungsung Yeo | April 1, 1960 | Non-executive Director | March 24, 2023 | March 23, 2025 | ||||
Jaehong Choi | August 1, 1962 | Non-executive Director | March 25, 2022 | March 24, 2024 | ||||
Sung-Yong Kim | March 16, 1966 | Non-executive Director | March 24, 2023 | March 23, 2025 |
| (1) | The date on which each term will end will be the date of the general stockholders’ meeting in the relevant year unless otherwise specified. |
Kyung Ho Kim has been a non-executive director since March 2019. He is currently an advisor at Jade-K Partners Co., Ltd. He previously served as a professor at Hongik University School of Business Administration, the vice president of Hongik University, a non-executive director of Shinhan Investment Corp., a non-executive director of Citibank Korea Inc., a vice chairman of the Korea Accounting Institute and president of the Korea Association for Government Accounting. Mr. Kim received a B.A. in business administration from Seoul National University and an M.S. and a Ph.D. in management from Purdue University.
Seon-joo Kwon has been a non-executive director since March 2020. She previously served a number of roles at Industrial Bank of Korea, including the chairman and chief executive officer, the head of the risk management division, the head of the credit card business division and the head of the central regional headquarters. She also previously served as a visiting scholar at the Korea Institute of Finance. Ms. Kwon received a B.A. in English from Yonsei University.
Whajoon Cho has been a non-executive director since March 2023. She previously served as the auditor of Mercedes-Benz Financial Services Korea Limited, the president, chief executive officer and chief financial officer of KT Capital Corporation, the chief financial officer of BC Card Co., Ltd. and the investor relations officer at KT Corporation. Ms. Cho received a B.A. in mass communication from Sogang University, an M.A. in sociology from Indiana University, an M.S. in accounting from University of Wisconsin, Madison and a Ph.D. in accounting from Indiana University.
Gyutaeg Oh has been a non-executive director since March 2020. He is currently a professor at Chung-Ang University School of Business Administration. He previously served as a member of the Public Funds Oversight Committee of the Financial Services Commission, an assistant professor at the University of Iowa, a non-executive director at Kiwoom Securities Co., Ltd. and a non-executive director at Moa Savings Bank. Mr. Oh received a B.A. in economics from Seoul National University, an M.S. in management science from the Korea Advanced Institute of Science and Technology and an M.A. and a Ph.D. in economics from Yale University.
Jungsung Yeo has been a non-executive director since March 2023. She is currently a professor in the Department of Consumer Science at Seoul National University and the chairperson of the Consumer Policy Committee of the Korean Government. She previously served as the executive vice president for Academic Affairs at Seoul National University, the executive vice president for Planning and Communication at Seoul National University, the president of the Korean Society of Consumer Studies, a commissioner of the Personal Information Protection Commission of Korea and a commissioned member of the National Economic Advisory Council under the President of Korea. Ms. Yeo received a B.S. in home economics from Seoul National University and an M.S. and a Ph.D. in consumer economics from Cornell University.
Jaehong Choi has been a non-executive director since March 2022. He is currently a professor at Gangneung-Wonju National University Multimedia Engineering. He previously served as a non-executive
153
Table of Contents
director at Kakao Corp., an advisor at NHN Japan Corp. and an advisor at eSamsung Japan Corp. Mr. Choi received a B.S., M.S. and Ph.D. in electronic engineering from Hanyang University.
Sung-Yong Kim has been a non-executive director since March 2023. He is currently a professor at Sungkyunkwan University Law School. He previously served as the chair of the Insolvency Law Institute of Korea, a non-standing commissioner of the Securities and Futures Commission, a member of the management committee for the Key Industries Stabilization Fund and a non-executive director at Woori Bank. Mr. Kim received an LL.B. from Seoul National University College of Law and an LL.M. from the University of Pennsylvania Law School.
Any director having an interest in a transaction that is subject to approval by the board of directors may not vote at the meeting during which the board approves the transaction.
Executive Officers
The table below identifies our executive officers who are not executive directors as of the date of this annual report:
Name | Date of Birth | Position | ||
Jong Hee Yang | June 10, 1961 | Vice Chairman and Head of Retail Customer, Wealth Management and Pension, Small and Medium Enterprise Business Units | ||
Yin Hur | December 19, 1961 | Vice Chairman and Head of Global / Insurance Business Units | ||
Dong Cheol Lee | October 4, 1961 | Vice Chairman and Head of Digital / IT Business Units | ||
Scott Y. H. Seo | March 26, 1966 | Senior Executive Vice President and Chief Finance Officer | ||
Cheal Soo Choi | October 8, 1966 | Senior Executive Vice President and Chief Risk Management Officer | ||
Dong Whan Han | January 30, 1965 | Senior Executive Vice President and Head of KB Research | ||
Se Min Kim | January 3, 1971 | Senior Managing Director and Chief Strategy Officer | ||
Bong Joong Kwon | November 5, 1969 | Senior Managing Director and Head of IR | ||
Yeo Woon Yoon | April 7, 1967 | Senior Managing Director and Chief Human Resources Officer | ||
Hye Ja Seo | September 26, 1966 | Senior Managing Director and Chief Compliance Officer | ||
Jin Gyu Maeng | January 15, 1966 | Senior Managing Director and Head of Audit | ||
Hye Sook Moon | September 8, 1971 | Managing Director and Head of ESG Division | ||
Byung Joo Oh | January 4, 1973 | Managing Director, Insurance Business Unit | ||
Jeong Rim Park | November 27, 1963 | Head of the Capital Market Business / Corporate and Investment Banking Business / Asset Management Business Units | ||
Sung Hyun Kim | August 5, 1963 | Head of Corporate and Investment Banking Business Unit | ||
Hyun Seung Lee | November 11, 1966 | Head of Asset Management Business Unit | ||
Jin Young Kim | August 5, 1969 | Chief Public Relations Officer | ||
Mun Cheol Jeong | August 3, 1968 | Senior Executive Vice President, Retail Customer Business Unit | ||
Jae Young Choi | June 7, 1967 | Senior Executive Vice President, Wealth Management and Pension Business Unit | ||
| Sung Ki Kwon | July 3, 1966 | Senior Executive Vice President, Small and Medium Enterprise Business Unit | ||
| Nam Hoon Cho | June 28, 1968 | Chief Global Strategy Officer | ||
| Young Suh Cho | February 25, 1971 | Chief Digital Platform Officer | ||
| Jin Soo Yoon | February 29, 1964 | Chief Information Technology Officer | ||
| Chang Hwa Yook | December 11, 1967 | Chief Data Officer | ||
Sung Pyo Jeon | August 20, 1966 | Chief Customer Contact Officer |
154
Table of Contents
Name | Date of Birth | Position | ||
| Jeong Ha | January 31, 1967 | Senior Executive Vice President, Capital Market Business Unit | ||
| Soon Bae Kang | August 30, 1964 | Senior Executive Vice President, Corporate and Investment Banking Business Unit | ||
| Nam Che Kang | August 11, 1967 | Head of Global Division | ||
| Yoon Ha | March 10, 1971 | Head of Customer Experience Design Center | ||
| Yoo Shim Hur | April 25, 1973 | Head of Digital Contents Center | ||
| Ki Eun Park | September 27, 1970 | Head of Technology Innovation Center | ||
| Joo Hyun Kim | November 15, 1970 | Head of Group Cloud Center | ||
| Soon Young Oh | August 26, 1977 | Head of Financial AI Center | ||
| Chan Yong Park | September 12, 1965 | Head of Office of Planning and Coordination | ||
| Min Hyuk Kang | January 8, 1970 | Head of Office of Capital Market Planning |
None of the executive officers has any significant activities outside KB Financial Group.
Jong Hee Yang is a vice chairman and serves as the head of our retail customer business unit, wealth management and pension business unit and small and medium enterprise business unit. He previously served as the chief executive officer of KB Insurance. Mr. Yang received a B.A. in history from Seoul National University.
Yin Hur is a vice chairman and serves as the head of our global business unit and insurance business unit. He previously served as the president and chief executive officer of Kookmin Bank. Mr. Hur received a B.A. and M.A. in law from Seoul National University.
Dong Cheol Lee is a vice chairman and serves as the head of our digital business unit and IT business unit. He previously served as the chief executive officer of KB Kookmin Card. Mr. Lee received a B.A. in law from Korea University and an L.L.M. from Tulane University Law School.
Scott Y. H. Seo is a senior executive vice president and our chief finance officer. He previously served as a senior managing director of the institution sales business unit of KB Securities. Mr. Seo received a B.A. in business administration from Sogang University.
Cheal Soo Choi is a senior executive vice president and our chief risk management officer. He previously served as a senior managing director of the risk management group of Kookmin Bank. Mr. Choi received a B.A. in agricultural economics from Korea University.
Dong Whan Han is a senior executive vice president and the head of KB Research. He previously served as our chief digital platform officer and chief digital innovation officer. Mr. Han received an M.S. in geography from Seoul National University and an M.B.A. from the University of Washington.
Se Min Kim is a senior managing director and our chief strategy officer. He previously served as a senior managing director and the head of the business management division of KB Capital. Mr. Kim received a B.A. in business administration from Sogang University.
Bong Joong Kwon is a senior managing director and the head of our IR department. He previously served as the general manager of our IR department. Mr. Kwon received a B.A. in law from Hallym University and an M.B.A. from Yonsei University.
Yeo Woon Yoon is a senior managing director and our chief human resources officer. He previously served as the head of the foreign exchange business division of Kookmin Bank. Mr. Yoon received a B.A. in English literature from Korea University.
Hye Ja Seo is a senior managing director and our chief compliance officer. She previously served as the head of Kookmin Bank’s Sangin-yeok regional head office. Ms. Suh received a B.A. in law from Kyungpook National University.
155
Table of Contents
Jin Gyu Maeng is a senior managing director and the head of audit. He previously served as the head of our office of planning and coordination. Mr. Maeng received a B.A. in economics from Dongguk University.
Hye Sook Moon is a managing director and the head of our ESG division. She previously served as a general manager of our ESG strategy department. Ms. Moon received an M.A. in economics from Korea University.
Byung Joo Oh is a managing director in our insurance business unit. He previously served as a general manager of KB Insurance’s strategic planning department. Mr. Oh received a B.A. in statistics from Korea University.
Jeong Rim Park is the head of our capital market business unit, corporate and investment banking business unit and asset management business unit and also serves as the chief executive officer of KB Securities. She previously served as a senior executive vice president of Kookmin Bank and the head of its wealth management group, as well as a senior executive vice president of KB Securities in charge of its wealth management division. Ms. Park received a B.A. in business administration and an M.B.A. from Seoul National University.
Sung Hyun Kim is the head of our corporate and investment banking business unit and also serves as the chief executive officer of KB Securities. He previously served as a senior executive vice president of the investment banking division of KB Securities. Mr. Kim received a B.A. in economics from Yonsei University.
Hyun Seung Lee is the head of our asset management business unit and also serves as the chief executive officer of KB Asset Management. He previously served as the chief executive officer of Hyundai Asset Management. Mr. Lee received a B.A. in business administration and an M.A. in public administration from Seoul National University and an M.A. in public administration from Harvard University.
Jin Young Kim is our chief public relations officer. He also serves as a senior managing director in Kookmin Bank’s brand strategy group. He previously served as a general manager of Kookmin Bank’s brand strategy department. Mr. Kim received a B.A. in law from Hanyang University and an M.A. in advertising and public relations from Yonsei University.
Mun Cheol Jeong is a senior executive vice president and directs our retail customer business unit. He also serves as a senior executive vice president of Kookmin Bank and the head of its retail consumer group. He previously served as the head of our small and medium enterprise business unit and a senior managing director of the strategy and finance planning group of Kookmin Bank. Mr. Jeong received a B.A. in business administration from Seoul National University and an M.B.A. from the Korea Advanced Institute of Science and Technology.
Jae Young Choi is a senior executive vice president and the head of our wealth management and pension business unit. He also serves as a senior executive vice president at the wealth management customer group of Kookmin Bank, a senior executive vice president of the wealth management business unit of KB Securities and a senior executive vice president of the wealth management and pension business unit of KB Insurance. He previously served as the head of our pension business division and Kookmin Bank’s pension business department. Mr. Choi received a B.A. in accounting information from Kookmin University and an M.B.A. from Yonsei University.
Sung Ki Kwon is a senior executive vice president and directs our small and medium enterprise business unit. He also serves as a senior executive vice president in the small and medium enterprise customer group of Kookmin Bank. He previously served as a senior managing director of the management supporting group of Kookmin Bank. Mr. Kwon received a B.A. in international trade from Kyungnam University.
Nam Hoon Cho is a senior managing director and our chief global strategy officer. He also serves as a senior managing director of the global business group at Kookmin Bank. He previously served as a managing director of the global business division of KB Securities. Mr. Cho received a B.A. in economics from Sungkyunkwan University.
156
Table of Contents
Young Suh Cho is our chief digital platform officer. He also serves as a senior managing director of Kookmin Bank’s digital transformation strategy division. He previously served at Shinhan DS (formerly Shinhan Data System) and Shinhan Financial Group, and as a partner at Bain & Company. Mr. Cho received a B.A. in economics from Seoul National University and an M.B.A. from Columbia University.
Jin Soo Yoon is our chief information technology officer. He also serves as a senior executive vice president of the tech group at Kookmin Bank. He previously served as our chief data officer. Mr. Yoon received a B.S. in computer science from Seoul National University and an M.S. and a Ph.D. from the Korea Advanced Institute of Science and Technology.
Chang Hwa Yook is our chief data officer. He also serves as a senior managing director of the data/AI division at Kookmin Bank. He previously served as the head of our data division. Mr. Yook received a B.S. in economics from Chungnam National University.
Sung Pyo Jeon is our chief customer contact officer. He also serves as a senior managing director of Kookmin Bank’s smart customer group. He previously headed our future contact center planning department. Mr. Jeon received a B.S. and an M.S. in land administration from Kangwon National University.
Jeong Ha is a senior executive vice president and directs our capital market business unit. He also serves as a senior executive vice president of Kookmin Bank’s capital markets group and KB Securities’ sales and trading group. He previously served as the head of Kookmin Bank’s capital markets division. Mr. Ha received a B.A. in business administration from Jeonbuk National University and an M.B.A. from the Korea Advanced Institute of Science and Technology.
Soon Bae Kang is a senior executive vice president and directs our corporate and investment banking business unit. He also serves as a senior executive vice president of Kookmin Bank’s corporate investment banking customer group and KB Securities’ investment banking group. He previously served as a senior managing director of Kookmin Bank’s structured finance division. Mr. Kang received an M.B.A. from Ajou University.
Nam Che Kang is the head of our global business division. He also serves as the head of the global growth supporting division at Kookmin Bank. He previously served as a general manager of KB Kookmin Card’s global business department. Mr. Kang received a B.A. in business administration from the University of Southern California.
Yoon Ha is the head of our customer experience design center. He also serves as the head of the customer experience design center at Kookmin Bank. He previously served as a principal designer of the customer experience innovation team at Samsung SDS. Mr. Ha received an M.S in psychology from Yonsei University and an M.S. in industrial design at Hongik University.
Yoo Shim Hur is the head of our digital contents center. She also serves as a managing director of the digital contents center at Kookmin Bank. She previously served as a vice president of SK Broadband. Ms. Hur received a B.A. in mass communication from the Hankuk University of Foreign Studies.
Ki Eun Park is the head of our technology innovation center. He also serves as a senior managing director of the technology innovation division at Kookmin Bank. He previously served as the chief technology officer at Naver Cloud. Mr. Park received a B.S. in electronic computation and an M.S. in computer science from Chung-Ang University.
Joo Hyun Kim is the head of our group cloud center. He also serves as the head of the cloud platform department of Kookmin Bank. He previously served as the head of the service technology center at Naver Cloud. Mr. Kim received a B.S. in computer science and statistics from Seoul National University.
157
Table of Contents
Soon Young Oh is the head of our financial AI center. She also serves as a managing director of the financial AI center at Kookmin Bank. She previously served as the chief technology officer of the research and development division at Hancom Inc. Ms. Oh received a B.S. in computer science from Seoul Women’s University.
Chan Yong Park is the head of our office of planning and coordination. He is also a senior managing director at Kookmin Bank’s planning and coordination department. He previously served as the head of Kookmin Bank’s shared service division. Mr. Park received a B.A. in business administration from Kwandong University.
Min Hyuk Kang is the head of our office of capital market planning. He is also the head of Kookmin Bank’s trading and capital markets planning department and a managing director at KB Securities’ capital market planning department. He previously served as a general manager of Kookmin Bank’s treasury department. Mr. Kang received a B.A. in business administration from Jeju National University and an M.A. in economics from Yonsei University.
| Item 6.B. | Compensation |
The aggregate remuneration paid and benefits-in-kind granted, excluding stock grants, by us and our subsidiaries to our chairman and chief executive officer, our other executive and non-standing directors, our non-executive directors and our executive officers for the year ended December 31, 2022 was ₩25,410 million. For the year ended December 31, 2022, we set aside ₩745 million for allowances for severance and retirement benefits for our chairman and chief executive officer, the other executive directors and our executive officers.
Among those who received total annual compensation exceeding ₩500 million in 2022 at the holding company level, the five highest-paid individuals were as follows:
Name | Position | Total Compensation in 2022 | Incentive Compensation for Payment | |||
Jong Kyoo Yoon | Chairman and Chief Executive Officer | ₩1,835 | 14,972 | |||
Pil Kyu Im | Senior Executive Vice President and Chief Risk Management Officer | 1,145 | 8,674 | |||
Jong Hee Yang | Vice Chairman and Head of Retail Customer, Wealth Management and Pension, Small and Medium Enterprise Business Units | 737 | 1,737 | |||
Soon Beom Kwon | Managing Director | 596 | 3,786 | |||
Jong Hoon Lee | Head of the Legal Affairs Unit | 587 | — |
| (1) | Includes annual salary and performance-based incentive payments paid by the holding company. |
| (2) | Consists of performance-based shares expected to be granted by the holding company in the future. The actual payment amount will be determined at the time of payment based on the then-current market price of our common shares. |
We do not have service contracts with any of our directors or executive officers providing for benefits upon termination of their employment with us.
In 2008, we established a stock grant plan. Pursuant to this plan, we have entered into performance share agreements with certain of our and our subsidiaries’ directors and executive officers, whereby we may grant
158
Table of Contents
shares of our common stock (or the equivalent monetary amount based on the market value of such shares) within specified periods as long-term incentive performance shares in accordance with pre-determined performance targets. See “Item 6.E. Share Ownership—Performance Share Agreements.” In 2022, we incurred ₩58,275 million of compensation costs relating to stock grants under such agreements. See Note 32 of the notes to our consolidated financial statements included elsewhere in this annual report.
| Item 6.C. | Board Practices |
See “Item 6.A. Directors and Senior Management” above for information concerning the terms of office and contractual employment arrangements with our directors and executive officers.
Committees of the Board of Directors
We currently have the following committees that serve under the board:
| • | the Audit Committee; |
| • | the Risk Management Committee; |
| • | the Evaluation & Compensation Committee; |
| • | the Non-Executive Director Nominating Committee; |
| • | the Audit Committee Member Nominating Committee; |
| • | the CEO Nominating Committee; |
| • | the Subsidiaries’ CEO Director Nominating Committee; and |
| • | the ESG Committee. |
Each committee member is appointed by the board of directors, except for members of the Audit Committee, who are elected at the general meeting of stockholders.
Audit Committee
The committee currently consists of four non-executive directors, Whajoon Cho, Kyung Ho Kim, Seon-joo Kwon and Sung-Yong Kim. The chairperson of the Audit Committee is Whajoon Cho. The committee oversees our financial reporting and approves the appointment of our independent registered public accounting firm. The committee also reviews our financial information, auditor’s examinations, key financial statement issues, the plans and evaluation of internal control and the administration of our financial affairs by the board of directors. In connection with the general meetings of stockholders, the committee examines the agenda for, and financial statements and other reports to be submitted by, the board of directors to each general meeting of stockholders. The committee holds regular meetings every quarter.
Risk Management Committee
The committee currently consists of four non-executive directors, Seon-joo Kwon, Gyutaeg Oh, Whajoon Cho and Jungsung Yeo. The chairperson of the committee is Seon-joo Kwon. The Risk Management Committee oversees and makes determinations on all issues relating to our comprehensive risk management function. In order to ensure our stable financial condition and to maximize our profits, the committee monitors our overall risk exposure and reviews our compliance with risk policies and risk limits. In addition, the committee reviews risk and control strategies and policies, evaluates whether each risk is at an adequate level, establishes or abolishes risk management divisions and reviews risk-based capital allocations as well as recovery and resolution plans. The committee holds regular meetings every quarter.
159
Table of Contents
Evaluation & Compensation Committee
The committee currently consists of four non-executive directors, Jungsung Yeo, Kyung Ho Kim, Whajoon Cho and Sung-Yong Kim. The chairperson of the committee is Jungsung Yeo. The Evaluation and Compensation Committee reviews compensation schemes and compensation levels of us and our subsidiaries. The committee is also responsible for deliberating and deciding the compensation of directors, evaluating management’s performance and implementing management training programs, as well as deciding and supervising the performance-based annual salary of the president and the executive officers of us and our subsidiaries. The committee holds regular meetings semi-annually.
Non-executive Director Nominating Committee
The committee currently consists of four non-executive directors, Jaehong Choi, Kyung Ho Kim, Seon-joo Kwon and Gyutaeg Oh. The chairperson of the committee is Jaehong Choi. The committee is responsible for the management and evaluation of a pool of non-executive director candidates and recommendation of the non-executive director candidates to be nominated at the annual general meeting of shareholders.
Audit Committee Member Nominating Committee
The committee currently consists of all seven of our non-executive directors. As of the date of this annual report, the committee has not appointed a chairperson. The committee oversees the selection of Audit Committee member candidates and recommends them annually sometime prior to the general stockholders meeting. The term of office of its members is from the first meeting of the committee held to nominate the Audit Committee members until the Audit Committee members are appointed.
CEO Nominating Committee
The committee currently consists of all seven of our non-executive directors. The chairperson of the CEO Nominating Committee is Kyung Ho Kim. The committee is responsible for establishing and monitoring procedures for our CEO candidate cultivation and succession program pursuant to our “CEO Succession Regulations,” which cover, among other things, the qualifications of CEO candidates, continued maintenance of the candidate pool and the CEO candidate nomination process. The committee holds regular meetings semi-annually.
Subsidiaries’ CEO Director Nominating Committee
The committee currently consists of one non-standing director, Jae Keun Lee, and three non-executive directors, Gyutaeg Oh, Jungsung Yeo and Jaehong Choi, together with our chairman and chief executive officer, Jong Kyoo Yoon. The chairperson of the Subsidiaries’ CEO Director Nominating Committee is Jong Kyoo Yoon. The committee is responsible for candidate cultivation and succession programs for chief executive officers of our subsidiaries. The committee holds regular meetings semi-annually.
ESG Committee
The Committee currently consists of all seven of our non-executive directors, one non-standing director, Jae Keun Lee, and our chairman and chief executive officer, Jong Kyoo Yoon. The chairperson of the ESG Committee is Gyutaeg Oh. The committee is responsible for establishing and enforcing strategies and policies relating to non-financial aspects of our business, which consist of the environment, social responsibility and corporate governance, in order to promote sustainable development and enhance our corporate value. The committee also manages ESG-related products and investments and monitors ESG-related global initiatives and community outreach efforts. The committee holds regular meetings semi-annually.
160
Table of Contents
| Item 6.D. | Employees |
As of December 31, 2022, we had a total of 145 full-time employees, excluding 32 executive officers, at our financial holding company.
The following table sets forth information regarding our employees at both our financial holding company and our subsidiaries as of the dates indicated:
| As of December 31, | ||||||||||||||
| 2020 | 2021 | 2022 | ||||||||||||
KB Financial Group | Full-time employees(1) | 154 | 149 | 145 | ||||||||||
| Contractual employees | — | — | — | |||||||||||
| Managerial employees | 134 | 133 | 131 | |||||||||||
| Members of Korea Financial Industry Union | — | — | — | |||||||||||
Kookmin Bank | Full-time employees(1) | 16,054 | 15,333 | 14,697 | ||||||||||
| Contractual employees | 1,728 | 1,899 | 2,429 | |||||||||||
| Managerial employees | 9,026 | 8,474 | 8,063 | |||||||||||
| Members of Korea Financial Industry Union | 14,266 | 13,989 | 13,016 | |||||||||||
Other subsidiaries | Full-time employees(1) | 9,319 | 9,181 | 9,171 | ||||||||||
| Contractual employees | 1,062 | 1,092 | 1,233 | |||||||||||
| Managerial employees | 5,256 | 5,190 | 5,341 | |||||||||||
| Members of Korea Financial Industry Union | 6,565 | 6,486 | 6,587 | |||||||||||
| (1) | Excluding executive officers. |
We consider our relations with our employees to be satisfactory. We and our subsidiaries each have a joint labor-management council which serves as a forum for ongoing discussions between our management and employees. At eight of our subsidiaries, Kookmin Bank, KB Securities, KB Insurance, KB Kookmin Card, KB Capital, KB Real Estate Trust, KB Data Systems and KB Credit Information, our employees have a labor union. Every year, the unions at Kookmin Bank, KB Securities, KB Insurance, KB Kookmin Card, KB Capital, KB Real Estate Trust, KB Data Systems and KB Credit Information and their respective managements negotiate and enter into new collective bargaining agreements and negotiate annual wage adjustments.
Our compensation packages consist of base salary and base bonuses. We also provide performance-based compensation to employees and management officers, including those of our subsidiaries, depending on the level of responsibility of the employee or officer and business of the relevant subsidiary. Typically, executive officers, heads of regional headquarters and employees in positions that require professional skills, such as fund managers and dealers, are compensated depending on their individual annual performance evaluation. Also, Kookmin Bank has implemented a profit-sharing system in order to enhance the performance of Kookmin Bank’s employees. Under this system, Kookmin Bank pays bonuses to its employees, in addition to the base salary and depending on Kookmin Bank’s annual performance.
In January 2016, Kookmin Bank implemented a “mileage stock” program, pursuant to which its employees may receive performance-based cash payments that correspond to the market value of our common shares. The accumulated “miles” of common shares can be exercised for cash during a two-year period commencing on the one-year anniversary of the grant date.
We provide a wide range of benefits to our employees, including our executive directors. Specific benefits provided may vary for each of our subsidiaries but generally include medical insurance, employment insurance, workers compensation, employee and spouse life insurance, free medical examinations, child tuition and fee reimbursement, disabled child financial assistance and reimbursement for medical expenses, and other benefits may be provided depending on the subsidiary.
161
Table of Contents
In accordance with the National Pension Act, we contribute an amount equal to 4.5% of employee wages, and each employee contributes 4.5% of his or her wages, into each employee’s personal pension account. In addition, in accordance with the Guarantee of Worker’s Retirement Benefits Act, we have adopted a retirement pension plan for our employees. Contributions under the retirement pension plan are deposited annually into a financial institution, and an employee may elect to receive a monthly pension or a lump-sum amount upon retirement. Our retirement pension plans are provided in the form of a defined benefit plan and a defined contribution plan. The defined benefit plan guarantees a certain payout at retirement, according to a fixed formula based on the employee’s average salary and the number of years for which the employee has been a plan member. The defined contribution plan, in which the employer’s contribution is determined in advance based on one twelfth of an employee’s total annual pay, is managed directly by the employees. Under Korean law, we may not terminate the employment of full-time employees except under certain limited circumstances. However, from time to time, we invite our employees to apply for our early retirement programs, which provide for varying amounts of severance pay based on the duration of time an employee has worked for us, along with several other key features. We believe that such programs enhance our productivity and efficiency by improving our labor structure.
In June 2009, we established an employee stock ownership association. All of our employees are eligible to participate in this association. We are not required to, and do not, make cash contributions to this plan. Members of our employee stock ownership association have pre-emptive rights to acquire up to 20% of our shares issued in public offerings by us pursuant to the Financial Investment Services and Capital Markets Act. In August 2009, we offered to members of our employee stock ownership association 6,000,000 of the 30,000,000 new shares of common stock to be issued in our rights offering to our existing shareholders, and the entire amount was subscribed by members of our employee stock ownership association. The employee stock ownership association held 9,253,663 shares of our common stock as of December 31, 2022.
Employees of Kookmin Bank have been eligible to participate in its employee stock ownership association, which will be terminated once all of our common stock held by the association (which the association received following the transfer of Kookmin Bank shares held by it as a result of the comprehensive stock transfer pursuant to which we were established) have been distributed to the relevant Kookmin Bank employees at the requests of such employees following the expiration of the required holding periods. As of December 31, 2022, such employee stock ownership association held 236,308 shares of our common stock.
In order to develop our next generation of leaders and enhance the operational capability of our employees at each of our subsidiaries, we operate various employee training programs. These programs, which are aimed at cultivating financial specialists with higher levels of management and business skills, developing regional experts for increased global capabilities and enhancing employee loyalty, comprise a number of customized programs such as training courses for employees of different positions, domestic and foreign M.B.A. courses and intensive human resources development programs for high performers to cultivate future leaders. For example, Kookmin Bank offers training programs at its employees’ worksites to facilitate access to training, as well as a foreign regional expert training program and a global language training course. We also provide financial and other support for our employees to develop their finance-related knowledge and skills by enrolling in training courses or engaging in self-study programs. The broad spectrum of training programs, combined with the state-of-the-art technologies such as cyber training, satellite broadcasting and mobile-learning, maximizes the level of exposure of the trainees to the contents of the programs. We also believe that our training scheme based on classified training courses and a development evaluation system has facilitated systemic development of employee skills and a spontaneous learning environment.
| Item 6.E. | Share Ownership |
Common Stock
As of March 31, 2023, the persons who are currently our directors or executive officers, as a group, held an aggregate of 77,787 shares of our common stock, representing approximately 0.02% of the issued shares of our
162
Table of Contents
common stock as of such date. None of these persons individually held more than 1% of the outstanding shares of our common stock as of such date. The following table presents information regarding our directors and executive officers who beneficially owned our shares as of March 31, 2023:
Name of Executive Officer or Director | Number of Shares of Common Stock | |||
Jong Kyoo Yoon | 21,000 | |||
Jae Keun Lee | 1,119 | |||
Jong Hee Yang | 914 | |||
Yin Hur | 13,506 | |||
Dong Cheol Lee | 3,325 | |||
Scott Y. H. Seo | 0 | |||
Cheal Soo Choi | 4 | |||
Dong Whan Han | 1,100 | |||
Se Min Kim | 174 | |||
Bong Joong Kwon | 286 | |||
Yeo Woon Yoon | 609 | |||
Hye Ja Seo | 1,356 | |||
Jin Gyu Maeng | 1,027 | |||
Hye Sook Moon | 652 | |||
Byung Joo Oh | 940 | |||
Jeong Rim Park | 3,150 | |||
Sung Hyun Kim | 15,468 | |||
Hyun Seung Lee | 0 | |||
Jin Young Kim | 765 | |||
Mun Cheol Jeong | 3,092 | |||
Jae Young Choi | 980 | |||
Sung Ki Kwon | 568 | |||
Nam Hoon Cho | 1,000 | |||
Young Suh Cho | 1,000 | |||
Jin Soo Yoon | 375 | |||
Chang Hwa Yook | 545 | |||
Sung Pyo Jeon | 976 | |||
Jeong Ha | 0 | |||
Soon Bae Kang | 1,290 | |||
Nam Che Kang | 485 | |||
Yoon Ha | 0 | |||
Yoo Shim Hur | 0 | |||
Ki Eun Park | 258 | |||
Joo Hyun Kim | 122 | |||
Soon Young Oh | 0 | |||
Chan Yong Park | 1,011 | |||
Min Hyuk Kang | 690 | |||
|
| |||
Total | 77,787 | |||
|
| |||
Performance Share Agreements
Pursuant to a stock grant plan we established in 2008, we have entered into performance share agreements with certain of our and our subsidiaries’ directors and executive officers, pursuant to which we may grant shares of our common stock (or the equivalent monetary amount based on the market value of such shares) within specified periods as long-term incentive performance shares in accordance with pre-determined performance
163
Table of Contents
targets. Since January 2010, in accordance with the best practice guidelines for outside directors of banking institutions announced by the Korea Federation of Banks, which have been replaced with the Financial Corporate Governance Code issued by the Financial Services Commission in December 2014, we have not entered into any performance share agreements with our non-executive directors.
| Item 6.F. | Disclosure of a Registrant’s Action to Recover Erroneously Awarded Compensation |
Not applicable.
| Item 7. | MAJOR SHAREHOLDERS AND RELATED PARTY TRANSACTIONS |
| Item 7.A. | Major Shareholders |
The following table presents information regarding the beneficial ownership of our shares at December 31, 2022 by each person or entity known to us to own beneficially more than 5% of our issued and outstanding shares.
Except as otherwise indicated, each stockholder identified by name has:
| • | sole voting and investment power with respect to its shares; and |
| • | record and beneficial ownership with respect to its shares. |
Beneficial Owner | Number of Shares of Common Stock | Percentage of Total Outstanding Shares of Common Stock (%)(1) | ||||||
Korean National Pension Service | 32,499,151 | 8.34 | % | |||||
JP Morgan Chase Bank, N.A.(2) | 25,435,390 | 6.53 | % | |||||
BlackRock Fund Advisors | 25,050,939 | (3) | 6.43 | % | ||||
| (1) | Calculated based on 389,634,335 shares of our common stock outstanding as of December 31, 2022. |
| (2) | As depositary bank. |
| (3) | As of February 26, 2021, based on disclosure made by BlackRock Fund Advisors in a statement of acquisition filing on March 10, 2021. |
Other than as set forth above, no other person or entity known by us to be acting in concert, directly or indirectly, jointly or separately, owned 5.0% or more of the issued shares of our common stock or exercised control or could exercise control over us as of December 31, 2022. None of our major stockholders has different voting rights from our other stockholders.
As of December 31, 2022, there were 389,634,335 shares of common stock outstanding. Of the total outstanding shares, 25,435,390 shares were held in the form of ADSs and 99,603,339 shares were held of record in the form of common stock by residents in the United States. As of December 31, 2022, the number of registered holders of our ADSs was 21 and the number of holders of our common stock in the United States was 2,068.
| Item 7.B. | Related Party Transactions |
As of December 31, 2022, we had an aggregate of ₩6,306 million in loans outstanding to our executive officers and directors, executive officers and directors of Kookmin Bank and chief executive officers of our other subsidiaries, including family members of such individuals. In addition, as of such date, we had loans outstanding to various companies whose directors or executive officers were serving concurrently as our directors or executive officers. See Note 43 of the notes to our consolidated financial statements included elsewhere in this annual report. All of these loans were made in the ordinary course of business, on substantially the same terms, including interest rate and collateral, as those prevailing at the time for comparable transactions with other persons and did not involve more than the normal risk of collectability or present other unfavorable features.
164
Table of Contents
None of our directors or officers have or had any interest in any transactions effected by us that are or were unusual in their nature or conditions or significant to our business which were effected during the current or immediately preceding year or were effected during an earlier year and remain in any respect outstanding or unperformed.
| Item 7.C. | Interests of Experts and Counsel |
Not applicable.
| Item 8. | FINANCIAL INFORMATION |
| Item 8.A. | Consolidated Statements and Other Financial Information |
See “Item 18. Financial Statements” and pages F-1 through F-252.
You should read the following data together with the more detailed information contained in “Item 5. Operating and Financial Review and Prospects” and our consolidated financial statements included elsewhere in this annual report. Historical results do not necessarily predict future results.
Profitability ratios and other data
| As of or for the year Ended December 31, | ||||||||||||
| 2020 | 2021 | 2022 | ||||||||||
| (Percentages) | ||||||||||||
Net interest spread(1) | 1.86 | 1.97 | 2.05 | |||||||||
Net interest margin(2) | 1.99 | 2.07 | 2.23 | |||||||||
Efficiency ratio(3) | 54.56 | 49.72 | 50.21 | |||||||||
Cost-to-average assets ratio(4) | 1.19 | 1.14 | 1.08 | |||||||||
Won loans (gross) as a percentage of Won deposits | 112.16 | 112.81 | 112.02 | |||||||||
Total loans (gross) as a percentage of total deposits | 112.37 | 113.32 | 113.32 | |||||||||
| (1) | Represents the difference between the yield on average interest-earning assets and cost of average interest-bearing liabilities. |
| (2) | Represents the ratio of net interest income to average interest-earning assets. |
| (3) | Represents the ratio of general and administrative expenses to the sum of net interest income, net fee and commission income, net insurance income, net gain on financial assets and liabilities at fair value through profit or loss and net other operating income. |
| (4) | Represents the ratio of general and administrative expenses to average total assets. |
Capital ratios
| As of or for the year Ended December 31, | ||||||||||||
| 2020 | 2021 | 2022 | ||||||||||
| (Percentages) | ||||||||||||
Consolidated capital adequacy ratio of KB Financial Group(1) | 15.28 | % | 15.77 | % | 16.16 | % | ||||||
Capital adequacy ratios of Kookmin Bank | ||||||||||||
Tier I capital adequacy ratio(2) | 15.42 | 14.98 | 14.92 | |||||||||
Common equity Tier I capital adequacy ratio(2) | 15.10 | 14.70 | 14.50 | |||||||||
Tier II capital adequacy ratio(2) | 2.36 | 2.50 | 2.54 | |||||||||
Average stockholders’ equity as a percentage of average total assets | 7.14 | 7.23 | 6.99 | |||||||||
| (1) | Under applicable guidelines of the Financial Services Commission, we, as a bank holding company, were required to maintain a total minimum consolidated capital adequacy ratio of 11.5% (including applicable additional capital buffers and requirements) as of December 31, 2022. See “Item 4.B. Business Overview—Supervision and Regulation—Principal Regulations Applicable to Financial Holding Companies—Capital Adequacy.” |
| (2) | Kookmin Bank’s capital adequacy ratios are computed in accordance with the guidelines issued by the Financial Services Commission. See “Item 4.B. Business Overview—Supervision and Regulation—Principal Regulations Applicable to Banks—Capital Adequacy.” |
165
Table of Contents
Credit portfolio ratios and other data
| As of December 31, | ||||||||
| 2021 | 2022 | |||||||
| (in billions of Won, except percentages) | ||||||||
Total loans(1) | ₩ | 421,585 | ₩ | 440,689 | ||||
Total non-performing loans(2) | 1,458 | 1,918 | ||||||
Other impaired loans not included in non-performing loans | 2,029 | 1,636 | ||||||
Total of non-performing loans and other impaired loans | 3,487 | 3,554 | ||||||
Total allowances for loan losses | 3,685 | 4,158 | ||||||
Non-performing loans as a percentage of total loans | 0.35 | % | 0.44 | % | ||||
Non-performing loans as a percentage of total assets | 0.22 | % | 0.27 | % | ||||
Total of non-performing loans and other impaired loans as a percentage of total loans | 0.83 | % | 0.81 | % | ||||
Allowances for loan losses as a percentage of total loans | 0.87 | % | 0.94 | % | ||||
| (1) | Before deduction of allowances for loan losses. |
| (2) | Non-performing loans are defined as those loans, including corporate, retail and other loans, which are past due by 90 days or more. |
166
Table of Contents
Selected Statistical Information
Average Balance Sheets and Related Interest
The following table shows our average balances and interest rates for the past three years:
| Year Ended December 31, | ||||||||||||||||||||||||||||||||||||
| 2020 | 2021 | 2022 | ||||||||||||||||||||||||||||||||||
| Average Balance(1) | Interest Income(2) | Average Yield | Average Balance(1) | Interest Income(2) | Average Yield | Average Balance(1) | Interest Income(2) | Average Yield | ||||||||||||||||||||||||||||
| (in billions of Won, except percentages) | ||||||||||||||||||||||||||||||||||||
Assets | ||||||||||||||||||||||||||||||||||||
Due from financial institutions measured at amortized cost | ₩ | 12,280 | ₩ | 92 | 0.75 | % | ₩ | 13,261 | ₩ | 66 | 0.50 | % | ₩ | 15,097 | ₩ | 159 | 1.05 | % | ||||||||||||||||||
Financial instruments at fair value through profit or loss (debt securities)(3) | 30,232 | 659 | 2.18 | 31,670 | 590 | 1.86 | 27,371 | 876 | 3.20 | |||||||||||||||||||||||||||
Financial investments (debt securities)(4) | 80,087 | 1,355 | 1.69 | 97,296 | 1,557 | 1.60 | 105,980 | 2,211 | 2.09 | |||||||||||||||||||||||||||
Loans: | ||||||||||||||||||||||||||||||||||||
Corporate | 158,508 | 4,547 | 2.87 | 168,868 | 4,511 | 2.67 | 197,172 | 6,745 | 3.42 | |||||||||||||||||||||||||||
Mortgage | 82,765 | 2,161 | 2.61 | 88,769 | 2,239 | 2.52 | 91,781 | 2,760 | 3.01 | |||||||||||||||||||||||||||
Home equity | 27,682 | 786 | 2.84 | 27,333 | 723 | 2.65 | 27,258 | 903 | 3.31 | |||||||||||||||||||||||||||
Other consumer(5) | 64,220 | 2,639 | 4.11 | 71,587 | 2,922 | 4.08 | 69,789 | 3,552 | 5.09 | |||||||||||||||||||||||||||
Credit cards(6) | 18,586 | 1,438 | 7.74 | 19,923 | 1,441 | 7.23 | 22,103 | 1,568 | 7.09 | |||||||||||||||||||||||||||
Foreign(7) | 14,683 | 809 | 5.51 | 22,580 | 1,162 | 5.15 | 32,309 | 2,015 | 6.24 | |||||||||||||||||||||||||||
|
|
|
|
|
|
|
|
|
|
|
| |||||||||||||||||||||||||
Loans (total) | 366,444 | 12,380 | 3.38 | 399,060 | 12,998 | 3.26 | 440,412 | 17,543 | 3.98 | |||||||||||||||||||||||||||
|
|
|
|
|
|
|
|
|
|
|
| |||||||||||||||||||||||||
Total average interest-earning assets | ₩ | 489,043 | ₩ | 14,486 | 2.96 | % | ₩ | 541,287 | ₩ | 15,211 | 2.81 | % | ₩ | 588,860 | ₩ | 20,789 | 3.53 | % | ||||||||||||||||||
|
|
|
|
|
|
|
|
|
|
|
| |||||||||||||||||||||||||
Cash and due from banks | 13,274 | — | — | 14,946 | — | — | 15,893 | — | — | |||||||||||||||||||||||||||
Financial assets at fair value through profit or loss (excluding debt securities): | ||||||||||||||||||||||||||||||||||||
Equity securities | 5,225 | — | — | 4,443 | — | — | 4,671 | — | — | |||||||||||||||||||||||||||
Other | 22,952 | — | — | 26,566 | — | — | 33,525 | — | — | |||||||||||||||||||||||||||
|
|
|
|
|
|
|
|
|
|
|
| |||||||||||||||||||||||||
Financial assets at fair value through profit or loss (excluding debt securities) (total) | 28,177 | — | — | 31,009 | — | — | 38,196 | — | — | |||||||||||||||||||||||||||
Financial investment (equity securities) | 2,427 | — | — | 3,684 | — | — | 3,285 | — | — | |||||||||||||||||||||||||||
Investment in associates | 612 | — | — | 555 | — | — | 595 | — | — | |||||||||||||||||||||||||||
Derivative financial assets | 4,189 | — | — | 3,899 | — | — | 8,903 | — | — | |||||||||||||||||||||||||||
Premises and equipment | 8,048 | — | — | 8,130 | — | — | 8,095 | — | — | |||||||||||||||||||||||||||
Intangible assets | 3,000 | — | — | 3,279 | — | — | 3,232 | — | — | |||||||||||||||||||||||||||
Allowances for loan losses | (2,954 | ) | — | — | (3,606 | ) | — | — | (4,002 | ) | — | — | ||||||||||||||||||||||||
Other non-interest-earning assets | 25,450 | — | — | 30,851 | — | — | 31,818 | — | — | |||||||||||||||||||||||||||
|
|
|
|
|
|
|
|
|
|
|
| |||||||||||||||||||||||||
Total average non-interest earning assets | 82,223 | — | — | 92,747 | — | — | 106,015 | — | — | |||||||||||||||||||||||||||
|
|
|
|
|
|
|
|
|
|
|
| |||||||||||||||||||||||||
Total average assets | ₩ | 571,266 | ₩ | 14,486 | 2.54 | % | ₩ | 634,034 | ₩ | 15,211 | 2.40 | % | ₩ | 694,875 | ₩ | 20,789 | 2.99 | % | ||||||||||||||||||
|
|
|
|
|
|
|
|
|
|
|
| |||||||||||||||||||||||||
167
Table of Contents
| Year Ended December 31, | ||||||||||||||||||||||||||||||||||||
| 2020 | 2021 | 2022 | ||||||||||||||||||||||||||||||||||
| Average Balance(1) | Interest Expense | Average Cost | Average Balance(1) | Interest Expense | Average Cost | Average Balance(1) | Interest Expense | Average Cost | ||||||||||||||||||||||||||||
| (in billions of Won, except percentages) | ||||||||||||||||||||||||||||||||||||
Liabilities | ||||||||||||||||||||||||||||||||||||
Deposits: | ||||||||||||||||||||||||||||||||||||
Demand deposits | ₩ | 149,141 | ₩ | 267 | 0.18 | % | ₩ | 180,936 | ₩ | 280 | 0.15 | % | ₩ | 182,468 | ₩ | 448 | 0.25 | % | ||||||||||||||||||
Time deposits | 166,275 | 2,600 | 1.56 | 158,795 | 1,907 | 1.20 | 187,934 | 3,958 | 2.11 | |||||||||||||||||||||||||||
Certificates of deposit | 3,636 | 50 | 1.38 | 3,618 | 31 | 0.86 | 5,511 | 130 | 2.36 | |||||||||||||||||||||||||||
|
|
|
|
|
|
|
|
|
|
|
| |||||||||||||||||||||||||
Deposits (total) | 319,052 | 2,917 | 0.91 | 343,349 | 2,218 | 0.65 | 375,913 | 4,536 | 1.21 | |||||||||||||||||||||||||||
Borrowings: | ||||||||||||||||||||||||||||||||||||
Bonds sold under repurchase agreements | 13,975 | 126 | 0.9 | 14,126 | 105 | 0.74 | 11,257 | 207 | 1.84 | |||||||||||||||||||||||||||
Other borrowings(8) | 39,359 | 535 | 1.36 | 48,781 | 488 | 1.00 | 62,628 | 1,291 | 2.06 | |||||||||||||||||||||||||||
Borrowings (total) | 53,334 | 661 | 1.24 | 62,907 | 593 | 0.94 | 73,885 | 1,498 | 2.03 | |||||||||||||||||||||||||||
Debentures | 59,379 | 1,186 | 2.00 | 65,759 | 1,170 | 1.78 | 70,132 | 1,641 | 2.34 | |||||||||||||||||||||||||||
|
|
|
|
|
|
|
|
|
|
|
| |||||||||||||||||||||||||
Total average interest-bearing liabilities | ₩ | 431,765 | ₩ | 4,764 | 1.10 | % | ₩ | 472,015 | ₩ | 3,981 | 0.84 | % | ₩ | 519,930 | ₩ | 7,676 | 1.48 | % | ||||||||||||||||||
|
|
|
|
|
|
|
|
|
|
|
| |||||||||||||||||||||||||
Non-interest bearing demand deposits | 4,533 | — | — | 5,263 | — | — | 5,427 | — | — | |||||||||||||||||||||||||||
Derivative financial liabilities | 4,474 | — | — | 3,704 | — | — | 9,353 | — | — | |||||||||||||||||||||||||||
Financial liabilities at fair value through profit or loss | 13,464 | — | — | 12,461 | — | — | 12,704 | — | — | |||||||||||||||||||||||||||
Other non-interest-bearing liabilities | 75,499 | — | — | 93,885 | — | — | 97,670 | — | — | |||||||||||||||||||||||||||
|
|
|
|
|
|
|
|
|
|
|
| |||||||||||||||||||||||||
Total average non-interest bearing liabilities | 97,970 | — | — | 115,313 | — | — | 125,154 | — | — | |||||||||||||||||||||||||||
|
|
|
|
|
|
|
|
|
|
|
| |||||||||||||||||||||||||
Total average liabilities | 529,735 | 4,764 | 0.90 | 587,328 | 3,981 | 0.68 | 645,084 | 7,676 | 1.19 | % | ||||||||||||||||||||||||||
|
|
|
|
|
|
|
|
|
|
|
| |||||||||||||||||||||||||
Total equity | 41,531 | — | — | 46,706 | — | — | 49,791 | — | — | |||||||||||||||||||||||||||
|
|
|
|
|
|
|
|
|
|
|
| |||||||||||||||||||||||||
Total average liabilities and equity | ₩ | 571,266 | ₩ | 4,764 | 0.83 | % | ₩ | 634,034 | ₩ | 3,981 | 0.63 | % | ₩ | 694,875 | ₩ | 7,676 | 1.10 | % | ||||||||||||||||||
|
|
|
|
|
|
|
|
|
|
|
| |||||||||||||||||||||||||
| (1) | Average balances are based on daily balances for our banking, credit card and securities operations and monthly or quarterly balances for our other operations. |
| (2) | We do not invest in any tax-exempt securities. |
| (3) | Includes deposits and loans at fair value through profit or loss. For information on interest income arising from such financial instruments, see Note 28 of the notes to our consolidated financial statements included elsewhere in this annual report. |
| (4) | Comprises financial assets at fair value through other comprehensive income and at amortized cost, and includes loans at fair value through other comprehensive income. For information on interest income arising from such financial instruments, see Note 28 of the notes to our consolidated financial statements included elsewhere in this annual report. Information related to investment securities classified as financial assets at fair value through other comprehensive income has been computed using amortized cost, and therefore does not give effect to changes in fair value that are reflected as a component of total equity. |
| (5) | Includes other interest income. |
| (6) | Interest income from credit cards includes principally cash advance fees of ₩195 billion, ₩185 billion and ₩190 billion and interest on credit card loans of ₩722 billion, ₩743 billion and ₩768 billion for the years ended December 31, 2020, 2021 and 2022, respectively, but does not include interchange fees. |
| (7) | Consists primarily of loans from the overseas branches of our subsidiaries to affiliates of large Korean manufacturing companies for trade financing and working capital. |
| (8) | Includes (i) lease-related interest expense pursuant to our adoption of IFRS 16 Leases and (ii) other interest expense. |
168
Table of Contents
The following table presents our net interest spread, net interest margin, and asset liability ratio for the past three years:
| Year Ended December 31, | ||||||||||||
| 2020 | 2021 | 2022 | ||||||||||
| (percentages) | ||||||||||||
Net interest spread(1) | 1.86 | % | 1.97 | % | 2.05 | % | ||||||
Net interest margin(2) | 1.99 | 2.07 | 2.23 | |||||||||
Average asset liability ratio(3) | 113.27 | 114.68 | 113.26 | |||||||||
| (1) | The difference between the average rate of interest earned on interest-earning assets and the average rate of interest paid on interest-bearing liabilities. |
| (2) | The ratio of net interest income to average interest-earning assets. |
| (3) | The ratio of average interest-earning assets to average interest-bearing liabilities. |
Analysis of Changes in Net Interest Income—Volume and Rate Analysis
The following table provides an analysis of changes in interest income, interest expense and net interest income based on changes in volume and changes in rate for 2020 compared to 2021 and 2021 compared to 2022. Information is provided with respect to: (1) effects attributable to changes in volume (changes in volume multiplied by prior rate) and (2) effects attributable to changes in rate (changes in rate multiplied by prior volume). Changes attributable to the combined impact of changes in rate and volume have been allocated proportionately to the changes due to volume changes and changes due to rate changes.
| 2021 vs. 2020 Increase/(Decrease) Due to Change in | 2022 vs. 2021 Increase/(Decrease) Due to Change in | |||||||||||||||||||||||
| Volume | Rate | Total | Volume | Rate | Total | |||||||||||||||||||
| (in billions of Won) | ||||||||||||||||||||||||
Interest-earning assets | ||||||||||||||||||||||||
Due from financial institutions measured at amortized cost | ₩ | 7 | ₩ | (33 | ) | ₩ | (26 | ) | ₩ | 10 | ₩ | 83 | ₩ | 93 | ||||||||||
Financial instruments at fair value through profit or loss (debt securities)(1) | 30 | (99 | ) | (69 | ) | (89 | ) | 375 | 286 | |||||||||||||||
Financial investments (debt securities)(2) | 277 | (75 | ) | 202 | 148 | 506 | 654 | |||||||||||||||||
Loans: | ||||||||||||||||||||||||
Corporate | 289 | (325 | ) | (36 | ) | 835 | 1,399 | 2,234 | ||||||||||||||||
Mortgage | 154 | (76 | ) | 78 | 77 | 444 | 521 | |||||||||||||||||
Home equity | (10 | ) | (53 | ) | (63 | ) | (2 | ) | 182 | 180 | ||||||||||||||
Other consumer | 302 | (19 | ) | 283 | (75 | ) | 705 | 630 | ||||||||||||||||
Credit cards | 101 | (98 | ) | 3 | 155 | (28 | ) | 127 | ||||||||||||||||
Foreign | 409 | (56 | ) | 353 | 572 | 281 | 853 | |||||||||||||||||
|
|
|
|
|
|
|
|
|
|
|
| |||||||||||||
Total interest income | ₩ | 1,559 | ₩ | (834 | ) | ₩ | 725 | ₩ | 1,631 | ₩ | 3,947 | ₩ | 5,578 | |||||||||||
|
|
|
|
|
|
|
|
|
|
|
| |||||||||||||
| 2021 vs. 2020 Increase/(Decrease) Due to Change in | 2022 vs. 2021 Increase/(Decrease) Due to Change in | |||||||||||||||||||||||
| Volume | Rate | Total | Volume | Rate | Total | |||||||||||||||||||
| (in billions of Won) | ||||||||||||||||||||||||
Interest-bearing liabilities | ||||||||||||||||||||||||
Deposits: | ||||||||||||||||||||||||
Demand deposits | ₩ | 58 | ₩ | (45 | ) | ₩ | 13 | ₩ | 2 | ₩ | 166 | ₩ | 168 | |||||||||||
Time deposits | (113 | ) | (580 | ) | (693 | ) | 400 | 1,651 | 2,051 | |||||||||||||||
Certificates of deposit | 0 | (19 | ) | (19 | ) | 23 | 76 | 99 | ||||||||||||||||
169
Table of Contents
| 2021 vs. 2020 Increase/(Decrease) Due to Change in | 2022 vs. 2021 Increase/(Decrease) Due to Change in | |||||||||||||||||||||||
| Volume | Rate | Total | Volume | Rate | Total | |||||||||||||||||||
| (in billions of Won) | ||||||||||||||||||||||||
Borrowings: | ||||||||||||||||||||||||
Bonds sold under repurchase agreements | 1 | (22 | ) | (21 | ) | (25 | ) | 127 | 102 | |||||||||||||||
Other borrowings | 112 | (159 | ) | (47 | ) | 170 | 633 | 803 | ||||||||||||||||
Debentures | 121 | (137 | ) | (16 | ) | 81 | 390 | 471 | ||||||||||||||||
|
|
|
|
|
|
|
|
|
|
|
| |||||||||||||
Total interest expense | 179 | (962 | ) | (783 | ) | 652 | 3,043 | 3,695 | ||||||||||||||||
|
|
|
|
|
|
|
|
|
|
|
| |||||||||||||
Total net interest income | ₩ | 1,380 | ₩ | 128 | ₩ | 1,508 | ₩ | 979 | ₩ | 904 | ₩ | 1,883 | ||||||||||||
|
|
|
|
|
|
|
|
|
|
|
| |||||||||||||
| (1) | Includes deposits and loans at fair value through profit or loss. For information on interest income arising from such financial instruments, see Note 28 of the notes to our consolidated financial statements included elsewhere in this annual report. |
| (2) | Comprises financial assets at fair value through other comprehensive income and at amortized cost, and includes loans at fair value through other comprehensive income. For information on interest income arising from such financial instruments, see Note 28 of the notes to our consolidated financial statements included elsewhere in this annual report. Information related to investment securities classified as financial assets at fair value through other comprehensive income has been computed using amortized cost, and therefore does not give effect to changes in fair value that are reflected as a component of total equity. |
Legal Proceedings
Excluding the legal proceedings discussed below, we and our subsidiaries are not a party to any legal or administrative proceedings and no proceedings are known by any of us or our subsidiaries to be contemplated by governmental authorities or third parties, which, if adversely determined, may have a material adverse effect on our consolidated financial condition or results of operations.
In June 2010, Fairfield Sentry Limited, or Fairfield, which is currently in liquidation and whose assets were directly or indirectly invested with Bernard L. Madoff Investment Securities LLC, or BLMIS, filed a lawsuit in the Supreme Court of the State of New York against Kookmin Bank, which acted as a trustee bank for its clients who invested in Fairfield. Fairfield seeks recovery of approximately US$42 million paid to Kookmin Bank by its clients in connection with share redemptions on the ground that such payments were made by mistake, based on inflated values resulting from BLMIS’ fraud. In September 2010, the case was transferred to the United States Bankruptcy Court for the Southern District of New York, or the Bankruptcy Court, which in turn ordered that the case be returned to a state court in September 2011 but then stayed the lawsuit before it was sent to state court. In August 2019, the Bankruptcy Court issued an order to the effect that the case would proceed in a federal court, instead of returning to a state court, on the condition that the proceedings be halted temporarily until a similar lawsuit that Fairfield had filed against a different fund investor (the “Parallel Case”), then pending in the United States District Court for the Southern District of New York, or the District Court, was decided. The Bankruptcy Court had dismissed the Parallel Case in December 2018, which Fairfield had then subsequently appealed to the District Court. In August 2022, the District Court dismissed Fairfield’s appeal related to the Parallel Case, and in September 2022, Fairfield again appealed such dismissal to the United States Court of Appeals for the Second Circuit, or the Second Circuit, where the Parallel Case is currently pending. It is difficult to predict when the Second Circuit will rule on Fairfield’s appeal. Fairfield has filed similar actions against numerous other fund investors to seek recovery of redemption payments.
In May 2012, the trustee appointed for the liquidation of BLMIS filed a lawsuit against Kookmin Bank in the Bankruptcy Court. The trustee seeks recovery of approximately US$42 million, the amount of funds that were allegedly redeemed by Kookmin Bank from Fairfield between June 2004 and January 2006. The trustee alleges that Fairfield was a “feeder fund” that invested in BLMIS and that redemptions from such BLMIS feeder fund are avoidable and recoverable under the U.S. Bankruptcy Code and New York law. The Bankruptcy Court issued an order to dismiss the case during the pleading stage of the litigation in March 2017, and the trustee appealed such decision to the United States Court of Appeals for the Second Circuit, or the Second Circuit,
170
Table of Contents
which reversed the dismissal and vacated the judgment in February 2019. Kookmin Bank, along with other defendants, filed a motion asking the Second Circuit to reconsider its ruling and, after such motion was denied, filed a petition for a writ of certiorari asking the United States Supreme Court to accept an appeal of the Second Circuit’s ruling, which was denied in June 2020. Subsequently, the Second Circuit remanded the case to the Bankruptcy Court for further proceedings, and in December 2022, Kookmin Bank’s motion to dismiss the case was denied. Kookmin Bank is preparing to file its response, and the case is currently ongoing. The trustee has filed similar claw back actions against numerous other institutions.
In February 2014, the Financial Services Commission suspended the new credit card issuance and other related activities of KB Kookmin Card for three months from February to May 2014, in response to an incident involving the misappropriation of the personal information of a large number of its customers by an employee of the Korea Credit Bureau in the first half of 2013. Specifically, during such suspension period, KB Kookmin Card was prohibited from engaging in the following activities:
| • | adding new subscribers for credit cards, prepaid cards and debit cards or issuing such types of cards (except as permitted by the chairman of the Financial Services Commission for public policy purposes); |
| • | providing new or additional credit lines to credit card customers; and |
| • | providing new services through mail order or telemarketing channels or related to travel or insurance products. |
In connection with the misappropriation incident, as of December 31, 2022, there was one remaining lawsuit against KB Kookmin Card filed by certain of KB Kookmin Card’s customers, with claimed damages amounting to approximately ₩0.05 billion. The final outcome of such lawsuit remains uncertain. In addition, KB Kookmin Card could become subject to additional litigation and may incur significant costs relating to the compensation of customers for losses incurred as a result of the fraudulent use of the misappropriated personal information.
In February 2018, pursuant to a request by the Financial Supervisory Service, the Supreme Prosecutors’ Office of Korea commenced an investigation into alleged irregularities in hiring practices at certain Korean banks, including Kookmin Bank. In May 2018, the prosecutors charged four current and former executive officers and employees of Kookmin Bank with obstruction of business and violation of the Act on the Equal Employment for Both Sexes, for violating certain regulations relating to the evaluation and hiring of certain individuals in 2015 and 2016. In October 2018, the Seoul Southern District Court sentenced such executive officers and employees to probation and ordered Kookmin Bank to pay a fine in the amount of ₩5 million. Although the individuals and Kookmin Bank appealed the ruling, such appeal was denied in July 2021. The individuals and Kookmin Bank then subsequently appealed to the Supreme Court, but such appeal was again denied in January 2022.
Commencing in December 2019, a number of plaintiffs brought legal action against KB Securities, alleging that they invested in JB Australia NDIS Private Equity Investment Trust No. 1 through KB Securities based on an offering circular that had made untrue statements of a material fact. The plaintiffs are seeking to terminate the related investment contract on the basis of either breach of contract or mistake, and are demanding ₩135 billion from KB Securities as compensation for the alleged unjust enrichment. In the alternative, they are seeking damages of ₩135 billion from KB Securities for violations of the relevant securities law, among others. As of the date of this annual report, the final outcome of the lawsuits remains uncertain.
Dividends
Dividends must be approved by the stockholders at the annual general meeting of stockholders. Cash dividends may be paid out of retained earnings that have not been appropriated to statutory reserves. See “Item 10.B. Memorandum and Articles of Association—Description of Capital Stock— Dividends and Other Distributions.” In addition to annual dividends, we may declare, and distribute in cash, interim dividends pursuant to board resolutions.
171
Table of Contents
The table below sets forth, for the periods indicated, the dividend per share of common stock and the total amount of dividends declared and paid by us in respect of the years ended December 31, 2020, 2021 and 2022. Except as otherwise noted, the dividends set forth below with respect to each year were paid within 30 days after our annual stockholders meeting, which was held no later than March of the following year.
Fiscal Year | Dividends per Common Share(1) | Total Amount of Cash Dividends Paid | ||||||
| (in millions of Won) | ||||||||
2020(2) | ₩ | 1,770 | ₩ | 689,653 | ||||
2021(3)(4) | 2,940 | 1,145,525 | ||||||
2022(5)(6) | 2,950 | 1,149,421 | ||||||
| (1) | Won amounts are expressed in U.S. dollars at the noon buying rate in effect at the end of the relevant periods as quoted by the Federal Reserve Bank of New York in the United States. |
| (2) | On February 4, 2021, our board of directors passed a board resolution recommending a cash dividend of ₩1,770 per common share (before dividend tax), representing 35.4% of the par value of each share, for the fiscal year ended December 31, 2020. This resolution was approved and ratified by our stockholders on March 26, 2021. |
| (3) | On February 8, 2022, our board of directors passed a board resolution recommending a cash dividend of ₩2,190 per common share (before dividend tax), representing 43.8% of the par value of each share, for the fiscal year ended December 31, 2021. This resolution was approved and ratified by our stockholders on March 25, 2022. |
| (4) | Includes an interim cash dividend of ₩750 per common share (before dividend tax), representing 15.0% of the par value of each share, declared and paid in 2021. |
| (5) | On February 7, 2023, our board of directors passed a board resolution recommending a cash dividend of ₩1,450 per common share (before dividend tax), representing 29.0% of the par value of each share, for the fiscal year ended December 31, 2022. This resolution was approved and ratified by our stockholders on March 24, 2023. |
| (6) | Includes an interim cash dividend of ₩500 per common share (before dividend tax), representing 10.0% of the par value of each share, declared in April 2022 and paid in May 2022, an interim cash dividend of ₩500 per common share (before dividend tax), representing 10.0% of the par value of each share, declared in July 2022 and paid in August 2022 and an interim cash dividend of ₩500 per common share (before dividend tax), representing 10.0% of the par value of each share, declared in October 2022 and paid in November 2022. |
Future dividends will depend upon our revenues, cash flow, financial condition and other factors. As an owner of ADSs, you will be entitled to receive dividends payable in respect of the shares of common stock represented by such ADSs.
For a description of the tax consequences of dividends paid to our stockholders, see “Item 10.E. Taxation—United States Taxation” and “—Korean Taxation—Taxation of Dividends on Common Shares or ADSs.”
| Item 8.B. | Significant Changes |
Except as disclosed elsewhere in this annual report, there have been no significant changes since the date of our audited financial statements included in this annual report.
| Item 9. | THE OFFER AND LISTING |
| Item 9.A. | Offering and Listing Details |
Principal Trading Market
The principal trading market for our common stock is the KRX KOSPI Market. Our common stock has been listed on the KRX KOSPI Market since October 10, 2008 under the identifying code 105560, and the ADSs have been listed on the New York Stock Exchange under the symbol “KB” since September 29, 2008. The ADSs are identified by the CUSIP number 48241A105.
Restrictions Applicable to ADSs
No Korean governmental approval is necessary for the sale and purchase of our ADSs in the secondary market outside Korea or for the withdrawal of shares of our common stock underlying the ADSs and the delivery
172
Table of Contents
inside Korea of shares in connection with the withdrawal, provided that a foreigner who intends to acquire the shares must obtain an investment registration card from the Financial Supervisory Service as described below. The acquisition of the shares by a foreigner must be immediately reported to the governor of the Financial Supervisory Service, either by the foreigner or by his standing proxy in Korea.
Persons who have acquired shares of our common stock as a result of the withdrawal of shares underlying our ADSs may exercise their preemptive rights for new shares, participate in free distributions and receive dividends on shares without any further Korean governmental approval.
Under current Korean laws and regulations, the depositary is required to obtain our prior consent for the number of shares of our common stock to be deposited in any given proposed deposit that exceeds the difference between:
| (1) | the aggregate number of shares of our common stock deposited by us for the issuance of our ADSs (including deposits in connection with the initial issuance and all subsequent offerings of our ADSs and stock dividends or other distributions related to these ADSs); and |
| (2) | the number of shares of our common stock on deposit with the depositary at the time of such proposed deposit. |
We have agreed to grant such consent to the extent that the total number of shares on deposit with the depositary would not exceed 116,583,985 at any time.
Restrictions Applicable to Shares
As a result of amendments to the Foreign Exchange Transaction Act of Korea, the regulations thereunder and Financial Services Commission regulations (which we refer to collectively as the “Investment Rules”), foreigners may invest, with limited exceptions and subject to procedural requirements, in all shares of Korean companies, whether listed on the KRX KOSPI Market or on the KRX KOSDAQ Market, unless prohibited by specific laws. Foreign investors may trade shares listed on the KRX KOSPI Market or on the KRX KOSDAQ Market only through the KRX KOSPI Market or the KRX KOSDAQ Market, except in limited circumstances, including:
| • | odd-lot trading of shares; |
| • | acquisition of shares (which we refer to as “Converted Shares”) by exercise of warrants, conversion rights or exchange rights under bonds with warrants, convertible bonds or exchangeable bonds or withdrawal rights under depositary receipts issued outside of Korea by a Korean company; |
| • | acquisition of shares as a result of inheritance, donation, bequest or exercise of stockholders’ rights, including preemptive rights or rights to participate in free distributions and receive dividends; |
| • | over-the-counter transactions between foreigners of a class of shares for which the ceiling on aggregate acquisition by foreigners has been reached or exceeded subject to certain exceptions; and |
| • | sale and purchase of shares at fair value between foreigners who are part of an investor group comprised of foreign companies investing under the control of a common investment manager pursuant to applicable laws or contract. |
The Investment Rules require a foreign investor who wishes to invest in shares on the KRX KOSPI Market or the KRX KOSDAQ Market (including Converted Shares) to register its identity with the Financial Supervisory Service prior to making any such investment. The registration requirement does not, however, apply to foreign investors who acquire Converted Shares with the intention of selling such Converted Shares within three months from the date of acquisition. Upon registration, the Financial Supervisory Service will issue to the foreign investor an investment registration card, which must be presented each time the foreign investor opens a
173
Table of Contents
brokerage account with a financial investment company with a brokerage license. Foreigners eligible to obtain an investment registration card include foreign nationals who have not been residing in Korea for a consecutive period of six months or more, foreign governments, foreign municipal authorities, foreign public institutions, international financial institutions or similar international organizations, corporations incorporated under foreign laws and any person in any additional category designated by the Enforcement Decree of the Financial Investment Services and Capital Markets Act. All Korean offices of a foreign corporation as a group are treated as a separate foreigner from the offices of the corporation outside Korea for the purpose of investment registration. However, a foreign corporation or depositary issuing depositary receipts may obtain one or more investment registration cards in its name in certain circumstances as described in the relevant regulations.
Upon a foreign investor’s purchase of shares through the KRX KOSPI Market or the KRX KOSDAQ Market, no separate report by the investor is required because the investment registration card system is designed to control and oversee foreign investment through a computer system. However, a foreign investor’s acquisition or sale of shares outside the KRX KOSPI Market or the KRX KOSDAQ Market (as discussed above) must be reported by the foreign investor or his standing proxy to the governor of the Financial Supervisory Service at the time of each such acquisition or sale. In particular, if a foreign investor acquires or sells his shares in connection with a tender offer or odd-lot trading of shares, such foreign investor or his standing proxy must ensure that the financial investment company that was engaged to facilitate the transaction reports such transaction to the governor of the Financial Supervisory Service. A foreign investor may appoint a standing proxy from among the Korea Securities Depository, foreign exchange banks (including domestic branches of foreign banks), financial investment companies with a dealing and/or brokerage license (including domestic branches of foreign financial investment companies with such license), financial investment companies with a collective investment license (including domestic branches of foreign financial investment companies with such license) and internationally recognized custodians which will act as a standing proxy to exercise stockholders’ rights or perform any matters related to the foregoing activities if the foreign investor does not perform these activities himself. Generally, a foreign investor may not permit any person, other than its standing proxy, to exercise rights relating to his shares or perform any tasks related thereto on his behalf. However, a foreign investor may be exempted from complying with these standing proxy rules with the approval of the governor of the Financial Supervisory Service in cases deemed inevitable, including by reason of conflict between laws of Korea and the home country of the foreign investor.
The shares of a listed Korean company owned by a foreign investor must be electronically registered in accordance with the Act on Electronic Registration of Stocks, Bonds, Etc. through an eligible custodian in Korea. The same entities eligible to act as a standing proxy are eligible to act as a custodian of shares for a non-resident or foreign investor. A foreign investor may be exempted from complying with the above requirement if it (i) acquires shares publicly offered or sold outside Korea for the purpose of listing on an overseas stock exchange or (ii) acquires or disposes of shares through an overseas stock exchange if such shares are simultaneously listed on the Korea Exchange and such overseas stock exchange.
An investment by a foreign investor in 10% or more of the issued and outstanding shares with voting rights of a Korean company is defined as a foreign direct investment under the Foreign Investment Promotion Act of Korea. Generally, a foreign direct investment must be reported to the Ministry of Trade, Industry and Energy of Korea. The acquisition of shares of a Korean company by a foreign investor may also be subject to certain foreign or other shareholding restrictions in the event that the restrictions are prescribed in a specific law that regulates the business of the Korean company. For a description of such restrictions applicable to Korean banks and bank holding companies (such as us), see “Item 4.B. Business Overview—Supervision and Regulation.”
| Item 9.B. | Plan of Distribution |
Not applicable.
174
Table of Contents
| Item 9.C. | Markets |
See “Item 9.A. Offering and Listing Details.”
| Item 9.D. | Selling Shareholders |
Not applicable.
| Item 9.E. | Dilution |
Not applicable.
| Item 9.F. | Expenses of the Issue |
Not applicable.
| Item 10. | ADDITIONAL INFORMATION |
| Item 10.A. | Share Capital |
Not applicable.
| Item 10.B. | Memorandum and Articles of Association |
Description of Capital Stock
Set forth below is information relating to our capital stock, including brief summaries of certain provisions of our articles of incorporation, the Korean Commercial Code, Financial Investment Services and Capital Markets Act and certain related laws of Korea, all as currently in effect. The following summaries do not purport to be complete and are subject to the articles of incorporation and the applicable provisions of the Financial Investment Services and Capital Markets Act, the Korean Commercial Code, and certain other related laws of Korea.
As of December 31, 2022, our authorized share capital is 1,000,000,000 shares. Pursuant to our articles of incorporation, we are authorized to issue shares with preferred dividend, non-voting shares, class shares with conversion rights, class shares with redemption rights and shares with a combination of all or any of the foregoing characteristics (which we refer to collectively as “Class Shares”), as well as common shares. Subject to applicable laws and regulations, we are authorized to issue Class Shares up to one-half of all of our issued and outstanding shares.
Under our articles of incorporation, dividends on non-voting shares with preferred dividend are required to be at least 1% per annum of the par value and the board of directors must determine at the time of issuance of such shares the dividend rate, type of distributable properties, method of determining the value of distributable properties and conditions on payment of dividends. Also, we may, pursuant to a resolution of the board of directors, issue such non-voting shares with preferred dividend as redeemable shares that may be redeemed with profits at the relevant shareholder’s or our discretion, up to one-half of all of our issued and outstanding shares.
In addition, pursuant to a resolution of the board of directors, we may issue shares that are convertible into common shares or Class Shares at the request of the relevant shareholders, up to 20% of all of our issued and outstanding shares. The period during which a relevant shareholder may make a request for conversion may be determined by a resolution of the board of directors and must be a period between one and ten years from the issue date.
175
Table of Contents
Furthermore, through an amendment of the articles of incorporation, we may create new classes of shares, which may be common shares or Class Shares having additional features as prescribed under the Korean Commercial Code. See “—Voting Rights.”
As of the date of this annual report, 403,511,072 shares of common stock were issued and 384,248,339 shares of common stock were outstanding. No Class Shares are currently outstanding. All of the issued and outstanding shares are fully-paid and non-assessable, and are in registered form. Our authorized but unissued share capital consists of 596,488,928 shares. We may issue the unissued shares without further stockholder approval, subject to a board resolution as provided in the articles of incorporation. See “—Preemptive Rights and Issuances of Additional Shares” and “—Dividends and Other Distributions—Distribution of Free Shares.”
Our articles of incorporation provide that our stockholders may, by special resolution, grant to our and our subsidiaries’ officers and employees stock options exercisable for up to 15% of the total number of our issued and outstanding shares. Our board of directors may also grant stock options to officers and employees other than directors exercisable for up to 1% of our issued and outstanding shares, provided that such grant must be approved by a resolution of the subsequent general meeting of stockholders. As of March 31, 2023, none of our officers, directors and employees held options to purchase shares of our common stock.
Share certificates are issued in denominations of one, five, ten, 50, 100, 500, 1,000 and 10,000 shares.
Organization and Register
We are a financial holding company established under the Financial Holding Company Act. We are registered with the commercial registry office of Seoul Central District Court.
Dividends and Other Distributions
Dividends
Dividends are distributed to stockholders in proportion to the number of shares of the relevant class of capital stock owned by each stockholder following approval by the stockholders at an annual general meeting of stockholders. Subject to the requirements of the Korean Commercial Code and other applicable laws and regulations, we expect to pay full annual dividends on newly issued shares for the year in which the new shares are issued.
We declare our dividend annually at the annual general meeting of stockholders, which are held within three months after the end of each fiscal year. Once declared, the annual dividend must be paid to the stockholders of record as of the end of the preceding fiscal year within one month after the annual general meeting unless otherwise resolved thereby. Annual dividends may be distributed either in cash or in shares provided that shares must be distributed at par value and, if the market price of the shares is less than their par value, dividends in shares may not exceed one-half of the total annual dividend (including dividends in shares). In addition, we may declare and distribute interim dividends pursuant to a board resolution.
Under the Korean Commercial Code and our articles of incorporation, we do not have an obligation to pay any annual or interim dividend unclaimed for five years from the payment date.
The Financial Holding Company Act and related regulations require that each time a Korean financial holding company pays an annual dividend, it must set aside in its legal reserve to stated capital an amount equal to at least one-tenth of its net income after tax until the amount set aside reaches at least the aggregate amount of its stated capital. Unless it sets aside this amount, a Korean financial holding company may not pay an annual dividend. We intend to set aside allowances for loan losses and reserves for severance pay in addition to this legal reserve.
For information regarding Korean taxes on dividends, see “Item 10.E. Taxation—Korean Taxation.”
176
Table of Contents
Distribution of Free Shares
In addition to permitting dividends in the form of shares to be paid out of retained or current earnings, the Korean Commercial Code permits a company to distribute to its stockholders, in the form of free shares, an amount transferred from the capital surplus or legal reserve to stated capital. These free shares must be distributed pro rata to all stockholders. Our articles of incorporation provide that the types of shares to be distributed to the holders of non-voting shares with preferred dividend will be the same type of non-voting shares with preferred dividend held by such holders.
Preemptive Rights and Issuances of Additional Shares
Unless otherwise provided in the Korean Commercial Code, a company may issue authorized but unissued shares at such times and upon such terms as the board of directors of the company may determine. The company must offer the new shares on uniform terms to all stockholders who have preemptive rights and who are listed on the stockholders’ register as of the applicable record date. Our stockholders will be entitled to subscribe for any newly issued shares in proportion to their existing shareholdings. However, as provided in our articles of incorporation, new shares may be issued to persons other than existing stockholders if such shares are: (1) publicly offered pursuant to the Financial Investment Services and Capital Markets Act, (2) issued to an employee stock ownership association, (3) issued upon exercise of stock options pursuant to the Financial Investment Services and Capital Markets Act, (4) issued for the issuance of our depositary receipts, (5) issued to certain foreign or domestic financial institutions or institutional investors to raise funds to meet urgent needs for our management or operations or (6) issued primarily to a third party who has contributed to the management of our business, including by providing financing, credit, advanced financing technique, know-how or entering into close business alliances, except that, in the case of issuances of new shares under (1), (4), (5) and (6) above, the number of new shares issued to persons other than existing stockholders may not exceed 50% of our total issued and outstanding capital stock.
Public notice of the preemptive rights to new shares and the transferability thereof must be given not less than two weeks (excluding the period during which the stockholders’ register is closed) prior to the record date. We will notify the stockholders or persons other than existing stockholders, who are entitled to subscribe for newly issued shares of the deadline for subscription at least two weeks prior to the deadline. If such stockholders or persons fail to subscribe on or before such deadline, their preemptive rights will lapse. Our board of directors may determine how to distribute shares in respect of which preemptive rights have not been exercised or where fractions of shares occur.
Under the Financial Investment Services and Capital Markets Act, members of a company’s employee stock ownership association, whether or not they are stockholders, will have a preemptive right, subject to certain exceptions, to subscribe for up to 20% of the shares publicly offered pursuant to the Financial Investment Services and Capital Markets Act. This right is exercisable only to the extent that the total number of shares so acquired and held by such members does not exceed 20% of the total number of shares then issued and outstanding.
Voting Rights
Each outstanding share of our common stock is entitled to one vote per share. However, voting rights with respect to shares of common stock that we hold or any of our subsidiaries holds may not be exercised. Unless stated otherwise in a company’s articles of incorporation, the Korean Commercial Code permits holders of an aggregate of 1% or more of the issued and outstanding shares with voting rights to request cumulative voting when electing two or more directors. Our articles of incorporation do not prohibit cumulative voting. The Korean Commercial Code and our articles of incorporation provide that an ordinary resolution may be adopted if approval is obtained from the holders of at least a majority of those shares of common stock present or represented at such meeting and such majority also represents at least one-fourth of the total of our issued and
177
Table of Contents
outstanding voting shares. Holders of non-voting shares (other than enfranchised non-voting shares) will not be entitled to vote on any resolution or to receive notice of any general meeting of stockholders unless the agenda of the meeting includes consideration of a resolution on which such holders are entitled to vote. The Korean Commercial Code provides that a company’s articles of incorporation may prescribe conditions for the enfranchisement of non-voting shares. For example, if our annual general stockholders’ meeting resolves not to pay to holders of non-voting shares with preferred dividend the annual dividend as determined by the board of directors at the time of issuance of such shares, the holders of non-voting shares with preferred dividend will be entitled to exercise voting rights from the general stockholders’ meeting following the meeting adopting such resolution to the end of a meeting to declare to pay such dividend with respect to the non-voting shares with preferred dividend. Holders of such enfranchised non-voting shares with preferred dividend will have the same rights as holders of common stock to request, receive notice of, attend and vote at a general meeting of stockholders.
The Korean Commercial Code provides that to amend the articles of incorporation, which is also required for any change to the authorized share capital of the company, and in certain other instances, including removal of a director of a company, dissolution, merger or consolidation of a company, transfer of the whole or a significant part of the business of a company, acquisition of all of the business of any other company, acquisition of a part of the business of any other company having a material effect on the business of the company or issuance of new shares at a price lower than their par value, a special resolution must be adopted by the approval of the holders of at least two-thirds of those shares present or represented at such meeting and such special majority also represents at least one-third of the total issued and outstanding shares with voting rights of the company.
In addition, in the case of amendments to the articles of incorporation or any merger or consolidation of a company or in certain other cases, where the rights or interest of the holders of Class Shares are adversely affected, a resolution must be adopted by a separate meeting of holders of Class Shares. Such a resolution may be adopted if the approval is obtained from stockholders of at least two-thirds of the Class Shares present or represented at such meeting and such shares also represent at least one-third of the total issued and outstanding Class Shares of the company.
A stockholder may exercise his voting rights by proxy given to another stockholder. The proxy must present the power of attorney prior to the start of a meeting of stockholders.
Liquidation Rights
In the event we are liquidated, the assets remaining after the payment of all borrowings, liquidation expenses and taxes will first be distributed to holders of Class Shares which have a preference right in respect of the distribution of residual properties as determined by our board of directors at the time of their issuance, and the residue thereafter will be distributed to the other stockholders in proportion to the number of shares held by them.
General Meetings of Stockholders
There are two types of general meetings of stockholders: annual general meetings and extraordinary general meetings. We are required to convene our annual general meeting within three months after the end of each fiscal year. Subject to a board resolution or court approval, an extraordinary general meeting of stockholders may be held when necessary or at the request of the holders of an aggregate of 3% or more of our issued and outstanding shares, or the holders of an aggregate of 0.75% or more of our issued and outstanding stock with voting rights, who have held those shares at least for six months, under the Act on the Corporate Governance of Financial Companies and its sub-regulations. Under the Korean Commercial Code, an extraordinary general meeting of stockholders may also be convened at the request of our Audit Committee, subject to a board resolution or court approval. Holders of non-voting shares may be entitled to request a general meeting of stockholders only to the
178
Table of Contents
extent the non-voting shares have become enfranchised as described under the section entitled “—Voting Rights” above, hereinafter referred to as “enfranchised non-voting shares.” Meeting agendas will be determined by the board of directors or proposed by holders of an aggregate of 3% or more of the issued and outstanding shares with voting rights, or by holders of an aggregate of 0.1% or more of our issued and outstanding shares with voting rights, who have held those shares for at least six months, by way of a written proposal to the board of directors at least six weeks prior to the meeting, under the Act on the Corporate Governance of Financial Companies and its sub-regulations. Written notices or e-mail notices stating the date, place and agenda of the meeting must be given to the stockholders at least two weeks prior to the date of the general meeting of stockholders. Notice may, however, be given to holders of 1% or less of the total number of issued and outstanding shares which are entitled to vote, either by placing at least two public notices at least two weeks in advance of the meeting in at least two daily newspapers or by placing a notice through the electronic disclosure system operated by the Financial Supervisory Service or the Korea Exchange. Stockholders who are not on the stockholders’ register as of the record date will not be entitled to receive notice of the general meeting of stockholders, and they will not be entitled to attend or vote at such meeting. Holders of enfranchised non-voting shares who are on the stockholders’ register as of the record date will be entitled to receive notice of the general meeting of stockholders and they will be entitled to attend and vote at such meeting. Otherwise, holders of non-voting shares will not be entitled to receive notice of or vote at general meetings of stockholders.
The general meeting of stockholders will be held at our head office, which is our registered head office, or, if necessary, may be held anywhere in the vicinity of our head office.
Rights of Dissenting Stockholders
Pursuant to the Financial Investment Services and Capital Markets Act and the Act on the Improvement of the Structure of the Financial Industry, in certain limited circumstances (including, without limitation, if we transfer all or any significant part of our business, if we acquire a part of the business of any other company and such acquisition has a material effect on our business or if we merge or consolidate with another company), dissenting holders of shares of our common stock and our stock with preferred dividends will have the right to require us to purchase their shares. To exercise such a right, stockholders must submit to us a written notice of their intention to dissent prior to the general meeting of stockholders. Within 20 days (10 days in the case of a stock transfer or exchange for the purposes of establishing a financial holding company or acquiring all issued shares of an existing subsidiary under the Financial Holding Company Act) after the date on which the relevant resolution is passed at such meeting, such dissenting stockholders must request in writing that we purchase their shares. We are obligated to purchase the shares from dissenting stockholders within one month after the end of such request period at a price to be determined by negotiation between the stockholder and us. If we cannot agree on a price with the stockholder through such negotiations, the purchase price will be the arithmetic mean of:
| • | the weighted average of the closing stock prices on the KRX KOSPI Market for the two-month period prior to the date of the adoption of the relevant board of directors’ resolution; |
| • | the weighted average of the closing stock prices on the KRX KOSPI Market for the one-month period prior to the date of the adoption of the relevant board of directors’ resolution; and |
| • | the weighted average of the closing stock prices on the KRX KOSPI Market for the one-week period prior to the date of the adoption of the relevant board of directors’ resolution. |
However, any dissenting stockholder who wishes to contest the purchase price may bring a claim in court.
Required Disclosure of Ownership
Any person whose direct or beneficial ownership of our common stock with voting rights, whether in the form of shares of common stock or ADSs, certificates representing the rights to subscribe for shares or equity-related debt securities including convertible bonds and bonds with warrants (which we refer to
179
Table of Contents
collectively as “Equity Securities”), together with the Equity Securities beneficially owned by certain related persons or by any person acting in concert with the person, accounts for 5% or more of the total issued and outstanding shares (Equity Securities of us held by such persons and treasury stock) is required to report the status and purpose (in terms of whether the purpose of the shareholding is to exercise control over our management) of the holdings to the Financial Services Commission and the KRX KOSPI Market within five business days after reaching the 5% ownership interest. In addition, any change in (i) the ownership interest subsequent to the report that equals or exceeds 1% of the total issued and outstanding Equity Securities of us or (ii) the purpose of the shareholding is required to be reported to the Financial Services Commission and the KRX KOSPI Market within five business days from the date of the change.
Violation of these reporting requirements may subject a person to criminal sanctions such as fines or imprisonment, an administrative fine of up to 0.001% of the aggregate market value of the total issued and outstanding stock or ₩500 million, whichever is lower, and/or a loss of voting rights with respect to the ownership of Equity Securities exceeding 5% of the total issued and outstanding Equity Securities with respect to which the reporting requirements were violated. Furthermore, the Financial Services Commission may order the disposal of the unreported Equity Securities.
In addition to the reporting requirements described above, any person whose direct or beneficial ownership of our stock accounts for 10% or more of the total issued and outstanding stock (which we refer to as a “major stockholder”) must report the status of his/her shareholding to the Korea Securities and Futures Commission and the KRX KOSPI Market within five days after becoming a major stockholder. In addition, any change in the ownership interest subsequent to the report must be reported to the Korea Securities and Futures Commission and the KRX KOSPI Market within five days of the occurrence of the change, provided that such reporting obligation would not apply if the change in the ownership interest consists of less than 1,000 shares and the amount of such change is less than ₩10 million. Violation of these reporting requirements may subject a person to criminal sanctions such as fines or imprisonment.
Other Provisions
Register of Stockholders and Record Dates
We maintain the register of our stockholders at our principal office in Seoul, Korea. We register transfers of shares on the register of stockholders upon presentation of the share certificates.
The record date for annual dividends is determined through a resolution of our board of directors. Further, the Korean Commercial Code and our articles of incorporation permit us upon at least two weeks’ public notice to set a record date for the purpose of determining the stockholders entitled to certain rights pertaining to the shares, provided, however, that the Korean Commercial Code further requires that the register of stockholders shall not be closed for such purposes for more than three months. The trading of shares and the delivery of certificates in respect thereof may continue while the register of stockholders is closed. Also, we may distribute dividends to stockholders on a quarterly basis, and the record dates for these quarterly dividends are the end of March, June and September of each year.
Annual Reports
Under the Financial Investment Services and Capital Markets Act, we must file with the Financial Services Commission and the KRX KOSPI Market an annual business report within 90 days after the end of each fiscal year, a half-year business report within 45 days after the end of the first six months of each fiscal year and quarterly business reports within 45 days after the end of the first three months and nine months of each fiscal year, respectively. In addition, in accordance with the Enforcement Decree of the Commercial Act, we must make available our annual business report and audit report to our shareholders by sending such reports electronically or posting them on our website at least one week before the annual general meeting of stockholders. Copies of such business reports will be available for public inspection at the Financial Services Commission and the KRX KOSPI Market.
180
Table of Contents
Transfer of Shares
Under the Korean Commercial Code, the transfer of shares is effected by the delivery of share certificates. The Financial Investment Services and Capital Markets Act provides, however, that in case of a company listed on the KRX KOSPI Market such as us, share transfers can be effected by the book-entry method. In order to assert stockholders’ rights against us, the transferee must have his name and address registered on the register of stockholders. For this purpose, stockholders are required to file with us their name, address and seal. Non-resident stockholders must notify us of the name of their proxy in Korea to which our notice can be sent.
Under current Korean regulations, the following entities may act as agents and provide related services for foreign stockholders:
| • | the Korea Securities Depository; |
| • | internationally recognized foreign custodians; |
| • | financial investment companies with a dealing license (including domestic branches of foreign financial investment companies with such license); |
| • | financial investment companies with a brokerage license (including domestic branches of foreign financial investment companies with such license); |
| • | foreign exchange banks (including domestic branches of foreign banks); and |
| • | financial investment companies with a collective investment license (including domestic branches of foreign financial investment companies with such license). |
In addition, foreign stockholders may appoint a standing proxy among the foregoing and generally may not allow any person other than the standing proxy to exercise rights to the acquired shares or perform any tasks related thereto on their behalf. Certain foreign exchange controls and securities regulations apply to the transfer of shares by non-residents or non-Koreans. See “Item 9.A. Offering and Listing Details” and “Item 10.D. Exchange Controls.” Except as provided in the Financial Holding Company Act, the ceiling on the aggregate shareholdings of a single stockholder and persons who stand in a special relationship with such stockholder is 10% of our issued and outstanding voting shares. See “Item 4.B. Business Overview—Supervision and Regulation—Principal Regulations Applicable to Financial Holding Companies—Restrictions on Ownership of a Financial Holding Company.”
Acquisition of Our Shares
Under the Korean Commercial Code, we may acquire our own shares upon a resolution of a general meeting of shareholders by either (i) purchasing them on a stock exchange or (ii) purchasing a number of shares, other than redeemable shares as set forth in Article 345, Paragraph (1) of the Korean Commercial Code, from each shareholder in proportion to their existing shareholding ratio through the methods set forth in the Presidential Decree, provided that the total purchase price does not exceed the amount of our profit that may be distributed as dividends in respect of the immediately preceding fiscal year.
Additionally, pursuant to the Financial Investment Services and Capital Markets Act and regulations under the Financial Holding Company Act and after submission of certain reports to the Financial Services Commission, we may purchase our own shares on the KRX KOSPI Market or through a tender offer, subject to the restrictions that:
| • | the aggregate purchase price of such shares may not exceed the total amount available for distribution of dividends at the end of the preceding fiscal year; and |
| • | the purchase of such shares shall meet the risk-weighted capital adequacy ratio requirements prescribed in the regulations under the Financial Holding Company Act based on Bank for International Settlements standards. |
181
Table of Contents
Subject to certain limited exceptions, our subsidiaries will not be permitted to acquire our shares pursuant to the Financial Holding Company Act.
| Item 10.C. | Material Contracts |
None.
| Item 10.D. | Exchange Controls |
General
The Foreign Exchange Transaction Act of Korea and the Enforcement Decree and regulations under that Act and Decree, which we refer to collectively as the “Foreign Exchange Transaction Laws,” regulate investment in Korean securities by non-residents and issuance of securities outside Korea by Korean companies. Non-residents may invest in Korean securities pursuant to the Foreign Exchange Transaction Laws. The Financial Services Commission has also adopted, pursuant to its authority under the Financial Investment Services and Capital Markets Act, regulations that restrict investment by foreigners in Korean securities and regulate issuance of securities outside Korea by Korean companies.
Under the Foreign Exchange Transaction Laws, (1) if the Korean government deems that it is inevitable due to the outbreak of natural calamities, wars, conflict of arms or grave and sudden changes in domestic or foreign economic circumstances or other situations equivalent thereto, the Ministry of Economy and Finance may temporarily suspend payment, receipt or the whole or part of transactions to which the Foreign Exchange Transaction Laws apply, or impose an obligation to safe-keep, deposit or sell means of payment in or to certain Korean governmental agencies or financial institutions; and (2) if the Korean government deems that international balance of payments and international finance are confronted or are likely to be confronted with serious difficulty or the movement of capital between Korea and abroad brings or is likely to bring about serious obstacles in carrying out its currency policies, exchange rate policies and other macroeconomic policies, the Ministry of Economy and Finance may take measures to require any person who intends to perform capital transactions to obtain permission or to require any person who performs capital transactions to deposit part of the payments received in such transactions at certain Korean governmental agencies or financial institutions, in each case subject to certain limitations.
Restrictions Applicable to Shares
Under the Foreign Exchange Transaction Laws, a foreign investor who intends to acquire shares must designate a foreign exchange bank at which he must open a foreign currency account and a Won account exclusively for stock investments. No approval is required for remittance into Korea and deposit of foreign currency funds in the foreign currency account. Foreign currency funds may be transferred from the foreign currency account at the time required to place a deposit for, or settle the purchase price of, a stock purchase transaction to a Won account opened at a financial investment company with a dealing and/or brokerage license. Funds in the foreign currency account may be remitted abroad without any Korean governmental approval.
Dividends on shares of Korean companies are paid in Won. No Korean governmental approval is required for foreign investors to receive dividends on, or the Won proceeds of the sale of, any shares to be paid, received and retained in Korea. Dividends paid on, and the Won proceeds of the sale of, any shares held by a non-resident of Korea must be deposited either in a Won account with the investor’s financial investment company with a dealing and/or brokerage license or in his Won account. Funds in the investor’s Won account may be transferred to his foreign currency account or withdrawn for local living expenses up to certain limitations. Funds in the Won account may also be used for future investment in shares or for payment of the subscription price of new shares obtained through the exercise of preemptive rights.
Financial investment companies with dealing and/or brokerage licenses are allowed to open foreign currency accounts with foreign exchange banks exclusively for accommodating foreign investors’ stock
182
Table of Contents
investments in Korea. Through these accounts, such financial investment companies may enter into foreign exchange transactions on a limited basis, such as conversion of foreign currency funds and Won funds, either as a counterparty to or on behalf of foreign investors, without the investors having to open their own accounts with foreign exchange banks.
| Item 10.E. | Taxation |
United States Taxation
This summary describes certain U.S. federal income tax consequences for a U.S. holder (as defined below) of acquiring, owning, and disposing of common shares or ADSs. This summary applies to you only if you hold the common shares or ADSs as capital assets for tax purposes. This summary does not apply to you if you are a member of a class of holders subject to special rules, such as:
| • | a broker or dealer in securities or currencies; |
| • | a trader in securities that elects to use a mark-to-market method of accounting for securities holdings; |
| • | a bank; |
| • | a life insurance company; |
| • | a tax-exempt organization; |
| • | an entity treated as a partnership for U.S. federal income tax purposes or a partner in such partnership; |
| • | a person that holds common shares or ADSs that are a hedge or that are hedged against interest rate or currency risks; |
| • | a person that holds common shares or ADSs as part of a straddle or conversion transaction for tax purposes; |
| • | a person whose functional currency for tax purposes is not the U.S. dollar; or |
| • | a person that owns or is deemed to own 10% or more of our stock, measured by voting power or value. |
This summary is based on the Internal Revenue Code of 1986, as amended, its legislative history, existing and proposed regulations promulgated thereunder, and published rulings and court decisions, all as currently in effect. These laws are subject to change, possibly on a retroactive basis.
This summary does not discuss the application of the U.S. federal estate and gift taxes, the Medicare net investment income tax or the alternative minimum tax, or state, local or non-U.S. taxes.
Please consult your own tax advisers concerning the U.S. federal, state, local, and other tax consequences of purchasing, owning, and disposing of common shares or ADSs in your particular circumstances.
For purposes of this summary, you are a “U.S. holder” if you are the beneficial owner of a common share or an ADS and are:
| • | a citizen or resident of the United States; |
| • | a U.S. domestic corporation; or |
| • | otherwise subject to U.S. federal income tax on a net income basis with respect to income from the common share or ADS. |
In general, if you are the beneficial owner of ADSs, you will be treated as the beneficial owner of the common shares represented by those ADSs for U.S. federal income tax purposes, and no gain or loss will be recognized if you exchange an ADS for the common share represented by that ADS.
183
Table of Contents
Dividends
The gross amount of cash dividends that you receive (prior to deduction of Korean taxes) generally will not be eligible for the dividends received deduction. Dividends paid in Won will be included in your income in a U.S. dollar amount calculated by reference to the exchange rate in effect on the date of your receipt of the dividend, in the case of common shares, or the depositary’s receipt, in the case of ADSs, regardless of whether the payment is in fact converted into U.S. dollars. If such a dividend is converted into U.S. dollars on the date of receipt, you generally should not be required to recognize foreign currency gain or loss in respect of the dividend income.
The U.S. dollar amount of dividends received by an individual with respect to the ADSs will be subject to taxation at reduced rates if the dividends are “qualified dividends.” Subject to certain exceptions for short-term and hedged positions, dividends paid on the common shares or ADSs will be treated as qualified dividends if (i) the common shares or ADSs are readily tradable on an established securities market in the United States or we are eligible for the benefits of a comprehensive tax treaty with the United States that the U.S. Treasury determines is satisfactory for purposes of this provision and that includes an exchange of information program; and (ii) we were not, in the year prior to the year in which the dividend was paid, and are not, in the year in which the dividend is paid, a passive foreign investment company as defined for U.S. federal income tax purposes (“PFIC”). The ADSs are listed on the New York Stock Exchange, and will qualify as readily tradable on an established securities market in the United States so long as they are so listed. In addition, the U.S. Treasury has determined that the Korea-United States income tax treaty (the “Treaty”) meets the requirements for reduced rates of taxation, and we believe we are eligible for the benefits of that treaty. Based on our audited financial statements, we believe that we were not a PFIC in our 2021 or 2022 taxable year. In addition, based on our audited financial statements and current expectations regarding our income, assets and activities, we do not anticipate becoming a PFIC for our 2023 taxable year. Therefore, we believe that dividends received by U.S. holders with respect to either common shares or ADSs will be “qualified dividends.” Holders should consult their own tax advisers regarding the availability of the reduced dividend tax rate in light of their own particular circumstances.
Distributions of additional shares in respect of common shares or ADSs that are made as part of a pro-rata distribution to all of our stockholders generally will not be subject to U.S. federal income tax.
Sale or Other Disposition
For U.S. federal income tax purposes, gain or loss you realize on a sale or other disposition of common shares or ADSs generally will be treated as U.S. source capital gain or loss, and will be long-term capital gain or loss if the common shares or ADSs were held for more than one year. Your ability to offset capital losses against ordinary income is limited. Long-term capital gain recognized by an individual U.S. holder generally is subject to taxation at reduced rates.
If a U.S. holder sells or otherwise disposes of our common shares or ADSs in exchange for currency other than U.S. dollars, the amount realized generally will be the U.S. dollar value of the currency received at the spot rate on the date of sale or other disposition (or, if the shares are traded on an established securities market at such time, in the case of cash basis and electing accrual basis U.S. holders, the settlement date). An accrual basis U.S. holder that does not elect to determine the amount realized using the spot exchange rate on the settlement date will recognize foreign currency gain or loss equal to the difference between the U.S. dollar value of the amount received based on the spot exchange rates in effect on the date of the sale or other disposition and the settlement date. If an accrual basis U.S. holder makes the election described in the first sentence of this paragraph, it must be applied consistently from year to year and cannot be revoked without the consent of the Internal Revenue Service, or the IRS. A U.S. holder should consult its own tax advisors regarding the treatment of any foreign currency gain or loss realized with respect to any currency received in a sale or other disposition of the common shares or ADSs.
184
Table of Contents
Foreign Tax Credit Considerations
Subject to generally applicable limitations and conditions, Korean tax on dividends paid at the appropriate rate applicable to you may be eligible for a credit against your U.S. federal income tax liability. These generally applicable limitations and conditions include new requirements recently adopted by the IRS and any Korean tax will need to satisfy these requirements in order to be eligible to be a creditable tax for a U.S. holder. In the case of a U.S. holder that is eligible for, and properly elects, the benefits of the Treaty, the Korean tax on dividends may be treated as meeting the new requirements and therefore as a creditable tax. The application of these requirements to the Korean tax on dividends is uncertain and we have not determined whether these requirements are met, including requirements applicable to the Treaty. If the Korean tax is not a creditable tax for a U.S. holder or you do not elect to claim a foreign tax credit for any foreign income taxes paid or accrued in the same taxable year, you may be able to deduct the Korean tax in computing your taxable income for U.S. federal income tax purposes. Dividends will constitute income from sources without the United States and, if the withholding tax is a creditable tax for a U.S. holder that elects to claim foreign tax credits, generally will constitute “passive category income” for foreign tax credit purposes.
Additionally, under the new foreign tax credit requirements recently adopted by the IRS, any Korean tax imposed on the sale or other disposition of the common shares or ADSs generally will not be treated as a creditable tax for U.S. foreign tax credit purposes except in the case of a U.S. holder that is eligible for, and properly elects to claim, the benefits of the Treaty. If the Korean tax is not a creditable tax, the tax would reduce the amount realized on the sale or other disposition of the common shares or ADSs even if you have elected to claim a foreign tax credit for other taxes in the same year. You should consult your own tax advisers regarding the application of the foreign tax credit rules to a sale or other disposition of the common shares or ADSs and any Korean tax imposed on such sale or disposition.
Any Korean securities transaction tax or agriculture and fishery special surtax that you pay will not be creditable for foreign tax credit purposes.
Similarly, a U.S. holder will not be able to claim a foreign tax credit against its U.S. federal income tax liability for any Korean inheritance or gift tax imposed in respect of the common shares or ADSs.
The availability and calculation of foreign tax credits and deductions for foreign taxes depend upon a U.S. holder’s particular circumstances and involve the application of complex rules to those circumstances. You should consult your own tax advisers regarding the application of these rules to your particular situation.
Specified Foreign Financial Assets
Certain U.S. holders that own “specified foreign financial assets” with an aggregate value in excess of US$50,000 on the last day of the taxable year or US$75,000 at any time during the taxable year are generally required to file an information statement along with their tax returns, currently on IRS Form 8938, with respect to such assets. “Specified foreign financial assets” include any financial accounts held at a non-U.S. financial institution, as well as securities issued by a non-U.S. issuer (which would include the common shares or ADSs) that are not held in accounts maintained by financial institutions. Higher reporting thresholds apply to certain individuals living abroad and to certain married individuals. Regulations extend this reporting requirement to certain entities that are treated as formed or availed of to hold direct or indirect interests in specified foreign financial assets based on certain objective criteria. U.S. holders who fail to report the required information could be subject to substantial penalties. Prospective investors should consult their own tax advisers concerning the application of these rules to their investment in the common shares or ADSs, including the application of the rules to their particular circumstances.
U.S. Information Reporting and Backup Withholding Rules
Payments of dividends and sales proceeds that are made within the United States or through certain U.S.-related financial intermediaries are subject to information reporting and may be subject to backup
185
Table of Contents
withholding unless the U.S. holder provides an accurate taxpayer identification number and makes any other required certification or otherwise establishes an exemption. Backup withholding is not an additional tax. The amount of any backup withholding from a payment to a U.S. holder will be allowed as a refund or credit against the U.S. holder’s U.S. federal income tax liability, provided the required information is furnished to the IRS in a timely manner.
Holders that are not U.S. persons generally are not subject to information reporting or backup withholding. However, such a holder may be required to provide a certification of its non-U.S. status in connection with payments received within the United States or through a U.S.-related financial intermediary.
Korean Taxation
The following summary of Korean tax considerations applies to you so long as you are not:
| • | a resident of Korea; |
| • | a corporation with its head office, principal place of business or place of effective management in Korea; or |
| • | engaged in a trade or business in Korea through a permanent establishment or a fixed base to which the relevant income is attributable or with which the relevant income is effectively connected. |
Taxation of Dividends on Common Shares or ADSs
We will deduct Korean withholding tax from dividends paid to you (whether payable in cash or in shares) at a rate of 22.0% (inclusive of local income surtax). If you are a qualified resident and a beneficial owner of the dividends in a country that has entered into a tax treaty with Korea, you may qualify for a reduced rate of Korean withholding tax. See “—Tax Treaties” below for a discussion on treaty benefits. If we distribute to you free shares representing a transfer of earning surplus or certain capital reserves into paid-in capital, that distribution may be subject to Korean withholding tax.
Taxation of Capital Gains from Transfer of Common Shares or ADSs
As a general rule, capital gains earned by non-residents upon transfer of our common shares or ADSs are subject to Korean withholding tax at the lower of (1) 11.0% (inclusive of local income surtax) of the gross proceeds realized or (2) subject to the production of satisfactory evidence of acquisition costs and certain direct transaction costs of the common shares or ADSs, 22.0% (inclusive of local income surtax) of the net realized gain, unless exempt from Korean income taxation under the applicable Korean tax treaty with the non-resident’s country of tax residence. See “—Tax Treaties” below for a discussion on treaty benefits. Even if you do not qualify for an exemption under a tax treaty, you will not be subject to the foregoing withholding tax on capital gains if you qualify under the relevant Korean domestic tax law exemptions discussed in the following paragraphs.
In regards to the transfer of our common shares through the Korea Exchange, you will not be subject to the withholding tax on capital gains (as described in the preceding paragraph) if you (1) have no permanent establishment in Korea and (2) did not own or have not owned (together with any shares owned by any person with which you have a certain special relationship) 25% or more of the total issued and outstanding shares, which may include the common shares represented by the ADSs, at any time during the calendar year in which the sale occurs and during the five consecutive calendar years prior to the calendar year in which the sale occurs.
Under Korean tax law, ADSs are viewed as shares of common stock for capital gains tax purposes. Accordingly, capital gains from the sale or disposition of ADSs are taxed (if such sale or disposition constitutes a taxable event) as if such gains are from the sale or disposition of the underlying common shares. Capital gains
186
Table of Contents
that you earn (regardless of whether you have a permanent establishment in Korea) from a transfer of ADSs outside of Korea will generally be exempt from Korean income taxation by virtue of the Special Tax Treatment Control Law of Korea, or STTCL, provided that the issuance of the ADSs is deemed to be an overseas issuance under the STTCL. However, if you transfer ADSs after having converted the underlying common shares, such exemption under the STTCL will not apply and you will be required to file a corporate income tax return and pay tax in Korea with respect to any capital gains derived from such transfer unless the purchaser or a financial investment company with a brokerage license, as applicable, withholds and pays such tax.
If you are subject to tax on capital gains with respect to the sale of ADSs, or of our common shares you acquired as a result of a withdrawal, the purchaser or, in the case of the sale of the common shares on the Korea Exchange or through a financial investment company with a brokerage license in Korea, such financial investment company is required to withhold Korean tax on capital gains from the sales price in an amount equal to the lower of (1) 11.0% (inclusive of local income surtax) of the gross realization proceeds or (2) subject to the production of satisfactory evidence of acquisition costs and certain direct transaction costs of the common shares or ADSs, 22.0% (inclusive of local income surtax) of the net realized gain, and to make payment of these amounts to the Korean tax authority, unless you establish your entitlement to an exemption under an applicable tax treaty or domestic tax law. See the discussion under “—Tax Treaties” below for an additional explanation on claiming treaty benefits.
Tax Treaties
Korea has entered into a number of income tax treaties with other countries (including the United States), which would reduce or exempt Korean withholding tax on dividends on, and capital gains on transfer of, the common shares or ADSs. For example, under the Korea-United States income tax treaty, reduced rates of Korean withholding tax of 16.5% or 11.0% (depending on your shareholding ratio and inclusive of local income surtax) on dividends and an exemption from Korean withholding tax on capital gains are available to residents of the United States that are beneficial owners of the relevant dividend income or capital gains, subject to certain exceptions. However, under Article 17 (Investment or Holding Companies) of the Korea-United States income tax treaty, such reduced rates and exemption do not apply if (i) you are a United States corporation, (ii) by reason of any special measures, the tax imposed on you by the United States with respect to such dividend income or capital gains is substantially less than the tax generally imposed by the United States on corporate profits and (iii) 25% or more of your capital is held of record or is otherwise determined, after consultation between competent authorities of the United States and Korea, to be owned directly or indirectly by one or more persons who are not individual residents of the United States. Also, under Article 16 (Capital Gains) of the Korea-United States income tax treaty, the exemption on capital gains does not apply if (a) you have a permanent establishment in Korea and any shares of common stock in which you hold an interest and which gives rise to capital gains are effectively connected with such permanent establishment, (b) you are an individual and you maintain a fixed base in Korea for an aggregate of 183 days or more during a given taxable year and your ADSs or common shares giving rise to capital gains are effectively connected with such fixed base or (c) you are an individual and you are present in Korea for an aggregate of 183 days or more during a given taxable year.
You should inquire for yourself whether you are entitled to the benefit of a tax treaty between Korea and the country where you are a resident. It is the responsibility of the party claiming the benefits of an income tax treaty in respect of dividend payments or capital gains to submit to us, the purchaser or the financial investment company, as applicable, a certificate as to his tax residence. In the absence of sufficient proof, we, the purchaser or the financial investment company, as applicable, must withhold tax at the normal rates. Furthermore, in order for you to claim the benefit of a tax rate reduction or tax exemption on certain Korean source income (such as dividends or capital gains) under an applicable tax treaty, Korean tax law requires you (or your agent) to submit an application (for reduced withholding tax rate, “application for entitlement to reduced tax rate,” and in the case of exemptions from withholding tax, “application for tax exemption,” along with a certificate of your tax residency issued by a competent authority of your country of tax residence, subject to certain exceptions) as the beneficial owner of such Korean source income (“BO application”). For example, a U.S. resident would be
187
Table of Contents
required to provide Form 6166 as a certificate of tax residency together with the application for entitlement to reduced tax rate or the application for tax exemption. Such application should be submitted to the withholding agent prior to the payment date of the relevant income. Subject to certain exceptions, where the relevant income is paid to an overseas investment vehicle (which is not the beneficial owner of such income) (���OIV”), a beneficial owner claiming the benefit of an applicable tax treaty with respect to such income must submit its BO application to such OIV, which must submit an OIV report and a schedule of beneficial owners (and the BO applications collected from each beneficial owner, if such beneficial owner is applying for tax exemption) to the withholding agent prior to the payment date of such income. Effective from January 1, 2022, an OIV is deemed to be a beneficial owner of the Korean source income if (i) under the applicable tax treaty, the OIV bears tax liabilities in the country in which it is established and (ii) the Korean source income is eligible for benefits under the tax treaty. The benefits under a tax treaty between Korea and the country of such OIV’s residence will apply with respect to the relevant income paid to such OIV, subject to certain application requirements as prescribed by the Corporate Income Tax or Individual Income Tax Law. In the case of a tax exemption application, the withholding agent is required to submit such applications (together with the applicable OIV report in the case of income paid to an OIV) to the relevant district tax office by the ninth day of the month following the date of the payment of such income.
Inheritance Tax and Gift Tax
If you die while holding an ADS or donate an ADS, it is unclear whether, for Korean inheritance tax and gift tax purposes, you will be treated as the owner of the common shares underlying the ADSs. If the tax authority interprets depositary receipts as the underlying share certificates, you may be treated as the owner of the common shares and your heir or the donee (or in certain circumstances, you as the donor) will be subject to Korean inheritance tax or gift tax presently at the rate of 10% to 50%, provided that the value of the ADSs or the common shares is greater than a specified amount.
If you die while holding a common share or donate a common share, your heir or donee (or in certain circumstances, you as the donor) will be subject to Korean inheritance tax or gift tax at the same rate as indicated above.
At present, Korea has not entered into any tax treaty relating to inheritance tax or gift tax.
Securities Transaction Tax
If you transfer our common shares on the Korea Exchange in 2023, you will be subject to securities transaction tax at the rate of 0.05% (with such rate to be reduced to 0.03% if the transfer is made in 2024 and no such securities transaction tax to be imposed on transfers starting January 1, 2025) and an agriculture and fishery special surtax at the rate of 0.15% of the sale price of the common shares. If your transfer of the common shares is not made on the Korea Exchange, subject to certain exceptions, you will be subject to securities transaction tax at the rate of 0.35% and will not be subject to an agriculture and fishery special surtax.
Under the Securities Transaction Tax Law, depositary receipts (such as American depositary receipts) constitute share certificates subject to the securities transaction tax. However, the transfer of depositary receipts listed on the New York Stock Exchange, the Nasdaq Global Market, or other qualified foreign exchanges is exempt from the securities transaction tax.
In principle, the securities transaction tax, if applicable, must be paid by the transferor of the common shares or ADSs. When the transfer is effected through a securities settlement company in Korea, such settlement company is generally required to withhold and pay the tax to the tax authorities. When such transfer is made through a financial investment company only, such financial investment company is required to withhold and pay the tax. Where the transfer is effected by a non-resident without a permanent establishment in Korea, other than through a securities settlement company or a financial investment company, the transferee is required to withhold the securities transaction tax.
188
Table of Contents
Non-reporting or under-reporting of securities transaction tax will generally result in penalties equal to 20% to 60% of the non-reported tax amount or 10% to 60% of under-reported tax amount. Also, a failure to timely pay securities transaction tax will result in a penalty equal to 8.03% per annum of the due but unpaid tax amount. The penalties are imposed on the party responsible for paying the securities transaction tax or, if such tax is required to be withheld, on the party that has the obligation to withhold.
| Item 10.F. | Dividends and Paying Agents |
Not applicable.
| Item 10.G. | Statement by Experts |
Not applicable.
| Item 10.H. | Documents on Display |
We are subject to the information requirements of the Exchange Act, and, in accordance therewith, are required to file reports, including annual reports on Form 20-F, and other information with the U.S. Securities and Exchange Commission. As a foreign private issuer, we are also required to make filings with the Commission by electronic means. Any filings we make electronically will be available to the public over the Internet at the Commission’s web site at http://www.sec.gov.
| Item 10.I. | Subsidiary Information |
Not applicable.
| Item 10.J. | Annual Report to Security Holders |
Not applicable.
| Item 11. | QUANTITATIVE AND QUALITATIVE DISCLOSURES ABOUT MARKET RISK |
Overview
As a financial services provider, we are exposed to various risks related to our lending and trading businesses, our funding activities and our operating environment, principally through Kookmin Bank, our banking subsidiary. Our goal in risk management is to ensure that we identify, measure, monitor and control the various risks that arise, and that our organization adheres strictly to the policies and procedures which we establish to address these risks. Under our internal regulations pertaining to our consolidated capital adequacy ratio and internal standards for risk appetite and internal capital under Basel III, we identify the following eight separate categories of risk inherent in our business activities: credit risk, market risk, operational risk, interest rate risk, liquidity risk, credit concentration risk, reputation risk and strategic risk. Of these, the principal risks to which we are exposed are credit risk, market risk, liquidity risk and operational risk, and we strive to manage these and other risks within acceptable limits.
Organization
We have a multi-tiered risk management governance structure. Our Risk Management Committee is ultimately responsible for group-wide risk management, and directs our various subordinate risk management entities. The Risk Management Council coordinates the implementation of policies set forth by the Risk Management Committee with the relevant risk management units of our subsidiaries. The Subsidiary Risk Management Committee of each of our subsidiaries, based on the Risk Management Committee’s policies,
189
Table of Contents
determines risk management strategies and implements risk management policies and guidelines for such subsidiary and directs the activities of the subsidiary’s risk management units within the risk guidelines set at the group level. Each Subsidiary Risk Management Committee generally receives inputs from the respective risk management units of such subsidiary, which report to the Risk Management Committee.
The following chart sets out our risk management governance structure as of the date of this annual report:
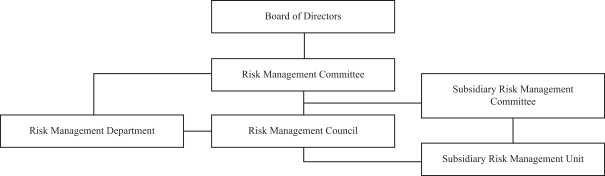
Risk Management Committee
Our Risk Management Committee is a board-level committee that is responsible for overseeing all risks and advising the board of directors with respect to risk management-related issues. The committee consists of four non-executive directors (one of whom serves as the chairman of the committee), and convenes on a quarterly basis. Its major roles include:
| • | establishing risk management strategies in accordance with the directives of the board of directors; |
| • | determining our target risk appetite; |
| • | allocating risk capital to each subsidiary and approving our subsidiaries’ risk limits; |
| • | reviewing the level of risks we are exposed to and the appropriateness of our risk management policies, systems and operations; and |
| • | reviewing recovery and resolution plans. |
Risk Management Council
Our Risk Management Council is responsible for coordinating with the risk management units of our subsidiaries to ensure that they implement the policies, guidelines and limits established by the Risk Management Committee. The Risk Management Council is comprised of our chief risk management officer and the chief risk management officers of all of our subsidiaries. It operates independently from all business units and convenes on a quarterly basis. Its responsibilities include:
| • | analyzing our risk status by using information provided by our subsidiary-level risk management units; |
| • | deliberating adjustments to the integrated risk capital allocation plan and risk limits for each of our subsidiaries; and |
| • | coordinating issues relating to the group-wide integration of our risk management functions. |
Subsidiary Risk Management Committees
Each of our subsidiaries has delegated risk management authority to its Subsidiary Risk Management Committee. Each Subsidiary Risk Management Committee measures and monitors the various risks faced by the
190
Table of Contents
relevant subsidiary and reports to that subsidiary’s board of directors regarding decisions that it makes on risk management issues. It also makes certain strategic risk-related decisions regarding the operations of the relevant subsidiary, such as setting total exposure limits, allocating credit risk limits and market risk-related limits and determining which market risk derivatives instruments the subsidiary can trade. The major activities of each Subsidiary Risk Management Committee include:
| • | determining and monitoring risk policies, guidelines, limits and tolerance levels and the level of subsidiary risk in accordance with group policy; |
| • | reviewing and analyzing the subsidiary’s risk profile; |
| • | setting limits for and adjusting the risk capital allocation plan and risk levels for each business unit within the subsidiary; and |
| • | monitoring compliance with our group-wide risk management policies and practices at the business unit and subsidiary level. |
Each Subsidiary Risk Management Committee is comprised of the subsidiary’s non-executive directors on its board of directors.
Credit Risk Management
Credit risk is the risk of expected and unexpected losses in the event of borrower or counterparty defaults. Credit risk management aims to improve asset quality and generate stable profits while reducing risk through diversified and balanced loan portfolios. We determine the creditworthiness of each type of borrower or counterparty through reviews conducted by our credit experts and through our credit rating systems, and we set a credit limit for each borrower or counterparty.
We assess and manage all credit exposures. We measure expected losses and internal capital on assets (whether on- or off-balance sheet) that are subject to credit risk management and use expected losses and internal capital as management indicators. We manage credit risk by allocating credit risk internal capital limits. In addition, we control credit concentration risk exposure by applying and managing total exposure limits to prevent excessive risk concentration to particular industries or borrowers. Credit exposures that we assess and manage include loans to borrowers and counterparties, investments in securities, letters of credit, bankers’ acceptances, derivatives and commitments. Our risk appetite, which is the ratio of our required internal capital to our estimated available book capital, is approved by the Risk Management Committee once a year. Thereafter, we calculate internal capital every month for all of our subsidiaries and on a holding company level based on attributed internal capital in accordance with the risk appetite as approved by the Risk Management Committee, and measure and report profiles of credit risk on a holding company level and by subsidiary regularly to our senior management, including our Risk Management Committee.
We use expected default rates and recovery rates to determine the expected loss rate of a borrower or counterparty. We use the expected loss rate to make credit related decisions, including pricing, loan approval and establishment of standards to be followed at each level of decision making. These rates are calculated using information gathered from our internal database. With respect to large corporate borrowers, we also use information provided by external credit rating services to calculate default rates and recovery rates.
Our credit risk management processes include:
| • | establishing credit policy; |
| • | credit evaluation and approval; |
| • | industry assessment; |
| • | total exposure management; |
191
Table of Contents
| • | collateral evaluation and monitoring; |
| • | credit risk assessment; |
| • | early warning and credit review; and |
| • | post-credit extension monitoring. |
Credit Evaluation
With respect to corporate loans, Kookmin Bank evaluates the ability of all loan applicants to repay their borrowings before it approves any loans, except for loans fully guaranteed by letters of guarantee issued by the Credit Guarantee Fund and the Korea Technology Credit Guarantee Fund, for loans fully secured by deposits and for other loans similarly guaranteed or secured. Kookmin Bank assigns each borrower or guarantor a credit rating based on the judgment of its experts or scores calculated using the appropriate credit rating system. Factors that Kookmin Bank considers in assigning credit ratings include both financial factors and non-financial factors, such as its perception of the borrower’s ability to meet its payment obligations, risks relating to the industry in which the borrower operates, management and operational risks relating to the borrower, the borrower’s financial flexibility and the borrower’s level of reliability based on its transaction history. With respect to retail loans, Kookmin Bank assigns credit ratings based on its internal information regarding the borrower that has been accumulated as well as external information gathered from credit bureaus relating to various criteria, such as the borrower’s profession, annual income, credit card overdue information and transaction history involving both Kookmin Bank and other financial institutions. The credit rating process differs according to the type, size and characteristics of the borrower.
Kookmin Bank uses its internally developed credit rating systems to rate potential borrowers. As the characteristics of each customer segment differ, Kookmin Bank uses several credit rating systems for its customers. The nature of the credit rating system used for a particular borrower depends on whether the borrower is an individual, a SOHO customer, a small- and medium-sized enterprise or a large company. For large companies and small- and medium-sized enterprises, Kookmin Bank has 17 credit ratings ranging from AAA to D for risk management purposes. For retail customers, it has 13 credit ratings ranging from grade 1 to grade 13.
Based on the credit rating of a borrower, Kookmin Bank applies different credit policies, which affect factors such as credit limit, loan period, loan pricing, loan classification and provisioning. Kookmin Bank also uses these credit ratings in evaluating its bank-wide risk management strategy. Factors Kookmin Bank considers in making this evaluation include the profitability of each company or transaction, performance of each business unit and portfolio management. Kookmin Bank monitors the credit status of borrowers and collect information to adjust its ratings appropriately. If Kookmin Bank changes a borrower’s credit rating, it will also change the credit policies relating to that borrower and may also change the policies underlying its loan portfolio.
Retail Loan Approval Process
Mortgage Loans and Secured Retail Loans. Branch staff employees of Kookmin Bank forward loan applications to processing centers and Kookmin Bank’s processing center staff reviews mortgage loans and retail loans secured by real estate or guarantees. However, in the case of loans secured by deposits with Kookmin Bank, its branch staff approves such loans. Kookmin Bank makes lending decisions based on its assessment of the value of the collateral, debt service capability and the borrower’s score generated from its credit scoring systems.
For mortgage loans and loans secured by real estate, Kookmin Bank evaluates the value of the real estate offered as collateral using a database it has developed that contains information about real estate values throughout Korea. Kookmin Bank also uses information from a third party provider about the real estate market in Korea, which gives it up-to-date market value information for Korean real estate. In addition, Kookmin Bank’s
192
Table of Contents
processing center staff employees review the value of real estate provided by the evaluation system to ensure there are no significant discrepancies. Kookmin Bank bases decisions regarding the approval of such loans primarily on the results of its credit scoring systems.
For loans secured by deposits, Kookmin Bank will generally grant loans up to 95% of the deposit amount if it holds the deposit.
Kookmin Bank generally decides whether to evaluate a loan application within three to five days after recording the relevant information in its credit scoring systems.
Unsecured Retail Loans. Kookmin Bank reviews applications for unsecured retail loans in accordance with its credit scoring systems. These automated systems evaluate loan applications and determine an appropriate pricing for the loan. The major benefits of using a credit scoring system are that it yields uniform results regardless of the user and that it can be used effectively by employees who do not necessarily have extensive experience in credit evaluation. The staff of Kookmin Bank’s processing centers reviews the results of the credit scoring system based on information input by its branch staff and, if approved, issues the loan.
Kookmin Bank’s credit scoring systems take into account factors including borrower’s income, assets, profession, transaction history (with both it and other financial institutions) and other relevant credit information. The systems rank each borrower in an appropriate grade, and that grade is used as a factor in deciding whether to approve loans as well as to determine loan amounts. Kookmin Bank generally bases its decisions on the results of its credit scoring systems to evaluate applications.
Corporate Loan Approval Process
We approve corporate loans at different levels of our organization depending on the size and type of the loan, the credit risk level assessed by the credit rating system, whether the loan is secured by collateral and, if secured, the value of the collateral. The lowest level of authority is the branch staff employee of Kookmin Bank, who can approve small loans and loans that have the lowest range of credit risk. Larger loans and loans with higher credit risk are approved by higher levels of authority depending on where they fall in a matrix of loan size and credit risk. Depending on the size and terms of any particular loan or the credit risk relating to a particular borrower, more than one entity may review the application, although generally loan applications are reviewed only by the entity having corresponding authority to approve the loan.
Kookmin Bank evaluates all of its corporate borrowers by using credit rating systems, except for applicants whose borrowings are fully secured by deposits or applicants who have obtained third-party guarantees from the government or certain other very highly rated guarantors. See “—Credit Evaluation.”
For owner-operated enterprises (which we refer to as SOHOs), Kookmin Bank has put in place a credit rating system known as Small Office Home Office Corporate Rating System, or SOHO CRS. For other small- and medium-sized enterprises, Kookmin Bank has put in place a similar credit rating system known as Corporate Rating System, or CRS. For large corporations, Kookmin Bank has put in place a similar credit rating system known as Large Corporate Rating System, or LCRS. For financial institutions, certain non-profit organizations and public institutions, Kookmin Bank has put in place a credit rating system known as Financial Institute, Non-profit, Public Corporate Rating System, or FNP CRS. The SOHO CRS, the CRS, the LCRS and the FNP CRS models consist of the following four parts:
| • | Financial Model. The financial model uses financial ratios such as stability ratio, profitability ratio and cash flow ratio to make credit determinations. |
| • | Non-financial Model. The non-financial model uses various qualitative and quantitative factors, such as future repayment capability, industry-related risks, management-related risks and operation-related risks, to evaluate borrowers. |
193
Table of Contents
| • | CEO Evaluation Model. The CEO evaluation model is relevant for the SOHO CRS in particular (including business entities without external audits), and evaluates the credit information of the individual owner of SOHOs by reviewing such owner’s personal information, bank transaction records and external credit ratings. |
| • | Default Signal Check Model. The default signal check model checks factors that have low frequency of occurrence but are highly likely to lead to a default in the event of an occurrence. The results of the default signal check model may be used to cap a borrower’s credit grade. |
Credit Card Approval Process
We make decisions on all credit card approvals based on the Financial Supervisory Service standard of review for payment ability (such as the occupation and income of the applicant), as well as a combination of KB Kookmin Card’s internal application scoring system and a credit scoring system developed by independent credit bureaus.
KB Kookmin Card’s application scoring system reflects various credit information, including basic customer information (such as credit history), transaction history with it, if any, delinquency and transaction history with other card companies and financial institutions and credit information provided by Korea Credit Information Services and other credit bureaus. KB Kookmin Card also considers repayment ability, total assets, total outstanding borrowings and the length of the applicant’s relationship, if any, and past contribution to our profitability, if any.
The credit scoring system developed by credit bureaus, reflects various sources of information regarding the credit risk of customers, including delinquency and transaction history with other credit card companies and financial institutions.
On the basis of the standard of review for payment ability and the combination of the scores from our application scoring system and the credit scoring system developed by independent credit bureaus, KB Kookmin Card establishes, among other things, the term of any new approvals, initial limits and differentiation of fee rates with respect to its credit cards. KB Kookmin Card’s systems allow it to differentiate applicants into groups that receive immediate credit card approval or rejection, or that may require it to further investigate that applicant’s credit qualifications. The initial limits of new applicants are based on their estimated disposable income, which is based on their occupation and the value of their personal assets. KB Kookmin Card applies its fee rates to applicants differently according to risk premium and profitability.
Total Exposure Management
We establish and manage total exposure limits for industries, chaebols and corporations, as well as certain small- and medium-sized enterprises, in order to efficiently manage financial assets and to optimize our credit portfolio. Kookmin Bank establishes total exposure limits for (i) main debtor groups designated by the Financial Supervisory Service, (ii) groups to which Kookmin Bank has total exposure of ₩50 billion or more, (iii) enterprises that belong to a main debtor group or large enterprises, in both cases to which Kookmin Bank has total exposure of ₩40 billion or more, (iv) small- and medium-sized enterprises to which Kookmin Bank has total exposure of ₩30 billion or more and (v) other groups or individual enterprises designated by the head of Kookmin Bank’s Risk Management Group as necessary. Kookmin Bank establishes total exposure limit by reviewing factors such as industry, size, cash flows, financial ratios and credit ratings, while establishing exposure limits for industries by reviewing the sales growth rate and risk concentration for each industry. The total exposure limits for a specific industry are set following approval by Kookmin Bank’s Risk Management Council after review by the Credit Risk Management Subcommittee, while the exposure limits for a specific company or company group are set during the review of their credit application by the relevant approval authority.
194
Table of Contents
Kookmin Bank’s maximum exposure limit is within 25% of its Tier I and Tier II capital for a single group, and within 10% of its Tier I and Tier II capital for a single corporation.
We manage and control exposure limits on a daily basis. The principal system that we use for this purpose is the Total Exposure Management System. This system allows us to monitor and control our total exposure to corporations, chaebols and industries. Kookmin Bank monitors its exposure to large corporations to which it has an exposure of ₩40 billion or more, individual corporations to which it has an exposure of ₩30 billion or more, and also its exposure to 168 business groups, which comprise the 32 largest highly-indebted business groups, such groups being the main debtor groups in Korea designated as such by the Financial Supervisory Service based on their outstanding exposures as well as 136 business groups to which it has exposures (in the form of securities or loans) of ₩50 billion or more. We also monitor our exposure to 37 industries. Our Total Exposure Management System integrates all of our credit-related risk including credit extended by our overseas branches and affiliates. The assets subject to the system include all Won-denominated and foreign currency-denominated loans, all assets in trust accounts except specified money trusts, guarantees, trade-related credits, commercial paper, corporate bonds and other securities and derivatives.
Collateral Evaluation and Monitoring System
Kookmin Bank uses the Collateral Evaluation and Monitoring System to manage the liquidation value of collateral it holds. The Collateral Evaluation and Monitoring System is a computerized collateral management system that can be accessed from Kookmin Bank’s headquarters and its branches. Using this system, Kookmin Bank can more accurately assess the actual liquidation value of collateral, determine the recovery rate on its loans and use this information in setting its credit risk management and loan policies. Kookmin Bank can monitor the value of all the collateral a borrower provides and the value of that collateral based on its liquidation value. When appraising the value of real estate collateral, which makes up the largest part of Kookmin Bank’s collateral, Kookmin Bank consults a regularly updated database provided by a third party that tracks the prices at which various types of real estate in various regions of Korea are sold. Kookmin Bank appraises the value of collateral when it makes a loan, when the loan is due for renewal and when events occur that may change the value of the collateral.
Credit Risk Management and Monitoring
Kookmin Bank’s Credit Risk Department establishes loan portfolio policies and appropriate credit risk limits, including those applicable to internal capital and total exposures to certain assets and business groups, to prevent excessive credit risk. It also analyzes and monitors our loan portfolios and monitors our compliance with the applicable limits for credit risk on a regular basis. In addition, it implements an industrial risk management plan by monitoring industrial trends and evaluating industry ratings. It also separately manages high-risk products, such as real estate project financing loans and over-the-counter derivative products, by setting appropriate limits.
Credit Review
Kookmin Bank’s credit review function is independent of the business groups which manage our assets. Its Credit Review Department:
| • | reviews internal credit regulations, policies and systems; |
| • | analyzes the credit status of selected loan assets and verifies the appropriateness of the credit evaluations/approvals made by branches and headquarters; and |
| • | evaluates the corporate credit risk of potentially insolvent companies. |
More specifically, Kookmin Bank’s Credit Review Department continually reviews the financial condition of selected borrowers with respect to their current debt, collateral, business, transactions with related parties and
195
Table of Contents
debt service capability. Based on such review, Kookmin Bank may adjust the borrower’s credit rating, lending policy or asset quality classification of the loan provided to the borrower, depending on the applicable circumstances. Kookmin Bank also regularly reviews other aspects of the lending process, including industries and regions in which its borrowers operate and the quality of its domestic and overseas assets. Kookmin Bank’s industry reviews focus on growth, stability, competition and ability to adapt to a changing environment. Based on the results of a particular industry review, Kookmin Bank may revise the total exposure limit assigned to that industry and lending policy for each company within that industry. When a review takes place, Kookmin Bank may adjust not only the credit ratings of its borrowers based on a variety of factors, but also asset quality classification, credit limits and its credit policies. Credit review results are reported to Kookmin Bank’s chief risk management officer and its Risk Management Committee on a quarterly basis.
Kookmin Bank’s Credit Review Department also conducts on-site reviews of selected branches that are experiencing increasing delinquency ratios and bad debts. During these visits Kookmin Bank examines the loan processes and recommends improvement plans and appropriate follow-up measures.
Also, based on guidelines provided by the Financial Supervisory Service to all Korean banks, Kookmin Bank operates a corporate credit risk assessment program to facilitate the identification of weak companies and possible commencement of corporate restructuring. Through this program, Kookmin Bank, together with other banks, is able to detect symptoms of financially troubled companies at an early stage, assess related credit risk and support the normalization of companies that are likely to turnaround through a workout process, or seek to liquidate those companies that are not likely to recover.
Kookmin Bank’s Credit Review Department also analyzes issues related to credit risk and provides information necessary for the formulation of effective credit policies and strategies and for effective credit risk management.
Market Risk Management
The major risks to which we are exposed are interest rate risk on debt instruments and interest bearing securities and foreign exchange risk and, to a lesser extent, stock price risk. The financial instruments that expose us to these risks are securities and financial derivatives. We are also exposed to interest rate risk and liquidity risk in Kookmin Bank’s banking book. We divide market risk into risks arising from trading activities and risks arising from non-trading activities.
Kookmin Bank’s Risk Management Council establishes overall market risk management principles. It has delegated the responsibility for the market risk management for trading activities to the Market Risk Management Subcommittee of Kookmin Bank, which is chaired by Kookmin Bank’s chief risk management officer. This subcommittee meets on a regular basis each month and as required to respond to developments in the market and the economy. Based on the policies approved by Kookmin Bank’s Risk Management Council, the Market Risk Management Subcommittee reviews and approves reports as required that include trading profits and losses, position reports, limit utilization, sensitivity analysis and VaR results for our trading activities.
Kookmin Bank’s Risk Management Council is responsible for interest rate and liquidity risk management for its non-trading activities. The council meets on a regular basis and as required to respond to developments in the market and the economy. Members of the Risk Management Council, acting through Kookmin Bank’s Risk Management Department, review Kookmin Bank’s interest rate and liquidity gap position monthly, as well as the business profile and its impact on asset and liability management.
To ensure adequate interest rate and liquidity risk management, we have assigned the responsibilities for our asset and liability risk management to Kookmin Bank’s Risk Management Department in Kookmin Bank’s Risk Management Group, which monitors and reviews the asset and liability operating procedures and activities of Kookmin Bank’s Financial Planning Department, and independently reports to the management on the related issues.
196
Table of Contents
Market Risk Management for Trading Activities
Our trading activities consist of:
| • | trading activities for our own account to realize short-term trading profits in Won-denominated debt and equities markets and foreign exchange markets based on our short-term forecast of changes in the market situation; and |
| • | trading activities involving derivatives, such as swaps, forwards, futures and option transactions, to realize profits primarily from selling derivative products to our customers and to hedge market risk incurred from those activities. |
We use derivative instruments to hedge our market risk and, to a limited extent, to make profits by trading derivative products within acceptable risk limits. The principal objective of our hedging strategy is to manage our market risk within established limits. We use the following hedging instruments to manage relevant risks:
| • | to hedge interest rate risk arising from its trading activities, the Capital Markets Group of Kookmin Bank occasionally uses interest rate futures (Korea Treasury Bond Futures) and interest rate swaps; |
| • | to hedge interest rate risk and foreign exchange risk arising from our foreign currency-denominated asset and liability positions as well as our trading activities, the Capital Markets Group of Kookmin Bank uses interest rate swaps, cross-currency interest rate swaps, foreign exchange forwards and futures, Euro-dollar futures and currency options; and |
| • | to change the interest rate characteristics of certain assets and liabilities after the original investment or funding, we use swaps. For example, depending on the market situation, we may choose to obtain fixed rate funding instead of floating rate funding if we believe that the terms are more favorable, which we can achieve by entering into interest rate swaps. |
We generally manage our market risk at the portfolio level. To control our exposure to market risk, we use internal capital limits set by Kookmin Bank’s Risk Management Committee for Kookmin Bank and at the group level within Kookmin Bank, VaR, position and stop loss limits set by Kookmin Bank’s Risk Management Council for Kookmin Bank and at the group level within Kookmin Bank, and VaR, position, stop loss and sensitivity limits (PVBP, Delta, Gamma, Vega) set by Kookmin Bank’s Market Risk Management Subcommittee at the department level within Kookmin Bank. We prepared our risk control and management guidelines for derivative trading based on the regulations and guidelines promulgated by the Financial Supervisory Service.
In addition, we have implemented internal processes which include a number of key controls designed to ensure that fair value is measured appropriately, particularly where a fair value model is internally developed and used to price a significant product. See Notes 4.4 and 6 of the notes to our consolidated financial statements. For example, each year, Kookmin Bank’s Risk Management Department reviews the existing pricing and valuation models, with a focus on their underlying modeling assumptions and restrictions, to assess the appropriateness of their continued use. In consultation with Kookmin Bank’s Trading Department, the Risk Management Department recommends potential valuation models to Kookmin Bank’s Fair Value Evaluation Committee. Upon approval by Kookmin Bank’s Fair Value Evaluation Committee, the selected valuation models are reported to its Market Risk Management Subcommittee.
We monitor market risk arising from trading activities of our business groups and departments. The market risk measurement model we use for both our Won-denominated trading operations and foreign currency-denominated trading operations is implemented through our integrated market risk management system called Adaptiv, which enables us to generate consistent VaR numbers for all trading activities.
Value at Risk analysis. We use VaR to measure market risk. VaR is a statistically estimated maximum amount of loss that could occur over a given period of time at a given level of confidence. VaR is a commonly used market risk management technique. However, this approach does have some shortcomings. VaR estimates possible losses over a certain period at a particular confidence level using past market movement data. Past
197
Table of Contents
market movement, however, is not necessarily a good indicator of future events, as there may be conditions and circumstances in the future that the model does not anticipate. As a result, the timing and magnitude of the actual losses can be different depending on the assumptions made at the time of calculation. In addition, the time periods used for the model, generally one or ten days, are assumed to be a sufficient holding period before liquidating the relevant underlying positions. If these holding periods are not sufficient, or too long, the VaR results may understate or overstate the potential loss. Different VaR methodologies and distributional assumptions could produce a materially different VaR. VaR is most appropriate as a risk measure for trading positions in liquid capital markets and will understate the risk associated with severe events, such as a period of extreme illiquidity.
We use a 99% single tail confidence level to measure VaR, which means the actual amount of loss may exceed the VaR, on average, once out of 100 business days. Until 2011, we used the “variance-covariance method” or parametric VaR (“PVaR”) methodology to measure our daily VaR, which took into account the diversification effects among different risk categories as well as within the same risk category. In 2012, we received authorization from the Financial Services Commission to use a historical simulation VaR (“HSVaR”) methodology, which we believe to be more accurate and responsive in reflecting market volatilities, to measure market risk. Our ten-day HSVaR method, which is computed using a full valuation and is computationally intensive, uses an archive of historic price data and the VaR for a portfolio is estimated by creating a hypothetical time series of returns on that portfolio, obtained by running the portfolio through actual ten-day historical data and computing the changes that would have occurred in each ten-day period.
The following table shows the volume and types of positions held by Kookmin Bank for which the VaR method is used to measure market risk as of December 31, 2021 and 2022.
| As of December 31, | ||||||||
| 2021 | 2022 | |||||||
| (in millions of Won) | ||||||||
Securities—Bond(1) | ₩ | 11,744,275 | ₩ | 12,580,957 | ||||
Securities—Equity(1) | 61,485 | 65,914 | ||||||
Spot exchanges(2) | 2,776,925 | 6,340,438 | ||||||
Derivatives(3) | 5,900,343 | 15,181,621 | ||||||
|
|
|
| |||||
Total | ₩ | 20,483,028 | ₩ | 34,168,929 | ||||
|
|
|
| |||||
| (1) | Represents amounts marked to market and as shown on the balance sheet information that is prepared and submitted to the Financial Supervisory Service for risk management purposes. |
| (2) | Represents the overall net open currency position in each currency, which is the greater of (i) the sum of the absolute value of all short positions and (ii) the sum of the absolute value of all long positions. |
| (3) | For over-the-counter derivatives, represents the absolute value of over-the-counter derivatives measured at fair value at year end. For exchange-traded derivatives, includes the amount of deposits and the collateral posted for such derivatives. |
The following table shows Kookmin Bank’s ten-day HSVaRs (at a 99% confidence level for a ten-day holding period) as of December 31, 2021 and 2022 for interest risk, stock price risk and foreign exchange risk relating to its trading activities. The following figures were calculated on a consolidated basis.
| As of December 31, | ||||||||
| 2021 | 2022 | |||||||
| (in billions of Won) | ||||||||
Risk categories: | ||||||||
Interest risk | ₩ | 16.5 | ₩ | 47.1 | ||||
Stock price risk | 5.5 | 9.4 | ||||||
Foreign exchange risk | 21.5 | 41.2 | ||||||
Less: diversification | (13.0 | ) | (5.1 | ) | ||||
|
|
|
| |||||
Diversified VaR for overall trading activities | ₩ | 30.5 | ₩ | 92.5 | ||||
|
|
|
| |||||
198
Table of Contents
In 2022, the average, high, low and ending amounts of ten-day HSVaR (at a 99% confidence level for a ten-day holding period) for Kookmin Bank relating to its trading activities were as follows:
| Trading activities VaR for 2022 | ||||||||||||||||
| Average | Minimum | Maximum | As of December 31, 2022 | |||||||||||||
| (in billions of Won) | ||||||||||||||||
Interest risk | ₩ | 34.9 | ₩ | 16.5 | ₩ | 64.4 | ₩ | 47.1 | ||||||||
Stock price risk | 8.6 | 5.1 | 11.1 | 9.4 | ||||||||||||
Foreign exchange risk | 24.1 | 14.4 | 41.8 | 41.2 | ||||||||||||
Less: diversification | (5.1 | ) | ||||||||||||||
|
|
|
|
|
|
|
| |||||||||
Diversified VaR for overall trading activities | ₩ | 49.7 | ₩ | 22.1 | ₩ | 99.4 | ₩ | 92.5 | ||||||||
|
|
|
|
|
|
|
| |||||||||
In 2021, the average, high, low and ending amounts of ten-day HSVaR (at a 99% confidence level for a ten-day holding period) for Kookmin Bank relating to its trading activities were as follows:
| Trading activities VaR for 2021 | ||||||||||||||||
| Average | Minimum | Maximum | As of December 31, 2021 | |||||||||||||
| (in billions of Won) | ||||||||||||||||
Interest risk | ₩ | 20.0 | ₩ | 6.3 | ₩ | 55.6 | ₩ | 16.5 | ||||||||
Stock price risk | 9.0 | 4.5 | 24.8 | 5.5 | ||||||||||||
Foreign exchange risk | 27.8 | 17.8 | 49.2 | 21.5 | ||||||||||||
Less: diversification | (13.0 | ) | ||||||||||||||
|
|
|
|
|
|
|
| |||||||||
Diversified VaR for overall trading activities | ₩ | 40.9 | ₩ | 15.9 | ₩ | 115.3 | ₩ | 30.5 | ||||||||
|
|
|
|
|
|
|
| |||||||||
In 2020, the average, high, low and ending amounts of ten-day HSVaR (at a 99% confidence level for a ten-day holding period) for Kookmin Bank relating to its trading activities were as follows:
| Trading activities VaR for 2020 | ||||||||||||||||
| Average | Minimum | Maximum | As of December 31, 2020 | |||||||||||||
| (in billions of Won) | ||||||||||||||||
Interest risk | ₩ | 59.3 | ₩ | 9.6 | ₩ | 106.0 | ₩ | 50.8 | ||||||||
Stock price risk | 15.2 | 3.8 | 24.3 | 24.8 | ||||||||||||
Foreign exchange risk | 36.1 | 5.3 | 67.8 | 49.3 | ||||||||||||
Less: diversification | (7.3 | ) | ||||||||||||||
|
|
|
|
|
|
|
| |||||||||
Diversified VaR for overall trading activities | ₩ | 105.4 | ₩ | 14.2 | ₩ | 158.8 | ₩ | 117.6 | ||||||||
|
|
|
|
|
|
|
| |||||||||
Standardized Method. Market risk for positions not measured by VaR are measured using the standardized method for measuring market risk-based required equity capital specified by the Financial Supervisory Service, which takes into account certain risk factors. Under the standardized method, the required equity capital is measured using the risk-weighted values for each risk factor. The method used to measure the market risk-based required equity capital for each risk factor is as follows:
| • | Interest rate risk: |
| • | General market risk: General market risk relates to the risk of losses from macroscopic events which could have an impact on interest rates, stock prices, exchange rates, and market prices of general commodities. General market interest rate risk of a debt security is calculated on its net position, taking into consideration the remaining maturity and coupon rate. |
199
Table of Contents
| • | Specific risk: Specific risk relates to the risk of loss from changes in credit risk of issuers of debt securities or equities, excluding changes in general market prices. Specific interest rate risk of a debt security is measured by multiplying the interest rate position appraised based on the market price of such security by the risk-weighted value applicable to the type of debt security, credit rating and the remaining maturity. |
| • | Equity risk: General and specific equity risk are calculated by multiplying the bought or sold position by the relevant risk-weighted values. |
| • | Foreign exchange risk: Foreign exchange risk is measured by multiplying the larger of the absolute values among the net bought or sold positions of each currency by the relevant risk-weighted values. |
| • | Option risk: Option risk is measured using the delta, gamma and vega of the option. |
The standardized method is used to measure the market risk of the positions for which the Financial Supervisory Service has not approved the use of the VaR method. In addition, we use the standardized method for positions which are held by certain subsidiaries or for which measuring VaR is difficult due to the lack of daily position data. See Note 4.4.3 of the notes to our consolidated financial statements included elsewhere in this annual report.
The following table shows the volume and types of instruments held by Kookmin Bank for which the standardized method is used to measure its required equity capital as of December 31, 2021 and 2022.
| As of December 31, | ||||||||
| 2021 | 2022 | |||||||
| (in millions of Won) | ||||||||
Bonds(1) | ₩ | 125,722 | ₩ | 177,016 | ||||
Swaps and foreign exchange positions(2) | 452,615 | 340,847 | ||||||
Derivative-linked securities | — | — | ||||||
Debt-equity swap stock put options(3) | 17 | 33 | ||||||
|
|
|
| |||||
Total | ₩ | 578,354 | ₩ | 517,895 | ||||
|
|
|
| |||||
| (1) | Bonds held by our overseas consolidated subsidiaries, which cannot be measured through the use of our internal models. |
| (2) | Includes our overseas consolidated subsidiaries’ currency positions and their positions for foreign exchange swaps, total return swaps held by special purpose vehicles and foreign exchange derivatives that have not been authorized by the Financial Supervisory Service, which cannot be measured through the use of our internal models. |
| (3) | Reflects the value of our debt-equity swap stock put options in purchase agreements, which cannot be measured through the use of our internal models. |
The following table shows Kookmin Bank’s required equity capital measured using the standardized method as of December 31, 2021 and 2022.
| As of December 31, | ||||||||
| 2021 | 2022 | |||||||
| (in millions of Won) | ||||||||
Risk categories: | ||||||||
Interest risk | ₩ | 25,431 | ₩ | 18,545 | ||||
Stock price risk | 5 | 4,686 | ||||||
Foreign exchange risk | 46,173 | 70,756 | ||||||
|
|
|
| |||||
Total | ₩ | 71,610 | ₩ | 93,987 | ||||
|
|
|
| |||||
Back-Testing. We conduct back testing on a daily basis to validate the adequacy of our market risk model. In back testing, we compare both the actual and hypothetical profit and loss with the VaR calculations and analyze any results that fall outside our predetermined confidence interval of 99%. The number of times the
200
Table of Contents
actual changes in fair values, earnings or cash flows from the market risk sensitive instruments exceeded the VaR amounts in 2020, 2021 and 2022 was 9, 2 and 7, respectively.
Stress testing. In addition to VaR, which assumes normal market situations, we use stress testing to assess our market risk exposure to abnormal market fluctuations. Abnormal market fluctuations include significant declines in the stock market and significant increases in the general level of interest rates. This is an important way to supplement VaR, as VaR is a statistical expression of possible loss under a given confidence level and holding period. It does not cover potential loss if the market moves in a manner that is outside our normal expectations. Stress testing projects the anticipated change in value of holding positions under certain scenarios assuming that no action is taken during a stress event to change the risk profile of a portfolio. According to Kookmin Bank’s stress testing, we estimate that as of December 31, 2022, Kookmin Bank’s trading portfolio could have lost ₩530 billion for an assumed short-term extreme decline of approximately 25% in the equity market and an approximate 111 basis point increase in the Korean treasury bond rates under an abnormal stress environment.
We monitor the impact of market turmoil or any abnormality by conducting stress tests and confirming that the results are within our market risk limits. If the impact is large, Kookmin Bank’s chief risk management officer may request that our portfolio be restructured or other appropriate action be taken.
Interest Risk
Interest risk from trading activities arises mainly from our trading of Won-denominated debt securities. Our trading strategy is to benefit from short-term movements in the prices of debt securities arising from changes in interest rates. As our trading accounts are marked-to-market daily, we manage the interest risk related to our trading accounts using market value-based tools such as VaR and sensitivity analysis. As of December 31, 2022, the VaR of Kookmin Bank’s interest risk from trading was ₩47.1 billion and the weighted average duration, or weighted average maturity, of its Won-denominated debt securities at fair value through profit or loss was approximately 4.7 years.
Foreign Exchange Risk
Foreign exchange risk arises because we have assets and liabilities that are denominated in currencies other than Won, as well as off-balance sheet items such as foreign exchange forwards and currency swaps. Our assets and liabilities denominated in U.S. dollars, Japanese Yen, Euro, Chinese Renminbi and Indonesian IDR have typically accounted for the majority of our foreign currency assets and liabilities.
The difference between our foreign currency assets and liabilities is offset against forward foreign exchange positions, currency options and currency swaps to obtain our net foreign currency open position. Kookmin Bank’s Risk Management Council and Market Risk Management Subcommittee oversee Kookmin Bank’s foreign exchange exposure for both trading and non-trading purposes by establishing a limit for this net foreign currency open position, together with stop loss limits. VaR limits are established on a combined basis for our domestic operations and foreign branches.
201
Table of Contents
The following table shows Kookmin Bank’s non-consolidated net open positions at the end of 2021 and 2022. Positive amounts represent long positions and negative amounts represent short positions. The net open positions held by subsidiaries other than Kookmin Bank are not significant.
| As of December 31,(1) | ||||||||
| 2021 | 2022 | |||||||
| (in millions of US$) | ||||||||
Currency: | ||||||||
U.S. dollars | US$ | (783.4 | ) | US$ | (448.7 | ) | ||
Japanese Yen | (4.2 | ) | 5.0 | |||||
Euro | 7.0 | 17.7 | ||||||
Chinese Renminbi | 50.8 | 67.0 | ||||||
Indonesian IDR | 618.7 | 954.6 | ||||||
Others | 96.7 | 91.6 | ||||||
|
|
|
| |||||
Total | US$ | (14.4 | ) | US$ | 687.2 | |||
|
|
|
| |||||
| (1) | Amounts prepared on a non-consolidated basis. |
Equity Price Risk
Equity price risk results from our equity derivatives trading portfolio in Won since we do not have any trading exposure to shares denominated in foreign currencies.
The equity derivatives trading portfolio in Won consists of exchange-traded stocks and equity derivatives under strict limits on diversification as well as position limits and stop loss limits.
Kookmin Bank’s Risk Management Council and Market Risk Management Subcommittee set annual and monthly stop loss limits that are monitored by Kookmin Bank’s Risk Management Department. In order to ensure timely action, the stop loss limit of individual securities is monitored by the relevant middle office.
As of December 31, 2022, Kookmin Bank’s equity trading position was ₩65.9 billion.
Derivative Market Risk
Our derivative trading includes interest rate and cross-currency swaps, foreign exchange forwards, stock index and interest rate futures and currency options. These activities consist primarily of the following:
| • | sales of tailor-made derivative products that meet various needs of our corporate customers and related transactions to reduce our exposure resulting from those sales; |
| • | taking positions in limited cases when we expect short-swing profits based on our market forecasts; and |
| • | trading to hedge our interest rate and foreign currency risk exposure as described above. |
Market risk from trading derivatives is not significant since our derivative trading activities are primarily driven by customer deals with very limited open trading positions.
Market Risk Management for Non-Trading Activities
Interest Rate Risk
Our principal market risk from non-trading activities is interest rate risk. Interest rate risk arises due to mismatches in the maturities or re-pricing periods of these rate-sensitive assets and liabilities. We measure interest rate risk for Won and foreign currency assets and liabilities in our bank accounts (including derivatives)
202
Table of Contents
and our principal guaranteed trust accounts. Most of our interest-earning assets and interest-bearing liabilities are denominated in Won and our foreign currency-denominated assets and liabilities are mostly denominated in U.S. dollars.
Our principal interest rate risk management objectives are to generate stable net interest revenues and to protect our asset value against interest rate fluctuations. We principally manage this risk for our non-trading activities by analyzing and managing maturity and duration gaps between our interest-earning assets and interest-bearing liabilities. In addition, we use hedging instruments for interest rate risk management for our non-trading assets and liabilities.
Interest rate gap analysis measures expected changes in net interest revenues by calculating the difference in the amounts of interest-earning assets and interest-bearing liabilities at each maturity and interest resetting date. We perform interest rate gap analysis for Won-denominated and foreign currency-denominated assets and trust assets on a monthly basis or more frequently when deemed necessary.
Interest Rate Gap Analysis. We perform interest rate gap analysis based on interest rate repricing maturities of assets and liabilities. However, for some of our assets and liabilities with either no maturities or unique characteristics, we use or assume certain maturities, including the following examples:
| • | With respect to asset maturities, we assume remaining maturities of prime rate-linked loans with remaining maturities of over one year to be one year and use the actual maturities for prime rate-linked loans with remaining maturities of less than one year. |
| • | With respect to liability maturities, we use last 120 months’ average balance to segregate “non-core” and “core” demand deposits. We assume “non-core” demand deposits to have remaining maturities of one day or less, and we assume “core” demand deposits to have remaining maturities between one month and five years. |
The following table shows Kookmin Bank’s interest rate gap for Won-denominated accounts and foreign currency-denominated accounts as of December 31, 2022.
| As of December 31, 2022 | ||||||||||||||||||||||||
| 0-3 Months | 3-6 Months | 6-12 Months | 1-3 Years | Over 3 Years | Total | |||||||||||||||||||
| (in billions of Won, except percentages) | ||||||||||||||||||||||||
Won-denominated | ||||||||||||||||||||||||
Loans | ₩ | 136,256 | ₩ | 83,762 | ₩ | 60,517 | ₩ | 36,680 | ₩ | 11,693 | ₩ | 328,908 | ||||||||||||
Securities | 8,045 | 5,057 | 9,750 | 30,238 | 13,886 | 66,976 | ||||||||||||||||||
Others | 2,599 | 16 | 37 | 3 | 0 | 2,655 | ||||||||||||||||||
|
|
|
|
|
|
|
|
|
|
|
| |||||||||||||
Total | ₩ | 146,900 | ₩ | 88,835 | ₩ | 70,304 | ₩ | 66,921 | ₩ | 25,579 | ₩ | 398,539 | ||||||||||||
|
|
|
|
|
|
|
|
|
|
|
| |||||||||||||
Interest-bearing liabilities: | ||||||||||||||||||||||||
Deposits | ₩ | 135,570 | ₩ | 37,820 | ₩ | 85,860 | ₩ | 49,968 | ₩ | 37,697 | ₩ | 346,915 | ||||||||||||
Borrowings | 16,661 | 0 | 24 | 144 | 0 | 16,829 | ||||||||||||||||||
Others | 18,354 | 4,010 | 2,130 | 1,720 | 2,450 | 28,664 | ||||||||||||||||||
|
|
|
|
|
|
|
|
|
|
|
| |||||||||||||
Total | ₩ | 170,585 | ₩ | 41,830 | ₩ | 88,014 | ₩ | 51,832 | ₩ | 40,147 | ₩ | 392,408 | ||||||||||||
|
|
|
|
|
|
|
|
|
|
|
| |||||||||||||
Sensitivity gap | (23,685 | ) | 47,005 | (17,710 | ) | 15,089 | (14,568 | ) | 6,131 | |||||||||||||||
Cumulative gap | (23,685 | ) | 23,320 | 5,610 | 20,699 | 6,131 | ||||||||||||||||||
% of total assets | (5.9 | )% | 5.9 | % | 1.4 | % | 5.2 | % | 1.5 | % | ||||||||||||||
203
Table of Contents
| As of December 31, 2022 | ||||||||||||||||||||||||
| 0-3 Months | 3-6 Months | 6-12 Months | 1-3 Years | Over 3 Years | Total | |||||||||||||||||||
| (in billions of Won, except percentages) | ||||||||||||||||||||||||
Foreign currency-denominated | ||||||||||||||||||||||||
Due from banks | ₩ | 5,851 | ₩ | 144 | ₩ | 129 | ₩ | 152 | ₩ | 0 | ₩ | 6,276 | ||||||||||||
Loans | 27,846 | 4,077 | 3,143 | 2,714 | 5,150 | 42,930 | ||||||||||||||||||
Securities | 5,366 | 1,179 | 2,043 | 1,236 | 1,900 | 11,724 | ||||||||||||||||||
|
|
|
|
|
|
|
|
|
|
|
| |||||||||||||
Total | ₩ | 39,063 | ₩ | 5,400 | ₩ | 5,315 | ₩ | 4,102 | ₩ | 7,050 | ₩ | 60,930 | ||||||||||||
|
|
|
|
|
|
|
|
|
|
|
| |||||||||||||
Interest-bearing liabilities: | ||||||||||||||||||||||||
Deposits | ₩ | 20,383 | ₩ | 4,761 | ₩ | 5,488 | ₩ | 2,606 | ₩ | 2,475 | ₩ | 35,713 | ||||||||||||
Borrowings | 15,590 | 4,776 | 2,885 | 3,008 | 4,233 | 30,492 | ||||||||||||||||||
Others | 1,211 | 0 | 0 | 0 | 0 | 1,211 | ||||||||||||||||||
|
|
|
|
|
|
|
|
|
|
|
| |||||||||||||
Total | ₩ | 37,184 | ₩ | 9,537 | ₩ | 8,373 | ₩ | 5,614 | ₩ | 6,708 | ₩ | 67,416 | ||||||||||||
|
|
|
|
|
|
|
|
|
|
|
| |||||||||||||
Sensitivity gap | 1,879 | (4,137 | ) | (3,058 | ) | (1,512 | ) | 342 | (6,486 | ) | ||||||||||||||
Cumulative gap | 1,879 | (2,258 | ) | (5,316 | ) | (6,828 | ) | (6,486 | ) | |||||||||||||||
% of total assets | 3.1 | % | (3.7 | )% | (8.7 | )% | (11.2 | )% | (10.6 | )% | ||||||||||||||
Duration Gap Analysis. We also perform duration gap analysis to measure and manage interest rate risk. Duration gap analysis is a more long-term risk indicator than interest rate gap analysis, as interest rate gap analysis focuses more on accounting income as opposed to the market value of the assets and liabilities. We emphasize duration gap analysis because, in the long run, our principal concern with respect to interest rate fluctuations is the net asset value rather than net interest revenue changes. In 2022, our Won-denominated asset and liability duration gap was positive and it moved between +0.020 years and +0.143 years. Accordingly, our net asset value would have declined (or increased) between ₩357 billion and ₩78 billion if interest rates had increased (or decreased) by one percentage point.
For duration gap analysis we use or assume the same maturities for different assets and liabilities that we use or assume for our interest rate gap analysis.
The following table shows Kookmin Bank’s duration gaps and net asset value changes when interest rates decrease by one percentage point as of the specified dates, on a non-consolidated basis.
| Won-denominated | Asset Duration | Liability Duration | Duration Gap | Net Asset Value Change | ||||||||||||
| Date | (in years) | (in years) | (in years) | (in billions of Won) | ||||||||||||
June 30, 2022 | 0.944 | 0.894 | 0.093 | ₩ | 357 | |||||||||||
December 31, 2022 | 0.827 | 0.838 | 0.020 | 78 | ||||||||||||
| Foreign currency-denominated | Asset Duration | Liability Duration | Duration Gap | Net Asset Value Change | ||||||||||||
| Date | (in years) | (in years) | (in years) | (in billions of Won) | ||||||||||||
June 30, 2022 | 0.906 | 0.743 | 0.136 | ₩ | 85 | |||||||||||
December 31, 2022 | 0.841 | 0.682 | 0.102 | 63 | ||||||||||||
We set interest rate risk limits using historical interest rate volatility of financial bonds and duration gaps with respect to expected asset and liability positions based on our annual business plans. The Risk Management Department in Kookmin Bank’s Risk Management Group submits interest rate gap analysis reports, duration gap analysis reports and interest rate risk limit compliance reports monthly to Kookmin Bank’s Risk Management Council and quarterly to Kookmin Bank’s Risk Management Committee.
204
Table of Contents
The following table summarizes Kookmin Bank’s interest rate risk, taking into account asset and liability durations as of December 31, 2022.
| As of December 31, 2022 | ||||||||||||||||||||||||
| 3 Months or Less | 3-6 Months | 6-12 Months | 1-3 Years | Over 3 Years | Total | |||||||||||||||||||
| (in billions of Won, except percentages and maturities in years) | ||||||||||||||||||||||||
Won-denominated: | ||||||||||||||||||||||||
Asset position | ₩ | 146,900 | ₩ | 88,835 | ₩ | 70,304 | ₩ | 66,921 | ₩ | 25,579 | ₩ | 398,539 | ||||||||||||
Liability position | 170,585 | 41,830 | 88,014 | 51,832 | 40,147 | 392,408 | ||||||||||||||||||
Gap | (23,685 | ) | 47,005 | (17,710 | ) | 15,089 | (14,568 | ) | 6,131 | |||||||||||||||
Average maturity | 0.085 | 0.331 | 0.646 | 1.596 | 4.407 | |||||||||||||||||||
Interest rate volatility | 11.57 | % | 10.87 | % | 9.11 | % | 6.39 | % | 3.77 | % | ||||||||||||||
Amount at risk | 807 | 1,738 | (1,294 | ) | 1,637 | (1,741 | ) | 1,147 | ||||||||||||||||
Foreign currency-denominated: | ||||||||||||||||||||||||
Asset position | ₩ | 39,063 | ₩ | 5,400 | ₩ | 5,315 | ₩ | 4,102 | ₩ | 7,050 | ₩ | 60,930 | ||||||||||||
Liability position | 37,184 | 9,537 | 8,373 | 5,614 | 6,708 | 67,416 | ||||||||||||||||||
Gap | 1,879 | (4,137 | ) | (3,058 | ) | (1,512 | ) | 342 | (6,484 | ) | ||||||||||||||
Average maturity | 0.092 | 0.360 | 0.702 | 1.758 | 4.576 | |||||||||||||||||||
Interest rate volatility | (3.82 | )% | (4.13 | )% | (3.62 | )% | (2.62 | )% | 0.37 | % | ||||||||||||||
Amount at risk | (9 | ) | 61 | 78 | 46 | 238 | 414 | |||||||||||||||||
IRRBB Analysis. Prior to January 2020, we estimated the maximum possible loss on net non-trading assets due to unfavorable changes in interest rates by calculating interest rate VaR using a historical simulation method with actual historical price, volatility and yield changes in comparison with the current position to generate hypothetical portfolios and calculate a distribution of position and portfolio market value changes. Using this method, Kookmin Bank’s interest rate VaR was ₩837 billion as of December 31, 2021 and ₩1,561 billion as of December 31, 2022.
Recent amendments to the Detailed Regulation on the Supervision of the Banking Business, which became effective in November 2019, require banks, including Kookmin Bank, to adopt the standards of the Interest Rate Risk in the Banking Book, or IRRBB, issued by the Basel Committee on Banking Supervision for calculating interest rate risk exposure. Such amendments were adopted in order to promote more financial stability for banks by requiring them to maintain a sufficient level of capital through a more robust risk management system. Under the new IRRBB analysis standards, Kookmin Bank estimates its interest rate risk by calculating the changes in economic value of equity and the changes in net interest income based on various interest rate risk scenarios. Under this method, Kookmin Bank’s interest risk exposure was ₩290 billion as of December 31, 2022.
For additional information, see Note 4.4 of the notes to our consolidated financial statements included elsewhere in this annual report.
Foreign Exchange Risk
We manage foreign exchange rate risk arising from our non-trading operations together with such risks arising from our trading operations. See “—Market Risk Management for Trading Activities—Foreign Exchange Risk” above.
Liquidity Risk Management
Liquidity risk is the risk of insolvency or loss due to a disparity between the inflow and outflow of funds resulting from, for example, maturity mismatches, obtaining funds at a high price or disposing of securities at an unfavorable price due to lack of available funds. We manage our liquidity in order to meet our financial liabilities
205
Table of Contents
from withdrawals of deposits, redemption of matured debentures and repayments at maturity of borrowed funds. We also require sufficient liquidity to fund loans, to extend other credits and to invest in securities. Our liquidity management goal is to meet all our liability repayments on time and fund all investment opportunities even under adverse conditions. To date, we have not experienced significant liquidity risk.
We maintain liquidity by holding sufficient quantities of assets that can be liquidated to meet actual or potential demands for funds from depositors and others. We also manage liquidity by ensuring that the excess of maturing liabilities over maturing assets in any period is kept to manageable levels relative to the amount of funds we believe we could raise by issuing securities. We seek to minimize our liquidity costs by managing our liquidity position on a daily basis and by limiting the amount of cash at any time that is not invested in interest-earning assets or securities.
We maintain diverse sources of liquidity to facilitate flexibility in meeting our funding requirements. We fund our operations principally by accepting deposits from retail and corporate depositors, accessing the call loan market (a short-term market for loans with maturities of less than 90 days), issuing debentures and borrowing from the Bank of Korea. We use the majority of funds we raise to extend loans or purchase securities. Generally, deposits are of shorter average maturity than loans or investments.
For Won-denominated assets and liabilities, we manage liquidity using a cash flow structure based on holding short-term liabilities and long-term assets. Generally, the average initial contract maturity of our new Won-denominated time deposits was less than one year, while during the same period most of our new loans and securities had maturities over one year.
We manage liquidity risk within the limits set on Won and foreign currency accounts in accordance with the regulations of the Financial Services Commission. The Financial Services Commission generally requires Korean banks, including Kookmin Bank, to maintain a liquidity coverage ratio of not less than 100%. The Financial Services Commission defines the liquidity coverage ratio as the ratio of highly liquid assets to total net cash outflows over a 30-day period. The highly liquid assets and total net cash outflows included in the calculation of the liquid coverage ratio are determined in accordance with the “Standards for Calculation of Liquidity Coverage Ratio” under the Detailed Regulation on the Supervision of the Banking Business. In addition, the Financial Services Commission requires Korean banks, including Kookmin Bank, to maintain a foreign currency liquidity coverage ratio of not less than 80%.
In April 2020, in order to encourage financial institutions to provide financial support to companies adversely affected by COVID-19, the Financial Services Commission announced that it would temporarily lower the required liquidity coverage ratio to 85%, and the required foreign currency liquidity coverage ratio to 70%. In June 2022, the Financial Services Commission began phasing out such temporary measures. The liquidity coverage ratio requirement is currently 92.5% and is expected to return to 100% in July 2023, while the foreign liquidity coverage ratio requirement returned to the pre-pandemic level of 80%.
Kookmin Bank’s Financial Planning Department is responsible for daily liquidity management with respect to its Won and foreign currency exposure. It reports monthly plans for funding and operations to the Asset Liability Management Committee of Kookmin Bank, which discusses factors such as interest rate movements and maturity structures of its deposits, loans and securities and establishes strategies with respect to deposit and lending rates.
206
Table of Contents
The following table shows Kookmin Bank’s liquidity coverage ratio and foreign currency liquidity coverage ratio on an average balance basis for the month of December 2022 in accordance with Financial Services Commission regulations:
Liquidity coverage ratio: | 30 Days or Less | |||
| (in billions of Won, except percentages) | ||||
Highly liquid assets (A) | ₩ | 76,781 | ||
Cash outflows (B) | 99,884 | |||
Cash inflows (C) | 22,475 | |||
Total net cash outflows (D = B-C) | 77,409 | |||
Liquidity coverage ratio (A/D) | 99.19 | % | ||
Minimum limit | 92.50 | % | ||
Foreign currency liquidity coverage ratio: | 30 Days or Less | |||
| (in millions of US$, except percentages) | ||||
Highly liquid assets (A) | US$ | 6,333 | ||
Cash outflows (B) | 13,798 | |||
Cash inflows (C) | 9,443 | |||
Total net cash outflows (D = B-C) | 4,355 | |||
Liquidity coverage ratio (A/D) | 145.42 | % | ||
Minimum limit | 80.00 | % | ||
The Risk Management Department in Kookmin Bank’s Risk Management Group reports whether it is complying with these limits monthly to Kookmin Bank’s Risk Management Council and quarterly to Kookmin Bank’s Risk Management Committee.
Operational Risk Management
Overall Status
There is no complete consensus on the definition of operational risk in the banking industry. We define operational risk broadly to include all financial and non-financial risks, other than credit risk, market risk, interest rate risk and liquidity risk, that may arise from our operations that could negatively impact our capital, including the risk of loss resulting from inadequate or failed internal processes, people and systems or from external events as defined under Basel II. Our operational risk management objectives include not only satisfying regulatory requirements, but also providing internal support through the growth of a strong risk management culture, reinforcement of internal controls, improvement of work processes and provision of timely feedback to management members and staff throughout the group.
Each of our subsidiaries manages operational risks related to its own business, and we regularly monitor them. Kookmin Bank, our banking subsidiary, uses an operational risk management framework meeting the Basel II Advanced Measurement Approach, or AMA, under which Kookmin Bank:
| • | calculates its operational risk VaR on a quarterly basis using the “loss distribution approach VaR” and “scenario based VaR” methodology; |
| • | monitors operational risk in terms of Key Risk Indicators, or KRIs, using tolerance levels for each indicator; |
| • | executes integrated compliance and operational risk Control Self Assessments, or CSAs, that enhance the effect on internal controls, which Kookmin Bank employees are able to access and use for process improvement; |
207
Table of Contents
| • | collects and analyzes internal and external loss data; |
| • | conducts scenario analyses to evaluate exposure to high-severity events; |
| • | manages certain insurance-related activities relating to insurance strategies established to mitigate operational risk; |
| • | examines operational risks arising in connection with the development of, changes in or discontinuance of products, policies or systems; |
| • | uses a detailed business continuity plan covering all of its operations and locations to prepare against unexpected events, including an alternate back-up site for use in disaster events as well as annual full-scale testing of such site; |
| • | refines bank-wide operational risk policies and procedures; |
| • | provides appropriate training and support to business line operational risk managers; and |
| • | reports overall operational risk status to our senior management. |
While Kookmin Bank’s Risk Management Department advises relevant business units with respect to the review of and suggested improvements on related operational processes and procedures, each of Kookmin Bank’s relevant business units has primary responsibility for the management of its own operational risk. In addition, the Operational Risk Unit, which is part of Kookmin Bank’s Risk Management Department, monitors bank-wide operational risk. Kookmin Bank also has business line operational risk managers in all of its subsidiaries, departments and branches who periodically conduct CSAs and monitor KRIs. For example, Kookmin Bank has developed KRIs relating to customer data protection, which are applied and monitored at all domestic branches and offices. In addition, in order to strengthen risk management of its overseas operations, Kookmin Bank designates expert auditors for overseas branches and conducts internal audits designed especially to check key risks identified for each overseas branch. Kookmin Bank has also established a risk CSA system for overseas branches, pursuant to which all employees (including locally hired staff) of such branches are required to perform a risk CSA on a quarterly basis. Furthermore, Kookmin Bank regularly monitors operational risks related to new businesses as well as existing operating processes and seeks to develop appropriate new KRIs and risk CSA measures on an ongoing basis. Through such methods, Kookmin Bank is able to ensure proper monitoring and measurement of operational risk in each of its business groups and overseas operations.
Internal Control
To monitor and control operational risks, we maintain a system of comprehensive policies and have put in place a control framework designed to provide a stable and well-managed operational environment throughout our organization. We have in place a prescribed leave policy for employees in certain high-risk categories to safeguard against fraud and to check for weaknesses in internal controls. In addition, we maintain an external whistleblower “ombudsman” channel to encourage whistleblowing and voluntary reporting of fraudulent behavior.
Each of our subsidiaries establishes its own internal control system in accordance with the group-level internal control principles. Our Compliance Supporting Department is responsible for monitoring and advising our subsidiaries regarding their internal control systems. Our Audit Committee, which consists of four non-executive directors, is an independent authority that evaluates the effectiveness and efficiency of our group-wide internal control systems and business processes and monitors our subsidiaries’ compliance with such systems and processes, as well as reviews the reliability of our financial statements to secure the transparency and stability of our management (including through the activities of our independent auditors). In particular, we have established group-wide internal guidelines with respect to our subsidiaries’ reporting requirements. Our subsidiaries review their operations and their level of compliance with internal control systems and business processes on a periodic basis and, as part of this process, they are required to report any problems discovered and
208
Table of Contents
any remedial actions taken to our chief compliance officer, who is responsible for reporting to our Audit Committee. Based on the results of these reports, or on an ad hoc basis in response to any problem or potential problem that it identifies, the Audit Committee may direct a subsidiary to conduct an audit of its operations or, if it chooses to do so, conduct its own audit of those operations. The Audit Committee interacts on a regular basis with our Audit Department, Compliance Supporting Department and our independent auditors. In carrying out these duties, the Audit Committee ultimately protects our property for the benefit of our shareholders, investors and customers by independently monitoring our management.
Our Audit Department supports our Audit Committee in monitoring our accounting and business operations and overseeing the management of our subsidiaries’ internal control systems by performing the following activities:
| • | general audits, which include full-scale audits of the overall operations performed according to an annual audit plan, and sectional audits of selected operations; and |
| • | special audits of troubled or weak operations, which are performed when our Audit Committee or executive officer responsible for audits deems it necessary or pursuant to requests by our board, executive officers or supervisory authorities, such as the Financial Supervisory Service. |
The Financial Supervisory Service periodically conducts a general examination of our operations. It also performs specific audits on particular aspects of our operations, such as risk management, credit monitoring and liquidity, as the need arises. We and our subsidiaries have in the past been subject to, and expect in the future to be subject to, the receipt of warning notices or the imposition of penalties in connection with our or our subsidiaries’ failure to comply with the applicable laws or rules, regulations and guidelines of the Financial Supervisory Service. For example, in November 2020, the Financial Supervisory Service conducted a risk management evaluation of our company and Kookmin Bank, the result of which was deemed satisfactory. More recently, in June 2021, the Financial Supervisory Service conducted a comprehensive annual inspection of overall operations at our company and Kookmin Bank, and imposed administrative fines on us and Kookmin Bank for certain alleged deficiencies in operations, risk management and asset quality management. We and Kookmin Bank are working to improve the areas which the Financial Supervisory Service has noted required improvement.
Kookmin Bank’s Audit Department is the execution body for its audit committee and supports Kookmin Bank’s management objectives by auditing the operations of its branches using a risk analysis system and reviewing the operations of its headquarters and subsidiaries through the use of “risk-based audit” in accordance with the “business measurement process” audit methodology, which requires that the Audit Department evaluate the risk and process of its business units and concentrate its audit capacity with respect to high risk areas.
As a result of recent regulatory trends, Kookmin Bank’s Audit Department is continuing its efforts to establish an advanced audit system and value-added internal audit by introducing risk-based audit techniques.
Our Compliance Supporting Department operates a compliance system to ensure that all of our employees comply with the relevant laws and regulations. This system’s main function is to establish and manage our compliance program, educate employees and management and improve our internal control process.
Legal Risk
We consider legal risk as a part of our operational risk. The uncertainty of the enforceability of the obligations of our customers and counterparties creates legal risk. Changes in laws and regulations could also adversely affect us. Legal risk is higher in new areas of business where the law is often untested in the courts, although legal risk can also increase in our traditional business to the extent that the legal and regulatory landscape in Korea is changing and many new laws and regulations governing the financial industry remain untested. Our Compliance Supporting Department seeks to minimize legal risk by using stringent legal documentation, employing procedures designed to ensure that transactions are properly authorized and consulting legal advisers.
209
Table of Contents
IT System Operational Risk
The integrity of our IT systems, and their ability to withstand potential catastrophic events, are crucial to our continuing operations. Accordingly, we are continuing to strengthen our disaster recovery capabilities. In order to minimize operational risks relating to our IT systems, we have implemented a multi-CPU system that runs multiple CPUs simultaneously on-site and ensures system continuity in case any of the CPUs fails. This system backs up our data systems at an off-site location on a real-time basis to ensure that our operations can be carried out normally and without material interruption in the event of CPU failure. Also, in order to protect our Internet banking services from system failures and cyber attacks, we process our Internet transactions through two separate data processing centers.
We currently test our disaster recovery systems on a quarterly basis, with the comprehensive testing covering our branches and the main IT center’s disaster recovery system, and our Infrastructure System Department monitoring all of our computerized network processes and IT systems. In addition, we monitor and report on any unusual delays or irregularities reported by our branches. Moreover, Kookmin Bank’s Information Security Department is responsible for the daily monitoring of its information security system. Our business operations regularly conduct IT security inspections with respect to such operations and have implemented measures to identify and respond collectively to security breach attempts, such as hacking attempts. Furthermore, KB Kookmin Card and Kookmin Bank have each established technical as well as management-related standards governing information protection under which they operate their businesses.
In particular, at Kookmin Bank, we have taken steps to establish a comprehensive security system aimed at detecting and responding to internal and external threats to its IT system and have implemented network segregation on the computers of all employees so that Intranet and Extranet functions are segregated. We have endeavored to enhance protection of customer data by using personal identification numbers internally generated and managed by Kookmin Bank in all customer financial transaction, in lieu of the resident registration numbers of its customers, and by amending forms and templates to minimize collection of potentially sensitive customer data. Kookmin Bank’s chief information security officer is responsible for ensuring protection of information assets and technologies and reducing IT risks.
At KB Kookmin Card, we have taken steps to strengthen its information security infrastructure by implementing a solution to prevent attacks on its website and a security system to prevent unauthorized access to local networks and information. As part of its efforts to strengthen its operational processes and procedures for customer information protection and to ensure compliance with relevant laws and regulations, KB Kookmin Card continually conducts annual status reviews, monthly information security inspections, information protection training for its employees and officers and mock training sessions for responding to malicious e-mails.
In 2009, Kookmin Bank obtained ISO 27001 certification, which relates to information security. In 2011, Kookmin Bank also obtained ISO 20000 certification, which relates to IT service management, and BS 25999 certification, which relates to business continuity management. Kookmin Bank is the first Korean bank to have obtained all three such international certifications. In addition, between 2013 and 2022, we, Kookmin Bank, KB Insurance and KB Kookmin Card obtained ISMS certification, which relates to information security management, and KB Securities, KB Kookmin Card and Kookmin Bank obtained ISMS-P certification, which relates to personal information in addition to information security management. In 2017, KB Kookmin Card obtained PCI DSS certification, which relates to protection of credit card data.
We implement various year-round education programs and training sessions designed to raise the information security awareness of both management and employees.
210
Table of Contents
| Item 12. | DESCRIPTION OF SECURITIES OTHER THAN EQUITY SECURITIES |
Fees and Charges
Under the terms of the deposit agreement, as a holder of our ADSs, you are required to pay the following service fees to the depositary:
Services | Fees | |
Issuance of ADSs | Up to $5.00 per 100 ADSs (or portion thereof) issued | |
Delivery of deposited shares against surrender of ADSs | Up to $5.00 per 100 ADSs (or portion thereof) surrendered | |
Distribution of cash dividends or other cash distributions | Up to $0.02 per ADS held | |
Transfer of ADSs, combination and split-up of American depositary receipts or interchange of certificated and uncertificated ADSs | Up to $1.50 per American depositary receipt transferred | |
Distribution or sale of securities pursuant to stock dividends, free stock distributions, exercise of rights or any other non-cash distributions | A fee equivalent to the fee that would be payable if securities distributed or sold, as the case may be, had been shares and such shares had been deposited for issuance of ADSs | |
Depositary Services | Up to $0.02 per ADS (or portion thereof) held on the applicable record date(s) established by the depositary | |
As a holder of our ADSs, you are also responsible for paying certain fees and expenses incurred by the depositary and certain taxes and governmental charges such as:
| • | Fees for the transfer and registration of shares charged by the registrar and transfer agent for the shares in Korea (i.e., upon deposit and withdrawal of shares). |
| • | Expenses incurred for converting foreign currency into U.S. dollars. |
| • | Expenses for cable, telex and fax transmissions and for delivery of securities. |
| • | Taxes and duties upon the transfer of securities (i.e., when shares are deposited or withdrawn from deposit). |
| • | Fees and expenses incurred in connection with the delivery or servicing of shares on deposit or other deposited securities. |
Depositary fees payable upon the issuance and surrender of ADSs are typically paid to the depositary by the brokers (on behalf of their clients) receiving the newly issued ADSs from the depositary and by the brokers (on behalf of their clients) delivering the ADSs to the depositary for surrender. The brokers in turn charge these fees to their clients. Depositary fees payable in connection with distributions of cash or securities to ADS holders and the depositary services fee are charged by the depositary to the holders of record of ADSs as of the applicable ADS record date.
The depositary fees payable for cash distributions are generally deducted from the cash being distributed. In the case of distributions other than cash (i.e., stock dividend, rights), the depositary charges the applicable fee to the ADS record date holders concurrent with the distribution. In the case of ADSs registered in the name of the investor (whether certificated or uncertificated in direct registration), the depositary sends invoices to the applicable record date ADS holders. In the case of ADSs held in brokerage and custodian accounts (via the Depository Trust Company, or DTC), the depositary generally collects its fees through the systems provided by DTC (whose nominee is the registered holder of the ADSs held in DTC) from the brokers and custodians holding
211
Table of Contents
ADSs in their DTC accounts. The brokers and custodians who hold their clients’ ADSs in DTC accounts in turn charge their clients’ accounts the amount of the fees paid to the depositary.
In the event of refusal to pay the depositary fees, the depositary may, under the terms of the deposit agreement, refuse the requested service until payment is received or may set off the amount of the depositary fees from any distribution to be made to such holder of ADSs.
Note that the fees and charges you may be required to pay may vary over time and may be changed by us and by the depositary. You will receive prior notice of such changes.
Fees and Payments from the Depositary to Us
In 2022, we received the following payments from the depositary:
Reimbursement of listing fees: | $ | 74,000 | ||
Reimbursement of SEC filing fees: | $ | 76,038 | ||
Reimbursement of expenses related to our investor relations activities (investor conferences and investor relations agency fees, etc.) and legal fees (expenses related to the preparation of our Form 20-F for fiscal year 2021): | $ | 1,305,579 |
In addition, as part of its service to us, the depositary waives its fees for the standard costs and operating expenses associated with the administration of the ADS facility.
| Item 13. | DEFAULTS, DIVIDEND ARREARAGES AND DELINQUENCIES |
Not applicable.
| Item 14. | MATERIAL MODIFICATIONS TO THE RIGHTS OF SECURITY HOLDERS AND USE OF PROCEEDS |
Not applicable.
| Item 15. | CONTROLS AND PROCEDURES |
Disclosure Controls and Procedures
We have evaluated, with the participation of our chief executive officer and chief finance officer, the effectiveness of our disclosure controls and procedures as of December 31, 2022. There are inherent limitations to the effectiveness of any system of disclosure controls and procedures, including the possibility of human error and the circumvention or overriding of the controls and procedures. Accordingly, even effective disclosure controls and procedures can only provide reasonable assurance of achieving their control objectives. Based upon our evaluation, our chief executive officer and chief finance officer concluded that our disclosure controls and procedures as of December 31, 2022 were effective to provide reasonable assurance that information required to be disclosed by us in the reports that we file or submit under the Exchange Act is recorded, processed, summarized and reported, within the time periods specified in the applicable rules and forms, and that it is accumulated and communicated to our management, including our chief executive officer and chief finance officer, as appropriate to allow timely decisions regarding required disclosure.
Management’s Annual Report on Internal Control Over Financial Reporting
Our management is responsible for establishing and maintaining adequate internal control over financial reporting, as such term is defined in Rules 13a-15(f) and 15d-15(f) under the Exchange Act. Under the
212
Table of Contents
supervision and with the participation of our management, including our chief executive officer and chief finance officer, we conducted an evaluation of the effectiveness of our internal control over financial reporting based on the framework in Internal Control – Integrated Framework 2013 issued by the Committee of Sponsoring Organizations of the Treadway Commission. Our internal control over financial reporting is a process designed to provide reasonable assurance regarding the reliability of financial reporting and the preparation of financial statements for external purposes in accordance with IFRS as issued by the IASB. Our internal control over financial reporting includes those policies and procedures that (1) pertain to the maintenance of records that, in reasonable detail, accurately and fairly reflect the transactions and dispositions of our assets; (2) provide reasonable assurance that transactions are recorded as necessary to permit preparation of financial statements in accordance with IFRS as issued by the IASB, and that our receipts and expenditures are being made only in accordance with authorizations of our management and directors; and (3) provide reasonable assurance regarding prevention or timely detection of unauthorized acquisition, use or disposition of our assets that could have a material effect on the financial statements.
Because of its inherent limitations, internal control over financial reporting is not intended to provide absolute assurance that a misstatement of our financial statements would be prevented or detected. Also, projections of any evaluation of effectiveness to future periods are subject to the risk that controls may become inadequate because of changes in conditions, or that the degree of compliance with the policies or procedures may deteriorate.
Based on our evaluation, our management concluded that our internal control over financial reporting was effective as of December 31, 2022.
The effectiveness of our internal control over financial reporting as of December 31, 2022 has been audited by KPMG Samjong Accounting Corp., an independent registered public accounting firm, as stated in its report included herein, which expressed an unqualified opinion on the effectiveness of our internal control over financial reporting as of December 31, 2022.
Attestation Report of the Registered Public Accounting Firm
The attestation report of our independent registered public accounting firm is included in Item 18 of this Form 20-F.
Changes in Internal Control Over Financial Reporting
There has been no change in our internal control over financial reporting during 2022 that has materially affected, or is reasonably likely to materially affect, our internal control over financial reporting.
| Item 16. | [RESERVED] |
| Item 16A. | AUDIT COMMITTEE FINANCIAL EXPERT |
Our board of directors has determined that Kyung Ho Kim and Whajoon Cho, our non-executive directors and members of our Audit Committee, qualify as “audit committee financial experts” and are independent within the meaning of this Item 16A.
| Item 16B. | CODE OF ETHICS |
We have adopted a code of ethics, as defined in Item 16B of Form 20-F under the Exchange Act. Our code of ethics applies to our chief executive officer and chief finance officer, as well as to our non-executive directors, non-standing directors and other officers and employees. Our code of ethics is available on our website at
213
Table of Contents
https://www.kbfg.com/Eng/about/ethics.htm. If we amend the provisions of our code of ethics that apply to our chief executive officer and chief finance officer and persons performing similar functions, or if we grant any waiver of such provisions, we will disclose such amendment or waiver on our website at the same address.
| Item 16C. | PRINCIPAL ACCOUNTANT FEES AND SERVICES |
Audit and Non-audit Fees
The following table sets forth the fees billed to us by independent registered public accounting firm KPMG Samjong Accounting Corp. during the fiscal year ended December 31, 2021 and 2022:
| Year Ended December 31, | ||||||||
| 2021 | 2022 | |||||||
| (in millions of Won) | ||||||||
Audit fees | ₩ | 12,459 | ₩ | 13,265 | ||||
Audit-related fees | 561 | 550 | ||||||
Tax fees | 220 | 440 | ||||||
|
|
|
| |||||
Total fees | ₩ | 13,240 | ₩ | 14,255 | ||||
|
|
|
| |||||
Audit fees in the above table are the aggregate fees billed by KPMG Samjong Accounting Corp. in connection with:
| • | the audits of our annual financial statements and the review of our interim financial statements; |
| • | the audits of our special purpose entities in connection with the Financial Investment Services and Capital Markets Act; and |
| • | our financial debenture offering services. |
Audit-related fees in the above table are the aggregate fees billed by KPMG Samjong Accounting Corp. in connection with due diligence services rendered in the ordinary course of our business.
Tax fees in the above table are fees billed by KPMG Samjong Accounting Corp. in connection with tax audit-related services performed for KB Capital Co., Ltd. in 2021 and fees expected to be billed by KPMG Samjong Accounting Corp. in connection with tax audit-related services for Kookmin Bank in 2022.
Audit Committee Pre-Approval Policies and Procedures
Our Audit Committee pre-approves the engagement of our independent auditors for audit services with respect to our financial statements. Our Audit Committee has implemented a policy regarding pre-approval of certain other services provided by our independent auditors to our subsidiaries that the Audit Committee has deemed as not affecting their independence. Under this policy, pre-approvals for the following services to our subsidiaries have been granted by our Audit Committee to each of our subsidiaries’ audit committees: (i) services related to the audit of financial statements prepared in accordance with IFRS as adopted by Korea and internal controls under Korean laws and regulations; (ii) general tax services; (iii) issuance of comfort letters in connection with offering of securities; and (iv) educational services provided to employees.
Any other audit or permitted non-audit service must be pre-approved by the Audit Committee on a case-by-case basis. Our Audit Committee did not pre-approve any non-audit services under the de minimis exception of Rule 2.01(c)(7)(i)(C) of Regulation S-X as promulgated by the Securities and Exchange Commission.
| Item 16D. | EXEMPTIONS FROM THE LISTING STANDARDS FOR AUDIT COMMITTEES |
Not applicable.
214
Table of Contents
| Item 16E. | PURCHASE OF EQUITY SECURITIES BY THE ISSUER AND AFFILIATED PURCHASERS |
Neither we nor any “affiliated purchaser,” as defined in Rule 10b-18(a)(3) of the Exchange Act, purchased any of our equity securities during the period covered by this annual report.
| Item 16F. | CHANGE IN REGISTRANT’S CERTIFYING ACCOUNTANT |
On December 7, 2022, our Audit Committee approved the appointment of Samil PricewaterhouseCoopers, or PwC, as our principal accountant to audit our financial statements prepared in accordance with IFRS as issued by the IASB for the fiscal years ending December 31, 2023, 2024 and 2025 and the dismissal of KPMG Samjong Accounting Corp., or KPMG, our independent registered public accountants. PwC was appointed on December 29, 2022, with such appointment to be effective from January 1, 2023, and KPMG will be dismissed effective upon completion of its audit of our financial statements as of and for the year ended December 31, 2022, and the issuance of its report thereon.
The decision of our Audit Committee to dismiss KPMG, and to appoint PwC, as our principal accountant to audit our financial statements prepared in accordance with IFRS as issued by the IASB, was due to the expiration of KPMG’s term of engagement, which covered the fiscal years ended December 31, 2020, 2021 and 2022, following their designation as our external auditor by the Securities and Futures Commission in November 2019. Pursuant to the Act on External Audit of Stock Companies, as amended, a corporation that was audited by an external auditor designated by the Securities and Futures Commission cannot be audited by the same designated external auditor in the period immediately following the designated audit period.
KPMG’s reports on our consolidated financial statements prepared in accordance with IFRS as issued by the IASB for each of the fiscal years ended December 31, 2022 and 2021 did not contain an adverse opinion or a disclaimer of opinion and were not qualified or modified as to uncertainty, audit scope or accounting principles. Furthermore, during the fiscal years ended December 31, 2022 and 2021 and in the subsequent interim period preceding KPMG’s dismissal, or the Pre-Engagement Period, there were no disagreements with KPMG on any matter of accounting principles or practice, financial statement disclosure or auditing scope or procedure that if not resolved to the satisfaction of KPMG, would have caused KPMG to make reference to the subject matter of the disagreement in its reports. In addition, during the Pre-Engagement Period, there were no “reportable events” requiring disclosure pursuant to Item 16F(a)(1)(v) of Form 20-F.
We provided a copy of the disclosure in this Item 16F to KPMG and requested that KPMG furnish us with a letter addressed to the Commission stating whether it agrees with such disclosure, and if it does not agree, stating the respects in which it does not agree. A copy of KPMG’s letter dated April 26, 2023 is filed as Exhibit 15.1 to this annual report on Form 20-F for the fiscal year ended December 31, 2022.
During the Pre-Engagement Period, neither we nor anyone acting on our behalf consulted with PwC regarding any matter that was either the subject of a disagreement, as that term is defined in Item 16F(a)(1)(iv) of Form 20-F (and the related instructions thereto), or a reportable event as described in Item 16F(a)(1)(v) of Form 20-F.
215
Table of Contents
| Item 16G. | CORPORATE GOVERNANCE |
Differences in Corporate Governance Practices
Pursuant to the rules of the New York Stock Exchange applicable to foreign private issuers like us that are listed on the New York Stock Exchange, we are required to disclose significant differences between the New York Stock Exchange’s corporate governance standards and those that we follow under Korean law and in accordance with our own internal procedures. The following is a summary of such significant differences:
NYSE Corporate Governance Standards | KB Financial Group | |
| Director Independence | ||
| Listed companies must have a majority of independent directors. | The majority of our board of directors is independent (as defined in accordance with the New York Stock Exchange’s standards), as seven out of nine directors are non-executive directors. | |
Executive Session | ||
| Non-management directors must meet in regularly scheduled executive sessions without management. Independent directors should meet alone in an executive session at least once a year. | Our non-executive directors hold executive sessions as needed in accordance with the Regulation of the Board of Directors. | |
Nomination/Corporate Governance Committee | ||
| A nomination/corporate governance committee of independent directors is required. The committee must have a charter that addresses the purpose, responsibilities (including development of corporate governance guidelines) and annual performance evaluation of the committee. | We maintain a Non-executive Director Nominating Committee composed of four non-executive directors.
We maintain a CEO Nominating Committee composed of all seven of our non-executive directors. | |
Compensation Committee | ||
A compensation committee of independent directors is required. The committee must have a charter that addresses the purpose, responsibilities and annual performance evaluation of the committee. The charter must be made available on the company’s website. In addition, in accordance with the U.S. Securities and Exchange Commission rules adopted pursuant to Section 952 of the Dodd-Frank Act, the New York Stock Exchange listing standards were amended to expand the factors relevant in determining whether a committee member has a relationship with the company that will materially affect that member’s duties to the compensation committee.
Additionally, the committee may obtain or retain the advice of a compensation adviser only after taking into consideration all factors relevant to determining that adviser’s independence from management. | We maintain an Evaluation and Compensation Committee composed of four non-executive directors. | |
Audit Committee | ||
| Listed companies must have an audit committee that satisfies the independence and other requirements of Rule 10A-3 under the Exchange Act. All members must be independent. The committee must have a charter | We maintain an Audit Committee composed of four non-executive directors. Accordingly, we are in compliance with Rule 10A-3 under the Exchange Act. | |
216
Table of Contents
| addressing the committee’s purpose, an annual performance evaluation of the committee, and the duties and responsibilities of the committee. The charter must be made available on the company’s website. | ||
Audit Committee Additional Requirements | ||
| Listed companies must have an audit committee that is composed of at least three directors. | Our Audit Committee has four members, as described above. | |
Shareholder Approval of Equity Compensation Plan | ||
| Listed companies must allow its shareholders to exercise their voting rights with respect to any material revision to the company’s equity compensation plan. | We currently have two equity compensation plans: (i) performance share agreements with certain of our directors and executive officers and (ii) an employee stock ownership plan, or ESOP. Matters related to the performance share agreements or ESOP are not subject to shareholders’ approval under Korean law.
Our Articles of Incorporation provide that our stockholders may, by special resolution, grant stock options to officers, directors and employees. All material matters related to stock options are provided in our Articles of Incorporation, and any amendments to the Articles of Incorporation are subject to shareholders’ approval. | |
Corporate Governance Guidelines | ||
| Listed companies must adopt and disclose corporate governance guidelines. | We have adopted corporate governance standards, the Korean-language version of which is available on our website. | |
| Item 16H. | MINE SAFETY DISCLOSURE |
Not applicable.
| Item 16I. | DISCLOSURE REGARDING FOREIGN JURISDICTIONS THAT PREVENT INSPECTIONS |
Not applicable.
| Item 17. | FINANCIAL STATEMENTS |
Not applicable.
| Item 18. | FINANCIAL STATEMENTS |
Reference is made to Item 19(a) for a list of all financial statements filed as part of this annual report.
| Item 19. | EXHIBITS |
| (a) | List of Financial Statements: |
| Page | ||||
Audited consolidated financial statements of KB Financial Group Inc. and subsidiaries, prepared in accordance with IFRS as issued by the IASB | ||||
| F-1 | ||||
Consolidated statements of financial position as of December 31, 2021 and 2022 | F-5 | |||
Consolidated statements of comprehensive income for the years ended December 31, 2020, 2021 and 2022 | F-6 | |||
Consolidated statements of changes in equity for the years ended December 31, 2020, 2021 and 2022 | F-9 | |||
Consolidated statements of cash flows for the years ended December 31, 2020, 2021 and 2022 | F-13 | |||
| F-15 | ||||
217
Table of Contents
| (b) | Exhibits |
Pursuant to the rules and regulations of the U.S. Securities and Exchange Commission, KB Financial Group has filed certain agreements as exhibits to this Annual Report on Form 20-F. These agreements may contain representations and warranties made by the parties. These representations and warranties have been made solely for the benefit of the other party or parties to such agreements and (i) may be intended not as statements of fact, but rather as a way of allocating the risk to one of the parties to such agreements if those statements turn out to be inaccurate, (ii) may have been qualified by disclosures that were made to such other party or parties and that either have been reflected in the company’s filings or are not required to be disclosed in those filings, (iii) may apply materiality standards different from what may be viewed as material to investors and (iv) were made only as of the date of such agreements or such other date(s) as may be specified in such agreements and are subject to more recent developments. Accordingly, these representations and warranties may not describe KB Financial Group’s actual state of affairs at the date of this annual report.
| (1) | Incorporated by reference to the registrant’s filing on Form 20-F (No. 000-53445), filed on June 15, 2009 (https://www.sec.gov/Archives/edgar/data/1445930/000095012309013901/h03411exv2w1.htm). |
| (2) | Incorporated by reference to the registrant’s filing on Form F-6 (No. 333-208008), filed on November 13, 2015 (https://www.sec.gov/Archives/edgar/data/1445930/000119380515001876/e614274_ex99-a.htm). |
| (3) | Incorporated by reference to “Item 10.B. Memorandum and Articles of Association—Description of Capital Stock” of this annual report. |
| (4) | Incorporated by reference to exhibit 2.4 to the registrant’s filing on Form 20-F (No. 000-53445) filed on April 24, 2020 (https://www.sec.gov/Archives/edgar/data/1445930/000119312520118233/d862752dex24.htm). |
| (5) | Incorporated by reference to Note 41 of the consolidated financial statements of the registrant included in this annual report. |
| (6) | Incorporated by reference to the registrant’s filing on Form 20-F (No. 000-53445), filed on April 28, 2016 (https://www.sec.gov/Archives/edgar/data/1445930/000119312516561071/d181570dex111.htm). |
218
Table of Contents
SIGNATURES
The registrant hereby certifies that it meets all of the requirements for filing on Form 20-F and that it has duly caused and authorized the undersigned to sign this annual report on its behalf.
| KB FINANCIAL GROUP INC. |
| (Registrant) |
| /s/ Jong Kyoo Yoon |
| (Signature) |
| Jong Kyoo Yoon |
| Chairman and Chief Executive Officer |
| (Name and Title) |
Date: April 26, 2023
219
Table of Contents
We have served as the Group’s auditor since 2019. |
| Seoul, Korea |
| April 26, 2023 |
Dec. 31 2021 | Dec. 31 2022 | Dec. 31 2022 | ||||||||||
Translation into U.S. dollars (Note 3) | ||||||||||||
(In millions of Korean won) | (In thousands) | |||||||||||
ASSETS | ||||||||||||
| Cash and due from financial institutions | ₩ | 31,009,374 | ₩ | 32,063,421 | US$ | 25,443,525 | ||||||
| Financial assets at fair value through profit or loss | 66,005,815 | 64,935,344 | 51,528,626 | |||||||||
| Derivative financial assets | 3,721,370 | 9,446,134 | 7,495,861 | |||||||||
| Loans measured at amortized cost | 417,900,273 | 436,530,502 | 346,403,293 | |||||||||
| Financial investments | 104,847,871 | 116,588,575 | 92,517,398 | |||||||||
| Investments in associates and joint ventures | 448,718 | 682,670 | 541,724 | |||||||||
| Property and equipment | 5,239,898 | 4,991,467 | 3,960,916 | |||||||||
| Investment property | 2,514,944 | 3,148,340 | 2,498,326 | |||||||||
| Intangible assets | 3,266,357 | 3,200,399 | 2,539,636 | |||||||||
| Net defined benefit assets | 100,083 | 478,934 | 380,052 | |||||||||
| Current income tax assets | 98,798 | 204,690 | 162,429 | |||||||||
| Deferred income tax assets | 159,093 | 251,085 | 199,245 | |||||||||
| Assets held for sale | 237,318 | 211,758 | 168,038 | |||||||||
| Assets of a disposal group held for sale | 171,749 | — | — | |||||||||
| Other assets | 28,174,173 | 28,437,529 | 22,566,244 | |||||||||
| Total assets | ₩ | 663,895,834 | ₩ | 701,170,848 | US$ | 556,405,314 | ||||||
LIABILITIES | ||||||||||||
| Financial liabilities at fair value through profit or loss | ₩ | 12,088,980 | ₩ | 12,271,604 | US$ | 9,737,977 | ||||||
| Derivative financial liabilities | 3,682,258 | 9,506,709 | 7,543,929 | |||||||||
| Deposits | 372,023,918 | 388,888,452 | 308,597,543 | |||||||||
| Borrowings | 56,912,374 | 71,717,366 | 56,910,414 | |||||||||
| Debentures | 67,430,188 | 68,698,203 | 54,514,596 | |||||||||
| Provisions | 808,604 | 968,819 | 768,794 | |||||||||
| Net defined benefit liabilities | 225,521 | 85,745 | 68,042 | |||||||||
| Current income tax liabilities | 662,672 | 997,675 | 791,692 | |||||||||
| Deferred income tax liabilities | 1,470,981 | 22,693 | 18,008 | |||||||||
| Insurance liabilities | 57,165,936 | 58,230,303 | 46,207,925 | |||||||||
| Other liabilities | 43,130,482 | 40,140,365 | 31,852,882 | |||||||||
| Total liabilities | 615,601,914 | 651,527,934 | 517,011,803 | |||||||||
TOTAL EQUITY | ||||||||||||
| Share capital | 2,090,558 | 2,090,558 | 1,658,936 | |||||||||
| Hybrid securities | 2,838,221 | 4,434,251 | 3,518,744 | |||||||||
| Capital surplus | 16,940,231 | 16,940,731 | 13,443,104 | |||||||||
| Accumulated other comprehensive income | 1,047,274 | (2,713,053 | ) | (2,152,909 | ) | |||||||
| Accumulated other comprehensive income relating to assets of a disposal group held for sale | 7,671 | — | — | |||||||||
| Retained earnings | 25,672,815 | 28,446,513 | 22,573,373 | |||||||||
| Treasury shares | (1,136,188 | ) | (836,188 | ) | (663,546 | ) | ||||||
| Equity attributable to shareholders of the Parent Company | 47,460,582 | 48,362,812 | 38,377,702 | |||||||||
Non-controlling interests | 833,338 | 1,280,102 | 1,015,809 | |||||||||
| Total equity | 48,293,920 | 49,642,914 | 39,393,510 | |||||||||
| Total liabilities and equity | ₩ | 663,895,834 | ₩ | 701,170,848 | US$ | 556,405,314 | ||||||
2020 | 2021 | 2022 | 2022 | |||||||||||||
Translation into U.S. dollars (Note 3) | ||||||||||||||||
(In millions of Korean won, except per share amounts) | (In thousands, except per share amounts) | |||||||||||||||
| Interest income | ₩ | 14,485,747 | ₩ | 15,210,878 | ₩ | 20,788,518 | US$ | 16,496,467 | ||||||||
| Interest income from financial instruments at fair value through other comprehensive income and amortized cost | 13,826,382 | 14,620,490 | 19,912,128 | 15,801,019 | ||||||||||||
| Interest income from financial instruments at fair value through profit or loss | 659,365 | 590,388 | 876,390 | 695,448 | ||||||||||||
| Interest expense | (4,763,473 | ) | (3,981,306 | ) | (7,675,584 | ) | (6,090,863 | ) | ||||||||
| Net interest income | 9,722,274 | 11,229,572 | 13,112,934 | 10,405,604 | ||||||||||||
| Fee and commission income | 4,527,024 | 5,323,606 | 5,121,520 | 4,064,118 | ||||||||||||
| Fee and commission expense | (1,568,085 | ) | (1,698,023 | ) | (1,799,888 | ) | (1,428,278 | ) | ||||||||
| Net fee and commission income | 2,958,939 | 3,625,583 | 3,321,632 | 2,635,839 | ||||||||||||
| Insurance income | 14,386,640 | 16,107,858 | 17,136,842 | 13,598,726 | ||||||||||||
| Insurance expense | (14,086,647 | ) | (15,551,147 | ) | (16,440,329 | ) | (13,046,016 | ) | ||||||||
| Net insurance income | 299,993 | 556,711 | 696,513 | 552,709 | ||||||||||||
| Net gains on financial instruments at fair value through profit or loss before applying overlay approach | 1,221,610 | 1,160,981 | (359,158 | ) | (285,005 | ) | ||||||||||
| Losses on overlay adjustments | (210,244 | ) | (165,677 | ) | 606,515 | 481,292 | ||||||||||
| Net gains on financial instruments at fair value through profit or loss | 1,011,366 | 995,304 | 247,357 | 196,287 | ||||||||||||
| Net other operating expenses | (1,499,930 | ) | (1,923,567 | ) | (2,365,791 | ) | (1,877,344 | ) | ||||||||
| General and administrative expenses | (6,814,812 | ) | (7,200,853 | ) | (7,537,802 | ) | (5,981,528 | ) | ||||||||
Operating income before provision for credit losses | 5,677,830 | 7,282,750 | 7,474,843 | 5,931,568 | ||||||||||||
| Provision for credit losses | (1,043,498 | ) | (1,185,133 | ) | (1,835,988 | ) | (1,456,925 | ) | ||||||||
Net operating income | 4,634,332 | 6,097,617 | 5,638,855 | 4,474,643 | ||||||||||||
| Share of profit (loss) of associates and joint ventures | (43,750 | ) | 93,526 | (28,758 | ) | (22,821 | ) | |||||||||
Net other non-operating income (expenses) | 189,390 | (109,537 | ) | 185,529 | 147,224 | |||||||||||
Net non-operating income (expenses) | 145,640 | (16,011 | ) | 156,771 | 124,404 | |||||||||||
Profit before income tax expense | 4,779,972 | 6,081,606 | 5,795,626 | 4,599,046 | ||||||||||||
| Income tax expense | (1,264,394 | ) | (1,697,225 | ) | (1,622,387 | ) | (1,287,425 | ) | ||||||||
Profit for the year | ₩ | 3,515,578 | ₩ | 4,384,381 | ₩ | 4,173,239 | US$ | 3,311,621 | ||||||||
2020 | 2021 | 2022 | 2022 | |||||||||||||
Translation into U.S. dollars (Note 3) | ||||||||||||||||
(In millions of Korean won, except per share amounts) | (In thousands, except per share amounts) | |||||||||||||||
| Items that will not be reclassified to profit or loss | ||||||||||||||||
| Remeasurements of net defined benefit liabilities | ₩ | (13,434 | ) | ₩ | (45,510 | ) | ₩ | 239,702 | US$ | 190,213 | ||||||
| Share of other comprehensive income (loss) of associates and joint ventures | (1 | ) | 51 | 183 | 145 | |||||||||||
| Gains (losses) on equity securities at fair value through other comprehensive income | 822,140 | 903,398 | (931,731 | ) | (739,363 | ) | ||||||||||
| Fair value changes on financial liabilities designated at fair value through profit or loss due to own credit risk | 8,819 | 13,715 | 38,867 | 30,842 | ||||||||||||
| 817,524 | 871,654 | (652,979 | ) | (518,163 | ) | |||||||||||
| Items that may be reclassified subsequently to profit or loss | ||||||||||||||||
| Currency translation differences | (187,283 | ) | 255,907 | 164,530 | 130,561 | |||||||||||
| Gains (losses) on debt securities at fair value through other comprehensive income | (356,572 | ) | (924,698 | ) | (2,375,084 | ) | (1,884,718 | ) | ||||||||
Shares of other comprehensive income (loss) of associates and joint | (6,846 | ) | 498 | (545 | ) | (432 | ) | |||||||||
| Gains (losses) on cash flow hedging instruments | (1,264 | ) | 20,864 | 31,474 | 24,976 | |||||||||||
| Gains (losses) on hedging instruments of net investments in foreign operations | 64,269 | (57,935 | ) | (79,085 | ) | (62,757 | ) | |||||||||
| Other comprehensive income (loss) arising from separate account | (9,683 | ) | (63,814 | ) | (159,619 | ) | (126,664 | ) | ||||||||
Gains (losses) on overlay adjustment | 152,125 | 120,282 | (440,129 | ) | (349,259 | ) | ||||||||||
| (345,254 | ) | (648,896 | ) | (2,858,458 | ) | (2,268,293 | ) | |||||||||
Other comprehensive income for the year, net of tax | 472,270 | 222,758 | (3,511,437 | ) | (2,786,457 | ) | ||||||||||
Total comprehensive income for the year | 3,987,848 | 4,607,139 | 661,802 | 525,165 | ||||||||||||
2020 | 2021 | 2022 | 2022 | |||||||||||||
Translation into U.S. dollars (Note 3) | ||||||||||||||||
(In millions of Korean won, except per share amounts) | (In thousands, except per share amounts) | |||||||||||||||
Profit attributable to: | ||||||||||||||||
| Shareholders of the Parent Company | 3,468,448 | 4,409,543 | 4,394,830 | 3,487,462 | ||||||||||||
Non-controlling interests | 47,130 | (25,162 | ) | (221,591 | ) | (175,841 | ) | |||||||||
| 3,515,578 | 4,384,381 | 4,173,239 | 3,311,621 | |||||||||||||
Total comprehensive income for the year attributable to: | ||||||||||||||||
| Shareholders of the Parent Company | 3,966,361 | 4,610,549 | 869,854 | 690,262 | ||||||||||||
Non-controlling interests | 21,487 | (3,410 | ) | (208,052 | ) | (165,097 | ) | |||||||||
| ₩ | 3,987,848 | ₩ | 4,607,139 | ₩ | 661,802 | US$ | 525,165 | |||||||||
Earnings per share | ||||||||||||||||
| Basic earnings per share | ₩ | 8,843 | ₩ | 11,134 | ₩ | 10,955 | US$ | 8.69 | ||||||||
| Diluted earnings per share | 8,730 | 10,890 | 10,705 | 8.49 | ||||||||||||
Equity attributable to shareholders of the Parent Company | ||||||||||||||||||||||||||||||||
Share capital | Hybrid securities | Capital surplus | Accumulated other comprehensive income | Retained earnings | Treasury shares | Non-controlling interests | Total equity | |||||||||||||||||||||||||
(In millions of Korean won) | ||||||||||||||||||||||||||||||||
Balance as of January 1, 2020 | ₩ | 2,090,558 | ₩ | 399,205 | ₩ | 17,122,777 | ₩ | 368,744 | ₩ | 19,719,472 | ₩ | (1,136,188 | ) | ₩ | 585,407 | ₩ | 39,149,975 | |||||||||||||||
Comprehensive income for the year | ||||||||||||||||||||||||||||||||
| Profit for the year | — | — | — | — | 3,468,448 | — | 47,130 | 3,515,578 | ||||||||||||||||||||||||
| Remeasurements of net defined benefit liabilities | — | — | — | (13,145 | ) | — | — | (289 | ) | (13,434 | ) | |||||||||||||||||||||
| Currency translation differences | — | — | — | (162,906 | ) | — | — | (24,377 | ) | (187,283 | ) | |||||||||||||||||||||
| Gains (losses) on financial instruments at fair value through other comprehensive income and transfer to retained earnings | — | — | — | 229,899 | 236,648 | — | (979 | ) | 465,568 | |||||||||||||||||||||||
| Share of other comprehensive loss of associates and joint ventures | — | — | — | (6,847 | ) | — | — | — | (6,847 | ) | ||||||||||||||||||||||
| Losses on cash flow hedging instruments | — | — | — | (1,264 | ) | — | — | — | (1,264 | ) | ||||||||||||||||||||||
| Gains on hedging instruments of net investments in foreign operations | — | — | — | 64,269 | — | — | — | 64,269 | ||||||||||||||||||||||||
| Other comprehensive loss arising from separate account | — | — | — | (9,683 | ) | — | — | — | (9,683 | ) | ||||||||||||||||||||||
| Fair value changes of financial liabilities designated at fair value through profit or loss due to own credit risk | — | — | — | 8,819 | — | — | — | 8,819 | ||||||||||||||||||||||||
| Gains on overlay adjustments | — | — | — | 152,125 | — | — | — | 152,125 | ||||||||||||||||||||||||
Total comprehensive income for the year | — | — | — | 261,267 | 3,705,096 | — | 21,485 | 3,987,848 | ||||||||||||||||||||||||
Transactions with shareholders | ||||||||||||||||||||||||||||||||
| Annual dividends paid to shareholders of the Parent Company | — | — | — | — | (861,092 | ) | — | — | (861,092 | ) | ||||||||||||||||||||||
| Issuance of hybrid securities | — | 1,296,783 | — | — | — | — | — | 1,296,783 | ||||||||||||||||||||||||
| Dividends on hybrid securities | — | — | — | — | (22,860 | ) | — | (25,658 | ) | (48,518 | ) | |||||||||||||||||||||
Non-controlling interests changes in business combination | — | — | — | — | — | — | 247,008 | 247,008 | ||||||||||||||||||||||||
| Others | — | — | (399,188 | ) | — | — | — | 29,541 | (369,647 | ) | ||||||||||||||||||||||
Total transactions with shareholders | — | 1,296,783 | (399,188 | ) | — | (883,952 | ) | — | 250,891 | 264,534 | ||||||||||||||||||||||
Balance as of December 31, 2020 | ₩ | 2,090,558 | ₩ | 1,695,988 | ₩ | 16,723,589 | ₩ | 630,011 | ₩ | 22,540,616 | ₩ | (1,136,188 | ) | ₩ | 857,783 | ₩ | 43,402,357 | |||||||||||||||
Equity attributable to shareholders of the Parent Company | ||||||||||||||||||||||||||||||||||||
Share capital | Hybrid securities | Capital surplus | Accumulated other comprehensive income | Accumulated other comprehensive income relating to assets of a disposal group held for sale | Retained earnings | Treasury shares | Non-controlling interests | Total equity | ||||||||||||||||||||||||||||
(In millions of Korean won) | ||||||||||||||||||||||||||||||||||||
Balance as of January 1, 2021 | ₩ | 2,090,558 | ₩ | 1,695,988 | ₩ | 16,723,589 | ₩ | 630,011 | ₩ | — | ₩ | 22,540,616 | ₩ | (1,136,188 | ) | ₩ | 857,783 | ₩ | 43,402,357 | |||||||||||||||||
Comprehensive income for the year | ||||||||||||||||||||||||||||||||||||
| Profit for the year | — | — | — | — | — | 4,409,543 | — | (25,162 | ) | 4,384,381 | ||||||||||||||||||||||||||
| Remeasurements of net defined benefit liabilities | — | — | — | (45,742 | ) | — | — | — | 232 | (45,510 | ) | |||||||||||||||||||||||||
| Currency translation differences | — | — | — | 241,273 | — | — | — | 14,634 | 255,907 | |||||||||||||||||||||||||||
| Gains (losses) on financial instruments at fair value through other comprehensive income and transfer to retained earnings | — | — | — | 201,697 | — | (223,928 | ) | — | 931 | (21,300 | ) | |||||||||||||||||||||||||
| Share of other comprehensive income of associates and joint ventures | — | — | — | 549 | — | — | — | — | 549 | |||||||||||||||||||||||||||
| Gains on cash flow hedging instruments | — | — | — | 20,864 | — | — | — | — | 20,864 | |||||||||||||||||||||||||||
| Losses on hedging instruments of net investments in foreign operations | — | — | — | (57,935 | ) | — | — | — | — | (57,935 | ) | |||||||||||||||||||||||||
| Other comprehensive loss arising from separate account | — | — | — | (63,814 | ) | — | — | — | — | (63,814 | ) | |||||||||||||||||||||||||
| Fair value changes of financial liabilities designated at fair value through profit or loss due to own credit risk | — | — | — | 13,715 | — | — | — | — | 13,715 | |||||||||||||||||||||||||||
| Gains on overlay adjustments | — | — | — | 120,282 | — | — | — | — | 120,282 | |||||||||||||||||||||||||||
| Transfer within equity | — | — | — | (7,671 | ) | 7,671 | — | — | — | — | ||||||||||||||||||||||||||
Total comprehensive income for the year | — | — | — | 423,218 | 7,671 | 4,185,615 | — | (9,365 | ) | 4,607,139 | ||||||||||||||||||||||||||
Transactions with shareholders | ||||||||||||||||||||||||||||||||||||
| Annual dividends paid to shareholders of the Parent Company | — | — | — | — | — | (689,653 | ) | — | — | (689,653 | ) | |||||||||||||||||||||||||
| Quarterly dividends paid to shareholders of the Parent Company | — | — | — | — | — | (292,226 | ) | — | — | (292,226 | ) | |||||||||||||||||||||||||
| Issuance of hybrid securities | — | 1,142,233 | — | — | — | — | — | — | 1,142,233 | |||||||||||||||||||||||||||
| Dividends on hybrid securities | — | — | — | — | — | (71,537 | ) | — | (24,145 | ) | (95,682 | ) | ||||||||||||||||||||||||
Non-controlling interests changes in business combination | — | — | — | — | — | — | — | 1,994 | 1,994 | |||||||||||||||||||||||||||
Transactions with non-controlling interests | — | — | 216,853 | (5,955 | ) | — | — | — | (18,306 | ) | 192,592 | |||||||||||||||||||||||||
| Others | — | — | (211 | ) | — | — | — | — | 25,377 | 25,166 | ||||||||||||||||||||||||||
Total transactions with shareholders | — | 1,142,233 | 216,642 | (5,955 | ) | — | (1,053,416 | ) | — | (15,080 | ) | 284,424 | ||||||||||||||||||||||||
Balance as of December 31, 2021 | ₩ | 2,090,558 | ₩ | 2,838,221 | ₩ | 16,940,231 | ₩ | 1,047,274 | ₩ | 7,671 | ₩ | 25,672,815 | ₩ | (1,136,188 | ) | ₩ | 833,338 | ₩ | 48,293,920 | |||||||||||||||||
Equity attributable to shareholders of the Parent Company | ||||||||||||||||||||||||||||||||||||
Share capital | Hybrid securities | Capital surplus | Accumulated other comprehensive income | Accumulated other comprehensive income relating to assets of a disposal group held for sale | Retained earnings | Treasury shares | Non-controlling interests | Total equity | ||||||||||||||||||||||||||||
(In millions of Korean won) | ||||||||||||||||||||||||||||||||||||
Balance as of January 1, 2022 | ₩ | 2,090,558 | ₩ | 2,838,221 | ₩ | 16,940,231 | ₩ | 1,047,274 | ₩ | 7,671 | ₩ | 25,672,815 | ₩ | (1,136,188 | ) | ₩ | 833,338 | ₩ | 48,293,920 | |||||||||||||||||
Comprehensive income for the year | ||||||||||||||||||||||||||||||||||||
| Profit for the year | — | — | — | — | — | 4,394,830 | — | (221,591 | ) | 4,173,239 | ||||||||||||||||||||||||||
| Remeasurements of net defined benefit liabilities | — | — | — | 239,624 | — | — | — | 78 | 239,702 | |||||||||||||||||||||||||||
| Currency translation differences | — | — | — | 157,281 | (7,671 | ) | — | — | 14,920 | 164,530 | ||||||||||||||||||||||||||
| Gains (losses) on financial instruments at fair value through other comprehensive income and transfer to retained earnings | — | — | — | (3,548,378 | ) | — | 243,021 | — | (1,458 | ) | (3,306,815 | ) | ||||||||||||||||||||||||
| Share of other comprehensive income of associates and joint ventures | — | — | — | (362 | ) | — | — | — | — | (362 | ) | |||||||||||||||||||||||||
| Gains on cash flow hedging instruments | — | — | — | 31,474 | — | — | — | — | 31,474 | |||||||||||||||||||||||||||
| Losses on hedging instruments of net investments in foreign operations | — | — | — | (79,085 | ) | — | — | — | — | (79,085 | ) | |||||||||||||||||||||||||
| Other comprehensive loss arising from separate account | — | — | — | (159,619 | ) | — | — | — | — | (159,619 | ) | |||||||||||||||||||||||||
| Fair value changes of financial liabilities designated at fair value through profit or loss due to own credit risk | — | — | — | 38,867 | — | — | — | — | 38,867 | |||||||||||||||||||||||||||
Losses on overlay adjustments | — | — | — | (440,129 | ) | — | — | — | — | (440,129 | ) | |||||||||||||||||||||||||
Total comprehensive income for the year | — | — | — | (3,760,327 | ) | (7,671 | ) | 4,637,851 | — | (208,051 | ) | 661,802 | ||||||||||||||||||||||||
Transactions with shareholders | ||||||||||||||||||||||||||||||||||||
| Annual dividends paid to shareholders of the Parent Company | — | — | — | — | — | (853,299 | ) | — | — | (853,299 | ) | |||||||||||||||||||||||||
| Quarterly dividends paid to shareholders of the Parent Company | — | — | — | — | — | (584,452 | ) | — | — | (584,452 | ) | |||||||||||||||||||||||||
| Issuance of hybrid securities | — | 1,596,030 | — | — | — | — | — | 431,807 | 2,027,837 | |||||||||||||||||||||||||||
| Dividends on hybrid securities | — | — | — | — | — | (126,402 | ) | — | (36,094 | ) | (162,496 | ) | ||||||||||||||||||||||||
| Retirement of treasury share | — | — | — | — | — | (300,000 | ) | 300,000 | — | — | ||||||||||||||||||||||||||
| Others | — | — | 500 | — | — | — | — | 259,102 | 259,602 | |||||||||||||||||||||||||||
Total transactions with shareholders | — | 1,596,030 | 500 | — | — | (1,864,153 | ) | 300,000 | 654,815 | 687,192 | ||||||||||||||||||||||||||
Balance as of December 31, 2022 | ₩ | 2,090,558 | ₩ | 4,434,251 | ₩ | 16,940,731 | ₩ | (2,713,053 | ) | ₩ | — | ₩ | 28,446,513 | ₩ | (836,188 | ) | ₩ | 1,280,102 | ₩ | 49,642,914 | ||||||||||||||||
Equity attributable to shareholders of the Parent Company | ||||||||||||||||||||||||||||||||||||
Share capital | Hybrid securities | Capital surplus | Accumulated other comprehensive income | Accumulated other comprehensive income relating to assets of a disposal group held for sale | Retained earnings | Treasury shares | Non-controlling interests | Total equity | ||||||||||||||||||||||||||||
Translation into U.S. dollars (Note 3) (In thousands) | ||||||||||||||||||||||||||||||||||||
Balance as of January 1, 2022 | US$ | 1,658,936 | US$ | 2,252,235 | US$ | 13,442,707 | US$ | 831,051 | US$ | 6,087 | US$ | 20,372,340 | US$ | (901,608 | ) | US$ | 661,285 | US$ | 38,323,033 | |||||||||||||||||
Comprehensive income for the year | ||||||||||||||||||||||||||||||||||||
| Profit for the year | — | — | — | — | — | 3,487,462 | — | (175,841 | ) | 3,311,621 | ||||||||||||||||||||||||||
| Remeasurements of net defined benefit liabilities | — | — | — | 190,151 | — | — | — | 62 | 190,213 | |||||||||||||||||||||||||||
| Currency translation differences | — | — | — | 124,808 | (6,087 | ) | — | — | 11,840 | 130,561 | ||||||||||||||||||||||||||
| Gains (losses) on financial instruments at fair value through other comprehensive income and transfer to retained earnings | — | — | — | (2,815,771 | ) | — | 192,846 | — | (1,157 | ) | (2,624,081 | ) | ||||||||||||||||||||||||
| Share of other comprehensive income of associates and joint ventures | — | — | — | (287 | ) | — | — | — | — | (287 | ) | |||||||||||||||||||||||||
| Gains on cash flow hedging instruments | — | — | — | 24,976 | — | — | — | — | 24,976 | |||||||||||||||||||||||||||
| Losses on hedging instruments of net investments in foreign operations | — | — | — | (62,757 | ) | — | — | — | — | (62,757 | ) | |||||||||||||||||||||||||
| Other comprehensive loss arising from separate account | — | — | — | (126,664 | ) | — | — | — | — | (126,664 | ) | |||||||||||||||||||||||||
| Fair value changes of financial liabilities designated at fair value through profit or loss due to own credit risk | — | — | — | 30,842 | — | — | — | — | 30,842 | |||||||||||||||||||||||||||
Losses on overlay adjustments | — | — | — | (349,259 | ) | — | — | — | — | (349,259 | ) | |||||||||||||||||||||||||
Total comprehensive income for the year | — | — | — | (2,983,960 | ) | (6,087 | ) | 3,680,308 | — | (165,096 | ) | 525,165 | ||||||||||||||||||||||||
Transactions with shareholders | ||||||||||||||||||||||||||||||||||||
| Annual dividends paid to shareholders of the Parent Company | — | — | — | — | — | (677,125 | ) | — | — | (677,125 | ) | |||||||||||||||||||||||||
| Quarterly dividends paid to shareholders of the Parent Company | — | — | — | — | — | (463,785 | ) | — | — | (463,785 | ) | |||||||||||||||||||||||||
| Issuance of hybrid securities | — | 1,266,510 | — | — | — | — | — | 342,655 | 1,609,165 | |||||||||||||||||||||||||||
| Dividends on hybrid securities | — | — | — | — | — | (100,305 | ) | — | (28,642 | ) | (128,947 | ) | ||||||||||||||||||||||||
| Retirement of treasury share | — | — | — | — | — | (238,061 | ) | 238,061 | — | — | ||||||||||||||||||||||||||
| Others | — | — | 397 | — | — | — | — | 205,607 | 206,004 | |||||||||||||||||||||||||||
Total transactions with shareholders | — | 1,266,510 | 397 | — | — | (1,479,275 | ) | 238,061 | 519,620 | 545,313 | ||||||||||||||||||||||||||
Balance as of December 31, 2022 | US$ | 1,658,936 | US$ | 3,518,744 | US$ | 13,443,104 | US$ | (2,152,909 | ) | US$ | — | US$ | 22,573,373 | US$ | (663,546) | US$ | 1,015,809 | US$ | 39,393,510 | |||||||||||||||||
2020 | 2021 | 2022 | 2022 | |||||||||||||
Translation into U.S. dollars (Note 3) | ||||||||||||||||
(In millions of Korean won) | (In thousands) | |||||||||||||||
Cash flows from operating activities: | ||||||||||||||||
| Profit for the year | ₩ | 3,515,578 | ₩ | 4,384,381 | ₩ | 4,173,239 | US$ | 3,311,621 | ||||||||
Adjustment for non-cash items | ||||||||||||||||
| Net gains on financial assets at fair value through profit or loss | (566,447 | ) | (274,515 | ) | (437,347 | ) | (347,051 | ) | ||||||||
| Net losses on derivative financial instruments for hedging purposes | (52,696 | ) | 213,996 | 141,759 | 112,491 | |||||||||||
| Adjustment of fair value of derivative financial instruments | (3,198 | ) | — | — | — | |||||||||||
| Provision for credit losses | 1,043,498 | 1,185,133 | 1,835,988 | 1,456,925 | ||||||||||||
| Net losses on financial investments | (278,805 | ) | 97,813 | 236,685 | 187,818 | |||||||||||
| Share of loss (profit) of associates and joint ventures | 43,750 | (93,526 | ) | 28,758 | 22,821 | |||||||||||
| Depreciation and amortization expense | 874,911 | 850,614 | 878,841 | 697,393 | ||||||||||||
| Amortization expense of VOBA | 173,866 | 156,074 | 137,617 | 109,204 | ||||||||||||
| Other net losses (gains) on property and equipment/intangible assets | (124,218 | ) | 1,974 | (251,858 | ) | (199,859 | ) | |||||||||
| Share-based payments | 49,364 | 101,935 | 58,275 | 46,243 | ||||||||||||
| Provision for policy reserves | 2,709,818 | 2,761,135 | 1,046,300 | 830,278 | ||||||||||||
| Post-employment benefits | 216,891 | 237,315 | 249,874 | 198,284 | ||||||||||||
| Net interest expense (income) | 458,210 | 256,736 | (89,588 | ) | (71,091 | ) | ||||||||||
| Losses (gains) on foreign currency translation | (116,786 | ) | (665,282 | ) | 669,989 | 531,661 | ||||||||||
| Gain on a bargain purchase | (145,067 | ) | (288 | ) | — | — | ||||||||||
| Other expenses | 524,742 | 721,459 | 800,935 | 635,572 | ||||||||||||
| 4,807,833 | 5,550,573 | 5,306,228 | 4,210,691 | |||||||||||||
| Changes in operating assets and liabilities | ||||||||||||||||
| Financial asset at fair value through profit or loss | (7,139,647 | ) | (6,149,781 | ) | 3,121,774 | 2,477,245 | ||||||||||
| Derivative financial instruments | (38,376 | ) | 39,343 | 546,095 | 433,347 | |||||||||||
| Loans measured at fair value through other comprehensive income | 81,803 | (24,618 | ) | (49,352 | ) | (39,163 | ) | |||||||||
| Loans measured at amortized cost | (31,126,636 | ) | (41,457,544 | ) | (21,129,553 | ) | (16,767,091 | ) | ||||||||
| Current income tax assets | (54,539 | ) | 10,581 | (105,892 | ) | (84,029 | ) | |||||||||
| Deferred income tax assets | (15,108 | ) | (92,967 | ) | (91,429 | ) | (72,552 | ) | ||||||||
| Other assets | (5,996,324 | ) | 950,313 | (1,222,952 | ) | (970,458 | ) | |||||||||
| Financial liabilities at fair value through profit or loss | (3,247,108 | ) | 759,989 | 1,252,561 | 993,954 | |||||||||||
| Deposits | 27,381,662 | 32,497,922 | 16,566,047 | 13,145,778 | ||||||||||||
| Current income tax liabilities | 323,313 | (102,273 | ) | 335,003 | 265,837 | |||||||||||
| Deferred income tax liabilities | (120,023 | ) | 294,130 | (152,767 | ) | (121,226 | ) | |||||||||
| Other liabilities | 3,216,600 | 1,314,561 | (2,862,918 | ) | (2,271,833 | ) | ||||||||||
| (16,734,383 | ) | (11,960,344 | ) | (3,793,383 | ) | (3,010,191 | ) | |||||||||
Net cash inflow (outflow) from operating activities | ₩ | (8,410,972 | ) | ₩ | (2,025,390 | ) | ₩ | 5,686,084 | US$ | 4,512,120 | ||||||
2020 | 2021 | 2022 | 2022 | |||||||||||||
Translation into U.S. dollars (Note 3) | ||||||||||||||||
(In millions of Korean won) | (In thousands) | |||||||||||||||
Cash flows from investing activities: | ||||||||||||||||
| Net cash flows from derivative financial instruments for hedging purposes | ₩ | (64,177 | ) | ₩ | 427 | ₩ | (166,066 | ) | US$ | (131,780 | ) | |||||
| Disposal of financial asset at fair value through profit or loss | 14,169,758 | 13,788,604 | 9,513,537 | 7,549,348 | ||||||||||||
| Acquisition of financial asset at fair value through profit or loss | (13,923,371 | ) | (12,298,792 | ) | (12,807,238 | ) | (10,163,023 | ) | ||||||||
| Disposal of financial investments | 83,143,443 | 50,825,909 | 25,993,266 | 20,626,630 | ||||||||||||
| Acquisition of financial investments | (92,206,817 | ) | (56,633,996 | ) | (43,612,269 | ) | (34,607,968) | |||||||||
| Disposal of investments in associates and joint ventures | 210,266 | 678,636 | 167,690 | 133,068 | ||||||||||||
| Acquisition of investments in associates and joint ventures | (515,342 | ) | (261,881 | ) | (430,400 | ) | (341,539) | |||||||||
| Disposal of property and equipment | 6,465 | 7,016 | 31,181 | 24,743 | ||||||||||||
| Acquisition of property and equipment | (424,862 | ) | (286,613 | ) | (296,937 | ) | (235,631 | ) | ||||||||
| Disposal of investment property | 646,263 | 177,033 | 1,292,114 | 1,025,341 | ||||||||||||
| Acquisition of investment property | (53,196 | ) | (118,961 | ) | (649,961 | ) | (515,768 | ) | ||||||||
| Disposal of intangible assets | 14,303 | 8,203 | 5,654 | 4,487 | ||||||||||||
| Acquisition of intangible assets | (182,859 | ) | (191,696 | ) | (237,258 | ) | (188,273 | ) | ||||||||
| Net cash flows from changes in ownership of subsidiaries | (1,951,245 | ) | 374,992 | 932,428 | 739,917 | |||||||||||
| Others | 142,961 | 75,105 | (21,456 | ) | (17,026 | ) | ||||||||||
Net cash outflow from investing activities | (10,988,410 | ) | (3,856,014 | ) | (20,285,715 | ) | (16,097,474 | ) | ||||||||
Cash flows from financing activities: | ||||||||||||||||
| Net cash flows from derivative financial instruments for hedging purposes | (16,202 | ) | 5,870 | 33,402 | 26,506 | |||||||||||
| Net increase in borrowings | 10,683,659 | 7,321,582 | 14,669,649 | 11,640,916 | ||||||||||||
| Increase in debentures | 119,705,016 | 121,767,039 | 107,607,314 | 85,390,432 | ||||||||||||
| Decrease in debentures | (107,760,800 | ) | (117,509,585 | ) | (106,631,213 | ) | (84,615,859 | ) | ||||||||
| Increase (decrease) in other payables to trust accounts | 2,326,495 | (509,106 | ) | (1,225,402 | ) | (972,402 | ) | |||||||||
| Dividends paid to shareholders of the Parent Company | (861,092 | ) | (981,879 | ) | (1,437,751 | ) | (1,140,909 | ) | ||||||||
| Dividends paid on hybrid securities | (22,860 | ) | (71,537 | ) | (126,402 | ) | (100,305 | ) | ||||||||
| Issuance of hybrid securities | 1,296,783 | 1,142,233 | 1,596,030 | 1,266,510 | ||||||||||||
Decrease in non-controlling interests | (25,658 | ) | (24,145 | ) | 395,713 | 314,013 | ||||||||||
| Redemption of principal of lease liabilities | (235,498 | ) | (253,248 | ) | (257,570 | ) | (204,391 | ) | ||||||||
| Others | 172,433 | (65,826 | ) | 694,473 | 551,090 | |||||||||||
Net cash inflow from financing activities | 25,262,276 | 10,821,398 | 15,318,243 | 12,155,599 | ||||||||||||
Effect of exchange rate changes on cash and cash equivalents | (261,665 | ) | 241,544 | 170,639 | 135,408 | |||||||||||
Net increase (decrease) in cash and cash equivalents | 5,601,229 | 5,181,538 | 889,251 | 705,654 | ||||||||||||
Cash and cash equivalents at the beginning of the year | 14,490,506 | 20,091,735 | 25,273,273 | 20,055,288 | ||||||||||||
Cash and cash equivalents at the end of the year | ₩ | 20,091,735 | ₩ | 25,273,273 | ₩ | 26,162,524 | US$ | 20,760,942 | ||||||||
| • | Amendments to IFRS No.16 Leases – COVID-19-Related 30, 2021 |
• | Amendments to IFRS No.3 Business Combination – Reference to the Conceptual Framework |
• | Amendments to IAS No.16 Property, Plant and Equipment – Proceeds Before Intended Use |
• | Amendments to IAS No.37 Provisions, Contingent Liabilities and Contingent Assets – Onerous Contracts: Cost of Fulfilling a Contract |
• | Annual improvements to IFRS 2018-2020 |
| • | IFRS No.1 First-time Adoption of International Financial Reporting Standards |
| • | IFRS No.9 Financial Instruments |
| • | IFRS No.16 Leases |
| • | IAS No.41 Agricultur |
2020 | 2021 | 2022 | ||||||||||
(In millions of Korean won) | ||||||||||||
| Increase in changes in other assets | ₩ | 3,129,722 | ₩ | 4,674,874 | ₩ | 175,012 | ||||||
| Increase (decrease) in effect of exchange rate changes on cash and cash equivalents in foreign currency | (89,860 | ) | 83,297 | 88,082 | ||||||||
| Increase in beginning balance of cash and cash equivalents | 8,366,781 | 11,406,643 | 16,164,814 | |||||||||
| Increase in ending balance of cash and cash equivalents | 11,406,643 | 16,164,814 | 16,427,908 | |||||||||
• | Amendments to IAS No.1 Presentation of Financial Statements – Classification of Liabilities as Current or Non-current |
• | Issuance of IFRS No.17 Insurance Contracts |
IFRS No.4 | IFRS No.17 | |||
| Insurance liability measurement | Measure at cost using the past information | Measure at current value using information at the reporting date | ||
| Need to choose transition method to adjust the existing group of insurance contracts to current measurement at the transition date (among the fully retrospective approach, modified retrospective approach or fair value approach) | ||||
| Recognition of insurance revenue | Apply cash basis to recognize the received premium as insurance revenue | Recognize revenue by reflecting services provided to the policyholder by each annual reporting period (accrual basis) | ||
| Include investment component, such as refunds due to termination and maturity, to insurance revenue | Exclude investment component (refunds due to termination and maturity) from insurance revenue Net insurance income and net investment income (financial income) are presented separately | |||
| Deferred acquisition cost | Recognize deferred acquisition cost as a separate asset | Do not recognize deferred acquisition cost as a separate asset | ||
| Estimate insurance liability based on net insurance premium (excluding administration expenses) | Estimate insurance liability based on operating insurance premium (including administration expenses) |
Key activity | Progress (at the reporting date) | Future plan | ||
| Implementation department | (Feb. 2017) Organize the implementation department of IFRS No.17 | — | ||
| (Apr. 2018) Expand the implementation department of IFRS No.17 (currently, total 14 personnel who are fully in charge of) | ||||
| Implementation of accounting system | (Feb. 2017) Start implementation of the integrated actuarial system (Jun. 2018) Complete implementation of the system | — | ||
(Sep. 2018) Start implementation of the accounting system (Nov. 2020) Complete implementation of the system | ||||
| Currently, pilot operation | ||||
| Training for executives and employees | Prepare and implement training for executives/head of departments and employees in related departments | — | ||
| Reporting to management | Report implementation of the system, financial effects, etc. | — |
Key activity | Progress (at the reporting date) | Future plan | ||
| Implementation department | (Apr. 2016) Organize the implementation department of IFRS No.17 (currently, total 10 personnel who are fully in charge of) | — | ||
| Implementation of accounting system | (Nov. 2017) Start implementation of the integrated actuarial system (Nov. 2018) Complete implementation of the system | Advancement of the internal control over financial reporting | ||
(Nov. 2020) Start implementation of the accounting system (Dec. 2021) Complete implementation of the system | ||||
| Training for executives and employees | Implement training for employees | — | ||
| Reporting to management | Report the implementation of the system, financial effect of insurance supervisory accounting for adoption of IFRS No.17 | — |
Key activity | Progress (at the reporting date) | Future plan | ||
Implementation department | (Jul. 2018) Organize the responsive team for IFRS No.17 (Mar. 2019) Organize and operate TF for IFRS No.17 | — | ||
Implementation of accounting system | (Mar. 2019) Start implementation of the accounting system (Dec. 2020) Complete implementation of the system Currently, pilot operation | — | ||
Training for executives and employees | Prepare and implement training for executives/head of departments and employees in related departments (total 20 trainings) (Nov. 2020) Open online training (Dec. 2021) Implement non-face-to-face | Plan to expand training target | ||
Reporting to management | Report implementation of the system, financial effects, etc. | — |
IFRS No.4 | IFRS No.17 | Net increase (decrease) | ||||||||||||
(In millions of Korean won) | ||||||||||||||
Assets | Assets | |||||||||||||
Financial assets | ₩ | 659,563,977 | Financial assets | ₩ | 660,449,629 | ₩ | 885,652 | |||||||
Intangible assets | 3,200,399 | Intangible assets | 1,858,470 | (1,341,929 | ) | |||||||||
Deferred income tax assets | 251,085 | Deferred income tax assets | 188,372 | (62,713 | ) | |||||||||
Other assets | 28,437,529 | Other assets | 14,815,439 | (13,622,090 | ) | |||||||||
Insurance contract assets | 83,304 | 83,304 | ||||||||||||
Reinsurance contract assets | 1,495,966 | 1,495,966 | ||||||||||||
Others | 9,717,858 | Others | 9,717,365 | (493 | ) | |||||||||
Total assets | ₩ | 701,170,848 | Total assets | ₩ | 688,608,545 | ₩ | (12,562,303 | ) | ||||||
Liabilities | Liabilities | |||||||||||||
Financial liabilities | 551,082,334 | Financial liabilities | 556,125,846 | 5,043,512 | ||||||||||
Insurance contract liabilities | 58,230,303 | Insurance contract liabilities | 45,920,012 | (12,310,291 | ) | |||||||||
Reinsurance contract liabilities | 31,728 | 31,728 | ||||||||||||
Deferred income tax liabilities | 22,693 | Deferred income tax liabilities | 1,574,954 | 1,552,261 | ||||||||||
Other liabilities | 40,140,365 | Other liabilities | 28,793,630 | (11,346,735 | ) | |||||||||
Others | 2,052,239 | Others | 2,018,127 | (34,112 | ) | |||||||||
Total liabilities | ₩ | 651,527,934 | Total liabilities | ₩ | 634,464,297 | ₩ | (17,063,637 | ) | ||||||
Equity | Equity | |||||||||||||
Share capital and capital adjustments | 22,629,352 | Share capital and capital adjustments | 22,629,352 | — | ||||||||||
Accumulated other comprehensive income | (2,713,053 | ) | Accumulated other comprehensive income | 1,312,522 | 4,025,575 | |||||||||
Retained earnings | 28,446,513 | Retained earnings | 28,922,272 | 475,759 | ||||||||||
Non-controlling interests | 1,280,102 | Non-controlling interests | 1,280,102 | — | ||||||||||
Total equity | ₩ | 49,642,914 | Total equity | ₩ | 54,144,248 | ₩ | 4,501,334 | |||||||
IFRS No.4 | IFRS No.17 | Net increase (decrease) | ||||||||||||
(In millions of Korean won) | ||||||||||||||
Net interest income | ₩ | 13,112,934 | Net interest income 1 | ₩ | 11,393,422 | ₩ | (1,719,512 | ) | ||||||
Net fee and commission income | 3,321,632 | Net fee and commission income | 3,514,902 | 193,270 | ||||||||||
Net insurance income | 696,513 | Net insurance income | 1,334,090 | 637,577 | ||||||||||
Insurance income | 17,136,842 | Insurance income | 9,544,474 | (7,592,368 | ) | |||||||||
Insurance expense | (16,440,329 | ) | Insurance service expense | (7,961,019 | ) | 8,479,310 | ||||||||
Reinsurance income | 522,389 | 522,389 | ||||||||||||
Reinsurance expense | (771,754 | ) | (771,754 | ) | ||||||||||
Net gains on financial instruments at fair value through profit or loss | 247,357 | Net gains on financial instruments at fair value through profit or loss | (1,133,475 | ) | (1,380,832 | ) | ||||||||
Insurance finance income | 897,441 | 897,441 | ||||||||||||
Net other operating expenses | (2,365,791 | ) | Net other operating expenses | (2,268,465 | ) | 97,326 | ||||||||
General and administrative expenses | (7,537,802 | ) | General and administrative expenses | (6,643,654 | ) | 894,148 | ||||||||
Provision for credit losses | (1,835,988 | ) | Provision for credit losses | (1,847,775 | ) | (11,787 | ) | |||||||
Net other non-operating income (expenses) | 156,771 | Net other non-operating income (expenses) | 160,569 | 3,798 | ||||||||||
Profit before income tax expense | 5,795,626 | Profit before income tax expense | 5,407,055 | (388,571 | ) | |||||||||
Income tax expense | (1,622,387 | ) | Income tax expense | (1,506,961 | ) | 115,426 | ||||||||
Profit for the year | 4,173,239 | Profit for the year | 3,900,094 | (273,145 | ) | |||||||||
Non-controlling interests | (221,591 | ) | Non-controlling interests | (221,591 | ) | — | ||||||||
Shareholders of the Parent Company | 4,394,830 | Shareholders of the Parent Company | 4,121,685 | (273,145 | ) | |||||||||
| Other comprehensive income for the year, net of tax | (3,511,437 | ) | Other comprehensive income for the year, net of tax | 146,661 | 3,658,098 | |||||||||
Total comprehensive income for the year | ₩ | 661,802 | Total comprehensive income for the year | ₩ | 4,046,755 | ₩ | 3,384,953 | |||||||
1 | Includes insurance interest expense on insurance contract liabilities. |
IFRS No.17 | ||||||||||||||
Transition method | Period | Insurance contract assets 1 | Insurance contract liabilities 1 | Contractual service margin 2 | ||||||||||
(In millions of Korean won) | ||||||||||||||
Fully retrospective approach | From 2018 to 2021 | ₩ | 1,358,667 | ₩ | 4,760,646 | ₩ | 5,061,116 | |||||||
Fair value approach | Before 2018 | 285,923 | 21,086,530 | 2,169,132 | ||||||||||
| ₩ | 1,644,590 | ₩ | 25,847,176 | ₩ | 7,230,248 | |||||||||
| 1 | Insurance contract assets and insurance contract liabilities are the total amounts, including reinsurance contract assets and reinsurance contract liabilities, respectively. |
| 2 | The contractual service margin is presented as net amount by offsetting the amounts included in the insurance contract assets and insurance contract liabilities. |
IFRS No.17 | ||||||||||||||
Transition method | Period | Insurance contract assets 1 | Insurance contract liabilities 1 | Contractual service margin 2 | ||||||||||
(In millions of Korean won) | ||||||||||||||
Fully retrospective approach | For the entire period | ₩ | — | ₩ | 20,140,367 | ₩ | 3,606,629 | |||||||
| ₩ | — | ₩ | 20,140,367 | ₩ | 3,606,629 | |||||||||
1 | Insurance contract assets and insurance contract liabilities are the total amounts, including reinsurance contract assets and reinsurance contract liabilities, respectively. |
| 2 | The contractual service margin is presented as net amount by offsetting the amounts included in the insurance contract assets and insurance contract liabilities. |
Transition method | Period | IFRS No.17 | ||||||||||||
Insurance contract assets 1 | Insurance contract liabilities 1 | Contractual service margin 2 | ||||||||||||
(In millions of Korean won) | ||||||||||||||
Fully retrospective approach | From 2019 to 2021 | ₩ | 3,369 | ₩ | 2,038,428 | ₩ | 359,140 | |||||||
Fair value approach | Before 2019 | 485 | 6,421,010 | 57,691 | ||||||||||
| ₩ | 3,854 | ₩ | 8,459,438 | ₩ | 416,831 | |||||||||
| 1 | Insurance contract assets and insurance contract liabilities are the total amounts, including reinsurance contract assets and reinsurance contract liabilities, respectively. |
| 2 | The contractual service margin is presented as net amount by offsetting the amounts included in the insurance contract assets and insurance contract liabilities. |
(In millions of Korean won) | Assets under IFRS No.17 | |||
Insurance contract assets | ₩ | 83,304 | ||
Contractual service margin | (316,418 | ) | ||
Reinsurance contract assets | 1,495,966 | |||
Contractual service margin on reinsurance contract | (93,045 | ) | ||
| ₩ | 1,579,270 | |||
(In millions of Korean won) | Liabilities under IFRS No.17 | |||
| Insurance contract liabilities | ₩ | 45,920,012 | ||
| Contractual service margin | 12,892,278 | |||
| Reinsurance contract liabilities | 31,728 | |||
| Contractual service margin on reinsurance contract | (7,922 | ) | ||
| ₩ | 45,951,740 | |||
Measurement categories before the re-evaluation ofthe business models | Measurement categories after the re-evaluation ofthe business models | Carrying amount before the re-evaluation ofthe business models | Carrying amount after the re-evaluation ofthe business models | |||
(In millions of Korean won) | ||||||
| Financial assets at fair value through profit or loss | Financial assets at fair value through other comprehensive income | ₩ 106,412 | ₩ 106,412 | |||
| Loans measured at amortized cost | Financial assets at fair value through other comprehensive income | 134,811 | 126,674 | |||
| Securities measured at amortized cost | Financial assets at fair value through other comprehensive income | 22,389,536 | 18,068,804 | |||
| * | The Group re-evaluated business model evaluation units, management performance reporting, compensation, and risk management for financial assets held in relation to activities related to contracts within the scope of IFRS No.17. Following there-evaluation of the business models, the Group will reclassify the financial assets as financial assets at fair value through other comprehensive income if both of the following conditions are met: (a) financial assets are held within a business model whose objective is achieved by both collecting contractual cash flows and selling financial assets, and (b) where the assets’ cash flows represent solely payments of principal and interest on the principal amount outstanding. |
• | Amendments to IAS No.1 Presentation of Financial Statements – Accounting Policy Disclosure |
| • | Amendments to IAS No.8 Accounting Policies, Changes in Accounting Estimates and Errors – Definition of Accounting Estimates |
| • | Amendments to IAS No.12 Income Taxes – Deferred Tax Related to Assets and Liabilities Arising from a Single Transaction |
| • | Amendments to IFRS No.1 Presentation of Financial Statements – Disclosure of gains or losses on valuation of financial liabilities with exercise price adjustment conditions |
| Level 1 : | Quoted prices (unadjusted) in active markets for identical assets or liabilities that the Group can access at the measurement date | |
| Level 2 : | Inputs other than quoted prices included within Level 1 that are observable for the asset or liability, either directly or indirectly | |
| Level 3 : | Unobservable inputs for the asset or liability | |
| • | Debt instruments that are held within a business model whose objective is achieved by both collecting contractual cash flows and selling financial assets, and where the assets’ cash flows represent solely payments of principal and interest on the principal amount outstanding and; |
| • | Equity instruments that are not held for short-term trading but held for strategic investment, and designated as financial assets at fair value through other comprehensive income |
| • | General approach: for financial assets and unused loan commitments not subject to the below 2 approaches |
| • | Simplified approach: for trade receivables, contract assets, and lease receivables |
| • | Credit-impaired approach: for financial assets that are credit-impaired at the time of acquisition |
| • | More than 30 days past due |
| • | Decline in credit rating at the end of the reporting period by certain notches or more compared to the time of initial recognition |
| • | Subsequent managing ratings below certain level in the early warning system |
| • | Debt restructuring (except for impaired financial assets) and |
| • | Credit delinquency information of Korea Federation of Banks, etc. |
| • | 90 days or more past due |
| • | Legal proceedings related to collection |
| • | A borrower registered on the credit management list of Korea Federation of Banks |
| • | A corporate borrower with the credit rating C and D |
| • | Refinancing and |
| • | Debt restructuring, etc. |
Key macroeconomic variables | Correlation between the major macroeconomic variables and the credit risk | |
| Domestic GDP growth rate | (-) | |
| Composite stock index | (-) | |
| Rate of change of construction investment | (-) | |
| Rate of change of housing transaction price index | (-) | |
| Interest rate spread | (+) | |
| Private consumption growth rate | (-) | |
| Change of call rate compared to the previous year (%p) | (+) | |
| Rate of change of household loan | (-) |
Property and equipment | Depreciation method | Estimated useful life | ||
| Buildings | Straight-line | 20~40 years | ||
| Leasehold improvements | Declining-balance/ Straight-line | 4~15 years | ||
| Equipment and vehicles | Declining-balance/ Straight-line | 3~15 years |
Investment properties | Depreciation method | Estimated useful life | ||
| Buildings | Straight-line | 20~40 years |
Intangible assets | Amortization method | Estimated useful life | ||
| Industrial property rights | Straight-line | 3 ~ 19 years | ||
| Software | Straight-line | 3 ~ 5 years | ||
| Value of business acquired | Declining-balance | 30, 60 years | ||
| Others | Straight-line / Declining-balance | 1 ~ 13 years |
| • | The amount determined in accordance with IFRS No.9 Financial Instruments |
| • | The amount initially recognized less, when appropriate, the cumulative amount of income recognized in accordance with IFRS No.15 Revenue from Contracts with Customers. |
| • | Step 1: Identify the contract with a customer. |
| • | Step 2: Identify the performance obligations in the contract. |
| • | Step 3: Determine the transaction price. |
| • | Step 4: Allocate the transaction price to the performance obligations in the contract. |
| • | Step 5: Recognize revenue when (or as) the entity satisfies a performance obligation. |
| • | Gains or losses relating to financial instruments at fair value through profit or loss (excluding interest income using the effective interest rate method) |
| • | Gains or losses relating to derivative financial instruments for trading (including derivative financial instruments for hedging purpose but do not qualify for hedge accounting) |
| • | Fixed payments (including in-substance fixed payments), less any lease incentives receivable |
| • | Variable lease payments that depend on an index or a rate |
| • | Amounts expected to be payable by the lessee under residual value guarantees |
| • | The exercise price of a purchase option if the lessee is reasonably certain to exercise that option, and |
| • | Payments of penalties for terminating the lease, if the lease term reflects the lessee exercising an option to terminate the lease |
| • | The amount of the initial measurement of the lease liability |
| • | Any lease payments made at or before the commencement date, less any lease incentives received |
| • | Any initial direct costs incurred by the lessee, and |
| • | An estimate of restoration costs |
| • | It is measured at fair value through profit or loss applying IFRS No.9 but would not have been measured at fair value through profit or loss in its entirety applying IAS No.39 and |
| • | It is not held in respect of an activity that is unconnected with contracts within the scope of IFRS No.4. |
| • | The amount reported in profit or loss for the designated financial assets applying IFRS No.9 and |
| • | The amount that would have been reported in profit or loss for the designated financial assets if the insurer had applied IAS No.39. |
December 31, 2021 | December 31, 2022 | |||||||
(In millions of Korean won) | ||||||||
Financial assets | ||||||||
| Due from financial institutions measured at amortized cost* | ₩ | 28,362,387 | ₩ | 29,500,768 | ||||
| Financial assets at fair value through profit or loss: | ||||||||
| Due from financial institutions measured at fair value through profit or loss | 200,742 | 69,469 | ||||||
| Securities measured at fair value through profit or loss | 63,002,692 | 61,787,727 | ||||||
| Loans measured at fair value through profit or loss | 269,296 | 493,562 | ||||||
| Financial instruments indexed to the price of gold | 113,622 | 90,006 | ||||||
| Derivatives | 3,721,370 | 9,446,134 | ||||||
| Loans measured at amortized cost* | 417,900,273 | 436,530,502 | ||||||
| Financial investments: | ||||||||
| Securities measured at fair value through other comprehensive income | 56,259,511 | 55,610,319 | ||||||
| Securities measured at amortized cost* | 44,471,628 | 58,288,734 | ||||||
| Loans measured at fair value through other comprehensive income | 313,604 | 363,144 | ||||||
| Other financial assets* | 10,755,350 | 11,209,350 | ||||||
| 625,370,475 | 663,389,715 | |||||||
Off-balance sheet items | ||||||||
| Acceptances and guarantees contracts | 10,199,689 | 12,425,753 | ||||||
| Financial guarantee contracts | 6,892,464 | 8,297,042 | ||||||
| Commitments | 170,218,143 | 188,168,340 | ||||||
| 187,310,296 | 208,891,135 | |||||||
| ₩ | 812,680,771 | ₩ | 872,280,850 | |||||
| * | After netting of allowance |
December 31, 2021 | ||||||||||||||||||||
12-month expected credit losses | Lifetime expected credit losses | Not applying expected credit losses | Total | |||||||||||||||||
Non-impaired | Impaired | |||||||||||||||||||
(In millions of Korean won) | ||||||||||||||||||||
Loans measured at amortized cost* | ||||||||||||||||||||
Corporate | ||||||||||||||||||||
| Grade 1 | ₩ | 111,284,284 | ₩ | 5,345,956 | ₩ | 3,705 | ₩ | — | ₩ | 116,633,945 | ||||||||||
| Grade 2 | 68,050,042 | 7,847,126 | 4,338 | — | 75,901,506 | |||||||||||||||
| Grade 3 | 5,323,745 | 2,850,266 | 2,949 | — | 8,176,960 | |||||||||||||||
| Grade 4 | 586,857 | 1,037,461 | 7,570 | — | 1,631,888 | |||||||||||||||
| Grade 5 | 12,877 | 352,046 | 2,143,708 | — | 2,508,631 | |||||||||||||||
| 185,257,805 | 17,432,855 | 2,162,270 | — | 204,852,930 | ||||||||||||||||
Retail | ||||||||||||||||||||
| Grade 1 | 170,810,128 | 4,593,302 | 11,609 | — | 175,415,039 | |||||||||||||||
| Grade 2 | 9,093,868 | 4,209,451 | 35,097 | — | 13,338,416 | |||||||||||||||
| Grade 3 | 3,410,624 | 1,414,439 | 23,467 | — | 4,848,530 | |||||||||||||||
| Grade 4 | 235,150 | 400,029 | 17,998 | — | 653,177 | |||||||||||||||
| Grade 5 | 495,987 | 445,588 | 710,341 | — | 1,651,916 | |||||||||||||||
| 184,045,757 | 11,062,809 | 798,512 | — | 195,907,078 | ||||||||||||||||
Credit card | ||||||||||||||||||||
| Grade 1 | 10,640,412 | 1,113,400 | — | — | 11,753,812 | |||||||||||||||
| Grade 2 | 3,919,053 | 1,027,546 | — | — | 4,946,599 | |||||||||||||||
| Grade 3 | 1,360,908 | 1,412,951 | — | — | 2,773,859 | |||||||||||||||
| Grade 4 | 82,565 | 608,250 | — | — | 690,815 | |||||||||||||||
| Grade 5 | 1,267 | 130,712 | 527,256 | — | 659,235 | |||||||||||||||
| 16,004,205 | 4,292,859 | 527,256 | — | 20,824,320 | ||||||||||||||||
| 385,307,767 | 32,788,523 | 3,488,038 | — | 421,584,328 | ||||||||||||||||
Loans measured at fair value through other comprehensive income | ||||||||||||||||||||
Corporate | ||||||||||||||||||||
| Grade 1 | 233,868 | — | — | — | 233,868 | |||||||||||||||
| Grade 2 | 79,736 | — | — | — | 79,736 | |||||||||||||||
| Grade 3 | — | — | — | — | — | |||||||||||||||
| Grade 4 | — | — | — | — | — | |||||||||||||||
| Grade 5 | — | — | — | — | — | |||||||||||||||
| 313,604 | — | — | — | 313,604 | ||||||||||||||||
| 313,604 | — | — | — | 313,604 | ||||||||||||||||
| ₩ | 385,621,371 | ₩ | 32,788,523 | ₩ | 3,488,038 | ₩ | — | ₩ | 421,897,932 | |||||||||||
December 31, 2022 | ||||||||||||||||||||
12-month expected credit losses | Lifetime expected credit losses | Not applying expected credit losses | Total | |||||||||||||||||
Non-impaired | Impaired | |||||||||||||||||||
(In millions of Korean won) | ||||||||||||||||||||
Loans measured at amortized cost* | ||||||||||||||||||||
Corporate | ||||||||||||||||||||
| Grade 1 | ₩ | 134,487,020 | ₩ | 5,877,660 | ₩ | 3,372 | ₩ | — | ₩ | 140,368,052 | ||||||||||
| Grade 2 | 65,627,866 | 8,585,346 | 4,480 | — | 74,217,692 | |||||||||||||||
| Grade 3 | 4,054,715 | 3,221,267 | 14,693 | — | 7,290,675 | |||||||||||||||
| Grade 4 | 570,670 | 922,748 | 34,298 | — | 1,527,716 | |||||||||||||||
| Grade 5 | 11,910 | 419,058 | 1,959,706 | — | 2,390,674 | |||||||||||||||
| 204,752,181 | 19,026,079 | 2,016,549 | — | 225,794,809 | ||||||||||||||||
Retail | ||||||||||||||||||||
| Grade 1 | 168,460,089 | 4,240,281 | 11,286 | — | 172,711,656 | |||||||||||||||
| Grade 2 | 7,697,699 | 3,846,756 | 32,877 | — | 11,577,332 | |||||||||||||||
| Grade 3 | 4,319,404 | 1,477,076 | 25,599 | — | 5,822,079 | |||||||||||||||
| Grade 4 | 293,828 | 313,999 | 32,330 | — | 640,157 | |||||||||||||||
| Grade 5 | 25,672 | 670,642 | 837,187 | — | 1,533,501 | |||||||||||||||
| 180,796,692 | 10,548,754 | 939,279 | — | 192,284,725 | ||||||||||||||||
Credit card | ||||||||||||||||||||
| Grade 1 | 11,547,014 | 1,316,136 | — | — | 12,863,150 | |||||||||||||||
| Grade 2 | 4,390,211 | 1,214,946 | — | — | 5,605,157 | |||||||||||||||
| Grade 3 | 1,142,362 | 1,925,145 | — | — | 3,067,507 | |||||||||||||||
| Grade 4 | 2,227 | 302,736 | — | — | 304,963 | |||||||||||||||
| Grade 5 | 666 | 173,049 | 595,101 | — | 768,816 | |||||||||||||||
| 17,082,480 | 4,932,012 | 595,101 | — | 22,609,593 | ||||||||||||||||
| 402,631,353 | 34,506,845 | 3,550,929 | — | 440,689,127 | ||||||||||||||||
Loans measured at fair value through other comprehensive income | ||||||||||||||||||||
Corporate | ||||||||||||||||||||
| Grade 1 | 303,317 | — | — | — | 303,317 | |||||||||||||||
| Grade 2 | 59,827 | — | — | — | 59,827 | |||||||||||||||
| Grade 3 | — | — | — | — | — | |||||||||||||||
| Grade 4 | — | — | — | — | — | |||||||||||||||
| Grade 5 | — | — | — | — | — | |||||||||||||||
| 363,144 | — | — | — | 363,144 | ||||||||||||||||
| 363,144 | — | — | — | 363,144 | ||||||||||||||||
| ₩ | 402,994,497 | ₩ | 34,506,845 | ₩ | 3,550,929 | ₩ | — | ₩ | 441,052,271 | |||||||||||
| * | Before netting of allowance |
Range of probability of default (%) | Retail | Corporate | ||||
| Grade 1 | 0.0 ~ 1.0 | 1 ~ 5 grade | AAA ~ BBB+ | |||
| Grade 2 | 1.0 ~ 5.0 | 6 ~ 8 grade | BBB ~ BB | |||
| Grade 3 | 5.0 ~ 15.0 | 9 ~ 10 grade | BB- ~ B | |||
| Grade 4 | 15.0 ~ 30.0 | 11 grade | B- ~ CCC | |||
| Grade 5 | 30.0 ~ | 12 grade or under | CC or under |
December 31, 2021 | ||||||||||||||||
12-month expected credit losses | Lifetime expected credit losses | Total | ||||||||||||||
Non-impaired | Impaired | |||||||||||||||
(In millions of Korean won) | ||||||||||||||||
| Guarantees | ₩ | 90,696,507 | ₩ | 6,604,758 | ₩ | 396,097 | ₩ | 97,697,362 | ||||||||
| Deposits and savings | 5,723,090 | 98,389 | 79,229 | 5,900,708 | ||||||||||||
| Property and equipment | 13,205,822 | 597,251 | 319,697 | 14,122,770 | ||||||||||||
| Real estate | 182,139,890 | 13,736,634 | 1,990,847 | 197,867,371 | ||||||||||||
| ₩ | 291,765,309 | ₩ | 21,037,032 | ₩ | 2,785,870 | ₩ | 315,588,211 | |||||||||
December 31, 2022 | ||||||||||||||||
12-month expected credit losses | Lifetime expected credit losses | Total | ||||||||||||||
Non-impaired | Impaired | |||||||||||||||
(In millions of Korean won) | ||||||||||||||||
| Guarantees | ₩ | 100,396,614 | ₩ | 7,060,738 | ₩ | 301,688 | ₩ | 107,759,040 | ||||||||
| Deposits and savings | 6,206,646 | 141,016 | 51,297 | 6,398,959 | ||||||||||||
| Property and equipment | 14,648,523 | 1,002,291 | 180,103 | 15,830,917 | ||||||||||||
| Real estate | 190,604,649 | 15,720,019 | 1,706,308 | 208,030,976 | ||||||||||||
| ₩ | 311,856,432 | ₩ | 23,924,064 | ₩ | 2,239,396 | ₩ | 338,019,892 | |||||||||
December 31, 2021 | ||||||||||||||||||||
12-month expected credit losses | Lifetime expected credit losses | Not applying expected credit losses | Total | |||||||||||||||||
Non-impaired | Impaired | |||||||||||||||||||
(In millions of Korean won) | ||||||||||||||||||||
Securities measured at amortized cost* | ||||||||||||||||||||
| Grade 1 | ₩ | 43,427,028 | ₩ | — | ₩ | — | ₩ | — | ₩ | 43,427,028 | ||||||||||
| Grade 2 | 1,039,757 | — | — | — | 1,039,757 | |||||||||||||||
| Grade 3 | 1,371 | 7,641 | — | — | 9,012 | |||||||||||||||
| Grade 4 | — | — | — | — | — | |||||||||||||||
| Grade 5 | — | — | — | — | — | |||||||||||||||
| 44,468,156 | 7,641 | — | — | 44,475,797 | ||||||||||||||||
Securities measured at fair value through other comprehensive income | ||||||||||||||||||||
| Grade 1 | 51,490,960 | — | — | — | 51,490,960 | |||||||||||||||
| Grade 2 | 4,682,582 | — | — | — | 4,682,582 | |||||||||||||||
| Grade 3 | 42,861 | 3,973 | — | — | 46,834 | |||||||||||||||
| Grade 4 | 39,135 | — | — | — | 39,135 | |||||||||||||||
| Grade 5 | — | — | — | — | — | |||||||||||||||
| 56,255,538 | 3,973 | — | — | 56,259,511 | ||||||||||||||||
| ₩ | 100,723,694 | ₩ | 11,614 | ₩ | — | ₩ | — | ₩ | 100,735,308 | |||||||||||
December 31, 2022 | ||||||||||||||||||||
12-month expected credit losses | Lifetime expected credit losses | Not applying expected credit losses | Total | |||||||||||||||||
Non-impaired | Impaired | |||||||||||||||||||
(In millions of Korean won) | ||||||||||||||||||||
Securities measured at amortized cost* | ||||||||||||||||||||
| Grade 1 | ₩ | 56,448,267 | ₩ | — | ₩ | — | ₩ | — | ₩ | 56,448,267 | ||||||||||
| Grade 2 | 1,845,339 | — | — | — | 1,845,339 | |||||||||||||||
| Grade 3 | 1,288 | — | — | — | 1,288 | |||||||||||||||
| Grade 4 | — | — | — | — | — | |||||||||||||||
| Grade 5 | — | — | — | — | — | |||||||||||||||
| 58,294,894 | — | — | — | 58,294,894 | ||||||||||||||||
Securities measured at fair value through other comprehensive income | ||||||||||||||||||||
| Grade 1 | 51,281,790 | — | — | — | 51,281,790 | |||||||||||||||
| Grade 2 | 4,180,121 | 53,861 | — | — | 4,233,982 | |||||||||||||||
| Grade 3 | 66,797 | 9,169 | — | — | 75,966 | |||||||||||||||
| Grade 4 | 13,941 | 4,640 | — | — | 18,581 | |||||||||||||||
| Grade 5 | — | — | — | — | — | |||||||||||||||
| 55,542,649 | 67,670 | — | — | 55,610,319 | ||||||||||||||||
| ₩ | 113,837,543 | ₩ | 67,670 | ₩ | — | ₩ | — | ₩ | 113,905,213 | |||||||||||
| * | Before netting of allowance |
Domestic | Foreign | |||||||||||||||||||||||||||
Credit quality | KIS | NICE P&I | KAP | FnPricing Inc. | S&P | Fitch-IBCA | Moody’s | |||||||||||||||||||||
Grade 1 | AA0 to AAA | AA0 to AAA | AA0 to AAA | AA0 to AAA | A- to AAA | A- to AAA | A3 to Aaa | |||||||||||||||||||||
Grade 2 | A - | A - | A- to AA- | A- to AA- | BBB- to BBB+ | BBB- to BBB+ | Baa3 to Baa1 | |||||||||||||||||||||
Grade 3 | BBB0 to BBB+ | BBB0 to BBB+ | BBB0 to BBB+ | BBB0 to BBB+ | BB to BB+ | BB to BB+ | Ba2 to Ba1 | |||||||||||||||||||||
Grade 4 | BB0 to BBB- | BB0 to BBB- | BB0 to BBB- | BB0 to BBB- | B+ to BB- | B + to BB- | B1 to Ba3 | |||||||||||||||||||||
Grade 5 | BB - | BB- or under | BB- or under | BB- or under | B or under | B or under | B2 or under | |||||||||||||||||||||
December 31, 2021 | ||||||||||||||||||||
12-month expectedcredit losses | Lifetime expected credit losses | Not applying expected credit losses | Total | |||||||||||||||||
Non-impaired | Impaired | |||||||||||||||||||
(In millions of Korean won) | ||||||||||||||||||||
Due from financial institutions measured at amortized cost* | ||||||||||||||||||||
Grade 1 | ₩ | 26,548,145 | ₩ | — | ₩ | — | ₩ | — | ₩ | 26,548,145 | ||||||||||
Grade 2 | 1,305,539 | — | — | — | 1,305,539 | |||||||||||||||
Grade 3 | 61,177 | — | — | — | 61,177 | |||||||||||||||
Grade 4 | — | — | — | — | — | |||||||||||||||
Grade 5 | 450,495 | — | — | — | 450,495 | |||||||||||||||
| ₩ | 28,365,356 | ₩ | — | ₩ | — | ₩ | — | ₩ | 28,365,356 | |||||||||||
December 31, 2022 | ||||||||||||||||||||
12-month expected credit losses | Lifetime expected credit losses | Not applying expected credit losses | Total | |||||||||||||||||
Non-impaired | Impaired | |||||||||||||||||||
(In millions of Korean won) | ||||||||||||||||||||
Due from financial institutions measured at amortized cost* | ||||||||||||||||||||
Grade 1 | ₩ | 27,612,549 | ₩ | — | ₩ | — | ₩ | — | ₩ | 27,612,549 | ||||||||||
Grade 2 | 1,428,663 | — | — | — | 1,428,663 | |||||||||||||||
Grade 3 | — | — | — | — | — | |||||||||||||||
Grade 4 | — | — | — | — | — | |||||||||||||||
Grade 5 | 462,299 | — | — | — | 462,299 | |||||||||||||||
| ₩ | 29,503,511 | ₩ | — | ₩ | — | ₩ | — | ₩ | 29,503,511 | |||||||||||
| * | Before netting of allowance |
December 31, 202 1 | December 31, 202 2 | |||||||
(In millions of Korean won) | ||||||||
| Deposits, savings, securities, and others | ₩ | 834,175 | ₩ | 2,966,923 | ||||
December 31, 2021 * | ||||||||||||||||||||||||||||
Retail | Corporate | Credit card | Total | % | Allowances | Carrying amount | ||||||||||||||||||||||
(In millions of Korean won) | ||||||||||||||||||||||||||||
Korea | ₩ | 191,601,232 | ₩ | 183,222,201 | ₩ | 20,766,535 | ₩ | 395,589,968 | 93.70 | ₩ | (2,653,256 | ) | ₩ | 392,936,712 | ||||||||||||||
Europe | — | 2,673,817 | — | 2,673,817 | 0.63 | (29,015 | ) | 2,644,802 | ||||||||||||||||||||
China | 34,982 | 6,743,756 | 327 | 6,779,065 | 1.61 | (34,316 | ) | 6,744,749 | ||||||||||||||||||||
Japan | 86 | 1,039,453 | 8 | 1,039,547 | 0.25 | (2,227 | ) | 1,037,320 | ||||||||||||||||||||
United States | — | 3,555,723 | — | 3,555,723 | 0.84 | (28,113 | ) | 3,527,610 | ||||||||||||||||||||
Cambodia | 1,985,808 | 3,115,992 | — | 5,101,800 | 1.21 | (70,660 | ) | 5,031,140 | ||||||||||||||||||||
Indonesia | 1,666,850 | 3,710,586 | 55,520 | 5,432,956 | 1.29 | (841,145 | ) | 4,591,811 | ||||||||||||||||||||
Others | 618,120 | 1,374,302 | 1,930 | 1,994,352 | 0.47 | (25,323 | ) | 1,969,029 | ||||||||||||||||||||
| ₩ | 195,907,078 | ₩ | 205,435,830 | ₩ | 20,824,320 | ₩ | 422,167,228 | 100.00 | ₩ | (3,684,055 | ) | ₩ | 418,483,173 | |||||||||||||||
December 31, 2022 * | ||||||||||||||||||||||||||||
Retail | Corporate | Credit card | Total | % | Allowances | Carrying amount | ||||||||||||||||||||||
(In millions of Korean won) | ||||||||||||||||||||||||||||
Korea | ₩ | 186,948,909 | ₩ | 198,853,096 | ₩ | 22,562,372 | ₩ | 408,364,377 | 92.49 | ₩ | (3,030,906 | ) | ₩ | 405,333,471 | ||||||||||||||
Europe | — | 4,671,790 | — | 4,671,790 | 1.06 | (25,689 | ) | 4,646,101 | ||||||||||||||||||||
China | 140,060 | 6,901,682 | 363 | 7,042,105 | 1.59 | (39,025 | ) | 7,003,080 | ||||||||||||||||||||
Japan | — | 1,150,151 | 46 | 1,150,197 | 0.26 | (1,755 | ) | 1,148,442 | ||||||||||||||||||||
United States | — | 5,130,629 | — | 5,130,629 | 1.16 | (18,229 | ) | 5,112,400 | ||||||||||||||||||||
Cambodia | 2,610,472 | 3,768,170 | — | 6,378,642 | 1.44 | (73,723 | ) | 6,304,919 | ||||||||||||||||||||
Indonesia | 1,735,571 | 2,896,037 | 43,023 | 4,674,631 | 1.06 | (795,309 | ) | 3,879,322 | ||||||||||||||||||||
Others | 849,713 | 3,279,960 | 3,789 | 4,133,462 | 0.94 | (173,989 | ) | 3,959,473 | ||||||||||||||||||||
| ₩ | 192,284,725 | ₩ | 226,651,515 | ₩ | 22,609,593 | ₩ | 441,545,833 | 100.00 | ₩ | (4,158,625 | ) | ₩ | 437,387,208 | |||||||||||||||
| * | Amount includes loans measured at fair value through profit or loss, other comprehensive income, and amortized cost. |
December 31, 2021 | ||||||||||||||||
Loans | % | Allowances | Carrying amount | |||||||||||||
(In millions of Korean won) | ||||||||||||||||
Financial institutions | ₩ | 22,059,895 | 10.74 | ₩ | (32,856 | ) | ₩ | 22,027,039 | ||||||||
Manufacturing | 49,149,918 | 23.92 | (510,762 | ) | 48,639,156 | |||||||||||
Service | 86,926,095 | 42.31 | (450,272 | ) | 86,475,823 | |||||||||||
Wholesale and retail | 26,862,247 | 13.08 | (257,541 | ) | 26,604,706 | |||||||||||
Construction | 5,683,471 | 2.77 | (228,803 | ) | 5,454,668 | |||||||||||
Public sector | 2,070,960 | 1.01 | (95,053 | ) | 1,975,907 | |||||||||||
Others | 12,683,244 | 6.17 | (311,629 | ) | 12,371,615 | |||||||||||
| ₩ | 205,435,830 | 100.00 | ₩ | (1,886,916 | ) | ₩ | 203,548,914 | |||||||||
December 31, 2022 | ||||||||||||||||
Loans | % | Allowances | Carrying amount | |||||||||||||
(In millions of Korean won) | ||||||||||||||||
Financial institutions | ₩ | 23,603,384 | 10.41 | ₩ | (52,108 | ) | ₩ | 23,551,276 | ||||||||
Manufacturing | 53,301,044 | 23.52 | (575,227 | ) | 52,725,817 | |||||||||||
Service | 98,306,161 | 43.37 | (479,440 | ) | 97,826,721 | |||||||||||
Wholesale and retail | 29,665,900 | 13.09 | (352,211 | ) | 29,313,689 | |||||||||||
Construction | 6,909,315 | 3.06 | (228,782 | ) | 6,680,533 | |||||||||||
Public sector | 1,903,185 | 0.84 | (84,423 | ) | 1,818,762 | |||||||||||
Others | 12,962,526 | 5.71 | (213,204 | ) | 12,749,322 | |||||||||||
| ₩ | 226,651,515 | 100.00 | ₩ | (1,985,395 | ) | ₩ | 224,666,120 | |||||||||
December 31, 2021 | ||||||||||||||||
Loans | % | Allowances | Carrying amount | |||||||||||||
(In millions of Korean won) | ||||||||||||||||
Housing loan | ₩ | 93,695,479 | 43.23 | ₩ | (71,424 | ) | ₩ | 93,624,055 | ||||||||
General loan | 102,211,599 | 47.16 | (933,571 | ) | 101,278,028 | |||||||||||
Credit card | 20,824,320 | 9.61 | (792,144 | ) | 20,032,176 | |||||||||||
| ₩ | 216,731,398 | 100.00 | ₩ | (1,797,139 | ) | ₩ | 214,934,259 | |||||||||
December 31, 2022 | ||||||||||||||||
Loans | % | Allowances | Carrying amount | |||||||||||||
(In millions of Korean won) | ||||||||||||||||
Housing loan | ₩ | 94,625,388 | 44.03 | ₩ | (162,446 | ) | ₩ | 94,462,942 | ||||||||
General loan | 97,659,337 | 45.45 | (1,172,942 | ) | 96,486,395 | |||||||||||
Credit card | 22,609,593 | 10.52 | (837,842 | ) | 21,771,751 | |||||||||||
| ₩ | 214,894,318 | 100.00 | ₩ | (2,173,230 | ) | ₩ | 212,721,088 | |||||||||
December 31, 2021 | ||||||||||||||||
Amount | % | Allowances | Carrying amount | |||||||||||||
(In millions of Korean won) | ||||||||||||||||
Due from financial institutions measured at amortized cost | ||||||||||||||||
Finance and insurance | ₩ | 28,365,356 | 100.00 | ₩ | (2,969 | ) | ₩ | 28,362,387 | ||||||||
| 28,365,356 | 100.00 | (2,969 | ) | 28,362,387 | ||||||||||||
Due from financial institutions measured at fair value through profit or loss | ||||||||||||||||
Finance and insurance | 200,742 | 100.00 | — | 200,742 | ||||||||||||
| 200,742 | 100.00 | — | 200,742 | |||||||||||||
Securities measured at fair value through profit or loss | ||||||||||||||||
Government and government funded institutions | 16,101,187 | 25.56 | — | 16,101,187 | ||||||||||||
Finance and insurance | 35,025,800 | 55.59 | — | 35,025,800 | ||||||||||||
Others | 11,875,705 | 18.85 | — | 11,875,705 | ||||||||||||
| 63,002,692 | 100.00 | — | 63,002,692 | |||||||||||||
Derivative financial assets | ||||||||||||||||
Government and government funded institutions | 6,985 | 0.19 | — | 6,985 | ||||||||||||
Finance and insurance | 3,554,783 | 95.52 | — | 3,554,783 | ||||||||||||
Others | 159,602 | 4.29 | — | 159,602 | ||||||||||||
| 3,721,370 | 100.00 | — | 3,721,370 | |||||||||||||
Securities measured at fair value through other comprehensive income | ||||||||||||||||
Government and government funded institutions | 24,609,458 | 43.74 | — | 24,609,458 | ||||||||||||
Finance and insurance | 22,669,379 | 40.29 | — | 22,669,379 | ||||||||||||
Others | 8,980,674 | 15.97 | — | 8,980,674 | ||||||||||||
| 56,259,511 | 100.00 | — | 56,259,511 | |||||||||||||
Securities measured at amortized cost | ||||||||||||||||
Government and government funded institutions | 31,996,180 | 71.94 | (34 | ) | 31,996,146 | |||||||||||
Finance and insurance | 10,450,497 | 23.50 | (3,337 | ) | 10,447,160 | |||||||||||
Others | 2,029,120 | 4.56 | (798 | ) | 2,028,322 | |||||||||||
| 44,475,797 | 100.00 | (4,169 | ) | 44,471,628 | ||||||||||||
| ₩ | 196,025,468 | ₩ | (7,138 | ) | ₩ | 196,018,330 | ||||||||||
December 31, 2022 | ||||||||||||||||
Amount | % | Allowances | Carrying amount | |||||||||||||
(In millions of Korean won) | ||||||||||||||||
Due from financial institutions measured at amortized cost | ||||||||||||||||
Finance and insurance | ₩ | 29,503,511 | 100.00 | ₩ | (2,743 | ) | ₩ | 29,500,768 | ||||||||
| 29,503,511 | 100.00 | (2,743 | ) | 29,500,768 | ||||||||||||
Due from financial institutions measured at fair value through profit or loss | ||||||||||||||||
Finance and insurance | 69,469 | 100.00 | — | 69,469 | ||||||||||||
| 69,469 | 100.00 | — | 69,469 | |||||||||||||
Securities measured at fair value through profit or loss | ||||||||||||||||
Government and government funded institutions | 15,523,407 | 25.12 | — | 15,523,407 | ||||||||||||
Finance and insurance | 35,904,941 | 58.11 | — | 35,904,941 | ||||||||||||
Others | 10,359,379 | 16.77 | — | 10,359,379 | ||||||||||||
| 61,787,727 | 100.00 | — | 61,787,727 | |||||||||||||
Derivative financial assets | ||||||||||||||||
Government and government funded institutions | 58,060 | 0.61 | — | 58,060 | ||||||||||||
Finance and insurance | 8,987,835 | 95.15 | — | 8,987,835 | ||||||||||||
Others | 400,239 | 4.24 | — | 400,239 | ||||||||||||
| 9,446,134 | 100.00 | — | 9,446,134 | |||||||||||||
Securities measured at fair value through other comprehensive income | ||||||||||||||||
Government and government funded institutions | 25,001,019 | 44.96 | — | 25,001,019 | ||||||||||||
Finance and insurance | 21,034,862 | 37.83 | — | 21,034,862 | ||||||||||||
Others | 9,574,438 | 17.21 | — | 9,574,438 | ||||||||||||
| 55,610,319 | 100.00 | — | 55,610,319 | |||||||||||||
Securities measured at amortized cost | ||||||||||||||||
Government and government funded institutions | 37,167,849 | 63.76 | (31 | ) | 37,167,818 | |||||||||||
Finance and insurance | 18,624,970 | 31.95 | (5,306 | ) | 18,619,664 | |||||||||||
Others | 2,502,075 | 4.29 | (823 | ) | 2,501,252 | |||||||||||
| 58,294,894 | 100.00 | (6,160 | ) | 58,288,734 | ||||||||||||
| ₩ | 214,712,054 | ₩ | (8,903 | ) | ₩ | 214,703,151 | ||||||||||
December 31, 2021 | ||||||||||||||||
Amount | % | Allowances | Carrying amount | |||||||||||||
(In millions of Korean won) | ||||||||||||||||
Due from financial institutions measured at amortized cost | ||||||||||||||||
Korea | ₩ | 21,051,229 | 74.21 | ₩ | (574 | ) | ₩ | 21,050,655 | ||||||||
United States | 2,875,884 | 10.14 | (136 | ) | 2,875,748 | |||||||||||
Others | 4,438,243 | 15.65 | (2,259 | ) | 4,435,984 | |||||||||||
| 28,365,356 | 100.00 | (2,969 | ) | 28,362,387 | ||||||||||||
Due from financial institutions measured at fair value through profit or loss | ||||||||||||||||
Korea | 200,742 | 100.00 | — | 200,742 | ||||||||||||
| 200,742 | 100.00 | — | 200,742 | |||||||||||||
Securities measured at fair value through profit or loss | ||||||||||||||||
Korea | 56,920,225 | 90.35 | — | 56,920,225 | ||||||||||||
United States | 3,334,888 | 5.29 | — | 3,334,888 | ||||||||||||
Others | 2,747,579 | 4.36 | — | 2,747,579 | ||||||||||||
| 63,002,692 | 100.00 | — | 63,002,692 | |||||||||||||
Derivative financial assets | ||||||||||||||||
Korea | 1,639,657 | 44.06 | — | 1,639,657 | ||||||||||||
United States | 753,896 | 20.26 | — | 753,896 | ||||||||||||
France | 370,787 | 9.96 | — | 370,787 | ||||||||||||
Singapore | 117,964 | 3.17 | — | 117,964 | ||||||||||||
Japan | 96,438 | 2.59 | — | 96,438 | ||||||||||||
Others | 742,628 | 19.96 | — | 742,628 | ||||||||||||
| 3,721,370 | 100.00 | — | 3,721,370 | |||||||||||||
Securities measured at fair value through other comprehensive income | ||||||||||||||||
Korea | 51,484,332 | 91.51 | — | 51,484,332 | ||||||||||||
United States | 1,417,898 | 2.52 | — | 1,417,898 | ||||||||||||
Others | 3,357,281 | 5.97 | — | 3,357,281 | ||||||||||||
| 56,259,511 | 100.00 | — | 56,259,511 | |||||||||||||
Securities measured at amortized cost | ||||||||||||||||
Korea | 41,912,154 | 94.24 | (3,183 | ) | 41,908,971 | |||||||||||
United States | 1,188,427 | 2.67 | (466 | ) | 1,187,961 | |||||||||||
Others | 1,375,216 | 3.09 | (520 | ) | 1,374,696 | |||||||||||
| 44,475,797 | 100.00 | (4,169 | ) | 44,471,628 | ||||||||||||
| ₩ | 196,025,468 | ₩ | (7,138 | ) | ₩ | 196,018,330 | ||||||||||
December 31, 2022 | ||||||||||||||||
Amount | % | Allowances | Carrying amount | |||||||||||||
(In millions of Korean won) | ||||||||||||||||
Due from financial institutions measured at amortized cost | ||||||||||||||||
Korea | ₩ | 21,765,088 | 73.77 | ₩ | (484 | ) | ₩ | 21,764,604 | ||||||||
United States | 2,248,004 | 7.62 | (28 | ) | 2,247,976 | |||||||||||
Others | 5,490,419 | 18.61 | (2,231 | ) | 5,488,188 | |||||||||||
| 29,503,511 | 100.00 | (2,743 | ) | 29,500,768 | ||||||||||||
Due from financial institutions measured at fair value through profit or loss | ||||||||||||||||
Korea | 69,469 | 100.00 | — | 69,469 | ||||||||||||
| 69,469 | 100.00 | — | 69,469 | |||||||||||||
Securities measured at fair value through profit or loss | ||||||||||||||||
Korea | 56,691,217 | 91.75 | — | 56,691,217 | ||||||||||||
United States | 2,934,339 | 4.75 | — | 2,934,339 | ||||||||||||
Others | 2,162,171 | 3.50 | — | 2,162,171 | ||||||||||||
| 61,787,727 | 100.00 | — | 61,787,727 | |||||||||||||
Derivative financial assets | ||||||||||||||||
Korea | 4,830,565 | 51.14 | — | 4,830,565 | ||||||||||||
United States | 1,351,969 | 14.31 | — | 1,351,969 | ||||||||||||
France | 1,281,270 | 13.56 | — | 1,281,270 | ||||||||||||
Singapore | 212,710 | 2.25 | — | 212,710 | ||||||||||||
Japan | 435,592 | 4.61 | — | 435,592 | ||||||||||||
Others | 1,334,028 | 14.13 | — | 1,334,028 | ||||||||||||
| 9,446,134 | 100.00 | — | 9,446,134 | |||||||||||||
Securities measured at fair value through other comprehensive income | ||||||||||||||||
Korea | 51,039,864 | 91.78 | — | 51,039,864 | ||||||||||||
United States | 1,459,063 | 2.63 | — | 1,459,063 | ||||||||||||
Others | 3,111,392 | 5.59 | — | 3,111,392 | ||||||||||||
| 55,610,319 | 100.00 | — | 55,610,319 | |||||||||||||
Securities measured at amortized cost | ||||||||||||||||
Korea | 51,832,992 | 88.92 | (4,046 | ) | 51,828,946 | |||||||||||
United States | 3,919,413 | 6.72 | (1,263 | ) | 3,918,150 | |||||||||||
Others | 2,542,489 | 4.36 | (851 | ) | 2,541,638 | |||||||||||
| 58,294,894 | 100.00 | (6,160 | ) | 58,288,734 | ||||||||||||
| ₩ | 214,712,054 | ₩ | (8,903 | ) | ₩ | 214,703,151 | ||||||||||
December 31, 2021 | ||||||||||||||||||||||||||||
On demand | Up to 1 month | 1-3 months | 3-12 months | 1-5 years | Over 5 years | Total | ||||||||||||||||||||||
(In millions of Korean won) | ||||||||||||||||||||||||||||
Financial liabilities | ||||||||||||||||||||||||||||
Financial liabilities at fair value through profit or loss 1 | ₩ | 2,939,584 | ₩ | — | ₩ | — | ₩ | — | ₩ | — | ₩ | — | ₩ | 2,939,584 | ||||||||||||||
Financial liabilities designated at fair value through profit or loss 1 | 9,149,396 | — | — | — | — | — | 9,149,396 | |||||||||||||||||||||
Derivatives held for trading 1 | 3,509,789 | — | — | — | — | — | 3,509,789 | |||||||||||||||||||||
Derivatives held for hedging 2 | — | 11,355 | 9,993 | 31,135 | 31,640 | 1,423 | 85,546 | |||||||||||||||||||||
Deposits 3 | 204,616,202 | 16,556,213 | 31,123,968 | 111,140,222 | 10,157,238 | 1,329,120 | 374,922,963 | |||||||||||||||||||||
| Borrowings | 8,504,084 | 17,807,785 | 5,825,350 | 13,861,238 | 10,380,171 | 1,003,369 | 57,381,997 | |||||||||||||||||||||
| Debentures | 14,528 | 3,438,621 | 5,318,699 | 20,496,869 | 34,863,044 | 6,509,966 | 70,641,727 | |||||||||||||||||||||
| Lease liabilities | 139 | 23,387 | 42,406 | 157,536 | 334,359 | 50,555 | 608,382 | |||||||||||||||||||||
| Other financial liabilities | 217,874 | 22,953,515 | 203,897 | 354,876 | 934,389 | 372,745 | 25,037,296 | |||||||||||||||||||||
| ₩ | 228,951,596 | ₩ | 60,790,876 | ₩ | 42,524,313 | ₩ | 146,041,876 | ₩ | 56,700,841 | ₩ | 9,267,178 | ₩ | 544,276,680 | |||||||||||||||
Off-balance sheet items | ||||||||||||||||||||||||||||
Commitments 4 | ₩ | 170,218,143 | ₩ | — | ₩ | — | ₩ | — | ₩ | — | ₩ | — | ₩ | 170,218,143 | ||||||||||||||
| Acceptances and guarantees contracts | 10,199,689 | — | — | — | — | — | 10,199,689 | |||||||||||||||||||||
Financial guarantee contracts 5 | 6,892,464 | — | — | — | — | — | 6,892,464 | |||||||||||||||||||||
| ₩ | 187,310,296 | ₩ | — | ₩ | — | ₩ | — | ₩ | — | ₩ | — | ₩ | 187,310,296 | |||||||||||||||
December 31, 2022 | ||||||||||||||||||||||||||||
On demand | Up to 1 month | 1-3 months | 3-12 months | 1-5 years | Over 5 years | Total | ||||||||||||||||||||||
(In millions of Korean won) | ||||||||||||||||||||||||||||
Financial liabilities | ||||||||||||||||||||||||||||
Financial liabilities at fair value through profit or loss 1 | ₩ | 2,193,210 | ₩ | — | ₩ | — | ₩ | — | ₩ | — | ₩ | — | ₩ | 2,193,210 | ||||||||||||||
Financial liabilities designated at fair value through profit or loss 1 | 10,078,394 | — | — | — | — | — | 10,078,394 | |||||||||||||||||||||
Derivatives held for trading 1 | 9,209,537 | — | — | — | — | — | 9,209,537 | |||||||||||||||||||||
Derivatives held for hedging 2 | — | 11,106 | 8,886 | 39,174 | 221,551 | 3,502 | 284,219 | |||||||||||||||||||||
Deposits 3 | 170,489,726 | 29,911,835 | 45,245,496 | 131,765,097 | 17,979,299 | 1,129,024 | 396,520,477 | |||||||||||||||||||||
| Borrowings | 7,831,474 | 23,821,330 | 7,676,952 | 19,120,861 | 12,839,302 | 1,159,432 | 72,449,351 | |||||||||||||||||||||
| Debentures | 11,117 | 4,011,679 | 8,353,663 | 20,995,587 | 33,216,320 | 6,485,136 | 73,073,502 | |||||||||||||||||||||
| Lease liabilities | 164 | 28,079 | 45,200 | 171,449 | 376,159 | 2,839 | 623,890 | |||||||||||||||||||||
| Other financial liabilities | 179,241 | 17,938,781 | 368,218 | 447,898 | 907,643 | 428,310 | 20,270,091 | |||||||||||||||||||||
| ₩ | 199,992,863 | ₩ | 75,722,810 | ₩ | 61,698,415 | ₩ | 172,540,066 | ₩ | 65,540,274 | ₩ | 9,208,243 | ₩ | 584,702,671 | |||||||||||||||
Off-balance sheet items | ||||||||||||||||||||||||||||
Commitments 4 | ₩ | 188,168,340 | ₩ | — | ₩ | — | ₩ | — | ₩ | — | ₩ | — | ₩ | 188,168,340 | ||||||||||||||
| Acceptances and guarantees contracts | 12,425,753 | — | — | — | — | — | 12,425,753 | |||||||||||||||||||||
Financial guarantee contracts 5 | 8,297,042 | — | — | — | — | — | 8,297,042 | |||||||||||||||||||||
| ₩ | 208,891,135 | ₩ | — | ₩ | — | ₩ | — | ₩ | — | ₩ | — | ₩ | 208,891,135 | |||||||||||||||
| 1 | Financial liabilities measured or designated at fair value through profit or loss and derivatives held for trading are not managed by contractual maturity because they are expected to be traded or redeemed before maturity. Therefore, the carrying amounts of those financial instruments are included in the ‘On demand’ category. |
| 2 | Cash flows of derivatives held for hedging are shown at net amount of cash inflows and outflows by remaining contractual maturity. |
| 3 | Deposits that are contractually repayable on demand or on short notice are included in the ‘On demand’ category. |
| 4 | Commitments are included in the ‘On demand’ category because payments can be requested at any time. |
| 5 | Cash flows under financial guarantee contracts are classified based on the earliest period that the contract can be executed. |
December 31, 2021 | ||||||||||||||||||||||||
Up to 1 month | 1-3 months | 3-12 months | 1-5 years | Over 5 years | Total | |||||||||||||||||||
(In millions of Korean won) | ||||||||||||||||||||||||
Cash flow to be received (paid) of net-settled derivatives | ₩ | (102 | ) | ₩ | (2,647 | ) | ₩ | (252 | ) | ₩ | 24,812 | ₩ | (11 | ) | ₩ | 21,800 | ||||||||
| Cash flow to be received of gross-settled derivatives | 126,429 | 325,664 | 619,100 | 2,084,618 | — | 3,155,811 | ||||||||||||||||||
| Cash flow to be paid of gross-settled derivatives | (130,919 | ) | (329,546 | ) | (630,023 | ) | (1,428,759 | ) | — | (2,519,247 | ) | |||||||||||||
December 31, 2022 | ||||||||||||||||||||||||
Up to 1 month | 1-3 months | 3-12 months | 1-5 years | Over 5 years | Total | |||||||||||||||||||
(In millions of Korean won) | ||||||||||||||||||||||||
Cash flow to be received (paid) of net-settled derivatives | ₩ | 1,534 | ₩ | 10,994 | ₩ | 25,749 | ₩ | 119,179 | ₩ | 3,526 | ₩ | 160,982 | ||||||||||||
| Cash flow to be received of gross-settled derivatives | 10,932 | 30,311 | 1,003,755 | 2,894,502 | — | 3,939,500 | ||||||||||||||||||
| Cash flow to be paid of gross-settled derivatives | (10,357 | ) | (54,794 | ) | (1,007,950 | ) | (2,255,613 | ) | — | (3,328,714 | ) | |||||||||||||
December 31, 2022 | ||||
Exposure amount* | ||||
USD LIBOR | ||||
(In millions of Korean won) | ||||
| Measured at fair value: | ||||
| Financial assets at fair value through profit or loss | ₩ | — | ||
| Financial liabilities designated at fair value through profit or loss | — | |||
| Financial investments | 22,800 | |||
| Measured at amortized cost: | ||||
| Loans | 1,954,327 | |||
| Borrowings and debentures | 531,334 | |||
| Others: | ||||
| Derivative financial instruments | 290,423 | |||
| * | Financial instruments to be expired before transition to alternative interest rate benchmark are excluded. |
| • | The target position has no restrictions on the sale, and the daily fair value assessment should be made, and the embedded significant risk can be hedged in the market. |
| • | The trading position classification criteria should be clearly defined in the Trading Policy and Guidelines, and the trading position should be managed by a separate trading department. |
| • | The target position must be operated according to the documented trading strategy and the management of position limit must be carried out. |
| • | The specialized dealer or operating department shall have the authority to execute the transaction without prior approval from the Risk Management Department, etc. within the predetermined limits of the target position. |
| • | The target positions should be periodically reported to management for risk management of the Group. |
2021 | ||||||||||||||||
Average | Minimum | Maximum | Dec. 31, 2021 | |||||||||||||
(In millions of Korean won) | ||||||||||||||||
| Interest rate risk | ₩ | 20,051 | ₩ | 6,372 | ₩ | 55,670 | ₩ | 16,534 | ||||||||
| Stock price risk | 9,067 | 4,537 | 24,824 | 5,513 | ||||||||||||
| Currency risk | 27,886 | 17,820 | 49,264 | 21,522 | ||||||||||||
| Diversification effect | (13,039 | ) | ||||||||||||||
| Total VaR | ₩ | 40,915 | ₩ | 15,986 | ₩ | 115,347 | ₩ | 30,530 | ||||||||
2022 | ||||||||||||||||
Average | Minimum | Maximum | Dec. 31, 2022 | |||||||||||||
(In millions of Korean won) | ||||||||||||||||
| Interest rate risk | ₩ | 34,923 | ₩ | 16,541 | ₩ | 64,356 | ₩ | 47,093 | ||||||||
| Stock price risk | 8,606 | 5,142 | 11,061 | 9,407 | ||||||||||||
| Currency risk | 24,054 | 14,428 | 41,815 | 41,189 | ||||||||||||
| Diversification effect | (5,140 | ) | ||||||||||||||
| Total VaR | ₩ | 49,701 | ₩ | 22,144 | ₩ | 99,436 | ₩ | 92,549 | ||||||||
December 31, 2021 | December 31, 2022 | |||||||
(In millions of Korean won) | ||||||||
| Interest rate risk | ₩ | 25,432 | ₩ | 18,545 | ||||
| Stock price risk | 6 | 4,686 | ||||||
| Currency risk | 46,173 | 70,757 | ||||||
| ₩ | 71,611 | ₩ | 93,988 | |||||
2021 | ||||||||||||||||
Average | Minimum | Maximum | Dec. 31, 2021 | |||||||||||||
(In millions of Korean won) | ||||||||||||||||
| Interest rate risk | ₩ | 724,482 | ₩ | 657,094 | ₩ | 821,864 | ₩ | 821,864 | ||||||||
| Stock price risk | 249,320 | 207,425 | 299,221 | 278,356 | ||||||||||||
| Currency risk | 14,275 | 6,808 | 22,543 | 22,543 | ||||||||||||
| Commodity risk | 88 | 3 | 210 | 19 | ||||||||||||
| ₩ | 988,165 | ₩ | 871,330 | ₩ | 1,143,838 | ₩ | 1,122,782 | |||||||||
2022 | ||||||||||||||||
Average | Minimum | Maximum | Dec. 31, 2022 | |||||||||||||
(In millions of Korean won) | ||||||||||||||||
| Interest rate risk | ₩ | 828,772 | ₩ | 755,379 | ₩ | 873,861 | ₩ | 755,379 | ||||||||
| Stock price risk | 212,679 | 150,149 | 297,812 | 171,592 | ||||||||||||
| Currency risk | 24,002 | 14,938 | 34,109 | 34,109 | ||||||||||||
| Commodity risk | 116 | 41 | 229 | 41 | ||||||||||||
| ₩ | 1,065,569 | ₩ | 920,507 | ₩ | 1,206,011 | ₩ | 961,121 | |||||||||
2021 | ||||||||||||||||
Average | Minimum | Maximum | Dec. 31, 2021 | |||||||||||||
(In millions of Korean won) | ||||||||||||||||
| Interest rate risk | ₩ | 5,445 | ₩ | 3,854 | ₩ | 6,553 | ₩ | 5,906 | ||||||||
| Currency risk | 34,560 | 28,035 | 40,853 | 40,853 | ||||||||||||
| ₩ | 40,005 | ₩ | 31,889 | ₩ | 47,406 | ₩ | 46,759 | |||||||||
2022 | ||||||||||||||||
Average | Minimum | Maximum | Dec. 31, 2022 | |||||||||||||
(In millions of Korean won) | ||||||||||||||||
| Interest rate risk | ₩ | 4,728 | ₩ | 3,159 | ₩ | 6,450 | ₩ | 3,159 | ||||||||
| Currency risk | 28,413 | 14,768 | 39,701 | 14,768 | ||||||||||||
| ₩ | 33,141 | ₩ | 17,927 | ₩ | 46,151 | ₩ | 17,927 | |||||||||
2021 | ||||||||||||||||
Average | Minimum | Maximum | Dec. 31, 2021 | |||||||||||||
(In millions of Korean won) | ||||||||||||||||
| Currency risk | ₩ | 13,029 | ₩ | 7,744 | ₩ | 16,094 | ₩ | 15,637 | ||||||||
2022 | ||||||||||||||||
Average | Minimum | Maximum | Dec. 31, 2022 | |||||||||||||
(In millions of Korean won) | ||||||||||||||||
| Currency risk | ₩ | 18,430 | ₩ | 16,483 | ₩ | 21,890 | ₩ | 21,341 | ||||||||
2021 | ||||||||||||||||
Average | Minimum | Maximum | Dec. 31, 2021 | |||||||||||||
(In millions of Korean won) | ||||||||||||||||
| Currency risk | ₩ | 4,676 | ₩ | 1,337 | ₩ | 7,211 | ₩ | 6,963 | ||||||||
2022 | ||||||||||||||||
Average | Minimum | Maximum | Dec. 31, 2022 | |||||||||||||
(In millions of Korean won) | ||||||||||||||||
| Currency risk | ₩ | 4,253 | ₩ | 853 | ₩ | 8,931 | ₩ | 8,931 | ||||||||
2021 | ||||||||||||||||
Average | Minimum | Maximum | Dec. 31, 2021 | |||||||||||||
(In millions of Korean won) | ||||||||||||||||
| Currency risk | ₩ | 2,151 | ₩ | 1,053 | ₩ | 3,085 | ₩ | 2,405 | ||||||||
2022 | ||||||||||||||||
Average | Minimum | Maximum | Dec. 31, 2022 | |||||||||||||
(In millions of Korean won) | ||||||||||||||||
| Currency risk | ₩ | 2,426 | ₩ | 1,607 | ₩ | 2,823 | ₩ | 2,455 | ||||||||
2021 | ||||||||||||||||
Average | Minimum | Maximum | Dec. 31, 2021 | |||||||||||||
(In millions of Korean won) | ||||||||||||||||
| Currency risk | ₩ | 1,121 | ₩ | 867 | ₩ | 1,280 | ₩ | 1,280 | ||||||||
2022 | ||||||||||||||||
Average | Minimum | Maximum | Dec. 31, 2022 | |||||||||||||
(In millions of Korean won) | ||||||||||||||||
| Currency risk | ₩ | 1,905 | ₩ | 1,298 | ₩ | 2,128 | ₩ | 2,045 | ||||||||
2021 | ||||||||||||||||
Average | Minimum | Maximum | Dec. 31, 2021 | |||||||||||||
(In millions of Korean won) | ||||||||||||||||
| Interest rate risk | ₩ | 2,095 | ₩ | 1,072 | ₩ | 2,932 | ₩ | 1,072 | ||||||||
| Currency risk | 4,216 | 1,725 | 6,651 | 6,378 | ||||||||||||
| ₩ | 6,311 | ₩ | 2,797 | ₩ | 9,583 | ₩ | 7,450 | |||||||||
2022 | ||||||||||||||||
Average | Minimum | Maximum | Dec. 31, 2022 | |||||||||||||
(In millions of Korean won) | ||||||||||||||||
| Interest rate risk | ₩ | 545 | ₩ | — | ₩ | 1,476 | ₩ | — | ||||||||
| Currency risk | 4,355 | 993 | 6,799 | 993 | ||||||||||||
| ₩ | 4,900 | ₩ | 993 | ₩ | 8,275 | ₩ | 993 | |||||||||
2021 | ||||||||||||||||
Average | Minimum | Maximum | Dec. 31, 2021 | |||||||||||||
(In millions of Korean won) | ||||||||||||||||
| Stock price risk | ₩ | 5,114 | ₩ | 3,518 | ₩ | 10,518 | ₩ | 10,518 | ||||||||
| Currency risk | 13,706 | 11,269 | 18,452 | 18,301 | ||||||||||||
| ₩ | 18,820 | ₩ | 14,787 | ₩ | 28,970 | ₩ | 28,819 | |||||||||
2022 | ||||||||||||||||
Average | Minimum | Maximum | Dec. 31, 2022 | |||||||||||||
(In millions of Korean won) | ||||||||||||||||
| Stock price risk | ₩ | 9,406 | ₩ | 8,002 | ₩ | 10,685 | ₩ | 8,438 | ||||||||
| Currency risk | 21,993 | 18,883 | 24,384 | 21,727 | ||||||||||||
| ₩ | 31,399 | ₩ | 26,885 | ₩ | 35,069 | ₩ | 30,165 | |||||||||
2021 | ||||||||||||||||
Average | Minimum | Maximum | Dec. 31, 2021 | |||||||||||||
(In millions of Korean won) | ||||||||||||||||
Stock price risk | ₩ | 177 | ₩ | — | ₩ | 231 | ₩ | 231 | ||||||||
2022 | ||||||||||||||||
Average | Minimum | Maximum | Dec. 31, 2022 | |||||||||||||
(In millions of Korean won) | ||||||||||||||||
Stock price risk | ₩ | 198 | ₩ | 155 | ₩ | 228 | ₩ | 155 | ||||||||
| • | Scenario 1 : Parallel shock up |
| • | Scenario 2 : Parallel shock down |
| • | Scenario 3 : Steepener shock (short rates down and long rates up) |
| • | Scenario 4 : Flattener shock (short rates up and long rates down) |
| • | Scenario 5 : Short rates shock up |
| • | Scenario 6 : Short rates shock down |
Time bucket intervals (D:Day M:Months Y:Years t cf :Repricing date) | ||||||||||||||||
Short-term rates | 1D (0.0028Y) | 1D< t cf ≤1M (0.0417Y) | 1M< t cf ≤3M (0.1667Y) | 3M< t cf ≤6M (0.375Y) | 6M< t cf ≤9M (0.625Y) | 9M< t cf ≤1Y (0.875Y) | 1Y< t cf ≤1.5Y (1.25Y) | 1.5Y< t cf ≤2Y (1.75Y) | ||||||||
Medium-term rates | 2Y< t cf ≤3Y (2.5Y) | 3Y< t cf ≤4Y (3.5Y) | 4Y< t cf ≤5Y (4.5Y) | 5Y< t cf ≤6Y (5.5Y) | 6Y< t cf ≤7Y (6.5Y) | |||||||||||
Long-term rates | 7Y< t cf ≤8Y (7.5Y) | 8Y< t cf ≤9Y (8.5Y) | 9Y< t cf ≤10Y (9.5Y) | 10Y< t cf ≤15Y (12.5Y) | 15Y< t cf ≤20Y (17.5Y) | t cf >20Y(25Y) | ||||||||||
| * | The number in brackets is the time bucket’s midpoint. |
Cap on proportion of core deposits (%) | Cap on average maturity of core deposits (years) | |||||||
Retail/transactional | 90 | 5 | ||||||
Retail/non-transactional | 70 | 4.5 | ||||||
Wholesale | 50 | 4 | ||||||
December 31, 2021 | December 31, 2022 | |||||||||||||||
| Δ EVE | Δ NII | Δ EVE | Δ NII | |||||||||||||
(In millions of Korean won) | ||||||||||||||||
Scenario 1 (Parallel shock up) | ₩ | 936,965 | ₩ | 564,771 | ₩ | 165,634 | ₩ | 162,959 | ||||||||
Scenario 2 (Parallel shock down) | — | — | 290,330 | — | ||||||||||||
Scenario 3 (Short rates down, long rates up) | 273,951 | 266,737 | ||||||||||||||
Scenario 4 (Short rates up, long rates down) | 311,497 | 268,261 | ||||||||||||||
Scenario 5 (Short rates shock up) | 568,246 | 288,737 | ||||||||||||||
Scenario 6 (Short rates shock down) | 345,987 | 132,998 | ||||||||||||||
Maximum out of six scenarios | 936,965 | 564,771 | 290,330 | 162,959 | ||||||||||||
Basic capital | 30,491,173 | 31,176,032 | ||||||||||||||
December 31, 2021 | December 31, 2022 | |||||||||||||||
| Δ EVE | Δ NII | Δ EVE | Δ NII | |||||||||||||
(In millions of Korean won) | ||||||||||||||||
KB Securities Co., Ltd. | ₩ | 173,199 | ₩ | 272,676 | ₩ | 37,498 | ₩ | 242,200 | ||||||||
KB Insurance Co., Ltd. | 939,720 | 37,119 | 182,310 | 44,405 | ||||||||||||
KB Kookmin Card Co., Ltd. | 93,232 | 225,581 | 96,282 | 244,602 | ||||||||||||
KB Life Insurance Co., Ltd.(former Prudential Life Insurance Company of Korea Ltd.) | 611,930 | 24,135 | 354,982 | 24,609 | ||||||||||||
KB Capital Co., Ltd. | 105,728 | 41,112 | 126,535 | 50,800 | ||||||||||||
KB Life Insurance Co., Ltd. | 143,393 | 33,942 | 73,277 | 35,645 | ||||||||||||
KB Savings Bank Co., Ltd. | 20,077 | 786 | 5,320 | 14,976 | ||||||||||||
December 31, 2021 | ||||||||||||||||||||||||||||
USD | JPY | EUR | GBP | CNY | Others | Total | ||||||||||||||||||||||
(In millions of Korean won) | ||||||||||||||||||||||||||||
Financial assets | ||||||||||||||||||||||||||||
Cash and due from financial institutions | ₩ | 6,995,653 | ₩ | 420,964 | ₩ | 482,144 | ₩ | 96,951 | ₩ | 570,186 | ₩ | 1,646,253 | ₩ | 10,212,151 | ||||||||||||||
Financial assets at fair value through profit or loss | 7,217,843 | 12,047 | 514,047 | 11,024 | 16,113 | 261,029 | 8,032,103 | |||||||||||||||||||||
Derivatives held for trading | 222,759 | 221 | 44,384 | 534 | 5,549 | 21,762 | 295,209 | |||||||||||||||||||||
Derivatives held for hedging | 104,091 | — | — | — | — | 4,541 | 108,632 | |||||||||||||||||||||
Loans measured at amortized cost | 26,605,737 | 597,413 | 1,777,967 | 234,612 | 1,774,589 | 6,518,650 | 37,508,968 | |||||||||||||||||||||
Financial assets at fair value through other comprehensive income | 6,604,010 | 5,152 | 121,573 | 6,272 | 536,747 | 405,391 | 7,679,145 | |||||||||||||||||||||
Financial assets at amortized cost | 2,267,233 | — | 300,856 | — | 48,435 | 710,950 | 3,327,474 | |||||||||||||||||||||
Other financial assets | 1,893,691 | 37,036 | 100,041 | 7,082 | 69,307 | 252,337 | 2,359,494 | |||||||||||||||||||||
| ₩ | 51,911,017 | ₩ | 1,072,833 | ₩ | 3,341,012 | ₩ | 356,475 | ₩ | 3,020,926 | ₩ | 9,820,913 | ₩ | 69,523,176 | |||||||||||||||
Financial liabilities | ||||||||||||||||||||||||||||
Financial liabilities at fair value through profit or loss | ₩ | 1,496,712 | ₩ | — | ₩ | — | ₩ | — | ₩ | — | ₩ | — | ₩ | 1,496,712 | ||||||||||||||
Derivatives held for trading | 376,230 | 6,099 | 61,941 | 19,833 | 18,223 | 117,217 | 599,543 | |||||||||||||||||||||
Derivatives held for hedging | 42,470 | — | — | — | — | — | 42,470 | |||||||||||||||||||||
Deposits | 21,324,104 | 900,044 | 1,873,026 | 106,456 | 1,943,015 | 5,402,000 | 31,548,645 | |||||||||||||||||||||
Borrowings | 15,597,440 | 456,029 | 386,023 | 496,084 | — | 2,176,532 | 19,112,108 | |||||||||||||||||||||
Debentures | 6,366,475 | — | 1,338,391 | — | 102,443 | 708,353 | 8,515,662 | |||||||||||||||||||||
Other financial liabilities | 1,834,429 | 23,158 | 140,779 | 16,543 | 93,933 | 211,516 | 2,320,358 | |||||||||||||||||||||
| ₩ | 47,037,860 | ₩ | 1,385,330 | ₩ | 3,800,160 | ₩ | 638,916 | ₩ | 2,157,614 | ₩ | 8,615,618 | ₩ | 63,635,498 | |||||||||||||||
Off-balance sheet items | ₩ | 19,149,581 | ₩ | 353 | ₩ | 262,116 | ₩ | 2,991 | ₩ | 250,239 | ₩ | 844,384 | ₩ | 20,509,664 | ||||||||||||||
December 31, 2022 | ||||||||||||||||||||||||||||
USD | JPY | EUR | GBP | CNY | Others | Total | ||||||||||||||||||||||
(In millions of Korean won) | ||||||||||||||||||||||||||||
Financial assets | ||||||||||||||||||||||||||||
Cash and due from financial institutions | ₩ | 6,334,501 | ₩ | 461,826 | ₩ | 456,888 | ₩ | 97,502 | ₩ | 645,271 | ₩ | 2,324,691 | ₩ | 10,320,679 | ||||||||||||||
Financial assets at fair value through profit or loss | 6,098,956 | 2,443 | 601,726 | 59,263 | 7,110 | 330,779 | 7,100,277 | |||||||||||||||||||||
Derivatives held for trading | 636,456 | 159 | 10,412 | 10 | 19,053 | 167,796 | 833,886 | |||||||||||||||||||||
Derivatives held for hedging | 251,522 | — | — | — | — | 22,522 | 274,044 | |||||||||||||||||||||
Loans measured at amortized cost | 32,995,825 | 683,705 | 2,813,855 | 755,912 | 1,944,500 | 6,596,283 | 45,790,080 | |||||||||||||||||||||
Financial assets at fair value through other comprehensive income | 5,326,003 | — | 9,091 | 5,677 | 556,052 | 972,787 | 6,869,610 | |||||||||||||||||||||
Financial assets at amortized cost | 5,841,305 | — | 322,755 | 37,816 | 60,013 | 1,316,707 | 7,578,596 | |||||||||||||||||||||
Other financial assets | 1,878,542 | 292,727 | 360,469 | 25,289 | 116,049 | 368,272 | 3,041,348 | |||||||||||||||||||||
| ₩ | 59,363,110 | ₩ | 1,440,860 | ₩ | 4,575,196 | ₩ | 981,469 | ₩ | 3,348,048 | ₩ | 12,099,837 | ₩ | 81,808,520 | |||||||||||||||
Financial liabilities | ||||||||||||||||||||||||||||
Financial liabilities at fair value through profit or loss | ₩ | 1,143,413 | ₩ | — | ₩ | — | ₩ | — | ₩ | — | ₩ | — | ₩ | 1,143,413 | ||||||||||||||
Derivatives held for trading | 893,781 | 9,016 | 81,119 | 17,072 | 6,868 | 264,833 | 1,272,689 | |||||||||||||||||||||
Derivatives held for hedging | 130,784 | — | — | — | — | — | 130,784 | |||||||||||||||||||||
Deposits | 25,706,364 | 1,339,119 | 1,429,567 | 344,824 | 2,307,068 | 5,238,485 | 36,365,427 | |||||||||||||||||||||
Borrowings | 19,700,039 | 458,856 | 446,968 | 588,324 | 266,727 | 2,442,313 | 23,903,227 | |||||||||||||||||||||
Debentures | 7,771,068 | — | 2,041,517 | — | 36,288 | 975,891 | 10,824,764 | |||||||||||||||||||||
Other financial liabilities | 3,615,838 | 266,569 | 190,103 | 14,521 | 126,752 | 435,606 | 4,649,389 | |||||||||||||||||||||
| ₩ | 58,961,287 | ₩ | 2,073,560 | ₩ | 4,189,274 | ₩ | 964,741 | ₩ | 2,743,703 | ₩ | 9,357,128 | ₩ | 78,289,693 | |||||||||||||||
Off-balance sheet items | ₩ | 23,777,728 | ₩ | — | ₩ | 243,431 | ₩ | 102,232 | ₩ | 220,890 | ₩ | 774,154 | ₩ | 25,118,435 | ||||||||||||||
| • | Common Equity Tier 1 Capital: Common equity Tier 1 Capital is the first to take losses of the Group and is the last to be compensated in liquidation of the Group and not repaid except for liquidation. It includes capital, capital surplus, retained earnings, non-controlling interests of the consolidated subsidiaries, accumulated other comprehensive income, and other capital surplus, etc. |
| • | Additional Tier 1 Capital: Additional Tier 1 Capital includes capital, capital surplus, etc. related to the issuance of capital securities of a permanent nature that meets the conditional capital securities requirements. |
| • | Tier 2 Capital: Tier 2 Capital means capital that can compensate for losses of the Group upon liquidation, including (a) the amount of subordinated bonds with maturity of not less than 5 years that meet the conditional capital securities requirements, and (b) the allowances for credit losses accumulated on the loans which are classified as normal or precautionary in accordance with Regulations on Supervision of Financial Holding Companies, and others. |
December 31, 2021 | December 31, 2022 | |||||||
(In millions of Korean won) | ||||||||
| Total Capital: | ₩ | 45,882,765 | ₩ | 48,969,952 | ||||
| Tier 1 Capital | 42,305,442 | 45,032,020 | ||||||
| Common Equity Tier 1 Capital | 39,144,259 | 40,103,660 | ||||||
| Additional Tier 1 Capital | 3,161,183 | 4,928,360 | ||||||
| Tier 2 Capital | 3,577,323 | 3,937,932 | ||||||
| Risk-Weighted Assets: | 290,913,570 | 302,967,993 | ||||||
| Total Capital ratio (%): | 15.77 | 16.16 | ||||||
| Tier 1 Capital ratio (%) | 14.54 | 14.86 | ||||||
| Common Equity Tier 1 Capital ratio (%) | 13.46 | 13.24 | ||||||
Banking business | Corporate banking | Loans, deposit products, and other related financial services to large, small and medium-sized enterprises and SOHOs | ||
Retail banking | Loans, deposit products, and other related financial services to individuals and households | |||
Other banking services | Trading activities in securities and derivatives, funding, and other supporting activities | |||
Securities business | Investment banking, brokerage services, and other supporting activities | |||
Non-life insurance business | Non-life insurance and other supporting activities | |||
Credit card business | Credit sale, cash advance, card loan, and other supporting activities | |||
Life insurance business | Life insurance and other supporting activities | |||
2021 | ||||||||||||||||||||||||||||||||||||||||||||
Banking business | ||||||||||||||||||||||||||||||||||||||||||||
Corporate banking | Retail banking | Other banking services | Sub-total | Securities | Non-life insurance | Credit card | Life insurance | Others | Consolidation adjustments | Total | ||||||||||||||||||||||||||||||||||
(In millions of Korean won) | ||||||||||||||||||||||||||||||||||||||||||||
Net operating revenues (expenses) from external customers | ₩ | 3,589,404 | ₩ | 2,958,198 | ₩ | 1,585,192 | ₩ | 8,132,794 | ₩ | 1,675,977 | ₩ | 1,285,593 | ₩ | 1,773,989 | ₩ | 631,065 | ₩ | 984,185 | ₩ | — | ₩ | 14,483,603 | ||||||||||||||||||||||
| Intersegment net operating revenues (expenses) | 34,771 | — | 271,887 | 306,658 | 11,002 | (53,017 | ) | (158,545 | ) | (7,273 | ) | 98,215 | (197,040 | ) | — | |||||||||||||||||||||||||||||
| 3,624,175 | 2,958,198 | 1,857,079 | 8,439,452 | 1,686,979 | 1,232,576 | 1,615,444 | 623,792 | 1,082,400 | (197,040 | ) | 14,483,603 | |||||||||||||||||||||||||||||||||
Net interest income | 3,802,477 | 3,541,539 | 384,460 | 7,728,476 | 556,386 | 625,228 | 1,390,753 | 519,609 | 411,874 | (2,754 | ) | 11,229,572 | ||||||||||||||||||||||||||||||||
Interest income | 5,317,800 | 4,437,930 | 918,631 | 10,674,361 | 824,775 | 634,816 | 1,768,215 | 523,882 | 816,515 | (31,686 | ) | 15,210,878 | ||||||||||||||||||||||||||||||||
Interest expense | (1,515,323 | ) | (896,391 | ) | (534,171 | ) | (2,945,885 | ) | (268,389 | ) | (9,588 | ) | (377,462 | ) | (4,273 | ) | (404,641 | ) | 28,932 | (3,981,306 | ) | |||||||||||||||||||||||
Net fee and commission income (expenses) | 390,619 | 392,060 | 405,202 | 1,187,881 | 1,014,801 | (173,348 | ) | 546,022 | (26,895 | ) | 1,068,648 | 8,474 | 3,625,583 | |||||||||||||||||||||||||||||||
Fee and commission income | 534,749 | 535,530 | 516,665 | 1,586,944 | 1,201,670 | 10,418 | 1,644,806 | 433 | 1,187,661 | (308,326 | ) | 5,323,606 | ||||||||||||||||||||||||||||||||
Fee and commission expense | (144,130 | ) | (143,470 | ) | (111,463 | ) | (399,063 | ) | (186,869 | ) | (183,766 | ) | (1,098,784 | ) | (27,328 | ) | (119,013 | ) | 316,800 | (1,698,023 | ) | |||||||||||||||||||||||
Net insurance income | — | — | — | — | — | 493,271 | 11,589 | 56,871 | — | (5,020 | ) | 556,711 | ||||||||||||||||||||||||||||||||
Insurance income | — | — | — | — | — | 12,722,178 | 21,711 | 3,406,145 | — | (42,176 | ) | 16,107,858 | ||||||||||||||||||||||||||||||||
Insurance expense | — | — | — | — | — | (12,228,907 | ) | (10,122 | ) | (3,349,274 | ) | — | 37,156 | (15,551,147 | ) | |||||||||||||||||||||||||||||
Net gains (losess) on financial instruments at fair value through profit or loss | 29,407 | — | 313,427 | 342,834 | 123,183 | 369,864 | 3,431 | 137,343 | 184,467 | (165,818 | ) | 995,304 | ||||||||||||||||||||||||||||||||
Net other operating income (expenses) | (598,328 | ) | (975,401 | ) | 753,990 | (819,739 | ) | (7,391 | ) | (82,439 | ) | (336,351 | ) | (63,136 | ) | (582,589 | ) | (31,922 | ) | (1,923,567 | ) | |||||||||||||||||||||||
General and administrative expenses | ₩ | (1,831,948 | ) | ₩ | (2,036,855 | ) | ₩ | (533,928 | ) | ₩ | (4,402,731 | ) | ₩ | (855,142 | ) | ₩ | (833,597 | ) | ₩ | (577,734 | ) | ₩ | (203,198 | ) | ₩ | (438,170 | ) | ₩ | 109,719 | ₩ | (7,200,853 | ) | ||||||||||||
Operating income (expenses) before provision for credit losses | 1,792,227 | 921,343 | 1,323,151 | 4,036,721 | 831,837 | 398,979 | 1,037,710 | 420,594 | 644,230 | (87,321 | ) | 7,282,750 | ||||||||||||||||||||||||||||||||
Reversal (provision) of credit losses | (392,956 | ) | (125,876 | ) | (3,896 | ) | (522,728 | ) | (18,438 | ) | (5,476 | ) | (465,342 | ) | 1,677 | (175,568 | ) | 742 | (1,185,133 | ) | ||||||||||||||||||||||||
Net operating income (expenses) | 1,399,271 | 795,467 | 1,319,255 | 3,513,993 | 813,399 | 393,503 | 572,368 | 422,271 | 468,662 | (86,579 | ) | 6,097,617 | ||||||||||||||||||||||||||||||||
Share of profit (loss) of associates and joint ventures | — | — | 57,156 | 57,156 | 14,484 | (143 | ) | 785 | — | 9,411 | 11,833 | 93,526 | ||||||||||||||||||||||||||||||||
Net other non-operating income (expenses) | (9,237 | ) | — | (70,368 | ) | (79,605 | ) | (18,307 | ) | 17,446 | (7,378 | ) | (158 | ) | 2,408 | (23,943 | ) | (109,537 | ) | |||||||||||||||||||||||||
Segment profit (loss) before income tax expense | 1,390,034 | 795,467 | 1,306,043 | 3,491,544 | 809,576 | 410,806 | 565,775 | 422,113 | 480,481 | (98,689 | ) | 6,081,606 | ||||||||||||||||||||||||||||||||
Income tax benefit (expense) | (368,577 | ) | (218,753 | ) | (366,185 | ) | (953,515 | ) | (215,424 | ) | (108,715 | ) | (144,611 | ) | (132,510 | ) | (148,044 | ) | 5,594 | (1,697,225 | ) | |||||||||||||||||||||||
Profit (loss) for the year | ₩ | 1,021,457 | ₩ | 576,714 | ₩ | 939,858 | ₩ | 2,538,029 | ₩ | 594,152 | ₩ | 302,091 | ₩ | 421,164 | ₩ | 289,603 | ₩ | 332,437 | ₩ | (93,095 | ) | ₩ | 4,384,381 | |||||||||||||||||||||
Profit (loss) attributable to shareholders of the Parent Company | 1,022,699 | 576,714 | 991,351 | 2,590,764 | 594,301 | 301,836 | 418,898 | 289,603 | 330,563 | (116,422 | ) | 4,409,543 | ||||||||||||||||||||||||||||||||
Profit (loss) attributable to non-controlling interests | (1,242 | ) | — | (51,493 | ) | (52,735 | ) | (149 | ) | 255 | 2,266 | — | 1,874 | 23,327 | (25,162 | ) | ||||||||||||||||||||||||||||
| Total assets* | 189,310,448 | 169,513,344 | 124,741,106 | 483,564,898 | 55,493,984 | 41,472,227 | 27,349,561 | 36,921,678 | 52,929,567 | (33,836,081 | ) | 663,895,834 | ||||||||||||||||||||||||||||||||
| Total liabilities* | 197,834,530 | 180,815,013 | 72,026,442 | 450,675,985 | 50,008,422 | 37,328,955 | 22,793,919 | 34,166,882 | 23,191,051 | (2,563,300 | ) | 615,601,914 | ||||||||||||||||||||||||||||||||
2022 | ||||||||||||||||||||||||||||||||||||||||||||
Banking business | Securities | Non-life insurance | Credit card | Life insurance | Others | Consolidation adjustments | Total | |||||||||||||||||||||||||||||||||||||
Corporate banking | Retail banking | Other banking services | Sub-total | |||||||||||||||||||||||||||||||||||||||||
(In millions of Korean won) | ||||||||||||||||||||||||||||||||||||||||||||
| Net operating revenues from external customers | ₩ | 4,981,702 | ₩ | 4,472,888 | ₩ | (188,422 | ) | ₩ | 9,266,168 | ₩ | 1,126,925 | ₩ | 1,423,684 | ₩ | 1,781,135 | ₩ | 501,983 | ₩ | 912,750 | ₩ | — | ₩ | 15,012,645 | |||||||||||||||||||||
| Intersegment net operating revenues (expenses) | 16,366 | — | 371,576 | 387,942 | (38,909 | ) | (29,335 | ) | (150,464 | ) | (29,827 | ) | 205,463 | (344,870 | ) | — | ||||||||||||||||||||||||||||
| 4,998,068 | 4,472,888 | 183,154 | 9,654,110 | 1,088,016 | 1,394,349 | 1,630,671 | 472,156 | 1,118,213 | (344,870 | ) | 15,012,645 | |||||||||||||||||||||||||||||||||
Net interest income | 4,720,718 | 3,936,872 | 633,431 | 9,291,021 | 538,275 | 693,193 | 1,474,209 | 555,188 | 559,468 | 1,580 | 13,112,934 | |||||||||||||||||||||||||||||||||
Interest income | 7,831,383 | 5,763,852 | 1,763,466 | 15,358,701 | 1,156,586 | 717,558 | 1,983,828 | 566,271 | 1,064,529 | (58,955 | ) | 20,788,518 | ||||||||||||||||||||||||||||||||
Interest expense | (3,110,665 | ) | (1,826,980 | ) | (1,130,035 | ) | (6,067,680 | ) | (618,311 | ) | (24,365 | ) | (509,619 | ) | (11,083 | ) | (505,061 | ) | 60,535 | (7,675,584 | ) | |||||||||||||||||||||||
Net fee and commission income (expenses) | 385,884 | 261,350 | 449,374 | 1,096,608 | 784,748 | (190,354 | ) | 519,501 | (39,059 | ) | 1,145,309 | 4,879 | 3,321,632 | |||||||||||||||||||||||||||||||
Fee and commission income | 546,634 | 415,858 | 567,666 | 1,530,158 | 979,215 | 17,889 | 1,617,446 | 508 | 1,301,765 | (325,461 | ) | 5,121,520 | ||||||||||||||||||||||||||||||||
Fee and commission expense | (160,750 | ) | (154,508 | ) | (118,292 | ) | (433,550 | ) | (194,467 | ) | (208,243 | ) | (1,097,945 | ) | (39,567 | ) | (156,456 | ) | 330,340 | (1,799,888 | ) | |||||||||||||||||||||||
Net insurance income | — | — | — | — | — | 655,452 | 10,593 | 39,160 | — | (8,692 | ) | 696,513 | ||||||||||||||||||||||||||||||||
Insurance income | — | — | — | — | — | 13,424,848 | 19,702 | 3,736,166 | — | (43,874 | ) | 17,136,842 | ||||||||||||||||||||||||||||||||
Insurance expense | — | — | — | — | — | (12,769,396 | ) | (9,109 | ) | (3,697,006 | ) | — | 35,182 | (16,440,329 | ) | |||||||||||||||||||||||||||||
Net gains on financial instruments at fair value through profit or loss | 73,680 | — | 136,901 | 210,581 | (210,589 | ) | 339,698 | 1,724 | 66,865 | 21,844 | (182,766 | ) | 247,357 | |||||||||||||||||||||||||||||||
Net other operating income (expenses) | (182,214 | ) | 274,666 | (1,036,552 | ) | (944,100 | ) | (24,418 | ) | (103,640 | ) | (375,356 | ) | (149,998 | ) | (608,408 | ) | (159,871 | ) | (2,365,791 | ) | |||||||||||||||||||||||
General and administrative expenses | ₩ | (1,972,147 | ) | ₩ | (2,092,770 | ) | ₩ | (633,034 | ) | ₩ | (4,697,951 | ) | ₩ | (822,409 | ) | ₩ | (849,452 | ) | ₩ | (597,158 | ) | ₩ | (224,968 | ) | ₩ | (466,510 | ) | ₩ | 120,646 | ₩ | (7,537,802 | ) | ||||||||||||
| Operating income before provision for credit losses | 3,025,921 | 2,380,118 | (449,880 | ) | 4,956,159 | 265,607 | 544,897 | 1,033,513 | 247,188 | 651,703 | (224,224 | ) | 7,474,843 | |||||||||||||||||||||||||||||||
| Reversal (provision) of credit losses | (778,260 | ) | (281,868 | ) | (61,042 | ) | (1,121,170 | ) | (28,425 | ) | (6,066 | ) | (500,453 | ) | 1,264 | (178,172 | ) | (2,966 | ) | (1,835,988 | ) | |||||||||||||||||||||||
Net operating income | 2,247,661 | 2,098,250 | (510,922 | ) | 3,834,989 | 237,182 | 538,831 | 533,060 | 248,452 | 473,531 | (227,190 | ) | 5,638,855 | |||||||||||||||||||||||||||||||
| Share of profit (loss) of associates and joint ventures | — | — | 12,666 | 12,666 | 3,039 | 1,104 | 1,583 | — | (7,966 | ) | (39,184 | ) | (28,758 | ) | ||||||||||||||||||||||||||||||
Net other non-operating income (expenses) | (13,317 | ) | — | (24,548 | ) | (37,865 | ) | 12,994 | 190,263 | (7,197 | ) | (379 | ) | (4,717 | ) | 32,430 | 185,529 | |||||||||||||||||||||||||||
| Segment profit before income tax expense | 2,234,344 | 2,098,250 | (522,804 | ) | 3,809,790 | 253,215 | 730,198 | 527,446 | 248,073 | 460,848 | (233,944 | ) | 5,795,626 | |||||||||||||||||||||||||||||||
Income tax expense | (732,211 | ) | (522,478 | ) | 173,206 | (1,081,483 | ) | (64,300 | ) | (172,169 | ) | (144,443 | ) | (61,810 | ) | (113,458 | ) | 15,276 | (1,622,387 | ) | ||||||||||||||||||||||||
Profit for the year | ₩ | 1,502,133 | ₩ | 1,575,772 | ₩ | (349,598 | ) | ₩ | 2,728,307 | ₩ | 188,915 | ₩ | 558,029 | ₩ | 383,003 | ₩ | 186,263 | ₩ | 347,390 | ₩ | (218,668 | ) | ₩ | 4,173,239 | ||||||||||||||||||||
| Profit attributable to shareholders of the Parent Company | 1,505,240 | 1,575,772 | (84,997 | ) | 2,996,015 | 187,784 | 557,680 | 378,592 | 186,263 | 343,859 | (255,363 | ) | 4,394,830 | |||||||||||||||||||||||||||||||
Profit (loss) attributable to non-controlling interests | (3,107 | ) | — | (264,601 | ) | (267,708 | ) | 1,131 | 349 | 4,411 | — | 3,531 | 36,695 | (221,591 | ) | |||||||||||||||||||||||||||||
| Total assets* | 211,989,036 | 165,273,848 | 140,506,628 | 517,769,512 | 53,824,245 | 42,736,747 | 29,721,017 | 34,846,987 | 60,219,661 | (37,947,321 | ) | 701,170,848 | ||||||||||||||||||||||||||||||||
| Total liabilities* | 205,382,625 | 191,786,626 | 86,877,002 | 484,046,253 | 47,946,933 | 39,397,168 | 24,998,214 | 33,097,892 | 25,973,896 | (3,932,422 | ) | 651,527,934 | ||||||||||||||||||||||||||||||||
| * | Assets and liabilities of the reporting segments are amounts before intersegment transactions. |
2020 | 2021 | 2022 | ||||||||||
(In millions of Korean won) | ||||||||||||
| Banking service | ₩ | 7,550,348 | ₩ | 8,132,794 | ₩ | 9,266,168 | ||||||
| Securities service | 1,448,409 | 1,675,977 | 1,126,925 | |||||||||
Non-life insurance service | 1,027,269 | 1,285,593 | 1,423,684 | |||||||||
| Credit card service | 1,538,230 | 1,773,989 | 1,781,135 | |||||||||
| Life insurance service | 237,416 | 631,065 | 501,983 | |||||||||
| Others | 690,970 | 984,185 | 912,750 | |||||||||
| ₩ | 12,492,642 | ₩ | 14,483,603 | ₩ | 15,012,645 | |||||||
Net operating revenues from external customers | Major non-current assets | |||||||||||||||||||
2020 | 2021 | 2022 | December 31, 2021 | December 31, 2022 | ||||||||||||||||
(In millions of Korean won) | ||||||||||||||||||||
| Domestic | ₩ | 11,891,540 | ₩ | 13,525,769 | ₩ | 13,778,598 | ₩ | 9,853,970 | ₩ | 9,699,637 | ||||||||||
| United States | 114,044 | 112,388 | 112,743 | 45,530 | 53,214 | |||||||||||||||
| New Zealand | 3,554 | 12,857 | 12,378 | 1,932 | 1,382 | |||||||||||||||
| China | 84,821 | 127,939 | 172,547 | 21,416 | 19,715 | |||||||||||||||
| Cambodia | 250,426 | 410,482 | 546,258 | 35,668 | 46,060 | |||||||||||||||
| United Kingdom | 28,681 | 29,764 | 31,685 | 86,361 | 5,808 | |||||||||||||||
| Indonesia | 44,392 | 166,683 | 234,878 | 437,088 | 422,024 | |||||||||||||||
| Others | 75,184 | 97,721 | 123,558 | 20,446 | 536,794 | |||||||||||||||
Consolidation adjustments | — | — | — | 518,788 | 555,572 | |||||||||||||||
| ₩ | 12,492,642 | ₩ | 14,483,603 | ₩ | 15,012,645 | ₩ | 11,021,199 | ₩ | 11,340,206 | |||||||||||
December 31, 2021 | ||||||||
Carrying amount | Fair value | |||||||
(In millions of Korean won) | ||||||||
Financial assets | ||||||||
| Cash and due from financial institutions | ₩ | 31,009,374 | ₩ | 31,081,231 | ||||
| Financial assets at fair value through profit or loss: | 66,005,815 | 66,005,815 | ||||||
| Due from financial institutions | 200,742 | 200,742 | ||||||
| Debt securities | 63,002,692 | 63,002,692 | ||||||
| Equity securities | 2,419,463 | 2,419,463 | ||||||
| Loans | 269,296 | 269,296 | ||||||
| Others | 113,622 | 113,622 | ||||||
| Derivatives held for trading | 3,532,542 | 3,532,542 | ||||||
| Derivatives held for hedging | 188,828 | 188,828 | ||||||
| Loans measured at amortized cost | 417,900,273 | 417,775,260 | ||||||
| Securities measured at amortized cost | 44,471,628 | 44,392,419 | ||||||
| Financial assets at fair value through other comprehensive income: | 60,376,243 | 60,376,243 | ||||||
| Debt securities | 56,259,511 | 56,259,511 | ||||||
| Equity securities | 3,803,128 | 3,803,128 | ||||||
| Loans | 313,604 | 313,604 | ||||||
| Other financial assets | 10,755,350 | 10,755,350 | ||||||
| ₩ | 634,240,053 | ₩ | 634,107,688 | |||||
Financial liabilities | ||||||||
| Financial liabilities at fair value through profit or loss | ₩ | 2,939,584 | ₩ | 2,939,584 | ||||
| Financial liabilities designated at fair value through profit or loss | 9,149,396 | 9,149,396 | ||||||
| Derivatives held for trading | 3,509,789 | 3,509,789 | ||||||
| Derivatives held for hedging | 172,469 | 172,469 | ||||||
| Deposits | 372,023,918 | 371,936,631 | ||||||
| Borrowings | 56,912,374 | 56,805,938 | ||||||
| Debentures | 67,430,188 | 67,288,409 | ||||||
| Other financial liabilities | 29,494,402 | 29,494,402 | ||||||
| ₩ | 541,632,120 | ₩ | 541,296,618 | |||||
December 31, 2022 | ||||||||
Carrying amount | Fair value | |||||||
(In millions of Korean won) | ||||||||
Financial assets | ||||||||
| Cash and due from financial institutions | ₩ | 32,063,421 | ₩ | 31,992,401 | ||||
| Financial assets at fair value through profit or loss: | 64,935,344 | 64,935,344 | ||||||
| Due from financial institutions | 69,469 | 69,469 | ||||||
| Debt securities | 61,787,727 | 61,787,727 | ||||||
| Equity securities | 2,494,580 | 2,494,580 | ||||||
| Loans | 493,562 | 493,562 | ||||||
| Others | 90,006 | 90,006 | ||||||
| Derivatives held for trading | 8,984,171 | 8,984,171 | ||||||
| Derivatives held for hedging | 461,963 | 461,963 | ||||||
| Loans measured at amortized cost | 436,530,502 | 433,885,302 | ||||||
| Securities measured at amortized cost | 58,288,734 | 54,291,992 | ||||||
| Financial assets at fair value through other comprehensive income: | 58,299,841 | 58,299,841 | ||||||
| Debt securities | 55,610,319 | 55,610,319 | ||||||
| Equity securities | 2,326,378 | 2,326,378 | ||||||
| Loans | 363,144 | 363,144 | ||||||
| Other financial assets | 11,209,350 | 11,209,350 | ||||||
| ₩ | 670,773,326 | ₩ | 664,060,364 | |||||
Financial liabilities | ||||||||
| Financial liabilities at fair value through profit or loss | ₩ | 2,193,210 | ₩ | 2,193,210 | ||||
| Financial liabilities designated at fair value through profit or loss | 10,078,394 | 10,078,394 | ||||||
| Derivatives held for trading | 9,209,537 | 9,209,537 | ||||||
| Derivatives held for hedging | 297,172 | 297,172 | ||||||
| Deposits | 388,888,452 | 388,417,827 | ||||||
| Borrowings | 71,717,366 | 71,187,130 | ||||||
| Debentures | 68,698,203 | 66,432,790 | ||||||
| Other financial liabilities | 26,705,247 | 26,705,247 | ||||||
| ₩ | 577,787,581 | ₩ | 574,521,307 | |||||
Cash and due from financial institutions | Fair value of cash is same as carrying amount. Carrying amount of demand deposit and settlement deposit is a reasonable approximation of fair value because these financial instruments do not have a fixed maturity and are receivable on demand. Fair value of general deposit is measured using Discounted Cash Flow (“DCF”) Model. | |
Securities | Fair value of securities and others that are traded in an active market is determined using the quoted prices. If there is no quoted price, fair value is determined using external professional valuation institutions. The institutions use one or more valuation techniques that are deemed appropriate considering the characteristics of the financial instruments among DCF Model, Free Cash Flow to Equity Model, Comparable Company Analysis, Dividend Discount Model, Risk Adjusted Discount Rate Method, and Net Asset Value Method. | |
Loans measured at amortized cost | Fair value of loans is determined using DCF Model discounting the expected cash flows, which are contractual cash flows adjusted by the expected prepayment rate, at an appropriate discount rate. | |
Derivatives and financial instruments at fair value through profit or loss | Fair value of exchange traded derivatives is determined using quoted price in an active market, and fair value of OTC derivatives is determined using valuation techniques. The Group uses internally developed valuation models that are widely used by market participants to determine fair value of plain vanilla OTC derivatives including options, interest rate swaps, and currency swaps, based on observable market parameters. However, some complex financial instruments are valued using appropriate models developed from generally accepted market valuation models including Finite Difference Method (“FDM”), MonteCarlo Simulation, Black-Scholes Model, Hull and White Model, Closed Form, and Tree Model or valuation results from independent external professional valuation institutions. | |
Deposits | Carrying amount of demand deposits is a reasonable approximation of fair value because they do not have a fixed maturity and are payable on demand. Fair value of time deposits is determined using DCF Model discounting the expected cash flows, which are contractual cash flows adjusted by the expected prepayment rate, at an appropriate discount rate. | |
Borrowings | Carrying amount of overdrafts in foreign currency is a reasonable approximation of fair value because they do not have a fixed maturity and are payable on demand. Fair value of other borrowings is determined using DCF Model. | |
Debentures | Fair value is determined using valuation results of external professional valuation institutions, which are calculated using market inputs. | |
Other financial assets and other financial liabilities | Carrying amount is a reasonable approximation of fair value because other financial assets and other financial liabilities are temporary accounts used for other various transactions and their maturities are relatively short or not defined. | |
December 31, 2021 | ||||||||||||||||
Fair value hierarchy | Total | |||||||||||||||
Level 1 | Level 2 | Level 3 | ||||||||||||||
(In millions of Korean won) | ||||||||||||||||
Financial assets | ||||||||||||||||
| Financial assets at fair value through profit or loss: | ₩ | 13,108,985 | ₩ | 40,205,783 | ₩ | 12,691,047 | ₩ | 66,005,815 | ||||||||
| Due from financial institutions | — | 128,726 | 72,016 | 200,742 | ||||||||||||
| Debt securities | 12,146,181 | 39,300,923 | 11,555,588 | 63,002,692 | ||||||||||||
| Equity securities | 849,182 | 600,768 | 969,513 | 2,419,463 | ||||||||||||
| Loans | — | 175,366 | 93,930 | 269,296 | ||||||||||||
| Others | 113,622 | — | — | 113,622 | ||||||||||||
| Derivatives held for trading | 81,408 | 3,241,129 | 210,005 | 3,532,542 | ||||||||||||
| Derivatives held for hedging | — | 188,828 | — | 188,828 | ||||||||||||
| Financial assets at fair value through other comprehensive income: | 20,027,158 | 38,900,548 | 1,448,537 | 60,376,243 | ||||||||||||
| Debt securities | 17,706,456 | 38,553,055 | — | 56,259,511 | ||||||||||||
| Equity securities | 2,320,702 | 47,859 | 1,434,567 | 3,803,128 | ||||||||||||
| Loans | — | 299,634 | 13,970 | 313,604 | ||||||||||||
| ₩ | 33,217,551 | ₩ | 82,536,288 | ₩ | 14,349,589 | ₩ | 130,103,428 | |||||||||
Financial liabilities | ||||||||||||||||
| Financial liabilities at fair value through profit or loss | ₩ | 2,939,584 | ₩ | — | ₩ | — | ₩ | 2,939,584 | ||||||||
| Financial liabilities designated at fair value through profit or loss | 36,938 | 1,294,944 | 7,817,514 | 9,149,396 | ||||||||||||
| Derivatives held for trading | 211,132 | 3,124,057 | 174,600 | 3,509,789 | ||||||||||||
| Derivatives held for hedging | — | 172,469 | — | 172,469 | ||||||||||||
| ₩ | 3,187,654 | ₩ | 4,591,470 | ₩ | 7,992,114 | ₩ | 15,771,238 | |||||||||
December 31, 2022 | ||||||||||||||||
Fair value hierarchy | Total | |||||||||||||||
Level 1 | Level 2 | Level 3* | ||||||||||||||
(In millions of Korean won) | ||||||||||||||||
Financial assets | ||||||||||||||||
| Financial assets at fair value through profit or loss: | ₩ | 15,494,273 | ₩ | 33,958,689 | ₩ | 15,482,382 | ₩ | 64,935,344 | ||||||||
| Due from financial institutions | — | 24,444 | 45,025 | 69,469 | ||||||||||||
| Debt securities | 14,550,359 | 33,175,465 | 14,061,903 | 61,787,727 | ||||||||||||
| Equity securities | 853,908 | 414,291 | 1,226,381 | 2,494,580 | ||||||||||||
| Loans | — | 344,489 | 149,073 | 493,562 | ||||||||||||
| Others | 90,006 | — | — | 90,006 | ||||||||||||
| Derivatives held for trading | 182,019 | 8,678,896 | 123,256 | 8,984,171 | ||||||||||||
| Derivatives held for hedging | — | 461,963 | — | 461,963 | ||||||||||||
| Financial assets at fair value through other comprehensive income: | 19,540,964 | 37,281,814 | 1,477,063 | 58,299,841 | ||||||||||||
| Debt securities | 18,928,038 | 36,682,281 | — | 55,610,319 | ||||||||||||
| Equity securities | 612,926 | 236,389 | 1,477,063 | 2,326,378 | ||||||||||||
| Loans | — | 363,144 | — | 363,144 | ||||||||||||
| ₩ | 35,217,256 | ₩ | 80,381,362 | ₩ | 17,082,701 | ₩ | 132,681,319 | |||||||||
Financial liabilities | ||||||||||||||||
| Financial liabilities at fair value through profit or loss | ₩ | 2,193,210 | ₩ | — | ₩ | — | ₩ | 2,193,210 | ||||||||
| Financial liabilities designated at fair value through profit or loss | 35,687 | 1,811,404 | 8,231,303 | 10,078,394 | ||||||||||||
| Derivatives held for trading | 442,042 | 7,984,424 | 783,071 | 9,209,537 | ||||||||||||
| Derivatives held for hedging | — | 297,172 | — | 297,172 | ||||||||||||
| ₩ | 2,670,939 | ₩ | 10,093,000 | ₩ | 9,014,374 | ₩ | 21,778,313 | |||||||||
| * | Includes KB Securities Co., Ltd.’s OTC derivatives consisting of ₩ 404,334 million of financial assets at fair value through profit or loss (debt instruments), ₩ 8,241,509 million of financial liabilities designated at fair value through profit or loss, ₩ 120,775 million of derivative financial assets, and ₩ 777,542 million of derivative financial liabilities. |
December 31, 2021 | ||||||||
Fair value | Valuation techniques | Inputs | ||||||
(In millions of Korean won) | ||||||||
Financial assets | ||||||||
| Financial assets at fair value through profit or loss: | ₩ | 40,205,783 | ||||||
| Due from financial institutions | 128,726 | DCF Model, Hull and White Model | Projected cash flow, Discount rate, Volatility, Correlation coefficient | |||||
| Debt securities | 39,300,923 | DCF Model, Hull and White Model, Closed Form, MonteCarlo Simulation, Black-Scholes Model, Net Asset Value Method, Binomial Model, and others | Projected cash flow, Fair value of underlying asset, Dividend yield, Price of underlying asset, Interest rate, Discount rate, Volatility, Correlation coefficient, and others | |||||
| Equity securities | 600,768 | DCF Model | Interest rate, Discount rate, and others | |||||
| Loans | 175,366 | DCF Model | Interest rate, Discount rate, and others | |||||
| Derivatives held for trading | 3,241,129 | DCF Model, Closed Form, FDM, MonteCarlo Simulation, Black-Scholes Model, Hull and White Model, Binomial Model, and others | Interest rate, Price of underlying asset, Foreign exchange rate, Credit spread, Discount rate, Volatility, and others | |||||
| Derivatives held for hedging | 188,828 | DCF Model, Closed Form, FDM | Projected cash flow, Discount rate, Forward foreign exchange rate, Volatility, Foreign exchange rate, and others | |||||
| Financial assets at fair value through other comprehensive income: | 38,900,548 | |||||||
| Debt securities | 38,553,055 | DCF Model, Market Value Approach, Option Model | Underlying asset index, Interest rate, Discount rate, and others | |||||
| Equity securities | 47,859 | DCF Model | Discount rate | |||||
| Loans | 299,634 | DCF Model | Discount rate | |||||
| ₩ | 82,536,288 | |||||||
Financial liabilities | ||||||||
| Financial liabilities designated at fair value through profit or loss | ₩ | 1,294,944 | DCF Model, Closed Form, FDM, MonteCarlo Simulation, Black-Scholes Model, Hull and White Model, Binomial Model | Price of underlying asset, Interest rate, Dividend yield, Volatility, Discount rate | ||||
| Derivatives held for trading | 3,124,057 | DCF Model, Closed Form, FDM, MonteCarlo Simulation, Black-Scholes Model, Hull and White Model, Binomial Model, and others | Interest rate, Price of underlying asset, Foreign exchange rate, Credit spread, Discount rate, Volatility, and others | |||||
| Derivatives held for hedging | 172,469 | DCF Model, Closed Form, FDM | Projected cash flow, Discount rate, Forward foreign exchange rate, Volatility, Foreign exchange rate, and others | |||||
| ₩ | 4,591,470 | |||||||
December 31, 2022 | ||||||||
Fair value | Valuation techniques | Inputs | ||||||
(In millions of Korean won) | ||||||||
Financial assets | ||||||||
| Financial assets at fair value through profit or loss: | ₩ | 33,958,689 | ||||||
| Due from financial institutions | 24,444 | DCF Model, Hull-white Model | Projected cash flow, Discount rate, Volatility, Correlation coefficient | |||||
| Debt securities | 33,175,465 | DCF Model, Closed Form, MonteCarlo Simulation, Black-Scholes Model, Hull-white Model, Net Asset Value Method, Binomial Model, and others | Projected cash flow, Fair value of underlying asset, Dividend yield, Price of underlying asset, Interest rate, Discount rate, Volatility, Correlation coefficient, and others | |||||
| Equity securities | 414,291 | DCF Model | Interest rate, Discount rate, and others | |||||
| Loans | 344,489 | DCF Model | Interest rate, Discount rate, and others | |||||
| Derivatives held for trading | 8,678,896 | DCF Model, Closed Form, FDM, MonteCarlo Simulation, Black-Scholes Model, Hull-white Model, Binomial Model, Option Model, and others | Price of underlying asset, Underlying asset index, Interest rate, Dividend yield, Volatility, Foreign exchange rate, Discount rate, and others | |||||
| Derivatives held for hedging | 461,963 | DCF Model, Closed Form, FDM | Projected cash flow, Discount rate, Forward foreign exchange rate, Volatility, Foreign exchange rate, CRS interest rate, and others | |||||
| Financial assets at fair value through other comprehensive income: | 37,281,814 | |||||||
| Debt securities | 36,682,281 | DCF Model, Option Model | Underlying asset index, Discount rate, and others | |||||
| Equity securities | 236,389 | DCF Model | Discount rate | |||||
| Loans | 363,144 | DCF Model | Discount rate | |||||
| ₩ | 80,381,362 | |||||||
Financial liabilities | ||||||||
| Financial liabilities designated at fair value through profit or loss | ₩ | 1,811,404 | DCF Model, Closed Form, MonteCarlo Simulation, Black-Scholes Model, Hull-white Model, Binomial Model, Net Asset Value Method | Price of underlying asset, Interest rate, Dividend yield, Volatility, Discount rate, Foreign exchange rate | ||||
| Derivatives held for trading | 7,984,424 | DCF Model, Closed Form, MonteCarlo Simulation, Black-Scholes Model, Hull-white Model, Binomial Model, and others | Interest rate, Price of underlying asset, Foreign exchange rate, Credit spread, Discount rate, Volatility, and others | |||||
| Derivatives held for hedging | 297,172 | DCF Model, Closed Form, FDM | Projected cash flow, Discount rate, Forward foreign exchange rate, Volatility, Foreign exchange rate, Risk free interest rate, and others | |||||
| ₩ | 10,093,000 | |||||||
December 31, 2021 | ||||||||||||||||
Fair value hierarchy | Total | |||||||||||||||
Level 1 | Level 2 | Level 3 | ||||||||||||||
(In millions of Korean won) | ||||||||||||||||
Financial assets | ||||||||||||||||
Cash and due from financial institutions 1 | ₩ | 3,330,920 | ₩ | 25,791,556 | ₩ | 1,958,755 | ₩ | 31,081,231 | ||||||||
| Loans measured at amortized cost | — | 260,101 | 417,515,159 | 417,775,260 | ||||||||||||
Securities measured at amortized cost 2 | 18,263,895 | 26,125,391 | 3,133 | 44,392,419 | ||||||||||||
Other financial assets 2 | — | — | 10,755,350 | 10,755,350 | ||||||||||||
| ₩ | 21,594,815 | ₩ | 52,177,048 | ₩ | 430,232,397 | ₩ | 504,004,260 | |||||||||
Financial liabilities | ||||||||||||||||
Deposits 1 | ₩ | — | ₩ | 204,299,174 | ₩ | 167,637,457 | ₩ | 371,936,631 | ||||||||
Borrowings 3 | — | 3,137,427 | 53,668,511 | 56,805,938 | ||||||||||||
| Debentures | — | 60,824,743 | 6,463,666 | 67,288,409 | ||||||||||||
Other financial liabilities 2 | — | — | 29,494,402 | 29,494,402 | ||||||||||||
| ₩ | — | ₩ | 268,261,344 | ₩ | 257,264,036 | ₩ | 525,525,380 | |||||||||
December 31, 2022 | ||||||||||||||||
Fair value hierarchy | Total | |||||||||||||||
Level 1 | Level 2 | Level 3 | ||||||||||||||
(In millions of Korean won) | ||||||||||||||||
Financial assets | ||||||||||||||||
Cash and due from financial institutions 1 | ₩ | 2,517,470 | ₩ | 26,734,157 | ₩ | 2,740,774 | ₩ | 31,992,401 | ||||||||
| Loans measured at amortized cost | — | 190,458 | 433,694,844 | 433,885,302 | ||||||||||||
Securities measured at amortized cost 2 | 20,626,701 | 33,646,001 | 19,290 | 54,291,992 | ||||||||||||
Other financial assets 2 | — | — | 11,209,350 | 11,209,350 | ||||||||||||
| ₩ | 23,144,171 | ₩ | 60,570,616 | ₩ | 447,664,258 | ₩ | 531,379,045 | |||||||||
Financial liabilities | ||||||||||||||||
Deposits 1 | ₩ | — | ₩ | 168,864,349 | ₩ | 219,553,478 | ₩ | 388,417,827 | ||||||||
Borrowings 3 | — | 6,088,123 | 65,099,007 | 71,187,130 | ||||||||||||
| Debentures | — | 58,668,855 | 7,763,935 | 66,432,790 | ||||||||||||
Other financial liabilities 2 | — | — | 26,705,247 | 26,705,247 | ||||||||||||
| ₩ | — | ₩ | 233,621,327 | ₩ | 319,121,667 | ₩ | 552,742,994 | |||||||||
| 1 | The amounts included in Level 2 are the carrying amounts which are reasonable approximations of fair value. |
| 2 | The amounts included in Level 3 are the carrying amounts which are reasonable approximations of fair value. |
| 3 | Borrowings of ₩ 2,143 million and ₩ 18,266 million included in Level 2 are the carrying amounts which are reasonable approximations of fair value as of December 31, 2021 and 2022, respectively. |
December 31, 2021 | ||||||||||||
Fair value | Valuation techniques | Inputs | ||||||||||
(In millions of Korean won) | ||||||||||||
Financial assets | ||||||||||||
| Loans measured at amortized cost | ₩ | 260,101 | DCF Model | Discount rate | ||||||||
| Securities measured at amortized cost | 26,125,391 | DCF Model, MonteCarlo Simulation | | Discount rate, Interest rate | | |||||||
| ₩ | 26,385,492 | |||||||||||
Financial liabilities | ||||||||||||
| Borrowings | ₩ | 3,135,284 | DCF Model | Discount rate | ||||||||
| Debentures | 60,824,743 | DCF Model | Discount rate | |||||||||
| ₩ | 63,960,027 | |||||||||||
December 31, 2022 | ||||||||||||
Fair value | Valuation techniques | Inputs | ||||||||||
(In millions of Korean won) | ||||||||||||
Financial assets | ||||||||||||
| Loans measured at amortized cost | ₩ | 190,458 | DCF Model | Discount rate | ||||||||
| Securities measured at amortized cost | 33,646,001 | DCF Model, MonteCarlo Simulation | | Discount rate, Interest rate | | |||||||
| ₩ | 33,836,459 | |||||||||||
Financial liabilities | ||||||||||||
| Borrowings | ₩ | 6,069,857 | DCF Model | Discount rate | ||||||||
| Debentures | 58,668,855 | DCF Model | Discount rate | |||||||||
| ₩ | 64,738,712 | |||||||||||
December 31, 2021 | ||||||||
Fair value | Valuation techniques | Inputs | ||||||
(In millions of Korean won) | ||||||||
Financial assets | ||||||||
| Cash and due from financial institutions | ₩ | 1,958,755 | DCF Model | Credit spread, Other spread, Interest rate | ||||
| Loans measured at amortized cost | 417,515,159 | DCF Model | Credit spread, Other spread, Prepayment rate, Interest rate | |||||
| ₩ | 419,473,914 | |||||||
Financial liabilities | ||||||||
| Deposits | ₩ | 167,637,457 | DCF Model | Other spread, Prepayment rate, Interest rate | ||||
| Borrowings | 53,668,511 | DCF Model | Other spread, Interest rate | |||||
| Debentures | 6,463,666 | DCF Model | Other spread, Interest rate | |||||
| ₩ | 227,769,634 | |||||||
December 31, 2022 | ||||||||
Fair value | Valuation techniques | Inputs | ||||||
(In millions of Korean won) | ||||||||
Financial assets | ||||||||
| Cash and due from financial institutions | ₩ | 2,740,774 | DCF Model | Credit spread, Other spread, Interest rate | ||||
| Loans measured at amortized cost | 433,694,844 | DCF Model | Credit spread, Other spread, Prepayment rate, Interest rate | |||||
| ₩ | 436,435,618 | |||||||
Financial liabilities | ||||||||
| Deposits | ₩ | 219,553,478 | DCF Model | Other spread, Prepayment rate, Interest rate | ||||
| Borrowings | 65,099,007 | DCF Model | Other spread, Interest rate | |||||
| Debentures | 7,763,935 | DCF Model | Other spread, Interest rate | |||||
| ₩ | 292,416,420 | |||||||
2021 | ||||||||||||||||||||||||||||
Financial assets at fair value through profit or loss | Financial investments | Financial liabilities at fair value through profit or loss | Net derivative financial instruments | |||||||||||||||||||||||||
Due from financial institutions measured at fair value through profit or loss | Securities measured at fair value through profit or loss | Loans measured at fair value through profit or loss | Equity securities measured at fair value through other comprehensive income | Loans measured at fair value through other comprehensive income | Financial liabilities designated at fair value through profit or loss | Derivatives held for trading | ||||||||||||||||||||||
(In millions of Korean won) | ||||||||||||||||||||||||||||
| Beginning | ₩ | 90,083 | ₩ | 11,099,923 | ₩ | 38,756 | ₩ | 2,419,908 | ₩ | 27,983 | ₩ | (9,201,431 | ) | ₩ | 300,420 | |||||||||||||
| Total gains or losses: | ||||||||||||||||||||||||||||
| Profit or loss | 212 | 346,982 | (431 | ) | — | — | 61,756 | (66,116 | ) | |||||||||||||||||||
| Other comprehensive income (loss) | 1,720 | 223,545 | — | (101,876 | ) | 87 | (5,446 | ) | — | |||||||||||||||||||
| Purchases | — | 3,567,937 | 55,605 | 74,602 | — | — | 3,954 | |||||||||||||||||||||
| Sales | (19,999 | ) | (2,360,801 | ) | — | (5,618 | ) | (14,100 | ) | — | (170,055 | ) | ||||||||||||||||
| Issues | — | — | — | — | — | (8,233,128 | ) | (32,516 | ) | |||||||||||||||||||
| Settlements | — | — | — | — | — | 9,560,735 | — | |||||||||||||||||||||
| Transfers into Level 3 * | — | 4,307 | — | — | — | — | (282 | ) | ||||||||||||||||||||
| Transfers out of Level 3 * | — | (356,792 | ) | — | (952,449 | ) | — | — | — | |||||||||||||||||||
| Ending | ₩ | 72,016 | ₩ | 12,525,101 | ₩ | 93,930 | ₩ | 1,434,567 | ₩ | 13,970 | ₩ | (7,817,514 | ) | ₩ | 35,405 | |||||||||||||
2022 | ||||||||||||||||||||||||||||
Financial assets at fair value through profit or loss | Financial investments | Financial liabilities at fair value through profit or loss | Net derivative financial instruments | |||||||||||||||||||||||||
Due from financial institutions measured at fair value through profit or loss | Securities measured at fair value through profit or loss | Loans measured at fair value through profit or loss | Equity securities measured at fair value through other comprehensive income | Loans measured at fair value through other comprehensive income | Financial liabilities designated at fair value through profit or loss | Derivatives held for trading | ||||||||||||||||||||||
(In millions of Korean won) | ||||||||||||||||||||||||||||
| Beginning | ₩ | 72,016 | ₩ | 12,525,101 | ₩ | 93,930 | ₩ | 1,434,567 | ₩ | 13,970 | ₩ | (7,817,514 | ) | ₩ | 35,405 | |||||||||||||
| Total gains or losses: | ||||||||||||||||||||||||||||
| Profit or loss | (74 | ) | 129,390 | 20,306 | — | — | 561,996 | (663,229 | ) | |||||||||||||||||||
| Other comprehensive income (loss) | (6,917 | ) | (304,847 | ) | — | (3,004 | ) | 130 | 60,520 | — | ||||||||||||||||||
| Purchases | — | 4,409,579 | 45,485 | 46,041 | — | — | 23,526 | |||||||||||||||||||||
| Sales | (20,000 | ) | (1,368,002 | ) | (10,648 | ) | (541 | ) | (14,100 | ) | — | (59,177 | ) | |||||||||||||||
| Issues | — | — | — | — | — | (5,222,820 | ) | (14,796 | ) | |||||||||||||||||||
| Settlements | — | (61,055 | ) | — | — | — | 4,186,515 | 18,456 | ||||||||||||||||||||
| Transfers into Level 3 * | — | 27,120 | — | — | — | — | — | |||||||||||||||||||||
| Transfers out of Level 3 * | — | (69,002 | ) | — | — | — | — | — | ||||||||||||||||||||
| Ending | ₩ | 45,025 | ₩ | 15,288,284 | ₩ | 149,073 | ₩ | 1,477,063 | ₩ | — | ₩ | (8,231,303 | ) | ₩ | (659,815 | ) | ||||||||||||
| * | Transfers into or out of Level 3 of the fair value hierarchy occurred due to the change in the availability of observable market data. |
2020 | 2021 | |||||||||||||||||||||||
Net losses on financial instruments at fair value through profit or loss | Other operating income | Net interest income | Net gains on financial instruments at fair value through profit or loss | Other operating expenses | Net interest income | |||||||||||||||||||
(In millions of Korean won) | ||||||||||||||||||||||||
Total gains (losses) recognized in profit or loss for the period | ₩ | 70,251 | ₩ | (56,329 | ) | ₩ | — | ₩ | 256,167 | ₩ | 86,236 | ₩ | — | |||||||||||
Total gains (losses) recognized in profit or loss from financial instruments held at the end of the reporting period | 129,824 | (60,884 | ) | — | 126,516 | 85,256 | — | |||||||||||||||||
2022 | ||||||||||||
Net gains on financial instruments at fair value through profit or loss | Other operating income | Net interest income | ||||||||||
(In millions of Korean won) | ||||||||||||
Total gains (losses) recognized in profit or loss for the period | ₩ | (75,653 | ) | ₩ | 124,042 | ₩ | — | |||||
Total gains recognized in profit or loss from financial instruments held at the end of the reporting period | 88,483 | 73,711 | — | |||||||||
(In millions of Korean won) | December 31, 2021 | |||||||||||||
Fair value | Valuation techniques | Unobservable inputs | Range of unobservable inputs (%) | Relationship of unobservable inputs to fair value | ||||||||||
(In millions of Korean won) | ||||||||||||||
Financial assets | ||||||||||||||
Financial assets at fair value through profit or loss: | ||||||||||||||
Due from financial institutions | ₩ | 72,016 | MonteCarlo Simulation, Hull and White Model | Volatility of underlying asset | 14.30 ~ 39.66 | The higher the volatility of underlying asset, the higher the fair value fluctuation | ||||||||
| Correlation coefficient | -3.36 | The higher the correlation coefficient, the higher the fair value fluctuation | ||||||||||||
Debt securities | 11,555,588 | DCF Model, Closed Form, FDM, MonteCarlo Simulation, Hull and White Model, Black-Scholes Model, Option Model, Binomial Model, Net Asset Value Method, Milestone Method, Income Approach, Market Value Approach, and others | Growth rate | 0.00 ~ 2.00 | The higher the growth rate, the higher the fair value | |||||||||
| Volatility | 13.87 ~ 58.39 | The higher the volatility, the higher the fair value fluctuation | ||||||||||||
| Discount rate | 0.60 ~ 21.37 | The lower the discount rate, the higher the fair value | ||||||||||||
| Stock price | 18.87 ~ 19.48 | The higher the stock price, the higher the fair value | ||||||||||||
| Correlation coefficient between underlying assets | -60.35 ~ 100.00 | The higher the correlation coefficient, the higher the fair value fluctuation | ||||||||||||
| Liquidation value | -1.00 ~ 1.00 | The higher the liquidation value, the higher the fair value | ||||||||||||
| Recovery rate | 40 | The higher the recovery rate, the higher the fair value | ||||||||||||
| Rate of real estate price fluctuation | -1.00 ~ 1.00 | The higher the sale price of real estate, the higher the fair value | ||||||||||||
Equity securities | 969,513 | Income Approach, Market Value Approach, Asset Value Approach, DCF Model, Comparable Company Analysis, Risk Adjusted Discount Rate Method, Dividend Discount Model, Usage of Past Transactions, Binomial Model, and others | Growth rate | 0.50 ~ 2.00 | The higher the growth rate, the higher the fair value | |||||||||
| Discount rate | 8.80 ~ 24.60 | The lower the discount rate, the higher the fair value | ||||||||||||
| Stock price | 23.36 ~ 25.49 | The higher the stock price, the higher the fair value | ||||||||||||
Loans | 93,930 | DCF Model | Discount rate | 8.21 | The lower the discount rate, the higher the fair value | |||||||||
(In millions of Korean won) | December 31, 2021 | |||||||||||||
Fair value | Valuation techniques | Unobservable inputs | Range of unobservable inputs (%) | Relationship of unobservable inputs to fair value | ||||||||||
(In millions of Korean won) | ||||||||||||||
Derivatives held for trading: | ||||||||||||||
Stock and index | ₩ | 184,165 | DCF Model, Closed Form, FDM, MonteCarlo Simulation, Hull and White Model, Black-Scholes Model, Binomial Model | Volatility of underlying asset | 15.07 ~ 80.58 | The higher the volatility, the higher the fair value fluctuation | ||||||||
| Correlation coefficient | - 60.35 ~ 88.17 | The higher the correlation coefficient, the higher the fair value fluctuation | ||||||||||||
| Stock price | -10.00 ~ 10.00 | The higher the stock price, the higher the fair value | ||||||||||||
Currency, interest rate, and others | 25,840 | DCF Model, Hull and White Model, MonteCarlo Simulation, Closed Form | Volatility | 2.67 ~ 81.32 | The higher the volatility, the higher the fair value fluctuation | |||||||||
| Correlation coefficient | -48.31 ~ 90.16 | The higher the correlation coefficient, the higher the fair value fluctuation | ||||||||||||
Financial assets at fair value through other comprehensive income: | ||||||||||||||
Equity securities | 1,434,567 | Risk Adjusted Discount Rate Method, IMV Model, DCF Model, Comparable Company Analysis, Dividend Discount Model, Net Asset Value Method, Market Value Approach, Hull and White Model, and others | Growth rate | 0.00 ~ 2.00 | The higher the growth rate, the higher the fair value | |||||||||
| Discount rate | 8.80 ~ 18.02 | The lower the discount rate, the higher the fair value | ||||||||||||
| Volatility | 23.36 ~ 31.65 | The higher the volatility, the higher the fair value fluctuation | ||||||||||||
Loans | 13,970 | DCF Model | Discount rate | 2.87 ~ 4.87 | The lower the discount rate, the higher the fair value | |||||||||
| ₩ | 14,349,589 | |||||||||||||
December 31, 2021 | ||||||||||||||
Fair value | Valuation techniques | Unobservable inputs | Range of unobservable inputs (%) | Relationship of unobservable inputs to fair value | ||||||||||
(In millions of Korean won) | ||||||||||||||
Financial liabilities | ||||||||||||||
Financial liabilities designated at fair value through profit or loss: | ||||||||||||||
Derivative-linked securities | ₩ | 7,817,514 | DCF Model, Closed Form, FDM, MonteCarlo Simulation, Hull-white Model, Black-Scholes Model | Volatility of underlying asset | 1.00 ~ 81.32 | The higher the volatility, the higher the fair value fluctuation | ||||||||
| Correlation coefficient between underlying assets | -60.35 ~ 90.16 | The higher the correlation coefficient, the higher the fair value fluctuation | ||||||||||||
Derivatives held for trading: | ||||||||||||||
Stock and index | 92,757 | DCF Model, Closed Form, FDM, MonteCarlo Simulation, Hull-white Model, Black-Scholes Model, Binomial Model | Volatility of underlying asset | 15.07 ~ 80.58 | The higher the volatility, the higher the fair value fluctuation | |||||||||
| Correlation coefficient between underlying assets | -60.35 ~ 88.17 | The higher the correlation coefficient, the higher the fair value fluctuation | ||||||||||||
Others | 81,843 | DCF Model, Hull-white Model, MonteCarlo Simulation, Closed Form | Discount rate | 1.46 ~ 2.83 | The lower the discount rate, the higher the fair value | |||||||||
| Volatility of underlying asset | 5.29 ~ 53.57 | The higher the volatility, the higher the fair value fluctuation | ||||||||||||
| Correlation coefficient between underlying assets | -48.31 ~ 90.16 | The higher the correlation coefficient, the higher the fair value fluctuation | ||||||||||||
| ₩ | 7,992,114 | |||||||||||||
December 31, 2022 | ||||||||||||||
Fair value | Valuation techniques | Unobservable inputs | Range of unobservable inputs (%) | Relationship of unobservable inputs to fair value | ||||||||||
(In millions of Korean won) | ||||||||||||||
Financial assets | ||||||||||||||
Financial assets at fair value through profit or loss: | ||||||||||||||
Due from financial institutions | ₩ | 45,025 | Hull-white Model | Interest rate | 0.86 | The lower the interest rate, the higher the fair value | ||||||||
Debt securities | 14,061,903 | DCF Model, Closed Form, MonteCarlo Simulation, Hull-white Model, Black-Scholes Model, Option Model, Binomial Model, Net Asset Value Method, Milestone Method, Income Approach, Market Value Approach, and others | Growth rate | 0.00 ~ 3.00 | The higher the growth rate, the higher the fair value | |||||||||
| Volatility | 0.24 ~ 37.39 | The higher the volatility, the higher the fair value fluctuation | ||||||||||||
| Discount rate | 1.54 ~ 15.75 | The lower the discount rate, the higher the fair value | ||||||||||||
| Correlation coefficient between underlying assets | -60.10 ~ 93.32 | The higher the correlation coefficient, the higher the fair value fluctuation | ||||||||||||
| Liquidation value | -1.00 ~ 1.00 | The higher the liquidation value, the higher the fair value | ||||||||||||
| Recovery rate | 40.00 | The higher the recovery rate, the higher the fair value | ||||||||||||
| Rate of real estate price fluctuation | -1.00 ~ 1.00 | The higher the sale price of real estate, the higher the fair value | ||||||||||||
| Volatility of Stock price | 18.87 ~ 19.48 | The higher the volatility, the higher the fair value fluctuation | ||||||||||||
Equity securities | 1,226,381 | Income Approach, Market Value Approach, Asset Value Approach, DCF Model, Comparable Company Analysis, Risk Adjusted Discount Rate Method, Dividend Discount Model, Usage of Past Transactions, Binomial Model, and others | Growth rate | 0.00 ~ 4.00 | The higher the growth rate, the higher the fair value | |||||||||
| Discount rate | 8.00 ~ 23.00 | The lower the discount rate, the higher the fair value | ||||||||||||
| Volatility | 16.80 ~ 25.50 | The higher the volatility, the higher the fair value fluctuation | ||||||||||||
Loans | 149,073 | DCF Model | Discount rate | 9.91 | The lower the discount rate, the higher the fair value | |||||||||
December 31, 2022 | ||||||||||||||
Fair value | Valuation techniques | Unobservable inputs | Range of unobservable inputs (%) | Relationship of unobservable inputs to fair value | ||||||||||
(In millions of Korean won) | ||||||||||||||
Derivatives held for trading: | ||||||||||||||
Stock and index | ₩ | 79,297 | DCF Model, Closed Form, MonteCarlo Simulation, Hull-white Model, Black-Scholes Model, Binomial Model, Net Asset Value Method | Volatility of underlying asset | 10.00 ~ 58.84 | The higher the volatility, the higher the fair value fluctuation | ||||||||
| Correlation coefficient | -60.10 ~ 79.72 | The higher the correlation coefficient, the higher the fair value fluctuation | ||||||||||||
Currency, interest rate, and others | 43,959 | DCF Model, Hull-white Model, MonteCarlo Simulation, Closed Form | Volatility | 9.77 ~ 32.92 | The higher the volatility, the higher the fair value fluctuation | |||||||||
| Correlation coefficient | 8.42 ~ 93.32 | The higher the correlation coefficient, the higher the fair value fluctuation | ||||||||||||
Financial assets at fair value through other comprehensive income: | ||||||||||||||
Equity securities | 1,477,063 | DCF Model, Comparable Company Analysis, Risk Adjusted Discount Rate Method, IMV Model, Income Approach, Net Asset Value Method, Market Value Approach, and others | Growth rate | 0.00 ~ 2.00 | The higher the growth rate, the higher the fair value | |||||||||
| Discount rate | 7.96 ~ 19.14 | The lower the discount rate, the higher the fair value | ||||||||||||
| Volatility of Stock price | 23.36 ~ 25.49 | The higher the volatility, the higher the fair value fluctuation | ||||||||||||
| Volatility of interest rate | 56.32~121.17 | The higher the volatility, the higher the fair value fluctuation | ||||||||||||
| ₩ | 17,082,701 | |||||||||||||
December 31, 2022 | ||||||||||||||
Fair value | Valuation techniques | Unobservable inputs | Range of unobservable inputs (%) | Relationship of unobservable inputs to fair value | ||||||||||
(In millions of Korean won) | ||||||||||||||
Financial liabilities | ||||||||||||||
Financial liabilities designated at fair value through profit or loss: | ||||||||||||||
Derivative-linked securities | ₩ | 8,231,303 | DCF Model, Closed Form, MonteCarlo Simulation, Black-Scholes Model, Hull-white Model, Net Asset Value Method, and others | Volatility of underlying asset | 1.00 ~ 119.27 | The higher the volatility, the higher the fair value fluctuation | ||||||||
| Correlation coefficient | - 60.10 ~93.32 | The higher the correlation coefficient, the higher the fair value fluctuation | ||||||||||||
Derivatives held for trading: | ||||||||||||||
Stock and index | 370,093 | DCF Model, Closed Form, MonteCarlo Simulation, Black-Scholes Model, Hull-white Model, Net Asset Value Method, and others | Volatility of underlying asset | 0.09 ~ 119.27 | The higher the volatility, the higher the fair value fluctuation | |||||||||
| Correlation coefficient | - 60.10 ~79.72 | The higher the correlation coefficient, the higher the fair value fluctuation | ||||||||||||
Others | 412,978 | DCF Model, Hull-white Model, MonteCarlo Simulation, Closed Form | Discount rate | 4.83 ~ 6.85 | The lower the discount rate, the higher the fair value | |||||||||
| Volatility of underlying asset | 8.68 ~ 119.27 | The higher the volatility, the higher the fair value fluctuation | ||||||||||||
| Correlation coefficient between underlying assets | -50.43 ~ 93.32 | The higher the correlation coefficient, the higher the fair value fluctuation | ||||||||||||
| ₩ | 9,014,374 | |||||||||||||
December 31, 2021 | ||||||||||||||||
Profit or loss | Other comprehensive income or loss | |||||||||||||||
Favorable changes | Unfavorable changes | Favorable changes | Unfavorable changes | |||||||||||||
(In millions of Korean won) | ||||||||||||||||
Financial assets | ||||||||||||||||
Financial assets at fair value through profit or loss: 1 | ||||||||||||||||
Due from financial institutions | ₩ | — | ₩ | — | ₩ | 19 | ₩ | (18 | ) | |||||||
Debt securities 4 | 13,149 | (12,562 | ) | 1,458 | (1,402 | ) | ||||||||||
Equity securities 3 | 11,259 | (8,192 | ) | 1,049 | (813 | ) | ||||||||||
Loans 5 | 3,062 | (2,742 | ) | — | — | |||||||||||
Derivatives held for trading 2 | 19,328 | (20,005 | ) | — | — | |||||||||||
Financial assets at fair value through other comprehensive income: | ||||||||||||||||
Equity securities 3 | 6,495 | (5,145 | ) | 95,599 | (71,171 | ) | ||||||||||
Loans 6 | — | — | 133 | (131 | ) | |||||||||||
| ₩ | 53,293 | ₩ | (48,646 | ) | ₩ | 98,258 | ₩ | (73,535 | ) | |||||||
Financial liabilities | ||||||||||||||||
Financial liabilities designated at fair value through profit or loss 1 | ₩ | 78,355 | ₩ | (82,797 | ) | ₩ | 78,356 | ₩ | (82,797 | ) | ||||||
Derivatives held for trading 2 | 31,310 | (29,309 | ) | 31,114 | (29,105 | ) | ||||||||||
| ₩ | 109,665 | ₩ | (112,106 | ) | ₩ | 109,470 | ₩ | (111,902 | ) | |||||||
December 31, 2022 | ||||||||||||||||
Profit or loss | Other comprehensive income or loss | |||||||||||||||
Favorable changes | Unfavorable changes | Favorable changes | Unfavorable changes | |||||||||||||
(In millions of Korean won) | ||||||||||||||||
Financial assets | ||||||||||||||||
Financial assets at fair value through profit or loss: 1 | ||||||||||||||||
Due from financial institutions | ₩ | — | ₩ | — | ₩ | 221 | ₩ | (247 | ) | |||||||
Debt securities 4 | 17,392 | (17,896 | ) | 1,642 | (1,869 | ) | ||||||||||
Equity securities 3 | 34,564 | (25,586 | ) | — | — | |||||||||||
Loans 5 | 2,276 | (2,055 | ) | — | — | |||||||||||
Derivatives held for trading 2 | 18,076 | (19,034 | ) | — | — | |||||||||||
Financial assets at fair value through other comprehensive income: | ||||||||||||||||
Equity securities 3 | — | — | 179,307 | (82,595 | ) | |||||||||||
Loans 6 | — | — | — | — | ||||||||||||
| ₩ | 72,308 | ₩ | (64,571 | ) | ₩ | 181,170 | ₩ | (84,711 | ) | |||||||
Financial liabilities | ||||||||||||||||
Financial liabilities designated at fair value through profit or loss 1 | ₩ | 94,001 | ₩ | (97,663 | ) | ₩ | — | ₩ | — | |||||||
Derivatives held for trading 2 | 48,768 | (46,427 | ) | — | — | |||||||||||
| ₩ | 142,769 | ₩ | (144,090 | ) | ₩ | — | ₩ | — | ||||||||
| 1 | For financial instruments at fair value through profit or loss, changes in fair value are calculated by shifting principal unobservable input parameters such as discount rate, recovery rate, liquidation value by ±1%p and volatility of underlying asset, growth rate by ±1%p or ±10% and correlation coefficient by ±10%. |
| 2 | For derivative financial instruments, changes in fair value are calculated by shifting principal unobservable input parameters such as price of underlying asset and volatility by ± 10%. |
| 3 | For equity securities, changes in fair value are calculated by shifting principal unobservable input parameters such as correlation between discount rate (-1%p~1%p) and growth rate (0%p~ 1%p). |
| 4 | For beneficiary certificates, it is practically impossible to analyze sensitivity of changes in unobservable inputs. However, for beneficiary certificates whose underlying assets are real estates, changes in fair value are calculated by shifting rate of real estate price fluctuation by -1%p~1%p, and for beneficiary certificates whose underlying assets are equity investments, changes in fair value are calculated by shifting principal unobservable input parameters such as liquidation value by -1%p~1%p and discount rate by -1%p~1%p. There is no significant correlation among major unobservable inputs. |
| 5 | For loans, changes in fair value are calculated by shifting principal unobservable input parameters such as discount rate by -1%p~1%p. |
| 6 | For loans measured at fair value through other comprehensive income, changes in fair value are calculated by shifting principal unobservable input parameters such as discount rate and growth rate by ±1%p. |
2021 | 2022 | |||||||
(In millions of Korean won) | ||||||||
Balance at the beginning of the year | ₩ | 61,393 | ₩ | 77,208 | ||||
New transactions | 166,443 | 113,504 | ||||||
Changes during the year | (150,628 | ) | (119,208 | ) | ||||
Balance at the end of the year | ₩ | 77,208 | ₩ | 71,504 | ||||
December 31, 2021 | ||||||||||||||||||||||||
Financial instruments at fair value through profit or loss | Financial instruments at fair value through other comprehensive income | Financial instruments designated at fair value through other comprehensive income | Financial instruments at amortized cost | Derivatives held for hedging | Total | |||||||||||||||||||
(In millions of Korean won) | ||||||||||||||||||||||||
Financial assets | ||||||||||||||||||||||||
Cash and due from financial institutions | ₩ | — | ₩ | — | ₩ | — | ₩ | 31,009,374 | ₩ | — | ₩ | 31,009,374 | ||||||||||||
Financial assets at fair value through profit or loss | 66,005,815 | — | — | — | — | 66,005,815 | ||||||||||||||||||
Derivative financial assets | 3,532,542 | — | — | — | 188,828 | 3,721,370 | ||||||||||||||||||
Loans measured at amortized cost | — | — | — | 417,900,273 | — | 417,900,273 | ||||||||||||||||||
Financial investments | — | 56,573,115 | 3,803,128 | 44,471,628 | — | 104,847,871 | ||||||||||||||||||
Other financial assets | — | — | — | 10,755,350 | — | 10,755,350 | ||||||||||||||||||
| ₩ | 69,538,357 | ₩ | 56,573,115 | ₩ | 3,803,128 | ₩ | 504,136,625 | ₩ | 188,828 | ₩ | 634,240,053 | |||||||||||||
December 31, 2021 | ||||||||||||||||||||
Financial instruments at fair value through profit or loss | Financial instruments designated at fair value through profit or loss | Financial instruments at amortized cost | Derivatives held for hedging | Total | ||||||||||||||||
(In milliions of Korean won) | ||||||||||||||||||||
Financial liabilities | ||||||||||||||||||||
Financial liabilities at fair value through profit or loss | ₩ | 2,939,584 | ₩ | 9,149,396 | ₩ | — | ₩ | — | ₩ | 12,088,980 | ||||||||||
Derivative financial liabilities | 3,509,789 | — | — | 172,469 | 3,682,258 | |||||||||||||||
Deposits | — | — | 372,023,918 | — | 372,023,918 | |||||||||||||||
Borrowings | — | — | 56,912,374 | — | 56,912,374 | |||||||||||||||
Debentures | — | — | 67,430,188 | — | 67,430,188 | |||||||||||||||
Other financial liabilities | — | — | 29,494,402 | — | 29,494,402 | |||||||||||||||
| ₩ | 6,449,373 | ₩ | 9,149,396 | ₩ | 525,860,882 | ₩ | 172,469 | ₩ | 541,632,120 | |||||||||||
December 31, 2022 | ||||||||||||||||||||||||
Financial instruments at fair value through profit or loss | Financial instruments at fair value through other comprehensive income | Financial instruments designated at fair value through other comprehensive income | Financial instruments at amortized cost | Derivatives held for hedging | Total | |||||||||||||||||||
(In millions of Korean won) | ||||||||||||||||||||||||
Financial assets | ||||||||||||||||||||||||
Cash and due from financial institutions | ₩ | — | ₩ | — | ₩ | — | ₩ | 32,063,421 | ₩ | — | ₩ | 32,063,421 | ||||||||||||
Financial assets at fair value through profit or loss | 64,935,344 | — | — | — | — | 64,935,344 | ||||||||||||||||||
Derivative financial assets | 8,984,171 | — | — | — | 461,963 | 9,446,134 | ||||||||||||||||||
Loans measured at amortized cost | — | — | — | 436,530,502 | — | 436,530,502 | ||||||||||||||||||
Financial investments | — | 55,973,463 | 2,326,378 | 58,288,734 | — | 116,588,575 | ||||||||||||||||||
Other financial assets | — | — | — | 11,209,350 | — | 11,209,350 | ||||||||||||||||||
| ₩ | 73,919,515 | ₩ | 55,973,463 | ₩ | 2,326,378 | ₩ | 538,092,007 | ₩ | 461,963 | ₩ | 670,773,326 | |||||||||||||
December 31, 2022 | ||||||||||||||||||||
Financial instruments at fair value through profit or loss | Financial instruments designated at fair value through profit or loss | Financial instruments at amortized cost | Derivatives held for hedging | Total | ||||||||||||||||
(In millions of Korean won) | ||||||||||||||||||||
Financial liabilities | ||||||||||||||||||||
Financial liabilities at fair value through profit or loss | ₩ | 2,193,210 | ₩ | 10,078,394 | ₩ | — | ₩ | — | ₩ | 12,271,604 | ||||||||||
Derivative financial liabilities | 9,209,537 | — | — | 297,172 | 9,506,709 | |||||||||||||||
Deposits | — | — | 388,888,452 | — | 388,888,452 | |||||||||||||||
Borrowings | — | — | 71,717,366 | — | 71,717,366 | |||||||||||||||
Debentures | — | — | 68,698,203 | — | 68,698,203 | |||||||||||||||
Other financial liabilities | — | — | 26,705,247 | — | 26,705,247 | |||||||||||||||
| ₩ | 11,402,747 | ₩ | 10,078,394 | ₩ | 556,009,268 | ₩ | 297,172 | ₩ | 577,787,581 | |||||||||||
December 31, 2021 | ||||||||||||
Type of continuing involvement | Classification of financial instruments | Carrying amount of continuing involvement | Fair value of continuing involvement | |||||||||
(In millions of Korean won) | ||||||||||||
Discovery 2 nd Securitization Specialty Co., Ltd. | Subordinated bond | Financial assets at fair value through profit or loss | ₩ | 5,189 | ₩ | 5,189 | ||||||
AP 4D ABS Ltd. | Subordinated bond | Financial assets at fair value through profit or loss | 5,463 | 5,463 | ||||||||
| ₩ | 10,652 | ₩ | 10,652 | |||||||||
December 31, 2022 | ||||||||||||
Type of continuing involvement | Classification of financial instruments | Carrying amount of continuing involvement | Fair value of continuing involvement | |||||||||
(In millions of Korean won) | ||||||||||||
Discovery 2 nd Securitization Specialty Co., Ltd. | Subordinated bond | Financial assets at fair value through profit or loss | ₩ | 564 | ₩ | 564 | ||||||
AP 4D ABS Ltd. | Subordinated bond | Financial assets at fair value through profit or loss | 541 | 541 | ||||||||
| ₩ | 1,105 | ₩ | 1,105 | |||||||||
December 31, 2021 | ||||||||||||||||
Carrying amount of underlying assets | Fair value of underlying assets | Carrying amount of senior debentures | Fair value of senior debentures | |||||||||||||
(In millions of Korean won) | ||||||||||||||||
KB Kookmin Card 5 th Securitization Co., Ltd.1 | ₩ | 492,108 | ₩ | 490,113 | ₩ | 299,881 | ₩ | 302,564 | ||||||||
KB Kookmin Card 6 th Securitization Co., Ltd.1 | 726,803 | 723,835 | 474,000 | 474,766 | ||||||||||||
KB Kookmin Card 7 th Securitization Co., Ltd.1 | 948,129 | 943,689 | 598,180 | 596,272 | ||||||||||||
KB Kookmin Card 8 th Securitization Co., Ltd.1 | 545,750 | 543,982 | 299,844 | 306,264 | ||||||||||||
KB Auto Second Asset Securitization Specialty Co., Ltd. 2 | 129,867 | 129,385 | 59,968 | 59,935 | ||||||||||||
| ₩ | 2,842,657 | ₩ | 2,831,004 | ₩ | 1,731,873 | ₩ | 1,739,801 | |||||||||
December 31, 2022 | ||||||||||||||||
Carrying amount of underlying assets | Fair value of underlying assets | Carrying amount of senior debentures | Fair value of senior debentures | |||||||||||||
(In millions of Korean won) | ||||||||||||||||
KB Kookmin Card 7 th Securitization Co., Ltd.1 | ₩ | 963,756 | ₩ | 958,207 | ₩ | 641,780 | ₩ | 628,274 | ||||||||
KB Kookmin Card 8 th Securitization Co., Ltd.1 | 556,487 | 553,729 | 299,878 | 285,111 | ||||||||||||
KB Kookmin Card 9 th Securitization Co., Ltd.1 | 615,565 | 612,543 | 349,829 | 372,724 | ||||||||||||
KB Kookmin Card 10 th Securitization Co., Ltd.1 | 1,138,578 | 1,132,170 | 503,392 | 503,644 | ||||||||||||
KB Auto Fifth Asset Securitization Specialty Co., Ltd. 2 | 441,080 | 429,626 | 299,705 | 299,705 | ||||||||||||
| ₩ | 3,715,466 | ₩ | 3,686,275 | ₩ | 2,094,584 | ₩ | 2,089,458 | |||||||||
| 1 | The Group has an obligation to early redeem the securitized debentures in the event of situations prescribed by the asset securitization contract, such as the remaining balance of the eligible underlying assets in trust-type asset securitization is below the solvency ratio (minimum ratio: 104.5%) of the beneficiary interest in the trust. To avoid such early redemption, the Group entrusts credit card accounts and deposits in addition to the previously entrusted credit card accounts. |
| 2 | The Group has an obligation to early redeem the securitized debentures in the event of situations prescribed by the asset securitization contract, such as when the trusted assets do not meet the eligibility requirements. |
December 31, 2021 | ||||||||
Carrying amount of transferred assets | Carrying amount of related liabilities | |||||||
(In millions of Korean won) | ||||||||
Bonds sold under repurchase agreements * | ₩ | 11,273,036 | ₩ | 10,978,971 | ||||
Loaned securities: | ||||||||
Government and public bonds | 1,035,736 | — | ||||||
Stock | 253 | — | ||||||
| ₩ | 12,309,025 | ₩ | 10,978,971 | |||||
December 31, 2022 | ||||||||
Carrying amount of transferred assets | Carrying amount of related liabilities | |||||||
(In millions of Korean won) | ||||||||
Bonds sold under repurchase agreements * | ₩ | 11,418,820 | ₩ | 10,610,882 | ||||
Loaned securities: | ||||||||
Government and public bonds | 1,661,550 | — | ||||||
Stock | 52,098 | — | ||||||
Others | 94,766 | — | ||||||
| ₩ | 13,227,234 | ₩ | 10,610,882 | |||||
| * | Bonds sold under repurchase agreements using borrowed securities as collateral amount to ₩ 2,050,635 million and ₩ 100,768 million as of December 31, 2021 and 2022, respectively. |
December 31, 2021 | December 31, 2022 | |||||||||
(In millions of Korean won) | ||||||||||
Underlying assets | Financial assets at fair value through profit or loss | ₩ | 289,188 | ₩ | 324,456 | |||||
| Loans measured at amortized cost * | 3,724,204 | 3,050,471 | ||||||||
| ₩ | 4,013,392 | ₩ | 3,374,927 | |||||||
Associated liabilities | Debentures | ₩ | 4,010,436 | ₩ | 3,222,237 | |||||
| * | Before netting of allowance |
December 31, 2021 | ||||||||||||||||||||||||
Gross assets | Gross liabilities offset | Net amount in the statement of financial position | Non-offsetting amount | Net amount | ||||||||||||||||||||
Financial instruments | Cash collateral | |||||||||||||||||||||||
(In millions of Korean won) | ||||||||||||||||||||||||
Derivatives held for trading and derivative-linked securities | ₩ | 3,673,348 | ₩ | — | ₩ | 3,673,348 | ||||||||||||||||||
Derivatives held for hedging | 188,828 | — | 188,828 | ₩ | (2,352,365 | ) | ₩ | (235,749 | ) | ₩ | 1,274,062 | |||||||||||||
Unsettled spot exchange receivable | 2,384,503 | — | 2,384,503 | (2,380,556 | ) | — | 3,947 | |||||||||||||||||
Bonds purchased under repurchase agreements | 5,955,194 | — | 5,955,194 | (5,955,194 | ) | — | — | |||||||||||||||||
Domestic exchange settlement debits | 43,497,849 | (42,482,911 | ) | 1,014,938 | — | — | 1,014,938 | |||||||||||||||||
Other financial instruments | 2,341,992 | (2,327,904 | ) | 14,088 | (3,209 | ) | — | 10,879 | ||||||||||||||||
| ₩ | 58,041,714 | ₩ | (44,810,815 | ) | ₩ | 13,230,899 | ₩ | (10,691,324 | ) | ₩ | (235,749 | ) | ₩ | 2,303,826 | ||||||||||
December 31, 2022 | ||||||||||||||||||||||||
Gross assets | Gross liabilities offset | Net amount in the statement of financial position | Non-offsetting amount | Net amount | ||||||||||||||||||||
Financial instruments | Cash collateral | |||||||||||||||||||||||
(In millions of Korean won) | ||||||||||||||||||||||||
Derivatives held for trading and derivative-linked securities | ₩ | 9,380,420 | ₩ | — | ₩ | 9,380,420 | ||||||||||||||||||
Derivatives held for hedging | 461,964 | — | 461,964 | ₩ | (7,710,408 | ) | ₩ | (195,224 | ) | ₩ | 1,936,752 | |||||||||||||
Unsettled spot exchange receivable | 3,374,369 | — | 3,374,369 | (3,360,673 | ) | — | 13,696 | |||||||||||||||||
Bonds purchased under repurchase agreements | 3,328,657 | — | 3,328,657 | (3,328,657 | ) | — | — | |||||||||||||||||
Domestic exchange settlement debits | 55,491,085 | (54,611,238 | ) | 879,847 | — | — | 879,847 | |||||||||||||||||
Other financial instruments | 2,010,671 | (1,912,964 | ) | 97,707 | (3,169 | ) | — | 94,538 | ||||||||||||||||
| ₩ | 74,047,166 | ₩ | (56,524,202 | ) | ₩ | 17,522,964 | ₩ | (14,402,907 | ) | ₩ | (195,224 | ) | ₩ | 2,924,833 | ||||||||||
December 31, 2021 | ||||||||||||||||||||||||
Gross liabilities | Gross assets offset | Net amount in the statement of financial position | Non-offsetting amount | Net amount | ||||||||||||||||||||
Financial instruments | Cash collateral | |||||||||||||||||||||||
(In millions of Korean won) | ||||||||||||||||||||||||
Derivatives held for trading and derivative-linked securities | ₩ | 4,132,915 | ₩ | — | ₩ | 4,132,915 | ||||||||||||||||||
Derivatives held for hedging | 172,470 | — | 172,470 | ₩ | (3,069,591 | ) | ₩ | (75,253 | ) | ₩ | 1,160,541 | |||||||||||||
Unsettled spot exchange payable | 2,383,399 | — | 2,383,399 | (2,380,556 | ) | — | 2,843 | |||||||||||||||||
Bonds sold under repurchase agreements * | 14,372,761 | — | 14,372,761 | (14,372,761 | ) | — | — | |||||||||||||||||
Securities borrowing agreements | 2,826,885 | — | 2,826,885 | (2,826,885 | ) | — | — | |||||||||||||||||
Domestic exchange settlement credits | 47,608,341 | (42,482,911 | ) | 5,125,430 | (5,125,430 | ) | — | — | ||||||||||||||||
Other financial instruments | 2,738,984 | (2,327,904 | ) | 411,080 | (3,209 | ) | — | 407,871 | ||||||||||||||||
| ₩ | 74,235,755 | ₩ | (44,810,815 | ) | ₩ | 29,424,940 | ₩ | (27,778,432 | ) | ₩ | (75,253 | ) | ₩ | 1,571,255 | ||||||||||
December 31, 2022 | ||||||||||||||||||||||||
Gross liabilities | Gross assets offset | Net amount in the statement of financial position | Non-offsetting amount | Net amount | ||||||||||||||||||||
Financial instruments | Cash collateral | |||||||||||||||||||||||
(In millions of Korean won) | ||||||||||||||||||||||||
Derivatives held for trading and derivative-linked securities | ₩ | 10,500,353 | ₩ | — | ₩ | 10,500,353 | ||||||||||||||||||
Derivatives held for hedging | 297,173 | — | 297,173 | ₩ | (2,302,059 | ) | ₩ | (83,837 | ) | ₩ | 8,411,630 | |||||||||||||
Unsettled spot exchange payable | 3,374,230 | — | 3,374,230 | (3,360,673 | ) | — | 13,557 | |||||||||||||||||
Bonds sold under repurchase agreements * | 11,769,694 | — | 11,769,694 | (11,769,694 | ) | — | — | |||||||||||||||||
Securities borrowing agreements | 2,102,537 | — | 2,102,537 | (2,102,537 | ) | — | — | |||||||||||||||||
Domestic exchange settlement credits | 56,349,727 | (54,611,238 | ) | 1,738,489 | (1,738,489 | ) | — | — | ||||||||||||||||
Other financial instruments | 1,973,123 | (1,912,964 | ) | 60,159 | (3,169 | ) | — | 56,990 | ||||||||||||||||
| ₩ | 86,366,837 | ₩ | (56,524,202 | ) | ₩ | 29,842,635 | ₩ | (21,276,621 | ) | ₩ | (83,837 | ) | ₩ | 8,482,177 | ||||||||||
| * | Includes bonds sold under repurchase agreements to customers. |
Financial institutions | Interest rate (%) as of December 31, 2022 | December 31, 2021 | December 31, 2022 | |||||||||||||
(In millions of Korean won) | ||||||||||||||||
| Due from financial institutions in Korean won | Due from the Bank of Korea | The Bank of Korea | — | ₩ | 15,317,033 | ₩ | 15,169,704 | |||||||||
| Due from banks | Hana Bank and others | 0.00 ~ 6.00 | 3,390,521 | 3,606,033 | ||||||||||||
| Due from others | NH Investment & Securities Co., Ltd. and others | 0.00 ~ 3.48 | 686,236 | 1,298,879 | ||||||||||||
| 19,393,790 | 20,074,616 | |||||||||||||||
| Due from financial institutions in foreign currencies | Due from banks in foreign currencies | The Bank of Korea and others | 0.00 ~ 4.00 | 6,329,310 | 5,669,702 | |||||||||||
| Time deposits in foreign currencies | Industrial and Commercial Bank of China and others | 0.00 ~ 6.80 | 587,782 | 587,218 | ||||||||||||
| Due from others | Societe Generale (Paris) and others | 0.00 ~ 8.00 | 2,054,474 | 3,171,975 | ||||||||||||
| 8,971,566 | 9,428,895 | |||||||||||||||
| ₩ | 28,365,356 | ₩ | 29,503,511 | |||||||||||||
| * | Before netting of allowance |
Financial institutions | December 31, 2021 | December 31, 2022 | Reasons of restriction | |||||||||||
(In millions of Korean won) | ||||||||||||||
| Due from financial institutions in Korean won | Due from the Bank of Korea | The Bank of Korea | ₩ | 15,317,033 | ₩ | 15,169,704 | Bank of Korea Act | |||||||
| Due from banks | Shinhan Bank and others | 803,445 | 522,306 | Net settlement and others | ||||||||||
| Due from others | NH Investment & Securities Co., Ltd. and others | 528,642 | 1,029,631 | Derivatives margin account and others | ||||||||||
| 16,649,120 | 16,721,641 | |||||||||||||
| Due from financial institutions in foreign currencies | Due from banks in foreign currencies | Bank of Indonesia and others | 2,262,610 | 2,350,933 | Indonesian law and others | |||||||||
| Time deposits in foreign currencies | Agricultural Bank of China and others | 68,588 | 72,437 | Bank Act of the State of New York and others | ||||||||||
| Due from others | Societe Generale (Paris) and others | 1,774,388 | 2,092,656 | Derivatives margin account and others | ||||||||||
| 4,105,586 | 4,516,026 | |||||||||||||
| ₩ | 20,754,706 | ₩ | 21,237,667 | |||||||||||
| * | Before netting of allowance |
2021 | ||||||||||||
12-month expected credit losses | Lifetime expected credit losses | |||||||||||
Non-impaired | Impaired | |||||||||||
(In millions of Korean won) | ||||||||||||
| Beginning | ₩ | 2,947 | ₩ | 34 | ₩ | 282 | ||||||
| Transfer between stages: | ||||||||||||
Transfer to 12-month expected credit losses | — | — | — | |||||||||
| Transfer to lifetime expected credit losses | — | — | — | |||||||||
| Impairment | — | — | — | |||||||||
| Reversal of credit losses | (51 | ) | (35 | ) | (282 | ) | ||||||
| Others | 73 | 1 | — | |||||||||
| Ending | ₩ | 2,969 | ₩ | — | ₩ | — | ||||||
202 2 | ||||||||||||
12-month expectedcredit losses | Lifetime expected credit losses | |||||||||||
Non-impaired | Impaired | |||||||||||
(In millions of Korean won) | ||||||||||||
| Beginning | ₩ | 2,969 | ₩ | — | ₩ | — | ||||||
| Transfer between stages: | ||||||||||||
Transfer to 12-month expected credit losses | — | — | — | |||||||||
| Transfer to lifetime expected credit losses | — | — | — | |||||||||
| Impairment | — | — | — | |||||||||
| Reversal of credit losses | (392 | ) | — | — | ||||||||
| Others | 166 | — | — | |||||||||
| Ending | ₩ | 2,743 | ₩ | — | ₩ | — | ||||||
December 31, 2021 | ||||||||
Assets pledged | Pledgee | Carrying amount | Reasons of pledge | |||||
(In millions of Korean won) | ||||||||
| Due from financial institutions | Shinhan Banks and others | ₩ | 1,163,138 | Borrowings from bank and others | ||||
| Financial assets at fair value through profit or loss | The Korea Securities Depository and others | 8,689,639 | Repurchase agreements | |||||
| The Korea Securities Depository and others | 9,294,924 | Securities borrowing transactions | ||||||
| Samsung Futures Inc. and others | 1,039,656 | Derivatives transactions | ||||||
| 19,024,219 | ||||||||
| Financial assets at fair value through other comprehensive income | The Korea Securities Depository and others | 2,048,029 | Repurchase agreements | |||||
| The Korea Securities Depository and others | 1,523,593 | Securities borrowing transactions | ||||||
| The Bank of Korea | 2,843,426 | Borrowings from the Bank of Korea | ||||||
| The Bank of Korea | 1,249,049 | Settlement risk of the Bank of Korea | ||||||
| Samsung Futures Inc. and others | 709,390 | Derivatives transactions | ||||||
| 8,373,487 | ||||||||
| Securities measured at amortized cost | The Korea Securities Depository and others | 494,973 | Repurchase agreements | |||||
| The Bank of Korea | 4,847,855 | Borrowings from the Bank of Korea | ||||||
| The Bank of Korea | 3,948,622 | Settlement risk of the Bank of Korea | ||||||
| Samsung Futures Inc. and others | 144,014 | Derivatives transactions | ||||||
| Others | 268,767 | Others | ||||||
| 9,704,231 | ||||||||
| Loans | Others | 9,659,575 | Covered bond and others | |||||
| Real estate | LGIM COMMERCIAL LENDING Ltd. and others | 1,598,553 | Borrowings from bank and others | |||||
| ₩ | 49,523,203 | |||||||
December 31, 2022 | ||||||||
Assets pledged | Pledgee | Carrying amount | Reasons of pledge | |||||
(In millions of Korean won) | ||||||||
| Due from financial institutions | KEB Hana Bank and others | ₩ | 1,263,167 | Borrowings from bank and others | ||||
| Financial assets at fair value through profit or loss | The Korea Securities Depository and others | 3,841,536 | Repurchase agreements | |||||
| The Korea Securities Depository and others | 7,063,541 | Securities borrowing transactions | ||||||
| The Bank of Korea | 34,071 | Borrowings from the Bank of Korea | ||||||
| The Bank of Korea | 236,832 | Settlement risk of the Bank of Korea | ||||||
| Samsung Futures Inc. and others | 1,131,217 | Derivatives transactions | ||||||
| 12,307,197 | ||||||||
| Financial assets at fair value through other comprehensive income | MERITZ Securities Co., LTD and others | 5,625,270 | Repurchase agreements | |||||
| The Korea Securities Depository and others | 1,592,460 | Securities borrowing transactions | ||||||
| The Bank of Korea | 5,495,686 | Borrowings from the Bank of Korea | ||||||
| The Bank of Korea | 1,782,507 | Settlement risk of the Bank of Korea | ||||||
| Samsung Futures Inc. and others | 1,121,999 | Derivatives transactions | ||||||
| 15,617,922 | ||||||||
| Securities measured at amortized cost | The Korea Securities Depository and others | 2,307,499 | Repurchase agreements | |||||
| The Bank of Korea | 4,020,539 | Borrowings from the Bank of Korea | ||||||
| The Bank of Korea | 5,047,277 | Settlement risk of the Bank of Korea | ||||||
| Samsung Futures Inc. and others | 327,684 | Derivatives transactions | ||||||
| Korea Exchange and others | 896,896 | Others | ||||||
| 12,599,895 | ||||||||
| Loans | Others | 12,863,079 | Covered bond and others | |||||
| Real estate | LGIM COMMERCIAL LENDING Ltd. and others | 834,003 | Borrowings from bank and others | |||||
| ₩ | 55,485,263 | |||||||
December 31, 2021 | ||||||||||||
Fair value of collateral held | Fair value of collateral sold or repledged | Total | ||||||||||
(In millions of Korean won) | ||||||||||||
| Securities | ₩ | 6,451,850 | ₩ | — | ₩ | 6,451,850 | ||||||
December 31, 2022 | ||||||||||||
Fair value of collateral held | Fair value of collateral sold or repledged | Total | ||||||||||
(In millions of Korean won) | ||||||||||||
| Securities | ₩ | 3,344,424 | ₩ | — | ₩ | 3,344,424 | ||||||
| • | Interest rate swaps relating to interest rate risk in Korean won |
| • | Cross-currency swaps, forwards, and options relating to currency risk |
| • | Stock index options linked with the Korea Composite Stock Price Index (“KOSPI”) |
December 31, 2021 | December 31, 2022 | |||||||||||||||||||||||
Notional amount | Assets | Liabilities | Notional amount | Assets | Liabilities | |||||||||||||||||||
(In millions of Korean won) | ||||||||||||||||||||||||
Interest rate | ||||||||||||||||||||||||
| Forwards | ₩ | 4,037,717 | ₩ | 140,126 | ₩ | 126,610 | ₩ | 8,261,663 | ₩ | 821,603 | ₩ | 431,002 | ||||||||||||
| Futures* | 6,479,692 | 1,903 | 2,464 | 4,450,505 | 765 | 256 | ||||||||||||||||||
| Swaps | 334,721,395 | 354,686 | 397,046 | 359,581,194 | 859,670 | 694,713 | ||||||||||||||||||
| Options | 12,547,000 | 176,274 | 199,567 | 10,508,000 | 274,596 | 272,284 | ||||||||||||||||||
| 357,785,804 | 672,989 | 725,687 | 382,801,362 | 1,956,634 | 1,398,255 | |||||||||||||||||||
Currency | ||||||||||||||||||||||||
| Forwards | 105,509,405 | 1,296,083 | 934,944 | 115,682,577 | 2,813,603 | 2,472,119 | ||||||||||||||||||
| Futures* | 361,791 | 464 | 877 | 413,960 | 36 | 2,364 | ||||||||||||||||||
| Swaps | 65,028,025 | 1,082,873 | 1,331,597 | 91,646,725 | 3,525,458 | 4,049,390 | ||||||||||||||||||
| Options | 1,885,064 | 7,643 | 11,044 | 1,852,065 | 27,258 | 13,025 | ||||||||||||||||||
| 172,784,285 | 2,387,063 | 2,278,462 | 209,595,327 | 6,366,355 | 6,536,898 | |||||||||||||||||||
Stock and index | ||||||||||||||||||||||||
| Futures* | 1,612,965 | 14,338 | 6,530 | 1,828,302 | 37,455 | 89,624 | ||||||||||||||||||
| Swaps | 5,207,198 | 322,888 | 132,619 | 6,649,735 | 377,840 | 492,275 | ||||||||||||||||||
| Options | 7,617,703 | 95,338 | 241,371 | 7,257,715 | 168,311 | 359,274 | ||||||||||||||||||
| 14,437,866 | 432,564 | 380,520 | 15,735,752 | 583,606 | 941,173 | |||||||||||||||||||
Credit | ||||||||||||||||||||||||
| Swaps | 2,602,382 | 18,979 | 7,409 | 3,006,114 | 32,860 | 17,468 | ||||||||||||||||||
| 2,602,382 | 18,979 | 7,409 | 3,006,114 | 32,860 | 17,468 | |||||||||||||||||||
Commodity | ||||||||||||||||||||||||
| Futures* | 6,370 | 43 | 82 | 28,577 | 1,970 | 941 | ||||||||||||||||||
| Swaps | — | — | — | 131,500 | 887 | 885 | ||||||||||||||||||
| 6,370 | 43 | 82 | 160,077 | 2,857 | 1,826 | |||||||||||||||||||
Others | 1,695,540 | 20,904 | 117,629 | 1,003,301 | 41,859 | 313,917 | ||||||||||||||||||
| ₩ | 549,312,247 | ₩ | 3,532,542 | ₩ | 3,509,789 | ₩ | 612,301,933 | ₩ | 8,984,171 | ₩ | 9,209,537 | |||||||||||||
| * | Gains or losses arising from some daily mark-to-market |
December 31, 2021 | ||||||||||||||||||||||||||||
1 year | 2 years | 3 years | 4 years | 5 years | Over 5 years | Total | ||||||||||||||||||||||
(In millions of Korean won) | ||||||||||||||||||||||||||||
Fair value hedge | ||||||||||||||||||||||||||||
| Nominal amount of the hedging instrument | ₩ | 2,223,113 | ₩ | 1,423,760 | ₩ | 967,376 | ₩ | 2,153,200 | ₩ | 1,428,673 | ₩ | 2,419,230 | ₩ | 10,615,352 | ||||||||||||||
| Average price condition (%) | 0.94 | 1.23 | 1.04 | 1.16 | 1.06 | 1.39 | 1.18 | |||||||||||||||||||||
| Average price condition (USD/KRW) | 1,144.74 | 1,154.78 | 1,169.72 | — | — | — | 1,150.30 | |||||||||||||||||||||
| Average price condition (EUR/KRW) | 1,359.59 | 1,363.95 | 1,394.84 | — | 1,458.92 | — | 1,409.23 | |||||||||||||||||||||
| Average price condition (AUD/KRW) | 859.41 | — | — | — | — | — | 859.41 | |||||||||||||||||||||
| Average price condition (GBP/KRW) | 1,554.65 | — | — | 1,620.05 | — | — | 1,557.47 | |||||||||||||||||||||
Cash flow hedge | ||||||||||||||||||||||||||||
| Nominal amount of the hedging instrument | ₩ | 4,150,546 | ₩ | 1,763,372 | ₩ | 322,735 | ₩ | 641,733 | ₩ | 580,128 | ₩ | 150,000 | ₩ | 7,608,514 | ||||||||||||||
| Average price condition (%) | 1.01 | 1.51 | 2.06 | 1.87 | 1.84 | 2.12 | 1.21 | |||||||||||||||||||||
| Average price condition (USD/KRW) | 1,159.92 | 1,178.13 | 1,145.05 | 1,139.40 | 1,123.13 | — | 1,152.89 | |||||||||||||||||||||
| Average price condition (EUR/KRW) | 1,312.75 | 1,321.00 | 1,364.00 | 1,374.73 | — | — | 1,351.76 | |||||||||||||||||||||
| Average price condition (AUD/KRW) | — | — | 856.40 | 851.50 | — | — | 853.40 | |||||||||||||||||||||
| Average price condition (SGD/KRW) | — | 866.14 | — | — | — | — | 866.14 | |||||||||||||||||||||
Hedge of net investments in foreign operations | ||||||||||||||||||||||||||||
| Nominal amount of the hedging instrument | ₩ | 91,636 | ₩ | — | ₩ | — | ₩ | — | ₩ | — | ₩ | — | ₩ | 91,636 | ||||||||||||||
| Average price condition (USD/KRW) | 1,071.00 | — | — | — | — | — | 1,071.00 | |||||||||||||||||||||
| Average price condition (GBP/KRW) | 1,465.26 | — | — | — | — | — | 1,465.26 | |||||||||||||||||||||
December 31, 2022 | ||||||||||||||||||||||||||||
1 year | 2 years | 3 years | 4 years | 5 years | Over 5 years | Total | ||||||||||||||||||||||
(In millions of Korean won) | ||||||||||||||||||||||||||||
Fair value hedge | ||||||||||||||||||||||||||||
| Nominal amount of the hedging instrument | ₩ | 5,612,378 | ₩ | 1,921,072 | ₩ | 2,701,675 | ₩ | 1,883,332 | ₩ | 426,551 | ₩ | 2,147,846 | ₩ | 14,692,854 | ||||||||||||||
| Average price condition (%) | 4.17 | 4.52 | 4.64 | 4.56 | 4.36 | 4.64 | 4.43 | |||||||||||||||||||||
| Average price condition (USD/KRW) | 1,197.01 | 1,262.56 | 1,276.70 | — | — | — | 1,240.59 | |||||||||||||||||||||
| Average price condition (EUR/KRW) | 1,363.42 | 1,373.32 | — | 1,436.86 | — | — | 1,387.71 | |||||||||||||||||||||
| Average price condition (AUD/KRW) | 886.23 | 895.76 | — | — | — | — | 890.17 | |||||||||||||||||||||
| Average price condition (GBP/KRW) | 1,617.02 | — | 1,535.25 | — | — | — | 1,537.85 | |||||||||||||||||||||
Cash flow hedge | ||||||||||||||||||||||||||||
| Nominal amount of the hedging instrument | ₩ | 3,033,420 | ₩ | 892,720 | ₩ | 1,846,139 | ₩ | 771,585 | ₩ | 1,078,676 | ₩ | 210,000 | ₩ | 7,832,540 | ||||||||||||||
| Average price condition (%) | 2.90 | 2.60 | 4.42 | 4.62 | 4.95 | 3.99 | 3.54 | |||||||||||||||||||||
| Average price condition (USD/KRW) | 1,178.13 | 1,196.80 | 1,166.24 | 1,225.35 | 1,252.61 | — | 1,202.02 | |||||||||||||||||||||
| Average price condition (EUR/KRW) | 1,321.00 | 1,364.00 | 1,374.73 | — | — | — | 1,362.51 | |||||||||||||||||||||
| Average price condition (AUD/KRW) | — | 856.40 | 851.50 | — | — | — | 853.40 | |||||||||||||||||||||
| Average price condition (SGD/KRW) | 866.14 | — | — | — | — | — | 866.14 | |||||||||||||||||||||
Hedge of net investments in foreign operations | ||||||||||||||||||||||||||||
| Nominal amount of the hedging instrument | ₩ | 65,012 | ₩ | 27,499 | ₩ | — | ₩ | — | ₩ | — | ₩ | — | ₩ | 92,511 | ||||||||||||||
| Average price condition (USD/KRW) | 1,071.00 | — | — | — | — | — | 1,071.00 | |||||||||||||||||||||
| Average price condition (GBP/KRW) | — | 1,465.26 | — | — | — | — | 1,465.26 | |||||||||||||||||||||
December 31, 2021 | 2021 | |||||||||||||||||||||
Carrying amount | Accumulated amount of hedge adjustments | Changes in fair value | ||||||||||||||||||||
Assets | Liabilities | Assets | Liabilities | |||||||||||||||||||
(In millions of Korean won) | ||||||||||||||||||||||
Hedge accounting | ||||||||||||||||||||||
Interest rate | Debt securities in Korean won | ₩ | 1,627,228 | ₩ | — | ₩ | (20,272 | ) | ₩ | — | ₩ | (26,247 | ) | |||||||||
| Debt securities in foreign currencies | 3,567,662 | — | (22,384 | ) | — | (71,246 | ) | |||||||||||||||
| Deposits in foreign currencies | — | 93,521 | — | (1,319 | ) | 3,222 | ||||||||||||||||
| Debentures in Korean won | — | 2,470,123 | — | (79,877 | ) | 70,308 | ||||||||||||||||
| Debentures in foreign currencies | — | 1,154,178 | — | 27,953 | 45,132 | |||||||||||||||||
| 5,194,890 | 3,717,822 | (42,656 | ) | (53,243 | ) | 21,169 | ||||||||||||||||
Currency | Debt securities in foreign currencies | 2,443,893 | — | 133,268 | — | 180,676 | ||||||||||||||||
| 2,443,893 | — | 133,268 | — | 180,676 | ||||||||||||||||||
| ₩ | 7,638,783 | ₩ | 3,717,822 | ₩ | 90,612 | ₩ | (53,243) | ₩ | 201,845 | |||||||||||||
December 31, 2022 | 2022 | |||||||||||||||||||||
Carrying amount | Accumulated amount of hedge adjustments | Changes in fair value | ||||||||||||||||||||
Assets | Liabilities | Assets | Liabilities | |||||||||||||||||||
(In millions of Korean won) | ||||||||||||||||||||||
Hedge accounting | ||||||||||||||||||||||
Interest rate | Debt securities in Korean won | ₩ | 2,467,171 | ₩ | — | ₩ | (107,444 | ) | ₩ | — | ₩ | (86,757 | ) | |||||||||
| Debt securities in foreign currencies | 3,142,973 | — | (232,085 | ) | — | (215,183 | ) | |||||||||||||||
| Deposits in foreign currencies | — | 29,429 | — | (8,591 | ) | 6,976 | ||||||||||||||||
| Debentures in Korean won | — | 5,690,371 | — | (249,629 | ) | 171,841 | ||||||||||||||||
| Debentures in foreign currencies | — | 1,196,781 | — | (95,865 | ) | 123,817 | ||||||||||||||||
| 5,610,144 | 6,916,581 | (339,529 | ) | (354,085 | ) | 694 | ||||||||||||||||
Currency | Debt securities in foreign currencies | 1,596,049 | — | 82,284 | — | 151,303 | ||||||||||||||||
| 1,596,049 | — | 82,284 | — | 151,303 | ||||||||||||||||||
| ₩ | 7,206,193 | ₩ | 6,916,581 | ₩ | (257,245 | ) | ₩ | (354,085) | ₩ | 151,997 | ||||||||||||
December 31, 2021 | 2021 | |||||||||||||||
Notional amount | Assets | Liabilities | Changes in fair value | |||||||||||||
(In millions of Korean won) | ||||||||||||||||
Interest rate | ||||||||||||||||
| Swaps | ₩ | 8,910,139 | ₩ | 127,290 | ₩ | 38,253 | ₩ | (33,227 | ) | |||||||
Currency | ||||||||||||||||
| Forwards | 1,705,213 | 2,436 | 54,855 | (174,707 | ) | |||||||||||
| ₩ | 10,615,352 | ₩ | 129,726 | ₩ | 93,108 | ₩ | (207,934 | ) | ||||||||
December 31, 2022 | 2022 | |||||||||||||||
Notional amount | Assets | Liabilities | Changes in fair value | |||||||||||||
(In millions of Korean won) | ||||||||||||||||
Interest rate | ||||||||||||||||
| Swaps | ₩ | 13,290,183 | ₩ | 186,258 | ₩ | 104,856 | ₩ | (1,244 | ) | |||||||
Currency | ||||||||||||||||
| Forwards | 1,402,671 | 36,567 | 26,008 | (129,451 | ) | |||||||||||
| ₩ | 14,692,854 | ₩ | 222,825 | ₩ | 130,864 | ₩ | (130,695 | ) | ||||||||
2020 | 2021 | 2022 | ||||||||||
(In millions of Korean won) | ||||||||||||
Hedge accounting | ||||||||||||
| Interest rate | ₩ | 5,742 | ₩ | (12,058 | ) | ₩ | (550 | ) | ||||
| Currency | 56,684 | 5,969 | 21,852 | |||||||||
| ₩ | 62,426 | ₩ | (6,089 | ) | ₩ | 21,302 | ||||||
2020 | 2021 | 2022 | ||||||||||
(In millions of Korean won) | ||||||||||||
| Gains (losses) on hedging instruments | ₩ | 89,179 | ₩ | (187,364 | ) | ₩ | (101,281 | ) | ||||
| Gains (losses) on hedged items attributable to the hedged risk | (26,899 | ) | 188,556 | 122,552 | ||||||||
| ₩ | 62,280 | ₩ | 1,192 | ₩ | 21,271 | |||||||
Cash flow hedge reserve | Changes in fair value | |||||||||||||||
December 31, 2021 | December 31, 2022 | 2021 | 2022 | |||||||||||||
(In millions of Korean won) | ||||||||||||||||
Hedge accounting | ||||||||||||||||
| Interest rate risk | ₩ | 4,864 | ₩ | 46,229 | ₩ | (36,428 | ) | ₩ | (107,134 | ) | ||||||
| Currency risk | (12,597 | ) | (22,488 | ) | 12,605 | 14,289 | ||||||||||
| ₩ | (7,733 | ) | ₩ | 23,741 | ₩ | (23,823 | ) | ₩ | (92,845 | ) | ||||||
December 31, 2021 | 2021 | |||||||||||||||
Notional amount | Assets | Liabilities | Changes in fair value | |||||||||||||
(In millions of Korean won) | ||||||||||||||||
Interest rate | ||||||||||||||||
| Swaps | ₩ | 4,553,250 | ₩ | 12,575 | ₩ | 9,532 | ₩ | 36,164 | ||||||||
Currency | ||||||||||||||||
| Swaps | 3,055,264 | 46,527 | 61,331 | 60,327 | ||||||||||||
| ₩ | 7,608,514 | ₩ | 59,102 | ₩ | 70,863 | ₩ | 96,491 | |||||||||
December 31, 2022 | 2022 | |||||||||||||||
Notional amount | Assets | Liabilities | Changes in fair value | |||||||||||||
(In millions of Korean won) | ||||||||||||||||
Interest rate | ||||||||||||||||
| Forwards | ₩ | 1,079,652 | ₩ | 20,202 | ₩ | 56,753 | ₩ | (36,372 | ) | |||||||
| Swaps | 3,231,288 | 101,975 | 124 | 111,902 | ||||||||||||
Currency | ||||||||||||||||
| Swaps | 3,521,600 | 116,961 | 98,237 | (6,379 | ) | |||||||||||
| ₩ | 7,832,540 | ₩ | 239,138 | ₩ | 155,114 | ₩ | 69,151 | |||||||||
2020 | 2021 | 2022 | ||||||||||
(In millions of Korean won) | ||||||||||||
| Gains (losses) on hedging instruments: | ₩ | (55,240 | ) | ₩ | 96,491 | ₩ | 69,151 | |||||
| Effective portion of gains (losses) on cash flow hedging instruments (recognized in other comprehensive income or loss) | (48,034 | ) | 95,478 | 71,692 | ||||||||
| Ineffective portion of gains (losses) on cash flow hedging instruments (recognized in profit or loss) | (7,206 | ) | 1,013 | (2,541 | ) | |||||||
2020 | 2021 | 2022 | ||||||||||
(In millions of Korean won) | ||||||||||||
| Other comprehensive income (loss) | ₩ | (48,034 | ) | ₩ | 95,478 | ₩ | 71,692 | |||||
| Reclassification to profit or loss | 39,190 | (53,080 | ) | (13,288 | ) | |||||||
| Income tax effect | 7,580 | (21,534 | ) | (26,930 | ) | |||||||
| ₩ | (1,264 | ) | ₩ | 20,864 | ₩ | 31,474 | ||||||
Foreign currency translation reserve | Changes in fair value | |||||||||||||||
December 31, 2021 | December 31, 2022 | 2021 | 2022 | |||||||||||||
(In millions of Korean won) | ||||||||||||||||
Hedge accounting | ||||||||||||||||
| Currency risk | ₩ | (35,658 | ) | ₩ | (114,743 | ) | ₩ | 88,729 | ₩ | 104,021 | ||||||
December 31, 2021 | 2021 | |||||||||||||||
Notional amount | Assets | Liabilities | Changes in fair value | |||||||||||||
(In millions of Korean won) | ||||||||||||||||
Currency | ||||||||||||||||
| Forwards | ₩ | 91,636 | ₩ | — | ₩ | 8,498 | ₩ | (8,494 | ) | |||||||
| Debentures in foreign currencies | 1,273,227 | — | 1,273,227 | (80,235 | ) | |||||||||||
| ₩ | 1,364,863 | ₩ | — | ₩ | 1,281,725 | ₩ | (88,729 | ) | ||||||||
December 31, 2022 | 2022 | |||||||||||||||
Notional amount | Assets | Liabilities | Changes in fair value | |||||||||||||
(In millions of Korean won) | ||||||||||||||||
Currency | ||||||||||||||||
| Forwards | ₩ | 92,511 | ₩ | — | ₩ | 11,194 | ₩ | (16,168 | ) | |||||||
| Debentures in foreign currencies | 1,361,080 | — | 1,361,080 | (87,853 | ) | |||||||||||
| ₩ | 1,453,591 | ₩ | — | ₩ | 1,372,274 | ₩ | (104,021 | ) | ||||||||
December 31, 2021 | December 31, 2022 | |||||||
(In millions of Korean won) | ||||||||
| Debentures in foreign currencies | ₩ | 1,275,291 | ₩ | 1,211,215 | ||||
2020 | 2021 | 2022 | ||||||||||
(In millions of Korean won) | ||||||||||||
| Gains (losses) on hedging instruments: | ₩ | 88,769 | ₩ | (88,729 | ) | ₩ | (104,021 | ) | ||||
| Effective portion of gains (losses) on hedge of net investments in foreign operations (recognized in other comprehensive income or loss) | 88,769 | (88,729 | ) | (104,021 | ) | |||||||
| Ineffective portion of gains (losses) on hedge of net investments in foreign operations (recognized in profit or loss) | — | — | — | |||||||||
2020 | 2021 | 2022 | ||||||||||
(In millions of Korean won) | ||||||||||||
| Other comprehensive income (loss) | ₩ | 88,769 | ₩ | (88,729 | ) | ₩ | (104,021 | ) | ||||
| Reclassification to profit or loss | — | 5,195 | — | |||||||||
| Income tax effect | (24,500 | ) | 25,599 | 24,936 | ||||||||
| ₩ | 64,269 | ₩ | (57,935 | ) | ₩ | (79,085 | ) | |||||
December 31, 2022 | ||||||||||||||||
Interest rate benchmark | Currency | Carrying amount of non-derivative assets | Carrying amount of non-derivative liabilities | Notional amount of hedging instruments | ||||||||||||
(In millions of Korean won and millions of US dollars) | ||||||||||||||||
| CD#3M | KRW | 2,760,791 | 5,690,371 | 6,440,000 | ||||||||||||
| USD#LIBOR#3M | USD | 1,895 | 1,385 | 3,753 | ||||||||||||
| USD#LIBOR#6M | USD | 167 | — | 182 | ||||||||||||
December 31, 2021 | December 31, 2022 | |||||||
(In millions of Korean won) | ||||||||
| Loans measured at amortized cost | ₩ | 420,910,259 | ₩ | 440,137,603 | ||||
| Deferred loan origination fees and costs | 674,069 | 551,524 | ||||||
| Less: Allowances for credit losses | (3,684,055 | ) | (4,158,625 | ) | ||||
| ₩ | 417,900,273 | ₩ | 436,530,502 | |||||
December 31, 2021 | December 31, 2022 | |||||||
(In millions of Korean won) | ||||||||
| Loans measured at amortized cost | ₩ | 8,325,177 | ₩ | 9,751,737 | ||||
| Less: Allowances for credit losses | (443 | ) | (1,951 | ) | ||||
| ₩ | 8,324,734 | ₩ | 9,749,786 | |||||
December 31, 2021 | ||||||||||||||||
Retail | Corporate | Credit card | Total | |||||||||||||
(In millions of Korean won) | ||||||||||||||||
| Loans in Korean won | ₩ | 184,872,384 | ₩ | 162,081,901 | ₩ | — | ₩ | 346,954,285 | ||||||||
| Loans in foreign currencies | 3,990,253 | 20,865,495 | — | 24,855,748 | ||||||||||||
| Domestic import usance bills | — | 3,311,142 | — | 3,311,142 | ||||||||||||
Off-shore funding loans | — | 1,064,623 | — | 1,064,623 | ||||||||||||
| Call loans | — | 902,301 | — | 902,301 | ||||||||||||
| Bills bought in Korean won | — | 2,209 | — | 2,209 | ||||||||||||
| Bills bought in foreign currencies | — | 2,001,046 | — | 2,001,046 | ||||||||||||
| Guarantee payments under acceptances and guarantees | 7 | 20,773 | — | 20,780 | ||||||||||||
| Credit card receivables in Korean won | — | — | 20,766,340 | 20,766,340 | ||||||||||||
| Credit card receivables in foreign currencies | — | — | 57,980 | 57,980 | ||||||||||||
| Bonds purchased under repurchase agreements | — | 4,855,194 | — | 4,855,194 | ||||||||||||
| Privately placed bonds | — | 758,557 | — | 758,557 | ||||||||||||
| Factored receivables | 113 | 458 | — | 571 | ||||||||||||
| Lease receivables | 778,425 | 513,714 | — | 1,292,139 | ||||||||||||
| Loans for installment credit | 6,265,896 | 150,340 | — | 6,416,236 | ||||||||||||
| 195,907,078 | 196,527,753 | 20,824,320 | 413,259,151 | |||||||||||||
| Proportion (%) | 47.40 | 47.56 | 5.04 | 100.00 | ||||||||||||
| Less: Allowances for credit losses | (1,004,995 | ) | (1,886,473 | ) | (792,144 | ) | (3,683,612 | ) | ||||||||
| ₩ | 194,902,083 | ₩ | 194,641,280 | ₩ | 20,032,176 | ₩ | 409,575,539 | |||||||||
December 31, 2022 | ||||||||||||||||
Retail | Corporate | Credit card | Total | |||||||||||||
(In millions of Korean won) | ||||||||||||||||
| Loans in Korean won | ₩ | 181,125,018 | ₩ | 177,396,151 | ₩ | — | ₩ | 358,521,169 | ||||||||
| Loans in foreign currencies | 4,668,207 | 26,052,080 | — | 30,720,287 | ||||||||||||
| Domestic import usance bills | — | 4,499,072 | — | 4,499,072 | ||||||||||||
Off-shore funding loans | — | 908,266 | — | 908,266 | ||||||||||||
| Call loans | — | 119,066 | — | 119,066 | ||||||||||||
| Bills bought in Korean won | — | 285,727 | — | 285,727 | ||||||||||||
| Bills bought in foreign currencies | — | 1,780,873 | — | 1,780,873 | ||||||||||||
| Guarantee payments under acceptances and guarantees | 1 | 18,459 | — | 18,460 | ||||||||||||
| Credit card receivables in Korean won | — | — | 22,562,217 | 22,562,217 | ||||||||||||
| Credit card receivables in foreign currencies | — | — | 47,376 | 47,376 | ||||||||||||
| Bonds purchased under repurchase agreements | — | 3,028,657 | — | 3,028,657 | ||||||||||||
| Privately placed bonds | — | 853,986 | — | 853,986 | ||||||||||||
| Factored receivables | 111 | 4 | — | 115 | ||||||||||||
| Lease receivables | 576,165 | 558,318 | — | 1,134,483 | ||||||||||||
| Loans for installment credit | 5,915,223 | 542,413 | — | 6,457,636 | ||||||||||||
| 192,284,725 | 216,043,072 | 22,609,593 | 430,937,390 | |||||||||||||
| Proportion (%) | 44.62 | 50.13 | 5.25 | 100.00 | ||||||||||||
| Less: Allowances for credit losses | (1,335,388 | ) | (1,983,444 | ) | (837,842 | ) | (4,156,674 | ) | ||||||||
| ₩ | 190,949,337 | ₩ | 214,059,628 | ₩ | 21,771,751 | ₩ | 426,780,716 | |||||||||
2021 | ||||||||||||||||||||
Beginning | Increase | Decrease | Others | Ending | ||||||||||||||||
(In millions of Korean won) | ||||||||||||||||||||
Deferred loan origination costs | ||||||||||||||||||||
| Loans in Korean won | ₩ | 673,957 | ₩ | 418,732 | ₩ | (424,785 | ) | ₩ | — | ₩ | 667,904 | |||||||||
Others 1 | 95,590 | 44,728 | (63,619 | ) | (4 | ) | 76,695 | |||||||||||||
| 769,547 | 463,460 | (488,404 | ) | (4 | ) | 744,599 | ||||||||||||||
Deferred loan origination fees | ||||||||||||||||||||
| Loans in Korean won | 9,148 | 11,909 | (3,556 | ) | — | 17,501 | ||||||||||||||
Others 2 | 44,072 | 32,667 | (27,332 | ) | 3,622 | 53,029 | ||||||||||||||
| 53,220 | 44,576 | (30,888 | ) | 3,622 | 70,530 | |||||||||||||||
| ₩ | 716,327 | ₩ | 418,884 | ₩ | (457,516 | ) | ₩ | (3,626 | ) | ₩ | 674,069 | |||||||||
2022 | ||||||||||||||||||||
Beginning | Increase | Decrease | Others | Ending | ||||||||||||||||
(In millions of Korean won) | ||||||||||||||||||||
Deferred loan origination costs | ||||||||||||||||||||
| Loans in Korean won | ₩ | 667,904 | ₩ | 291,342 | ₩ | (380,718 | ) | ₩ | — | ₩ | 578,528 | |||||||||
Others 1 | 76,695 | 38,913 | (47,445 | ) | 4 | 68,167 | ||||||||||||||
| 744,599 | 330,255 | (428,163 | ) | 4 | 646,695 | |||||||||||||||
Deferred loan origination fees | ||||||||||||||||||||
| Loans in Korean won | 17,501 | 23,780 | (13,117 | ) | — | 28,164 | ||||||||||||||
Others 2 | 53,029 | 49,245 | (37,730 | ) | 2,463 | 67,007 | ||||||||||||||
| 70,530 | 73,025 | (50,847 | ) | 2,463 | 95,171 | |||||||||||||||
| ₩ | 674,069 | ₩ | 257,230 | ₩ | (377,316 | ) | ₩ | (2,459 | ) | ₩ | 551,524 | |||||||||
| 1 | Includes deferred loan origination costs related to credit card receivables, loans for installment credit, and finance lease receivables. |
| 2 | Includes deferred loan origination fees related to loans in foreign currencies executed by PT Bank KB Bukopin Tbk and PRASAC Microfinance Institution Plc. |
2021 | ||||||||||||||||||||||||||||||||||||
Retail | Corporate | Credit card | ||||||||||||||||||||||||||||||||||
12-month expected credit losses | Lifetime expected credit losses | 12-month expected credit losses | Lifetime expected credit losses | 12-month expected credit losses | Lifetime expected credit losses | |||||||||||||||||||||||||||||||
Non-impaired | Impaired | Non-impaired | Impaired | Non-impaired | Impaired | |||||||||||||||||||||||||||||||
(In millions of Korean won) | ||||||||||||||||||||||||||||||||||||
| Beginning | ₩ | 403,805 | ₩ | 240,578 | ₩ | 265,705 | ₩ | 368,782 | ₩ | 410,937 | ₩ | 892,061 | ₩ | 205,157 | ₩ | 234,219 | ₩ | 262,119 | ||||||||||||||||||
| Transfer between stages: | ||||||||||||||||||||||||||||||||||||
Transfer to 12-month expected credit losses | 125,634 | (120,132 | ) | (5,502 | ) | 133,798 | (71,772 | ) | (62,026 | ) | 45,938 | (44,858 | ) | (1,080 | ) | |||||||||||||||||||||
| Transfer to lifetime expected credit losses | (97,040 | ) | 115,427 | (18,387 | ) | (71,902 | ) | 92,245 | (20,343 | ) | (34,208 | ) | 35,846 | (1,638 | ) | |||||||||||||||||||||
| Impairment | (6,312 | ) | (49,244 | ) | 55,556 | (2,942 | ) | (42,158 | ) | 45,100 | (2,228 | ) | (12,580 | ) | 14,808 | |||||||||||||||||||||
| Write-offs | — | 12 | (411,083 | ) | — | (3 | ) | (239,815 | ) | — | — | (440,721 | ) | |||||||||||||||||||||||
| Sales | (1,112 | ) | (53 | ) | (3,592 | ) | (179 | ) | — | (16,257 | ) | — | — | — | ||||||||||||||||||||||
Provision (reversal) for credit losses 1,2 | 40,616 | 52,528 | 397,492 | 14,299 | 88,230 | 338,746 | (39,533 | ) | 110,022 | 474,041 | ||||||||||||||||||||||||||
| Business combination | 8,315 | 2,223 | 7,194 | — | — | 1,654 | — | — | — | |||||||||||||||||||||||||||
| Others (exchange differences, etc.) | 77 | 532 | 1,758 | 5,942 | 675 | 21,844 | 42 | — | (13,202 | ) | ||||||||||||||||||||||||||
Ending 3 | ₩ | 473,983 | ₩ | 241,871 | ₩ | 289,141 | ₩ | 447,798 | ₩ | 478,154 | ₩ | 960,964 | ₩ | 175,168 | ₩ | 322,649 | ₩ | 294,327 | ||||||||||||||||||
2022 | ||||||||||||||||||||||||||||||||||||
Retail | Corporate | Credit card | ||||||||||||||||||||||||||||||||||
12-month expected credit losses | Lifetime expected credit losses | 12-month expected credit losses | Lifetime expected credit losses | 12-month expected credit losses | Lifetime expected credit losses | |||||||||||||||||||||||||||||||
Non-impaired | Impaired | Non-impaired | Impaired | Non-impaired | Impaired | |||||||||||||||||||||||||||||||
(In millions of Korean won) | ||||||||||||||||||||||||||||||||||||
| Beginning | ₩ | 473,983 | ₩ | 241,871 | ₩ | 289,141 | ₩ | 447,798 | ₩ | 478,154 | ₩ | 960,964 | ₩ | 175,168 | ₩ | 322,649 | ₩ | 294,327 | ||||||||||||||||||
| Transfer between stages: | ||||||||||||||||||||||||||||||||||||
Transfer to 12-month expected credit losses | 129,975 | (122,881 | ) | (7,094 | ) | 127,679 | (120,619 | ) | (7,060 | ) | 57,128 | (50,836 | ) | (6,292 | ) | |||||||||||||||||||||
| Transfer to lifetime expected credit losses | (102,988 | ) | 122,804 | (19,816 | ) | (93,169 | ) | 125,031 | (31,862 | ) | (23,042 | ) | 24,324 | (1,282 | ) | |||||||||||||||||||||
| Impairment | (6,042 | ) | (52,137 | ) | 58,179 | (13,524 | ) | (48,220 | ) | 61,744 | (2,129 | ) | (19,219 | ) | 21,348 | |||||||||||||||||||||
| Write-offs | — | (1 | ) | (448,376 | ) | — | (3 | ) | (617,332 | ) | — | — | (450,389 | ) | ||||||||||||||||||||||
| Sales | (810 | ) | (163 | ) | (5,689 | ) | (103 | ) | (145 | ) | (70,603 | ) | — | — | — | |||||||||||||||||||||
Provision (reversal) for credit losses 1,2 | 108,300 | 94,535 | 595,991 | 49,789 | 126,627 | 690,534 | (43,497 | ) | 77,418 | 480,849 | ||||||||||||||||||||||||||
| Others (exchange differences, etc.) | (1,332 | ) | (647 | ) | (11,415 | ) | 3,701 | 1,111 | (85,097 | ) | (443 | ) | (21 | ) | (18,219 | ) | ||||||||||||||||||||
Ending 3 | ₩ | 601,086 | 283,381 | 450,921 | 522,171 | 561,936 | 901,288 | 163,185 | 354,315 | 320,342 | ||||||||||||||||||||||||||
| 1 | Provision for credit losses in the consolidated statements of comprehensive income also includes provision (reversal) for credit losses of due from financial institutions (Note 7.3), provision (reversal) for credit losses of financial investments (Note 12.5), provision (reversal) for credit losses of unused commitments, acceptances and guarantees (Note 24.2), provision (reversal) for credit losses of financial guarantee contracts (Note 24.3), and provision (reversal) for credit losses of other financial assets (Note 19.2). |
| 2 | Includes ₩ 387,860 million and ₩ 415,998 million of collections from written-off loans for the years ended December 31, 2021 and 2022, respectively. |
2021 | ||||||||||||
12-month expected credit losses | Lifetime expected credit losses | |||||||||||
Non-impaired | Impaired | |||||||||||
(In millions of Korean won) | ||||||||||||
| Beginning | ₩ | 348,518,780 | ₩ | 28,504,202 | ₩ | 3,427,365 | ||||||
| Transfer between stages: | ||||||||||||
Transfer to 12-month expected credit losses | 31,046,440 | (30,615,747 | ) | (430,693 | ) | |||||||
Transfer to lifetime expected credit losses (non-impaired) | (36,815,970 | ) | 37,276,737 | (460,767 | ) | |||||||
| Transfer to lifetime expected credit losses (impaired) | (668,120 | ) | (1,486,835 | ) | 2,154,955 | |||||||
| Write-offs | — | 9 | (1,091,619 | ) | ||||||||
| Sales | (2,892,774 | ) | (8,541 | ) | (151,714 | ) | ||||||
| Business combination | 116,067 | 3,924 | 12,808 | |||||||||
| Net increase (decrease) (execution, repayment, and others) | 46,013,068 | (895,012 | ) | 27,765 | ||||||||
| Ending | ₩ | 385,317,491 | ₩ | 32,778,737 | ₩ | 3,488,100 | ||||||
2022 | ||||||||||||
12-month expected credit losses | Lifetime expected credit losses | |||||||||||
Non-impaired | Impaired | |||||||||||
(In millions of Korean won) | ||||||||||||
| Beginning | ₩ | 385,317,491 | ₩ | 32,778,737 | ₩ | 3,488,100 | ||||||
| Transfer between stages: | ||||||||||||
Transfer to 12-month expected credit losses | 34,445,894 | (34,282,273 | ) | (163,621 | ) | |||||||
Transfer to lifetime expected credit losses (non-impaired) | (38,397,090 | ) | 38,818,713 | (421,623 | ) | |||||||
| Transfer to lifetime expected credit losses (impaired) | (1,127,437 | ) | (1,478,968 | ) | 2,606,405 | |||||||
| Write-offs | — | (4 | ) | (1,516,097 | ) | |||||||
| Sales | (3,182,398 | ) | (15,961 | ) | (270,541 | ) | ||||||
| Net increase (decrease) (execution, repayment, and others) | 25,587,528 | (1,325,731 | ) | (171,997 | ) | |||||||
| Ending | ₩ | 402,643,988 | ₩ | 34,494,513 | ₩ | 3,550,626 | ||||||
December 31, 2021 | December 31, 2022 | |||||||
(In millions of Korean won) | ||||||||
Financial assets at fair value through profit or loss | ||||||||
| Debt securities: | ||||||||
| Government and public bonds | ₩ | 8,294,084 | ₩ | 8,405,662 | ||||
| Financial bonds | 16,887,594 | 12,121,116 | ||||||
| Corporate bonds | 5,433,010 | 4,289,284 | ||||||
| Asset-backed securities | 197,865 | 164,543 | ||||||
| Beneficiary certificates | 15,849,129 | 18,320,226 | ||||||
| Derivative-linked securities | 1,543,188 | 1,713,779 | ||||||
| Other debt securities | 14,797,822 | 16,773,117 | ||||||
| Equity securities: | ||||||||
| Stocks | 1,804,507 | 1,880,611 | ||||||
| Other equity securities | 614,956 | 613,969 | ||||||
| Loans: | ||||||||
| Privately placed bonds | 230,006 | 158,731 | ||||||
| Other loans | 39,290 | 334,831 | ||||||
| Due from financial institutions: | ||||||||
| Other due from financial institutions | 200,742 | 69,469 | ||||||
| Others | 113,622 | 90,006 | ||||||
| ₩ | 66,005,815 | ₩ | 64,935,344 | |||||
Financial investments | ||||||||
| Financial assets at fair value through other comprehensive income | ||||||||
| Debt securities: | ||||||||
| Government and public bonds | ₩ | 14,317,477 | ₩ | 15,974,281 | ||||
| Financial bonds | 21,928,735 | 20,632,077 | ||||||
| Corporate bonds | 18,986,005 | 18,282,144 | ||||||
| Asset-backed securities | 996,428 | 436,840 | ||||||
| Other debt securities | 30,866 | 284,977 | ||||||
| Equity securities: | ||||||||
| Stocks | 3,588,415 | 1,907,737 | ||||||
| Equity investments | 27,211 | 17,096 | ||||||
| Other equity securities | 187,502 | 401,545 | ||||||
| Loans: | ||||||||
| Privately placed bonds | 299,634 | 363,144 | ||||||
| Other loans | 13,970 | — | ||||||
| 60,376,243 | 58,299,841 | |||||||
| Financial assets at amortized cost | ||||||||
| Debt securities: | ||||||||
| Government and public bonds | 21,447,622 | 23,180,348 | ||||||
| Financial bonds | 3,850,954 | 11,325,479 | ||||||
| Corporate bonds | 12,246,441 | 15,770,225 | ||||||
| Asset-backed securities | 6,899,675 | 7,654,857 | ||||||
| Other debt securities | 31,105 | 363,985 | ||||||
| Less: Allowances for credit losses | (4,169 | ) | (6,160 | ) | ||||
| 44,471,628 | 58,288,734 | |||||||
| ₩ | 104,847,871 | ₩ | 116,588,575 | |||||
2021 | 2022 | |||||||||||||||||
From the equity securities derecognized | From the equity securities held | From the equity securities derecognized | From the equity securities held | |||||||||||||||
(In millions of Korean won) | ||||||||||||||||||
| Equity securities measured at fair value through other comprehensive income: | ||||||||||||||||||
| Stocks | Listed | ₩ | 7,106 | ₩ | 300 | ₩ | — | ₩ | 976 | |||||||||
| Unlisted | 372 | 19,035 | — | 20,658 | ||||||||||||||
| Equity investments | — | 114 | — | — | ||||||||||||||
| Other equity securities | — | 6,877 | — | 15,041 | ||||||||||||||
| ₩ | 7,478 | ₩ | 26,326 | ₩ | — | ₩ | 36,675 | |||||||||||
2021 | 2022 | |||||||||||||||||
Disposal price | Accumulated other comprehensive income (loss) as of disposal date | Disposal price | Accumulated other comprehensive income (loss) as of disposal date | |||||||||||||||
(In millions of Korean won) | ||||||||||||||||||
| Equity securities measured at fair value through other comprehensive income: | ||||||||||||||||||
| Stocks | Listed | ₩ | 575,288 | ₩ | (313,427 | ) | ₩ | 425,736 | ₩ | 335,203 | ||||||||
| Unlisted | 5,577 | 4,559 | — | — | ||||||||||||||
| ₩ | 580,865 | ₩ | (308,868 | ) | ₩ | 425,736 | ₩ | 335,203 | ||||||||||
2020 | ||||||||||||
Provision | Reversal | Total | ||||||||||
(In millions of Korean won) | ||||||||||||
| Securities measured at fair value through other comprehensive income | ₩ | 4,297 | ₩ | (229 | ) | ₩ | 4,068 | |||||
| Loans measured at fair value through other comprehensive income | 202 | (316 | ) | (114 | ) | |||||||
| Securities measured at amortized cost | 1,916 | (636 | ) | 1,280 | ||||||||
| ₩ | 6,415 | ₩ | (1,181 | ) | ₩ | 5,234 | ||||||
2021 | ||||||||||||
Provision | Reversal | Total | ||||||||||
(In millions of Korean won) | ||||||||||||
| Securities measured at fair value through other comprehensive income | ₩ | 7,466 | ₩ | (385 | ) | ₩ | 7,081 | |||||
| Loans measured at fair value through other comprehensive income | 237 | (15 | ) | 222 | ||||||||
| Securities measured at amortized cost | 1,892 | (691 | ) | 1,201 | ||||||||
| ₩ | 9,595 | ₩ | (1,091 | ) | ₩ | 8,504 | ||||||
2022 | ||||||||||||
Provision | Reversal | Total | ||||||||||
(In millions of Korean won) | ||||||||||||
| Securities measured at fair value through other comprehensive income | ₩ | 2,009 | ₩ | (4,896 | ) | ₩ | (2,887 | ) | ||||
| Loans measured at fair value through other comprehensive income | 72 | (260 | ) | (188 | ) | |||||||
| Securities measured at amortized cost | 2,808 | (828 | ) | 1,980 | ||||||||
| ₩ | 4,889 | ₩ | (5,984 | ) | ₩ | (1,095 | ) | |||||
2021 | ||||||||||||
12-month expected credit losses | Lifetime expected credit losses | |||||||||||
Non-impaired | Impaired | |||||||||||
(In millions of Korean won) | ||||||||||||
| Beginning | ₩ | 9,908 | ₩ | 39 | ₩ | 73 | ||||||
| Transfer between stages: | ||||||||||||
Transfer to 12-month expected credit losses | — | — | — | |||||||||
| Transfer to lifetime expected credit losses | — | — | — | |||||||||
| Sales | (1,568 | ) | (4 | ) | — | |||||||
| Provision (reversal) for credit losses | 8,512 | (11 | ) | 3 | ||||||||
| Others | (32 | ) | 4 | — | ||||||||
| Ending | ₩ | 16,820 | ₩ | 28 | ₩ | 76 | ||||||
2022 | ||||||||||||
12-month expected credit losses | Lifetime expected credit losses | |||||||||||
Non-impaired | Impaired | |||||||||||
(In millions of Korean won) | ||||||||||||
| Beginning | ₩ | 16,820 | ₩ | 28 | ₩ | 76 | ||||||
| Transfer between stages: | ||||||||||||
Transfer to 12-month expected credit losses | — | — | — | |||||||||
| Transfer to lifetime expected credit losses | — | — | — | |||||||||
| Sales | (533 | ) | (20 | ) | — | |||||||
| Provision (reversal) for credit losses | (1,358 | ) | 263 | — | ||||||||
| Others | 255 | — | �� | — | ||||||||
| Ending | ₩ | 15,184 | ₩ | 271 | ₩ | 76 | ||||||
December 31, 2021 | ||||||||||||||||||||
Ownership (%) | Acquisition cost | Share of net asset amount | Carrying amount | Industry | Location | |||||||||||||||
(In millions of Korean won) | ||||||||||||||||||||
KB Pre IPO Secondary Venture Fund No.1 1 | 15.19 | ₩ | 259 | ₩ | 1,622 | ₩ | 1,622 | Investment finance | Korea | |||||||||||
KB-KDBC Pre-IPO New Technology Business Investment Fund2 | 66.66 | 8,801 | 11,789 | 11,789 | Investment finance | Korea | ||||||||||||||
| KB Star Office Private Real Estate Master Fund No.1 | 21.05 | 20,000 | 26,240 | 26,240 | Investment finance | Korea | ||||||||||||||
Balhae Infrastructure Company 1 | 12.61 | 105,924 | 99,785 | 99,785 | Investment finance | Korea | ||||||||||||||
| Aju Good Technology Venture Fund | 38.46 | 12,343 | 22,921 | 22,921 | Investment finance | Korea | ||||||||||||||
| SY Auto Capital Co., Ltd. | 49.00 | 9,800 | 19,835 | 18,222 | Auto loans | Korea | ||||||||||||||
Incheon Bridge Co., Ltd. 1 | 14.99 | 9,158 | (19,481 | ) | — | Operation of highways and related facilities | Korea | |||||||||||||
Big Dipper Co., Ltd. 1 | 25.14 | 440 | (147 | ) | — | Research, consulting, and big data | Korea | |||||||||||||
Paycoms Co., Ltd. 3 | 11.05 | 800 | 181 | 525 | System software publishing | Korea | ||||||||||||||
Food Factory Co., Ltd. 4 | 22.22 | 1,000 | 633 | 1,320 | Farm product distribution | Korea | ||||||||||||||
KBSP Private Equity Fund No.4 1 | 14.95 | 6,100 | 5,628 | 5,628 | Investment finance | Korea | ||||||||||||||
Korea Credit Bureau Co., Ltd. 1 | 9.00 | 4,500 | 4,497 | 4,497 | Credit information | Korea | ||||||||||||||
| KB Social Impact Investment Fund | 30.00 | 4,500 | 4,282 | 4,282 | Investment finance | Korea | ||||||||||||||
KB-Solidus Global Healthcare Fund2 | 43.33 | 45,557 | 48,201 | 48,898 | Investment finance | Korea | ||||||||||||||
POSCO-KB Shipbuilding Fund | 31.25 | 2,776 | 5,413 | 5,413 | Investment finance | Korea | ||||||||||||||
KB-TS Technology Venture Private Equity Fund2 | 56.00 | 14,280 | 16,828 | 16,828 | Investment finance | Korea | ||||||||||||||
KB-Brain KOSDAQScale-up New Technology Business Investment Fund2 | 42.55 | 25,250 | 29,669 | 28,919 | Investment finance | Korea | ||||||||||||||
KB-SJ Tourism Venture Fund1 | 18.52 | 4,999 | 4,146 | 4,146 | Investment finance | Korea | ||||||||||||||
| UNION Media Commerce Fund | 28.99 | 1,000 | 959 | 959 | Investment finance | Korea | ||||||||||||||
KB-Stonebridge Secondary Private Equity Fund1 | 14.56 | 21,641 | 21,948 | 21,948 | Investment finance | Korea | ||||||||||||||
KB SPROTT Renewable Private Equity Fund No.1 2 | 37.69 | 5,795 | 4,680 | 4,680 | Investment finance | Korea | ||||||||||||||
KB-UTC Inno-Tech Venture Fund2 | 44.29 | 21,375 | 20,972 | 20,972 | Investment finance | Korea | ||||||||||||||
| WJ Private Equity Fund No.1 | 26.95 | 10,000 | 9,604 | 9,604 | Investment finance | Korea | ||||||||||||||
All Together Korea Fund No.2 5 | 99.99 | 10,000 | 10,070 | 10,070 | Asset management | Korea | ||||||||||||||
KB-NAU Special Situation Corporate Restructuring Private Equity Fund1 | 12.00 | 13,392 | 15,254 | 15,254 | Asset management | Korea | ||||||||||||||
| Project Vanilla Co., Ltd. | 49.00 | 2,450 | 525 | 525 | Investment finance | Korea | ||||||||||||||
December & Company Inc. 1 | 16.78 | 25,330 | 9,054 | 21,388 | Investment finance | Korea | ||||||||||||||
2020 KB Fintech Renaissance Fund 1 | 5.05 | 550 | 618 | 618 | Investment finance | Korea | ||||||||||||||
KB Material and Parts No.1 PEF 1 | 14.47 | 3,400 | 3,343 | 3,343 | Investment finance | Korea | ||||||||||||||
| FineKB Private Equity Fund No.1 | 25.00 | 8,375 | 8,067 | 8,067 | Investment finance | Korea | ||||||||||||||
KB Bio Private Equity No.3 Ltd. 1 | 12.20 | 10,000 | 9,950 | 9,950 | Investment finance | Korea | ||||||||||||||
| G payment Joint Stock Company | 43.84 | 9,029 | 3,175 | 9,350 | Investment advisory and securities trading | Vietnam | ||||||||||||||
498 Seventh Owners LLC 6 | 49.90 | 166,851 | — | — | Real estate investment | United States | ||||||||||||||
| Smart Korea KB Future9-Sejong Venture Fund | 38.46 | 1,000 | 962 | 962 | Investment finance | Korea | ||||||||||||||
KB-KTB Technology Venture Fund2 | 50.50 | 5,600 | 5,503 | 5,554 | Investment finance | Korea | ||||||||||||||
KB-SOLIDUS Healthcare Investment Fund2 | 88.23 | 1,800 | 1,800 | 1,800 | Investment finance | Korea | ||||||||||||||
| Paramark KB Fund No.1 | 20.69 | 2,040 | 1,850 | 1,850 | Investment finance | Korea | ||||||||||||||
| Others | 2,475 | 81 | 789 | |||||||||||||||||
| ₩ | 598,590 | ₩ | 410,457 | ₩ | 448,718 | |||||||||||||||
December 31, 2022 | ||||||||||||||||||||
Ownership (%) | Acquisition cost | Share of net asset amount | Carrying amount | Industry | Location | |||||||||||||||
(In millions of Korean won) | ||||||||||||||||||||
KB-KDBC Pre-IPO New Technology Business Investment Fund2 | 66.66 | ₩ | 3,601 | ₩ | 5,978 | ₩ | 5,978 | Investment finance | Korea | |||||||||||
Balhae Infrastructure Company 1 | 12.61 | 96,516 | 90,653 | 90,617 | Investment finance | Korea | ||||||||||||||
| Aju Good Technology Venture Fund | 38.47 | 8,143 | 19,840 | 19,836 | Investment finance | Korea | ||||||||||||||
| SY Auto Capital Co., Ltd. | 49.00 | 9,800 | 20,250 | 19,162 | Auto loans | Korea | ||||||||||||||
Incheon Bridge Co., Ltd. 1 | 14.99 | 9,158 | (15,963 | ) | — | Operation of highways and related facilities | Korea | |||||||||||||
Big Dipper Co., Ltd. 1 | 17.86 | 440 | 60 | 60 | Research, consulting, and big data | Korea | ||||||||||||||
Paycoms Co., Ltd. 3 | 12.24 | 800 | 201 | 213 | System software publishing | Korea | ||||||||||||||
Food Factory Co., Ltd. 4 | 22.22 | 1,000 | 696 | 1,399 | Farm product distribution | Korea | ||||||||||||||
KBSP Private Equity Fund No.4 1 | 14.95 | 6,100 | 1,892 | 1,892 | Investment finance | Korea | ||||||||||||||
Korea Credit Bureau Co., Ltd. 1 | 9.00 | 4,500 | 4,959 | 4,959 | Credit information | Korea | ||||||||||||||
| KB Social Impact Investment Fund | 30.00 | 4,500 | 4,266 | 4,266 | Investment finance | Korea | ||||||||||||||
KB-Solidus Global Healthcare Fund2 | 43.33 | 25,927 | 21,735 | 22,432 | Investment finance | Korea | ||||||||||||||
POSCO-KB Shipbuilding Fund | 31.25 | 1,826 | 4,798 | 4,798 | Investment finance | Korea | ||||||||||||||
KB-TS Technology Venture Private Equity Fund2 | 56.00 | 9,744 | 13,794 | 13,794 | Investment finance | Korea | ||||||||||||||
KB-Brain KOSDAQScale-up New Technology Business Investment Fund2 | 42.55 | 12,450 | 17,801 | 17,051 | Investment finance | Korea | ||||||||||||||
KB-SJ Tourism Venture Fund1 | 18.52 | 4,599 | 3,773 | 3,773 | Investment finance | Korea | ||||||||||||||
| UNION Media Commerce Fund | 28.99 | 1,000 | 957 | 957 | Investment finance | Korea | ||||||||||||||
KB-Stonebridge Secondary Private Equity Fund1 | 14.56 | 23,801 | 25,144 | 25,144 | Investment finance | Korea | ||||||||||||||
KB SPROTT Renewable Private Equity Fund No.1 2 | 37.69 | 18,041 | 16,539 | 16,539 | Investment finance | Korea | ||||||||||||||
KB-UTC Inno-Tech Venture Fund2 | 44.29 | 21,375 | 19,180 | 19,180 | Investment finance | Korea | ||||||||||||||
| WJ Private Equity Fund No.1 | 26.95 | 10,000 | 9,542 | 9,542 | Investment finance | Korea | ||||||||||||||
All Together Korea Fund No.2 5 | 99.99 | 10,000 | 10,244 | 10,244 | Asset management | Korea | ||||||||||||||
KB-NAU Special Situation Corporate Restructuring Private Equity Fund1 | 12.00 | 10,006 | 12,554 | 12,554 | Asset management | Korea | ||||||||||||||
December & Company Inc. 1 | 16.78 | 29,951 | 3,735 | 16,029 | Investment finance | Korea | ||||||||||||||
2020 KB Fintech Renaissance Fund 1 | 5.05 | 550 | 630 | 630 | Investment finance | Korea | ||||||||||||||
KB Material and Parts No.1 PEF 1 | 14.47 | 3,400 | 3,321 | 3,321 | Investment finance | Korea | ||||||||||||||
| FineKB Private Equity Fund No.1 | 25.00 | 12,775 | 10,483 | 10,483 | Investment finance | Korea | ||||||||||||||
| G payment Joint Stock Company | 43.84 | 9,029 | 2,917 | 9,281 | Investment advisory and securities trading | Vietnam | ||||||||||||||
KB-GeneN Medical Venture Fund No.1 | 22.52 | 2,000 | 1,965 | 1,965 | Investment finance | Korea | ||||||||||||||
KB-BridgePole Venture Investment Fund1 | 6.30 | 850 | 835 | 835 | Investment finance | Korea | ||||||||||||||
KB-Kyobo New Mobility Power Fund | 28.57 | 3,000 | 2,826 | 2,826 | Investment finance | Korea | ||||||||||||||
DA-Friend New Technology Investment Fund No.2 | 27.06 | 988 | 949 | 949 | Investment finance | Korea | ||||||||||||||
| Cornerstone Pentastone Fund No.4 | 21.52 | 818 | 792 | 792 | Investment finance | Korea | ||||||||||||||
SKS-VLP New Technology Investment Fund No.2 | 23.11 | 1,156 | 1,121 | 1,121 | Investment finance | Korea | ||||||||||||||
| Star-Lord General Investors Private Real Estate Investment Company No.10 | 26.24 | 46,700 | 45,157 | — | Real estate investment | Korea | ||||||||||||||
KB-Badgers Future Mobility ESG Fund No.1 | 40.91 | 2,137 | 1,475 | 1,475 | Investment finance | Korea | ||||||||||||||
| JS Private Equity Fund No.3 | 20.48 | 1,700 | 1,664 | 1,664 | Investment finance | Korea | ||||||||||||||
| Mirae Asset Mobility Investment Fund No.1 | 22.99 | 2,000 | 1,979 | 1,979 | Investment finance | Korea | ||||||||||||||
KB-FT 1st Green Growth Investment Fund1 | 10.34 | 2,000 | 1,970 | 1,970 | Investment finance | Korea | ||||||||||||||
December 31, 2022 | ||||||||||||||||||||
Ownership (%) | Acquisition cost | Share of net asset amount | Carrying amount | Industry | Location | |||||||||||||||
(In millions of Korean won) | ||||||||||||||||||||
| Glenwood Credit Private Equity Fund No.2 | 29.89 | 42,000 | 43,468 | 43,468 | Investment finance | Korea | ||||||||||||||
| THE CHAEUL FUND NO.1 | 31.25 | 1,000 | 989 | 989 | Investment finance | Korea | ||||||||||||||
| Smart Korea KB Future9-Sejong Venture Fund | 38.46 | 2,000 | 1,870 | 1,870 | Investment finance | Korea | ||||||||||||||
KB-KTB Technology Venture Fund2 | 50.90 | 16,800 | 16,256 | 16,256 | Investment finance | Korea | ||||||||||||||
KB-SOLIDUS Healthcare Investment Fund2 | 88.23 | 19,800 | 18,651 | 18,651 | Investment finance | Korea | ||||||||||||||
| Paramark KB Fund No.1 | 17.34 | 12,199 | 10,966 | 10,966 | Investment finance | Korea | ||||||||||||||
KB Co-Investment Private Equity Fund No.11 | 7.12 | 7,268 | 7,269 | 7,233 | Investment finance | Korea | ||||||||||||||
| POSITIVE Sobujang Venture Fund No.1 | 43.96 | 2,000 | 1,977 | 1,977 | Investment finance | Korea | ||||||||||||||
| History 2022 Fintech Fund | 34.78 | 2,000 | 1,981 | 1,981 | Investment finance | Korea | ||||||||||||||
PEBBLES-MW M.C.E New Technology Investment Fund 1st | 23.26 | 2,000 | 1,982 | 1,982 | Investment finance | Korea | ||||||||||||||
KB-NP Green ESG New Technology Venture Capital Fund | 29.85 | 9,350 | 9,043 | 9,043 | Investment finance | Korea | ||||||||||||||
TMAP Mobility Co., Ltd. 1 | 8.25 | 200,000 | 61,518 | 194,455 | Application software development and supply | Korea | ||||||||||||||
Nextrade Co., Ltd. 1 | 6.64 | 9,700 | 9,700 | 9,700 | Investment finance | Korea | ||||||||||||||
| Shinhan Global Mobility Fund1 | 24.56 | 1,345 | 1,345 | 1,345 | Investment finance | Korea | ||||||||||||||
SKB Next Unicorn K-Battery Fund No.1 | 24.84 | 1,995 | 1,995 | 1,995 | Investment finance | Korea | ||||||||||||||
| Others | 2,029 | (741 | ) | 1,049 | ||||||||||||||||
| ₩ | 743,867 | ₩ | 558,981 | ₩ | 682,670 | |||||||||||||||
| 1 | As of December 31, 2021 and 2022, the Group can exercise significant influence on the decision-making processes of the associate’s financial and business policies through participation in governing bodies. |
| 2 | In order to direct relevant activities, it is necessary to obtain the consent of the two co-operative members; the Group has applied the equity method as the Group cannot control the investee by itself. |
| 3 | The ownership of Paycoms Co., Ltd. would be 21.84% and 21.68% as of December 31, 2021 and 2022, respectively, considering the potential voting rights of convertible bonds. |
| 4 | The ownership of Food Factory Co., Ltd. would be 30.00% and 30.00% as of December 31, 2021 and 2022, respectively, considering the potential voting rights of convertible bonds. |
| 5 | As of December 31, 2021 and 2022, the Group participates in the investment management committee but cannot exercise control. |
| 6 | The investment was classified as assets of a disposal group held for sale as of December 31, 2021. |
December 31, 2021 * | ||||||||||||||||||||||||||||
Total assets | Total liabilities | Paid-in capital | Equity | Share of net asset amount | Unrealized gains (losses) and others | Consolidated carrying amount | ||||||||||||||||||||||
(In millions of Korean won) | ||||||||||||||||||||||||||||
| KB Pre IPO Secondary Venture Fund No.1 | ₩ | 10,678 | ₩ | 3 | ₩ | 4,015 | ₩ | 10,675 | ₩ | 1,622 | ₩ | — | ₩ | 1,622 | ||||||||||||||
KB-KDBC Pre-IPO New Technology Business Investment Fund | 18,069 | 385 | 13,200 | 17,684 | 11,789 | — | 11,789 | |||||||||||||||||||||
| KB Star Office Private Real Estate Master Fund No.1 | 247,259 | 122,620 | 95,000 | 124,639 | 26,240 | — | 26,240 | |||||||||||||||||||||
| Balhae Infrastructure Company | 853,961 | 62,336 | 840,323 | 791,625 | 99,785 | — | 99,785 | |||||||||||||||||||||
| Aju Good Technology Venture Fund | 64,303 | 4,703 | 32,100 | 59,600 | 22,921 | — | 22,921 | |||||||||||||||||||||
| SY Auto Capital Co., Ltd. | 88,144 | 47,665 | 20,000 | 40,479 | 19,835 | (1,613 | ) | 18,222 | ||||||||||||||||||||
| Incheon Bridge Co., Ltd. | 560,570 | 690,530 | 61,096 | (129,960 | ) | (19,481 | ) | 19,481 | — | |||||||||||||||||||
| Big Dipper Co., Ltd. | 143 | 748 | 1,750 | (605 | ) | (147 | ) | 147 | — | |||||||||||||||||||
| Paycoms Co., Ltd. | 3,597 | 1,960 | 855 | 1,637 | 181 | 344 | 525 | |||||||||||||||||||||
| Food Factory Co., Ltd. | 8,332 | 5,482 | 450 | 2,850 | 633 | 687 | 1,320 | |||||||||||||||||||||
| KBSP Private Equity Fund No.4 | 37,646 | 5 | 40,800 | 37,641 | 5,628 | — | 5,628 | |||||||||||||||||||||
| Korea Credit Bureau Co., Ltd. | 128,297 | 78,328 | 10,000 | 49,969 | 4,497 | — | 4,497 | |||||||||||||||||||||
| KB Social Impact Investment Fund | 14,431 | 157 | 15,000 | 14,274 | 4,282 | — | 4,282 | |||||||||||||||||||||
KB-Solidus Global Healthcare Fund | 112,358 | 1,126 | 68,400 | 111,232 | 48,201 | 697 | 48,898 | |||||||||||||||||||||
POSCO-KB Shipbuilding Fund | 17,754 | 432 | 8,880 | 17,322 | 5,413 | — | 5,413 | |||||||||||||||||||||
KB-TS Technology Venture Private Equity Fund | 35,279 | 5,228 | 25,500 | 30,051 | 16,828 | — | 16,828 | |||||||||||||||||||||
KB-Brain KOSDAQScale-up New Technology Business Investment Fund | 69,943 | 221 | 61,100 | 69,722 | 29,669 | (750 | ) | 28,919 | ||||||||||||||||||||
KB-SJ Tourism Venture Fund | 22,947 | 557 | 27,000 | 22,390 | 4,146 | — | 4,146 | |||||||||||||||||||||
| UNION Media Commerce Fund | 3,318 | 10 | 3,450 | 3,308 | 959 | — | 959 | |||||||||||||||||||||
KB-Stonebridge Secondary Private Equity Fund | 151,004 | 316 | 148,587 | 150,688 | 21,948 | — | 21,948 | |||||||||||||||||||||
| KB SPROTT Renewable Private Equity Fund No.1 | 13,886 | 1,467 | 15,376 | 12,419 | 4,680 | — | 4,680 | |||||||||||||||||||||
KB-UTC Inno-Tech Venture Fund | 47,848 | 497 | 48,260 | 47,351 | 20,972 | — | 20,972 | |||||||||||||||||||||
| WJ Private Equity Fund No.1 | 35,799 | 170 | 37,100 | 35,629 | 9,604 | — | 9,604 | |||||||||||||||||||||
| All Together Korea Fund No.2 | 10,073 | 1 | 10,002 | 10,072 | 10,070 | — | 10,070 | |||||||||||||||||||||
KB-NAU Special Situation Corporate Restructuring Private Equity Fund | 127,960 | 844 | 111,600 | 127,116 | 15,254 | — | 15,254 | |||||||||||||||||||||
| Project Vanilla Co., Ltd. | 1,283 | 211 | 5,000 | 1,072 | 525 | — | 525 | |||||||||||||||||||||
| December & Company Inc. | 71,219 | 17,276 | 37,241 | 53,943 | 9,054 | 12,334 | 21,388 | |||||||||||||||||||||
| 2020 KB Fintech Renaissance Fund | 12,252 | 5 | 10,900 | 12,247 | 618 | — | 618 | |||||||||||||||||||||
| KB Material and Parts No.1 PEF | 23,104 | — | 23,500 | 23,104 | 3,343 | — | 3,343 | |||||||||||||||||||||
| FineKB Private Equity Fund No.1 | �� | 32,583 | 315 | 33,500 | 32,268 | 8,067 | — | 8,067 | ||||||||||||||||||||
| KB Bio Private Equity No.3 Ltd. | 81,691 | 101 | 82,000 | 81,590 | 9,950 | — | 9,950 | |||||||||||||||||||||
| G payment Joint Stock Company | 7,797 | 557 | 2,950 | 7,240 | 3,175 | 6,175 | 9,350 | |||||||||||||||||||||
| Smart Korea KB Future9-Sejong Venture Fund | 2,581 | 81 | 2,600 | 2,500 | 962 | — | 962 | |||||||||||||||||||||
KB-KTB Technology Venture Fund | 11,008 | 101 | 11,000 | 10,907 | 5,503 | 51 | 5,554 | |||||||||||||||||||||
KB-SOLIDUS Healthcare Investment Fund | 2,040 | — | 2,040 | 2,040 | 1,800 | — | 1,800 | |||||||||||||||||||||
| Paramark KB Fund No.1 | 8,943 | 3 | 9,860 | 8,940 | 1,850 | — | 1,850 | |||||||||||||||||||||
2021* | ||||||||||||||||||||
Operating revenue | Net profit (loss) | Other comprehensive income (loss) | Total comprehensive income (loss) | Dividends | ||||||||||||||||
(In millions of Korean won) | ||||||||||||||||||||
| KB Pre IPO Secondary Venture Fund No.1 | ₩ | 4,594 | ₩ | 4,180 | ₩ | — | ₩ | 4,180 | ₩ | — | ||||||||||
KB-KDBC Pre-IPO New Technology Business Investment Fund | 530 | 120 | — | 120 | — | |||||||||||||||
| KB Star Office Private Real Estate Master Fund No.1 | 18 | (127 | ) | — | (127 | ) | 963 | |||||||||||||
| Balhae Infrastructure Company | 97,833 | 19,559 | — | 19,559 | 9,121 | |||||||||||||||
| Aju Good Technology Venture Fund | 22,486 | 15,407 | — | 15,407 | — | |||||||||||||||
| SY Auto Capital Co., Ltd. | 14,316 | 2,193 | 104 | 2,297 | — | |||||||||||||||
| Incheon Bridge Co., Ltd. | 84,068 | (16,219 | ) | — | (16,219 | ) | — | |||||||||||||
| Big Dipper Co., Ltd. | 939 | (583 | ) | — | (583 | ) | — | |||||||||||||
| Paycoms Co., Ltd. | 1,515 | 857 | — | 857 | — | |||||||||||||||
| Food Factory Co., Ltd. | 8,853 | 354 | — | 354 | — | |||||||||||||||
| KBSP Private Equity Fund No.4 | (1,358 | ) | (2,154 | ) | — | (2,154 | ) | — | ||||||||||||
| Korea Credit Bureau Co., Ltd. | 128,150 | (27,327 | ) | — | (27,327 | ) | 90 | |||||||||||||
| KB Social Impact Investment Fund | 7 | (306 | ) | — | (306 | ) | — | |||||||||||||
KB-Solidus Global Healthcare Fund | 18,782 | 13,396 | — | 13,396 | — | |||||||||||||||
POSCO-KB Shipbuilding Fund | 1,880 | 376 | — | 376 | — | |||||||||||||||
KB-TS Technology Venture Private Equity Fund | 2,094 | (1,151 | ) | — | (1,151 | ) | — | |||||||||||||
KB-Brain KOSDAQScale-up New Technology Business Investment Fund | 14,244 | 8,495 | — | 8,495 | — | |||||||||||||||
KB-SJ Tourism Venture Fund | 170 | (2,631 | ) | — | (2,631 | ) | — | |||||||||||||
| UNION Media Commerce Fund | — | (3 | ) | — | (3 | ) | — | |||||||||||||
KB-Stonebridge Secondary Private Equity Fund | 55,572 | 54,053 | — | 54,053 | 9,895 | |||||||||||||||
| KB SPROTT Renewable Private Equity Fund No.1 | — | (983 | ) | — | (983 | ) | — | |||||||||||||
KB-UTC Inno-Tech Venture Fund | 1,080 | 32 | — | 32 | — | |||||||||||||||
| WJ Private Equity Fund No.1 | 291 | (398 | ) | — | (398 | ) | — | |||||||||||||
| All Together Korea Fund No.2 | 53 | 47 | — | 47 | — | |||||||||||||||
KB-NAU Special Situation Corporate Restructuring Private Equity Fund | 20,594 | 16,252 | — | 16,252 | — | |||||||||||||||
| Project Vanilla Co., Ltd. | — | (3,231 | ) | — | (3,231 | ) | — | |||||||||||||
| December & Company Inc. | 3,982 | (20,767 | ) | — | (20,767 | ) | — | |||||||||||||
| 2020 KB Fintech Renaissance Fund | 1,566 | 1,411 | — | 1,411 | — | |||||||||||||||
| KB Material and Parts No.1 PEF | 451 | 42 | — | 42 | 34 | |||||||||||||||
| FineKB Private Equity Fund No.1 | 2 | (1,155 | ) | — | (1,155 | ) | — | |||||||||||||
| KB Bio Private Equity No.3 Ltd. | 4 | (410 | ) | — | (410 | ) | — | |||||||||||||
| G payment Joint Stock Company | 819 | (762 | ) | — | (762 | ) | — | |||||||||||||
| Smart Korea KB Future9-Sejong Venture Fund | 2 | (100 | ) | — | (100 | ) | — | |||||||||||||
KB-KTB Technology Venture Fund | 8 | (93 | ) | — | (93 | ) | — | |||||||||||||
KB-SOLIDUS Healthcare Investment Fund | — | — | — | — | — | |||||||||||||||
| Paramark KB Fund No.1 | — | (920 | ) | — | (920 | ) | — | |||||||||||||
December 31, 2022* | ||||||||||||||||||||||||||||
Total assets | Total liabilities | Paid-in capital | Equity | Share of net asset amount | Unrealized gains (losses) and others | Consolidated carrying amount | ||||||||||||||||||||||
(In millions of Korean won) | ||||||||||||||||||||||||||||
KB-KDBC Pre-IPO New Technology Business Investment Fund | ₩ | 9,226 | ₩ | 260 | ₩ | 5,400 | ₩ | 8,966 | ₩ | 5,978 | ₩ | — | ��� | 5,978 | ||||||||||||||
| Balhae Infrastructure Company | 781,317 | 62,422 | 765,686 | 718,895 | 90,653 | (36 | ) | 90,617 | ||||||||||||||||||||
| Aju Good Technology Venture Fund | 58,749 | 7,171 | 21,180 | 51,578 | 19,840 | (4 | ) | 19,836 | ||||||||||||||||||||
| SY Auto Capital Co., Ltd. | 85,077 | 43,749 | 20,000 | 41,328 | 20,250 | (1,088 | ) | 19,162 | ||||||||||||||||||||
| Incheon Bridge Co., Ltd. | 554,738 | 661,227 | 61,096 | (106,489 | ) | (15,963 | ) | 15,963 | — | |||||||||||||||||||
| Big Dipper Co., Ltd. | 642 | 308 | 493 | 334 | 60 | — | 60 | |||||||||||||||||||||
| Paycoms Co., Ltd. | 3,781 | 2,032 | 926 | 1,749 | 201 | 12 | 213 | |||||||||||||||||||||
| Food Factory Co., Ltd. | 8,599 | 5,468 | 450 | 3,131 | 696 | 703 | 1,399 | |||||||||||||||||||||
| KBSP Private Equity Fund No.4 | 13,432 | 776 | 40,800 | 12,656 | 1,892 | — | 1,892 | |||||||||||||||||||||
| Korea Credit Bureau Co., Ltd. | 155,165 | 100,065 | 10,000 | 55,100 | 4,959 | — | 4,959 | |||||||||||||||||||||
December 31, 2022* | ||||||||||||||||||||||||||||
Total assets | Total liabilities | Paid-in capital | Equity | Share of net asset amount | Unrealized gains (losses) and others | Consolidated carrying amount | ||||||||||||||||||||||
(In millions of Korean won) | ||||||||||||||||||||||||||||
| KB Social Impact Investment Fund | 14,658 | 439 | 15,000 | 14,219 | 4,266 | — | 4,266 | |||||||||||||||||||||
KB-Solidus Global Healthcare Fund | 50,796 | 639 | 23,100 | 50,157 | 21,735 | 697 | 22,432 | |||||||||||||||||||||
POSCO-KB Shipbuilding Fund | 15,675 | 321 | 5,840 | 15,354 | 4,798 | — | 4,798 | |||||||||||||||||||||
KB-TS Technology Venture Private Equity Fund | 30,346 | 5,714 | 17,400 | 24,632 | 13,794 | — | 13,794 | |||||||||||||||||||||
KB-Brain KOSDAQScale-up New Technology Business Investment Fund | 42,538 | 705 | 31,020 | 41,833 | 17,801 | (750 | ) | 17,051 | ||||||||||||||||||||
KB-SJ Tourism Venture Fund | 20,926 | 551 | 24,840 | 20,375 | 3,773 | — | 3,773 | |||||||||||||||||||||
| UNION Media Commerce Fund | 3,319 | 18 | 3,450 | 3,301 | 957 | — | 957 | |||||||||||||||||||||
KB-Stonebridge Secondary Private Equity Fund | 172,979 | 349 | 163,413 | 172,630 | 25,144 | — | 25,144 | |||||||||||||||||||||
| KB SPROTT Renewable Private Equity Fund No.1 | 44,880 | 996 | 47,868 | 43,884 | 16,539 | — | 16,539 | |||||||||||||||||||||
KB-UTC Inno-Tech Venture Fund | 44,111 | 809 | 48,260 | 43,302 | 19,180 | — | 19,180 | |||||||||||||||||||||
| WJ Private Equity Fund No.1 | 35,561 | 161 | 37,100 | 35,400 | 9,542 | — | 9,542 | |||||||||||||||||||||
| All Together Korea Fund No.2 | 10,246 | 1 | 10,001 | 10,245 | 10,244 | — | 10,244 | |||||||||||||||||||||
KB-NAU Special Situation Corporate Restructuring Private Equity Fund | 102,827 | 498 | 81,100 | 102,329 | 12,554 | — | 12,554 | |||||||||||||||||||||
| December & Company Inc. | 35,602 | 13,271 | 37,367 | 22,331 | 3,735 | 12,294 | 16,029 | |||||||||||||||||||||
| 2020 KB Fintech Renaissance Fund | 12,529 | 38 | 10,900 | 12,491 | 630 | — | 630 | |||||||||||||||||||||
| KB Material and Parts No.1 PEF | 22,953 | 2 | 23,500 | 22,951 | 3,321 | — | 3,321 | |||||||||||||||||||||
| FineKB Private Equity Fund No.1 | 43,759 | 1,828 | 51,100 | 41,931 | 10,483 | — | 10,483 | |||||||||||||||||||||
| G payment Joint Stock Company | 10,177 | 3,523 | 2,950 | 6,654 | 2,917 | 6,364 | 9,281 | |||||||||||||||||||||
KB-GeneN Medical Venture Fund No.1 | 8,770 | 48 | 8,880 | 8,722 | 1,965 | — | 1,965 | |||||||||||||||||||||
KB-BridgePole Venture Investment Fund | 13,331 | 73 | 13,500 | 13,258 | 835 | — | 835 | |||||||||||||||||||||
KB-Kyobo New Mobility Power Fund | 9,932 | 40 | 10,500 | 9,892 | 2,826 | — | 2,826 | |||||||||||||||||||||
DA-Friend New Technology Investment Fund No.2 | 3,527 | 21 | 3,650 | 3,506 | 949 | — | 949 | |||||||||||||||||||||
| Cornerstone Pentastone Fund No.4 | 3,704 | 23 | 3,800 | 3,681 | 792 | — | 792 | |||||||||||||||||||||
SKS-VLP New Technology Investment Fund No.2 | 4,855 | 2 | 5,001 | 4,853 | 1,121 | — | 1,121 | |||||||||||||||||||||
| Star-Lord General Investors Private Real Estate Investment Company No.10 | 585,401 | 413,283 | 178,000 | 172,118 | 45,157 | (45,157 | ) | — | ||||||||||||||||||||
KB-Badgers Future Mobility ESG Fund No.1 | 3,607 | — | 5,225 | 3,607 | 1,475 | — | 1,475 | |||||||||||||||||||||
| JS Private Equity Fund No.3 | 8,126 | 1 | 8,300 | 8,125 | 1,664 | — | 1,664 | |||||||||||||||||||||
| Mirae Asset Mobility Investment Fund No.1 | 8,683 | 73 | 8,700 | 8,610 | 1,979 | — | 1,979 | |||||||||||||||||||||
KB-FT 1st Green Growth Investment Fund 1 | 19,051 | — | 19,345 | 19,051 | 1,970 | — | 1,970 | |||||||||||||||||||||
| Glenwood Credit Private Equity Fund No.2 | 145,787 | 376 | 140,500 | 145,411 | 43,468 | — | 43,468 | |||||||||||||||||||||
| THE CHAEUL FUND NO.1 | 3,166 | — | 3,200 | 3,166 | 989 | — | 989 | |||||||||||||||||||||
| Smart Korea KB Future9-Sejong Venture Fund | 4,862 | — | 5,200 | 4,862 | 1,870 | — | 1,870 | |||||||||||||||||||||
KB-KTB Technology Venture Fund | 32,214 | 280 | 33,000 | 31,934 | 16,256 | — | 16,256 | |||||||||||||||||||||
KB-SOLIDUS Healthcare Investment Fund | 21,483 | 345 | 22,440 | 21,138 | 18,651 | — | 18,651 | |||||||||||||||||||||
| Paramark KB Fund No.1 | 63,260 | 22 | 70,169 | 63,238 | 10,966 | — | 10,966 | |||||||||||||||||||||
KB Co-Investment Private Equity Fund No.1 | 101,771 | 198 | 102,067 | 101,573 | 7,269 | (36 | ) | 7,233 | ||||||||||||||||||||
December 31, 2022* | ||||||||||||||||||||||||||||
Total assets | Total liabilities | Paid-in capital | Equity | Share of net asset amount | Unrealized gains (losses) and others | Consolidated carrying amount | ||||||||||||||||||||||
(In millions of Korean won) | ||||||||||||||||||||||||||||
| POSITIVE Sobujang Venture Fund No.1 | 4,521 | 23 | 4,550 | 4,498 | 1,977 | — | 1,977 | |||||||||||||||||||||
| History 2022 Fintech Fund | 5,695 | — | 5,750 | 5,695 | 1,981 | — | 1,981 | |||||||||||||||||||||
PEBBLES-MW M.C.E New Technology Investment Fund 1st | 8,562 | 40 | 8,600 | 8,522 | 1,982 | — | 1,982 | |||||||||||||||||||||
KB-NP Green ESG New Technology Venture Capital Fund | 31,838 | 638 | 32,260 | 31,200 | 9,043 | — | 9,043 | |||||||||||||||||||||
| TMAP Mobility Co., Ltd. | 920,597 | 174,696 | 8,677 | 745,901 | 61,518 | 132,937 | 194,455 | |||||||||||||||||||||
| Nextrade Co., Ltd. | 146,100 | — | 146,100 | 146,100 | 9,700 | — | 9,700 | |||||||||||||||||||||
| Shinhan Global Mobility Fund1 | 5,474 | — | 5,700 | 5,474 | 1,345 | — | 1,345 | |||||||||||||||||||||
SKB Next Unicorn K-Battery Fund No.1 | 5,705 | 14 | 5,691 | 5,691 | 1,995 | — | 1,995 | |||||||||||||||||||||
2022* | ||||||||||||||||||||
Operating revenue | Net profit (loss) | Other comprehensive income (loss) | Total comprehensive income (loss) | Dividends | ||||||||||||||||
(In millions of Korean won) | ||||||||||||||||||||
KB-KDBC Pre-IPO New Technology Business Investment Fund | ₩ | 1,699 | ₩ | (917 | ) | ₩ | — | ₩ | (917 | ) | ₩ | — | ||||||||
| Balhae Infrastructure Company | 100,720 | 133,964 | — | 133,964 | 16,646 | |||||||||||||||
| Aju Good Technology Venture Fund | 22,381 | 6,018 | — | 6,018 | 1,200 | |||||||||||||||
| SY Auto Capital Co., Ltd. | 11,569 | 474 | 374 | 848 | — | |||||||||||||||
| Incheon Bridge Co., Ltd. | 130,456 | 23,754 | — | 23,754 | — | |||||||||||||||
| Big Dipper Co., Ltd. | 834 | (672 | ) | — | (672 | ) | — | |||||||||||||
| Paycoms Co., Ltd. | 1,266 | 399 | — | 399 | — | |||||||||||||||
| Food Factory Co., Ltd. | 9,059 | 605 | — | 605 | — | |||||||||||||||
| KBSP Private Equity Fund No.4 | 6 | (24,985 | ) | — | (24,985 | ) | — | |||||||||||||
| Korea Credit Bureau Co., Ltd. | 144,906 | 13,809 | — | 13,809 | — | |||||||||||||||
| KB Social Impact Investment Fund | 240 | (55 | ) | — | (55 | ) | — | |||||||||||||
KB-Solidus Global Healthcare Fund | 2,952 | (15,775 | ) | — | (15,775 | ) | — | |||||||||||||
POSCO-KB Shipbuilding Fund | 1,721 | 1,072 | — | 1,072 | — | |||||||||||||||
KB-TS Technology Venture Private Equity Fund | 1,043 | 2,682 | — | 2,682 | — | |||||||||||||||
KB-Brain KOSDAQScale-up New Technology Business Investment Fund | 11,851 | 1,541 | — | 1,541 | — | |||||||||||||||
KB-SJ Tourism Venture Fund | 719 | 145 | — | 145 | — | |||||||||||||||
| UNION Media Commerce Fund | — | (8 | ) | — | (8 | ) | — | |||||||||||||
KB-Stonebridge Secondary Private Equity Fund | 22,445 | 20,887 | — | 20,887 | 2,006 | |||||||||||||||
| KB SPROTT Renewable Private Equity Fund No.1 | — | (1,020 | ) | — | (1,020 | ) | — | |||||||||||||
KB-UTC Inno-Tech Venture Fund | — | (905 | ) | (1,647 | ) | (2,552 | ) | — | ||||||||||||
| WJ Private Equity Fund No.1 | 430 | (229 | ) | — | (229 | ) | — | |||||||||||||
| All Together Korea Fund No.2 | 179 | 173 | — | 173 | — | |||||||||||||||
KB-NAU Special Situation Corporate Restructuring Private Equity Fund | 21,470 | 5,713 | — | 5,713 | — | |||||||||||||||
| December & Company Inc. | 868 | (32,002 | ) | — | (32,002 | ) | — | |||||||||||||
| 2020 KB Fintech Renaissance Fund | 395 | 243 | — | 243 | — | |||||||||||||||
| KB Material and Parts No.1 PEF | 451 | 83 | — | 83 | 34 | |||||||||||||||
2022* | ||||||||||||||||||||
Operating revenue | Net profit (loss) | Other comprehensive income (loss) | Total comprehensive income (loss) | Dividends | ||||||||||||||||
(In millions of Korean won) | ||||||||||||||||||||
| FineKB Private Equity Fund No.1 | 14,244 | (7,938 | ) | — | (7,938 | ) | — | |||||||||||||
| G payment Joint Stock Company | 3,401 | (831 | ) | — | (831 | ) | — | |||||||||||||
KB-GeneN Medical Venture Fund No.1 | 1 | (158 | ) | — | (158 | ) | — | |||||||||||||
KB-BridgePole Venture Investment Fund | 4 | (242 | ) | — | (242 | ) | — | |||||||||||||
KB-Kyobo New Mobility Power Fund | 2 | (608 | ) | — | (608 | ) | — | |||||||||||||
DA-Friend New Technology Investment Fund No.2 | — | (144 | ) | — | (144 | ) | — | |||||||||||||
| Cornerstone Pentastone Fund No.4 | — | (119 | ) | — | (119 | ) | — | |||||||||||||
SKS-VLP New Technology Investment Fund No.2 | 1 | (148 | ) | — | (148 | ) | — | |||||||||||||
| Star-Lord General Investors Private Real Estate Investment Company No.10 | 16,792 | (4,254 | ) | — | (4,254 | ) | — | |||||||||||||
KB-Badgers Future Mobility ESG Fund No.1 | — | (1,618 | ) | — | (1,618 | ) | — | |||||||||||||
| JS Private Equity Fund No.3 | — | (175 | ) | — | (175 | ) | — | |||||||||||||
| Mirae Asset Mobility Investment Fund No.1 | 9 | (90 | ) | — | (90 | ) | — | |||||||||||||
KB-FT 1st Green Growth Investment Fund 1 | 5 | (294 | ) | — | (294 | ) | — | |||||||||||||
| Glenwood Credit Private Equity Fund No.2 | 5,286 | 4,911 | — | 4,911 | — | |||||||||||||||
| THE CHAEUL FUND NO.1 | — | (34 | ) | — | (34 | ) | — | |||||||||||||
| Smart Korea KB Future9-Sejong Venture Fund | 13 | (236 | ) | — | (236 | ) | — | |||||||||||||
KB-KTB Technology Venture Fund | 134 | (973 | ) | — | (973 | ) | — | |||||||||||||
KB-SOLIDUS Healthcare Investment Fund | 14 | (1,302 | ) | — | (1,302 | ) | — | |||||||||||||
| Paramark KB Fund No.1 | 581 | (6,010 | ) | — | (6,010 | ) | — | |||||||||||||
KB Co-Investment Private Equity Fund No.1 | 14 | (494 | ) | — | (494 | ) | — | |||||||||||||
| POSITIVE Sobujang Venture Fund No.1 | 1 | (52 | ) | — | (52 | ) | — | |||||||||||||
| History 2022 Fintech Fund | — | (55 | ) | — | (55 | ) | — | |||||||||||||
PEBBLES-MW M.C.E New Technology Investment Fund 1st | — | (78 | ) | — | (78 | ) | — | |||||||||||||
KB-NP Green ESG New Technology Venture Capital Fund | 19 | (1,059 | ) | — | (1,059 | ) | — | |||||||||||||
| TMAP Mobility Co., Ltd. | 139,792 | (132,476 | ) | — | (132,476 | ) | — | |||||||||||||
| Nextrade Co., Ltd. | — | — | — | — | — | |||||||||||||||
| Shinhan Global Mobility Fund1 | — | (226 | ) | — | (226 | ) | — | |||||||||||||
SKB Next Unicorn K-Battery Fund No.1 | 1 | — | — | — | — | |||||||||||||||
| * | The condensed financial information of the associates and joint ventures is adjusted to reflect adjustments, such as fair value adjustments recognized at the time of acquisition and adjustments for differences in accounting policies. |
2021 1 | ||||||||||||||||||||||||||||
Beginning | Acquisition and others | Disposal and others | Dividends | Gains (losses) on equity- method accounting | Other compre- hensive income (loss) | Ending | ||||||||||||||||||||||
(In millions of Korean won) | ||||||||||||||||||||||||||||
| KB Pre IPO Secondary Venture Fund No.1 | ₩ | 1,279 | ₩ | — | ₩ | (292 | ) | ₩ | — | ₩ | 635 | ₩ | — | ₩ | 1,622 | |||||||||||||
| KB GwS Private Securities Investment Trust | 141,359 | — | (141,359 | ) | — | — | — | — | ||||||||||||||||||||
KB-KDBC Pre-IPO New Technology Business Investment Fund | 16,042 | — | (4,800 | ) | — | 547 | — | 11,789 | ||||||||||||||||||||
| KB Star Office Private Real Estate Master Fund No.1 | 20,066 | — | — | (963 | ) | 7,137 | — | 26,240 | ||||||||||||||||||||
| Balhae Infrastructure Company | 106,624 | 280 | (463 | ) | (9,121 | ) | 2,465 | — | 99,785 | |||||||||||||||||||
| Aju Good Technology Venture Fund | 21,348 | — | (4,770 | ) | — | 6,343 | — | 22,921 | ||||||||||||||||||||
| SY Auto Capital Co., Ltd. | 16,144 | — | — | — | 2,027 | 51 | 18,222 | |||||||||||||||||||||
| Incheon Bridge Co., Ltd. | — | — | — | — | — | — | — | |||||||||||||||||||||
| Big Dipper Co., Ltd. | — | — | — | — | — | — | — | |||||||||||||||||||||
| Paycoms Co., Ltd. | 198 | — | — | — | 327 | — | 525 | |||||||||||||||||||||
| Food Factory Co., Ltd. | 1,281 | — | — | — | 7 | 32 | 1,320 | |||||||||||||||||||||
| KBSP Private Equity Fund No.4 | 5,950 | — | — | — | (322 | ) | — | 5,628 | ||||||||||||||||||||
| KB Private Equity Fund No.3 | 94 | — | (13 | ) | (81 | ) | — | — | — | |||||||||||||||||||
| Korea Credit Bureau Co., Ltd. | 7,153 | — | — | (90 | ) | (2,566 | ) | — | 4,497 | |||||||||||||||||||
| KoFC POSCO Hanwha KB Shared Growth Private Equity Fund No.2 | 9,845 | — | (9,725 | ) | (2,120 | ) | 2,000 | — | — | |||||||||||||||||||
| Keystone-Hyundai Securities No.1 Private Equity Fund | 1,556 | — | (1,044 | ) | (512 | ) | — | — | — | |||||||||||||||||||
| KB Social Impact Investment Fund | 2,874 | 1,500 | — | — | (92 | ) | — | 4,282 | ||||||||||||||||||||
KB-Solidus Global Healthcare Fund | 46,213 | — | (3,120 | ) | — | 5,805 | — | 48,898 | ||||||||||||||||||||
POSCO-KB Shipbuilding Fund | 12,895 | — | (7,599 | ) | — | 117 | — | 5,413 | ||||||||||||||||||||
KB-TS Technology Venture Private Equity Fund | 17,630 | 3,080 | (5,376 | ) | — | 1,494 | — | 16,828 | ||||||||||||||||||||
KB-Brain KOSDAQScale-up New Technology Business Investment Fund | 26,763 | 10,000 | (10,800 | ) | — | 2,956 | — | 28,919 | ||||||||||||||||||||
KB-SJ Tourism Venture Fund | 4,133 | 499 | — | — | (486 | ) | — | 4,146 | ||||||||||||||||||||
| UNION Media Commerce Fund | 960 | — | — | — | (1 | ) | — | 959 | ||||||||||||||||||||
KB-Stonebridge Secondary Private Equity Fund | 16,636 | 13,257 | (5,924 | ) | (9,895 | ) | 7,874 | — | 21,948 | |||||||||||||||||||
| KB SPROTT Renewable Private Equity Fund No.1 | 5,049 | — | — | — | (369 | ) | — | 4,680 | ||||||||||||||||||||
KB-UTC Inno-Tech Venture Fund | 16,999 | 5,085 | (1,126 | ) | — | 14 | — | 20,972 | ||||||||||||||||||||
| WJ Private Equity Fund No.1 | 9,711 | — | — | — | (107 | ) | — | 9,604 | ||||||||||||||||||||
| All Together Korea Fund No.2 | 10,023 | — | — | — | 47 | — | 10,070 | |||||||||||||||||||||
KB-NAU Special Situation Corporate Restructuring Private Equity Fund | 5,611 | 7,692 | — | — | 1,951 | — | 15,254 | |||||||||||||||||||||
| JR Global REIT | 215,854 | — | (209,250 | ) | (6,604 | ) | — | — | — | |||||||||||||||||||
| Project Vanilla Co., Ltd. | 2,151 | — | — | — | (1,626 | ) | — | 525 | ||||||||||||||||||||
| December & Company Inc. | 24,402 | 481 | — | — | (3,507 | ) | 12 | 21,388 | ||||||||||||||||||||
| 2020 KB Fintech Renaissance Fund | 547 | — | — | — | 71 | — | 618 | |||||||||||||||||||||
| KB Material and Parts No.1 PEF | 3,371 | — | — | (34 | ) | 6 | — | 3,343 | ||||||||||||||||||||
| FineKB Private Equity Fund No.1 | — | 8,375 | — | — | (308 | ) | — | 8,067 | ||||||||||||||||||||
| KB Bio Private Equity No.3 Ltd. | — | 10,000 | — | — | (50 | ) | — | 9,950 | ||||||||||||||||||||
| K The 15th REIT Co., Ltd. | — | 8,600 | (8,600 | ) | — | — | — | — | ||||||||||||||||||||
| G payment Joint Stock Company | — | 9,684 | — | — | (334 | ) | — | 9,350 | ||||||||||||||||||||
498 Seventh Owners LLC 2 | — | 172,907 | (169,424 | ) | (3,483 | ) | — | — | — | |||||||||||||||||||
| Smart Korea KB Future9-Sejong Venture Fund | — | 1,000 | — | — | (38 | ) | — | 962 | ||||||||||||||||||||
KB-KTB Technology Venture Fund | — | 5,601 | — | — | (47 | ) | — | 5,554 | ||||||||||||||||||||
KB-SOLIDUS Healthcare Investment Fund | — | 1,800 | — | — | — | — | 1,800 | |||||||||||||||||||||
| Paramark KB Fund No.1 | — | 2,040 | — | — | (190 | ) | — | 1,850 | ||||||||||||||||||||
| Others | 674 | — | — | — | (303 | ) | 418 | 789 | ||||||||||||||||||||
| ₩ | 771,435 | ₩ | 261,881 | ₩ | (583,685 | ) | ₩ | (32,903 | ) | ₩ | 31,477 | ₩ | 513 | ₩ | 448,718 | |||||||||||||
2022 1 | ||||||||||||||||||||||||||||
Beginning | Acquisition and others | Disposal and others | Dividends | Gains (losses) on equity- method accounting | Other compre- hensive income (loss) | Ending | ||||||||||||||||||||||
(In millions of Korean won) | ||||||||||||||||||||||||||||
| KB Pre IPO Secondary Venture Fund No.1 | ₩ | 1,622 | ₩ | — | ₩ | (1,429 | ) | ₩ | — | ₩ | (193 | ) | ₩ | — | ₩ | — | ||||||||||||
KB-KDBC Pre-IPO New Technology Business Investment Fund | 11,789 | — | (5,200 | ) | — | (611 | ) | — | 5,978 | |||||||||||||||||||
| KB Star Office Private Real Estate Master Fund No.1 | 26,240 | — | (5,960 | ) | (20,280 | ) | — | — | — | |||||||||||||||||||
| Balhae Infrastructure Company | 99,785 | — | (9,408 | ) | (16,646 | ) | 16,886 | — | 90,617 | |||||||||||||||||||
| Incheon Bridge Co., Ltd. | — | — | — | — | — | — | — | |||||||||||||||||||||
| Aju Good Technology Venture Fund | 22,921 | — | (4,200 | ) | (1,200 | ) | 2,315 | — | 19,836 | |||||||||||||||||||
| SY Auto Capital Co., Ltd. | 18,222 | — | — | — | 757 | 183 | 19,162 | |||||||||||||||||||||
| Big Dipper Co., Ltd. | — | 291 | — | — | (231 | ) | — | 60 | ||||||||||||||||||||
| Paycoms Co., Ltd. | 525 | — | — | — | (312 | ) | — | 213 | ||||||||||||||||||||
| Food Factory Co., Ltd. | 1,320 | — | — | — | 132 | (53 | ) | 1,399 | ||||||||||||||||||||
| KBSP Private Equity Fund No.4 | 5,628 | — | — | — | (3,736 | ) | — | 1,892 | ||||||||||||||||||||
| Korea Credit Bureau Co., Ltd. | 4,497 | — | — | — | 462 | — | 4,959 | |||||||||||||||||||||
| KB Social Impact Investment Fund | 4,282 | — | — | — | (16 | ) | — | 4,266 | ||||||||||||||||||||
KB-Solidus Global Healthcare Fund | 48,898 | — | (19,630 | ) | — | (6,836 | ) | — | 22,432 | |||||||||||||||||||
POSCO-KB Shipbuilding Fund | 5,413 | — | (950 | ) | — | 335 | — | 4,798 | ||||||||||||||||||||
KB-TS Technology Venture Private Equity Fund | 16,828 | — | (4,536 | ) | — | 1,502 | — | 13,794 | ||||||||||||||||||||
KB-Brain KOSDAQScale-up New Technology Business Investment Fund | 28,919 | — | (12,800 | ) | — | 932 | — | 17,051 | ||||||||||||||||||||
KB-SJ Tourism Venture Fund | 4,146 | — | (400 | ) | — | 27 | — | 3,773 | ||||||||||||||||||||
| UNION Media Commerce Fund | 959 | — | — | — | (2 | ) | — | 957 | ||||||||||||||||||||
KB-Stonebridge Secondary Private Equity Fund | 21,948 | 4,370 | (2,210 | ) | (2,006 | ) | 3,042 | — | 25,144 | |||||||||||||||||||
| KB SPROTT Renewable Private Equity Fund No.1 | 4,680 | 12,246 | — | — | (387 | ) | — | 16,539 | ||||||||||||||||||||
KB-UTC Inno-Tech Venture Fund | 20,972 | — | — | — | (1,306 | ) | (486 | ) | 19,180 | |||||||||||||||||||
| WJ Private Equity Fund No.1 | 9,604 | — | — | — | (62 | ) | — | 9,542 | ||||||||||||||||||||
| All Together Korea Fund No.2 | 10,070 | — | — | — | 174 | — | 10,244 | |||||||||||||||||||||
KB-NAU Special Situation Corporate Restructuring Private Equity Fund | 15,254 | 1,320 | (4,706 | ) | — | 686 | — | 12,554 | ||||||||||||||||||||
| Project Vanilla Co., Ltd. | 525 | — | (525 | ) | — | — | — | — | ||||||||||||||||||||
| December & Company Inc. | 21,388 | — | (49 | ) | — | (5,353 | ) | 43 | 16,029 | |||||||||||||||||||
| 2020 KB Fintech Renaissance Fund | 618 | — | — | — | 12 | — | 630 | |||||||||||||||||||||
| KB Material and Parts No.1 PEF | 3,343 | — | — | (34 | ) | 12 | — | 3,321 | ||||||||||||||||||||
| FineKB Private Equity Fund No.1 | 8,067 | 7,500 | (3,100 | ) | — | (1,984 | ) | — | 10,483 | |||||||||||||||||||
| KB Bio Private Equity No.3 Ltd. | 9,950 | — | (3,922 | ) | (6,028 | ) | — | — | — | |||||||||||||||||||
| G payment Joint Stock Company | 9,350 | 295 | — | — | (364 | ) | — | 9,281 | ||||||||||||||||||||
| Apollo REIT PropCo LLC | — | 19,968 | (19,968 | ) | — | — | — | — | ||||||||||||||||||||
KB-GeneN Medical Venture Fund No.1 | — | 2,000 | — | — | (35 | ) | — | 1,965 | ||||||||||||||||||||
KB-BridgePole Venture Investment Fund | — | 850 | — | — | (15 | ) | — | 835 | ||||||||||||||||||||
KB-Kyobo New Mobility Power Fund | — | 3,000 | — | — | (174 | ) | — | 2,826 | ||||||||||||||||||||
DA-Friend New Technology Investment Fund No.2 | — | 988 | — | — | (39 | ) | — | 949 | ||||||||||||||||||||
| Cornerstone Pentastone Fund No.4 | — | 818 | — | — | (26 | ) | — | 792 | ||||||||||||||||||||
SKS-VLP New Technology Investment Fund No.2 | — | 1,156 | — | — | (35 | ) | — | 1,121 | ||||||||||||||||||||
| Star-Lord General Investors Private Real Estate Investment Company No.10 | — | 46,700 | — | — | (46,700 | ) | — | — | ||||||||||||||||||||
KB-Badgers Future Mobility ESG Fund No.1 | — | 2,137 | — | — | (662 | ) | — | 1,475 | ||||||||||||||||||||
| JS Private Equity Fund No.3 | — | 1,700 | — | — | (36 | ) | — | 1,664 | ||||||||||||||||||||
| Mirae Asset Mobility Investment Fund No.1 | — | 2,000 | — | — | (21 | ) | — | 1,979 | ||||||||||||||||||||
KB-FT 1st Green Growth Investment Fund 1 | — | 2,000 | — | — | (30 | ) | — | 1,970 | ||||||||||||||||||||
| Glenwood Credit Private Equity Fund No.2 | — | 42,000 | — | — | 1,468 | — | 43,468 | |||||||||||||||||||||
| THE CHAEUL FUND NO.1 | — | 1,000 | — | — | (11 | ) | — | 989 | ||||||||||||||||||||
| Smart Korea KB Future9-Sejong Venture Fund | 962 | 1,000 | — | — | (92 | ) | — | 1,870 | ||||||||||||||||||||
KB-KTB Technology Venture Fund | 5,554 | 11,200 | — | — | (498 | ) | — | 16,256 | ||||||||||||||||||||
KB-SOLIDUS Healthcare Investment Fund | 1,800 | 18,000 | — | — | (1,149 | ) | — | 18,651 | ||||||||||||||||||||
| Paramark KB Fund No.1 | 1,850 | 12,444 | (2,285 | ) | — | (1,043 | ) | — | 10,966 | |||||||||||||||||||
KB Co-Investment Private Equity Fund No.1 | — | 7,268 | — | — | (35 | ) | — | 7,233 | ||||||||||||||||||||
| POSITIVE Sobujang Venture Fund No.1 | — | 2,000 | — | — | (23 | ) | — | 1,977 | ||||||||||||||||||||
| History 2022 Fintech Fund | — | 2,000 | — | — | (19 | ) | — | 1,981 | ||||||||||||||||||||
PEBBLES-MW M.C.E New Technology Investment Fund 1st | — | 2,000 | — | — | (18 | ) | — | 1,982 | ||||||||||||||||||||
KB-NP Green ESG New Technology Venture Capital Fund | — | 9,350 | — | — | (307 | ) | — | 9,043 | ||||||||||||||||||||
| TMAP Mobility Co., Ltd. | — | 200,000 | — | — | (5,797 | ) | 252 | 194,455 | ||||||||||||||||||||
| Nextrade Co., Ltd. | — | 9,700 | — | — | — | — | 9,700 | |||||||||||||||||||||
| Shinhan Global Mobility Fund1 | — | 1,345 | — | — | — | — | 1,345 | |||||||||||||||||||||
SKB Next Unicorn K-Battery Fund No.1 | — | 1,995 | — | — | — | — | 1,995 | |||||||||||||||||||||
| Others | 789 | 50 | (43 | ) | — | 75 | 178 | 1,049 | ||||||||||||||||||||
| ₩ | 448,718 | ₩ | 430,691 | ₩ | (101,321 | ) | ₩ | (46,194 | ) | ₩ | (49,341 | ) | ₩ | 117 | ₩ | 682,670 | ||||||||||||
| 1 | Gains on disposal of investments in associates and joint ventures amount to ₩ 62,048 million ₩ 20,585 million for the years ended December 31, 2021 and 2022, respectively. |
| 2 | The investment was classified as assets of a disposal group held for sale as of December 31, 2021. |
Unrecognized losses for the period | Accumulated unrecognized losses | |||||||||||||||
2021 | 2022 | December 31, 2021 | December 31, 2022 | |||||||||||||
(In millions of Korean won) | ||||||||||||||||
| DSMETAL Co., Ltd. | ₩ | 38 | ₩ | — | ₩ | 103 | ₩ | 103 | ||||||||
| Incheon Bridge Co., Ltd. | 1,381 | (3,518 | ) | 19,481 | 15,963 | |||||||||||
| Jungdong Steel Co., Ltd. | — | — | 489 | 489 | ||||||||||||
| Shinla Construction Co., Ltd. | — | — | 183 | 183 | ||||||||||||
| Jaeyang Industry Co., Ltd. | — | — | 30 | 30 | ||||||||||||
| Terra Corporation | — | — | 14 | 14 | ||||||||||||
| Jungdo Co., Ltd. | 239 | (8 | ) | 551 | 543 | |||||||||||
| Jinseung Tech Co., Ltd. | 12 | (15 | ) | 33 | 18 | |||||||||||
| Korea NM Tech Co., Ltd. | — | 3 | 28 | 31 | ||||||||||||
| Chongil Machine & Tools Co., Ltd. | 49 | 7 | 68 | 75 | ||||||||||||
| Skydigital Inc. | 68 | 3 | 174 | 177 | ||||||||||||
| Imt Technology Co., Ltd. | (3 | ) | — | — | — | |||||||||||
| Jo Yang Industrial Co., Ltd. | 9 | 8 | 105 | 113 | ||||||||||||
| IDTECK Co., Ltd. | (72 | ) | (144 | ) | 144 | — | ||||||||||
| MJT&I Corp. | 152 | 1 | 152 | 153 | ||||||||||||
Dae-A Leisure Co., Ltd. | 202 | 310 | 202 | 512 | ||||||||||||
Il-Kwang Electronic Materials Co., Ltd. | 160 | (2 | ) | 160 | 158 | |||||||||||
| Inter Shipping Co., Ltd. | 117 | 1,022 | 117 | 1,139 | ||||||||||||
| Dongjo Co., Ltd | — | 696 | — | 696 | ||||||||||||
| Iwon Alloy Co., Ltd. | — | 19 | — | 19 | ||||||||||||
| Chunsung-meat co., ltd. | — | 24 | — | 24 | ||||||||||||
| ALTSCS CO., LTD. | — | 1 | — | 1 | ||||||||||||
| RAND Bio Science Co., Ltd. | 309 | 231 | 309 | 540 | ||||||||||||
| Star-Lord General Investors Private Real Estate Investment Company No.10 | — | 9,741 | — | 9,741 | ||||||||||||
| ₩ | 2,661 | ₩ | 8,379 | ₩ | 22,343 | ₩ | 30,722 | |||||||||
December 31, 2021 | ||||||||||||||||
Acquisition cost | Accumulated depreciation | Accumulated impairment losses | Carrying amount | |||||||||||||
(In millions of Korean won) | ||||||||||||||||
| Land | ₩ | 2,548,185 | ₩ | — | ₩ | (4 | ) | ₩ | 2,548,181 | |||||||
| Buildings | 2,534,134 | (851,730 | ) | (5,747 | ) | 1,676,657 | ||||||||||
| Leasehold improvements | 977,853 | (889,602 | ) | — | 88,251 | |||||||||||
| Equipment and vehicles | 2,093,461 | (1,782,278 | ) | — | 311,183 | |||||||||||
Construction in-progress | 39,579 | — | — | 39,579 | ||||||||||||
Right-of-use | 1,301,864 | (725,817 | ) | — | 576,047 | |||||||||||
| ₩ | 9,495,076 | ₩ | (4,249,427 | ) | ₩ | (5,751 | ) | ₩ | 5,239,898 | |||||||
December 31, 2022 | ||||||||||||||||
Acquisition cost | Accumulated depreciation | Accumulated impairment losses | Carrying amount | |||||||||||||
(In millions of Korean won) | ||||||||||||||||
| Land | ₩ | 2,416,730 | ₩ | — | ₩ | (4 | ) | ₩ | 2,416,726 | |||||||
| Buildings | 2,426,317 | (839,137 | ) | (5,747 | ) | 1,581,433 | ||||||||||
| Leasehold improvements | 1,020,095 | (943,711 | ) | — | 76,384 | |||||||||||
| Equipment and vehicles | 2,070,374 | (1,766,036 | ) | — | 304,338 | |||||||||||
Construction in-progress | 28,045 | — | — | 28,045 | ||||||||||||
Right-of-use | 1,440,686 | (856,145 | ) | — | 584,541 | |||||||||||
| ₩ | 9,402,247 | ₩ | (4,405,029 | ) | ₩ | (5,751 | ) | ₩ | 4,991,467 | |||||||
2021 | ||||||||||||||||||||||||||||||||
Beginning | Acquisition | Transfer 1 | Disposal | Depreciation 2 | Business combination | Others 3 | Ending | |||||||||||||||||||||||||
(In millions of Korean won) | ||||||||||||||||||||||||||||||||
| Land | ₩ | 2,610,586 | ₩ | 1,106 | ₩ | (81,690 | ) | ₩ | (11,399 | ) | ₩ | — | ₩ | — | ₩ | 29,578 | ₩ | 2,548,181 | ||||||||||||||
| Buildings | 1,771,582 | 2,412 | (79,802 | ) | 6,213 | (69,118 | ) | — | 45,370 | 1,676,657 | ||||||||||||||||||||||
| Leasehold improvements | 95,827 | 13,079 | 40,148 | (891 | ) | (61,294 | ) | — | 1,382 | 88,251 | ||||||||||||||||||||||
| Equipment and vehicles | 340,658 | 153,459 | 2,488 | (1,819 | ) | (187,918 | ) | 537 | 3,778 | 311,183 | ||||||||||||||||||||||
| Construction in-progress | 44,190 | 129,682 | (99,763 | ) | (8,435 | ) | — | — | (26,095 | ) | 39,579 | |||||||||||||||||||||
| Right-of-use assets | 570,711 | 614,069 | (9 | ) | (324,104 | ) | (288,980 | ) | 20 | 4,340 | 576,047 | |||||||||||||||||||||
| ₩ | 5,433,554 | ₩ | 913,807 | ₩ | (218,628 | ) | ₩ | (340,435 | ) | ₩ | (607,310 | ) | ₩ | 557 | ₩ | 58,353 | ₩ | 5,239,898 | ||||||||||||||
2022 | ||||||||||||||||||||||||||||||||
Beginning | Acquisition | Transfer 1 | Disposal | Depreciation 2 | Business combination | Others 3 | Ending | |||||||||||||||||||||||||
(In millions of Korean won) | ||||||||||||||||||||||||||||||||
| Land | ₩ | 2,548,181 | ₩ | 678 | ₩ | (117,290 | ) | ₩ | (7,223 | ) | ₩ | — | ₩ | — | ₩ | (7,620 | ) | ₩ | 2,416,726 | |||||||||||||
| Buildings | 1,676,657 | 12,867 | (39,460 | ) | (7,860 | ) | (66,044 | ) | — | 5,273 | 1,581,433 | |||||||||||||||||||||
| Leasehold improvements | 88,251 | 12,533 | 36,379 | (455 | ) | (60,129 | ) | 8 | (203 | ) | 76,384 | |||||||||||||||||||||
| Equipment and vehicles | 311,183 | 159,109 | 1,899 | (1,795 | ) | (170,529 | ) | 30 | 4,441 | 304,338 | ||||||||||||||||||||||
| Construction in-progress | 39,579 | 110,378 | (121,306 | ) | (397 | ) | — | — | (209 | ) | 28,045 | |||||||||||||||||||||
| Right-of-use assets | 576,047 | 682,393 | (2,640 | ) | (416,712 | ) | (296,509 | ) | — | 41,962 | 584,541 | |||||||||||||||||||||
| ₩ | 5,239,898 | ₩ | 977,958 | ₩ | (242,418 | ) | ₩ | (434,442 | ) | ₩ | (593,211 | ) | ₩ | 38 | ₩ | 43,644 | ₩ | 4,991,467 | ||||||||||||||
1 | Includes transfers with investment properties and assets held for sale. |
| 2 | Includes depreciation expenses amounting to ₩ 196 million and ₩ 255 million recorded as other operating expenses and others for the years ended December 31, 2021 and 2022, respectively. |
3 | Includes net exchange difference. |
2021 | ||||||||||||||||||||
Beginning | Impairment | Reversal | Disposal and others | Ending | ||||||||||||||||
(In millions of Korean won) | ||||||||||||||||||||
| Accumulated impairment losses of property and equipment | ₩ | (6,877 | ) | ₩ | — | ₩ | — | ₩ | 1,126 | ₩ | (5,751 | ) | ||||||||
2022 | ||||||||||||||||||||
Beginning | Impairment | Reversal | Disposal and others | Ending | ||||||||||||||||
(In millions of Korean won) | ||||||||||||||||||||
| Accumulated impairment losses of property and equipment | ₩ | (5,751 | ) | ₩ | — | ₩ | — | ₩ | — | ₩ | (5,751 | ) | ||||||||
December 31, 2021 | ||||||||||||||||
Acquisition cost | Accumulated depreciation | Accumulated impairment losses | Carrying amount | |||||||||||||
(In millions of Korean won) | ||||||||||||||||
| Land | ₩ | 1,577,800 | ₩ | — | ₩ | (447 | ) | ₩ | 1,577,353 | |||||||
| Buildings | 1,089,761 | (147,307 | ) | (4,863 | ) | 937,591 | ||||||||||
| ₩ | 2,667,561 | ₩ | (147,307 | ) | ₩ | (5,310 | ) | ₩ | 2,514,944 | |||||||
December 31, 2022 | ||||||||||||||||
Acquisition cost | Accumulated depreciation | Accumulated impairment losses | Carrying amount | |||||||||||||
(In millions of Korean won) | ||||||||||||||||
| Land | ₩ | 1,496,007 | ₩ | — | ₩ | (478 | ) | ₩ | 1,495,529 | |||||||
| Buildings | 1,783,438 | (125,428 | ) | (5,199 | ) | 1,652,811 | ||||||||||
| ₩ | 3,279,445 | ₩ | (125,428 | ) | ₩ | (5,677 | ) | ₩ | 3,148,340 | |||||||
December 31, 2022 | ||||||||
Fair value | Valuation techniques | Inputs | ||||||
(In millions of Korean won) | ||||||||
| Land and buildings | ₩ | 194,157 | Cost approach method | - Price per square meter - Replacement cost | ||||
| 1,514,800 | Market comparison method | - Price per square meter | ||||||
| 1,527,096 | Discounted cash flow method | - Prospective rental market growth rate - Period of vacancy - Rental ratio - Discount rate and others | ||||||
| 233,850 | Income approach method | - Discount rate - Capitalization rate - Vacancy rate | ||||||
2021 | ||||||||||||||||||||||||||||
Beginning | Acquisition | Transfer* | Disposal | Depreciation | Others | Ending | ||||||||||||||||||||||
(In millions of Korean won) | ||||||||||||||||||||||||||||
| Land | ₩ | 1,568,098 | ₩ | 28,568 | ₩ | 22,410 | ₩ | (63,546 | ) | ₩ | — | ₩ | 21,823 | ₩ | 1,577,353 | |||||||||||||
| Buildings | 965,441 | 90,393 | 1,802 | (112,159 | ) | (28,933 | ) | 21,047 | 937,591 | |||||||||||||||||||
| ₩ | 2,533,539 | ₩ | 118,961 | ₩ | 24,212 | ₩ | (175,705 | ) | ₩ | (28,933 | ) | ₩ | 42,870 | ₩ | 2,514,944 | |||||||||||||
2022 | ||||||||||||||||||||||||||||
Beginning | Acquisition | Transfer* | Disposal | Depreciation | Others | Ending | ||||||||||||||||||||||
(In millions of Korean won) | ||||||||||||||||||||||||||||
| Land | ₩ | 1,577,353 | ₩ | 387,282 | ₩ | (64,630 | ) | ₩ | (414,335 | ) | ₩ | — | ₩ | 9,859 | ₩ | 1,495,529 | ||||||||||||
| Buildings | 937,591 | 880,545 | (62,186 | ) | (153,562 | ) | (38,156 | ) | 88,579 | 1,652,811 | ||||||||||||||||||
| ₩ | 2,514,944 | ₩ | 1,267,827 | ₩ | (126,816 | ) | ₩ | (567,897 | ) | ₩ | (38,156 | ) | ₩ | 98,438 | ₩ | 3,148,340 | ||||||||||||
| * | Includes transfers with property and equipment and assets held for sale. |
December 31, 2021 | ||||||||||||||||||||
Acquisition cost | Accumulated amortization | Accumulated impairment losses | Others | Carrying amount | ||||||||||||||||
(In millions of Korean won) | ||||||||||||||||||||
| Goodwill | ₩ | 887,259 | ₩ | — | ₩ | (70,517 | ) | ₩ | (10,335 | ) | ₩ | 806,407 | ||||||||
| Other intangible assets | 5,227,231 | (2,732,394 | ) | (34,887 | ) | — | 2,459,950 | |||||||||||||
| ₩ | 6,114,490 | ₩ | (2,732,394 | ) | ₩ | (105,404 | ) | ₩ | (10,335 | ) | ₩ | 3,266,357 | ||||||||
December 31, 2022 | ||||||||||||||||||||
Acquisition cost | Accumulated amortization | Accumulated impairment losses | Others | Carrying amount | ||||||||||||||||
(In millions of Korean won) | ||||||||||||||||||||
| Goodwill | ₩ | 903,003 | ₩ | — | ₩ | (70,517 | ) | ₩ | 12,669 | ₩ | 845,155 | |||||||||
| Other intangible assets | 5,537,835 | (3,149,825 | ) | (32,766 | ) | — | 2,355,244 | |||||||||||||
| ₩ | 6,440,838 | ₩ | (3,149,825 | ) | ₩ | (103,283 | ) | ₩ | 12,669 | ₩ | 3,200,399 | |||||||||
December 31, 2021 | December 31, 2022 | |||||||||||||||
Acquisition cost | Carrying amount * | Acquisition cost | Carrying amount * | |||||||||||||
(In millions of Korean won) | ||||||||||||||||
| Housing & Commercial Bank | ₩ | 65,288 | ₩ | 65,288 | ₩ | 65,288 | ₩ | 65,288 | ||||||||
| Kookmin Bank Cambodia Plc. | 1,202 | — | 1,202 | — | ||||||||||||
| KB Securities Co., Ltd. | 70,265 | 58,889 | 70,265 | 58,889 | ||||||||||||
| KB Capital Co., Ltd. | 79,609 | 79,609 | 79,609 | 79,609 | ||||||||||||
| KB Savings Bank Co., Ltd. | 115,343 | 57,404 | 115,343 | 57,404 | ||||||||||||
| KB Securities Vietnam Joint Stock Company | 13,092 | 13,533 | 13,092 | 13,947 | ||||||||||||
| KB Daehan Specialized Bank Plc. | 1,515 | 1,601 | 1,515 | 1,712 | ||||||||||||
| PRASAC Microfinance Institution Plc. | 396,942 | 388,524 | 396,942 | 415,332 | ||||||||||||
| PT Sunindo Kookmin Best Finance | 2,963 | 2,894 | 2,963 | 2,817 | ||||||||||||
| PT Bank KB Bukopin Tbk | 89,220 | 85,893 | 89,220 | 83,619 | ||||||||||||
| PT. KB Finansia Multi Finance | 51,820 | 52,772 | 51,820 | 51,376 | ||||||||||||
| PT. KB Valbury Sekurita | — | — | 11,070 | 10,713 | ||||||||||||
I-Finance Leasing | — | — | 4,674 | 4,449 | ||||||||||||
| ₩ | 887,259 | ₩ | 806,407 | ₩ | 903,003 | ₩ | 845,155 | |||||||||
| * | Includes the effect of exchange differences and others. |
2021 | ||||||||||||||||
Beginning | Impairment | Others | Ending | |||||||||||||
(In millions of Korean won) | ||||||||||||||||
| Accumulated impairment losses of goodwill | ₩ | (70,517 | ) | ₩ | — | ₩ | — | ₩ | (70,517 | ) | ||||||
2022 | ||||||||||||||||
Beginning | Impairment | Others | Ending | |||||||||||||
(In millions of Korean won) | ||||||||||||||||
| Accumulated impairment losses of goodwill | ₩ | (70,517 | ) | ₩ | — | ₩ | — | ₩ | (70,517 | ) | ||||||
December 31, 2022 | ||||||||||||||||||||
Carrying amount of goodwill | Recoverable amount exceeding carrying amount* | Discount rate (%) | Permanent growth rate (%) | |||||||||||||||||
(In millions of Korean won) | ||||||||||||||||||||
| Housing & Commercial Bank | Retail banking | ₩ | 49,315 | ₩ | 5,778,171 | 16.60 | 1.00 | |||||||||||||
| Corporate banking | 15,973 | 2,905,282 | 17.01 | 1.00 | ||||||||||||||||
| KB Securities Co., Ltd. | 58,889 | 29,096 | 17.86 | 1.00 | ||||||||||||||||
| KB Capital Co., Ltd. | 79,609 | 1,019,677 | 16.74 | 1.00 | ||||||||||||||||
| KB Savings Bank Co., Ltd. and Yehansoul Savings Bank Co., Ltd. | 57,404 | 730,113 | 12.16 | 1.00 | ||||||||||||||||
| KB Securities Vietnam Joint Stock Company | 13,947 | 69,658 | 19.66 | 1.00 | ||||||||||||||||
| KB Daehan Specialized Bank Plc. | 1,712 | 23,981 | 21.84 | 1.00 | ||||||||||||||||
| PT Bank KB Bukopin Tbk | 83,619 | 582,823 | 20.16 | 3.00 | ||||||||||||||||
| PRASAC Microfinance Institution Plc. | 415,332 | 122,207 | 30.40 | 3.00 | ||||||||||||||||
| PT Sunindo Kookmin Best Finance | 2,817 | 10,699 | 18.55 | — | ||||||||||||||||
| PT. KB Finansia Multi Finance | 51,376 | 128,087 | 16.35 | 1.00 | ||||||||||||||||
| PT. KB Valbury Sekurita | 10,713 | 67,989 | 13.95 | 1.00 | ||||||||||||||||
| ₩ | 840,706 | ₩ | 11,467,783 | |||||||||||||||||
| * | The recoverable amount exceeding carrying amount is the amount at the time of impairment testing. |
December 31, 2021 | ||||||||||||||||
Acquisition cost | Accumulated amortization | Accumulated impairment losses | Carrying amount | |||||||||||||
(In millions of Korean won) | ||||||||||||||||
| Industrial property rights | ₩ | 3,056 | ₩ | (1,953 | ) | ₩ | — | ₩ | 1,103 | |||||||
| Software | 1,996,646 | (1,417,705 | ) | — | 578,941 | |||||||||||
| Other intangible assets | 797,107 | (365,473 | ) | (34,887 | ) | 396,747 | ||||||||||
| VOBA | 2,395,291 | (915,746 | ) | — | 1,479,545 | |||||||||||
Right-of-use | 35,131 | (31,517 | ) | — | 3,614 | |||||||||||
| ₩ | 5,227,231 | ₩ | (2,732,394 | ) | ₩ | (34,887 | ) | ₩ | 2,459,950 | |||||||
December 31, 2022 | ||||||||||||||||
Acquisition cost | Accumulated amortization | Accumulated impairment losses | Carrying amount | |||||||||||||
(In millions of Korean won) | ||||||||||||||||
| Industrial property rights | ₩ | 4,740 | ₩ | (2,913 | ) | ₩ | (716 | ) | ₩ | 1,111 | ||||||
| Software | 2,260,879 | (1,640,631 | ) | — | 620,248 | |||||||||||
| Other intangible assets | 841,785 | (420,381 | ) | (32,050 | ) | 389,354 | ||||||||||
| VOBA | 2,395,291 | (1,053,362 | ) | — | 1,341,929 | |||||||||||
Right-of-use | 35,140 | (32,538 | ) | — | 2,602 | |||||||||||
| ₩ | 5,537,835 | ₩ | (3,149,825 | ) | ₩ | (32,766 | ) | ₩ | 2,355,244 | |||||||
2021 | ||||||||||||||||||||||||||||
Beginning | Acquisition & transfer | Disposal | Amortization 1 | Business combination | Others | Ending | ||||||||||||||||||||||
(In millions of Korean won) | ||||||||||||||||||||||||||||
| Industrial property rights | ₩ | 2,347 | ₩ | 207 | ₩ | (1,080 | ) | ₩ | (371 | ) | ₩ | — | ₩ | — | ₩ | 1,103 | ||||||||||||
| Software | 573,186 | 219,128 | (838 | ) | (216,073 | ) | 8,742 | (5,204 | ) | 578,941 | ||||||||||||||||||
Other intangible assets 2 | 371,773 | 100,460 | (16,907 | ) | (59,761 | ) | — | 1,182 | 396,747 | |||||||||||||||||||
| VOBA | 1,635,619 | — | — | (156,074 | ) | — | — | 1,479,545 | ||||||||||||||||||||
Right-of-use | 4,626 | — | — | (1,012 | ) | — | — | 3,614 | ||||||||||||||||||||
| ₩ | 2,587,551 | ₩ | 319,795 | ₩ | (18,825 | ) | ₩ | (433,291 | ) | ₩ | 8,742 | ₩ | (4,022 | ) | ₩ | 2,459,950 | ||||||||||||
2022 | ||||||||||||||||||||||||
Beginning | Acquisition & transfer | Disposal | Amortization 1 | Others | Ending | |||||||||||||||||||
(In millions of Korean won) | ||||||||||||||||||||||||
| Industrial property rights | ₩ | 1,103 | ₩ | 254 | ₩ | — | ₩ | (246 | ) | ₩ | — | ₩ | 1,111 | |||||||||||
| Software | 578,941 | 290,229 | (332 | ) | (249,050 | ) | 460 | 620,248 | ||||||||||||||||
Other intangible assets 2 | 396,747 | 69,596 | (10,192 | ) | (62,270 | ) | (4,527 | ) | 389,354 | |||||||||||||||
| VOBA | 1,479,545 | — | — | (137,616 | ) | — | 1,341,929 | |||||||||||||||||
Right-of-use | 3,614 | — | — | (1,012 | ) | — | 2,602 | |||||||||||||||||
| ₩ | 2,459,950 | ₩ | 360,079 | ₩ | (10,524 | ) | ₩ | (450,194 | ) | ₩ | (4,067 | ) | ₩ | 2,355,244 | ||||||||||
| 1 | Includes ₩ 189,791 million and ₩ 164,308 million recorded as insurance expenses and other operating expenses for the years ended December 31, 2021 and 2022, respectively. |
| 2 | Impairment losses for membership right with indefinite useful life among other intangible assets are recognized when its recoverable amount is lower than its carrying amount, and reversal of impairment losses are recognized when its recoverable amount is higher than its carrying amount. |
2021 | ||||||||||||||||||||
Beginning | Impairment | Reversal | Disposal and others | Ending | ||||||||||||||||
(In millions of Korean won) | ||||||||||||||||||||
| Accumulated impairment losses of other intangible assets | ₩ | (36,264 | ) | ₩ | (5,306 | ) | ₩ | 2,939 | ₩ | 3,744 | ₩ | (34,887 | ) | |||||||
2022 | ||||||||||||||||||||
Beginning | Impairment | Reversal | Disposal and others | Ending | ||||||||||||||||
(In millions of Korean won) | ||||||||||||||||||||
| Accumulated impairment losses of other intangible assets | ₩ | (34,887 | ) | ₩ | (1,301 | ) | ₩ | 425 | ₩ | 2,997 | ₩ | (32,766 | ) | |||||||
December 31, 2021 | December 31, 2022 | |||||||
(In millions of Korean won) | ||||||||
Right-of-use | ||||||||
| Real estate | ₩ | 544,075 | ₩ | 557,122 | ||||
| Vehicles | 18,416 | 20,281 | ||||||
| Others | 13,556 | 7,138 | ||||||
| 576,047 | 584,541 | |||||||
Right-of-use | 3,614 | 2,602 | ||||||
| ₩ | 579,661 | ₩ | 587,143 | |||||
| Lease liabilities * | ₩ | 578,808 | ₩ | 592,697 | ||||
| * | Included in property and equipment, intangible assets, and other liabilities. |
2021 | 2022 | |||||||
(In millions of Korean won) | ||||||||
Depreciation and amortization of right-of-use | ||||||||
| Real estate | ₩ | 262,240 | ₩ | 271,703 | ||||
| Vehicles | 17,796 | 17,661 | ||||||
| Others | 8,944 | 7,145 | ||||||
| Intangible assets | 1,012 | 1,012 | ||||||
| ₩ | 289,992 | ₩ | 297,521 | |||||
| Interest expenses on the lease liabilities | ₩ | 14,678 | ₩ | 17,849 | ||||
| Expense relating to short-term lease | 5,920 | 4,388 | ||||||
Expense relating to lease of low-value assets that are not short-term lease | 8,434 | 10,089 | ||||||
| Expense relating to variable lease payments not included in lease liabilities (included in administrative expenses) | 262 | 3 | ||||||
December 31, 2021 | December 31, 2022 | |||||||||||||||
Gross investment in the lease | Present value of minimum lease payments | Gross investment in the lease | Present value of minimum lease payments | |||||||||||||
(In millions of Korean won) | ||||||||||||||||
| Up to 1 year | ₩ | 559,569 | ₩ | 379,439 | ₩ | 509,316 | ₩ | 363,085 | ||||||||
1-5 years | 808,256 | 540,219 | 679,773 | 516,701 | ||||||||||||
| Over 5 years | — | — | 10,166 | 10,167 | ||||||||||||
| ₩ | 1,367,825 | ₩ | 919,658 | ₩ | 1,199,255 | ₩ | 889,953 | |||||||||
December 31, 2021 | December 31, 2022 | |||||||
(In millions of Korean won) | ||||||||
| Gross investment in the lease | ₩ | 1,367,825 | ₩ | 1,199,255 | ||||
| Net investment in the lease: | ||||||||
| Present value of minimum lease payments | 919,658 | 889,953 | ||||||
| Present value of unguaranteed residual value | 349,478 | 232,047 | ||||||
| 1,269,136 | 1,122,000 | |||||||
| Unearned finance income | ₩ | 98,689 | ₩ | 77,255 | ||||
December 31, 2021 | December 31, 2022 | |||||||
(In millions of Korean won) | ||||||||
| Minimum lease payments to be received: | ||||||||
| Up to 1 year | ₩ | 918,640 | ₩ | 919,299 | ||||
1-5 years | 1,797,551 | 1,576,352 | ||||||
| Over 5 years | 299,984 | 227,946 | ||||||
| ₩ | 3,016,175 | ₩ | 2,723,597 | |||||
December 31, 2021 | ||||||||||||
Assets | Liabilities | Net amount | ||||||||||
(In millions of Korean won) | ||||||||||||
| Other provisions | ₩ | 178,027 | ₩ | — | ₩ | 178,027 | ||||||
| Allowances for credit losses | 28,770 | (3,008 | ) | 25,762 | ||||||||
| Impairment losses of property and equipment | 9,198 | (1,833 | ) | 7,365 | ||||||||
| Share-based payments | 24,249 | — | 24,249 | |||||||||
| Provisions for acceptances and guarantees | 33,091 | — | 33,091 | |||||||||
| Gains or losses on valuation of derivatives | 41,289 | (139,281 | ) | (97,992 | ) | |||||||
| Present value discount | 14,254 | (5,929 | ) | 8,325 | ||||||||
| Gains or losses on fair value hedge | — | (14,642 | ) | (14,642 | ) | |||||||
| Accrued interest | — | (140,852 | ) | (140,852 | ) | |||||||
| Deferred loan origination fees and costs | 10,473 | (223,170 | ) | (212,697 | ) | |||||||
| Advanced depreciation provision | — | (1,703 | ) | (1,703 | ) | |||||||
| Gains or losses on revaluation | — | (318,539 | ) | (318,539 | ) | |||||||
| Investments in subsidiaries and others | 42,547 | (159,411 | ) | (116,864 | ) | |||||||
| Gains or losses on valuation of security investment | 104,168 | (1,192,004 | ) | (1,087,836 | ) | |||||||
| Defined benefit liabilities | 608,471 | — | 608,471 | |||||||||
| Accrued expenses | 281,983 | — | 281,983 | |||||||||
| Retirement insurance expense | — | (573,895 | ) | (573,895 | ) | |||||||
| Adjustments to the prepaid contributions | — | (29,273 | ) | (29,273 | ) | |||||||
| Derivative-linked securities | 2,241 | (46,895 | ) | (44,654 | ) | |||||||
| Others* | 1,031,411 | (871,625 | ) | 159,786 | ||||||||
| 2,410,172 | (3,722,060 | ) | (1,311,888 | ) | ||||||||
| Offsetting of deferred income tax assets and liabilities | (2,251,079 | ) | 2,251,079 | — | ||||||||
| ₩ | 159,093 | ₩ | (1,470,981 | ) | ₩ | (1,311,888 | ) | |||||
December 31, 2022 | ||||||||||||
Assets | Liabilities | Net amount | ||||||||||
(In millions of Korean won) | ||||||||||||
| Other provisions | ₩ | 195,191 | ₩ | — | ₩ | 195,191 | ||||||
| Allowances for credit losses | 2,151 | (12,259 | ) | (10,108 | ) | |||||||
| Impairment losses of property and equipment | 6,088 | (1,476 | ) | 4,612 | ||||||||
| Share-based payments | 21,406 | — | 21,406 | |||||||||
| Provisions for acceptances and guarantees | 39,787 | — | 39,787 | |||||||||
| Gains or losses on valuation of derivatives | 135,985 | (207,778 | ) | (71,793 | ) | |||||||
| Present value discount | 20,247 | (2,571 | ) | 17,676 | ||||||||
| Gains or losses on fair value hedge | — | (93,833 | ) | (93,833 | ) | |||||||
| Accrued interest | — | (168,068 | ) | (168,068 | ) | |||||||
| Deferred loan origination fees and costs | 13,675 | (185,723 | ) | (172,048 | ) | |||||||
| Advanced depreciation provision | — | (4,018 | ) | (4,018 | ) | |||||||
| Gains or losses on revaluation | 315 | (292,373 | ) | (292,058 | ) | |||||||
| Investments in subsidiaries and others | 48,693 | (203,130 | ) | (154,437 | ) | |||||||
| Gains or losses on valuation of security investment | 1,040,989 | (278,334 | ) | 762,655 | ||||||||
| Defined benefit liabilities | 497,982 | (799 | ) | 497,183 | ||||||||
| Accrued expenses | 268,529 | — | 268,529 | |||||||||
| Retirement insurance expense | — | (583,156 | ) | (583,156 | ) | |||||||
| Adjustments to the prepaid contributions | — | (27,986 | ) | (27,986 | ) | |||||||
| Derivative-linked securities | 10,102 | (283,840 | ) | (273,738 | ) | |||||||
| Others* | 1,224,029 | (951,433 | ) | 272,596 | ||||||||
| 3,525,169 | (3,296,777 | ) | 228,392 | |||||||||
| Offsetting of deferred income tax assets and liabilities | (3,274,084 | ) | 3,274,084 | — | ||||||||
| ₩ | 251,085 | ₩ | (22,693 | ) | ₩ | 228,392 | ||||||
| * | Includes Purchase Price Allocation (“PPA”) amount arising from the acquisition of KB Life Insurance Co., Ltd.(former Prudential Life Insurance Company of Korea Ltd.), KB Insurance Co., Ltd. and others. |
| • | The Group is able to control the timing of the reversal of the temporary differences. |
| • | It is probable that these temporary differences will not reverse in the foreseeable future. |
2021 | ||||||||||||||||
Beginning | Decrease | Increase | Ending | |||||||||||||
(In millions of Korean won) | ||||||||||||||||
Deductible temporary differences | ||||||||||||||||
| Gains or losses on fair value hedge | ₩ | 76,583 | ₩ | 76,583 | ₩ | — | ₩ | — | ||||||||
| Other provisions | 544,705 | 527,058 | 631,800 | 649,447 | ||||||||||||
| Allowances for credit losses | 93,749 | 69,023 | 75,452 | 100,178 | ||||||||||||
| Impairment losses of property and equipment | 14,516 | 4,361 | 23,290 | 33,445 | ||||||||||||
| Deferred loan origination fees and costs | 26,269 | 13,719 | 25,536 | 38,086 | ||||||||||||
| Share-based payments | 62,085 | 55,002 | 78,225 | 85,308 | ||||||||||||
| Provisions for acceptances and guarantees | 61,984 | 61,984 | 120,332 | 120,332 | ||||||||||||
| Gains or losses on valuation of derivatives | 76,238 | 76,238 | 149,817 | 149,817 | ||||||||||||
| Present value discount | 62,029 | 61,783 | 51,586 | 51,832 | ||||||||||||
| Investments in subsidiaries and others | 371,001 | 203,470 | 346,809 | 514,340 | ||||||||||||
| Gains or losses on valuation of security investment | 251,690 | 252,497 | 368,886 | 368,079 | ||||||||||||
| Defined benefit liabilities | 2,299,159 | 315,719 | 393,189 | 2,376,629 | ||||||||||||
| Accrued expenses | 1,220,283 | 1,220,283 | 1,026,651 | 1,026,651 | ||||||||||||
| Derivative-linked securities | 284,370 | 284,370 | 8,147 | 8,147 | ||||||||||||
| Others* | 3,648,764 | 554,628 | 100,539 | 3,194,675 | ||||||||||||
| 9,093,425 | 3,776,718 | 3,400,259 | 8,716,966 | |||||||||||||
Unrecognized deferred income tax assets | ||||||||||||||||
| Other provisions | 3,054 | 404 | ||||||||||||||
| Investments in subsidiaries and others | 242,875 | 372,410 | ||||||||||||||
| Others | 75,831 | 107,067 | ||||||||||||||
| 8,771,665 | 8,237,085 | |||||||||||||||
| Tax rate (%) | 27.5 | 27.5 | ||||||||||||||
Total deferred income tax assets | ₩ | 2,478,283 | ₩ | 2,410,172 | ||||||||||||
Taxable temporary differences | ||||||||||||||||
| Gains or losses on fair value hedge | ₩ | — | ₩ | — | ₩ | (53,243 | ) | ₩ | (53,243 | ) | ||||||
| Accrued interest | (457,626 | ) | (442,101 | ) | (496,663 | ) | (512,188 | ) | ||||||||
| Allowances for credit losses | (12,203 | ) | (12,203 | ) | (10,939 | ) | (10,939 | ) | ||||||||
| Impairment losses of property and equipment | (3,935 | ) | (204 | ) | — | (3,731 | ) | |||||||||
| Deferred loan origination fees and costs | (820,223 | ) | (820,223 | ) | (802,237 | ) | (802,237 | ) | ||||||||
| Advanced depreciation provision | (6,192 | ) | — | — | (6,192 | ) | ||||||||||
| Gains or losses on valuation of derivatives | (812,662 | ) | (804,383 | ) | (498,197 | ) | (506,476 | ) | ||||||||
| Present value discount | (10,916 | ) | (10,916 | ) | (21,469 | ) | (21,469 | ) | ||||||||
| Goodwill arising from the merger | (65,288 | ) | — | — | (65,288 | ) | ||||||||||
| Gains or losses on revaluation | (1,162,538 | ) | (48,981 | ) | (44,765 | ) | (1,158,322 | ) | ||||||||
| Investments in subsidiaries and others | (646,676 | ) | (150,480 | ) | (468,334 | ) | (964,530 | ) | ||||||||
| Gains or losses on valuation of security investment | (4,425,922 | ) | (2,552,447 | ) | (2,394,100 | ) | (4,267,575 | ) | ||||||||
| Retirement insurance expense | (1,963,061 | ) | (228,784 | ) | (346,368 | ) | (2,080,645 | ) | ||||||||
| Adjustments to the prepaid contributions | (102,768 | ) | (102,768 | ) | (106,446 | ) | (106,446 | ) | ||||||||
| Derivative-linked securities | (112,293 | ) | (112,293 | ) | (170,526 | ) | (170,526 | ) | ||||||||
| Others* | (2,706,386 | ) | (1,819,652 | ) | (2,208,579 | ) | (3,095,313 | ) | ||||||||
| (13,308,689 | ) | (7,105,435 | ) | (7,621,866 | ) | (13,825,120 | ) | |||||||||
Unrecognized deferred income tax liabilities | ||||||||||||||||
| Goodwill arising from the merger | (65,288 | ) | (65,288 | ) | ||||||||||||
| Investments in subsidiaries and others | (260,739 | ) | (404,147 | ) | ||||||||||||
| Others | (1,042 | ) | (446 | ) | ||||||||||||
| (12,981,620 | ) | (13,355,239 | ) | |||||||||||||
| Tax rate (%) | 27.5 | 27.5 | ||||||||||||||
Total deferred income tax liabilities | ₩ | (3,591,024 | ) | ₩ | (3,722,060 | ) | ||||||||||
2022 | ||||||||||||||||
Beginning | Decrease | Increase | Ending | |||||||||||||
(In millions of Korean won) | ||||||||||||||||
Deductible temporary differences | ||||||||||||||||
| Other provisions | ₩ | 649,447 | ₩ | 625,770 | ₩ | 715,694 | ₩ | 739,371 | ||||||||
| Allowances for credit losses | 100,178 | 99,713 | 326 | 791 | ||||||||||||
| Impairment losses of property and equipment | 33,445 | 22,725 | 12,255 | 22,975 | ||||||||||||
| Deferred loan origination fees and costs | 38,086 | 19,556 | 33,075 | 51,605 | ||||||||||||
| Share-based payments | 85,308 | 74,120 | 69,589 | 80,777 | ||||||||||||
| Provisions for acceptances and guarantees | 120,332 | 120,332 | 150,140 | 150,140 | ||||||||||||
| Gains or losses on valuation of derivatives | 149,817 | 149,817 | 513,151 | 513,151 | ||||||||||||
| Present value discount | 51,832 | 51,586 | 76,153 | 76,399 | ||||||||||||
| Investments in subsidiaries and others | 514,340 | 59,444 | 863,317 | 1,318,213 | ||||||||||||
| Gains or losses on valuation of security investment | 368,079 | 368,079 | 3,872,016 | 3,872,016 | ||||||||||||
| Defined benefit liabilities | 2,376,629 | 467,454 | 118,171 | 2,027,346 | ||||||||||||
| Accrued expenses | 1,026,651 | 1,026,591 | 1,013,263 | 1,013,323 | ||||||||||||
| Derivative-linked securities | 8,147 | 8,147 | 38,123 | 38,123 | ||||||||||||
Others 1 | 3,194,675 | 2,306,121 | 2,950,445 | 3,838,999 | ||||||||||||
| 8,716,966 | 5,399,455 | 10,425,718 | 13,743,229 | |||||||||||||
Unrecognized deferred income tax assets | ||||||||||||||||
| Other provisions | 404 | 3,880 | ||||||||||||||
| Investments in subsidiaries and others | 372,410 | 1,148,089 | ||||||||||||||
| Others | 107,067 | 96,750 | ||||||||||||||
| 8,237,085 | 12,494,510 | |||||||||||||||
| Tax rate (%) | 27.5 | 26.5 | ||||||||||||||
Total deferred income tax assets | ₩ | 2,410,172 | ₩ | 3,525,169 | ||||||||||||
Taxable temporary differences | ||||||||||||||||
| Gains or losses on fair value hedge | ₩ | (53,243 | ) | ₩ | (53,243 | ) | ₩ | (354,085 | ) | ₩ | (354,085 | ) | ||||
| Accrued interest | (512,188 | ) | (475,840 | ) | (597,870 | ) | (634,218 | ) | ||||||||
| Allowances for credit losses | (10,939 | ) | (10,939 | ) | (46,262 | ) | (46,262 | ) | ||||||||
| Impairment losses of property and equipment | (3,731 | ) | (283 | ) | — | (3,448 | ) | |||||||||
| Deferred loan origination fees and costs | (802,237 | ) | (802,237 | ) | (690,979 | ) | (690,979 | ) | ||||||||
| Advanced depreciation provision | (6,192 | ) | (126 | ) | (9,097 | ) | (15,163 | ) | ||||||||
| Gains or losses on valuation of derivatives | (506,476 | ) | (498,609 | ) | (747,674 | ) | (755,541 | ) | ||||||||
| Present value discount | (21,469 | ) | (21,469 | ) | (9,703 | ) | (9,703 | ) | ||||||||
| Goodwill arising from the merger | (65,288 | ) | — | — | (65,288 | ) | ||||||||||
| Gains or losses on revaluation | (1,158,322 | ) | (92,944 | ) | (37,914 | ) | (1,103,292 | ) | ||||||||
| Investments in subsidiaries and others | (964,530 | ) | (87,129 | ) | (434,311 | ) | (1,311,712 | ) | ||||||||
| Gains or losses on valuation of security investment | (4,267,575 | ) | (4,263,845 | ) | (988,618 | ) | (992,348 | ) | ||||||||
| Defined benefit liabilities | — | — | (3,014 | ) | (3,014 | ) | ||||||||||
| Retirement insurance expense | (2,080,645 | ) | (324,513 | ) | (437,492 | ) | (2,193,624 | ) | ||||||||
| Adjustments to the prepaid contributions | (106,446 | ) | (106,446 | ) | (105,608 | ) | (105,608 | ) | ||||||||
| Derivative-linked securities | (170,526 | ) | (170,526 | ) | (1,071,093 | ) | (1,071,093 | ) | ||||||||
Others 1 | (3,095,313 | ) | (1,832,328 | ) | (2,218,485 | ) | (3,481,470 | ) | ||||||||
| (13,825,120 | ) | (8,740,477 | ) | (7,752,205 | ) | (12,836,848 | ) | |||||||||
Unrecognized deferred income tax liabilities | ||||||||||||||||
| Goodwill arising from the merger | (65,288 | ) | (65,288 | ) | ||||||||||||
| Investments in subsidiaries and others | (404,147 | ) | (565,035 | ) | ||||||||||||
| Others | (446 | ) | (446 | ) | ||||||||||||
| (13,355,239 | ) | (12,206,079 | ) | |||||||||||||
Tax rate (%) 2 | 27.5 | 26.5 | ||||||||||||||
Total deferred income tax liabilities | ₩ | (3,722,060 | ) | ₩ | (3,296,777 | ) | ||||||||||
| * | Includes PPA amount arising from the acquisition of KB Life Insurance Co., Ltd.(former Prudential Life Insurance Company of Korea Ltd.), KB Insurance Co., Ltd. and others. |
| 1 | Includes PPA amount arising from the acquisition of KB Life Insurance Co., Ltd.(former Prudential Life Insurance Company of Korea Ltd.), KB Insurance Co., Ltd. and others. |
| 2 | The corporate tax rate was changed due to the amendment of corporate tax law in 2022. Accordingly, the rate of 26.5% has been applied for the deferred tax assets and liabilities expected to be utilized in periods after December 31, 2022. |
December 31, 2021 | ||||||||||||||||
Acquisition cost* | Accumulated impairment losses | Carrying amount | Fair value less costs to sell | |||||||||||||
(In millions of Korean won) | ||||||||||||||||
| Land held for sale | ₩ | 115,099 | ₩ | (16,528 | ) | ₩ | 98,571 | ₩ | 135,192 | |||||||
| Buildings held for sale | 170,892 | (36,923 | ) | 133,969 | 149,569 | |||||||||||
| Other assets held for sale | 10,142 | (5,364 | ) | 4,778 | 4,778 | |||||||||||
| ₩ | 296,133 | ₩ | (58,815 | ) | ₩ | 237,318 | ₩ | 289,539 | ||||||||
December 31, 2022 | ||||||||||||||||
Acquisition cost* | Accumulated impairment losses | Carrying amount | Fair value less costs to sell | |||||||||||||
(In millions of Korean won) | ||||||||||||||||
| Land held for sale | ₩ | 106,349 | ₩ | (20,395 | ) | ₩ | 85,954 | ₩ | 104,990 | |||||||
| Buildings held for sale | 162,973 | (38,869 | ) | 124,104 | 137,706 | |||||||||||
| Other assets held for sale | 4,547 | (2,847 | ) | 1,700 | 1,699 | |||||||||||
| ₩ | 273,869 | ₩ | (62,111 | ) | ₩ | 211,758 | ₩ | 244,395 | ||||||||
| * | Acquisition cost of buildings held for sale is net of accumulated depreciation amount immediately before the initial classification of the assets as held for sale. |
December 31, 2022 | ||||||||||||
Fair value | Valuation techniques 1 | Unobservable inputs 2 | Estimated range of unobservable inputs (%) | Effect of unobservable inputs to fair value | ||||||||
(In millions of Korean won) | ||||||||||||
| Land and buildings | ₩ | 244,395 | Sales comparison approach model and others | Adjustment index | 0.68 ~ 1.95 | Fair value increases as the adjustment index rises | ||||||
| 1 | The appraisal value is adjusted by the adjustment ratio in the event the public sale is unsuccessful. |
| 2 | Adjustment index is calculated using the time factor correction or local factors or individual factors. |
2021 | ||||||||||||||||||||
Beginning | Provision | Reversal | Others | Ending | ||||||||||||||||
(In millions of Korean won) | ||||||||||||||||||||
| Accumulated impairment losses of assets held for sale | ₩ | (46,115 | ) | ₩ | (15,490 | ) | ₩ | — | ₩ | 2,790 | ₩ | (58,815 | ) | |||||||
2022 | ||||||||||||||||||||
Beginning | Provision | Reversal | Others | Ending | ||||||||||||||||
(In millions of Korean won) | ||||||||||||||||||||
| Accumulated impairment losses of assets held for sale | ₩ | (58,815 | ) | ₩ | (7,587 | ) | ₩ | 242 | ₩ | 4,049 | ₩ | (62,111 | ) | |||||||
December 31, 2021 | ||||||||||||
498 seventh Holdco LP | 498 seventh KOR LLC | Total | ||||||||||
(In millions of Korean won) | ||||||||||||
| Cash | ₩ | 556 | ₩ | 512 | ₩ | 1,068 | ||||||
| Investments in associates | — | 169,424 | 169,424 | |||||||||
| Other assets | — | 1,257 | 1,257 | |||||||||
| ₩ | 556 | ₩ | 171,193 | ₩ | 171,749 | |||||||
December 31, 2021 | ||||
(In millions of Korean won) | ||||
| Currency translation differences | ₩ | 7,671 | ||
December 31, 2021 | December 31, 2022 | |||||||
(In millions of Korean won) | ||||||||
Other financial assets | ||||||||
| Other receivables | ₩ | 6,732,917 | ₩ | 6,648,187 | ||||
| Accrued income | 1,916,667 | 2,507,324 | ||||||
| Guarantee deposits | 1,035,522 | 984,176 | ||||||
| Domestic exchange settlement debits | 1,014,938 | 879,847 | ||||||
| Others | 204,940 | 352,955 | ||||||
| Less: Allowances for credit losses | (143,205 | ) | (155,404 | ) | ||||
| Less: Present value discount | (6,429 | ) | (7,735 | ) | ||||
| 10,755,350 | 11,209,350 | |||||||
Other non-financial assets | ||||||||
| Other receivables | 1,764 | 5,653 | ||||||
| Prepaid expenses | 254,990 | 471,258 | ||||||
| Guarantee deposits | 7,268 | 3,157 | ||||||
| Insurance assets | 2,924,698 | 3,248,548 | ||||||
| Separate account assets | 10,556,935 | 9,820,673 | ||||||
| Others | 3,689,340 | 3,697,420 | ||||||
| Less: Allowances for credit losses | (16,172 | ) | (18,530 | ) | ||||
| 17,418,823 | 17,228,179 | |||||||
| ₩ | 28,174,173 | ₩ | 28,437,529 | |||||
2021 | ||||||||||||
Other financial assets | Other non-financial assets | Total | ||||||||||
(In millions of Korean won) | ||||||||||||
| Beginning | ₩ | 119,762 | ₩ | 17,520 | ₩ | 137,282 | ||||||
| Write-offs | (3,504 | ) | (380 | ) | (3,884 | ) | ||||||
| Provision | 25,387 | (447 | ) | 24,940 | ||||||||
| Business combination | 227 | — | 227 | |||||||||
| Others | 1,333 | (521 | ) | 812 | ||||||||
| Ending | ₩ | 143,205 | ₩ | 16,172 | ₩ | 159,377 | ||||||
2022 | ||||||||||||
Other financial assets | Other non-financial assets | Total | ||||||||||
(In millions of Korean won) | ||||||||||||
| Beginning | ₩ | 143,205 | ₩ | 16,172 | ₩ | 159,377 | ||||||
| Write-offs | (10,028 | ) | (70 | ) | (10,098 | ) | ||||||
| Provision (reversal) | 15,224 | 2,182 | 17,406 | |||||||||
| Business combination | 267 | — | 267 | |||||||||
| Others | 6,736 | 246 | 6,982 | |||||||||
| Ending | ₩ | 155,404 | ₩ | 18,530 | ₩ | 173,934 | ||||||
December 31, 2021 | December 31, 2022 | |||||||
(In millions of Korean won) | ||||||||
Financial liabilities at fair value through profit or loss | ||||||||
| Borrowed securities sold | ₩ | 2,826,885 | ₩ | 2,102,537 | ||||
| Others | 112,699 | 90,673 | ||||||
| 2,939,584 | 2,193,210 | |||||||
Financial liabilities designated at fair value through profit or loss | ||||||||
| Derivative-linked securities | 9,149,396 | 10,078,394 | ||||||
| 9,149,396 | 10,078,394 | |||||||
| ₩ | 12,088,980 | ₩ | 12,271,604 | |||||
December 31, 2021 | December 31, 2022 | |||||||
(In millions of Korean won) | ||||||||
| Amount contractually required to pay at maturity | ₩ | 8,957,602 | ₩ | 9,973,340 | ||||
| Carrying amount | 9,149,396 | 10,078,394 | ||||||
| Difference | ₩ | (191,794 | ) | ₩ | (105,054 | ) | ||
December 31, 2021 | December 31, 2022 | |||||||
(In millions of Korean won) | ||||||||
Demand deposits | ||||||||
| Demand deposits in Korean won | ₩ | 180,560,022 | ₩ | 152,079,457 | ||||
| Demand deposits in foreign currencies | 15,955,246 | 12,844,385 | ||||||
| 196,515,268 | 164,923,842 | |||||||
Time deposits | ||||||||
| Time deposits in Korean won | 155,799,563 | 194,117,692 | ||||||
| 155,799,563 | 194,117,692 | |||||||
| Time deposits in foreign currencies | 15,594,718 | 23,529,633 | ||||||
| Fair value adjustments of fair value hedged time deposits in foreign currencies | (1,319 | ) | (8,591 | ) | ||||
| 15,593,399 | 23,521,042 | |||||||
| 171,392,962 | 217,638,734 | |||||||
Certificates of deposits | 4,115,688 | 6,325,876 | ||||||
| ₩ | 372,023,918 | ₩ | 388,888,452 | |||||
December 31, 2021 | December 31, 2022 | |||||||
(In millions of Korean won) | ||||||||
| General borrowings | ₩ | 40,859,845 | ₩ | 55,789,869 | ||||
| Bonds sold under repurchase agreements and others | 14,374,863 | 11,773,494 | ||||||
| Call money | 1,677,666 | 4,154,003 | ||||||
| ₩ | 56,912,374 | ₩ | 71,717,366 | |||||
Lenders | Interest rate (%) as of December 31, 2022 | December 31, 2021 | December 31, 2022 | |||||||||||
(In millions of Korean won) | ||||||||||||||
Borrowings in Korean won | Borrowings from the Bank of Korea | The Bank of Korea | 0.25 ~ 1.75 | ₩ | 7,131,019 | ₩ | 8,282,289 | |||||||
| Borrowings from the government | SEMAS and others | 0.00 ~ 3.23 | 2,683,056 | 2,670,867 | ||||||||||
| Borrowings from banks | Shinhan Bank and others | 2.49 ~ 6.53 | 171,482 | 914,360 | ||||||||||
Borrowings from non-banking financial institutions | Korea Securities Finance Corporation and others | 1.39 ~ 6.96 | 1,935,906 | 2,189,510 | ||||||||||
| Other borrowings | The Korea Development Bank and others | 0.00 ~ 8.79 | 13,292,759 | 19,806,869 | ||||||||||
| 25,214,222 | 33,863,895 | |||||||||||||
Borrowings in foreign currencies | Due to banks | Bank of China Seoul Branch and others | — | 2,143 | 18,266 | |||||||||
| Borrowings from banks | Central Bank of Uzbekistan and others | 0.00 ~ 14.00 | 13,396,379 | 16,296,725 | ||||||||||
| Borrowings from other financial institutions | The Export-Import Bank of Korea and others | 5.07 ~ 5.89 | 24,867 | 38,249 | ||||||||||
| Other borrowings | Standard Chartered Bank and others | 0.00 ~ 8.00 | 2,222,234 | 5,572,734 | ||||||||||
| 15,645,623 | 21,925,974 | |||||||||||||
| ₩ | 40,859,845 | ₩ | 55,789,869 | |||||||||||
Lenders | Interest rate (%) as of December 31, 2022 | December 31, 2021 | December 31, 2022 | |||||||||||
(In millions of Korean won) | ||||||||||||||
| Bonds sold under repurchase agreements | Individuals, groups, and corporations | 0.00~9.75 | ₩ | 14,372,761 | ₩ | 11,769,694 | ||||||||
| Bills sold | Counter sale | 1.55~2.00 | 2,102 | 3,800 | ||||||||||
| ₩ | 14,374,863 | ₩ | 11,773,494 | |||||||||||
Lenders | Interest rate (%) as of December 31, 2022 | December 31, 202 1 | December 31, 202 2 | |||||||||||
(In millions of Korean won) | ||||||||||||||
| Call money in Korean won | Samsung Asset Management and others | 2.90~5.05 | ₩ | 40,000 | ₩ | 2,943,500 | ||||||||
| Call money in foreign currencies | BANK CIMB NIAGA and others | 0.00~7.80 | 1,637,666 | 1,210,503 | ||||||||||
| ₩ | 1,677,666 | ₩ | 4,154,003 | |||||||||||
Interest rate (%) as of December 31, 2022 | December 31, 2021 | December 31, 2022 | ||||||||||
(In millions of Korean won) | ||||||||||||
Debentures in Korean won | ||||||||||||
| Structured debentures | 5.65 ~ 8.62 | ₩ | 910 | ₩ | 710 | |||||||
| Exchangeable bonds* | 0.00 | 240,000 | 240,000 | |||||||||
| Subordinated fixed rate debentures | 2.02 ~ 7.86 | 6,241,957 | 5,354,890 | |||||||||
| Fixed rate debentures | 0.99 ~ 13.70 | 44,124,235 | 45,424,094 | |||||||||
| Floating rate debentures | 1.54 ~ 6.36 | 6,893,782 | 5,455,000 | |||||||||
| 57,500,884 | 56,474,694 | |||||||||||
Fair value adjustments of fair value hedged debentures in Korean won | (79,877 | ) | (249,629 | ) | ||||||||
Less: Discount on debentures in Korean won | (38,976 | ) | (29,166 | ) | ||||||||
Less: Adjustment for exchange right of exchangeable bonds in Korean won | (11,719 | ) | (8,435 | ) | ||||||||
| 57,370,312 | 56,187,464 | |||||||||||
Debentures in foreign currencies | ||||||||||||
| Floating rate debentures | 2.42 ~ 5.98 | 2,749,174 | 2,168,341 | |||||||||
| Fixed rate debentures | 0.05 ~ 12.00 | 7,312,966 | 10,482,244 | |||||||||
| 10,062,140 | 12,650,585 | |||||||||||
Fair value adjustments of fair value hedged debentures in foreign currencies | 27,953 | (95,865 | ) | |||||||||
Less: Discount on debentures in foreign currencies | (30,217 | ) | (43,981 | ) | ||||||||
| 10,059,876 | 12,510,739 | |||||||||||
| ₩ | 67,430,188 | ₩ | 68,698,203 | |||||||||
| * | Fair value of the liability component of exchangeable bonds is calculated by using market interest rate of bonds under the same conditions without the exchange right. The residual amount after deducting the liability component from the issuance amount, represents the value of the exchange right and is recorded in equity. Shares to be exchanged are 5 million treasury shares of KB Financial Group Inc. with the exchange price of ₩ 48,000. Exercise period for exchange right is from the 60th day of the issuance date to 10 days before the maturity date. |
2021 | ||||||||||||||||||||
Beginning | Issue | Repayment | Others | Ending | ||||||||||||||||
(In millions of Korean won) | ||||||||||||||||||||
Debentures in Korean won | ||||||||||||||||||||
| Structured debentures | ₩ | 1,960 | ₩ | — | ₩ | (1,050 | ) | ₩ | — | ₩ | 910 | |||||||||
| Exchangeable bonds | 240,000 | — | — | — | 240,000 | |||||||||||||||
| Subordinated fixed rate debentures | 4,834,407 | 1,409,000 | (1,450 | ) | — | 6,241,957 | ||||||||||||||
| Fixed rate debentures | 47,229,619 | 110,295,448 | (113,400,832 | ) | — | 44,124,235 | ||||||||||||||
| Floating rate debentures | 3,190,000 | 6,085,064 | (2,381,282 | ) | — | 6,893,782 | ||||||||||||||
| 55,495,986 | 117,789,512 | (115,784,614 | ) | — | 57,500,884 | |||||||||||||||
Debentures in foreign currencies | ||||||||||||||||||||
| Floating rate debentures | 2,232,938 | 810,920 | (500,901 | ) | 206,217 | 2,749,174 | ||||||||||||||
| Fixed rate debentures | 5,030,580 | 3,195,539 | (1,224,070 | ) | 310,917 | 7,312,966 | ||||||||||||||
| 7,263,518 | 4,006,459 | (1,724,971 | ) | 517,134 | 10,062,140 | |||||||||||||||
| ₩ | 62,759,504 | ₩ | 121,795,971 | ₩ | (117,509,585 | ) | ₩ | 517,134 | ₩ | 67,563,024 | ||||||||||
2022 | ||||||||||||||||||||
Beginning | Issue | Repayment | Others | Ending | ||||||||||||||||
(In millions of Korean won) | ||||||||||||||||||||
Debentures in Korean won | ||||||||||||||||||||
| Structured debentures | ₩ | 910 | ₩ | — | ₩ | (200 | ) | ₩ | — | ₩ | 710 | |||||||||
| Exchangeable bonds | 240,000 | — | — | — | 240,000 | |||||||||||||||
| Subordinated fixed rate debentures | 6,241,957 | 286,000 | (1,173,067 | ) | — | 5,354,890 | ||||||||||||||
| Fixed rate debentures | 44,124,235 | 96,782,415 | (95,482,556 | ) | — | 45,424,094 | ||||||||||||||
| Floating rate debentures | 6,893,782 | 5,350,000 | (6,788,782 | ) | — | 5,455,000 | ||||||||||||||
| 57,500,884 | 102,418,415 | (103,444,605 | ) | — | 56,474,694 | |||||||||||||||
Debentures in foreign currencies | ||||||||||||||||||||
| Floating rate debentures | 2,749,174 | 1,286,016 | (2,072,615 | ) | 205,766 | 2,168,341 | ||||||||||||||
| Fixed rate debentures | 7,312,966 | 3,940,693 | (1,113,993 | ) | 342,578 | 10,482,244 | ||||||||||||||
| 10,062,140 | 5,226,709 | (3,186,608 | ) | 548,344 | 12,650,585 | |||||||||||||||
| ₩ | 67,563,024 | ₩ | 107,645,124 | ₩ | (106,631,213 | ) | ₩ | 548,344 | ₩ | 69,125,279 | ||||||||||
December 31, 2021 | December 31, 2022 | |||||||
(In millions of Korean won) | ||||||||
| Provisions for credit losses of unused loan commitments | ₩ | 308,640 | ₩ | 342,182 | ||||
| Provisions for credit losses of acceptances and guarantees | 121,104 | 153,529 | ||||||
| Provisions for credit losses of financial guarantee contracts | 5,351 | 2,955 | ||||||
| Provisions for restoration costs | 152,186 | 159,033 | ||||||
| Others* | 221,323 | 311,120 | ||||||
| ₩ | 808,604 | ₩ | 968,819 | |||||
| * | Includes provisions for redemption-suspended funds. |
2021 | ||||||||||||||||||||||||
Provisions for credit losses of unused loan commitments | Provisions for credit losses of acceptances and guarantees | |||||||||||||||||||||||
12-month expected credit losses | Lifetime expected credit losses | 12-month expected credit losses | Lifetime expected credit losses | |||||||||||||||||||||
Non- impaired | Impaired | Non- impaired | Impaired | |||||||||||||||||||||
(In millions of Korean won) | ||||||||||||||||||||||||
| Beginning | ₩ | 162,721 | ₩ | 127,463 | ₩ | 8,569 | ₩ | 33,088 | ₩ | 14,838 | ₩ | 14,328 | ||||||||||||
| Transfer between stages: | ||||||||||||||||||||||||
Transfer to 12-month expected credit losses | 38,831 | (37,595 | ) | (1,236 | ) | 3,958 | (203 | ) | (3,755 | ) | ||||||||||||||
| Transfer to lifetime expected credit losses | (27,308 | ) | 28,203 | (895 | ) | (3,973 | ) | 3,982 | (9 | ) | ||||||||||||||
| Impairment | (457 | ) | (1,002 | ) | 1,459 | (10 | ) | (85 | ) | 95 | ||||||||||||||
| Provision (reversal) for credit losses | (22,543 | ) | 29,145 | 127 | (7,425 | ) | 64,178 | 711 | ||||||||||||||||
| Business combination | 813 | — | — | — | — | — | ||||||||||||||||||
| Others (exchange differences, etc.) | 1,940 | 405 | — | 1,759 | (540 | ) | 167 | |||||||||||||||||
| Ending | ₩ | 153,997 | ₩ | 146,619 | ₩ | 8,024 | ₩ | 27,397 | ₩ | 82,170 | ₩ | 11,537 | ||||||||||||
2022 | ||||||||||||||||||||||||
Provisions for credit losses of unused loan commitments | Provisions for credit losses of acceptances and guarantees | |||||||||||||||||||||||
12-month expected credit losses | Lifetime expected credit losses | 12-month expected credit losses | Lifetime expected credit losses | |||||||||||||||||||||
Non- impaired | Impaired | Non- impaired | Impaired | |||||||||||||||||||||
(In millions of Korean won) | ||||||||||||||||||||||||
| Beginning | ₩ | 153,997 | ₩ | 146,619 | ₩ | 8,024 | ₩ | 27,397 | ₩ | 82,170 | ₩ | 11,537 | ||||||||||||
| Transfer between stages: | ||||||||||||||||||||||||
Transfer to 12-month expected credit losses | 41,314 | (40,375 | ) | (939 | ) | 1,144 | (1,144 | ) | — | |||||||||||||||
| Transfer to lifetime expected credit losses | (19,232 | ) | 19,848 | (616 | ) | (355 | ) | 1,016 | (661 | ) | ||||||||||||||
| Impairment | (338 | ) | (1,705 | ) | 2,043 | (9 | ) | (142 | ) | 151 | ||||||||||||||
| Provision (reversal) for credit losses | 2,587 | 25,743 | 2,738 | (1,689 | ) | 33,983 | (3,262 | ) | ||||||||||||||||
| Others (exchange differences, etc.) | 1,557 | 937 | (20 | ) | 418 | 2,841 | 134 | |||||||||||||||||
| Ending | ₩ | 179,885 | ₩ | 151,067 | ₩ | 11,230 | ₩ | 26,906 | ₩ | 118,724 | ₩ | 7,899 | ||||||||||||
2021 | 2022 | |||||||
(In millions of Korean won) | ||||||||
| Beginning | ₩ | 6,348 | ₩ | 5,351 | ||||
| Provision (reversal) | (830 | ) | (2,396 | ) | ||||
| Others | (167 | ) | — | |||||
| Ending | ₩ | 5,351 | ₩ | 2,955 | ||||
2021 | 2022 | |||||||
(In millions of Korean won) | ||||||||
| Beginning | ₩ | 151,696 | ₩ | 152,186 | ||||
| Provision | 11,350 | 17,270 | ||||||
| Reversal | (2,075 | ) | 210 | |||||
| Used | (15,739 | ) | (23,916 | ) | ||||
| Unwinding of discount | 1,589 | 2,725 | ||||||
| Effect of changes in discount rate | 5,365 | 10,558 | ||||||
| Ending | ₩ | 152,186 | ₩ | 159,033 | ||||
2021 | ||||||||||||||||||||
Membership rewards program | Dormant accounts | Litigations | Others | Total | ||||||||||||||||
(In millions of Korean won) | ||||||||||||||||||||
| Beginning | ₩ | 19,501 | ₩ | 3,007 | ₩ | 40,517 | ₩ | 132,827 | ₩ | 195,852 | ||||||||||
| Increase | 77,384 | 3,429 | 18,670 | 71,972 | 171,455 | |||||||||||||||
| Decrease | (73,983 | ) | (3,374 | ) | (4,190 | ) | (64,614 | ) | (146,161 | ) | ||||||||||
| Others | — | — | 171 | 6 | 177 | |||||||||||||||
| Ending | ₩ | 22,902 | ₩ | 3,062 | ₩ | 55,168 | ₩ | 140,191 | ₩ | 221,323 | ||||||||||
2022 | ||||||||||||||||||||
Membership rewards program | Dormant accounts | Litigations | Others | Total | ||||||||||||||||
(In millions of Korean won) | ||||||||||||||||||||
| Beginning | ₩ | 22,902 | ₩ | 3,062 | ₩ | 55,168 | ₩ | 140,191 | ₩ | 221,323 | ||||||||||
| Increase | 84 | 2,666 | 62,611 | 89,179 | 154,540 | |||||||||||||||
| Decrease | (22,940 | ) | (2,934 | ) | (4,252 | ) | (34,617 | ) | (64,743 | ) | ||||||||||
| Ending | ₩ | 46 | ₩ | 2,794 | ₩ | 113,527 | ₩ | 194,753 | ₩ | 311,120 | ||||||||||
| • | The Group has the obligation to pay the agreed benefits to all its current and former employees. |
| • | The Group assumes actuarial risk (that benefits will cost more than expected) and investment risk. |
2021 | ||||||||||||
Present value of defined benefit obligation | Fair value of plan assets | Net defined benefit liabilities(assets) | ||||||||||
(In millions of Korean won) | ||||||||||||
| Beginning | ₩ | 2,491,923 | ₩ | (2,302,953 | ) | ₩ | 188,970 | |||||
| Current service cost | 241,448 | — | 241,448 | |||||||||
| Past service cost | 451 | — | 451 | |||||||||
| Gains on settlement | (4,311 | ) | — | (4,311 | ) | |||||||
| Interest expense (income) | 47,481 | (44,560 | ) | 2,921 | ||||||||
| Remeasurements: | ||||||||||||
| Actuarial gains and losses by changes in demographic assumptions | 27,611 | — | 27,611 | |||||||||
| Actuarial gains and losses by changes in financial assumptions | 52,684 | — | 52,684 | |||||||||
| Actuarial gains and losses by experience adjustments | (24,592 | ) | — | (24,592 | ) | |||||||
| Return on plan assets (excluding amounts included in interest income) | — | 9,438 | 9,438 | |||||||||
| Contributions by the Group | — | (319,601 | ) | (319,601 | ) | |||||||
| Contributions by the employees | — | (17,574 | ) | (17,574 | ) | |||||||
| Payments from plans (settlement) | (6,961 | ) | 6,944 | (17 | ) | |||||||
| Payments from plans (benefit payments) | (221,276 | ) | 221,274 | (2 | ) | |||||||
| Payments from the Group | (34,242 | ) | — | (34,242 | ) | |||||||
| Transfer in | 9,854 | (9,292 | ) | 562 | ||||||||
| Transfer out | (9,292 | ) | 9,292 | — | ||||||||
| Effect of exchange differences | 1,670 | (47 | ) | 1,623 | ||||||||
| Effect of business acquisition and disposal | 21 | — | 21 | |||||||||
| Others | 48 | — | 48 | |||||||||
| Ending* | ₩ | 2,572,517 | ₩ | (2,447,079 | ) | ₩ | 125,438 | |||||
2022 | ||||||||||||
Present value of defined benefit obligation | Fair value of plan assets | Net defined benefit liabilities(assets) | ||||||||||
(In millions of Korean won) | ||||||||||||
| Beginning | ₩ | 2,572,517 | ₩ | (2,447,079 | ) | ₩ | 125,438 | |||||
| Current service cost | 249,099 | — | 249,099 | |||||||||
| Past service cost | 3,669 | — | 3,669 | |||||||||
| Gains on settlement | (1,859 | ) | — | (1,859 | ) | |||||||
| Interest expense (income) | 65,357 | (62,872 | ) | 2,485 | ||||||||
| Remeasurements: | ||||||||||||
| Actuarial gains and losses by changes in demographic assumptions | 33,078 | — | 33,078 | |||||||||
| Actuarial gains and losses by changes in financial assumptions | (479,797 | ) | — | (479,797 | ) | |||||||
| Actuarial gains and losses by experience adjustments | 47,086 | — | 47,086 | |||||||||
| Return on plan assets (excluding amounts included in interest income) | — | 68,550 | 68,550 | |||||||||
| Contributions by the Group | — | (400,689 | ) | (400,689 | ) | |||||||
| Contributions by the employees | — | — | — | |||||||||
| Payments from plans (settlement) | (78 | ) | — | (78 | ) | |||||||
| Payments from plans (benefit payments) | (234,192 | ) | 232,994 | (1,198 | ) | |||||||
| Payments from the Group | (43,763 | ) | 494 | (43,269 | ) | |||||||
| Transfer in | 13,982 | (13,285 | ) | 697 | ||||||||
| Transfer out | (13,340 | ) | 13,299 | (41 | ) | |||||||
| Effect of exchange differences | 1,218 | 69 | 1,287 | |||||||||
| Effect of business acquisition and disposal | 2,635 | — | 2,635 | |||||||||
| Others | (282 | ) | — | (282 | ) | |||||||
| Ending* | ₩ | 2,215,330 | ₩ | (2,608,519 | ) | ₩ | (393,189 | ) | ||||
| * | The net defined benefit liabilities of ₩ 125,438 million is calculated by subtracting ₩ 100,083 million of net defined benefit assets from ₩ 225,521 million of net defined benefit liabilities as of December 31, 2021. The net defined benefit assets of ₩ 393,189 million is calculated by subtracting ₩ 85,745 million of net defined benefit liabilities from ₩ 478,934 million of net defined benefit assets as of December 31, 2022. |
December 31, 2021 | December 31, 2022 | |||||||
(In millions of Korean won) | ||||||||
| Present value of defined benefit obligation | ₩ | 2,572,517 | ₩ | 2,215,330 | ||||
| Fair value of plan assets | (2,447,079 | ) | (2,608,519 | ) | ||||
| Net defined benefit liabilities | ₩ | 125,438 | ₩ | (393,189 | ) | |||
2020 | 2021 | 2022 | ||||||||||
(In millions of Korean won) | ||||||||||||
Current service cost | ₩ | 233,273 | ₩ | 241,448 | ₩ | 249,099 | ||||||
Past service cost | (16,197 | ) | 451 | 3,669 | ||||||||
Net interest expense on net defined benefit liabilities | 4,743 | 2,921 | 2,485 | |||||||||
Gains on settlement | (1,912 | ) | (4,311 | ) | (1,859 | ) | ||||||
Post-employment benefits * | ₩ | 219,907 | ₩ | 240,509 | ₩ | 253,394 | ||||||
| * | Includes post-employment benefits amounting to ₩ 2,840 million, ₩ 3,194 million and ₩ 3,383 million recognized as other operating expenses for the years ended December 31, 2020, 2021, 2022 and ₩ 176 million and ₩ 137 million recognized as prepayment for the years ended December 31, 2020 and 2022. |
2020 | 2021 | 2022 | ||||||||||
(In millions of Korean won) | ||||||||||||
Remeasurements: | ||||||||||||
Return on plan assets (excluding amounts included in interest income) | ₩ | (6,308 | ) | ₩ | (9,438 | ) | ₩ | (68,550 | ) | |||
Actuarial gains and losses | (11,676 | ) | (55,703 | ) | 399,633 | |||||||
Income tax effect | 4,949 | 18,638 | (91,150 | ) | ||||||||
Effect of exchange differences | (399 | ) | 993 | (231 | ) | |||||||
Remeasurements after income tax expense | ₩ | (13,434 | ) | ₩ | (45,510 | ) | ₩ | 239,702 | ||||
December 31, 2021 | ||||||||||||
Assets quoted in an active market | Assets not quoted in an active market | Total | ||||||||||
(In millions of Korean won) | ||||||||||||
Cash and due from financial institutions | ₩ | — | ₩ | 2,441,324 | ₩ | 2,441,324 | ||||||
Derivative instruments | — | 3,427 | 3,427 | |||||||||
Investment fund | — | 2,328 | 2,328 | |||||||||
| ₩ | — | ₩ | 2,447,079 | ₩ | 2,447,079 | |||||||
December 31, 2022 | ||||||||||||
Assets quoted in an active market | Assets not quoted in an active market | Total | ||||||||||
(In millions of Korean won) | ||||||||||||
Cash and due from financial institutions | ₩ | — | ₩ | 2,571,508 | ₩ | 2,571,508 | ||||||
Derivative instruments | — | 33,434 | 33,434 | |||||||||
Investment fund | — | 3,577 | 3,577 | |||||||||
| ₩ | — | ₩ | 2,608,519 | ₩ | 2,608,519 | |||||||
December 31, 2021 | December 31, 2022 | |||||||
Discount rate (%) | 1.80~2.70 | 4.90~5.20 | ||||||
Salary increase rate (%) | 0.00~7.50 | 0.00~7.00 | ||||||
Turnover rate (%) | 0.00~50.00 | 0.00~38.60 | ||||||
Changes in assumptions | Effect on defined benefit obligation | |||||||||||
Increase in assumptions | Decrease in assumptions | |||||||||||
Discount rate | 0.5 | %p | 3.12% decrease | 3.31% increase | ||||||||
Salary increase rate | 0 .5 | %p | 3.27% increase | 3.10% decrease | ||||||||
Turnover rate | 0.5 | %p | 0.14% increase | 0.15% decrease | ||||||||
Up to 1 year | 1~2 years | 2~5 years | 5~10 years | Over 10 years | Total | |||||||||||||||||||
(In millions of Korean won) | ||||||||||||||||||||||||
Pension benefits * | ₩211,591 | ₩279,808 | ₩849,878 | ₩1,557,212 | ₩7,553,530 | ₩10,452,019 | ||||||||||||||||||
| * | Amount determined under the promotion compensation type defined contribution plan is excluded. |
December 31, 2021 | December 31, 2022 | |||||||
(In millions of Korean won) | ||||||||
Other financial liabilities | ||||||||
Other payables | ₩ | 11,175,682 | ₩ | 11,730,583 | ||||
Prepaid card and debit card payables | 33,972 | 35,259 | ||||||
Accrued expenses | 2,620,819 | 3,950,605 | ||||||
Financial guarantee contracts liabilities | 52,603 | 46,467 | ||||||
Deposits for letter of guarantees and others | 1,093,680 | 1,762,482 | ||||||
Domestic exchange settlement credits | 5,125,430 | 1,738,489 | ||||||
Foreign exchange settlement credits | 169,264 | 250,138 | ||||||
Due to trust accounts | 7,033,849 | 5,808,446 | ||||||
Liabilities incurred from agency relationships | 739,276 | 513,621 | ||||||
Account for agency business | 423,798 | 241,910 | ||||||
Dividend payables | 474 | 3,425 | ||||||
Lease liabilities | 578,808 | 592,697 | ||||||
Others | 446,747 | 31,124 | ||||||
| 29,494,402 | 26,705,246 | |||||||
Other non-financial liabilities | ||||||||
Other payables | 348,003 | 400,407 | ||||||
Unearned revenue | 656,375 | 759,308 | ||||||
Accrued expenses | 956,461 | 900,141 | ||||||
Deferred revenue on credit card points | 214,053 | 243,131 | ||||||
Withholding taxes | 164,333 | 228,119 | ||||||
Separate account liabilities | 11,071,159 | 10,513,553 | ||||||
Others | 225,696 | 390,460 | ||||||
| 13,636,080 | 13,435,119 | |||||||
| ₩ | 43,130,482 | ₩ | 40,140,365 | |||||
December 31, 2021 | December 31, 2022 | |||||||
Type of share | Ordinary share | Ordinary share | ||||||
(In millions of Korean won and in number of shares) | ||||||||
Number of authorized shares | 1,000,000,000 | 1,000,000,000 | ||||||
Par value per share (In Korean won) | ₩ | 5,000 | ₩ | 5,000 | ||||
Number of issued shares | 415,807,920 | 408,897,068 | ||||||
Share capital * | ₩ | 2,090,558 | ₩ | 2,090,558 | ||||
| * | Due to the retirement of shares deducted through retained earnings, it is different from the total par value of the shares issued. |
2021 | 2022 | |||||||
(In number of shares) | ||||||||
Beginning | 389,634,335 | 389,634,335 | ||||||
Increase | — | — | ||||||
Decrease | — | — | ||||||
Ending | 389,634,335 | 389,634,335 | ||||||
Hybrid securities | Issuance date | Maturity | Interest rate (%) as of December 31, 2022 | December 31, 2021 | December 31, 2022 | |||||||||||||||
(In millions of Korean won) | ||||||||||||||||||||
The 1-1 st | May 2, 2019 | Perpetual bond | 3.23 | ₩ | 349,309 | ₩ | 349,309 | |||||||||||||
The 1-2 nd | May 2, 2019 | Perpetual bond | 3.44 | 49,896 | 49,896 | |||||||||||||||
The 2-1 st | May 8, 2020 | Perpetual bond | 3.30 | 324,099 | 324,099 | |||||||||||||||
The 2-2 nd | May 8, 2020 | Perpetual bond | 3.43 | 74,812 | 74,812 | |||||||||||||||
The 3-1 st | Jul. 14, 2020 | Perpetual bond | 3.17 | 369,099 | 369,099 | |||||||||||||||
The 3-2 nd | Jul. 14, 2020 | Perpetual bond | 3.38 | 29,922 | 29,922 | |||||||||||||||
The 4-1 st | Oct. 20, 2020 | Perpetual bond | 3.00 | 433,996 | 433,996 | |||||||||||||||
The 4-2 nd | Oct. 20, 2020 | Perpetual bond | 3.28 | 64,855 | 64,855 | |||||||||||||||
The 5-1 st | Feb. 19, 2021 | Perpetual bond | 2.67 | 419,071 | 419,071 | |||||||||||||||
The 5-2 nd | Feb. 19, 2021 | Perpetual bond | 2.87 | 59,862 | 59,862 | |||||||||||||||
The 5-3 rd | Feb. 19, 2021 | Perpetual bond | 3.28 | 119,727 | 119,727 | |||||||||||||||
The 6-1 st | May 28, 2021 | Perpetual bond | 3.20 | 165,563 | 165,563 | |||||||||||||||
The 6-2 nd | May 28, 2021 | Perpetual bond | 3.60 | 109,708 | 109,708 | |||||||||||||||
The 7-1 st | Oct. 8, 2021 | Perpetual bond | 3.57 | 208,468 | 208,468 | |||||||||||||||
The 7-2 nd | Oct. 8, 2021 | Perpetual bond | 3.80 | 59,834 | 59,834 | |||||||||||||||
The 8-1 st | Feb. 16, 2022 | Perpetual bond | 4.00 | — | 442,970 | |||||||||||||||
The 8-2 nd | Feb. 16, 2022 | Perpetual bond | 4.30 | — | 155,626 | |||||||||||||||
The 9-1 st | May 12, 2022 | Perpetual bond | 4.68 | — | 478,829 | |||||||||||||||
The 9-2 nd | May 12, 2022 | Perpetual bond | 4.97 | — | 19,906 | |||||||||||||||
The 10-1 st | Aug. 26, 2022 | Perpetual bond | 4.90 | — | 407,936 | |||||||||||||||
The 10-2 nd | Aug. 26, 2022 | Perpetual bond | 5.15 | — | 70,819 | |||||||||||||||
The 10-3 rd | Aug. 26, 2022 | Perpetual bond | 5.30 | — | 19,944 | |||||||||||||||
| ₩ | 2,838,221 | ₩ | 4,434,251 | |||||||||||||||||
December 31, 2021 | December 31, 2022 | |||||||
(In millions of Korean won) | ||||||||
Paid-in capital in excess of par value | ₩ | 13,190,274 | ₩ | 13,190,274 | ||||
| Losses on sales of treasury shares | (481,332 | ) | (481,332 | ) | ||||
| Other capital surplus | 4,219,356 | 4,219,856 | ||||||
| Consideration for exchange right of exchangeable bonds | 11,933 | 11,933 | ||||||
| ₩ | 16,940,231 | ₩ | 16,940,731 | |||||
December 31, 2021 | December 31, 2022 | |||||||
(In millions of Korean won) | ||||||||
| Remeasurements of net defined benefit liabilities | ₩ | (328,392 | ) | ₩ | (88,768 | ) | ||
| Currency translation differences | 96,534 | 253,815 | ||||||
| Gains(losses) on financial instruments at fair value through other comprehensive income | 918,927 | (2,629,451 | ) | |||||
| Share of other comprehensive loss of associates and joint ventures | (2,980 | ) | (3,342 | ) | ||||
| Gains(Losses) on cash flow hedging instruments | (7,733 | ) | 23,741 | |||||
| Losses on hedging instruments of net investments in foreign operations | (35,658 | ) | (114,743 | ) | ||||
| Other comprehensive loss arising from separate account | (55,116 | ) | (214,735 | ) | ||||
| Fair value changes of financial liabilities designated at fair value through profit or loss due to own credit risk | 2,208 | 41,075 | ||||||
| Gains on overlay adjustment | 459,484 | 19,355 | ||||||
| Assets of a disposal group held for sale | 7,671 | — | ||||||
| ₩ | 1,054,945 | ₩ | (2,713,053 | ) | ||||
December 31, 2021 | December 31, 2022 | |||||||
(In millions of Korean won) | ||||||||
Legal reserves 1 | ₩ | 695,347 | ₩ | 839,235 | ||||
| Voluntary reserves | 982,000 | 982,000 | ||||||
Unappropriated retained earnings 2 | 23,995,468 | 26,625,278 | ||||||
| ₩ | 25,672,815 | ₩ | 28,446,513 | |||||
| 1 | With respect to the allocation of net profit earned in a fiscal term, the Parent Company must set aside in its legal reserve an amount equal to at least 10% of its profit after tax as reported in the financial statements, each time it pays dividends on its net profits earned until its legal reserve reaches the aggregate amount of its paid-in capital in accordance with Article 53 of the Financial Holding Company Act. This reserve is not available for the payment of cash dividends, but may be transferred to share capital, or used to reduce accumulated deficit. |
| 2 | The regulatory reserve for credit losses the Group appropriated in retained earnings is ₩ 4,116,579 million and ₩ 4,355,734 million for the years ended December 31, 2021 and 2022, respectively. |
2021 | ||||||||||||||||
Beginning | Acquisition | Disposal | Ending | |||||||||||||
(In millions of Korean won and in number of shares) | ||||||||||||||||
| Number of treasury shares* | 26,173,585 | — | — | 26,173,585 | ||||||||||||
| Carrying amount | ₩ | 1,136,188 | ₩ | — | ₩ | — | ₩ | 1,136,188 | ||||||||
2022 | ||||||||||||||||
Beginning | Acquisition | Disposal | Ending | |||||||||||||
(In millions of Korean won and in number of shares) | ||||||||||||||||
| Number of treasury shares* | 26,173,585 | — | (6,910,852 | ) | 19,262,733 | |||||||||||
| Carrying amount | ₩ | 1,136,188 | ₩ | — | ₩ | (300,000 | ) | ₩ | 836,188 | |||||||
| * | 5 million treasury shares are deposited at the Korea Securities Depository for the exchange of exchangeable bonds. |
2020 | 2021 | 2022 | ||||||||||
(In millions of Korean won) | ||||||||||||
Interest income | ||||||||||||
| Due from financial institutions measured at fair value through profit or loss | ₩ | 649 | ₩ | 1,723 | ₩ | 3,186 | ||||||
| Securities measured at fair value through profit or loss | 647,840 | 579,128 | 860,271 | |||||||||
| Loans measured at fair value through profit or loss | 10,876 | 9,537 | 12,933 | |||||||||
| Securities measured at fair value through other comprehensive income | 719,434 | 784,980 | 1,079,548 | |||||||||
| Loans measured at fair value through other comprehensive income | 7,899 | 4,618 | 10,612 | |||||||||
| Due from financial institutions measured at amortized cost | 92,155 | 66,375 | 157,913 | |||||||||
| Securities measured at amortized cost | 627,201 | 765,656 | 1,120,608 | |||||||||
| Loans measured at amortized cost | 12,177,822 | 12,745,780 | 17,191,116 | |||||||||
| Others | 201,871 | 253,081 | 352,331 | |||||||||
| 14,485,747 | 15,210,878 | 20,788,518 | ||||||||||
Interest expense | ||||||||||||
| Deposits | 2,916,794 | 2,218,556 | 4,536,373 | |||||||||
| Borrowings | 572,946 | 510,385 | 1,291,380 | |||||||||
| Debentures | 1,186,310 | 1,169,708 | 1,640,773 | |||||||||
| Others | 87,423 | 82,657 | 207,058 | |||||||||
| 4,763,473 | 3,981,306 | 7,675,584 | ||||||||||
Net interest income | ₩ | 9,722,274 | ₩ | 11,229,572 | ₩ | 13,112,934 | ||||||
2020 | 2021 | 2022 | ||||||||||
(In millions of Korean won) | ||||||||||||
Fee and commission income | ||||||||||||
| Banking activity fees | ₩ | 189,100 | ₩ | 178,412 | ₩ | 180,749 | ||||||
| Lending activity fees | 91,663 | 82,184 | 80,700 | |||||||||
| Credit card and debit card related fees | 1,378,450 | 1,526,911 | 1,491,666 | |||||||||
| Agent activity fees | 196,518 | 205,206 | 243,740 | |||||||||
| Trust and other fiduciary fees | 331,827 | 408,834 | 337,171 | |||||||||
| Fund management related fees | 154,612 | 178,090 | 130,629 | |||||||||
| Acceptances and guarantees fees | 54,108 | 49,782 | 66,827 | |||||||||
| Foreign currency related fees | 173,313 | 245,299 | 285,380 | |||||||||
| Securities agency fees | 172,097 | 174,709 | 124,771 | |||||||||
| Other business account commission on consignment | 40,461 | 39,178 | 36,211 | |||||||||
| Commissions received on securities business | 793,278 | 881,407 | 628,449 | |||||||||
| Lease fees | 636,301 | 897,983 | 1,004,670 | |||||||||
| Others | 315,296 | 455,611 | 510,557 | |||||||||
| 4,527,024 | 5,323,606 | 5,121,520 | ||||||||||
Fee and commission expense | ||||||||||||
| Trading activity related fees * | 38,497 | 54,857 | 44,200 | |||||||||
| Lending activity fees | 33,444 | 42,981 | 42,086 | |||||||||
| Credit card and debit card related fees | 848,823 | 831,724 | 815,252 | |||||||||
| Outsourcing related fees | 216,962 | 210,480 | 255,899 | |||||||||
| Foreign currency related fees | 49,435 | 51,931 | 75,078 | |||||||||
| Others | 380,924 | 506,050 | 567,373 | |||||||||
| 1,568,085 | 1,698,023 | 1,799,888 | ||||||||||
Net fee and commission income | ₩ | 2,958,939 | ₩ | 3,625,583 | ₩ | 3,321,632 | ||||||
| * | Fees from financial instruments at fair value through profit or loss |
2020 | 2021 | 2022 | ||||||||||
(In millions of Korean won) | ||||||||||||
Gains on financial instruments at fair value through profit or loss | ||||||||||||
| Financial assets at fair value through profit or loss: | ||||||||||||
| Debt securities | ₩ | 2,061,505 | ₩ | 1,804,112 | ₩ | 2,045,436 | ||||||
| Equity securities | 725,072 | 733,823 | 494,723 | |||||||||
| 2,786,577 | 2,537,935 | 2,540,159 | ||||||||||
| Derivatives held for trading: | ||||||||||||
| Interest rate | 2,632,246 | 4,820,712 | 11,772,927 | |||||||||
| Currency | 8,335,594 | 7,492,806 | 15,020,553 | |||||||||
| Stock or stock index | 2,808,284 | 1,603,501 | 1,983,900 | |||||||||
| Credit | 28,434 | 20,147 | 78,638 | |||||||||
| Commodity | 18,097 | 21,864 | 33,576 | |||||||||
| Others | 231,901 | 145,879 | 101,097 | |||||||||
| 14,054,556 | 14,104,909 | 28,990,691 | ||||||||||
| Financial liabilities at fair value through profit or loss | 28,160 | 72,585 | 114,525 | |||||||||
| Other financial instruments | 689 | 6,753 | 252 | |||||||||
| 16,869,982 | 16,722,182 | 31,645,627 | ||||||||||
Losses on financial instruments at fair value through profit or loss | ||||||||||||
| Financial assets at fair value through profit or loss: | ||||||||||||
| Debt securities | 1,040,285 | 1,280,960 | 2,733,891 | |||||||||
| Equity securities | 444,554 | 426,431 | 546,036 | |||||||||
| 1,484,839 | 1,707,391 | 3,279,927 | ||||||||||
| Derivatives held for trading: | ||||||||||||
| Interest rate | 2,687,114 | 4,669,893 | 10,747,221 | |||||||||
| Currency | 8,191,456 | 7,422,604 | 15,160,772 | |||||||||
| Stock or stock index | 2,558,205 | 1,604,027 | 2,482,044 | |||||||||
| Credit | 19,213 | 14,051 | 68,324 | |||||||||
| Commodity | 21,797 | 14,815 | 30,167 | |||||||||
| Others | 253,406 | 175,411 | 323,704 | |||||||||
| 13,731,191 | 13,900,801 | 28,812,232 | ||||||||||
| Financial liabilities at fair value through profit or loss | 153,227 | 80,790 | 63,571 | |||||||||
| Other financial instruments | 116 | 6,839 | 205 | |||||||||
| 15,369,373 | 15,695,821 | 32,155,935 | ||||||||||
Net gains(loss) on financial instruments at fair value through profit or loss | ₩ | 1,500,609 | ₩ | 1,026,361 | ₩ | (510,308 | ) | |||||
2020 | 2021 | 2022 | ||||||||||
(In millions of Korean won) | ||||||||||||
Gains on financial instruments designated at fair value through profit or loss | ||||||||||||
| Financial liabilities designated at fair value through profit or loss | ₩ | 654,045 | ₩ | 623,929 | ₩ | 1,186,908 | ||||||
| 654,045 | 623,929 | 1,186,908 | ||||||||||
Losses on financial instruments designated at fair value through profit or loss | ||||||||||||
| Financial liabilities designated at fair value through profit or loss | 1,143,288 | 654,986 | 429,243 | |||||||||
| 1,143,288 | 654,986 | 429,243 | ||||||||||
| Net gains(losses) on financial instruments designated at fair value through profit or loss | ₩ | (489,243 | ) | ₩ | (31,057 | ) | ₩ | 757,665 | ||||
2020 | 2021 | 2022 | ||||||||||
(In millions of Korean won) | ||||||||||||
Other operating income | ||||||||||||
| Gains on financial instruments at fair value through other comprehensive income: | ||||||||||||
| Gains on redemption of financial instruments at fair value through other comprehensive income | ₩ | 351 | ₩ | 2 | ₩ | 24 | ||||||
| Gains on disposal of financial instruments at fair value through other comprehensive income | 304,217 | 126,710 | 24,735 | |||||||||
| 304,568 | 126,712 | 24,759 | ||||||||||
| Gains on financial assets at amortized cost: | ||||||||||||
| Gains on sale of loans measured at amortized cost | 180,038 | 136,620 | 83,552 | |||||||||
| Gains on redemption of securities measured at amortized cost | — | 126 | — | |||||||||
| Gains on disposal of securities measured at amortized cost | 229 | 41 | 110 | |||||||||
| 180,267 | 136,787 | 83,662 | ||||||||||
| Gains on loans measured at fair value through other comprehensive income: | ||||||||||||
| Gains on sale of loans measured at fair value through other comprehensive income | — | 226 | — | |||||||||
| — | 226 | — | ||||||||||
| Gains on hedge accounting | — | 386,398 | 858,305 | |||||||||
| Gains on foreign exchange transactions | 3,634,987 | 3,878,089 | 11,514,706 | |||||||||
| Dividend income | 45,125 | 33,805 | 36,675 | |||||||||
| Others | 591,798 | 367,177 | 498,412 | |||||||||
| 4,756,745 | 4,929,194 | 13,016,519 | ||||||||||
Other operating expenses | ||||||||||||
| Losses on financial instruments at fair value through other comprehensive income: | ||||||||||||
| Losses on redemption of financial instruments at fair value through other comprehensive income | 320 | 2,172 | 3,049 | |||||||||
| Losses on disposal of financial instruments at fair value through other comprehensive income | 19,159 | 222,512 | 258,505 | |||||||||
| 19,479 | 224,684 | 261,554 | ||||||||||
| Losses on financial assets at amortized cost: | ||||||||||||
| Losses on sale of loans measured at amortized cost | 16,061 | 14,669 | 78,089 | |||||||||
| Losses on redemption of securities measured at amortized cost | — | 6 | — | |||||||||
| Losses on disposal of securities measured at amortized cost | 6,513 | 2 | — | |||||||||
| 22,574 | 14,677 | 78,089 | ||||||||||
| Losses on hedge accounting | — | 473,091 | 877,512 | |||||||||
| Losses on foreign exchange transactions | 3,530,618 | 3,570,783 | 11,173,168 | |||||||||
| Deposit insurance fee | 507,621 | 550,677 | 598,548 | |||||||||
| Credit guarantee fund fee | 242,216 | 263,297 | 283,912 | |||||||||
| Depreciation expenses of operating lease assets | 423,684 | 602,908 | 682,783 | |||||||||
| Others | 1,510,483 | 1,152,644 | 1,426,744 | |||||||||
| 6,256,675 | 6,852,761 | 15,382,310 | ||||||||||
Net other operating expenses | ₩ | (1,499,930 | ) | ₩ | (1,923,567 | ) | ₩ | (2,365,791 | ) | |||
2020 | 2021 | 2022 | ||||||||||
(In millions of Korean won) | ||||||||||||
Expenses related to employee | ||||||||||||
Employee benefits—salaries | ₩ | 2,789,201 | ₩ | 3,007,439 | ₩ | 3,070,840 | ||||||
Employee benefits—others | 871,014 | 927,665 | 988,778 | |||||||||
Post-employment benefits—defined benefit plans | 216,891 | 237,315 | 249,874 | |||||||||
Post-employment benefits—defined contribution plans | 37,328 | 37,731 | 45,655 | |||||||||
Termination benefits | 361,098 | 322,970 | 319,794 | |||||||||
Share-based payments | 49,364 | 101,935 | 58,275 | |||||||||
| 4,324,896 | 4,635,055 | 4,733,216 | ||||||||||
Depreciation and amortization | 874,911 | 850,614 | 878,841 | |||||||||
Other general and administrative expenses | ||||||||||||
Rental expense | 116,325 | 112,902 | 121,577 | |||||||||
Tax and dues | 260,071 | 268,383 | 310,853 | |||||||||
Communication | 53,596 | 60,221 | 63,871 | |||||||||
Electricity and utilities | 32,298 | 36,565 | 35,987 | |||||||||
Publication | 13,988 | 13,417 | 11,991 | |||||||||
Repairs and maintenance | 32,448 | 53,218 | 56,221 | |||||||||
Vehicle | 14,314 | 16,901 | 19,815 | |||||||||
Travel | 12,251 | 13,271 | 23,585 | |||||||||
Training | 27,610 | 34,056 | 36,890 | |||||||||
Service fees | 238,787 | 260,298 | 264,854 | |||||||||
Electronic data processing expenses | 280,773 | 314,511 | 397,315 | |||||||||
Advertising | 236,618 | 210,187 | 227,991 | |||||||||
Others | 295,926 | 321,254 | 354,795 | |||||||||
| 1,615,005 | 1,715,184 | 1,925,745 | ||||||||||
| ₩ | 6,814,812 | ₩ | 7,200,853 | ₩ | 7,537,802 | |||||||
Grant date | Number of granted shares 1 | Vesting conditions 2 | ||||||
(In number of shares) | ||||||||
KB Financial Group Inc. | ||||||||
Series 27 | Jun. 16, 2020 | 184 | Services fulfillment, market performance 3 30%, andnon-market performance4 70% | |||||
Series 28 | Nov. 21, 2020 | 68,135 | Services fulfillment, market performance 3 35%, andnon-market performance5 65% | |||||
Series 29 | Jan. 1, 2021 | 79,840 | Services fulfillment, market performance 3 0~30%, andnon-market performance4 70~100% | |||||
Series 30 | Apr. 1, 2021 | 3,069 | Services fulfillment, market performance 3 30%, andnon-market performance4 70% | |||||
Series 33 | Jan. 1, 2022 | 62,991 | Services fulfillment, market performance 3 0~30%, andnon-market performance4 70~100% | |||||
Series 34 | Feb. 1, 2022 | 654 | Services fulfillment, market performance 3 30%, andnon-market performance4 70% | |||||
Series 35 | May. 27, 2022 | 6,126 | Services fulfillment, market performance 3 30%, andnon-market performance4 70% | |||||
Deferred grant in 2015 | 4,243 | Satisfied | ||||||
Deferred grant in 2016 | 3,533 | Satisfied | ||||||
Deferred grant in 2017 | 1,127 | Satisfied | ||||||
Deferred grant in 2018 | 1,766 | Satisfied | ||||||
Deferred grant in 2019 | 7,598 | Satisfied | ||||||
Deferred grant in 2020 | 27,956 | Satisfied | ||||||
Deferred grant in 2021 | 27,204 | Satisfied | ||||||
| 294,426 | ||||||||
Kookmin Bank | ||||||||
Series 80 | Mar. 1, 2020 | 7,982 | Services fulfillment, market performance 3 30~50%, andnon-market performance4 50~70% | |||||
Series 81 | Jan. 1, 2021 | 139,783 | Services fulfillment, market performance 3 0~30%, andnon-market performance4 70~100% | |||||
Series 83 | Apr. 1, 2021 | 15,278 | Services fulfillment, market performance 3 0~30%, andnon-market performance4 70~100% | |||||
Series 85 | Jan. 1, 2022 | 292,777 | Services fulfillment, market performance 3 0~30%, andnon-market performance4 70~100% | |||||
| Services fulfillment, market performance 3 30%, and EPS & Asset Quality6 70% | ||||||||
Series 86 | Feb. 1, 2022 | 1,525 | Services fulfillment, market performance 3 0~30%, andnon-market performance4 70~100% | |||||
Series 87 | Mar. 1, 2022 | 2,599 | Services fulfillment, market performance 3 0~30%, andnon-market performance4 70~100% | |||||
Grant date | Number of granted shares 1 | Vesting conditions 2 | ||||||
(In number of shares) | ||||||||
Series 88 | Mar. 14, 2022 | 5,884 | Services fulfillment, market performance 3 0~30%, andnon-market performance4 70~100% | |||||
Series 89 | May 26, 2022 | 2,363 | Services fulfillment, market performance 3 0~30%, andnon-market performance4 70~100% | |||||
Series 90 | Jul. 18, 2022 | 4,131 | Services fulfillment, market performance 3 0~30%, andnon-market performance4 70~100% | |||||
Series 91 | Aug. 24, 2022 | 7,277 | Services fulfillment, market performance 3 0~30%, andnon-market performance4 70~100% | |||||
Deferred grant in 2016 | 2,426 | Satisfied | ||||||
Deferred grant in 2017 | 4,582 | Satisfied | ||||||
Deferred grant in 2018 | 2,287 | Satisfied | ||||||
Deferred grant in 2019 | 32,756 | Satisfied | ||||||
Deferred grant in 2020 | 53,502 | Satisfied | ||||||
Deferred grant in 2021 | 156,939 | Satisfied | ||||||
| 732,091 | ||||||||
Other subsidiaries | ||||||||
Stock granted in 2010 | 106 | Services fulfillment, market performance 3 0~50%, andnon-market performance4 50~100% | ||||||
Stock granted in 2011 | 146 | |||||||
Stock granted in 2012 | 420 | |||||||
Stock granted in 2013 | 544 | |||||||
Stock granted in 2014 | 1,028 | |||||||
Stock granted in 2015 | 2,374 | |||||||
Stock granted in 2016 | 3,749 | |||||||
Stock granted in 2017 | 14,006 | |||||||
Stock granted in 2018 | 26,572 | |||||||
Stock granted in 2019 | 42,273 | |||||||
Stock granted in 2020 | 165,810 | |||||||
Stock granted in 2021 | 501,365 | |||||||
Stock granted in 2022 | 249,267 | |||||||
| 1,007,660 | ||||||||
| 2,034,177 | ||||||||
| 1 | Granted shares represent the total number of shares initially granted to executives and employees who have residual shares as of December 31, 2022 (Deferred grants are residual shares vested as of December 31, 2022). |
| 2 | Executives and employees were given the right of choice about the timing of the deferred payment (after the date of retirement), payment ratio, and payment period. Accordingly, a certain percentage of the granted shares is deferred for up to five years after the date of retirement after the deferred grant has been confirmed. |
| 3 | Relative TSR (Total Shareholder Return): [(Fair value at the end of the contract—Fair value at the beginning of the contract) + (Total amount of dividend per share paid during the contract period)] / Fair value at the beginning of the contract |
| 4 | Performance results of company and employee |
| 5 | EPS (Earnings Per Share), Asset Quality, HCROI (Human Capital Return on Investment), Profit from non-banking segments |
| 6 | EPS, Asset Quality |
Estimated number of vested shares * | Vesting conditions | |||||
(In number of shares) | ||||||
KB Financial Group Inc. | ||||||
Stock granted in 2015 | 3,725 | Satisfied | ||||
Stock granted in 2016 | 4,223 | Satisfied | ||||
Stock granted in 2017 | 1,401 | Satisfied | ||||
Stock granted in 2018 | 760 | Satisfied | ||||
Stock granted in 2019 | 9,354 | Satisfied | ||||
Stock granted in 2020 | 22,586 | Satisfied | ||||
Stock granted in 2021 | 35,497 | Satisfied | ||||
Stock granted in 2022 | 46,898 | Proportional to service period | ||||
Kookmin Bank | ||||||
Stock granted in 2015 | 1,292 | Satisfied | ||||
Stock granted in 2016 | 4,875 | Satisfied | ||||
Stock granted in 2017 | 1,998 | Satisfied | ||||
Stock granted in 2018 | 2,109 | Satisfied | ||||
Stock granted in 2019 | 41,737 | Satisfied | ||||
Stock granted in 2020 | 89,888 | Satisfied | ||||
Stock granted in 2021 | 130,331 | Satisfied | ||||
Stock granted in 2022 | 134,402 | Proportional to service period | ||||
Other subsidiaries | ||||||
Stock granted in 2015 | 5,762 | Satisfied | ||||
Stock granted in 2016 | 25,831 | Satisfied | ||||
Stock granted in 2017 | 46,223 | Satisfied | ||||
Stock granted in 2018 | 99,594 | Satisfied | ||||
Stock granted in 2019 | 243,130 | Satisfied | ||||
Stock granted in 2020 | 433,210 | Satisfied | ||||
Stock granted in 2021 | 610,167 | Satisfied | ||||
Stock granted in 2022 | 324,412 | Proportional to service period | ||||
| 2,319,405 | ||||||
| * | Executives and employees were given the right of choice about the timing of the deferred payment (after the date of retirement), payment ratio, and payment period. Accordingly, a certain percentage of the granted shares is deferred for up to five years after the date of retirement after the deferred grant has been confirmed. |
Risk-free rate (%) | Fair value (market performance condition) | Fair value (non-market performance condition) | ||||||||||
(In Korean won) | ||||||||||||
Linked to long-term performance | ||||||||||||
(KB Financial Group Inc.) | ||||||||||||
Series 27 | 3.78 | — | 43,157~46,663 | |||||||||
Series 28 | 3.78 | 35,289~39,662 | 41,704~46,873 | |||||||||
Series 29 | 3.78 | 40,757~48,322 | 43,157~50,973 | |||||||||
Series 30 | 3.78 | 38,805~43,583 | 41,548~46,663 | |||||||||
Series 33 | 3.78 | 37,409~45,666 | 41,548~50,973 | |||||||||
Series 34 | 3.78 | 35,486~39,839 | 39,958~44,859 | |||||||||
Series 35 | 3.78 | 38,247~42,939 | 39,958~44,859 | |||||||||
Deferred grant in 2015 | 3.78 | — | 43,157~50,973 | |||||||||
Deferred grant in 2016 | 3.78 | — | 46,663~50,973 | |||||||||
Deferred grant in 2017 | 3.78 | — | 50,973 | |||||||||
Deferred grant in 2018 | 3.78 | — | 46,663~50,973 | |||||||||
Deferred grant in 2019 | 3.78 | — | 50,973 | |||||||||
Deferred grant in 2020 | 3.78 | — | 43,157~50,973 | |||||||||
Deferred grant in 2021 | 3.78 | — | 44,859~50,973 | |||||||||
(Kookmin Bank) | ||||||||||||
Series 80 | 3.78 | 43,157~50,973 | 43,157~50,973 | |||||||||
Series 81 | 3.78 | 35,905~41,289 | 43,157~50,973 | |||||||||
Series 83 | 3.78 | 38,660~43,583 | 41,548~46,663 | |||||||||
Series 85 | 3.78 | 33,668~37,813 | 41,548~46,663 | |||||||||
Series 86 | 3.78 | 35,486~39,839 | 39,958~44,859 | |||||||||
Series 87 | 3.78 | 38,957~46,013 | 43,157~50,973 | |||||||||
Series 88 | 3.78 | 37,288~41,862 | 39,958~44,859 | |||||||||
Series 89 | 3.78 | 40,943~48,358 | 43,157~50,973 | |||||||||
Series 90 | 3.78 | 39,554~44,405 | 39,958~44,859 | |||||||||
Series 91 | 3.78 | 37,840~42,481 | 39,958~44,859 | |||||||||
Grant deferred in 2016 | 3.78 | — | 46,663~50,973 | |||||||||
Grant deferred in 2017 | 3.78 | — | 46,663~50,973 | |||||||||
Grant deferred in 2018 | 3.78 | — | 46,663~50,973 | |||||||||
Grant deferred in 2019 | 3.78 | — | 50,973 | |||||||||
Grant deferred in 2020 | 3.78 | — | 46,663~50,973 | |||||||||
Grant deferred in 2021 | 3.78 | — | 44,859~50,973 | |||||||||
(Other subsidiaries) | ||||||||||||
Stock granted in 2010 | 3.78 | — | 44,859 | |||||||||
Stock granted in 2011 | 3.78 | — | 44,859 | |||||||||
Stock granted in 2012 | 3.78 | — | 44,859~46,663 | |||||||||
Stock granted in 2013 | 3.78 | — | 44,859~46,663 | |||||||||
Stock granted in 2014 | 3.78 | — | 46,663 | |||||||||
Stock granted in 2015 | 3.78 | — | 41,548~50,973 | |||||||||
Stock granted in 2016 | 3.78 | — | 44,859~56,379 | |||||||||
Stock granted in 2017 | 3.78 | — | 41,548~61,294 | |||||||||
Stock granted in 2018 | 3.78 | — | 39,958~56,379 | |||||||||
Stock granted in 2019 | 3.78 | — | 38,393~56,379 | |||||||||
Risk-free rate (%) | Fair value (market performance condition) | Fair value (non-market performance condition) | ||||||||||
(In Korean won) | ||||||||||||
Linked to long-term performance | ||||||||||||
Stock granted in 2020 | 3.78 | 43,157~50,973 | 39,958~56,379 | |||||||||
Stock granted in 2021 | 3.78 | 39,042~50,651 | 41,548~56,379 | |||||||||
Stock granted in 2022 | 3.78 | 35,286~49,647 | 39,958~62,269 | |||||||||
Linked to short-term performance | ||||||||||||
(KB Financial Group Inc.) | ||||||||||||
Stock granted in 2015 | 3.78 | — | 43,157~50,973 | |||||||||
Stock granted in 2016 | 3.78 | — | 38,393~50,973 | |||||||||
Stock granted in 2017 | 3.78 | — | 46,663~50,973 | |||||||||
Stock granted in 2018 | 3.78 | — | 46,663~50,973 | |||||||||
Stock granted in 2019 | 3.78 | — | 50,973 | |||||||||
Stock granted in 2020 | 3.78 | — | 43,157~50,973 | |||||||||
Stock granted in 2021 | 3.78 | — | 44,859~50,973 | |||||||||
Stock granted in 2022 | 3.78 | — | 43,157~50,973 | |||||||||
(Kookmin Bank) | ||||||||||||
Stock granted in 2015 | 3.78 | — | 46,663~50,973 | |||||||||
Stock granted in 2016 | 3.78 | — | 44,859~50,973 | |||||||||
Stock granted in 2017 | 3.78 | — | 46,663~50,973 | |||||||||
Stock granted in 2018 | 3.78 | — | 0~56,379 | |||||||||
Stock granted in 2019 | 3.78 | — | 45,096~56,379 | |||||||||
Stock granted in 2020 | 3.78 | — | 46,663~56,379 | |||||||||
Stock granted in 2021 | 3.78 | — | 44,859~50,973 | |||||||||
Stock granted in 2022 | 3.78 | — | 39,958~46,663 | |||||||||
(Other subsidiaries) | ||||||||||||
Stock granted in 2015 | 3.78 | — | 41,548~50,973 | |||||||||
Stock granted in 2016 | 3.78 | — | 41,548~50,973 | |||||||||
Stock granted in 2017 | 3.78 | — | 39,958~50,973 | |||||||||
Stock granted in 2018 | 3.78 | — | 38,393~56,379 | |||||||||
Stock granted in 2019 | 3.78 | — | 38,393~56,379 | |||||||||
Stock granted in 2020 | 3.78 | — | 41,548~56,379 | |||||||||
Stock granted in 2021 | 3.78 | — | 41,548~50,973 | |||||||||
Stock granted in 2022 | 3.78 | — | 39,958~56,379 | |||||||||
Grant date | Number of granted shares 1 | Expected exercise period (years) 2 | Remaining shares | |||||||||
(In number of shares) | ||||||||||||
Stock granted in 2019 | Nov. 1, 2019 | 119 | 0.00 | 48 | ||||||||
| Nov. 8, 2019 | 14 | 0.00 | 6 | |||||||||
| Dec. 6, 2019 | 84 | 0.00 | 50 | |||||||||
| Dec. 5, 2019 | 56 | 0.00 | 41 | |||||||||
| Dec. 31, 2019 | 87 | 0.00 | 43 | |||||||||
Stock granted in 2020 | Jan. 18, 2020 | 28,645 | 0.00~0.05 | 15,541 | ||||||||
| May 12, 2020 | 46 | 0.00~0.36 | 43 | |||||||||
| Jun. 30, 2020 | 206 | 0.00~0.50 | 147 | |||||||||
| Aug. 26, 2020 | 40 | 0.00~0.65 | 27 | |||||||||
| Oct. 29, 2020 | 160 | 0.00~0.83 | 107 | |||||||||
| Nov. 6, 2020 | 45 | 0.00~0.85 | 37 | |||||||||
| Nov. 30, 2020 | 35 | 0.00~0.92 | 34 | |||||||||
| Dec. 2, 2020 | 57 | 0.00~0.92 | 44 | |||||||||
| Dec. 4, 2020 | 154 | 0.00~0.93 | 110 | |||||||||
| Dec. 30, 2020 | 88 | 0.00~1.00 | 64 | |||||||||
Stock granted in 2021 | Jan. 15, 2021 | 28,156 | 0.00~1.04 | 18,712 | ||||||||
| Apr. 5, 2021 | 89 | 0.00~1.26 | 53 | |||||||||
| Jul. 1, 2021 | 54 | 0.00~1.50 | 54 | |||||||||
| Jul. 2, 2021 | 11 | 0.00~1.50 | 11 | |||||||||
| Jul. 27, 2021 | 70 | 0.00~1.57 | 63 | |||||||||
| Nov. 1, 2021 | 71 | 0.00~1.84 | 71 | |||||||||
| Nov. 16, 2021 | 53 | 0.00~1.88 | 48 | |||||||||
| Dec. 6, 2021 | 87 | 0.00~1.93 | 87 | |||||||||
| Dec. 3, 2021 | 91 | 0.00~1.92 | 89 | |||||||||
| Dec. 30, 2021 | 76 | 0.00~2.00 | 76 | |||||||||
Stock granted in 2022 | Jan. 14, 2022 | 20,909 | 0.00~2.04 | 19,864 | ||||||||
| Apr. 4, 2022 | 65 | 0.00~2.26 | 65 | |||||||||
| Apr. 19, 2022 | 33 | 0.00~2.30 | 33 | |||||||||
| Jul. 1, 2022 | 62 | 0.00~2.50 | 62 | |||||||||
| Aug. 3, 2022 | 62 | 0.00~2.59 | 62 | |||||||||
| Aug. 9, 2022 | 80 | 0.00~2.61 | 76 | |||||||||
| Oct. 19, 2022 | 55 | 0.00~2.80 | 55 | |||||||||
| Nov. 1, 2022 | 177 | 0.00~2.84 | 177 | |||||||||
| Dec. 1, 2022 | 49 | 0.00~2.92 | 49 | |||||||||
| Dec. 12, 2022 | 114 | 0.00~2.95 | 114 | |||||||||
| Dec. 6, 2022 | 88 | 0.00~2.93 | 88 | |||||||||
| Dec. 2, 2022 | 42 | 0.00~2.92 | 42 | |||||||||
| Dec. 15, 2022 | 42 | 0.00~2.96 | 42 | |||||||||
| Dec. 30, 2022 | 114 | 0.00~3.00 | 114 | |||||||||
80,486 | 56,449 | |||||||||||
| 1 | Mileage stock is exercisable for two years after one year from the grant date at the closing price of the end of the previous month. However, mileage stock can be exercised at the closing price of the end of the previous month on the date of occurrence of retirement or transfer despite a one-year grace period. |
| 2 | Assessed based on the stock price as of December 31, 2022. These shares are vested immediately at grant date. |
Grant date | Vested shares | Expected exercise period (years) | Vesting condition | |||||||||||||
(In number of shares) | ||||||||||||||||
| Granted in 2020 | 2020 | 13,402 | 1.00 | Services fulfillment | ||||||||||||
Risk-free rate (%) | Fair value (market performance condition) | Fair value (non-market performance condition) | ||||||||||
(In Korean won) | ||||||||||||
| Granted in 2020 | 3.78 | — | 46,663 | |||||||||
2020 | 2021 | 2022 | ||||||||||
(In millions of Korean won) | ||||||||||||
Other non-operating income | ||||||||||||
| Gains on disposal of property and equipment | ₩ | 111,132 | ₩ | 9,045 | ₩ | 155,177 | ||||||
| Rental income | 113,075 | 34,791 | 26,176 | |||||||||
| Gains on a bargain purchase | 145,067 | 288 | — | |||||||||
| Others | 96,931 | 81,210 | 284,060 | |||||||||
| 466,205 | 125,334 | 465,413 | ||||||||||
Other non-operating expenses | ||||||||||||
| Losses on disposal of property and equipment | 11,945 | 6,552 | 2,164 | |||||||||
| Donation | 113,083 | 103,647 | 94,771 | |||||||||
| Restoration costs | 5,043 | 3,436 | 2,750 | |||||||||
Management cost for written-off loans | 3,018 | 4,054 | 4,296 | |||||||||
| Others | 143,726 | 117,182 | 175,903 | |||||||||
| 276,815 | 234,871 | 279,884 | ||||||||||
Net other non-operating income (expenses) | ₩ | 189,390 | ₩ | (109,537 | ) | ₩ | 185,529 | |||||
2020 | 2021 | 2022 | ||||||||||
(In millions of Korean won) | ||||||||||||
Income tax payable | ||||||||||||
Current income tax expense | ₩ | 1,099,171 | ₩ | 1,571,947 | ₩ | 1,972,104 | ||||||
Adjustments of income tax of prior years recognized in current tax | (13,434 | ) | 7,952 | (122,385 | ) | |||||||
| 1,085,737 | 1,579,899 | 1,849,719 | ||||||||||
Changes in deferred income tax assets and liabilities* | 326,918 | 214,660 | (1,540,280 | ) | ||||||||
Income tax recognized directly in equity and others | ||||||||||||
Remeasurements of net defined benefit liabilities | 4,949 | 18,638 | (91,150 | ) | ||||||||
Currency translation differences | 14,988 | (15,675 | ) | (15,059 | ) | |||||||
Net gains or losses on financial assets at fair value through other comprehensive income | (88,907 | ) | (71,421 | ) | 1,291,023 | |||||||
Share of other comprehensive income or loss of associates and joint ventures | 2,976 | (7 | ) | 44 | ||||||||
Gains or losses on cash flow hedging instruments | 7,580 | (21,534 | ) | (26,930 | ) | |||||||
Gains or losses on hedging instruments of net investments in foreign operations | (24,500 | ) | 25,599 | 24,936 | ||||||||
Other comprehensive income or loss arising from separate account | 3,671 | 24,206 | 56,765 | |||||||||
Fair value changes of financial liabilities designated at fair value through profit or loss due to own credit risk | (3,350 | ) | (5,202 | ) | (14,009 | ) | ||||||
Net gains or losses on overlay adjustment | (61,637 | ) | (46,834 | ) | 167,741 | |||||||
Consideration for exchange right of exchangeable bonds | (4,526 | ) | — | — | ||||||||
| (148,756 | ) | (92,230 | ) | 1,393,361 | ||||||||
Others | 495 | (5,104 | ) | (80,413 | ) | |||||||
Income tax expense | ₩ | 1,264,394 | ₩ | 1,697,225 | ₩ | 1,622,387 | ||||||
| * | Due to amendments of tax laws at the end of 2022, the effect of corporate tax rate change is reflected in deferred income tax assets and liabilities that are expected to be realized after December 31, 2022. (Corporate tax rates after the amendments: 10% for tax base ₩ 200 million or less, 21% for tax base over ₩ 200 million to ₩ 20,000 million, 23.2% for tax base over ₩ 20,000 million to �� 300,000 million, 26.5% for tax base over ₩ 300,000 million) |
2020 | 2021 | 2022 | ||||||||||||||||||||||
Tax rate (%) | Amount | Tax rate (%) | Amount | Tax rate (%) | Amount | |||||||||||||||||||
(In millions of Korean won) | ||||||||||||||||||||||||
Profit before income tax expense | ₩ | 4,779,972 | ₩ | 6,081,606 | ₩ | 5,795,626 | ||||||||||||||||||
Income tax at the applicable tax rate* | 27.28 | 1,304,130 | 27.33 | 1,662,080 | 27.32 | 1,583,435 | ||||||||||||||||||
Non-taxable income | (1.55 | ) | (73,855 | ) | (0.67 | ) | (40,708 | ) | (1.21 | ) | (70,105 | ) | ||||||||||||
Non-deductible expenses | 0.35 | 16,541 | 0.42 | 25,739 | 0.39 | 22,661 | ||||||||||||||||||
Tax credit and tax exemption | (0.08 | ) | (4,016 | ) | (0.01 | ) | (361 | ) | (0.04 | ) | (2,380 | ) | ||||||||||||
Temporary difference for which no deferred tax is recognized | 0.47 | 22,189 | 0.08 | 5,065 | 2.34 | 135,694 | ||||||||||||||||||
Changes in recognition and measurement of deferred tax | 0.24 | 11,616 | 0.10 | 5,997 | 0.85 | 49,262 | ||||||||||||||||||
Income tax refund for tax of prior years | (0.46 | ) | (22,139 | ) | (0.23 | ) | (13,953 | ) | (2.39 | ) | (138,314 | ) | ||||||||||||
Income tax expense of overseas branches | 0.23 | 10,739 | 0.31 | 18,571 | 0.54 | 31,270 | ||||||||||||||||||
Tax rate change effect | — | — | 0.19 | 10,726 | ||||||||||||||||||||
Others | (0.02 | ) | (811 | ) | 0.57 | 34,795 | 0.00 | 138 | ||||||||||||||||
Average effective tax rate and income tax expense | 26.45 | ₩ | 1,264,394 | 27.91 | ₩ | 1,697,225 | 27.99 | ₩ | 1,622,387 | |||||||||||||||
| * | Applicable income tax rate for ₩ 200 million and below is 11%, for over ₩ 200 million to ₩ 20 billion is 22%, for over ₩ 20 billion to ₩ 300 billion is 24.2% and for over ₩ 300 billion is 27.5% for the years ended December 31, 2020, 2021 and 2022. |
2021 | ||||||||||||||||||||||||
Beginning | Changes except for reclassification | Reclassification to profit or loss | Transfer within equity | Tax effect | Ending | |||||||||||||||||||
(In millions of Korean won) | ||||||||||||||||||||||||
Remeasurements of net defined benefit liabilities | ₩ | (282,650 | ) | ₩ | (64,380 | ) | ₩ | — | ₩ | — | ₩ | 18,638 | ₩ | (328,392 | ) | |||||||||
Currency translation differences | (131,113 | ) | 248,998 | 1,995 | (7,671 | ) | (15,675 | ) | 96,534 | |||||||||||||||
Gains on financial instruments at fair value through other comprehensive income | 717,230 | (62,043 | ) | 20,537 | 314,624 | (71,421 | ) | 918,927 | ||||||||||||||||
Share of other comprehensive income (loss) of associates and joint ventures | (3,529 | ) | 3,276 | (2,720 | ) | — | (7 | ) | (2,980 | ) | ||||||||||||||
Losses on cash flow hedging instruments | (28,597 | ) | 95,478 | (53,080 | ) | — | (21,534 | ) | (7,733 | ) | ||||||||||||||
Gains (losses) on hedging instruments of net investments in foreign operations | 22,277 | (88,729 | ) | 5,195 | — | 25,599 | (35,658 | ) | ||||||||||||||||
Other comprehensive income (loss) arising from separate account | 8,698 | (81,601 | ) | (6,419 | ) | — | 24,206 | (55,116 | ) | |||||||||||||||
Fair value changes of financial liabilities designated at fair value through profit or loss due to own credit risk | (11,507 | ) | 18,917 | — | — | (5,202 | ) | 2,208 | ||||||||||||||||
Gains on overlay adjustment | 339,202 | 257,574 | (90,458 | ) | — | (46,834 | ) | 459,484 | ||||||||||||||||
Assets of a disposal group held for sale | — | — | — | 7,671 | — | 7,671 | ||||||||||||||||||
| ₩ | 630,011 | ₩ | 327,490 | ₩ | (124,950 | ) | ₩ | 314,624 | ₩ | (92,230 | ) | ₩ | 1,054,945 | |||||||||||
2022 | ||||||||||||||||||||||||
Beginning | Changes except for reclassification | Reclassification to profit or loss | Transfer within equity | Tax effect | Ending | |||||||||||||||||||
(In millions of Korean won) | ||||||||||||||||||||||||
Remeasurements of net defined benefit liabilities | ₩ | (328,392 | ) | ₩ | 330,774 | ₩ | — | ₩ | — | ₩ | (91,150 | ) | ₩ | (88,768 | ) | |||||||||
Currency translation differences | 96,534 | 172,340 | — | — | (15,059 | ) | 253,815 | |||||||||||||||||
Gains (losses) on financial instruments at fair value through other comprehensive income | 918,927 | (4,830,635 | ) | 326,437 | (335,203 | ) | 1,291,023 | (2,629,451 | ) | |||||||||||||||
Share of other comprehensive income (loss) of associates and joint ventures | (2,980 | ) | (406 | ) | — | — | 44 | (3,342 | ) | |||||||||||||||
Gains (losses) on cash flow hedging instruments | (7,733 | ) | 71,692 | (13,288 | ) | — | (26,930 | ) | 23,741 | |||||||||||||||
Gains (losses) on hedging instruments of net investments in foreign operations | (35,658 | ) | (104,021 | ) | — | — | 24,936 | (114,743 | ) | |||||||||||||||
Other comprehensive income (loss) arising from separate account | (55,116 | ) | (225,426 | ) | 9,042 | — | 56,765 | (214,735 | ) | |||||||||||||||
Fair value changes of financial liabilities designated at fair value through profit or loss due to own credit risk | 2,208 | 52,876 | — | — | (14,009 | ) | 41,075 | |||||||||||||||||
Gains (losses) on overlay adjustment | 459,484 | (526,085 | ) | (81,785 | ) | — | 167,741 | 19,355 | ||||||||||||||||
Assets of a disposal group held for sale | 7,671 | (7,671 | ) | — | — | — | — | |||||||||||||||||
| ₩ | 1,054,945 | ₩ | (5,066,562 | ) | ₩ | 240,406 | ₩ | (335,203 | ) | ₩ | 1,393,361 | ₩ | (2,713,053 | ) | ||||||||||
2020 | 2021 | 2022 | ||||||||||||||||||||||
Number of shares | Accumulated number of shares | Number of shares | Accumulated number of shares | Number of shares | Accumulated number of shares | |||||||||||||||||||
(In number of shares) | ||||||||||||||||||||||||
Number of issued ordinary shares | 415,807,920 | 152,185,698,720 | 415,807,920 | 151,769,890,800 | 408,897,068 | 150,138,929,728 | ||||||||||||||||||
Number of treasury shares* | (26,173,585 | ) | (9,579,532,110 | ) | (26,173,585 | ) | (9,553,358,525 | ) | (19,262,733 | ) | (7,922,397,453 | ) | ||||||||||||
Average number of ordinary shares outstanding | 389,634,335 | 142,606,166,610 | 389,634,335 | 142,216,532,275 | 389,634,335 | 142,216,532,275 | ||||||||||||||||||
Number of days | 366 | 365 | 365 | |||||||||||||||||||||
Weighted average number of ordinary shares outstanding | 389,634,335 | 389,634,335 | 389,634,335 | |||||||||||||||||||||
| * | The number of treasury shares have excluded the initial redemption of treasury shares from February 14, 2022, and the 2nd redemption from August 1, 2022. |
2020 | 2021 | 2022 | ||||||||||
(In Korean won and in number of shares) | ||||||||||||
Profit attributable to shareholders of the Parent Company | ₩ | 3,468,447,701,501 | ₩ | 4,409,543,288,213 | ₩ | 4,394,828,402,454 | ||||||
Deduction: Dividends on hybrid securities | (22,859,500,000 | ) | (71,537,500,000 | ) | (126,402,175,000 | ) | ||||||
Profit attributable to ordinary equity holders of the Parent Company (A) | 3,445,588,201,501 | 4,338,005,788,213 | 4,268,426,227,454 | |||||||||
Weighted average number of ordinary shares outstanding (B) | 389,634,335 | 389,634,335 | 389,634,335 | |||||||||
Basic earnings per share (A/B) | ₩ | 8,843 | ₩ | 11,134 | ₩ | 10,955 | ||||||
2020 | 2021 | 2022 | ||||||||||
(In Korean won) | ||||||||||||
Profit attributable to shareholders of the Parent Company | ₩ | 3,468,447,701,501 | ₩ | 4,409,543,288,213 | ₩ | 4,394,828,402,454 | ||||||
Deduction: Dividends on hybrid securities | (22,859,500,000 | ) | (71,537,500,000 | ) | (126,402,175,000 | ) | ||||||
Profit attributable to ordinary equity holders of the Parent Company | 3,445,588,201,501 | 4,338,005,788,213 | 4,268,426,227,454 | |||||||||
Adjustments: Interest expense on exchangeable bonds | 798,012,332 | 2,347,186,871 | 2,380,953,816 | |||||||||
Adjusted profit for diluted earnings per share | ₩ | 3,446,386,213,833 | ₩ | 4,340,352,975,084 | ₩ | 4,270,807,181,270 | ||||||
2020 | 2021 | 2022 | ||||||||||
(In number of shares) | ||||||||||||
Weighted average number of ordinary shares outstanding | 389,634,335 | 389,634,335 | 389,634,335 | |||||||||
Adjustment: | ||||||||||||
Stock grants | 3,416,737 | 3,945,208 | 4,306,711 | |||||||||
Exchangeable bonds | 1,707,650 | 5,000,000 | 5,000,000 | |||||||||
Adjusted weighted average number of ordinary shares outstanding for diluted earnings per share | 394,758,722 | 398,579,543 | 398,941,046 | |||||||||
2020 | 2021 | 2022 | ||||||||||
(In Korean won and in number of shares) | ||||||||||||
Adjusted profit for diluted earnings per share | ₩ | 3,446,386,213,833 | ₩ | 4,340,352,975,084 | ₩ | 4,270,807,181,270 | ||||||
Adjusted weighted average number of ordinary shares outstanding for diluted earnings per share | 394,758,722 | 398,579,543 | 398,941,046 | |||||||||
Diluted earnings per share | ₩ | 8,730 | ₩ | 10,890 | ₩ | 10,705 | ||||||
December 31, 2021 | December 31, 2022 | |||||||
(In millions of Korean won) | ||||||||
Non-life insurance | ₩ | 1,230,375 | ₩ | 1,430,461 | ||||
Life insurance | 345,831 | 479,700 | ||||||
| ₩ | 1,576,206 | ₩ | 1,910,161 | |||||
2021 | ||||||||||||||||
Beginning | Increase | Amortization | Ending | |||||||||||||
(In millions of Korean won) | ||||||||||||||||
Non-life insurance | ₩ | 965,683 | ₩ | 965,735 | ₩ | (701,043 | ) | ₩ | 1,230,375 | |||||||
Life insurance | 205,289 | 258,653 | (118,111 | ) | 345,831 | |||||||||||
| ₩ | 1,170,972 | ₩ | 1,224,388 | ₩ | (819,154 | ) | ₩ | 1,576,206 | ||||||||
2022 | ||||||||||||||||
Beginning | Increase | Amortization | Ending | |||||||||||||
(In millions of Korean won) | ||||||||||||||||
Non-life insurance | ₩ | 1,230,375 | ₩ | 1,060,160 | ₩ | (860,074 | ) | ₩ | 1,430,461 | |||||||
Life insurance | 345,831 | 292,579 | (158,710 | ) | 479,700 | |||||||||||
| ₩ | 1,576,206 | ₩ | 1,352,739 | ₩ | (1,018,784 | ) | ₩ | 1,910,161 | ||||||||
December 31, 2021 | December 31, 2022 | |||||||||
(In millions of Korean won) | ||||||||||
Non-life insurance | Reserve for outstanding claims: | |||||||||
General insurance | ₩ | 879,936 | ₩ | 869,492 | ||||||
Automobile insurance | 16,989 | 15,136 | ||||||||
Long-term insurance | 178,531 | 187,619 | ||||||||
| Unearned premium reserve: | ||||||||||
General insurance | 262,020 | 262,817 | ||||||||
Automobile insurance | 5,575 | 1,078 | ||||||||
| 1,343,051 | 1,336,142 | |||||||||
Life insurance | Reserve for outstanding claims | 2,169 | 2,300 | |||||||
| Unearned premium reserve | 985 | 950 | ||||||||
| 3,154 | 3,250 | |||||||||
Others | Reserve for outstanding claims | 2,103 | 2,462 | |||||||
| Unearned premium reserve | 620 | 587 | ||||||||
| 2,723 | 3,049 | |||||||||
Total reinsurance assets | 1,348,928 | 1,342,441 | ||||||||
Less: Allowances for impairment losses | (436 | ) | (4,054 | ) | ||||||
| ₩ | 1,348,492 | ₩ | 1,338,387 | |||||||
2021 | ||||||||||||||
Beginning | Net increase (decrease) | Ending | ||||||||||||
(In millions of Korean won) | ||||||||||||||
Non-life insurance | Reserve for outstanding claims: | |||||||||||||
General insurance | ₩ | 732,579 | ₩ | 147,357 | ₩ | 879,936 | ||||||||
Automobile insurance | 14,916 | 2,073 | 16,989 | |||||||||||
Long-term insurance | 156,234 | 22,297 | 178,531 | |||||||||||
Unearned premium reserve: | ||||||||||||||
General insurance | 285,634 | (23,614 | ) | 262,020 | ||||||||||
Automobile insurance | 10,870 | (5,295 | ) | 5,575 | ||||||||||
| 1,200,233 | 142,818 | 1,343,051 | ||||||||||||
Life insurance | Reserve for outstanding claims | 2,081 | 88 | 2,169 | ||||||||||
Unearned premium reserve | 951 | 34 | 985 | |||||||||||
| 3,032 | 122 | 3,154 | ||||||||||||
Others | Reserve for outstanding claims | 2,427 | (324 | ) | 2,103 | |||||||||
Unearned premium reserve | 895 | (275 | ) | 620 | ||||||||||
| 3,322 | (599 | ) | 2,723 | |||||||||||
Total reinsurance assets | 1,206,587 | 142,341 | 1,348,928 | |||||||||||
Less: Allowances for impairment losses | (879 | ) | 443 | (436 | ) | |||||||||
| ₩ | 1,205,708 | ₩ | 142,784 | ₩ | 1,348,492 | |||||||||
2022 | ||||||||||||||
Beginning | Net increase (decrease) | Ending | ||||||||||||
(In millions of Korean won) | ||||||||||||||
Non-life insurance | Reserve for outstanding claims: | |||||||||||||
General insurance | ₩ | 879,936 | ₩ | (10,444 | ) | ₩ | 869,492 | |||||||
Automobile insurance | 16,989 | (1,853 | ) | 15,136 | ||||||||||
Long-term insurance | 178,531 | 9,088 | 187,619 | |||||||||||
Unearned premium reserve: | ||||||||||||||
General insurance | 262,020 | 797 | 262,817 | |||||||||||
Automobile insurance | 5,575 | (4,497 | ) | 1,078 | ||||||||||
| 1,343,051 | (6,909 | ) | 1,336,142 | |||||||||||
Life insurance | Reserve for outstanding claims | 2,169 | 131 | 2,300 | ||||||||||
Unearned premium reserve | 985 | (35 | ) | 950 | ||||||||||
| 3,154 | 96 | 3,250 | ||||||||||||
Others | Reserve for outstanding claims | 2,103 | 359 | 2,462 | ||||||||||
Unearned premium reserve | 620 | (33 | ) | 587 | ||||||||||
| 2,723 | 326 | 3,049 | ||||||||||||
Total reinsurance assets | 1,348,928 | (6,487 | ) | 1,342,441 | ||||||||||
Less: Allowances for impairment losses | (436 | ) | (3,618 | ) | (4,054 | ) | ||||||||
| ₩ | 1,348,492 | ₩ | (10,105 | ) | ₩ | 1,338,387 | ||||||||
December 31, 2021 | ||||||||||||||||
Non-life insurance | Life insurance | Others | Total | |||||||||||||
(In millions of Korean won) | ||||||||||||||||
Premium reserve* | ₩ | 26,086,004 | ₩ | 24,363,509 | ₩ | — | ₩ | 50,449,513 | ||||||||
Reserve for outstanding claims | 3,378,427 | 259,848 | 2,102 | 3,640,377 | ||||||||||||
Unearned premium reserve | 1,909,327 | 9,358 | 622 | 1,919,307 | ||||||||||||
Reserve for dividend to policyholders | 122,025 | 40,960 | — | 162,985 | ||||||||||||
Reserve for distribution of earnings to policyholders | 63,093 | 4,857 | — | 67,950 | ||||||||||||
Reserve for loss compensation on participating insurance | 24,790 | 6,108 | — | 30,898 | ||||||||||||
Guarantee reserve | — | 894,906 | — | 894,906 | ||||||||||||
| ₩ | 31,583,666 | ₩ | 25,579,546 | ₩ | 2,724 | ₩ | 57,165,936 | |||||||||
December 31, 2022 | ||||||||||||||||
Non-life insurance | Life insurance | Others | Total | |||||||||||||
(In millions of Korean won) | ||||||||||||||||
Premium reserve* | ₩ | 26,765,973 | ₩ | 24,613,169 | ₩ | — | ₩ | 51,379,142 | ||||||||
Reserve for outstanding claims | 3,531,159 | 225,226 | 2,460 | 3,758,845 | ||||||||||||
Unearned premium reserve | 2,038,077 | 7,112 | 588 | 2,045,777 | ||||||||||||
Reserve for dividend to policyholders | 132,076 | 39,233 | — | 171,309 | ||||||||||||
Reserve for distribution of earnings to policyholders | 63,821 | 3,866 | — | 67,687 | ||||||||||||
Reserve for loss compensation on participating insurance | 24,070 | 5,392 | — | 29,462 | ||||||||||||
Guarantee reserve | — | 778,081 | — | 778,081 | ||||||||||||
| ₩ | 32,555,176 | ₩ | 25,672,079 | ₩ | 3,048 | ₩ | 58,230,303 | |||||||||
| * | Includes negative VOBA amounting to ₩ 2,390,985 million and ₩ 2,111,541 million as of December 31, 2021 and 2022, respectively. |
2021 | ||||||||||||||
Beginning | Net increase (decrease) 1 | Ending | ||||||||||||
(In millions of Korean won) | ||||||||||||||
Non-life insurance | General insurance | ₩ | 1,568,741 | ₩ | 222,543 | ₩ | 1,791,284 | |||||||
| Automobile insurance | 1,897,872 | 127,693 | 2,025,565 | |||||||||||
| Long-term insurance | 26,362,479 | 1,373,257 | 27,735,736 | |||||||||||
| Long-term investment contract | 106,853 | (75,772 | ) | 31,081 | ||||||||||
Life insurance | Pure endowment insurance | 7,570,349 | 436,999 | 8,007,348 | ||||||||||
| Death insurance | 15,706,051 | 810,366 | 16,516,417 | |||||||||||
| Endowment insurance | 1,188,299 | (142,962 | ) | 1,045,337 | ||||||||||
| Group insurance and others 2 | 11,330 | (885 | ) | 10,445 | ||||||||||
Others | 3,322 | (599 | ) | 2,723 | ||||||||||
| ₩ | 54,415,296 | ₩ | 2,750,640 | ₩ | 57,165,936 | |||||||||
2022 | ||||||||||||||
Beginning | Net increase (decrease) 1 | Ending | ||||||||||||
(In millions of Korean won) | ||||||||||||||
Non-life insurance | General insurance | ₩ | 1,791,284 | ₩ | 68,690 | ₩ | 1,859,974 | |||||||
| Automobile insurance | 2,025,565 | 145,331 | 2,170,896 | |||||||||||
| Long-term insurance | 27,735,736 | 778,634 | 28,514,370 | |||||||||||
| Long-term investment contract | 31,081 | (21,147 | ) | 9,934 | ||||||||||
| Life insurance | Pure endowment insurance | 8,007,348 | (840,495 | ) | 7,166,853 | |||||||||
| Death insurance | 16,516,417 | 816,485 | 17,332,902 | |||||||||||
| Endowment insurance | 1,045,337 | 118,328 | 1,163,665 | |||||||||||
| Group insurance and others 2 | 10,445 | (1,785 | ) | 8,660 | ||||||||||
| Others | 2,723 | 326 | 3,049 | |||||||||||
| ₩ | 57,165,936 | ₩ | 1,064,367 | ₩ | 58,230,303 | |||||||||
| 1 | Includes exchange differences effect and decrease in liabilities related to investment contracts. |
| 2 | Includes reserve for distribution of earnings to policyholders and reserve for loss compensation on participating insurance. |
Assumptions (%) | Calculation basis | |||||
December 31, 2021 | December 31, 2022 | |||||
Long-term insurance | ||||||
| Discount rate | -3.39 ~ 19.54 | -2.84 ~ 21.14 | Calculated by applying an interest rate scenario which is a risk-free rate scenario adjusted by liquidity premium presented by director of the Financial Supervisory Service | |||
| Expense ratio | 6.25 | 5.93 | Calculated using future expense plan based on the recent one-year experience statistics | |||
| Lapse ratio | 1.49 ~ 35.98 | 1.37 ~ 32.92 | Calculated based on the recent five-year experience statistics | |||
| Risk ratio | 7.4 ~ 1,143.8 | 8.2 ~ 1,214.3 | Calculated by ratio of insurance claim payments to risk premiums based on the recent seven-year experience statistics | |||
General insurance | ||||||
| Lapse ratio | 0.9 | 0.86 | Ratio of surrender value to direct insurance premiums by type of contracts for the preceding five years | |||
Assumptions (%) | Calculation basis | |||||
December 31, 2021 | December 31, 2022 | |||||
| Sales cost ratio | 6.3 | 6.31 | Ratio of sales cost to direct insurance premiums by type of contracts for the preceding year (applicable only to unpaid premiums) | |||
| Maintenance cost ratio | 10.5 | 9.12 | Ratio of maintenance cost to earned premiums by type of contracts for the preceding year | |||
| Claim survey cost ratio | 4.7 | 4.54 | Ratio of claim survey cost to insurance claim payments by type of contracts for the preceding three years | |||
| Loss ratio | 78.5 | 82.27 | Ratio of final loss incurred to earned premiums by type of contracts for the preceding five years | |||
Automobile insurance | ||||||
| Lapse ratio | 4.7 | 4.7 | Ratio of surrender value to direct insurance premiums by type of contracts for the preceding five years | |||
| Sales cost ratio | 7.6 | 7.5 | Ratio of sales cost to direct insurance premiums by type of contracts for the preceding year (applicable only to unpaid premiums) | |||
| Maintenance cost ratio | 8.8 | 8.5 | Ratio of maintenance cost to earned premiums by type of collaterals for the preceding year | |||
| Claim survey cost ratio | 8.1 | 8.1 | Ratio of claim survey cost to insurance claim payments by type of collaterals for the preceding three years | |||
| Loss ratio | 78.2 | 77.6 | Ratio of final loss incurred to earned premiums by type of collaterals for the preceding five years | |||
December 31, 2021 | ||||||||||||
Recognized liabilities* | Estimated adequate liabilities | Surplus (shortfall) | ||||||||||
(In millions of Korean won) | ||||||||||||
| General insurance | ₩ | 465,812 | ₩ | 437,555 | ₩ | 28,257 | ||||||
| Automobile insurance | 1,401,462 | 1,322,026 | 79,436 | |||||||||
| Long-term insurance | 21,812,939 | 14,277,162 | 7,535,777 | |||||||||
| ₩ | 23,680,213 | ₩ | 16,036,743 | ₩ | 7,643,470 | |||||||
December 31, 2022 | ||||||||||||
Recognized liabilities* | Estimated adequate liabilities | Surplus (shortfall) | ||||||||||
(In millions of Korean won) | ||||||||||||
| General insurance | ₩ | 570,608 | ₩ | 537,204 | ₩ | 33,404 | ||||||
| Automobile insurance | 1,491,245 | 1,395,407 | 95,838 | |||||||||
| Long-term insurance | 22,309,067 | 8,538,565 | 13,770,502 | |||||||||
| ₩24,370,920 | ₩ | 10,471,176 | ₩ | 13,899,744 | ||||||||
| * | In the case of long-term insurance, premium reserve and unearned premium reserve are recognized; the premium reserve is the amount of subtracting deferred acquisition costs and insurance contract loans from the net insurance premium reserve in accordance with Article6-3 of the Regulations on Supervision of Insurance Business. |
Assumptions (%) | ||||||
December 31, 2021 | December 31, 2022 | Calculation basis | ||||
Lapse ratio | 0 ~ 65.57 | 0 | Ratio of canceled premiums to premiums by product group, method of payment, channel, and elapsed period, based on the recent five-year experience statistics | |||
Loss ratio | 22 ~ 162 | 20 | Ratio of number of accidents to the number of holding contracts, by collateral, gender, and elapsed period, based on the recent seven-year experience statistics | |||
Discount rate | -3.39 ~ 19.54 | -2.84 | Estimated investment yield based on the interest rate scenario provided by the Financial Supervisory Service adjusted by risk spread | |||
December 31, 2021 | ||||||||||||||
Recognized liabilities | Estimated adequate liabilities | Surplus (shortfall) | ||||||||||||
(In millions of Korean won) | ||||||||||||||
Fixed interest type | Participating | ₩ | 30,828 | ₩ | 51,443 | ₩ | (20,615 | ) | ||||||
| Non-participating | 664,569 | 5,876 | 658,693 | |||||||||||
Variable interest type | Participating | 896,754 | 913,067 | (16,313 | ) | |||||||||
| Non-participating | 5,754,214 | 5,263,775 | 490,439 | |||||||||||
Variable type | (7,822 | ) | (101,418 | ) | 93,596 | |||||||||
| ₩ | 7,338,543 | ₩ | 6,132,743 | ₩ | 1,205,800 | |||||||||
December 31, 2022 | ||||||||||||||
Recognized liabilities | Estimated adequate liabilities | Surplus (shortfall) | ||||||||||||
(In millions of Korean won) | ||||||||||||||
Fixed interest type | Participating | ₩ | 30,720 | ₩ | 43,889 | ₩ | (13,169 | ) | ||||||
| Non-participating | 1,238,004 | (6,488 | ) | 1,244,492 | ||||||||||
Variable interest type | Participating | 814,350 | 817,087 | (2,737 | ) | |||||||||
| Non-participating | 4,826,517 | 4,219,110 | 607,407 | |||||||||||
Variable type | (45,907 | ) | (103,354 | ) | 57,447 | |||||||||
| ₩ | 6,863,684 | ₩ | 4,970,244 | ₩ | 1,893,440 | |||||||||
Assumptions (%) | ||||||
December 31, 2021 | December 31, 2022 | Calculation basis | ||||
Discount rate | -3.39 ~ 19.54 | -2.84 ~ 21.14 | Calculated by applying an interest rate scenario which is a risk-free rate scenario adjusted by liquidity premium presented by the Financial Supervisory Service | |||
Lapse ratio | 1 ~ 26 | 1.3 ~ 25 | Calculated based on the amount of insurance coverage by elapsed period based on the recent five-year experience statistics | |||
Risk ratio | 28 ~ 545 | 21 ~ 982 | Calculated by ratio of insurance claim payments to risk premiums by elapsed period based on the recent five-year experience statistics | |||
Surplus (shortfall) | ||||||||||
December 31, 2021 | December 31, 2022 | |||||||||
(In millions of Korean won) | ||||||||||
Fixed interest type | Participating | ₩ | (7,687 | ) | ₩ | 1,177 | ||||
| Non-participating | 787,200 | 4,484,049 | ||||||||
Variable interest type | Non-participating | 128,963 | 185,675 | |||||||
Variable type | 1,278,620 | 1,265,066 | ||||||||
| ₩ | 2,187,096 | ₩ | 5,935,967 | |||||||
2020 | 2021 | 2022 | ||||||||||||
(In millions of Korean won) | ||||||||||||||
Insurance income | Premium income | ₩ | 12,872,727 | ₩ | 14,684,383 | ₩ | 15,765,939 | |||||||
| Reinsurance income | 823,500 | 990,437 | 1,029,943 | |||||||||||
| Reversal of policy reserve | 85 | 599 | — | |||||||||||
| Separate account income | 216,485 | 286,967 | 331,281 | |||||||||||
| Income from changes in reinsurance assets | 467,729 | 135,159 | — | |||||||||||
| Other insurance income | 6,114 | 10,313 | 9,679 | |||||||||||
| 14,386,640 | 16,107,858 | 17,136,842 | ||||||||||||
Insurance expenses | Insurance claims paid | 5,264,829 | 5,777,899 | 6,325,021 | ||||||||||
| Dividend expenses | 11,661 | 14,038 | 15,370 | |||||||||||
| Refunds of surrender value | 3,286,150 | 4,032,209 | 5,556,410 | |||||||||||
| Reinsurance expenses | 1,127,304 | 1,163,056 | 1,268,711 | |||||||||||
| Provision for policy reserve | 2,709,903 | 2,761,735 | 1,046,300 | |||||||||||
| Separate account expenses | 113,703 | 112,180 | 264,517 | |||||||||||
| Administration expenses | 563,085 | 644,947 | 715,317 | |||||||||||
| Amortization of deferred acquisition costs | 767,633 | 819,154 | 1,018,784 | |||||||||||
| Expenses from changes in reinsurance assets | 163 | — | — | |||||||||||
| Claim survey expenses paid | 58,873 | 60,234 | 73,803 | |||||||||||
| Other insurance expenses | 183,343 | 165,695 | 156,096 | |||||||||||
| 14,086,647 | 15,551,147 | 16,440,329 | ||||||||||||
Net insurance income | ₩ | 299,993 | ₩ | 556,711 | ₩ | 696,513 | ||||||||
December 31, 2021 | ||||||||||||||||
Direct risk premium | Assumed risk reinsurance premium | Ceded risk reinsurance premium | Total | |||||||||||||
(In millions of Korean won) | ||||||||||||||||
| General | ₩ | 1,161,427 | ₩ | 93,191 | ₩ | (630,231 | ) | ₩ | 624,387 | |||||||
| Automobile | 2,538,277 | — | (13,683 | ) | 2,524,594 | |||||||||||
| Long-term | 3,128,821 | — | (462,261 | ) | 2,666,560 | |||||||||||
| ₩ | 6,828,525 | ₩ | 93,191 | ₩ | (1,106,175 | ) | ₩ | 5,815,541 | ||||||||
December 31, 2022 | ||||||||||||||||
Direct risk premium | Assumed risk reinsurance premium | Ceded risk reinsurance premium | Total | |||||||||||||
(In millions of Korean won) | ||||||||||||||||
| General | ₩ | 1,287,819 | ₩ | 121,296 | ₩ | (698,981 | ) | ₩ | 710,134 | |||||||
| Automobile | 2,684,544 | — | (4,788 | ) | 2,679,756 | |||||||||||
| Long-term | 3,495,031 | — | (494,563 | ) | 3,000,468 | |||||||||||
| ₩ | 7,467,394 | ₩ | 121,296 | ₩ | (1,198,332) | ₩ | 6,390,358 | |||||||||
Development year | ||||||||||||||||||||
| Accident year | After 1 year | After 2 years | After 3 years | After 4 years | After 5 years | |||||||||||||||
(In millions of Korean won) | ||||||||||||||||||||
Estimate of gross ultimate claims (A) | ||||||||||||||||||||
| 2017.1.1 ~ 2017.12.31 | ₩ | 169,234 | ₩ | 201,406 | ₩ | 205,075 | ₩ | 206,856 | ₩ | 207,252 | ||||||||||
| 2018.1.1 ~ 2018.12.31 | 200,968 | 241,471 | 246,499 | 250,083 | — | |||||||||||||||
| 2019.1.1 ~ 2019.12.31 | 219,419 | 263,105 | 267,687 | — | — | |||||||||||||||
| 2020.1.1 ~ 2020.12.31 | 232,622 | 273,531 | — | — | — | |||||||||||||||
| 2021.1.1 ~ 2021.12.31 | 290,480 | — | — | — | — | |||||||||||||||
| 1,112,723 | 979,513 | 719,261 | 456,939 | 207,252 | ||||||||||||||||
Gross cumulative claim payments (B) | ||||||||||||||||||||
| 2017.1.1 ~ 2017.12.31 | 133,254 | 185,107 | 194,511 | 199,926 | 202,548 | |||||||||||||||
| 2018.1.1 ~ 2018.12.31 | 153,770 | 217,955 | 235,900 | 240,171 | — | |||||||||||||||
| 2019.1.1 ~ 2019.12.31 | 185,645 | 246,397 | 258,465 | — | — | |||||||||||||||
| 2020.1.1 ~ 2020.12.31 | 167,129 | 244,074 | — | — | — | |||||||||||||||
| 2021.1.1 ~ 2021.12.31 | 236,265 | — | — | — | — | |||||||||||||||
| 876,063 | 893,533 | 688,876 | 440,097 | 202,548 | ||||||||||||||||
Difference (A-B) | ₩ | 236,660 | ₩ | 85,980 | ₩ | 30,385 | ₩ | 16,842 | ₩ | 4,704 | ||||||||||
Development year | ||||||||||||||||||||||||||||
| Accident year | After 1 year | After 2 years | After 3 years | After 4 years | After 5 years | After 6 years | After 7 years | |||||||||||||||||||||
(In millions of Korean won) | ||||||||||||||||||||||||||||
Estimate of gross ultimate claims (A) | ||||||||||||||||||||||||||||
| 2015.1.1 ~ 2015.12.31 | ₩ | 1,227,107 | ₩ | 1,245,781 | ₩ | 1,256,059 | ₩ | 1,263,044 | ₩ | 1,267,142 | ₩ | 1,271,000 | ₩ | 1,282,673 | ||||||||||||||
| 2016.1.1 ~ 2016.12.31 | 1,276,939 | 1,281,381 | 1,287,728 | 1,294,735 | 1,299,964 | 1,309,221 | — | |||||||||||||||||||||
| 2017.1.1 ~ 2017.12.31 | 1,342,998 | 1,348,828 | 1,358,867 | 1,368,016 | 1,371,619 | — | — | |||||||||||||||||||||
| 2018.1.1 ~ 2018.12.31 | 1,468,784 | 1,471,807 | 1,481,509 | 1,488,890 | — | — | — | |||||||||||||||||||||
| 2019.1.1 ~ 2019.12.31 | 1,591,793 | 1,620,609 | 1,635,704 | — | — | — | — | |||||||||||||||||||||
| 2020.1.1 ~ 2020.12.31 | 1,624,341 | 1,632,626 | — | — | — | — | — | |||||||||||||||||||||
| 2021.1.1 ~ 2021.12.31 | 1,750,508 | — | — | — | — | — | — | |||||||||||||||||||||
| 10,282,470 | 8,601,032 | 7,019,867 | 5,414,685 | 3,938,725 | 2,580,221 | 1,282,673 | ||||||||||||||||||||||
Gross cumulative claim payments (B) | ||||||||||||||||||||||||||||
| 2015.1.1 ~ 2015.12.31 | 1,020,975 | 1,198,240 | 1,228,357 | 1,245,780 | 1,254,186 | 1,261,995 | 1,264,247 | |||||||||||||||||||||
| 2016.1.1 ~ 2016.12.31 | 1,052,830 | 1,235,656 | 1,264,651 | 1,282,346 | 1,288,754 | 1,291,380 | — | |||||||||||||||||||||
| 2017.1.1 ~ 2017.12.31 | 1,104,158 | 1,306,235 | 1,335,962 | 1,350,174 | 1,357,903 | — | — | |||||||||||||||||||||
| 2018.1.1 ~ 2018.12.31 | 1,224,820 | 1,428,973 | 1,456,532 | 1,471,379 | — | — | — | |||||||||||||||||||||
| 2019.1.1 ~ 2019.12.31 | 1,332,849 | 1,570,194 | 1,598,956 | — | — | — | — | |||||||||||||||||||||
| 2020.1.1 ~ 2020.12.31 | 1,353,799 | 1,570,730 | — | — | — | — | — | |||||||||||||||||||||
| 2021.1.1 ~ 2021.12.31 | 1,445,877 | — | — | — | — | — | — | |||||||||||||||||||||
| 8,535,308 | 8,310,028 | 6,884,458 | 5,349,679 | 3,900,843 | 2,553,375 | 1,264,247 | ||||||||||||||||||||||
Difference (A-B) | ₩ | 1,747,162 | ₩ | 291,004 | ₩ | 135,409 | ₩ | 65,006 | ₩ | 37,882 | ₩ | 26,846 | ₩ | 18,426 | ||||||||||||||
Development year | ||||||||||||||||||||||||||||
| Accident year | After 1 year | After 2 years | After 3 years | After 4 years | After 5 years | After 6 years | After 7 years | |||||||||||||||||||||
(In millions of Korean won) | ||||||||||||||||||||||||||||
Estimate of gross ultimate claims (A) | ||||||||||||||||||||||||||||
| 2015.1.1 ~ 2015.12.31 | ₩ | 885,476 | ₩ | 1,219,394 | ₩ | 1,256,051 | ₩ | 1,266,881 | ₩ | 1,270,967 | ₩ | 1,273,615 | ₩ | 1,275,520 | ||||||||||||||
| 2016.1.1 ~ 2016.12.31 | 1,064,744 | 1,437,574 | 1,485,839 | 1,500,403 | 1,506,889 | 1,510,197 | — | |||||||||||||||||||||
| 2017.1.1 ~ 2017.12.31 | 1,184,224 | 1,614,903 | 1,670,929 | 1,689,768 | 1,695,477 | — | — | |||||||||||||||||||||
| 2018.1.1 ~ 2018.12.31 | 1,372,706 | 1,881,046 | 1,941,497 | 1,965,983 | — | — | — | |||||||||||||||||||||
| 2019.1.1 ~ 2019.12.31 | 1,626,481 | 2,229,830 | 2,297,861 | — | — | — | — | |||||||||||||||||||||
| 2020.1.1 ~ 2020.12.31 | 1,818,316 | 2,442,633 | — | — | — | — | — | |||||||||||||||||||||
| 2021.1.1 ~ 2021.12.31 | 2,124,582 | — | — | — | — | — | — | |||||||||||||||||||||
| 10,076,529 | 10,825,380 | 8,652,177 | 6,423,035 | 4,473,333 | 2,783,812 | 1,275,520 | ||||||||||||||||||||||
Gross cumulative claim payments (B) | ||||||||||||||||||||||||||||
| 2015.1.1 ~ 2015.12.31 | 836,472 | 1,205,130 | 1,248,475 | 1,262,528 | 1,269,557 | 1,272,648 | 1,274,908 | |||||||||||||||||||||
| 2016.1.1 ~ 2016.12.31 | 1,017,243 | 1,424,948 | 1,477,415 | 1,496,556 | 1,503,841 | 1,507,284 | — | |||||||||||||||||||||
| 2017.1.1 ~ 2017.12.31 | 1,130,868 | 1,599,227 | 1,662,978 | 1,683,997 | 1,692,323 | — | — | |||||||||||||||||||||
| 2018.1.1 ~ 2018.12.31 | 1,319,613 | 1,868,434 | 1,933,543 | 1,958,256 | — | — | — | |||||||||||||||||||||
| 2019.1.1 ~ 2019.12.31 | 1,574,696 | 2,211,717 | 2,288,023 | — | — | — | — | |||||||||||||||||||||
| 2020.1.1 ~ 2020.12.31 | 1,749,647 | 2,426,351 | — | — | — | — | — | |||||||||||||||||||||
| 2021.1.1 ~ 2021.12.31 | 2,057,154 | — | — | — | — | — | — | |||||||||||||||||||||
| 9,685,693 | 10,735,807 | 8,610,434 | 6,401,337 | 4,465,721 | 2,779,932 | 1,274,908 | ||||||||||||||||||||||
Difference (A-B) | ₩ | 390,836 | ₩ | 89,573 | ₩ | 41,743 | ₩ | 21,698 | ₩ | 7,612 | ₩ | 3,880 | ₩ | 612 | ||||||||||||||
Development year | ||||||||||||||||||||
| Accident year | After 1 year | After 2 years | After 3 years | After 4 years | After 5 years | |||||||||||||||
(In millions of Korean won) | ||||||||||||||||||||
Estimate of gross ultimate claims (A) | ||||||||||||||||||||
| 2018.1.1 ~ 2018.12.31 | ₩ | 200,968 | ₩ | 241,474 | ₩ | 246,871 | ₩ | 250,935 | ₩ | 251,815 | ||||||||||
| 2019.1.1 ~ 2019.12.31 | 220,043 | 266,489 | 270,815 | 271,047 | — | |||||||||||||||
| 2020.1.1 ~ 2020.12.31 | 235,365 | 274,260 | 277,957 | — | — | |||||||||||||||
| 2021.1.1 ~ 2021.12.31 | 296,348 | 347,715 | — | — | — | |||||||||||||||
| 2022.1.1 ~ 2022.12.31 | 336,344 | — | — | — | — | |||||||||||||||
| 1,289,068 | 1,129,938 | 795,643 | 521,982 | 251,815 | ||||||||||||||||
Gross cumulative claim payments (B) | ||||||||||||||||||||
| 2018.1.1 ~ 2018.12.31 | 153,770 | 217,955 | 235,900 | 240,518 | 245,732 | |||||||||||||||
| 2019.1.1 ~ 2019.12.31 | 185,645 | 247,945 | 260,774 | 264,952 | — | |||||||||||||||
| 2020.1.1 ~ 2020.12.31 | 169,859 | 246,805 | 257,784 | — | — | |||||||||||||||
| 2021.1.1 ~ 2021.12.31 | 237,065 | 317,089 | — | — | — | |||||||||||||||
| 2022.1.1 ~ 2022.12.31 | 240,982 | — | — | — | — | |||||||||||||||
| 987,321 | 1,029,794 | 754,458 | 505,470 | 245,732 | ||||||||||||||||
Difference (A-B) | ₩ | 301,747 | ₩ | 100,144 | ₩ | 41,185 | ₩ | 16,512 | ₩ | 6,083 | ||||||||||
Development year | ||||||||||||||||||||||||||||
| Accident year | After 1 year | After 2 years | After 3 years | After 4 years | After 5 years | After 6 years | After 7 years | |||||||||||||||||||||
(In millions of Korean won) | ||||||||||||||||||||||||||||
Estimate of gross ultimate claims (A) | ||||||||||||||||||||||||||||
| 2016.1.1 ~ 2016.12.31 | ₩ | 1,276,939 | ₩ | 1,281,381 | ₩ | 1,287,728 | ₩ | 1,294,735 | ₩ | 1,299,964 | ₩ | 1,309,221 | ₩ | 1,316,456 | ||||||||||||||
| 2017.1.1 ~ 2017.12.31 | 1,342,998 | 1,348,828 | 1,358,867 | 1,368,016 | 1,371,619 | 1,377,499 | — | |||||||||||||||||||||
| 2018.1.1 ~ 2018.12.31 | 1,468,784 | 1,471,807 | 1,481,509 | 1,488,890 | 1,498,384 | — | — | |||||||||||||||||||||
| 2019.1.1 ~ 2019.12.31 | 1,591,793 | 1,620,609 | 1,635,704 | 1,649,928 | — | — | — | |||||||||||||||||||||
| 2020.1.1 ~ 2020.12.31 | 1,624,341 | 1,632,626 | 1,639,325 | — | — | — | — | |||||||||||||||||||||
| 2021.1.1 ~ 2021.12.31 | 1,750,508 | 1,757,801 | — | — | — | — | — | |||||||||||||||||||||
| 2022.1.1 ~ 2022.12.31 | 1,858,395 | — | — | — | — | — | — | |||||||||||||||||||||
| 10,913,758 | 9,113,052 | 7,403,133 | 5,801,569 | 4,169,967 | 2,686,720 | 1,316,456 | ||||||||||||||||||||||
Gross cumulative claim payments (B) | ||||||||||||||||||||||||||||
| 2016.1.1 ~ 2016.12.31 | 1,052,830 | 1,235,655 | 1,264,651 | 1,282,346 | 1,288,754 | 1,291,380 | 1,293,473 | |||||||||||||||||||||
| 2017.1.1 ~ 2017.12.31 | 1,104,158 | 1,306,235 | 1,335,962 | 1,350,174 | 1,357,903 | 1,361,232 | — | |||||||||||||||||||||
| 2018.1.1 ~ 2018.12.31 | 1,224,820 | 1,428,973 | 1,456,532 | 1,471,379 | 1,476,781 | — | — | |||||||||||||||||||||
| 2019.1.1 ~ 2019.12.31 | 1,332,849 | 1,570,194 | 1,598,956 | 1,614,015 | — | — | — | |||||||||||||||||||||
| 2020.1.1 ~ 2020.12.31 | 1,353,799 | 1,570,730 | 1,595,586 | — | — | — | — | |||||||||||||||||||||
| 2021.1.1 ~ 2021.12.31 | 1,445,877 | 1,684,092 | — | — | — | — | — | |||||||||||||||||||||
| 2022.1.1 ~ 2022.12.31 | 1,516,007 | — | — | — | — | — | — | |||||||||||||||||||||
| 9,030,340 | 8,795,879 | 7,251,687 | 5,717,914 | 4,123,438 | 2,652,612 | 1,293,473 | ||||||||||||||||||||||
Difference (A-B) | ₩ | 1,883,418 | ₩ | 317,173 | ₩ | 151,446 | ₩ | 83,655 | ₩ | 46,529 | ₩ | 34,108 | ₩ | 22,983 | ||||||||||||||
Development year | ||||||||||||||||||||||||||||
| Accident year | After 1 year | After 2 years | After 3 years | After 4 years | After 5 years | After 6 years | After 7 years | |||||||||||||||||||||
(In millions of Korean won) | ||||||||||||||||||||||||||||
Estimate of gross ultimate claims (A) | ||||||||||||||||||||||||||||
| 2016.1.1 ~ 2016.12.31 | ₩ | 1,064,743 | ₩ | 1,437,574 | ₩ | 1,485,839 | ₩ | 1,500,403 | ₩ | 1,506,889 | ₩ | 1,510,197 | ₩ | 1,511,728 | ||||||||||||||
| 2017.1.1 ~ 2017.12.31 | 1,184,224 | 1,614,904 | 1,670,929 | 1,689,768 | 1,695,477 | 1,698,804 | — | |||||||||||||||||||||
| 2018.1.1 ~ 2018.12.31 | 1,372,706 | 1,881,046 | 1,941,497 | 1,965,983 | 1,972,727 | — | — | |||||||||||||||||||||
| 2019.1.1 ~ 2019.12.31 | 1,626,481 | 2,229,830 | 2,297,861 | 2,324,246 | — | — | — | |||||||||||||||||||||
| 2020.1.1 ~ 2020.12.31 | 1,818,316 | 2,442,633 | 2,514,577 | — | — | — | — | |||||||||||||||||||||
| 2021.1.1 ~ 2021.12.31 | 2,124,582 | 2,841,110 | — | — | — | — | — | |||||||||||||||||||||
| 2022.1.1 ~ 2022.12.31 | 2,277,455 | — | — | — | — | — | — | |||||||||||||||||||||
| 11,468,507 | 12,447,097 | 9,910,703 | 7,480,400 | 5,175,093 | 3,209,001 | 1,511,728 | ||||||||||||||||||||||
Gross cumulative claim payments (B) | ||||||||||||||||||||||||||||
| 2016.1.1 ~ 2016.12.31 | 1,017,244 | 1,424,948 | 1,477,414 | 1,496,556 | 1,503,841 | 1,507,284 | 1,509,334 | |||||||||||||||||||||
| 2017.1.1 ~ 2017.12.31 | 1,130,868 | 1,599,227 | 1,662,978 | 1,683,997 | 1,692,323 | 1,696,284 | — | |||||||||||||||||||||
| 2018.1.1 ~ 2018.12.31 | 1,319,613 | 1,868,434 | 1,933,543 | 1,958,256 | 1,967,097 | — | — | |||||||||||||||||||||
| 2019.1.1 ~ 2019.12.31 | 1,574,696 | 2,211,717 | 2,288,023 | 2,316,190 | — | — | — | |||||||||||||||||||||
| 2020.1.1 ~ 2020.12.31 | 1,749,647 | 2,426,351 | 2,503,496 | — | — | — | — | |||||||||||||||||||||
| 2021.1.1 ~ 2021.12.31 | 2,057,154 | 2,818,484 | — | — | — | — | — | |||||||||||||||||||||
| 2022.1.1 ~ 2022.12.31 | 2,168,671 | — | — | — | — | — | — | |||||||||||||||||||||
| 11,017,893 | 12,349,161 | 9,865,454 | 7,454,999 | 5,163,261 | 3,203,568 | 1,509,334 | ||||||||||||||||||||||
Difference (A-B) | ₩ | 450,614 | ₩ | 97,936 | ₩ | 45,249 | ₩ | 25,401 | ₩ | 11,832 | ₩ | 5,433 | ₩ | 2,394 | ||||||||||||||
December 31, 2021 | ||||||||||||||||||||
Assumption change | Effect on | |||||||||||||||||||
Base amount of LAT | Insurance liabilities | Profit before tax | Equity | |||||||||||||||||
(In millions of Korean won) | ||||||||||||||||||||
| Lapse ratio | +10 | % | ₩ | 337,969 | ₩ | — | ₩ | — | ₩ | — | ||||||||||
| Loss ratio | +10 | % | 6,065,429 | — | — | — | ||||||||||||||
| Expense ratio | +10 | % | 503,132 | — | — | — | ||||||||||||||
| Discount rate | -0.5 | %p | 1,985,421 | — | — | — | ||||||||||||||
December 31, 2022 | ||||||||||||||||||||
Assumption change | Effect on | |||||||||||||||||||
Base amount of LAT | Insurance liabilities | Profit before tax | Equity | |||||||||||||||||
(In millions of Korean won) | ||||||||||||||||||||
| Lapse ratio | +10 | % | ₩ | 495,870 | ₩ | — | ₩ | — | ₩ | — | ||||||||||
| Loss ratio | +10 | % | 5,745,896 | — | — | — | ||||||||||||||
| Expense ratio | +10 | % | 413,073 | — | — | — | ||||||||||||||
| Discount rate | -0.5 | %p | 1,084,314 | — | — | — | ||||||||||||||
December 31, 2021 * | ||||||||||||||||||||||||
Up to 1 year | 1~5 years | 5~10 years | 10~20 years | Over 20 years | Total | |||||||||||||||||||
(In millions of Korean won) | ||||||||||||||||||||||||
| Long-term insurance non-participating: | ||||||||||||||||||||||||
| Fixed interest type | ₩ | 121,988 | ₩ | 64,730 | ₩ | 77,880 | ₩ | 59,042 | ₩ | 324,259 | ₩ | 647,899 | ||||||||||||
| Variable interest type | 959,348 | 1,958,267 | 1,536,690 | 919,726 | 16,123,312 | 21,497,343 | ||||||||||||||||||
| 1,081,336 | 2,022,997 | 1,614,570 | 978,768 | 16,447,571 | 22,145,242 | |||||||||||||||||||
| Annuity: | ||||||||||||||||||||||||
| Fixed interest type | — | 820 | 2,134 | 3,813 | 532 | 7,299 | ||||||||||||||||||
| Variable interest type | 252 | 103,419 | 407,556 | 1,324,916 | 2,121,076 | 3,957,219 | ||||||||||||||||||
| 252 | 104,239 | 409,690 | 1,328,729 | 2,121,608 | 3,964,518 | |||||||||||||||||||
| Total: | ||||||||||||||||||||||||
| Fixed interest type | 121,988 | 65,550 | 80,014 | 62,855 | 324,791 | 655,198 | ||||||||||||||||||
| Variable interest type | 959,600 | 2,061,686 | 1,944,246 | 2,244,642 | 18,244,388 | 25,454,562 | ||||||||||||||||||
| ₩ | 1,081,588 | ₩ | 2,127,236 | ₩ | 2,024,260 | ₩ | 2,307,497 | ₩ | 18,569,179 | ₩ | 26,109,760 | |||||||||||||
December 31, 2022 * | ||||||||||||||||||||||||
Up to 1 year | 1~5 years | 5~10 years | 10~20 years | Over 20 years | Total | |||||||||||||||||||
(In millions of Korean won) | ||||||||||||||||||||||||
| Long-term insurance non-participating: | ||||||||||||||||||||||||
| Fixed interest type | ₩ | 22,436 | ₩ | 90,447 | ₩ | 26,234 | ₩ | 65,721 | ₩ | 575,938 | ₩ | 780,776 | ||||||||||||
| Variable interest type | 480,248 | 2,178,620 | 924,254 | 991,874 | 17,517,632 | 22,092,628 | ||||||||||||||||||
| 502,684 | 2,269,067 | 950,488 | 1,057,595 | 18,093,570 | 22,873,404 | |||||||||||||||||||
| Annuity: | ||||||||||||||||||||||||
| Fixed interest type | 39 | 992 | 1,935 | 3,700 | 398 | 7,064 | ||||||||||||||||||
| Variable interest type | 296 | 114,980 | 416,820 | 1,325,911 | 2,050,230 | 3,908,237 | ||||||||||||||||||
| 335 | 115,972 | 418,755 | 1,329,611 | 2,050,628 | 3,915,301 | |||||||||||||||||||
| Total: | ||||||||||||||||||||||||
| Fixed interest type | 22,475 | 91,439 | 28,169 | 69,421 | 576,336 | 787,840 | ||||||||||||||||||
| Variable interest type | 480,544 | 2,293,600 | 1,341,074 | 2,317,785 | 19,567,862 | 26,000,865 | ||||||||||||||||||
| ₩ | 503,019 | ₩ | 2,385,039 | ₩ | 1,369,243 | ₩ | 2,387,206 | ₩ | 20,144,198 | ₩ | 26,788,705 | |||||||||||||
| * | Includes long-term investment contracts liabilities classified as investment contracts amounting to ₩31,081 million and ₩9,934 million, as of December 31, 2021 and 2022, respectively. |
Reinsurance company | Ratio | Credit rating | ||||||
| KOREAN RE | 29.82 | % | AA | |||||
| MUNICH RE | 8.53 | % | AAA | |||||
| HISCOX | 5.44 | % | AA+ | |||||
December 31, 2021 | December 31, 2022 | |||||||
(In millions of Korean won) | ||||||||
Reinsurance assets 1 | ₩ | 1,342,615 | ₩ | 1,332,088 | ||||
Receivables from reinsurers 2 | 377,619 | 396,292 | ||||||
| ₩ | 1,720,234 | ₩ | 1,728,380 | |||||
| 1 | Net carrying amount after impairment losses |
| 2 | Net carrying amount after allowances for credit losses |
December 31, 2021 | December 31, 2022 | |||||||
(In millions of Korean won) | ||||||||
Interest-bearing liabilities | ||||||||
| Fixed interest rate type | ₩ | 489,399 | ₩ | 520,250 | ||||
| Variable interest rate type | 24,246,760 | 24,802,062 | ||||||
| ₩ | 24,736,159 | ₩ | 25,322,312 | |||||
Interest-bearing assets | ||||||||
| Due from financial institutions measured at amortized cost and cash equivalents | ₩ | 81,806 | ₩ | 113,043 | ||||
| Financial assets at fair value through profit or loss | 3,863,978 | 5,076,615 | ||||||
| Financial assets at fair value through other comprehensive income | 4,488,443 | 5,000,002 | ||||||
| Securities measured at amortized cost | 8,514,272 | 8,373,125 | ||||||
| Loans measured at amortized cost | 6,433,839 | 6,506,787 | ||||||
| ₩ | 23,382,338 | ₩ | 25,069,572 | |||||
| (a) | In the decision-making process of launching a new product, the Group decides on ceding reinsurance. Subsequently, the Group selects the reinsurer through bidding, and decides whether to reinsure or not through agreements with the relevant departments, and final approval by executive of department in charge. |
| (b) | The reinsurance department analyzes the object of reinsurance, the maximum limit of reinsurance, and the loss ratio through consultation with the relevant departments. |
December 31, 2021 | December 31, 2022 | |||||||||||||||
Before reinsurance mitigation | After reinsurance mitigation | Before reinsurance mitigation | After reinsurance mitigation | |||||||||||||
(In millions of Korean won) | ||||||||||||||||
| Death | ₩ | 14,977 | ₩ | 11,976 | ₩ | 16,025 | ₩ | 4,462 | ||||||||
| Disability | 586 | 296 | 526 | 412 | ||||||||||||
| Hospitalization | 1,124 | 730 | 1,040 | 399 | ||||||||||||
| Operation and diagnosis | 5,088 | 1,110 | 5,927 | 4,929 | ||||||||||||
| Actual medical expense | 1,194 | 262 | 1,310 | 1,200 | ||||||||||||
| Others | 972 | 316 | 943 | 765 | ||||||||||||
| ₩ | 23,941 | ₩ | 14,690 | ₩ | 25,771 | ₩ | 12,167 | |||||||||
December 31, 2021 | December 31, 2022 | |||||||||||||||
Policyholders’ reserve * | Guarantee reserve | Policyholders’ reserve * | Guarantee reserve | |||||||||||||
(In millions of Korean won) | ||||||||||||||||
| Variable annuity | ₩ | 611,283 | ₩ | 3,014 | ₩ | 626,542 | ₩ | 3,532 | ||||||||
| Variable universal | 78,689 | 2,768 | 66,057 | 2,627 | ||||||||||||
| Variable saving | 556,196 | 393 | 519,893 | 365 | ||||||||||||
| ₩ | 1,246,168 | ₩ | 6,175 | ₩ | 1,212,492 | ₩ | 6,524 | |||||||||
| * | Excludes the amount of the lapsed insurance reserve. |
December 31, 2021 | ||||||||||||||||||||||||||||
Up to 3 years | 3-5 years | 5-10 years | 10-15 years | 15-20 years | Over 20 years | Total | ||||||||||||||||||||||
(In millions of Korean won) | ||||||||||||||||||||||||||||
| Premium reserve | ₩ | 651,638 | ₩ | 285,623 | ₩ | 578,102 | ₩ | 386,515 | ₩ | 545,270 | ₩ | 5,403,252 | ₩ | 7,850,400 | ||||||||||||||
| Unearned premium reserve | 156 | — | 24 | — | — | 5,763 | 5,943 | |||||||||||||||||||||
December 31, 2022 | ||||||||||||||||||||||||||||
Up to 3 years | 3-5 years | 5-10 years | 10-15 years | 15-20 years | Over 20 years | Total | ||||||||||||||||||||||
(In millions of Korean won) | ||||||||||||||||||||||||||||
| Premium reserve | ₩ | 411,197 | ₩ | 243,863 | ₩ | 749,678 | ₩ | 336,597 | ₩ | 492,547 | ₩ | 5,200,432 | ₩ | 7,434,314 | ||||||||||||||
| Unearned premium reserve | 168 | 1 | 21 | — | 2 | 4,048 | 4,240 | |||||||||||||||||||||
December 31, 2021 | ||||||||||||||||||||
Assumption change | Effect on | |||||||||||||||||||
Base amount of LAT | Insurance liabilities | Profit before tax | Equity | |||||||||||||||||
(In millions of Korean won) | ||||||||||||||||||||
| Lapse ratio | +10 | % | ₩ | 82,811 | ₩ | — | ₩ | — | ₩ | — | ||||||||||
| Claim ratio | +10 | % | 50,899 | — | — | — | ||||||||||||||
| Expense ratio | +10 | % | 53,511 | — | — | — | ||||||||||||||
| Discount rate | -0.5 | %p | 482,638 | — | — | — | ||||||||||||||
December 31, 2022 | ||||||||||||||||||||
Assumption change | Effect on | |||||||||||||||||||
Base amount of LAT | Insurance liabilities | Profit before tax | Equity | |||||||||||||||||
(In millions of Korean won) | ||||||||||||||||||||
| Lapse ratio | +10 | % | ₩ | 121,800 | ₩ | — | ₩ | — | ₩ | — | ||||||||||
| Claim ratio | +10 | % | 60,023 | — | — | — | ||||||||||||||
| Expense ratio | +10 | % | 49,380 | — | — | — | ||||||||||||||
| Discount rate | -0.5 | %p | 417,625 | — | — | — | ||||||||||||||
December 31, 2021 | December 31, 2022 | |||||||||||||||
Before reinsurance mitigation | After reinsurance mitigation | Before reinsurance mitigation | After reinsurance mitigation | |||||||||||||
(In millions of Korean won) | ||||||||||||||||
| Death | ₩ | 253,325 | ₩ | 250,045 | ₩ | 273,801 | ₩ | 270,623 | ||||||||
| Disability | 10,331 | 10,230 | 10,220 | 10,199 | ||||||||||||
| Hospitalization | 34,194 | 34,194 | 35,067 | 35,067 | ||||||||||||
| Operation and diagnosis | 81,429 | 79,850 | 84,937 | 83,261 | ||||||||||||
| ₩ | 379,279 | ₩ | 374,319 | ₩ | 404,025 | ₩ | 399,150 | |||||||||
2021 | 2022 | |||||||||||||||
Ceded reinsurance premium | Proportion (%) | Ceded reinsurance premium | Proportion (%) | |||||||||||||
(In millions of Korean won) | ||||||||||||||||
| AA- or higher | ₩ | 5,223 | 100.00 | ₩ | 4,535 | 100.00 | ||||||||||
| A+ ~ A- | — | — | — | — | ||||||||||||
| BBB+ or lower | — | — | — | — | ||||||||||||
| Others | — | — | — | — | ||||||||||||
| ₩ | 5,223 | 100.00 | ₩ | 4,535 | 100.00 | |||||||||||
December 31, 2021 | ||||||||||||||||||||||||||||
Up to 3 years | 3-5 years | 5-10 years | 10-15 years | 15-20 years | Over 20 years | Total | ||||||||||||||||||||||
(In millions of Korean won) | ||||||||||||||||||||||||||||
Premium reserve | ₩ | 39,578 | ₩ | 40,894 | ₩ | 154,062 | ₩ | 237,021 | ₩ | 528,373 | ₩ | 13,122,197 | ₩ | 14,122,125 | ||||||||||||||
Unearned premium reserve | 31 | 15 | 50 | 51 | 65 | 4,092 | 4,304 | |||||||||||||||||||||
December 31, 2022 | ||||||||||||||||||||||||||||
Up to 3 years | 3-5 years | 5-10 years | 10-15 years | 15-20 years | Over 20 years | Total | ||||||||||||||||||||||
(In millions of Korean won) | ||||||||||||||||||||||||||||
Premium reserve | ₩ | 42,775 | ₩ | 40,755 | ₩ | 168,133 | ₩ | 265,998 | ₩ | 639,920 | ₩ | 13,909,732 | ₩ | 15,067,313 | ||||||||||||||
Unearned premium reserve | 30 | 13 | 46 | 41 | 56 | 3,636 | 3,822 | |||||||||||||||||||||
December 31, 2021 | ||||||||||||||||||||
Assumption change | Effect on | |||||||||||||||||||
Base amount of LAT | Insurance liabilities | Profit before tax | Equity | |||||||||||||||||
(In millions of Korean won) | ||||||||||||||||||||
Lapse ratio | +10 | % | ₩ | 114,427 | ₩ | — | ₩ | — | ₩ | — | ||||||||||
Claim ratio | +10 | % | 571,446 | — | — | — | ||||||||||||||
Expense ratio | +10 | % | 157,924 | — | — | — | ||||||||||||||
Discount rate | -0.5 | %p | 1,563,571 | — | — | — | ||||||||||||||
December 31, 2022 | ||||||||||||||||||||
Assumption change | Effect on | |||||||||||||||||||
Base amount of LAT | Insurance liabilities | Profit before tax | Equity | |||||||||||||||||
(In millions of Korean won) | ||||||||||||||||||||
Lapse ratio | +10 | % | ₩ | 212,126 | ₩ | — | ₩ | — | ₩ | — | ||||||||||
Claim ratio | +10 | % | 468,779 | — | — | — | ||||||||||||||
Expense ratio | +10 | % | 125,063 | — | — | — | ||||||||||||||
Discount rate | -0.5 | %p | 1,106,606 | — | — | — | ||||||||||||||
December 31, 2021 | December 31, 2022 | |||||||
(In millions of Korean won) | ||||||||
Financial assets at fair value through profit or loss: | ||||||||
Due from financial institutions | ₩ | 80,179 | ₩ | 69,469 | ||||
Debt securities | 8,023,999 | 8,806,018 | ||||||
Equity securities | 239,426 | 60,611 | ||||||
| ₩ | 8,343,604 | ₩ | 8,936,098 | |||||
2021 | 2022 | |||||||
(In millions of Korean won) | ||||||||
Beginning | ₩ | 339,202 | ₩ | 459,484 | ||||
Recognition of other comprehensive income due to acquisition and valuation | 185,906 | (381,037 | ) | |||||
Reclassification to profit or loss due to disposal | (65,624 | ) | (59,092 | ) | ||||
Ending | ₩ | 459,484 | ₩ | 19,355 | ||||
December 31, 2021 | December 31, 2022 | |||||||
(In millions of Korean won) | ||||||||
Cash | ₩ | 2,496,941 | ₩ | 2,439,490 | ||||
Checks issued by other banks | 150,047 | 123,163 | ||||||
Due from the Bank of Korea | 17,579,643 | 17,520,636 | ||||||
Due from other financial institutions | 10,782,743 | 11,980,132 | ||||||
| 31,009,374 | 32,063,421 | |||||||
Due from financial institutions measured at fair value through profit or loss | 200,743 | 69,469 | ||||||
| 31,210,117 | 32,132,890 | |||||||
Deduction: | ||||||||
Restricted due from financial institutions* | (4,589,893 | ) | (4,809,759 | ) | ||||
Due from financial institutions with original maturities over three months | (1,346,951 | ) | (1,160,607 | ) | ||||
| (5,936,844 | ) | (5,970,366 | ) | |||||
| ₩ | 25,273,273 | ₩ | 26,162,524 | |||||
| * | Items meeting the definition of cash are excluded in accordance with IAS No.7 Statement of Cash Flows. Detailed information on the effects of this change in accounting policy is described in Note 2.1 Application of IFRS. |
Financial institutions | December 31, 2021 | December 31, 2022 | ||||||||||
(In millions of Korean won) | ||||||||||||
| Due from financial institutions in Korean won | Due from the Bank of Korea | The Bank of Korea | ₩ | 15,117,033 | ₩ | 15,169,703 | ||||||
| Due from others | Korea Development Bank and others | 37,914 | 39,358 | |||||||||
| Due from financial institutions in foreign currencies | Due from banks in foreign currencies | Bank Indonesia and others | 1,009,866 | 1,218,847 | ||||||||
| ₩ | 16,164,813 | ₩ | 16,427,908 | |||||||||
2020 | 2021 | 2022 | ||||||||||
(In millions of Korean won) | ||||||||||||
| Write-offs of loans | ₩ | 1,283,071 | ₩ | 1,086,296 | ₩ | 1,486,357 | ||||||
| Changes in financial investments due to debt-for-equity swap | 13,820 | 327 | — | |||||||||
| Changes in accumulated other comprehensive income from valuation of financial instruments at fair value through other comprehensive income | 496,159 | 507,175 | (2,522,854 | ) | ||||||||
| Changes in accumulated other comprehensive income from valuation of investments in associates | (6,978 | ) | 165 | (64 | ) | |||||||
| Reclassification to assets of a disposal group held for sale | — | 171,749 | — | |||||||||
Activities | 2020 | 2021 | 2022 | |||||||||||||
(In millions of Korean won) | ||||||||||||||||
| Income tax paid | Operating | ₩ | 1,119,252 | ₩ | 1,586,750 | ₩ | 1,524,025 | |||||||||
| Interest received | Operating | 14,986,532 | 15,152,796 | 20,509,411 | ||||||||||||
| Interest paid | Operating | 5,266,158 | 4,062,469 | 6,356,211 | ||||||||||||
| Dividends received | Operating | 187,699 | 290,089 | 388,030 | ||||||||||||
| Dividends paid | Financing | 883,952 | 1,053,416 | 1,564,153 | ||||||||||||
2021 | ||||||||||||||||||||||||||||||||
Non-cash changes | ||||||||||||||||||||||||||||||||
Beginning | Net cash flows | Acquisition (disposal) | Exchange differences | Changes in fair value | Subsidiaries | Others | Ending | |||||||||||||||||||||||||
(In millions of Korean won) | ||||||||||||||||||||||||||||||||
| Derivatives held for hedging * | ₩ | (57,196 | ) | ₩ | 5,870 | ₩ | — | ₩ | 246,352 | ₩ | (70,225 | ) | ₩ | — | ₩ | (150,084 | ) | ₩ | (25,283 | ) | ||||||||||||
| Borrowings and debentures | 112,587,843 | 11,579,036 | — | 630,913 | (115,440 | ) | (329,512 | ) | (10,278 | ) | 124,342,562 | |||||||||||||||||||||
| Due to trust accounts | 7,542,955 | (509,106 | ) | — | — | — | — | — | 7,033,849 | |||||||||||||||||||||||
| Non-controlling interests | 857,783 | (24,145 | ) | — | — | — | 1,994 | (2,294 | ) | 833,338 | ||||||||||||||||||||||
| Others | 1,019,075 | (319,074 | ) | 166,336 | 119 | — | — | 119,398 | 985,854 | |||||||||||||||||||||||
| ₩ | 121,950,460 | ₩ | 10,732,581 | ₩ | 166,336 | ₩ | 877,384 | ₩ | (185,665 | ) | ₩ | (327,518 | ) | ₩ | (43,258 | ) | ₩ | 133,170,320 | ||||||||||||||
2022 | ||||||||||||||||||||||||||||||||
Non-cash changes | ||||||||||||||||||||||||||||||||
Beginning | Net cash flows | Acquisition (disposal) | Exchange differences | Changes in fair value | Subsidiaries | Others | Ending | |||||||||||||||||||||||||
(In millions of Korean won) | ||||||||||||||||||||||||||||||||
| Derivatives held for hedging * | ₩ | (25,283 | ) | ₩ | 33,402 | ₩ | — | ₩ | 153,646 | ₩ | 8,730 | ₩ | — | ₩ | (180,415 | ) | ₩ | (9,920 | ) | |||||||||||||
| Borrowings and debentures | 124,342,562 | 15,645,750 | — | 895,758 | (297,468 | ) | 81,268 | (252,302 | ) | 140,415,568 | ||||||||||||||||||||||
| Due to trust accounts | 7,033,849 | (1,225,402 | ) | — | — | — | — | — | 5,808,447 | |||||||||||||||||||||||
| Non-controlling interests | 833,338 | 395,713 | — | — | — | 752 | 50,300 | 1,280,103 | ||||||||||||||||||||||||
| Others | 985,854 | 436,903 | 154,004 | 199 | — | — | 118,863 | 1,695,823 | ||||||||||||||||||||||||
| ₩ | 133,170,320 | ₩ | 15,286,366 | ₩ | 154,004 | ₩ | 1,049,603 | ₩ | (288,738 | ) | ₩ | 82,020 | ₩ | (263,554 | ) | ₩ | 149,190,021 | |||||||||||||||
| * | Derivatives held for hedging purposes are the net amount after offsetting liabilities and assets. |
December 31, 2021 | December 31, 2022 | |||||||
(In millions of Korean won) | ||||||||
Confirmed acceptances and guarantees | ||||||||
| Confirmed acceptances and guarantees in Korean won: | ||||||||
| Acceptances and guarantees for KB purchasing loan | ₩ | 136,914 | ₩ | 167,538 | ||||
| Others | 817,470 | 918,670 | ||||||
| 954,384 | 1,086,208 | |||||||
| Confirmed acceptances and guarantees in foreign currencies: | ||||||||
| Acceptances of letter of credit | 523,037 | 502,217 | ||||||
| Letter of guarantees | 83,089 | 78,414 | ||||||
| Bid bond | 18,874 | 19,998 | ||||||
| Performance bond | 855,247 | 976,008 | ||||||
| Refund guarantees | 874,173 | 1,705,796 | ||||||
| Others | 2,505,353 | 3,485,842 | ||||||
| 4,859,773 | 6,768,275 | |||||||
| Financial guarantee contracts: | ||||||||
| Acceptances and guarantees for issuance of debentures | 5,040 | 5,040 | ||||||
| Acceptances and guarantees for mortgage | 51,053 | 94,861 | ||||||
| Overseas debt guarantees | 428,109 | 509,157 | ||||||
| International financing guarantees in foreign currencies | 132,114 | 181,241 | ||||||
| Others | 50,950 | — | ||||||
| 667,266 | 790,299 | |||||||
| 6,481,423 | 8,644,782 | |||||||
Unconfirmed acceptances and guarantees | ||||||||
| Guarantees of letter of credit | 3,551,767 | 3,042,911 | ||||||
| Refund guarantees | 833,765 | 1,528,359 | ||||||
| 4,385,532 | 4,571,270 | |||||||
| ₩ | 10,866,955 | ₩ | 13,216,052 | |||||
December 31, 2021 | ||||||||||||||||
12-month expected credit losses | Lifetime expected credit losses | Total | ||||||||||||||
Non-impaired | Impaired | |||||||||||||||
(In millions of Korean won) | ||||||||||||||||
Confirmed acceptances and guarantees | ||||||||||||||||
| Grade 1 | ₩ | 4,532,747 | ₩ | 838 | ₩ | — | ₩ | 4,533,585 | ||||||||
| Grade 2 | 1,594,714 | 32,567 | — | 1,627,281 | ||||||||||||
| Grade 3 | 105,691 | 46,174 | — | 151,865 | ||||||||||||
| Grade 4 | 7,722 | 149,785 | 214 | 157,721 | ||||||||||||
| Grade 5 | — | 774 | 10,197 | 10,971 | ||||||||||||
| 6,240,874 | 230,138 | 10,411 | 6,481,423 | |||||||||||||
Unconfirmed acceptances and guarantees | ||||||||||||||||
| Grade 1 | 3,083,636 | 3,391 | — | 3,087,027 | ||||||||||||
| Grade 2 | 998,204 | 39,224 | — | 1,037,428 | ||||||||||||
| Grade 3 | 12,039 | 34,797 | — | 46,836 | ||||||||||||
| Grade 4 | 11,925 | 195,794 | — | 207,719 | ||||||||||||
| Grade 5 | — | 138 | 6,384 | 6,522 | ||||||||||||
| 4,105,804 | 273,344 | 6,384 | 4,385,532 | |||||||||||||
| ₩ | 10,346,678 | ₩ | 503,482 | ₩ | 16,795 | ₩ | 10,866,955 | |||||||||
December 31, 2022 | ||||||||||||||||
12-month expected credit losses | Lifetime expected credit losses | Total | ||||||||||||||
Non-impaired | Impaired | |||||||||||||||
(In millions of Korean won) | ||||||||||||||||
Confirmed acceptances and guarantees | ||||||||||||||||
| Grade 1 | ₩ | 5,939,025 | ₩ | 1,140 | ₩ | — | ₩ | 5,940,165 | ||||||||
| Grade 2 | 1,882,080 | 10,474 | — | 1,892,554 | ||||||||||||
| Grade 3 | 494,924 | 18,649 | — | 513,573 | ||||||||||||
| Grade 4 | 63,689 | 215,382 | 442 | 279,513 | ||||||||||||
| Grade 5 | — | 4,130 | 14,847 | 18,977 | ||||||||||||
| 8,379,718 | 249,775 | 15,289 | 8,644,782 | |||||||||||||
Unconfirmed acceptances and guarantees | ||||||||||||||||
| Grade 1 | 3,232,325 | 844 | — | 3,233,169 | ||||||||||||
| Grade 2 | 1,040,908 | 36,879 | — | 1,077,787 | ||||||||||||
| Grade 3 | 4,685 | 13,308 | — | 17,993 | ||||||||||||
| Grade 4 | 1,265 | 236,687 | 5 | 237,957 | ||||||||||||
| Grade 5 | — | 199 | 4,165 | 4,364 | ||||||||||||
| 4,279,183 | 287,917 | 4,170 | 4,571,270 | |||||||||||||
| ₩ | 12,658,901 | ₩ | 537,692 | ₩ | 19,459 | ₩ | 13,216,052 | |||||||||
December 31, 2021 | ||||||||||||||||
Confirmed guarantees | Unconfirmed guarantees | Total | Proportion (%) | |||||||||||||
(In millions of Korean won) | ||||||||||||||||
| Large companies | ₩ | 5,431,921 | ₩ | 3,377,150 | ₩ | 8,809,071 | 81.06 | |||||||||
| Small and medium-sized companies | 820,327 | 657,073 | 1,477,400 | 13.60 | ||||||||||||
| Public sector and others | 229,175 | 351,309 | 580,484 | 5.34 | ||||||||||||
| ₩ | 6,481,423 | ₩ | 4,385,532 | ₩ | 10,866,955 | 100.00 | ||||||||||
December 31, 2022 | ||||||||||||||||
Confirmed guarantees | Unconfirmed guarantees | Total | Proportion (%) | |||||||||||||
(In millions of Korean won) | ||||||||||||||||
| Large companies | ₩ | 7,530,546 | ₩ | 3,810,565 | ₩ | 11,341,111 | 85.81 | |||||||||
| Small and medium-sized companies | 718,722 | 496,709 | 1,215,431 | 9.20 | ||||||||||||
| Public sector and others | 395,514 | 263,996 | 659,510 | 4.99 | ||||||||||||
| ₩ | 8,644,782 | ₩ | 4,571,270 | ₩ | 13,216,052 | 100.00 | ||||||||||
December 31, 2021 | ||||||||||||||||
Confirmed guarantees | Unconfirmed guarantees | Total | Proportion (%) | |||||||||||||
(In millions of Korean won) | ||||||||||||||||
| Financial institutions | ₩ | 385,761 | ₩ | 10,114 | ₩ | 395,875 | 3.64 | |||||||||
| Manufacturing | 2,742,224 | 2,979,232 | 5,721,456 | 52.65 | ||||||||||||
| Service | 676,440 | 38,920 | 715,360 | 6.58 | ||||||||||||
| Wholesale and retail | 1,603,085 | 999,416 | 2,602,501 | 23.95 | ||||||||||||
| Construction | 317,946 | 38,260 | 356,206 | 3.28 | ||||||||||||
| Public sector | 28,257 | 99,841 | 128,098 | 1.18 | ||||||||||||
| Others | 727,710 | 219,749 | 947,459 | 8.72 | ||||||||||||
| ₩ | 6,481,423 | ₩ | 4,385,532 | ₩ | 10,866,955 | 100.00 | ||||||||||
December 31, 2022 | ||||||||||||||||
Confirmed guarantees | Unconfirmed guarantees | Total | Proportion (%) | |||||||||||||
(In millions of Korean won) | ||||||||||||||||
| Financial institutions | ₩ | 462,657 | ₩ | 2,012 | ₩ | 464,669 | 3.52 | |||||||||
| Manufacturing | 3,851,832 | 3,589,948 | 7,441,780 | 56.31 | ||||||||||||
| Service | 751,846 | 31,465 | 783,311 | 5.93 | ||||||||||||
| Wholesale and retail | 2,181,469 | 658,875 | 2,840,344 | 21.49 | ||||||||||||
| Construction | 420,937 | 47,465 | 468,402 | 3.54 | ||||||||||||
| Public sector | 32,635 | 81,607 | 114,242 | 0.86 | ||||||||||||
| Others | 943,406 | 159,898 | 1,103,304 | 8.35 | ||||||||||||
| ₩ | 8,644,782 | ₩ | 4,571,270 | ₩ | 13,216,052 | 100.00 | ||||||||||
December 31, 2021 | December 31, 2022 | |||||||
(In millions of Korean won) | ||||||||
Commitments | ||||||||
| Corporate loan commitments | ₩ | 45,767,502 | ₩ | 51,743,718 | ||||
| Retail loan commitments | 47,080,416 | 51,241,471 | ||||||
| Credit line of credit cards | 70,534,719 | 77,825,953 | ||||||
| Purchase of other securities | 6,835,506 | 7,357,198 | ||||||
| 170,218,143 | 188,168,340 | |||||||
Financial guarantee contracts | ||||||||
| Credit line | 5,729,798 | 7,135,542 | ||||||
| Purchase of securities | 495,400 | 371,201 | ||||||
| 6,225,198 | 7,506,743 | |||||||
| ₩ | 176,443,341 | ₩ | 195,675,083 | |||||
Company | Lawsuits | No. of cases | Amount | Description of the lawsuits | Status of the lawsuits | |||||||||
| Kookmin Bank | Request for a return of redemption amount | 1 | ₩ | 53,239 | Kookmin Bank invested the assets entrusted by OO Asset Management and OO Investment Trust Management in the Fairfield Sentry Limited, and Fairfield Sentry Limited reinvested the assets in Bernard L. Madoff Investment Securities LLC managed by Bernard Madoff (Bernard L. Madoff Investment Securities LLC is in the liquidation process due to Ponzi scheme fraud-related losses). Bankruptcy trustee of Bernard L. Madoff Investment Securities LLC filed a lawsuit against Kookmin Bank seeking to return the amount of redemptions received by Kookmin Bank through Fairfield Sentry Limited. | Application for dismissal by the defendant has been denied, and further proceedings are scheduled. [Related litigation is in progress at the New York Southern District Federal Bankruptcy Court (10-3777) at the written complaint review stage] | ||||||||
Company | Lawsuits | No. of cases | Amount | Description of the lawsuits | Status of the lawsuits | |||||||||
| Confirm the absence of debt | 1 | 96,200 | Galamat-Art LLP is a joint guarantor of the PF loan for the ‘Kazakhstan Almaty City Complex Development Project’ in which Kookmin Bank Co., Ltd. participated as a lender. OO Bank, the agent bank of the lending group, filed a provisional seizure and a lawsuit on the merits of the guarantee debt to the local court against Galamat-Art LLP. And Galamat-Art LLP filed a counterclaim against the lenders, including Kookmin Bank, to confirm the absence of debt denying the joint guarantee obligation. | Kookmin Bank won the case in the first and second trials, but the second trial is scheduled to be re-run as the registered shareholders of the Plaintiff filed an objection. | ||||||||||
| Expropriation of long-term leasehold rights | 1 | 316,825 | Kookmin Bank invested assets entrusted by DAOL Asset Management Co., Ltd. in loans that are directly or indirectly collateralized by the building and land leasehold rights (hereinafter referred to as “the real estate in this case”) of Union Station in Washington, D.C., the United States. The Plaintiff, who is the operator of the railway facility, filed this lawsuit against those concerned with the real estate in this case, including Kookmin Bank, to expropriate the real estate in this case and determine indemnity. | Kookmin Bank submitted the response letter and will proceed with the process in the future. | ||||||||||
| KB Securities Co., Ltd. | Request for a return of transaction amount (Australian fund) | 1 | 37,468 | The plaintiffs OOOO Securities and OOOO Life Insurance filed lawsuits, claiming that the KB Securities Co., Ltd. provided false information on major matters in the product description while selling JB Australia NDIS Private Fund No.1 (on April 25, 2019, plaintiffs invested ₩50 billion each) (a) (Primary claim) requesting KB Securities Co., Ltd. to return unjust enrichment of ₩100 billion for cancelation of sales contracts of beneficiary certificates due to an error or termination of the contract due to default, (b) (Secondary claim) requesting for compensation for damages in investments amounting to ₩100 billion due to violation of the investor protection obligation and fraudulent transactions of KB Securities Co., Ltd. and OOO Asset Management. The Plaintiff’s complaint price was changed to ₩37.47 billion due to the Plaintiff’s request to change the purpose and cause of the claim on October 11, 2022. | First trial is in progress (the pleading resumption has been decided on February 6, 2023, and the 9th pleading is scheduled on April 11, 2023.). | |||||||||
Investor | Investee | Ownership (%) | Location | Date of financial statements | Industry | |||||||
| KB Financial Group Inc. | Kookmin Bank | 100.00 | Korea | Dec. 31 | Banking and foreign exchange transaction | |||||||
| KB Securities Co., Ltd. | 100.00 | Korea | Dec. 31 | Financial investment | ||||||||
| KB Insurance Co., Ltd. | 100.00 | Korea | Dec. 31 | Non-life insurance | ||||||||
| KB Kookmin Card Co., Ltd. | 100.00 | Korea | Dec. 31 | Credit card and installment financing | ||||||||
| KB Life Insurance Co., Ltd.(former Prudential Life Insurance Company of Korea Ltd.) | 100.00 | Korea | Dec. 31 | Life insurance | ||||||||
| KB Asset Management Co., Ltd. | 100.00 | Korea | Dec. 31 | Collective investment and advisory | ||||||||
| KB Capital Co., Ltd. | 100.00 | Korea | Dec. 31 | Financial Leasing | ||||||||
| KB Life Insurance Co., Ltd. | 100.00 | Korea | Dec. 31 | Life insurance | ||||||||
| KB Real Estate Trust Co., Ltd. | 100.00 | Korea | Dec. 31 | Real estate trust management | ||||||||
| KB Savings Bank Co., Ltd. | 100.00 | Korea | Dec. 31 | Savings banking | ||||||||
| KB Investment Co., Ltd. | 100.00 | Korea | Dec. 31 | Capital investment | ||||||||
| KB Data System Co., Ltd. | 100.00 | Korea | Dec. 31 | Software advisory, development, and supply | ||||||||
| KB Credit Information Co., Ltd. | 100.00 | Korea | Dec. 31 | Collection of receivables or credit investigation | ||||||||
| Kookmin Bank | Kookmin Bank Cambodia Plc. | 100.00 | Cambodia | Dec. 31 | Banking and foreign exchange transaction | |||||||
| Kookmin Bank (China) Ltd. | 100.00 | China | Dec. 31 | Banking and foreign exchange transaction | ||||||||
| KB Microfinance Myanmar Co., Ltd. | 100.00 | Myanmar | Dec. 31 | Microfinance services | ||||||||
| PRASAC Microfinance Institution Plc. | 100.00 | Cambodia | Dec. 31 | Microfinance services | ||||||||
| PT Bank KB Bukopin Tbk | 67.00 | Indonesia | Dec. 31 | Banking and foreign exchange transaction | ||||||||
| Kookmin Bank | PT Bank Syariah Bukopin | 92.78 | Indonesia | Dec. 31 | Banking | |||||||
| PT Bukopin Finance | 97.03 | Indonesia | Dec. 31 | Installment financing | ||||||||
| KB Bank Myanmar Co., Ltd. | 100.00 | Myanmar | Dec. 31 | Banking and foreign exchange transaction | ||||||||
| KB Securities Co., Ltd. | KBFG Securities America Inc. | 100.00 | United States | Dec. 31 | Investment advisory and securities trading | |||||||
| KB Securities Hong Kong Ltd. | 100.00 | China | Dec. 31 | Investment advisory and securities trading | ||||||||
| KB Securities Vietnam Joint Stock Company | 99.81 | Vietnam | Dec. 31 | Investment advisory and securities trading | ||||||||
| KB FINA Joint Stock Company | 77.82 | Vietnam | Dec. 31 | Investment advisory and securities trading | ||||||||
| PT KB VALBURY SEKURITAS | 65.00 | Indonesia | Dec. 31 | Investment advisory and securities trading | ||||||||
| PT.KB Valbury Capital Management | 79.00 | Indonesia | Dec. 31 | Financial investment | ||||||||
| KB Insurance Co., Ltd. | Leading Insurance Services, Inc. | 100.00 | United States | Dec. 31 | Management service | |||||||
| KBFG Insurance (China) Co., Ltd. | 100.00 | China | Dec. 31 | Non-life insurance | ||||||||
| PT. KB Insurance Indonesia | 70.00 | Indonesia | Dec. 31 | Non-life insurance | ||||||||
| KB Claims Survey & Adjusting | 100.00 | Korea | Dec. 31 | Claim service | ||||||||
| KB Sonbo CNS | 100.00 | Korea | Dec. 31 | Management service | ||||||||
| KB Golden Life Care Co., Ltd. | 100.00 | Korea | Dec. 31 | Service | ||||||||
| KB Healthcare Co., Ltd. | 100.00 | Korea | Dec. 31 | Information and communication | ||||||||
Investor | Investee | Ownership (%) | Location | Date of financial statements | Industry | |||||||
KB Life Insurance Co., Ltd.(former Prudential Life Insurance Company of Korea Ltd.) | KB Life Partners Co., Ltd. | 100.00 | Korea | Dec. 31 | Insurance agent | |||||||
KB Kookmin Card Co., Ltd. | KB Daehan Specialized Bank Plc. | 95.71 | Cambodia | Dec. 31 | Auto Installment finance | |||||||
| PT. KB Finansia Multi Finance | 80.00 | Indonesia | Dec. 31 | Auto Installment finance | ||||||||
| KB J Capital Co., Ltd. | 50.99 | Thailand | Dec. 31 | Service | ||||||||
| i-Finance Leasing Plc. | 100.00 | Cambodia | Dec. 31 | Leasing | ||||||||
KB Capital Co., Ltd. | PT Sunindo Kookmin Best Finance | 85.00 | Indonesia | Dec. 31 | Auto Installment finance | |||||||
KB Kookmin Card Co., Ltd. KB Capital Co., Ltd. | KB KOLAO Leasing Co., Ltd. | 80.00 | Laos | Dec. 31 | Auto Installment finance | |||||||
Kookmin Bank, KB Data System Co., Ltd. | PT KB Data Systems Indonesia | 100.00 | Indonesia | Dec. 31 | Service | |||||||
KB Asset Management Co., Ltd. | KBAM Shanghai Advisory Services Co., Ltd. | 100.00 | China | Dec. 31 | General advisory | |||||||
| KB Asset Management Singapore PTE. LTD. | 100.00 | Singapore | Dec. 31 | Collective investment | ||||||||
Consolidated structured entities | Reasons for consolidation | |||
Trusts | Kookmin Bank (development trust) and 10 others | The Group controls the trust because it has power to determine management performance of the trust and is significantly exposed to variable returns that absorb losses through the guarantees of payment of principal, or payment of principal and fixed rate of return. | ||
Asset-backed securitization | Taejon Samho The First Co., Ltd. and 119 others | The Group controls these investees because it has power over relevant activities in the event of default, is significantly exposed to variable returns by providing lines of credit, ABCP purchase commitments or acquisition of subordinated debt and has ability to affect those returns through its power. | ||
Consolidated structured entities | Reasons for consolidation | |||
| Investment funds and others | KB Global Platform Fund and 204 others | Funds are consolidated if the Group, as a collective investor or operating manager (member), etc., can manage fund assets on behalf of other investors, or dismiss the collective investor and operating manager, and is substantially exposed to significant variable returns or has such rights. |
December 31, 2021 | 2021 | |||||||||||||||||||||||
Assets | Liabilities | Equity | Operating revenue 3 | Profit (loss) attributable to shareholders of the Parent Company | Total compre-hensive income (loss) attributable to shareholders of the Parent Company | |||||||||||||||||||
(In millions of Korean won) | ||||||||||||||||||||||||
Kookmin Bank 1 | ₩ | 483,564,898 | ₩ | 450,675,985 | ₩ | 32,888,913 | ₩ | 26,536,995 | ₩ | 2,590,764 | ₩ | 3,265,921 | ||||||||||||
KB Securities Co., Ltd. 1,2 | 55,493,985 | 50,008,422 | 5,485,563 | 8,543,590 | 594,301 | 628,112 | ||||||||||||||||||
KB Insurance Co., Ltd. 1,2 | 41,472,227 | 37,328,954 | 4,143,273 | 14,131,278 | 301,836 | 107,240 | ||||||||||||||||||
KB Kookmin Card Co., Ltd. 1 | 27,349,561 | 22,793,920 | 4,555,641 | 3,527,354 | 418,898 | 442,873 | ||||||||||||||||||
KB Life Insurance Co., Ltd.(former Prudential Life Insurance Company of Korea Ltd.) 2 | 26,287,116 | 23,992,601 | 2,294,515 | 1,976,122 | 336,198 | 54,587 | ||||||||||||||||||
KB Asset Management Co., Ltd. 1 | 375,739 | 128,589 | 247,150 | 254,162 | 79,899 | 79,071 | ||||||||||||||||||
KB Capital Co., Ltd. 1,2 | 14,529,427 | 12,707,210 | 1,822,217 | 1,634,759 | 209,899 | 209,719 | ||||||||||||||||||
| KB Life Insurance Co., Ltd. | 10,634,562 | 10,174,282 | 460,280 | 2,259,301 | (46,595 | ) | (121,847 | ) | ||||||||||||||||
| KB Real Estate Trust Co., Ltd. | 496,522 | 119,700 | 376,822 | 168,373 | 81,480 | 82,299 | ||||||||||||||||||
| KB Savings Bank Co., Ltd. | 2,601,134 | 2,339,037 | 262,097 | 150,028 | 18,932 | 22,526 | ||||||||||||||||||
KB Investment Co., Ltd. 1 | 1,197,720 | 922,239 | 275,481 | 207,367 | 55,338 | 55,340 | ||||||||||||||||||
KB Data System Co., Ltd. 1 | 44,486 | 25,911 | 18,575 | 174,819 | 467 | 1,105 | ||||||||||||||||||
| KB Credit Information Co., Ltd. | 28,674 | 12,303 | 16,371 | 39,909 | 388 | 434 | ||||||||||||||||||
December 31, 2022 | 2022 | |||||||||||||||||||||||
Assets | Liabilities | Equity | Operating revenue 3 | Profit (loss) attributable to shareholders of the Parent Company | Total compre-hensive income (loss) attributable to shareholders of the Parent Company | |||||||||||||||||||
(In millions of Korean won) | ||||||||||||||||||||||||
Kookmin Bank 1 | ₩ | 517,769,512 | ₩ | 484,046,253 | ₩ | 33,723,259 | ₩ | 49,436,046 | ₩ | 2,996,015 | ₩ | 1,856,632 | ||||||||||||
KB Securities Co., Ltd. 1,2 | 53,824,246 | 47,946,933 | 5,877,313 | 14,264,399 | 187,784 | 263,605 | ||||||||||||||||||
KB Insurance Co., Ltd. 1,2 | 42,736,747 | 39,397,167 | 3,339,580 | 14,959,264 | 557,680 | (820,382 | ) | |||||||||||||||||
KB Kookmin Card Co., Ltd. 1 | 29,721,017 | 24,998,215 | 4,722,802 | 3,694,352 | 378,592 | 412,208 | ||||||||||||||||||
KB Life Insurance Co., Ltd.(former Prudential Life Insurance Company of Korea Ltd.) 1,2 | 24,710,078 | 23,047,601 | 1,662,477 | 2,255,418 | 250,308 | (532,038 | ) | |||||||||||||||||
KB Asset Management Co., Ltd. 1 | 369,488 | 102,970 | 266,518 | 233,293 | 59,345 | 59,367 | ||||||||||||||||||
KB Capital Co., Ltd. 1,2 | 16,053,026 | 13,946,800 | 2,106,226 | 1,906,694 | 217,139 | 209,808 | ||||||||||||||||||
| KB Life Insurance Co., Ltd. | 10,136,909 | 10,050,292 | 86,617 | 2,907,001 | (64,045 | ) | (422,048 | ) | ||||||||||||||||
| KB Real Estate Trust Co., Ltd. | 518,980 | 113,444 | 405,536 | 152,686 | 67,723 | 68,714 | ||||||||||||||||||
| KB Savings Bank Co., Ltd. | 3,138,543 | 2,854,549 | 283,994 | 191,337 | 21,814 | 21,897 | ||||||||||||||||||
KB Investment Co., Ltd. 1 | 1,378,550 | 1,108,264 | 270,286 | 161,210 | 4,807 | 4,805 | ||||||||||||||||||
KB Data System Co., Ltd. 1 | 63,645 | 40,570 | 23,075 | 233,320 | 3,162 | 4,546 | ||||||||||||||||||
| KB Credit Information Co., Ltd. | 42,219 | 24,923 | 17,296 | 36,469 | 484 | 924 | ||||||||||||||||||
| 1 | Financial information is based on its consolidated financial statements. |
| 2 | Includes fair value adjustments arising from the acquisition. |
3 | Operating revenue consists of interest income, fee and commission income, insurance income and others. |
Company | Reasons of obtaining control | |||
| PT.KB VALBURY SEKURITAS and 30 others | Holds more than half of the ownership interests | |||
| New star Gimpo 4th Co., Ltd. and 55 others | Holds the power in the event of default and is exposed to significant variable returns by providing lines of credit, ABCP purchase commitments or acquisition of subordinated debt | |||
| KB Korea Short Term Premium Private Securities Fund No.25(USD)(Bond) and 34 others | Holds the power to determine the operation of the funds and is exposed to variable returns by holding significant amount of ownership interests | |||
| KB Tail End Fund and 11 others | Holds the power as a general partner and is exposed to variable returns by holding significant amount of ownership interests |
Company | Reasons of losing control | |||
| Able Pocheon 1st Co., Ltd. and 60 others | Termination of the commitments | |||
| KB Pre IPO Secondary Venture Fund No.2 and 21 others | Liquidation | |||
| 498 Seventh KOR Holdco LP and 3 other | Disposal | |||
| KB Global Digital-Chain Economy Securities Fund(Equity) and 9 others | Decrease in ownership interests to less than majority |
Nature | Purpose | Activity | Method of financing | |||
Structured financing | Granting PF loans to SOC and real estate Granting loans to ships/aircrafts SPC | Construction of SOC and real estate Building ships, construction and purchase of aircrafts | Loan commitments through credit line, providing credit line, and investment agreements | |||
Investment funds | Investment in beneficiary certificates Investment in PEF and partnerships | Management of fund assets Payment of fund fees and allocation of fund profits | Sales of beneficiary certificate instruments Investment from general partners and limited partners | |||
Trusts | Management of financial trusts; —Development trust —General unspecified money trust — Trust whose principal is not guaranteed —Other trusts | Management of trusted financial assets Payment of trust fees and allocation of trust profits. | Sales of trusted financial assets | |||
Asset-backed securitization | Early cash generation through transfer of securitized assets Fees earned through services to SPC, such as providing lines of credit and ABCP purchase commitments | Fulfillment of asset-backed securitization plan Purchase and collection of securitized assets Issuance and repayment of ABS and ABCP | Issuance of ABS and ABCP based on securitized assets | |||
December 31, 2021 | ||||||||||||||||||||
Structured financing | Investment funds | Trusts | Asset-backed securitization and others | Total | ||||||||||||||||
(In millions of Korean won) | ||||||||||||||||||||
| Total assets of unconsolidated structured entities | ₩ | 89,647,771 | ₩ | 416,401,893 | ₩ | 3,005,720 | ₩ | 144,897,727 | ₩ | 653,953,111 | ||||||||||
| Carrying amount in the financial statements | ||||||||||||||||||||
| Assets: | ||||||||||||||||||||
| Financial assets at fair value through profit or loss | ₩ | 126,086 | ₩ | 13,340,292 | ₩ | 90,348 | ₩ | 3,602,631 | ₩ | 17,159,357 | ||||||||||
| Derivative financial assets | — | — | — | 181 | 181 | |||||||||||||||
| Loans measured at amortized cost | 8,290,514 | 479,452 | 265,173 | 1,194,705 | 10,229,844 | |||||||||||||||
| Financial investments | — | — | — | 8,084,101 | 8,084,101 | |||||||||||||||
| Investments in associates | — | 292,315 | — | — | 292,315 | |||||||||||||||
| Other assets | 2,496 | 3,111 | 119,630 | 15,638 | 140,875 | |||||||||||||||
| ₩ | 8,419,096 | ₩ | 14,115,170 | ₩ | 475,151 | ₩ | 12,897,256 | ₩ | 35,906,673 | |||||||||||
| Liabilities: | ||||||||||||||||||||
| Deposits | ₩ | 650,834 | ₩ | 58,348 | ₩ | — | ₩ | 330,592 | ₩ | 1,039,774 | ||||||||||
| Derivative financial liabilities | — | — | — | 437 | 437 | |||||||||||||||
| Other liabilities | 8,196 | 289 | — | 32,179 | 40,664 | |||||||||||||||
| ₩ | 659,030 | ₩ | 58,637 | ₩ | — | ₩ | 363,208 | ₩ | 1,080,875 | |||||||||||
| Maximum exposure * | ||||||||||||||||||||
| Assets held | ₩ | 8,419,096 | ₩ | 14,115,170 | ₩ | 475,151 | ₩ | 12,897,256 | ₩ | 35,906,673 | ||||||||||
| Purchase and investment commitments | — | 6,131,739 | 131,102 | 499,682 | 6,762,523 | |||||||||||||||
| Unused credit | 855,322 | — | — | 4,990,797 | 5,846,119 | |||||||||||||||
| Acceptances and guarantees and loan commitments | 1,544,394 | — | 15,890 | 496,284 | 2,056,568 | |||||||||||||||
| ₩ | 10,818,812 | ₩ | 20,246,909 | ₩ | 622,143 | ₩ | 18,884,019 | ₩ | 50,571,883 | |||||||||||
| Methods of determining the maximum exposure | | Loan commitments / investment agreements / purchase commitments and acceptances and guarantees | | | Investments / loans and Investment agreements | | Trust paying dividends by results: Total amount of trust exposure | | | Providing credit lines/ purchase commitments/ loan commitments and acceptances and guarantees | | |||||||||
December 31, 2022 | ||||||||||||||||||||
Structured financing | Investment funds | Trusts | Asset-backed securitization and others | Total | ||||||||||||||||
(In millions of Korean won) | ||||||||||||||||||||
| Total assets of unconsolidated structured entities | ₩ | 110,862,054 | ₩ | 435,585,129 | ₩ | 5,516,039 | ₩ | 144,018,286 | ₩ | 695,981,508 | ||||||||||
| Carrying amount in the financial statements | ||||||||||||||||||||
Assets: | ||||||||||||||||||||
Financial assets at fair value through profit or loss | ₩ | 105,637 | ₩ | 12,963,303 | ₩ | 298,169 | ₩ | 3,566,948 | ₩ | 16,934,057 | ||||||||||
Loans measured at amortized cost | 8,829,758 | 469,777 | 163,220 | 3,037,021 | 12,499,776 | |||||||||||||||
Financial investments | 1,012 | — | — | 7,893,604 | 7,894,616 | |||||||||||||||
Investments in associates | — | 335,746 | — | — | 335,746 | |||||||||||||||
Other assets | 6,663 | 1,504 | 242,853 | 5,950 | 256,970 | |||||||||||||||
| ₩ | 8,943,070 | ₩ | 13,770,330 | ₩ | 704,242 | ₩ | 14,503,523 | ₩ | 37,921,165 | |||||||||||
Liabilities: | ||||||||||||||||||||
Deposits | ₩ | 1,596,011 | ₩ | 41,288 | ₩ | — | ₩ | 219,641 | ₩ | 1,856,940 | ||||||||||
Derivative financial liabilities | 437 | 2,102 | — | 698 | 3,237 | |||||||||||||||
Other liabilities | 3,044 | 11 | — | 54,425 | 57,480 | |||||||||||||||
| ₩ | 1,599,492 | ₩ | 43,401 | ₩ | — | ₩ | 274,764 | ₩ | 1,917,657 | |||||||||||
Maximum exposure * | ||||||||||||||||||||
Assets held | ₩ | 8,943,070 | ₩ | 13,770,330 | ₩ | 704,242 | ₩ | 14,503,523 | ₩ | 37,921,165 | ||||||||||
Purchase and investment commitments | 227,098 | 6,301,588 | 144,269 | 678,564 | 7,351,519 | |||||||||||||||
Unused credit | 1,380,348 | — | 8,547 | 6,161,171 | 7,550,066 | |||||||||||||||
Acceptances and guarantees and loan commitments | 1,015,619 | — | — | 20,000 | 1,035,619 | |||||||||||||||
| ₩ | 11,566,135 | ₩ | 20,071,918 | ₩ | 857,058 | ₩ | 21,363,258 | ₩ | 53,858,369 | |||||||||||
Methods of determining the maximum exposure | | Loan commitments / investment agreements / purchase commitments and acceptances and guarantees | | | Investments / loans and Investment agreements | | Trust paying dividends by results: Total amount of trust exposure | | | Providing credit lines/ purchase commitments/ loan commitments and acceptances and guarantees | | |||||||||
| * | Maximum exposure includes the asset amounts, after deducting loss (provisions for credit losses, impairment losses, and others), recognized in the consolidated financial statements of the Group. |
2020 | 2021 | 2022 | ||||||||||||
(In millions of Korean won) | ||||||||||||||
Associates and joint ventures | ||||||||||||||
Balhae Infrastructure Company | Fee and commission income | ₩ | 6,817 | ₩ | 5,689 | ₩ | 5,194 | |||||||
Korea Credit Bureau Co., Ltd. | Interest expense | 7 | 6 | 1 | ||||||||||
| Fee and commission income | 957 | 910 | 649 | |||||||||||
| Insurance income | 5 | 4 | 4 | |||||||||||
| Fee and commission expense | 3,280 | 4,256 | 3,973 | |||||||||||
Other operating expenses | 1 | 11 | 15 | |||||||||||
KB GwS Private Securities Investment Trust * | Fee and commission income | 853 | 146 | — | ||||||||||
Incheon Bridge Co., Ltd. | Interest income | 4,345 | 4,069 | 7,516 | ||||||||||
Interest expense | 334 | 158 | 517 | |||||||||||
Fee and commission income | 23 | 22 | 23 | |||||||||||
Fee and commission expense | 6 | 6 | 6 | |||||||||||
Insurance income | 279 | 230 | 212 | |||||||||||
Gains on financial instruments at fair value through profit or loss | 899 | — | — | |||||||||||
Losses on financial instruments at fair value through profit or loss | — | 1,374 | 4,434 | |||||||||||
| Reversal of credit losses | — | 444 | 28 | |||||||||||
| Provision for credit losses | 472 | 1 | 9 | |||||||||||
Kendai Co.,Ltd. | Other non-operating expenses | — | — | 3 | ||||||||||
KoFC POSCO Hanwha KB Shared Growth Private Equity Fund No.2 | Fee and commission income | 12 | — | — | ||||||||||
Aju Good Technology Venture Fund | Interest expense | 18 | 27 | 108 | ||||||||||
| KB Star Office Private Real Estate Master Fund No.1 * | Interest income | 371 | 370 | — | ||||||||||
| Interest expense | 61 | 5 | 2 | |||||||||||
| Fee and commission income | 436 | 435 | 276 | |||||||||||
RAND Bio Science Co., Ltd. | Interest expense | 11 | — | — | ||||||||||
Star-Lord General Investors Private Real Estate Investment Company No.10 | Insurance income | — | — | 97 | ||||||||||
| Interest income | — | — | 3,098 | |||||||||||
| Interest expense | — | — | 413 | |||||||||||
| Provision for credit losses | — | — | 1 | |||||||||||
| General and administrative expenses | — | — | 5,562 | |||||||||||
SY Auto Capital Co., Ltd. | Interest income | 1,097 | 941 | 889 | ||||||||||
| Interest expense | 2 | — | — | |||||||||||
| Fee and commission income | 39 | 88 | 47 | |||||||||||
| Fee and commission expense | 132 | 15 | 10 | |||||||||||
| Insurance income | 40 | 42 | 43 | |||||||||||
| Other operating income | 1,709 | 710 | 487 | |||||||||||
| Other operating expenses | 121 | 64 | 32 | |||||||||||
| Reversal of credit losses | 17 | 11 | — | |||||||||||
| Provision for credit losses | — | — | 9 | |||||||||||
2020 | 2021 | 2022 | ||||||||||||
(In millions of Korean won) | ||||||||||||||
Food Factory Co., Ltd. | Interest income | 52 | 70 | 80 | ||||||||||
| Interest expense | 12 | 5 | 6 | |||||||||||
| Insurance income | 5 | 9 | 10 | |||||||||||
| Fee and commission income | — | — | 1 | |||||||||||
| Fee and commission expense | 4 | 2 | — | |||||||||||
Gains on financial instruments at fair value through profit or loss | 72 | — | 33 | |||||||||||
Losses on financial instruments at fair value through profit or loss | — | 1 | — | |||||||||||
| Reversal of credit losses | — | 6 | 1 | |||||||||||
| Provision for credit losses | 8 | — | — | |||||||||||
| KB Pre IPO Secondary Venture Fund No.1 * | Interest expense | 3 | 1 | — | ||||||||||
| Fee and commission income | 110 | 110 | 1,204 | |||||||||||
KB Private Equity Fund No.3 * | Fee and commission income | 463 | — | — | ||||||||||
Acts Co., Ltd. | Interest income | 1 | — | — | ||||||||||
| Insurance income | — | 1 | 2 | |||||||||||
Dongjo Co., Ltd. | Insurance income | 1 | 1 | — | ||||||||||
| Interest income | — | — | 9 | |||||||||||
A-PRO Co., Ltd. * | Interest income | 7 | — | — | ||||||||||
| Interest expense | 1 | — | — | |||||||||||
| Insurance income | 1 | — | — | |||||||||||
| Provision for credit losses | 1 | — | — | |||||||||||
POSCO-KB Shipbuilding Fund | Fee and commission income | 387 | 213 | 177 | ||||||||||
Dae-A Leisure Co., Ltd. | Interest expense | 7 | 2 | ��� | ||||||||||
Paycoms Co., Ltd. | Interest income | 10 | 10 | 7 | ||||||||||
Gains on financial instruments at fair value through profit or loss | 69 | 42 | 39 | |||||||||||
Big Dipper Co., Ltd. | Interest expense | — | — | 1 | ||||||||||
| Fee and commission expense | 768 | 655 | 393 | |||||||||||
KB-KDBC Pre-IPO New Technology Business Investment Fund | Interest expense | 23 | 1 | 1 | ||||||||||
| Fee and commission income | 300 | 190 | 129 | |||||||||||
KB-TS Technology Venture Private Equity Fund | Fee and commission income | 126 | 285 | 185 | ||||||||||
KB-SJ Tourism Venture Fund | Fee and commission income | 338 | 279 | 209 | ||||||||||
Banksalad Co., Ltd. | Gains on financial instruments at fair value through profit or loss | 1,636 | 613 | — | ||||||||||
Losses on financial instruments at fair value through profit or loss | — | 663 | — | |||||||||||
| Fee and commission income | 36 | 36 | 36 | |||||||||||
| Fee and commission expense | 5 | 48 | 17 | |||||||||||
Iwon Alloy Co., Ltd. | Insurance income | 1 | — | 1 | ||||||||||
Bioprotect Ltd. | Gains on financial instruments at fair value through profit or loss | — | 293 | — | ||||||||||
Losses on financial instruments at fair value through profit or loss | 216 | — | — | |||||||||||
2020 | 2021 | 2022 | ||||||||||||
(In millions of Korean won) | ||||||||||||||
RMGP Bio-Pharma Investment Fund, L.P. | Fee and commission income | 27 | 38 | 43 | ||||||||||
Gains on financial instruments at fair value through profit or loss | — | 531 | — | |||||||||||
Losses on financial instruments at fair value through profit or loss | 489 | 2,373 | — | |||||||||||
RMGP Bio-Pharma Investment, L.P. | Losses on financial instruments at fair value through profit or loss | 1 | — | — | ||||||||||
KB-MDI Centauri Fund LP | Fee and commission income | 308 | 401 | 487 | ||||||||||
Gains on financial instruments at fair value through profit or loss | — | 551 | — | |||||||||||
Losses on financial instruments at fair value through profit or loss | 322 | 284 | — | |||||||||||
Hibiscus Fund LP | Fee and commission income | — | 372 | 524 | ||||||||||
Gains on financial instruments at fair value through profit or loss | — | 113 | — | |||||||||||
RMG-KB BioAccess Fund L.P. | Fee and commission income | — | 57 | 325 | ||||||||||
Gains on financial instruments at fair value through profit or loss | — | 5 | — | |||||||||||
S&E Bio Co., Ltd. | Interest expense | 1 | 1 | 2 | ||||||||||
Contents First Inc. | Interest income | — | — | 128 | ||||||||||
| Interest expense | 14 | 83 | 34 | |||||||||||
| Fee and commission income | — | — | 1 | |||||||||||
| Provision for credit losses | — | — | 1 | |||||||||||
December & Company Inc. | Interest expense | 1 | — | — | ||||||||||
| Insurance income | — | 109 | 174 | |||||||||||
GENINUS Inc. * | Interest expense | 70 | 29 | 12 | ||||||||||
Gains on financial instruments at fair value through profit or loss | — | 4,009 | — | |||||||||||
| Provision for credit losses | — | 6 | — | |||||||||||
Pin Therapeutics Inc. | Interest expense | — | — | 110 | ||||||||||
Wyatt Corp. | Insurance income | 63 | 87 | 142 | ||||||||||
KB-Brain KOSDAQ Scale-up New Technology Business Investment Fund | Interest expense | 40 | 17 | 6 | ||||||||||
| Fee and commission income | 734 | 514 | 423 | |||||||||||
Spark Biopharma Inc. | Interest expense | — | 7 | 272 | ||||||||||
Skydigital Inc. | Fee and commission income | 4 | 3 | 3 | ||||||||||
Il-Kwang Electronic Materials Co., Ltd. | Other non-operating expenses | — | — | 1 | ||||||||||
SO-MYUNG Recycling Co., Ltd. | Other non-operating expenses | — | — | 2 | ||||||||||
| KB No.17 Special Purpose Acquisition Company * | Gains on financial instruments at fair value through profit or loss | 4 | — | — | ||||||||||
Losses on financial instruments at fair value through profit or loss | — | 1,388 | — | |||||||||||
| Interest expense | 25 | 14 | 1 | |||||||||||
| KB No.18 Special Purpose Acquisition Company * | Gains on financial instruments at fair value through profit or loss | 84 | 8 | — | ||||||||||
| Interest expense | 31 | 20 | 5 | |||||||||||
2020 | 2021 | 2022 | ||||||||||||
(In millions of Korean won) | ||||||||||||||
| KB No.19 Special Purpose Acquisition Company * | Gains on financial instruments at fair value through profit or loss | 11 | 36 | — | ||||||||||
| Interest expense | 13 | 9 | 5 | |||||||||||
| KB No.20 Special Purpose Acquisition Company * | Fee and commission income | 210 | — | — | ||||||||||
Gains on financial instruments at fair value through profit or loss | 1,568 | 68 | — | |||||||||||
| Interest expense | 25 | 15 | 22 | |||||||||||
| KB No.21 Special Purpose Acquisition Company * | Fee and commission income | — | — | 263 | ||||||||||
Gains on financial instruments at fair value through profit or loss | — | — | 1,469 | |||||||||||
| Interest expense | — | — | 30 | |||||||||||
KB No.22 Special Purpose Acquisition Company | Fee and commission income | — | — | 175 | ||||||||||
Gains on financial instruments at fair value through profit or loss | — | — | 982 | |||||||||||
| Interest expense | — | — | 1 | |||||||||||
KB No.23 Special Purpose Acquisition Company | Gains on financial instruments at fair value through profit or loss | — | — | 1,476 | ||||||||||
| Interest expense | — | — | 23 | |||||||||||
KB No.24 Special Purpose Acquisition Company | Interest expense | — | — | 1 | ||||||||||
KB SPROTT Renewable Private Equity Fund No.1 | Fee and commission income | 488 | 487 | 345 | ||||||||||
KB-Stonebridge Secondary Private Equity Fund | Fee and commission income | 1,442 | 550 | 706 | ||||||||||
COSES GT Co., Ltd. | Interest income | 6 | 18 | 23 | ||||||||||
| Interest expense | — | 1 | 1 | |||||||||||
| Provision for credit losses | 4 | — | 3 | |||||||||||
| Reversal of credit losses | — | 3 | — | |||||||||||
IDTECK Co., Ltd. | Insurance income | — | 1 | — | ||||||||||
Mantisco Co., Ltd. | Interest expense | — | 1 | 1 | ||||||||||
SuperNGine Co., Ltd. | Interest expense | — | 1 | — | ||||||||||
Desilo Inc. | Interest income | — | 1 | 9 | ||||||||||
| Provision for credit losses | — | 2 | — | |||||||||||
Turing Co., Ltd. | Interest expense | — | 1 | 1 | ||||||||||
IGGYMOB Co., Ltd. | Interest expense | — | 1 | 1 | ||||||||||
Kukka Co., Ltd. | Interest expense | — | — | 2 | ||||||||||
ZIPDOC Inc. | Interest expense | — | — | 1 | ||||||||||
| Reversal of credit losses | — | — | 3 | |||||||||||
TeamSparta Inc. | Interest expense | — | — | 19 | ||||||||||
Chabot Mobility Co., Ltd. | Interest expense | — | — | 1 | ||||||||||
| Fee and commission expense | — | — | 824 | |||||||||||
Wemade Connect Co., Ltd. | Insurance income | — | — | 3 | ||||||||||
| Interest expense | — | — | 81 | |||||||||||
| Reversal of credit losses | — | — | 1 | |||||||||||
TMAP Mobility Co., Ltd. | Interest expense | — | — | 226 | ||||||||||
| Fee and commission expense | — | — | 78 | |||||||||||
Nextrade Co., Ltd. | Interest expense | — | — | 263 | ||||||||||
WJ Private Equity Fund No.1 | Fee and commission income | 5 | 7 | 7 | ||||||||||
2020 | 2021 | 2022 | ||||||||||||
(In millions of Korean won) | ||||||||||||||
UPRISE, Inc. | Interest income | 2 | 5 | — | ||||||||||
| Interest expense | — | 1 | 3 | |||||||||||
| Provision for credit losses | 1 | — | — | |||||||||||
| Reversal of credit losses | — | 1 | — | |||||||||||
Channel Corporation | Interest expense | — | — | 43 | ||||||||||
CWhy Inc. | Losses on financial instruments at fair value through profit or loss | 2,000 | — | — | ||||||||||
| Insurance income | — | — | 2 | |||||||||||
CellinCells Co., Ltd. | Interest expense | 4 | — | — | ||||||||||
Bomapp Inc. | Fee and commission expense | 9 | 5 | — | ||||||||||
| Insurance income | 8 | — | — | |||||||||||
Losses on financial instruments at fair value through profit or loss | — | 1,980 | — | |||||||||||
KB Social Impact Investment Fund | Fee and commission income | 300 | 300 | 286 | ||||||||||
KB-UTC Inno-Tech Venture Fund | Fee and commission income | 371 | 471 | 449 | ||||||||||
KBSP Private Equity Fund No.4 | Fee and commission income | 480 | 389 | 211 | ||||||||||
KB-NAU Special Situation Corporate Restructuring Private Equity Fund | Fee and commission income | 237 | 1,198 | 561 | ||||||||||
JR Global REIT * | Fee and commission income | 6,210 | — | — | ||||||||||
IGIS No.371 Professional Investors’ Real Estate Investment Company * | Fee and commission income | 200 | — | — | ||||||||||
Koreit Tower Real Estate Investment Trust Company * | Fee and commission income | 2,852 | — | — | ||||||||||
2020 KB Fintech Renaissance Fund | Fee and commission income | 60 | 147 | 147 | ||||||||||
KB Material and Parts No.1 PEF | Fee and commission income | 63 | 353 | 353 | ||||||||||
FineKB Private Equity Fund No.1 | Fee and commission income | 38 | 540 | 641 | ||||||||||
Paramark KB Fund No.1 | Fee and commission income | — | 100 | 356 | ||||||||||
KB-Badgers Future Mobility ESG Fund No.1 | Fee and commission income | — | — | 905 | ||||||||||
KB Bio Private Equity No.3 Ltd.* | Fee and commission income | — | 324 | 4,035 | ||||||||||
K The 15th REIT Co., Ltd. * | Fee and commission income | — | 500 | — | ||||||||||
| Insurance income | — | 1 | — | |||||||||||
KB-KTB Technology Venture Fund | Fee and commission income | — | — | 600 | ||||||||||
THE CHAEUL FUND NO.1 | Fee and commission income | — | — | 82 | ||||||||||
Bluepointpartners Inc. | Gains on financial instruments at fair value through profit or loss | — | 846 | — | ||||||||||
Losses on financial instruments at fair value through profit or loss | 68 | — | — | |||||||||||
KB-Solidus Global Healthcare Fund | Fee and commission income | 777 | 167 | 350 | ||||||||||
SwatchOn Inc.* | Fee and commission income | 9 | 8 | 5 | ||||||||||
| Interest expense | 47 | 10 | 5 | |||||||||||
Gomi corporation Inc. | Interest income | — | 19 | 61 | ||||||||||
| Interest expense | — | 1 | 2 | |||||||||||
| Fee and commission income | — | — | 1 | |||||||||||
| Provision for credit losses | — | 13 | 3 | |||||||||||
BNF Corporation Ltd. * | Interest income | 401 | — | — | ||||||||||
| Fee and commission income | 2 | — | — | |||||||||||
| Provision for credit losses | 8 | — | — | |||||||||||
KB Cape No.1 Private Equity Fund | Fee and commission income | 144 | 144 | 72 | ||||||||||
Losses on financial instruments at fair value through profit or loss | — | 69 | — | |||||||||||
2020 | 2021 | 2022 | ||||||||||||
(In millions of Korean won) | ||||||||||||||
Keystone-Hyundai Securities No.1 Private Equity Fund * | Fee and commission income | 115 | 43 | — | ||||||||||
KB-GeneN Medical Venture Fund No.1 | Fee and commission income | — | — | 76 | ||||||||||
KB-BridgePole Venture Investment Fund | Fee and commission income | — | — | 118 | ||||||||||
KB-Kyobo New Mobility Power Fund | Fee and commission income | — | — | 69 | ||||||||||
KB Co-Investment Private Equity Fund No.1 | Fee and commission income | — | — | 483 | ||||||||||
KB-NP Green ESG New Technology Venture Capital Fund | Fee and commission income | — | — | 435 | ||||||||||
Others | ||||||||||||||
Retirement pension | Fee and commission income | 1,077 | 1,338 | 1,352 | ||||||||||
| Interest expense | 3 | 9 | 39 | |||||||||||
| * | Excluded from the Group’s related party as of December 31, 2022. |
December 31, 2021 | December 31, 2022 | |||||||||
(In millions of Korean won) | ||||||||||
Associates and joint ventures | ||||||||||
Balhae Infrastructure Company | Other assets | ₩ | 1,427 | ₩ | 1,306 | |||||
Korea Credit Bureau Co., Ltd. | Loans measured at amortized cost (gross amount) | 36 | 38 | |||||||
Deposits | 10,200 | 27,889 | ||||||||
Provisions | — | 2 | ||||||||
Insurance liabilities | 1 | 1 | ||||||||
Incheon Bridge Co., Ltd. | Financial assets at fair value through profit or loss | 37,382 | 32,948 | |||||||
| Loans measured at amortized cost (gross amount) | 114,107 | 95,211 | ||||||||
Allowances for credit losses | 26 | 12 | ||||||||
Other assets | 423 | 615 | ||||||||
Deposits | 35,487 | 48,639 | ||||||||
Provisions | 24 | 18 | ||||||||
Insurance liabilities | 79 | 89 | ||||||||
Other liabilities | 99 | 446 | ||||||||
Jungdo Co., Ltd. | Deposits | 4 | 4 | |||||||
Dae-A Leisure Co., Ltd. | Deposits | 17 | 154 | |||||||
Aju Good Technology Venture Fund | Deposits | 6,286 | 7,222 | |||||||
Other liabilities | 10 | 73 | ||||||||
KB Star Office Private Real Estate Master Fund No.1 * | Loans measured at amortized cost (gross amount) | 10,000 | — | |||||||
Allowances for credit losses | 5 | — | ||||||||
Other assets | 138 | — | ||||||||
Deposits | 2,578 | — | ||||||||
December 31, 2021 | December 31, 2022 | |||||||||
(In millions of Korean won) | ||||||||||
Star-Lord General Investors Private Real Estate Investment Company No.10 | Loans measured at amortized cost (gross amount) | — | 149,294 | |||||||
| Allowances for credit losses | — | 1 | ||||||||
| Property and equipment | — | 9,915 | ||||||||
| Other assets | — | 8,591 | ||||||||
| Insurance liabilities | — | 46 | ||||||||
| Other liabilities | — | 14,227 | ||||||||
KB-Brain KOSDAQ Scale-up New Technology Business Investment Fund | Deposits | 1,524 | 1,526 | |||||||
Other liabilities | — | 1 | ||||||||
WJ Private Equity Fund No.1 | Other assets | 2 | 2 | |||||||
Deposits | 260 | 221 | ||||||||
KB Cape No.1 Private Equity Fund | Financial assets at fair value through profit or loss | 1,591 | 2,017 | |||||||
Other assets | 73 | — | ||||||||
RAND Bio Science Co., Ltd. | Deposits | 443 | 3 | |||||||
| Loans measured at amortized cost (gross amount) | 1 | — | ||||||||
SY Auto Capital Co., Ltd. | Loans measured at amortized cost (gross amount) | 40,074 | 40,040 | |||||||
| Allowances for credit losses | 68 | 55 | ||||||||
| Other assets | 630 | 63 | ||||||||
| Deposits | 17 | 10 | ||||||||
| Insurance liabilities | 14 | 14 | ||||||||
| Other liabilities | 36 | 5 | ||||||||
Food Factory Co., Ltd. | Financial assets at fair value through profit or loss | 663 | 696 | |||||||
| Loans measured at amortized cost (gross amount) | 3,553 | 3,345 | ||||||||
| Allowances for credit losses | 4 | 4 | ||||||||
| Other assets | 2 | 4 | ||||||||
| Deposits | 839 | 664 | ||||||||
| Insurance liabilities | 8 | 8 | ||||||||
| Other liabilities | 6 | 1 | ||||||||
KB Pre IPO Secondary Venture Fund No.1 * | Deposits | 103 | — | |||||||
Acts Co., Ltd *. | Deposits | 154 | — | |||||||
| Insurance liabilities | 2 | — | ||||||||
| Other liabilities | 100 | — | ||||||||
POSCO-KB Shipbuilding Fund | Other assets | 213 | 177 | |||||||
Paycoms Co., Ltd. | Other assets | 1 | — | |||||||
| Financial assets at fair value through profit or loss | 1,269 | 1,172 | ||||||||
| Deposits | 1 | 1 | ||||||||
Big Dipper Co., Ltd. | Loans measured at amortized cost (gross amount) | 17 | 18 | |||||||
| Deposits | — | 19 | ||||||||
December 31, 2021 | December 31, 2022 | |||||||||
(In millions of Korean won) | ||||||||||
KB-KDBC Pre-IPO New Technology Business Investment Fund | Deposits | 904 | 317 | |||||||
Iwon Alloy Co., Ltd. | Deposits | — | 1 | |||||||
| Insurance liabilities | 1 | 1 | ||||||||
Computerlife Co., Ltd. | Deposits | — | 3 | |||||||
RMGP Bio-Pharma Investment Fund, L.P. | Financial assets at fair value through profit or loss | 5,423 | 6,384 | |||||||
| Other liabilities | 79 | 36 | ||||||||
RMGP Bio-Pharma Investment, L.P. | Financial assets at fair value through profit or loss | 14 | 17 | |||||||
Wyatt Corp. | Financial assets at fair value through profit or loss | 6,000 | 6,000 | |||||||
| Deposits | 1 | 1 | ||||||||
| Insurance liabilities | 94 | 75 | ||||||||
Skydigital Inc. | Deposits | 85 | 10 | |||||||
Banksalad Co., Ltd. | Financial assets at fair value through profit or loss | 9,090 | 10,470 | |||||||
Spark Biopharma Inc. | Financial assets at fair value through profit or loss | 4,950 | 7,450 | |||||||
| Loans measured at amortized cost (gross amount) | 17 | 17 | ||||||||
| Deposits | 6,015 | 17,534 | ||||||||
| Other liabilities | 3 | 91 | ||||||||
UPRISE, Inc. | Financial assets at fair value through profit or loss | 1,250 | 5,248 | |||||||
| Deposits | 4,001 | 27 | ||||||||
Stratio, Inc. | Financial assets at fair value through profit or loss | 1,000 | 1,000 | |||||||
Honest Fund, Inc. | Financial assets at fair value through profit or loss | 3,999 | 3,999 | |||||||
CellinCells Co., Ltd. | Financial assets at fair value through profit or loss | 2,000 | 2,000 | |||||||
| Loans measured at amortized cost (gross amount) | 6 | 7 | ||||||||
| Deposits | 38 | 37 | ||||||||
Channel Corporation | Financial assets at fair value through profit or loss | 14,551 | 18,099 | |||||||
| Deposits | — | 3,000 | ||||||||
| Other liabilities | — | 21 | ||||||||
Jo Yang Industrial Co., Ltd. | Deposits | 1 | — | |||||||
KB No.17 Special Purpose Acquisition Company * | Financial assets at fair value through profit or loss | 1,301 | — | |||||||
| Deposits | 1,687 | — | ||||||||
| Other liabilities | 12 | — | ||||||||
KB No.18 Special Purpose Acquisition Company * | Financial assets at fair value through profit or loss | 3,881 | — | |||||||
| Deposits | 2,077 | — | ||||||||
| Other liabilities | 12 | — | ||||||||
December 31, 2021 | December 31, 2022 | |||||||||
(In millions of Korean won) | ||||||||||
KB No.19 Special Purpose Acquisition Company * | Financial assets at fair value through profit or loss | 2,091 | — | |||||||
| Deposits | 1,013 | — | ||||||||
| Other liabilities | 5 | — | ||||||||
KB No.20 Special Purpose Acquisition Company* | Financial assets at fair value through profit or loss | 3,135 | — | |||||||
| Deposits | 1,681 | — | ||||||||
| Other liabilities | 3 | — | ||||||||
KB No.21 Special Purpose Acquisition Company | Financial assets at fair value through profit or loss | — | 2,959 | |||||||
| Deposits | — | 2,263 | ||||||||
| Other liabilities | — | 29 | ||||||||
KB No.22 Special Purpose Acquisition Company | Financial assets at fair value through profit or loss | — | 1,972 | |||||||
| Deposits | — | 1,948 | ||||||||
KB No.23 Special Purpose Acquisition Company | Financial assets at fair value through profit or loss | — | 2,971 | |||||||
| Deposits | — | 2,205 | ||||||||
| Other liabilities | — | 22 | ||||||||
KB No.24 Special Purpose Acquisition Company | Financial assets at fair value through profit or loss | — | 6,975 | |||||||
| Deposits | — | 9,983 | ||||||||
| Other liabilities | — | 1 | ||||||||
COSES GT Co., Ltd. | Financial assets at fair value through profit or loss | 4,930 | 4,930 | |||||||
| Loans measured at amortized cost (gross amount) | 515 | 506 | ||||||||
| Allowances for credit losses | 2 | 4 | ||||||||
| Other assets | 1 | 2 | ||||||||
| Deposits | 1,939 | 1,213 | ||||||||
IDTECK Co., Ltd. | Insurance liabilities | 1 | — | |||||||
Bomapp Inc. * | Financial assets at fair value through profit or loss | 19 | — | |||||||
| Deposits | — | 1 | ||||||||
MitoImmune Therapeutics | Financial assets at fair value through profit or loss | 7,000 | 7,000 | |||||||
KB-Solidus Global Healthcare Fund | Other assets | 620 | 350 | |||||||
Bioprotect Ltd. | Financial assets at fair value through profit or loss | 3,557 | 3,802 | |||||||
Gomi corporation Inc. | Financial assets at fair value through profit or loss | 2,500 | 4,000 | |||||||
| Loans measured at amortized cost (gross amount) | 2,233 | 2,234 | ||||||||
| Allowances for credit losses | 12 | 17 | ||||||||
| Other assets | 4 | 5 | ||||||||
| Deposits | 3,188 | 915 | ||||||||
| Other liabilities | 1 | 1 | ||||||||
Copin Communications, Inc. * | Financial assets at fair value through profit or loss | 4,801 | — | |||||||
December 31, 2021 | December 31, 2022 | |||||||||
(In millions of Korean won) | ||||||||||
Go2joy Co., Ltd. | Financial assets at fair value through profit or loss | 1,200 | 1,200 | |||||||
ClavisTherapeutics, Inc. | Financial assets at fair value through profit or loss | 2,000 | 2,000 | |||||||
S&E Bio Co., Ltd. | Financial assets at fair value through profit or loss | 2,000 | 4,000 | |||||||
| Loans measured at amortized cost (gross amount) | — | 10 | ||||||||
| Deposits | 263 | 6,419 | ||||||||
Bluepointpartners Inc. | Financial assets at fair value through profit or loss | 2,278 | 2,133 | |||||||
4N Inc. | Financial assets at fair value through profit or loss | 200 | 200 | |||||||
| Deposits | 39 | 5 | ||||||||
Xenohelix Co., Ltd. | Financial assets at fair value through profit or loss | 2,100 | 2,100 | |||||||
Contents First Inc. | Financial assets at fair value through profit or loss | 7,277 | 7,277 | |||||||
| Loans measured at amortized cost (gross amount) | — | 10,017 | ||||||||
| Allowances for credit losses | — | 1 | ||||||||
| Other assets | — | 2 | ||||||||
| Deposits | 12,650 | 5,010 | ||||||||
| Other liabilities | 57 | 21 | ||||||||
KB-MDI Centauri Fund LP | Financial assets at fair value through profit or loss | 9,633 | 17,471 | |||||||
| Other assets | 104 | 470 | ||||||||
2020 KB Fintech Renaissance Fund | Other assets | — | 37 | |||||||
OKXE Inc. | Financial assets at fair value through profit or loss | 800 | 800 | |||||||
GENINUS Inc. * | Financial assets at fair value through profit or loss | 5,855 | — | |||||||
| Loans measured at amortized cost (gross amount) | 17 | — | ||||||||
| Allowances for credit losses | 6 | — | ||||||||
| Deposits | 34,415 | — | ||||||||
| Other liabilities | 2 | — | ||||||||
Mantisco Co., Ltd. | Loans measured at amortized cost (gross amount) | 1 | 15 | |||||||
| Financial assets at fair value through profit or loss | 3,000 | 3,000 | ||||||||
| Deposits | 386 | 623 | ||||||||
Pin Therapeutics Inc. | Loans measured at amortized cost (gross amount) | — | 13 | |||||||
| Financial assets at fair value through profit or loss | 3,000 | 5,000 | ||||||||
| Deposits | — | 6,033 | ||||||||
| Other liabilities | — | 18 | ||||||||
December 31, 2021 | December 31, 2022 | |||||||||
(In millions of Korean won) | ||||||||||
IMBiologics Corp. | Loans measured at amortized cost (gross amount) | 4 | 4 | |||||||
| Financial assets at fair value through profit or loss | 5,000 | 5,000 | ||||||||
SuperNGine Co., Ltd. | Loans measured at amortized cost (gross amount) | 2 | 6 | |||||||
| Deposits | 944 | 17 | ||||||||
| Financial assets at fair value through profit or loss | 1,996 | 1,996 | ||||||||
Desilo Inc. | Financial assets at fair value through profit or loss | 3,168 | 3,168 | |||||||
| Loans measured at amortized cost (gross amount) | 301 | 300 | ||||||||
| Allowances for credit losses | 2 | 2 | ||||||||
| Deposits | 168 | 1 | ||||||||
Turing Co., Ltd. | Financial assets at fair value through profit or loss | 3,000 | 3,000 | |||||||
| Deposits | 1,054 | 2,788 | ||||||||
IGGYMOB Co., Ltd. | Financial assets at fair value through profit or loss | 5,000 | 5,000 | |||||||
| Loans measured at amortized cost (gross amount) | 6 | 15 | ||||||||
| Deposits | 2,938 | 254 | ||||||||
Kukka Co., Ltd. | Financial assets at fair value through profit or loss | — | 2,490 | |||||||
ZIPDOC Inc. | Financial assets at fair value through profit or loss | — | 2,000 | |||||||
| Deposits | — | 915 | ||||||||
TeamSparta Inc. | Financial assets at fair value through profit or loss | — | 4,001 | |||||||
| Deposits | — | 12,502 | ||||||||
| Other liabilities | — | 6 | ||||||||
Chabot Mobility Co., Ltd. | Financial assets at fair value through profit or loss | — | 2,000 | |||||||
| Deposits | — | 86 | ||||||||
Wemade Connect Co., Ltd. | Financial assets at fair value through profit or loss | — | 12,000 | |||||||
| Loans measured at amortized cost (gross amount) | — | 52 | ||||||||
| Provisions | — | 2 | ||||||||
| Deposits | — | 10,370 | ||||||||
| Insurance liabilities | — | 2 | ||||||||
| Other liabilities | — | 28 | ||||||||
Nextrade Co., Ltd. | Deposits | — | 56,202 | |||||||
| Other liabilities | — | 263 | ||||||||
TMAP Mobility Co., Ltd. | Deposits | — | 30,000 | |||||||
| Other liabilities | — | 76 | ||||||||
FutureConnect Co., Ltd. | Financial assets at fair value through profit or loss | — | 1,499 | |||||||
Gushcloud Talent Agency | Financial assets at fair value through profit or loss | — | 4,165 | |||||||
December 31, 2021 | December 31, 2022 | |||||||||
(In millions of Korean won) | ||||||||||
Grinergy | Financial assets at fair value through profit or loss | — | 2,500 | |||||||
NexThera Co., Ltd. | Financial assets at fair value through profit or loss | — | 2,000 | |||||||
FineKB Private Equity Fund No.1 | Other assets | 153 | 160 | |||||||
Paramark KB Fund No.1 | Other liabilities | 200 | 34 | |||||||
December & Company Inc. | Deposits | 1 | 1 | |||||||
| Insurance liabilities | 10 | 9 | ||||||||
KB Social Impact Investment Fund | Other assets | 150 | 436 | |||||||
Checkmate Therapeutics Inc. | Financial assets at fair value through profit or loss | 2,200 | 3,200 | |||||||
| Insurance liabilities | — | 3 | ||||||||
G1 Playground Co., Ltd. | Financial assets at fair value through profit or loss | 1,000 | 1,000 | |||||||
| Deposits | 354 | — | ||||||||
Hibiscus Fund LP | Financial assets at fair value through profit or loss | 4,731 | 10,221 | |||||||
| Other assets | 251 | — | ||||||||
| Other liabilities | — | 257 | ||||||||
RMG-KB BioAccess Fund L.P. | Financial assets at fair value through profit or loss | 353 | 2,753 | |||||||
RMG-KB BP Management Ltd. | Financial assets at fair value through profit or loss | 7 | 77 | |||||||
SwatchOn Inc.* | Financial assets at fair value through profit or loss | 3,345 | — | |||||||
| Loans measured at amortized cost (gross amount) | 73 | — | ||||||||
| Deposits | 686 | — | ||||||||
KB Co-Investment Private Equity Fund No.1 | Other assets | — | 191 | |||||||
Key management personnel | Loans measured at amortized cost (gross amount) | 4,591 | 6,299 | |||||||
| Allowances for credit losses | 2 | 3 | ||||||||
| Other assets | 4 | 7 | ||||||||
| Deposits | 16,996 | 17,618 | ||||||||
| Provisions | 1 | 1 | ||||||||
| Insurance liabilities | 2,471 | 2,374 | ||||||||
| Other liabilities | 345 | 387 | ||||||||
Others | ||||||||||
Retirement pension | Other assets | 369 | 778 | |||||||
| Other liabilities | 5,014 | 10,141 | ||||||||
| * | Excluded from the Group’s related party as of December 31, 2022, therefore, the remaining outstanding balances with those entities are not disclosed. |
2021 | ||||||||||||||||
Beginning | Loan | Collection | Ending | |||||||||||||
(In millions of Korean won) | ||||||||||||||||
Associates and joint ventures | ||||||||||||||||
Korea Credit Bureau Co., Ltd. | ₩ | 36 | ₩ | 36 | ₩ | (36 | ) | ₩ | 36 | |||||||
Incheon Bridge Co., Ltd. | 171,758 | 7 | (20,276 | ) | 151,489 | |||||||||||
KB Star Office Private Real Estate Master Fund No.1* | 10,000 | — | — | 10,000 | ||||||||||||
KB Cape No.1 Private Equity Fund | 2,000 | — | (409 | ) | 1,591 | |||||||||||
RAND Bio Science Co., Ltd. | 1 | 1 | (1 | ) | 1 | |||||||||||
SY Auto Capital Co., Ltd. | 40,060 | 74 | (60 | ) | 40,074 | |||||||||||
Food Factory Co., Ltd. | 3,872 | 397 | (53 | ) | 4,216 | |||||||||||
Paycoms Co., Ltd. | 1,226 | 43 | — | 1,269 | ||||||||||||
Big Dipper Co., Ltd. | 4 | 17 | (4 | ) | 17 | |||||||||||
RMGP Bio-Pharma Investment Fund, L.P. | 4,250 | 1,173 | — | 5,423 | ||||||||||||
RMGP Bio-Pharma Investment, L.P. | 9 | 5 | — | 14 | ||||||||||||
Wyatt Corp. | 6,000 | — | — | 6,000 | ||||||||||||
Banksalad Co., Ltd. | 9,141 | — | (51 | ) | 9,090 | |||||||||||
UPRISE, Inc. | 750 | 1,000 | (500 | ) | 1,250 | |||||||||||
Stratio, Inc. | 1,000 | — | — | 1,000 | ||||||||||||
Honest Fund, Inc. | 3,999 | — | — | 3,999 | ||||||||||||
CellinCells Co., Ltd. | 2,024 | 6 | (24 | ) | 2,006 | |||||||||||
KB No.17 Special Purpose Acquisition Company* | 2,687 | — | (1,386 | ) | 1,301 | |||||||||||
KB No.18 Special Purpose Acquisition Company* | 3,873 | 8 | — | 3,881 | ||||||||||||
KB No.19 Special Purpose Acquisition Company* | 2,055 | 36 | — | 2,091 | ||||||||||||
KB No.20 Special Purpose Acquisition Company* | 3,067 | 68 | — | 3,135 | ||||||||||||
COSES GT Co., Ltd. | 5,430 | 15 | — | 5,445 | ||||||||||||
Bomapp Inc.* | 1,999 | — | (1,980 | ) | 19 | |||||||||||
Channel Corporation | 4,551 | 10,000 | — | 14,551 | ||||||||||||
MitoImmune Therapeutics | 5,000 | 2,000 | — | 7,000 | ||||||||||||
Bioprotect Ltd. | 3,264 | 293 | — | 3,557 | ||||||||||||
Gomi corporation Inc. | 509 | 4,233 | (9 | ) | 4,733 | |||||||||||
Copin Communications, Inc.* | 1,500 | 3,301 | — | 4,801 | ||||||||||||
Go2joy Co., Ltd. | 1,200 | — | — | 1,200 | ||||||||||||
ClavisTherapeutics, Inc. | 2,000 | — | — | 2,000 | ||||||||||||
S&E Bio Co., Ltd. | 2,000 | — | — | 2,000 | ||||||||||||
Bluepointpartners Inc. | 1,432 | 846 | — | 2,278 | ||||||||||||
4N Inc. | 200 | — | — | 200 | ||||||||||||
Xenohelix Co., Ltd. | 2,100 | — | — | 2,100 | ||||||||||||
Contents First Inc. | 6,146 | 1,131 | — | 7,277 | ||||||||||||
KB-MDI Centauri Fund LP | 4,280 | 5,353 | — | 9,633 | ||||||||||||
SwatchOn Inc.* | 3,404 | 73 | (59 | ) | 3,418 | |||||||||||
OKXE Inc. | 800 | — | — | 800 | ||||||||||||
GENINUS Inc.* | 5,599 | 273 | — | 5,872 | ||||||||||||
Checkmate Therapeutics Inc. | — | 2,200 | — | 2,200 | ||||||||||||
Mantisco Co., Ltd. | — | 3,001 | — | 3,001 | ||||||||||||
IMBiologics Corp. | — | 5,004 | — | 5,004 | ||||||||||||
Spark Biopharma Inc. | — | 4,967 | — | 4,967 | ||||||||||||
G1 Playground Co., Ltd. | — | 1,000 | — | 1,000 | ||||||||||||
Pin Therapeutics Inc. | — | 3,000 | — | 3,000 | ||||||||||||
Hibiscus Fund LP | — | 4,731 | — | 4,731 | ||||||||||||
SuperNGine Co., Ltd. | — | 1,998 | — | 1,998 | ||||||||||||
Desilo Inc. | — | 3,469 | — | 3,469 | ||||||||||||
2021 | ||||||||||||||||
Beginning | Loan | Collection | Ending | |||||||||||||
(In millions of Korean won) | ||||||||||||||||
RMG-KB BioAccess Fund L.P. | — | 353 | — | 353 | ||||||||||||
RMG-KB BP Management Ltd. | — | 7 | — | 7 | ||||||||||||
IGGYMOB Co., Ltd. | — | 5,006 | — | 5,006 | ||||||||||||
Turing Co., Ltd. | — | 3,000 | — | 3,000 | ||||||||||||
Key management personnel | 5,153 | 3,421 | (3,983 | ) | 4,591 | |||||||||||
| * | Excluded from the Group’s related party as of December 31, 2021. |
2022 | ||||||||||||||||
Beginning | Loan | Collection | Ending | |||||||||||||
(In millions of Korean won) | ||||||||||||||||
Associates and joint ventures | ||||||||||||||||
Korea Credit Bureau Co., Ltd. | ₩ | 36 | ₩ | 38 | ₩ | (36 | ) | ₩ | 38 | |||||||
Incheon Bridge Co., Ltd. | 151,489 | 11 | (23,341 | ) | 128,159 | |||||||||||
Star-Lord General Investors Private Real Estate Investment Company No.10 | — | 150,000 | (706 | ) | 149,294 | |||||||||||
KB Star Office Private Real Estate Master Fund No.1* | 10,000 | — | (10,000 | ) | — | |||||||||||
KB Cape No.1 Private Equity Fund | 1,591 | 426 | — | 2,017 | ||||||||||||
RAND Bio Science Co., Ltd. | 1 | — | (1 | ) | — | |||||||||||
SY Auto Capital Co., Ltd. | 40,074 | 40 | (74 | ) | 40,040 | |||||||||||
Food Factory Co., Ltd. | 4,216 | 1,541 | (1,716 | ) | 4,041 | |||||||||||
Paycoms Co., Ltd. | 1,269 | — | (97 | ) | 1,172 | |||||||||||
Big Dipper Co., Ltd. | 17 | 18 | (17 | ) | 18 | |||||||||||
RMGP Bio-Pharma Investment Fund, L.P. | 5,423 | 961 | — | 6,384 | ||||||||||||
RMGP Bio-Pharma Investment, L.P. | 14 | 3 | — | 17 | ||||||||||||
Wyatt Corp. | 6,000 | — | — | 6,000 | ||||||||||||
Banksalad Co., Ltd. | 9,090 | 1,380 | — | 10,470 | ||||||||||||
UPRISE, Inc. | 1,250 | 3,998 | — | 5,248 | ||||||||||||
Stratio, Inc. | 1,000 | — | — | 1,000 | ||||||||||||
Honest Fund, Inc. | 3,999 | — | — | 3,999 | ||||||||||||
CellinCells Co., Ltd. | 2,006 | 7 | (6 | ) | 2,007 | |||||||||||
KB No.17 Special Purpose Acquisition Company* | 1,301 | — | (1,301 | ) | — | |||||||||||
KB No.18 Special Purpose Acquisition Company* | 3,881 | — | (3,881 | ) | — | |||||||||||
KB No.19 Special Purpose Acquisition Company* | 2,091 | — | (2,091 | ) | — | |||||||||||
KB No.20 Special Purpose Acquisition Company* | 3,135 | — | (3,135 | ) | — | |||||||||||
KB No.21 Special Purpose Acquisition Company | — | 2,959 | — | 2,959 | ||||||||||||
KB No.22 Special Purpose Acquisition Company | — | 1,972 | — | 1,972 | ||||||||||||
KB No.23 Special Purpose Acquisition Company | — | 2,971 | — | 2,971 | ||||||||||||
KB No.24 Special Purpose Acquisition Company | — | 6,975 | — | 6,975 | ||||||||||||
COSES GT Co., Ltd. | 5,445 | 6 | (15 | ) | 5,436 | |||||||||||
Bomapp Inc.* | 19 | — | (19 | ) | — | |||||||||||
Channel Corporation | 14,551 | 3,548 | — | 18,099 | ||||||||||||
MitoImmune Therapeutics | 7,000 | — | — | 7,000 | ||||||||||||
Bioprotect Ltd. | 3,557 | 245 | — | 3,802 | ||||||||||||
Gomi corporation Inc. | 4,733 | 1,534 | (33 | ) | 6,234 | |||||||||||
Copin Communications, Inc.* | 4,801 | — | (4,801 | ) | — | |||||||||||
Go2joy Co., Ltd. | 1,200 | — | — | 1,200 | ||||||||||||
ClavisTherapeutics, Inc. | 2,000 | — | — | 2,000 | ||||||||||||
S&E Bio Co., Ltd. | 2,000 | 2,010 | — | 4,010 | ||||||||||||
Bluepointpartners Inc. | 2,278 | — | (145 | ) | 2,133 | |||||||||||
4N Inc. | 200 | — | — | 200 | ||||||||||||
2022 | ||||||||||||||||
Beginning | Loan | Collection | Ending | |||||||||||||
(In millions of Korean won) | ||||||||||||||||
Xenohelix Co., Ltd. | 2,100 | — | — | 2,100 | ||||||||||||
Contents First Inc. | 7,277 | 10,017 | — | 17,294 | ||||||||||||
KB-MDI Centauri Fund LP | 9,633 | 7,838 | — | 17,471 | ||||||||||||
SwatchOn Inc.* | 3,418 | — | (3,418 | ) | — | |||||||||||
OKXE Inc. | 800 | — | — | 800 | ||||||||||||
GENINUS Inc.* | 5,872 | — | (5,872 | ) | — | |||||||||||
Checkmate Therapeutics Inc. | 2,200 | 1,000 | — | 3,200 | ||||||||||||
Mantisco Co., Ltd. | 3,001 | 15 | (1 | ) | 3,015 | |||||||||||
IMBiologics Corp. | 5,004 | 4 | (4 | ) | 5,004 | |||||||||||
Spark Biopharma Inc. | 4,967 | 2,517 | (17 | ) | 7,467 | |||||||||||
G1 Playground Co., Ltd. | 1,000 | — | — | 1,000 | ||||||||||||
Pin Therapeutics Inc. | 3,000 | 2,013 | — | 5,013 | ||||||||||||
Hibiscus Fund LP | 4,731 | 5,490 | — | 10,221 | ||||||||||||
SuperNGine Co., Ltd. | 1,998 | 6 | (2 | ) | 2,002 | |||||||||||
Desilo Inc. | 3,469 | — | (1 | ) | 3,468 | |||||||||||
RMG-KB BioAccess Fund L.P. | 353 | 2,400 | — | 2,753 | ||||||||||||
RMG-KB BP Management Ltd. | 7 | 70 | — | 77 | ||||||||||||
IGGYMOB Co., Ltd. | 5,006 | 15 | (6 | ) | 5,015 | |||||||||||
Turing Co., Ltd. | 3,000 | — | — | 3,000 | ||||||||||||
Kukka Co., Ltd. | — | 2,490 | — | 2,490 | ||||||||||||
ZIPDOC Inc. | — | 2,000 | — | 2,000 | ||||||||||||
Gushcloud Talent Agency | — | 4,165 | — | 4,165 | ||||||||||||
Grinergy | — | 2,500 | — | 2,500 | ||||||||||||
NexThera Co., Ltd. | — | 2,000 | — | 2,000 | ||||||||||||
Chabot Mobility Co., Ltd. | — | 2,000 | — | 2,000 | ||||||||||||
TeamSparta Inc. | — | 4,001 | — | 4,001 | ||||||||||||
FutureConnect Co., Ltd. | — | 1,499 | — | 1,499 | ||||||||||||
Wemade Connect Co., Ltd. | — | 12,052 | — | 12,052 | ||||||||||||
Key management personnel | 4,591 | 4,527 | (2,819 | ) | 6,299 | |||||||||||
| * | Excluded from the Group’s related party as of December 31, 2022. |
2021 | ||||||||||||||||||||
Beginning | Borrowing | Repayment | Others 1 | Ending | ||||||||||||||||
(In millions of Korean won) | ||||||||||||||||||||
Associates and joint ventures | ||||||||||||||||||||
Korea Credit Bureau Co., Ltd. | ₩ | 19,982 | ₩ | — | ₩ | (1,000 | ) | ₩ | (8,782 | ) | ₩ | 10,200 | ||||||||
Incheon Bridge Co., Ltd. | 39,520 | 15,000 | (20,000 | ) | 967 | 35,487 | ||||||||||||||
Jungdo Co., Ltd. | 4 | — | — | — | 4 | |||||||||||||||
Dae-A Leisure Co., Ltd. | 636 | — | (479 | ) | (140 | ) | 17 | |||||||||||||
Skydigital Inc. | 15 | — | — | 70 | 85 | |||||||||||||||
Jo Yang Industrial Co., Ltd. | 2 | — | — | (1 | ) | 1 | ||||||||||||||
Aju Good Technology Venture Fund | 3,093 | 3,840 | (1,442 | ) | 795 | 6,286 | ||||||||||||||
KB-KDBC Pre-IPO New Technology Business Investment Fund | 923 | — | — | (19 | ) | 904 | ||||||||||||||
KB-Brain KOSDAQ Scale-up New Technology Business Investment Fund | 8,097 | — | — | (6,573 | ) | 1,524 | ||||||||||||||
Neomio Corp. 2 | 535 | — | — | (535 | ) | — | ||||||||||||||
2021 | ||||||||||||||||||||
Beginning | Borrowing | Repayment | Others 1 | Ending | ||||||||||||||||
(In millions of Korean won) | ||||||||||||||||||||
WJ Private Equity Fund No.1 | 349 | — | — | (89 | ) | 260 | ||||||||||||||
KB Star Office Private Real Estate Master Fund No.1 2 | 4,255 | — | (1,770 | ) | 93 | 2,578 | ||||||||||||||
SY Auto Capital Co., Ltd. | 6 | — | — | 11 | 17 | |||||||||||||||
KB No.17 Special Purpose Acquisition Company 2 | 1,711 | 1,546 | (1,525 | ) | (45 | ) | 1,687 | |||||||||||||
KB No.18 Special Purpose Acquisition Company 2 | 2,101 | 2,016 | (2,063 | ) | 23 | 2,077 | ||||||||||||||
KB No.19 Special Purpose Acquisition Company 2 | 1,053 | 1,000 | (1,000 | ) | (40 | ) | 1,013 | |||||||||||||
KB No.20 Special Purpose Acquisition Company 2 | 1,716 | 1,534 | (1,522 | ) | (47 | ) | 1,681 | |||||||||||||
RAND Bio Science Co., Ltd. | 693 | — | (400 | ) | 150 | 443 | ||||||||||||||
Food Factory Co., Ltd. | 1,555 | 507 | (500 | ) | (723 | ) | 839 | |||||||||||||
Acts Co., Ltd. 2 | 18 | — | — | 136 | 154 | |||||||||||||||
Paycoms Co., Ltd. | 1 | — | — | — | 1 | |||||||||||||||
Big Dipper Co., Ltd. | 1 | — | — | (1 | ) | — | ||||||||||||||
Wyatt Corp. | 1 | — | — | — | 1 | |||||||||||||||
Stratio, Inc. | 13 | — | �� | (13 | ) | — | ||||||||||||||
UPRISE, Inc. | 11 | — | — | 3,990 | 4,001 | |||||||||||||||
CellinCells Co., Ltd. | 260 | — | — | (222 | ) | 38 | ||||||||||||||
COSES GT Co., Ltd. | 292 | — | — | 1,647 | 1,939 | |||||||||||||||
SwatchOn Inc. 2 | 3,947 | 200 | (3,501 | ) | 40 | 686 | ||||||||||||||
Gomi corporation Inc. | 37 | — | — | 3,151 | 3,188 | |||||||||||||||
S&E Bio Co., Ltd. | 1,142 | — | — | (879 | ) | 263 | ||||||||||||||
KB Pre IPO Secondary Venture Fund No.1 2 | 629 | — | — | (526 | ) | 103 | ||||||||||||||
4N Inc. | 76 | — | — | (37 | ) | 39 | ||||||||||||||
Contents First Inc. | 1,823 | 20,000 | (11,000 | ) | 1,827 | 12,650 | ||||||||||||||
December & Company Inc. | 1 | — | — | — | 1 | |||||||||||||||
GENINUS Inc. 2 | 13,630 | — | (5,000 | ) | 25,785 | 34,415 | ||||||||||||||
Mantisco Co., Ltd. | — | — | — | 386 | 386 | |||||||||||||||
Spark Biopharma Inc. | — | 1,000 | (3,000 | ) | 8,015 | 6,015 | ||||||||||||||
G1 Playground Co., Ltd. | — | — | — | 354 | 354 | |||||||||||||||
SuperNGine Co., Ltd. | — | — | — | 944 | 944 | |||||||||||||||
Desilo Inc. | — | — | — | 168 | 168 | |||||||||||||||
Turing Co., Ltd. | — | — | — | 1,054 | 1,054 | |||||||||||||||
IGGYMOB Co., Ltd. | — | — | — | 2,938 | 2,938 | |||||||||||||||
Key management personnel | 17,167 | 16,574 | (16,994 | ) | 249 | 16,996 | ||||||||||||||
2022 | ||||||||||||||||||||
Beginning | Borrowing | Repayment | Others 1 | Ending | ||||||||||||||||
(In millions of Korean won) | ||||||||||||||||||||
Associates and joint ventures | ||||||||||||||||||||
Korea Credit Bureau Co., Ltd. | ₩ | 10,200 | ₩ | — | ₩ | — | ₩ | 17,689 | ₩ | 27,889 | ||||||||||
Incheon Bridge Co., Ltd. | 35,487 | 29,217 | (15,000 | ) | (1,065 | ) | 48,639 | |||||||||||||
Jungdo Co., Ltd. | 4 | — | — | — | 4 | |||||||||||||||
Dae-A Leisure Co., Ltd. | 17 | — | — | 137 | 154 | |||||||||||||||
Iwon Alloy Co., Ltd. | — | — | — | 1 | 1 | |||||||||||||||
Computerlife Co., Ltd. | — | — | — | 3 | 3 | |||||||||||||||
Skydigital Inc. | 85 | — | — | (75 | ) | 10 | ||||||||||||||
Jo Yang Industrial Co., Ltd. | 1 | — | — | (1 | ) | — | ||||||||||||||
Aju Good Technology Venture Fund | 6,286 | 6,577 | (3,840 | ) | (1,801 | ) | 7,222 | |||||||||||||
2022 | ||||||||||||||||||||
Beginning | Borrowing | Repayment | Others 1 | Ending | ||||||||||||||||
(In millions of Korean won) | ||||||||||||||||||||
KB-KDBC Pre-IPO New Technology Business Investment Fund | 904 | — | — | (587 | ) | 317 | ||||||||||||||
KB-Brain KOSDAQ Scale-up New Technology Business Investment Fund | 1,524 | — | — | 2 | 1,526 | |||||||||||||||
WJ Private Equity Fund No.1 | 260 | — | — | (39 | ) | 221 | ||||||||||||||
KB Star Office Private Real Estate Master Fund No.1 2 | 2,578 | — | (2,578 | ) | — | — | ||||||||||||||
SY Auto Capital Co., Ltd. | 17 | — | — | (7 | ) | 10 | ||||||||||||||
KB No.17 Special Purpose Acquisition Company 2 | 1,687 | — | (1,546 | ) | (141 | ) | — | |||||||||||||
KB No.18 Special Purpose Acquisition Company 2 | 2,077 | — | (2,016 | ) | (61 | ) | — | |||||||||||||
KB No.19 Special Purpose Acquisition Company 2 | 1,013 | — | (1,000 | ) | (13 | ) | — | |||||||||||||
KB No.20 Special Purpose Acquisition Company 2 | 1,681 | — | (1,534 | ) | (147 | ) | — | |||||||||||||
KB No.21 Special Purpose Acquisition Company | — | 2,000 | — | 263 | 2,263 | |||||||||||||||
KB No.22 Special Purpose Acquisition Company | — | — | — | 1,948 | 1,948 | |||||||||||||||
KB No.23 Special Purpose Acquisition Company | — | 2,133 | — | 72 | 2,205 | |||||||||||||||
KB No.24 Special Purpose Acquisition Company | — | — | — | 9,983 | 9,983 | |||||||||||||||
RAND Bio Science Co., Ltd. | 443 | — | — | (440 | ) | 3 | ||||||||||||||
Food Factory Co., Ltd. | 839 | 511 | (1,018 | ) | 332 | 664 | ||||||||||||||
Acts Co., Ltd. 2 | 154 | — | — | (154 | ) | — | ||||||||||||||
Paycoms Co., Ltd. | 1 | — | — | — | 1 | |||||||||||||||
Big Dipper Co., Ltd. | — | 300 | (300 | ) | 19 | 19 | ||||||||||||||
Wyatt Corp. | 1 | — | — | — | 1 | |||||||||||||||
UPRISE, Inc. | 4,001 | — | — | (3,974 | ) | 27 | ||||||||||||||
CellinCells Co., Ltd. | 38 | — | — | (1 | ) | 37 | ||||||||||||||
COSES GT Co., Ltd. | 1,939 | — | — | (726 | ) | 1,213 | ||||||||||||||
SwatchOn Inc. 2 | 686 | — | — | (686 | ) | — | ||||||||||||||
Gomi corporation Inc. | 3,188 | — | — | (2,273 | ) | 915 | ||||||||||||||
S&E Bio Co., Ltd. | 263 | 50 | — | 6,106 | 6,419 | |||||||||||||||
KB Pre IPO Secondary Venture Fund No.1 2 | 103 | — | — | (103 | ) | — | ||||||||||||||
4N Inc. | 39 | — | — | (34 | ) | 5 | ||||||||||||||
Contents First Inc. | 12,650 | 10,000 | (16,000 | ) | (1,640 | ) | 5,010 | |||||||||||||
December & Company Inc. | 1 | — | — | — | 1 | |||||||||||||||
GENINUS Inc. 2 | 34,415 | — | — | (34,415 | ) | — | ||||||||||||||
Mantisco Co., Ltd. | 386 | — | — | 237 | 623 | |||||||||||||||
Pin Therapeutics Inc. | — | 21,000 | (16,200 | ) | 1,233 | 6,033 | ||||||||||||||
Spark Biopharma Inc. | 6,015 | 41,165 | (27,539 | ) | (2,107 | ) | 17,534 | |||||||||||||
G1 Playground Co., Ltd. | 354 | — | — | (354 | ) | — | ||||||||||||||
SuperNGine Co., Ltd. | 944 | — | — | (927 | ) | 17 | ||||||||||||||
Desilo Inc. | 168 | — | — | (167 | ) | 1 | ||||||||||||||
Turing Co., Ltd. | 1,054 | — | — | 1,734 | 2,788 | |||||||||||||||
IGGYMOB Co., Ltd. | 2,938 | — | — | (2,684 | ) | 254 | ||||||||||||||
TMAP Mobility Co., Ltd. | — | 80,000 | (50,000 | ) | — | 30,000 | ||||||||||||||
Nextrade Co., Ltd. | — | 56,200 | — | 2 | 56,202 | |||||||||||||||
Kukka Co., Ltd. | — | — | — | — | — | |||||||||||||||
ZIPDOC Inc. | — | — | — | 915 | 915 | |||||||||||||||
TeamSparta Inc. | — | 9,000 | (4,000 | ) | 7,502 | 12,502 | ||||||||||||||
Chabot Mobility Co., Ltd. | — | — | — | 86 | 86 | |||||||||||||||
Wemade Connect Co., Ltd. | — | 11,010 | (3,267 | ) | 2,627 | 10,370 | ||||||||||||||
2022 | ||||||||||||||||||||
Beginning | Borrowing | Repayment | Others 1 | Ending | ||||||||||||||||
(In millions of Korean won) | ||||||||||||||||||||
Wise Asset Management Co., Ltd. | — | 6 | (6 | ) | — | — | ||||||||||||||
Channel Corporation | — | 6,000 | (3,000 | ) | — | 3,000 | ||||||||||||||
Key management personnel | 16,996 | 20,855 | (17,189 | ) | (3,043 | ) | 17,619 | |||||||||||||
| 1 | Transactions between related parties, such as settlements arising from operating activities and deposits, are expressed in net amount. |
| 2 | Excluded from the Group’s related party as of December 31, 2022. |
2021 | 2022 | |||||||||||||||
Equity investment and others | Withdrawal and others | Equity investment and others | Withdrawal and others | |||||||||||||
(In millions of Korean won) | ||||||||||||||||
Balhae Infrastructure Company | ₩ | 279 | ₩ | 3,620 | ₩ | — | ₩ | 26,054 | ||||||||
KB GwS Private Securities Investment Trust * | — | 188,836 | — | — | ||||||||||||
KoFC POSCO Hanwha KB Shared Growth Private Equity Fund No.2 * | — | 1,950 | — | 5 | ||||||||||||
POSCO-KB Shipbuilding Fund | — | 5,925 | — | 950 | ||||||||||||
KB Pre IPO Secondary Venture Fund No.1 * | — | 292 | — | 1,429 | ||||||||||||
KB-KDBC Pre-IPO New Technology Business Investment Fund | — | 3,000 | — | 5,200 | ||||||||||||
KB-SJ Tourism Venture Fund | 500 | — | — | 400 | ||||||||||||
Korea Credit Bureau Co., Ltd. | — | 90 | — | — | ||||||||||||
KB-UTC Inno-Tech Venture Fund | 5,085 | — | — | — | ||||||||||||
KB-Solidus Global Healthcare Fund | — | — | — | 19,630 | ||||||||||||
KB-Stonebridge Secondary Private Equity Fund | 10,734 | 10,992 | 4,369 | 4,216 | ||||||||||||
KB Star Office Private Real Estate Master Fund No.1 * | — | 601 | — | 26,240 | ||||||||||||
KB SPROTT Renewable Private Equity Fund No.1 | — | — | 12,247 | — | ||||||||||||
KB-NAU Special Situation Corporate Restructuring Private Equity Fund | 6,968 | — | 1,320 | 4,706 | ||||||||||||
JR Global REIT * | — | 65,025 | — | — | ||||||||||||
KB Bio Private Equity No.3 Ltd. * | 10,000 | — | — | 10,000 | ||||||||||||
K The 15th REIT Co., Ltd. * | 8,600 | 8,600 | — | — | ||||||||||||
Project Vanilla Co., Ltd. * | — | — | — | 525 | ||||||||||||
KB Social Impact Investment Fund | 1,500 | — | — | — | ||||||||||||
KB-TS Technology Venture Private Equity Fund | 1,510 | 2,976 | — | 4,536 | ||||||||||||
Keystone-Hyundai Securities No.1 Private Equity Fund * | — | 1,925 | — | — | ||||||||||||
KB-Brain KOSDAQ Scale-up New Technology Business Investment Fund | 8,000 | 8,200 | — | 12,800 | ||||||||||||
Aju Good Technology Venture Fund | — | 769 | — | 5,400 | ||||||||||||
G payment Joint Stock Company | 9,029 | — | — | — | ||||||||||||
498/7 Owners LLC * | — | — | — | 166,851 | ||||||||||||
KB-KTB Technology Venture Fund | — | — | 11,200 | — | ||||||||||||
KB-SOLIDUS Healthcare Investment Fund | — | — | 18,000 | — | ||||||||||||
Paramark KB Fund No.1 | — | — | 12,444 | 2,285 | ||||||||||||
FineKB Private Equity Fund No.1 | 8,375 | — | 7,500 | 3,100 | ||||||||||||
KB-GeneN Medical Venture Fund No.1 | — | — | 2,000 | — | ||||||||||||
2021 | 2022 | |||||||||||||||
Equity investment and others | Withdrawal and others | Equity investment and others | Withdrawal and others | |||||||||||||
(In millions of Korean won) | ||||||||||||||||
KB-BridgePole Venture Investment Fund | — | — | 850 | — | ||||||||||||
KB-Kyobo New Mobility Power Fund | — | — | 3,000 | — | ||||||||||||
DA-Friend New Technology Investment Fund No.2 | — | — | 988 | — | ||||||||||||
Cornerstone Pentastone Fund No.4 | — | — | 818 | — | ||||||||||||
SKS-VLP New Technology Investment Fund No.2 | — | — | 1,156 | — | ||||||||||||
JS Private Equity Fund No.3 | — | — | 1,700 | — | ||||||||||||
Mirae Asset Mobility Investment Fund No.1 | — | — | 2,000 | — | ||||||||||||
KB-FT 1st Green Growth Investment Fund | — | — | 2,000 | — | ||||||||||||
THE CHAEUL FUND NO.1 | — | — | 1,000 | — | ||||||||||||
Star-Lord General Investors Private Real Estate Investment Company No.10 | — | — | 46,700 | 10 | ||||||||||||
KB Co-Investment Private Equity Fund No.1 | — | — | 7,268 | — | ||||||||||||
Glenwood Credit Private Equity Fund No.2 | — | — | 42,000 | — | ||||||||||||
Apollo REIT PropCo LLC * | — | — | 19,968 | 19,968 | ||||||||||||
TMAP Mobility Co., Ltd. | — | — | 200,000 | — | ||||||||||||
POSITIVE Sobujang Venture Fund No.1 | — | — | 2,000 | — | ||||||||||||
History 2022 Fintech Fund | — | — | 2,000 | — | ||||||||||||
PEBBLES-MW M.C.E New Technology Investment Fund 1 st | — | — | 2,000 | — | ||||||||||||
KB-NP Green ESG New Technology Venture Capital Fund | — | — | 9,350 | — | ||||||||||||
Nextrade Co., Ltd. | — | — | 9,700 | — | ||||||||||||
KB-Badgers Future Mobility ESG Fund No.1 | — | — | 2,137 | — | ||||||||||||
Shinhan Global Mobility Fund1 | — | — | 1,345 | — | ||||||||||||
SKB Next Unicorn K-Battery Fund No.1 | — | — | 1,995 | — | ||||||||||||
| * | Excluded from the Group’s related party as of December 31, 2022. |
December 31, 2021 | December 31, 2022 | |||||||||
(In millions of Korean won or in a US Dollar or Malaysian ringgit) | ||||||||||
Associates and joint ventures | ||||||||||
Balhae Infrastructure Company | Purchase of securities | ₩ | 6,154 | ₩ | 6,154 | |||||
Korea Credit Bureau Co., Ltd. | Unused lines of credit for credit card | 565 | 562 | |||||||
Incheon Bridge Co., Ltd. | Loan commitments in Korean won | 20,000 | 20,000 | |||||||
Unused lines of credit for credit card | 93 | 89 | ||||||||
KoFC POSCO Hanwha KB Shared Growth Private Equity Fund No.2 * | Commitments on loss absorption priority | 10,000 | — | |||||||
SY Auto Capital Co., Ltd. | Unused lines of credit for credit card | 98 | 110 | |||||||
Food Factory Co., Ltd. | Unused lines of credit for credit card | 82 | 52 | |||||||
KB No.18 Special Purpose Acquisition Company * | Unused lines of credit for credit card | 15 | — | |||||||
KB No.19 Special Purpose Acquisition Company * | Unused lines of credit for credit card | 1 | — | |||||||
KB No.23 Special Purpose Acquisition Company | Unused lines of credit for credit card | — | 12 | |||||||
CellinCells Co., Ltd. | Unused lines of credit for credit card | 18 | 17 | |||||||
RAND Bio Science Co., Ltd. | Unused lines of credit for credit card | 24 | 25 | |||||||
Big Dipper Co., Ltd. | Unused lines of credit for credit card | 43 | 27 | |||||||
SwatchOn Inc. * | Unused lines of credit for credit card | 127 | — | |||||||
Gomi corporation Inc. | Unused lines of credit for credit card | 2 | 16 | |||||||
COSES GT Co., Ltd. | Unused lines of credit for credit card | 15 | 24 | |||||||
GENINUS Inc. * | Unused lines of credit for credit card | 43 | — | |||||||
Spark Biopharma Inc. | Unused lines of credit for credit card | 33 | 33 | |||||||
Mantisco Co., Ltd. | Unused lines of credit for credit card | 29 | 15 | |||||||
IMBiologics Corp. | Unused lines of credit for credit card | 18 | 18 | |||||||
SuperNGine Co., Ltd. | Unused lines of credit for credit card | 18 | 14 | |||||||
IGGYMOB Co., Ltd. | Unused lines of credit for credit card | 14 | 35 | |||||||
Pin Therapeutics Inc. | Unused lines of credit for credit card | — | 37 | |||||||
Grinergy | Unused lines of credit for credit card | — | 10 | |||||||
S&E Bio Co., Ltd. | Unused lines of credit for credit card | — | 40 | |||||||
Desilo Inc. | Unused lines of credit for credit card | — | — | |||||||
ZIPDOC Inc. | Unused lines of credit for credit card | — | — | |||||||
Wemade Connect Co., Ltd. | Unused lines of credit for credit card | — | 148 | |||||||
KB Pre IPO Secondary Venture Fund No.1 * | Commitments on loss absorption priority | 1,671 | — | |||||||
KB-TS Technology Venture Private Equity Fund | Purchase of securities | 616 | 110 | |||||||
KB SPROTT Renewable Private Equity Fund No.1 | Purchase of securities | 18,704 | 5,140 | |||||||
KB-Stonebridge Secondary Private Equity Fund | Purchase of securities | 5,579 | 864 | |||||||
KB-NAU Special Situation Corporate Restructuring Private Equity Fund | Purchase of securities | 16,608 | 15,288 | |||||||
All Together Korea Fund No.2 | Purchase of securities | — | 990,000 | |||||||
KB-KTB Technology Venture Fund | Purchase of securities | 22,400 | 11,200 | |||||||
KB-SOLIDUS Healthcare Investment Fund | Purchase of securities | 88,200 | 70,200 | |||||||
KB Co-Investment Private Equity Fund No.1 | Purchase of securities | 20,000 | 15,732 | |||||||
KB-Badgers Future Mobility ESG Fund No.1 | Purchase of securities | — | 42,863 | |||||||
KB-NP Green ESG New Technology Venture Capital Fund | Purchase of securities | — | 40,650 | |||||||
December 31, 2021 | December 31, 2022 | |||||||||
(In millions of Korean won or in a US Dollar or Malaysian ringgit) | ||||||||||
FineKB Private Equity Fund No.1 | Purchase of securities | 16,625 | 9,125 | |||||||
KB-Solidus Global Healthcare Fund | Purchase of securities | 2,120 | 2,120 | |||||||
Commitments on loss | 4,500 | 4,500 | ||||||||
Paramark KB Fund No.1 | Purchase of securities | 27,960 | 17,832 | |||||||
RMGP Bio-Pharma Investment Fund, L.P. | Purchase of securities | USD | 5,169,932 | USD | 4,094,487 | |||||
RMGP Bio-Pharma Investment, L.P. | Purchase of securities | USD | 12,615 | USD | 10,731 | |||||
KB-MDI Centauri Fund LP | Purchase of securities | USD | 6,622,923 | USD | 1,744,518 | |||||
Hibiscus Fund LP | Purchase of securities | MYR | 33,333,333 | MYR | 16,666,667 | |||||
RMG-KB BP Management Ltd. | Purchase of securities | USD | 616,170 | USD | 699,733 | |||||
RMG-KB BioAccess Fund L.P. | Purchase of securities | USD | 29,702,324 | USD | 27,428,899 | |||||
Key management personnel | Loan commitments in Korean won | 2,018 | 2,354 | |||||||
| * | Excluded from the Group’s related party as of December 31, 2022. |
2020 | ||||||||||||||||
Short-term employee benefits | Post-employment benefits | Share-based payments | Total | |||||||||||||
(In millions of Korean won) | ||||||||||||||||
Registered directors (executive) | ₩ | 8,111 | ₩ | 672 | ₩ | 6,369 | ₩ | 15,152 | ||||||||
Registered directors (non-executive) | 1,133 | — | — | 1,133 | ||||||||||||
Non-registered directors | 10,782 | 396 | 6,934 | 18,112 | ||||||||||||
| ₩ | 20,026 | ₩ | 1,068 | ₩ | 13,303 | ₩ | 34,397 | |||||||||
2021 | ||||||||||||||||
Short-term employee benefits | Post-employment benefits | Share-based payments | Total | |||||||||||||
(In millions of Korean won) | ||||||||||||||||
Registered directors (executive) | ₩ | 8,152 | ₩ | 966 | ₩ | 11,655 | ₩ | 20,773 | ||||||||
Registered directors (non-executive) | 1,061 | — | — | 1,061 | ||||||||||||
Non-registered directors | 12,820 | 466 | 14,424 | 27,710 | ||||||||||||
| ₩ | 22,033 | ₩ | 1,432 | ₩ | 26,079 | ₩ | 49,544 | |||||||||
2022 | ||||||||||||||||
Short-term employee benefits | Post-employment benefits | Share-based payments | Total | |||||||||||||
(In millions of Korean won) | ||||||||||||||||
Registered directors (executive) | ₩ | 8,725 | ₩ | 863 | ₩ | 7,487 | ₩ | 17,075 | ||||||||
Registered directors (non-executive) | 1,058 | — | — | 1,058 | ||||||||||||
Non-registered directors | 16,756 | 484 | 12,432 | 29,672 | ||||||||||||
| ₩ | 26,539 | ₩ | 1,347 | ₩ | 19,919 | ₩ | 47,805 | |||||||||
Assets held as collateral | December 31, 2021 | December 31, 2022 | ||||||||
(In millions of Korean won) | ||||||||||
Associates | ||||||||||
KB Star Office Private Real Estate Master Fund No.1 | Real estate | ₩ | 13,000 | ₩ | — | |||||
Key management personnel | Time deposits and others | 745 | 457 | |||||||
Real estate | 5,176 | 7,483 | ||||||||
December 31, 2021 | December 31, 2022 | |||||||
(In millions of Korean won) | ||||||||
Assets | ||||||||
Cash and due from financial institutions | ₩ | 608,076 | ₩ | 351,056 | ||||
Financial assets at fair value through profit or loss | 440,760 | 1,522,314 | ||||||
Loans at amortized cost | 249,128 | 522,326 | ||||||
Investments in subsidiaries * | ||||||||
Banking subsidiaries | 14,821,721 | 14,821,721 | ||||||
Nonbanking subsidiaries. | 11,919,717 | 11,919,717 | ||||||
Other assets | 831,977 | 1,316,693 | ||||||
Total assets | ₩ | 28,871,379 | ₩ | 30,453,827 | ||||
Liabilities and shareholders’ equity | ||||||||
Debentures | ₩ | 5,552,791 | ₩ | 4,956,949 | ||||
Other liabilities | 805,614 | 1,265,062 | ||||||
Shareholders’ equity | 22,512,974 | 24,231,816 | ||||||
Total liabilities and shareholders’ equity | ₩ | 28,871,379 | ₩ | 30,453,827 | ||||
| * | Investments in subsidiaries were accounted at cost method in accordance with IAS No.27. |
2020 | 2021 | 2022 | ||||||||||
(In millions of Korean won) | ||||||||||||
Income | ||||||||||||
Dividends from subsidiaries | ₩ | 1,573,411 | ₩ | 1,617,949 | ₩ | 1,871,223 | ||||||
Interest from subsidiaries | 3,519 | 7,897 | 17,310 | |||||||||
Other income | 22,749 | 30,953 | 52,777 | |||||||||
Total income | 1,599,679 | 1,656,799 | 1,941,310 | |||||||||
Expense | ||||||||||||
Interest expense | 132,437 | 120,469 | 112,353 | |||||||||
Non-interest expense | 87,876 | 99,745 | 159,708 | |||||||||
Total expense | 220,313 | 220,214 | 272,061 | |||||||||
Profit before income tax expense | 1,379,366 | 1,436,585 | 1,669,249 | |||||||||
Income tax benefit | 49 | 2,281 | 15,263 | |||||||||
Profit for the year | 1,379,415 | 1,438,866 | 1,684,512 | |||||||||
Other comprehensive gain(loss) for the year, net of tax | (368 | ) | (298 | ) | 2,483 | |||||||
Total comprehensive income for the year | ₩ | 1,379,047 | ₩ | 1,438,568 | ₩ | 1,686,995 | ||||||
2020 | 2021 | 2022 | ||||||||||
(In millions of Korean won) | ||||||||||||
Operating activities | ||||||||||||
Net income | ₩ | 1,379,415 | ₩ | 1,438,866 | ₩ | 1,684,512 | ||||||
Reconciliation of net income to net cash provided by operating activities: | ||||||||||||
Other operating activities, net | 9,930 | (92,785 | ) | 7,807 | ||||||||
Net cash inflow from operating activities | 1,389,345 | 1,346,081 | 1,692,319 | |||||||||
Investing activities | ||||||||||||
Net payments to subsidiaries | (2,347,543 | ) | (219,268 | ) | — | |||||||
Other investing activities, net | (146,477 | ) | (39,477 | ) | (1,409,500 | ) | ||||||
Net cash outflow from investing activities | (2,494,020 | ) | (258,745 | ) | (1,409,500 | ) | ||||||
Financing activities | ||||||||||||
Net increase (decrease) in borrowings | 100,000 | (100,000 | ) | — | ||||||||
Increases in debentures | 1,537,091 | 389,405 | 498,898 | |||||||||
Repayments of debentures and lease liabilities | (940,610 | ) | (970,535 | ) | (1,100,584 | ) | ||||||
Issuance of hybrid securities | 1,296,693 | 1,142,203 | 1,596,000 | |||||||||
Cash dividends paid | (883,952 | ) | (1,053,417 | ) | (1,564,153 | ) | ||||||
Net cash inflow (outflow) from financing activities | 1,109,222 | (592,344 | ) | (569,839 | ) | |||||||
Net increase (decrease) in cash and cash equivalents | 4,547 | 494,992 | (287,020 | ) | ||||||||
Cash and cash equivalents as of January 1 | 18,534 | 23,081 | 518,073 | |||||||||
Cash and cash equivalents as of December 31 | ₩ | 23,081 | ₩ | 518,073 | ₩ | 231,053 | ||||||