UNITED STATES
SECURITIES AND EXCHANGE COMMISSION
Washington, D.C. 20549
FORM N-CSR
CERTIFIED SHAREHOLDER REPORT OF REGISTERED MANAGEMENT
INVESTMENT COMPANIES
Investment Company Act File Number 811-22263
Exchange Traded Concepts Trust
(Exact name of registrant as specified in charter)
10900 Hefner Pointe Drive
Suite 401
Oklahoma City, OK 73120
(Address of principal executive offices) (Zip code)
J. Garrett Stevens
Exchange Traded Concepts Trust
10900 Hefner Pointe Drive
Suite 401
Oklahoma City, OK 73120
(Name and address of agent for service)
Copy to:
Christopher Menconi
Morgan, Lewis & Bockius LLP
1111 Pennsylvania Avenue NW
Washington, DC 20004
Registrant’s telephone number, including area code: 1-405-778-8377
Date of fiscal year end: November 30, 2020
Date of reporting period: November 30, 2020
| Item 1. | Reports to Stockholders. |
The registrant’s schedules as of the close of the reporting period, as set forth in §§ 210.12-12 through 210.12-14 of Regulation S-X [17 CFR §§ 210-12.12-12.14], are attached hereto.
![]()
EXCHANGE TRADED CONCEPTS TRUST
6 Meridian Low Beta Equity Strategy ETF
6 Meridian Mega Cap Equity ETF
6 Meridian Small Cap Equity ETF
6 Meridian Hedged Equity-Index Option Strategy ETF
Annual Report
November 30, 2020
![]()
As permitted by regulations adopted by the U.S. Securities and Exchange Commission (the “Commission”), the Funds may determine to no longer send shareholder reports by mail, unless you specifically request paper copies of the reports from your financial intermediary, such as a broker-dealer or bank. Instead, the reports will be made available on a website, and you will be notified by mail each time a report is posted and provided with a website link to access the report.
If you already elected to receive shareholder reports electronically, you will not be affected by this change and you need not take any action. Please contact your financial intermediary to elect to receive shareholder reports and other Fund communications electronically.
You may elect to receive all future reports in paper free of charge. Please contact your financial intermediary to inform them that you wish to continue receiving paper copies of your shareholder reports and for details about whether your election to receive reports in paper will apply to all funds held with your financial intermediary.
6 Meridian
Table of Contents
1 | ||
9 | ||
19 | ||
21 | ||
23 | ||
27 | ||
28 | ||
39 | ||
40 | ||
42 | ||
43 | ||
44 |
The Funds file their complete schedule of Fund holdings with the Commission for the first and third quarters of each fiscal year as an exhibit to each Fund’s report on Form N-PORT within sixty days after the period end. Each Fund’s Form N-PORT reports are available on the Commission’s website at https://www.sec.gov.
Exchange Traded Concepts, LLC’s proxy voting policies and procedures are attached to each Fund’s Statement of Additional Information (the “SAI”). The SAI, as well as information relating to how each Fund voted proxies relating to its securities during the most recent 12-month period ended June 30, is available (i) without charge, upon request, by calling 866-SIXM-ETF (749-6383); and (ii) on the Commission’s website at https://www.sec.gov.
Dear Shareholders,
Thank you for your investment in the 6 Meridian Low Beta Equity Strategy ETF (“SIXL” or the “Fund”). The information presented in this report relates to the operations of SIXL for the fiscal period May 8, 2020 (Commencement of Operations) through November 30, 2020.
The Fund is an actively managed ETF that seeks to provide capital appreciation by investing in equity securities, mainly common stocks. The Fund may invest in equity security companies of any capitalization. The Fund may also invest in real estate investment trusts (“REITs”). The Fund’s Sub-Adviser, 6 Meridian LLC (the “Sub-Adviser”) uses a quantitatively driven strategy designed to emphasize high quality securities with a relatively low exposure to broad equity market risk. The Sub-Adviser believes that, when held over a full market cycle, high quality securities with lower relative exposure to broad market risk may produce high risk-adjusted returns than securities of lower quality with higher relative exposure to broad market risk.
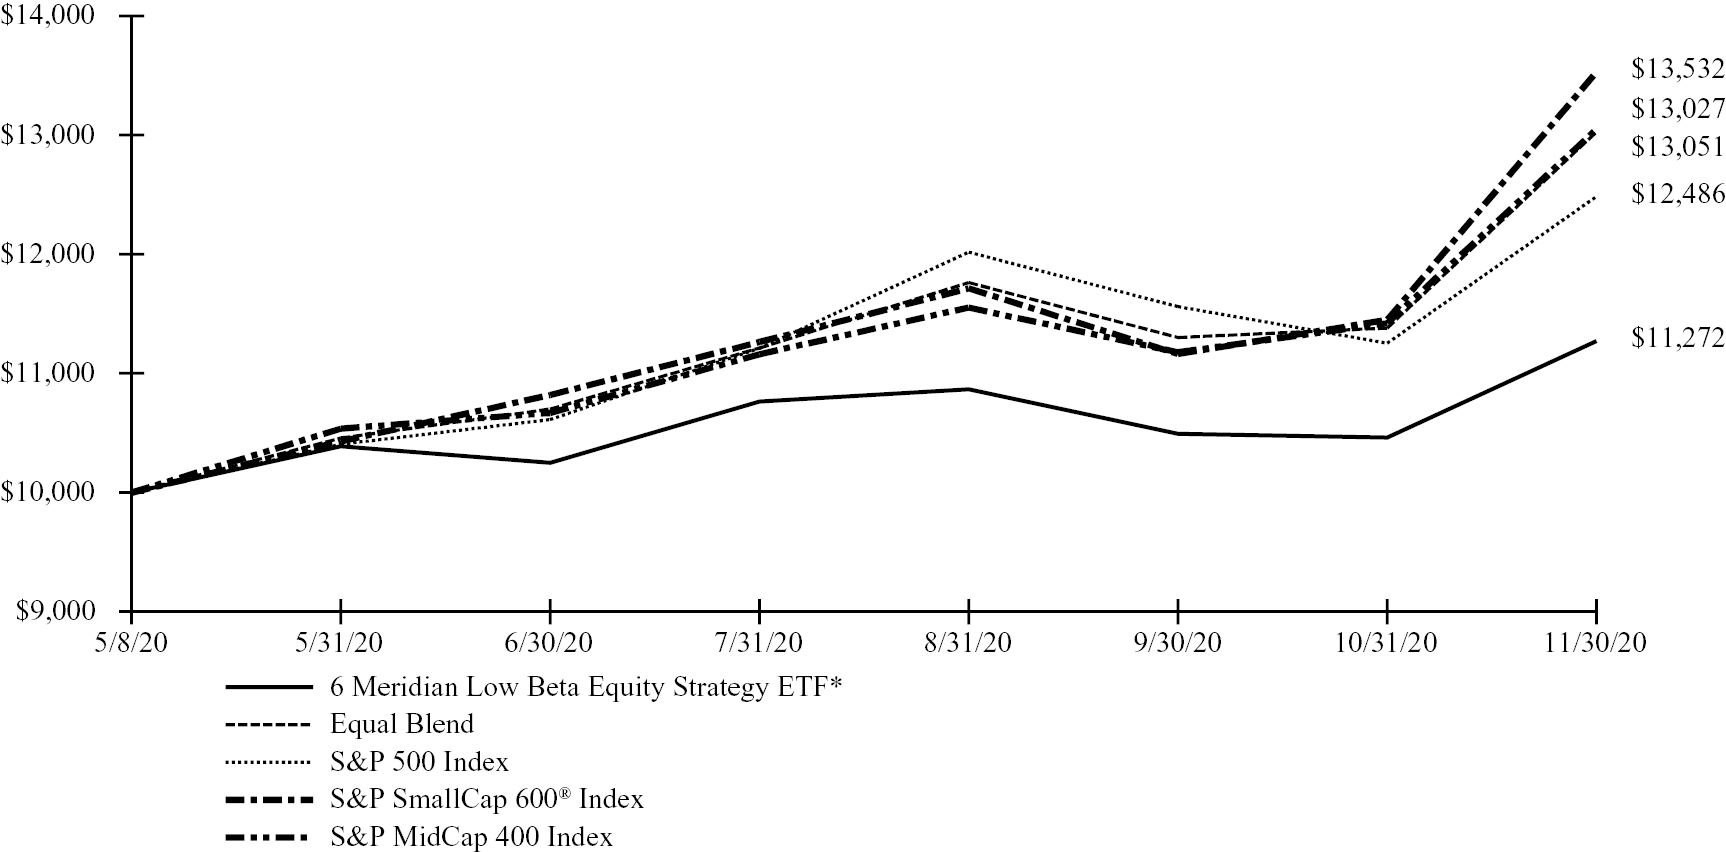
For the period ended November 30, 2020, the Fund’s market price increased 12.72%, and the net asset value increased 12.72%, while the S&P 500 Index, a broad market index, increased 24.86% over the same period.
The Fund began trading on May 11, 2020, with 3,250,000 shares outstanding as of November 30, 2020.
We appreciate your investment in the 6 Meridian Low Beta Equity Strategy ETF.
Sincerely,
Garrett Stevens,
Chief Executive Officer
Exchange Traded Concepts, Adviser to the Fund
The S&P 500 Index is a market-value weighted index consisting of 500 stocks chosen for market size, liquidity, and industry group representation, with each stock’s weight in the S&P 500 Index proportionate to its market value.
The S&P SmallCap 600® Index seeks to measure the small-cap segment of the U.S. equity market. The index is designed to track companies that meet specific inclusion criteria to ensure that they are liquid and financially viable.
The S&P MidCap 400 Index provides investors with a benchmark for mid-sized companies. The index, which is distinct from the large-cap S&P 500®, is designed to measure the performance of 400 mid-sized companies, reflecting the distinctive risk and return characteristics of this market segment.
This material represents an assessment of the market environment at a specific point in time and is not intended to be a forecast of future events, or a guarantee of future results. This information should not be relied upon by the reader as research or investment advice.
1
6 Meridian
Low Beta Equity Strategy ETF
Management Discussion of Fund Performance
(Unaudited) (Concluded)
Growth of a $10,000 Investment‡
(at Net Asset Value)‡
CUMULATIVE ANNUAL TOTAL RETURN | |||
Cumulative Inception to Date | |||
Net Asset | Market | ||
6 Meridian Low Beta Equity Strategy ETF | 12.72% | 12.72% | |
Equal Blend of the following 3 Indices | 30.27% | 30.27% | |
S&P 500 Index | 24.86% | 24.86% | |
S&P SmallCap 600® Index | 35.32% | 35.32% | |
S&P MidCap 400 Index | 30.51% | 30.51% | |
* Fund commenced operations on May 8, 2020.
‡ Unaudited
The performance data quoted herein represents past performance and the return and value of an investment in the Fund will fluctuate so that shares, when redeemed or sold in the market, may be worth more or less than their original cost. Past performance is no guarantee of future performance and should not be considered as a representation of the future results of the Fund. The Fund’s performance assumes the reinvestment of all dividends and all capital gains. Index returns assume reinvestment of dividends and, unlike the Fund’s returns, do not reflect any fees or expenses. If such fees and expenses were included in the Index returns, the performance would have been lower. Please note that one cannot invest directly in an unmanaged index.
Investors should consider the investment objectives, risks, charges and expenses of the Fund carefully before investing. A prospectus, containing this and other information, is available at www.6meridianfunds.com. Investors should read the prospectus carefully before investing. There are risks associated with investing, including possible loss of principal.
Current performance may be lower or higher than the performance data shown above.
Performance data current to the most recent month-end is available at www.6meridianfunds.com.
There are no assurances that the Fund will meet its stated objective.
The Fund’s holdings and allocations are subject to change and should not be considered recommendations to buy individual securities.
Returns shown do not reflect the deduction of taxes that a shareholder would pay on Fund distributions or the redemption of Fund shares.
2
6 Meridian
Mega Cap Equity ETF
Management Discussion of Fund Performance
(Unaudited)
Dear Shareholders,
Thank you for your investment in the 6 Meridian Mega Cap Equity ETF (“SIXA” or the “Fund”). The information presented in this report relates to the operations of SIXA for the fiscal period May 8, 2020 (Commencement of Operations) through November 30, 2020.
The Fund is an actively managed ETF that seeks to provide capital appreciation by investing in mega capitalization equity securities, mainly common stocks. The Fund’s Sub-Adviser, 6 Meridian LLC (the “Sub-Adviser”), considers mega capitalization companies to be the largest 10% of stocks included in the Russell 3000 Index by market capitalization. In selecting investments for the Fund, the Sub-Adviser uses a quantitatively driven strategy designed to emphasize high quality large-capitalization stocks.
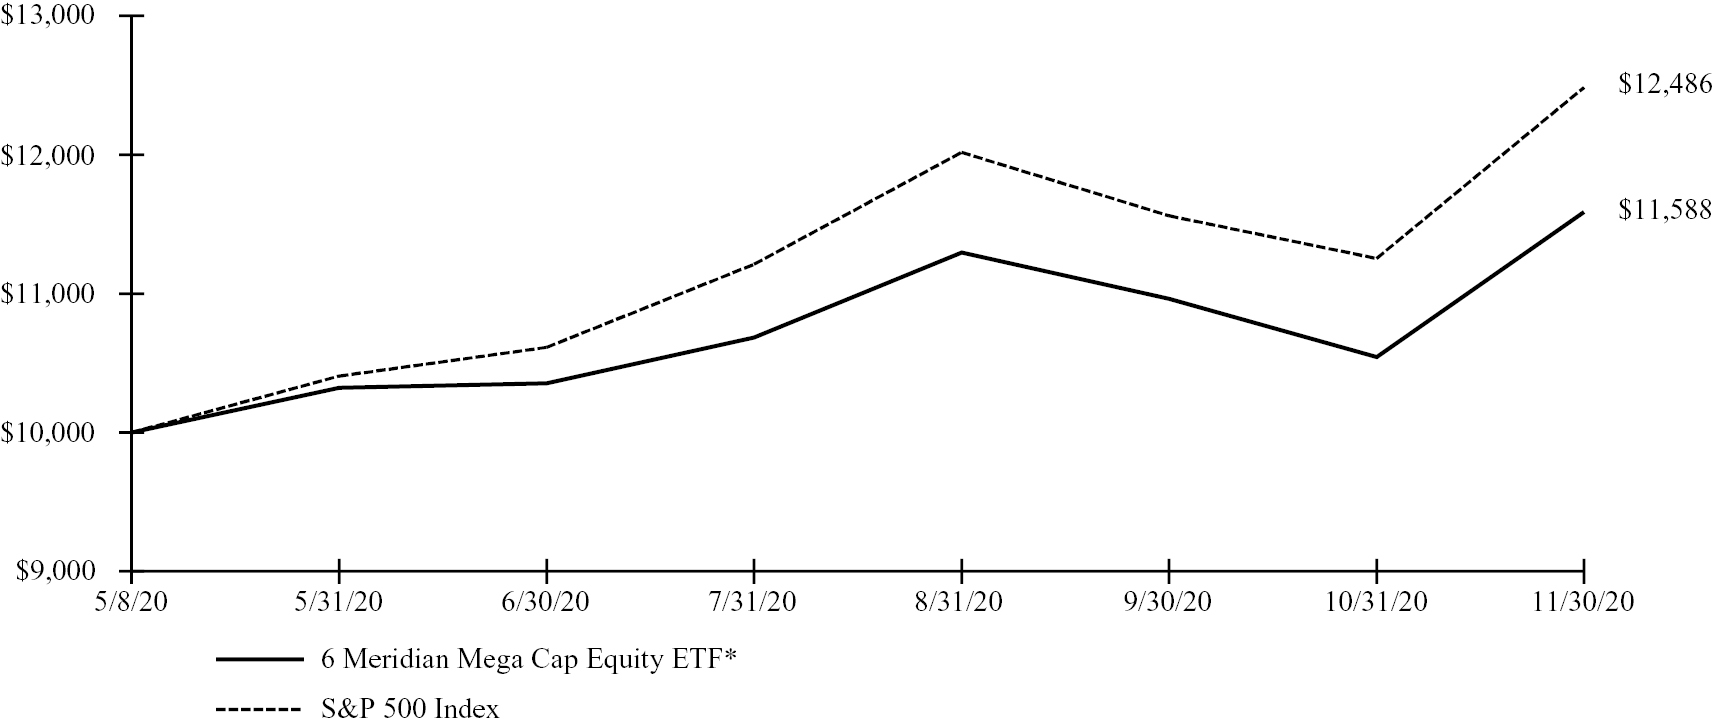
For the period ended November 30, 2020, the Fund’s market price increased 15.80%, and the net asset value increased 15.88%, while the S&P 500 Index, a broad market index, increased 24.86% over the same period.
The Fund began trading on May 11, 2020, with 3,975,000 shares outstanding as of November 30, 2020.
We appreciate your investment in the 6 Meridian Mega Cap Equity ETF.
Sincerely,
Garrett Stevens,
Chief Executive Officer
Exchange Traded Concepts, Adviser to the Fund
The S&P 500 Index is a market-value weighted index consisting of 500 stocks chosen for market size, liquidity, and industry group representation, with each stock’s weight in the S&P 500 Index proportionate to its market value.
This material represents an assessment of the market environment at a specific point in time and is not intended to be a forecast of future events, or a guarantee of future results. This information should not be relied upon by the reader as research or investment advice.
3
6 Meridian
Mega Cap Equity ETF
Management Discussion of Fund Performance
(Unaudited) (Concluded)
Growth of a $10,000 Investment‡
(at Net Asset Value)‡
CUMULATIVE ANNUAL TOTAL RETURN | |||
Cumulative Inception to Date | |||
Net Asset | Market | ||
6 Meridian Mega Cap Equity ETF | 15.88% | 15.80% | |
S&P 500 Index | 24.86% | 24.86% | |
* Fund commenced operations on May 8, 2020.
‡ Unaudited
The performance data quoted herein represents past performance and the return and value of an investment in the Fund will fluctuate so that shares, when redeemed or sold in the market, may be worth more or less than their original cost. Past performance is no guarantee of future performance and should not be considered as a representation of the future results of the Fund. The Fund’s performance assumes the reinvestment of all dividends and all capital gains. Index returns assume reinvestment of dividends and, unlike the Fund’s returns, do not reflect any fees or expenses. If such fees and expenses were included in the Index returns, the performance would have been lower. Please note that one cannot invest directly in an unmanaged index.
Investors should consider the investment objectives, risks, charges and expenses of the Fund carefully before investing. A prospectus, containing this and other information, is available at www.6meridianfunds.com. Investors should read the prospectus carefully before investing. There are risks associated with investing, including possible loss of principal.
Current performance may be lower or higher than the performance data shown above.
Performance data current to the most recent month-end is available at www.6meridianfunds.com.
There are no assurances that the Fund will meet its stated objective.
The Fund’s holdings and allocations are subject to change and should not be considered recommendations to buy individual securities.
Returns shown do not reflect the deduction of taxes that a shareholder would pay on Fund distributions or the redemption of Fund shares.
4
6 Meridian
Small Cap Equity ETF
Management Discussion of Fund Performance
(Unaudited)
Dear Shareholders,
Thank you for your investment in the 6 Meridian Small Cap Equity ETF (“SIXS” or the “Fund”). The information presented in this report relates to the operations of SIXS for the fiscal period May 8, 2020 (Commencement of Operations) through November 30, 2020.
The Fund is an actively managed ETF that seeks to provide capital appreciation by investing in small-capitalization equity securities, mainly common stocks. The Fund may also invest in equity securities of companies of any capitalization and may also invest in real estate investment trusts (“REITs”). The Fund’s Sub-Adviser, 6 Meridian LLC (the “Sub-Adviser”), considers small-capitalization securities to be those with market capitalizations within the range of the market capitalization of companies included in the S&P SmallCap 600® Index. In selecting investments for the Fund, the Sub-Adviser uses a quantitatively-driven strategy designed to emphasize high quality small-capitalization securities. The Fund’s holdings are concentrated in low beta and value small cap stocks.
For the period ended November 30, 2020, the Fund’s market price increased 32.95%, and the net asset value increased 33.11%, while the S&P SmallCap 600® Index, a broad market index, increased 35.32% over the same period.
The Fund began trading on May 11, 2020, with 925,000 shares outstanding as of November 30, 2020.
We appreciate your investment in the 6 Meridian Small Cap Equity ETF.
Sincerely,
Garrett Stevens,
Chief Executive Officer
Exchange Traded Concepts, Adviser to the Fund
The S&P SmallCap 600® Index seeks to measure the small-cap segment of the U.S. equity market. The index is designed to track companies that meet specific inclusion criteria to ensure that they are liquid and financially viable.
This material represents an assessment of the market environment at a specific point in time and is not intended to be a forecast of future events, or a guarantee of future results. This information should not be relied upon by the reader as research or investment advice.
5
6 Meridian
Small Cap Equity ETF
Management Discussion of Fund Performance
(Unaudited) (Concluded)
Growth of a $10,000 Investment‡
(at Net Asset Value)‡
CUMULATIVE ANNUAL TOTAL RETURN | |||
Cumulative Inception to Date | |||
Net Asset | Market | ||
6 Meridian Small Cap Equity ETF | 33.11% | 32.95% | |
S&P SmallCap 600® Index | 35.32% | 35.32% | |

* Fund commenced operations on May 8, 2020.
‡ Unaudited
The performance data quoted herein represents past performance and the return and value of an investment in the Fund will fluctuate so that shares, when redeemed or sold in the market, may be worth more or less than their original cost. Past performance is no guarantee of future performance and should not be considered as a representation of the future results of the Fund. The Fund’s performance assumes the reinvestment of all dividends and all capital gains. Index returns assume reinvestment of dividends and, unlike the Fund’s returns, do not reflect any fees or expenses. If such fees and expenses were included in the Index returns, the performance would have been lower. Please note that one cannot invest directly in an unmanaged index.
Investors should consider the investment objectives, risks, charges and expenses of the Fund carefully before investing. A prospectus, containing this and other information, is available at www.6meridianfunds.com. Investors should read the prospectus carefully before investing. There are risks associated with investing, including possible loss of principal.
Current performance may be lower or higher than the performance data shown above.
Performance data current to the most recent month-end is available at www.6meridianfunds.com.
There are no assurances that the Fund will meet its stated objective.
The Fund’s holdings and allocations are subject to change and should not be considered recommendations to buy individual securities.
Returns shown do not reflect the deduction of taxes that a shareholder would pay on Fund distributions or the redemption of Fund shares.
6
6 Meridian
Hedged Equity-Index Option Strategy ETF
Management Discussion of Fund Performance
(Unaudited)
Dear Shareholders,
Thank you for your investment in the 6 Meridian Hedged Equity-Index Option Strategy ETF (“SIXH” or the “Fund”). The information presented in this report relates to the operations of SIXH for the fiscal period May 8, 2020 (Commencement of Operations) through November 30, 2020.
The Fund is an actively managed ETF that seeks to provide capital appreciation by investing in a portfolio of equity securities, mostly common stocks, while selling call options against market indices or funds. The Fund may invest in securities of companies of any capitalization. 6 Meridian LLC (the “Sub-Adviser”) employs a strategy pairing a portfolio of equity securities with an index call option writing overlay designed to reduce the exposure of the Fund to broad equity market risk with the goal of providing good risk-adjusted returns. Pursuant to this investment strategy, the Sub-Adviser will sell (or write) call options on broad equity market indices or funds. In constructing the equity portfolio, the Sub-Adviser uses quantitatively-driven methods emphasizing high quality large-capitalization stocks.
For the period ended November 30, 2020, the Fund’s market price increased 5.79%, and the net asset value increased 6.14%, while the S&P 500 Buy/Write Index, a broad market index which also writes options against its portfolio, increased 15.99% over the same period.
The Fund began trading on May 11, 2020, with 7,600,000 shares outstanding as of November 30, 2020.
We appreciate your investment in the 6 Meridian Hedged Equity-Index Option Strategy ETF.
Sincerely,
Garrett Stevens,
Chief Executive Officer
Exchange Traded Concepts, Adviser to the Fund
The S&P 500 Buy/Write Index is a benchmark index designed to show the hypothetical performance of a portfolio that engages in a buy-write strategy using S&P 500 index call options.
This material represents an assessment of the market environment at a specific point in time and is not intended to be a forecast of future events, or a guarantee of future results. This information should not be relied upon by the reader as research or investment advice.
7
6 Meridian
Hedged Equity-Index Option Strategy ETF
Management Discussion of Fund Performance
(Unaudited) (Concluded)
Growth of a $10,000 Investment‡
(at Net Asset Value)‡
CUMULATIVE ANNUAL TOTAL RETURN | |||
Cumulative Inception to Date | |||
Net Asset | Market | ||
6 Meridian Hedged Equity-Index Option Strategy ETF | 6.14% | 5.79% | |
S&P 500 Buy/Write Index | 15.99% | 15.99% | |

* Fund commenced operations on May 8, 2020.
‡ Unaudited
The performance data quoted herein represents past performance and the return and value of an investment in the Fund will fluctuate so that shares, when redeemed or sold in the market, may be worth more or less than their original cost. Past performance is no guarantee of future performance and should not be considered as a representation of the future results of the Fund. The Fund’s performance assumes the reinvestment of all dividends and all capital gains. Index returns assume reinvestment of dividends and, unlike the Fund’s returns, do not reflect any fees or expenses. If such fees and expenses were included in the Index returns, the performance would have been lower. Please note that one cannot invest directly in an unmanaged index.
Investors should consider the investment objectives, risks, charges and expenses of the Fund carefully before investing. A prospectus, containing this and other information, is available at www.6meridianfunds.com. Investors should read the prospectus carefully before investing. There are risks associated with investing, including possible loss of principal.
Current performance may be lower or higher than the performance data shown above.
Performance data current to the most recent month-end is available at www.6meridianfunds.com.
There are no assurances that the Fund will meet its stated objective.
The Fund’s holdings and allocations are subject to change and should not be considered recommendations to buy individual securities.
Returns shown do not reflect the deduction of taxes that a shareholder would pay on Fund distributions or the redemption of Fund shares.
8
Description | Shares | Fair Value | |||
COMMON STOCK — 99.5% |
| ||||
Communication Services — 7.0% |
| ||||
Activision Blizzard | 4,457 | $ | 354,242 | ||
AMC Networks, Cl A* | 16,126 |
| 531,674 | ||
Cable One | 195 |
| 386,231 | ||
Charter Communications, Cl A* | 668 |
| 435,529 | ||
Cincinnati Bell* | 23,610 |
| 359,108 | ||
Cogent Communications Holdings | 4,351 |
| 252,967 | ||
Electronic Arts | 2,606 |
| 332,917 | ||
Glu Mobile* | 36,251 |
| 366,497 | ||
John Wiley & Sons, Cl A | 9,901 |
| 341,981 | ||
Netflix* | 701 |
| 343,981 | ||
New York Times, Cl A | 8,216 |
| 352,549 | ||
Spok Holdings | 40,629 |
| 399,383 | ||
Take-Two Interactive Software* | 2,389 |
| 431,238 | ||
TechTarget* | 9,535 |
| 500,588 | ||
TEGNA | 32,457 |
| 467,705 | ||
Verizon Communications | 6,383 |
| 385,597 | ||
World Wrestling Entertainment, Cl A | 7,707 |
| 331,709 | ||
| 6,573,896 | ||||
Consumer Discretionary — 10.7% | |||||
Adtalem Global Education* | 11,141 |
| 318,967 | ||
Amazon.com* | 110 |
| 348,484 | ||
American Public Education* | 11,849 |
| 367,793 | ||
Core-Mark Holding | 14,833 |
| 462,641 | ||
Dollar General | 1,892 |
| 413,553 | ||
Dollar Tree* | 3,915 |
| 427,675 | ||
Domino’s Pizza | 920 |
| 361,165 | ||
Dorman Products* | 5,465 |
| 504,802 | ||
eBay | 6,063 |
| 305,757 | ||
Etsy* | 3,158 |
| 507,491 | ||
Description | Shares | Fair Value | |||
Consumer Discretionary (continued) | |||||
Gentex | 13,927 | $ | 454,020 | ||
Grand Canyon Education* | 4,041 |
| 337,302 | ||
Liquidity Services* | 66,327 |
| 630,770 | ||
Murphy USA | 3,159 |
| 404,984 | ||
Papa John’s International | 4,001 |
| 321,520 | ||
Pool | 1,305 |
| 451,674 | ||
Service International | 9,352 |
| 454,881 | ||
Shutterstock | 9,561 |
| 657,414 | ||
Stamps.com* | 1,728 |
| 323,931 | ||
Sturm Ruger | 4,535 |
| 277,723 | ||
Target | 3,003 |
| 539,129 | ||
Tiffany | 2,906 |
| 382,081 | ||
Tractor Supply | 2,606 |
| 366,951 | ||
Wingstop | 2,510 |
| 319,548 | ||
| 9,940,256 | ||||
Consumer Staples — 19.1% |
| ||||
Altria Group | 8,865 |
| 353,093 | ||
B&G Foods | 13,880 |
| 384,337 | ||
BJ’s Wholesale Club Holdings* | 9,378 |
| 384,404 | ||
Boston Beer, Cl A* | 598 |
| 556,641 | ||
Calavo Growers | 5,993 |
| 429,278 | ||
Cal-Maine Foods* | 7,941 |
| 310,731 | ||
Campbell Soup | 7,132 |
| 356,743 | ||
Casey’s General Stores | 2,362 |
| 429,128 | ||
Central Garden & Pet, Cl A* | 9,811 |
| 392,832 | ||
Church & Dwight | 4,400 |
| 386,188 | ||
Clorox | 1,567 |
| 318,038 | ||
Coca-Cola | 7,842 |
| 404,647 | ||
Coca-Cola Consolidated | 1,530 |
| 400,386 | ||
Colgate-Palmolive | 4,743 |
| 406,191 | ||
Conagra Brands | 9,901 |
| 361,981 | ||
Costco Wholesale | 1,115 |
| 436,824 | ||
Flowers Foods | 16,093 |
| 357,104 | ||
Fresh Del Monte Produce | 15,394 |
| 390,854 | ||
General Mills | 5,615 |
| 341,504 | ||
Grocery Outlet Holding* | 8,258 |
| 318,924 | ||
Hain Celestial Group* | 11,130 |
| 428,504 | ||
Hershey | 2,750 |
| 406,698 | ||
Hormel Foods | 7,375 |
| 347,953 | ||
Ingredion | 4,340 |
| 334,831 | ||
J M Smucker | 3,371 |
| 395,081 | ||
John B Sanfilippo & Son | 4,243 |
| 314,873 | ||
Kellogg | 5,303 |
| 338,915 | ||
Kroger | 10,899 |
| 359,667 | ||
Lancaster Colony | 2,255 |
| 381,839 | ||
McCormick | 1,921 |
| 359,189 | ||
The accompanying notes are an integral part of the financial statements.
9
6 Meridian
Low Beta Equity Strategy ETF
Schedule of Investments
November 30, 2020 (Continued)
Description | Shares | Fair Value | |||
Consumer Staples (continued) |
| ||||
MGP Ingredients | 10,083 | $ | 439,720 | ||
National Beverage* | 5,185 |
| 508,286 | ||
Pilgrim’s Pride* | 22,160 |
| 418,602 | ||
Post Holdings* | 3,963 |
| 374,345 | ||
PriceSmart | 5,944 |
| 483,129 | ||
Procter & Gamble | 2,876 |
| 399,390 | ||
Sanderson Farms | 2,980 |
| 407,455 | ||
SpartanNash | 17,107 |
| 322,980 | ||
Sprouts Farmers Market* | 14,206 |
| 300,741 | ||
Tootsie Roll Industries | 10,560 |
| 327,043 | ||
TreeHouse Foods* | 8,113 |
| 333,688 | ||
Tyson Foods, Cl A | 6,097 |
| 397,524 | ||
Universal | 8,460 |
| 385,015 | ||
Vector Group | 38,380 |
| 431,391 | ||
Walmart | 2,836 |
| 433,312 | ||
WD-40 | 1,740 |
| 442,500 | ||
| 17,792,499 | ||||
Energy — 1.1% |
| ||||
Cabot Oil & Gas | 20,137 |
| 352,800 | ||
CNX Resources* | 40,214 |
| 378,414 | ||
Equitrans Midstream | 35,526 |
| 289,892 | ||
| 1,021,106 | ||||
Financials — 4.3% |
| ||||
Brown & Brown | 8,606 |
| 387,528 | ||
Cboe Global Markets | 3,799 |
| 346,925 | ||
Employers Holdings | 12,069 |
| 368,225 | ||
EZCORP, Cl A* | 60,116 |
| 305,990 | ||
HCI Group | 8,048 |
| 419,703 | ||
MarketAxess Holdings | 644 |
| 347,232 | ||
Mercury General | 8,763 |
| 389,691 | ||
New York Community Bancorp | 36,591 |
| 354,567 | ||
Progressive | 4,568 |
| 397,918 | ||
RenaissanceRe Holdings | 2,084 |
| 343,110 | ||
Westamerica BanCorp | 6,416 |
| 353,650 | ||
| 4,014,539 | ||||
Health Care — 24.4% |
| ||||
AbbVie | 3,559 |
| 372,200 | ||
ABIOMED* | 1,330 |
| 364,553 | ||
Addus HomeCare* | 3,927 |
| 389,755 | ||
Alexion Pharmaceuticals* | 3,272 |
| 399,543 | ||
Amedisys* | 1,756 |
| 429,851 | ||
Amgen | 1,401 |
| 311,078 | ||
AMN Healthcare Services* | 8,092 |
| 527,275 | ||
Amphastar Pharmaceuticals* | 16,439 |
| 291,957 | ||
Baxter International | 4,198 |
| 319,342 | ||
Description | Shares | Fair Value | |||
Health Care (continued) |
| ||||
Becton Dickinson | 1,395 | $ | 327,602 | ||
Bio-Rad Laboratories, Cl A* | 752 |
| 404,952 | ||
Bio-Techne | 1,285 |
| 389,753 | ||
Cardiovascular Systems* | 11,633 |
| 400,873 | ||
Cerner | 5,048 |
| 377,792 | ||
Chemed | 739 |
| 353,427 | ||
Corcept Therapeutics* | 20,989 |
| 475,191 | ||
Danaher | 1,913 |
| 429,717 | ||
DaVita* | 4,315 |
| 474,003 | ||
DexCom* | 811 |
| 259,260 | ||
Eagle Pharmaceuticals* | 7,623 |
| 346,847 | ||
Eli Lilly | 2,090 |
| 304,409 | ||
Emergent BioSolutions* | 3,740 |
| 306,418 | ||
Enanta Pharmaceuticals* | 7,025 |
| 289,430 | ||
Exelixis* | 14,778 |
| 283,146 | ||
Gilead Sciences | 4,670 |
| 283,329 | ||
Globus Medical, Cl A* | 7,606 |
| 456,969 | ||
Haemonetics* | 3,948 |
| 445,532 | ||
HealthStream* | 16,432 |
| 306,950 | ||
Hill-Rom Holdings | 3,156 |
| 299,378 | ||
HMS Holdings* | 10,873 |
| 341,630 | ||
ICU Medical* | 1,917 |
| 361,738 | ||
Incyte* | 3,264 |
| 275,939 | ||
Inogen* | 9,851 |
| 345,475 | ||
Integra LifeSciences Holdings* | 7,553 |
| 413,376 | ||
Johnson & Johnson | 2,462 |
| 356,202 | ||
LHC Group* | 1,973 |
| 387,339 | ||
Luminex | 10,937 |
| 259,535 | ||
Masimo* | 1,505 |
| 383,007 | ||
Merck | 4,532 |
| 364,327 | ||
Meridian Bioscience* | 14,440 |
| 272,916 | ||
Mesa Laboratories | 1,595 |
| 433,457 | ||
Molina Healthcare* | 1,934 |
| 394,787 | ||
Nektar Therapeutics, Cl A* | 14,256 |
| 233,656 | ||
Neogen* | 4,541 |
| 337,033 | ||
Omnicell* | 5,425 |
| 568,811 | ||
OraSure Technologies* | 26,437 |
| 317,244 | ||
Orthofix Medical* | 11,648 |
| 428,180 | ||
Penumbra* | 1,822 |
| 404,302 | ||
PerkinElmer | 3,449 |
| 458,717 | ||
Pfizer | 10,471 |
| 401,144 | ||
Prestige Consumer Healthcare* | 9,754 |
| 346,950 | ||
Quest Diagnostics | 2,997 |
| 371,568 | ||
Quidel* | 1,486 |
| 289,844 | ||
Regeneron Pharmaceuticals* | 551 |
| 284,333 | ||
Repligen* | 2,818 |
| 534,490 | ||
Simulations Plus | 5,712 |
| 319,701 | ||
The accompanying notes are an integral part of the financial statements.
10
6 Meridian
Low Beta Equity Strategy ETF
Schedule of Investments
November 30, 2020 (Continued)
Description | Shares | Fair Value | |||
Health Care (continued) |
| ||||
Supernus Pharmaceuticals* | 15,118 | $ | 322,013 | ||
Thermo Fisher Scientific | 914 |
| 424,992 | ||
United Therapeutics* | 3,001 |
| 398,053 | ||
Vanda Pharmaceuticals* | 30,522 |
| 372,674 | ||
Viatris, Cl W* | 23,128 |
| 389,013 | ||
West Pharmaceutical Services | 1,518 |
| 417,693 | ||
| 22,830,671 | ||||
Industrials — 10.1% |
| ||||
A O Smith | 7,385 |
| 415,849 | ||
AAON | 6,513 |
| 424,192 | ||
CH Robinson Worldwide | 4,387 |
| 412,246 | ||
Expeditors International of Washington | 4,620 |
| 412,889 | ||
Exponent | 4,474 |
| 371,387 | ||
FTI Consulting* | 3,141 |
| 329,868 | ||
Heartland Express | 16,703 |
| 308,671 | ||
Heidrick & Struggles International | 17,777 |
| 463,980 | ||
Hub Group, Cl A* | 6,992 |
| 381,903 | ||
Knight-Swift Transportation Holdings, Cl A | 8,035 |
| 331,765 | ||
Landstar System | 3,050 |
| 400,832 | ||
MSC Industrial Direct, Cl A | 5,179 |
| 431,514 | ||
National Presto Industries | 4,094 |
| 348,195 | ||
Northrop Grumman | 1,174 |
| 354,853 | ||
Park Aerospace | 32,913 |
| 418,982 | ||
Rollins | 7,860 |
| 449,435 | ||
Toro | 5,397 |
| 489,562 | ||
TrueBlue* | 27,046 |
| 516,578 | ||
United Parcel Service, Cl B | 3,084 |
| 527,581 | ||
Valmont Industries | 3,096 |
| 504,586 | ||
Waste Management | 3,426 |
| 408,139 | ||
Watsco | 1,916 |
| 435,622 | ||
Werner Enterprises | 7,904 |
| 316,081 | ||
| 9,454,710 | ||||
Information Technology — 12.2% | |||||
Akamai Technologies* | 3,137 |
| 324,711 | ||
Alarm.com Holdings* | 5,096 |
| 386,837 | ||
Broadridge Financial Solutions | 2,748 |
| 403,626 | ||
Ciena* | 6,363 |
| 285,062 | ||
Citrix Systems | 2,361 |
| 292,575 | ||
CommVault Systems* | 9,283 |
| 443,356 | ||
CSG Systems International | 8,934 |
| 387,557 | ||
Daktronics* | 84,770 |
| 382,313 | ||
DSP Group* | 22,644 |
| 381,099 | ||
F5 Networks* | 2,634 |
| 428,842 | ||
Fabrinet* | 5,583 |
| 381,375 | ||
Description | Shares | Fair Value | |||
Information Technology (continued) | |||||
Harmonic* | 75,209 | $ | 491,115 | ||
J2 Global* | 5,929 |
| 531,298 | ||
Jack Henry & Associates | 1,938 |
| 311,747 | ||
Juniper Networks | 15,847 |
| 344,989 | ||
Knowles* | 23,580 |
| 400,388 | ||
MAXIMUS | 4,893 |
| 351,366 | ||
MicroStrategy, Cl A* | 2,990 |
| 1,024,882 | ||
NETGEAR* | 14,787 |
| 470,374 | ||
NIC | 15,673 |
| 367,297 | ||
OneSpan* | 12,410 |
| 245,470 | ||
OSI Systems* | 5,062 |
| 445,962 | ||
PC Connection | 7,363 |
| 336,121 | ||
Progress Software | 9,599 |
| 384,920 | ||
PTC* | 4,500 |
| 485,325 | ||
Qualys* | 3,293 |
| 312,868 | ||
Teradata* | 17,895 |
| 392,437 | ||
Tyler Technologies* | 992 |
| 424,179 | ||
| 11,418,091 | ||||
Materials — 3.4% |
| ||||
AptarGroup | 3,130 |
| 395,382 | ||
Balchem | 3,851 |
| 399,310 | ||
Ball | 4,897 |
| 470,161 | ||
NewMarket | 886 |
| 327,607 | ||
Royal Gold | 2,787 |
| 307,880 | ||
Sensient Technologies | 6,271 |
| 449,756 | ||
Silgan Holdings | 10,770 |
| 364,026 | ||
Stepan | 3,756 |
| 436,297 | ||
| 3,150,419 | ||||
Real Estate — 2.5% |
| ||||
CoreSite Realty‡ | 2,879 |
| 360,998 | ||
Extra Space Storage‡ | 3,693 |
| 416,312 | ||
Investors Real Estate Trust‡ | 5,013 |
| 347,902 | ||
Life Storage‡ | 3,701 |
| 406,074 | ||
Public Storage‡ | 1,828 |
| 410,313 | ||
Taubman Centers‡* | 9,517 |
| 406,566 | ||
| 2,348,165 | ||||
Utilities — 4.7% |
| ||||
American Electric Power | 4,284 |
| 363,669 | ||
American States Water | 4,560 |
| 336,619 | ||
Avista | 9,909 |
| 371,786 | ||
California Water Service Group | 7,412 |
| 366,746 | ||
CMS Energy | 5,947 |
| 365,978 | ||
Consolidated Edison | 4,878 |
| 371,948 | ||
Hawaiian Electric Industries | 9,853 |
| 353,033 | ||
IDACORP | 3,977 |
| 360,237 | ||
National Fuel Gas | 8,551 |
| 352,044 | ||
The accompanying notes are an integral part of the financial statements.
11
6 Meridian
Low Beta Equity Strategy ETF
Schedule of Investments
November 30, 2020 (Concluded)
Description | Shares | Fair Value | |||
Utilities (continued) | |||||
OGE Energy | 11,479 | $ | 371,804 | ||
Spire | 5,409 |
| 345,960 | ||
WEC Energy Group | 3,980 |
| 377,901 | ||
| 4,337,725 | ||||
Total Common Stock |
| 92,882,077 | |||
SHORT-TERM INVESTMENT — 0.5% | |||||
Invesco Government & Agency, CI Institutional, 0.015% | 445,896 |
| 445,896 | ||
Total Short-Term Investment |
| 445,896 | |||
Total Investments — 100.0% | $ | 93,327,973 | |||
Percentages are based on Net Assets of $93,282,603.
* Non-income producing security.
‡ Real Estate Investment Trust.
Cl — Class
As of November 30, 2020, all of the Fund’s investments were considered Level 1, in accordance with the authoritative guidance under U.S. GAAP.
For the period ended November 30, 2020, there have been no transfers in or out of Level 3.
For more information on valuation inputs, see Note 2 — Significant Accounting Policies in the Notes to Financial Statements.
The accompanying notes are an integral part of the financial statements.
12
6 Meridian
Mega Cap Equity ETF
Schedule of Investments
November 30, 2020

Description | Shares | Fair Value | |||
COMMON STOCK — 99.8% | |||||
Communication Services — 8.9% | |||||
AT&T | 51,961 | $ | 1,493,879 | ||
Facebook, Cl A* | 5,435 |
| 1,505,332 | ||
Netflix* | 5,866 |
| 2,878,446 | ||
Verizon Communications | 73,866 |
| 4,462,245 | ||
| 10,339,902 | ||||
Consumer Discretionary — 14.5% |
| ||||
Amazon.com* | 1,415 |
| 4,482,777 | ||
Home Depot | 5,247 |
| 1,455,570 | ||
Lowe’s | 17,732 |
| 2,763,001 | ||
NIKE, Cl B | 23,217 |
| 3,127,330 | ||
Target | 27,604 |
| 4,955,745 | ||
| 16,784,423 | ||||
Consumer Staples — 18.3% |
| ||||
Altria Group | 38,941 |
| 1,551,020 | ||
Colgate-Palmolive | 35,444 |
| 3,035,424 | ||
Costco Wholesale | 7,798 |
| 3,055,022 | ||
Kraft Heinz | 44,859 |
| 1,477,655 | ||
PepsiCo | 10,512 |
| 1,516,146 | ||
Philip Morris International | 59,502 |
| 4,507,277 | ||
Procter & Gamble | 10,256 |
| 1,424,251 | ||
Walgreens Boots Alliance | 39,693 |
| 1,508,731 | ||
Walmart | 20,237 |
| 3,092,011 | ||
| 21,167,537 | ||||
Energy — 1.5% |
| ||||
Kinder Morgan | 119,485 |
| 1,718,194 | ||
Description | Shares | Fair Value | |||
Financials — 12.8% |
| ||||
Allstate | 15,628 | $ | 1,599,526 | ||
Bank of America | 58,999 |
| 1,661,412 | ||
Bank of New York Mellon | 40,474 |
| 1,583,343 | ||
JPMorgan Chase | 14,171 |
| 1,670,477 | ||
MetLife | 73,421 |
| 3,389,847 | ||
Morgan Stanley | 28,767 |
| 1,778,663 | ||
US Bancorp | 71,500 |
| 3,089,516 | ||
| 14,772,784 | ||||
Health Care — 20.9% |
| ||||
AbbVie | 32,196 |
| 3,367,058 | ||
Biogen* | 11,409 |
| 2,740,100 | ||
Bristol-Myers Squibb | 23,881 |
| 1,490,174 | ||
CVS Caremark | 24,458 |
| 1,658,008 | ||
Danaher | 6,110 |
| 1,372,489 | ||
Eli Lilly | 21,584 |
| 3,143,710 | ||
Gilead Sciences | 48,547 |
| 2,945,346 | ||
Johnson & Johnson | 10,242 |
| 1,481,813 | ||
Merck | 18,518 |
| 1,488,662 | ||
Pfizer | 78,429 |
| 3,004,615 | ||
Thermo Fisher Scientific | 2,954 |
| 1,373,551 | ||
Viatris, Cl W* | 9,731 |
| 163,675 | ||
| 24,229,201 | ||||
Industrials — 2.7% |
| ||||
General Dynamics | 10,437 |
| 1,558,766 | ||
United Parcel Service, Cl B | 8,904 |
| 1,523,207 | ||
| 3,081,973 | ||||
Information Technology — 19.0% |
| ||||
Adobe* | 6,386 |
| 3,055,510 | ||
Apple | 13,061 |
| 1,554,912 | ||
Cisco Systems | 79,147 |
| 3,404,904 | ||
Intel | 31,951 |
| 1,544,831 | ||
International Business Machines | 25,165 |
| 3,108,381 | ||
Microsoft | 7,021 |
| 1,502,985 | ||
NVIDIA | 2,820 |
| 1,511,689 | ||
PayPal Holdings* | 7,564 |
| 1,619,604 | ||
QUALCOMM | 11,460 |
| 1,686,568 | ||
salesforce.com* | 6,110 |
| 1,501,838 | ||
Texas Instruments | 9,756 |
| 1,573,155 | ||
| 22,064,377 | ||||
Utilities — 1.2% |
| ||||
Southern | 24,074 |
| 1,440,829 | ||
Total Common Stock |
| 115,599,220 | |||
The accompanying notes are an integral part of the financial statements.
13
6 Meridian
Mega Cap Equity ETF
Schedule of Investments
November 30, 2020 (Concluded)
Description | Shares | Fair Value | |||
SHORT-TERM INVESTMENT — 0.3% | |||||
Invesco Government & Agency, CI Institutional, 0.015% | 305,636 | $ | 305,636 | ||
Total Short-Term Investment |
| 305,636 | |||
Total Investments — 100.1% | $ | 115,904,856 | |||
Percentages are based on Net Assets of $115,826,931.
* Non-income producing security.
Cl — Class
As of November 30, 2020, all of the Fund’s investments were considered Level 1, in accordance with the authoritative guidance under U.S. GAAP.
For the period ended November 30, 2020, there have been no transfers in or out of Level 3.
For more information on valuation inputs, see Note 2 — Significant Accounting Policies in the Notes to Financial Statements.
The accompanying notes are an integral part of the financial statements.
14
6 Meridian
Small Cap Equity ETF
Schedule of Investments
November 30, 2020

Description | Shares | Fair Value | |||
COMMON STOCK — 99.9% | |||||
Communication Services — 2.6% | |||||
Cincinnati Bell* | 20,068 | $ | 305,234 | ||
Cogent Communications Holdings | 3,684 |
| 214,188 | ||
Glu Mobile* | 31,228 |
| 315,715 | ||
| 835,137 | ||||
Consumer Discretionary — 10.9% |
| ||||
American Public Education* | 10,077 |
| 312,790 | ||
Century Communities* | 9,827 |
| 437,301 | ||
Dorman Products* | 4,496 |
| 415,296 | ||
Group 1 Automotive | 4,626 |
| 549,614 | ||
M/I Homes* | 9,070 |
| 412,232 | ||
Rent-A-Center, Cl A | 11,119 |
| 376,045 | ||
Shutterstock | 8,055 |
| 553,862 | ||
Sturm Ruger | 3,836 |
| 234,917 | ||
Wingstop | 1,875 |
| 238,706 | ||
| 3,530,763 | ||||
Consumer Staples — 12.3% |
| ||||
B&G Foods | 12,079 |
| 334,468 | ||
Calavo Growers | 4,839 |
| 346,618 | ||
Cal-Maine Foods* | 6,653 |
| 260,332 | ||
Central Garden & Pet, Cl A* | 8,291 |
| 331,972 | ||
Coca-Cola Consolidated | 1,278 |
| 334,440 | ||
Fresh Del Monte Produce | 12,495 |
| 317,248 | ||
John B Sanfilippo & Son | 3,573 |
| 265,152 | ||
National Beverage* | 4,635 |
| 454,369 | ||
SpartanNash | 14,376 |
| 271,419 | ||
Universal | 7,134 |
| 324,668 | ||
Vector Group | 31,274 |
| 351,520 | ||
WD-40 | 1,525 |
| 387,822 | ||
| 3,980,028 | ||||
Description | Shares | Fair Value | |||
Energy — 4.9% |
| ||||
Bonanza Creek Energy* | 19,416 | $ | 428,511 | ||
Dorian LPG* | 38,742 |
| 423,450 | ||
Renewable Energy Group* | 12,495 |
| 725,710 | ||
| 1,577,671 | ||||
Financials — 24.3% | |||||
American Equity Investment Life Holding | 12,919 |
| 339,511 | ||
Axos Financial* | 14,405 |
| 482,568 | ||
Brightsphere Investment Group | 23,436 |
| 414,817 | ||
Central Pacific Financial | 19,611 |
| 321,424 | ||
Customers Bancorp* | 26,545 |
| 448,344 | ||
Donnelley Financial Solutions* | 34,390 |
| 560,213 | ||
Eagle Bancorp | 9,748 |
| 358,531 | ||
Employers Holdings | 10,213 |
| 311,599 | ||
First Financial Bancorp | 22,630 |
| 363,212 | ||
First Midwest Bancorp | 23,473 |
| 328,387 | ||
HCI Group | 6,604 |
| 344,399 | ||
Hope Bancorp | 34,234 |
| 324,538 | ||
Independent Bank Group | 7,413 |
| 415,943 | ||
Meta Financial Group | 16,897 |
| 559,291 | ||
NMI Holdings, Cl A* | 18,953 |
| 415,260 | ||
Pacific Premier Bancorp | 14,707 |
| 423,856 | ||
Preferred Bank | 7,418 |
| 272,760 | ||
Simmons First National, Cl A | 18,381 |
| 358,430 | ||
Stewart Information Services | 9,458 |
| 396,006 | ||
Walker & Dunlop | 6,031 |
| 482,540 | ||
| 7,921,629 | ||||
Health Care — 14.2% | |||||
Addus HomeCare* | 3,318 |
| 329,312 | ||
AMN Healthcare Services* | 6,827 |
| 444,847 | ||
AngioDynamics* | 28,869 |
| 410,518 | ||
Corcept Therapeutics* | 17,956 |
| 406,524 | ||
Eagle Pharmaceuticals* | 6,303 |
| 286,787 | ||
HealthStream* | 13,524 |
| 252,628 | ||
HMS Holdings* | 9,156 |
| 287,682 | ||
Innoviva* | 21,757 |
| 227,469 | ||
Luminex | 9,065 |
| 215,112 | ||
Meridian Bioscience* | 12,298 |
| 232,432 | ||
Mesa Laboratories | 1,347 |
| 366,061 | ||
OraSure Technologies* | 23,792 |
| 285,504 | ||
Simulations Plus | 4,853 |
| 271,622 | ||
Supernus Pharmaceuticals* | 12,732 |
| 271,192 | ||
Vanda Pharmaceuticals* | 25,550 |
| 311,965 | ||
| 4,599,655 | ||||
The accompanying notes are an integral part of the financial statements.
15
6 Meridian
Small Cap Equity ETF
Schedule of Investments
November 30, 2020 (Concluded)
Description | Shares | Fair Value | |||
Industrials — 10.1% | |||||
EnPro Industries | 6,237 | $ | 441,642 | ||
Exponent | 3,708 |
| 307,801 | ||
Harsco* | 23,024 |
| 390,257 | ||
Heartland Express | 14,458 |
| 267,184 | ||
Kaman | 7,343 |
| 383,966 | ||
Meritor* | 14,903 |
| 393,439 | ||
National Presto Industries | 3,466 |
| 294,783 | ||
SkyWest* | 9,387 |
| 402,984 | ||
TrueBlue* | 20,763 |
| 396,573 | ||
| 3,278,629 | ||||
Information Technology — 10.7% | |||||
Brooks Automation | 6,716 |
| 490,201 | ||
CSG Systems International | 7,373 |
| 319,841 | ||
Ebix | 13,875 |
| 471,889 | ||
MicroStrategy, Cl A* | 2,503 |
| 857,953 | ||
NIC | 13,371 |
| 313,349 | ||
PC Connection | 6,243 |
| 284,993 | ||
Progress Software | 7,873 |
| 315,707 | ||
Unisys* | 28,619 |
| 417,265 | ||
| 3,471,198 | ||||
Materials — 3.5% | |||||
FutureFuel | 25,683 |
| 307,939 | ||
Kraton* | 17,701 |
| 477,927 | ||
Warrior Met Coal | 19,776 |
| 344,498 | ||
| 1,130,364 | ||||
Real Estate — 5.5% | |||||
DiamondRock Hospitality‡* | 55,086 |
| 414,246 | ||
iStar‡ | 25,078 |
| 353,600 | ||
NexPoint Residential Trust‡ | 8,547 |
| 378,718 | ||
RPT Realty‡* | 43,514 |
| 318,958 | ||
Washington Real Estate Investment Trust‡ | 13,199 |
| 306,349 | ||
| 1,771,871 | ||||
Utilities — 0.9% |
| ||||
American States Water | 3,832 |
| 282,878 | ||
Total Common Stock |
| 32,379,823 | |||
Description | Shares | Fair Value | |||
SHORT-TERM INVESTMENT — 0.2% | |||||
Invesco Government & Agency, CI Institutional, 0.015% | 62,701 | $ | 62,701 | ||
Total Short-Term Investment |
| 62,701 | |||
Total Investments — 100.1% | $ | 32,442,524 | |||
Percentages are based on Net Assets of $32,423,150.
* Non-income producing security.
‡ Real Estate Investment Trust.
Cl — Class
As of November 30, 2020, all of the Fund’s investments were considered Level 1, in accordance with the authoritative guidance under U.S. GAAP.
For the period ended November 30, 2020, there have been no transfers in or out of Level 3.
For more information on valuation inputs, see Note 2 — Significant Accounting Policies in the Notes to Financial Statements.
The accompanying notes are an integral part of the financial statements.
16
6 Meridian
Hedged Equity-Index Option Strategy ETF
Schedule of Investments
November 30, 2020
Description | Shares | Fair Value | |||
COMMON STOCK — 101.7% |
| ||||
Communication Services — 9.1% |
| ||||
AT&T(A) | 92,550 | $ | 2,660,813 | ||
Facebook, Cl A(A)* | 9,677 |
| 2,680,239 | ||
Netflix(A)* | 10,452 |
| 5,128,796 | ||
Verizon Communications(A) | 131,565 |
| 7,947,841 | ||
| 18,417,689 | ||||
Consumer Discretionary — 14.8% |
| ||||
Amazon.com(A)* | 2,525 |
| 7,999,301 | ||
Home Depot(A) | 9,342 |
| 2,591,564 | ||
Lowe’s(A) | 31,580 |
| 4,920,796 | ||
NIKE, Cl B(A) | 41,351 |
| 5,569,980 | ||
Target(A) | 49,167 |
| 8,826,951 | ||
| 29,908,592 | ||||
Consumer Staples — 18.6% |
| ||||
Altria Group | 69,363 |
| 2,762,728 | ||
Colgate-Palmolive(A) | 63,132 |
| 5,406,625 | ||
Costco Wholesale(A) | 13,885 |
| 5,439,726 | ||
Kraft Heinz(A) | 79,894 |
| 2,631,708 | ||
PepsiCo(A) | 18,719 |
| 2,699,841 | ||
Philip Morris International(A) | 105,979 |
| 8,027,910 | ||
Procter & Gamble(A) | 18,269 |
| 2,537,016 | ||
Walgreens Boots Alliance(A) | 70,698 |
| 2,687,231 | ||
Walmart(A) | 36,043 |
| 5,507,010 | ||
| 37,699,795 | ||||
Energy — 1.5% |
| ||||
Kinder Morgan(A) | 212,816 |
| 3,060,294 | ||
Description | Shares | Fair Value | |||
Financials — 13.0% |
| ||||
Allstate(A) | 27,834 | $ | 2,848,810 | ||
Bank of America(A) | 105,079 |
| 2,959,025 | ||
Bank of New York Mellon(A) | 72,090 |
| 2,820,161 | ||
JPMorgan Chase(A) | 25,241 |
| 2,975,409 | ||
MetLife(A) | 130,774 |
| 6,037,835 | ||
Morgan Stanley(A) | 51,240 |
| 3,168,169 | ||
US Bancorp | 127,347 |
| 5,502,664 | ||
| 26,312,073 | ||||
Health Care — 21.3% |
| ||||
AbbVie(A) | 57,344 |
| 5,997,035 | ||
Biogen(A)* | 20,321 |
| 4,880,495 | ||
Bristol-Myers Squibb | 42,529 |
| 2,653,810 | ||
CVS Caremark | 43,565 |
| 2,953,271 | ||
Danaher | 10,881 |
| 2,444,199 | ||
Eli Lilly(A) | 38,446 |
| 5,599,659 | ||
Gilead Sciences(A) | 86,466 |
| 5,245,892 | ||
Johnson & Johnson(A) | 18,245 |
| 2,639,687 | ||
Merck(A) | 32,983 |
| 2,651,503 | ||
Pfizer(A) | 139,687 |
| 5,351,409 | ||
Thermo Fisher Scientific(A) | 5,264 |
| 2,447,655 | ||
Viatris, Cl W(A)* | 17,330 |
| 291,491 | ||
| 43,156,106 | ||||
Industrials — 2.7% |
| ||||
General Dynamics | 18,593 |
| 2,776,865 | ||
United Parcel Service, Cl B | 15,859 |
| 2,712,999 | ||
| 5,489,864 | ||||
Information Technology — 19.4% | |||||
Adobe(A)* | 11,372 |
| 5,441,161 | ||
Apple(A) | 23,261 |
| 2,769,222 | ||
Cisco Systems | 140,970 |
| 6,064,529 | ||
Intel(A) | 56,913 |
| 2,751,744 | ||
International Business Machines(A) | 44,820 |
| 5,536,166 | ||
Microsoft(A) | 12,505 |
| 2,676,945 | ||
NVIDIA(A) | 5,025 |
| 2,693,702 | ||
PayPal Holdings* | 13,475 |
| 2,885,267 | ||
QUALCOMM(A) | 20,410 |
| 3,003,739 | ||
salesforce.com* | 10,881 |
| 2,674,550 | ||
Texas Instruments(A) | 17,378 |
| 2,802,203 | ||
| 39,299,228 | ||||
Utilities — 1.3% |
| ||||
Southern(A) | 42,880 |
| 2,566,368 | ||
Total Common Stock |
| 205,910,009 | |||
The accompanying notes are an integral part of the financial statements.
17
6 Meridian
Hedged Equity-Index Option Strategy ETF
Schedule of Investments
November 30, 2020 (Concluded)
Description | Shares | Fair Value |
| |||||
SHORT-TERM INVESTMENT — 0.7% |
| |||||||
Invesco Government & Agency, CI Institutional, 0.015% | 1,462,457 | $ | 1,462,457 |
| ||||
Total Short-Term Investment |
| 1,462,457 |
| |||||
Total Investments — 102.4% | $ | 207,372,466 |
| |||||
WRITTEN OPTION — -7.8%(B) |
|
| ||||||
Total Written Option | $ | (15,781,480 | ) | |||||
Percentages are based on Net Assets of $202,523,953.
Description | Number of | Notional | Exercise | Expiration | Value | |||||||||||
WRITTEN OPTION — (7.8)% |
|
|
|
|
|
| ||||||||||
Call Options |
|
|
|
|
|
| ||||||||||
SPX Short Index Option* | (572 | ) | $ | (207,157,236 | ) | $ | 3,350.00 | 12/18/20 | $ | (15,781,480 | ) | |||||
Total Written Option |
|
|
|
| $ | (15,781,480 | ) | |||||||||
* Non-income producing security.
(A) All or a portion of these securities has been pledged as collateral on written options with a fair value of $58,050,962.
(B) Refer to table below for details on Options Contracts.
Cl — Class
SPX — S&P 500 Index
As of November 30, 2020, all of the Fund’s investments were considered Level 1, in accordance with the authoritative guidance under U.S. GAAP.
For the period ended November 30, 2020, there have been no transfers in or out of Level 3.
For more information on valuation inputs, see Note 2 — Significant Accounting Policies in the Notes to Financial Statements.
The accompanying notes are an integral part of the financial statements.
18
6 Meridian | 6 Meridian | |||||
Assets: |
|
| ||||
Investments, at Cost | $ | 83,623,255 | $ | 102,863,813 | ||
Investments at Fair Value | $ | 93,327,973 | $ | 115,904,856 | ||
Dividends Receivable |
| 131,230 |
| 232,708 | ||
Total Assets |
| 93,459,203 |
| 116,137,564 | ||
|
| |||||
Liabilities: |
|
| ||||
Income distributions Payable |
| 68,803 |
| 183,287 | ||
Advisory Fees Payable |
| 45,392 |
| 56,338 | ||
Payable for Audit Expenses |
| 16,500 |
| 16,500 | ||
Payable for Trustees’ Fee |
| 5,243 |
| 6,551 | ||
Payable due to Administrator |
| 5,209 |
| 6,465 | ||
Payable for Offering Costs |
| 670 |
| 831 | ||
Chief Compliance Officer Fees Payable |
| 1,573 |
| 1,965 | ||
Other Accrued Expenses |
| 33,210 |
| 38,696 | ||
|
| |||||
Total Liabilities |
| 176,600 |
| 310,633 | ||
|
| |||||
Net Assets | $ | 93,282,603 | $ | 115,826,931 | ||
|
| |||||
Net Assets Consist of: |
|
| ||||
Paid-in Capital | $ | 83,991,964 | $ | 104,612,511 | ||
Total Distributable Earnings |
| 9,290,639 |
| 11,214,420 | ||
|
| |||||
Net Assets | $ | 93,282,603 | $ | 115,826,931 | ||
Outstanding Shares of Beneficial Interest |
| 3,250,000 |
| 3,975,000 | ||
Net Asset Value, Offering and Redemption Price Per Share | $ | 28.70 | $ | 29.14 | ||
The accompanying notes are an integral part of the financial statements.
19
6 Meridian
Statements of Assets and Liabilities
November 30, 2020 (Concluded)
6 Meridian | 6 Meridian | |||||
Assets: |
|
| ||||
Investments, at Cost | $ | 26,042,366 | $ | 184,666,181 | ||
Investments at Fair Value | $ | 32,442,524 | $ | 207,372,466 | ||
Deposits at Broker for Option Contracts |
| — |
| 11,062,302 | ||
Dividends Receivable |
| 43,566 |
| 415,488 | ||
Total Assets |
| 32,486,090 |
| 218,850,256 | ||
|
| |||||
Liabilities: |
|
| ||||
Income Distributions Payable |
| 17,040 |
| 334,028 | ||
Payable for Audit Expenses |
| 16,500 |
| 16,500 | ||
Advisory Fees Payable |
| 10,211 |
| 99,802 | ||
Payable due to Administrator |
| 1,652 |
| 11,453 | ||
Payable for Trustees’ Fee |
| 1,597 |
| 11,609 | ||
Chief Compliance Officer Fees Payable |
| 479 |
| 3,483 | ||
Payable for Offering Costs |
| 212 |
| 1,473 | ||
Options Written, at Value (Premiums Received $- and $8,340,422) |
| — |
| 15,781,480 | ||
Other Accrued Expenses |
| 15,249 |
| 66,475 | ||
|
| |||||
Total Liabilities |
| 62,940 |
| 16,326,303 | ||
|
| |||||
Net Assets | $ | 32,423,150 | $ | 202,523,953 | ||
|
| |||||
Net Assets Consist of: |
|
| ||||
Paid-in Capital | $ | 26,443,953 | $ | 199,322,772 | ||
Total Distributable Earnings |
| 5,979,197 |
| 3,201,181 | ||
|
| |||||
Net Assets | $ | 32,423,150 | $ | 202,523,953 | ||
Outstanding Shares of Beneficial Interest |
| 925,000 |
| 7,600,000 | ||
Net Asset Value, Offering and Redemption Price Per Share | $ | 35.05 | $ | 26.65 | ||
The accompanying notes are an integral part of the financial statements.
20
6 Meridian | 6 Meridian | ||||||
Investment Income: |
|
|
| ||||
Dividend Income | $ | 689,706 |
| $ | 1,442,649 | ||
Less: Foreign Taxes Withheld |
| (91 | ) |
| — | ||
|
|
| |||||
Total Investment Income |
| 689,615 |
|
| 1,442,649 | ||
|
|
| |||||
Expenses: |
|
|
| ||||
Advisory Fees |
| 274,078 |
|
| 340,071 | ||
Administration Fees |
| 32,392 |
|
| 40,160 | ||
Trustees’ Fees |
| 12,204 |
|
| 15,132 | ||
Chief Compliance Officer Fees |
| 3,661 |
|
| 4,540 | ||
Transfer Agent Fees |
| 10,530 |
|
| 13,516 | ||
Printing Fees |
| 2,506 |
|
| 3,034 | ||
Custodian Fees |
| 9,144 |
|
| 6,386 | ||
Offering Costs |
| 4,044 |
|
| 5,017 | ||
Pricing Fees |
| 965 |
|
| 431 | ||
Legal Fees |
| 4,282 |
|
| 5,350 | ||
Audit Fees |
| 16,500 |
|
| 16,500 | ||
Registration Fees |
| 14,331 |
|
| 16,220 | ||
Other Fees |
| 12,635 |
|
| 15,722 | ||
Total Expenses |
| 397,272 |
|
| 482,079 | ||
|
|
| |||||
Net Investment Income |
| 292,343 |
|
| 960,570 | ||
|
|
| |||||
Net Realized Gain (Loss) on: |
|
|
| ||||
Investments(2) |
| 737,982 |
|
| 2,395,786 | ||
|
|
| |||||
Net Unrealized Appreciation on: |
|
|
| ||||
Investments |
| 9,704,718 |
|
| 13,041,043 | ||
Net Realized and Unrealized Gain on Investments |
| 10,442,700 |
|
| 15,436,829 | ||
|
|
| |||||
Net Increase in Net Assets Resulting from Operations | $ | 10,735,043 |
| $ | 16,397,399 | ||
(1) Commenced operations on May 8, 2020
(2) Includes realized gain as a result of in-kind transactions. (See Note 4 in Notes to Financial Statements.)
Amounts designated as “—” are $0.
The accompanying notes are an integral part of the financial statements.
21
6 Meridian
Statements of Operations
For the period ended November 30, 2020 (Concluded)
6 Meridian | 6 Meridian | |||||||
Investment Income: |
|
|
|
| ||||
Dividend Income | $ | 222,985 |
| $ | 2,622,192 |
| ||
|
|
|
| |||||
Total Investment Income |
| 222,985 |
|
| 2,622,192 |
| ||
|
|
|
| |||||
Expenses: |
|
|
|
| ||||
Advisory Fees |
| 77,144 |
|
| 620,134 |
| ||
Administration Fees |
| 9,107 |
|
| 73,436 |
| ||
Trustees’ Fees |
| 3,476 |
|
| 27,522 |
| ||
Interest Expense on Broker Account |
| — |
|
| 40,812 |
| ||
Chief Compliance Officer Fees |
| 1,043 |
|
| 8,257 |
| ||
Transfer Agent Fees |
| 12,872 |
|
| 12,897 |
| ||
Printing Fees |
| 903 |
|
| 5,223 |
| ||
Custodian Fees |
| 2,660 |
|
| 6,162 |
| ||
Offering Costs |
| 1,138 |
|
| 9,150 |
| ||
Pricing Fees |
| 333 |
|
| 672 |
| ||
Legal Fees |
| 1,304 |
|
| 9,481 |
| ||
Audit Fees |
| 16,500 |
|
| 16,500 |
| ||
Registration Fees |
| 9,353 |
|
| 24,235 |
| ||
Other Fees |
| 3,849 |
|
| 27,971 |
| ||
Total Expenses |
| 139,682 |
|
| 882,452 |
| ||
Less: Management Fee Waiver |
| (13,217 | ) |
| — |
| ||
|
|
|
| |||||
Net Investment Income |
| 96,520 |
|
| 1,739,740 |
| ||
|
|
|
| |||||
Net Realized Gain (Loss) on: |
|
|
|
| ||||
Investments(2) |
| 499,974 |
|
| 4,649,180 |
| ||
Written Options |
| — |
|
| (8,891,980 | ) | ||
|
|
|
| |||||
Net Unrealized Appreciation/(Depreciation) on: |
|
|
|
| ||||
Investments |
| 6,400,158 |
|
| 22,706,285 |
| ||
Written Options |
| — |
|
| (7,441,058 | ) | ||
Net Realized and Unrealized Gain on Investments |
| 6,900,132 |
|
| 11,022,427 |
| ||
|
|
|
| |||||
Net Increase in Net Assets Resulting from Operations | $ | 6,996,652 |
| $ | 12,762,167 |
| ||
(1) Commenced operations on May 8, 2020
(2) Includes realized gain as a result of in-kind transactions. (See Note 4 in Notes to Financial Statements.)
Amounts designated as “—” are $0.
The accompanying notes are an integral part of the financial statements.
22
6 Meridian | ||||
Period Ended | ||||
Operations: |
|
| ||
Net Investment Income | $ | 292,343 |
| |
Net Realized Gain on Investments(2) |
| 737,982 |
| |
Net Change in Unrealized Appreciation on Investments |
| 9,704,718 |
| |
Net Increase in Net Assets Resulting from Operations |
| 10,735,043 |
| |
|
| |||
Distributions: |
| (263,570 | ) | |
|
| |||
Capital Share Transactions: |
|
| ||
Issued |
| 91,283,818 |
| |
Redeemed |
| (8,472,688 | ) | |
Increase in Net Assets from Capital Share Transactions |
| 82,811,130 |
| |
|
| |||
Total Increase in Net Assets |
| 93,282,603 |
| |
|
| |||
Net Assets: |
|
| ||
Beginning of Period |
| — |
| |
End of Period | $ | 93,282,603 |
| |
|
| |||
Share Transactions: |
|
| ||
Issued |
| 3,575,000 |
| |
Redeemed |
| (325,000 | ) | |
|
| |||
Net Increase in Shares Outstanding from Share Transactions |
| 3,250,000 |
| |
|
| |||
(1) Commenced operations on May 8, 2020
(2) Includes realized gains as a result of in-kind transactions (see Note 4 in Notes to Financial Statements).
Amounts designated as “—” are $0.
The accompanying notes are an integral part of the financial statements.
23
6 Meridian
Statements of Changes in Net Assets (Continued)
6 Meridian | ||||
Period Ended | ||||
Operations: |
|
| ||
Net Investment Income | $ | 960,570 |
| |
Net Realized Gain on Investments(2) |
| 2,395,786 |
| |
Net Change in Unrealized Appreciation on Investments |
| 13,041,043 |
| |
Net Increase in Net Assets Resulting from Operations |
| 16,397,399 |
| |
|
| |||
Distributions: |
| (969,400 | ) | |
|
| |||
Capital Share Transactions: |
|
| ||
Issued |
| 135,504,988 |
| |
Redeemed |
| (35,106,056 | ) | |
Increase in Net Assets from Capital Share Transactions |
| 100,398,932 |
| |
|
| |||
Total Increase in Net Assets |
| 115,826,931 |
| |
|
| |||
Net Assets: |
|
| ||
Beginning of Period |
| — |
| |
End of Period | $ | 115,826,931 |
| |
|
| |||
Share Transactions: |
|
| ||
Issued |
| 5,275,000 |
| |
Redeemed |
| (1,300,000 | ) | |
|
| |||
Net Increase in Shares Outstanding from Share Transactions |
| 3,975,000 |
| |
(1) Commenced operations on May 8, 2020
(2) Includes realized gains as a result of in-kind transactions (see Note 4 in Notes to Financial Statements).
Amounts designated as “—” are $0.
The accompanying notes are an integral part of the financial statements.
24
6 Meridian
Statements of Changes in Net Assets (Continued)
6 Meridian | ||||
Period Ended | ||||
Operations: |
|
| ||
Net Investment Income | $ | 96,520 |
| |
Net Realized Gain on Investments(2) |
| 499,974 |
| |
Net Change in Unrealized Appreciation on Investments |
| 6,400,158 |
| |
Net Increase in Net Assets Resulting from Operations |
| 6,996,652 |
| |
|
| |||
Distributions: |
| (87,651 | ) | |
|
| |||
Capital Share Transactions: |
|
| ||
Issued |
| 31,826,851 |
| |
Redeemed |
| (6,312,702 | ) | |
Increase in Net Assets from Capital Share Transactions |
| 25,514,149 |
| |
|
| |||
Total Increase in Net Assets |
| 32,423,150 |
| |
|
| |||
Net Assets: |
|
| ||
Beginning of Period |
| — |
| |
End of Period | $ | 32,423,150 |
| |
|
| |||
Share Transactions: |
|
| ||
Issued |
| 1,150,000 |
| |
Redeemed |
| (225,000 | ) | |
|
| |||
Net Increase in Shares Outstanding from Share Transactions |
| 925,000 |
| |
(1) Commenced operations on May 8, 2020
(2) Includes realized gains as a result of in-kind transactions (see Note 4 in Notes to Financial Statements).
Amounts designated as “—” are $0.
The accompanying notes are an integral part of the financial statements.
25
6 Meridian
Statements of Changes in Net Assets (Concluded)
6 Meridian | ||||
Period Ended | ||||
Operations: |
|
| ||
Net Investment Income | $ | 1,739,740 |
| |
Net Realized Loss on Investments and Written Options(2) |
| (4,242,800 | ) | |
Net Change in Unrealized Appreciation on Investments and Written Options |
| 15,265,227 |
| |
Net Increase in Net Assets Resulting from Operations |
| 12,762,167 |
| |
|
| |||
Distributions: |
| (1,754,443 | ) | |
|
| |||
Capital Share Transactions: |
|
| ||
Issued |
| 252,773,238 |
| |
Redeemed |
| (61,257,009 | ) | |
Increase in Net Assets from Capital Share Transactions |
| 191,516,229 |
| |
|
| |||
Total Increase in Net Assets |
| 202,523,953 |
| |
|
| |||
Net Assets: |
|
| ||
Beginning of Period |
| — |
| |
End of Period | $ | 202,523,953 |
| |
|
| |||
Share Transactions: |
|
| ||
Issued |
| 9,975,000 |
| |
Redeemed |
| (2,375,000 | ) | |
|
| |||
Net Increase in Shares Outstanding from Share Transactions |
| 7,600,000 |
| |
|
| |||
(1) Commenced operations on May 8, 2020
(2) Includes realized gains as a result of in-kind transactions (see Note 4 in Notes to Financial Statements).
Amounts designated as “—” are $0.
The accompanying notes are an integral part of the financial statements.
26
Selected Per Share Data & Ratios
For the Period Ended November 30, 2020
For a Share Outstanding Throughout the Period
Net Asset | Net | Net | Total from Operations | Distributions | Total |
| Market | Total |
| Ratio of | Ratio of | Ratio of | Portfolio | |||||||||||||||||||||||||||||||
6 Meridian Low Beta Equity Strategy ETF |
|
|
|
|
|
|
|
|
| |||||||||||||||||||||||||||||||||||
2020(3) | $ | 25.54 | $ | 0.10 | $ | 3.15 | $ | 3.25 | $ | (0.09 | ) | $ | (0.09 | ) | $ | 28.70 | $ | 28.70 | 12.72 | % | $ | 93,283 | 0.88 | %(4) | 0.88 | %(4) | 0.65 | %(4) | 13 | % | ||||||||||||||
6 Meridian Mega Cap Equity ETF |
|
|
|
|
|
|
|
|
|
|
|
|
|
| ||||||||||||||||||||||||||||||
2020(3) | $ | 25.38 | $ | 0.27 | $ | 3.74 | $ | 4.01 | $ | (0.25 | ) | $ | (0.25 | ) | $ | 29.14 | $ | 29.12 | 15.88 | % | $ | 115,827 | 0.86 | %(4) | 0.86 | %(4) | 1.72 | %(4) | 38 | % | ||||||||||||||
6 Meridian Small Cap Equity ETF |
|
|
|
|
|
|
|
|
|
|
|
|
|
| ||||||||||||||||||||||||||||||
2020(3) | $ | 26.43 | $ | 0.13 | $ | 8.60 | $ | 8.73 | $ | (0.11 | ) | $ | (0.11 | ) | $ | 35.05 | $ | 35.01 | 33.11 | % | $ | 32,423 | 1.00 | %(4) | 1.10 | %(4) | 0.76 | %(4) | 29 | % | ||||||||||||||
6 Meridian Hedged Equity-Index Option Strategy ETF |
|
|
|
|
|
|
|
|
| |||||||||||||||||||||||||||||||||||
2020(3) | $ | 25.34 | $ | 0.25 | $ | 1.30 | $ | 1.55 | $ | (0.24 | ) | $ | (0.24 | ) | $ | 26.65 | $ | 26.56 | 6.14 | % | $ | 202,524 | 0.87 | %(4)(5) | 0.87 | %(4)(5) | 1.71 | %(4)(5) | 49 | % | ||||||||||||||
* Per share data calculated using average shares method.
(1) Total return is for the period indicated and has not been annualized for periods less than one year. Returns do not reflect the deduction of taxes the shareholder would pay on fund distributions or redemption of Fund shares.
(2) Portfolio turnover rate is for the period indicated and periods of less than one year have not been annualized. Excludes effect of securities received or delivered from processing in-kind creations or redemptions.
(3) Commenced operations on May 8, 2020.
(4) Annualized.
(5) The expense ratio includes interest expense. Had this expense been excluded the ratio’s would have been 0.83%, 0.83% and 1.75%.
The accompanying notes are an integral part of the financial statements.
27
1. ORGANIZATION
Exchange Traded Concepts Trust (the “Trust”) is a Delaware statutory trust formed on July 17, 2009. The Trust is registered with the Commission under the Investment Company Act of 1940 (the “1940 Act”) as an open-end management investment company with multiple investment portfolios. The financial statements herein are those of the 6 Meridian Low Beta Equity Strategy ETF, 6 Meridian Mega Cap Equity ETF, 6 Meridian Small Cap Equity ETF and 6 Meridian Hedged Equity-Index Option Strategy ETF (each, a “Fund” and collectively, the “Funds”).
Each Fund seeks to provide capital appreciation. The 6 Meridian Low Beta Equity Strategy ETF and 6 Meridian Small Equity ETF are classified as “diversified” under the 1940 Act. The 6 Meridian Mega Cap Equity ETF and 6 Meridian Hedged Equity-Index Option Strategy ETF are classified as “non-diversified” under the 1940 Act (see “Non-Diversification Risk” under Note 6). Exchange Traded Concepts, LLC (the “Adviser”), an Oklahoma limited liability Company, serves as the investment adviser for the Fund and is subject to the supervision of the Board of Trustees the “Board”). The Funds commenced operations on May 8, 2020.
Shares of each Fund are listed and traded on the NYSE Arca, Inc. (the “Exchange”). Market prices for the shares may be different from their net asset value (“NAV”). The Funds issue and redeem shares on a continuous basis to certain institutional investors (typically market makers or other broker-dealers) at NAV only in large blocks of shares, typically 25,000 shares, called “Creation Units”. Creation Unit transactions for a Fund are typically conducted in exchange for the deposit or delivery of a portfolio of securities closely approximating the holdings of that Fund and a specified amount of cash. Once created, shares trade in a secondary market at market prices that change throughout the day in share amounts less than a Creation Unit.
2. SIGNIFICANT ACCOUNTING POLICIES
The following significant accounting policies, which are consistently followed in the preparation of the financial statements of the Trust, are in conformity with accounting principles generally accepted in the United States of America (“U.S. GAAP”) for investment companies. The accompanying financial statements have been prepared in accordance with U.S. GAAP on the accrual basis of accounting. Management has reviewed Financial Accounting Standards Board (“FASB”) Accounting Standards Codification (“ASC”) Topic 946, Financial Services — Investment Companies (“ASC 946”), and concluded that the Funds meet criteria of an “investment company,” and therefore, the Funds prepare its financial statements in accordance with investment company accounting as outlined in ASC 946.
Use of Estimates and Indemnifications — The preparation of financial statements in conformity with U.S. GAAP requires management to make estimates and assumptions that affect the reported amounts of assets and liabilities and disclosure of contingent assets and liabilities at the date of the financial statements and the reported amounts of increases and decreases in net assets from operations during the reporting period. Actual results could differ from those estimates.
In the normal course of business, the Trust, on behalf of the Funds, enters into contracts that contain a variety of representations which provide general indemnifications. Each Fund’s maximum exposure under these arrangements cannot be known; however, the Funds expect any risk of loss to be remote.
Security Valuation — Securities listed on a securities exchange, market or automated quotation system for which quotations are readily available (except for securities traded on NASDAQ), including securities traded over the counter, are valued at the last quoted sale price on the primary exchange or market (foreign or domestic) on which they are traded (or at approximately 4:00 pm Eastern Time if a security’s primary exchange is normally open at that time), or, if there is no such reported sale, at the most recent quoted bid for long positions and the most recent ask price for short positions. For securities traded on NASDAQ, the NASDAQ Official Closing Price will be used. If available, debt securities are priced based upon valuations provided by independent, third-party pricing agents. Such values generally reflect the last reported sales price if the security is actively traded. The third-party pricing agents may also value debt securities at an evaluated bid price by employing methodologies that utilize actual market transactions, broker-supplied valuations, or other methodologies designed to identify the fair value for
28
6 Meridian
Notes to Financial Statements
November 30, 2020 (Continued)
2. SIGNIFICANT ACCOUNTING POLICIES (continued)
such securities. Debt obligations with remaining maturities of sixty days or less when acquired will be valued at their market value. If a market value is not available from a pricing vendor or from an independent broker, the security shall be fair valued according to the Trust’s Fair Value Procedures.
Options are valued at the last quoted sales price. If there is no such reported sale on the valuation date, long positions are valued at the most recent bid price, and short positions are valued at the most recent ask price.
Prices for most securities held by the Funds are provided daily by recognized independent pricing agents. If a security price cannot be obtained from an independent, third-party pricing agent, the Funds seek to obtain a bid price from at least one independent broker.
Securities for which market prices are not “readily available” are valued in accordance with fair value procedures established by the Board. The Funds’ fair value procedures are implemented through a fair value committee (the “Committee”) designated by the Board. Some of the more common reasons that may necessitate that a security be valued using fair value procedures include: the security’s trading has been halted or suspended; the security has been de-listed from a national exchange; the security’s primary trading market is temporarily closed at a time when, under normal conditions, it would be open; the security has not been traded for an extended period of time; the security’s primary pricing source is not able or willing to provide a price; or trading of the security is subject to local government-imposed restrictions. In addition, the Funds may fair value their securities if an event that may materially affect the value of the Funds’ securities that traded outside of the United States (a “Significant Event”) has occurred between the time of the security’s last close and the time that the Funds calculates their net asset value. A Significant Event may relate to a single issuer or to an entire market sector. Events that may be Significant Events include, but are not limited to: government actions, natural disasters, armed conflict, acts of terrorism and significant market fluctuations. If the Adviser becomes aware of a Significant Event that has occurred with respect to a security or group of securities after the closing of the exchange or market on which the security or securities principally trade, but before the time at which the Funds calculate their net asset value, it may request that a Committee meeting be called. When a security is valued in accordance with the fair value procedures, the Committee will determine the value after taking into consideration relevant information reasonably available to the Committee.
In accordance with the authoritative guidance on fair value measurements and disclosure under GAAP, the Funds disclose fair value of their investments in a hierarchy that prioritizes the inputs to valuation techniques used to measure the fair value. The objective of a fair value measurement is to determine the price that would be received to sell an asset, or paid to transfer a liability, in an orderly transaction between market participants at the measurement date (an exit price). Accordingly, the fair value hierarchy gives the highest priority to quoted prices (unadjusted) in active markets for identical assets or liabilities (Level 1) and the lowest priority to unobservable inputs (Level 3). The three levels of the fair value hierarchy are described below:
• Level 1 – Unadjusted quoted prices in active markets for identical, unrestricted assets or liabilities that the Funds has the ability to access at the measurement date;
• Level 2 – Quoted prices which are not active, or inputs that are observable (either directly or indirectly) for substantially the full term of the asset or liability; and
• Level 3 – Prices, inputs or exotic modeling techniques which are both significant to the fair value measurement and unobservable (supported by little or no market activity).
The valuation techniques used by the Funds to measure fair value during the period ended November 30, 2020 maximized the use of observable inputs and minimized the use of unobservable inputs.
For the period ended November 30, 2020, there have been no significant changes to the Funds’ fair valuation methodologies.
29
6 Meridian
Notes to Financial Statements
November 30, 2020 (Continued)
2. SIGNIFICANT ACCOUNTING POLICIES (continued)
Federal Income Taxes — It is the Funds’ intention to qualify as a regulated investment company for Federal income tax purposes by complying with the appropriate provisions of Subchapter M of the Internal Revenue Code of 1986, as amended. Accordingly, no provisions for federal income taxes have been made in the financial statements.
The Funds’ policy is to classify interest and penalties associated with underpayment of federal and state income taxes, if any, as income tax expense on their Statements of Operations. As of November 30, 2020, the Funds did not have any interest or penalties associated with the underpayment of any income taxes. Tax years that are open, remain subject to examination by tax jurisdictions. The Funds have reviewed all major jurisdictions and concluded that there is no impact on the Funds’ net assets and no tax liability resulting from unrecognized tax benefits relating to uncertain income tax positions taken or expected to be taken on its tax returns.
Security Transactions and Investment Income — Security transactions are accounted for on trade date. Costs used in determining realized gains and losses on the sale of investment securities are based on specific identification. Dividend income is recorded on the ex-dividend date. Interest income is recognized on the accrual basis. Withholding taxes and reclaims on foreign dividends have been provided for in accordance with the Funds’ understanding of the applicable country’s tax rules and rates.
Options Written/Purchased — The Funds may utilize longer maturity options for stock replacement when and as price and volatility relationships become more favorable for options versus underlying stocks or for tax and liquidity management purposes. The Funds are authorized to write (sell) and purchase put and call options. The risk in writing a call option is that the Funds give up the opportunity to profit if the market price of the security increases. The risk in writing a put option is that the Funds may incur a loss if the market price of the security decreases and the option is exercised. The risk in purchasing an option is that the Funds pay a premium whether or not the option is exercised. The Funds also have the additional risk of being unable to enter into a closing transaction at an acceptable price if a liquid secondary market does not exist. Option contracts also involve the risk that they may not work as intended due to unanticipated developments in market conditions or other causes.
The 6 Meridian Hedge Equity-Index Option Strategy ETF entered into written option contracts during the period ended November 30, 2020. These written option contracts were index options composed entirely of equity risk. The realized and unrealized gain (loss) on these written option contracts can be found on the Statements of Operations.
Written options are collateralized by cash deposits and pledged securities held at the custodian, Bank of New York Mellon. The collateral required is determined daily by reference to the market value of the written options. Refer to the Statements of Assets and Liabilities regarding deposits at broker for option contracts.
For the period ended November 30, 2020, the average quarterly notional amount of written option contracts held were as follows:
Hedged Equity-Index Option Strategy ETF(1) |
|
| ||
Average Quarterly Notional Balance Long | $ | — |
| |
Average Quarterly Notional Balance Short |
| (188,676,373 | ) |
(1) Commenced operations on May 8, 2020.
Dividends and Distributions to Shareholders — Each Fund pays out dividends from its net investment income monthly and distributes its net capital gains, if any, to investors at least annually. All distributions are recorded on ex-dividend date.
Offering costs — Offering costs, including costs of printing initial prospectus, legal and registration fees, are expensed monthly from inception for each Fund. The total offering costs to be expensed for the Funds is $135,000. As of November 30, 2020, the Funds have expensed $19,349 of offering costs with $115,651 remaining. Refer to the Assets & Liabilities for current payable amounts for each Fund.
30
6 Meridian
Notes to Financial Statements
November 30, 2020 (Continued)
2. SIGNIFICANT ACCOUNTING POLICIES (continued)
Creation Units — The Funds issue and redeem shares at NAV and only in large blocks of shares (each block of shares for the Funds is called a “Creation Unit” or multiples thereof). Purchasers of Creation Units at NAV must pay a standard creation transaction fee of $1,000 for the 6 Meridian Low Beta Equity Strategy ETF and $500 for the 6 Meridian Mega Cap Equity ETF, 6 Meridian Small Cap Equity ETF and 6 Meridian Hedged Equity-Index Option Strategy ETF. An authorized participant who holds Creation Units (“Authorized Participants”) and wishes to redeem at NAV would also pay a standard redemption transaction fee of $1,000 for the 6 Meridian Low Beta Equity Strategy ETF and $500 for the 6 Meridian Mega Cap Equity ETF, 6 Meridian Small Cap Equity ETF and 6 Meridian Hedged Equity-Index Option Strategy ETF. The Adviser may retain all or a portion of the transaction fee to the extent the Adviser bears the expenses that otherwise would be borne by a Fund in connection with the purchase or redemption of a Creation Unit, which the transaction fee is designed to cover.
Except when aggregated in Creation Units, shares are not redeemable securities of the Funds. Shares of the Funds may only be purchased or redeemed by certain Authorized Participants. An Authorized Participant is either (i) a broker-dealer or other participant in the clearing process through the Continuous Net Settlement System of the National Securities Clearing Corporation or (ii) a Depository Trust Company (“DTC”) participant and, in each case, must have executed an Authorized Participant Agreement with the Funds’ distributor. Most retail investors will not qualify as Authorized Participants or have the resources to buy and sell whole Creation Units. Therefore, they will be unable to purchase or redeem the shares directly from the Funds. Rather, most retail investors will purchase shares in the secondary market with the assistance of a broker and will be subject to customary brokerage commissions or fees.
The following table discloses the Creation Unit breakdown based on the NAV as of November 30, 2020:
Creation Unit | Creation | Value | Redemption | ||||||||
6 Meridian Low Beta Equity Strategy ETF | 25,000 | $ | 1,000 | $ | 717,500 | $ | 1,000 | ||||
6 Meridian Mega Cap Equity ETF | 25,000 |
| 500 |
| 728,500 |
| 500 | ||||
6 Meridian Small Cap Equity ETF | 25,000 |
| 500 |
| 876,250 |
| 500 | ||||
6 Meridian Hedged Equity-Index Option Strategy ETF | 25,000 |
| 500 |
| 666,250 |
| 500 | ||||
To the extent contemplated by a participant agreement, in the event an Authorized Participant has submitted a redemption request in proper form but is unable to transfer all or part of the shares comprising a Creation Unit to be redeemed to the Distributor, on behalf of a Fund, by the time as set forth in a participant agreement, the Distributor may nonetheless accept the redemption request in reliance on the undertaking by the Authorized Participant to deliver the missing shares as soon as possible, which undertaking shall be secured by the Authorized Participant’s delivery and maintenance of collateral equal to a percentage of the value of the missing shares as specified in the participant agreement. A participant agreement may permit a Fund to use such collateral to purchase the missing shares, and could subject an Authorized Participant to liability for any shortfall between the cost of a Fund acquiring such shares and the value of the collateral.
3. SERVICE PROVIDERS
Investment Advisory Agreement
The Adviser is located at 10900 Hefner Pointe Drive, Suite 401, Oklahoma City, Oklahoma 73120, its principle place of business, and 295 Madison Avenue, New York, New York 10017. The Adviser serves as investment adviser to the Trust, including the Funds, pursuant to an investment advisory agreement (“Advisory Agreement”). Under the Advisory Agreement, the Adviser provides investment advisory services to each Fund. The Adviser is responsible for, among other things, overseeing the Sub-Adviser (as defined below), including regular review of the Sub-Adviser’s performance, and trading portfolio securities on behalf of each Fund, including selecting broker-dealers to execute purchase and sale transactions, subject to the supervision of the Board. The Adviser also arranges for transfer agency, custody, fund administration and accounting, and other non-distribution related
31
6 Meridian
Notes to Financial Statements
November 30, 2020 (Continued)
3. SERVICE PROVIDERS (continued)
services necessary for the Funds to operate. The Adviser administers each Fund’s business affairs, provides office facilities and equipment and certain clerical, bookkeeping and administrative services, and provides its officers and employees to serve as officers or Trustees of the Trust.
For the services it provides to each Fund, the Adviser receives a fee, which is calculated daily and paid monthly, at an annual rate of 0.61% of average daily net assets of each Fund.
The Adviser has contractually agreed to waive its fees and reimburse expenses to the extent necessary to keep total annual operating expenses of each Fund (excluding amounts payable pursuant to any plan adopted in accordance with Rule 12b-1, interest expense, taxes, brokerage commissions, acquired fund fees and expenses, other expenditures which are capitalized in accordance with generally accepted accounting principles, and extraordinary expenses) from exceeding 1.00% of each Fund’s average daily net assets until at least May 6, 2021. The expense limitation agreement may be terminated, without payment of any penalty: (i) by the Trust for any reason and at any time and (ii) by the Adviser, for any reason, upon ninety (90) days’ prior written notice to the Trust, such termination to be effective as of the close of business on the last day of the then-current one-year period. If it becomes unnecessary for the Adviser to waive fees or reimburse expenses, the Board may permit the Adviser to retain the difference between the Funds’ total annual operating expenses and the expense limitation currently in effect, or, if lower, the expense limitation that was in effect at the time of the waiver and/or reimbursement, to recapture all or a portion of its prior fee waivers or expense reimbursements within three years of the date they were waived or reimbursed. The fees which were waived and/or reimbursed to the Fund by the Adviser, which may be subject to possible future reimbursement, up to the expense cap in place at the time the expenses were waived and reimbursed to the Adviser were $13,217 expiring in 2023 for the 6 Meridian Small Cap Equity ETF.
An interested Trustee and certain officers of the Trust is also an officer of the Adviser. He receives no fees for serving as an officer of the Trust.
Sub-Advisory Agreement
6 Meridian LLC (the “Sub-Adviser”), a Delaware limited liability company, serves as the Funds’ sub-adviser pursuant to a sub-advisory agreement (“Sub-Advisory Agreement”). Under the Sub-Advisory Agreement, the Sub-Adviser makes investment decisions for the Funds and continuously reviews, supervises, and administers the investment program of the Funds, subject to the supervision of the Adviser and the Board.
Under the Sub-Advisory Agreement, with respect to each Fund, the Adviser pays the Sub-Adviser a fee out of the fee the Adviser receives from the Funds, calculated daily and paid monthly at an annual rate of 0.49% of the Funds’ average daily net assets.
Distribution Arrangement
SEI Investments Distribution Co. (the “Distributor”) serves as the Funds’ underwriter and distributor of each Fund’s shares pursuant to an amended and restated Distribution Agreement (the “Distribution Agreement”). Under the Distribution Agreement, the Distributor, as agent, receives orders to purchase shares in Creation Units and transmits such orders to the Funds’ custodian and transfer agent. The Distributor has no obligation to sell any specific quantity of a Fund’s shares. The Distributor bears the following costs and expenses relating to the distribution of shares: (i) the expenses of maintaining its registration or qualification as a dealer or broker under federal or state laws; (ii) filing fees; and (iii) all other expenses incurred in connection with the distribution services, that are not reimbursed by the Adviser, as contemplated in the Distribution Agreement. The Distributor does not maintain any secondary market in any Fund’s shares.
The Funds have adopted a Distribution and Service Plan (the “Plan”) pursuant to Rule 12b-1 under the 1940 Act. In accordance with the Plan, the Funds are authorized to pay an amount up to 0.25% of their average daily assets each year for certain distribution-related activities. For the period ended November 30, 2020, no fees were paid by the Funds under the Plan and the Plan will only be implemented with approval of the Board.
32
6 Meridian
Notes to Financial Statements
November 30, 2020 (Continued)
3. SERVICE PROVIDERS (continued)
Administrator, Custodian and Transfer Agent
SEI Investments Global Funds Services (the “Administrator”) serves as the Funds’ Administrator pursuant to an Administration Agreement. Bank of New York Mellon (the “Custodian” and “Transfer Agent”) serves as the Funds’ Custodian and Transfer agent pursuant to a Custodian Agreement and Transfer Agency Services Agreement. The Adviser of the Funds pay these fees.
An officer of the Trust is affiliated with the Administrator and Distributor. They receive no fees for serving as an officer of the Trust.
4. INVESTMENT TRANSACTIONS
For the period ended November 30, 2020, the purchases and sales of investments in securities, excluding in-kind transactions, long-term U.S. Government and short-term securities were:
Purchases | Sales and | |||||
6 Meridian Low Beta Equity Strategy ETF* | $ | 11,923,049 | $ | 11,222,656 | ||
6 Meridian Mega Cap Equity ETF* |
| 39,246,161 |
| 39,881,713 | ||
6 Meridian Small Cap Equity ETF* |
| 6,750,762 |
| 7,233,203 | ||
6 Meridian Hedged Equity-Index Option Strategy ETF* |
| 91,464,233 |
| 92,530,142 | ||
There were no purchases or sales of long-term U.S. Government securities by any of the Funds.
* Commenced operations on May 8, 2020.
For the period ended November 30, 2020, in-kind transactions associated with creations and redemptions were:
Purchases | Sales | Net Realized | |||||||
6 Meridian Low Beta Equity Strategy ETF* | $ | 89,707,529 | $ | 7,965,383 | $ | 1,180,835 | |||
6 Meridian Mega Cap Equity ETF* |
| 134,626,722 |
| 33,828,301 |
| 4,213,529 | |||
6 Meridian Small Cap Equity ETF* |
| 31,728,401 |
| 5,764,484 |
| 929,804 | |||
6 Meridian Hedged Equity-Index Option Strategy ETF* |
| 240,539,644 |
| 60,918,375 |
| 7,806,542 | |||
* Commenced operations on May 8, 2020.
5. TAX INFORMATION
The amount and character of income and capital gain distributions to be paid, if any, are determined in accordance with Federal income tax regulations, which may differ from U.S. GAAP. As a result, net investment income (loss) and net realized gain (loss) on investment transactions for a reporting period may differ significantly from distributions during such period. These book/tax differences may be temporary or permanent. To the extent these differences are permanent in nature, they are charged or credited to paid-in capital or total distributable earnings as appropriate, in the period that the differences arise.
Accordingly, the following permanent differences primarily attributable to redemptions in-kind have been reclassified within the components of net assets for the period ended November 30, 2020:
Total | Paid-in | ||||||
6 Meridian Low Beta Equity Strategy ETF | $ | (1,180,835 | ) | $ | 1,180,835 | ||
6 Meridian Mega Cap Equity ETF |
| (4,213,579 | ) |
| 4,213,579 | ||
6 Meridian Small Cap Equity ETF |
| (929,804 | ) |
| 929,804 | ||
6 Meridian Hedged Equity-Index Option Strategy ETF |
| (7,806,542 | ) |
| 7,806,542 | ||
33
6 Meridian
Notes to Financial Statements
November 30, 2020 (Continued)
5. TAX INFORMATION (continued)
During the period ended November 30, 2020, the 6 Meridian Low Beta Equity Strategy ETF, 6 Meridian Mega Cap Equity ETF, 6 Meridian Small Cap Equity ETF and 6 Meridian Hedged Equity-Index Option Strategy ETF realized $1,180,835, $4,213,529, $929,804 and $7,806,542, respectively, of net capital gains resulting from in-kind redemptions in which shareholders exchanged Fund shares for securities held by the Funds rather than cash. Because such gains are not taxable to the Funds, and are not distributed to shareholders, they have been reclassified from accumulated net realized losses to paid-in-capital.
These reclassifications have no impact on net assets or net asset value per share.
The tax character of dividends and distributions paid during the period ended November 30, 2020 were as follows:
Ordinary | Long-Term | Totals | |||||||
6 Meridian Low Beta Equity Strategy ETF 2020 | $ | 263,570 | $ | — | $ | 263,570 | |||
6 Meridian Mega Cap Equity ETF 2020 |
| 969,400 |
| — |
| 969,400 | |||
6 Meridian Small Cap Equity ETF 2020 |
| 87,651 |
| — |
| 87,651 | |||
6 Meridian Hedged Equity-Index Option Strategy ETF 2020 |
| 1,754,443 |
| — |
| 1,754,443 | |||
As of November 30, 2020, the components of Distributable Earnings (Accumulated Losses) on a tax basis were as follows:
6 Meridian | 6 Meridian | 6 Meridian | 6 Meridian | |||||||||||||
Undistributed Ordinary Income | $ | 100,687 |
| $ | 174,929 |
| $ | 27,642 |
| $ | 320,127 |
| ||||
Post-October Losses |
| (14,298 | ) |
| (684,301 | ) |
| — |
|
| (11,508,709 | ) | ||||
Capital Loss Carryforwards |
| (300,676 | ) |
| — |
|
| (379,479 | ) |
| (5,704,902 | ) | ||||
Unrealized Appreciation |
| 9,573,728 |
|
| 11,907,081 |
|
| 6,348,072 |
|
| 20,428,695 |
| ||||
Other Temporary Differences |
| (68,802 | ) |
| (183,289 | ) |
| (17,038 | ) |
| (334,030 | ) | ||||
Total Distributable Earnings | $ | 9,290,639 |
| $ | 11,214,420 |
| $ | 5,979,197 |
| $ | 3,201,181 |
| ||||
The Funds are permitted to utilize capital losses that are carried forward and will retain their character as either short-term or long-term capital losses. As of November 30, 2020, the following Funds have capital loss carryforwards to offset capital gains for an unlimited period:
Non Expiring | Non Expiring | Total | |||||||
6 Meridian Low Beta Equity Strategy ETF | $ | 300,676 | $ | — | $ | 300,676 | |||
6 Meridian Small Cap Equity ETF |
| 379,479 |
| — |
| 379,479 | |||
6 Meridian Hedged Equity-Index Option Strategy ETF |
| 2,129,410 |
| 3 ,575,492 |
| 5,704,902 | |||
For Federal income tax purposes, the cost of securities owned at November 30, 2020, and the net realized gains or losses on securities sold for the period, were different from amounts reported for financial reporting purposes primarily due to wash sales which cannot be used for Federal income tax purposes in the current period and
34
6 Meridian
Notes to Financial Statements
November 30, 2020 (Continued)
5. TAX INFORMATION (continued)
have been deferred for use in future years. The Federal tax cost and aggregate gross unrealized appreciation and depreciation on investments and foreign currency transactions held by the Funds at November 30, 2020, were as follows:
Federal Tax | Aggregated | Aggregated | Net | ||||||||||
6 Meridian Low Beta Equity Strategy ETF | $ | 83,754,245 | $ | 12,149,569 | $ | (2,575,841 | ) | $ | 9,573,728 | ||||
6 Meridian Mega Cap Equity ETF |
| 103,997,775 |
| 14,265,995 |
| (2,358,914 | ) |
| 11,907,081 | ||||
6 Meridian Small Cap Equity ETF |
| 26,094,452 |
| 6,903,841 |
| (555,769 | ) |
| 6,348,072 | ||||
6 Meridian Hedged Equity-Index Option Strategy ETF |
| 186,943,807 |
| 24,988,537 |
| (4,559,842 | ) |
| 20,428,695 | ||||
6. RISKS OF INVESTING IN THE FUNDS
As with all exchange traded funds (“ETFs”), a shareholder of any of the Funds is subject to the risk that his or her investment could lose money. The Funds are subject to the principal risks noted below, unless otherwise noted. Any of these risks may adversely affect a Fund’s NAV, trading price, yield, total return and ability to meet its investment objective. Additional principal risks are disclosed in each Fund’s prospectus. Please refer to the Funds’ prospectus for a complete description of the principal risks of investing in a Fund.
Asset Class Risk. Securities and other assets in the Fund’s portfolio may underperform in comparison to the general financial markets, a particular financial market or other asset classes.
Common Stock Risk. Common stock holds the lowest priority in the capital structure of a company, and, therefore, takes the largest share of the company’s risk and its accompanying volatility. The value of the common stock held by the Funds may fall due to general market and economic conditions, perceptions regarding the industries in which the issuers of securities held by the Funds participate, or facts relating to specific companies in which the Funds invests.
Dividends Risk. (6 Meridian Mega Cap Equity ETF and 6 Meridian Hedged Equity-Index Option Strategy ETF) The Funds’ investment in dividend-paying securities could cause the Funds to underperform similar funds that invest without consideration of an issuer’s track record of paying dividends. Companies that issue dividend-paying securities are not required to continue to pay dividends on such securities. Therefore, there is the possibility that such companies could reduce or eliminate the payment of dividends in the future.
Early Close/Trading Halt Risk. An exchange or market may close or issue trading halts on specific securities, or the ability to buy or sell certain securities or financial instruments may be restricted, which may result in the Funds being unable to buy or sell certain securities or financial instruments. In such circumstances, the Funds may be unable to rebalance its portfolio, may be unable to accurately price its investments and/or may incur substantial trading losses.
Equity Risk. The prices of equity securities in which the Funds invests may rise and fall daily. These price movements may result from factors affecting individual issuers, industries or the stock market as a whole.
Issuer-Specific Risk. Fund performance depends on the performance of the issuers to which the Fund has exposure. Issuer-specific events, including changes in the financial condition of an issuer, can have a negative impact on the value of the Fund.
Large-Capitalization Risk. The Funds’ performance may be adversely affected if securities of large-capitalization companies underperform securities of smaller-capitalization companies or the market as a whole. The securities of large-capitalization companies may be relatively mature compared to smaller companies and therefore subject to slower growth during times of economic expansion.
35
6 Meridian
Notes to Financial Statements
November 30, 2020 (Continued)
6. RISKS OF INVESTING IN THE FUNDS (continued)
Limited Authorized Participants, Market Makers and Liquidity Providers Risk. Because the Funds is an ETF, only a limited number of institutional investors (known as “Authorized Participants”) are authorized to purchase and redeem shares directly from the Funds. In addition, there may be a limited number of market makers and/or liquidity providers in the marketplace. To the extent either of the following events occurs, shares of the Funds may trade at a material discount to their NAV per share and possibly face delisting: (i) Authorized Participants exit the business or otherwise become unable to process creation and/or redemption orders and no other Authorized Participants step forward to perform these services, or (ii) market makers and/or liquidity providers exit the business or significantly reduce their business activities and no other entities step forward to perform their functions.
Low Beta Style Risk. Although subject to the risks of common stocks, low beta stocks are seen as having a lower risk profile than the overall markets. However, a portfolio comprised of low beta stocks may not produce investment exposure that has lower variability to changes in such stock price levels. Low beta stocks are likely to underperform the broader market during periods of rapidly rising stock prices.
Market Risk. The market price of a security or instrument could decline, sometimes rapidly or unpredictably, due to general market conditions that are not specifically related to a particular company, such as real or perceived adverse economic or political conditions throughout the world, changes in the general outlook for corporate earnings, changes in interest or currency rates or adverse investor sentiment generally. Local, regional, or global events such as war, acts of terrorism, the spread of infectious illness or other public health issues, recessions, or other events could have a significant impact on the market generally and on specific securities. The market value of a security may also decline because of factors that affect a particular industry or industries, such as labor shortages or increased production costs and competitive conditions within an industry.
Management Risk. The Sub-Adviser continuously evaluates the Funds’ holdings, purchases and sales with a view to achieving the Funds’ investment objective. However, the achievement of the stated investment objective cannot be guaranteed over short- or long-term market cycles. The Sub-Adviser’s judgments about the markets, the economy, or companies may not anticipate actual market movements, economic conditions, or company performance, and these judgments may affect the return on your investment. The quantitative strategy used by the Sub-Adviser may not perform as expected, particularly in volatile markets.
Models and Data Risk. The Sub-Adviser relies heavily on quantitative models as well as data and information supplied by third parties that are utilized by the models. To the extent the models do not perform as designed or as intended, the Funds’ strategy may not be successfully implemented and the Funds may lose value. If the models or data are incorrect or incomplete, any decisions made in reliance thereon may lead to the inclusion or exclusion of securities that would have been excluded or included had the models or data been correct and complete.
New/Smaller Fund Risk. A new or smaller fund is subject to the risk that its performance may not represent how the Funds are expected to or may perform in the long term. In addition, new funds have limited operating histories for investors to evaluate and new and smaller funds may not attract sufficient assets to achieve investment and trading efficiencies. There can be no assurance that the Funds will achieve an economically viable size, in which case it could ultimately liquidate. The Funds may be liquidated by the Board without a shareholder vote. In a liquidation, shareholders of the Funds will receive an amount equal to the Fund’s NAV, after deducting the costs of liquidation, including the transaction costs of disposing of the Fund’s portfolio investments. Receipt of a liquidation distribution may have negative tax consequences for shareholders. Additionally, during the Funds’ liquidation all or a portion of the Funds’ portfolio may be invested in a manner not consistent with its investment objective and investment policies.
Non-Diversification Risk. (6 Meridian Mega Cap Equity ETF and 6 Meridian Hedged Equity-Index Option Strategy ETF) The Funds are a non-diversified investment company under the 1940 Act, meaning that, as compared to a diversified fund, it can invest a greater percentage of its assets in securities issued by or representing a small number of issuers. As a result, the performance of these issuers can have a substantial impact on the Funds’ performance.
36
6 Meridian
Notes to Financial Statements
November 30, 2020 (Continued)
6. RISKS OF INVESTING IN THE FUNDS (continued)
Operational Risk. The Funds and its service providers may experience disruptions that arise from human error, processing and communications errors, counterparty or third-party errors, technology or systems failures, any of which may have an adverse impact on the Funds.
Options Risk. Options give the holder of the option the right to buy (or to sell) a position in a security or in a contract to the writer of the option, at a certain price. They are subject to correlation risk because there may be an imperfect correlation between the options and the securities markets that cause a given transaction to fail to achieve its objectives. The successful use of options depends on the Sub-Adviser’s ability to correctly predict future price fluctuations and the degree of correlation between the options and securities markets. Exchanges can limit the number of positions that can be held or controlled by the Fund or the Sub-Adviser, thus limiting the ability to implement the Fund’s strategies. Options are also particularly subject to leverage risk and can be subject to liquidity risk.
Quality Stocks Risk. Stocks that demonstrate attributes of quality as determined by the Sub-Adviser’s quantitative models may experience lower than expected returns or negative returns. Many factors can affect a stock’s quality and performance and the impact of these factors on a stock is impossible to predict.
Small and Mid-Capitalization Risk. (6 Meridian Low Beat Equity Strategy ETF, 6 Meridian Small Cap Equity ETF, 6 Meridian Hedged Equity-Index Option Strategy ETF) The small- and mid-capitalization companies in which the Funds invests may be more vulnerable to adverse business or economic events than larger, more established companies, and may underperform other segments of the market or the equity market as a whole. Securities of small and mid-capitalization companies generally trade in lower volumes, are often more vulnerable to market volatility, and are subject to greater and more unpredictable price changes than larger capitalization stocks or the stock market as a whole.
Trading Risk. Shares of the Funds may trade on the Exchange above or below their NAV. The NAV of shares of the Funds will fluctuate with changes in the market value of the Funds’ holdings. In addition, although the Funds’ shares are currently listed on the Exchange, there can be no assurance that an active trading market for shares will develop or be maintained. Trading in Fund shares may be halted due to market conditions or for reasons that, in the view of the Exchange, make trading in shares of the Fund inadvisable.
Value Style Risk. (6 Meridian Mega Cap Equity ETF, 6 Meridian Small Cap Equity ETF, 6 Meridian Hedged Equity-Index Option Strategy ETF) Investing in or having exposure to “value” securities presents the risk that the securities may never reach what the Sub-Adviser believes are their full market values, either because the market fails to recognize what the Sub-Adviser considers to be the security’s true value or the Sub-Adviser misjudged that value. In addition, there may be periods during which the investment performance of the Funds while using a value strategy may suffer.
7. OTHER
At November 30, 2020, the records of the Trust, reflected in the table below, shows the total shares outstanding held by Authorized Participants, in the form of Creation Units. However, the individual shares comprising such Creation Units are listed and traded on the Exchange. and have been purchased and sold by persons other than Authorized Participants.
Total Shares | Number of | |||
6 Meridian Low Beta Equity Strategy ETF | 100% | 3 | ||
6 Meridian Mega Cap Equity ETF | 100% | 3 | ||
6 Meridian Small Cap Equity ETF | 100% | 2 | ||
6 Meridian Hedged Equity-Index Option Strategy ETF | 100% | 2 |
37
6 Meridian
Notes to Financial Statements
November 30, 2020 (Concluded)
8. RECENT MARKET EVENTS
The spread of COVID-19 around the world has caused significant volatility in U.S. and international markets. There is significant uncertainty around the breadth and duration of business disruptions related to COVID-19, as well as its impact on the U.S. and international economies. The operational and financial performance of the issuers of securities in which the Funds invest depends on future developments, including the duration and spread of the outbreak, and such developments may in turn impact the value of the Funds’ investments. The ultimate impact of COVID-19 on the financial performance of the Funds’ investments is not reasonably estimable at this time.
9. SUBSEQUENT EVENTS
The Funds have evaluated the need for additional disclosures and/or adjustments resulting from subsequent events through the date the financial statements were issued. Based on this evaluation, no disclosure and/or adjustments were required to the financial statements.
38
To the Shareholders of 6 Meridian Low Beta Equity Strategy ETF, 6 Meridian Mega Cap Equity ETF, 6 Meridian Small Cap Equity ETF, 6 Meridian Hedged Equity-Index Option Strategy ETF and
Board of Trustees of Exchange Traded Concepts Trust
Opinion on the Financial Statements
We have audited the accompanying statements of assets and liabilities, including the schedules of investments, of 6 Meridian Low Beta Equity Strategy ETF, 6 Meridian Mega Cap Equity ETF, 6 Meridian Small Cap Equity ETF and 6 Meridian Hedged Equity-Index Option Strategy ETF (the “Funds”), each a series of Exchange Traded Concepts Trust, as of November 30, 2020, and the related statements of operations and changes in net assets, the related notes, and the financial highlights for the period from May 8, 2020 (commencement of operations) through November 30, 2020 (collectively referred to as the “financial statements”). In our opinion, the financial statements present fairly, in all material respects, the financial position of each of the Funds as of November 30, 2020, the results of their operations, changes in net assets, and the financial highlights for the period from May 8, 2020 (commencement of operations) through November 30, 2020, in conformity with accounting principles generally accepted in the United States of America.
Basis for Opinion
These financial statements are the responsibility of the Funds’ management. Our responsibility is to express an opinion on the Funds’ financial statements based on our audit. We are a public accounting firm registered with the Public Company Accounting Oversight Board (United States) (“PCAOB”) and are required to be independent with respect to the Funds in accordance with the U.S. federal securities laws and the applicable rules and regulations of the Securities and Exchange Commission and the PCAOB.
We conducted our audit in accordance with the standards of the PCAOB. Those standards require that we plan and perform the audit to obtain reasonable assurance about whether the financial statements are free of material misstatement whether due to error or fraud.
Our audit included performing procedures to assess the risks of material misstatement of the financial statements, whether due to error or fraud, and performing procedures that respond to those risks. Such procedures included examining, on a test basis, evidence regarding the amounts and disclosures in the financial statements. Our procedures included confirmation of securities owned as of November 30, 2020, by correspondence with the custodian and brokers. Our audit also included evaluating the accounting principles used and significant estimates made by management, as well as evaluating the overall presentation of the financial statements. We believe that our audit provides a reasonable basis for our opinion.
We have served as the auditor of one or more investment companies advised by Exchange Traded Concepts, LLC since 2012.

COHEN & COMPANY, LTD.
Chicago, Illinois
January 28, 2021
39
Set forth below is information about the Trustees of the Trust. The address of each Trustee of the Trust is c/o Exchange Traded Concepts Trust, 10900 Hefner Pointe Drive, Suite 401, Oklahoma City, Oklahoma 73120. The Funds’ Statement of Additional Information (“SAI”) includes additional information about the Trustees. The SAI may be obtained without charge by calling 1-866-SIXM-ETF.
Name and | Position(s) | Term of | Principal | Number of | Other |
Interested Trustee |
|
|
|
| |
J. Garrett Stevens (1979) | Trustee and President | Trustee (Since 2009); President (Since 2011) | Investment Adviser/Vice President, T.S. Phillips Investments, Inc. (since 2000); Chief Executive Officer, Exchange Traded Concepts, LLC (since 2009); President, Exchange Traded Concepts Trust (since 2011); President, Exchange Listed Funds Trust (since 2012). | 15 | Trustee, ETF Series Solutions (2012 to 2014) |
Independent Trustees(3) |
|
|
|
| |
Timothy J. Jacoby (1952) | Trustee | Since 2014 | Senior Partner, Deloitte & Touche LLP, Private Equity/Hedge Fund/Mutual Fund Services Practice (2000 – 2014). | 26 | Audit Committee Chair, Perth Mint Physical Gold ETF (2018 – 2020); Independent Trustee Edward Jones Money Market Fund (since 2017); Independent Trustee, Source ETF Trust (2014 to 2015). |
Linda Petrone (1962) | Trustee | Since 2019 | Founding Partner, Sage Search Advisors (since 2012). | 26 | None. |
Stuart Strauss(4) (1953) | Trustee | Since 2021 | Partner, Dechert, LLP (2009 – 2020) | 15 | None. |
Mark Zurack (1957) | Trustee | Since 2011 | Professor, Columbia Business School (since 2002). | 15 | Independent Trustee, AQR Funds (46 portfolios) (since 2014); Independent Trustee, Exchange Listed Funds Trust (2019); Independent Trustee, Source ETF Trust, (2014 to 2015). |
(1) Each Trustee shall serve during the continued life of the Trust until he or she dies, resigns, is declared bankrupt or incompetent by a court of competent jurisdiction, or is removed.
(2) The Fund complex includes each series of the Trust and of Exchange Listed Funds Trust.
(3) David M. Mahle resigned as an Independent Trustee effective December 31, 2020.
(4) Mr. Strauss was appointed as an Independent Trustee effective January 1, 2021.
40
6 Meridian
Trustees and Officers of the Trust (Concluded)
Set forth below is information about each of the persons currently serving as officers of the Trust. The address of J. Garrett Stevens, Richard Hogan, and James J. Baker is c/o Exchange Traded Concepts Trust, 10900 Hefner Pointe Drive, Suite 401, Oklahoma City, Oklahoma 73120; the address of Stephen Connors is SEI Investments Company, One Freedom Valley Drive, Oaks, Pennsylvania 19456; and the address of Joseph Scavetti is Cipperman Compliance Services, 480 E. Swedesford Road, Suite 220, Wayne, PA 19087.
Name and Year of Birth | Position(s) Held | Term of Office and Length | Principal Occupation(s) | |||
J. Garrett Stevens (1979) | Trustee and President | Trustee (Since 2009); President (Since 2011) | Investment Adviser/Vice President, T.S. Phillips Investments, Inc. (since 2000); Chief Executive Officer, Exchange Traded Concepts, LLC (since 2009); President, Exchange Traded Concepts Trust (since 2011); President, Exchange Listed Funds Trust (since 2012). | |||
Richard Hogan (1961) | Secretary | Since 2011 | President, Exchange Traded Concepts, LLC (since 2011); Private Investor (since 2003); Trustee and Secretary, Exchange Listed Funds Trust (since 2012); Board Member, Peconic Land Trust (2012 – 2016); Managing Member, Yorkville ETF Advisors (2011 – 2016). | |||
James J. Baker Jr. (1951) | Treasurer | Since 2015 | Managing Partner, Exchange Traded Concepts, LLC (since 2011); Managing Partner, Yorkville ETF Advisors (2012 – 2016); Vice President, Goldman Sachs (2000 – 2011). | |||
Stephen Connors (1984) | Assistant Treasurer | Since 2020 | Director, SEI Investments, Fund Accounting (since 2014.) Audit Manager, Deloitte & Touche LLP, (2011 to 2014). | |||
Joseph Scavetti (1968) | Chief Compliance Officer | Since 2018 | Compliance Director, Cipperman Compliance Services, LLC (since 2018); Chief Operating Officer, Palladiem, LLC (2011 – 2018). |
(1) Each officer serves at the pleasure of the Board of Trustees.
41
All ETFs have operating expenses. As a shareholder of a Fund you incur an advisory fee. In addition to the advisory fee, a shareholder may pay brokerage expenses, taxes, interest, litigation expenses and other extraordinary expenses (including acquired fund fees and expenses), if any. It is important for you to understand the impact of these ongoing costs of your investment returns. Shareholders may incur brokerage commissions on their purchases and sales of a Fund’s shares, which are not reflected in the examples below.
The following examples use the annualized expense ratio and are intended to help you understand the ongoing costs (in dollars) of investing in a Fund and to compare these costs with those of other funds. The examples are based on an investment of $1,000 made at the beginning of the period shown and held for the entire period (June 1, 2020 to November 30, 2020) (unless otherwise noted below). The table below illustrates a Fund’s cost in two ways:
Actual Fund Return. This section helps you to estimate the actual expenses after fee waivers that your Fund incurred over the period. The “Expenses Paid During Period” column shows the actual dollar expense cost incurred by a $1,000 investment in the Funds, and the “Ending Account Value” number is derived from deducting that expense cost from the Fund’s gross investment return.
You can use this information, together with the actual amount you invested in a Fund, to estimate the expenses you paid over that period. Simply divide your actual account value by $1,000 to arrive at a ratio (for example, an $8,600 account value divided by $1,000 = 8.6), then multiply that ratio by the number shown for your Fund under “Expenses Paid During Period.”
Hypothetical 5% Return. This section helps you compare your Fund’s costs with those of other funds. It assumes that the Funds had an annual 5% return before expenses during the year, but that the expense ratio (Column 3) for the period is unchanged. This example is useful in making comparisons because the Commission requires all funds to make this 5% calculation. You can assess your Fund’s comparative cost by comparing the hypothetical result for your Fund in the “Expenses Paid During Period” column with those that appear in the same charts in the shareholder reports for other funds.
NOTE: Because the return is set at 5% for comparison purposes — NOT your Fund’s actual return — the account values shown may not apply to your specific investment.
| Beginning | Ending | Annualized | Expenses |
6 Meridian Low Beta Equity Strategy ETF | ||||
Actual Fund Return | $ 1,000.00 | $ 1,085.20 | 0.88% | $ 4.59 |
Hypothetical 5% Return | $ 1,000.00 | $ 1,020.60 | 0.88% | $ 4.45 |
6 Meridian Mega Cap Equity ETF | ||||
Actual Fund Return | $ 1,000.00 | $ 1,122.50 | 0.86% | $ 4.56 |
Hypothetical 5% Return | $ 1,000.00 | $ 1,020.70 | 0.86% | $ 4.34 |
6 Meridian Small Cap Equity ETF | ||||
Actual Fund Return | $ 1,000.00 | $ 1,247.90 | 1.00% | $ 5.62 |
Hypothetical 5% Return | $ 1,000.00 | $ 1,020.00 | 1.00% | $ 5.05 |
6 Meridian Hedged Equity-Index Option Strategy ETF | ||||
Actual Fund Return | $ 1,000.00 | $ 1,053.50 | 0.86% | $ 4.42 |
Hypothetical 5% Return | $ 1,000.00 | $ 1,020.70 | 0.86% | $ 4.34 |
(1) Expenses are equal to the Fund’s annualized expense ratio multiplied by the average account value over the period, multiplied 183/366 (to reflect the one-half year period shown).
42
For shareholders that do not have an November 30, 2020 tax year end, this notice is for informational purposes only. For shareholders with an November 30, 2020 tax year end, please consult your tax advisor as to the pertinence of this notice.
For the fiscal year ended November 30, 2020, the Funds is designating the following items with regard to distributions paid during the year.
| Long Term | Ordinary | Total | Qualifying | Qualifying | U.S. | Interest | Short-Term | ||||||||
6 Meridian Low Beta Equity Strategy ETF | 0.00% | 100.00% | 100.00% | 100.00% | 100.00% | 0.00% | 0.00% | 0.00% | ||||||||
6 Meridian Mega Cap Equity ETF | 0.00% | 100.00% | 100.00% | 100.00% | 100.00% | 0.00% | 0.00% | 0.00% | ||||||||
6 Meridian Small Cap Equity ETF | 0.00% | 100.00% | 100.00% | 100.00% | 100.00% | 0.00% | 0.00% | 0.00% | ||||||||
6 Meridian Hedged Equity-Index Option Strategy ETF | 0.00% | 100.00% | 100.00% | 100.00% | 100.00% | 0.00% | 0.00% | 0.00% |
(1) Qualifying dividends represent dividends which qualify for the corporate dividends received deduction and is reflected as a percentage of ordinary income distributions (the total of short term capital gain and net investment income distributions).
(2) The percentage in this column represents the amount of “Qualifying Dividend Income” as created by the Jobs and Growth Relief Reconciliation Act of 2003 and its reflected as a percentage of ordinary income distributions (the total of short term capital gain and net investment income distributions). It is the intention of the aforementioned fund to designate the maximum amount permitted by law.
(3) U.S. Government Interest represents the amount of interest that was derived from U.S. Government obligations and distributed during the fiscal year. Generally, interest from direct U.S. Government obligations is exempt from state income tax.
(4) The percentage in this column represents the amount of “Interest Related Dividends” as created by the American Jobs Creation Act of 2004 and is a percentage of net investment income that is exempt from U.S. withholding tax when paid for foreign investors.
(5) The percentage in this column represents the amount of “Short-Term Capital Gain Dividends” as created by the American Jobs Creation Act of 2004 and is reflected as a percentage of short-term capital gain distributions that is exempt from U.S. withholding tax when paid to foreign investors.
43
NAV is the price per share at which the Funds issue and redeem shares. It is calculated in accordance with the standard formula for valuing mutual fund shares. The “Market Price” of a Fund generally is determined using the midpoint between the highest bid and the lowest offer on the stock exchange on which the shares of the Fund are listed for trading, as of the time that the Funds’ NAV is calculated. The Fund’s Market Price may be at, above or below its NAV. The NAV of a Fund will fluctuate with changes in the market value of a Fund’s holdings. The Market Price of a Fund will fluctuate in accordance with changes in its NAV, as well as market supply and demand.
Premiums or discounts are the differences (expressed as a percentage) between the NAV and Market Price of the Fund on a given day, generally at the time NAV is calculated. A premium is the amount that a Fund is trading above the reported NAV, expressed as a percentage of the NAV. A discount is the amount that a Fund is trading below the reported NAV, expressed as a percentage of the NAV.
Further information regarding premiums and discounts is available on the Funds’ website at www.6meridianfunds.com.
44
THIS PAGE INTENTIONALLY LEFT BLANK
![]()
10900 Hefner Pointe Drive, Suite 401
Oklahoma City, OK 73120
Investment Adviser:
Exchange Traded Concepts, LLC
10900 Hefner Pointe Drive, Suite 401
Oklahoma City, OK 73120
Sub-Adviser:
6 Meridian LLC
8301 E 21st St. North
Suite 150
Wicha, KS 67206
Distributor:
SEI Investments Distribution Co.
One Freedom Valley Drive
Oaks, PA 19456
Administrator:
SEI Investments Global Funds Services
One Freedom Valley Drive
Oaks, PA 19456
Legal Counsel:
Morgan, Lewis & Bockius LLP
1111 Pennsylvania Avenue NW
Washington, DC 20004
Independent Registered Public Accounting Firm:
Cohen & Company, Ltd.
151 North Franklin Street
Suite 575
Chicago, IL 60606
This information must be preceded or accompanied by a current prospectus for the Fund.
MER-AR-001-0100
| Item 2. | Code of Ethics. |
The Registrant has adopted a code of ethics that applies to the Registrant's principal executive officer, principal financial officer, comptroller or principal accounting officer or any person who performs a similar function.
| Item 3. | Audit Committee Financial Expert. |
(a) (1) The Registrant’s Board of Trustees has determined that the Registrant has an audit committee financial expert serving on the audit committee.
(a) (2) The audit committee financial expert Timothy Jacoby is an independent trustee as defined in Form N-CSR Item 3 (a) (2).
| Item 4. | Principal Accountant Fees and Services. |
Fees billed by Cohen & Company, Ltd (Cohen) related to the Registrant.
Cohen billed the Registrant aggregate fees for services rendered to the Registrant for the last two fiscal years as follows:
| 2020 | 2019 | ||||||
| All fees and services to the Trust that were pre-approved | All fees and services to service affiliates that were pre-approved | All other fees and services to service affiliates that did not require pre-approval | All fees and services to the Trust that were pre-approved | All fees and services to service affiliates that were pre-approved | All other fees and services to service affiliates that did not require pre-approval | ||
| (a) | Audit Fees
| $97,500 | N/A | N/A | $58,500 | N/A | N/A |
| (b) | Audit-Related Fees
| N/A | N/A | N/A | N/A | N/A | N/A |
| (c) | Tax Fees
| $23,500 | N/A | N/A | $12,500 | N/A | N/A |
| (d) | All Other Fees
| N/A | N/A | N/A | N/A | N/A | N/A |
(e)(1) The Trust’s Audit Committee has adopted, and the Board of Trustees has ratified, an Audit and Non-Audit Services Pre-Approval Policy (the “Policy”), which sets forth the procedures and the conditions pursuant to which services proposed to be performed by the independent auditor of the Trust may be pre-approved.
(e)(2) Percentage of fees billed applicable to non-audit services pursuant to waiver of pre-approval requirement were as follows:
| 2020 | 2019 | |
Audit-Related Fees
| 0% | 0% |
Tax Fees
| 0% | 0% |
All Other Fees
| 0% | 0% |
(f) Not Applicable.
(g) The aggregate non-audit fees and services billed by Cohen for the fiscal years 2020 and 2019 were $23,500 and $12,500, respectively.
(h) During the past fiscal year, Registrant's principal accountant provided certain non-audit services to Registrant's investment adviser or to entities controlling, controlled by, or under common control with Registrant's investment adviser that provide ongoing services to Registrant that were not subject to pre-approval pursuant to paragraph (c)(7)(ii) of Rule 2-01 of Regulation S-X. The Audit Committee of Registrant's Board of Trustees reviewed and considered these non-audit services provided by Registrant's principal accountant to Registrant's affiliates, including whether the provision of these non-audit services is compatible with maintaining the principal accountant's independence.
| Item 5. | Audit Committee of Listed Registrants. |
The Registrant has a separately-designated standing Audit Committee, which is composed of the Registrant's Independent Trustees: Timothy Jacoby, Stuart Strauss, Linda Petrone and Mark Zurack.
| Item 6. | Investments |
Schedule of Investments is included as part of the Report to Shareholders filed under Item 1 of this form.
| Item 7. | Disclosure of Proxy Voting Policies and Procedures for Closed-End Management Investment Companies. |
Not applicable to open-end management investment companies.
| Item 8. | Portfolio Managers of Closed-End Management Investment Companies |
Not applicable to open-end management investment companies.
| Item 9. | Purchases of Equity Securities by Closed-End Management Company and Affiliated Purchasers. |
Not applicable to open-end management investment companies.
| Item 10. | Submission of Matters to a Vote of Security Holders. |
There have been no changes to the procedures by which shareholders may recommend nominees to the Registrant’s Board of Trustees during the period covered by this report.
| Item 11. | Controls and Procedures. |
(a) The Registrant’s principal executive and principal financial officers, or persons performing similar functions, have concluded that the Registrant’s disclosure controls and procedures (as defined in Rule 30a-3(c) under the Act (17 CFR 270.30a-3(c))) as of a date within 90 days of the filing date of the report, are effective based on the evaluation of these controls and procedures required by Rule 30a-3(b) under the Act (17 CFR 270.30a-3(b)) and Rules 13a-15(b) or 15d-15(b) under the Exchange Act (17 CFR 240.13a-15(b) or 240.15d-15(b)).
(b) There has been no change in the Registrant’s internal control over financial reporting (as defined in Rule 30a-3(d) under the Act (17 CFR 270.30a-3(d)) that occurred during the period covered by this report that has materially affected, or is reasonably likely to materially affect, the Registrant’s internal control over financial reporting.
| Item 12. | Disclosure of Securities Lending Activities for the Closed-End Management Investment Companies. |
Not applicable to open-end management investment companies.
| Item 13. | Exhibits. |
(a)(1) Code of Ethics attached hereto.
SIGNATURES
Pursuant to the requirements of the Securities Exchange Act of 1934 and the Investment Company Act of 1940, the Registrant has duly caused this report to be signed on its behalf by the undersigned, thereunto duly authorized.
| Exchange Traded Concepts Trust | ||
| By | /s/ J. Garrett Stevens | |
| J. Garrett Stevens, Trustee and President |
Date: February 5, 2021
Pursuant to the requirements of the Securities Exchange Act of 1934 and the Investment Company Act of 1940, this report has been signed below by the following persons on behalf of the Registrant and in the capacities and on the dates indicated.
| By | /s/ J. Garrett Stevens | |
| J. Garrett Stevens, Trustee and President |
Date: February 5, 2021
| By | /s/ James J. Baker Jr. | |
| James J. Baker, Jr., Treasurer |
Date: February 5, 2021