Washington, D.C. 20549
116 South Franklin Street, Post Office Box 69, Rocky Mount, North Carolina 27802
(Address of principal executive offices) (Zip code)
A. Vason Hamrick
116 South Franklin Street, Post Office Box 69, Rocky Mount, North Carolina 27802
Item 1. REPORTS TO STOCKHOLDERS.
Annual Report 2011
September 30, 2011
This report and the financial statements contained herein are submitted for the general information of the shareholders of the Sector Rotation Fund (the “Fund”). This report is not authorized for distribution to prospective investors in the Fund unless preceded or accompanied by an effective prospectus. The Fund’s shares are not deposits or obligations of, or guaranteed by, any depository institution. The Fund’s shares are not insured by the FDIC, Federal Reserve Board or any other agency, and are subject to investment risks, including possible loss of principal amount invested. Neither the Fund nor the Fund’s distributor is a bank.
The Sector Rotation Fund is distributed by Capital Investment Group, Inc., Member FINRA/SIPC, 17 Glenwood Ave, Raleigh, NC, 27603. There is no affiliation between The Sector Rotation Fund, including its principals, and Capital Investment Group, Inc.
Statements in this Annual Report that reflect projections or expectations of future financial or economic performance of the Sector Rotation Fund (“Fund”) and of the market in general and statements of the Fund’s plans and objectives for future operations are forward-looking statements. No assurance can be given that actual results or events will not differ materially from those projected, estimated, assumed or anticipated in any such forward-looking statements. Important factors that could result in such differences, in addition to the other factors noted with such forward-looking statements, include, without limitation, general economic conditions such as inflation, recession and interest rates. Past performance is not a guarantee of future results.
An investment in the Fund is subject to investment risks, including the possible loss of some or the entire principal amount invested. There can be no assurance that the Fund will be successful in meeting its investment objective. Investment in the Fund is also subject to the following risks: investments in ETF’s, foreign securities risk, inverse correlation risk, short sales risk, derivative risk, leverage risk, market risk, small-cap and mid-cap securities risk, fixed income risk, management style risk, manager risk, non-diversified fund risk, sector focus risk, portfolio turnover risk, and operating risk. More information about these risks and other risks can be found in the Fund’s prospectus.
The performance information quoted in this annual report represents past performance, which is not a guarantee of future results. Investment return and principal value of an investment will fluctuate so that an investor’s shares, when redeemed, may be worth more or less than their original cost. Current performance may be lower or higher than the performance data quoted. An investor may obtain performance data current to the most recent month-end by visiting www.navfx.com.
This Annual Report was first distributed to shareholders on or about November 29, 2011.
For More Information on Your Sector Rotation Fund:
See Our Web site @ www.navfx.com
or
Call Our Shareholder Services Group Toll-Free at 1-800-773-3863.
Dear Fellow Shareholder:
As of September 30, 2011, The Sector Rotation Fund (the “Fund”) had a total one year return of 3.58%, as compared to the S&P 500 Index’s return of 1.14%. I attribute the 2.44% over performance to several factors:
| 1. | I felt that the end of April 2011 would likely be a market high, at least for the foreseeable future, and locked in some very attractive profits by selling fund portfolio holdings around that time. |
| 2. | From June 30, 2011 through September 30, 2011, the S&P 500 Index lost approximately 13%. However, the Fund experienced very small outflows, which allowed me to keep the Fund’s portfolio allocation intact. |
| 3. | The use of ETFs related to the asset classes such as treasury inflation protected securities, gold, silver, and dividend producing equities helped on the downside while producing income to stabilize the share price. |
In its third and final revision of second-quarter gross domestic product (GDP), the Commerce Department reported that the U.S. economy grew at a 1.3% pace in the spring, up from previous estimates of 1%. Lower consensus forecasts for third-quarter GDP renewed recession fears, leading the U.S. Federal Reserve Board (Fed) to reach into its bag of tricks and pull out a move it hadn't used in 50 years: “Operation Twist.”
The move, first used in 1961, involves the Fed’s selling of $400 billion of short-term securities in order to buy longer-term securities (much like a homeowner swapping higher-rate credit-card debt for a lower-rate home-equity loan). The goal of the move, to be completed by June 2012, is to push long-term interest rates lower. The Fed thinks that—along with a pledge to leave its target federal funds rate unchanged at record lows (0% to 0.25%) through mid-2013—will spur consumption, inducing businesses to expand and consumers to spend.
As far as we’re concerned, the Fed can twist and shout all it wants, but the economy isn’t improving. Incoming economic data has hardly been robust, and definitely doesn’t suggest the kind of self-reinforcing growth that has characterized past recoveries from deep recessions.
Economy
Appearing before the Joint Economic Committee in Washington, D.C. in early October 2011, Fed Chairman Ben Bernanke said the economy is growing more slowly than the Fed had expected and is, indeed, “close to faltering.” Let’s look at some of that data.
Employment. According to Bernanke, the most significant factor depressing consumer confidence is poor job growth. U.S. employers added 103,000 net jobs in September, barely enough to keep up with population growth. As of the date of this letter, the nation’s unemployment rate is holding steady at 9.1%, and the outlook is grim: The number of planned layoffs at U.S. companies leapt to their highest level in more than two years in September, according to a report from consultants Challenger, Gray & Christmas. In a survey of consumer sentiment, Thomson Reuters/University of Michigan reported that 65% percent of consumers expect no income increase during the year ahead, and 39% cite income declines as the reason why their finances have recently worsened. Both levels were the highest ever recorded by the survey.
Housing. Housing, meanwhile, has remained at depressed levels. August data was poor: Housing starts fell 5.0% (vs. an anticipated decline of 1.5%), from 601,000 to 571,000, which is 12% below their August 2010 level. New home sales fell 2.3% to a pathetic 295,000 annual rate (vs. 1 million plus in good years). Pending-home sales fell 1% (to their lowest level in four months). Perhaps more alarming, however, is the fact that first mortgage default rates rose from 1.92% in August to 1.99% in September and second mortgage default rates rose from 1.27% to 1.32% over the same period, according to Standard & Poor’s and Experian. This is the first time we’ve seen an increase in first mortgage default rates since November 2010, and it suggests the housing market isn’t anywhere near recovering.
Inflation. Meanwhile, inflation is still a problem, regardless of what anyone may say about reduced inflationary pressures. The consumer price index (CPI) rose 3.9% year-over-year in September. However, if the same calculation method in place prior to 1983 was used, the price level increase would be 7.2% and 11.5% per calculation methods used prior to 1990, according to Shadowstats. Increasing price levels are a problem, no matter what the current statistics report.
Consumer confidence. Given these statistics, it’s not surprising that consumer confidence has been low. The Thomson Reuters/University of Michigan's preliminary reading on the overall index on consumer sentiment fell from 59.4 in September to 57.5 in October, short of the median forecast of 60.2. One segment of the survey, consumers' outlook, also deteriorated, to its lowest level since May 1980. Overall, that data indicates that a recessionary downturn is likely to occur, according to the survey director, because even if the economy manages to avoid formal recession designation by The National Bureau of Economic Research, consumer expenditures will not be strong enough to enable the more robust job growth that is needed to offset economic stagnation on consumer behavior. In other words, consumer confidence is a self-fulfilling prophecy, causing businesses and consumers to hunker down even more.
Looking forward, there are a number of additional risks to the U.S. economy. Europe’s debt crisis could boil over, damaging the U.S. economy through financial and trade linkages. There’s also the potential for premature fiscal tightening, which, if implemented too quickly, could weigh even more on an economic recovery that’s already struggling.
Markets
While daily reports of market rallies may have investors thinking the markets are fine, longer-term data—from September and the third quarter—paint a dreary picture.
Stocks. The third quarter brought a broad selloff in stocks. The S&P 500 Index saw its worst August since 2001 and five daily declines greater than 3%. It continued its slide in September, returning –7.03%. The Index’s total third-quarter return was –13.87%. Hardest hit sectors were cyclical, such as materials, industrials, and financials. During the quarter, large-cap stocks outperformed small-cap stocks by the largest margin since the first quarter of 1999, with the large-cap S&P 500 Index outperforming the small-cap Russell 2000 Index by 8 percentage points. And the deterioration was global, with the MSCI World Index returning –16.61% in the third quarter and –8.64% in September. Emerging-market stocks were particularly hard hit, with the MSCI Emerging Markets Index returning –22.56% in the third quarter, the fastest decline since the fourth quarter of 2008. And Europe ex-United Kingdom saw its worst quarter since the third quarter of 2002.
Bonds. Risk aversion has fueled a fixed-income rally. U.S. Treasuries rose 6.5% in the third quarter, the most since the fourth quarter of 2008, with 10-year yields hitting record lows of 1.72%. The Barclays Capital U.S. Aggregate Index rose 0.73% in September and 3.82% in the third quarter (its eleventh rise in 12 quarters). The Barclays Capital Municipal Bond Index rose 1.03% in September and 3.81% in the third quarter (the fastest pace in eight quarters), with revenue bonds outperforming both general obligation bonds and high-yield municipals for the first time since the second quarter of 2008. Treasury inflation-protected securities (TIPS) also rose (for the eleventh consecutive quarter!) as inflation expectations fell.
Commodities. Surprisingly, risk aversion didn’t drive investors to hard assets in the form of commodities. The Dow Jones-UBS Commodity Index returned –14.74% in September and –11.34% in the third quarter (its second straight quarterly loss), primarily on the back of a U.S. dollar rally and global growth concerns. The S&P/Citigroup Gold & Precious Metals Index, meanwhile, returned –9.38% in September and –5.51% in the third quarter. Gold itself fell by more than $200 per ounce in September (from a record high of $1,891 per ounce on August 22).
If Europe can muddle through its current troubles without a full-blown crisis, and the United States is able to avoid recession, risk assets, such as stocks, will likely rally, and bonds will probably give up some ground. But we don’t see that happening. Lasting solutions to problems such as the European crisis are elusive, and U.S. growth prospects are modest at best, with ample downside risk. The stock market, then, is likely to stay on edge.
Mark A. Grimaldi
Fund Manager
Sector Rotation Fund
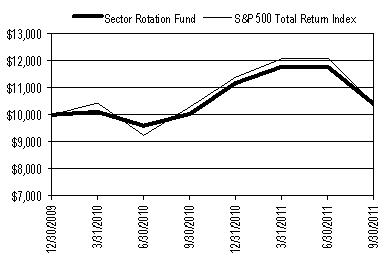
Performance Update - $10,000 Investment (Unaudited)
For the period from December 30, 2009 (Commencement of Operations) to September 30, 2011
 | Performance Returns for the period ended September 30, 2011 |
Average Annual Total Returns | One Year | Since Inception* | Gross Expense Ratio** |
| Sector Rotation Fund | 3.59% | 2.21% | 2.20% |
Cumulative Total Investment Returns | Since Inception* | Final Value of $10,000 Investment |
| Sector Rotation Fund | 3.90% | $10,390 |
| S&P 500 Total Return Index | 4.02% | $10,402 |
| * The Fund’s inception date is December 30, 2009 (Commencement of Operations). |
This graph assumes an initial investment of $10,000 at December 30, 2009. All dividends and distributions are reinvested. This graph depicts the performance of the Sector Rotation Fund (the “Fund”) versus the S&P 500 Total Return Index. It is important to note that the Fund is a professionally managed mutual fund while the index is not available for investment and is unmanaged. The comparison is shown for illustrative purposes only. ** The gross expense ratio shown is from the Fund’s prospectus dated June 27, 2011. This number may vary from the expense ratio shown elsewhere in this report because it is based on a different time period and, if applicable, does not include fee or expense waivers. |
Performance quoted above represents past performance, which is no guarantee of future results. Investment return and principal value will fluctuate so that shares, when redeemed, may be worth more or less than their original cost. Current performance may be lower or higher than the performance data quoted. An investor may obtain performance data, current to the most recent month-end, by visiting www.navfx.com.
The graph and table do not reflect the deduction of taxes that a shareholder would pay on Fund distributions or the redemption of Fund shares. Average annual total returns are historical in nature and measure net investment income and capital gain or loss from portfolio investments assuming reinvestments of distributions.
Investing in the securities of small companies generally involves greater risk than investing in larger, more established companies. Therefore, investments in the Fund may involve a greater degree of risk than investments in other mutual funds that seek capital growth by investing in larger, more established companies.
Fund Expenses (Unaudited)
Example – As a shareholder of the Fund, you incur ongoing costs, including management fees and other Fund expenses. This example is intended to help you understand your ongoing costs (in dollars) of investing in the Fund and to compare these costs with the ongoing costs of investing in other mutual funds. The example is based on an investment of $1,000 invested at the beginning of the period and held for the entire period as indicated below. Actual Expenses – The first line of the table below provides information about the actual account values and actual expenses. You may use the information in this line, together with the amount you invested, to estimate the expenses that you paid over the period. Simply divide your account value by $1,000 (for example, an $8,600 account value divided by $1,000 = 8.6), then multiply the result by the number in the first line under the heading entitled “Expenses Paid During Period” to estimate the expenses you paid on your account during this period. Hypothetical Example for Comparison Purposes – The second line of the table below provides information about hypothetical account values and hypothetical expenses based on the Fund’s actual expense ratio and an assumed annual rate of return of 5% before expenses, which is not the Fund’s actual return. The hypothetical account values and expenses may not be used to estimate the actual ending account balance or expenses you paid for the period. You may use this information to compare the ongoing costs of investing in the Fund and other funds by comparing this 5% hypothetical example with the 5% hypothetical examples that appear in the shareholder reports of other funds. |
| Expense Example | Beginning Account Value April 1, 2011 | Ending Account Value September 30, 2011 | Expenses Paid During Period* |
| Actual | $1,000.00 | $882.80 | $7.79 |
| Hypothetical (5% return before expenses) | $1,000.00 | $1,016.80 | $8.34 |
* Actual expenses are based on expenses incurred in the most recent six-month period. The Fund’s annualized six-month expense ratio is 1.65%. The values under “Expenses Paid During Period” are equal to the annualized expense ratio multiplied by the average account value over the period, multiplied by 183/365 (to reflect the one-half year period).
| Sector Rotation Fund | | | | | | | |
| | | | | | | | | | |
| Schedule of Investments | | | | | | | |
| | | | | | | | | | |
| | | | | | | | | | |
| As of September 30, 2011 | | | | | | |
| | | | | | | | Shares | | Value (Note 1) |
| | | | | | | | | | |
| EXCHANGE-TRADED FUNDS - 65.03% | | | | | | |
| | | | | | | | | | |
| | Fixed Income - 6.93% | | | | | | |
| | | iShares iBoxx $ High Yield Corporate Bond Fund | | 2,000 | $ | 165,660 |
| | | ProShares UltraShort 20+ Year Treasury | | 5,000 | | 97,200 |
| | | SPDR Barclays Capital High Yield Bond ETF | | 7,000 | | 253,330 |
| | | SPDR Barclays Capital TIPS ETF | | | | 18,000 | | 1,022,400 |
| | | | | | | | | | 1,538,590 |
| | International - 3.93% | | | | | | | |
| | | iShares MSCI Canada Index Fund | | | | 5,000 | | 127,450 |
| | | iShares MSCI Hong Kong Index Fund | | | 1,000 | | 14,330 |
| | | iShares MSCI Japan Index Fund | | | | 10,000 | | 94,600 |
| | | iShares MSCI Pacific ex-Japan Index Fund | | 10,000 | | 367,700 |
| | | iShares MSCI Switzerland Index Fund | | | 5,000 | | 108,300 |
| | | iShares MSCI Taiwan Index Fund | | | | 1,000 | | 11,810 |
| | | iShares MSCI United Kingdom Index Fund | | 10,000 | | 147,700 |
| | | | | | | | | | 871,890 |
| | Large Cap - 45.39% | | | | | | | |
| | | ProShares Ultra S&P500 | | | | 49,000 | | 1,860,530 |
| | | ProShares UltraPro S&P 500 | | | | 12,000 | | 550,560 |
| | | SPDR S&P 500 ETF Trust | | | | 22,000 | | 2,489,300 |
| | | SPDR S&P Dividend ETF | | | | 92,000 | | 4,466,600 |
| | | Vanguard Value ETF | | | | 15,000 | | 705,750 |
| | | | | | | | | | 10,072,740 |
| | Mid Cap - 2.03% | | | | | | | |
| | | iShares S&P MidCap 400 Growth Index Fund | | 5,000 | | 449,200 |
| | | | | | | | | | 449,200 |
| | Small Cap - 4.91% | | | | | | | |
| | * | ProShares Ultra Russell2000 | | | | 40,000 | | 1,089,200 |
| | | | | | | | | | 1,089,200 |
| | Utilities - 1.84% | | | | | | | |
| | | iShares Dow Jones US Utilities Sector Index Fund | | 5,000 | | 408,750 |
| | | | | | | | | | 408,750 |
| | | | | | | | | | |
| | | Total Exchange-Traded Funds (Cost $14,366,126) | | | | 14,430,370 |
| | | | | | | | | | |
| COMMODITIES - 4.92% | | | | | | | |
| | * | iShares Silver Trust | | | | 5,000 | | 144,550 |
| | * | SPDR Gold Shares | | | | 6,000 | | 948,360 |
| | | | | | | | | | |
| | | Total Commodities (Cost $868,150) | | | | | | 1,092,910 |
| | | | | | | | | | |
| | | | | | | | | | |
| | | | | | | | | | |
| | | | | | | | | | (Continued) |
| Sector Rotation Fund | | | | | | | |
| | | | | | | | | | |
| Schedule of Investments | | | | | | | |
| | | | | | | | | | |
| | | | | | | | | | |
| As of September 30, 2011 | | | | | | |
| | | | | | | | Shares | Value (Note 1) |
| | | | | | | | | | |
| SHORT-TERM INVESTMENT - 9.63% | | | | | | |
| | § | Fidelity Institutional Money Market Funds, 0.01% | | 2,135,962 | $ | 2,135,962 |
| | | | | | | | | | |
| | | Total Short-Term Investment (Cost $2,135,962) | | | | 2,135,962 |
| | | | | | | | | | |
| Total Value of Investments (Cost $17,370,238) - 79.58% | | | $ | 17,659,242 |
| | | | | | | | | | |
| Other Assets Less Liabilities - 20.42% | | | | | | 4,530,884 |
| | | | | | | | | | |
| | Net Assets - 100.00% | | | | | $ | 22,190,126 |
| | | | | | | | | | |
| * | Non-income producing investment | | | | | | |
| § | Represents 7 day effective yield | | | | | | |
| | | | | | | | | | |
| The following acronyms are used in this portfolio: | | | | |
| | ETF - Exchange-Traded Fund | | | | | | |
| | TIPS - Treasury Inflation-Protected Securities | | | | |
| | | | | | | | | | |
| | | | | | | | | | |
| | | | | | | | | | |
| | | | Summary of Investments by Sector | | | | |
| | | | | | % of Net | | | | |
| | | | Sector | | Assets | | Value | | |
| | | | ETF Fixed Income | 6.93% | | $ 1,538,590 | | |
| | | | ETF International | | 3.93% | | 871,890 | | |
| | | | ETF Large Cap | | 45.39% | | 10,072,740 | | |
| | | | ETF Mid Cap | | 2.03% | | 449,200 | | |
| | | | ETF Small Cap | | 4.91% | | 1,089,200 | | |
| | | | ETF Utilities | | 1.84% | | 408,750 | | |
| | | | Commodities | | 4.92% | | 1,092,910 | | |
| | | | Other | | 9.63% | | 2,135,962 | | |
| | | | Total | | 79.58% | | $17,659,242 | | |
| | | | | | | | | | |
| | | | | | | | | | |
| | | | | | | | | | |
| | | | | | | | | | |
| | | | | | | | | | |
| | | | | | | | | | |
| | | | | | | | | | |
| | | | | | | | | | |
| | | | | | | | | | |
| | | | | | | | | | |
| | | | | | | | | | |
| | | | | | | | | | |
| See Notes to Financial Statements | | | | | | |
| Sector Rotation Fund | | |
| | | | | |
| Statement of Assets and Liabilities | | |
| | | | | |
| | | | | |
| As of September 30, 2011 | | |
| | | | | |
| Assets: | | |
| | Investments, at value (cost $17,370,238) | $ | 17,659,242 |
| | Receivables: | | |
| | | Investments sold | | 8,535,242 |
| | | Fund shares sold | | 9,970 |
| | | Dividends | | 13,778 |
| | Prepaid expenses (note 5) | | 84,797 |
| | | | | |
| Total assets | | 26,303,029 |
| | | | | |
| Liabilities: | | |
| | Payables: | | |
| | | Investments purchased | | 3,891,919 |
| | | Fund shares repurchased | | 189,702 |
| | Accrued expenses | | |
| | | Administration fees | | 12,327 |
| | | Advisory fees | | 18,955 |
| | | | | |
| | Total liabilities | | 4,112,903 |
| | | | | |
| Net Assets | $ | 22,190,126 |
| | | | | |
| Net Assets Consist of: | | |
| | Capital | $ | 21,498,767 |
| | | Distributable net investment income | | 118,802 |
| | | Distributable net realized gain on investments | | 283,553 |
| | | Net unrealized appreciation on investments | | 289,004 |
| | | | | |
| | | Total Net Assets | $ | 22,190,126 |
| | | Shares Outstanding, no par value (unlimited authorized shares) | | 2,138,150 |
| | | Net Asset Value, Maximum Offering Price and Redemption Price Per Share | $ | 10.38 |
| | | | | |
| | | | | |
| | | | | |
| | | | | |
| | | | | |
| | | | | |
| | | | | |
| | | | | |
| | | | | |
| | | | | |
| | | | | |
| | | | | |
| | | | | |
| | | | | |
| | | | | |
| | | | | |
| See Notes to Financial Statements | | |
| Sector Rotation Fund | | |
| | | | |
| Statement of Operations | | |
| | | | |
| | | | |
| For the fiscal year ended September 30, 2011 | | |
| | | | |
| Investment Income: | | |
| | Dividends | $ | 496,372 |
| | | | |
| | Total Investment Income | | 496,372 |
| | | | |
| Expenses: | | |
| | Advisory fees (note 2) | | 228,830 |
| | Administration fees (note 2) | | 63,877 |
| | Transfer agent fees (note 2) | | 30,785 |
| | Custody fees | | 4,637 |
| | Organizational expenses | | 13,530 |
| | Deferred offering costs | | 4,394 |
| | Legal fees | | 34,235 |
| | Audit and tax preparation fees | | 11,975 |
| | Registration and filing expenses | | 16,539 |
| | Printing expenses | | 11,698 |
| | Trustee fees and meeting expenses | | 3,600 |
| | Securities pricing fees | | 15,002 |
| | Other operating expenses | | 24,902 |
| | | | |
| Total Expenses | | 464,004 |
| | | | |
| | Advisory fees waived (note 2) | | (86,434) |
| | | | |
| | Net Expenses | | 377,570 |
| | | | |
| Net Investment Income | | 118,802 |
| | | | |
| Realized and Unrealized Gain on Investments | | |
| | | | |
| | Net realized gain from investment transactions | | 648,727 |
| | Change in unrealized depreciation on investments | | (464,544) |
| | | | |
| Realized and Unrealized Gain on Investments | | 184,183 |
| | | | |
| Net Increase in Net Assets Resulting from Operations | $ | 302,985 |
| | | | |
| | | | |
| | | | |
| | | | |
| | | | |
| | | | |
| | | | |
| | | | |
| | | | |
| | | | |
| | | | |
| See Notes to Financial Statements | | |
| Sector Rotation Fund | | | | | | |
| | | | | | | | | | | |
| Statements of Changes in Net Assets | | | | | | |
| | | | | | | | | | | |
| | | | | | | | | | | |
| For the fiscal year and period ended September 30, | | | 2011 | | 2010 (a) |
| | | | | | | | | | | |
| Operations: | | | | | | | |
| | Net investment income (loss) | | | $ | 118,802 | $ | (11,845) |
| | Net realized gain (loss) from investment transactions | | | 648,727 | | (365,174) |
| | Change in unrealized appreciation on investments | | | (464,544) | | 753,548 |
| | | | | | | | | | | |
| Net Increase in Net Assets Resulting from Operations | | | 302,985 | | 376,529 |
| | | | | | | | | | | |
| Capital Share Transactions | | | | | | |
| | Shares sold | | | | | 7,951,135 | | 19,105,132 |
| | Shares repurchased | | | | (4,267,268) | | (1,278,387) |
| | | | | | | | | | | |
| Increase from Capital Share Transactions | | | | 3,683,867 | | 17,826,745 |
| | | | | | | | | | | |
| Net Increase in Net Assets | | | | 3,986,852 | | 18,203,274 |
| | | | | | | | | | | |
| Net Assets: | | | | | | | |
| | Beginning of Period | | | | 18,203,274 | | - |
| | End of Period | | | | $ | 22,190,126 | $ | 18,203,274 |
| | | | | | | | | | | |
| Undistributed Net Investment Income | | | $ | 118,802 | $ | - |
| | | | | | | | | | | |
| Share Information: | | | | | | |
| | Shares Sold | | | | | 705,923 | | 1,946,723 |
| | Shares repurchased | | | | (383,748) | | (130,748) |
| | Net Increase in Capital Shares | | | | 322,175 | | 1,815,975 |
| | Shares Outstanding, Beginning of Period | | | | 1,815,975 | | - |
| | Shares Outstanding, End of Period | | | | 2,138,150 | | 1,815,975 |
| | | | | | | | | | | |
| (a) | For the period from December 31, 2009 (Commencement of Operations) to September 30, 2010. |
| | | | | | | | | | | |
| | | | | | | | | | | |
| | | | | | | | | | | |
| | | | | | | | | | | |
| | | | | | | | | | | |
| | | | | | | | | | | |
| | | | | | | | | | | |
| | | | | | | | | | | |
| | | | | | | | | | | |
| | | | | | | | | | | |
| | | | | | | | | | | |
| | | | | | | | | | | |
| | | | | | | | | | | |
| | | | | | | | | | | |
| | | | | | | | | | | |
| | | | | | | | | | | |
| | | | | | | | | | | |
| | | | | | | | | | | |
| See Notes to Financial Statements | | | | | | |
| Sector Rotation Fund | | | | | |
| | | | | | | | | | |
| Financial Highlights | | | | | |
| | | | | | | | | | |
| For a share outstanding during the | | | | | |
| fiscal year or period ended September 30, | | 2011 | | 2010 (a) | |
| | | | | | | | | | |
| Net Asset Value, Beginning of Period | $ | 10.02 | $ | 10.00 | |
| | | | | | | | | | |
| Income (Loss) from Investment Operations | | | | | |
| | Net investment income (loss) | | 0.06 | | (0.01) | |
| | Net realized and unrealized gain (loss) on securities | | 0.30 | | 0.03 | |
| | | | | | | | | | |
| Total from Investment Operations | | 0.36 | | 0.02 | |
| | | | | | | | | | |
| Net Asset Value, End of Period | $ | 10.38 | $ | 10.02 | |
| | | | | | | | | | |
| Total Return (d) | | | 3.59% | | 0.20% | (c) |
| | | | | | | | | | |
| Net Assets, End of Period (in thousands) | $ | 22,190 | $ | 18,203 | |
| | | | | | | | | | |
| Average Net Assets for the Period (in thousands) | $ | 22,864 | $ | 14,130 | |
| | | | | | | | | | |
| Ratios of: | | | | | | | |
| Gross Expenses to Average Net Assets (e) | | 2.03% | | 2.58% | (b) |
| Net Expenses to Average Net Assets (e) | | 1.65% | | 1.65% | (b) |
| Net Investment Income (Loss) to Average Net Assets | | 0.52% | | (0.11)% | (b) |
| | | | | | | | | | |
| Portfolio turnover rate | | 227.34% | | 457.43% | (c) |
| | | | | | | | | | |
| (a) | For the period from December 31, 2009 (Commencement of Operations) to September 30, 2010. | |
| (b) | Annualized. | | | | | | |
| (c) | Not annualized. | | | | | |
| | Total return does not reflect sales charge, if any. | | | | | |
| (d) | Includes adjustments in accordance with accounting principles generally accepted in the United States and, |
| | consequently, the net asset value for financial reporting purposes and the returns based upon those net asset |
| | values may differ from the net asset values and returns for shareholder transactions. | | |
| (e) | The expense ratios listed reflect total expenses prior to any waivers and reimbursements (gross expense ratio) |
| | and after any waivers and reimbursements (net expense ratio). | | | | | |
| | | | | | | | | | |
| | | | | | | | | | |
| | | | | | | | | | |
| | | | | | | | | | |
| | | | | | | | | | |
| | | | | | | | | | |
| | | | | | | | | | |
| | | | | | | | | | |
| | | | | | | | | | |
| | | | | | | | | | |
| | | | | | | | | | |
| | | | | | | | | | |
| | | | | | | | | | |
| | | | | | | | | | |
| | | | | | | | | | |
| See Notes to Financial Statements | | | | | |
Sector Rotation Fund
Notes to Financial Statements
1. Organization and Significant Accounting Policies
The Sector Rotation Fund (“Fund”), formally a series of World Funds Trust (“WFT”), is a series of the Starboard Investment Trust (“Trust”). The Trust is organized as a Delaware statutory trust and is registered under the Investment Company Act of 1940, as amended (“1940 Act”), as an open-end management investment company. The Fund is a separate non-diversified series of the Trust. The Fund commenced operations on December 31, 2009. Effective November 29, 2010, the Fund changed its name from the Navigator Fund to the Sector Rotation Fund.
The Board of Trustees (“Trustees”) of the Fund approved a Plan of Reorganization (“Plan”) on May 4, 2011 whereby the Fund would be reorganized from WFT into a newly created series of the Trust. A special meeting of shareholders was held on June 22, 2011 resulting in approval of the Plan.
The investment objective of the Fund is to achieve capital appreciation. Under normal circumstances, the Fund invests in Exchange-traded funds (“ETFs”). An ETF is an open-end investment company that holds a portfolio of investments designed to track a particular market segment or underlying index.
The following is a summary of significant accounting policies consistently followed by the Fund. The policies are in conformity with accounting principles generally accepted in the United States of America (“GAAP”).
Investment Valuation
The Fund’s investments in securities are carried at fair value. Securities listed on an exchange or quoted on a national market system are valued at the last sales price as of 4:00 p.m. Eastern Time. Securities traded in the NASDAQ over-the-counter market are generally valued at the NASDAQ Official Closing Price. Other securities traded in the over-the-counter market and listed securities for which no sale was reported on that date are valued at the most recent bid price. Securities and assets for which representative market quotations are not readily available (e.g., if the exchange on which the security is principally traded closes early or if trading of the particular security is halted during the day and does not resume prior to the Fund’s net asset value calculation) or which cannot be accurately valued using the Fund’s normal pricing procedures are valued at fair value as determined in good faith under policies approved by the Trustees. A security’s “fair value” price may differ from the price next available for that security using the Fund’s normal pricing procedures. Instruments with maturities of 60 days or less are valued at amortized cost, which approximates market value.
Fair Value Measurement
Various inputs are used in determining the value of the Fund's investments. These inputs are summarized in the three broad levels listed below:
Level 1: quoted prices in active markets for identical securities
Level 2: other significant observable inputs (including quoted prices for similar securities, interest rates, credit risk, etc.)
Level 3: significant unobservable inputs (including the Fund’s own assumptions in determining fair value of investments)
The availability of observable inputs can vary from security to security and is affected by a wide variety of factors, including, for example, the type of security, whether the security is new and not yet established in the marketplace, the liquidity of markets, and other characteristics particular to the security. To the extent that valuation is based on models or inputs that are less observable or unobservable in the market, the determination of fair value requires more judgment. Accordingly, the degree of judgment exercised in determining fair value is greatest for instruments categorized in Level 3.
The inputs used to measure fair value may fall into different levels of the fair value hierarchy. In such cases, for disclosure purposes, the level in the fair value hierarchy within which the fair value measurement falls in its entirety, is determined based on the lowest level input that is significant to the fair value measurement in its entirety.
Sector Rotation Fund
Notes to Financial Statements
The inputs or methodology used for valuing securities are not necessarily an indication of the risk associated with investing in those securities. The following tables summarize the inputs as of September 30, 2011 for the Fund’s assets and liabilities measured at fair value:
| Sector Rotation Fund | | |
| Investments in Securities | | Total | | Level 1 | | Level 2 | | Level 3 |
| Assets | | | | | | | | |
| Exchange-Traded Funds | $ | 14,430,370 | $ | 14,430,370 | $ | - | $ | - |
| Commodities | | 1,092,910 | | 1,092,910 | | - | | - |
| Short-Term Investment | | 2,135,962 | | - | | 2,135,962 | | |
| Total Assets | $ | 17,659,242 | $ | 15,523,280 | $ | 2,135,962 | $ | - |
| | | | | | | | | |
Investment Transactions and Investment Income
Investment transactions are accounted for as of the date purchased or sold (trade date). Dividend income is recorded on the ex-dividend date. Certain dividends from foreign securities will be recorded as soon as the Fund is informed of the dividend if such information is obtained subsequent to the ex-dividend date. Interest income is recorded on the accrual basis and includes amortization of discounts and premiums. Gains and losses are determined on the identified cost basis, which is the same basis used for federal income tax purposes.
Expenses
The Fund bears expenses incurred specifically on its behalf as well as a portion of general expenses, which are allocated according to methods reviewed annually by the Trustees.
Dividend Distributions
The Fund may declare and distribute dividends from net investment income (if any), quarterly. Distributions from capital gains (if any) are generally declared and distributed annually. Dividends and distributions to shareholders are recorded on ex-date.
Estimates
The preparation of financial statements in conformity with accounting principles generally accepted in the United States of America requires management to make estimates and assumptions that affect the reported amounts of assets and liabilities and the disclosure of contingent assets and liabilities at the date of the financial statements and the reported amounts of increases and decreases in the net assets from operations during the reported period. Actual results could differ from those estimates.
Federal Income Taxes
No provision for income taxes is included in the accompanying financial statements, as the Fund intends to distribute to shareholders all taxable investment income and realized gains and otherwise complies with Subchapter M of the Internal Revenue Code applicable to regulated investment companies.
| 2. | Transactions with Affiliates & Service Providers |
Advisor
As full compensation for the investment advisory services provided to the Fund by Navigator Money Management, Inc. (the “Advisor”), the Advisor receives a monthly fee based on the Fund’s average daily net assets. The Advisor shall receive an investment advisory fee equal to an annualized rate of 1.00% of the average daily net assets of the Fund. In accordance with these terms, the Advisor earned $228,830 and waived $86,434 in advisory fees for the fiscal year ended September 30, 2011.
Sector Rotation Fund
Notes to Financial Statements
Prior to June 27, 2011, the Advisor had contractually agreed to waive or limit its fees and to assume other operating expenses so that the ratio of total annual operating expenses was limited to 1.65% of the average net assets of the Fund. The limit does not apply to interest, taxes, brokerage commissions, other expenditures capitalized in accordance with GAAP or other extraordinary expenses not incurred in the ordinary course of business. The total amount of reimbursement recoverable by the Advisor is the sum of all fees previously waived or reimbursed by the Advisor to the Fund during any of the previous three (3) years, less any reimbursement previously paid by the Fund to the Advisor with respect to any waivers, reductions, and payments made with respect to the Fund. The total amount of recoverable reimbursements as of September 30, 2011 was $185,405 and expires as follows:
| Expiration Date | | Amount |
| September 30, 2013 | | $ 98,971 |
| September 30, 2014 | | 86,434 |
| Total | | $ 185,405 |
| | | |
The recovery of any amounts is limited to situations where the repayment would not cause the Fund’s expense ratio of total annual operating expenses to exceed 1.65%.
Administrator
Under the terms of an Administration Agreement with the Trust, effective June 27, 2011, The Nottingham Company (“Administrator”) assists the Trust in the performance of its administrative responsibilities to the Fund, coordinates and pays for the services of each vendor and the operating expense to the Fund, and provides the Fund with certain administrative, fund accounting, and compliance services. As part of its services and consolidated fee arrangement, the Administrator receives compensation based on the Fund’s average daily net assets. The annual rate is 0.650% if the average daily net assets are under $30 million and gradually decreases to an annual rate of 0.095% if the average daily net assets are $1.795 billion or more. The fee paid to the Administrator is calculated by multiplying the average daily net assets of the Fund by the highest applicable annual rate. The Advisor has entered into an Operating Plan with the Fund’s administrator under which it has agreed to assume certain fees of the administrator to the extent such fees exceed the maximum of 1.65% of the average daily net assets of the Fund to be paid by the Fund to the administrator under its consolidated fee arrangement. The Advisor cannot recoup from the Fund any amounts paid by the Advisor to the Administrator under the Operating Plan.
The Administrator pays all expenses not assumed by the Advisor, including, without limitation: the fees and expenses of its independent accountants and of its legal counsel; the costs of printing and mailing to shareholders annual and semi-annual reports, proxy statements, prospectuses, statements of additional information and supplements thereto; the costs of printing registration statements; bank transaction charges and custodian’s fees; any proxy solicitors’ fees and expenses; filing fees; any federal, state or local income or other taxes; any interest; any membership fees of the Investment Company Institute and similar organizations; fidelity bond and Trustees’ liability insurance premiums. The Fund paid $41,773 in administration fees to the Administrator for the fiscal year ended September 30, 2011.
Prior to June 27, 2011, the administrative agent for the Fund was Commonwealth Shareholder Services, Inc. (“CSS”). CSS provided shareholder, recordkeeping, administrative and blue sky filing services. For such administrative services, CSS received an asset based fee on the Fund’s average daily net assets in the amount of $22,104 for the fiscal year ended September 30, 2011.
Prior to June 27, 2011, the fund accounting agent was Commonwealth Fund Accounting (“CFA”). CFA provided fund accounting services and served as the Fund’s pricing agent. For such fund accounting services, CFA received $15,002 for the fiscal year ended September 30, 2011.
Compliance Services
Nottingham Compliance Services, LLC, a fully owned affiliate of the Administrator, provides services which assist the Trust’s Chief Compliance Officer in monitoring and testing the policies and procedures of the Trust in conjunction with requirements under Rule 38a-1 of the 1940 Act. It receives compensation for this service at an annual rate of $10,500.
Sector Rotation Fund
Notes to Financial Statements
Transfer Agent
Under the terms of a Dividend Disbursing and Transfer Agent Agreement with the Trust, effective June 27, 2011, Nottingham Shareholder Services, LLC (“Transfer Agent”) serves as transfer, dividend paying, and shareholder servicing agent for the Fund. Transfer Agent receives compensation for its services based upon $21 per shareholder per year, subject to a minimum fee of $1,750 per month.
Prior to June 27, 2011, the Fund’s transfer and dividend disbursing agent was Commonwealth Fund Services (“CFSI”). For such transfer and dividend disbursing services, CFSI received $21,447 for the fiscal year ended September 30, 2011.
Distributor
Under the terms of a Distribution Agreement with the Trust, effective June 27, 2011, Capital Investment Group, Inc. (“Distributor”) serves as the Fund’s principal underwriter and distributor. The Distributor receives $5,000 per year paid in monthly installments for services provided and expenses assumed.
Prior to June 27, 2011, the Fund’s principal underwriter and distributor was First Dominion Capital Corporation (“FDCC”). FDCC received no commissions from sale of Fund shares for the fiscal year ended September 30, 2011.
Certain Trustees and officers of the Trust are also officers of the Advisor, the Distributor, or the Administrator.
| 3. | Purchases and Sales of Investment Securities |
For the fiscal year ended September 30, 2011, the aggregate cost of purchases and proceeds from sales of investment securities (excluding short-term securities) were as follows:
| Fiscal Year Ended | Purchases of Securities | Proceeds from Sales of Securities |
| September 30, 2011 | $47,999,678 | $49,798,503 |
There were no long-term purchases or sales of U.S Government Obligations during the fiscal year ended September 30, 2011.
Distributions are determined in accordance with Federal income tax regulations, which differ from generally accepted accounting principles, and, therefore, may differ significantly in amount or character from net investment income and realized gains for financial reporting purposes. Financial reporting records are adjusted for permanent book/tax differences to reflect tax character but are not adjusted for temporary differences.
Management reviewed the tax positions in the open tax years of 2009, 2010, and 2011 and determined that the implementation of ASC Topic 740 “Accounting for Uncertainty in Income Taxes” had no impact on the Fund’s net assets or results of operations. As of and during the fiscal year ended September 30, 2011, the Fund does not have a liability for uncertain tax positions. The Fund recognizes interest and penalties, if any, related to unrecognized tax benefits as income tax expense in the statement of operations. During the period, the Fund did not incur any interest or penalties.
Reclassifications to paid-in capital relate primarily to differing book/tax treatment of ordinary net investment losses. For the fiscal year ended September 30, 2011, there were no reclassifications.
Distributions during the fiscal year ended were characterized for tax purposes as follows:
| | September 30, 2011 | September 30, 2010 |
| Ordinary Income | - | - |
| Long-term capital gain | - | - |
Sector Rotation Fund
Notes to Financial Statements
At September 30, 2011, the tax-basis cost of investments and components of distributable earnings were as follows:
| Cost of Investments | $ | 17,789,053 |
| | | |
| Unrealized Appreciation | $ | 401,801 |
| Unrealized Depreciation | | (531,613) |
| Net Unrealized Appreciation (Depreciation) | | (129,812) |
| Undistributed Ordinary Income | | 712,142 |
| Undistributed Long-Term Gains | | 109,029 |
| | | |
| Distributable Earnings | $ | 691,359 |
| | | | | | |
The difference between book-basis and tax-basis net unrealized appreciation (depreciation) is attributable to the deferral of losses from wash sales.
| 5. | Reorganizational Expenses |
As outlined in Note 1, the Trustees of the Fund approved a Plan on May 4, 2011 whereby the Fund would be reorganized from WFT into a newly created series of the Trust. A special meeting of shareholders was held on June 22, 2011 resulting in approval of the Plan. The Fund assumed the costs of these reorganizational expenses which amounted to $84,797 and it is being amortized over twelve months.
On August 18, 2010, Clark Capital Management, Inc. (“CCM”), an investment advisor, filed suit against Navigator Money Management, Inc. (“NNM”), the investment advisor to the Fund. In that suit, CCM named the Fund, but not WFT as a party. CCM demanded that NMM cease immediately from the use of the term “Navigator Fund”. CCM’s demand was based on various claims to the term “Navigator Fund”. The time for a response to the CCM claim has been extended in the courts on several occasions as the parties pursued settlement negotiations. In November 2010, NMM and CCM reached a settlement and general release agreement: In exchange for changing the Fund’s name from the Navigator Fund to the Sector Rotation Fund, NMM would pay nominal legal expenses of CCM in reaching the settlement/release agreement. The ticker symbol of the Fund remained NAVFX. The Fund has no financial obligation under this settlement agreement; however, the Fund has incurred legal fees in the fiscal year ended September 30, 2011 in the amount of $6,577 and in the period ended September 30, 2010 in the amount of $11,865 relating to this matter. Additionally, the name of the Fund was officially changed to the Sector Rotation Fund effective November 29, 2010 pursuant to the settlement agreement.
| 7. | Commitments and Contingencies |
Under the Trust’s organizational documents, its officers and Trustees are indemnified against certain liabilities arising out of the performance of their duties to the Fund. In addition, in the normal course of business, the Trust entered into contracts with its service providers, on behalf of the Fund, and others that provide for general indemnifications. The Fund’s maximum exposure under these arrangements is unknown, as this would involve future claims that may be made against the Fund. The Fund expects risk of loss to be remote.
| 8. | New Accounting Pronouncements |
In May 2011, the FASB issued ASU No. 2011-04 “Amendments to Achieve Common Fair Value Measurement and Disclosure Requirements.” ASU No. 2011-04 amends FASB ASC Topic 820, Fair Value Measurements and Disclosures, to establish common requirements for measuring fair value and for disclosing information about fair value measurements in accordance with GAAP and International Financial Reporting Standards (“IFRS”). ASU No. 2011-04 is effective for fiscal years beginning after December 15, 2011 and for interim periods within those fiscal years.
Sector Rotation Fund
Notes to Financial Statements
Management is currently evaluating the impact these amendments may have on the Fund’s financial statements.
The Funds have evaluated the need for disclosures and/or adjustments resulting from subsequent events through the date of issuance of these financial statements. This evaluation did not result in any subsequent events that necessitated disclosures and/or adjustments.
REPORT OF INDEPENDENT REGISTERED PUBLIC ACCOUNTING FIRM
To the Shareholders,
Trustees, and
Audit Committee of
Sector Rotation Fund
We have audited the accompanying statement of assets and liabilities of the Sector Rotation Fund (the “Fund”, one of the series constituting the Starboard Investment Trust), including the schedule of investments, as of September 30, 2011, and the related statements of operations, the statements of changes in net assets and the financial highlights for the year then ended. These financial statements and financial highlights are the responsibility of the Fund's management. Our responsibility is to express an opinion on these financial statements and financial highlights based on our audit. The statements of changes in net assets and the financial highlights for the period from December 31, 2009 (Commencement of Operations) to September 30, 2010 were audited by other auditors whose report dated November 29, 2010 expressed an unqualified opinion on those financial statements.
We conducted our audit in accordance with the standards of the Public Company Accounting Oversight Board (United States). Those standards require that we plan and perform the audit to obtain reasonable assurance about whether the financial statements and financial highlights are free of material misstatement. The Fund is not required to have, nor were we engaged to perform, an audit of its internal control over financial reporting. Our audit included consideration of internal control over financial reporting as a basis for designing audit procedures that are appropriate in the circumstances, but not for the purpose of expressing an opinion on the effectiveness of the Fund's internal control over financial reporting. Accordingly, we express no such opinion. An audit also includes examining, on a test basis, evidence supporting the amounts and disclosures in the financial statements, assessing the accounting principles used and significant estimates made by management, as well as evaluating the overall financial statement presentation. Our procedures included confirmation of securities owned as of September 30, 2011, by correspondence with the custodian and brokers. We believe that our audits provide a reasonable basis for our opinion.
In our opinion, the financial statements and financial highlights referred to above present fairly, in all material respects, the financial position of the Sector Rotation Fund as of September 30, 2011, the results of its operations for the year then ended, and the changes in net assets and the financial highlights for the year ended in conformity with accounting principles generally accepted in the United States of America.
Chicago, Illinois
November 21, 2011
Sector Rotation Fund
Additional Information (Unaudited)
| 1. | Proxy Voting Policies and Voting Record |
A copy of the Trust’s Proxy Voting and Disclosure Policy and the Advisor’s Disclosure Policy are included as Appendix B to the Fund’s Statement of Additional Information and are available, without charge, upon request, by calling 1-800-773-3863, and on the website of the Security and Exchange Commission (“SEC”) at http://www.sec.gov. Information regarding how the Fund voted proxies relating to portfolio securities during the most recent period ended June 30, is available (1) without charge, upon request, by calling the Fund at the number above and (2) on the SEC’s website at http://www.sec.gov.
| 2. | Quarterly Portfolio Holdings |
The Fund files its complete schedule of portfolio holdings with the SEC for the first and third quarters of each fiscal year on Form N-Q. The Fund’s Forms N-Q are available on the SEC’s website at http://www.sec.gov. You may review and make copies at the SEC’s Public Reference Room in Washington, D.C. Information on the operation of the Public Reference Room may be obtained by calling the SEC at 202-942-8090. You may also obtain copies without charge, upon request, by calling the Fund toll-free at 1-800-773-3863.
| 3. | Approval of Advisory Agreement |
The Advisor supervises the investments of the Fund pursuant to an Investment Advisory Agreement. Prior to the reorganization of the Fund from a series of the World Funds Trust to a series of the Starboard Investment Trust, the Board of Trustees of the Starboard Investment Trust met on April 28, 2011 and approved a new Investment Advisory Agreement for an initial two-year term. In considering whether to approve the Investment Advisory Agreement, the Trustees reviewed and considered the information they deemed reasonably necessary, including the following material factors: (i) the nature, extent, and quality of the services provided by the Advisor; (ii) the investment performance of the Fund and Advisor, (iii) the costs of the services to be provided and profits to be realized by the Advisor and its affiliates from the relationship with the Fund; (iv) the extent to which economies of scale would be realized as the Fund grows and whether advisory fee levels reflect those economies of scale for the benefit of the Fund’s investors; (v) the Advisor’s practices regarding brokerage and portfolio transactions; and (vi) the Advisor’s practices regarding possible conflicts of interest.
At the meeting, the Trustees reviewed various informational materials including, without limitation, the Investment Advisory Agreement for the Fund; a memorandum from the Advisor to the Trustees containing information about the Advisor, its business, its finances, its personnel, its services to the Fund, and comparative expense ratio information for other mutual funds with a strategy similar to the Fund; and a memorandum from the Fund’s legal counsel that summarized the fiduciary duties and responsibilities of the Board of Trustees in reviewing and approving the Investment Advisory Agreement, including the types of information and factors that should be considered in order to make an informed decision.
In considering the nature, extent, and quality of the services provided by the Advisor, the Trustees reviewed the responsibilities of the Advisor under the Investment Advisory Agreement. The Trustees reviewed the services to be provided by the Advisor to the Fund including, without limitation, the Advisor’s procedures for formulating investment recommendations and assuring compliance with the Fund’s investment objectives and limitations, proposed efforts during the Fund’s start-up phase, coordination of services for the Fund among the Fund’s service providers, and efforts to promote the Fund, grow the Fund’s assets, and assist in the distribution of Fund shares. The Trustees also noted that the Fund’s principal officer is the chief executive officer of the Advisor and will serve the Fund without additional compensation. After reviewing the foregoing information and further information in the memorandum from the Advisor (e.g., the Advisor’s Form ADV and descriptions of the Advisor’s business and compliance program), the Board of Trustees concluded that the quality, extent, and nature of the services to be provided by the Advisor were satisfactory and adequate for the Fund.
In considering the investment performance of the Fund and the Advisor, the Trustees compared the performance of the Fund with the performance of its benchmark index, comparable funds with similar objectives managed by other investment advisors, and applicable peer group data (e.g., Morningstar peer group averages). After reviewing the investment performance of the Fund, the Advisor’s experience managing the Fund and other advisory accounts, and other factors, the Board of Trustees concluded that the investment performance of the Fund and the Advisor was satisfactory.
Sector Rotation Fund
Additional Information (Unaudited)
In considering the costs of the services to be provided and profits to be realized by the Advisor and its affiliates from the relationship with the Fund, the Trustees evaluated the Advisor’s staffing, personnel, and methods of operating; the education and experience of the Advisor’s personnel; the Advisor’s compliance programs, policies, and procedures; the financial condition of the Advisor; the level of commitment to the Fund and the Advisor by the principals of the Advisor; the projected asset levels of the Fund; the Advisor’s payment of startup costs for the Fund; and the overall expenses of the Fund, including the nature and frequency of advisory fee payments. The Trustees reviewed the financial statements of the Advisor and discussed the financial stability and profitability of the firm. The Advisor responded to several questions about the financial condition of the firm and its principals. The Trustees also considered potential benefits for the Advisor in managing the Fund, including promotion of the Advisor’s name, the ability for the Advisor to place small accounts into the Fund, and the potential for the Advisor to generate soft dollars from Fund trades that may benefit the Advisor’s other clients. The Trustees then compared the expected fees and expenses of the Fund (including the management fee) to other funds comparable in terms of the type of fund, the nature of its investment strategy, and its style of investment management, among other factors. The Trustees determined that the Fund’s management fees were higher than some of the comparable funds and lower than others. The Trustees also determined that the Fund’s net expense ratio was higher than some of the comparable funds and lower than others and was higher than the peer group average. The Trustees noted that the Advisor will either make payments to the Administrator or directly pay for certain expenses of the Fund under an Operating Plan in order to help limit the Fund’s annual operating expenses. The Trustees also noted that the Fund was much smaller in size than its peer group average. Following this comparison and upon further consideration and discussion of the foregoing, the Board of Trustees concluded that the fees to be paid to the Advisor by the Fund were fair and reasonable in relation to the nature and quality of the services provided by the Advisor and that they reflected charges that were within a range of what could have been negotiated at arm’s length.
In considering the extent to which economies of scale would be realized as the Fund grows and whether advisory fee levels reflect those economies of scale for the benefit of the Fund’s investors, the Trustees considered the Fund’s fee arrangements with the Advisor. The Trustees noted that although the maximum management fee would stay the same when the Fund reached higher asset levels, the Advisor had agreed to make payments to the Administrator at lower asset levels in order to help limit the Fund’s expenses. The Trustees pointed out that the Fund would benefit from economies of scale under its agreements with service providers other than the Advisor. In particular, it was noted that the Fund’s agreement with its fund accountant and administrator would determine the Fund’s gross expenses and that this agreement utilized breakpoints in its fee schedule that allowed the Fund’s shareholders to benefit from economies of scale. Following further discussion of the Fund’s projected asset levels, expectations for growth, and levels of fees, the Board of Trustees determined that the Fund’s fee arrangements with the Advisor were fair and reasonable in relation to the nature and quality of the services provided by the Advisor.
In considering the Advisor’s practices regarding brokerage and portfolio transactions, the Trustees reviewed the Advisor’s standards, and performance in utilizing those standards, for seeking best execution for Fund portfolio transactions. The Trustees also considered the anticipated portfolio turnover rate for the Fund; the process by which evaluations are made of the overall reasonableness of commissions paid; the method and basis for selecting and evaluating the broker-dealers used; any anticipated allocation of portfolio business to persons affiliated with the Advisor; and the extent to which the Fund allocates portfolio business to broker-dealers who provide research, statistical, or other services (“soft dollars”). After further review and discussion, the Board of Trustees determined that the Advisor’s practices regarding brokerage and portfolio transactions were satisfactory.
In considering the Advisor’s practices regarding conflicts of interest, the Trustees evaluated the potential for conflicts of interest and considered such matters as the experience and ability of the advisory personnel assigned to the Fund; the basis of decisions to buy or sell securities for the Fund and the Advisor’s other accounts; the method for bunching of portfolio securities transactions; and the substance and administration of the Advisor’s code of ethics. Following further consideration and discussion, the Board of Trustees indicated that the Advisor’s standards and practices relating to the identification and mitigation of potential conflicts of interests were satisfactory.
(Continued)
Sector Rotation Fund
Additional Information (Unaudited)
Based upon all of the foregoing considerations, the Board of Trustees, including a majority of the Independent Trustees, approved the Investment Advisory Agreement for the Fund.
4. Special Meeting of Shareholders
A special meeting of the shareholders of the Sector Rotation Fund, a series of the World Funds Trust, was held at the offices of Commonwealth Shareholder Services, located at 8730 Stony Point Parkway, Suite 205, Richmond, Virginia 23235 on Tuesday, June 22, 2011 at 10:00 a.m. Eastern Time.
At this special meeting, the shareholders voted on the following items: (i) to approve a proposed Plan of Reorganization under which the Fund would reorganize into a newly created series of the Starboard Investment Trust in a tax-free reorganization and (ii) to approve a revision to the Fund’s fundamental investment policy on concentration of investments in a particular industry or group of industries.
With respect to the first proposal, 1,181,690 shares voted in favor of the item, no shares voted against the item, and 6,808 shares abstained from voting on the item. Since both a majority of the shares of the Fund and more than 67% of the shares of the Fund present at the meeting voted in favor of the item, the proposed Plan of Reorganization was approved.
With respect to the second proposal, 1,172,388 shares voted in favor of the item, 7,995 shares voted against the item, and 8,114 shares abstained from voting on the item. Since both a majority of the shares of the Fund and more than 67% of the shares of the Fund present at the meeting voted in favor of the item, the proposal to revise the Fund’s fundamental investment policy on concentration of investments in a particular industry or group of industries was approved.
5. Information about Trustees and Officers
The business and affairs of the Fund and the Trust are managed under the direction of the Board of Trustees of the Trust. Information concerning the Trustees and officers of the Trust and Fund is set forth below. Generally, each Trustee and officer serves an indefinite term or until certain circumstances such as their resignation, death, or otherwise as specified in the Trust’s organizational documents. Any Trustee may be removed at a meeting of shareholders by a vote meeting the requirements of the Trust’s organizational documents. The Statement of Additional Information of the Fund includes additional information about the Trustees and officers and is available, without charge, upon request by calling the Fund toll-free at 1-800-773-3863. The address of each Trustee and officer, unless otherwise indicated below, is 116 South Franklin Street, Rocky Mount, North Carolina 27804. The Independent Trustees each received aggregate compensation of $500 during the fiscal year ended September 30, 2011 from the Fund for their services to the Fund and Trust.
Name, Age and Address | Position held with Funds or Trust | Length of Time Served | Principal Occupation During Past 5 Years | Number of Portfolios in Fund Complex Overseen by Trustee | Other Directorships Held by Trustee During Past 5 Years |
| Independent Trustees |
Jack E. Brinson Age: 79 | Trustee, Chairman | Since 7/09 | Retired; previously, President of Brinson Investment Co. (personal investments) and President of Brinson Chevrolet, Inc. (auto dealership). | 6 | Independent Trustee of the following: DGHM Investment Trust for the two series of that trust; Gardner Lewis Investment Trust for the two series of that trust; Giordano Investment Trust for the one series of that trust; Hillman Capital Management Investment Trust for the two series of that trust; Nottingham Investment Trust II for the three series of the trust; and Tilson Investment Trust for the two series of that trust; (all registered investment companies); previously, Independent Trustee of de Leon Funds Trust for its one series from 2000 to 2005, MurphyMorris Investment Trust for its one series from 2003 to 2006, New Providence Investment Trust for its one series from inception until 2011, and Piedmont Investment Trust for its one series from 2005 to 2006 (all registered investment companies). |
Michael G. Mosley Age: 58 | Trustee | Since 7/10 | Owner of Commercial Realty Services (real estate) since 2004. | 6 | None |
Theo H. Pitt, Jr. Age: 75 | Trustee | Since 9/10 | Senior Partner, Community Financial Institutions Consulting (financial consulting) since 1999; Partner, Pikar Properties (real estate) since 2001; Account Administrator, Holden Wealth Management Group of Wachovia Securities (money management firm) from 2003-2008. | 6 | Independent Trustee of DGHM Investment Trust for its two series and Gardner Lewis Investment Trust for its two series (all registered investment companies). Previously, Independent Trustee of de Leon Funds Trust for its one series from 2000 to 2005, Hillman Capital Management Investment Trust for its two series from 2000 to 2009, MurphyMorris Investment Trust for its one series from 2003 to 2006, Piedmont Investment Trust for its one series from 2005 to 2006, NCM Capital Investment Trust for its one series from 2007 to 2009, New Providence Investment Trust from 2008 to 2009, and Tilson Investment Trust for its two series from 2004 to 2009 (all registered investment companies) |
Name, Age and Address | Position held with Funds or Trust | Length of Time Served | Principal Occupation During Past 5 Years | Number of Portfolios in Fund Complex Overseen by Trustee | Other Directorships Held by Trustee During Past 5 Years |
James H. Speed, Jr. Age: 58 | Trustee | Since 7/09 | President and CEO of NC Mutual Insurance Company (insurance company) since 2003; President of Speed Financial Group, Inc. (consulting and private investments) from 2000 to 2003. | 6 | Independent Trustee of the following Hillman Capital Management Investment Trust for the two series of that trust; Nottingham Investment Trust II for the three series of the trust; and Tilson Investment Trust for the two series of that trust; (all registered investment companies). Member of Board of Directors of NC Mutual Life Insurance Company. Member of Board of Directors of M&F Bancorp. Previously, Independent Trustee of New Providence Investment Trust for its one series from 2009 until 2011 (registered investment company). |
J. Buckley Strandberg Age: 51 | Trustee | Since 7/09 | President of Standard Insurance and Realty (insurance and property management) since 1982. | 6 | Director, Southern Bank from 2002-2006; Independent Trustee, Nottingham Investment Trust II for the four series of that trust (registered investment company) from 1991-2006. |
| Other Officers |
Robert G. Fontana Age: 41 5950 Fairview Road Suite 610-A Charlotte, NC 28210 | President and Treasurer (Caritas All-Cap Growth Fund) | Since 7/09 | President and CIO of Caritas Capital, LLC (advisor to the Caritas All-Cap Growth Fund) since 2009; Portfolio Manager for Portfolio Capital Management (investment management) since 2006; previously, Portfolio Manager for Covenant Capital, LLC (investment management). | n/a | n/a |
D. Jerry Murphey Age: 53 821 Pacific Street Omaha, Nebraska 68108 | President (FMX Funds) | Since 7/09 | Manager, President, and CEO of FolioMetrix, LLC (advisor to the FMX Funds) since 2009; principal of Uptrade Research Associates, LLC (investment research) since 2009; previously, Investment Management Consultant for Prudential Investments, Wealth Management Solutions (investment management). | n/a | n/a |
Name, Age and Address | Position held with Funds or Trust | Length of Time Served | Principal Occupation During Past 5 Years | Number of Portfolios in Fund Complex Overseen by Trustee | Other Directorships Held by Trustee During Past 5 Years |
Julie M. Koethe Age: 31 821 Pacific Street Omaha, Nebraska 68108 | Treasurer (FMX Funds) | Since 4/10 | Chief Operating Officer of FolioMetrix, LLC (advisor to the FMX Funds) since 2010; Insurance Accounting Supervisor for Applied Underwriters (workers compensation and payroll service provider) from 2003-2010. | n/a | n/a |
Matthew R. Lee Age: 29 1777 Borel Place, Suite 415, San Mateo, CA 94402 | President (Presidio Multi-Strategy Fund) | Since 2/10 | Chief Executive Officer of Presidio Capital Investments, LLC (advisor to the Presidio Multi-Strategy Fund) since 2006; Financial Planning Specialist with Smith Barney, a division of Citigroup Global Markets, Inc. (now known as Morgan Stanley Smith Barney) from 2004-2006; Associate at Bank of America Investments, Inc. (investment management) from 2003-2004. | n/a | n/a |
James C. Roumell Age: 50 2 Wisconsin Circle Suite 660 Chevy Chase, MD 20815 | President (Roumell Opportunistic Value Fund) | Since 9/10 | President of Roumell Asset Management, LLC (advisor to the Roumell Opportunistic Value Fund) since 1998. | n/a | n/a |
Craig L. Lukin Age:43 2 Wisconsin Circle Suite 660 Chevy Chase, MD 20815 | Treasurer (Roumell Opportunistic Value Fund) | Since 9/10 | Chief Operating Officer and Chief Compliance Officer of Roumell Asset Management, LLC since 2007; Research Analyst at Roumell Asset Management, LLC from 2003-2007; Private Equity Analyst for Dent & Company, Inc. (investment services) from 2000-2002; Corporate Value Consulting Manager for PricewaterhouseCoopers, LLP (accountancy and professional services) from 1994-2000. | n/a | n/a |
Mark A. Grimaldi Age: 49 1207 Route 9 Suite 10 Wappingers Falls, NY 12590 | President and Treasurer (Sector Rotation Fund) | Since 4/11 | President and Chief Compliance Officer of Navigator Money Management, Inc. (advisor to the Sector Rotation Fund) since 1996; Vice President of The Prestige Organization, Inc. since 1996; and Co-Fund Manager of ETF Market Opportunity Fund (formerly Navigator Fund) from 2008-2009. | n/a | n/a |
Name, Age and Address | Position held with Funds or Trust | Length of Time Served | Principal Occupation During Past 5 Years | Number of Portfolios in Fund Complex Overseen by Trustee | Other Directorships Held by Trustee During Past 5 Years |
T. Lee Hale, Jr. Age: 33 | Chief Compliance Officer; Assistant Treasurer | Since 7/09 and 4/10 | Fund Accounting Team Manager of The Nottingham Company since September 2011; previously, Director of Financial Reporting, The Nottingham Company from 2009 - 2011; previously, principal of Lee Hale Contracting (marine industry consulting). | n/a | n/a |
A. Vason Hamrick Age: 34 | Secretary | Since 7/09 | Corporate Counsel for The Nottingham Company since 2004. | n/a | n/a |
Sector Rotation Fund
is a series of| The Starboard Investment Trust |
| For Shareholder Service Inquiries: | For Investment Advisor Inquiries: |
| Nottingham Shareholder Services | Navigator Money Management, Inc. |
| 116 South Franklin Street | Executive Park |
Post Office Drawer 4365 Rocky Mount, North Carolina 27803 | 1207 Route 9, Suite 10 Wappingers Falls, NY 12590 |
| Toll-Free Telephone: | Toll-Free Telephone: |
| 1-800-773-3863 | 1-866-688-0028 |
World Wide Web @: ncfunds.com | World Wide Web @: navfx.com |
Item 2. CODE OF ETHICS.
The registrant’s Board of Trustees has determined that the registrant has an audit committee financial expert, as defined in Item 3 of Form N-CSR, serving on its audit committee.
As of the date of this report, September 30, 2011, the registrant’s audit committee financial expert is Mr. James H. Speed, Jr. Mr. Speed is “independent” for purposes of Item 3 of Form N-CSR.
Item 4. PRINCIPAL ACCOUNTANT FEES AND SERVICES.
Not applicable.
A copy of the schedule of investments of unaffiliated issuers as of the close of the reporting period is included as part of the report to shareholders filed under Item 1 of this Form.
Not applicable.
Not applicable.
Item 10. SUBMISSION OF MATTERS TO A VOTE OF SECURITY HOLDERS.
Item 11. CONTROLS AND PROCEDURES.
Item 12. EXHIBITS.
Pursuant to the requirements of the Securities Exchange Act of 1934 and the Investment Company Act of 1940, the registrant has duly caused this report to be signed on its behalf by the undersigned, thereunto duly authorized.
Pursuant to the requirements of the Securities Exchange Act of 1934 and the Investment Company Act of 1940, this report has been signed below by the following persons on behalf of the registrant and in the capacities and on the dates indicated.