Washington, D.C. 20549
116 South Franklin Street, Post Office Box 69, Rocky Mount, North Carolina 27802
(Address of principal executive offices) (Zip code)
A. Vason Hamrick
116 South Franklin Street, Post Office Box 69, Rocky Mount, North Carolina 27802
Item 1. REPORTS TO STOCKHOLDERS.
Annual Report 2012
May 31, 2012
FMX Growth Allocation Fund
Institutional Class Shares
Advisor Class Shares
This report and the financial statements contained herein are submitted for the general information of the shareholders of the FMX Growth Allocation Fund (the “Fund”). The Fund’s shares are not deposits or obligations of, or guaranteed by, any depository institution. The Fund’s shares are not insured by the FDIC, Federal Reserve Board or any other agency, and are subject to investment risks, including possible loss of principal amount invested. Neither the Fund nor the Fund’s distributor is a bank.
The FMX Growth Allocation Fund is distributed by Capital Investment Group, Inc., Member FINRA/SIPC, 17 Glenwood Ave, Raleigh, NC, 27603. There is no affiliation between the FMX Growth Allocation Fund, including its principals, and Capital Investment Group, Inc.
Statements in this Annual Report that reflect projections or expectations of future financial or economic performance of the FMX Growth Allocation Fund (“Fund”) and of the market in general and statements of the Fund’s plans and objectives for future operations are forward-looking statements. No assurance can be given that actual results or events will not differ materially from those projected, estimated, assumed or anticipated in any such forward-looking statements. Important factors that could result in such differences, in addition to the other factors noted with such forward-looking statements, include, without limitation, general economic conditions such as inflation, recession and interest rates. Past performance is not a guarantee of future results.
An investment in the Fund is subject to investment risks, including the possible loss of some or the entire principal amount invested. There can be no assurance that the Fund will be successful in meeting its investment objective. Investment in the Fund is also subject to the following risks: market risk, risks related to “fund of funds” structure, derivative risk, leverage risk, short sales risk, sector risk, portfolio turnover risk, management style risk, investment advisor risk, operating risk, new fund risk, small-cap and mid-cap securities risk, and foreign securities and emerging markets risk. More information about these risks and other risks can be found in the Fund’s prospectus.
The performance information quoted in this annual report represents past performance, which is not a guarantee of future results. Investment return and principal value of an investment will fluctuate so that an investor’s shares, when redeemed, may be worth more or less than their original cost. Current performance may be lower or higher than the performance data quoted. An investor may obtain performance data current to the most recent month-end by visiting www.ncfunds.com.
An investor should consider the investment objectives, risks, and charges and expenses of the Fund carefully before investing. The prospectus contains this and other information about the Fund. A copy of the prospectus is available at www.ncfunds.com or by calling Shareholder Services at 1-800-773-3863. The prospectus should be read carefully before investing.
This Annual Report was first distributed to shareholders on or about July 30, 2012.
For More Information on Your FMX Growth Allocation Fund:
See Our Web site @ www.ncfunds.com
or
Call Our Shareholder Services Group Toll-Free at 1-800-773-3863.
May 31, 2012
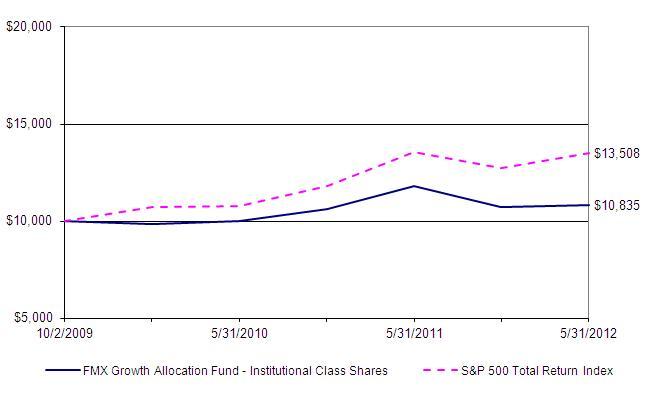
Enclosed for your review is the Annual Report of the FMX Growth Allocation Fund (the “Fund”) for the period ended May 31, 2012. From June 1, 2011 through May 31, 2012, the Fund’s Institutional Class Shares underperformed the Fund’s benchmark, the S&P 500 TR Index1 (the S&P 500) by 7.68%, with the S&P 500 having a one year return of -0.41%. On a global scale, the Fund’s Institutional Class Shares outperformed the S&P Global Broad Market Index1 (the S&P BMI) by 6.64% with a one year return of -8.09% compared to the S&P Global BMI Index return of -14.73%.
Average Annual Total Returns | Past | Since | Net Expense | Gross Expense | |
| Period Ended June 30, 2012 | 1 Year | Inception* | Ratio** | Ratio*** |
| FMX Growth Allocation Fund – Institutional Class Shares | -3.36% | 4.14% | 1.38% | 4.76% | |
| S&P 500 TR Index | 5.45% | 13.23% | n/a | n/a | |
| S&P Global Broad Market Index | -9.19% | 4.76% | n/a | n/a | |
Performance shown is for the period ended March 31, 2012. The performance data quoted above represents past performance, which is not a guarantee of future results. Investment return and principal value of an investment in the Funds will fluctuate so that an investor's shares, when redeemed, may be worth more or less than their original cost. Current performance may be lower or higher than the performance data quoted. To obtain more current performance data regarding the Funds, including performance data current to the Funds' most recent month-end, please visit www.fmxfund.com *The Fund’s inception date is October 2, 2009. ** The Advisor has entered into an Operating Plan with the Administrator through October 1, 2012, under which it has agreed to assume certain expenses of the Administrator to the extent the operating expenses exceed 1.45% of the average daily net assets of the Fund, exclusive of amounts payable under a Rule 12b-1 distribution plan, acquired fund fees and expenses, and extraordinary expenses. The Operating Plan can only be terminated at the conclusion of the then-current term by notice of non-renewal to a party or mutual agreement of the parties. ***Gross expense ratio is from the Funds' prospectus dated September 28, 2011. | |
Performance
Over the past year, the S&P 500 has seen returns that many equity indices did not necessarily enjoy. From a global perspective, many areas of the equity markets had significant negative returns during the period. We certainly aren’t pleased that we didn’t participate in the entire upside of the S&P 500; however, what is not reflected in the total return numbers are the fluctuations in index levels from point A to point B. Over the one year period mentioned above, the S&P 500 had a peak to valley decline of 15.3% and the S&P Global BMI had a decline of 19.28%. While we have a long-term growth
perspective, we also attempt to limit volatility where prudent which is reflected in some basic risk measures for the Fund: For the period ending May 31, our portfolio beta relative to the S&P 500 was .76. For the same period, the Fund’s volatility of returns, measured by standard deviation, was 13.8 while the S&P 500 and S&P BMI had a standard deviation of 17.86 and 21.45 respectively.
Starting last summer, we have seen bouts of volatility and very few clear trends in most markets. As the markets have been oscillating, we have maintained a defensive position which has been advantageous relative to the S&P Global BMI. However, the same defensive stance has been the largest factor in underperforming the S&P 500. We don’t make excuses for performance and we will continue to make any improvements necessary with the objective of respectable long-term returns. With the same objective, we also respect the fact that some temporary market conditions call for minimizing losses and having a conservative position.
Areas perceived as safe havens saw investment inflows over the past year. The best performing sectors in general were Utilities, Consumer Discretionary and Consumer Staples. The worst performing sectors during this time period were Precious Metals, Natural Resources, Energy and Financials. International and Emerging Markets were the worst performing broad asset classes, due in part to the European situation which has inspired intraday market exuberance or pessimism, depending on the headline of the moment. Over the past year, our defensive positions have included consumer staples, utilities and healthcare while some examples of opportunistic exposure include emerging markets such as Latin America, India, Brazil, Thailand, Vietnam and Indonesia.
Portfolio
As you are aware, the portfolio is segmented into four components: 1. A high quality Core section, 2. a more liberal Global All-Cap segment, 3. a smaller weighting to a more actively traded Opportunistic segment, and 4. a cash overlay for the most extreme market situations. This segmentation strategy has historically served us well when there are clear upward trends in the market and our conservative measures have historically proved beneficial as markets head south. What we would like is for the market, or even parts of the market, to find some solid footing as opposed to the excess volatility that we’ve been subjected to over the last year. However, we are realistic in our expectations and prepared to either remain defensive if necessary, while continuing to utilize our tactical ability within Global All Cap and Opportunistic. We continuously review and critique our process and we welcome the opportunity to adapt with the changing markets. We have no reason to believe that we need to implement any structural changes
Our approach to investing is not to “buy and hold,” but rather to invest in those asset classes and sectors which our models identify as attractive. Over the past year, the Fund has had exposure to (i) various sectors, including healthcare, communications, consumer staples, utilities, real estate, energy, technology, industrials, financials and materials; (ii) commodities, including sugar, copper, agriculture, precious metals and oil; (iii) countries, including China, Japan and Europe (iv) emerging markets, including Latin America, India, Brazil, Thailand, Vietnam and Indonesia.
The Fund offers diversification combined with a disciplined security selection approach which can help manage risk. In addition, the utilization of our proprietary cash allocation algorithm helps protect the portfolio from downside risk while still providing the opportunity to take advantage of market gains. Our goal is to deliver on our word and to continue to improve all aspects of our business. Also, later this year we will announce ways in which we are improving upon our deliverables.
As always, we remain optimistic and committed to achieving these goals. Thank you for your business.
Very truly yours,
Dale J. Murphey, CEO and President
1You cannot invest directly in these indexes. The indexes do not have an investment advisor and do not pay any commissions, expenses or taxes. If these indexes paid commissions, expenses or taxes, their returns would be lower.
| FMX Growth Allocation Fund - Institutional Class Shares | | | | | | | | | | |
| | | | | | | | | | | | | | | | | | | | |
| Performance Update (Unaudited) | | | | | | | | | | | | | |
| | | | | | | | | | | | | | | | | | | | |
| | | | | | | | | | | | | | | | | | | | |
| For the period from October 2, 2009 (Commencement of Operations) to May 31, 2012 | | |
| | | | | | | | | | | | | | | | | | | | |
| Comparison of the Change in Value of a $10,000 Investment | | | | | | | | |
| | | | | | | | | | | | | | | | | | | | |
 |
| | | | | | | | | | | | | | | | | | | | |
| The graph above assumes an initial $10,000 investment and represents the reinvestment of dividends and capital gains. This graph depicts the performance of Institutional Class Shares versus the S&P 500 Total Return Index and the S&P Global Broad Market Index. It is important to note that the Fund is a professionally managed mutual fund while the indices are not available for investment and are unmanaged. The comparison is shown for illustrative purposes only. |
| | | | | | | | | | | | | | | | | | | | |
| | Average Annual Total Returns | | |
| | | | | | | | | | | | | | | | | | Gross | | |
| | | As of | | | | | | | One | | Since | | Inception | | Expense | | |
| | | May 31, 2012 | | | | | | Year | | Inception | | Date | | Ratio* | | |
| | | Institutional Class Shares | | | | | -8.09% | | 3.06% | | 10/02/09 | | 4.76% | | |
| | | S&P 500 Total Return Index | | | | | -0.41% | | 11.95% | | N/A | | N/A | | |
| | | S&P 500 Global Broad Market Index | | | | -14.73% | | 3.17% | | N/A | | N/A | | |
| | | | | | | | | | | | | | | | | | | | |
| * The gross expense ratio shown is from the Fund's prospectus dated September 28, 2011. | | | | |
| | | | | | | | | | | | | | | | | | | | |
| Performance quoted above represents past performance, which is no guarantee of future results. Investment return and principal value will fluctuate so that shares, when redeemed, may be worth more or less than their original cost. Current performance may be lower or higher than the performance data quoted. An investor may obtain performance data, current to the most recent month-end, by visiting www.ncfunds.com. |
| | | | | | | | | | | | | | | | | | | | |
| The graph and table do not reflect the deduction of taxes that a shareholder would pay on Fund distributions or the redemption of Fund shares. Average annual total returns are historical in nature and measure net investment income and capital gain or loss from portfolio investments assuming reinvestments of distributions. |
| | | | | | | | | | | | | | | | | | | | |
| | | | | | | | | | | | | | | | | | | | |
| FMX Growth Allocation Fund - Advisor Class Shares | | | | | | | | | | |
| | | | | | | | | | | | | | | | | | | | |
| Performance Update (Unaudited) | | | | | | | | | | | | | |
| | | | | | | | | | | | | | | | | | | | |
| | | | | | | | | | | | | | | | | | | | |
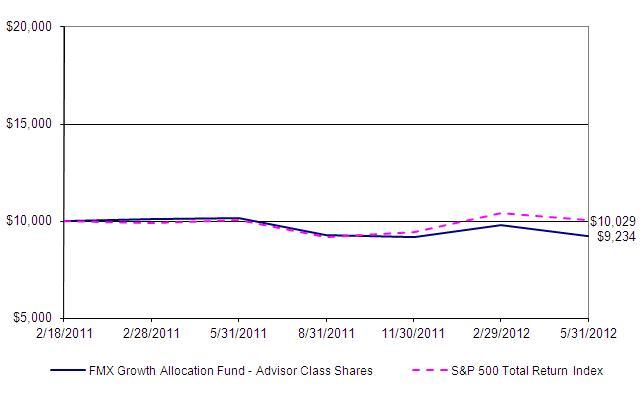
| For the period from February 18, 2011 (Date of Initial Public Investment) to May 31, 2012 | | |
| | | | | | | | | | | | | | | | | | | | |
| Comparison of the Change in Value of a $10,000 Investment | | | | | | | | |
| | | | | | | | | | | | | | | | | | | | |
 |
| | | | | | | | | | | | | | | | | | | | |
| The graph above assumes an initial $10,000 investment and represents the reinvestment of dividends and capital gains. This graph depicts the performance of Advisor Class Shares versus the S&P 500 Total Return Index and the S&P 500 Global Broad Market Index. It is important to note that the Fund is a professionally managed mutual fund while the indices are not available for investment and are unmanaged. The comparison is shown for illustrative purposes only. |
| | | | | | | | | | | | | | | | | | | | |
| | Average Annual Total Returns | | |
| | | | | | | | | | | | | | | | | | Gross | | |
| | | As of | | | | | | | One | | Since | | Inception | | Expense | | |
| | | May 31, 2012 | | | | | | Year | | Inception | | Date | | Ratio* | | |
| | | Advisor Class Shares - No Sales Load | | | | -8.90% | | -6.02% | | 02/18/11 | | 5.76% | | |
| | | S&P 500 Total Return Index | | | | | -0.41% | | 0.22% | | N/A | | N/A | | |
| | | S&P 500 Global Broad Market Index | | | | -14.73% | | -11.50% | | N/A | | N/A | | |
| | | | | | | | | | | | | | | | | | | | |
| * The gross expense ratio shown is from the Fund's prospectus dated September 28, 2011. | | | | |
| | | | | | | | | | | | | | | | | | | | |
| Performance quoted above represents past performance, which is no guarantee of future results. Investment return and principal value will fluctuate so that shares, when redeemed, may be worth more or less than their original cost. Current performance may be lower or higher than the performance data quoted. An investor may obtain performance data, current to the most recent month-end, by visiting www.ncfunds.com. |
| | | | | | | | | | | | | | | | | | | | |
| The graph and table do not reflect the deduction of taxes that a shareholder would pay on Fund distributions or the redemption of Fund shares. Average annual total returns are historical in nature and measure net investment income and capital gain or loss from portfolio investments assuming reinvestments of distributions. |
| | | | | | | | | | | | | | | | | | | | |
| | | | | | | | | | | | | | | | | | | | |
| FMX Growth Allocation Fund | | | | | | |
| | | | | | | | | | |
| Schedule of Investments | | | | | | |
| | | | | | | | | | |
| | | | | | | | | | |
| As of May 31, 2012 | | | | | | | |
| | | | | | | | Shares | | Value (Note 1) |
| | | | | | | | | | |
| EXCHANGE TRADED PRODUCTS - 33.39% | | | | | |
| | | First Trust Health Care AlphaDEX Fund | | | 31,695 | $ | 935,953 |
| | * | First Trust NYSE Arca Biotechnology Index Fund | | 11,294 | | 480,673 |
| | | iShares Dow Jones US Home Construction Index Fund | | 31,995 | | 462,328 |
| | | iShares FTSE NAREIT Mortgage Plus Capped Index Fund | | 34,800 | | 487,026 |
| | | iShares FTSE NAREIT Residential Plus Capped Index Fund | | 10,670 | | 490,820 |
| | | iShares Nasdaq Biotechnology Index Fund | | | 7,566 | | 932,207 |
| | | iShares S&P Global Consumer Staples Sector Index Fund | | 13,801 | | 939,986 |
| | * | SPDR S&P Biotech ETF | | | | 5,998 | | 479,867 |
| | | Utilities Select Sector SPDR Fund | | | | 13,792 | | 493,436 |
| | | | | | | | | | |
| | | Total Exchange Traded Products (Cost $5,806,002) | | | | 5,702,296 |
| | | | | | | | | | |
| OPEN-END FUNDS - 65.98% | | | | | | |
| | * | Ave Maria Growth Fund | | | | 70,267 | | 1,559,936 |
| | | Federated Strategic Value Dividend Fund | | | 328,677 | | 1,567,789 |
| | * | John Hancock US Global Leaders Growth Fund | | | 45,752 | | 1,563,355 |
| | * | Legg Mason ClearBridge Small Cap Growth Fund I | | 79,948 | | 1,561,378 |
| | * | Oppenheimer Discovery Fund | | | | 14,849 | | 939,666 |
| | | PIMCO StocksPlus Total Return Fund | | | 187,715 | | 1,569,298 |
| | | SEI Institutional Managed Trust - U.S. Managed Volatility Fund | 120,878 | | 1,567,789 |
| | | T Rowe Price Blue Chip Growth Fund | | | 22,052 | | 939,209 |
| | | | | | | | | | |
| | | Total Open-End Funds (Cost $11,450,412) | | | | | 11,268,420 |
| | | | | | | | | | |
| SHORT-TERM INVESTMENT - 15.23% | | | | | | |
| | § | Fidelity Institutional Money Market Funds - Money Market Portfolio, 0.19% | | 2,601,396 |
| | | | | | | | | | |
| | | Total Short-Term Investment (Cost $2,601,396) | | | | | 2,601,396 |
| | | | | | | | | | |
| Total Value of Investments (Cost $19,857,810) - 114.60% | | | $ | 19,572,112 |
| | | | | | | | | | |
| Liabilities in Excess of Other Assets - (14.60)% | | | | | (2,493,476) |
| | | | | | | | | | |
| | Net Assets - 100% | | | | | | $ | 17,078,636 |
| | | | | | | | | | |
| * | Non-income producing investment | | § | Represents 7 day effective yield |
| | | | | | | | | | |
| | | | Summary of Investments by Sector | | | | |
| | | | | | | | | | |
| | | | Sector | | % of Net Assets | | Value | | |
| | | | Exchange Traded Products | 33.39% | $ | 5,702,296 | | |
| | | | Open-End Funds | | 65.98% | | 11,268,420 | | |
| | | | Short-Term Investment | 15.23% | | 2,601,396 | | |
| | | | Total | | 114.60% | $ | 19,572,112 | | |
| | | | | | | | | | |
| See Notes to Financial Statements | | | | | | |
| FMX Growth Allocation Fund | | | | |
| | | | | | | | | |
| Statement of Assets and Liabilities | | | |
| | | | | | | | | |
| | | | | | | | | |
| As of May 31, 2012 | | | | |
| | | | | | | | | |
| Assets: | | | | | | |
| | Investments, at value (cost $19,857,810) | $ | 19,572,112 | |
| | Receivables: | | | | |
| | | Investments sold | | | 5,208,466 | |
| | | Fund shares sold | | | 11,516 | |
| | | Dividends and interest | | | 73 | |
| | Prepaid expenses | | | 1,188 | |
| | | | | | | | | |
| | Total assets | | | 24,793,355 | |
| | | | | | | | | |
| Liabilities: | | | | | | |
| | Payables: | | | | | |
| | | Investments purchased | | | 7,491,032 | |
| | | Fund shares repurchased | | 203,787 | |
| | Accrued expenses | | | | |
| | | Administration fees | | | 12,877 | |
| | | Advisory fees | | | 6,309 | |
| | | Other expenses | | | 714 | |
| | | | | | | | | |
| | Total liabilities | | | 7,714,719 | |
| | | | | | | | | |
| Net Assets | | | | $ | 17,078,636 | |
| | | | | | | | | |
| Net Assets Consist of: | | | | |
| | Capital | | | | $ | 18,232,442 | |
| | Distributable Income: | | | | |
| | | Net investment income | | | - | |
| | | Net realized loss on investments | | (868,108) | |
| | Net unrealized depreciation on investments | | (285,698) | |
| | | | | | | | | |
| | Total Net Assets | | $ | 17,078,636 | |
| | | | | | | | | |
| Institutional Class Shares outstanding, no par value (unlimited authorized shares) | | 1,726,796 | |
| | Net Assets | | | | 16,271,025 | |
| | Net Asset Value, Offering Price and Redemption Price Per Share | $ | 9.42 | |
| | | | | | | | | |
| Advisor Class Shares outstanding, no par value (unlimited authorized shares) | | 85,223 | |
| | Net Assets | | | | 807,611 | |
| | Net Asset Value, Offering Price and Redemption Price Per Share | $ | 9.48 | |
| | | | | | | | | |
| | | | | | | | | |
| | | | | | | | | |
| | | | | | | | | |
| | | | | | | | | |
| | | | | | | | | |
| | | | | | | | | |
| See Notes to Financial Statements | | | |
| FMX Growth Allocation Fund | | |
| | | | | | | | |
| Statement of Operations | | |
| | | | | | | | |
| | | | | | | | |
| For the Year Ended May 31, 2012 | | |
| | | | | | | | |
| Investment Income: | | |
| | Dividends | | | $ | 356,976 |
| | | | | | | | |
| | Total Income | | | 356,976 |
| | | | | | | | |
| Expenses: | | | | | |
| | Advisory fees (note 2) | | 99,781 |
| | Administration fees (note 2) | | 164,632 |
| | Distribution and service fees - Advisor Class Shares (note 3) | | 7,856 |
| | | | | | | | |
| | Total Expenses | | | 272,269 |
| | | | | | | | |
| | Advisory fees waived (note 2) | | (9,012) |
| | Administration fees waived (note 2) | | (4,506) |
| | | | | | | | |
| | Net Expenses | | | 258,751 |
| | | | | | | | |
| Net Investment Income | | 98,225 |
| | | | | | | | |
| Realized and Unrealized Loss on Investments | | |
| | | | | | | | |
| | Net realized loss from investment transactions | | (868,065) |
| | Change in unrealized depreciation on investments | | (432,349) |
| | | | | | | | |
| Realized and Unrealized Loss on Investments | | (1,300,414) |
| | | | | | | | |
| Net Decrease in Net Assets Resulting from Operations | $ | (1,202,189) |
| | | | | | | | |
| | | | | | | | |
| | | | | | | | |
| | | | | | | | |
| | | | | | | | |
| | | | | | | | |
| | | | | | | | |
| | | | | | | | |
| | | | | | | | |
| | | | | | | | |
| | | | | | | | |
| | | | | | | | |
| | | | | | | | |
| | | | | | | | |
| | | | | | | | |
| | | | | | | | |
| | | | | | | | |
| | | | | | | | |
| | | | | | | | |
| See Notes to Financial Statements | | |
| FMX Growth Allocation Fund | | | | | | | | |
| | | | | | | | | | | | | |
| Statements of Changes in Net Assets | | | | | | | | |
| | | | | | | | | | | | | |
| | | | | | | | | | | | | |
| For the Year Ended May 31, | | | | 2012 | | | | 2011 |
| | | | | | | | | | | | | |
| Operations: | | | | | | | | | |
| | Net investment income (loss) | | | | $ 98,225 | | | | $ (94,958) |
| | Net realized (loss) gain from investment transactions | | (868,065) | | | | 2,344,257 |
| | Change in unrealized appreciation (depreciation) on investments | (432,349) | | | | 146,335 |
| | | | | | | | | | | | | |
| Net (Decrease) Increase in Net Assets Resulting from Operations | | (1,202,189) | | | | 2,395,634 |
| | | | | | | | | | | | | |
Distributions to Shareholders: (note 5) | | | | | | | | |
| | Return of capital | | | | | | | | |
| | | Institutional Class Shares | | | | (392,810) | | | | - |
| | | Advisor Class Shares | | | | (14,605) | | | | - |
| | Net realized gain from investment transactions | | | | | | | |
| | | Institutional Class Shares | | | | (2,249,896) | | | | (9,266) |
| | | Advisor Class Shares | | | | (80,137) | | | | - |
| | | | | | | | | | | | | |
| Decrease in Net Assets Resulting from Distributions | | | (2,737,448) | | | | (9,266) |
| | | | | | | | | | | | | |
| Capital Share Transactions: | | | | | | | | |
| | Shares sold | | | | | 12,082,259 | | | | 28,548,365 |
| | Reinvested dividends and distributions | | | | 891,976 | | | | 245 |
| | Shares repurchased | | | | (7,847,735) | | | | (15,490,104) |
| | | | | | | | | | | | | |
| Increase from Capital Share Transactions | | | | 5,126,500 | | | | 13,058,506 |
| | | | | | | | | | | | | |
| Net Increase in Net Assets | | | | 1,186,863 | | | | 15,444,874 |
| | | | | | | | | | | | | |
| Net Assets: | | | | | | | | | |
| | Beginning of Year | | | | 15,891,773 | | | | 446,899 |
| | End of Year | | | | | 17,078,636 | | | | 15,891,773 |
| | | | | | | | | | | | | |
| | | | | | | | | | | | | |
| Share Information: | | Shares | | Amount | | Shares | | Amount |
| | Institutional Class Shares | | | | | | | | |
| | | Shares sold | | 1,100,246 | $ | 11,525,284 | | 2,791,337 | $ | 27,997,870 |
| | | Reinvested dividends and distributions | | 85,662 | | 814,439 | | 22 | | 245 |
| | | Shares repurchased | | (761,623) | | (7,641,249) | | (1,533,825) | | (15,490,104) |
| | Net Increase in Capital Shares | | 424,285 | $ | 4,698,474 | | 1,257,534 | $ | 12,508,011 |
| | Outstanding, Beginning of Year | | 1,302,511 | | 12,965,319 | | 44,977 | | 457,308 |
| | Outstanding, End of Year | | 1,726,796 | $ | 17,663,793 | | 1,302,511 | $ | 12,965,319 |
| | | | | | | | | | | | | |
| | Advisor Class Shares | | | | | | | | |
| | | Shares sold | | 50,380 | $ | 556,974 | | 46,405 | $ | 549,027 |
| | | Reinvested dividends and distributions | | 8,095 | | 77,536 | | - | | - |
| | | Shares repurchased | | (19,657) | | (206,486) | | - | | - |
| | Net Increase in Capital Shares | | 38,818 | $ | 428,024 | | 46,405 | $ | 549,027 |
| | Outstanding, Beginning of Year | | 46,405 | | 549,027 | | - | | - |
| | Outstanding, End of Year | | 85,223 | $ | 977,051 | | 46,405 | $ | 549,027 |
| See Notes to Financial Statements | | | | | | | | |
| FMX Growth Allocation Fund | | | | | | | | |
| | | | | | | | | | | | | |
| Financial Highlights | | | | | | | | |
| | | | | | | | | | | | | |
| For a share outstanding during the | | Institutional Class Shares | |
| fiscal year ended May 31, | | 2012 | | 2011 | | 2010(a) | |
| | | | | | | | | | | | | |
| Net Asset Value, Beginning of Year | $ | 11.78 | $ | 9.94 | $ | 10.00 | | |
| | | | | | | | | | | | | |
| Income (Loss) from Investment Operations | | | | | | | | |
| | Net investment loss | | 0.06 | | (0.07) | | (0.05) | | |
| | Net realized and unrealized gain (loss) on securities | | (1.05) | | 1.92 | | (0.01) | | |
| | | | | | | | | | | | | |
| Total from Investment Operations | | (0.99) | | 1.85 | | (0.06) | | |
| | | | | | | | | | | | | |
| Less Distributions: | | | | | | | | |
| | Distributions (from capital gains) | | (1.16) | | (0.01) | | - | | |
| | | | | | | | | | | | | |
| Total Distributions | | (1.16) | | (0.01) | | - | | |
| | | | | | | | | | | | | |
| Paid in Capital | | | | | | | | | |
| | Paid in capital | | (0.21) | | - | | - | | |
| | | | | | | | | | | | | |
| Total Paid in Capital | | (0.21) | | - | | - | | |
| | | | | | | | | | | | | |
| Net Asset Value, End of Year | $ | 9.42 | $ | 11.78 | $ | 9.94 | | |
| | | | | | | | | | | | | |
| Total Return (d) | | | (8.09) | % | 18.12 | % | 0.60 | % | |
| | | | | | | | | | | | | |
| Net Assets, End of Year (in thousands) | $ | 16,271 | $ | 15,341 | $ | 447 | | |
| | | | | | | | | | | | | |
| Average Net Assets for the Year (in thousands) | $ | 17,454 | $ | 10,871 | $ | 337 | | |
| | | | | | | | | | | | | |
| Ratios of: | | | | | | | | | | |
| Gross Expenses to Average Net Assets (e) | | 1.45 | % | 1.45 | % | 1.45 | % | (b) |
| Net Expenses to Average Net Assets (e) | | 1.38 | % | 1.45 | % | 1.45 | % | (b) |
| Net Investment Income/(Loss) to Average Net Assets (f) | | 0.59 | % | (0.86) | % | (1.10) | % | (b) |
| | | | | | | | | | | | | |
| Portfolio turnover rate | | 711.11 | % | 658.15 | % | 332.64 | % | (c) |
| | | | | | | | | | | | | |
| | | | | | | | | | | | | |
| (a) | For the period from October 2, 2009 (Commencement of Operations) to May 31, 2010. | | | | |
| (b) | Annualized | | | | | | | | | |
| (c) | Not annualized. | | | | | | | | |
| (d) | Includes adjustments in accordance with accounting principles generally accepted in the United States and, |
| | consequently, the net asset value for financial reporting purposes and the returns based upon those net asset |
| | values may differ from the net asset values and returns for shareholder transactions. | | | | |
| (e) | Does not include expenses of the investment companies in which the Fund invests. | | | | |
| (f) | Recognition of net investment income by the Fund is affected by the timing of the declaration of dividends | |
| | by the underlying investment companies in which the Fund invests. | | | | | | | |
| | | | | | | | | | | | | |
| | | | | | | | | | | | | |
| | | | | | | | | | | | | |
| | | | | | | | | | | | | (Continued) |
| FMX Growth Allocation Fund | | | | | | |
| | | | | | | | | | | |
| Financial Highlights | | | | | | |
| | | | | | | | | | | |
| For a share outstanding during the | | Advisor Class Shares | |
| fiscal year ended May 31, | | 2012 | | 2011(a) | |
| | | | | | | | | | | |
| Net Asset Value, Beginning of Year | $ | 11.87 | $ | 11.71 | | |
| | | | | | | | | | | |
| Income (Loss) from Investment Operations | | | | | | |
| | Net investment income (loss) | | (0.05) | | (0.03) | | |
| | Net realized and unrealized gain (loss) on securities | | (1.03) | | 0.19 | | |
| | | | | | | | | | | |
| Total from Investment Operations | | (1.08) | | 0.16 | | |
| | | | | | | | | | | |
| Less Distributions: | | | | | | |
| | Distributions (from capital gains) | | (1.10) | | - | | |
| | | | | | | | | | | |
| Total Distributions | | (1.10) | | - | | |
| | | | | | | | | | | |
| Paid in Capital | | | | | | | |
| | Paid in capital | | (0.21) | | - | | |
| | | | | | | | | | | |
| Total Paid in Capital | | (0.21) | | - | | |
| | | | | | | | | | | |
| Net Asset Value, End of Year | $ | 9.48 | $ | 11.87 | | |
| | | | | | | | | | | |
| Total Return (d) | | | (8.90) | % | 1.37 | % | |
| | | | | | | | | | | |
| Net Assets, End of Year (in thousands) | $ | 808 | $ | 551 | | |
| | | | | | | | | | | |
| Average Net Assets for the Year (in thousands) | $ | 786 | $ | 206 | | |
| | | | | | | | | | | |
| Ratios of: | | | | | | | | |
| Gross Expenses to Average Net Assets (e) | | 2.44 | % | 2.45 | % | (b) |
| Net Expenses to Average Net Assets (e) | | 2.38 | % | 2.45 | % | (b) |
| Net Investment Income/(Loss) to Average Net Assets (f) | | (0.60) | % | (2.39) | % | (b) |
| | | | | | | | | | | |
| Portfolio turnover rate | | 711.11 | % | 658.15 | % | (c) |
| | | | | | | | | | | |
| | | | | | | | | | | |
| (a) | For the period from February 18, 2011 (Date of Initial Public Investment) to May 31, 2011. | | | | |
| (b) | Annualized | | | | | | | |
| (c) | Not annualized. | | | | | | |
| (d) | Includes adjustments in accordance with accounting principles generally accepted in the United States and, | | |
| | consequently, the net asset value for financial reporting purposes and the returns based upon those net asset | | |
| | values may differ from the net asset values and returns for shareholder transactions. | | | | | | |
| (e) | Does not include expenses of the investment companies in which the Fund invests. | | | | | | |
| (f) | Recognition of net investment income by the Fund is affected by the timing of the declaration of dividends | | |
| | by the underlying investment companies in which the Fund invests. | | | | | | |
| | | | | | | | | | | |
| | | | | | | | | | | |
| | | | | | | | | | | |
| | | | | | | | | | | |
FMX Growth Allocation Fund
Notes to Financial Statements
| 1. | Organization and Significant Accounting Policies |
The FMX Growth Allocation Fund (“Fund”) is a series of the Starboard Investment Trust (“Trust”). The Trust is organized as a Delaware statutory trust and is registered under the Investment Company Act of 1940, as amended (the “1940 Act”), as an open-end management investment company. The Fund is a separate diversified series of the Trust.
The Fund commenced operations on October 2, 2009. The investment objective of the Fund is to seek capital appreciation without regard to current income. In order to achieve its investment objective, FolioMetrix LLC (“Advisor”) will seek to invest primarily in no-load, institutional, and exchange-traded funds (“Portfolio Funds”). Although the Fund will primarily invests in Portfolio Funds with no sales related expenses or very low sales related expenses, the Fund is not precluded from investing in Portfolio Funds with sales-related expenses, redemption fees, and/or service fees in excess of 0.25%. The Fund will primarily invest in Portfolio Funds that have a similar investment objective or that are otherwise permitted investments under the Fund’s investment policies. The Portfolio Funds’ investments generally will include, but are not limited to, equity securities.
The Advisor uses a proprietary screening process to select Portfolio Funds for investment. The screening process includes analysis of sector and asset allocations, total returns, and risk data. The Advisor will seek to construct portfolios that achieve the Fund’s investment objective while assuming risk that is no more than 20% greater than the S&P 500 Index. The Advisor will generally sell a Portfolio Fund when a more attractive investment opportunity is identified or the Fund’s portfolio needs to be rebalanced.
The Board of Trustees of the Trust approved, on November 4, 2010, a plan to authorize a new class of shares for the Fund designated as Advisor Class Shares. On February 15, 2011, the Advisor Class Shares became effective. The Fund currently has an unlimited number of authorized shares, which are divided into two classes – Institutional Class Shares and Advisor Class Shares. Each class of shares has equal rights as to assets of the Fund, and the classes are identical except for differences in ongoing distribution and service fees. The Advisor Class Shares are subject to distribution plan fees as described in Note 3. Income, expenses (other than distribution and service fees), and realized and unrealized gains or losses on investments are allocated to each class of shares based upon its relative net assets. All classes have equal voting privileges, except where otherwise required by law or when the Trustees determine that the matter to be voted on affects only the interests of the shareholders of a particular class.
The following is a summary of significant accounting policies consistently followed by the Fund. The policies are in conformity with accounting principles generally accepted in the United States of America. In June 2009, the Financial Accounting Standards Board (“FASB”) codified its standards and accounting principles for the financial statements issued for years ending after September 15, 2009. Herein, the Fund will make reference to accounting principles generally accepted in the United States issued by FASB as Accounting Standards Codification (“ASC”).
Investment Valuation
The Fund’s investments in securities are carried at fair value. Investments in funds within the FMX Growth Allocation Fund are valued based on the net asset values as reported by the underlying funds. Securities listed on an exchange or quoted on a national market system are valued at the last sales price as of 4:00 p.m. Eastern Time. Securities traded in the NASDAQ over-the-counter market are generally valued at the NASDAQ Official Closing Price. Other securities traded in the over-the-counter market and listed securities for which no sale was reported on that date are valued at the most recent bid price. Securities and assets for which representative market quotations are not readily available (e.g., if the exchange on which the portfolio security is principally traded closes early or if trading of the particular portfolio security is halted during the day and does not resume prior to the Fund’s net asset value calculation) or which cannot be accurately valued using the Fund’s normal pricing procedures are valued at fair value as determined in good faith under policies approved by the Trustees. A portfolio security’s “fair value” price may differ from the price next available for that portfolio security using the Fund’s normal pricing procedures. Instruments with maturities of 60 days or less are valued at amortized cost, which approximates market value.
FMX Growth Allocation Fund
Notes to Financial Statements
Fair Value Measurement
The Fund has adopted ASC Topic 820, Fair Value Measurements. ASC Topic 820 defines fair value, establishes a frame work for measuring fair value and expands disclosure about fair value measurements.
Various inputs are used in determining the value of the Fund's investments. These inputs are summarized in the three broad levels listed below:
| a. | Level 1: Unadjusted quoted prices in active markets for identical securities |
| b. | Level 2: other significant observable inputs (including quoted prices for similar securities, interest rates, credit risk, etc.) |
| c. | Level 3: significant unobservable inputs (including the Fund’s own assumptions in determining fair value of investments) |
The Fund has adopted FASB guidance updating ASC Topic 820 titled, “Determining Fair Value When the Volume and Level of Activity for the Asset or Liability have Significantly Decreased and Identifying Transactions that are not Orderly” which provides guidance on determining when there has been a significant decrease in the volume and level of activity for an asset or liability, when a transaction that is not orderly, and how that information must be incorporated into fair value measurement. The guidance emphasizes that even if there has been a significant decrease in volume and level of activity for an asset or liability and regardless of the valuation techniques used, the objective of a fair value measurement remains the same.
An Investment asset’s or liability’s level within the fair value hierarchy is based on the lowest level input, individually or in aggregate, that is significant to fair value measurement.
The valuation techniques used by the Fund to measure fair value for the fiscal year ended May 31, 2012 maximized the use of observable inputs and minimized the use of unobservable inputs.
The inputs or methodology used for valuing securities are not necessarily an indication of the risk associated with investing in those securities. The following is a summary of the inputs used in valuing the Fund's assets:
| Assets | | Total | | Level 1 | | Level 2 | | Level 3 |
| Exchange Traded Products | $ | 5,702,296 | $ | 5,702,296 | $ | - - | $ | - - |
| Open-End Funds | | 11,268,420 | | 11,268,420 | | - - | | - - |
| Short-Term Investment | | 2,601,396 | | 2,601,396 | | - | | - - |
| Total | $ | 19,572,112 | $ | 19,572,112 | $ | - - | $ | - - |
Investment Transactions and Investment Income
Investment transactions are accounted for as of the date purchased or sold (trade date). Dividend income is recorded on the ex-dividend date. Certain dividends from foreign securities will be recorded as soon as the Fund is informed of the dividend if such information is obtained subsequent to the ex-dividend date. Interest income is recorded on the accrual basis and includes amortization of discounts and premiums. Gains and losses are determined on the identified cost basis, which is the same basis used for federal income tax purposes.
Expenses
The Fund bears expenses incurred specifically on its behalf as well as a portion of general expenses, which are allocated according to methods reviewed annually by the Trustees.
Dividend Distributions
The Fund may declare and distribute dividends from net investment income (if any) quarterly. Distributions from capital gains (if any) are generally declared and distributed annually. Dividends and distributions to shareholders are recorded on ex-date.
FMX Growth Allocation Fund
Notes to Financial Statements
Estimates
The preparation of financial statements in conformity with accounting principles generally accepted in the United States of America requires management to make estimates and assumptions that affect the reported amounts of assets and liabilities and disclosure of contingent assets and liabilities at the date of the financial statements and the reported amounts of increases and decreases in the net assets from operations during the reported period. Actual results could differ from those estimates.
Federal Income Taxes
No provision for income taxes is included in the accompanying financial statements, as the Fund intends to distribute to shareholders all taxable investment income and realized gains and otherwise comply with Subchapter M of the Internal Revenue Code applicable to regulated investment companies.
| 2. | Transactions with Affiliates & Service Providers |
Advisor
As full compensation for the investment advisory services provided to the Fund, the Advisor receives a monthly fee based on the Fund’s average daily net assets. The minimum annual rate is 0.00% if the average daily net assets are under $11 million and gradually increases to a maximum annual rate of 0.95% if the average daily net assets are $39 million or more. The fee paid to the Advisor is calculated by multiplying the average daily net assets of the Fund, as of the last day of each month by the highest applicable annual rate. In accordance with these terms, the Fund paid $99,781 in advisory fees for the fiscal year ended May 31, 2012, of which $9,012 was subsequently and voluntarily waived.
The Advisor has entered into an Operating Plan with the Fund’s administrator under which it has agreed to assume certain fees of the administrator to the extent such fees exceed the maximum of 1.45% of the average daily net assets of the Fund to be paid by the Fund to the administrator under its consolidated fee arrangement. The Advisor cannot recoup from the Fund any amounts paid by the Advisor to the Administrator under the Operating Plan.
Administrator
The Nottingham Company (“Administrator”) assists the Trust in the performance of its administrative responsibilities to the Fund, coordinates and pays for the services of each vendor and the operating expense to the Fund, and provides the Fund with certain administrative, fund accounting, and compliance services. As part of its services and consolidated fee arrangement, the Administrator receives compensation based on the Fund’s average daily net assets. The annual rate is 1.45% if the average daily net assets are under $11 million and gradually decreases to an annual rate of 0.175% once the average daily net assets reach $370 million or more.
The fee paid to the Administrator is calculated by multiplying the average daily net assets of the Fund by the highest applicable annual rate. The Administrator pays all expenses not assumed by the Advisor, including, without limitation: the fees and expenses of its independent accountants, of its legal counsel, and of its Trustees; the costs of printing and mailing to shareholders annual and semi-annual reports, proxy statements, prospectuses, statements of additional information and supplements thereto; the costs of printing registration statements; bank transaction charges and custodian’s fees; any proxy solicitors’ fees and expenses; filing fees; any federal, state or local income or other taxes; any interest; any membership fees of the Investment Company Institute and similar organizations; fidelity bond and Trustees’ liability insurance premiums. The Fund paid $164,632 in administration fees for the fiscal year ended May 31, 2012, of which $4,506 was subsequently and voluntarily waived.
Compliance Services
Nottingham Compliance Services, LLC (“NCS”), a fully owned affiliate of the Administrator, provides services which assist the Trust’s Chief Compliance Officer in monitoring and testing the policies and procedures of the Trust in conjunction with requirements under Rule 38a-1 of the 1940 Act. NCS is entitled to receive compensation from the Administrator pursuant to the Administrator’s fee arrangements with the Fund.
FMX Growth Allocation Fund
Notes to Financial Statements
Transfer Agent
Nottingham Shareholder Services, LLC (“Transfer Agent”) serves as transfer, dividend paying, and shareholder servicing agent for the Fund. For its services, the Transfer Agent is entitled to receive compensation from the Administrator pursuant to the Administrator’s fee arrangements with the Fund.
Distributor
Capital Investment Group, Inc. (the “Distributor”) serves as the Fund’s principal underwriter and distributor. For its services, the Distributor is entitled to receive compensation from the Administrator pursuant to the Administrator’s fee arrangements with the Fund.
Certain Trustees and officers of the Trust may also be officers of the Advisor, the Distributor, the Administrator, or NCS.
Because the underlying funds have varied expense and fee levels and the Fund may own different proportions of underlying funds at different times, the amount of fees and expense incurred indirectly by the Fund will vary.
| 3. | Distribution and Service Fees |
The Board of Trustees, including a majority of the Trustees who are not “interested persons” as defined in the 1940 Act, adopted a distribution and service plan pursuant to Rule 12b-1 of the 1940 Act (the “Plan”) for the Advisor Class Shares. The 1940 Act regulates the manner in which a registered investment company may assume costs of distributing and promoting the sales of its shares and servicing of its shareholder accounts. The Plan provides that the Fund may incur certain costs, which may not exceed 1.00% per annum of the average daily net assets of the Advisor Class Shares for each year elapsed subsequent to adoption of the Plan, for payment to the Distributor and others for items such as advertising expenses, selling expenses, commissions, travel, or other expenses reasonably intended to result in sales of Advisor Class Shares or servicing of Advisor Class shareholder accounts. For the year ended May 31, 2012, $7,856 in fees were incurred by the Distributor.
| 4. | Purchases and Sales of Investment Securities |
For the fiscal year ended May 31, 2012, the aggregate cost of purchases and proceeds from sales of investment securities (excluding short-term securities) were as follows:
| Fiscal Year | Purchases of Securities | Proceeds from Sales of Securities |
| June 1, 2011 - May 31, 2012 | $123,963,690 | $121,159,454 |
There were no long-term purchases or sales of U.S Government Obligations during the six month period ended May 31, 2012.
Distributions are determined in accordance with Federal income tax regulations, which differ from generally accepted accounting principles, and, therefore, may differ significantly in amount or character from net investment income and realized
gains for financial reporting purposes. Financial reporting records are adjusted for permanent book/tax differences to reflect tax character but are not adjusted for temporary differences. For the year ended May 31, 2012 there were no differences between the book and the tax treatment of the distributions.
Management has analyzed the Fund’s tax positions for all open tax years (current and prior three tax years, is applicable) and determined that the implementation of ASC Topic 740 “Accounting for Uncertainty in Income Taxes” had no impact on the Fund’s net assets or results of operations. As of and during the fiscal year ended May 31, 2012, the Fund does not have a liability for uncertain tax positions. The Fund recognizes interest and penalties, if any, related to unrecognized tax benefits as income tax expense in the statement of operations. During the fiscal year, the Fund did not incur any interest or penalties.
FMX Growth Allocation Fund
Notes to Financial Statements
Reclassifications to paid-in capital relate primarily to differing book/tax treatment of ordinary net investment losses. For the fiscal year ended May 31, 2012, the following reclassifications, which had no impact on results of operations or net assets, were recorded to reflect tax character:
Paid-in Capital | $(407,415) |
| Undistributed Net Investment Income (Loss) | | (98,225) |
| Undistributed Net Realized Gain (Loss) on Investments | | 505,640 |
At May 31, 2012, the tax-basis cost of investments and components of distributable earnings were as follows:
| Cost of Investments | | $ 19,866,012 |
| | | |
| Unrealized Appreciation | | $ 63,974 |
| Unrealized Depreciation | | (357,874) |
| Net Unrealized Appreciation | | (293,900) |
| | | |
| Accumulated Capital Losses | | (859,906) |
| | | |
| Distributable Earnings | | $(1,153,806) |
| | | | | | |
The difference between book-basis and tax-basis net unrealized appreciation (depreciation) is attributable to the deferral of losses from wash sales. Accumulated capital losses noted above represent net capital loss carryovers as of May 31, 2012 that are available to offset future realized capital gains, if any, and thereby reduce future taxable gain distributions.
For the fiscal year ended May 31, 2010, ($60) of Accumulated Capital Losses and ($8,601) of Other Book/Tax Differences were reported in the 2010 Annual Report and was restated to ($7,877) of Other Book/Tax Differences.
For the fiscal year ended May 31, 2011, $2,231,023 was reported as Undistributed Ordinary Income in the 2011 Annual Report. Due to the restatement noted above to the 2010 Annual Report, Undistributed Short-Term Gains was restated to $2,231,808.
Also, for the fiscal year ended May 31, 2011, reclassifications to paid-in capital relating primarily to differing book/tax treatment of ordinary investment losses are restated below:
| | Original | Restated |
| Paid-in Capital | | ($94,958) | $ - |
| Undistributed Net Investment Income (Loss) | | 94,958 | 94,958 |
| Undistributed Net Realized Gain (Loss) on Investments | | - | (94,958) |
| 6. | Commitments and Contingencies |
Under the Trust’s organizational documents, its officers and Trustees are indemnified against certain liabilities arising out of the performance of their duties to the Fund. In addition, in the normal course of business, the Trust entered into contracts with its service providers, on behalf of the Fund, and others that provide for general indemnifications. The Fund’s maximum exposure under these arrangements is unknown, as this would involve future claims that may be made against the Fund. The Fund expects risk of loss to be remote.
FMX Growth Allocation Fund
Notes to Financial Statements
| 7. | New Accounting Pronouncements |
In May 2011, the FASB issued ASU No. 2011-04 “Amendments to Achieve Common Fair Value Measurement and Disclosure Requirements.” ASU No. 2011-04 amends FASB ASC Topic 820, Fair Value Measurements and Disclosures, to establish common requirements for measuring fair value and for disclosing information about fair value measurements in accordance with GAAP and International Financial Reporting Standards (“IFRS”). ASU No. 2011-04 is effective for fiscal years beginning after December 15, 2011 and for interim periods within those fiscal years.
In accordance with the adoption of ASC Topic 855, Subsequent Events, and in preparing these financial statements, the Fund has evaluated the need for disclosures and/or adjustments resulting from subsequent events through the date of issuance of these financial statements. This evaluation did not result in any subsequent events that necessitated disclosures and/or adjustments.
REPORT OF INDEPENDENT REGISTERED PUBLIC ACCOUNTING FIRM
To the Shareholders,
Trustees, and
Audit Committee of
FMX Growth Allocation Fund
We have audited the accompanying statement of assets and liabilities of the FMX Growth Allocation Fund (the “Fund”, one of the series constituting the Starboard Investment Trust), including the schedule of investments, as of May 31, 2012, and the related statement of operations for the year ended May 31, 2012, the statements of changes in net assets for each of the two years in the period then ended and the financial highlights for the year ended May 31, 2012, May 31, 2011 and the period from October 2, 2009 (Commencement of Operations) to May 31, 2010. These financial statements and financial highlights are the responsibility of the Fund's management. Our responsibility is to express an opinion on these financial statements and financial highlights based on our audits.
We conducted our audits in accordance with the standards of the Public Company Accounting Oversight Board (United States). Those standards require that we plan and perform the audit to obtain reasonable assurance about whether the financial statements and financial highlights are free of material misstatement. The Fund is not required to have, nor were we engaged to perform, an audit of its internal control over financial reporting. Our audits included consideration of internal control over financial reporting as a basis for designing audit procedures that are appropriate in the circumstances, but not for the purpose of expressing an opinion on the effectiveness of the Fund's internal control over financial reporting. Accordingly, we express no such opinion. An audit also includes examining, on a test basis, evidence supporting the amounts and disclosures in the financial statements, assessing the accounting principles used and significant estimates made by management, as well as evaluating the overall financial statement presentation. Our procedures included confirmation of securities owned as of May 31, 2012, by correspondence with the custodian and brokers. We believe that our audits provide a reasonable basis for our opinion.
In our opinion, the financial statements and financial highlights referred to above present fairly, in all material respects, the financial position of the FMX Growth Allocation Fund as of May 31, 2012, the results of its operations for the year then ended and its changes in its net assets for each of the two years in the period then ended, and the financial highlights for the year ended May 31, 2012, May 31, 2011 and the period from October 2, 2009 (Commencement of Operations) to May 31, 2010 in conformity with accounting principles generally accepted in the United States of America.
Chicago, Illinois
July 26, 2012
FMX Growth Allocation Fund
Additional Information (Unaudited)
| 1. | Proxy Voting Policies and Voting Record |
A copy of the Trust’s Proxy Voting and Disclosure Policy and the Advisor’s Disclosure Policy are included as Appendix B to the Fund’s Statement of Additional Information and are available, without charge, upon request, by calling 1-800-773-3863, and on the website of the Security and Exchange Commission (“SEC”) at http://www.sec.gov. Information regarding how the Fund voted proxies relating to portfolio securities during the most recent period ended June 30, is available (1) without charge, upon request, by calling the Fund at the number above and (2) on the SEC’s website at http://www.sec.gov.
| 2. | Quarterly Portfolio Holdings |
The Fund files its complete schedule of portfolio holdings with the SEC for the first and third quarters of each fiscal year on Form N-Q. The Fund’s Forms N-Q is available on the SEC’s website at http://www.sec.gov. You may review and make copies at the SEC’s Public Reference Room in Washington, D.C. Information on the operation of the Public Reference Room may be obtained by calling the SEC at 202-942-8090. You may also obtain copies without charge, upon request, by calling the Fund toll-free at 1-800-773-3863.
We are required to advise you within 60 days of the Fund’s fiscal year-end regarding the federal tax status of certain distributions received by shareholders during each fiscal year. The following information is provided for the Fund’s fiscal year ended May 31, 2012.
Individual shareholders are eligible for reduced tax rates on qualified dividend income. For the purposes of computing the dividends eligible for reduced tax rates, all of the dividends paid by the funds from ordinary income earned during the fiscal year are considered qualified dividend income.
Corporate shareholders may exclude up to 70% of qualifying dividends. For the purposes of computing this exclusion, all of the dividends paid by the fund from ordinary income earned during the fiscal year represent qualifying dividends.
Dividend and distributions received by retirement plans such as IRAs, Keogh-type plans and 403(b) plans need not be reported as taxable income. However, many retirement plans may need this information for their annual information meeting.
4. Schedule of Shareholder Expenses
As a shareholder of the Fund, you incur two types of costs: (1) transaction costs, which may include sales charges (loads) on purchase payments and (2) ongoing costs, including investment advisory fees; distribution (12b-1) fees; and other Fund expenses. This example is intended to help you understand your ongoing costs (in dollars) of investing in the Fund and to compare these costs with the ongoing costs of investing in other mutual funds. The example is based on an investment of $1,000 invested at the beginning of the period and held for the entire period as indicated below.
Actual Expenses – The first line of the table below provides information about the actual account values and actual expenses. You may use the information in this line, together with the amount you invested, to estimate the expenses that you paid over the period. Simply divide your account value by $1,000 (for example, an $8,600 account value divided by $1,000 = 8.6), then multiply the result by the number in the first line under the heading entitled “Expenses Paid During Period” to estimate the expenses you paid on your account during this period.
Hypothetical Example for Comparison Purposes – The last line of the table below provides information about hypothetical account values and hypothetical expenses based on the Fund’s actual expense ratio and an assumed annual rate of return of 5% before expenses, which is not the Fund’s actual return. The hypothetical account values and expenses may not be used to estimate the actual ending account balance or expenses you paid for the period. You may use this information to compare the ongoing costs of investing in the Fund and other funds by comparing this 5% hypothetical example with the 5% hypothetical examples that appear in the shareholder reports of other funds.
FMX Growth Allocation Fund
Additional Information (Unaudited)
| Institutional Class Shares | Beginning Account Value December 1, 2011 | Ending Account Value May 31, 2012 | Expenses Paid During Period* |
Actual Hypothetical (5% annual return before expenses) | | | |
| $1,000.00 | $1,010.00 | $6.60 |
| $1,000.00 | $1,018.50 | $6.63 |
Expenses are equal to the average account value over the period multiplied by the Fund’s annualized expense ratio, multiplied by the number of days in the most recent period divided by the number of days in the fiscal year (to reflect the initial period).
| Advisor Class Shares | Beginning Account Value December 1, 2011 | Ending Account Value May 31, 2012 | Expenses Paid During Period* |
Actual Hypothetical (5% annual return before expenses) | | | |
| $1,000.00 | $ 1,006.90 | $11.57 |
| $1,000.00 | $ 1,013.54 | $11.61 |
Expenses are equal to the average account value over the period multiplied by the Fund’s annualized expense ratio, multiplied by the number of days in the most recent period divided by the number of days in the fiscal year (to reflect the initial period).
5. Information about Trustees and Officers
The business and affairs of the Fund and the Trust are managed under the direction of the Board of Trustees of the Trust. Information concerning the Trustees and officers of the Trust and Fund is set forth below. Generally, each Trustee and officer serves an indefinite term or until certain circumstances such as their resignation, death, or otherwise as specified in the Trust’s organizational documents. Any Trustee may be removed at a meeting of shareholders by a vote meeting the requirements of the Trust’s organizational documents. The Statement of Additional Information of the Fund includes additional information about the Trustees and officers and is available, without charge, upon request by calling the Fund toll-free at 1-800-773-3863. The address of each Trustee and officer, unless otherwise indicated below, is 116 South Franklin Street, Rocky Mount, North Carolina 27804. The Independent Trustees each received aggregate compensation of $2,000.00 during the fiscal year ended May 31, 2012 from the Fund for their services to the Fund and Trust.
FMX Growth Allocation Fund
Additional Information (Unaudited)
Name, Age and Address | Position held with Funds or Trust | Length of Time Served | Principal Occupation During Past 5 Years | Number of Portfolios in Fund Complex Overseen by Trustee | Other Directorships Held by Trustee During Past 5 Years |
| Independent Trustees |
Jack E. Brinson Age: 80 | Trustee | Since 7/09 | Retired; previously, President of Brinson Investment Co. (personal investments) and President of Brinson Chevrolet, Inc. (auto dealership). | 10 | Independent Trustee of the following: DGHM Investment Trust for the two series of that trust; Gardner Lewis Investment Trust for the two series of that trust; Giordano Investment Trust for the one series of that trust; Hillman Capital Management Investment Trust for the two series of that trust; Brown Capital Management Mutual Funds for the three series of the trust; and Tilson Investment Trust for the two series of that trust; (all registered investment companies); previously, Independent Trustee of New Providence Investment Trust for its one series from inception until 2011 (all registered investment companies). |
Michael G. Mosley Age: 59 | Trustee | Since 7/10 | Owner of Commercial Realty Services (real estate) since 2004. | 10 | None |
Theo H. Pitt, Jr. Age: 76 | Trustee | Since 9/10 | Senior Partner, Community Financial Institutions Consulting (financial consulting) since 1999; Partner, Pikar Properties (real estate) since 2001; Account Administrator, Holden Wealth Management Group of Wachovia Securities (money management firm) from 2003-2008. | 10 | Independent Trustee of DGHM Investment Trust for its two series of that trust; Gardner Lewis Investment Trust for its two series of that trust and Hanna Investment Trust for its one series of that trust (all registered investment companies). Previously, Independent Trustee of Hillman Capital Management Investment Trust for its two series from 2000 to 2009, NCM Capital Investment Trust for its one series from 2007 to 2009, New Providence Investment Trust from 2008 to 2009, and Tilson Investment Trust for its two series from 2004 to 2009 (all registered investment companies). |
FMX Growth Allocation Fund
Additional Information (Unaudited)
Name, Age and Address | Position held with Funds or Trust | Length of Time Served | Principal Occupation During Past 5 Years | Number of Portfolios in Fund Complex Overseen by Trustee | Other Directorships Held by Trustee During Past 5 Years |
James H. Speed, Jr. Age: 58 | Trustee, Chairman | Since 7/09 | President and CEO of NC Mutual Insurance Company (insurance company) since 2003; President of Speed Financial Group, Inc. (consulting and private investments) from 2000 to 2003. | 10 | Independent Trustee of the following Hillman Capital Management Investment Trust for the two series of that trust; Brown Capital Management Mutual Funds for the three series of the trust; and Tilson Investment Trust for the two series of that trust; (all registered investment companies). Member of Board of Directors of NC Mutual Life Insurance Company. Member of Board of Directors of M&F Bancorp. Previously, Independent Trustee of New Providence Investment Trust for its one series from 2009 until 2011 (registered investment company). |
J. Buckley Strandberg Age: 52 | Trustee | Since 7/09 | President of Standard Insurance and Realty (insurance and property management) since 1982. | 10 | None |
| Other Officers |
D. Jerry Murphey Age: 54 821 Pacific Street Omaha, Nebraska 68108 | President (FMX Funds) | Since 7/09 | Manager, President, and CEO of FolioMetrix, LLC (advisor to the FMX Funds) since 2009; principal of Uptrade Research Associates, LLC (investment research) since 2009; previously, Investment Management Consultant for Prudential Investments, Wealth Management Solutions (investment management). | n/a | n/a |
Julie M. Koethe Age: 31 821 Pacific Street Omaha, Nebraska 68108 | Treasurer (FMX Funds) | Since 4/10 | Chief Operating Officer of FolioMetrix, LLC (advisor to the FMX Funds) since 2010; Insurance Accounting Supervisor for Applied Underwriters (workers compensation and payroll service provider) from 2003-2010. | n/a | n/a |
T. Lee Hale, Jr. Age: 34 | Chief Compliance Officer; Assistant Treasurer | Since 7/09 and 4/10 | Financial Reporting Manager for The Nottingham Company (fund administrator) since 2009; previously, principal of Lee Hale Contracting (marine industry consulting). | n/a | n/a |
A. Vason Hamrick Age: 35 | Secretary | Since 7/09 | Corporate Counsel for The Nottingham Company since 2004. | n/a | n/a |
(Continued)
FMX Growth Allocation Fund
is a series of| The Starboard Investment Trust |
| For Shareholder Service Inquiries: | For Investment Advisor Inquiries: |
| Nottingham Shareholder Services, LLC | FolioMetrix, LLC |
| 116 South Franklin Street | 821 Pacific Street |
Post Office Drawer 4365 Rocky Mount, North Carolina 27803 | Omaha, Nebraska 68108 |
| Toll-Free Telephone: | Toll-Free Telephone: |
| 1-800-773-3863 | 1-800-773-3863 |
World Wide Web @: ncfunds.com | World Wide Web @: foliometrix.com |
Annual Report 2012
May 31, 2012
FMX Total Return Fund
Institutional Class Shares
Advisor Class Shares
This report and the financial statements contained herein are submitted for the general information of the shareholders of the FMX Total Return Fund (the “Fund”). The Fund’s shares are not deposits or obligations of, or guaranteed by, any depository institution. The Fund’s shares are not insured by the FDIC, Federal Reserve Board or any other agency, and are subject to investment risks, including possible loss of principal amount invested. Neither the Fund nor the Fund’s distributor is a bank.
The FMX Total Return Fund is distributed by Capital Investment Group, Inc., Member FINRA/SIPC, 17 Glenwood Ave, Raleigh, NC, 27603. There is no affiliation between the FMX Total Return Fund, including its principals, and Capital Investment Group, Inc.
Statements in this Annual Report that reflect projections or expectations of future financial or economic performance of the FMX Total Return Fund (“Fund”) and of the market in general and statements of the Fund’s plans and objectives for future operations are forward-looking statements. No assurance can be given that actual results or events will not differ materially from those projected, estimated, assumed or anticipated in any such forward-looking statements. Important factors that could result in such differences, in addition to the other factors noted with such forward-looking statements, include, without limitation, general economic conditions such as inflation, recession and interest rates. Past performance is not a guarantee of future results.
An investment in the Fund is subject to investment risks, including the possible loss of some or the entire principal amount invested. There can be no assurance that the Fund will be successful in meeting its investment objective. Investment in the Fund is also subject to the following risks: market risk, risks related to “fund of funds” structure, derivative risk, leverage risk, short sales risk, sector risk, portfolio turnover risk, management style risk, investment advisor risk, operating risk, new fund risk, interest rate and credit risk, high-yield risk, inflation risk, risks of investing in corporate debt securities, risks of investing in convertible securities, and risks of investing in TIPS. More information about these risks and other risks can be found in the Fund’s prospectus.
The performance information quoted in this annual report represents past performance, which is not a guarantee of future results. Investment return and principal value of an investment will fluctuate so that an investor’s shares, when redeemed, may be worth more or less than their original cost. Current performance may be lower or higher than the performance data quoted. An investor may obtain performance data current to the most recent month-end by visiting www.ncfunds.com.
An investor should consider the investment objectives, risks, and charges and expenses of the Fund carefully before investing. The prospectus contains this and other information about the Fund. A copy of the prospectus is available at www.ncfunds.com or by calling Shareholder Services at 1-800-773-3863. The prospectus should be read carefully before investing.
This Annual Report was first distributed to shareholders on or about July 30, 2012.
For More Information on Your FMX Total Return Fund:
See Our Web site @ www.ncfunds.com
or
Call Our Shareholder Services Group Toll-Free at 1-800-773-3863.
May 31, 2012
Enclosed for your review is the Annual Report of the FMX Total Return Fund (the "Fund") for the period ended May 31, 2012. From the beginning of the Fund’s fiscal year on June 1, the Fund’s Institutional Class shares trailed its benchmark, the Barclays Capital US Aggregate Bond Index1 (the "BarCap"), by 6.74%, with the Fund’s Institutional Class shares having a return of 0.38%, and the BarCap having a return of 7.12%. The standard deviations of these returns on a monthly basis were 2.55% and 2.48% (standard deviation is a measure of volatility, the lower the standard deviation, the lower the volatility) for the Fund’s Institutional Class Shares and the BarCap, respectively. Consistent with the Fund’s objective of total return, we strive to provide relative returns to the BarCap over a full market cycle with less volatility. Please see the table below for the Fund’s historical performance information through the calendar quarter ended June 30, 2012.
Average Annual Total Returns | Past | Since | Net Expense | Gross Expense | |
| Period Ended June 30, 2012 | 1 Year | Inception* | Ratio** | Ratio*** | |
| FMX Total Return Fund – Institutional Class Shares | 1.17% | 2.29% | 1.91% | 5.48% | |
Barclays Capital US Aggregate Bond Index1 | 7.47% | 6.07% | | | |
Performance shown is for the period ended June 30, 2012. The performance data quoted above represents past performance, which is not a guarantee of future results. Investment return and principal value of an investment in the Funds will fluctuate so that an investor's shares, when redeemed, may be worth more or less than their original cost. Current performance may be lower or higher than the performance data quoted. To obtain more current performance data regarding the Funds, including performance data current to the Funds' most recent month-end, please visit www.fmxfund.com *The Fund’s inception date is October 2, 2009. ** The Advisor has entered into an Operating Plan with the Administrator through October 1, 2012, under which it has agreed to assume certain expenses of the Administrator to the extent the operating expenses exceed 1.20% of the average daily net assets of the Fund, exclusive of amounts payable under a Rule 12b-1 distribution plan, acquired fund fees and expenses, and extraordinary expenses. The Operating Plan can only be terminated at the conclusion of the then-current term by notice of non-renewal to a party or mutual agreement of the parties. ***Gross expense ratio is from the Funds' prospectus dated September 28, 2011. |
Markets
The fixed income markets remained unstable over the course of the past year. Yields, especially on the 10-Year Treasury Bonds have been incredibly volatile and have continued on the downward slide, ending up around 1.50% as of May 31st, 2012. This level of yield nears historical lows.
Within the fixed income universe, long term bonds seemed to do very well over the past 12 months, with the Barclays US Govt/Credit Long Index returning 22.75%. The European problems have not cleared up and markets still seem to overreact to both good and bad news coming out of the EU. The constant barrage of news coming out of the EU has wreaked havoc on United States markets causing a flight to quality. This has also been compounded by the continuation of Operation Twist, which has led to the unprecedented returns; especially within long maturity US Government fixed income.
In contrast to the relatively high returns within the US fixed income markets, Emerging Markets, as well as other international markets did not fare as well. The Morningstar Emerging Markets Corporate Bond Index returned -0.26% over the past 12 months and the Barclays Global Aggregate Total Return USD returned 2.32%.
Portfolio
The portfolio continues to perform as we would expect given the current market conditions. The Fund is a go-anywhere type of strategy that has a strong bias towards lower volatility fixed income investments. Unfortunately, the yield and return disparity over the past couple years has made it difficult to achieve good performance from investments with lower volatility which we seek to have in the portfolio.
The Fund had a maximum allocation of 1.60% in Emerging Markets over the past 6 months due to the poor performance of these investments. High Yield investments, which sit at approximately 9.60%, are a larger allocation of the portfolio. The extreme volatility has made it fairly difficult to manage the curve on these high yield investments, as any definitive position seems to get whipsawed from one month to the next.
Although the returns for the Fund have not been stellar as of late, the risk exposure within the Fund has been managed effectively. It has managed to provide positive returns over the past fiscal year despite market conditions that are adverse for any type of dynamically managed momentum type strategy. In addition to protecting assets in nominal terms, the fund has also outperformed the inflation rate, as measured by the US BLS CPI All Urban NSA 1982-1984, thus providing a positive real return as well.
Very truly yours,
FolioMetrix LLC
Dale J Murphey, CEO and President
1You cannot invest directly in this index. The index does not have an investment advisor and does not pay any commissions, expenses, or taxes. If this index did pay commissions, expenses, or taxes, its returns would be lower.

| FMX Total Return Fund - Institutional Class Shares | | | | | | | | | | | |
| | | | | | | | | | | | | | | | | | | | |
| Performance Update (Unaudited) | | | | | | | | | | | | | |
| | | | | | | | | | | | | | | | | | | | |
| | | | | | | | | | | | | | | | | | | | |
| For the period from October 2, 2009 (Commencement of Operations) to May 31, 2012 | | |
| | | | | | | | | | | | | | | | | | | | |
| Comparison of the Change in Value of a $10,000 Investment | | | | | | | | |
| | | | | | | | | | | | | | | | | | | | |
 |
| | | | | | | | | | | | | | | | | | | | |
| The graph above assumes an initial $10,000 investment and represents the reinvestment of dividends and capital gains. This graph depicts the performance of Institutional Class Shares versus the Barclays Capital Aggregate Bond Index. It is important to note that the Fund is a professionally managed mutual fund while the indices are not available for investment and are unmanaged. The comparison is shown for illustrative purposes only. |
| | | | | | | | | | | | | | | | | | | | |
| | Average Annual Total Returns | | | | | | | | | | | | | |
| | | | | | | | | | | | | | | | | | Gross | | |
| | | As of | | | | | | | One | | Since | | Inception | | Expense | | |
| | | May 31, 2012 | | | | | | Year | | Inception | | Date | | Ratio* | | |
| | | Institutional Class Shares | | | | | 0.38% | | 2.21% | | 10/02/09 | | 5.48% | | |
| | | Barclays Capital Aggregate Bond Index | | | | 7.12% | | 6.25% | | N/A | | N/A | | |
| | | | | | | | | | | | | | | | | | | | |
* The gross expense ratio shown is from the Fund's prospectus dated September 28, 2011. | | | | |
| Performance quoted above represents past performance, which is no guarantee of future results. Investment return and principal value will fluctuate so that shares, when redeemed, may be worth more or less than their original cost. Current performance may be lower or higher than the performance data quoted. An investor may obtain performance data, current to the most recent month-end, by visiting www.ncfunds.com. |
| | | | | | | | | | | | | | | | | | | | |
| The graph and table do not reflect the deduction of taxes that a shareholder would pay on Fund distributions or the redemption of Fund shares. Average annual total returns are historical in nature and measure net investment income and capital gain or loss from portfolio investments assuming reinvestments of distributions. |
| | | | | | | | | | | | | | | | | | | | |
| FMX Total Return Fund - Advisor Class Shares | | | | | | | | | | | | |
| | | | | | | | | | | | | | | | | | | | |
| Performance Update (Unaudited) | | | | | | | | | | | | | |
| | | | | | | | | | | | | | | | | | | | |
| | | | | | | | | | | | | | | | | | | | |
| For the period from February 25, 2011 (Date of Initial Public Investment) to May 31, 2012 | | |
| | | | | | | | | | | | | | | | | | | | |
| Comparison of the Change in Value of a $10,000 Investment | | | | | | | | |
| | | | | | | | | | | | | | | | | | | | |
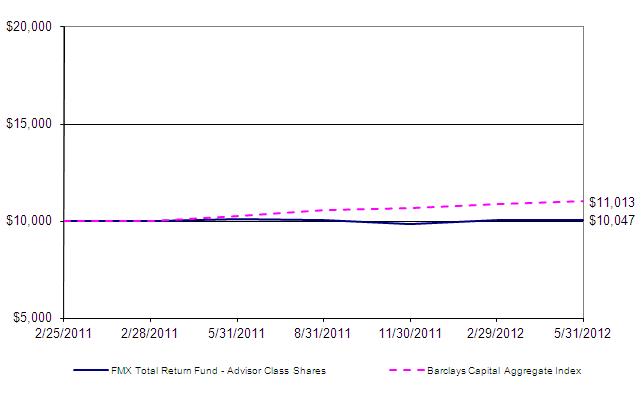 |
| | | | | | | | | | | | | | | | | | | | |
| The graph above assumes an initial $10,000 investment and represents the reinvestment of dividends and capital gains. This graph depicts the performance of Advisor Class Shares versus the Barclays Capital Aggregate Bond Index. It is important to note that the Fund is a professionally managed mutual fund while the indices are not available for investment and are unmanaged. The comparison is shown for illustrative purposes only. |
| | | | | | | | | | | | | | | | | | | | |
| | Average Annual Total Returns | | | | | | | | | | | | | |
| | | | | | | | | | | | | | | | | | Gross | | |
| | | As of | | | | | | | One | | Since | | Inception | | Expense | | |
| | | May 31, 2012 | | | | | | Year | | Inception | | Date | | Ratio* | | |
| | | Advisor Class Shares - No Sales Load | | | | -0.63% | | 0.37% | | 02/25/11 | | 6.48% | | |
| | | Barclays Capital Aggregate Bond Index | | | | 7.12% | | 7.94% | | N/A | | N/A | | |
| | | | | | | | | | | | | | | | | | | | |
* The gross expense ratio shown is from the Fund's prospectus dated September 28, 2011. | | | | |
| Performance quoted above represents past performance, which is no guarantee of future results. Investment return and principal value will fluctuate so that shares, when redeemed, may be worth more or less than their original cost. Current performance may be lower or higher than the performance data quoted. An investor may obtain performance data, current to the most recent month-end, by visiting www.ncfunds.com. |
| | | | | | | | | | | | | | | | | | | | |
| The graph and table do not reflect the deduction of taxes that a shareholder would pay on Fund distributions or the redemption of Fund shares. Average annual total returns are historical in nature and measure net investment income and capital gain or loss from portfolio investments assuming reinvestments of distributions. |
| | | | | | | | | | | | | | | | | | | | |
| FMX Total Return Fund | | | | | |
| | | | | | | | | | |
| Schedule of Investments | | | | | |
| | | | | | | | | | |
| | | | | | | | | | |
| As of May 31, 2012 | | | | | |
| | | | | | | | Shares | | Value (Note 1) |
| | | | | | | | | | |
| OPEN-END FUNDS - 97.92% | | | | | |
| | | AllianceBernstein High Income Fund | | 32,366 | $ | 285,142 |
| | | AllianceBernstein Unconstrained Bond Fund | 32,291 | | 286,419 |
| | | BBH Broad Market Fund | | | 69,340 | | 715,591 |
| | | DWS Unconstrained Income Fund | | 58,801 | | 285,773 |
| | | Forward Credit Analysis Long/Short Fund | | 32,999 | | 285,774 |
| | | Invesco High Yield Securities Fund | | 8,450 | | 142,719 |
| | | Ivy High Income Fund | | | 17,341 | | 142,887 |
| | | Loomis Sayles High Income Fund | | 33,001 | | 142,564 |
| | | PIA High Yield Investor Fund | | | 14,129 | | 143,553 |
| | | PIMCO Floating Income Fund | | | - | | - |
| | | PIMCO High Yield Spectrum Fund | | 14,078 | | 142,749 |
| | | PIMCO Income Fund | | | 25,178 | | 285,773 |
| | | PIMCO Total Return Fund | | | 152,275 | | 1,717,657 |
| | | PIMCO Unconstrained Bond Fund | | 25,267 | | 285,773 |
| | | RidgeWorth US Government Securities Ultra Short Bond Fund | 70,318 | | 713,733 |
| | | Sit US Government Securities Fund | | 62,890 | | 715,061 |
| | | TCW High Yield Bond Fund | | | 23,696 | | 142,887 |
| | | TCW Total Return Bond Fund | | | 72,020 | | 711,553 |
| | | Touchstone Short Duration Fixed Income Fund | 72,976 | | 714,434 |
| | | Touchstone Ultra Short Duration Fixed Income Fund | 74,732 | | 714,434 |
| | | | | | | | | | |
| | | Total Open-End Funds (Cost $8,510,652) | | | | 8,574,476 |
| | | | | | | | | | |
| SHORT-TERM INVESTMENT - 2.62% | | | | |
| | § | Fidelity Institutional Money Market Funds, 0.19% | 229,639 | | 229,639 |
| | | | | | | | | | |
| | | Total Short-Term Investment (Cost $229,639) | | | 229,639 |
| | | | | | | | | | |
| Total Value of Investments (Cost $8,740,291) - 100.54% | | $ | 8,804,115 |
| | | | | | | | | | |
| Liabilities in Excess of Other Assets - (0.54)% | | | | (47,092) |
| | | | | | | | | | |
| | Net Assets - 100% | | | | $ | 8,757,023 |
| | | | | | | | | | |
| § | Represents 7 day effective yield | | | | | |
| | | | | | | | | | |
| | | | | Summary of Investments by Sector | | | |
| | | | | | | | | | |
| | | | | Sector | | % of Net Assets | | Value | |
| | | | | Open-End Funds | | 97.92% | $ | 8,574,476 | |
| | | | | Short-Term Investment | 2.62% | | 229,639 | |
| | | | | Total | | 100.54% | $ | 8,804,115 | |
| | | | | | | | | | |
| See Notes to Financial Statements | | | | | |
| FMX Total Return Fund | | | | |
| | | | | | | | | |
| Statement of Assets and Liabilities | | | |
| | | | | | | | | |
| | | | | | | | | |
| As of May 31, 2012 | | | | |
| | | | | | | | | |
| Assets: | | | | | | |
| | Investments, at value (cost $8,740,291) | $ | 8,804,115 | |
| | Cash | | | | | 3 | |
| | Receivables: | | | | |
| | | Investments sold | | | 831,673 | |
| | | Fund shares sold | | | 30,465 | |
| | | Dividends and interest | | | 31 | |
| | Prepaid expenses | | | 1,734 | |
| | | | | | | | | |
| | Total assets | | | 9,668,021 | |
| | | | | | | | | |
| Liabilities: | | | | | | |
| | Payables: | | | | | |
| | | Investments purchased | | | 888,780 | |
| | | Fund shares repurchased | | 13,000 | |
| | Accrued expenses | | | | |
| | | Administration fees | | | 8,519 | |
| | | Other expenses | | | 699 | |
| | | | | | | | | |
| | Total liabilities | | | 910,998 | |
| | | | | | | | | |
| Net Assets | | | | $ | 8,757,023 | |
| | | | | | | | | |
| Net Assets Consist of: | | | | |
| | Capital | | | | $ | 8,865,578 | |
| | Distributable Income: | | | | |
| | | Net investment income | | | 76,181 | |
| | | Net realized loss on investments | | (248,560) | |
| | Net unrealized appreciation on investments | | 63,824 | |
| | | | | | | | | |
| | Total Net Assets | | $ | 8,757,023 | |
| | | | | | | | | |
| Institutional Class Shares outstanding, no par value (unlimited authorized shares) | | 779,406 | |
| | Net Assets | | | | 7,920,243 | |
| | Net Asset Value, Offering Price and Redemption Price Per Share | $ | 10.16 | |
| | | | | | | | | |
| Advisor Class Shares outstanding, no par value (unlimited authorized shares) | | 84,198 | |
| | Net Assets | | | | 836,780 | |
| | Net Asset Value, Offering Price and Redemption Price Per Share | $ | 9.94 | |
| | | | | | | | | |
| | | | | | | | | |
| | | | | | | | | |
| | | | | | | | | |
| | | | | | | | | |
| | | | | | | | | |
| See Notes to Financial Statements | | | |
| FMX Total Return Fund | | |
| | | | | | | | |
| Statement of Operations | | |
| | | | | | | | |
| | | | | | | | |
| For the Year ended May 31, 2012 | | |
| | | | | | | | |
| Investment Income: | | |
| | Dividends | | | $ | 271,850 |
| | | | | | | | |
| | Total Income | | | 271,850 |
| | | | | | | | |
| Expenses: | | | | | |
| | Administration fees (note 2) | | 100,618 |
| | Distribution and service fees - Advisor Class (note 3) | | 7,371 |
| | | | | | | | |
| | Total Expenses | | | 107,989 |
| | | | | | | | |
| | Administration fees waived (note 2) | | (2,054) |
| | | | | | | | |
| | Net Expenses | | | 105,935 |
| | | | | | | | |
| Net Investment Income | | 165,915 |
| | | | | | | | |
| Realized and Unrealized Gain (Loss) on Investments | | |
| | | | | | | | |
| | Net realized loss from investment transactions | | (250,243) |
| | Change in unrealized appreciation on investments | | 59,262 |
| | | | | | | | |
| Realized and Unrealized Loss on Investments | | (190,981) |
| | | | | | | | |
| Net Decrease in Net Assets Resulting from Operations | $ | (25,066) |
| | | | | | | | |
| | | | | | | | |
| | | | | | | | |
| | | | | | | | |
| | | | | | | | |
| | | | | | | | |
| | | | | | | | |
| | | | | | | | |
| | | | | | | | |
| | | | | | | | |
| | | | | | | | |
| | | | | | | | |
| | | | | | | | |
| | | | | | | | |
| | | | | | | | |
| | | | | | | | |
| | | | | | | | |
| | | | | | | | |
| | | | | | | | |
| | | | | | | | |
| See Notes to Financial Statements | | |
| FMX Total Return Fund | | | | | | | |
| | | | | | | | | | | | |
| Statements of Changes in Net Assets | | | | | | | |
| | | | | | | | | | | | |
| | | | | | | | | | | | |
| For the Year ended May 31, | | | 2012 | | | | 2011 |
| | | | | | | | | | | | |
| Operations: | | | | | | | | |
| | Net investment income | | $ | 165,915 | | | $ | 116,522 |
| | Net realized (loss) gain from investment transactions | | (250,243) | | | | 1,682 |
| | Change in unrealized appreciation on investments | | 59,262 | | | | 3,527 |
| | | | | | | | | | | | |
| Net (Decrease) Increase in Net Assets Resulting from Operations | (25,066) | | | | 121,731 |
| | | | | | | | | | | | |
Distributions to Shareholders: (note 5) | | | | | | | |
| | Net investment income | | | | | | | |
| | | Institutional Class Shares | | | (115,468) | | | | (82,832) |
| | | Advisor Class Shares | | | (8,039) | | | | - |
| | | | | | | | | | | | |
| Decrease in Net Assets Resulting from Distributions | | (123,507) | | | | (82,832) |
| | | | | | | | | | | | |
| Capital Share Transactions: | | | | | | | |
| | Shares sold | | | | 10,363,604 | | | | 9,467,016 |
| | Reinvested dividends and distributions | | | 34,051 | | | | 3,288 |
| | Shares repurchased | | | (5,716,817) | | | | (5,414,397) |
| | | | | | | | | | | | |
| Increase from Capital Share Transactions | | | 4,680,838 | | | | 4,055,907 |
| | | | | | | | | | | | |
| Net Increase in Net Assets | | | 4,532,265 | | | | 4,094,806 |
| | | | | | | | | | | | |
| Net Assets: | | | | | | | | |
| | Beginning of Year | | | 4,224,758 | | | | 129,952 |
| | End of Year | | | $ | 8,757,023 | | | $ | 4,224,758 |
| | | | | | | | | | | | |
| Undistributed Net Investment Income | | $ | 76,181 | | | | - |
| | | | | | | | | | | | |
| Share Information: | Shares | | Amount | | Shares | | Amount |
| | Institutional Class Shares | | | | | | | |
| | | Shares sold | 939,312 | $ | 9,609,027 | | 898,476 | | $9,159,684 |
| | | Reinvested dividends and distributions | 2,705 | | 26,892 | | 328 | | 3,288 |
| | | Shares repurchased | (543,455) | | (5,493,412) | | (530,867) | | (5,414,397) |
| | Net Increase in Capital Shares | 398,562 | $ | 4,142,507 | | 367,937 | | $3,748,575 |
| | Outstanding, Beginning of Year | 380,843 | | 3,877,408 | | 12,906 | | 128,833 |
| | Outstanding, End of Year | 779,405 | $ | 8,019,915 | | 380,843 | | $3,877,408 |
| | | | | | | | | | | | |
| | Advisor Class Shares | | | | | | | |
| | | Shares sold | 75,438 | $ | 754,577 | | 30,556 | $ | 307,332 |
| | | Reinvested dividends and distributions | 734 | | 7,159 | | - | | - |
| | | Shares repurchased | (22,529) | | (223,405) | | - | | - |
| | Net Increase in Capital Shares | 53,643 | $ | 538,331 | | 30,556 | $ | 307,332 |
| | Outstanding, Beginning of Year | 30,556 | | 307,332 | | - | | - |
| | Outstanding, End of Year | 84,199 | $ | 845,663 | | 30,556 | $ | 307,332 |
| | | | | | | | | | | | |
| See Notes to Financial Statements | | | | | | | |
| FMX Total Return Fund | | | | | | | |
| | | | | | | | | | | | |
| Financial Highlights | | | | | | | |
| | | | | | | | | | | | |
| For a share outstanding during the | | Institutional Class Shares | | | |
| fiscal year ended May 31, | | 2012 | | 2011 | | 2010(a) |
| | | | | | | | | | | | |
| Net Asset Value, Beginning of Year | $ | 10.28 | $ | 10.07 | $ | 10.00 | |
| | | | | | | | | | | | |
| Income (Loss) from Investment Operations | | | | | | | |
| | Net investment income (loss) | | 0.17 | | 0.35 | | 0.00 | (g) |
| | Net realized and unrealized gain (loss) on securities | | (0.13) | | 0.13 | | 0.07 | |
| | | | | | | | | | | | |
| Total from Investment Operations | | 0.04 | | 0.48 | | 0.07 | |
| | | | | | | | | | | | |
| Less Distributions: | | | | | | | |
| | Dividends (from net investment income) | | (0.16) | | (0.27) | | - | |
| | | | | | | | | | | | |
| Total Distributions | | (0.16) | | (0.27) | | - | |
| | | | | | | | | | | | |
| Net Asset Value, End of Year | $ | 10.16 | $ | 10.28 | $ | 10.07 | |
| | | | | | | | | | | | |
| Total Return (d) | | | 0.38% | | 4.87% | | 0.70% | |
| | | | | | | | | | | | |
| Net Assets, End of Year (in thousands) | $ | 7,920 | $ | 3,916 | $ | 130 | |
| | | | | | | | | | | | |
| Average Net Assets for the Year (in thousands) | $ | 7,660 | $ | 3,089 | $ | 76 | |
| | | | | | | | | | | | |
| Ratios of: | | | | | | | | | |
| Gross Expenses to Average Net Assets (e) | | 1.20% | | 1.20% | | 1.20% | (b) |
| Net Expenses to Average Net Assets (e) | | 1.17% | | 1.20% | | 1.20% | (b) |
| Net Investment Income/(Loss) to Average Net Assets (f) | | 2.06% | | 3.77% | | 0.17% | (b) |
| | | | | | | | | | | | |
| Portfolio turnover rate | | 207.87% | | 218.16% | | 48.89% | (c) |
| | | | | | | | | | | | |
| | | | | | | | | | | | |
| (a) | For the period from October 2, 2009 (Commencement of Operations) to May 31, 2010. | | | |
| (b) | Annualized. | | | | | | | | |
| (c) | Not annualized. | | | | | | | |
| (d) | Includes adjustments in accordance with accounting principles generally accepted in the United States and, |
| | consequently, the net asset value for financial reporting purposes and the returns based upon those net asset |
| | values may differ from the net asset values and returns for shareholder transactions. | | | |
| (e) | Does not include expenses of the investment companies in which the Fund invests. | | | |
| (f) | Recognition of net investment income by the Fund is affected by the timing of the declaration of dividends | |
| | by the underlying investment companies in which the Fund invests. | | | | | |
| (g) | Actual amount is less than $0.01 per share. | | | | | | | |
| | | | | | | | | | | | |
| | | | | | | | | | | | |
| | | | | | | | | | | | |
| | | | | | | | | | | | |
| | | | | | | | | | | | |
| | | | | | | | | | | | |
| See Notes to Financial Statements | | | | | | | (Continued) |
| FMX Total Return Fund | | | | | |
| | | | | | | | | | |
| Financial Highlights | | | | | |
| | | | | | | | | | |
| For a share outstanding during the | | Advisor Class Shares | |
| fiscal year ended May 31, | | 2012 | | 2011(a) | |
| | | | | | | | | | |
| Net Asset Value, Beginning of Year | $ | 10.11 | $ | 10.00 | |
| | | | | | | | | | |
| Income (Loss) from Investment Operations | | | | | |
| | Net investment income (loss) | | 0.10 | | 0.00 | (g) |
| | Net realized and unrealized gain (loss) on securities | | (0.17) | | 0.11 | |
| | | | | | | | | | |
| Total from Investment Operations | | (0.07) | | 0.11 | |
| | | | | | | | | | |
| Less Distributions: | | | | | |
| | Dividends (from net investment income) | | (0.10) | | - | |
| | | | | | | | | | |
| Total Distributions | | (0.10) | | - | |
| | | | | | | | | | |
| Net Asset Value, End of Year | $ | 9.94 | $ | 10.11 | |
| | | | | | | | | | |
| Total Return (d) | | | (0.63)% | | 1.10% | |
| | | | | | | | | | |
| Net Assets, End of Year (in thousands) | $ | 837 | $ | 309 | |
| | | | | | | | | | |
| Average Net Assets for the Year (in thousands) | $ | 737 | $ | 142 | |
| | | | | | | | | | |
| Ratios of: | | | | | | | |
| Gross Expenses to Average Net Assets (e) | | 2.20% | | 2.20% | (b) |
| Net Expenses to Average Net Assets (e) | | 2.17% | | 2.20% | (b) |
| Net Investment Income/(Loss) to Average Net Assets (f) | | 1.11% | | 0.26% | (b) |
| | | | | | | | | | |
| Portfolio turnover rate | | 207.87% | | 218.16% | (c) |
| | | | | | | | | | |
| | | | | | | | | | |
| (a) | For the period from February 25, 2011 (Date of Initial Public Investment) to May 31, 2011. | | | |
| (b) | Annualized. | | | | | | |
| (c) | Not annualized. | | | | | |
| (d) | Includes adjustments in accordance with accounting principles generally accepted in the United States and, | |
| | consequently, the net asset value for financial reporting purposes and the returns based upon those net asset | |
| | values may differ from the net asset values and returns for shareholder transactions. | | | |
| (e) | Does not include expenses of the investment companies in which the Fund invests. | | | | |
| (f) | Recognition of net investment income by the Fund is affected by the timing of the declaration of dividends | |
| | by the underlying investment companies in which the Fund invests. | | | | | |
| (g) | Actual amount is less than $0.01 per share. | | | | | |
| | | | | | | | | | |
| | | | | | | | | | |
| | | | | | | | | | |
| | | | | | | | | | |
| | | | | | | | | | |
| | | | | | | | | | |
| See Notes to Financial Statements | | | | | |
FMX Total Return Fund
Notes to Financial Statements
1. Organization and Significant Accounting Policies
The FMX Total Return Fund (“Fund”) is a series of the Starboard Investment Trust (“Trust”). The Trust is organized as a Delaware statutory trust and is registered under the Investment Company Act of 1940, as amended (the “1940 Act”), as an open-end management investment company. The Fund is a separate diversified series of the Trust.
The Fund commenced operations on October 2, 2009. The investment objective of the Fund is to seek total return through a combination of capital appreciation and current income. In order to achieve its investment objective, FolioMetrix LLC (“Advisor”) will seek to invest primarily in no-load, institutional, and exchange-traded funds (“Portfolio Funds”). Although the Fund will primarily invest in Portfolio Funds with no sales related expenses or very low sales related expenses, the Fund is not precluded from investing in Portfolio Funds with sales-related expenses, redemption fees, and/or service fees in excess of 0.25%. The Fund will primarily invest in Portfolio Funds that have a similar investment objective or that are otherwise permitted investments under the Fund’s investment policies. The Portfolio Funds’ investments generally will include, but are not limited to, fixed income securities (such as bonds, corporate debt securities, convertible securities, TIPS and other treasuries).
The Advisor uses a proprietary screening process to select Portfolio Funds for investment. The screening process includes analysis of sector and asset allocations, total returns, and risk data. The Advisor will seek to construct portfolios that achieve the Fund’s investment objective while assuming risk that is no greater than the BarCap U.S. Aggregate Index. The Advisor will generally sell a Portfolio Fund when a more attractive investment opportunity is identified or the Fund’s portfolio needs to be rebalanced.
The Board of Trustees of the Trust approved, on November 4, 2010, a plan to authorize a new class of shares for the Fund designated as Advisor Class Shares. On February 15, 2011, the Advisor Class Shares became effective. The Fund currently has an unlimited number of authorized shares, which are divided into two classes – Institutional Class Shares and Advisor Class Shares. Each class of shares has equal rights as to assets of the Fund, and the classes are identical except for differences in ongoing distribution and service fees. The Advisor Class Shares are subject to distribution plan fees as described in Note 3. Income, expenses (other than distribution and service fees), and realized and unrealized gains or losses on investments are allocated to each class of shares based upon its relative net assets. All classes have equal voting privileges, except where otherwise required by law or when the Trustees determine that the matter to be voted on affects only the interests of the shareholders of a particular class.
The following is a summary of significant accounting policies consistently followed by the Fund. The policies are in conformity with accounting principles generally accepted in the United States of America. In June 2009, the Financial Accounting Standards Board (“FASB”) codified its standards and accounting principles for the financial statements issued for years ending after September 15, 2009. Herein, the Fund will make reference to accounting principles generally accepted in the United States issued by FASB as Accounting Standards Codification (“ASC”).
Investment Valuation
The Fund’s investments in securities are carried at fair value. Investments in funds within the FMX Total Return Fund are valued based on the net asset values as reported by the underlying funds. Securities listed on an exchange or quoted on a national market system are valued at the last sales price as of 4:00 p.m. Eastern Time. Securities traded in the NASDAQ over-the-counter market are generally valued at the NASDAQ Official Closing Price. Other securities traded in the over-the-counter market and listed securities for which no sale was reported on that date are valued at the most recent bid price. Securities and assets for which representative market quotations are not readily available (e.g., if the exchange on which the portfolio security is principally traded closes early or if trading of the particular portfolio security is halted during the day and does not resume prior to the Fund’s net asset value calculation) or which cannot be accurately valued using the Fund’s normal pricing procedures are valued at fair value as determined in good faith under policies approved by the Trustees. A portfolio security’s “fair value” price may differ from the price next available for that portfolio security using the Fund’s normal pricing procedures. Instruments with maturities of 60 days or less are valued at amortized cost, which approximates market value.
FMX Total Return Fund
Notes to Financial Statements
Fair Value Measurement
The Fund has adopted ASC Topic 820, Fair Value Measurements. ASC Topic 820 defines fair value, establishes a frame work for measuring fair value and expands disclosure about fair value measurements.
Various inputs are used in determining the value of the Fund's investments. These inputs are summarized in the three broad levels listed below:
| a. | Level 1: quoted prices in active markets for identical securities |
| b. | Level 2: other significant observable inputs (including quoted prices for similar securities, interest rates, credit risk, etc.) |
| c. | Level 3: significant unobservable inputs (including the Fund’s own assumptions in determining fair value of investments) |
The Fund has adopted FASB guidance updating ASC Topic 820 titled, Determining Fair Value When the Volume and Level of Activity for the Asset or Liability have Significantly Decreased and Identifying Transactions that are not Orderly which provides guidance on determining when there has been a significant decrease in the volume and level of activity for an asset or liability, when a transaction that is not orderly, and how that information must be incorporated into fair value measurement. The guidance emphasizes that even if there has been a significant decrease in volume and level of activity for an asset or liability and regardless of the valuation techniques used, the objective of a fair value measurement remains the same.
An Investment asset’s or liability’s level within the fair value hierarchy is based on the lowest level input, individually or in aggregate, that is significant to fair value measurement.
The valuation techniques used by the Fund to measure fair value for the fiscal year ended May 31, 2012 maximized the use of observable inputs and minimized the use of unobservable inputs.
The inputs or methodology used for valuing securities are not necessarily an indication of the risk associated with investing in those securities. The following is a summary of the inputs used in valuing the Fund's assets:
| Assets | | Total | | Level 1 | | Level 2 | | Level 3 |
| Open-End Funds | $ | 8,574,476 | $ | 8,574,476 | $ | - - | $ | - - |
| Short-Term Investment | | 229,639 | | 229,639 | | - - | | - - |
| Total | $ | 8,804,115 | $ | 8,804,115 | $ | - - | $ | - - |
Investment Transactions and Investment Income
Investment transactions are accounted for as of the date purchased or sold (trade date). Dividend income is recorded on the ex-dividend date. Certain dividends from foreign securities will be recorded as soon as the Fund is informed of the dividend if such information is obtained subsequent to the ex-dividend date. Interest income is recorded on the accrual basis and includes amortization of discounts and premiums. Gains and losses are determined on the identified cost basis, which is the same basis used for federal income tax purposes.
Expenses
The Fund bears expenses incurred specifically on its behalf as well as a portion of general expenses, which are allocated according to methods reviewed annually by the Trustees.
Dividend Distributions
The Fund may declare and distribute dividends from net investment income (if any) quarterly. Distributions from capital gains (if any) are generally declared and distributed annually. Dividends and distributions to shareholders are recorded on ex-date.
FMX Total Return Fund
Notes to Financial Statements
Estimates
The preparation of financial statements in conformity with accounting principles generally accepted in the United States of America requires management to make estimates and assumptions that affect the reported amounts of assets and liabilities and disclosure of contingent assets and liabilities at the date of the financial statements and the reported amounts of increases and decreases in the net assets from operations during the reported period. Actual results could differ from those estimates.
Federal Income Taxes
No provision for income taxes is included in the accompanying financial statements, as the Fund intends to distribute to shareholders all taxable investment income and realized gains and otherwise comply with Subchapter M of the Internal Revenue Code applicable to regulated investment companies.
2. Transactions with Affiliates & Service Providers
Advisor
As full compensation for the investment advisory services provided to the Fund, the Advisor receives a monthly fee based on the Fund’s average daily net assets. The minimum annual rate is 0.00% if the average daily net assets are under $13 million and gradually increases to a maximum annual rate of 0.70% if the average daily net assets are $41 million or more. The fee paid to the Advisor is calculated by multiplying the average daily net assets of the Fund by the highest applicable annual rate. In agreement with these terms, the Fund paid no investment advisory fees for the fiscal year ended May 31, 2012.
The Advisor has entered into an Operating Plan with the Fund’s administrator under which it has agreed to assume certain fees of the administrator to the extent such fees exceed the maximum of 1.20% of the average daily net assets of the Fund to be paid by the Fund to the administrator under its consolidated fee arrangement. The Advisor cannot recoup from the Fund any amounts paid by the Advisor to the Administrator under the Operating Plan.
Administrator
The Nottingham Company (“Administrator”) assists the Trust in the performance of its administrative responsibilities to the Fund, coordinates and pays for the services of each vendor and the operating expense to the Fund, and provides the Fund with certain administrative, fund accounting, and compliance services. As part of its services and consolidated fee arrangement, the Administrator receives compensation based on the Fund’s average daily net assets. The annual rate is 1.20% if the average daily net assets are under $13 million and gradually decreases to an annual rate of 0.175% once the average daily net assets reach $370 million or more.
The fee paid to the Administrator is calculated by multiplying the average daily net assets of the Fund by the highest applicable annual rate. The Administrator pays all expenses not assumed by the Advisor, including, without limitation: the fees and expenses of its independent accountants, of its legal counsel, and of its Trustees; the costs of printing and mailing to shareholders annual and semi-annual reports, proxy statements, prospectuses, statements of additional information and supplements thereto; the costs of printing registration statements; bank transaction charges and custodian’s fees; any proxy solicitors’ fees and expenses; filing fees; any federal, state or local income or other taxes; any interest; any membership fees of the Investment Company Institute and similar organizations; fidelity bond and Trustees’ liability insurance premiums. The Fund incurred $100,618 in administration fees for the fiscal year ended May 31, 2012, of which $2,054 were voluntarily waived by the administrator.
Compliance Services
Nottingham Compliance Services, LLC (“NCS”), a fully owned affiliate of the Administrator, provides services which assist the Trust’s Chief Compliance Officer in monitoring and testing the policies and procedures of the Trust in conjunction with requirements under Rule 38a-1 of the 1940 Act. NCS is entitled to receive compensation from the Administrator pursuant to the Administrator’s fee arrangements with the Fund.
FMX Total Return Fund
Notes to Financial Statements
Transfer Agent
Nottingham Shareholder Services, LLC (“Transfer Agent”) serves as transfer, dividend paying, and shareholder servicing agent for the Fund. For its services, the Transfer Agent is entitled to receive compensation from the Administrator pursuant to the Administrator’s fee arrangements with the Fund.
Distributor
Capital Investment Group, Inc. (the “Distributor”) serves as the Fund’s principal underwriter and distributor. For its services, the Distributor is entitled to receive compensation from the Administrator pursuant to the Administrator’s fee arrangements with the Fund.
Certain Trustees and officers of the Trust may also be officers of the Advisor, the Distributor, the Administrator, or NCS.
Because the underlying funds have varied expense and fee levels and the Fund may own different proportions of underlying funds at different times, the amount of fees and expense incurred indirectly by the Fund will vary.
3. Distribution and Service Fees
The Board of Trustees, including a majority of the Trustees who are not “interested persons” as defined in the 1940 Act, adopted a distribution and service plan pursuant to Rule 12b-1 of the 1940 Act (the “Plan”) for the Advisor Class Shares. The 1940 Act regulates the manner in which a registered investment company may assume costs of distributing and promoting the sales of its shares and servicing of its shareholder accounts. The Plan provides that the Fund may incur certain costs, which may not exceed 1.00% per annum of the average daily net assets of the Advisor Class Shares for each year elapsed subsequent to adoption of the Plan, for payment to the Distributor and others for items such as advertising expenses, selling expenses, commissions, travel, or other expenses reasonably intended to result in sales of Advisor Class Shares or servicing of Advisor Class shareholder accounts. For the year ended May 31, 2012, $7,371 in fees were incurred by the Distributor.
4. Purchases and Sales of Investment Securities
The aggregate cost of purchases and proceeds from sales of investment securities (excluding short-term securities) were as follows:
| Fiscal Year Ended | Purchases of Securities | Proceeds from Sales of Securities |
| May 31, 2012 | $20,775,839 | $16,076,512 |
There were no long-term purchases or sales of U.S Government Obligations during the fiscal year ended May 31, 2012.
5. Federal Income Tax
Distributions are determined in accordance with Federal income tax regulations, which differ from generally accepted accounting principles, and, therefore, may differ significantly in amount or character from net investment income and realized gains for financial reporting purposes. Financial reporting records are adjusted for permanent book/tax differences to reflect tax character but are not adjusted for temporary differences. For the year ended May 31, 2012 there were no difference between the book and the tax treatment of the distributions.
Management has analyzed the Fund’s tax positions for all open tax years (current and prior three tax years, is applicable) and determined that the implementation of ASC Topic 740 titled Accounting for Uncertainty in Income Taxes had no impact on the Fund’s net assets or results of operations. As of and during the fiscal year ended May 31, 2012, the Fund does not have a liability for uncertain tax positions. The Fund recognizes interest and penalties, if any, related to unrecognized tax benefits as income tax expense in the statement of operations. During the fiscal year, the Fund did not incur any interest or penalties.
FMX Total Return Fund
Notes to Financial Statements
At May 31, 2012, the tax-basis cost of investments and components of distributable earnings were as follows:
| Cost of Investments | | $ 8,786,654 |
| | | |
| Unrealized Appreciation | | $82,260 |
| Unrealized Depreciation | | (64,799) |
| Net Unrealized Appreciation | | 17,461 |
| Undistributed Ordinary Income | | 84,364 |
| Accumulated Capital Losses | | (136,454) |
| Other Book/Tax Differences | | (73,926) |
| | | |
| Distributable Earnings | | $ 108,555 |
| | | | | | |
6. Commitments and Contingencies
Under the Trust’s organizational documents, its officers and Trustees are indemnified against certain liabilities arising out of the performance of their duties to the Fund. In addition, in the normal course of business, the Trust entered into contracts with its service providers, on behalf of the Fund, and others that provide for general indemnifications. The Fund’s maximum exposure under these arrangements is unknown, as this would involve future claims that may be made against the Fund. The Fund expects risk of loss to be remote.
7. New Accounting Pronouncements
In May 2011, the FASB issued ASU No. 2011-04 “Amendments to Achieve Common Fair Value Measurement and Disclosure Requirements.” ASU No. 2011-04 amends FASB ASC Topic 820, Fair Value Measurements and Disclosures, to establish common requirements for measuring fair value and for disclosing information about fair value measurements in accordance with GAAP and International Financial Reporting Standards (“IFRS”). ASU No. 2011-04 is effective for fiscal years beginning after December 15, 2011 and for interim periods within those fiscal years.
8. Subsequent Events
In accordance with the adoption of ASC Topic 855, Subsequent Events, and in preparing these financial statements, the Fund has evaluated the need for disclosures and/or adjustments resulting from subsequent events through the date of issuance of these financial statements. This evaluation did not result in any subsequent events that necessitated disclosures and/or adjustments.
REPORT OF INDEPENDENT REGISTERED PUBLIC ACCOUNTING FIRM
To the Shareholders, Trustees and
Audit Committee of FMX Total Return Fund
We have audited the accompanying statement of assets and liabilities of the FMX Total Return Fund (the “Fund”, one of the series constituting the Starboard Investment Trust), including the schedule of investments as of May 31, 2012, and the related statements of operations for the year then ended, the statements of changes in net assets for each of the two years in the period then ended, and the financial highlights for the years ended May 31, 2012, May 31, 2011 and the period from October 2, 2009 (Date of Initial Public Investments) to May 31, 2010. These financial statements and financial highlights are the responsibility of the Fund’s management. Our responsibility is to express an opinion on these financial statements and financial highlights based on our audits.
We conducted our audits in accordance with the standards of the Public Company Accounting Oversight Board (United States). Those standards require that we plan and perform the audit to obtain reasonable assurance about whether the financial statements and financial highlights are free of material misstatement. The Fund is not required to have, nor were we engaged to perform, an audit of its internal control over financial reporting. Our audits included consideration of internal control over financial reporting as a basis for designing audit procedures that are appropriate in the circumstances, but not for the purpose of expressing an opinion on the effectiveness of the Fund’s internal control over financial reporting. Accordingly, we express no such opinion. An audit also includes examining, on a test basis, evidence supporting the amounts and disclosures in the financial statements, assessing the accounting principles used and significant estimates made by management, as well as evaluating the overall financial statement presentation. Our procedures included confirmation of the securities owned as of May 31, 2012, by correspondence with the custodian and brokers. We believe that our audits provide a reasonable basis for our opinion.
In our opinion, the financial statements and financial highlights referred to above present fairly, in all material respects, the financial position of FMX Total Return Fund as of May 31, 2012, and the results of its operations for the year then ended, the changes in net assets for each of the two years in the period then ended, and the financial highlights for the years ended May 31, 2012, May 31, 2011 and the period from October 2, 2009 (Date of Initial Public Investments) to May 31, 2010 in conformity with accounting principles generally accepted in the United States of America.
| Chicago, Illinois |
| | |
| July 26, 2012 | |
| | |

FMX Total Return Fund
Additional Information (Unaudited)
| 1. | Proxy Voting Policies and Voting Record |
A copy of the Trust’s Proxy Voting and Disclosure Policy and the Advisor’s Disclosure Policy are included as Appendix B to the Fund’s Statement of Additional Information and are available, without charge, upon request, by calling 1-800-773-3863, and on the website of the Security and Exchange Commission (“SEC”) at http://www.sec.gov. Information regarding how the Fund voted proxies relating to portfolio securities during the most recent period ended June 30, is available (1) without charge, upon request, by calling the Fund at the number above and (2) on the SEC’s website at http://www.sec.gov.
| 2. | Quarterly Portfolio Holdings |
The Fund files its complete schedule of portfolio holdings with the SEC for the first and third quarters of each fiscal year on Form N-Q. The Fund’s Forms N-Q is available on the SEC’s website at http://www.sec.gov. You may review and make copies at the SEC’s Public Reference Room in Washington, D.C. Information on the operation of the Public Reference Room may be obtained by calling the SEC at 202-942-8090. You may also obtain copies without charge, upon request, by calling the Fund toll-free at 1-800-773-3863.
We are required to advise you within 60 days of the Fund’s fiscal year-end regarding the federal tax status of certain distributions received by shareholders during each fiscal year. The following information is provided for the Fund’s fiscal year ended May 31, 2012.
During the fiscal year, the Fund paid no long-term capital gain distributions.
Individual shareholders are eligible for reduced tax rates on qualified dividend income. For the purposes of computing the dividends eligible for reduced tax rates, all of the dividends paid by the funds from ordinary income earned during the fiscal year are considered qualified dividend income.
Corporate shareholders may exclude up to 70% of qualifying dividends. For the purposes of computing this exclusion, all of the dividends paid by the fund from ordinary income earned during the fiscal year represent qualifying dividends.
Dividend and distributions received by retirement plans such as IRAs, Keogh-type plans and 403(b) plans need not be reported as taxable income. However, many retirement plans may need this information for their annual information meeting.
4. Schedule of Shareholder Expenses
As a shareholder of the Fund, you incur two types of costs: (1) transaction costs, which may include sales charges (loads) on purchase payments and (2) ongoing costs, including investment advisory fees; distribution (12b-1) fees; and other Fund expenses. This example is intended to help you understand your ongoing costs (in dollars) of investing in the Fund and to compare these costs with the ongoing costs of investing in other mutual funds. The example is based on an investment of $1,000 invested at the beginning of the period and held for the entire period as indicated below.
Actual Expenses – The first line of the table below provides information about the actual account values and actual expenses. You may use the information in this line, together with the amount you invested, to estimate the expenses that you paid over the period. Simply divide your account value by $1,000 (for example, an $8,600 account value divided by $1,000 = 8.6), then multiply the result by the number in the first line under the heading entitled “Expenses Paid During Period” to estimate the expenses you paid on your account during this period.
Hypothetical Example for Comparison Purposes – The last line of the table below provides information about hypothetical account values and hypothetical expenses based on the Fund’s actual expense ratio and an assumed annual rate of return of 5% before expenses, which is not the Fund’s actual return. The hypothetical account values and expenses may not be used to estimate the actual ending account balance or expenses you paid for the period. You may use this information to compare the ongoing costs of investing in the Fund and other funds by comparing this 5% hypothetical example with the 5% hypothetical examples that appear in the shareholder reports of other funds.
FMX Total Return Fund
Additional Information (Unaudited)
| Institutional Class Shares | Beginning Account Value December 1, 2011 | Ending Account Value May 31, 2012 | Expenses Paid During Period* |
Actual Hypothetical (5% annual return before expenses) | | | |
| $1,000.00 | $1,025.70 | $5.84 |
| $1,000.00 | $1,019.30 | $5.82 |
*Expenses are equal to the average account value over the period multiplied by the Fund’s annualized expense ratio, multiplied by the number of days in the most recent period divided by the number of days in the fiscal year (to reflect the initial period).
| Advisor Class Shares | Beginning Account Value December 1, 2011 | Ending Account Value May 31, 2012 | Expenses Paid During Period* |
Actual Hypothetical (5% annual return before expenses) | | | |
| $1,000.00 | $ 1,021.00 | $10.84 |
| $1,000.00 | $ 1,014.34 | $10.81 |
*Expenses are equal to the average account value over the period multiplied by the Fund’s annualized expense ratio, multiplied by the number of days in the most recent period divided by the number of days in the fiscal year (to reflect the initial period).
5. Information about Trustees and Officers
The business and affairs of the Fund and the Trust are managed under the direction of the Board of Trustees of the Trust. Information concerning the Trustees and officers of the Trust and Fund is set forth below. Generally, each Trustee and officer serves an indefinite term or until certain circumstances such as their resignation, death, or otherwise as specified in the Trust’s organizational documents. Any Trustee may be removed at a meeting of shareholders by a vote meeting the requirements of the Trust’s organizational documents. The Statement of Additional Information of the Fund includes additional information about the Trustees and officers and is available, without charge, upon request by calling the Fund toll-free at 1-800-773-3863. The address of each Trustee and officer, unless otherwise indicated below, is 116 South Franklin Street, Rocky Mount, North Carolina 27804. The Independent Trustees each received aggregate compensation of $2,000.00 during the fiscal year ended May 31, 2012 from the Fund for their services to the Fund and Trust.
FMX Total Return Fund
Additional Information (Unaudited)
Name, Age and Address | Position held with Funds or Trust | Length of Time Served | Principal Occupation During Past 5 Years | Number of Portfolios in Fund Complex Overseen by Trustee | Other Directorships Held by Trustee During Past 5 Years |
| Independent Trustees |
Jack E. Brinson Age: 80 | Trustee | Since 7/09 | Retired; previously, President of Brinson Investment Co. (personal investments) and President of Brinson Chevrolet, Inc. (auto dealership). | 10 | Independent Trustee of the following: DGHM Investment Trust for the two series of that trust; Gardner Lewis Investment Trust for the two series of that trust; Giordano Investment Trust for the one series of that trust; Hillman Capital Management Investment Trust for the two series of that trust; Brown Capital Management Mutual Funds for the three series of the trust; and Tilson Investment Trust for the two series of that trust; (all registered investment companies); previously, Independent Trustee of New Providence Investment Trust for its one series from inception until 2011 (all registered investment companies). |
Michael G. Mosley Age: 59 | Trustee | Since 7/10 | Owner of Commercial Realty Services (real estate) since 2004. | 10 | None |
Theo H. Pitt, Jr. Age: 76 | Trustee | Since 9/10 | Senior Partner, Community Financial Institutions Consulting (financial consulting) since 1999; Partner, Pikar Properties (real estate) since 2001; Account Administrator, Holden Wealth Management Group of Wachovia Securities (money management firm) from 2003-2008. | 10 | Independent Trustee of DGHM Investment Trust for its two series of that trust; Gardner Lewis Investment Trust for its two series of that trust and Hanna Investment Trust for its one series of that trust (all registered investment companies). Previously, Independent Trustee of Hillman Capital Management Investment Trust for its two series from 2000 to 2009, NCM Capital Investment Trust for its one series from 2007 to 2009, New Providence Investment Trust from 2008 to 2009, and Tilson Investment Trust for its two series from 2004 to 2009 (all registered investment companies). |
FMX Total Return Fund
Additional Information (Unaudited)
Name, Age and Address | Position held with Funds or Trust | Length of Time Served | Principal Occupation During Past 5 Years | Number of Portfolios in Fund Complex Overseen by Trustee | Other Directorships Held by Trustee During Past 5 Years |
James H. Speed, Jr. Age: 58 | Trustee, Chairman | Since 7/09 | President and CEO of NC Mutual Insurance Company (insurance company) since 2003; President of Speed Financial Group, Inc. (consulting and private investments) from 2000 to 2003. | 10 | Independent Trustee of the following Hillman Capital Management Investment Trust for the two series of that trust; Brown Capital Management Mutual Funds for the three series of the trust; and Tilson Investment Trust for the two series of that trust; (all registered investment companies). Member of Board of Directors of NC Mutual Life Insurance Company. Member of Board of Directors of M&F Bancorp. Previously, Independent Trustee of New Providence Investment Trust for its one series from 2009 until 2011 (registered investment company). |
J. Buckley Strandberg Age: 52 | Trustee | Since 7/09 | President of Standard Insurance and Realty (insurance and property management) since 1982. | 10 | None |
| Other Officers |
D. Jerry Murphey Age: 54 821 Pacific Street Omaha, Nebraska 68108 | President (FMX Funds) | Since 7/09 | Manager, President, and CEO of FolioMetrix, LLC (advisor to the FMX Funds) since 2009; principal of Uptrade Research Associates, LLC (investment research) since 2009; previously, Investment Management Consultant for Prudential Investments, Wealth Management Solutions (investment management). | n/a | n/a |
Julie M. Koethe Age: 31 821 Pacific Street Omaha, Nebraska 68108 | Treasurer (FMX Funds) | Since 4/10 | Chief Operating Officer of FolioMetrix, LLC (advisor to the FMX Funds) since 2010; Insurance Accounting Supervisor for Applied Underwriters (workers compensation and payroll service provider) from 2003-2010. | n/a | n/a |
T. Lee Hale, Jr. Age: 34 | Chief Compliance Officer; Assistant Treasurer | Since 7/09 and 4/10 | Financial Reporting Manager for The Nottingham Company (fund administrator) since 2009; previously, principal of Lee Hale Contracting (marine industry consulting). | n/a | n/a |
A. Vason Hamrick Age: 35 | Secretary | Since 7/09 | Corporate Counsel for The Nottingham Company since 2004. | n/a | n/a |
(Continued)
FMX Total Return Fund
is a series of| The Starboard Investment Trust |
| For Shareholder Service Inquiries: | For Investment Advisor Inquiries: |
| Nottingham Shareholder Services, LLC | FolioMetrix, LLC |
| 116 South Franklin Street | 821 Pacific Street |
Post Office Drawer 4365 Rocky Mount, North Carolina 27803 | Omaha, Nebraska 68108 |
| Toll-Free Telephone: | Toll-Free Telephone: |
| 1-800-773-3863 | 1-800-773-3863 |
World Wide Web @: ncfunds.com | World Wide Web @: foliometrix.com |
Annual Report 2012
May 31, 2012
Caritas All-Cap Growth Fund
This report and the financial statements contained herein are submitted for the general information of the shareholders of the Caritas All-Cap Growth Fund (the “Fund”). The Fund’s shares are not deposits or obligations of, or guaranteed by, any depository institution. The Fund’s shares are not insured by the FDIC, Federal Reserve Board or any other agency, and are subject to investment risks, including possible loss of principal amount invested. Neither the Fund nor the Fund’s distributor is a bank.
The Caritas All-Cap Growth Fund is distributed by Capital Investment Group, Inc., Member FINRA/SIPC, 17 Glenwood Ave, Raleigh, NC, 27603. There is no affiliation between the Caritas All-Cap Growth Fund, including its principals, and Capital Investment Group, Inc.
Statements in this Annual Report that reflect projections or expectations of future financial or economic performance of the Caritas All-Cap Growth Fund (“Fund”) and of the market in general and statements of the Fund’s plans and objectives for future operations are forward-looking statements. No assurance can be given that actual results or events will not differ materially from those projected, estimated, assumed or anticipated in any such forward-looking statements. Important factors that could result in such differences, in addition to the other factors noted with such forward-looking statements, include, without limitation, general economic conditions such as inflation, recession and interest rates. Past performance is not a guarantee of future results.
An investment in the Fund is subject to investment risks, including the possible loss of some or the entire principal amount invested. There can be no assurance that the Fund will be successful in meeting its investment objective. Investment in the Fund is also subject to the following risks: Market risk, portfolio turnover risk, investment advisor risk, new fund risk, short sales risk, small-cap and mid-cap securities risk, micro-cap securities risk, and risks related to investing in other investment companies. More information about these risks and other risks can be found in the Fund’s prospectus.
The performance information quoted in this annual report represents past performance, which is not a guarantee of future results. Investment return and principal value of an investment will fluctuate so that an investor’s shares, when redeemed, may be worth more or less than their original cost. Current performance may be lower or higher than the performance data quoted. An investor may obtain performance data current to the most recent month-end by visiting www.caritascapital.com.
An investor should consider the investment objectives, risks, and charges and expenses of the Fund carefully before investing. The prospectus contains this and other information about the Fund. A copy of the prospectus is available at www.ncfunds.com or by calling Shareholder Services at 1-800-773-3863. The prospectus should be read carefully before investing.
This Annual Report was first distributed to shareholders on or about July 30, 2012.
For More Information on Your Caritas All-Cap Growth Fund:
See Our Web site @ www.caritascapital.com
or
Call Our Shareholder Services Group Toll-Free at 1-800-773-3863.

5950 Fairview Road, Suite 610-A
Charlotte, NC 28210
(704) 553-8778 ~ Fax (704) 552-8757
Email: bfontana@caritascapital.com
www.caritascapital.com
June 5, 2012
Dear Fellow Shareholders of the Caritas All-Cap Growth Fund:
Enclosed for your review is the Annual Report for the Caritas All-Cap Growth Fund (the “Fund”) for the fiscal year ending May 31, 2012. The return for the Fund during this period was -6.55%. This compares to 0.56% for the Russell 3000 Growth Index and -0.41% for the S&P 500. Our goal each year is to deliver above market returns while taking on below market risk. We only achieved half of our goal over the past year. The Fund’s returns underperformed the market during the past year, in large part due to our focus on managing the risk of the portfolio given the increased volatility that global macroeconomic events caused in the markets. As a result, the Fund focused on preserving capital with less risk during much of the past year, and did not participate meaningfully in the periods when the market rallied. While we would have preferred to participate more in those market rallies, we remain comfortable with the performance, as it was the result of increased downside protection for our investors. We will continue to seek above market returns with below market risk for the Fund in the periods ahead.
| | Returns from July 1, 2011 - June 30, 2012 | Annualized Returns from December 31, 2009 -June 30, 2012 | Net Expense Ratio | Gross Expense Ratio |
| Caritas All-Cap Growth Fund (without load) | -3.92% | 8.20% | 2.15% | 3.81% |
| Caritas All-Cap Growth Fund (with load) | -9.45% | 5.67% | 2.15% | 3.81% |
| Russell 3000 Growth Index* | 5.05% | 11.82% | | |
| S&P 500 Index* | 5.45% | 10.61% | | |
The performance data quoted above represents past performance, which is not a guarantee of future results. Investment return and principal value of an investment in the Fund will fluctuate so that an investor's shares, when redeemed, may be worth more or less than their original cost. Current performance may be lower or higher than the performance data quoted. To obtain more current performance data regarding the Fund, including performance data current to the Fund’s most recent month-end, please visit www.ncfunds.com or call the Fund at (800)525-3863. Fee waivers and expenses reimbursements have positively impacted Fund performance.
*You cannot invest directly in this index. This index does not have an investment advisor and does not pay any commissions, expenses, or taxes. If this index did pay commissions, expenses, or taxes, its returns would be lower.
**The Advisor has entered into an Operating Plan with the Fund’s administrator, through December 1, 2012, under which it has agreed to assume certain fees of the administrator and Acquired Fund Fees and Expenses to the extent such fees and expenses cause the Total Annual Fund Operating Expenses to exceed 2.15% of the average daily net assets of the Fund. The Operating Plan may be terminated by either party at the conclusion of the then current term upon (i) written notice of non-renewal to the other party not less than sixty days prior to the end of the term, or (ii) mutual written agreement of the parties. The Advisor cannot recoup from the Fund any amounts paid by the Advisor to the Administrator under the Operating Plan.
***Gross expense ratio is from the Fund’s prospectus dated December 1, 2011.
As a reminder, while we use the Fund’s benchmark to provide an objective measure of the Fund’s performance, we do not manage the Fund to any specific benchmark. The investment strategy of the Fund incorporates elements that the major benchmarks simply do not capture (i.e. hedging, periods of high levels of cash, etc.). Our current investment philosophy is that we are in a multi-year period of returns for the equity markets that are below historical averages, and we will likely be in such a market for the next several years. As a result, we believe that the Fund should be managed in a way that is atypical from how mutual funds have traditionally been managed. Specifically, we believe that investors should have:
| · | Sensitivity to both growth characteristics and valuation levels for individual stocks. We seek to achieve this by focusing on a “growth at a reasonable price” (GARP) investment approach, where we look for companies across all market capitalizations with healthy growth prospects that we believe are not yet reflected in their stock prices; and |
| · | The ability to preserve capital in down market periods. We seek to achieve this by buying short Exchange Traded Funds (ETFs), which typically increase in value when the market declines. We are also willing to hold relatively high levels of cash (over 10%) if we do not find stocks that meet our investment criteria. In addition, we focus heavily on risk/reward characteristics of each stock, and seek to purchase stocks that we believe have limited downside compared to their upside potential. |
In our opinion, the equity markets thus far in 2012 remain concerned about two primary things: (a) global macroeconomic issues, most notably the impact of the European debt crisis; and (b) ongoing uncertainty and/or ineptitude coming out of Washington, D.C. Indeed, as we write this letter, the equity markets just experienced a notable decline in the second quarter on increased volatility, and investor sentiment has become increasingly cautious. While we acknowledge these concerns, we are unusually bullish on the equity markets for the remainder of the year. In our opinion, the markets are well aware of the European debt issues, and every day that goes by brings us that much closer to some type of resolution. It is our belief that the markets can adjust to whatever resolution emerges, be it positive or negative; what the market does not like is the uncertainty of Europe, so as that uncertainty is gradually removed, we expect that to be positive for the equity markets. In the US, the economy is progressing in spite of the ineptitude of our political leaders in Washington, D.C. Indeed, albeit less than we would prefer, the US economy is showing healthy growth, monthly job gains, and a stabilizing to declining unemployment rate. Further, the US manufacturing sector has shown an impressive resurgence, which we believe is here for the foreseeable future. Admittedly, the US will likely have election year rhetoric that may impact the markets, but that will be resolved in November. Accordingly, we believe that the two primary weights on the markets (Europe and Washington, D.C.) will likely be removed by the end of the year, paving the way for strong returns for stocks. Admittedly, given the volatility that will likely continue in the markets until such time, we believe it is appropriate for our Fund to seek to preserve capital through hedging tools and relatively high cash levels.
As for the Fund itself, the recent declines in the markets have significantly increased the number of stocks that meet our risk/reward investment criteria. That historically had boded well for the equity markets. Indeed, we have been increasing our market exposure by deploying our cash into these stocks during the recent market pullback. We will continue to use our hedging tools to help lessen the risk in the portfolio, and we will remain disciplined to our GARP investment philosophy with a focus on stocks that have attractive risk/reward characteristics. We believe that such discipline, in combination with the hedging and relatively high cash levels, should result in attractive returns for the Fund during this period of below historical average equity returns.
I invite any current or prospective shareholder to call or email me directly to discuss the Caritas All-Cap Growth Fund and our investment approach.
Very truly yours,
Bob Fontana, CFA
Caritas Capital, LLC
The views in the foregoing discussion were those of the Fund’s investment advisor as of the date set forth above and may not reflect its views on the date this Annual Report is first published or anytime thereafter. These views are intended to assist shareholders in understanding their investment in the Fund and do not constitute investment advice.
| Caritas All-Cap Growth Fund | | | | | | | | | | | | | |
| | | | | | | | | | | | | | | | | | | | |
| Performance Update | | | | | | | | | | | | | | |
| (Unaudited) | | | | | | | | | | | | | | |
| | | | | | | | | | | | | | | | | | | | |
| For the period from January 4, 2010 (Date of Initial Public Investment ) to May 31, 2012 | | |
| | | | | | | | | | | | | | | | | | | | |
| Comparison of the Change in Value of a $10,000 Investment | | | | | | | | |
| | | | | | | | | | | | | | | | | | | | |
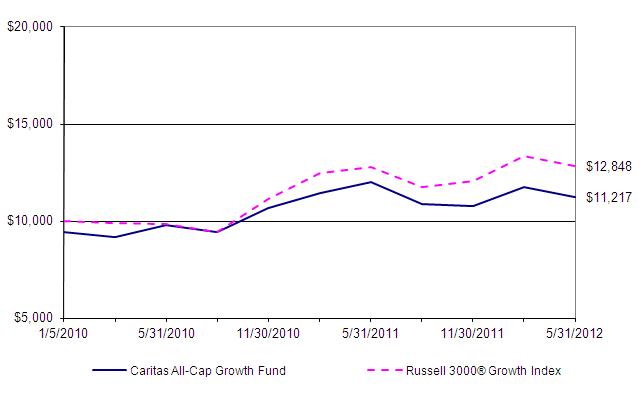 |
| | | | | | | | | | | | | | | | | | | | |
| This graph assumes an initial investment of $10,000 ($9,425 after maximum sales load of 5.75%) at January 4, 2010 (Date of Initial Public Investment ). All dividends and distributions are reinvested. This graph depicts the performance of the Caritas All-Cap Growth Fund versus the Russell 3000® Growth Index. It is important to note that the Fund is a professionally managed mutual fund while the indices are not available for investment and are unmanaged. The comparison is shown for illustrative purposes only. |
| | | | | | | | | | | | | | | | | | | | |
| | Average Annual Total Returns | | | | | | | | | | | | | |
| | | | | | | | | | | | | | | | | | Gross | | |
| | | As of | | | | | | | One | | Since | | Inception | | Expense | | |
| | | May 31, 2012 | | | | | | Year | | Inception | | Date | | Ratio* | | |
| | | Caritas All-Cap Growth Fund - No Sales Load | | | | -6.55% | | 7.47% | | 12/31/09 | | 3.81% | | |
| | | Caritas All-Cap Growth Fund - 5.75% Maximum Sales Load | -11.92% | | 4.87% | | 12/31/09 | | 3.81% | | |
| | | Russell 3000® Growth Index | | | | | 0.56% | | 10.93% | | N/A | | N/A | | |
| | | | | | | | | | | | | | | | | | | | |
| * The gross expense ratio shown is from the Fund's prospectus dated September 28, 2011. | | | | |
| | | | | | | | | | | | | | | | | | | | |
| Performance quoted above represents past performance, which is no guarantee of future results. Investment return and principal value will fluctuate so that shares, when redeemed, may be worth more or less than their original cost. Current performance may be lower or higher than the performance data quoted. An investor may obtain performance data, current to the most recent month-end, by visiting www.caritascapital.com. |
| | | | | | | | | | | | | | | | | | | | |
| The graph and table do not reflect the deduction of taxes that a shareholder would pay on Fund distributions or the redemption of Fund shares. Average annual total returns are historical in nature and measure net investment income and capital gain or loss from portfolio investments assuming reinvestments of distributions. |
| | | | | | | | | | | | | | | | | | | | |
| Caritas All-Cap Growth Fund | | | | | | |
| | | | | | | | | | |
| Schedule of Investments | | | | | | |
| | | | | | | | | | |
| | | | | | | | | | |
| As of May 31, 2012 | | | | | | | |
| | | | | | | | Shares | | Value (note 1) |
| | | | | | | | | | |
| COMMON STOCKS - 76.36% | | | | | | |
| | | | | | | | | | |
| | Consumer Discretionary - 13.35% | | | | | | |
| | * | Ascena Retail Group, Inc. | | | | 10,000 | $ | 189,300 |
| | | CBS Corp. | | | | | 9,350 | | 298,452 |
| | * | Coinstar, Inc. | | | | | 2,800 | | 172,004 |
| | * | Krispy Kreme Doughnuts, Inc. | | | | 30,000 | | 188,400 |
| | | Las Vegas Sands Corp. | | | | 3,900 | | 180,102 |
| | | | | | | | | | 1,028,258 |
| | Energy - 4.39% | | | | | | | |
| | * | Dresser-Rand Group, Inc. | | | | 3,750 | | 164,625 |
| | | Oceaneering International, Inc. | | | | 3,750 | | 173,400 |
| | | | | | | | | | 338,025 |
| | Health Care - 13.52% | | | | | | |
| | * | Alexion Pharmaceuticals, Inc. | | | | 2,500 | | 226,425 |
| | * | Align Technology, Inc. | | | | 6,100 | | 190,503 |
| | * | Hanger, Inc. | | | | | 7,500 | | 162,000 |
| | | Medicis Pharmaceutical Corp. Cl. A | | | 4,200 | | 151,704 |
| | * | Questcor Pharmaceuticals, Inc. | | | | 7,500 | | 310,500 |
| | | | | | | | | | 1,041,132 |
| | Industrials - 20.67% | | | | | | |
| | | Chicago Bridge & Iron Co. NV | | | | 5,300 | | 190,429 |
| | * | EnerSys | | | | | 6,600 | | 217,602 |
| | * | General Cable Corp. | | | | 5,750 | | 163,588 |
| | * | Hertz Global Holdings, Inc. | | | | 12,400 | | 168,764 |
| | * | Kirby Corp. | | | | | 2,750 | | 145,145 |
| | * | Quality Distribution, Inc. | | | | 14,000 | | 148,680 |
| | | Robbins & Myers, Inc. | | | | 3,875 | | 176,545 |
| | | Stanley Black & Decker, Inc. | | | | 2,400 | | 159,048 |
| | | Triumph Group, Inc. | | | | 3,700 | | 221,408 |
| | | | | | | | | | 1,591,209 |
| | Information Technology - 16.46% | | | | | | |
| | * | Cardtronics, Inc. | | | | 6,900 | | 193,338 |
| | * | Cirrus Logic, Inc. | | | | 8,200 | | 235,504 |
| | * | Datalink Corp. | | | | | 18,500 | | 183,520 |
| | * | eBay, Inc. | | | | | 4,900 | | 192,031 |
| | | Microsoft Corp. | | | | | 6,000 | | 175,140 |
| | * | Ultratech, Inc. | | | | | 9,500 | | 288,040 |
| | | | | | | | | | 1,267,573 |
| | Materials - 4.42% | | | | | | | |
| | | Agrium, Inc. | | | | | 2,400 | | 187,608 |
| | * | WR Grace & Co. | | | | 2,900 | | 152,395 |
| | | | | | | | | | 340,003 |
| | | | | | | | | | (Continued) |
| Caritas All-Cap Growth Fund | | | | | | |
| | | | | | | | | | |
| Schedule of Investments | | | | | | |
| | | | | | | | | | |
| | | | | | | | | | |
| As of May 31, 2012 | | | | | | | |
| | | | | | | | Shares | | Value (note 1) |
| | | | | | | | | | |
| COMMON STOCKS - (Continued) | | | | | | |
| | | | | | | | | | |
| | Telecommunication Services - 3.55% | | | | | |
| | | AT&T, Inc. | | | | | 8,000 | $ | 273,360 |
| | | | | | | | | | |
| | | Total Common Stocks (Cost $4,842,558) | | | | | 5,879,560 |
| | | | | | | | | | |
| EXCHANGE TRADED PRODUCTS - 10.00% | | | | | |
| | * | ProShares Short MidCap 400 | | | | 8,900 | | 255,791 |
| | * | ProShares Short Russell 2000 | | | | 9,000 | | 253,170 |
| | * | ProShares UltraShort S&P 500 | | | | 7,600 | | 129,960 |
| | * | ProShares UltraShort Technology | | | | 3,200 | | 131,424 |
| | | | | | | | | | |
| | | Total Exchange Traded Products (Cost $746,884) | | | | 770,345 |
| | | | | | | | | | |
| SHORT-TERM INVESTMENT - 11.77% | | | | | | |
| | § | Federated Treasury Obligations Fund, 0.01% | | | 905,995 | | 905,995 |
| | | | | | | | | | |
| | | Total Short-Term Investment (Cost $905,995) | | | | | 905,995 |
| | | | | | | | | | |
| TOTAL VALUE OF INVESTMENTS (Cost $6,495,437) - 98.13% | | | $ | 7,555,900 |
| | | | | | | | | | |
| OTHER ASSETS LESS LIABILITIES - 1.87% | | | | | 144,161 |
| | | | | | | | | | |
| NET ASSETS - 100.00% | | | | | $ | 7,700,061 |
| | | | | | | | | | |
| * | Non-income producing investment | | The following acronym is used in this portfolio: |
| § | Represents 7 day effective yield | | NV - Naamloze Vennootschap | | |
| | | | | | | | | | |
| | | | Summary of Investments by Sector | | | | |
| | | | | | % of Net | | | | |
| | | | Sector | | Assets | | Value | | |
| | | | Consumer Discretionary | 13.35% | | $ 1,028,258 | | |
| | | | Energy | | 4.39% | | 338,025 | | |
| | | | Health Care | | 13.52% | | 1,041,132 | | |
| | | | Industrials | | 20.67% | | 1,591,209 | | |
| | | | Information Technology | 16.46% | | 1,267,573 | | |
| | | | Materials | | 4.42% | | 340,003 | | |
| | | | Telecommunication Services | 3.55% | | 273,360 | | |
| | | | Exchange Traded Products | 10.00% | | 770,345 | | |
| | | | Short-Term Investment | 11.77% | | 905,995 | | |
| | | | Total | | 98.13% | | $ 7,555,900 | | |
| | | | | | | | | | |
| See Notes to Financial Statements | | | | | | |
| Caritas All-Cap Growth Fund | | |
| | | | |
| Statement of Assets and Liabilities | | |
| | | | |
| | | | |
| As of May 31, 2012 | | |
| | | | |
| ASSETS | | |
| | Investments, at value (cost $6,495,437) | $ | 7,555,900 |
| | | Receivables: | | |
| | | | Investments sold | | 291,832 |
| | | | Fund shares sold | | 27,404 |
| | | | Dividends and interest | | 3,160 |
| | | | | Total assets | | 7,878,296 |
| | | | |
| LIABILITIES | | |
| | Payables: | | |
| | | Investments purchased | | 155,577 |
| | | Distributions | | 1 |
| | Accrued expenses | | |
| | | | Administration fees | | 3,021 |
| | | | Advisory fees | | 8,256 |
| | | | Other expenses | | 11,380 |
| | | | Total liabilities | | 178,235 |
| | | |
| NET ASSETS | $ | 7,700,061 |
| | | | |
| Net Assets Consist of: | | |
| | Capital (par value and paid in surplus) | $ | 6,700,099 |
| | Distributable Income: | | |
| | Net investment loss | | - |
| | Net realized gain on investments | | (60,501) |
| | Net unrealized appreciation on investments | | 1,060,463 |
| | | Total Net Assets | $ | 7,700,061 |
| | | | |
| | Shares Outstanding, no par value (unlimited authorized shares) | | 662,910 |
| | | | |
| | Net Asset Value, Redemption Price Per Share | $ | 11.62 |
| | | | |
| | Net Asset Value, Maximum Offering Price Per Share ($11.62 ÷ 94.25%) | $ | 12.33 |
| | | | |
| (a) | The Fund charges a redemption fee of 2% of the amount redeemed on redemptions of fund shares occuring within 30 days following the issuance of such shares |
| | | | |
| | | | |
| | | | |
| | | | |
| | | | |
| | | | |
| | | | |
| | | | |
| | | | |
| | | | |
| See Notes to Financial Statements | | |
| Caritas All-Cap Growth Fund | | |
| | | | |
| Statement of Operations | | |
| | | | |
| | | | |
| For the fiscal year ended May 31, 2012 | | |
| | | | |
| INVESTMENT INCOME | | |
| | Dividends (net of withholding taxes of $286) | $ | 49,916 |
| | | Total Investment Income | | 49,916 |
| | | | |
| EXPENSES | | |
| | Advisory fees (note 2) | | 101,943 |
| | Administration fees (note 2) | | 35,767 |
| | Transfer agent fees (note 2) | | 11,009 |
| | Fund accounting fees (note 2) | | 13,912 |
| | Compliance service fees (note 2) | | 5,156 |
| | Custody fees (note 2) | | 1,433 |
| | Distribution and service fees (note 3) | | 20,389 |
| | Registration and filing administration fees (note 2) | | 752 |
| | Legal fees | | 2,628 |
| | Audit and tax preparation fees | | 6,601 |
| | Registration and filing expenses | | 5,977 |
| | Trustee fees and meeting expenses | | 4,000 |
| | Securities pricing fees | | 2,602 |
| | Other operating expenses | | 7,168 |
| | | Gross Expenses | | 219,337 |
| | | | |
| | Expenses reimbursed by advisor (note 2) | | (13,001) |
| | Advisory fees waived (note 2) | | (47,314) |
| | | Net Expenses | | 159,022 |
| | | | |
| NET INVESTMENT LOSS | | (109,106) |
| | | | |
| REALIZED AND UNREALIZED LOSS ON INVESTMENTS | | |
| | | | |
| | Net realized gain from: | | |
| | | Investments | | 32,459 |
| | | | 32,459 |
| | Change in unrealized depreciation on: | | |
| | | Investments | | (535,344) |
| | | | (535,344) |
| | | | |
| NET REALIZED AND UNREALIZED LOSS ON INVESTMENTS | | (502,885) |
| | | | |
| NET DECREASE IN NET ASSETS RESULTING FROM OPERATIONS | $ | (611,991) |
| | | | |
| | | | |
| | | | |
| | | | |
| | | | |
| | | | |
| See Notes to Financial Statements | | |
| Caritas All-Cap Growth Fund | | | | | | | |
| | | | | | | | | | |
| Statements of Changes in Net Assets | | | | | | | |
| | | | | | | | | | |
| | | | | | | Year Ended | | Year Ended | |
| | | | | | | May 31, 2012 | | May 31, 2011 | |
| | | | | | | | | | |
| OPERATIONS: | | | | | | | |
| | Net investment loss | | | $ | (109,106) | $ | (75,531) | |
| | Net realized gain from investment transactions | | | 32,459 | | 159,288 | |
| | Change in unrealized appreciation (depreciation) on investments | | (535,344) | | 1,346,135 | |
| | | Net (decrease) increase in net assets resulting from operations | | (611,991) | | 1,429,892 | |
| | | | | | | | | |
| DISTRIBUTIONS TO SHAREHOLDERS: | | | | | | | |
| | Net realized gain from investment transactions | | | (163,043) | | (19,891) | |
| | | Decrease in net assets resulting from distributions | | | (163,043) | | (19,891) | |
| | | | | | | | | | |
| CAPITAL SHARE TRANSACTIONS: | | | | | | | |
| | Shares sold | | | | 1,866,032 | | 3,118,853 | |
| | Reinvested dividends and distributions | | | | 49,262 | | 5,628 | |
| | Shares redeemed | | | | (2,170,283) | | (668,356) | |
| | Net (decrease) increase from capital share transactions | | | (254,989) | | 2,456,125 | |
| | | | | | | | | | |
| | | Net (decrease) increase in net assets | | | (1,030,023) | | 3,866,126 | |
| | | | | | | | | | |
| NET ASSETS: | | | | | | | |
| | Beginning of year | | | | 8,730,084 | | 4,863,958 | |
| | End of year | | | $ | 7,700,061 | $ | 8,730,084 | |
| | | | | | | | | | |
| Net investment loss | | | $ | - | $ | - | |
| | | | | | | | | | |
| TRANSACTIONS IN SHARES: | | | | | | | |
| | Shares sold | | | | 155,983 | | 274,596 | |
| | Reinvested dividends and distributions | | | | 4,587 | | 473 | |
| | Shares redeemed | | | | (185,113) | | (54,884) | |
| | | Net (decrease) increase | | | | (24,543) | | 220,185 | |
| |
| |
| |
| |
| |
| |
| |
| |
| |
| |
| |
| |
| |
| | | | | | | | |
| See Notes to Financial Statements | | | | | | | |
| Caritas All-Cap Growth Fund | | | | | | | | |
| | | | | | | | | | | | | |
| Financial Highlights | | | | | | | | |
| | | | | | | | | | | | | |
| | | | | | | For the Years Ended May 31, | | |
| For a share outstanding throughout each period | | 2012 | | 2011 | | 2010 (f) | | |
| | | | | | | | | | | | | |
| Net asset value, beginning of period | $ | 12.70 | $ | 10.41 | $ | 10.00 | | |
| | | | | | | | | | | | | |
| Income (loss) from investment operations | | | | | | | | |
| | Net investment income (loss) | | (0.16) | | (0.11) | | (0.04) | | |
| | Net realized and unrealized gains | | | | | | | | |
| | | (losses) on securities | | (0.68) | | 2.43 | | 0.45 | | |
| Total from investment operations | | (0.84) | | 2.32 | | 0.41 | | |
| | | | | | | | | | | | | |
| Less distributions: | | | | | | | | |
| | From net realized gains | | (0.24) | | (0.03) | | - | | |
| Total distributions | | (0.24) | | (0.03) | | - | | |
| | | | | | | | | | | | | |
| Paid in capital | | | | | | | | | |
| | From redemption fees | | - | | 0.00 | (a) | 0.00 | | (a) |
| Total paid in capital | | - | | 0.00 | | 0.00 | | |
| | | | | | | | | | | | | |
| Net asset value, end of period | $ | 11.62 | $ | 12.70 | $ | 10.41 | | |
| | | | | | | | | | | | | |
| Total Return (c)(d) | | (6.47) | % | 22.34 | % | 4.10 | % | |
| | | | | | | | | | | | | |
| Net assets, end of period (000's) | $ | 7,700 | $ | 8,730 | $ | 4,864 | | |
| | | | | | | | | | | | | |
| Ratios of: | | | | | | | | | | |
| Gross expenses to average net assets (e) | | 2.69 | % | 3.61 | % | 5.56 | % | (b) |
| Net expenses to average net assets (e) | | 1.95 | % | 1.96 | % | 1.91 | % | (b) |
| Net investment income/(loss) | | | | | | | | |
| | to average net assets | | (1.34) | % | (1.11) | % | (1.31) | % | (b) |
| | | | | | | | | | | | | |
| Portfolio turnover rate | | 87.49 | % | 126.59 | % | 50.48 | % | |
| | | | | | | | | | | | | |
| | | | | | | | | | | | | |
| | | | | | | | | | | | | |
| (a) | Actual amount is less than $0.01 per share. | | | | | | | | |
| (b) | Annualized. | | | | | | | | | |
| (c) | Total return does not reflect sales charge, if any. | | | | | | |
| (d) | Includes adjustments in accordance with accounting principles generally accepted in the United States and, consequently, the net asset value for financial reporting purposes and the returns based upon those net asset values may differ from the net asset values and returns for shareholder transactions. |
| (e) | The expense ratios listed reflect total expenses prior to any waivers and reimbursements (gross expense ratio) and after any waivers and reimbursements (net expense ratio). |
| (f) | For the time period from January 4, 2010 (Date of Initial Public Investment) to May 31, 2010. | | |
| | | | | | | | | | | | | |
| | | | | | | | | | | | | |
| | | | | | | | | | �� | | | |
| | | | | | | | | | | | | |
| See Notes to Financial Statements | | | | | | | | |
Caritas All-Cap Growth Fund
Notes to Financial Statements
1. Organization and Significant Accounting Policies
The Caritas All-Cap Growth Fund (“Fund”) is a series of the Starboard Investment Trust (“Trust”). The Trust is organized as a Delaware statutory trust and is registered under the Investment Company Act of 1940, as amended (the “1940 Act”), as an open-end management investment company. The Fund is a separate diversified series of the Trust.
The Fund commenced operations on January 4, 2010. The investment objective of the Fund is to seek capital appreciation. In order to achieve its investment objective, Caritas Capital, LLC (“Advisor”) will seek to invest primarily in a portfolio of common stocks of companies that the Advisor believes have above-average future growth potential relative to their peers. The Advisor also anticipates hedging the Fund’s long positions in equity securities through investments in “short” exchange traded funds (“ETF’s”). A “short” ETF is an investment that seeks to track the opposite of the performance of an index by holding in its portfolio short positions in either the contents of the index or a representative sample of the securities in the index.
The Fund invests in companies of all sizes traded on any United States stock exchange or over-the-counter market (“Universe”). The Universe is not limited by market capitalization or industry segmentation, and may include large-, mid-, small- and micro- cap companies. The Advisor generally selects common stocks based on fundamental, bottom up research. Other factors that influence investment decisions include economic and technical analysis. The Fund will generally hold each of its equity positions from one to three years. The Advisor, may, however, trade the Fund’s portfolio more actively if market conditions warrant.
The following is a summary of significant accounting policies consistently followed by the Fund. The policies are in conformity with accounting principles generally accepted in the United States of America. In June 2009, the Financial Accounting Standards Board (“FASB”) codified its standards and accounting principles for the financial statements issued for years ending after September 15, 2009. Herein, the Fund will make reference to accounting principles generally accepted in the United States issued by FASB as Accounting Standards Codification (“ASC”).
Investment Valuation
The Fund’s investments in securities are carried at fair value. Securities listed on an exchange or quoted on a national market system are valued at the last sales price as of 4:00 p.m. Eastern Time. Securities traded in the NASDAQ over-the-counter market are generally valued at the NASDAQ Official Closing Price. Other securities traded in the over-the-counter market and listed securities for which no sale was reported on that date are valued at the most recent bid price. Securities and assets for which representative market quotations are not readily available (e.g., if the exchange on which the portfolio security is principally traded closes early or if trading of the particular portfolio security is halted during the day and does not resume prior to the Fund’s net asset value calculation) or which cannot be accurately valued using the Fund’s normal pricing procedures are valued at fair value as determined in good faith under policies approved by the Trustees. A portfolio security’s “fair value” price may differ from the price next available for that portfolio security using the Fund’s normal pricing procedures. Instruments with maturities of 60 days or less are valued at amortized cost, which approximates market value.
Fair Value Measurement
Various inputs are used in determining the value of the Fund's investments. These inputs are summarized in the three broad levels listed below:
Level 1: quoted prices in active markets for identical securities
Level 2: other significant observable inputs (including quoted prices for similar securities and identical securities in inactive markets, interest rates, credit risk, etc.)
Level 3: significant unobservable inputs (including the Fund’s own assumptions in determining fair value of investments)
The availability of observable inputs can vary from security to security and is affected by a wide variety of factors, including, for example, the type of security, whether the security is new and not yet established in the marketplace, the liquidity of markets, and other characteristics particular to the security. To the extent that valuation is based on models or inputs that are less observable or unobservable in the market, the determination of fair value requires more judgment. Accordingly, the degree of judgment exercised in determining fair value is greatest for instruments categorized in Level 3.
Caritas All-Cap Growth Fund
Notes to Financial Statements
The inputs used to measure fair value may fall into different levels of the fair value hierarchy. In such cases, for disclosure purposes, the level in the fair value hierarchy within which the fair value measurement falls in its entirety, is determined based on the lowest level input that is significant to the fair value measurement in its entirety.
An Investment asset’s or liability’s level within the fair value hierarchy is based on the lowest level input, individually or in aggregate, that is significant to fair value measurement.
The valuation techniques used by the Fund to measure fair value during the fiscal year ended May 31, 2011 maximized the use of observable inputs and minimized the use of unobservable inputs.
The inputs or methodology used for valuing securities are not necessarily an indication of the risk associated with investing in those securities. The following table summarizes the inputs as of May 31, 2012 for the Fund’s assets measured at fair value:
| Assets | | Total | | Level 1 | | Level 2 | | Level 3 |
| Common Stocks | $ | 5,879,560 | $ | 5,879,560 | $ | - | $ | - |
| Exchange Traded Products | | 770,345 | | 770,345 | | - | | - |
| Short-Term Investment | | 905,995 | | 905,995 | | - | | - |
| Total | $ | 7,555,900 | $ | 7,555,900 | $ | - | $ | - |
Investment Transactions and Investment Income
Investment transactions are accounted for as of the date purchased or sold (trade date). Dividend income is recorded on the ex-dividend date. Certain dividends from foreign securities will be recorded as soon as the Fund is informed of the dividend if such information is obtained subsequent to the ex-dividend date. Interest income is recorded on the accrual basis and includes amortization of discounts and premiums. Gains and losses are determined on the identified cost basis, which is the same basis used for federal income tax purposes.
Expenses
The Fund bears expenses incurred specifically on its behalf as well as a portion of general expenses, which are allocated according to methods reviewed annually by the Trustees.
Dividend Distributions
The Fund may declare and distribute dividends from net investment income (if any) quarterly. Distributions from capital gains (if any) are generally declared and distributed annually. Dividends and distributions to shareholders are recorded on ex-date.
Estimates
The preparation of financial statements in conformity with accounting principles generally accepted in the United States of America requires management to make estimates and assumptions that affect the reported amounts of assets and liabilities and disclosure of contingent assets and liabilities at the date of the financial statements and the reported amounts of increases and decreases in the net assets from operations during the reported period. Actual results could differ from those estimates.
Federal Income Taxes
No provision for income taxes is included in the accompanying financial statements, as the Fund intends to distribute to shareholders all taxable investment income and realized gains and otherwise comply with Subchapter M of the Internal Revenue Code applicable to regulated investment companies.
Caritas All-Cap Growth Fund
Notes to Financial Statements
| 2. | Transactions with Affiliates & Service Providers |
Advisor
The Fund pays a monthly advisory fee to Caritas Capital, LLC (the “Advisor”) based upon the average daily net assets of the Fund and calculated at an annual rate. For the fiscal year ended May 31, 2012, the Fund paid advisory fees in the amount of $101,943.
Effective October 27, 2011, the Advisor has entered into an Operating Plan with the Fund’s administrator under which it has agreed to make payments to the administrator to the extent that the cost of administering the Fund exceeds the 0.45% of average daily net assets paid by the Funds to the Administrator under its consolidated fee arrangement. The agreement continues in effect until October 31, 2012 and may not be terminated prior to that date.
During the fiscal year ended May 31, 2012, the Advisor contractually agreed to waive all or part of its advisory fee and to reimburse expenses to ensure that the Fund’s annual operating expenses (exclusive of interest, taxes, brokerage fees and commissions, extraordinary expenses, payments under the Rule
12b-1 distribution plan, and acquire fund fees and expenses) will not exceed 1.70% of the daily average net assets for Fund shares. In accordance with these terms, the Advisor waived $47,314 and reimbursed $13,001 for the fiscal year ended May 31, 2012.
Administrator
Under the terms of an Administration Agreement with the Trust, effective October 27, 2011, The Nottingham Company (“Administrator”) assists the Trust in the performance of its administrative responsibilities to the Fund, coordinates and pays for the services of each vendor and the operating expenses to the Fund, and provides the Fund with certain administrative, fund accounting, and compliance services. As part of its services and consolidated fee arrangement, the Administrator receives compensation based on the Fund’s average daily net assets. The annual rate is 0.450% if the average daily net assets are under $40 million and gradually decreases to an annual rate of 0.094% once the average daily net assets reach $1.82 billion or more.
The fee paid to the Administrator is calculated by multiplying the average daily net assets of the Fund by the highest applicable annual rate. The Administrator pays all expenses not assumed by the Advisor, including, without limitation: the fees and expenses of its independent accountants, of its legal counsel, and of its Trustees; the costs of printing and mailing to shareholders annual and semi-annual reports, proxy statements, prospectuses, statements of additional information and supplements thereto; the costs of printing registration statements; bank transaction charges and custodian’s fees; any proxy solicitors’ fees and expenses; filing fees; any federal, state or local income or other taxes; any interest; any membership fees of the Investment Company Institute and similar organizations; fidelity bond and Trustees’ liability insurance premiums.
Prior to October 27, 2011, the Fund paid a monthly administration fee to the Administrator based upon the average daily net assets of the Fund and calculated at the annual rates as shown in the schedule below which is subject to a minimum of $2,000 per month. The Administrator also received a fee to procure and pay the Fund’s custodian, additional compensation for fund accounting and recordkeeping services, and additional compensation for certain costs involved with the daily valuation of securities and as reimbursement for out-of-pocket expenses. A breakdown of these fees is provided below.
| Administration Fees* | Custody Fees* | Fund Accounting Fees (monthly) | Fund Accounting Fees | Blue Sky Administration Fees (annual) |
Average Net Assets | Annual Rate | Average Net Assets | Annual Rate |
| First $40 million | 0.450% | First $100 million | 0.020% | $2,250 | 0.01% | $150 per state |
| Next $1 million | 0.442% | Over $100 million | 0.009% | | | |
| Next $1 million | 0.435% | | | | | |
| Next $1 million | 0.428% | *Minimum monthly fees of $3,000 and $417 for Administration and Custody, respectively. |
| Next $1 million | 0.422% |
Caritas All-Cap Growth Fund
Notes to Financial Statements
Compliance Services
Nottingham Compliance Services, LLC (“NCS”), a fully owned affiliate of the Administrator, provides services which assist the Trust’s Chief Compliance Officer in monitoring and testing the policies and procedures of the Trust in conjunction with requirements under Rule 38a-1 of the 1940 Act. NCS is entitled to receive compensation from the Administrator pursuant to the Administrator’s fee arrangements with the Fund.
Transfer Agent
Nottingham Shareholder Services, LLC (“Transfer Agent”) serves as transfer, dividend paying, and shareholder servicing agent for the Funds. For its services, the Transfer Agent is entitled to receive compensation from the Administrator pursuant to the Administrator’s fee arrangements with the Fund.
Distributor
Capital Investment Group, Inc. (the “Distributor”) serves as the Funds’ principal underwriter and distributor. For its services, the Distributor is entitled to receive compensation from the Administrator pursuant to the Administrator’s fee arrangements with the Fund.
Certain Trustees and officers of the Trust may also be officers of the Advisor, the Distributor, the Administrator, or NCS.
| 3. | Distribution and Service Fees |
The Trustees, including a majority of the Trustees who are not “interested persons” of the Trust as defined in the 1940 Act and who have no direct or indirect financial interest in such plan or in any agreement related to such plan, adopted a distribution plan pursuant to Rule 12b-1 of the 1940 Act (the “Plan”). The 1940 Act regulates the manner in which a regulated investment company may assume expenses of distributing and promoting the sales of its shares and servicing of its shareholder accounts. The Plan provides that the Fund may incur certain expenses, which may not exceed 0.25% per annum of the Fund’s average daily net assets for each year elapsed subsequent to adoption of the Plan, for payment to the Distributor and others for items such as advertising expenses, selling expenses, commissions, travel or other expenses reasonably intended to result in sales of shares of the Fund or support servicing of shareholder accounts. For the fiscal year ended May 31, 2012, $20,389 was incurred by the Distributor.
| 4. | Purchases and Sales of Investment Securities |
For the fiscal year ended May 31, 2012, the aggregate cost of purchases and proceeds from sales of investment securities (excluding short-term securities) were as follows:
| Fiscal Year Ended | Purchases of Securities | Proceeds from Sales of Securities |
| May 31, 2012 | $6,369,111 | $6,509,422 |
There were no long-term purchases or sales of U.S Government Obligations during the fiscal year ended May 31, 2012.
Distributions are determined in accordance with Federal income tax regulations, which differ from generally accepted accounting principles, and, therefore, may differ significantly in amount or character from net investment income and realized gains for financial reporting purposes. Financial reporting records are adjusted for permanent book/tax differences to reflect tax character but are not adjusted for temporary differences. For the year ended May 31, 2012, the tax treatment for the distributions was the same as the book.
Management has analyzed the Fund’s tax positions for all open tax years (current and prior three tax years, if applicable) and determined that the implementation of ASC Topic 740 “Accounting for Uncertainty in Income Taxes” had no impact on the Fund’s net assets or results of operations. As of and during the fiscal year ended May 31, 2012, the Fund does not have a liability for uncertain tax positions. The Fund recognizes interest and penalties, if any, related to unrecognized tax benefits as income tax expense in the statement of operations. During the fiscal year, the Fund did not incur any interest or penalties.
Caritas All-Cap Growth Fund
Notes to Financial Statements
Reclassifications to paid-in capital relate primarily to differing book/tax treatment of ordinary net investment losses. For the fiscal year ended May 31, 2012, the following reclassifications, which had no impact on results of operations or net assets, were recorded to reflect tax character:
Paid-in Capital | $(49,779) |
| Undistributed Net Investment Income (Loss) | | 109,106 |
| Undistributed Net Realized Gain (Loss) on Investments | | (59,327) |
At May 31, 2012, the tax-basis cost of investments and components of distributable earnings were as follows:
| Cost of Investments | | $ 6,495,436 |
| | | |
| Unrealized Appreciation | | $1,217,831 |
| Unrealized Depreciation | | (157,367) |
| Net Unrealized Appreciation | | 1,060,464 |
| Undistributed Ordinary Income | | - |
| Other Book/Tax Differences | | (60,502) |
| | | |
| Distributable Earnings | | $ 999,962 |
| | | | | | |
Pursuant to federal income tax regulations applicable to investment companies, recognition of capital losses on certain transactions is deferred until the subsequent tax year. Consequently, realized losses reflected in the accompanying financial statements include net capital losses realized between November 1 and the funds fiscal year-end that have not been recognized for tax purposes. Other book/tax differences in the current year primarily consist of post-October loss deferrals.
For the fiscal year ended May 31, 2011, reclassifications to paid-in capital relating primarily to differing book/tax treatment of ordinary net investment losses were not reflected properly in the 2011 Annual Report. Below reflects what was originally reported and the restated amounts:
Paid-in Capital | Original | Restated |
| | | $ (79,287) | $ (45,653) |
| Undistributed Net Investment Income (Loss) | | 55,640 | 75,531 |
| Undistributed Net Realized Gain (Loss) on Investments | | 23,647 | (29,878) |
These reclassifications had no impact on results of operations or net assets and were recorded to reflect tax character.
| 6. | Commitments and Contingencies |
Under the Trust’s organizational documents, its officers and Trustees are indemnified against certain liabilities arising out of the performance of their duties to the Fund. In addition, in the normal course of business, the Trust entered into contracts with its service providers, on behalf of the Fund, and others that provide for general indemnifications. The Fund’s maximum exposure under these arrangements is unknown, as this would involve future claims that may be made against the Fund. The Fund expects risk of loss to be remote.
Caritas All-Cap Growth Fund
Notes to Financial Statements
| 7. | New Accounting Pronouncements |
In May 2011, the FASB issued ASU No. 2011-04 “Amendments to Achieve Common Fair Value Measurement and Disclosure Requirements.” ASU No. 2011-04 amends FASB ASC Topic 820, Fair Value Measurements and Disclosures, to establish common requirements for measuring fair value and for disclosing information about fair value measurements in accordance with GAAP and International Financial Reporting Standards (“IFRS”). ASU No. 2011-04 is effective for fiscal years beginning after December 15, 2011 and for interim periods within those fiscal years.
8. Subsequent Events
In accordance with the adoption of ASC Topic 855, Subsequent Events, and in preparing these financial statements, the Fund has evaluated the need for disclosures and/or adjustments resulting from subsequent events through the date of issuance of these financial statements. This evaluation did not result in any subsequent events that necessitated disclosures and/or adjustments.
REPORT OF INDEPENDENT REGISTERED PUBLIC ACCOUNTING FIRM
To the Shareholders, Trustees and
Audit Committee of Caritas All-Cap Growth Fund
We have audited the accompanying statement of assets and liabilities of the Caritas All-Cap Growth Fund (the “Fund”, one of the series constituting the Starboard Investment Trust), including the schedule of investments as of May 31, 2012, and the related statement of operations for the year then ended, the statements of changes in net assets for each of the two years in the period then ended, and the financial highlights for the years ended May 31, 2012, May 31, 2011 and the period from January 4, 2010 (Date of Initial Public Investments) to May 31, 2010. These financial statements and financial highlights are the responsibility of the Fund’s management. Our responsibility is to express an opinion on these financial statements and financial highlights based on our audits.
We conducted our audits in accordance with the standards of the Public Company Accounting Oversight Board (United States). Those standards require that we plan and perform the audit to obtain reasonable assurance about whether the financial statements and financial highlights are free of material misstatement. The Fund is not required to have, nor were we engaged to perform, an audit of its internal control over financial reporting. Our audits included consideration of internal control over financial reporting as a basis for designing audit procedures that are appropriate in the circumstances, but not for the purpose of expressing an opinion on the effectiveness of the Fund’s internal control over financial reporting. Accordingly, we express no such opinion. An audit also includes examining, on a test basis, evidence supporting the amounts and disclosures in the financial statements, assessing the accounting principles used and significant estimates made by management, as well as evaluating the overall financial statement presentation. Our procedures included confirmation of the securities owned as of May 31, 2012, by correspondence with the custodian and brokers. We believe that our audits provide a reasonable basis for our opinion.
In our opinion, the financial statements and financial highlights referred to above present fairly, in all material respects, the financial position of Caritas All-Cap Growth Fund as of May 31, 2012, and the results of its operations for the year then ended, the changes in net assets for each of the two years in the period then ended, and the financial highlights for the years ended May 31, 2012, May 31, 2011 and the period from January 4, 2010 (Date of Initial Public Investments) to May 31, 2010 in conformity with accounting principles generally accepted in the United States of America.

| Chicago, Illinois |
| | |
| July 26, 2012 | |
Caritas All-Cap Growth Fund
Additional Information (Unaudited)
| 1. | Proxy Voting Policies and Voting Record |
A copy of the Trust’s Proxy Voting and Disclosure Policy and the Advisor’s Disclosure Policy are included as Appendix B to the Fund’s Statement of Additional Information and are available, without charge, upon request, by calling 1-800-773-3863, and on the website of the Security and Exchange Commission (“SEC”) at http://www.sec.gov. Information regarding how the Fund voted proxies relating to portfolio securities during the most recent period ended June 30, is available (1) without charge, upon request, by calling the Fund at the number above and (2) on the SEC’s website at http://www.sec.gov.
| 2. | Quarterly Portfolio Holdings |
The Fund files its complete schedule of portfolio holdings with the SEC for the first and third quarters of each fiscal year on Form N-Q. The Fund’s Forms N-Q are available on the SEC’s website at http://www.sec.gov. You may review and make copies at the SEC’s Public Reference Room in Washington, D.C. Information on the operation of the Public Reference Room may be obtained by calling the SEC at 202-942-8090. You may also obtain copies without charge, upon request, by calling the Fund toll-free at 1-800-773-3863.
We are required to advise you within 60 days of the Fund’s fiscal year-end regarding the federal tax status of certain distributions received by shareholders during each fiscal year. The following information is provided for the Fund’s fiscal year ended May 31, 2012.
During the fiscal year, the fund paid a long-term capital gain distribution in the amount of $163,043.
Individual shareholders are eligible for reduced tax rates on qualified dividend income. For the purposes of computing the dividends eligible for reduced tax rates, all of the dividends paid by the funds from ordinary income earned during the fiscal year are considered qualified dividend income.
Corporate shareholders may exclude up to 70% of qualifying dividends. For the purposes of computing this exclusion, all of the dividends paid by the fund from ordinary income earned during the fiscal year represent qualifying dividends.
Dividend and distributions received by retirement plans such as IRAs, Keogh-type plans and 403(b) plans need not be reported as taxable income. However, many retirement plans may need this information for their annual information meeting.
| 4. | Schedule of Shareholder Expenses |
As a shareholder of the Fund, you incur two types of costs: (1) transaction costs, which may include sales charges (loads) on purchase payments and (2) ongoing costs, including investment advisory fees; distribution (12b-1) fees; and other Fund expenses. This example is intended to help you understand your ongoing costs (in dollars) of investing in the Fund and to compare these costs with the ongoing costs of investing in other mutual funds. The example is based on an investment of $1,000 invested at the beginning of the period and held for the entire period as indicated below.
Actual Expenses – The first line of the table below provides information about the actual account values and actual expenses. You may use the information in this line, together with the amount you invested, to estimate the expenses that you paid over the period. Simply divide your account value by $1,000 (for example, an $8,600 account value divided by $1,000 = 8.6), then multiply the result by the number in the first line under the heading entitled “Expenses Paid During Period” to estimate the expenses you paid on your account during this period.
Hypothetical Example for Comparison Purposes – The last line of the table below provides information about hypothetical account values and hypothetical expenses based on the Fund’s actual expense ratio and an assumed annual rate of return of 5% before expenses, which is not the Fund’s actual return. The hypothetical account values and expenses may not be used to estimate the actual ending account balance or expenses you paid for the period. You may use this information to compare the ongoing costs of investing in the Fund and other funds by comparing this 5% hypothetical example with the 5% hypothetical examples that appear in the shareholder reports of other funds.
| Expense Example | Beginning Account Value December 1, 2011 | Ending Account Value May 31, 2012 | Expenses Paid During Period* |
| Actual | $1,000.00 | $1,041.90 | $9.95 |
| Hypothetical (5% annual return before expenses) | $1,000.00 | $1,015.25 | $9.82 |
Expenses are equal to the average account value over the period multiplied by the Fund’s annualized expense ratio, multiplied by the number of days in the most recent period divided by the number of days in the fiscal year.
| 5. | Approval of Advisory Agreement |
The Advisor supervises the investments of the Fund pursuant to an Investment Advisory Agreement. At a meeting of the Fund’s Board of Trustees on January 26, 2012, the Trustees unanimously approved the renewal of the Investment Advisory Agreement for another year. In considering whether to approve the renewal of the Investment Advisory Agreement, the Trustees reviewed and considered the information they deemed reasonably necessary, including the following material factors: (i) the nature, extent, and quality of the services provided by the Advisor; (ii) the investment performance of the Fund and the Advisor; (iii) the costs of the services provided and profits realized by the Advisor and its affiliates from the relationship with the Fund; (iv) the extent to which economies of scale would be realized as the Fund grows and whether advisory fee levels reflect those economies of scale for the benefit of the Fund’s investors; (v) the Advisor’s practices regarding brokerage and portfolio transactions; and (vi) the Advisor’s practices regarding possible conflicts of interest.
At the meeting, the Trustees reviewed various informational materials including, without limitation, the Investment Advisory Agreement for the Fund; a memorandum from the Advisor to the Trustees containing information about the Advisor, its business, its finances, its personnel, its services to the Fund, and comparative expense information for other mutual funds with a strategy similar to the Fund; and a memorandum from the Fund’s legal counsel that summarized the fiduciary duties and responsibilities of the Board of Trustees in reviewing and approving the Investment Advisory Agreement, including the types of information and factors that should be considered in order to make an informed decision.
In considering the nature, extent, and quality of the services provided by the Advisor, the Trustees reviewed the responsibilities of the Advisor under the Investment Advisory Agreement. The Trustees reviewed the services being provided by the Advisor to the Fund including, without limitation, the quality of its investment advisory services since the Fund’s inception (including research and recommendations with respect to portfolio securities); its procedures for formulating investment recommendations and assuring compliance with the Fund’s investment objectives and limitations; its coordination of services for the Fund among the Fund’s service providers; and its efforts to promote the Fund, grow the Fund’s assets, and assist in the distribution of Fund shares. The Trustees noted that the Advisor uses fundamental, bottom up research and seeks to achieve the Fund’s investment objective by investing in common stocks of companies of all sizes that it believes have above-average future growth potential relative to their peers. The Trustees further noted that the principal executive and financial officer of the Fund was an employee of the Advisor and serves without additional compensation from the Fund. After reviewing the foregoing information and further information in the memorandum from the Advisor (e.g., descriptions of the Advisor’s business, the Advisor’s compliance programs, and the Advisor’s Form ADV), the Board of Trustees concluded that the nature, extent, and quality of the services provided by the Advisor were satisfactory and adequate for the Fund.
In considering the investment performance of the Fund and the Advisor, the Trustees compared the performance of the Fund with the performance of its benchmark index, comparable funds with similar objectives managed by other investment advisors, and applicable peer group data (e.g., Bloomberg peer group average). The Trustees noted that the return for the one-year period ended December 31, 2011 was -5.45%, which lagged the returns of most of the comparable funds, the peer group average, and the benchmark index. The Trustees also considered the consistency of the Advisor’s management of the
Fund with its investment objective and policies. After reviewing the short and long-term investment performance of the Fund, the Advisor’s experience managing the Fund and other advisory accounts, the Advisor’s historical investment performance, and other factors, the Board of Trustees concluded that the investment performance of the Fund and the Advisor was satisfactory.
In considering the costs of the services to be provided and profits to be realized by the Advisor and its affiliates from the relationship with the Fund, including any benefits derived by the Advisor from the relationship with the Fund, the Trustees reviewed the Advisor’s staffing, personnel, and methods of operating; the education and experience of the Advisor’s personnel; the Advisor’s compliance program; the financial condition of the Advisor; the level of commitment to the Fund and the Advisor by the principals of the Advisor; the asset level of the Fund; the overall expenses of the Fund, including certain prior fee waivers and reimbursements by the Advisor; and the nature and frequency of advisory fee payments. The Trustees reviewed the financial statements for the Advisor and discussed the financial stability and profitability of the firm. The Trustees noted that the Advisor either makes payments to the Administrator or directly pays for certain expenses of the Fund under an Operating Plan in order to help limit the Fund’s annual operating expenses. The Trustees also considered potential benefits for the Advisor in managing the Fund, including promotion of the Advisor’s name, the ability for the Advisor to place small accounts into the Fund, and the potential for the Advisor to generate soft dollars from Fund trades that may benefit the Advisor as well. The Trustees then compared the fees and expenses of the Fund (including the management fee) to other funds comparable in terms of the type of fund, the nature of its investment strategy, and its style of investment management, among other factors. The Trustees determined that the Fund’s management fee and net expense ratio were higher than those of some of the comparable funds and lower than others, while the management fee and net expense ratio were higher than the peer group average. The Trustees noted that the Fund was much smaller than the peer group average. Following this comparison and upon further consideration and discussion of the foregoing, the Board of Trustees concluded that the fees paid to the Advisor by the Fund were fair and reasonable in relation to the nature and quality of the services provided by the Advisor and that they reflected charges that were within a range of what could have been negotiated at arm’s length.
In considering the extent to which economies of scale would be realized as the Fund grows and whether advisory fee levels reflect those economies of scale for the benefit of the Fund’s investors, the Trustees considered the Fund’s fee arrangements with the Advisor. The Trustees noted that although the maximum management fee under the Investment Advisory Agreement would stay the same regardless of the Fund’s asset levels, the Advisor had agreed to make payments to the Administrator at lower asset levels in order to help limit the Fund’s expenses. The Trustees pointed out that the Fund would benefit from economies of scale under agreements with service providers other than the Advisor. In particular, it was noted that the Fund’s agreement with the Administrator would determine the Fund’s gross expenses and that this agreement utilized breakpoints in its fee schedule that allowed the Fund’s shareholders to benefit from economies of scale. Following further discussion of the Fund’s asset level, expectations for growth, and fee levels, the Board of Trustees determined that the Fund’s fee arrangements with the Advisor were fair and reasonable in relation to the nature and quality of the services provided by the Advisor.
In considering the Advisor’s practices regarding brokerage and portfolio transactions, the Trustees reviewed the Advisor’s standards, and performance in utilizing those standards, for seeking best execution for Fund portfolio transactions. The Trustees also considered the portfolio turnover rate for the Fund; the process by which evaluations are made of the overall reasonableness of commissions paid; the method and basis for selecting and evaluating the broker-dealers used; any allocation of portfolio business to persons affiliated with the Advisor; and the extent to which the Fund allocates portfolio business to broker-dealers who provide research, statistical, or other services (soft dollars). The Trustees noted, among other things, that the Fund rarely trades blocks of shares which require special handling and that the average commission rate for the Fund was under $0.04 per share. After further review and discussion, the Board of Trustees determined that the Advisor’s practices regarding brokerage and portfolio transactions were satisfactory.
In considering the Advisor’s practices regarding possible conflicts of interest, the Trustees evaluated the potential for conflicts of interest and considered such matters as the experience and ability of the advisory personnel assigned to the Fund; the basis for soft dollar payments with broker-dealers, including any broker-dealers affiliated with the Advisor; the method for bunching of portfolio securities transactions should the Advisor add new accounts; and the substance and administration of the Advisor’s code of ethics. Following further consideration and discussion, the Board of Trustees indicated that the Advisor’s standards and practices relating to the identification and mitigation of possible conflicts of interests were satisfactory.
Based upon all of the foregoing considerations, the Board of Trustees, including a majority of the Independent Trustees, approved the renewal of the Investment Advisory Agreement for the Fund.
| 6. | Information about Trustees and Officers |
The business and affairs of the Fund and the Trust are managed under the direction of the Board of Trustees of the Trust. Information concerning the Trustees and officers of the Trust and Fund is set forth below. Generally, each Trustee and officer serves an indefinite term or until certain circumstances such as their resignation, death, or otherwise as specified in the Trust’s organizational documents. Any Trustee may be removed at a meeting of shareholders by a vote meeting the requirements of the Trust’s organizational documents. The Statement of Additional Information of the Fund includes additional information about the Trustees and officers and is available, without charge, upon request by calling the Fund toll-free at 1-800-773-3863. The address of each Trustee and officer, unless otherwise indicated below, is 116 South Franklin Street, Rocky Mount, North Carolina 27804. The Independent Trustees each received aggregate compensation of $2,000.00 during the fiscal year ended May 31, 2012 from the Fund for their services to the Fund and Trust.
Name, Age and Address | Position held with Funds or Trust | Length of Time Served | Principal Occupation During Past 5 Years | Number of Portfolios in Fund Complex Overseen by Trustee | Other Directorships Held by Trustee During Past 5 Years |
| Independent Trustees |
Jack E. Brinson Age: 80 | Trustee | Since 7/09 | Retired; previously, President of Brinson Investment Co. (personal investments) and President of Brinson Chevrolet, Inc. (auto dealership). | 10 | Independent Trustee of the following: DGHM Investment Trust for the two series of that trust; Gardner Lewis Investment Trust for the two series of that trust; Giordano Investment Trust for the one series of that trust; Hillman Capital Management Investment Trust for the two series of that trust; Brown Capital Management Mutual Funds for the three series of the trust; and Tilson Investment Trust for the two series of that trust; (all registered investment companies); previously, Independent Trustee of New Providence Investment Trust for its one series from inception until 2011 (all registered investment companies). |
Michael G. Mosley Age: 59 | Trustee | Since 7/10 | Owner of Commercial Realty Services (real estate) since 2004. | 10 | None |
Name, Age and Address | Position held with Funds or Trust | Length of Time Served | Principal Occupation During Past 5 Years | Number of Portfolios in Fund Complex Overseen by Trustee | Other Directorships Held by Trustee During Past 5 Years |
Theo H. Pitt, Jr. Age: 76 | Trustee | Since 9/10 | Senior Partner, Community Financial Institutions Consulting (financial consulting) since 1999; Partner, Pikar Properties (real estate) since 2001; Account Administrator, Holden Wealth Management Group of Wachovia Securities (money management firm) from 2003-2008. | 10 | Independent Trustee of DGHM Investment Trust for its two series of that trust; Gardner Lewis Investment Trust for its two series of that trust and Hanna Investment Trust for its one series of that trust (all registered investment companies). Previously, Independent Trustee of Hillman Capital Management Investment Trust for its two series from 2000 to 2009, NCM Capital Investment Trust for its one series from 2007 to 2009, New Providence Investment Trust from 2008 to 2009, and Tilson Investment Trust for its two series from 2004 to 2009 (all registered investment companies). |
James H. Speed, Jr. Age: 58 | Trustee, Chairman | Since 7/09 | President and CEO of NC Mutual Insurance Company (insurance company) since 2003; President of Speed Financial Group, Inc. (consulting and private investments) from 2000 to 2003. | 10 | Independent Trustee of the following Hillman Capital Management Investment Trust for the two series of that trust; Brown Capital Management Mutual Funds for the three series of the trust; and Tilson Investment Trust for the two series of that trust; (all registered investment companies). Member of Board of Directors of NC Mutual Life Insurance Company. Member of Board of Directors of M&F Bancorp. Previously, Independent Trustee of New Providence Investment Trust for its one series from 2009 until 2011 (registered investment company). |
J. Buckley Strandberg Age: 52 | Trustee | Since 7/09 | President of Standard Insurance and Realty (insurance and property management) since 1982. | 10 | None |
| Other Officers |
Robert G. Fontana Age: 42 5950 Fairview Road Suite 610-A Charlotte, NC 28210 | President and Treasurer (Caritas All-Cap Growth Fund) | Since 7/09 | President and CIO of Caritas Capital, LLC (advisor to the Caritas All-Cap Growth Fund) since 2009; Portfolio Manager for Portfolio Capital Management (investment management) since 2006; previously, Portfolio Manager for Covenant Capital, LLC (investment management). | n/a | n/a |
Name, Age and Address | Position held with Funds or Trust | Length of Time Served | Principal Occupation During Past 5 Years | Number of Portfolios in Fund Complex Overseen by Trustee | Other Directorships Held by Trustee During Past 5 Years |
T. Lee Hale, Jr. Age: 34 | Chief Compliance Officer; Assistant Treasurer | Since 7/09 and 4/10 | Financial Reporting Manager for The Nottingham Company (fund administrator) since 2009; previously, principal of Lee Hale Contracting (marine industry consulting). | n/a | n/a |
A. Vason Hamrick Age: 35 | Secretary | Since 7/09 | Corporate Counsel for The Nottingham Company since 2004. | n/a | n/a |
Caritas All-Cap Growth Fund
is a series of| The Starboard Investment Trust |
| For Shareholder Service Inquiries: | For Investment Advisor Inquiries: |
| Nottingham Shareholder Services, LLC | Caritas Capital, LLC |
| 116 South Franklin Street | 5950 Fairview Road |
Post Office Drawer 4365 Rocky Mount, North Carolina 27803 | Suite 610-A Charlotte, North Carolina 28210 |
Toll-Free Telephone: 1-800-773-3863 | Toll-Free Telephone: 1-800-773-3863 |
World Wide Web @: ncfunds.com | World Wide Web @: caritascapital.com |
Annual Report 2012
May 31, 2012
Presidio Multi-Strategy Fund
This report and the financial statements contained herein are submitted for the general information of the shareholders of the Presidio Multi-Strategy Fund (the “Fund”). The Fund’s shares are not deposits or obligations of, or guaranteed by, any depository institution. The Fund’s shares are not insured by the FDIC, Federal Reserve Board or any other agency, and are subject to investment risks, including possible loss of principal amount invested. Neither the Fund nor the Fund’s distributor is a bank.
The Presidio Multi-Strategy Fund is distributed by Capital Investment Group, Inc., Member FINRA/SIPC, 17 Glenwood Ave, Raleigh, NC, 27603. There is no affiliation between the Presidio Multi-Strategy Fund, including its principals, and Capital Investment Group, Inc.
Statements in this Annual Report that reflect projections or expectations of future financial or economic performance of the Presidio Multi-Strategy Fund (“Fund”) and of the market in general and statements of the Fund’s plans and objectives for future operations are forward-looking statements. No assurance can be given that actual results or events will not differ materially from those projected, estimated, assumed or anticipated in any such forward-looking statements. Important factors that could result in such differences, in addition to the other factors noted with such forward-looking statements, include, without limitation, general economic conditions such as inflation, recession and interest rates. Past performance is not a guarantee of future results.
An investment in the Fund is subject to investment risks, including the possible loss of some or the entire principal amount invested. There can be no assurance that the Fund will be successful in meeting its investment objective. Investment in the Fund is also subject to the following risks: market risk, sector risk, investment advisor risk, new fund risk, operating risk, foreign securities and emerging markets risk, currency risk, political/economic risk, derivative risk, currency option transactions risk, currency futures risk, leverage risk, counterparty risk, short sales risk, risks related to investing in other investment companies, ETN risk, small-cap and mid-cap securities risk, interest rate and credit risk, maturity risk, inflation risk, investment-grade securities risk, lower-rated securities or “junk bonds” risk, risks of investing in corporate debt securities, and government debt markets may be illiquid or disrupted. More information about these risks and other risks can be found in the Fund’s prospectus.
The performance information quoted in this annual report represents past performance, which is not a guarantee of future results. Investment return and principal value of an investment will fluctuate so that an investor’s shares, when redeemed, may be worth more or less than their original cost. Current performance may be lower or higher than the performance data quoted. An investor may obtain performance data current to the most recent month-end by visiting www.ncfunds.com.
An investor should consider the investment objectives, risks, and charges and expenses of the Fund carefully before investing. The prospectus contains this and other information about the Fund. A copy of the prospectus is available at www.ncfunds.com or by calling Shareholder Services at 1-800-773-3863. The prospectus should be read carefully before investing.
This Annual Report was first distributed to shareholders on or about July 30, 2012.
For More Information on Your Presidio Multi-Strategy Fund:
See Our Web site @ www.ncfunds.com
or
Call Our Shareholder Services Group Toll-Free at 1-800-773-3863.
Dear Fellow Shareholders of the Presidio Multi-Strategy Fund:
Enclosed for your review is the Annual Report for the Presidio Multi-Strategy Fund (the “Fund”) for the fiscal year ending May 31, 2012. The Fund returned an annualized -2.93%1 vs. the benchmark (50% S&P and 50% Barclays Agg2) return of 2.95%, with an annualized volatility of 8.22%3 and a beta of 0.235. The underperformance to the 50% S&P/ 50% Barclays Agg benchmark wasn’t much of a surprise, as the Fund is (and expected to be) significantly underweight in equities (stocks) versus the benchmark, and especially since the equity markets have rallied during this period. We should remind shareholders that, while we use the benchmark to provide an objective measure of the performance of the Fund, we do not manage the Fund to any specific benchmark. In managing the Fund, one of our objectives is to continue to provide our clients with a differentiated source of return that is lowly correlated to the general movements of the equity markets, and as such, we are likely to have little equity exposure in the portfolio at any given time. We continue to maintain a diversified portfolio of asset classes and strategies that we think will reward our investors over the long-term.
Risk, Return and Correlation Statistics:
Presidio Multi Strategy Fund 50% S&P, 50% Barclays Agg
| Net Return | -2.38%1 | 2.95% | |
| Realized Volatility | 8.22%3 | 10.92% | |
| Realized Correlation to S&P 500 | 0.664 | 0.99 | |
| Realized Beta to S&P 500 | 0.235 | 0.46 | |
��
Please see the table below for the Fund’s historical performance information through the calendar quarter ended June 30, 2012.
Average Annual Total Returns | | Past 1 Year | | Since Inception* | Net | Gross |
Period Ended June 30, 2012 | Past 1 Year | Sales Load Included | Since Inception* | Sales Load Included | Expense Ratio** | Expense Ratio*** |
| Presidio Multi-Strategy Fund | -0.58% | -4.80% | 3.70% | 1.46% | 1.97% | 4.42% |
50%S&P500 Index/ 50%Barclays Aggregate Blend Index | 6.36% | | 10.89% | | | |
The performance data quoted above represents past performance, which is not a guarantee of future results Investment return and principal value of an investment in the Fund will fluctuate so that an investor's shares, when redeemed, may be worth more or less than their original cost. Current performance may be lower or higher than the performance data quoted. To obtain more current performance data regarding the Fund, including performance data current to the Fund’s most recent month-end, please visit www.ncfunds.com or call the Fund at (800)525-3863. Fee waivers and expenses reimbursements have positively impacted Fund performance. *The Fund’s inception date is July 7, 2010. ** The Advisor has entered into an Operating Plan with the Administrator through October 1, 2012, under which it has agreed to assume certain expenses of the Administrator to the extent the operating expenses exceed 1.50% of the average daily net assets of the Fund, exclusive of amounts payable under a Rule 12b-1 distribution plan, acquired fund fees and expenses, and extraordinary expenses. The Operating Plan can only be terminated at the conclusion of the then-current term by notice of non-renewal to a party or mutual agreement of the parties. ***Gross expense ratio is from the Fund’s prospectus dated January 6, 2012. |
Outlook:
Equity valuation, credit spreads and other valuation measures point towards a more modest expectation of risk premiums, and looking forward, we expect investors to receive fair (to somewhat slightly below fair) compensation for embracing risk assets (e.g. equities, credit, interest rate risk, commodities). Though individual asset classes may be fairly valued, we do believe that there are interesting and attractive relative value opportunities in credit, energy and natural resources, which we hope to take advantage of for the Fund.
At Presidio Capital Investments, we remain committed to our investment principles of maintaining a diversified portfolio across asset classes and strategies, and taking on risks we think are worthwhile. We continue to monitor and price a wide range of risk assets, and evaluate the strategies we can utilize to express and manage those risks. It is this valuation framework, coupled with our investment philosophy and risk management process that guides us to making thoughtful, risk-adjusted investment decisions. And we believe that the rapidly changing environment that we are currently in demands even more attention and thoughtfulness in managing risk capital.
I invite any current or prospective shareholder to call or email me directly to discuss the Presidio Multi-Strategy Fund and our investment approach.
With warmest regards,
Matthew R. Lee
Presidio Capital Investments, LLC
The views in the foregoing discussion were those of the Fund’s investment advisor as of the date set forth above and may not reflect its views on the date this Semi-Annual Report is first published or anytime thereafter. These views are intended to assist shareholders in understanding their investment in the Fund and do not constitute investment advice.
An investor should consider the Fund’s investment objectives, risks, and charges and expenses carefully before investing. The Fund’s Prospectus contains this and other important information. For information on the Fund’s expense ratio, please see the Financial Highlights Table found within the accompanying Annual Report.
1) The performance information quoted above represents past performance and past performance does not guarantee future results. Investment return and principal value of an investment will fluctuate so that an investor’s shares, when redeemed, may be worth more or less than their original cost. Current performance may be lower or higher than the performance data quoted. Performance data, current to the most recent month end, may be obtained by calling the Fund at (800)525-3863. Fee waivers and expense reimbursements have positively impacted Fund performance. The performance information presented is not inclusive of sales charge and if adjusted for sales charges, performance quoted would be reduced.
2) The S&P 500 Total Return Index is a market capitalization weighted index that is widely used as a barometer of U.S. stock market performance. The S&P 500 Total Return Index provides investors with a price-plus gross cash dividend return of the companies represented in the S&P 500 Total Return Index. The Barclays Capital U.S. Government/Credit Index represents securities that are U.S. domestic, taxable, and dollar denominated. The Index covers the U.S. investment grade fixed rate bond market, with index components for government and corporate securities. You cannot invest directly in these indices. These indices do not have investment advisors and do not pay any commissions, expenses, or taxes. If these indices did pay commissions, expenses, or taxes, their returns would be lower.
3) Realized volatility is measured as annualized standard deviation and is considered a measure of risk. Annualized standard deviation is calculated using standard methodology of taking the standard deviation of realized daily returns multiplied by the square root of the number of trading days in a year (assumed at 250). Volatility is a statistical measure that provides an estimate of the dispersion (or range) of potential returns. Investors should be aware that volatility estimates, like any other “statistics”, are not constant, and that they may change as the capital markets change and as the composition of the underlying portfolio changes.
4) Correlation is computed into what is known as the correlation coefficient, which ranges between -1 and +1. Perfect positive correlation (a correlation co-efficient of +1) implies that as one security moves, either up or down, the other security will move by an equal amount in the same direction. Alternatively, perfect negative correlation means that if one security moves in either direction the security that is perfectly negatively correlated will move by an equal amount in the opposite direction. If the correlation is 0, the movements of the securities are said to have no correlation; they are completely random.
5) Beta is a measure of the price sensitivity of an asset (or portfolio) to the broader market, and is also considered a risk statistic. Beta was calculated by regressing the daily returns of the fund and daily returns of the S&P 500 (for the time period from fund inception through 11/30/10). Investors should be aware that volatility estimates, like any other “statistics”, are not constant, and that they may change as the capital markets change and as the composition of the underlying portfolio changes.
| Presidio Multi-Strategy Fund | | | | | | | | | | | | | |
| | | | | | | | | | | | | | | | | | | | |
| Performance Update (Unaudited) | | | | | | | | | | | | | |
| | | | | | | | | | | | | | | | | | | | |
| | | | | | | | | | | | | | | | | | | | |
| For the period from July 7, 2010 (Date of Initial Public Investment) to May 31, 2012 | | |
| | | | | | | | | | | | | | | | | | | | |
| Comparison of the Change in Value of a $10,000 Investment | | | | | | | | |
| | | | | | | | | | | | | | | | | | | | |
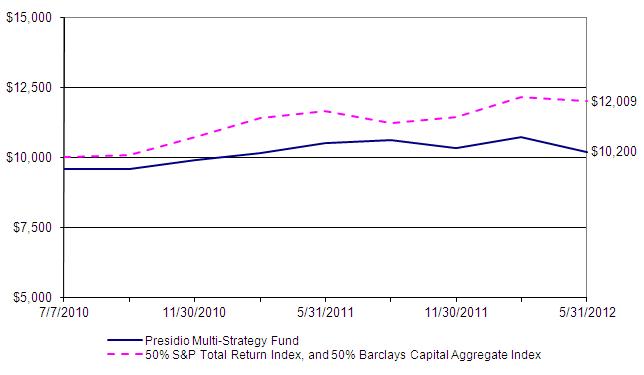 |
| | | | | | | | | | | | | | | | | | | | |
| This graph assumes an initial investment of $10,000 ($9,575 after maximum sales load of 4.25%) at July 7, 2010 (Date of Initial Public Investment). All dividends and distributions are reinvested. This graph depicts the performance of the Presidio Multi-Strategy Fund versus 50% of the S&P Total Return Index, and 50% of the Barclays Capital Aggregate Bond Index. It is important to note that the Fund is a professionally managed mutual fund while the indices are not available for investment and are unmanaged. The comparison is shown for illustrative purposes only. |
| | | | | | | | | | | | | | | | | | | | |
| | Average Annual Total Returns | | | | | | | | | | | | | |
| | | | | | | | | | | | | | | | | | Gross | | |
| | | As of | | | | | | | One | | Since | | Inception | | Expense | | |
| | | May 31, 2012 | | | | | | Year | | Inception | | Date | | Ratio* | | |
| | | Presidio Multi-Strategy Fund | | | | | -2.93% | | 3.38% | | 07/07/10 | | 4.42% | | |
| | | Presidio Multi-Strategy Fund - 4.25% Maximum Sales Load | -7.05% | | 1.05% | | 07/07/10 | | 4.42% | | |
| | | 50% S&P Total Return Index, and | | | | | | | | | | | | |
| | | | 50% Barclays Capital Aggregate Bond Index | | | 2.95% | | 10.11% | | N/A | | N/A | | |
| | | | | | | | | | | | | | | | | | | | |
| * The gross expense ratio shown is from the Fund's prospectus dated September 28, 2011. | | | | |
| | | | | | | | | | | | | | | | | | | | |
| Performance quoted above represents past performance, which is no guarantee of future results. Investment return and principal value will fluctuate so that shares, when redeemed, may be worth more or less than their original cost. Current performance may be lower or higher than the performance data quoted. An investor may obtain performance data, current to the most recent month-end, by visiting www.presidio-cap.com. |
| | | | | | | | | | | | | | | | | | | | |
| | | | | | | | | | | | | | | | | | | | |
| The graph and table do not reflect the deduction of taxes that a shareholder would pay on Fund distributions or the redemption of Fund shares. Average annual total returns are historical in nature and measure net investment income and capital gain or loss from portfolio investments assuming reinvestments of distributions. |
| | | | | | | | | | | | | | | | | | | | |
| Presidio Multi-Strategy Fund | | | | | | | |
| | | | | | | | | | | | |
| Schedule of Investments | | | | | | | |
| | | | | | | | | | | | |
| | | | | | | | | | | | |
| As of May 31, 2012 | | | | | | | | |
| | | | | | | | Shares | | | | Value (note 1) |
| | | | | | | | | | | | |
| EXCHANGE TRADED PRODUCTS - 110.20% | | | | | | | |
| | † | Alerian MLP ETF | | | 1,300 | | | $ | 20,449 |
| | † | Energy Select Sector SPDR Fund | | | 3,500 | | | | 222,705 |
| | † | iShares Barclays 1-3 Year Treasury Bond Fund | | | 50 | | | | 4,224 |
| | † | iShares Barclays 20+ Year Treasury Bond Fund | | | 500 | | | | 63,800 |
| | | iShares Barclays 3-7 Year Treasury Bond Fund | | | 2,746 | | | | 338,719 |
| | † | iShares Barclays 7-10 Year Treasury Bond Fund | | | 4,100 | | | | 445,055 |
| | † | iShares Barclays Aggregate Bond Fund | | | 3,300 | | | | 368,148 |
| | † | iShares Dow Jones US Real Estate Index Fund | | | 4,500 | | | | 275,490 |
| | † | iShares iBoxx $ High Yield Corporate Bond Fund | | | 6,400 | | | | 561,728 |
| | † | iShares iBoxx Investment Grade Corporate Bond Fund | | 10,250 | | | | 1,198,942 |
| | † | iShares JPMorgan USD Emerging Markets Bond Fund | | 1,100 | | | | 121,748 |
| | † | iShares MSCI EAFE Index Fund | | | 900 | | | | 42,984 |
| | † | iShares MSCI Emerging Markets Index Fund | | | 6,400 | | | | 241,280 |
| | † | iShares Russell 2000 Index Fund | | | 950 | | | | 72,304 |
| | † | iShares Russell 2000 Value Index Fund | | | 1,100 | | | | 74,239 |
| | *† | iShares S&P GSCI Commodity Indexed Trust | | | 100 | | | | 3,023 |
| | † | iShares S&P MidCap 400 Index Fund | | | 3,700 | | | | 342,361 |
| | † | iShares S&P National Municipal Bond Fund | | | 100 | | | | 11,113 |
| | † | iShares S&P North American Natural Resources Sector Index Fund | 3,700 | | | | 126,392 |
| | *† | iShares Silver Trust | | | 600 | | | | 16,176 |
| | † | Market Vectors Rare Earth/Strategic Metals ETF | | | 1,500 | | | | 20,235 |
| | *† | PowerShares DB Agriculture Fund | | | 1,100 | | | | 28,688 |
| | *† | PowerShares DB US Dollar Index Bullish Fund | | | 8,700 | | | | 200,013 |
| | † | SPDR Barclays Capital Convertible Securities ETF | | 10,000 | | | | 369,100 |
| | † | SPDR Barclays Capital High Yield Bond ETF | | | 31,009 | | | | 1,181,753 |
| | † | SPDR Barclays Capital International Treasury Bond ETF | | 2,000 | | | | 117,280 |
| | † | SPDR S&P 500 ETF Trust | | | 500 | | | | 65,735 |
| | † | SPDR S&P MidCap 400 ETF Trust | | | 350 | | | | 59,000 |
| | *† | United States Gasoline Fund LP | | | 500 | | | | 24,410 |
| | *† | United States Natural Gas Fund LP | | | 162 | | | | 2,720 |
| | *† | United States Oil Fund LP | | | 700 | | | | 22,827 |
| | † | Vanguard MSCI Emerging Markets ETF | | | 4,900 | | | | 186,298 |
| | † | Vanguard REIT ETF | | | 2,550 | | | | 159,426 |
| | † | Vanguard Small-Cap Value ETF | | | 4,850 | | | | 316,598 |
| | † | Vanguard Total Bond Market ETF | | | 3,250 | | | | 274,658 |
| | *† | WisdomTree Dreyfus Emerging Currency Fund | | | 1,700 | | | �� | 33,218 |
| | | | | | | | | | | | |
| | | Total Exchange Traded Products (Cost $7,534,256) | | | | | | 7,612,839 |
| | | | | | | | | | | | |
| | | | | | | | | | | | |
| | | | | | | | | | | | |
| | | | | | | | | | | | |
| | | | | | | | | | | | (Continued) |
| Presidio Multi-Strategy Fund | | | | | | | |
| | | | | | | | | | | | |
| Schedule of Investments | | | | | | | |
| | | | | | | | | | | | |
| | | | | | | | | | | | |
| As of May 31, 2012 | | | | | | | | |
| | | | | | | | Shares | | | | Value (note 1) |
| | | | | | | | | | | | |
| COMMON STOCKS - 2.63% | | | | | | | |
| | | | | | | | | | | | |
| | Consumer Discretionary | | | | | | | |
| | † | McDonald's Corp. | | | 50 | | | $ | 4,467 |
| | † | NIKE, Inc. Cl. B | | | 50 | | | | 5,412 |
| | † | Omnicom Group, Inc. | | | 50 | | | | 2,384 |
| | | | | | | | | | | | 12,263 |
| | Consumer Staples | | | | | | | | |
| | † | Altria Group, Inc. | | | 50 | | | | 1,609 |
| | † | Brown-Forman Corp. Cl. B | | | 50 | | | | 4,359 |
| | † | McCormick & Co., Inc. | | | 50 | | | | 2,818 |
| | † | PepsiCo., Inc. | | | | 50 | | | | 3,392 |
| | † | Philip Morris International, Inc. | | | 50 | | | | 4,226 |
| | † | The Coca-Cola Co. | | | 50 | | | | 3,739 |
| | † | The Procter & Gamble Co. | | | 50 | | | | 3,115 |
| | † | Wal-Mart Stores, Inc. | | | 100 | | | | 6,582 |
| | | | | | | | | | | | 29,840 |
| | Energy | | | | | | | | | |
| | † | Exxon Mobil Corp. | | | 50 | | | | 3,939 |
| | | | | | | | | | | | 3,939 |
| | Financials | | | | | | | | | |
| | *† | Berkshire Hathaway, Inc. Cl. B | | | 50 | | | | 3,967 |
| | | | | | | | | | | | 3,967 |
| | Health Care | | | | | | | | | |
| | † | Abbott Laboratories | | | 50 | | | | 3,089 |
| | † | Becton Dickinson and Co. | | | 50 | | | | 3,656 |
| | †µ | GlaxoSmithKline PLC | | | 50 | | | | 2,203 |
| | † | Johnson & Johnson | | | 100 | | | | 6,241 |
| | † | Medtronic, Inc. | | | | 50 | | | | 1,842 |
| | † | Merck & Co., Inc. | | | 50 | | | | 1,879 |
| | †µ | Novo Nordisk A/S | | | 50 | | | | 6,694 |
| | † | Pfizer, Inc. | | | | | 250 | | | | 5,488 |
| | † | Stryker Corp. | | | | 50 | | | | 2,573 |
| | *† | Varian Medical Systems, Inc. | | | 50 | | | | 2,933 |
| | | | | | | | | | | | 36,598 |
| | Industrials | | | | | | | | | |
| | † | 3M Co. | | | | | 50 | | | | 4,220 |
| | † | General Dynamics Corp. | | | 50 | | | | 3,202 |
| | † | United Technologies Corp. | | | 50 | | | | 3,706 |
| | | | | | | | | | | | 11,128 |
| | | | | | | | | | | | |
| | | | | | | | | | | | |
| | | | | | | | | | | | |
| | | | | | | | | | | | (Continued) |
| Presidio Multi-Strategy Fund | | | | | | | |
| | | | | | | | | | | | |
| Schedule of Investments | | | | | | | |
| | | | | | | | | | | | |
| | | | | | | | | | | | |
| As of May 31, 2012 | | | | | | | | |
| | | | | | | | Shares | | | | Value (note 1) |
| | | | | | | | | | | | |
| COMMON STOCKS (continued) | | | | | | | |
| | | | | | | | | | | | |
| | Information Technology | | | | | | | |
| | *† | Adobe Systems, Inc. | | | 200 | | | $ | 6,210 |
| | † | Automatic Data Processing, Inc. | | | 50 | | | | 2,607 |
| | † | Cisco Systems, Inc. | | | 100 | | | | 1,633 |
| | † | FactSet Research Systems, Inc. | | | 50 | | | | 5,271 |
| | † | Microsoft Corp. | | | | 250 | | | | 7,297 |
| | † | Oracle Corp. | | | | 250 | | | | 6,618 |
| | † | Paychex, Inc. | | | | 100 | | | | 2,997 |
| | † | QUALCOMM, Inc. | | | 50 | | | | 2,866 |
| | | | | | | | | | | | 35,499 |
| | Materials | | | | | | | | | |
| | | Freeport-McMoRan Copper & Gold, Inc. | | | 1,500 | | | | 48,060 |
| | | | | | | | | | | | 48,060 |
| | | | | | | | | | | | |
| | | Total Common Stocks (Cost $175,178) | | | | | | | 181,294 |
| | | | | | | | | | | | |
| | | | | | Number of Contracts | Exercise Price | Maturity Date | Value (note 1) |
| | | | | | | | | | | | |
| PUT OPTIONS PURCHASED - 2.52% | | | | | | | |
| | | SPDR S&P 500 ETF Trust | 200 | | $ 139.00 | | 6/16/2012 | $ | 162,400 |
| | | SPDR S&P 500 ETF Trust | 5 | | 140.00 | | 6/16/2012 | | 4,690 |
| | | SPDR S&P 500 ETF Trust | 5 | | 145.00 | | 6/16/2012 | | 7,305 |
| | | | | | | | | | | | |
| | | Total Put Options Purchased (Cost $95,446) | | | | | | | 174,395 |
| | | | | | | | | | | | |
| CALL OPTIONS PURCHASED - 1.48% | | | | | | | |
| | | CBOE SPX Volatility Index | 45 | | $ 16 | | 6/20/2012 | $ | 46,755 |
| | | CBOE SPX Volatility Index | 25 | | 17.00 | | 6/20/2012 | | 20,250 |
| | | CBOE SPX Volatility Index | 25 | | 18.00 | | 6/20/2012 | | 17,000 |
| | | iShares Dow Jones US Real Estate Index Fund | 18 | | 61.00 | | 6/16/2012 | | 2,250 |
| | | iShares iBoxx $ High Yield Corporate Bond Fund | 20 | | 91.00 | | 6/16/2012 | | 100 |
| | | iShares MSCI EAFE Index Fund | 50 | | 54.00 | | 6/16/2012 | | 100 |
| | | iShares MSCI Emerging Markets Index Fund | 45 | | 43.00 | | 6/16/2012 | | 45 |
| | | iShares Silver Trust | 25 | | 30.00 | | 6/16/2012 | | 125 |
| | | PowerShares DB US Dollar Index Bullish Fund | 140 | | 22.00 | | 6/16/2012 | | 13,440 |
| | | SPDR Gold Trust | 25 | | 159.00 | | 6/16/2012 | | 1,100 |
| | | SPDR S&P 500 ETF Trust | 20 | | 138.00 | | 6/16/2012 | | 200 |
| | | SPDR S&P 500 ETF Trust | 15 | | 139.00 | | 7/21/2012 | | 1,065 |
| | | | | | | | | | | | |
| | | Total Call Options Purchased (Cost $144,106) | | | | | | | 102,430 |
| | | | | | | | | | | | (Continued) |
| Presidio Multi-Strategy Fund | | | | | | | |
| | | | | | | | | | | | |
| Schedule of Investments | | | | | | | |
| | | | | | | | | | | | |
| | | | | | | | | | | | |
| As of May 31, 2012 | | | | | | | | |
| | | | | | | | | | | | Value (note 1) |
| | | | | | | | | | | | |
| SHORT-TERM INVESTMENT - 13.77% | | | | | | | |
| | § | Fidelity Institutional Money Market Funds - Money Market Portfolio, 0.19% | | | $ | 951,015 |
| | | | | | | | | | | | |
| | | Total Short-Term Investment (Cost $951,015) | | | | | | | 951,015 |
| | | | | | | | | | | | |
| Total Value of Investments (Cost $8,900,002) - 130.60% | | | | | $ | 9,021,973 |
| | | | | | | | | | | | |
| Liabilities in Excess of Other Assets - (30.60)% | | | | | | | (2,113,925) |
| | | | | | | | | | | | |
| | Net Assets - 100% | | | | | | $ | 6,908,048 |
| | | | | | | | | | | | |
| | * | Non-income producing investment | | | | | | | |
| | † | Portion of security pledged as collateral for options written | | | | | | |
| | § | Represents 7 day effective yield | | | | | | | |
| | μ | American Depositary Receipt | | | | | | | |
| | | | | | | | | | | | |
| | | The following acronyms is used in this portfolio: | | | | | | | |
| | | PLC - Public Limited Company | | | | | | | |
| | | REIT - Real Estate Investment Trust | | | | | | | |
| | | | | | | | | | | | |
| | | | | | | | | | | | |
| | | | | | | | | | | | |
| | | | | Summary of Investments by Sector | | | | | | |
| | | | | | % of Net | | | | | | |
| | | | | Sector | Assets | | Value | | | | |
| | | | | Exchange Traded Products | 110.20% | $ | 7,612,839 | | | | |
| | | | | Consumer Discretionary | 0.18% | | 12,263 | | | | |
| | | | | Consumer Staples | 0.43% | | 29,840 | | | | |
| | | | | Energy | 0.06% | | 3,939 | | | | |
| | | | | Financials | 0.06% | | 3,967 | | | | |
| | | | | Health Care | 0.53% | | 36,598 | | | | |
| | | | | Industrials | 0.16% | | 11,128 | | | | |
| | | | | Information Technology | 0.51% | | 35,499 | | | | |
| | | | | Materials | 0.70% | | 48,060 | | | | |
| | | | | Put Options Purchased | 2.52% | | 174,395 | | | | |
| | | | | Call Options Purchased | 1.48% | | 102,430 | | | | |
| | | | | Short-Term Investment | 13.77% | | 951,015 | | | | |
| | | | | Total | 130.60% | $ | 9,021,973 | | | | |
| | | | | | | | | | | | |
| | | | | | | | | | | | |
| | | | | | | | | | | | |
| | | | | | | | | | | | |
| | | | | | | | | | | | |
| | | | | | | | | | | | (Continued) |
| Presidio Multi-Strategy Fund | | | | | | | |
| | | | | | | | | | | | |
| Schedule of Investments | | | | | | | |
| | | | | | | | | | | | |
| | | | | | | | | | | | |
| As of May 31, 2012 | | | | | | | | |
| | | | | | Number of Contracts | Exercise Price | Maturity Date | Value (note 1) |
| | | | | | | | | | | | |
| CALL OPTIONS WRITTEN (note 1) | | | | | | | |
| | * | CBOE SPX Volatility Index | 25 | $ | 28.00 | | 6/20/2012 | $ | 4,625 |
| | * | CBOE SPX Volatility Index | 45 | | 30.00 | | 6/20/2012 | | 7,650 |
| | * | CBOE SPX Volatility Index | 25 | | 32.50 | | 6/20/2012 | | 3,000 |
| | * | SPDR S&P 500 ETF Trust | 200 | | 139.00 | | 6/16/2012 | | 1,200 |
| | * | SPDR S&P 500 ETF Trust | 5 | | 140.00 | | 6/16/2012 | | 20 |
| | * | SPDR S&P 500 ETF Trust | 20 | | 144.00 | | 6/16/2012 | | 20 |
| | * | SPDR S&P 500 ETF Trust | 5 | | 145.00 | | 6/16/2012 | | 10 |
| | | | | | | | | | | | |
| | Total (Premiums Received $111,247) | | | | | | | 16,525 |
| | | | | | | | | | | | |
| PUT OPTIONS WRITTEN (note 1) | | | | | | | |
| | * | iShares Barclays 7-10 Year Treasury Bond Fund | 10 | | 105.00 | | 6/16/2012 | | 75 |
| | * | iShares Dow Jones US Real Estate Index Fund | 18 | | 61.00 | | 6/16/2012 | | 1,854 |
| | * | iShares iBoxx $ High Yield Corporate Bond Fund | 10 | | 85.00 | | 6/16/2012 | | 350 |
| | * | iShares iBoxx $ High Yield Corporate Bond Fund | 5 | | 88.00 | | 6/16/2012 | | 500 |
| | * | iShares iBoxx $ High Yield Corporate Bond Fund | 5 | | 90.00 | | 6/16/2012 | | 1,050 |
| | * | iShares iBoxx $ High Yield Corporate Bond Fund | 40 | | 91.00 | | 6/16/2012 | | 15,200 |
| | * | iShares iBoxx Invest Grade Corporate Bond Fund | 20 | | 115.00 | | 6/16/2012 | | 400 |
| | * | iShares MSCI EAFE Index Fund | 50 | | 54.00 | | 6/16/2012 | | 31,750 |
| | * | iShares MSCI Emerging Markets Index Fund | 20 | | 43.00 | | 6/16/2012 | | 10,750 |
| | * | iShares Silver Trust | 25 | | 30.00 | | 6/16/2012 | | 7,700 |
| | * | PowerShares DB US Dollar Index Bullish Fund | 140 | | 22.00 | | 6/16/2012 | | 140 |
| | * | SPDR Barclays Capital High Yield Bond ETF | 5 | | 36.74 | | 6/16/2012 | | 75 |
| | * | SPDR Barclays Capital High Yield Bond ETF | 10 | | 37.74 | | 6/16/2012 | | 400 |
| | * | SPDR Gold Trust | 25 | | 159.00 | | 6/16/2012 | | 18,000 |
| | * | SPDR S&P 500 ETF Trust | 20 | | 132.00 | | 6/16/2012 | | 5,760 |
| | * | SPDR S&P 500 ETF Trust | 15 | | 139.00 | | 7/21/2012 | | 12,930 |
| | | | | | | | | | | | |
| | Total (Premiums Received $69,950) | | | | | | | 106,934 |
| | | | | | | | | | | | |
| SECURITIES SOLD SHORT | | | | | | | |
| | | | | | | | | | | | |
| | EXCHANGE TRADED PRODUCTS | | | | | | | |
| | | iShares Barclays 1-3 Year Treasury Bond Fund | 3,009 | | | | | | 254,200 |
| | | iShares Barclays 20+ Year Treasury Bond Fund | 1,000 | | | | | | 127,600 |
| | | iShares Barclays 3-7 Year Treasury Bond Fund | 3,150 | | | | | | 388,552 |
| | | iShares Barclays 7-10 Year Treasury Bond Fund | 7,242 | | | | | | 786,119 |
| | | iShares Russell 2000 Index Fund | 1,700 | | | | | | 129,387 |
| | | iShares S&P 500 Index Fund/US | 1,050 | | | | | | 138,443 |
| | | SPDR Dow Jones Industrial Average ETF Trust | 600 | | | | | | 74,220 |
| | | SPDR S&P 500 ETF Trust | 1,500 | | | | | | 197,205 |
| | | | | | | | | | | | |
| | Total (Premiums Received $1,973,543) | | | | | | $ | 2,095,726 |
| See Notes to Financial Statements | | | | | | | |
| Presidio Multi-Strategy Fund | | | |
| | | | | |
| Statement of Assets and Liabilities | | | |
| | | | | |
| | | | | |
| As of May 31, 2012 | | | |
| | | | | |
| Assets: | | | |
| | Investments in securities, at fair value (cost $8,900,002) | $ | 9,021,973 | |
| | Cash | | 79,759 | |
| | Receivables: | | | |
| | | Capital shares sold | | 78,142 | |
| | | Dividends and interest | | 306 | |
| | Prepaid expenses | | 65,107 | |
| | | | | |
| | Total assets | | 9,245,287 | |
| | | | | |
| Liabilities: | | | |
| | Call Options written, at fair value (premiums received $111,247) | | 16,525 | |
| | Put Options written, at fair value (premiums received $69,950) | | 106,934 | |
| | Securities sold short, at fair value (proceeds received $1,973,543) | | 2,095,726 | |
| | Payables: | | | |
| | | Investment securities purchased | | 107,512 | |
| | Accrued expenses | | | |
| | | Administration fees | | 2,819 | |
| | | Advisory fees | | 5,637 | |
| | | Other expenses | | 2,086 | |
| | | | | |
| | Total liabilities | | 2,337,239 | |
| | | | | |
| Net Assets | $ | 6,908,048 | |
| | | | | |
| Net Assets Consist of: | | | |
| | Capital | $ | 7,017,876 | |
| | Distributable Income: | | | |
| | | Net investment income | | 10,045 | |
| | | Net realized loss on investments | | (177,400) | |
| | Net unrealized appreciation on investments | | 57,527 | |
| | | | | |
| | Total Net Assets | $ | 6,908,048 | |
| | Shares Outstanding, no par value (unlimited authorized shares) | | 680,659 | |
| | Net Asset Value and Redemption Price Per Share | $ | 10.15 | |
| | | | | |
| Maximum Offering Price Per Share ($10.15 ÷ 95.75%) | $ | 10.60 | |
| | | | | |
| | | | | |
| | | | | |
| | | | | |
| | | | | |
| | | | | |
| | | | | |
| | | | | |
| See Notes to Financial Statements | | | |
| Presidio Multi-Strategy Fund | | |
| | | | |
| Statement of Operations | | |
| | | | |
| | | | |
| For the fiscal year ended May 31, 2012 | | |
| | | | |
| Investment Income: | | |
| | Interest | $ | 782 |
| | Dividends | | 226,404 |
| | | | |
| | Total Investment Income | | 227,186 |
| | | | |
| Expenses: | | |
| | Advisory fees (note 2) | | 59,315 |
| | Administration fees (note 2) | | 29,658 |
| | Distribution and service fees (note 3) | | 14,829 |
| | | | |
| | Total Expenses | | 103,802 |
| | | | |
| Net Investment Income | | 123,384 |
| | | | |
| Realized and Unrealized Gain (Loss) from Investments | | |
| | | | |
| | Net realized gain (loss) from investment transactions: | | |
| | | Investments | | (277,821) |
| | | Options Written | | 473,819 |
| | | Options Purchased | | (455,587) |
| | | | |
| | Change in unrealized appreciation (depreciation) on investments | | |
| | | Investments | | (109,601) |
| | | Options Written | | 3,386 |
| | | Options Purchased | | 51,661 |
| | | | |
| | | | |
| Realized and Unrealized Loss on Investments | | (314,143) |
| | | | |
| Net Decrease in Net Assets Resulting from Operations | $ | (190,759) |
| | | | |
| | | | |
| | | | |
| | | | |
| | | | |
| | | | |
| | | | |
| | | | |
| | | | |
| | | | |
| | | | |
| | | | |
| | | | |
| | | | |
| See Notes to Financial Statements | | |
| Presidio Multi-Strategy Fund | | | | | | | |
| | | | | | | | | | |
| Statements of Changes in Net Assets | | | | | | | |
| | | | | | | | | | |
| | | | | | | | | | |
| For the fiscal year ended May 31, | | | | 2012 | | 2011(a) | |
| | | | | | | | | | |
| Operations: | | | | | | | | |
| | Net investment income | | | $ | 123,384 | $ | 37,947 | |
| | Net realized (loss) gain from investment transactions | | | (259,589) | | 171,368 | |
| | Change in unrealized appreciation (depreciation) on investments | | (54,554) | | 112,081 | |
| | | | | | | | | | |
| Net (Decrease) Increase in Net Assets Resulting from Operations | | (190,759) | | 321,396 | |
| | | | | | | | | | |
Distributions to Shareholders: (note 6) | | | | | | | |
| | Net investment income | | | | (130,095) | | (21,191) | |
| | Net realized gain from investment transactions | | | (95) | | (89,084) | |
| | | | | | | | | | |
| Decrease in Net Assets Resulting from Distributions | | | (130,190) | | (110,275) | |
| | | | | | | | | | |
| Capital Share Transactions: | | | | | | | |
| | Shares sold | | | | $ | 3,090,462 | $ | 4,756,624 | |
| | Reinvested dividends and distributions | | | | 113,770 | | 109,771 | |
| | Shares redeemed | | | | (619,487) | | (433,264) | |
| | | | | | | | | | |
| Increase from Capital Share Transactions | | | | 2,584,745 | | 4,433,131 | |
| | | | | | | | | | |
| Net Increase in Net Assets | | | | 2,263,796 | | 4,644,252 | |
| | | | | | | | | | |
| Net Assets: | | | | | | | | |
| | Beginning of year | | | | | 4,644,252 | | - | |
| | End of year | | | | $ | 6,908,048 | $ | 4,644,252 | |
| | | | | | | | | | |
| Undistributed Net Investment Income | | | $ | 10,045 | $ | - | |
| | | | | | | | | | |
| Share Information: | | | | | | | |
| | Shares Sold | | | | | 293,900 | | 466,153 | |
| | Reinvested distributions | | | | 11,121 | | 10,839 | |
| | Shares redeemed | | | | (59,194) | | (42,160) | |
| | Net Increase in Capital Shares | | | | 245,827 | | 434,832 | |
| | Shares Outstanding, Beginning of Year | | | | 434,832 | | - | |
| | Shares Outstanding, End of Year | | | | 680,659 | | 434,832 | |
| | | | | | | | | | |
| (a) | For the period from July 7, 2010 (Date of Initial Public Investment) to May 31, 2011 | | | |
| | | | | | | | | | |
| | | | | | | | | | |
| | | | | | | | | | |
| | | | | | | | | | |
| | | | | | | | | | |
| | | | | | | | | | |
| | | | | | | | | | |
| | | | | | | | | | |
| See Notes to Financial Statements | | | | | | | |
| Presidio Multi-Strategy Fund | | | | | | | |
| | | | | | | | | | | | |
| Financial Highlights | | | | | | | |
| | | | | | | | | | | | |
| For a share outstanding during the | | | | | | | |
| fiscal years ended May 31, | | 2012 | | | 2011(a) | | |
| | | | | | | | | | | | |
| Net Asset Value, Beginning of Year | $ | 10.68 | | $ | 10.00 | | |
| | | | | | | | | | | | |
| Income (Loss) from Investment Operations | | | | | | | |
| | Net investment income (h) | | 0.19 | | | 0.09 | | |
| | Net realized and unrealized gain (loss) on securities | | (0.50) | | | 0.87 | | |
| | | | | | | | | | | | |
| Total from Investment Operations | | (0.31) | | | 0.96 | | |
| | | | | | | | | | | | |
| Less Distributions: | | | | | | | |
| | Dividends (from net investment income) | | (0.22) | | | (0.05) | | |
| | Distributions (from capital gains) | | 0.00 | (i) | | (0.23) | | |
| | | | | | | | | | | | |
| Total Distributions | | (0.22) | | | (0.28) | | |
| | | | | | | | | | | | |
| Net Asset Value, End of Year | $ | 10.15 | | $ | 10.68 | | |
| | | | | | | | | | | | |
| Total Return (d)(e) | | (2.93) | % | | 9.74 | % | |
| | | | | | | | | | | | |
| Net Assets, End of Period (in thousands) | $ | 6,908 | | $ | 4,644 | | |
| | | | | | | | | | | | |
| Average Net Assets for the Period (in thousands) | $ | 5,938 | | $ | 3,405 | | |
| | | | | | | | | | | | |
| Ratios of: | | | | | | | | | |
| Gross Expenses to Average Net Assets (f)(g) | | 1.74 | % | | 1.74 | % | (b) |
| Net Expenses to Average Net Assets (f) | | 1.74 | % | | 1.74 | % | (b) |
| Net Investment Income to Average Net Assets (h) | | 2.07 | % | | 1.24 | % | (b) |
| | | | | | | | | | | | |
| Portfolio turnover rate | | 4.90 | % | | 51.01 | % | (c) |
| | | | | | | | | | | | |
| (a) | For the period from July 7, 2010 (Date of Initial Public Investment) to May 31, 2011. | | | | |
| (b) | Annualized. | | | | | | | | |
| (c) | Not annualized. | | | | | | | |
| (d) | Total return does not reflect sales charge, if any. | | | | | | | |
| (e) | Includes adjustments in accordance with accounting principles generally accepted in the United States and, | | |
| | consequently, the net asset value for financial reporting purposes and the returns based upon those net asset | | |
| | values may differ from the net asset values and returns for shareholder transactions. | | | | | |
| (f) | The expense ratios listed reflect total expenses prior to any waivers and reimbursements (gross expense ratio) | | |
| | and after any waivers and reimbursements (net expense ratio). | | | | | | | |
| (g) | Does not include expenses of the investment companies in which the Fund invests. | | | | | |
| (h) | Recognition of net investment income by the Fund is affected by the timing of the declaration of dividends | |
| | by the underlying investment companies in which the Fund invests. | | | | | |
| (i) | Actual amount is less than $0.01 per share | | | | | | | |
| | | | | | | | | | | | |
| | | | | | | | | | | | |
| | | | | | | | | | | | |
| See Notes to Financial Statements | | | | | | | |
Presidio Multi-Strategy Fund
Notes to Financial Statements
| 1. | Organization and Significant Accounting Policies |
The Presidio Multi-Strategy Fund (“Fund”) is a series of the Starboard Investment Trust (“Trust”). The Trust is organized as a Delaware statutory trust and is registered under the Investment Company Act of 1940, as amended (the “1940 Act”), as an open-end management investment company. The Fund is a separate diversified series of the Trust. The investment objective of the Fund is to seek capital appreciation without regard to current income.
The Fund’s investment advisor, Presidio Capital Investments, LLC (the “Advisor”), seeks to achieve the Fund’s investment objective by investing in a globally diversified portfolio of (i) domestic and foreign equity securities, (ii) domestic and foreign government and corporate debt securities, including Exchange Traded Notes (“ETNs”) and “junk bonds” and (iii) options and futures on currencies and commodities. The Fund may invest in these securities directly or indirectly through investments in other investment companies including Exchange Traded Funds (“ETFs”). The Fund’s investment policy may be changed without shareholder approval upon prior written notice to shareholders.
The Advisor’s methodology is based upon analysis that seeks to measure the risk and volatility of asset classes, macroeconomic factors of relative valuations between asset classes, world economies, economic sectors, and individual securities within those asset classes and industry sectors relative to the potential and expected return of those asset classes and individual securities within asset classes over comparable time periods. The Fund’s portfolio is constructed using a multi-faceted analysis designed to contribute to and balance the level of risk and return of the Fund’s portfolio.
The following accounting policies have been consistently followed by the Fund and are in conformity with accounting principles generally accepted in the United States of America in the investment company industry.
Investment Valuation
The Fund’s investments in securities are carried at fair value. Investments in funds within the Presidio Multi-Strategy Fund are valued based on the net asset values as reported by the underlying funds Securities listed on an exchange or quoted on a national market system are valued at the last sales price as of 4:00 p.m. Eastern Time. Securities traded in the NASDAQ over-the-counter market are generally valued at the NASDAQ Official Closing Price. Other securities traded in the over-the-counter market and listed securities for which no sale was reported on that date are valued at the most recent bid price. Securities and assets for which representative market quotations are not readily available (e.g., if the exchange on which the portfolio security is principally traded closes early or if trading of the particular portfolio security is halted during the day and does not resume prior to the Fund’s net asset value calculation) or which cannot be accurately valued using the Fund’s normal pricing procedures are valued at fair value as determined in good faith under policies approved by the Trustees. A portfolio security’s “fair value” price may differ from the price next available for that portfolio security using the Fund’s normal pricing procedures. Instruments with maturities of 60 days or less are valued at amortized cost, which approximates market value.
Option Valuation
Exchange-listed options are valued at their last quoted sales price as reported on their primary exchange as of 4:00 p.m. Eastern Time (the “Valuation Time”). For purposes of determining the primary exchange for each exchange-traded portfolio option the following shall apply: (i) if the option is traded on the Chicago Board Options Exchange (“CBOE”), the CBOE shall be considered the primary exchange for such option, unless the Advisor instructs the Administrator in writing to use a different exchange as the primary exchange for such option; and (ii) if the option does not trade on the CBOE, the Advisor shall instruct the Administrator in writing as to the primary exchange for such option. Unlisted options for which market quotations are readily available are valued at the last quoted sales price at the Valuation Time. If an option is not traded on the valuation date, the option shall be priced at the mean of the last quoted bid and ask prices as of the Valuation Time. An option may be valued using Fair Valuation when (i) the option does not trade on the valuation date; and (ii) reliable last quoted bid and ask prices as of the Valuation Time are not readily available.
Option Writing
When the Fund writes an option, an amount equal to the premium received by the Fund is recorded as a liability and is subsequently adjusted to the current fair value of the option written. Premiums received from writing options that expire unexercised are treated by the Fund on the expiration date as realized gains from investments. The difference between the premium and the amount paid on effecting a closing purchase transaction, including brokerage commissions, is also treated as a realized gain or loss (depending on if the premium is less than the amount paid for the closing purchase
Presidio Multi-Strategy Fund
Notes to Financial Statements
transaction). If a call option is exercised, the premium is added to the proceeds from the sale of the underlying security or currency in determining whether the Fund have realized a gain or loss. If a put option is exercised, the premium reduces the cost basis of the securities purchased by the Fund. The Fund, as the writer of an option, bears the market risk of an unfavorable change in the price of the security underlying the written option.
Fair Value Measurement
The Fund has adopted ASC Topic 820, Fair Value Measurements. ASC Topic 820 defines fair value, establishes a frame work for measuring fair value and expands disclosure about fair value measurements. Various inputs are used in determining the value of the Fund's investments. These inputs are summarized in the three broad levels listed below:
Level 1: Unadjusted quoted prices in active markets for identical securities
Level 2: other significant observable inputs (including quoted prices for similar securities, interest rates, credit risk, etc.)
Level 3: significant unobservable inputs (including the Fund’s own assumptions in determining fair value of investments)
The Fund has adopted FASB guidance updating ASC Topic 820 titled, “Determining Fair Value When the Volume and Level of Activity for the Asset or Liability have Significantly Decreased and Identifying Transactions that are not Orderly” which provides guidance on determining when there has been a significant decrease in the volume and level of activity for an asset or liability, when a transaction that is not orderly, and how that information must be incorporated into fair value measurement. The guidance emphasizes that even if there has been a significant decrease in volume and level of activity for an asset or liability and regardless of the valuation techniques used, the objective of a fair value measurement remains the same.
An Investment asset’s or liability’s level within the fair value hierarchy is based on the lowest level input, individually or in aggregate, that is significant to fair value measurement.
The valuation techniques used by the Fund to measure fair value during the fiscal year ended May 31, 2012 maximized the use of observable inputs and minimized the use of unobservable inputs.
The inputs or methodology used for valuing securities are not necessarily an indication of the risk associated with investing in those securities. The following is a summary of the inputs used in valuing the Fund's assets:
| | | |
| Investments in Securities | | Total | | Level 1 | | Level 2 | | Level 3 |
| Assets | | | | | | | | |
| Exchange Traded Products | $ | 7,612,839 | $ | 7,612,839 | $ | - | $ | - |
| Common Stocks | | 181,294 | | 181,294 | | - | | - |
| Put Options Purchased | | 174,395 | | 174,395 | | - | | - |
| Call Options Purchased | | 102,430 | | 102,430 | | - | | - |
| Short-Term Investment | | 951,015 | | 951,015 | | - | | - |
| Total Assets | $ | 9,021,973 | $ | 9,021,973 | $ | - | $ | - |
| | | | | | | | | |
| Liabilities | | | | | | | | |
| Call Options Written | $ | 16,525 | $ | 16,525 | $ | - | $ | - |
| Put Options Written | | 106,934 | | 106,934 | | - | | - |
| Securities Sold Short | | 2,095,726 | | 2,095,726 | | - | | - |
| Total LIabilities | $ | 2,219,185 | $ | 2,219,185 | $ | - | $ | - |
| | | | | | | | | |
Derivative Financial Instruments
The Fund may invest in derivative financial instruments (derivatives) in order to manage risk or gain exposure to various other investments or markets. Derivatives may contain various risks including the potential inability of the counterparty to fulfill their obligations under the terms of the contract, the potential for an illiquid secondary market, and the potential for market movements which may expose the Fund to gains or losses in excess of the amounts shown on the Statement of Assets and Liabilities.
Derivatives are marked to market daily based upon quotations from market makers or the Fund’s independent pricing services and the Fund’s net benefit or obligation under the contract, as measured by the fair market value of the contract, is included in net assets on the Statements of Assets and Liabilities. Realized gain and loss and unrealized appreciation and depreciation on these contracts for the period are included in the Statement of Operations.
The following table set forth the effect of the option contracts on the Statement of Assets and Liabilities for the fiscal year ended May 31, 2012:
| Derivative Type | Location | | Fair Value |
| Equity Contracts – purchased options | Investments, at value | $ | 276,825 |
| Equity Contracts – written options | Options written, at value | | 123,459 |
The following table sets forth the effect of the option contracts on the Statement of Operations for the fiscal year ended May 31, 2012:
| Derivative Type | Location | Gains (Losses) | |
| Equity Contracts – purchased options | Net realized gain (loss) from investment transactions | $(455,587) | |
| Equity Contracts – written options | Net realized gain (loss) from investment transactions | 473,819 | |
| Equity Contracts – purchased options | Change in unrealized appreciation (depreciation) on investments | 51,661 | |
| Equity Contracts – written options | Change in unrealized appreciation (depreciation) on investments | 3,386 | |
From the above mentioned losses, no component was excluded from assessment of hedge and no amount of hedge was treated as ineffective. See Derivative Financial Instruments and Option Writing under Note 1 for additional information on the Fund’s purposes for entering into derivative contracts and associated risks.
Foreign Currency Translation
Portfolio securities and other assets and liabilities denominated in foreign currencies are translated into U.S. dollars based on the exchange rate of such currencies against U.S. dollars on the date of valuation. Purchases and sales of securities and income items denominated in foreign currencies are translated into U.S. dollars at the exchange rate in effect on the transaction date.
The Fund does not separately report the effect of changes in foreign exchange rates from changes in market prices on securities held. Such changes are included in net realized and unrealized gain or loss from investments.
Realized foreign exchange gains or losses arise from sales of foreign currencies, currency gains or losses realized between the trade and settlement dates on securities transactions and the difference between the recorded amounts of dividends, interest, and foreign withholding taxes, and the U.S. dollar equivalent of the amounts actually received or paid. Net unrealized foreign exchange gains and losses arise from changes in foreign exchange rates on foreign denominated assets and liabilities other than investments in securities held at the end of the reporting period.
Investment Transactions and Investment Income
Investment transactions are accounted for as of the date purchased or sold (trade date). Dividend income is recorded on the ex-dividend date. Certain dividends from foreign securities will be recorded as soon as the Fund is informed of the dividend if such information is obtained subsequent to the ex-dividend date. Interest income is recorded on the accrual basis and includes amortization of discounts and premiums. Gains and losses are determined on the identified cost basis, which is the same basis used for federal income tax purposes.
Presidio Multi-Strategy Fund
Notes to Financial Statements
Expenses
The Fund bears expenses incurred specifically on its behalf as well as a portion of general expenses, which are allocated according to methods reviewed annually by the Trustees.
Dividend Distributions
The Fund may declare and distribute dividends from net investment income (if any) quarterly. Distributions from capital gains (if any) are generally declared and distributed annually. Dividends and distributions to shareholders are recorded on ex-date.
Estimates
The preparation of financial statements in conformity with accounting principles generally accepted in the United States of America requires management to make estimates and assumptions that affect the reported amounts of assets and liabilities and disclosure of contingent assets and liabilities at the date of the financial statements and the reported amounts of increases and decreases in the net assets from operations during the reported period. Actual results could differ from those estimates.
Federal Income Taxes
No provision for income taxes is included in the accompanying financial statements, as the Fund intends to distribute to shareholders all taxable investment income and realized gains and otherwise comply with Subchapter M of the Internal Revenue Code applicable to regulated investment companies.
| 2. | Transactions with Affiliates & Service Providers |
Advisor
As full compensation for the investment advisory services provided to the Fund, the Advisor receives a monthly fee based on the Fund’s average daily net assets. The Advisor shall receive an investment advisory fee equal to an annualized rate of 1.00% of the average daily net assets of the Fund. The fee paid to the Advisor is calculated by multiplying the average daily net assets of the Fund by the highest applicable annual rate. In accordance with these terms, the Fund paid $59,315 in advisory fees for the fiscal year ended May 31, 2012.
Administrator
The Nottingham Company (“Administrator”) assists the Trust in the performance of its administrative responsibilities to the Fund, coordinates and pays for the services of each vendor and the operating expense to the Fund, and provides the Fund with certain administrative, fund accounting, and compliance services. As part of its services and consolidated fee arrangement, the Administrator receives compensation based on the Fund’s average daily net assets. The annual rate is 0.500% if the average daily net assets are under $51 million and gradually decreases to an annual rate of 0.078% if the average daily net assets are $1,095,000,000 or more. The fee paid to the Administrator is calculated by multiplying the average daily net assets of the Fund by the highest applicable annual rate. The Advisor has entered into an Operating Plan with the Fund’s administrator under which it has agreed to assume certain fees of the administrator to the extent such fees exceed the maximum of 1.75% of the average daily net assets of the Fund to be paid by the Fund to the administrator under its consolidated fee arrangement. The Advisor cannot recoup from the Fund any amounts paid by the Advisor to the Administrator under the Operating Plan.
The fee paid to the Administrator is calculated by multiplying the average daily net assets of the Fund by the highest applicable annual rate. The Administrator pays all expenses not assumed by the Advisor, including, without limitation: the fees and expenses of its independent accountants and of its legal counsel; the costs of printing and mailing to shareholders annual and semi-annual reports, proxy statements, prospectuses, statements of additional information and supplements thereto; the costs of printing registration statements; bank transaction charges and custodian’s fees; any proxy solicitors’ fees
Presidio Multi-Strategy Fund
Notes to Financial Statements
and expenses; filing fees; any federal, state or local income or other taxes; any interest; any membership fees of the Investment Company Institute and similar organizations; fidelity bond and Trustees’ liability insurance premiums. The Fund paid $29,658 in administration fees for the fiscal year ended May 31, 2012.
Compliance Services
Nottingham Compliance Services, LLC (“NCS”), a fully owned affiliate of the Administrator, provides services which assist the Trust’s Chief Compliance Officer in monitoring and testing the policies and procedures of the Trust in conjunction with requirements under Rule 38a-1 of the 1940 Act. NCS is entitled to receive compensation from the Administrator pursuant to the Administrator’s fee arrangements with the Fund.
Transfer Agent
Nottingham Shareholder Services, LLC (“Transfer Agent”) serves as transfer, dividend paying, and shareholder servicing agent for the Fund. For its services, the Transfer Agent is entitled to receive compensation from the Administrator pursuant to the Administrator’s fee arrangements with the Fund.
Distributor
Capital Investment Group, Inc. (the “Distributor”) serves as the Fund’s principal underwriter and distributor. For its services, the Distributor is entitled to receive compensation from the Administrator pursuant to the Administrator’s fee arrangements with the Fund.
Certain Trustees and officers of the Trust may also be officers of the Advisor, the Distributor, the Administrator, or NCS.
Because the underlying funds have varied expense and fee levels and the Fund may own different proportions of underlying funds at different times, the amount of fees and expense incurred indirectly by the Fund will vary.
| 3. | Distribution and Service Fees |
The Trustees, including a majority of the Trustees who are not “interested persons” of the Trust as defined in the 1940 Act and who have no direct or indirect financial interest in such plan or in any agreement related to such plan, adopted a distribution plan pursuant to Rule 12b-1 of the 1940 Act (the “Plan”). The 1940 Act regulates the manner in which a regulated investment company may assume expenses of distributing and promoting the sales of its shares and servicing of its shareholder accounts. The Plan provides that the Fund may incur certain expenses, which may not exceed 0.25% per annum of the Fund’s average daily net assets for each year elapsed subsequent to adoption of the Plan, for payment to the Distributor and others for items such as advertising expenses, selling expenses, commissions, travel or other expenses reasonably intended to result in sales of shares of the Fund or support servicing of shareholder accounts. For the fiscal year ended May 31, 2012, $14,829 in fees were incurred by the distributor.
| 4. | Purchases and Sales of Investment Securities |
For the fiscal year ended May 31, 2012, the aggregate cost of purchases and proceeds from sales of investment securities (excluding short-term securities) were as follows:
| Fiscal Year Ended | Purchases of Securities | Proceeds from Sales of Securities |
| May 31, 2012 | $8,492,228 | $6,189,361 |
There were no long-term purchases or sales of U.S Government Obligations during the fiscal year ended May 31, 2012.
Presidio Multi-Strategy Fund
Notes to Financial Statements
| Option Contracts Written for the fiscal year ended May 31, 2012 | Number of Contracts | | Premiums Received |
| Options Outstanding, Beginning of Year | 768 | | $ 145,213 |
| Options written | 4,582 | | 955,729 |
| Options closed | (2,358) | | (567,386) |
| Options exercised | - | | - |
| Options expired | (2,249) | | (352,358) |
| Options Outstanding, End of Year | 743 | | $ 181,198 |
Distributions are determined in accordance with Federal income tax regulations, which differ from generally accepted accounting principles, and, therefore, may differ significantly in amount or character from net investment income and realized gains for financial reporting purposes. Financial reporting records are adjusted for permanent book/tax differences to reflect tax character but are not adjusted for temporary differences. For the fiscal year ended May 31, 2012, there were no differences between the book and the tax treatment of the distributions.
Management has analyzed the Fund’s tax positions for all open tax years (current and prior three tax years, is applicable) and determined that the implementation of ASC Topic 740 “Accounting for Uncertainty in Income Taxes” had no impact on the Fund’s net assets or results of operations. As of and during the fiscal year ended May 31, 2012, the Fund does not have a liability for uncertain tax positions. The Fund recognizes interest and penalties, if any, related to unrecognized tax benefits as income tax expense in the statement of operations. During the period, the Fund did not incur any interest or penalties.
On May 31, 2012, the tax-basis cost of investments and components of distributable earnings were as follows:
| Cost of Investments | | | $ | 6,783,267 |
| | | | | |
| Unrealized Appreciation | | | $ | 534,874 |
| Unrealized Depreciation | | | | (515,353) |
| Net Unrealized Appreciation | | | | 19,521 |
| Undistributed Ordinary Income | | | | 154,332 |
| Undistributed Long-term Capital Gain | | | | 1,407 |
| Other Book/Tax Differences | | | | (284,265) |
| | | | | |
| Distributable Earnings | | | | $ (109,005) |
| | | | | |
| 7. | Commitments and Contingencies |
Under the Trust’s organizational documents, its officers and Trustees are indemnified against certain liabilities arising out of the performance of their duties to the Fund. In addition, in the normal course of business, the Trust entered into contracts with its service providers, on behalf of the Fund, and others that provide for general indemnifications. The Fund’s maximum exposure under these arrangements is unknown, as this would involve future claims that may be made against the Fund. The Fund expects risk of loss to be remote.
Presidio Multi-Strategy Fund
Notes to Financial Statements
| 8. | Financial Instruments with Off-Balance Sheet Risk or Concentrations of Credit Risk |
Leverage
The Fund intends to utilize leverage, including the use of borrowed funds, in equity trading and may use leverage as well in certain types of options, such as puts, calls, and warrants. While such strategies and techniques increase the opportunity to achieve higher returns on amounts invested, they also substantially increase the risk of loss.
Securities sold short represent obligations of the Fund to deliver the specified security at the contracted price and, thereby, create a liability to repurchase the security in the market at prevailing prices. Accordingly, these transactions result in off-balance sheet risk as the Fund’s satisfaction of the obligations may exceed the amount recognized in the statement of financial condition. As of May 31, 2012, there were $2,095,726 of securities sold short by the Fund.
| 9. | New Accounting Pronouncements |
In May 2011, the FASB issued ASU No. 2011-04 “Amendments to Achieve Common Fair Value Measurement and Disclosure Requirements.” ASU No. 2011-04 amends FASB ASC Topic 820, Fair Value Measurements and Disclosures, to establish common requirements for measuring fair value and for disclosing information about fair value measurements in accordance with GAAP and International Financial Reporting Standards (“IFRS”). ASU No. 2011-04 is effective for fiscal years beginning after December 15, 2011 and for interim periods within those fiscal years.
In accordance with the adoption of ASC Topic 855, Subsequent Events, and in preparing these financial statements, the Fund has evaluated the need for disclosures and/or adjustments resulting from subsequent events through the date of issuance of these financial statements. This evaluation did not result in any subsequent events that necessitated disclosures and/or adjustments.
REPORT OF INDEPENDENT REGISTERED PUBLIC ACCOUNTING FIRM
To the Shareholders, Trustees and
Audit Committee of Presidio Multi-Strategy Fund
We have audited the accompanying statement of assets and liabilities of the Presidio Multi-Strategy Fund (the “Fund”, one of the series constituting the Starboard Investment Trust), including the schedule of investments as of May 31, 2012, and the related statements of operations for the year then ended, the statements of changes in net assets and the financial highlights for the year then ended and the period from July 7, 2010 (Date of Initial Public Investments) to May 31, 2011. These financial statements and financial highlights are the responsibility of the Fund’s management. Our responsibility is to express an opinion on these financial statements and financial highlights based on our audits.
We conducted our audits in accordance with the standards of the Public Company Accounting Oversight Board (United States). Those standards require that we plan and perform the audit to obtain reasonable assurance about whether the financial statements and financial highlights are free of material misstatement. The Fund is not required to have, nor were we engaged to perform, an audit of its internal control over financial reporting. Our audits included consideration of internal control over financial reporting as a basis for designing audit procedures that are appropriate in the circumstances, but not for the purpose of expressing an opinion on the effectiveness of the Fund’s internal control over financial reporting. Accordingly, we express no such opinion. An audit also includes examining, on a test basis, evidence supporting the amounts and disclosures in the financial statements, assessing the accounting principles used and significant estimates made by management, as well as evaluating the overall financial statement presentation. Our procedures included confirmation of the securities owned as of May 31, 2012, by correspondence with the custodian and brokers. We believe that our audits provide a reasonable basis for our opinion.
In our opinion, the financial statements and financial highlights referred to above present fairly, in all material respects, the financial position of Presidio Multi-Strategy Fund as of May 31, 2012, and the results of its operations for the year then ended, the changes in net assets and the financial highlights for the year then ended and the period from July 7, 2010 (Date of Initial Public Investments) to May 31, 2011 in conformity with accounting principles generally accepted in the United States of America.
| Chicago, Illinois |
| | |
| July 23, 2012 | |
| | |
Presidio Multi-Strategy Fund
Additional Information
(Unaudited)
| 1. | Proxy Voting Policies and Voting Record |
A copy of the Trust’s Proxy Voting and Disclosure Policy and the Advisor’s Disclosure Policy are included as Appendix B to the Fund’s Statement of Additional Information and are available, without charge, upon request, by calling 1-800-773-3863, and on the website of the Security and Exchange Commission (“SEC”) at http://www.sec.gov. Information regarding how the Fund voted proxies relating to portfolio securities during the most recent period ended June 30, is available (1) without charge, upon request, by calling the Fund at the number above and (2) on the SEC’s website at http://www.sec.gov.
| 2. | Quarterly Portfolio Holdings |
The Fund files its complete schedule of portfolio holdings with the SEC for the first and third quarters of each fiscal year on Form N-Q. The Fund’s Forms N-Q are available on the SEC’s website at http://www.sec.gov. You may review and make copies at the SEC’s Public Reference Room in Washington, D.C. Information on the operation of the Public Reference Room may be obtained by calling the SEC at 202-942-8090. You may also obtain copies without charge, upon request, by calling the Fund toll-free at 1-800-773-3863.
We are required to advise you within 60 days of the Fund’s fiscal year-end regarding the federal tax status of certain distributions received by shareholders during each fiscal year. The following information is provided for the Fund’s fiscal year ended May 31, 2012.
During the fiscal year, the Fund paid a long-term capital gain distribution of $95.
Individual shareholders are eligible for reduced tax rates on qualified dividend income. For the purposes of computing the dividends eligible for reduced tax rates, all of the dividends paid by the funds from ordinary income earned during the fiscal year are considered qualified dividend income.
Corporate shareholders may exclude up to 70% of qualifying dividends. For the purposes of computing this exclusion, all of the dividends paid by the fund from ordinary income earned during the fiscal year represent qualifying dividends.
Dividend and distributions received by retirement plans such as IRAs, Keogh-type plans and 403(b) plans need not be reported as taxable income. However, many retirement plans may need this information for their annual information meeting.
| 4. | Schedule of Shareholder Expenses |
As a shareholder of the Fund, you incur two types of costs: (1) transaction costs, which may include sales charges (loads) on purchase payments and (2) ongoing costs, including investment advisory fees; distribution (12b-1) fees; and other Fund expenses. This example is intended to help you understand your ongoing costs (in dollars) of investing in the Fund and to compare these costs with the ongoing costs of investing in other mutual funds. The example is based on an investment of $1,000 invested at the beginning of the period and held for the entire period as indicated below.
Actual Expenses – The first line of the table below provides information about the actual account values and actual expenses. You may use the information in this line, together with the amount you invested, to estimate the expenses that you paid over the period. Simply divide your account value by $1,000 (for example, an $8,600 account value divided by $1,000 = 8.6), then multiply the result by the number in the first line under the heading entitled “Expenses Paid During Period” to estimate the expenses you paid on your account during this period.
Hypothetical Example for Comparison Purposes – The last line of the table below provides information about hypothetical account values and hypothetical expenses based on the Fund’s actual expense ratio and an assumed annual rate of return of 5% before expenses, which is not the Fund’s actual return. The hypothetical account values and expenses may not be used to estimate the actual ending account balance or expenses you paid for the period. You may use this information to compare the ongoing costs of investing in the Fund and other funds by comparing this 5% hypothetical example with the 5% hypothetical examples that appear in the shareholder reports of other funds.
Presidio Multi-Strategy Fund
Additional Information
(Unaudited)
| Presidio Multi-Strategy Fund | Beginning Account Value December 1, 2011 | Ending Account Value May 31, 2012 | Expenses Paid During Period* |
Actual Hypothetical (5% annual return before expenses) | | | |
| $1,000.00 | $ 987.40 | $8.67 |
| $1,000.00 | $1,016.34 | $8.80 |
Expenses are equal to the average account value over the period multiplied by the Fund’s annualized expense ratio, multiplied by the number of days in the most recent period divided by the number of days in the fiscal year (to reflect the initial period).
| 5. | Approval of Advisory Agreement |
The Advisor supervises the investments of the Fund pursuant to an Investment Advisory Agreement. At a meeting of the Fund’s Board of Trustees on January 26, 2012, the Trustees unanimously approved the renewal of the Investment Advisory Agreement for another year. In considering whether to approve the renewal of the Investment Advisory Agreement, the Trustees reviewed and considered the information they deemed reasonably necessary, including the following material factors: (i) the nature, extent, and quality of the services provided by the Advisor; (ii) the investment performance of the Fund and the Advisor; (iii) the costs of the services provided and profits realized by the Advisor and its affiliates from the relationship with the Fund; (iv) the extent to which economies of scale would be realized as the Fund grows and whether advisory fee levels reflect those economies of scale for the benefit of the Fund’s investors; (v) the Advisor’s practices regarding brokerage and portfolio transactions; and (vi) the Advisor’s practices regarding possible conflicts of interest.
At the meeting, the Trustees reviewed various informational materials including, without limitation, the Investment Advisory Agreement for the Fund; a memorandum from the Advisor to the Trustees containing information about the Advisor, its business, its finances, its personnel, its services to the Fund, and comparative expense information for other mutual funds with a strategy similar to the Fund; and a memorandum from the Fund’s legal counsel that summarized the fiduciary duties and responsibilities of the Board of Trustees in reviewing and approving the Investment Advisory Agreement, including the types of information and factors that should be considered in order to make an informed decision.
In considering the nature, extent, and quality of the services provided by the Advisor, the Trustees reviewed the responsibilities of the Advisor under the Investment Advisory Agreement. The Trustees reviewed the services being provided by the Advisor to the Fund including, without limitation, the quality of its investment advisory services since the Fund’s inception (including research and recommendations with respect to portfolio securities); its procedures for formulating investment recommendations and assuring compliance with the Fund’s investment objectives and limitations; its coordination of services for the Fund among the Fund’s service providers; and its efforts to promote the Fund, grow the Fund’s assets, and assist in the distribution of Fund shares. The Trustees noted that the Advisor utilizes a broad range of asset classes and strategies to construct a globally diversified, risk-balanced portfolio based on multiple investment strategies, including shorting and option strategies. The Trustees further noted that the principal executive and financial officer of the Fund was a principal of the Advisor and serves the Trust without additional compensation from the Fund. After reviewing the foregoing information and further information in the memorandum from the Advisor (e.g., descriptions of the Advisor’s business, the Advisor’s compliance program, and the Advisor’s Form ADV), the Board of Trustees concluded that the nature, extent, and quality of the services provided by the Advisor were satisfactory and adequate for the Fund.
In considering the investment performance of the Fund and the Advisor, the Trustees compared the performance of the Fund with the performance of its benchmark index, comparable funds with similar objectives managed by other investment advisors, and applicable peer group data (e.g., Bloomberg peer group average). The Trustees noted that the return for the one-year period ended December 31, 2011 was 2.04%, which outperformed the returns of most of the comparable funds and the peer group average, but lagged the benchmark index. The Trustees also considered the consistency of the Advisor’s
Presidio Multi-Strategy Fund
Additional Information
(Unaudited)
management of the Fund with its investment objective and policies. After reviewing the short and long-term investment performance of the Fund, the Advisor’s experience managing the Fund, the Advisor’s historical investment performance, and other factors, the Board of Trustees concluded that the investment performance of the Fund and the Advisor was satisfactory.
In considering the costs of the services provided and profits realized by the Advisor and its affiliates from the relationship with the Fund, the Trustees reviewed the Advisor’s staffing, personnel, and methods of operating; the education and experience of the Advisor’s personnel; the Advisor’s compliance program; the financial condition of the Advisor; the level of commitment to the Fund and the Advisor by the principals of the Advisor; the asset level of the Fund; and the overall expenses of the Fund, including certain prior fee waivers and reimbursements by the Advisor; and the nature and frequency of advisory fee payments. The Trustees reviewed the financial statements for the Advisor and discussed the financial stability and profitability of the firm. The Trustees noted that the Advisor either makes payments to the Administrator or directly pays for certain expenses of the Fund under an Operating Plan in order to help limit the Fund’s annual operating expenses. The Trustees further noted that the Advisor was willing to enter a collateral agreement under certain conditions to provide added assurance that the Advisor’s obligations under the Investment Advisory Agreement and Operating Plan would be met. The Trustees also considered potential benefits for the Advisor in managing the Fund, including promotion of the Advisor’s name, the ability for the Advisor to place small accounts into the Fund, and the potential for the Advisor to generate soft dollars from Fund trades that may benefit the Advisor as well. The Trustees then compared the fees and expenses of the Fund (including the management fee) to other funds comparable in terms of the type of fund, the nature of its investment strategy, and its style of investment management, among other factors. The Trustees determined that the Fund’s management fee was lower than the comparable funds, but higher than the peer group average. The Trustees also determined that the net expense ratio was higher than those of some of the comparable funds and lower than others, and higher than the peer group average. The Trustees noted that the Fund was much smaller than the peer group average. Following this comparison and upon further consideration and discussion of the foregoing, the Board of Trustees concluded that the fees paid to the Advisor by the Fund were fair and reasonable in relation to the nature and quality of the services provided by the Advisor and that they reflected charges that were within a range of what could have been negotiated at arm’s length.
In considering the extent to which economies of scale would be realized as the Fund grows and whether advisory fee levels reflect those economies of scale for the benefit of the Fund’s investors, the Trustees considered that the Fund’s fee arrangements with the Advisor. The Trustees noted that although the maximum management fee under the Investment Advisory Agreement would stay the same regardless of the Fund’s asset levels, the Advisor had agreed to make payments to the Administrator at lower asset levels in order to help limit the Fund’s expenses. The Trustees pointed out that the Fund would benefit from economies of scale under agreements with service providers other than the Advisor. In particular, it was noted that the Fund’s agreement with the Administrator would determine the Fund’s gross expenses and that this agreement utilized breakpoints in its fee schedule that allowed the Fund’s shareholders to benefit from economies of scale. Following further discussion of the Fund’s asset level, expectations for growth, and fee levels, the Board of Trustees determined that the Fund’s fee arrangements with the Advisor were fair and reasonable in relation to the nature and quality of the services provided by the Advisor.
In considering the Advisor’s practices regarding brokerage and portfolio transactions, the Trustees reviewed the Advisor’s standards, and performance in utilizing those standards, for seeking best execution for Fund portfolio transactions. The Trustees also considered the portfolio turnover rate for the Fund; the process by which evaluations are made of the overall reasonableness of commissions paid; the method and basis for selecting and evaluating the broker-dealers used; any allocation of portfolio business to persons affiliated with the Advisor; and the extent to which the Fund allocates portfolio business to broker-dealers who provide research, statistical, or other services (soft dollars). The Trustees noted, among other things, that the Fund rarely trades blocks of shares which require special handling and that the average commission rate for the Fund was under $0.02 per share. After further review and discussion, the Board of Trustees determined that the Advisor’s practices regarding brokerage and portfolio transactions were satisfactory.
Presidio Multi-Strategy Fund
Additional Information
(Unaudited)
In considering the Advisor’s practices regarding conflicts of interest, the Trustees evaluated the potential for conflicts of interest and considered such matters as the experience and ability of the advisory personnel assigned to the Fund; the method for bunching of portfolio securities transactions should the Advisor add new accounts; and the substance and administration of the Advisor’s code of ethics. Following further consideration and discussion, the Board of Trustees indicated that the Advisor’s standards and practices relating to the identification and mitigation of possible conflicts of interests were satisfactory.
Based upon all of the foregoing considerations, the Board of Trustees, including a majority of the Independent Trustees, approved the renewal of the Investment Advisory Agreement for the Fund.
| 6. | Information about Trustees and Officers |
The business and affairs of the Fund and the Trust are managed under the direction of the Board of Trustees of the Trust. Information concerning the Trustees and officers of the Trust and Fund is set forth below. Generally, each Trustee and officer serves an indefinite term or until certain circumstances such as their resignation, death, or otherwise as specified in the Trust’s organizational documents. Any Trustee may be removed at a meeting of shareholders by a vote meeting the requirements of the Trust’s organizational documents. The Statement of Additional Information of the Fund includes additional information about the Trustees and officers and is available, without charge, upon request by calling the Fund toll-free at 1-800-773-3863. The address of each Trustee and officer, unless otherwise indicated below, is 116 South Franklin Street, Rocky Mount, North Carolina 27804. The Independent Trustees each received aggregate compensation of $2,000.00 during the fiscal year ended May 31, 2012 from the Fund for their services to the Fund and Trust.
Name, Age and Address | Position held with Funds or Trust | Length of Time Served | Principal Occupation During Past 5 Years | Number of Portfolios in Fund Complex Overseen by Trustee | Other Directorships Held by Trustee During Past 5 Years |
| Independent Trustees |
Jack E. Brinson Age: 80 | Trustee | Since 7/09 | Retired; previously, President of Brinson Investment Co. (personal investments) and President of Brinson Chevrolet, Inc. (auto dealership). | 10 | Independent Trustee of the following: DGHM Investment Trust for the two series of that trust; Gardner Lewis Investment Trust for the two series of that trust; Giordano Investment Trust for the one series of that trust; Hillman Capital Management Investment Trust for the two series of that trust; Brown Capital Management Mutual Funds for the three series of the trust; and Tilson Investment Trust for the two series of that trust; (all registered investment companies); previously, Independent Trustee of New Providence Investment Trust for its one series from inception until 2011 (all registered investment companies). |
Michael G. Mosley Age: 59 | Trustee | Since 7/10 | Owner of Commercial Realty Services (real estate) since 2004. | 10 | None |
Presidio Multi-Strategy Fund
Additional Information
(Unaudited)
Name, Age and Address | Position held with Funds or Trust | Length of Time Served | Principal Occupation During Past 5 Years | Number of Portfolios in Fund Complex Overseen by Trustee | Other Directorships Held by Trustee During Past 5 Years |
Theo H. Pitt, Jr. Age: 76 | Trustee | Since 9/10 | Senior Partner, Community Financial Institutions Consulting (financial consulting) since 1999; Partner, Pikar Properties (real estate) since 2001; Account Administrator, Holden Wealth Management Group of Wachovia Securities (money management firm) from 2003-2008. | 10 | Independent Trustee of DGHM Investment Trust for its two series of that trust; Gardner Lewis Investment Trust for its two series of that trust and Hanna Investment Trust for its one series of that trust (all registered investment companies). Previously, Independent Trustee of Hillman Capital Management Investment Trust for its two series from 2000 to 2009, NCM Capital Investment Trust for its one series from 2007 to 2009, New Providence Investment Trust from 2008 to 2009, and Tilson Investment Trust for its two series from 2004 to 2009 (all registered investment companies). |
James H. Speed, Jr. Age: 58 | Trustee, Chairman | Since 7/09 | President and CEO of NC Mutual Insurance Company (insurance company) since 2003; President of Speed Financial Group, Inc. (consulting and private investments) from 2000 to 2003. | 10 | Independent Trustee of the following Hillman Capital Management Investment Trust for the two series of that trust; Brown Capital Management Mutual Funds for the three series of the trust; and Tilson Investment Trust for the two series of that trust; (all registered investment companies). Member of Board of Directors of NC Mutual Life Insurance Company. Member of Board of Directors of M&F Bancorp. Previously, Independent Trustee of New Providence Investment Trust for its one series from 2009 until 2011 (registered investment company). |
J. Buckley Strandberg Age: 52 | Trustee | Since 7/09 | President of Standard Insurance and Realty (insurance and property management) since 1982. | 10 | None |
Presidio Multi-Strategy Fund
Additional Information
(Unaudited)
Name, Age and Address | Position held with Funds or Trust | Length of Time Served | Principal Occupation During Past 5 Years | Number of Portfolios in Fund Complex Overseen by Trustee | Other Directorships Held by Trustee During Past 5 Years |
| Other Officers |
Matthew R. Lee Age: 30 1777 Borel Place, Suite 415, San Mateo, CA 94402 | President (Presidio Multi-Strategy Fund) | Since 2/10 | Chief Executive Officer of Presidio Capital Investments, LLC (advisor to the Presidio Multi-Strategy Fund) since 2006; Financial Planning Specialist with Smith Barney, a division of Citigroup Global Markets, Inc. (now known as Morgan Stanley Smith Barney) from 2004-2006; Associate at Bank of America Investments, Inc. (investment management) from 2003-2004. | n/a | n/a |
T. Lee Hale, Jr. Age: 34 | Chief Compliance Officer; Assistant Treasurer | Since 7/09 and 4/10 | Financial Reporting Manager for The Nottingham Company (fund administrator) since 2009; previously, principal of Lee Hale Contracting (marine industry consulting). | n/a | n/a |
A. Vason Hamrick Age: 35 | Secretary | Since 7/09 | Corporate Counsel for The Nottingham Company since 2004. | n/a | n/a |
Presidio Multi-Strategy Fund
is a series of| The Starboard Investment Trust |
| For Shareholder Service Inquiries: | For Investment Advisor Inquiries: |
| Nottingham Shareholder Services | Presidio Capital Investments, LLC |
| 116 South Franklin Street | 1777 Borel Place, Suite 415 |
Post Office Drawer 4365 Rocky Mount, North Carolina 27803 | San Mateo, California, 94402 |
| Toll-Free Telephone: | Toll-Free Telephone: |
| 1-800-773-3863 | 650-341-1019 |
World Wide Web @: ncfunds.com | World Wide Web @: presidio-cap.com |
Item 2. CODE OF ETHICS.
The registrant’s Board of Trustees has determined that the registrant has an audit committee financial expert, as defined in Item 3 of Form N-CSR, serving on its audit committee.
As of the date of this report, May 31, 2012, the registrant’s audit committee financial expert is Mr. James H. Speed, Jr. Mr. Speed is “independent” for purposes of Item 3 of Form N-CSR.
Item 4. PRINCIPAL ACCOUNTANT FEES AND SERVICES.
Not applicable.
A copy of the schedule of investments of unaffiliated issuers as of the close of the reporting period is included as part of the report to shareholders filed under Item 1 of this Form.
Not applicable.
Not applicable.
Item 10. SUBMISSION OF MATTERS TO A VOTE OF SECURITY HOLDERS.
Item 11. CONTROLS AND PROCEDURES.
Item 12. EXHIBITS.
Pursuant to the requirements of the Securities Exchange Act of 1934 and the Investment Company Act of 1940, the registrant has duly caused this report to be signed on its behalf by the undersigned, thereunto duly authorized.
Pursuant to the requirements of the Securities Exchange Act of 1934 and the Investment Company Act of 1940, this report has been signed below by the following persons on behalf of the registrant and in the capacities and on the dates indicated.