Washington, D.C. 20549
A. Vason Hamrick
116 South Franklin Street, Post Office Box 69, Rocky Mount, North Carolina 27802
Item 1. REPORTS TO STOCKHOLDERS.
Annual Report 2012
August 31, 2012
Roumell Opportunistic Value Fund
Institutional Class Shares
Class A Shares
This report and the financial statements contained herein are submitted for the general information of the shareholders of the Roumell Opportunistic Value Fund (the “Fund”). The Fund’s shares are not deposits or obligations of, or guaranteed by, any depository institution. The Fund’s shares are not insured by the FDIC, Federal Reserve Board or any other agency, and are subject to investment risks, including possible loss of principal amount invested. Neither the Fund nor the Fund’s distributor is a bank.
The Roumell Opportunistic Value Fund is distributed by Capital Investment Group, Inc., Member FINRA/SIPC, 17 Glenwood Ave, Raleigh, NC, 27603. There is no affiliation between the Roumell Opportunistic Value Fund, including its principals, and Capital Investment Group, Inc.
Statements in this Annual Report that reflect projections or expectations of future financial or economic performance of the Roumell Opportunistic Value Fund (“Fund”) and of the market in general and statements of the Fund’s plans and objectives for future operations are forward-looking statements. No assurance can be given that actual results or events will not differ materially from those projected, estimated, assumed or anticipated in any such forward-looking statements. Important factors that could result in such differences, in addition to the other factors noted with such forward-looking statements, include, without limitation, general economic conditions such as inflation, recession and interest rates. Past performance is not a guarantee of future results.
An investment in the Fund is subject to investment risks, including the possible loss of some or the entire principal amount invested. There can be no assurance that the Fund will be successful in meeting its investment objective. Investment in the Fund is also subject to the following risks: market risk, opportunistic investment strategy risk, sector risk, non-diversified fund risk, investment advisor risk, new fund risk, operating risk, political/economic risk, small-cap and mid-cap securities risk, micro-cap securities risk, interest rate and credit risk, maturity risk, inflation risk, investment-grade securities risk, lower-rated securities or “junk bonds” risk, risks of investing in municipal securities, risks of investing in REITs, risk of investing in corporate debt securities, government debt markets may be illiquid or disrupted, foreign securities risk, and currency risk. More information about these risks and other risks can be found in the Fund’s prospectus.
The performance information quoted in this annual report represents past performance, which is not a guarantee of future results. Investment return and principal value of an investment will fluctuate so that an investor’s shares, when redeemed, may be worth more or less than their original cost. Current performance may be lower or higher than the performance data quoted. An investor may obtain performance data current to the most recent month-end by visiting www.ncfunds.com.
An investor should consider the investment objectives, risks, and charges and expenses of the Fund carefully before investing. The prospectus contains this and other information about the Fund. A copy of the prospectus is available at www.ncfunds.com or by calling Shareholder Services at 1-800-773-3863. The prospectus should be read carefully before investing.
This Annual Report was first distributed to shareholders on or about October 30, 2012.
For More Information on Your Roumell Opportunistic Value Fund:
See Our Web site @ www.ncfunds.com
or
Call Our Shareholder Services Group Toll-Free at 1-800-773-3863.

August 31, 2012
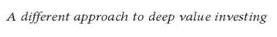
Our performance for the year ended August 31, 2012 was disappointing. The return on the Institutional class shares was -0.36%. This compares to 14.08% for the Russell 2000 Value Index, 10.85% for the 60% Russell 2000 Value Index/40% Barclays Government Credit Index, and 18.00% for the S&P 500 over the same period.
Please see the table below for the Fund’s historical performance information through the calendar quarter ended September 30, 2012.
Average Annual Total Returns | | | Net | Gross |
Period Ended September 30, 2012 | Past 1 Year | Since Inception* | Expense Ratio** | Expense Ratio*** |
Roumell Opportunistic Value Fund – Institutional Class Shares | 5.99% | -2.91% | 1.23% | 2.36% |
Russell 2000 Value Index | 32.63% | 4.54% | | |
60% Russell 2000 Value index, and 40% Barclays Capital U.S. Government/Credit Index | 20.01% | 5.74% | | |
S&P 500 Total Return Index | 30.20% | 10.39% | | |
The performance data quoted above represents past performance, which is not a guarantee of future results. Investment return and principal value of an investment in the Fund will fluctuate so that an investor's shares, when redeemed, may be worth more or less than their original cost. Current performance may be lower or higher than the performance data quoted. To obtain more current performance data regarding the Fund, including performance data current to the Fund’s most recent month-end, please visit www.ncfunds.com or call the Fund at (800)525-3863. Fee waivers and expenses reimbursements have positively impacted Fund performance.
*The Fund’s inception date is December 31, 2010.
**The Advisor has entered into an Operating Plan with the Fund’s administrator, through December 31, 2012, under which it has agreed to assume certain fees of the administrator and Acquired Fund Fees and Expenses to the extent such fees and expenses cause the Total Annual Fund Operating Expenses to exceed 1.48% of the average daily net assets of the Class A shares of the Fund or 1.23% of the average daily net assets of the Institutional Class shares of the Fund. The Operating Plan may be terminated by either party at the conclusion of the then current term upon (i) written notice of non-renewal to the other party not less than sixty days prior to the end of the term, or (ii) mutual written agreement of the parties. The Advisor cannot recoup from the Fund any amounts paid by the Advisor to the Administrator under the Operating Plan.
***Gross expense ratio is from the Fund’s prospectus dated December 29, 2011.
Our fiscal 2012 performance was a result of three primary factors: 1) The market’s realization of the intrinsic values underlying several of our core investments simply did not occur. We nonetheless remain committed to these investments, and we have taken advantage of market volatility to reduce our average cost basis in most cases. We believe our expected returns have been delayed, but will ultimately not be denied. 2) Several analytical mistakes including a poor judgment call on the character of one of our management teams. 3) A reluctance to allocate much capital to larger cap equities, which we viewed as being overvalued. We continue to believe that highly specific, special-situation equities combined with select purchases of asset-backed higher yielding corporate bonds will serve our clients well over time.
Although our performance for the year was weak, the second half of the year improved considerably as investments made over the past 12 months began to mature. Our performance numbers were accomplished with roughly 52% invested in common stocks, 21% in corporate bonds, and 27% in cash.
Our willingness to focus on high-conviction ideas weighted to have a meaningful impact on portfolio returns is a fundamental attribute of our solution. For instance, our top 10 equity holdings account for more than 70% of our equity allocation. Our top three equity investments account for about 20% of our portfolio. These securities are deeply researched, possess unique investment characteristics, and fall into our sweet spot of “out of favor, overlooked, or misunderstood” securities.
The Roumell Asset Management Investment Philosophy
Roumell Asset Management, founded in 1998, pursues long-term capital growth and income through opportunistic value investing. We believe owning a basket of deeply researched, conservatively financed securities, which are overlooked by Wall Street and thus able to be bought cheaply, maximizes the probability of solid returns over time. The firm adheres to the following approach:
| · | We analyze a company as a private business. The price we pay for a common stock must be at a substantial discount to what we believe the issuer is worth as a private company. We ask ourselves if we would want to own the entire company at the price being offered. |
| · | We find value by pursuing securities that are out of favor, overlooked, or misunderstood, where an analytical or informational edge is more likely, as compared to popular securities, which are well understood by most investors. |
| · | In the absence of compelling investment opportunities, we hold cash. |
| · | We invest predominantly in companies with strong balance sheets, an approach that we believe dramatically reduces our risk of permanent loss of capital. The companies in which we invest possess valuable assets, tend to have substantial cash positions, and are typically unencumbered by significant liabilities. |
| · | Roumell does not share the common view that volatility is risk. While volatility can be distressing, it creates exceptional investment opportunities for those poised to exploit it. Further, it offers us the chance to reduce the average cost on our existing positions. We simply believe thorough research and a great price ultimately trump the discomfort of volatility. |
| · | Because our investments are based on specific knowledge, we have less of a need to over-diversify. We typically invest about 5% of our portfolio in each of our highest-conviction ideas, whereas most mutual funds often invest only 2% in high-conviction ideas. We believe that our best ideas deserve much more of our capital. |
| · | Management teams with whom we partner are measured by integrity, drive, competence as operators and capital allocators, and incentives to do right by shareholders. |
| · | We invest in corporate bonds, most often supported by hard assets, that offer attractive yields and are protected by rights to claim assets ahead of common and preferred stock. |
| · | Our research process is relentless and includes regular travel to see management teams, assets, customers, and competitors firsthand. |
| · | We measure ourselves on a rolling three-year basis because the gap between market value and intrinsic value often does not close in one quarter or even one year. |
| · | When our target price is met, we sell. |
| · | We believe that the temperament to remain steadfast in our analytical conviction, especially when others are consumed by fear or blinded by enthusiasm, is necessary in order to obtain superior long-term returns. Further, flexibility must be maintained in order to avoid the pitfalls of overconfidence. |
Higgs Boson, Markowitz, and Graham
A “unified theory” has long been the Holy Grail in theoretical physics that could account for both subatomic and universal realities. It appears the field has made a giant leap forward with the recent discovery of the Higgs boson particle, commonly referred to as the “God particle.” Higgs boson accounts for the various strains of information, analyses, and data that physicists, working with different approaches, have gained over the years from their efforts to better understand our universe. While some physicists prefer to focus on big-picture questions like how time and space interact, others prefer to ask why some particles have mass, while others, such as light, do not. Different starting points, same goal: knowledge.
Although investing is certainly not a hard science, it too has long pursued its own unified theory. On the one hand, financial planners and advisers use asset allocation to construct portfolios with multiple asset classes in order to spread risk and reduce volatility. Harry M. Markowitz is known for his pioneering work on Modern Portfolio Theory. Markowitz’s Portfolio Selection, which he wrote in 1952 while a graduate student at the University of Chicago, serves as the framework for planners using asset allocation as the primary portfolio construction tool. Markowitz argued that a portfolio should be designed using uncorrelated asset classes to maximize returns with the greatest efficiency (reduced volatility).
The shortcomings of the asset allocation model include today’s high level of correlation among asset classes. In addition, performance is tied to overall market returns and leaves little opportunity to exploit market inefficiencies. Of course, many investors in this camp believe security prices reflect all known information and are thus always efficiently priced.
In contrast to the investment allocators are individual securities investors. For value investors like us, Benjamin Graham wrote the gospel with its emphasis on specific security characteristics, margin of safety, and the temperament to see the process to fruition. Graham elegantly stated in 1934, “The field of analytical work may be said to rest upon a two-fold assumption: first, that the market price is frequently out of line with the true value; and, second, that there is an inherent tendency for those disparities to correct themselves.”
The mantra for security-specific investors is that market price diverges from intrinsic value often enough to add investment value, particularly in smaller overlooked and/or out- of-favor securities.
As decided adherents of the security-specific, bottom-up value investment camp, Roumell Asset Management does not begin with a belief that we should own a little of everything. Rather, we begin by searching for value in the marketplace, wherever it may be. We firmly believe that obsessing about price paid has a far greater impact on securing respectable returns than gauging what John Maynard Keynes referred to as “the average opinion of the average opinion.” There are multitudes of analysts, commentators, and investors putting forth their opinions about the upcoming direction of gold bullion, U.S. Treasury bonds, and the stock market. We have nothing of substantive value to add to this conversation. It’s not what we do.
A subtle but highly important distinction in reviewing market efficiency literature is necessary, in our view. To paraphrase Warren Buffett, the difference between markets being mostly efficient and always efficient is the difference between night and day. Interestingly, Berkshire Hathaway seeded additional capital to its two recently hired portfolio managers and gave them authority to manage the funds “exactly as they see fit.”
The reasonable question to ask then is how much should a portfolio be constructed with an emphasis on hitting all the major asset-class boxes (large cap growth, small cap value, emerging market stocks, corporate bonds, etc.) versus putting together a portfolio of security-specific-focused managers with the latitude to go anywhere in their search for value? In other words, rather than arguing about who’s “right” perhaps it’s more reasonable to simply ask: How much Markowitz and how much Graham does an investor want in his or her portfolio? An allocator only need believe that markets are inefficient enough to warrant some exposure to security-specific, bottom-up investors, be they growth or value oriented.
We do not seek to change any investor’s mind regarding investment philosophy. Rather, we want our investors to understand our investment philosophy. Our clients can trust that 100% of our own investment capital will remain invested in our portfolio options because determined research, a deep appreciation for value, a contrarian bent, and a steady temperament are what make the most sense to us.
Finally, we believe our modest size provides an investment advantage. We intend to remain of an asset size that allows us to take positions in smaller, less liquid securities that can have a meaningful impact on portfolio returns.
Best Regards,
Jim Roumell
Lead Portfolio Manager
Roumell Opportunistic Value Fund
| ROUMELL OPPORTUNISTIC VALUE FUND | | | | | | | | | | | |
| Institutional Class Shares | | | | | | | | | | | | |
| | | | | | | | | | | | | | | | | | | | |
| Performance Update (Unaudited) | | | | | | | | | | | | | |
| | | | | | | | | | | | | | | | | | | | |
| For the period from December 31, 2010 (Date of Initial Public Offering) to August 31, 2012 | |
| | | | | | | | | | | | | | | | | | | | |
| Comparison of the Change in Value of a $10,000 Investment | | | | | | | | |
|
| This graph assumes an initial investment of $10,000 at December 31, 2010 (Date of Initial Public Investment). All dividends and distributions are reinvested. This graph depicts the performance of the Roumell Opportunistic Value Fund Institutional Class Shares (the “Fund”) versus the Russell 2000 Value Index, a blend of 60% of the Russell 2000 Value Index and 40% of the Barclays Government Credit Index, and the S&P 500 Total Return Index. It is important to note that the Fund is a professionally managed mutual fund while the indices are not available for investment and are unmanaged. The comparison is shown for illustrative purposes only. |
| | | | | | | | | | | | | | | | | | | | |
| | | | | | | | | | | | | | | | | | | | |
| | | | | | | | | | | | | | | | | | | | |
| | Average Annual Total Returns | | | | | | | | | | | | | |
| | | | | | | | | | | | | | | | | | Gross | | |
| | | As of | | | | | | One | | Since | | Inception | | Expense | |
| | | August 31, 2012 | | | | | Year | | Inception | Date | | Ratio* | | |
| | | Institutional Class Shares | | | | | -0.36% | | -3.73% | | 12/31/10 | | 2.36% | | |
| | | Russell 2000 Value Index | | | | | 14.08% | | 2.59% | | N/A | | N/A | | |
| | | 60% Russell 2000 Value Index | | | | | | | | | | | | |
| | | | 40% Barclays Government Credit Index | | 10.85% | | 4.72% | | N/A | | N/A | | |
| | | S&P 500 Total Return Index | | | | | 18.00% | | 9.25% | | N/A | | N/A | | |
| | | | | | | | | | | | | | | | | | | | |
| | | | | | | | | | | | | | | | | | | | |
| * The gross expense ratio shown is from the Fund's prospectus dated December 29, 2011. | | |
| | | | | | | | | | | | | | | | | | | | |
| Performance quoted above represents past performance, which is no guarantee of future results. Investment return and principal value will fluctuate so that shares, when redeemed, may be worth more or less than their original cost. Current performance may be lower or higher than the performance data quoted. An investor may obtain performance data, current to the most recent month-end, by visiting www.ncfunds.com. |
| | | | | | | | | | | | | | | | | | | | |
| The graph and table do not reflect the deduction of taxes that a shareholder would pay on Fund distributions or the redemption of Fund shares. Average annual total returns are historical in nature and measure net investment income and capital gain or loss from portfolio investments assuming reinvestments of distributions. |
| | | | | | | | | | | | | | | | | | | | |
| ROUMELL OPPORTUNISTIC VALUE FUND | | | | | | | | | | | | | |
| Class A Shares | | | | | | | | | | | | | | |
| | | | | | | | | | | | | | | | | | | | | |
| Performance Update (Unaudited) | | | | | | | | | | | | | | |
| | | | | | | | | | | | | | | | | | | | | |
| For the period from December 31, 2010 (Date of Initial Public Offering) to August 31, 2012 | | | | | |
| | | | | | | | | | | | | | | | | | | | | |
| Comparison of the Change in Value of a $10,000 Investment | | | | | | | | | | | |
|
| | | | | | | | | | | | | | | | | | | | | |
| This graph assumes an initial investment of $10,000 ($9,550 after maximum sales load of 4.50%) at December 31, 2010 (Date of Initial Public Investment). All dividends and distributions are reinvested. This graph depicts the performance of the Roumell Opportunistic Value Fund Class A Shares (the “Fund”) versus the Russell 2000 Value Index, a blend of 60% of the Russell 2000 Value Index and 40% of the Barclays Government Credit Index, and the S&P 500 Total Return Index. It is important to note that the Fund is a professionally managed mutual fund while the indices are not available for investment and are unmanaged. The comparison is shown for illustrative purposes only. |
| | | | | | | | | | | | | | | | | | | | | |
| | | | | | | | | | | | | | | | | | | | | |
| | | | | | | | | | | | | | | | | | | | | |
| | Average Annual Total Returns | | | | | | | | | | | | | | |
| | | | | | | | | | | | | | | | | | Gross | | | |
| | | As of | | | | | | | One | | Since | | Inception | | Expense | | | |
| | | August 31, 2012 | | | | | | Year | | Inception | | Date | | Ratio* | | | |
| | | Class A Shares - No Sales Load | | | | -0.56% | | -3.96% | | 12/31/10 | | 2.61% | | | |
| | | Class A Shares - 4.50% Maximum Sales Load | | -5.03% | | -6.58% | | N/A | | N/A | | | |
| | | Russell 2000 Value Index | | | | | 14.08% | | 2.59% | | N/A | | N/A | | | |
| | | 60% Russell 2000 Value Index | | | | | | | | | | | | | |
| | | | 40% Barclays Government Credit Index | | | 10.85% | | 4.72% | | N/A | | N/A | | | |
| | | S&P 500 Total Return Index | | | | | 18.00% | | 9.25% | | N/A | | N/A | | | |
| | | | | | | | | | | | | | | | | | | | | |
| * The gross expense ratio shown is from the Fund's prospectus dated December 29, 2011. | | | |
| | | | | | | | | | | | | | | | | | | | | |
| Performance quoted above represents past performance, which is no guarantee of future results. Investment return and principal value will fluctuate so that shares, when redeemed, may be worth more or less than their original cost. Current performance may be lower or higher than the performance data quoted. An investor may obtain performance data, current to the most recent month-end, by visiting www.ncfunds.com. |
| | | | | | | | | | | | | | | | | | | | | |
| The graph and table do not reflect the deduction of taxes that a shareholder would pay on Fund distributions or the redemption of Fund shares. Average annual total returns are historical in nature and measure net investment income and capital gain or loss from portfolio investments assuming reinvestments of distributions. |
| | | | | | | | | | | | | | | | | | | | | |
| ROUMELL OPPORTUNISTIC VALUE FUND | | | | | | |
| | | | | | | | | | | |
| Schedule of Investments | | | | | | | |
| | | | | | | | | | | |
| | | | | | | | | | | |
| As of August 31, 2012 | | | | | | | |
| | | | | | | Shares | | Cost | | Value (Note 1) |
| | | | | | | | | | | |
| COMMON STOCKS - 57.80% | | | | | | | |
| | | | | | | | | | | |
| | Consumer Discretionary - 10.13% | | | | | | |
| | | Abercrombie & Fitch Co. | | | 11,500 | $ | 373,203 | $ | 413,885 |
| | * | Digital Generation, Inc. | | | 103,000 | | 1,193,682 | | 1,148,450 |
| | * | Dover Motorsports, Inc. | | | 286,711 | | 364,074 | | 429,837 |
| | | | | | | | | | | 1,992,172 |
| | Energy - 4.16% | | | | | | | |
| | * | Tetra Technologies, Inc. | | | 80,000 | | 625,518 | | 513,600 |
| | *β | Thunderbird Energy Corp. | | | 413,500 | | 52,225 | | 58,724 |
| | * | Ultra Petroleum Corp. | | | 12,000 | | 290,826 | | 246,840 |
| | | | | | | | | | | 819,164 |
| | Financials - 4.22% | | | | | | | |
| | * | American Safety Insurance Holdings Ltd. | | 35,300 | | 668,665 | | 608,219 |
| | α | Saizen REIT | | | 1,750,000 | | 213,287 | | 221,821 |
| | | | | | | | | | | 830,040 |
| | Industrials - 8.68% | | | | | | | |
| | * | Tecumseh Products Co. Cl. A | | 312,000 | | 1,847,403 | | 1,650,480 |
| | * | Tecumseh Products Co. Cl. B | | 10,400 | | 35,464 | | 58,136 |
| | | | | | | | | | | 1,708,616 |
| | Information Technology - 28.44% | | | | | | |
| | * | Checkpoint Systems, Inc. | | | 80,000 | | 839,867 | | 640,000 |
| | * | Compuware Corp. | | | 81,000 | | 632,623 | | 809,190 |
| | * | Dell, Inc. | | | 37,000 | | 468,245 | | 391,830 |
| | * | DSP Group, Inc. | | | 91,000 | | 647,310 | | 521,430 |
| | * | Gilat Satellite Networks Ltd. | | | 126,000 | | 526,443 | | 400,680 |
| | | QAD, Inc. Cl. A | | | 43,900 | | 458,442 | | 537,775 |
| | | QAD, Inc. Cl. B | | | 9,500 | | 99,599 | | 111,435 |
| | * | Seachange International, Inc. | | 122,000 | | 982,155 | | 995,520 |
| | * | Sierra Wireless Inc | | | 79,400 | | 698,338 | | 689,192 |
| | | Tellabs, Inc. | | | 6,540 | | 39,485 | | 23,217 |
| | * | Transact Technologies, Inc. | | | 66,300 | | 752,011 | | 475,371 |
| | | | | | | | | | | 5,595,640 |
| | | | | | | | | | | |
| | | | | | | | | | | |
| | | | | | | | | | | (Continued) |
| ROUMELL OPPORTUNISTIC VALUE FUND | | | | | | |
| | | | | | | | | | | |
| Schedule of Investments | | | | | | | |
| | | | | | | | | | | |
| | | | | | | | | | | |
| As of August 31, 2012 | | | | | | | |
| | | | | | | Shares | | Cost | | Value (Note 1) |
| | | | | | | | | | | |
| | Materials - 2.17% | | | | | | | |
| | *β | Sandstorm Metals & Energy Ltd. | | 1,425,000 | | 405,041 | | 426,430 |
| | | | | | | | | | | 426,430 |
| | | | | | | | | | | |
| | | Total Common Stocks (Cost $12,213,907) | | | | | 11,372,062 |
| | | | | | | | | | | |
| EXCHANGE TRADED PRODUCT - 1.46% | | | | | | |
| | | Market Vectors Gold Miners ETF | | 6,000 | | 285,320 | | 287,641 |
| | | | | | | | | | | |
| | | Total Exchange Traded Product (Cost $285,320) | | | | 287,641 |
| | | | | | | | | | | |
| SHORT-TERM INVESTMENT - 17.61% | | | | | | |
| | § | Federated Treasury Obligations Fund, 0.01% | 3,465,648 | $ | 3,465,648 | $ | 3,465,648 |
| | | | | | | | | | | |
| | | Total Short-Term Investment (Cost $3,465,648) | | | | 3,465,648 |
| | | | | | | | | | | |
| | | | | Principal | | Interest Rate | | Maturity Date | | |
| CORPORATE BONDS - 21.54% | | | | | | |
| | | Chesapeake Energy Corp. | 590,000 | | 7.250% | | 12/15/2018 | | 618,025 |
| | | Clayton Williams Energy, Inc. | 570,000 | | 7.750% | | 4/1/2019 | | 565,725 |
| | | Comstock Resources, Inc. | 985,000 | | 7.750% | | 4/1/2019 | | 970,225 |
| | | Goodrich Petroleum Corp. | 950,000 | | 8.875% | | 3/15/2019 | | 921,500 |
| | | Stone Energy Corp. | 490,000 | | 6.750% | | 12/15/2014 | | 490,000 |
| | | Stonemor Operating LLC | 675,000 | | 10.250% | | 12/1/2017 | | 673,313 |
| | | | | | | | | | | |
| | | Total Corporate Bonds (Cost $4,220,793) | | | | | | 4,238,788 |
| | | | | | | | | | | |
| CONVERTIBLE BONDS - 0.57% | | | | | | | |
| | | GMX Resources, Inc. | 265,000 | | 4.500% | | 5/1/2015 | | 111,631 |
| | | | | | | | | | | |
| | | Total Convertible Bonds (Cost $199,043) | | | | | | 111,631 |
| | | | | | | | | | | |
| | | | | | | | | | | |
| | | | | | | | | | | |
| | | | | | | | | | | |
| | | | | | | | | | | (Continued) |
| ROUMELL OPPORTUNISTIC VALUE FUND | | | | | | |
| | | | | | | | | | | |
| Schedule of Investments | | | | | | | |
| | | | | | | | | | | |
| | | | | | | | | | | |
| As of August 31, 2012 | | | | | | | |
| | | | | | | | | | | Value (Note 1) |
| | | | | | | | | | | |
| Total Value of Investments (Cost $20,384,711) - 98.98% | | | $ | 19,475,770 |
| | | | | | | | | | | |
| Other Assets in Excess of Liabilities - 1.02% | | | | | | 199,093 |
| | | | | | | | | | | |
| | Net Assets - 100% | | | | | | $ | 19,674,863 |
| | | | | | | | | | | |
| * | Non-income producing investment | α | Singapore security | | |
| § | Represents 7 day effective yield | β | Canadian security | | |
| | | | | | | | | | | |
| | The following acronyms are used in this portfolio: | | | | |
| | REIT - Real Estate Investment Trust | | LLC - Limited Liability Company |
| | | | | | | | | | | |
| | | | | | | | | | | |
| | | | | | | | | | | |
| | | | Summary of Investments by Sector | | | | | | |
| | | | | | | % of Net | | | | |
| | | | Sector | | | Assets | | Value | | |
| | | | Consumer Discretionary | | 10.13% | $ | 1,992,172 | | |
| | | | Energy | | | 4.16% | | 819,164 | | |
| | | | Financials | | | 4.22% | | 830,040 | | |
| | | | Industrials | | | 8.68% | | 1,708,616 | | |
| | | | Information Technology | | | 28.44% | | 5,595,640 | | |
| | | | Materials | | | 2.17% | | 426,430 | | |
| | | | Exchange Traded Product | | 1.46% | | 287,641 | | |
| | | | Short-Term Investment | | | 17.61% | | 3,465,648 | | |
| | | | Convertible Bonds | | | 0.57% | | 111,631 | | |
| | | | Corporate Bonds | | | 21.54% | | 4,238,788 | | |
| | | | Total | | | 98.98% | $ | 19,475,770 | | |
| | | | | | | | | | | |
| | | | | | | | | | | |
| | | | | | | | | | | |
| | | | | | | | | | | |
| | | | | | | | | | | |
| | | | | | | | | | | |
| | | | | | | | | | | |
| See Notes to Financial Statements | | | | | | |
| ROUMELL OPPORTUNISTIC VALUE FUND | | |
| | | | | | | | |
| Statement of Assets and Liabilities | | | |
| | | | | | | | |
| | | | | | | | |
| As of August 31, 2012 | | | | |
| | | | | | | | |
| Assets: | | | | | |
| | Investments, at value (cost $20,384,711) | $ | 19,475,770 |
| | Receivables: | | | | |
| | | Fund shares sold | | | 92,225 |
| | | Dividends and interest | | | 132,146 |
| | Total assets | | | | 19,700,141 |
| | | | | | | | |
| Liabilities: | | | | |
| | Payables: | | | | |
| | | Fund shares repurchased | | | 4,626 |
| | Accrued expenses | | | | |
| | | Administration fees | | | | 5,106 |
| | | Advisory fees | | | | 15,153 |
| | | Other expenses | | | | 393 |
| | Total liabilities | | | | 25,278 |
| | | | | | | | |
| Net Assets | | | $ | 19,674,863 |
| | | | | | | | |
| Net Assets Consist of: | | | | |
| | Capital | | | $ | 20,739,280 |
| | Distributable net investment income | | 104,617 |
| | Net realized loss on investments and foreign currency transactions | | (260,093) |
| | Net unrealized depreciation on investments and | | |
| | | translation of assets and liabilities in foreign currency | | (908,941) |
| | Total Net Assets | | | $ | 19,674,863 |
| | | | | | | | |
| Institutional Class Shares outstanding, no par value (unlimited authorized shares) | 1,961,011 |
| | Net Assets | | | | 18,249,136 |
| | Net Asset Value, Offering Price and Redemption Price Per Share | $ | 9.31 |
| | | | | | | | |
| Class A Shares outstanding, no par value (unlimited authorized shares) | | 153,673 |
| | Net Assets | | | | 1,425,727 |
| | Net Asset Value, Offering Price and Redemption Price Per Share | $ | 9.28 |
| | Offering Price Per Share ($9.28 ÷ 95.50%) | $ | 9.72 |
| | | | | | | | |
| | | | | | | | |
| | | | | | | | |
| See Notes to Financial Statements | | | |
| ROUMELL OPPORTUNISTIC VALUE FUND | | |
| | | | | | | | |
| Statement of Operations | | | | |
| | | | | | | | |
| | | | | | | | |
| For the Year ended August 31, 2012 | | |
| | | | | | | | |
| Investment Income: | | | | |
| | Interest | | | $ | 334,521 |
| | Dividends | | | | 79,245 |
| | | | | | | | |
| | Total Income | | | | 413,766 |
| | | | | | | | |
| Expenses: | | | | |
| | Advisory fees (note 2) | | | 163,183 |
| | Administration fees (note 2) | | 54,986 |
| | Distribution and service fees - Class A Shares (note 3) | | 4,072 |
| | | | | | | | |
| | Total Expenses | | | | 222,241 |
| | | | | | | | |
| | Net Expenses | | | | 222,241 |
| | | | | | | | |
| Net Investment Income | | | | 191,525 |
| | | | | | | | |
| Realized and Unrealized Gain (Loss) on Investments: | | |
| | | | | | | | |
| | Net realized loss from investments and foreign currency transactions | | (247,244) |
| | Change in unrealized appreciation on investments and translation of | | |
| | | assets and liabilities in foreign currency | | 152,790 |
| | | | | | | | |
| Realized and Unrealized Loss on Investments | | (94,454) |
| | | | | | | | |
| Net Increase in Net Assets Resulting from Operations | $ | 97,071 |
| | | | | | | | |
| | | | | | | | |
| | | | | | | | |
| | | | | | | | |
| | | | | | | | |
| | | | | | | | |
| | | | | | | | |
| | | | | | | | |
| | | | | | | | |
| | | | | | | | |
| | | | | | | | |
| See Notes to Financial Statements | | |
| ROUMELL OPPORTUNISTIC VALUE FUND | | | | | | |
| | | | | | | | | | | | |
| Statements of Changes in Net Assets | | | | | | | |
| | | | | | | | | | | | |
| | | | | | | | | | | | |
| For the Year ended August 31, | | | | | 2012 | | 2011 |
| | | | | | | | | | | | |
| Operations: | | | | | | | | |
| | Net investment income | | | | $ | 191,525 | $ | 46,220 |
| | Net realized loss from investment transactions | | | | | |
| | | and foreign currency transactions | | | | (247,244) | | (12,849) |
| | Change in unrealized depreciation on investments | | | | |
| | | and translation of assets and liabilities in foreign currency | | 152,790 | | (1,061,731) |
| Net Increase (Decrease) in Net Assets Resulting from Operations | 97,071 | | (1,028,360) |
| | | | | | | | | | | | |
Distributions to Shareholders: (note 5) | | | | | | |
| | Net investment income | | | | | | | |
| | | Institutional Class Shares | | | | | (121,586) | | - |
| | | Class A Shares | | | | | | (11,542) | | - |
| Decrease in Net Assets Resulting from Distributions | | (133,128) | | - |
| | | | | | | | | | | | |
| Capital Share Transactions: | | | | | | | |
| | Shares sold | | | | | | 8,774,062 | | 15,380,813 |
| | Reinvested dividends and distributions | | | | 120,749 | | - |
| | Shares repurchased | | | | | (3,225,860) | | (310,484) |
| Increase from Capital Share Transactions | | | | 5,668,951 | | 15,070,329 |
| | | | | | | | | | | | |
| Net Increase in Net Assets | | | | | 5,632,894 | | 14,041,969 |
| | | | | | | | | | | | |
| Net Assets: | | | | | | | | |
| | Beginning of Period | | | | | | 14,041,969 | | - |
| | End of Period | | | | | $ | 19,674,863 | $ | 14,041,969 |
| | | | | | | | | | | | |
| Undistributed Net Investment Income | | | $ | 104,617 | $ | 46,220 |
| | | | | | | | | | | | |
| | | | | | | | | | | | |
| | | | | | | | | | | | |
| | | | | | | | | | | | |
| | | | | | | | | | | | |
| | | | | | | | | | | | |
| | | | | | | | | | | | |
| | | | | | | | | | | | |
| | | | | | | | | | | | |
| | | | | | | | | | | | |
| | | | | | | | | | | | (Continued) |
| ROUMELL OPPORTUNISTIC VALUE FUND | | | | | | |
| | | | | | | | | | | | |
| Statements of Changes in Net Assets | | | | | | | |
| | | | | | | | | | | | |
| | | | | | | | | | | | |
| For the Year ended August 31, | 2012 | | 2011 |
| | | | | | | | | | | | |
| Share Information: | | | | | | | | |
| | Institutional Class Shares | Shares | Amount | | Shares | | Amount |
| | | Shares sold | | 936,132 | $ | 8,506,230 | | 1,339,079 | $ | 13,532,610 |
| | | Redemption fees | - | | 217 | | - | | - |
| | | Reinvested dividends | | | | | | | |
| | | | and distributions | 12,541 | | 109,860 | | - | | - |
| | | Shares repurchased | (300,289) | | (2,727,037) | | (26,452) | | (263,060) |
| | Net Increase in Capital Shares | 648,384 | $ | 5,889,270 | | 1,312,627 | $ | 13,269,550 |
| | Outstanding, Beginning of Period | 1,312,627 | | 13,269,550 | | - | | - |
| | Outstanding, End of Period | 1,961,011 | $ | 19,158,820 | | 1,312,627 | $ | 13,269,550 |
| | | | | | | | | | | | |
| | Class A Shares | | Shares | Amount | | Shares | | Amount |
| | | Shares sold | | 29,318 | $ | 267,612 | | 182,642 | $ | 1,848,203 |
| | | Redemption fees | - | | 3 | | - | | - |
| | | Reinvested dividends | | | | | | | |
| | | | and distributions | 1,244 | | 10,889 | | - | | - |
| | | Shares repurchased | (54,781) | | (498,823) | | (4,750) | | (47,424) |
| | Net Increase in Capital Shares | (24,219) | $ | (220,319) | | 177,892 | $ | 1,800,779 |
| | Outstanding, Beginning of Period | 177,892 | | 1,800,779 | | - | | - |
| | Outstanding, End of Period | 153,673 | $ | 1,580,460 | | 177,892 | $ | 1,800,779 |
| | | | | | | | | | | | |
| | | | | | | | | | | | |
| | | | | | | | | | | | |
| | | | | | | | | | | | |
| | | | | | | | | | | | |
| | | | | | | | | | | | |
| | | | | | | | | | | | |
| | | | | | | | | | | | |
| | | | | | | | | | | | |
| | | | | | | | | | | | |
| | | | | | | | | | | | |
| | | | | | | | | | | | |
| | | | | | | | | | | | |
| | | | | | | | | | | | |
| | | | | | | | | | | | |
| | | | | | | | | | | | |
| | | | | | | | | | | | |
| See Notes to Financial Statements | | | | | | |
| ROUMELL OPPORTUNISTIC VALUE FUND | | | | | |
| | | | | | | | | | |
| Financial Highlights | | | | | | |
| | | | | | | | | | |
| For a share outstanding during the | | Institutional Class Shares |
| fiscal year or period ended August 31, | | 2012 | | 2011 (f) | |
| | | | | | | | | | |
| Net Asset Value, Beginning of Period | $ | 9.42 | $ | 10.00 | |
| | | | | | | | | | |
| Income (Loss) from Investment Operations | | | | | |
| | Net investment income | | 0.09 | | 0.03 | |
| | Net realized and unrealized loss on securities | | (0.13) | | (0.61) | |
| Total from Investment Operations | | (0.04) | | (0.58) | |
| | | | | | | | | | |
| Less Distributions: | | | | | | |
| | Dividends (from net investment income) | | (0.07) | | - | |
| Total Distributions | | | (0.07) | | - | |
| | | | | | | | | | |
| Net Asset Value, End of Period | $ | 9.31 | $ | 9.42 | |
| | | | | | | | | | |
| Total Return (c)(d) | | | (0.36)% | | (5.80)% | |
| | | | | | | | | | |
| Net Assets, End of Period (in thousands) | $ | 18,249 | $ | 12,368 | |
| Average Net Assets for the Period (in thousands) | $ | 16,109 | $ | 5,837 | |
| | | | | | | | | | |
| Ratios of: | | | | | | | |
| Gross Expenses to Average Net Assets (e) | | 1.23% | | 1.23% | (a) |
| Net Expenses to Average Net Assets (e) | | 1.23% | | 1.23% | (a) |
| Net Investment Income/(Loss) to Average Net Assets | | 1.10% | | 1.08% | (a) |
| | | | | | | | | | |
| Portfolio turnover rate | | | 49.34% | | 33.08% | (b) |
| | | | | | | | | | |
| (a) | Annualized. | | | | | | |
| (b) | Not annualized. | | | | | | |
| (c) | Total return does not reflect sales charge, if any. | | | | | |
| (d) | Includes adjustments in accordance with accounting principles generally accepted in the United |
| | States and, consequently, the net asset value for financial reporting purposes and the returns |
| | based upon those net asset values may differ from the net asset values and returns for | |
| | shareholder transactions. | | | | | |
| (e) | The expense ratios listed reflect total expenses prior to any waivers and reimbursements |
| | (gross expense ratio) and after any waivers and reimbursements (net expense ratio). | |
| (f) | For a share outstanding for the initial period from December 31, 2010 (Date of Initial Public |
| | Investment) to August 31, 2011. | | | | | |
| | | | | | | | | | |
| See Notes to Financial Statements | | | | (Continued) |
| ROUMELL OPPORTUNISTIC VALUE FUND | | | | | |
| | | | | | | | | | |
| Financial Highlights | | | | | |
| | | | | | | | | | |
| For a share outstanding during the | | Class A Shares | |
| fiscal year or period ended August 31, | | 2012 | | 2011 (f) | |
| | | | | | | | | | |
| Net Asset Value, Beginning of Period | $ | 9.41 | $ | 10.00 | |
| | | | | | | | | | |
| Income (Loss) from Investment Operations | | | | | |
| | Net investment income | | 0.08 | | 0.03 | |
| | Net realized and unrealized loss on securities | | (0.15) | | (0.62) | |
| Total from Investment Operations | | (0.07) | | (0.59) | |
| | | | | | | | | | |
| Less Distributions: | | | | | |
| | Dividends (from net investment income) | | (0.06) | | - | |
| Total Distributions | | (0.06) | | - | |
| | | | | | | | | | |
| Net Asset Value, End of Period | $ | 9.28 | $ | 9.41 | |
| | | | | | | | | | |
| Total Return (c)(d) | | (0.56)% | | (6.00)% | |
| | | | | | | | | | |
| Net Assets, End of Period (in thousands) | $ | 1,426 | $ | 1,674 | |
| Average Net Assets for the Period (in thousands) | $ | 1,629 | $ | 959 | |
| | | | | | | | | | |
| Ratios of: | | | | | | | |
| Gross Expenses to Average Net Assets (e) | | 1.48% | | 1.48% | (a) |
| Net Expenses to Average Net Assets (e) | | 1.48% | | 1.48% | (a) |
| Net Investment Income/(Loss) to Average Net Assets | | 0.89% | | 0.73% | (a) |
| | | | | | | | | | |
| Portfolio turnover rate | | 49.34% | | 33.08% | (b) |
| | | | | | | | | | |
| (a) | Annualized. | | | | | |
| (b) | Not annualized. | | | | | |
| (c) | Total return does not reflect sales charge, if any. | | | | | |
| (d) | Includes adjustments in accordance with accounting principles generally accepted in the United |
| | States and, consequently, the net asset value for financial reporting purposes and the returns |
| | based upon those net asset values may differ from the net asset values and returns for | |
| | shareholder transactions. | | | | | |
| (e) | The expense ratios listed reflect total expenses prior to any waivers and reimbursements | |
| | (gross expense ratio) and after any waivers and reimbursements (net expense ratio). | |
| (f) | For a share outstanding for the initial period from December 31, 2010 (Date of Initial Public |
| | Investment) to August 31, 2011. | | | | | |
| | | | | | | | | | |
| See Notes to Financial Statements | | | | | |
| ROUMELL OPPORTUNISTIC VALUE FUND | | | | | | |
| | | | | | | | | | | |
| Schedule of Realized Gains and Losses | | | | | | | |
| | | | | | | | | | | |
| | | | | | | | | | | |
| As of August 31, 2012 | | | | | | | | |
| | | | | Purchase Price | Sales Proceeds | Realized Gain/Loss Percentage | Realized Gain/Loss |
| | | | | | | | | | | |
| | American Eagle Outfitters, Inc. | $ 405,642 | | 398,553 | | -1.75% | $ | (7,088) |
| | Comstock Resources, Inc. | 280,875 | | 343,543 | | 22.31% | | 62,668 |
| | Capital Southwest Corp. | 286,678 | | 317,884 | | 10.89% | | 31,206 |
| | DSP Group, Inc. | | 222,572 | | 187,541 | | -15.74% | | (35,031) |
| | Ellington Financial LLC | 424,383 | | 378,053 | | -10.92% | | (46,331) |
| | Gilat Satellite Networks Ltd. | 219,124 | | 196,860 | | -10.16% | | (22,263) |
| | Geokinetics Holdings U.S.A., Inc. | 638,400 | | 455,000 | | -28.73% | | (183,400) |
| | GMX Resources, Inc. | | 168,600 | | 105,750 | | -37.28% | | (62,850) |
| | Hewlett-Packard Co. | | 626,026 | | 542,990 | | -13.26% | | (83,036) |
| | InterOil Corp. | | | 241,703 | | 282,912 | | 17.05% | | 41,208 |
| | KVH Industries, Inc. | | 392,661 | | 521,484 | | 32.81% | | 128,824 |
| | Merck & Co., Inc. | | 492,165 | | 479,982 | | -2.48% | | (12,183) |
| | O'Charley's, Inc. | | 267,222 | | 270,000 | | 1.04% | | 2,778 |
| | QAD, Inc. | | | 33,578 | | 52,058 | | 55.04% | | 18,480 |
| | Solo Cup Co. | | | 117,734 | | 116,438 | | -1.10% | | (1,297) |
| | Skechers U.S.A., Inc. | | 350,527 | | 378,610 | | 8.01% | | 28,083 |
| | American Select Portfolio | 481,370 | | 496,852 | | 3.22% | | 15,482 |
| | SUPERVALU, Inc. | | 48,176 | | 50,875 | | 5.60% | | 2,699 |
| | Sierra Wireless, Inc. | | 109,657 | | 79,993 | | -27.05% | | (29,664) |
| | Transact Technologies, Inc. | 416,534 | | 321,486 | | -22.82% | | (95,047) |
| | Tower Group, Inc. | | 412,234 | | 412,127 | | -0.03% | | (107) |
| | | | | | | | | | | |
| | Total Realized Loss | | | | | | | $ | (246,869) |
ROUMELL OPPORTUNISTIC VALUE FUND
Notes to Financial Statements
| 1. | Organization and Significant Accounting Policies |
The Roumell Opportunistic Value Fund (“Fund”) is a series of the Starboard Investment Trust (“Trust”). The Trust is organized as a Delaware statutory trust and is registered under the Investment Company Act of 1940, as amended (the “1940 Act”), as an open-end management investment company. The Fund is a separate diversified series of the Trust.
The fund commenced operations on December 31, 2010. The Investment objective of the fund is to seek capital appreciation and income. Roumell Asset Management, LLC (“Roumell Asset Management” or the “Advisor”) seeks to achieve the Fund’s investment objective by using an opportunistic investment strategy. The Advisor is an opportunistic capital allocator (OCA) with a deep value bias in selecting individual securities. The Advisor will wait until an investment situation is presented where, in its opinion, the odds of success are favorable relative to the risks. In the absence of such situations, the Fund will stay liquid and on the sidelines invested in Cash and Cash Equivalents. The Advisor’s approach to opportunistic investing emphasizes purchasing securities at a meaningful, quantifiable discount to its calculation of intrinsic value taking into consideration the understandability of the business model, the safety of the capital structure, and the competency of the company’s management. Using this opportunistic strategy, however, may result in the Advisor finding many suitable investment opportunities for the Fund during certain periods but finding very few during other periods.
The Advisor believes that its strength lies in digging deeply into specific securities (equity and fixed income), assessing underlying value, and remaining highly disciplined about what it deems to be a reasonable price for those securities.
The Advisor also believes that securities that possess deep value characteristics can be found in various asset classes, not just equities. Although much attention is paid to the stock market’s daily activities, the Advisor believes that mispricing can occur in other markets as well; therefore, the Advisor is impartial as to where in a company’s capital structure it will invest, and, consequently, the Advisor will pursue both equity and debt investments. The Advisor’s ultimate goal is to buy securities at a meaningful discount to its estimate of underlying intrinsic value.
ROUMELL OPPORTUNISTIC VALUE FUND
Notes to Financial Statements
The Fund’s portfolio will primarily consist of (i) domestic and foreign equity securities (“Equity Securities”); (ii) domestic and foreign fixed income securities including, but not limited to, government and corporate debt securities, “junk” bonds, municipal securities and REITs (“Fixed Income Securities”); and (iii) interest-bearing instruments, including, but not limited to, treasury bills, other U.S. government obligations and bonds, collateralized repurchase contracts, money market instruments and money market funds (collectively, “Cash and Cash Equivalents”). The Fund may invest in these securities directly or indirectly through investments in other investment companies including closed-end funds and Exchange Traded Funds (“ETFs”). The Fund’s emphasis will be on domestic equity and domestic high-yield corporate debt; however, there is no predetermined allocation of the Fund’s assets among Equity Securities, Fixed Income Securities and Cash and Cash Equivalents. The Advisor will allocate the Fund’s assets as it deems appropriate in accordance with the Fund’s investment objective and investment strategy. The Fund’s investment policy may be changed without shareholder approval upon prior written notice to shareholders.
The fund is not diversified.
The following accounting policies have been consistently followed by the Fund and are in conformity with accounting principles generally accepted in the United States of America in the investment company industry.
Investment Valuation
The Fund’s investments in securities are carried at fair value. Securities listed on an exchange or quoted on a national market system are valued at the last sales price as of 4:00 p.m. Eastern Time. Securities traded in the NASDAQ over-the-counter market are generally valued at the NASDAQ Official Closing Price. Other securities traded in the over-the-counter market and listed securities for which no sale was reported on that date are valued at the most recent bid price. Securities and assets for which representative market quotations are not readily available (e.g., if the exchange on which the portfolio security is principally traded closes early or if trading of the particular portfolio security is halted during the day and does not resume prior to the Fund’s net asset value calculation) or which cannot be accurately valued using the Fund’s normal pricing procedures are valued at fair value as determined in good faith under policies approved by the Trustees. A portfolio security’s “fair value” price may differ from the price next available for that portfolio security using the Fund’s normal pricing procedures. Instruments with maturities of 60 days or less are valued at amortized cost, which approximates market value.
ROUMELL OPPORTUNISTIC VALUE FUND
Notes to Financial Statements
Fair Value Measurement
The Fund has adopted ASC Topic 820, Fair Value Measurements. ASC Topic 820 defines fair value, establishes a frame work for measuring fair value and expands disclosure about fair value measurements.
Various inputs are used in determining the value of the Fund's investments. These inputs are summarized in the three broad levels listed below:
Level 1: quoted prices in active markets for identical securities
Level 2: other significant observable inputs (including quoted prices for similar securities, interest rates, credit risk, etc.)
Level 3: significant unobservable inputs (including the Fund’s own assumptions in determining fair value of investments)
The Fund has adopted FASB guidance updating ASC Topic 820 titled, “Determining Fair Value When the Volume and Level of Activity for the Asset or Liability have Significantly Decreased and Identifying Transactions that are not Orderly” which provides guidance on determining when there has been a significant decrease in the volume and level of activity for an asset or liability, when a transaction that is not orderly, and how that information must be incorporated into fair value measurement. The guidance emphasizes that even if there has been a significant decrease in volume and level of activity for an asset or liability and regardless of the valuation techniques used, the objective of a fair value measurement remains the same.
An Investment asset’s or liability’s level within the fair value hierarchy is based on the lowest level input, individually or in aggregate, that is significant to fair value measurement.
The valuation techniques used by the Fund to measure fair value for the fiscal year ended August 31, 2012 maximized the use of observable inputs and minimized the use of unobservable inputs.
The inputs or methodology used for valuing securities are not necessarily an indication of the risk associated with investing in those securities.
ROUMELL OPPORTUNISTIC VALUE FUND
Notes to Financial Statements
The following is a summary of the inputs used in valuing the Fund's assets:
| Assets | | Total | | Level 1 | | Level 2 | | Level 3 |
| Common Stocks | $ | 11,372,062 | $ | 11,372,062 | $ | - - | $ | - - |
| Exchange Traded Products | | 287,641 | | 287,641 | | - - | | - - |
| Short-term Investments | | 3,465,648 | | 3,465,648 | | - - | | - - |
| Corporate Bonds | | 4,238,788 | | - | | 4,238,788 | | - - |
| Convertible Bonds | | 111,631 | | - | | 111,631 | | - - |
| Total | $ | 19,475,770 | $ | 15,125,351 | $ | 4,350,419 | $ | - - |
Foreign Currency Translation
Portfolio securities and other assets and liabilities denominated in foreign currencies are translated into U.S. dollars based on the exchange rate of such currencies against U.S. dollars on the date of valuation. Purchases and sales of securities and income items denominated in foreign currencies are translated into U.S. dollars at the exchange rate in effect on the transaction date.
The Fund does not separately report the effect of changes in foreign exchange rates from changes in market prices on securities held. Such changes are included in net realized and unrealized gain or loss from investments.
Realized foreign exchange gains or losses arise from sales of foreign currencies, currency gains or losses realized between the trade and settlement dates on securities transactions and the difference between the recorded amounts of dividends, interest, and foreign withholding taxes, and the U.S. dollar equivalent of the amounts actually received or paid. Net unrealized foreign exchange gains and losses arise from changes in foreign exchange rates on foreign denominated assets and liabilities other than investments in securities held at the end of the reporting period.
Investment Transactions and Investment Income
Investment transactions are accounted for as of the date purchased or sold (trade date). Dividend income is recorded on the ex-dividend date. Certain dividends from foreign securities will be recorded as soon as the Fund is informed of the dividend if such information is obtained subsequent to the ex-dividend date. Interest income is recorded on the accrual basis and includes amortization of discounts and premiums. Gains and losses are determined on the identified cost basis, which is the same basis used for federal income tax purposes.
ROUMELL OPPORTUNISTIC VALUE FUND
Notes to Financial Statements
Expenses
The Fund bears expenses incurred specifically on its behalf as well as a portion of general expenses, which are allocated according to methods reviewed annually by the Trustees.
Dividend Distributions
The Fund may declare and distribute dividends from net investment income (if any) quarterly. Distributions from capital gains (if any) are generally declared and distributed annually. Dividends and distributions to shareholders are recorded on ex-date.
Estimates
The preparation of financial statements in conformity with accounting principles generally accepted in the United States of America requires management to make estimates and assumptions that affect the reported amounts of assets and liabilities and disclosure of contingent assets and liabilities at the date of the financial statements and the reported amounts of increases and decreases in the net assets from operations during the reported period. Actual results could differ from those estimates.
Federal Income Taxes
No provision for income taxes is included in the accompanying financial statements, as the Fund intends to distribute to shareholders all taxable investment income and realized gains and otherwise complies with Subchapter M of the Internal Revenue Code applicable to regulated investment companies.
| 2. | Transactions with Affiliates & Service Providers |
Advisor
As full compensation for the investment advisory services provided to the Fund, the Advisor receives a monthly fee equal to an annualized rate of 0.92% of Fund’s average daily net assets. The fee paid to the Advisor is calculated by multiplying the average daily net assets of the Fund, computed at the end of each month and payable within five days thereafter.
ROUMELL OPPORTUNISTIC VALUE FUND
Notes to Financial Statements
The Advisor has entered into an Operating Plan with the Fund’s administrator under which it has agreed to assume certain fees of the administrator and Acquired Fund Fees and Expenses to the extent such fees and expenses cause the Total Annual Fund Operating Expenses to exceed 1.48% of the average daily net assets of the Class A shares of the Fund or 1.23% of the average daily net assets of the Institutional Class shares of the Fund. The Operating Plan may be terminated by either party at the conclusion of the then current term upon (i) written notice of non-renewal to the other party not less than sixty days prior to the end of the term, or (ii) mutual written agreement of the parties. The Advisor cannot recoup from the Fund any amounts paid by the Advisor to the Administrator under the Operating Plan. The advisor paid $94,173 to the administrator for the fiscal year ended August 31, 2012.
Administrator
The Nottingham Company (“Administrator”) assists the Trust in the performance of its administrative responsibilities to the Fund, coordinates and pays for the services of each vendor and the operating expense to the Fund, and provides the Fund with certain administrative, fund accounting, and compliance services. As part of its services and consolidated fee arrangement, the Administrator receives compensation based on the Fund’s average daily net assets. The annual rate is 0.31% if the average daily net assets are under $80,000,000 and gradually decreases to an annual rate of 0.124% once the average daily net assets reach $2 billion or more.
The fee paid to the Administrator is calculated by multiplying the average daily net assets of the Fund by the highest applicable annual rate. The Administrator pays all expenses not assumed by the Advisor, including, without limitation: the fees and expenses of its independent accountants and of its legal counsel; the costs of printing and mailing to shareholders annual and semi-annual reports, proxy statements, prospectuses, statements of additional information and supplements thereto; the costs of printing registration statements; bank transaction charges and custodian’s fees; any proxy solicitors’ fees and expenses; filing fees; any federal, state or local income or other taxes; any interest; any membership fees of the Investment Company Institute and similar organizations; fidelity bond and Trustees’ liability insurance premiums.
ROUMELL OPPORTUNISTIC VALUE FUND
Notes to Financial Statements
Compliance Services
Nottingham Compliance Services, LLC (“NCS”), a fully owned affiliate of the Administrator, provides services which assist the Trust’s Chief Compliance Officer in monitoring and testing the policies and procedures of the Trust in conjunction with requirements under Rule 38a-1 of the 1940 Act. NCS is entitled to receive compensation from the Administrator pursuant to the Administrator’s fee arrangements with the Fund.
Transfer Agent
Nottingham Shareholder Services, LLC (“Transfer Agent”) serves as transfer, dividend paying, and shareholder servicing agent for the Fund. For its services, the Transfer Agent is entitled to receive compensation from the Administrator pursuant to the Administrator’s fee arrangements with the Fund.
Distributor
Capital Investment Group, Inc. (the “Distributor”) serves as the Fund’s principal underwriter and distributor. For its services, the Distributor is entitled to receive compensation from the Administrator pursuant to the Administrator’s fee arrangements with the Fund.
Certain Trustees and officers of the Trust may also be officers of the Advisor, the Distributor, the Administrator, or NCS.
| 3. | Distribution and Service Fees |
The Trust has adopted a Distribution Plan pursuant to Rule 12b-1 under the 1940 Act for the Class A shares of the Fund (the “Plan”). Pursuant to the Plan, the Fund is authorized to pay the Distributor a fee at an annual rate of 0.25% of average daily net assets of the Fund attributable to the Class A shares. The 0.25% fee is comprised of a 0.25% service fee. Such fees are to be paid by the Fund monthly, or at such other intervals, as the Board shall determine. Such fees shall be based upon the average daily net assets of the Fund attributable to the Class A shares during the preceding month, and shall be calculated and accrued daily. The Fund may pay fees to the Distributor at a lesser rate, as agreed upon by the Board of Trustees of the Trust and the Distributor. The Plan authorizes payments to the Distributor
ROUMELL OPPORTUNISTIC VALUE FUND
Notes to Financial Statements
as compensation for providing account maintenance services to Fund shareholders, including arranging for certain securities dealers or brokers, administrators and others (“Recipients”) to provide these services and paying compensation for these services. The Fund charges a Rule 12b-1 fee at the annual rate of 0.25% of average daily net assets of the Fund attributable to the Class A shares.
| 4. | Purchases and Sales of Investment Securities |
For the fiscal year ended August 31, 2012, the aggregate cost of purchases and proceeds from sales of investment securities (excluding short-term securities) were as follows:
| Fiscal year | Purchases of Securities | Proceeds from Sales of Securities |
| September 1, 2011 - August 31, 2012 | $11,851,598 | $6,635,860 |
There were no long-term purchases or sales of U.S Government Obligations during the the fiscal year ended August 31, 2012.
Distributions are determined in accordance with Federal income tax regulations, which differ from generally accepted accounting principles, and, therefore, may differ significantly in amount or character from net investment income and realized gains for financial reporting purposes. Financial reporting records are adjusted for permanent book/tax differences to reflect tax character but are not adjusted for temporary differences.
Management has analyzed the Fund’s tax positions and determined that the implementation of ASC Topic 740 “Accounting for Uncertainty in Income Taxes” had no impact on the Fund’s net assets or results of operations. As of and during the initial year ended August 31, 2012, the Fund did not have a liability for uncertain tax positions. The Fund recognizes interest and penalties, if any, related to unrecognized tax benefits as income tax expense in the statement of operations. During the fiscal year ended August 31, 2012, the Fund did not incur any interest or penalties.
Reclassifications to paid-in capital relate primarily to differing book/tax treatment of ordinary net investment losses. For the fiscal year ended August 31, 2012, there were no reclassifications necessary.
ROUMELL OPPORTUNISTIC VALUE FUND
Notes to Financial Statements
At August 31, 2012, the tax-basis cost of investments and components of distributable earnings were as follows:
| Cost of Investments | $ | 20,384,711 |
| | | |
| Unrealized Appreciation | $ | 990,597 |
| Unrealized Depreciation | | (1,899,538) |
| Net Unrealized Depreciation | | (908,941) |
| | | |
| Undistributed Ordinary Income | | 104,617 |
| Accumulated Capital Losses | | (52,331) |
| Other Book/Tax Differences | | (207,762) |
| | | |
| Distributable Earnings (Loss) | $ | (1,064,417) |
| 6. | Commitments and Contingencies |
Under the Trust’s organizational documents, its officers and Trustees are indemnified against certain liabilities arising out of the performance of their duties to the Fund. In addition, in the normal course of business, the Trust entered into contracts with its service providers, on behalf of the Fund, and others that provide for general indemnifications. The Fund’s maximum exposure under these arrangements is unknown, as this would involve future claims that may be made against the Fund. The Fund expects risk of loss to be remote.
| 7. | New Accounting Pronouncements |
In May 2011, the FASB issued ASU No. 2011-04 “Amendments to Achieve Common Fair Value Measurement and Disclosure Requirements.” ASU No. 2011-04 amends FASB ASC Topic 820, Fair Value Measurements and Disclosures, to establish common requirements for measuring fair value and for disclosing information about fair value measurements in accordance with GAAP and International Financial Reporting Standards (“IFRS”). ASU No. 2011-04 is effective for fiscal years beginning after December 15, 2011 and for interim periods within those fiscal years.
ROUMELL OPPORTUNISTIC VALUE FUND
Notes to Financial Statements
In accordance with the adoption of ASC Topic 855, Subsequent Events, and in preparing these financial statements, the Fund has evaluated the need for disclosures and/or adjustments resulting from subsequent events through the date of issuance of these financial statements. This evaluation did not result in any additional subsequent events that necessitated disclosures and/or adjustments.
REPORT OF INDEPENDENT REGISTERED PUBLIC ACCOUNTING FIRM
To the Shareholders,
Trustees, and
Audit Committee of
ROUMELL OPPORTUNISTIC VALUE FUND
We have audited the accompanying statement of assets and liabilities of the Roumell Opportunistic Value Fund (the “Fund”, one of the series constituting the Starboard Investment Trust), including the schedule of investments, as of August 31, 2012, and the related statements of operations for the year then ended, the statements of changes in net assets and the financial highlights for the year then ended and the period from December 31, 2010 (Date of Initial Public Investment) to August 31, 2011. These financial statements and financial highlights are the responsibility of the Fund's management. Our responsibility is to express an opinion on these financial statements and financial highlights based on our audit.
We conducted our audit in accordance with the standards of the Public Company Accounting Oversight Board (United States). Those standards require that we plan and perform the audit to obtain reasonable assurance about whether the financial statements and financial highlights are free of material misstatement. The Fund is not required to have, nor were we engaged to perform, an audit of its internal control over financial reporting. Our audit included consideration of internal control over financial reporting as a basis for designing audit procedures that are appropriate in the circumstances, but not for the purpose of expressing an opinion on the effectiveness of the Fund's internal control over financial reporting. Accordingly, we express no such opinion. An audit also includes examining, on a test basis, evidence supporting the amounts and disclosures in the financial statements, assessing the accounting principles used and significant estimates made by management, as well as evaluating the overall financial statement presentation. Our procedures included confirmation of securities owned as of August 31, 2012, by correspondence with the custodian and brokers. We believe that our audits provide a reasonable basis for our opinion.
In our opinion, the financial statements and financial highlights referred to above present fairly, in all material respects, the financial position of the Roumell Opportunistic Value Fund as of August 31, 2012, the results of its operations for the year then ended and its changes in its net assets, and the financial highlights for the year then ended and period from December 31, 2010 (Date of Initial Public Investment) to August 31, 2011 in conformity with accounting principles generally accepted in the United States of America.
Chicago, Illinois
October 22, 2012
1. Proxy Voting Policies and Voting Record
A copy of the Trust’s Proxy Voting and Disclosure Policy and the Advisor’s Disclosure Policy are included as Appendix B to the Fund’s Statement of Additional Information and are available, without charge, upon request, by calling 1-800-773-3863, and on the website of the Security and Exchange Commission (“SEC”) at http://www.sec.gov. Information regarding how the Fund voted proxies relating to portfolio securities during the most recent period ended February 28, is available (1) without charge, upon request, by calling the Fund at the number above and (2) on the SEC’s website at http://www.sec.gov.
2. Quarterly Portfolio Holdings
The Fund files its complete schedule of portfolio holdings with the SEC for the first and third quarters of each fiscal year on Form N-Q. The Fund’s Forms N-Q is available on the SEC’s website at http://www.sec.gov. You may review and make copies at the SEC’s Public Reference Room in Washington, D.C. Information on the operation of the Public Reference Room may be obtained by calling the SEC at 202-942-8090. You may also obtain copies without charge, upon request, by calling the Fund toll-free at 1-800-773-3863.
3. Tax Information
We are required to advise you within 60 days of the Fund’s fiscal year-end regarding the federal tax status of certain distributions received by shareholders during each fiscal year. The following information is provided for the Fund’s fiscal year ended August 31, 2012.
During the fiscal year, no long-term capital gain distributions were paid from the Fund.
Dividend and distributions received by retirement plans such as IRAs, Keogh-type plans, and 403(b) plans need not be reported as taxable income. However, many retirement plans may need this information for their annual information meeting.
4. Schedule of Shareholder Expenses
As a shareholder of the Fund, you incur two types of costs: (1) transaction costs, which may include sales charges (loads) on purchase payments and (2) ongoing costs, including investment advisory fees; distribution (12b-1) fees; and other Fund expenses. This example is intended to help you understand your ongoing costs (in dollars) of investing in the Fund and to compare these costs with the ongoing costs of investing in other mutual funds. The example is based on an investment of $1,000 invested at the beginning of the period and held for the entire period as indicated below.
Actual Expenses – The first line of the table below provides information about the actual account values and actual expenses. You may use the information in this line, together with the amount you invested, to estimate the expenses that you paid over the period. Simply divide your account value by $1,000 (for example, an $8,600 account value divided by $1,000 = 8.6), then multiply the result by the number in the first line under the heading entitled “Expenses Paid During Period” to estimate the expenses you paid on your account during this period.
Hypothetical Example for Comparison Purposes – The last line of the table below provides information about hypothetical account values and hypothetical expenses based on the Fund’s actual expense ratio and an assumed annual rate of return of 5% before expenses, which is not the Fund’s actual return. The hypothetical account values and expenses may not be used to estimate the actual ending account balance or expenses you paid for the period. You may use this information to compare the ongoing costs of investing in the Fund and other funds by comparing this 5% hypothetical example with the 5% hypothetical examples that appear in the shareholder reports of other funds.
| Institutional Class Shares | Beginning Account Value March 1, 2012 | Ending Account Value August 31, 2012 | Expenses Paid During Period* |
Actual Hypothetical (5% annual return before expenses) | $1,000.00 | $1,033.30 | $6.30 |
| | | |
| $1,000.00 | $1,019.00 | $6.26 |
*Expenses are equal to the average account value over the period multiplied by the Fund’s annualized expense ratio, multiplied by the number of days in the most recent period divided by the number of days in the fiscal year (to reflect the initial period).
| Class A Shares | Beginning Account Value March 1, 2012 | Ending Account Value August 31, 2012 | Expenses Paid During Period* |
Actual Hypothetical (5% annual return before expenses) | $1,000.00 | $ 1,032.30 | $7.58 |
| | | |
| $1,000.00 | $ 1,017.74 | $7.53 |
*Expenses are equal to the average account value over the period multiplied by the Fund’s annualized expense ratio, multiplied by the number of days in the most recent period divided by the number of days in the fiscal year (to reflect the initial period).
5. Approval of Advisory Agreement
The Advisor supervises the investments of the Fund pursuant to an Investment Advisory Agreement. At the organizational meeting of the Fund’s Board of Trustees on July 19, 2102, the Trustees approved the renewal of the Investment Advisory Agreement for a one-year term. In considering whether to approve the Investment Advisory Agreement, the Trustees reviewed and considered the information they deemed reasonably necessary, including the following material factors: (i) the nature, extent, and quality of the services provided by the Advisor; (ii) the investment performance of the Fund and Advisor; (iii) the costs of the services to be provided and profits to be realized by the Advisor and its affiliates from the relationship with the Fund; (iv) the extent to which economies of scale would be realized as the Fund grows and whether advisory fee levels reflect those economies of scale for the benefit of the Fund’s investors; (v) the Advisor’s practices regarding brokerage and portfolio transactions; and (vi) the Advisor’s practices regarding possible conflicts of interest.
At the meeting, the Trustees reviewed various informational materials including, without limitation, the Investment Advisory Agreement for the Fund; a memorandum from the Advisor to the Trustees containing information about the Advisor, its business, its finances, its personnel, its services to the Fund, and comparative expense ratio information for other mutual funds with a strategy similar to the Fund; and a memorandum from the Fund’s legal counsel that summarized the fiduciary duties and responsibilities of the Board of Trustees in reviewing and approving the Investment Advisory Agreement, including the types of information and factors that should be considered in order to make an informed decision.
In considering the nature, extent, and quality of the services provided by the Advisor, the Trustees reviewed the responsibilities of the Advisor under the Investment Advisory Agreement. The Trustees reviewed the services being provided by the Advisor to the Fund including, without limitation, the quality of its investment advisory services since the Fund’s inception (including research and recommendations with respect to portfolio securities); its procedures for formulating investment recommendations and assuring compliance with the Fund’s investment objectives and limitations; its coordination of services for the Fund among the Fund’s service providers; and its efforts to promote the Fund, grow the Fund’s assets, and assist in the distribution of Fund shares. The Trustees noted that the Advisor seeks to achieve the Fund’s investment objective by using an opportunistic investment strategy with a deep value bias in selecting individual securities. The Trustees further noted that the principal executive and financial officer of the Fund were provided by the Advisor and serve without additional compensation from the Fund. After reviewing the foregoing information and further information in the memorandum from the Advisor (e.g., descriptions of the Advisor’s business, the Advisor’s compliance program, and the Advisor’s Form ADV), the Board concluded that the nature, extent, and quality of the services provided by the Advisor were satisfactory and adequate for the Fund.
In considering the investment performance of the Fund and Advisor, the Trustees compared the performance of the Fund with the performance of its benchmark index, comparable funds with similar objectives managed by other investment advisors, and applicable peer group data (e.g., Bloomberg peer group average). The Trustees noted that the return for the one-year period ended June 30, 2012 for the Institutional Class Shares was -7.28%, which lagged the returns of most of the comparable funds, the peer group average, and the benchmark index. The Trustees then noted that the return for the six-month period ended June 30, 2012 for the Institutional Class Shares was 7.19%, which outperformed some of the comparable funds and lagged others the returns, and outperformed the peer group
average and benchmark index. The Trustees also considered the consistency of the Advisor’s management of the Fund with its investment objective and policies. After reviewing the short and long-term investment performance of the Fund, the Advisor’s experience managing the Fund, the Advisor’s historical investment performance, and other factors, the Board of Trustees concluded that the investment performance of the Fund and the Advisor was satisfactory.
In considering the costs of the services to be provided and profits to be realized by the Advisor and its affiliates from the relationship with the Fund, including any benefits derived by the Advisor from the relationship with the Fund, the Trustees reviewed the Advisor’s staffing, personnel, and methods of operating; the education and experience of the Advisor’s personnel; the Advisor’s compliance program; the financial condition of the Advisor; the level of commitment to the Fund and the Advisor by the principals of the Advisor; the asset level of the Fund; and the overall expenses of the Fund, including certain prior fee waivers and reimbursements by the Advisor; and the nature and frequency of advisory fee payments. The Trustees reviewed the financial statements for the Advisor and discussed the financial stability and profitability of the firm. The Trustees noted that the Advisor either makes payments to the Administrator or directly pays for certain expenses of the Fund under an Operating Plan in order to help limit the Fund’s annual operating expenses. The Trustees agreed that excess profitability was not a concern at this time. The Trustees also considered potential benefits for the Advisor in managing the Fund, including promotion of the Advisor’s name, the ability for the Advisor to place small accounts into the Fund, and the potential for the Advisor to generate soft dollars from Fund trades that may benefit the Advisor as well. The Trustees then compared the fees and expenses of the Fund (including the management fee) to other funds comparable in terms of the type of fund, the nature of its investment strategy, and its style of investment management, among other factors. The Trustees determined that the Fund’s management fees were higher than some of the comparable funds and lower than others and were higher than the peer group average. The
Trustees also determined that the Fund’s net expense ratio was higher than some of the comparable funds and lower than others and was equal to the peer group average. The Trustees noted that the Fund was smaller than the peer group average. Following this comparison and upon further consideration and discussion of the foregoing, the Board of Trustees concluded that the fees to be paid to the Advisor by the Fund were fair and reasonable in relation to the nature and quality of the services provided by the Advisor and that they reflected charges that were within a range of what could have been negotiated at arm’s length.
In considering the extent to which economies of scale would be realized as the Fund grows and whether advisory fee levels reflect those economies of scale for the benefit of the Fund’s investors, the Trustees considered the Fund’s fee arrangements with the Advisor. The Trustees noted that although the maximum management fee under the Investment Advisory Agreement would stay the same regardless of the Fund’s asset levels, the Advisor had agreed to make payments to the Administrator at lower asset levels in order to help limit the Fund’s expenses. The Trustees pointed out that the Fund would benefit from economies of scale under agreements with service providers other than the Advisor. In particular, it was noted that the Fund’s administration fee was a significant component of the gross expense ratio and that the agreement utilized breakpoints in its fee schedule that allowed the Fund’s shareholders to benefit from economies of scale. The Trustees also noted that economies of scale were unlikely to be realized in the near future due to the size of the Fund. It was pointed out that breakpoints in the management fee could be reconsidered in the future. Following further discussion of the Fund’s asset level, expectations for growth, and fee levels, the Board of Trustees determined that the Fund’s fee arrangements with the Advisor were fair and reasonable in relation to the nature and quality of the services provided by the Advisor.
In considering the Advisor’s practices regarding brokerage and portfolio transactions, the Trustees reviewed the Advisor’s standards, and performance in utilizing those standards, for seeking best execution for Fund portfolio transactions. The Trustees also considered the portfolio turnover rate for the Fund; the process by which evaluations are made of the overall reasonableness of commissions paid; the method and basis for selecting and evaluating the broker-dealers used; any allocation of portfolio business to persons affiliated with the Advisor; and the extent to which the Fund allocates portfolio business to broker-dealers who provide research, statistical, or other services (soft dollars). The Trustees noted, among other things, that the Fund rarely trades blocks of shares which require special handling and that the average commission rate for the Fund was approximately $0.005 per share. After further review and discussion, the Board of Trustees determined that the Advisor’s practices regarding brokerage and portfolio transactions were satisfactory.
In considering the Advisor’s practices regarding conflicts of interest, the Trustees evaluated the potential for conflicts of interest and considered such matters as the experience and ability of the advisory personnel assigned to the Fund; the basis of decisions to buy or sell securities for the Fund and the Advisor’s other accounts; the method for bunching of portfolio securities transactions; and the substance and administration of the Advisor’s code of ethics. Following further consideration and discussion, the Board of Trustees indicated that the Advisor’s standards and practices relating to the identification and mitigation of possible conflicts of interests were satisfactory.
Based upon all of the foregoing considerations, the Board of Trustees, including a majority of the Independent Trustees, approved the Investment Advisory Agreement for the Fund.
6. Information about Trustees and Officers
The business and affairs of the Fund and the Trust are managed under the direction of the Board of Trustees of the Trust. Information concerning the Trustees and officers of the Trust and Fund is set forth below. Generally, each Trustee and officer serves an indefinite term or until certain circumstances such as their resignation, death, or otherwise as specified in the Trust’s organizational documents. Any Trustee may be removed at a meeting of shareholders by a vote meeting the requirements of the Trust’s organizational documents. The Statement of Additional Information of the Fund includes additional information about the Trustees and officers and is available, without charge, upon request by calling the Fund toll-free at 1-800-773-3863. The address of each Trustee and officer, unless otherwise indicated below, is 116 South Franklin Street, Rocky Mount, North Carolina 27804.
Name, Age and Address | Position held with Fund or Trust | Length of Time Served | Principal Occupation During Past 5 Years | Number of Portfolios in Fund Complex Overseen by Trustee | Other Directorships Held by Trustee During Past 5 Years |
| Independent Trustees |
Jack E. Brinson Age: 80 | Independent Trustee | Since 7/09 | Retired; previously, President of Brinson Investment Co. (personal investments) and President of Brinson Chevrolet, Inc. (auto dealership). | 19 | Independent Trustee of Brown Capital Management Funds for its three series, DGHM Investment Trust for its two series, Gardner Lewis Investment Trust for its two series, Hillman Capital Management Investment Trust for its one series, and Tilson Investment Trust for its two series (all registered investment companies); previously, Independent Trustee of de Leon Funds Trust for its one series from 2000 to 2005, Giordano Investment Trust for its one series during 2011, and New Providence Investment Trust for its one series from inception until 2011 (all registered investment companies). |
Michael G. Mosley Age: 59 | Independent Trustee | Since 7/10 | Owner of Commercial Realty Services (real estate) since 2004. | 19 | None. |
Theo H. Pitt, Jr. Age: 76 | Independent Trustee | Since 9/10 | Senior Partner, Community Financial Institutions Consulting (financial consulting) since 1999; Partner, Pikar Properties (real estate) since 2001; Account Administrator, Holden Wealth Management Group of Wachovia Securities (money management firm) from 2003-2008. | 19 | Independent Trustee of DGHM Investment Trust for its two series, Gardner Lewis Investment Trust for its two series, and Hanna Investment Trust for its one series (all registered investment companies); previously, Independent Trustee of Hillman Capital Management Investment Trust for its two series from 2000 to 2009, NCM Capital Investment Trust for its one series from 2007 to 2009, New Providence Investment Trust for its one series from 2008 to 2009, and Tilson Investment Trust for its two series from 2004 to 2009 (all registered investment companies). |
Name, Age and Address | Position held with Fund or Trust | Length of Time Served | Principal Occupation During Past 5 Years | Number of Portfolios in Fund Complex Overseen by Trustee | Other Directorships Held by Trustee During Past 5 Years |
James H. Speed, Jr. Age: 59 | Independent Trustee, Chairman | Trustee since 7/09, Chair since 5/12 | President and CEO of NC Mutual Insurance Company (insurance company) since 2003; President of Speed Financial Group, Inc. (consulting and private investments) from 2000 to 2003. | 19 | Independent Trustee of the following Brown Capital Management Funds for its three series, Hillman Capital Management Investment Trust for its one series, and Tilson Investment Trust for its two series (all registered investment companies). Member of Board of Directors of NC Mutual Life Insurance Company. Member of Board of Directors of M&F Bancorp. Previously, Independent Trustee of New Providence Investment Trust for its one series from 2009 until 2011 (registered investment company). |
J. Buckley Strandberg Age: 52 | Independent Trustee | Since 7/09 | President of Standard Insurance and Realty (insurance and property management) since 1982. | 19 | None. |
| Other Officers |
James C. Roumell Age: 51 2 Wisconsin Circle Suite 660 Chevy Chase, MD 20815 | President (Roumell Opportunistic Value Fund) | Since 9/10 | President of Roumell Asset Management, LLC (advisor to the Roumell Opportunistic Value Fund) since 1998. | n/a | n/a |
Craig L. Lukin Age:44 2 Wisconsin Circle Suite 660 Chevy Chase, MD 20815 | Treasurer (Roumell Opportunistic Value Fund) | Since 9/10 | Chief Operating Officer and Chief Compliance Officer of Roumell Asset Management, LLC since 2007; Research Analyst at Roumell Asset Management, LLC from 2003-2007; Private Equity Analyst for Dent & Company, Inc. (investment services) from 2000-2002; Corporate Value Consulting Manager for PricewaterhouseCoopers, LLP (accountancy and professional services) from 1994-2000. | n/a | n/a |
T. Lee Hale, Jr. Age: 34 | Chief Compliance Officer; Assistant Treasurer | Since 7/09 and 4/10 | Financial Reporting Manager for The Nottingham Company (fund administrator) since 2009; previously, principal of Lee Hale Contracting (marine industry consulting). | n/a | n/a |
Name, Age and Address | Position held with Fund or Trust | Length of Time Served | Principal Occupation During Past 5 Years | Number of Portfolios in Fund Complex Overseen by Trustee | Other Directorships Held by Trustee During Past 5 Years |
A. Vason Hamrick Age: 35 | Secretary | Since 7/09 | Corporate Counsel for The Nottingham Company since 2004. | n/a | n/a |
Roumell Opportunistic Value Fund
is a series of| The Starboard Investment Trust |
| For Shareholder Service Inquiries: | For Investment Advisor Inquiries: |
| Nottingham Shareholder Services | Roumell Opportunistic Value Fund |
| 116 South Franklin Street | 2 Wisconsin Circle, Suite 660 |
Post Office Drawer 4365 Rocky Mount, North Carolina 27803 | Chevy Chase, Maryland 20815 |
| Toll-Free Telephone: | Toll-Free Telephone: |
| 1-800-773-3863 | 1-800-773-3863 |
| World Wide Web @: | World Wide Web @: |
| ncfunds.com | roumellfund.com |
Annual Report 2012
For the Period from February 9, 2012 (Date of Initial Public Investment) to August 31, 2012
SCS Tactical Allocation Fund
This report and the financial statements contained herein are submitted for the general information of the shareholders of the SCS Tactical Allocation Fund (the “Fund”). The Fund’s shares are not deposits or obligations of, or guaranteed by, any depository institution. The Fund’s shares are not insured by the FDIC, Federal Reserve Board or any other agency, and are subject to investment risks, including possible loss of principal amount invested. Neither the Fund nor the Fund’s distributor is a bank.
The SCS Tactical Allocation Fund is distributed by Capital Investment Group, Inc., Member FINRA/SIPC, 17 Glenwood Ave, Raleigh, NC, 27603. There is no affiliation between the SCS Tactical Allocation Fund, including its principals, and Capital Investment Group, Inc.
Statements in this Annual Report that reflect projections or expectations of future financial or economic performance of the SCS Tactical Allocation Fund (“Fund”) and of the market in general and statements of the Fund’s plans and objectives for future operations are forward-looking statements. No assurance can be given that actual results or events will not differ materially from those projected, estimated, assumed or anticipated in any such forward-looking statements. Important factors that could result in such differences, in addition to the other factors noted with such forward-looking statements, include, without limitation, general economic conditions such as inflation, recession and interest rates. Past performance is not a guarantee of future results.
An investment in the Fund is subject to investment risks, including the possible loss of some or the entire principal amount invested. There can be no assurance that the Fund will be successful in meeting its investment objective. Investment in the Fund is also subject to the following risks: depository receipts, fixed income risk, interest rate risk, large-cap company risk, management style risk, manager risk, market risk, new fund risk, new manager risk, risks of investing in corporate debt securities, risks of investing in municipal securities, risks related to investing in other investment companies, risks of investing in REITs, and small-cap and mid-cap securities risk. More information about these risks and other risks can be found in the Fund’s prospectus.
The performance information quoted in this annual report represents past performance, which is not a guarantee of future results. Investment return and principal value of an investment will fluctuate so that an investor’s shares, when redeemed, may be worth more or less than their original cost. Current performance may be lower or higher than the performance data quoted. An investor may obtain performance data current to the most recent month-end by visiting www.ncfunds.com.
An investor should consider the investment objectives, risks, and charges and expenses of the Fund carefully before investing. The prospectus contains this and other information about the Fund. A copy of the prospectus is available at www.ncfunds.com or by calling Shareholder Services at 1-800-773-3863. The prospectus should be read carefully before investing.
This Annual Report was first distributed to shareholders on or about October 30, 2012.
For More Information on Your SCS Tactical Allocation Fund:
See Our Web site at www.ncfunds.com
or
Call Our Shareholder Services Group Toll-Free at 1-800-773-3863.
August 31, 2012
Dear Shareholders of the SCS Tactical Allocation Fund,
Since taking the Fund live in February of 2012, our markets and economy have been anything but stable. This volatility is the reason we opened SCS Tactical Allocation, and we still believe our approach - having the ability to invest in any sector, market or investment whether it is fixed income, equities or cash - is the correct approach. From February 9, 2012 (Date of Initial Public Investment) through the Fund’s fiscal year end of August 31, 2012, the Fund’s performance was 3.20% compared to 4.60% for the benchmark for the fund, which is a blend of 60% S&P 500 and 40% Barclays Aggregate Bond Index. Since the month of May on we have been underweight in equities, and that has lead to the under performance of our fund. The same underweighting of equities which lowered our performance since June, helped us for the month of May. Because of our formula, we have been slowly increasing our equity percentage since August, and we believe that our consistent approach to growth and downside protection will provide shareholders with long term gains while minimizing volatility.
Please see the table below for the Fund’s historical performance information through the calendar quarter ended September 30, 2012.
Average Annual Total Returns | | Net | Gross |
Period Ended September 30, 2012 | Since Inception* | Expense Ratio** | Expense Ratio*** |
| SCS Tactical Allocation Fund | 3.20% | 1.65% | 2.27% |
60% S&P 500 and 40% Barclays Aggregate Bond Index**** | 6.29% | | |
The performance data quoted above represents past performance, which is not a guarantee of future results. Investment return and principal value of an investment in the Fund will fluctuate so that an investor's shares, when redeemed, may be worth more or less than their original cost. Current performance may be lower or higher than the performance data quoted. To obtain more current performance data regarding the Fund, including performance data current to the Fund’s most recent month-end, please visit www.ncfunds.com or call the Fund at (800)525-3863. Fee waivers and expenses reimbursements have positively impacted Fund performance.
*The Fund’s inception date is February 9, 2012.
**The net expense ratio reflects a contractual expense limitation that continues through January 1, 2013. Thereafter, the expense limitation may be changed or terminated at any time. Performance would have been lower without this expense limitation.
***Gross expense ratio is from the Fund’s prospectus dated November 4, 2011.
****You cannot invest directly in this index. This index does not have an investment advisor and does not pay any commissions, expenses, or taxes. If this index did pay commissions, expenses, or taxes, its returns would be lower.
While we may not have had the most glamorous returns during the market run-up from June until the time of this writing, we believe in our goal to be consistent with a long term approach to investing, and we will continue to look for value in every investment. Though there are many headwinds in the short term (U.S. Fiscal Cliff, Greece, Spain, U.S. election and the U.S. Budgets), these uncertainties can create opportunities in the long run.
I would like to thank all of our shareholders for their continued trust in our money management. We do not take that responsibility lightly, and as always, we will continue to look for opportunities while trying to avoid risks.
Sincerely,
Cort Meinelschmidt
Sentinel Capital Solutions
| SCS Tactical Allocation Fund | | | | | | | | | | | | | |
| | | | | | | | | | | | | | | | | | | | |
| Performance Update | | | | | | | | | | | | | | |
| (Unaudited) | | | | | | | | | | | | | | |
| | | | | | | | | | | | | | | | | | | | |
| For the period from February 9, 2012 (Date of Initial Public Investment) to August 31, 2012 | |
| | | | | | | | | | | | | | | | | | | | |
| Comparison of the Change in Value of a $10,000 Investment | | | | | | | | |
| | | | | | | | | | | | | | | | | | | | |
|
| | | | | | | | | | | | | | | | | | | | |
| This graph assumes an initial investment of $10,000 ($9,525 after maximum sales load of 4.75%) at February 9, 2012 (Date of Initial Public Investment). All dividends and distributions are reinvested. This graph depicts the performance of the SCS Tactical Allocation Fund versus a blend of 60% S&P 500 and 40% Barclays Aggregate Bond Index. It is important to note that the Fund is a professionally managed mutual fund while the index is not available for investment and is unmanaged. The comparison is shown for illustrative purposes only. |
| | | | | | | | | | | | | | | | | | | | |
| | Average Annual Total Returns | | | | | | | | | | | | | |
| | | | | | | | | | | | | | | | | | Gross | | |
| | | As of | | | | | | | | | Since | | Inception | | Expense | | |
| | | August 31, 2012 | | | | | | | | Inception | | Date | | Ratio* | | |
| | | SCS Tactical Allocation Fund - No Sales Load | | | | | 3.20% | | 02/09/12 | | 2.27% | | |
| | | SCS Tactical Allocation Fund - 4.75% Maximum Sales Load | | -1.70% | | 02/09/12 | | 2.27% | | |
| | | 60% S&P500 and 40% Barclays Aggregate Bond Index | | | | 4.60% | | 02/09/12 | | | | |
| | | | | | | | | | | | | | | | | | | | |
| * The gross expense ratio shown is from the Fund's prospectus dated November 4, 2011. | | | | |
| Performance quoted above represents past performance, which is no guarantee of future results. Investment return and principal value will fluctuate so that shares, when redeemed, may be worth more or less than their original cost. Current performance may be lower or higher than the performance data quoted. An investor may obtain performance data, current to the most recent month-end, by visiting www.ncfunds.com. |
| | | | | | | | | | | | | | | | | | | | |
| The graph and table do not reflect the deduction of taxes that a shareholder would pay on Fund distributions or the redemption of Fund shares. Average annual total returns are historical in nature and measure net investment income and capital gain or loss from portfolio investments assuming reinvestments of distributions. |
| | | | | | | | | | | | | | | | | | | | |
| SCS Tactical Allocation Fund | | | | | | | | | |
| | | | | | | | | | | | | |
| Schedule of Investments | | | | | | | | | |
| | | | | | | | | | | | | |
| | | | | | | | | | | | | |
| As of August 31, 2012 | | | | | | | | | |
| | | | | | | | | Shares | | | | Value (Note 1) |
| | | | | | | | | | | | | |
| COMMON STOCKS - 45.41% | | | | | | | | | |
| | | | | | | | | | | | | |
| | Consumer Discretionary - 9.63% | | | | | | | | |
| | | Autoliv, Inc. | | | | | | 765 | | | $ | 45,365 |
| | | Mattel, Inc. | | | | | | 1,380 | | | | 48,492 |
| | | Target Corp. | | | | | | 630 | | | | 40,376 |
| | μ | Volkswagen AG | | | | | 600 | | | | 19,536 |
| | | | | | | | | | | | | 153,769 |
| | Consumer Staples - 10.35% | | | | | | | | | |
| | * | Green Mountain Coffee Roasters, Inc. | | | | 1,000 | | | | 24,310 |
| | | Kimberly-Clark Corp. | | | | | 200 | | | | 16,720 |
| | | Molson Coors Brewing Co. | | | | 895 | | | | 39,846 |
| | | PepsiCo, Inc. | | | | | | 500 | | | | 36,215 |
| | | The Procter & Gamble Co. | | | | 718 | | | | 48,242 |
| | | | | | | | | | | | | 165,333 |
| | Energy - 6.17% | | | | | | | | | | |
| | * | American Eagle Energy Corp. | | | | 50,000 | | | | 37,500 |
| | | Boardwalk Pipeline Partners LP | | | | 1,000 | | | | 27,040 |
| | | ConocoPhillips | | | | | | 600 | | | | 34,066 |
| | | | | | | | | | | | | 98,606 |
| | Financials - 1.16% | | | | | | | | | | |
| | | The Chubb Corp. | | | | | 250 | | | | 18,473 |
| | | | | | | | | | | | | 18,473 |
| | Health Care - 1.56% | | | | | | | | | |
| | | Johnson & Johnson | | | | | 370 | | | | 24,949 |
| | | | | | | | | | | | | 24,949 |
| | Industrials - 9.21% | | | | | | | | | | |
| | | Box Ships, Inc. | | | | | | 4,500 | | | | 27,315 |
| | | General Dynamics Corp. | | | | | 590 | | | | 38,663 |
| | | Stanley Black & Decker, Inc. | | | | 460 | | | | 30,259 |
| | | Textainer Group Holdings Ltd. | | | | 1,270 | | | | 44,869 |
| | | Timken Co. | | | | | | 150 | | | | 6,024 |
| | | | | | | | | | | | | 147,130 |
| | Information Technology - 6.58% | | | | | | | | |
| | | Apple, Inc. | | | | | | 117 | | | | 77,833 |
| | | Intel Corp. | | | | | | 1,100 | | | | 27,313 |
| | | | | | | | | | | | | 105,146 |
| | Utilities - 0.75% | | | | | | | | | | |
| | | CMS Energy Corp. | | | | | 520 | | | | 11,991 |
| | | | | | | | | | | | | 11,991 |
| | | | | | | | | | | | | |
| | | Total Common Stocks (Cost $706,865) | | | | | | | | 725,397 |
| | | | | | | | | | | | | |
| | | | | | | | | | | | | (Continued) |
| SCS Tactical Allocation Fund | | | | | | | | | |
| | | | | | | | | | | | | |
| Schedule of Investments | | | | | | | | | |
| | | | | | | | | | | | | |
| | | | | | | | | | | | | |
| As of August 31, 2012 | | | | | | | | | |
| | | | | | | | | Shares | | | | Value (Note 1) |
| | | | | | | | | | | | | |
| EXCHANGE TRADED PRODUCTS- 19.80% | | | | | | | | |
| | | Market Vectors High Yield Municipal Index ETF | | 2,900 | | | $ | 95,381 |
| | | PowerShares Build America Bond Portfolio | | | 1,820 | | | | 55,376 |
| | | PowerShares Senior Loan Portfolio | | | | 1,990 | | | | 49,292 |
| | | SPDR Barclays Capital High Yield Bond ETF | | | 2,155 | | | | 86,502 |
| | | SPDR Nuveen S&P High Yield Municipal Bond ETF | | 520 | | | | 29,827 |
| | | | | | | | | | | | | |
| | | Total Exchange Traded Products (Cost $306,141) | | | | | | | 316,378 |
| | | | | | | | | | | | | |
| SHORT-TERM INVESTMENT - 18.62% | | | | | | | | |
| | § | Fidelity Institutional Money Market Funds, 0.16% | | 297,394 | | | | 297,394 |
| | | | | | | | | | | | | |
| | | Total Short-Term Investment (Cost $297,394) | | | | | | | 297,394 |
| | | | | | | | | | | | | |
| | | | | | | | | Interest | | Maturity | | |
| MUNICIPAL BONDS- 15.58% | | | Principal | | Rate | | Date | | |
| | Alabama Water Pollution Control Authority | | 20,000 | | 4.250% | | 2/15/2015 | | 18,733 |
| | Alpharetta Development Authority | | 10,547 | | 5.250% | | 7/1/2021 | | 8,965 |
| | Atlanta Development Authority | | 25,000 | | 6.250% | | 7/1/2024 | | 17,992 |
| | Cathedral City Public Financing Authority | | 25,000 | | 4.125% | | 8/1/2016 | | 23,176 |
| | County of Independence AR Hydroelectric Power | 25,000 | | 4.600% | | 5/1/2019 | | 17,570 |
| | County of Jefferson AL Sewer Revenue | | 25,000 | | 5.000% | | 2/1/2015 | | 16,990 |
| | County of Richland SC | | | 20,000 | | 5.125% | | 1/1/2028 | | 18,130 |
| | Florida Keys College Campus Foundation Inc | 20,000 | | 7.000% | | 11/1/2042 | | 20,914 |
| | Jefferson County Public Building Authority | | 25,000 | | 5.125% | | 4/1/2021 | | 17,467 |
| | Maryland Health & Higher Educational Facilities | 20,000 | | 4.500% | | 7/1/2028 | | 18,481 |
| | New York City Industrial Development Agency | 100,000 | | 5.875% | | 10/1/2046 | | 51,438 |
| | York County Industrial Development Authority | 20,000 | | 8.500% | | 12/1/2035 | | 19,047 |
| | | | | | | | | | | | | |
| | | Total Municipal Bonds (Cost $259,742) | | | | | | | | 248,903 |
| | | | | | | | | | | | | |
| Total Value of Investments (Cost $1,570,141) - 99.41% | | | | | | $ | 1,588,072 |
| | | | | | | | | | | | | |
| Other Assets Less Liabilities - 0.59% | | | | | | | | 9,400 |
| | | | | | | | | | | | | |
| | Net Assets - 100% | | | | | | | | $ | 1,597,472 |
| | | | | | | | | | | | | |
| § | Represents 7 day effective yield | | | | | | | | |
| * | Non-income producing investment | | | | | | | | |
| μ | American Depository Receipt | | | | | | | | | |
| | | | | | | | | | | | | |
| | | | | | | | | | | | | |
| | | | | | | | | | | | | |
| | | | | | | | | | | | | (Continued) |
| SCS Tactical Allocation Fund | | | | | | | | | |
| | | | | | | | | | | | | |
| Schedule of Investments | | | | | | | | | |
| | | | | | | | | | | | | |
| | | | | | | | | | | | | |
| As of August 31, 2012 | | | | | | | | | |
| | | | | | | | | | | | | |
| | | | | | | | | | | | | |
| | | | | | | | | | | | | |
| | | | Summary of Investments by Sector | | | | | | |
| | | | | | | % of Net | | | | | | |
| | | | Sector | | | Assets | | | | Value | | |
| | | | Consumer Discretionary | | 9.63% | | | $ | 153,769 | | |
| | | | Consumer Staples | | 10.35% | | | | 165,333 | | |
| | | | Energy | | | 6.17% | | | | 98,606 | | |
| | | | Exchange Traded Products | 19.80% | | | | 316,378 | | |
| | | | Financials | | | 1.16% | | | | 18,473 | | |
| | | | Health Care | | 1.56% | | | | 24,949 | | |
| | | | Industrials | | | 9.21% | | | | 147,130 | | |
| | | | Information Technology | | 6.58% | | | | 105,146 | | |
| | | | Utilities | | | 0.75% | | | | 11,991 | | |
| | | | Municipal Bonds | | 15.58% | | | | 248,903 | | |
| | | | Short-Term Investment | | 18.62% | | | | 297,394 | | |
| | | | Total | | | 99.41% | | | $ | 1,588,072 | | |
| | | | | | | | | | | | | |
| | | | | | | | | | | | | |
| | | | | | | | | | | | | |
| | | | | | | | | | | | | |
| | | | | | | | | | | | | |
| | | | | | | | | | | | | |
| | | | | | | | | | | | | |
| | | | | | | | | | | | | |
| | | | | | | | | | | | | |
| | | | | | | | | | | | | |
| | | | | | | | | | | | | |
| | | | | | | | | | | | | |
| | | | | | | | | | | | | |
| | | | | | | | | | | | | |
| | | | | | | | | | | | | |
| | | | | | | | | | | | | |
| | | | | | | | | | | | | |
| | | | | | | | | | | | | |
| | | | | | | | | | | | | |
| | | | | | | | | | | | | |
| | | | | | | | | | | | | |
| | | | | | | | | | | | | |
| | | | | | | | | | | | | |
| | | | | | | | | | | | | |
| | | | | | | | | | | | | |
| | | | | | | | | | | | | |
| | | | | | | | | | | | | |
| | | | | | | | | | | | | |
| | | | | | | | | | | | | |
| See Notes to Financial Statements | | | | | | | | |
| SCS Tactical Allocation Fund | | |
| | | | |
| Statement of Assets and Liabilities | | |
| | | | |
| | | | |
| As of August 31, 2012 | | |
| | | | |
| ASSETS | | |
| | Investments, at value (cost $1,570,141) | $ | 1,588,072 |
| | Receivables: | | |
| | | Fund shares sold | | 31 |
| | | Dividends and interest | | 7,933 |
| | Prepaid expenses | | |
| | | Fund accounting fees | | 2,250 |
| | | Compliance services fees | | 484 |
| | | Other expenses | | 2,268 |
| | Due from affiliates: | | |
| | | Advisor (note 2) | | 16,496 |
| | | | Total assets | | 1,617,534 |
| | | | |
| LIABILITIES | | |
| | Payables: | | |
| | | Investments purchased | | 533 |
| | Accrued expenses | | |
| | | Administration fees | | 26 |
| | | Fund accounting fees | | 1 |
| | | Other expenses | | 19,502 |
| | | | Total liabilities | | 20,062 |
| | | | |
| NET ASSETS | $ | 1,597,472 |
| | | | |
| Net Assets Consist of: | | |
| | Capital | $ | 1,582,855 |
| | Distributable Income: | | |
| | | Net investment income | | 17,008 |
| | | Net realized loss on investments | | (20,323) |
| | Net unrealized appreciation on investments | | 17,932 |
| | | Total Net Assets | $ | 1,597,472 |
| | | | |
| | Shares Outstanding, no par value (unlimited authorized shares) | | 154,721 |
| | | | |
| | Net Asset Value and Redemption Price Per Share | $ | 10.32 |
| | Maximum Offering Price Per Share ($10.32 ÷ 95.25%) | | 10.83 |
| | | | |
| | | | |
| | | | |
| | | | |
| | | | |
| | | | |
| | | | |
| | | | |
| | | | |
| See Notes to Financial Statements | | |
| SCS Tactical Allocation Fund | | |
| | | | |
| Statement of Operations | | |
| | | | |
| | | | |
| For the period from February 9, 2012 (Date of Initial Public Investment) to August 31, 2012 | | |
| | | | |
| INVESTMENT INCOME | | |
| | Interest | $ | 8,239 |
| | Dividends | | 20,078 |
| | Other Income | | 82 |
| | | Total Investment Income | | 28,399 |
| | | | |
| EXPENSES | | |
| | Advisory fees (note 2) | | 6,897 |
| | Administration fees (note 2) | | 14,025 |
| | Transfer agent fees (note 2) | | 13,029 |
| | Fund accounting fees (note 2) | | 15,276 |
| | Compliance service fees (note 2) | | 6,304 |
| | Custody fees (note 2) | | 3,835 |
| | Distribution and service fees (note 3) | | 1,722 |
| | Registration and filing administration fees (note 2) | | 314 |
| | Legal fees | | 1,178 |
| | Audit and tax preparation fees | | 13,500 |
| | Registration and filing expenses | | 1,473 |
| | Printing expenses | | 427 |
| | Trustee fees and meeting expenses | | 6,667 |
| | Securities pricing fees | | 222 |
| | Other operating expenses | | 6,797 |
| | | Gross Expenses | | 91,666 |
| | | | |
| | Expenses reimbursed by advisor (note 2) | | (73,378) |
| | Advisory fees waived (note 2) | | (6,897) |
| | Net Expenses | | 11,391 |
| | | | |
| NET INVESTMENT INCOME | | 17,008 |
| | | | |
| REALIZED AND UNREALIZED GAIN (LOSS) ON INVESTMENTS | | |
| | | | |
| | Net realized loss from: | | |
| | | Investments | | (20,323) |
| | | | (20,323) |
| | Change in unrealized appreciation on: | | |
| | | Investments | | 17,932 |
| | | | 17,932 |
| | | | |
| NET REALIZED AND UNREALIZED (LOSS) ON INVESTMENTS | | (2,391) |
| | | | |
| NET INCREASE IN NET ASSETS RESULTING FROM OPERATIONS | $ | 14,617 |
| | | | |
| | | | |
| | | | |
| | | | |
| See Notes to Financial Statements | | |
| SCS Tactical Allocation Fund | | | | |
| | | | | | | |
| Statements of Changes in Net Assets | | | | |
| | | | | | | |
| | | | | | | |
| For the period from February 9, 2012 (Date of Initial Public Investment) to August 31, 2012 | | |
| | | | | | | |
| OPERATIONS: | | | | |
| Net investment income | | | $ | 17,008 |
| | Net realized loss from investment transactions | | | (20,323) |
| | Change in unrealized appreciation on investments | | | 17,932 |
| | | Net increase in net assets resulting from operations | | | 14,617 |
| | | | | | | |
| | | | | | | |
| CAPITAL SHARE TRANSACTIONS: | | | | |
| | Shares sold | | | | 1,597,132 |
| | Reinvested dividends and distributions | | | | - |
| | Shares redeemed | | | | (14,277) |
| | | Net increase from capital share transactions | | | | 1,582,855 |
| | | | | | | |
| | | Net increase in net assets | | | $ | 1,597,472 |
| | | | | | | |
| NET ASSETS: | | | | |
| | Beginning of period | | | | - |
| | End of period | | | $ | 1,597,472 |
| | | | | | | |
| TRANSACTIONS IN SHARES: | | | | |
| | Shares sold | | | | 156,120 |
| | Shares redeemed | | | | (1,399) |
| | | Net increase | | | | 154,721 |
| | | | | | | |
| | | | | | | |
| | | | | | | |
| | | | | | | |
| | | | | | | |
| | | | | | | |
| | | | | | | |
| | | | | | | |
| | |
| See Notes to Financial Statements | | | | |
| SCS Tactical Allocation Fund | | | |
| | | | | | | |
| Financial Highlights | | | |
| | | | | | | |
| For a share outstanding during the initial period | | | |
| from February 9, 2012 (Date of Initial Public Investment) to August 31, 2012 | | |
| | | | | | | |
| Net asset value, beginning of period | $ | 10.00 | |
| | | | | | | |
| Income from investment operations | | | |
| | Net investment income | | 0.11 | |
| | Net realized and unrealized gains on securities | | 0.21 | |
| Total from investment operations | | 0.32 | |
| | | | | | | |
| Net asset value, end of period | $ | 10.32 | |
| | | | | | | |
| Total Return (c)(d) | | 3.20% | (b) |
| | | | | | | |
| Net assets, end of period (000's) | $ | 1,597 | |
| | | | | | | |
| Ratios of: | | | | |
| Gross expenses to average net assets (e) | | 13.24% | (a) |
| Net expenses to average net assets (e) | | 1.65% | (a) |
| Net investment income | | | |
| | to average net assets | | 2.46% | (a) |
| | | | | | | |
| Portfolio turnover rate | | 67.51% | (b) |
| | | | | | | |
| | | | | | | |
| | | | | | | |
| (a) | Annualized. | | | |
| (b) | Not annualized. | | | |
| (c) | Total return does not reflect sales charge, if any. | | | |
| (d) | Includes adjustments in accordance with accounting principles generally accepted in the United States and, consequently, the net asset value for financial reporting purposes and the returns based upon those net asset values may differ from the net asset values and returns for shareholder transactions. |
| (e) | The expense ratios listed reflect total expenses prior to any waivers and reimbursements (gross expense ratio) and after any waivers and reimbursements (net expense ratio). |
| | | | | | | |
| | | | | | | |
| | | | | | | |
| | | | | | | |
| | | | | | | |
| | | | | | | |
| | | | | | | |
| | | | | | | |
| | | | | | | |
| | | | | | | |
| | | | | | | |
| | | | | | | |
| | | | | | | |
| | | | | | | |
| | | | | | | |
| | | | | | | |
| See Notes to Financial Statements | | | |
SCS Tactical Allocation Fund
Notes to Financial Statements
1. Organization and Significant Accounting Policies
The SCS Tactical Allocation Fund (“Fund”) is a series of the Starboard Investment Trust (“Trust”). The Trust is organized as a Delaware statutory trust and is registered under the Investment Company Act of 1940, as amended (the “1940 Act”), as an open-end management investment company. The Fund is a separate diversified series of the Trust and commenced operations on February 9, 2012.
The Fund seeks to achieve its investment objective of capital appreciation by investing in a mix of equity securities and fixed income securities, which the Fund’s investment advisor, Sentinel Capital Solutions, Inc. (the “Advisor”), determines are undervalued, offer the potential for capital appreciation, or may offer appreciation with lower volatility than the overall market.
The following is a summary of significant accounting policies consistently followed by the Fund. The policies are in conformity with accounting principles generally accepted in the United States of America. In June 2009, the Financial Accounting Standards Board (“FASB”) codified its standards and accounting principles for the financial statements issued for years ending after September 15, 2009. Herein, the Fund will make reference to accounting principles generally accepted in the United States issued by FASB as Accounting Standards Codification (“ASC”).
Investment Valuation
The Fund’s investments in securities are carried at fair value. Securities listed on an exchange or quoted on a national market system are valued at the last sales price as of 4:00 p.m. Eastern Time. Securities traded in the NASDAQ over-the-counter market are generally valued at the NASDAQ Official Closing Price. Listed securities and other securities traded in the over-the-counter market for which no sale was reported on that date are valued at the most recent bid price. Instruments with maturities of 60 days or less are valued at amortized cost, which approximates market value. Securities and assets for which representative market quotations are not readily available (e.g., if the exchange on which the portfolio security is principally traded closes early or if trading of the particular portfolio security is halted during the day and does not resume prior to the Fund’s net asset value calculation) or which cannot be accurately valued using the Fund’s normal pricing procedures are valued at fair value as determined in good faith by either a valuation committee or the Fund’s investment advisor in accordance with procedures established by, and under the supervision of, the Fund’s Trustees. A portfolio security’s “fair value” price may differ from the price next available for that portfolio security using the Fund’s normal pricing procedures.
Fair Value Measurement
The Fund has adopted ASC Topic 820, Fair Value Measurements. ASC Topic 820 defines fair value, establishes a frame work for measuring fair value and expands disclosure about fair value measurements.
Various inputs are used in determining the value of the Fund's investments. These inputs are summarized in the three broad levels listed below:
| a. | Level 1: quoted prices in active markets for identical securities |
| b. | Level 2: other significant observable inputs (including quoted prices for similar securities, interest rates, credit risk, etc.) |
| c. | Level 3: significant unobservable inputs (including the Fund’s own assumptions in determining fair value of investments) |
The availability of observable inputs can vary from security to security and is affected by a wide variety of factors, including, for example, the type of security, whether the security is new and not yet established in the marketplace, the liquidity of markets, and other characteristics particular to the security. To the extent that valuation is based on models or inputs that are less observable or unobservable in the market, the determination of fair value requires more judgment. Accordingly, the degree of judgment exercised in determining fair value is greatest for instruments categorized in Level 3.
SCS Tactical Allocation Fund
Notes to Financial Statements
The inputs used to measure fair value may fall into different levels of the fair value hierarchy. In such cases, for disclosure purposes, the level in the fair value hierarchy within which the fair value measurement falls in its entirety, is determined based on the lowest level input that is significant to the fair value measurement in its entirety.
The inputs or methodology used for valuing securities are not necessarily an indication of the risk associated with investing in those securities. The following table summarizes the inputs as of August 31, 2012 for the Fund’s assets measured at fair value:
| Assets | | Total | | Level 1 | | Level 2 | | Level 3 |
| Common Stocks | $ | 725,397 | $ | 725,397 | $ | - | $ | - |
| Exchange Traded Products | | 316,378 | | 316,378 | | - | | - |
| Municipal Bonds | | 248,903 | | - | | 248,903 | | - |
| Short-Term Investment | | 297,394 | | 297,394 | | - | | - |
| Total | $ | 1,588,072 | $ | 1,339,169 | $ | 248,903 | $ | - |
Investment Transactions and Investment Income
Investment transactions are accounted for as of the date purchased or sold (trade date). Dividend income is recorded on the ex-dividend date. Certain dividends from foreign securities will be recorded as soon as the Fund is informed of the dividend if such information is obtained subsequent to the ex-dividend date. Interest income is recorded on the accrual basis and includes amortization of discounts and premiums. Gains and losses are determined on the identified cost basis, which is the same basis used for federal income tax purposes.
Expenses
The Fund bears expenses incurred specifically on its behalf as well as a portion of general expenses, which are allocated according to methods reviewed annually by the Trustees.
Dividend Distributions
The Fund may declare and distribute dividends from net investment income (if any) quarterly. Distributions from capital gains (if any) are generally declared and distributed annually. Dividends and distributions to shareholders are recorded on ex-date.
Estimates
The preparation of financial statements in conformity with accounting principles generally accepted in the United States of America requires management to make estimates and assumptions that affect the reported amounts of assets and liabilities and disclosure of contingent assets and liabilities at the date of the financial statements and the reported amounts of increases and decreases in the net assets from operations during the reported period. Actual results could differ from those estimates.
Federal Income Taxes
No provision for income taxes is included in the accompanying financial statements, as the Fund intends to distribute to shareholders all taxable investment income and realized gains and otherwise comply with Subchapter M of the Internal Revenue Code applicable to regulated investment companies.
| 2. | Transactions with Affiliates & Service Providers |
Advisor
The Fund pays a monthly advisory fee to Sentinel Capital Solutions, Inc., (the “Advisor”) based upon the average daily net assets of the Fund and calculated at the annual rate as shown in Schedule A. The Advisor has contractually agreed to waive all or part of its advisory fee and to reimburse expenses at least until January 1, 2013, to ensure that the Fund’s annual operating expenses (exclusive of interest, taxes, brokerage fees and commissions, extraordinary expenses, payments under the Rule 12b-1 distribution plan, and acquire fund fees and expenses) will not exceed 1.65% of the daily average net assets for Fund shares. The expense limitation percentage, as well as the advisory fees waived and expenses reimbursed for the initial period ended August 31, 2012, are included in Schedule A provided below.
SCS Tactical Allocation Fund
Notes to Financial Statements
Schedule A: Advisor Fees | Expense Limitation Ratio | Advisor Fees Waived | Expenses Reimbursed |
| Average Net Assets | Rate |
| All assets | 1.00% | 1.65% | $6,897 | $73,378 |
Administrator
The Fund pays a monthly administration fee to the Administrator based upon the average daily net assets of the Fund and calculated at the annual rates as shown in the schedule below which is subject to a minimum of $2,000 per month. The Administrator also receives a fee to procure and pay the Fund’s custodian, additional compensation for fund accounting and recordkeeping services, and additional compensation for certain costs involved with the daily valuation of securities and as reimbursement for out-of-pocket expenses. A breakdown of these fees is provided below.
| Administration Fees* | Custody Fees* | Fund Accounting Fees (monthly) | Fund Accounting Fees | Blue Sky Administration Fees (annual) |
Average Net Assets | Annual Rate | Average Net Assets | Annual Rate |
| First $100 million | 0.100% | First $100 million | 0.020% | $2,250 | 0.01% | $150 per state |
| Next $150 million | 0.080% | Over $100 million | 0.009% | | | |
| Next $250 million | 0.060% | | | | | |
| Next $500 million | 0.050% | | | | | |
| Next $1 billion | 0.040% | *Minimum monthly fees of $2,000 and $417 for Administration and Custody, respectively. |
| Next $2 billion | 0.030% |
Compliance Services
Nottingham Compliance Services, LLC (“NCS”), a wholly owned affiliate of the Administrator, provides services which assist the Trust’s Chief Compliance Officer in monitoring and testing the policies and procedures of the Trust in conjunction with requirements under Rule 38a-1 of the 1940 Act. NCS is entitled to receive compensation from the Administrator pursuant to the Administrator’s fee arrangements with the fund.
Transfer Agent
Nottingham Shareholder Services, LLC (the “Transfer Agent”) serves as transfer, dividend paying, and shareholder servicing agent for the Fund. The Transfer Agent is also reimbursed for out-of-pocket expenses. For its services, the Transfer Agent is entitled to receive compensation from the Administrator pursuant to the Administrator’s fee arrangements with the fund.
Distributor
Capital Investment Group, Inc. (the “Distributor”) serves as the Fund’s principal underwriter and distributor. For its services, the Distributor is entitled to receive compensation from the Administrator pursuant to the Administrator’s fee arrangements with the fund.
Certain Trustees and officers of the Trust may also be officers of the Advisor, the Distributor, the Administrator, or NCS.
| 3. | Distribution and Service Fees |
The Trustees, including a majority of the Trustees who are not “interested persons” of the Trust as defined in the 1940 Act and who have no direct or indirect financial interest in such plan or in any agreement related to such plan, adopted a distribution plan pursuant to Rule 12b-1 of the 1940 Act (the “Plan”). The 1940 Act regulates the manner in which a regulated investment company may assume expenses of distributing and promoting the sales of its shares and servicing of its shareholder accounts. The Plan provides that the Fund may incur certain expenses, which may not exceed 0.25% per annum of
SCS Tactical Allocation Fund
Notes to Financial Statements
the Fund’s average daily net assets for each year elapsed subsequent to adoption of the Plan, for payment to the Distributor and others for items such as advertising expenses, selling expenses, commissions, travel or other expenses reasonably intended to result in sales of shares of the Fund or support servicing of shareholder accounts. For the initial period ended August 31, 2012, $1,722 in fees were incurred by the Distributor.
| 4. | Purchases and Sales of Investment Securities |
For the initial period ended August 31, 2012, the aggregate cost of purchases and proceeds from sales of investment securities (excluding short-term securities) were as follows:
| Initial Period | Purchases of Securities | Proceeds from Sales of Securities |
| February 9, 2012 – August 31, 2012 | $1,930,045 | $639,049 |
There were no long-term purchases or sales of U.S Government Obligations during the initial period ended August 31, 2012.
Distributions are determined in accordance with Federal income tax regulations, which differ from generally accepted accounting principles, and, therefore, may differ significantly in amount or character from net investment income and realized gains for financial reporting purposes. Financial reporting records are adjusted for permanent book/tax differences to reflect tax character but are not adjusted for temporary differences.
Management has analyzed the Fund’s tax positions in the open tax year of 2012 and determined that the implementation of ASC Topic 740 “Accounting for Uncertainty in Income Taxes” had no impact on the Fund’s net assets or results of operations. As of and during the initial year ended August 31, 2012, the Fund did not have a liability for uncertain tax positions. The Fund recognizes interest and penalties, if any, related to unrecognized tax benefits as income tax expense in the statement of operations. During the initial period ended August 31, 2012, the Fund did not incur any interest or penalties.
Reclassifications to paid-in capital relate primarily to differing book/tax treatment of ordinary net investment losses. For the initial period ended August 31, 2012, there were no reclassifications necessary.
Distributions during the fiscal year ended were characterized for tax purposes as follows:
| | | August 31, 2012 |
| Ordinary Income | | - |
| Long-term capital gain | | - |
SCS Tactical Allocation Fund
Notes to Financial Statements
At August 31, 2012, the tax-basis cost of investments and components of distributable earnings were as follows:
| Cost of Investments | $ | 1,573,088 |
| | | |
| Unrealized Appreciation | $ | 57,480 |
| Unrealized Depreciation | | (42,495) |
| Net Unrealized Appreciation | | 14,985 |
| Undistributed Ordinary Losses | | (368) |
| | | |
| Distributable Earnings | $ | 14,617 |
| | | | | | |
The difference between book-basis and tax-basis net unrealized appreciation (depreciation) is attributable to the deferral of losses from wash sales. Accumulated capital losses noted above represent net capital loss carryovers as of August 31, 2012 that are available to offset future realized capital gains, if any, and thereby reduce future taxable gain distributions
| 6. | Commitments and Contingencies |
Under the Trust’s organizational documents, its officers and Trustees are indemnified against certain liabilities arising out of the performance of their duties to the Fund. In addition, in the normal course of business, the Trust entered into contracts with its service providers, on behalf of the Fund, and others that provide for general indemnifications. The Fund’s maximum exposure under these arrangements is unknown, as this would involve future claims that may be made against the Fund. The Fund expects risk of loss to be remote.
| 7. | New Accounting Pronouncements |
In May 2011, the FASB issued ASU No. 2011-04 “Amendments to Achieve Common Fair Value Measurement and Disclosure Requirements.” ASU No. 2011-04 amends FASB ASC Topic 820, Fair Value Measurements and Disclosures, to establish common requirements for measuring fair value and for disclosing information about fair value measurements in accordance with GAAP and International Financial Reporting Standards (“IFRS”). ASU No. 2011-04 is effective for fiscal years beginning after December 15, 2011 and for interim periods within those fiscal years.
8. Subsequent Events
In accordance with the adoption of ASC Topic 855, Subsequent Events, and in preparing these financial statements, the Fund has evaluated the need for disclosures and/or adjustments resulting from subsequent events through the date of issuance of these financial statements. This evaluation did not result in any subsequent events that necessitated disclosures and/or adjustments in addition to the disclosure below.
REPORT OF INDEPENDENT REGISTERED PUBLIC ACCOUNTING FIRM
To the Shareholders, Trustees and
Audit Committee of SCS Tactical Allocation Fund
We have audited the accompanying statement of assets and liabilities of the SCS Tactical Allocation Fund (the “Fund”, one of the series constituting the Starboard Investment Trust), including the schedule of investments as of August 31, 2012, and the related statements of operations, the statements of changes in net assets, and the financial highlights for the initial period from February 9, 2012 (date of initial public investment) to August 31, 2012. These financial statements and financial highlights are the responsibility of the Fund’s management. Our responsibility is to express an opinion on these financial statements and financial highlights based on our audits.
We conducted our audits in accordance with the standards of the Public Company Accounting Oversight Board (United States). Those standards require that we plan and perform the audit to obtain reasonable assurance about whether the financial statements and financial highlights are free of material misstatement. The Fund is not required to have, nor were we engaged to perform, an audit of its internal control over financial reporting. Our audits included consideration of internal control over financial reporting as a basis for designing audit procedures that are appropriate in the circumstances, but not for the purpose of expressing an opinion on the effectiveness of the Fund’s internal control over financial reporting. Accordingly, we express no such opinion. An audit also includes examining, on a test basis, evidence supporting the amounts and disclosures in the financial statements, assessing the accounting principles used and significant estimates made by management, as well as evaluating the overall financial statement presentation. Our procedures included confirmation of the securities owned as of August 31, 2012, by correspondence with the custodian and brokers. We believe that our audits provide a reasonable basis for our opinion.
In our opinion, the financial statements and financial highlights referred to above present fairly, in all material respects, the financial position of SCS Tactical Allocation Fund as of August 31, 2012, and the results of its operations, the changes in net assets, and the financial highlights for the initial period from February 9, 2012 (date of initial public investment) to August 31, 2012 in conformity with accounting principles generally accepted in the United States of America.
Chicago, Illinois
October 22, 2012
SCS Tactical Allocation Fund
Additional Information (Unaudited)
| 1. | Proxy Voting Policies and Voting Record |
A copy of the Trust’s Proxy Voting and Disclosure Policy and the Advisor’s Disclosure Policy are included as Appendix B to the Fund’s Statement of Additional Information and are available, without charge, upon request, by calling 1-800-773-3863, and on the website of the Security and Exchange Commission (“SEC”) at http://www.sec.gov. Information regarding how the Fund voted proxies relating to portfolio securities during the most recent period ended June 30, is available (1) without charge, upon request, by calling the Fund at the number above and (2) on the SEC’s website at http://www.sec.gov.
| 2. | Quarterly Portfolio Holdings |
The Fund files its complete schedule of portfolio holdings with the SEC for the first and third quarters of each fiscal year on Form N-Q. The Fund’s Forms N-Q are available on the SEC’s website at http://www.sec.gov. You may review and make copies at the SEC’s Public Reference Room in Washington, D.C. Information on the operation of the Public Reference Room may be obtained by calling the SEC at 202-942-8090. You may also obtain copies without charge, upon request, by calling the Fund toll-free at 1-800-773-3863.
We are required to advise you within 60 days of the Fund’s fiscal year-end regarding the federal tax status of certain distributions received by shareholders during each fiscal year. The following information is provided for the Fund’s fiscal year ended August 31, 2012.
During the fiscal year, no long-term capital gain distributions were paid from the Fund.
Dividend and distributions received by retirement plans such as IRAs, Keogh-type plans, and 403(b) plans need not be reported as taxable income. However, many retirement plans may need this information for their annual information meeting.
| 4. | Schedule of Shareholder Expenses |
As a shareholder of the Fund, you incur two types of costs: (1) transaction costs, which may include sales charges (loads) on purchase payments and (2) ongoing costs, including investment advisory fees; distribution (12b-1) fees; and other Fund expenses. This example is intended to help you understand your ongoing costs (in dollars) of investing in the Fund and to compare these costs with the ongoing costs of investing in other mutual funds. The example is based on an investment of $1,000 invested at the beginning of the period and held for the entire period as indicated below.
Actual Expenses – The first line of the table below provides information about the actual account values and actual expenses. You may use the information in this line, together with the amount you invested, to estimate the expenses that you paid over the period. Simply divide your account value by $1,000 (for example, an $8,600 account value divided by $1,000 = 8.6), then multiply the result by the number in the first line under the heading entitled “Expenses Paid During Period” to estimate the expenses you paid on your account during this period.
SCS Tactical Allocation Fund
Additional Information (Unaudited)
Hypothetical Example for Comparison Purposes – The last line of the table below provides information about hypothetical account values and hypothetical expenses based on the Fund’s actual expense ratio and an assumed annual rate of return of 5% before expenses, which is not the Fund’s actual return. The hypothetical account values and expenses may not be used to estimate the actual ending account balance or expenses you paid for the period. You may use this information to compare the ongoing costs of investing in the Fund and other funds by comparing this 5% hypothetical example with the 5% hypothetical examples that appear in the shareholder reports of other funds.
| Institutional Class Shares | Beginning Account Value March 1, 2012 | Ending Account Value August 31, 2012 | Expenses Paid During Period* |
Actual Hypothetical (5% annual return before expenses) | | | |
| $1,000.00 | $1,006.80 | $8.32 |
| $1,000.00 | $1,016.84 | $8.36 |
Expenses are equal to the average account value over the period multiplied by the Fund’s annualized expense ratio, multiplied by the number of days in the most recent period divided by the number of days in the fiscal year (to reflect the initial period).
| 5. | Information about Trustees and Officers |
The business and affairs of the Fund and the Trust are managed under the direction of the Board of Trustees of the Trust. Information concerning the Trustees and officers of the Trust and Fund is set forth below. Generally, each Trustee and officer serves an indefinite term or until certain circumstances such as their resignation, death, or otherwise as specified in the Trust’s organizational documents. Any Trustee may be removed at a meeting of shareholders by a vote meeting the requirements of the Trust’s organizational documents. The Statement of Additional Information of the Fund includes additional information about the Trustees and officers and is available, without charge, upon request by calling the Fund toll-free at 1-800-773-3863. The address of each Trustee and officer, unless otherwise indicated below, is 116 South Franklin Street, Rocky Mount, North Carolina 27804. The Independent Trustees each received aggregate compensation of $1,000.00 during the fiscal year ended August 31, 2012 from the Fund for their services to the Fund and Trust.
SCS Tactical Allocation Fund
Additional Information (Unaudited)
Name, Age and Address | Position held with Fund or Trust | Length of Time Served | Principal Occupation During Past 5 Years | Number of Portfolios in Fund Complex Overseen by Trustee | Other Directorships Held by Trustee During Past 5 Years |
| Independent Trustees |
Jack E. Brinson Age: 80 | Independent Trustee | Since 7/09 | Retired; previously, President of Brinson Investment Co. (personal investments) and President of Brinson Chevrolet, Inc. (auto dealership). | 19 | Independent Trustee of Brown Capital Management Funds for its three series, DGHM Investment Trust for its two series, Gardner Lewis Investment Trust for its two series, Hillman Capital Management Investment Trust for its one series, and Tilson Investment Trust for its two series (all registered investment companies); previously, Independent Trustee of de Leon Funds Trust for its one series from 2000 to 2005, Giordano Investment Trust for its one series during 2011, and New Providence Investment Trust for its one series from inception until 2011 (all registered investment companies). |
Michael G. Mosley Age: 59 | Independent Trustee | Since 7/10 | Owner of Commercial Realty Services (real estate) since 2004. | 19 | None. |
Theo H. Pitt, Jr. Age: 76 | Independent Trustee | Since 9/10 | Senior Partner, Community Financial Institutions Consulting (financial consulting) since 1999; Partner, Pikar Properties (real estate) since 2001; Account Administrator, Holden Wealth Management Group of Wachovia Securities (money management firm) from 2003-2008. | 19 | Independent Trustee of DGHM Investment Trust for its two series, Gardner Lewis Investment Trust for its two series, and Hanna Investment Trust for its one series (all registered investment companies); previously, Independent Trustee of Hillman Capital Management Investment Trust for its two series from 2000 to 2009, NCM Capital Investment Trust for its one series from 2007 to 2009, New Providence Investment Trust for its one series from 2008 to 2009, and Tilson Investment Trust for its two series from 2004 to 2009 (all registered investment companies). |
SCS Tactical Allocation Fund
Additional Information (Unaudited)
Name, Age and Address | Position held with Fund or Trust | Length of Time Served | Principal Occupation During Past 5 Years | Number of Portfolios in Fund Complex Overseen by Trustee | Other Directorships Held by Trustee During Past 5 Years |
James H. Speed, Jr. Age: 59 | Independent Trustee, Chairman | Trustee since 7/09, Chair since 5/12 | President and CEO of NC Mutual Insurance Company (insurance company) since 2003; President of Speed Financial Group, Inc. (consulting and private investments) from 2000 to 2003. | 19 | Independent Trustee of the following Brown Capital Management Funds for its three series, Hillman Capital Management Investment Trust for its one series, and Tilson Investment Trust for its two series (all registered investment companies). Member of Board of Directors of NC Mutual Life Insurance Company. Member of Board of Directors of M&F Bancorp. Previously, Independent Trustee of New Providence Investment Trust for its one series from 2009 until 2011 (registered investment company). |
J. Buckley Strandberg Age: 52 | Independent Trustee | Since 7/09 | President of Standard Insurance and Realty (insurance and property management) since 1982. | 19 | None. |
| Other Officers |
Cort F. Meinelschmidt Age: 33 38 S. Potomac Street Suite 304 Hagerstown, MD 21740 | President and Treasurer (SCS Tactical Allocation Fund) | Since 10/11 | President of Sentinel Capital Solutions, Inc. (advisor to the SCS Tactical Allocation Fund) since 2011; Financial Advisor for Centra Financial Services (investment services) from 2010-2011; Financial Advisor for Edward Jones (investment services) from 2004-2010. | n/a | n/a |
T. Lee Hale, Jr. Age: 34 | Chief Compliance Officer; Assistant Treasurer | Since 7/09 and 4/10 | Financial Reporting Manager for The Nottingham Company (fund administrator) since 2009; previously, principal of Lee Hale Contracting (marine industry consulting). | n/a | n/a |
A. Vason Hamrick Age: 35 | Secretary | Since 7/09 | Corporate Counsel for The Nottingham Company since 2004. | n/a | n/a |
SCS Tactical Allocation Fund
is a series of
Starboard Investment Trust
| For Shareholder Service Inquiries: | For Investment Advisor Inquiries: |
| Nottingham Shareholder Services, LLC | Sentinel Capital Solutions |
| 116 South Franklin Street | 38 S. Potomac Street |
Post Office Drawer 4365 Rocky Mount, North Carolina 27803 | Suite 304 Hagerstown, MD 21740 |
Toll-Free Telephone: Toll-Free Telephone:
| 1-800-773-3863 | 1-800-773-3863 |
| World Wide Web @: | World Wide Web @: |
Item 2. CODE OF ETHICS.
The registrant’s Board of Trustees has determined that the registrant has an audit committee financial expert, as defined in Item 3 of Form N-CSR, serving on its audit committee.
As of the date of this report, August 31, 2012, the registrant’s audit committee financial expert is Mr. James H. Speed, Jr. Mr. Speed is “independent” for purposes of Item 3 of Form N-CSR.
Item 4. PRINCIPAL ACCOUNTANT FEES AND SERVICES.
Not applicable.
A copy of the schedule of investments of unaffiliated issuers as of the close of the reporting period is included as part of the report to shareholders filed under Item 1 of this Form.
Not applicable.
Not applicable.
Item 10. SUBMISSION OF MATTERS TO A VOTE OF SECURITY HOLDERS.
Item 11. CONTROLS AND PROCEDURES.
Item 12. EXHIBITS.
Pursuant to the requirements of the Securities Exchange Act of 1934 and the Investment Company Act of 1940, the registrant has duly caused this report to be signed on its behalf by the undersigned, thereunto duly authorized.
Pursuant to the requirements of the Securities Exchange Act of 1934 and the Investment Company Act of 1940, this report has been signed below by the following persons on behalf of the registrant and in the capacities and on the dates indicated.