UNITED STATES
SECURITIES AND EXCHANGE COMMISSION
Washington, D.C. 20549
FORM N-CSR
CERTIFIED SHAREHOLDER REPORT OF REGISTERED
MANAGEMENT INVESTMENT COMPANIES
Investment Company Act file number 811-22298
Starboard Investment Trust
(Exact name of registrant as specified in charter)
116 South Franklin Street, Post Office Box 69, Rocky Mount, North Carolina 27802
(Address of principal executive offices) (Zip code)
Terrence O. Davis
116 South Franklin Street, Post Office Box 69, Rocky Mount, North Carolina 27802
(Name and address of agent for service)
Registrant's telephone number, including area code: 252-972-9922
Date of fiscal year end: August 31
Date of reporting period: August 31, 2013
Item 1. REPORTS TO STOCKHOLDERS.
Statements in this Annual Report that reflect projections or expectations of future financial or economic performance of the Roumell Opportunistic Value Fund (“Fund”) and of the market in general and statements of the Fund’s plans and objectives for future operations are forward-looking statements. No assurance can be given that actual results or events will not differ materially from those projected, estimated, assumed or anticipated in any such forward-looking statements. Important factors that could result in such differences, in addition to the other factors noted with such forward-looking statements, include, without limitation, general economic conditions such as inflation, recession and interest rates. Past performance is not a guarantee of future results.
An investment in the Fund is subject to investment risks, including the possible loss of some or the entire principal amount invested. There can be no assurance that the Fund will be successful in meeting its investment objective. Investment in the Fund is also subject to the following risks: market risk, opportunistic investment strategy risk, sector risk, non-diversified fund risk, investment advisor risk, new fund risk, operating risk, common stocks risk, preferred stock risk, warrants risk, convertible securities risk, large-cap securities risk, small-cap and mid-cap securities risk, micro-cap securities risk, risks related to investing in other investment companies, interest rate and credit risk, maturity risk, inflation risk, investment-grade securities risk, lower-rated securities or “junk bonds” risk, risks of investing in municipal securities, risks of investing in REITs, risk of investing in corporate debt securities, government debt markets may be illiquid or disrupted, foreign securities risk, and currency risk. More information about these risks and other risks can be found in the Fund’s prospectus.
The performance information quoted in this annual report represents past performance, which is not a guarantee of future results. Investment return and principal value of an investment will fluctuate so that an investor’s shares, when redeemed, may be worth more or less than their original cost. Current performance may be lower or higher than the performance data quoted. An investor may obtain performance data current to the most recent month-end by visiting ncfunds.com.
An investor should consider the investment objectives, risks, and charges and expenses of the Fund carefully before investing. The prospectus contains this and other information about the Fund. A copy of the prospectus is available at ncfunds.com or by calling Shareholder Services at 800-773-3863. The prospectus should be read carefully before investing.
This Annual Report was first distributed to shareholders on or about October 30, 2013.
For More Information on Your Roumell Opportunistic Value Fund:
See Our Web site @ ncfunds.com.
or
Call Our Shareholder Services Group at 800-773-3863.
August 31, 2013
For the year ended August 31, 2013, the return on the Institutional class shares was 20.71%. This compares to 24.38% for the Russell 2000 Value Index, 13.04% for the 60% Russell 2000 Value Index/40% Barclays Government Credit Index and 18.70% for the S&P 500 over the same period. These returns were attained with an allocation of about 26% in cash, 58% in equities, and 16% in fixed income during the fiscal year.
Please see the table below for the Fund’s historical performance information through the calendar quarter ended September 30, 2013.
Average Annual Total Returns | | | Net | Gross |
Period Ended September 30, 2013 | Past 1 Year | Since Inception* | Expense Ratio** | Expense Ratio*** |
Roumell Opportunistic Value Fund – Institutional Class Shares | 19.51% | 4.71% | 1.23% | 1.83% |
Russell 2000 Value Index | 27.04% | 12.21% | | |
60% Russell 2000 Value index, and 40% Barclays Capital U.S. Government Credit Index | 15.09% | 9.05% | | |
S&P 500 Total Return Index | 19.34% | 13.57% | | |
The quoted performance data represents past performance, which is not a guarantee of future results. Investment return and principal value of an investment in the Fund will fluctuate so that an investor's shares, when redeemed, may be worth more or less than their original cost. Current performance may be lower or higher than the performance data quoted. To obtain more current performance data regarding the Fund, including performance data current to the Fund’s most recent month-end, please visit ncfunds.com or call the Fund at (800)525-3863. Fee waivers and expenses reimbursements have positively impacted Fund performance.
*The Fund’s inception date is December 31, 2010.
**The Advisor has entered into an Operating Plan with the Fund’s administrator through January 1, 2015, under which it has agreed to (i) to pay the administrator a fee based on the daily average net assets of the Fund when net assets are below $77 million; (ii) if these payments are less than a designated minimum, then the Advisor pays a fee that makes up the difference; and (iii) to assume expenses of the Fund outlined in the Operating Plan that are not covered by the fee paid under Fund Accounting and Administration Agreement. These measures are intended to limit the Fund’s operating expenses to 1.23% of the average daily net assets, exclusive of brokerage fees and commissions, portfolio transaction fees, registration fees taxes, borrowing costs (such as interest or dividend expenses on securities sold short), acquired fund fees and expenses, extraordinary expenses, and distribution and/or service (12b-1) fees. The Fund’s net expense ratio will be higher than 1.23% to the extent the Fund incurs expenses excluded from this arrangement. The Operating Plan can only be terminated prior to the conclusion of the current term with the approval of the Fund’s Board of Trustees. The net expense ratio does not include acquired fund fees and expenses. More recent expense ratios are found in the Financial Highlights.
***Gross expense ratio is from the Fund’s prospectus dated July 23, 2013 and includes acquired fund fees and expenses and other expenses.
Roumell Asset Management, LLC (“RAM”) pursues long-term capital growth and income through opportunistic value investing. We seek to own a basket of deeply researched, conservatively financed securities that are out of favor, overlooked, or misunderstood by Wall Street and thus able to be bought at a significant discount to our calculation of intrinsic value. We believe this strategy maximizes the probability of above-average rates of return over time.
RAM is an opportunistic capital allocator. As such, we have the advantage of waiting for opportunities, unlike the vast majority of mutual fund managers, who must live with investment mandates to remain fully invested at all times. RAM sits patiently in cash in the absence of exceptional pricing. We are in the business of valuing companies (in terms of their earnings power and asset value), determining an appropriate discount level required to live with the risks embedded in the security, and buying when that price level is met. We ask this central question: would we take this company private in a heartbeat? One doesn’t take a company private as a result of anticipated Fed action, interest rate expectations, or attempts to handicap money flows into select asset classes. That’s market “stuff,” and it’s not what we do.
We take comfort in our portfolio of conservatively financed companies with unique assets which we own at meaningful discounts to our calculation of intrinsic value. We invest predominantly in companies with strong balance sheets, an approach that we believe dramatically reduces our risk of permanent loss of capital. The companies in which we invest possess valuable assets, tend to have substantial cash
positions, and are typically unencumbered by significant liabilities. We believe selecting specific securities at very specific prices will prove to be the most effective way to manage risk while capturing attractive rates of return over time.
Price Trumps Economic Forecasting
In July 2009, the very popular macroeconomic investment strategist Marc Faber predicted that the United States was about to enter a period of hyperinflation approaching the levels of Zimbabwe. PIMCO’s Bill Gross in May of 2009 expressed his belief in “accelerating inflation” and low market returns because of subdued growth. Inflation has been modest, at best. Nouriel Roubini, the widely regarded NYU economist who correctly predicted the housing collapse, rightly indicated in 2009 that the economic recovery would be anemic; unfortunately for those who may have taken his advice, he recommended investors keep all their assets safely in cash, thereby missing the past few years’ dramatic market rise. Columbia University Professor Edmund Phelps, winner of a Nobel Prize in economics in 2006, predicted in 2009 that it may take as long as 15 years for U.S. households to restore the wealth lost in the financial crisis. It actually took four years, having recently climbed to $70 trillion, above the 2008 peak of $67 trillion.
There’s no shortage of examples of “the dismal science’s” dismal record in predicting the economy’s future. In July 2005, the same month that home-builder stocks peaked, soon-to-be Federal Reserve chairman Ben Bernanke disputed the existence of a housing bubble. Bernanke said, “We’ve never had a decline in house prices on a nationwide basis. So what I think is more likely is that house prices will slow, maybe stabilize. … I don’t think it’s going to drive the economy too far from its full employment path, though.” A few months later, his predecessor, Alan Greenspan, said, “We’re not about to go into a situation where prices will go down. … There is no evidence home prices are going to collapse.” Moreover, macroeconomic conditions do not foretell market responses, as Roubini’s correct economic forecast, but dead wrong market prediction, well illustrates. If the best trained, most highly educated economists, possessing the best information, cannot reasonably predict the future or, more importantly, markets’ reactions, why do investors keep trying to use economics as an investment tool?
In the past, we have weighed in over the past few years with our own economic observations. Like many investors, we have wrestled with how much time we should allocate to understanding macroeconomic trends. We have noted—as points of concern—economic growth rates that seem to be perennially reset down, in both the United States and Europe, persistently high real unemployment
levels, and overleveraged consumers. Particularly in the aftermath of the financial crisis, we focused more time on these issues. However, three factors appear to undermine the utility of economic forecasting as an investment tool: the absence of price in the equation, the scarcity of original thinking, and the difficulty of predicting human behavior.
As investors, we have come to appreciate that an economic perspective is useless if not viewed in relation to security prices. And prices, in turn, must be viewed in relation to a reasonable range of earnings and/or asset values through the entirety of an economic cycle. To wit, in January of 2000, the economy was doing quite well: a budget surplus coincided with a sub-5% unemployment rate and robust GDP growth. The market fell more than 40% in the following 30 months. By March 2009, the country’s deficit climbed to $1.5 trillion, unemployment shot above 10%, and GDP was declining. The market has risen by more than 100% since that time. The most prescient variable seems to have been price. Prices in 2000 were high (while the economy was quite strong), and prices were cheap in 2009 (while the economy was abysmally weak).
What you pay (price), in relation to what you get (value), is the most important determinant of investment results over time, period. A superior price occurs when it occurs. It can happen in any market environment. Certainly, markets themselves get overvalued, in aggregate, and finding a great price is more difficult during those times, such as now, in our opinion. The simple question for us has always been: would we take this company private in a heartbeat at the price being offered? Intrinsic value is determined by a company’s cash flows and/or asset values (e.g., non-core real estate, salable divisions, intellectual property, or oil and gas reserves), regardless of how those things are measured in the stock market at an arbitrary point in time. Private market value is what steadies us, keeps us focused and reasonably sane during periods of market volatility and economic uncertainty. It will always be our North Star.
The second reason economic forecasting has limited investment appeal to us is the challenge of noting something that isn’t widely recognized and thus already incorporated in prices. We often end up hearing what John Maynard Keynes referred to as “the average opinion of the average opinion.” Following are some of the headlines in 2009, precisely when security prices were superior, that give the strong impression of an echo chamber. There is an absence of truly variant views, which is more often than not a prerequisite to making money:
· “2009 Will Be Very, Very Bleak,” Nouriel Roubini, Forbes
· “U.S. Foreclosure Filings Up 81% in 2008,” Yahoo News
· “Gloom Deepens among Executives, Economists at Davos,” Bloomberg
· “Bad News: We’re Back to 1931. Good News: It’s Not 1933 Yet,” Telegraph
· “Morgan Stanley Says S&P 500 to Drop 25%, Cuts Outlook,” Bloomberg
Morgan Stanley’s claim was made on March 13, 2009, four days after the S&P 500’s 13-year bottom. What was the utility to investors of rehashing widely known information that was likely fully incorporated into stock prices?
The last reason that makes forecasting’s investment efficacy wanting is the human actor — he or she is very difficult to predict. Yale professor Robert Shiller, a superb economist in our view, who in fact correctly predicted the housing collapse, has written extensively about why economic modeling will always remain a big challenge, ranging from estimating a housing recovery to predicting savings rates. “Animal spirits,” so important to economic growth, seem to happen when they happen and what triggers them remains a mystery, like much of human behavior. Shiller doesn’t look for economists’ batting average to rise, noting, “The rational expectations models will be tweaked to account for the current crisis. The basic curriculum will not change.”
We believe that an investor’s time is best spent deepening his or her understanding of a specific company’s dynamics, and the less followed a company is by the broader investment community the better because less information is likely to be “priced-in.” If you focus on securities with the least amount of information priced-in, detailed, exhaustive research can provide a significant investment edge, in our opinion. Time spent talking to a company’s customers is more valuable than time spent trying to gauge the direction of interest rates. Recently, in Birmingham, Alabama, we met with a significant customer of one of our holdings and learned that this client’s satisfaction and loyalty to our company were quite high, but that the client had nonetheless used new competition in the marketplace to extract much better pricing. Our investors will be far better served by that interview than had we attempted to forecast interest rates. Information pertaining to specific securities beats musing about overall economics, in our view.
Notwithstanding such observations, compiling reported economic data to form a general view on the economy is useful. We simply believe economic data must be considered in the context of price, while the usefulness of economic forecasting must be discounted. Our view is that current growth levels in the United States are insufficient to absorb population and productivity gains, and although the headline unemployment number has come down, 2.8 million of the 5.3 million employment gains since June 2009 are low-paying part-time jobs. In Europe, bank liabilities are 3x GDP, compared to 0.8x in the
United States, making credit expansion in Europe all but impossible. China’s economic growth appears to be slowing, and countries around the world seem to be ready to use their currencies to compete for market share by driving their values down and thus making their exports cheaper. The unforeseen U.S. energy boom exemplifies the diversity of this economy and is Exhibit A as to why this country should never be likened to Greece. With those general views, among others, we go about searching for value wherever we might find it. We might invest in a retailer despite consumer deleveraging, or in a company leveraged to copper despite a slowing Chinese economy, if those particular securities are adequately priced to compensate us for risk attributed to the economic headwinds.
This general discussion shouldn’t lead one to believe that dedicated bottom-up company investors, in contrast to macroeconomic ones, are in the clear. Hardly. We make mistakes selecting securities. In 2011, our individual security holdings diverged from the market as we were early on a number of investments and we experienced a period of negative returns when the overall market advanced. We put a high focus on extracting lessons from our mistakes.
Peter Lynch, the famed 1980s manager of the Fidelity Magellan Fund, once said, “If an investor spends fifteen minutes a year studying the economy, he’s wasted ten.” Essentially, the cost to relying on macroeconomic data to determine investment allocation will likely be many missed opportunities, as fear about the world supplants the facts of a well-priced particular security. Similarly, a booming economy can instill false confidence when price doesn’t warrant investment. There are a handful of successful macro-oriented investors, such as George Soros, who has been particularly adroit at trading currencies. A. Gary Shilling deserves recognition for his persistent and quite contrarian investment call in long-term treasury securities. The odds of success, however, are decidedly in favor of bottom-up investors. The lack of wealthy economists seems instructive. Since the firm’s founding 15 years ago, we have had a company-specific investment focus and will continue to do so due to our conviction that particulars are more important than generalities.
Best Regards,
Jim Roumell
Lead Portfolio Manager
Roumell Opportunistic Value Fund
| ROUMELL OPPORTUNISTIC VALUE FUND | | | | | | | | | | | |
| Institutional Class Shares | | | | | | | | | | | | |
| | | | | | | | | | | | | | | | | | | | |
| Performance Update (Unaudited) | | | | | | | | | | | | | |
| | | | | | | | | | | | | | | | | | | | |
| For the period from December 31, 2010 (Date of Initial Public Investment) to August 31, 2013 | |
| | | | | | | | | | | | | | | | | | | | |
| Comparison of the Change in Value of a $25,000 Investment | | | | | | | | |
| | | | | | | | | | | | | | | | | | | | |
| |  | | |
| | | | | | | | | | | | | | | | | | | | |
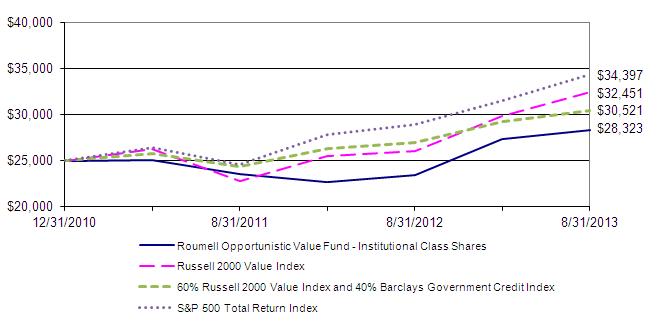
| This graph assumes the minimum initial investment of $25,000 at December 31, 2010 (Date of Initial Public Investment). All dividends and distributions are reinvested. This graph depicts the performance of the Roumell Opportunistic Value Fund Institutional Class Shares (the “Fund”) versus the Russell 2000 Value Index, a blend of 60% of the Russell 2000 Value Index and 40% of the Barclays Government Credit Index, and the S&P 500 Total Return Index. It is important to note that the Fund is a professionally managed mutual fund while the indices are not available for investment and are unmanaged. The comparison is shown for illustrative purposes only. |
| | | | | | | | | | | | | | | | | | | | |
| | Average Annual Total Returns | |
| | | | | | | | | | | | | | | | | | Gross | | |
| | | As of | | | | | | One | | Since | | Inception | Expense | |
| | | August 31, 2013 | | | | | Year | | Inception | | Date | | Ratio* | | |
| | | Institutional Class Shares | | | | | 20.71% | | 4.79% | | 12/31/10 | | 1.83% | | |
| | | Russell 2000 Value Index | | | | | 24.38% | | 10.27% | | N/A | | N/A | | |
| | | 60% Russell 2000 Value Index and | | | | | | | | | | | |
| | | | 40% Barclays Government Credit Index | | | 13.04% | | 7.76% | | N/A | | N/A | | |
| | | S&P 500 Total Return Index | | | | 18.70% | | 12.70% | | N/A | | N/A | | |
| | | | | | | | | | | | | | | | | | | | |
| * The gross expense ratio shown is from the Fund's prospectus dated July 23, 2013. | | | |
| | | | | | | | | | | | | | | | | | | | |
| Performance quoted above represents past performance, which is no guarantee of future results. Investment return and principal value will fluctuate so that shares, when redeemed, may be worth more or less than their original cost. Current performance may be lower or higher than the performance data quoted. An investor may obtain performance data, current to the most recent month-end, by visiting ncfunds.com. |
| | | | | | | | | | | | | | | | | | | | |
| The graph and table do not reflect the deduction of taxes that a shareholder would pay on Fund distributions or the redemption of Fund shares. Average annual total returns are historical in nature and measure net investment income and capital gain or loss from portfolio investments assuming reinvestments of distributions. |
| | | | | | | | | | | | | | | | | | | | |
| | | | | | | | | | | | | | | | | | | | |
| ROUMELL OPPORTUNISTIC VALUE FUND | | | | | | | | | | | |
| Class A Shares | | | | | | | | | | | | | |
| | | | | | | | | | | | | | | | | | | | |
| Performance Update (Unaudited) | | | | | | | | | | | | | |
| | | | | | | | | | | | | | | | | | | | |
| For the period from December 31, 2010 (Date of Initial Public Investment) to August 31, 2013 | | |
| | | | | | | | | | | | | | | | | | | | |
| Comparison of the Change in Value of a $10,000 Investment | | | | | | | | |
| | | | | | | | | | | | | | | | | | | | |
| |  | |
| | | | | | | | | | | | | | | | | | | | |
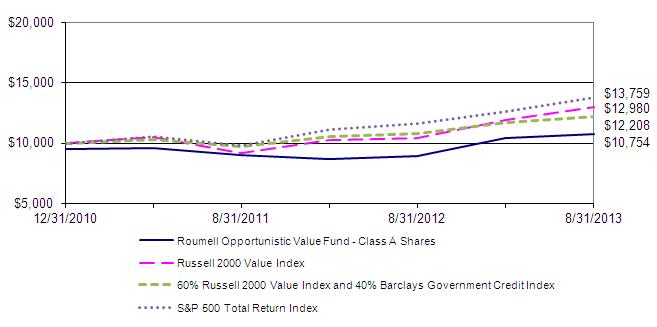
| This graph assumes an initial investment of $10,000 ($9,550 after maximum sales load of 4.50%) at December 31, 2010 (Date of Initial Public Investment). All dividends and distributions are reinvested. This graph depicts the performance of the Roumell Opportunistic Value Fund Class A Shares (the “Fund”) versus the Russell 2000 Value Index, a blend of 60% of the Russell 2000 Value Index and 40% of the Barclays Government Credit Index, and the S&P 500 Total Return Index. It is important to note that the Fund is a professionally managed mutual fund while the indices are not available for investment and are unmanaged. The comparison is shown for illustrative purposes only. |
| | | | | | | | | | | | | | | | | | | | |
| | Average Annual Total Returns | | | | | | | | | | | | | |
| | | | | | | | | | | | | | | | | | Gross | | |
| | | As of | | | | | | One | | Since | | Inception | | Expense | |
| | | August 31, 2013 | | | | | Year | | Inception | | Date | | Ratio* | | |
| | | Class A Shares - No Sales Load | | | 20.46% | | 4.55% | | 12/31/10 | | 2.08% | | |
| | | Class A Shares - 4.50% Maximum Sales Load | | 15.01% | | 2.76% | | 12/31/10 | | 2.08% | | |
| | | Russell 2000 Value Index | | | | 24.38% | | 10.27% | | N/A | | N/A | | |
| | | 60% Russell 2000 Value Index and | | | | | | | | | | | |
| | | | 40% Barclays Government Credit Index | | 13.04% | | 7.76% | | N/A | | N/A | | |
| | | S&P 500 Total Return Index | | | | 18.70% | | 12.70% | | N/A | | N/A | | |
| * The gross expense ratio shown is from the Fund's prospectus dated July 23, 2013. | | | | |
| | | | | | | | | | | | | | | | | | | | |
| Performance quoted above represents past performance, which is no guarantee of future results. Investment return and principal value will fluctuate so that shares, when redeemed, may be worth more or less than their original cost. Current performance may be lower or higher than the performance data quoted. An investor may obtain performance data, current to the most recent month-end, by visiting ncfunds.com. |
| | | | | | | | | | | | | | | | | | | | |
| The graph and table do not reflect the deduction of taxes that a shareholder would pay on Fund distributions or the redemption of Fund shares. Average annual total returns are historical in nature and measure net investment income and capital gain or loss from portfolio investments assuming reinvestments of distributions. |
| | | | | | | | | | | | | | | | | | | | |
| | | | | | | | | | | | | | | | | | | | |
| ROUMELL OPPORTUNISTIC VALUE FUND | | | | | | | | | | | |
| Class C Shares | | | | | | | | | | | | | |
| | | | | | | | | | | | | | | | | | | | |
| Performance Update (Unaudited) | | | | | | | | | | | | | |
| | | | | | | | | | | | | | | | | | | | |
| For the period from July 30, 2013 (Date of Initial Public Investment) to August 31, 2013 | | |
| | | | | | | | | | | | | | | | | | | | |
| Comparison of the Change in Value of a $10,000 Investment | | | | | | | | |
| | | | | | | | | | | | | | | | | | | | |
| |  | | |
| | | | | | | | | | | | | | | | | | | | |
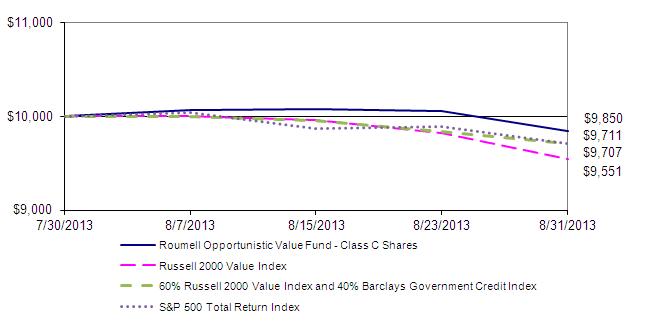
| This graph assumes an initial investment of $10,000 at July 30, 2013 (Date of Initial Public Investment) and includes the 1% maximum deferred sales charge. All dividends and distributions are reinvested. This graph depicts the performance of the Roumell Opportunistic Value Fund Class C Shares (the “Fund”) versus the Russell 2000 Value Index, a blend of 60% of the Russell 2000 Value Index and 40% of the Barclays Government Credit Index, and the S&P 500 Total Return Index. It is important to note that the Fund is a professionally managed mutual fund while the indices are not available for investment and are unmanaged. The comparison is shown for illustrative purposes only. |
| | | | | | | | | | | | | | | | | | | | |
| | Average Annual Total Returns | | | | | | | | | | | | | |
| | | | | | | | | | | | | | | | | | Gross | | |
| | | As of | | | | Since | | | | Inception | | | | Expense | |
| | | August 31, 2013 | | | Inception | | | | Date | | | | Ratio* | | |
| | | Class C Shares | | | -1.50% | | | | 07/30/13 | | | | 2.83% | | |
| | | Russell 2000 Value Index | | -4.49% | | | | N/A | | | | N/A | | |
| | | 60% Russell 2000 Value Index and | | | | | | | | | | | |
| | | | 40% Barclays Government Credit Index | -2.93% | | | | N/A | | | | N/A | | |
| | | S&P 500 Total Return Index | | -2.89% | | | | N/A | | | | N/A | | |
| | | | | | | | | | | | | | | | | | | | |
| * The gross expense ratio shown is from the Fund's prospectus dated July 23, 2013. | | |
| | | | | | | | | | | | | | | | | | | | |
| Performance quoted above represents past performance, which is no guarantee of future results. Investment return and principal value will fluctuate so that shares, when redeemed, may be worth more or less than their original cost. Current performance may be lower or higher than the performance data quoted. An investor may obtain performance data, current to the most recent month-end, by visiting ncfunds.com. |
| | | | | | | | | | | | | | | | | | | | |
| The graph and table do not reflect the deduction of taxes that a shareholder would pay on Fund distributions or the redemption of Fund shares. Average annual total returns are historical in nature and measure net investment income and capital gain or loss from portfolio investments assuming reinvestments of distributions. |
| | | | | | | | | | | | | | | | | | | | |
| | | | | | | | | | | | | | | | | | | | |
| ROUMELL OPPORTUNISTIC VALUE FUND | | | | | |
| | | | | | | | | | | |
| Schedule of Investments | | | | | | | |
| | | | | | | | | | | |
| | | | | | | | | | | |
| As of August 31, 2013 | | | | | | | |
| | | | | | | Shares | | Cost | | Value (Note 1) |
| | | | | | | | | | | |
| COMMON STOCKS - 38.48% | | | | | | | |
| | | | | | | | | | | |
| | Consumer Discretionary - 4.68% | | | | | | |
| | * | Aeropostale, Inc. | | | 73,000 | $ | 967,425 | $ | 593,490 |
| | * | Digital Generation, Inc. | | | 92,000 | | 743,427 | | 1,128,840 |
| | | | | | | | | | | 1,722,330 |
| | Energy - 8.00% | | | | | | | |
| | * | TETRA Technologies, Inc. | | | 132,000 | | 894,196 | | 1,551,000 |
| | *β | Thunderbird Energy Corp. | | | 413,500 | | 52,225 | | 5,889 |
| | * | Ultra Petroleum Corp. | | | 67,000 | | 1,260,980 | | 1,386,900 |
| | | | | | | | | | | 2,943,789 |
| | Financials - 4.46% | | | | | | | |
| | * | American Safety Insurance Holdings Ltd. | | 5,000 | | 82,525 | | 150,650 |
| | * | First Acceptance Corp. | | | 345,546 | | 426,524 | | 611,616 |
| | * | Lai Sun Development Company Ltd. | | 30,500,000 | | 835,215 | | 877,115 |
| | | | | | | | | | | 1,639,381 |
| | Health Care - 2.41% | | | | | | | |
| | * | Itamar Medical Ltd. | | | 215,000 | | 92,837 | | 79,676 |
| | * | Transcept Pharmaceuticals, Inc. | | 300,000 | | 1,288,499 | | 807,000 |
| | | | | | | | | | | 886,676 |
| | Industrials - 5.18% | | | | | | | |
| | * | Tecumseh Products Co. Cl. A | | 187,000 | | 784,889 | | 1,808,290 |
| | * | Tecumseh Products Co. Cl. B | | 10,400 | | 35,464 | | 95,472 |
| | | | | | | | | | | 1,903,762 |
| | Information Technology - 11.23% | | | | | | |
| | | Apple, Inc. | | | 4,574 | | 2,139,322 | | 2,228,526 |
| | * | DSP Group, Inc. | | | 65,000 | | 349,978 | | 412,750 |
| | | QAD, Inc. Cl. A | | | 43,900 | | 458,442 | | 543,482 |
| | | QAD, Inc. Cl. B | | | 9,500 | | 99,599 | | 104,690 |
| | * | Seachange International, Inc. | | 84,070 | | 624,708 | | 840,700 |
| | | | | | | | | | | 4,130,148 |
| | | | | | | | | | | |
| | | | | | | | | | | |
| | | | | | | | | | | |
| | | | | | | | | | | |
| | | | | | | | | | | (Continued) |
| ROUMELL OPPORTUNISTIC VALUE FUND | | | | | |
| | | | | | | | | | | |
| Schedule of Investments | | | | | | | |
| | | | | | | | | | | |
| | | | | | | | | | | |
| As of August 31, 2013 | | | | | | | |
| | | | | | | Shares | | Cost | | Value (Note 1) |
| | | | | | | | | | | |
| | Materials - 2.52% | | | | | | | |
| | *β | Sandstorm Metals & Energy Ltd. | | 651,000 | $ | 1,721,122 | $ | 927,174 |
| | | | | | | | | | | 927,174 |
| | | | | | | | | | | |
| | | Total Common Stocks (Cost $12,857,377) | | | | | 14,153,260 |
| | | | | | | | | | | |
| EXCHANGE TRADED PRODUCT - 0.73% | | | | | | |
| | | Market Vectors Gold Miners ETF | | 9,570 | | 455,224 | | 269,205 |
| | | | | | | | | | | |
| | | Total Exchange Traded Product (Cost $455,224) | | | | 269,205 |
| | | | | | | | | | | |
| | | | | Par | | Interest Rate | | Maturity Date | | |
| CORPORATE BONDS - 8.04% | | | | | | | |
| | | Clayton Williams Energy, Inc. | | $ | 820,000 | | 7.750% | | 4/1/2019 | | 836,400 |
| | ε | GMX Resources, Inc. | 185,000 | | 9.000% | | 3/2/2018 | | 18,500 |
| | | Goodrich Petroleum Corp. | 1,280,000 | | 8.875% | | 3/15/2019 | | 1,318,400 |
| | | Resolute Energy Corp. | 770,000 | | 8.500% | | 5/1/2020 | | 785,400 |
| | | | | | | | | | | |
| | | Total Corporate Bonds (Cost $3,083,196) | | | | | 2,958,700 |
| | | | | | | | | | | |
| | | | | Shares | | Dividend Rate | | | |
| PREFERRED STOCKS - 5.60% | | | | | | |
| | | MVC Capital, Inc. | 33,000 | | 7.250% | | | | 825,000 |
| | | Oxford Lane Capital Corp. | 16,666 | | 8.500% | | | | 433,316 |
| | | SandRidge Energy, Inc. | 8,200 | | 8.500% | | | | 803,600 |
| | | | | | | | | | | |
| | | Total Preferred Stocks (Cost $2,031,829) | | | | | 2,061,916 |
| | | | | | | | | | | |
| | | | | | | | | | | |
| | | | | | | | | | | |
| | | | | | | | | | | |
| | | | | | | | | | | |
| | | | | | | | | | | |
| | | | | | | | | | | |
| | | | | | | | | | | (Continued) |
| ROUMELL OPPORTUNISTIC VALUE FUND | | | | | |
| | | | | | | | | | | |
| Schedule of Investments | | | | | | | |
| | | | | | | | | | | |
| | | | | | | | | | | |
| As of August 31, 2013 | | | | | | | |
| | | | | | | Shares | | Cost | | Value (Note 1) |
| | | | | | | | | | | |
| SHORT-TERM INVESTMENT - 46.98% | | | | | | |
| | § | Federated Treasury Obligations Fund, 0.01% | 17,279,996 | | 17,279,996 | | 17,279,996 |
| | | | | | | | | | | |
| | | Total Short-Term Investment (Cost $17,279,996) | | | | 17,279,996 |
| | | | | | | | | | | |
| Total Value of Investments (Cost $35,707,622) - 99.83% | | | $ | 36,723,077 |
| | | | | | | | | | | |
| Other Assets Less Liabilities - 0.17% | | | | | | 61,976 |
| | | | | | | | | | | |
| | Net Assets - 100.00% | | | | | | $ | 36,785,053 |
| | | | | | | | | | | |
| * | Non-income producing investment | β | Canadian security | | |
| § | Represents 7 day effective yield | ε | Security is in default | | |
| | | | | | | | | | | |
| | | | | | | | | | | |
| | | | | | | | | | | |
| | | | | | | | | | | |
| | | | Summary of Investments | | |
| | | | | | | % of Net | | | | |
| | | | | | | Assets | | Value | | |
| | | | Common Stocks | | | 38.48% | $ | 14,153,260 | | |
| | | | Exchange Traded Product | | 0.73% | | 269,205 | | |
| | | | Corporate Bonds | | | 8.04% | | 2,958,700 | | |
| | | | Preferred Stocks | | | 5.60% | | 2,061,916 | | |
| | | | Short-Term Investment | | | 46.98% | | 17,279,996 | | |
| | | | Total | | | 99.83% | $ | 36,723,077 | | |
| | | | | | | | | | | |
| | | | | | | | | | | |
| | | | | | | | | | | |
| | | | | | | | | | | |
| | | | | | | | | | | |
| | | | | | | | | | | |
| | | | | | | | | | | |
| | | | | | | | | | | |
| | | | | | | | | | | |
| See Notes to Financial Statements | | | | | | |
| ROUMELL OPPORTUNISTIC VALUE FUND | | |
| | | | | | | | |
| Statement of Assets and Liabilities | | |
| | | | | | | | |
| | | | | | | | |
| As of August 31, 2013 | | | |
| | | | | | | | |
| Assets: | | | | | |
| | Investments, at value (cost $35,707,622) | $ | 36,723,077 |
| | Receivables: | | | |
| | | Fund shares sold | | | 196,170 |
| | | Dividends and interest | | 100,804 |
| | Total assets | | | 37,020,051 |
| | | | | | | | |
| Liabilities: | | | | |
| | Payables: | | | | |
| | | Investments purchased | | 143,030 |
| | | Fund shares repurchased | | 53,587 |
| | Accrued expenses | | | |
| | | Advisory fees | | | 28,041 |
| | | Administration fees | | | 9,449 |
| | | Distribution and service fees | | 891 |
| | Total liabilities | | | 234,998 |
| | | | | | | | |
| Net Assets | | | $ | 36,785,053 |
| | | | | | | | |
| Net Assets Consist of: | | | |
| | Paid in Capital | | $ | 33,352,697 |
| | Undistributed net investment income | | 1,842 |
| | Undistributed net realized gain on investments | | 2,415,059 |
| | Net unrealized appreciation on investments | | 1,015,455 |
| | Total Net Assets | | $ | 36,785,053 |
| | | | | | | | |
| Institutional Class Shares of beneficial interest outstanding, no par value (a) | | 3,013,988 |
| | Net Assets | | $ | 33,616,850 |
| | Net Asset Value, Offering Price and Redemption Price Per Share (b) | $ | 11.15 |
| | | | | | | | |
| Class A Shares of beneficial interest outstanding, no par value (a) | | 230,011 |
| | Net Assets | | $ | 2,553,387 |
| | Net Asset Value and Redemption Price Per Share (b) | $ | 11.10 |
| | Offering Price Per Share ($11.10 ÷ 95.50%) | $ | 11.62 |
| | | | | | | | |
| Class C Shares of beneficial interest outstanding, no par value (a) | | 61,762 |
| | Net Assets | | $ | 614,816 |
| | Net Asset Value, Offering Price and Redemption Price Per Share (b)(c) | $ | 9.95 |
| | | | | | | | |
| (a) | Unlimited Authorized Shares | | |
| (b) | The fund charges a 1% redemption fee on redemptions made within 60 days of initial purchase. |
| (c) | Contingent deferred sales charge for Class C Shares is imposed on proceeds redeemed within |
| | one year of purchase date (note 1). | | |
| | | | | | | | |
| See Notes to Financial Statements | | |
| ROUMELL OPPORTUNISTIC VALUE FUND | | |
| | | | | | | | |
| Statement of Operations | | |
| | | | | | | | |
| | | | | | | | |
| For the Year ended August 31, 2013 | | |
| | | | | | | | |
| Investment Income: | | |
| | Interest | | | $ | 283,906 |
| | Dividends | | | 126,757 |
| | | | | | | | |
| | Total Investment Income | | 410,663 |
| | | | | | | | |
| Expenses: | | | | |
| | Advisory fees (note 2) | | 245,484 |
| | Administration fees (note 2) | | 82,717 |
| | Distribution and service fees - Class A Shares (note 3) | | 4,852 |
| | Distribution and service fees - Class C Shares (note 3) | | 289 |
| | | | | | | | |
| | Total Expenses | | 333,342 |
| | | | | | | | |
| Net Investment Income | | 77,321 |
| | | | | | | | |
| Realized and Unrealized Gain on Investments: | | |
| | | | | | | | |
| | Net realized gain from investments and foreign currency transactions | | 2,676,127 |
| | | | | | | | |
| | Net change in unrealized appreciation on investments and translation of | | |
| | | assets and liabilities in foreign currency | | 1,924,396 |
| | | | | | | | |
| Net Realized and Unrealized Gain on Investments | | 4,600,523 |
| | | | | | | | |
| Net Increase in Net Assets Resulting from Operations | $ | 4,677,844 |
| | | | | | | | |
| | | | | | | | |
| | | | | | | | |
| | | | | | | | |
| | | | | | | | |
| | | | | | | | |
| | | | | | | | |
| | | | | | | | |
| | | | | | | | |
| | | | | | | | |
| | | | | | | | |
| See Notes to Financial Statements | | |
| ROUMELL OPPORTUNISTIC VALUE FUND | | | | | |
| | | | | | | | | | | | |
| Statements of Changes in Net Assets | | | | | | | |
| | | | | | | | | | | | |
| | | | | | | | | | | | |
| For the Year ended August 31, | | | | | 2013 | | 2012 |
| | | | | | | | | | | | |
| Operations: | | | | | | | | |
| | Net investment income | | | | $ | 77,321 | $ | 191,525 |
| | Net realized gain from investments and foreign | | | | |
| | | currency transactions | | | | | 2,676,127 | | (247,244) |
| | Net change in unrealized appreciation on investments and | | | | |
| | | translation of assets and liabilities in foreign currency | | 1,924,396 | | 152,790 |
| | | | | | | | | | | | |
| Net Increase in Net Assets Resulting from Operations | | 4,677,844 | | 97,071 |
| | | | | | | | | | | | |
Distributions to Shareholders: (note 5) | | | | | | |
| | Net investment income | | | | | | | |
| | | Institutional Class Shares | | | | | (169,985) | | (121,586) |
| | | Class A Shares | | | | | (11,086) | | (11,542) |
| | | | | | | | | | | | |
| Decrease in Net Assets Resulting from Distributions | | (181,071) | | (133,128) |
| | | | | | | | | | | | |
| Capital Share Transactions: | | | | | | | |
| | Shares sold | | | | | 17,785,572 | | 8,773,842 |
| | Redemption fees | | | | | 344 | | 220 |
| | Reinvested dividends and distributions | | | | 161,618 | | 120,749 |
| | Shares repurchased | | | | | (5,334,117) | | (3,225,860) |
| | | | | | | | | | | | |
| Increase from Capital Share Transactions | | | | 12,613,417 | | 5,668,951 |
| | | | | | | | | | | | |
| Net Increase in Net Assets | | | | | 17,110,190 | | 5,632,894 |
| | | | | | | | | | | | |
| Net Assets: | | | | | | | | |
| | Beginning of Year | | | | | 19,674,863 | | 14,041,969 |
| | End of Year | | | | $ | 36,785,053 | $ | 19,674,863 |
| | | | | | | | | | | | |
| Undistributed Net Investment Income | | | $ | 1,842 | $ | 104,617 |
| | | | | | | | | | | | |
| | | | | | | | | | | | |
| | | | | | | | | | | | |
| | | | | | | | | | | | |
| | | | | | | | | | | | |
| | | | | | | | | | | | |
| See Notes to Financial Statements | | | | | | (Continued) |
| ROUMELL OPPORTUNISTIC VALUE FUND | | | | | |
| | | | | | | | | | | | |
| Statements of Changes in Net Assets (continued) | | | | | | |
| | | | | | | | | | | | |
| | | | | | | | | | | | |
| For the Year ended | August 31, 2013 | | August 31, 2012 |
| | | | | | | | | | | | |
| Share Information: | | | | | | | |
| | Institutional Class Shares | Shares | | Amount | | Shares | | Amount |
| | | Shares sold | 1,513,598 | $ | 16,237,651 | | 936,132 | $ | 8,506,230 |
| | | Redemption fees | - | | 344 | | - | | 217 |
| | | Reinvested dividends | | | | | | | |
| | | | and distributions | 15,546 | | 150,992 | | 12,541 | | 109,860 |
| | | Shares repurchased | (476,166) | | (5,206,363) | | (300,289) | | (2,727,037) |
| | Net Increase in Capital Shares | 1,052,978 | $ | 11,182,624 | | 648,384 | $ | 5,889,270 |
| | | | | | | | | | | | |
| | Class A Shares | Shares | | Amount | | Shares | | Amount |
| | | Shares sold | 87,457 | $ | 927,154 | | 29,318 | $ | 267,612 |
| | | Redemption fees | - | | - | | - | | 3 |
| | | Reinvested dividends | | | | | | | |
| | | | and distributions | 1,097 | | 10,626 | | 1,244 | | 10,889 |
| | | Shares repurchased | (12,217) | | (127,754) | | (54,781) | | (498,823) |
| | Net Increase (Decrease) | | | �� | | | | |
| | | in Capital Shares | 76,337 | $ | 810,026 | | (24,219) | $ | (220,319) |
| | | | | | | | | | | | |
| | Class C Shares* | Shares | | Amount | | Shares | | Amount |
| | | Shares sold | 61,762 | $ | 620,767 | | - | $ | - |
| | | Redemption fees | - | | - | | - | | - |
| | | Reinvested dividends | | | | | | | |
| | | | and distributions | - | | - | | - | | - |
| | | Shares repurchased | - | | - | | - | | - |
| | Net Increase in Capital Shares | 61,762 | $ | 620,767 | | - | $ | - |
| | | | | | | | | | | | |
| | *For the period from July 30, 2013 (Date of Initial Public Investment) to August 31, 2013. |
| | | | | | | | | | | | |
| | | | | | | | | | | | |
| | | | | | | | | | | | |
| | | | | | | | | | | | |
| | | | | | | | | | | | |
| | | | | | | | | | | | |
| | | | | | | | | | | | |
| | | | | | | | | | | | |
| | | | | | | | | | | | |
| | | | | | | | | | | | |
| See Notes to Financial Statements | | | | | | |
| ROUMELL OPPORTUNISTIC VALUE FUND | | | | | | | |
| | | | | | | | | | | | |
| Financial Highlights | | | | | | | |
| | | | | | | | | | | | |
| For a share outstanding during the | | Institutional Class Shares |
| fiscal year or period ended August 31, | | 2013 | | 2012 | | 2011 (e) | |
| | | | | | | | | | | | |
| Net Asset Value, Beginning of Period | $ | 9.31 | $ | 9.42 | $ | 10.00 | |
| | | | | | | | | | | | |
| Income (Loss) from Investment Operations | | | | | | | |
| | Net investment income | | 0.03 | | 0.09 | | 0.03 | |
| | Net realized and unrealized gain (loss) on investments | 1.89 | | (0.13) | | (0.61) | |
| Total from Investment Operations | | 1.92 | | (0.04) | | (0.58) | |
| | | | | | | | | | | | |
| Less Distributions: | | | | | | | |
| | From net investment income | | (0.08) | | (0.07) | | - | |
| Total Distributions | | �� (0.08) | | (0.07) | | - | |
| | | | | | | | | | | | |
| Paid in Capital: | | | | | | | |
| | Paid in Capital (from redemption fees) (note 1) | | 0.00 | (f) | 0.00 | (f) | - | |
| Total Paid in Capital | | 0.00 | (f) | 0.00 | (f) | - | |
| | | | | | | | | | | | |
| Net Asset Value, End of Period | $ | 11.15 | $ | 9.31 | $ | 9.42 | |
| | | | | | | | | | | | |
| Total Return (c)(d) | | 20.71% | | (0.36)% | | (5.80)% | (b) |
| | | | | | | | | | | | |
| Net Assets, End of Period (in thousands) | $ | 33,617 | $ | 18,249 | $ | 12,368 | |
| | | | | | | | | | | | |
| Ratios of: | | | | | | | | | |
| Total Expenses to Average Net Assets | | 1.23% | | 1.23% | | 1.23% | (a) |
| Net Investment Income to Average Net Assets | | 0.31% | | 1.10% | | 1.08% | (a) |
| | | | | | | | | | | | |
| Portfolio turnover rate | | 77.73% | | 49.34% | | 33.08% | (b) |
| | | | | | | | | | | | |
| (a) | Annualized. | | | | | | | |
| (b) | Not annualized. | | | | | | | |
| (c) | Total return does not reflect sales charge, if any. | | | | | | | |
| (d) | Includes adjustments in accordance with accounting principles generally accepted in the United |
| | States of America and, consequently, the net asset value for financial reporting purposes and |
| | the returns based upon those net asset values may differ from the net asset values and returns |
| | for shareholder transactions. | | | | | | | |
| (e) | For a share outstanding for the initial period from December 31, 2010 (Date of Initial Public |
| | Investment) to August 31, 2011. | | | | | | | |
| (f) | Actual amount is less than $0.01 per share. | | | | | | | |
| | | | | | | | | | | | |
| | | | | | | | | | | | |
| | | | | | | | | | | | |
| See Notes to Financial Statements | | | | | | (Continued) |
| ROUMELL OPPORTUNISTIC VALUE FUND | | | | | | | |
| | | | | | | | | | | | |
| Financial Highlights | | | | | | | |
| | | | | | | | | | | | |
| For a share outstanding during the | | Class A Shares |
| fiscal year or period ended August 31, | | 2013 | | 2012 | | 2011 (e) | |
| | | | | | | | | | | | |
| Net Asset Value, Beginning of Period | $ | 9.28 | $ | 9.41 | $ | 10.00 | |
| | | | | | | | | | | | |
| Income (Loss) from Investment Operations | | | | | | | |
| | Net investment income | | 0.01 | | 0.08 | | 0.03 | |
| | Net realized and unrealized gain (loss) on investments | 1.88 | | (0.15) | | (0.62) | |
| Total from Investment Operations | | 1.89 | | (0.07) | | (0.59) | |
| | | | | | | | | | | | |
| Less Distributions: | | | | | | | |
| | From net investment income | | (0.07) | | (0.06) | | - | |
| Total Distributions | | (0.07) | | (0.06) | | - | |
| | | | | | | | | | | | |
| Paid in Capital: | | | | | | | |
| | Paid in Capital (from redemption fees) (note 1) | | - | | 0.00 | (f) | - | |
| Total Paid in Capital | | - | | 0.00 | (f) | - | |
| | | | | | | | | | | | |
| Net Asset Value, End of Period | $ | 11.10 | $ | 9.28 | $ | 9.41 | |
| | | | | | | | | | | | |
| Total Return (c)(d) | | 20.46% | | (0.56)% | | (6.00)% | (b) |
| | | | | | | | | | | | |
| Net Assets, End of Period (in thousands) | $ | 2,553 | $ | 1,426 | $ | 1,674 | |
| | | | | | | | | | | | |
| Ratios of: | | | | | | | | | |
| Total Expenses to Average Net Assets | | 1.48% | | 1.48% | | 1.48% | (a) |
| Net Investment Income to Average Net Assets | | 0.03% | | 0.89% | | 0.73% | (a) |
| | | | | | | | | | | | |
| Portfolio turnover rate | | 77.73% | | 49.34% | | 33.08% | (b) |
| | | | | | | | | | | | |
| (a) | Annualized. | | | | | | | |
| (b) | Not annualized. | | | | | | | |
| (c) | Total return does not reflect sales charge, if any. | | | | | | | |
| (d) | Includes adjustments in accordance with accounting principles generally accepted in the United |
| | States of America and, consequently, the net asset value for financial reporting purposes and | |
| | the returns based upon those net asset values may differ from the net asset values and returns | |
| | for shareholder transactions. | | | | | | | |
| (e) | For a share outstanding for the initial period from December 31, 2010 (Date of Initial Public | |
| | Investment) to August 31, 2011. | | | | | | | |
| (f) | Actual amount is less than $0.01 per share. | | | | | | | |
| | | | | | | | | | | | |
| | | | | | | | | | | | |
| | | | | | | | | | | | |
| See Notes to Financial Statements | | | | | | (Continued) |
| ROUMELL OPPORTUNISTIC VALUE FUND | | | |
| | | | | | | | |
| Financial Highlights | | | |
| | | | | | | | |
| For a share outstanding during the period from | | Class C Shares |
| July 30, 2013 (Date of Initial Public Investment) to August 31, 2013 | | | |
| | | | | | | | |
| Net Asset Value, Beginning of Period | $ | 10.00 | |
| | | | | | | | |
| Loss from Investment Operations | | | |
| | Net investment loss | | (0.01) | |
| | Net realized and unrealized loss on investments | | (0.04) | |
| Total from Investment Operations | | (0.05) | |
| | | | | | | | |
| Net Asset Value, End of Period | $ | 9.95 | |
| | | | | | | | |
| Total Return (c)(d) | | (0.50)% | (b) |
| | | | | | | | |
| Net Assets, End of Period (in thousands) | $ | 615 | |
| | | | | | | | |
| Ratios of: | | | | | |
| Total Expenses to Average Net Assets | | 2.23% | (a) |
| Net Investment Loss to Average Net Assets | | (1.20)% | (a) |
| | | | | | | | |
| Portfolio turnover rate | | 77.73% | (b) |
| | | | | | | | |
| (a) | Annualized. | | | |
| (b) | Not annualized. | | | |
| (c) | Total return does not reflect sales charge, if any. | | | |
| (d) | Includes adjustments in accordance with accounting principles generally accepted in the United |
| | States of America and, consequently, the net asset value for financial reporting purposes and | |
| | the returns based upon those net asset values may differ from the net asset values and returns | |
| | for shareholder transactions. | | | |
| | | | | | | | |
| | | | | | | | |
| | | | | | | | |
| | | | | | | | |
| | | | | | | | |
| | | | | | | | |
| | | | | | | | |
| | | | | | | | |
| | | | | | | | |
| | | | | | | | |
| | | | | | | | |
| See Notes to Financial Statements | | | |
ROUMELL OPPORTUNISTIC VALUE FUND
Notes to Financial Statements
| 1. | Organization and Significant Accounting Policies |
The Roumell Opportunistic Value Fund (“Fund”) is a series of the Starboard Investment Trust (“Trust”). The Trust is organized as a Delaware statutory trust and is registered under the Investment Company Act of 1940, as amended (the “1940 Act”), as an open-end management investment company. The Fund is a separate non-diversified series of the Trust.
The Fund commenced operations on December 31, 2010. The investment objective of the Fund is to seek capital appreciation and income. Roumell Asset Management, LLC (“Roumell Asset Management” or the “Advisor”) seeks to achieve the Fund’s investment objective by using an opportunistic investment strategy. The Advisor is an opportunistic capital allocator (OCA) with a deep value bias in selecting individual securities. The Advisor will wait until an investment situation is presented where, in its opinion, the odds of success are favorable relative to the risks. In the absence of such situations, the Fund will stay liquid and on the sidelines invested in Cash and Cash Equivalents. The Advisor’s approach to opportunistic investing emphasizes purchasing securities at a meaningful, quantifiable discount to its calculation of intrinsic value taking into consideration the understandability of the business model, the safety of the capital structure, and the competency of the company’s management. Using this opportunistic strategy, however, may result in the Advisor finding many suitable investment opportunities for the Fund during certain periods, but finding very few during other periods.
The Fund currently has an unlimited number of authorized shares, which are divided into three classes - Institutional Class Shares, Class A Shares, and Class C Shares. Each class of shares has equal rights as to assets of the Fund, and the classes are identical except for differences in sales charges and ongoing distribution and service fees. Class A Shares are subject to an initial sales charge of 4.50%. Class C Shares are subject to a contingent deferred sales charge of 1% of the proceeds redeemed within one year of the purchase date. Class A Shares and Class C Shares are subject to distribution plan fees, which are further discussed in Note 3. All share classes are subject to redemption fees within 60 days of the issuance of such shares of 1.00%. Income, expenses (other than distribution and service fees), and realized and unrealized gains or losses on investments are allocated to each class of shares based upon its relative net assets. All classes have equal voting privileges, except where otherwise required by law or when the Trustees determine that the matter to be voted on affects only the interests of the shareholders of a particular class.
ROUMELL OPPORTUNISTIC VALUE FUND
Notes to Financial Statements
The following accounting policies have been consistently followed by the Fund and are in conformity with accounting principles generally accepted in the United States of America (“GAAP”).
Investment Valuation
The Fund’s investments in securities are carried at fair value. Securities listed on an exchange or quoted on a national market system are valued at the last sales price as of 4:00 p.m. Eastern Time. Securities traded in the NASDAQ over-the-counter market are generally valued at the NASDAQ Official Closing Price. Other securities traded in the over-the-counter market and listed securities for which no sale was reported on that date are valued at the most recent bid price. Securities and assets for which representative market quotations are not readily available (e.g., if the exchange on which the portfolio security is principally traded closes early or if trading of the particular portfolio security is halted during the day and does not resume prior to the Fund’s net asset value calculation) or which cannot be accurately valued using the Fund’s normal pricing procedures are valued at fair value as determined in good faith under policies approved by the Trustees. A portfolio security’s “fair value” price may differ from the price next available for that portfolio security using the Fund’s normal pricing procedures. Instruments with maturities of 60 days or less are valued at amortized cost, which approximates market value.
Fair Value Measurement
Various inputs are used in determining the value of the Fund's investments. These inputs are summarized in the three broad levels listed below:
Level 1: quoted prices in active markets for identical securities
Level 2: other significant observable inputs (including quoted prices for similar securities, interest rates, credit risk, etc.)
Level 3: significant unobservable inputs (including the Fund’s own assumptions in determining fair value of investments)
The availability of observable inputs can vary from security to security and is affected by a wide variety of factors, including, for example, the type of security, whether the security is new and not yet established in the marketplace, the liquidity of markets, and other characteristics particular to the security. To the extent that valuation is based on models or inputs that are less observable or unobservable in
ROUMELL OPPORTUNISTIC VALUE FUND
Notes to Financial Statements
the market, the determination of fair value requires more judgment. Accordingly, the degree of judgment exercised in determining fair value is greatest for instruments categorized in Level 3.
The inputs used to measure fair value may fall into different levels of the fair value hierarchy. In such cases, for disclosure purposes, the level in the fair value hierarchy within which the fair value measurement falls in its entirety, is determined based on the lowest level input that is significant to the fair value measurement in its entirety.
The inputs or methodology used for valuing securities are not necessarily an indication of the risk associated with investing in those securities. The following table summarizes the inputs as of August 31, 2013 for the Fund’s assets measured at fair value:
| Investments in Securities (a) | | Total | | Level 1 | | Level 2 | | Level 3 |
| Common Stocks* | $ | 14,153,260 | $ | 14,153,260 | $ | - | $ | - |
| Exchange Traded Product | | 269,205 | | 269,205 | | - | | - |
| Short-term Investment | | 17,279,996 | | 17,279,996 | | - | | - |
| Corporate Bonds | | 2,958,700 | | - | | 2,958,700 | | - |
| Preferred Stock | | 2,061,916 | | 2,061,916 | | - | | - |
| Total | $ | 36,723,077 | $ | 33,764,377 | $ | 2,958,700 | $ | - |
*Refer to Schedule of Investments for breakdown by Sector
(a) The Fund had no significant transfers into or out of Level 1, 2, or 3 during the year ended August 31, 2013. The Fund did not hold any Level 3 securities during the year.
Foreign Currency Translation
Portfolio securities and other assets and liabilities denominated in foreign currencies are translated into U.S. dollars based on the exchange rate of such currencies against U.S. dollars on the date of valuation. Purchases and sales of securities and income items denominated in foreign currencies are translated into U.S. dollars at the exchange rate in effect on the transaction date.
The Fund does not separately report the effect of changes in foreign exchange rates from changes in market prices on securities held. Such changes are included in net realized and unrealized gain or loss from investments.
Realized foreign exchange gains or losses arise from sales of foreign currencies, currency gains or losses realized between the trade and settlement dates on securities transactions and the difference between
ROUMELL OPPORTUNISTIC VALUE FUND
Notes to Financial Statements
the recorded amounts of dividends, interest, and foreign withholding taxes, and the U.S. dollar equivalent of the amounts actually received or paid. Net unrealized foreign exchange gains and losses arise from changes in foreign exchange rates on foreign denominated assets and liabilities other than investments in securities held at the end of the reporting period.
Investment Transactions and Investment Income
Investment transactions are accounted for as of the date purchased or sold (trade date). Dividend income is recorded on the ex-dividend date. Certain dividends from foreign securities will be recorded as soon as the Fund is informed of the dividend if such information is obtained subsequent to the ex-dividend date. Interest income is recorded on the accrual basis and includes amortization of discounts and premiums. Gains and losses are determined on the identified cost basis, which is the same basis used for federal income tax purposes.
Expenses
The Fund bears expenses incurred specifically on its behalf as well as a portion of general expenses, which are allocated according to methods reviewed annually by the Trustees.
Distributions
The Fund may declare and distribute dividends from net investment income (if any) quarterly. Distributions from capital gains (if any) are generally declared and distributed annually. Dividends and distributions to shareholders are recorded on ex-date.
Estimates
The preparation of financial statements in conformity with accounting principles generally accepted in the United States of America requires management to make estimates and assumptions that affect the reported amounts of assets and liabilities and disclosure of contingent assets and liabilities at the date of the financial statements and the reported amounts of increases and decreases in the net assets from operations during the reported period. Actual results could differ from those estimates.
Fees on Redemptions
The Fund charges a redemption fee of 1.00% on redemptions of Fund shares occurring within 60 days following the issuance of such shares. The redemption fee is not a fee to finance sales or sales
ROUMELL OPPORTUNISTIC VALUE FUND
Notes to Financial Statements
promotion expenses, but is paid to the Fund to defray the costs of liquidating an investor and discouraging short-term trading of the Fund’s shares. No redemption fee will be imposed on the redemption of shares representing dividends or capital gains distributions, or on amounts representing capital appreciation of shares.
Federal Income Taxes
No provision for income taxes is included in the accompanying financial statements, as the Fund intends to distribute to shareholders all taxable investment income and realized gains and otherwise comply with Subchapter M of the Internal Revenue Code applicable to regulated investment companies.
| 2. | Transactions with Affiliates and Service Providers |
Advisor
As full compensation for the investment advisory services provided to the Fund, the Advisor receives a monthly fee equal to an annualized rate of 0.92% of the Fund’s average daily net assets. The fee paid to the Advisor is calculated by multiplying the average daily net assets of the Fund, computed at the end of each month and payable within five days thereafter.
Administrator
Fund Accounting and Administration Agreement: The Administrator provides the Fund with administrative, fund accounting, and compliance services. The Administrator receives compensation from the Fund at a maximum annual rate of 0.31% and is responsible for the coordination and payment of vendor services and other Fund expenses from such compensation. Pursuant to this arrangement, the Administrator pays the following expenses: (i) compensation and expenses of any employees of the Trust and of any other persons rendering any services to the Fund; (ii) clerical and shareholder service staff salaries; (iii) office space and other office expenses; (iv) fees and expenses incurred by the Fund in connection with membership in investment company organizations; (v) fees and expenses of counsel to the Trustees who are not interested persons of the Fund and Trust; (vi) fees and expenses of counsel to the Fund and Trust engaged to assist with preparation of Fund and Trust documents and filings and
ROUMELL OPPORTUNISTIC VALUE FUND
Notes to Financial Statements
provide other ordinary legal services; (vii) fees and expenses of independent public accountants to the Fund, including fees and expense for tax preparation; (viii) expenses of registering shares under federal and state securities laws; (ix) insurance expenses; (x) fees and expenses of the custodian, shareholder servicing, dividend disbursing and transfer agent, administrator, distributor, and accounting and pricing services agents of the Fund; (xi) compensation for a chief compliance officer for the Trust; (xii) expenses, including clerical expenses, of issue, sale, redemption, or repurchase of shares of the Fund; (xiii) the cost of preparing and distributing reports and notices to shareholders; (xiv) the cost of printing or preparing prospectuses and statements of additional information for delivery to the Fund’s current shareholders; (xv) the cost of printing or preparing documents, statements or reports to shareholders; and (xvi) other expenses not specifically assumed by the Fund or Advisor. The Administrator cannot recoup from the Fund any Fund expenses in excess of the administration fees payable under the Fund Accounting and Administration Agreement.
Operating Plan: The Advisor has entered into an Operating Plan with the Administrator under which it has agreed make the following payments to the Administrator: (i) when the Fund’s assets are below $77 million, the Advisor pays the Administrator a fee based on the daily average net assets of the Fund; and (ii) when the consolidated fee collected by the Administrator is less than a designated minimum operating cost, then the Advisor pays the Administrator a fee that makes up the difference. The Advisor is also obligated to pay the following Fund expenses under the Operating Plan: (i) marketing, distribution, and servicing expenses related to the sale or promotion of Fund shares that the Fund is not authorized to pay pursuant to the Investment Company Act; (ii) expenses incurred in connection with the organization and initial registration of shares of the Fund; (iii) expenses incurred in connection with the dissolution and liquidation of the Fund; (iv) expenses related to shareholder meetings and proxy solicitations; (v) fees and expenses related to legal, auditing, and accounting services that are outside of the scope of ordinary services; and (vi) hiring employees and retaining advisers and experts as contemplated by Rule 0-1(a)(7)(vii) of the Investment Company Act.
Compliance Services
Nottingham Compliance Services, LLC (“NCS”), a fully owned affiliate of the Administrator, provides services which assist the Trust’s Chief Compliance Officer in monitoring and testing the policies and procedures of the Trust in conjunction with requirements under Rule 38a-1 of the 1940 Act. NCS is entitled to receive compensation from the Administrator pursuant to the Administrator’s fee arrangements with the Fund.
Transfer Agent
Nottingham Shareholder Services, LLC (“Transfer Agent”) serves as transfer, dividend paying, and shareholder servicing agent for the Fund. For its services, the Transfer Agent is entitled to receive
ROUMELL OPPORTUNISTIC VALUE FUND
Notes to Financial Statements
compensation from the Administrator pursuant to the Administrator’s fee arrangements with the Fund.
Distributor
Capital Investment Group, Inc. (the “Distributor”) serves as the Fund’s principal underwriter and distributor. For its services, the Distributor is entitled to receive compensation from the Administrator pursuant to the Administrator’s fee arrangements with the Fund.
Certain Trustees and officers of the Trust may also be officers of the Advisor or the Administrator.
| 3. | Distribution and Service Fees |
The Board of Trustees, including a majority of the Trustees who are not “interested persons” as defined in the 1940 Act, adopted a distribution and service plan pursuant to Rule 12b-1 of the 1940 Act (the “Plan”) for the Class A Shares and Class C Shares. The 1940 Act regulates the manner in which a registered investment company may assume costs of distributing and promoting the sales of its shares and servicing of its shareholder accounts. The Plan provides that the Fund may incur certain costs, which may not exceed 0.25% per annum of the average daily net assets of the Class A Shares and 1.00% per annum of the average daily net assets of the Class C Shares for each year elapsed subsequent to adoption of the Plan, for payment to the Distributor and others for items such as advertising expenses, selling expenses, commissions, travel, or other expenses reasonably intended to result in sales of the Class A Shares and Class C Shares or servicing of Class A Shares and Class C Shares shareholder accounts.
| 4. | Purchases and Sales of Investment Securities |
For the fiscal year ended August 31, 2013, the aggregate cost of purchases and proceeds from sales of investment securities (excluding short-term securities) were as follows:
| Purchases of Securities | Proceeds from Sales of Securities |
| $14,960,176 | $16,136,206 |
ROUMELL OPPORTUNISTIC VALUE FUND
Notes to Financial Statements
There were no long-term purchases or sales of U.S. Government Obligations during the fiscal year ended August 31, 2013.
The following table shows the realized gains and losses that resulted from sales of securities during the fiscal year ended August 31, 2013:
| Description | | Cost | | Sales Proceeds | Realized Gain/(Loss) Percentage | | Realized Gain (Loss) |
| Abercrombie and Fitch Co. | | $373,203 | | 569,234 | 52.53% | $ | 196,031 |
| American Safety Insurance | | 668,665 | | 1,020,912 | 52.68% | | 352,247 |
| Checkpoint Systems, Inc. | | 839,867 | | 1,102,787 | 31.30% | | 262,920 |
| Chesapeake Energy Corp.** | | 589,354 | | 685,138 | 16.25% | | 95,784 |
| Compuware Corporation | | 632,623 | | 950,738 | 50.29% | | 318,115 |
| Comstock Resources** | | 935,314 | | 1,039,175 | 11.10% | | 103,861 |
| Dell, Inc. | | 715,578 | | 797,720 | 11.48% | | 82,142 |
| Digital Generation, Inc. | | 903,700 | | 940,410 | 4.06% | | 36,710 |
| Dover Motorsports, Inc. | | 364,074 | | 724,391 | 98.97% | | 360,317 |
| DSP Group, Inc. | | 517,880 | | 534,995 | 3.30% | | 17,115 |
| First Acceptance Corp. | | 72,993 | | 115,258 | 57.90% | | 42,265 |
| Gilat Satellite Networks Ltd. | | 526,443 | | 614,866 | 16.80% | | 88,423 |
| JC Penney Corp., Inc.** | | 1,336,689 | | 1,361,328 | 1.84% | | 24,639 |
| Saizen REIT* | | 454,845 | | 474,281 | 4.27% | | 19,437 |
| SeaChange International, Inc. | | 630,511 | | 801,370 | 27.10% | | 170,859 |
| Sierra Wireless, Inc. | | 917,146 | | 1,343,334 | 46.47% | | 426,188 |
| Stone Energy Corp.** | | 489,691 | | 490,000 | 0.06% | | 309 |
| Stonemor Operating LLC** | | 692,728 | | 676,894 | (2.29)% | | (15,834) |
| Tecumseh Products Company | | 1,062,514 | | 1,264,182 | 18.98% | | 201,668 |
| Tellabs, Inc. | | 39,485 | | 24,346 | (38.34)% | | (15,139) |
| TETRA Technologies, Inc. | | 186,487 | | 242,012 | 29.77% | | 55,525 |
| TransAct Technologies, Inc. | | 752,011 | | 604,556 | (19.61)% | | (147,455) |
| Net Realized Gain | | | | | | $ | 2,676,127 |
*Includes settlement of foreign currency sales.
**Excludes interest earned on bonds over the holding period.
ROUMELL OPPORTUNISTIC VALUE FUND
Notes to Financial Statements
Distributions are determined in accordance with Federal income tax regulations, which differ from generally accepted accounting principles, and, therefore, may differ significantly in amount or character from net investment income and realized gains for financial reporting purposes. Financial reporting records are adjusted for permanent book/tax differences to reflect tax character but are not adjusted for temporary differences.
The Fund has reviewed all taxable years / periods that are open for examination (i.e., not barred by the applicable statute of limitations) by taxing authorities of all major jurisdictions, including the Internal Revenue Service. As of August 31, 2013, open taxable years consisted of the taxable year / period ended August 31, 2011, August 31, 2012, and August 31, 2013. No examination of tax returns is currently in progress for the Fund.
Reclassifications relate primarily to differing book/tax treatment of foreign currency transactions. For the year ended August 31, 2013, the following reclassifications were made:
| Undistributed Net Investment Income | $ | 975 |
| Accumulated Net Realized Gain on Investments | | (975) |
Distributions during the fiscal years ended were characterized for tax purposes as follows:
| | | Distributions from |
For the Fiscal Years Ended | | Ordinary Income | | Long-Term- Capital Gains |
| 08/31/2013 | $ | 181,071 | $ | - |
| 08/31/2012 | $ | 133,128 | $ | - |
ROUMELL OPPORTUNISTIC VALUE FUND
Notes to Financial Statements
At August 31, 2013, the tax-basis cost of investments and components of distributable earnings were as follows:
| Cost of Investments | $ | 35,707,626 |
| | | |
| Unrealized Appreciation | $ | 3,213,638 |
| Unrealized Depreciation | | (2,198,187) |
| Net Unrealized Appreciation | | 1,015,451 |
| | | |
| Undistributed Ordinary Income | | 265,412 |
| Undistributed Long-Term Gains | | 2,151,886 |
| Late Year Losses | | (393) |
| | | |
| Distributable Earnings | $ | 3,432,356 |
The difference between book-basis and tax-basis net unrealized appreciation (depreciation) is attributable to the tax deferral of losses from wash sales.
Late year losses incurred after December 31 within the fiscal year are deemed to arise on the first business day of the following fiscal year for tax purposes.
| 6. | Commitments and Contingencies |
Under the Trust’s organizational documents, its officers and Trustees are indemnified against certain liabilities arising out of the performance of their duties to the Fund. In addition, in the normal course of business, the Trust entered into contracts with its service providers, on behalf of the Fund, and others that provide for general indemnifications. The Fund’s maximum exposure under these arrangements is unknown, as this would involve future claims that may be made against the Fund. The Fund expects risk of loss to be remote.
| 7. | New Accounting Pronouncements |
In December 2011, FASB issued ASU No. 2011-11 related to disclosures about offsetting assets and liabilities. The amendments in this ASU require an entity to disclose information about offsetting and related arrangements to enable users of its financial statements to understand the effect of those arrangements on its financial position. The ASU is effective for annual reporting periods beginning on or after
ROUMELL OPPORTUNISTIC VALUE FUND
Notes to Financial Statements
January 1, 2013, and interim periods within those annual periods. The guidance requires retrospective application for all comparative periods presented.
In January 2013, the FASB issued ASU No. 2013-01 “Clarifying the Scope of Disclosures about Offsetting Assets and Liabilities.” ASU No. 2013-01 clarifies that ordinary trade receivables and payables are not included in the scope of ASU No. 2011-11. ASU No. 2011-11 applies only to derivatives, repurchase agreements and reverse repurchase agreements, and securities borrowing and lending that are offset in accordance with specific criteria contained in the FASB Accounting Standards codification.
Management is currently evaluating the impact ASU No. 2011-11 and ASU No. 2013-01 will have on the Fund’s financial statements and disclosures.
| 8. | Underlying Investments in Other Investment Companies |
The Fund currently invests a portion of its assets in the Federated Treasury Obligations Fund. The Fund may redeem its investment from the Federated Treasury Obligations Fund at any time if the Advisor determines that it is in the best interest of the Fund and its shareholders to do so.
The performance of the Fund may be directly affected by the performance of the Federated Treasury Obligations Fund. The financial statements of the Federated Treasury Obligations Fund, including the portfolio of investments, can be found at Federated’s website, federatedinvestors.com or the Securities and Exchange Commission’s website at sec.gov, and should only be read in conjunction with the Fund’s financial statements. As of August 31, 2013, the percentage of the Fund’s net assets invested in the Federated Treasury Obligations Fund was 46.98%.
| 9. | Change in Independent Registered Public Accounting Firm |
On October 25, 2012, BBD, LLP was selected as the Trust’s independent registered public accounting firm for the 2013 fiscal year. The selection of BBD, LLP was recommended by the Trust’s Audit Committee, comprised of all non-interested Trustees, and was approved by the Board of Trustees. The report of the predecessor independent registered public accounting firm, on the financial statements of
ROUMELL OPPORTUNISTIC VALUE FUND
Notes to Financial Statements
the Fund for the fiscal year ended August 31, 2012, did not contain any adverse opinion or disclaimer of opinion, nor was it qualified or modified as to uncertainty, audit scope or accounting principle. In addition, there were no disagreements between the Trust and the predecessor auditor on accounting principles, financial statement disclosures or audit scope, which, if not resolved to the satisfaction of the predecessor auditor would have caused them to make reference to the disagreement in their report on the financial statements for such period.
The Fund has evaluated the need for disclosures and/or adjustments resulting from subsequent events through the date of issuance of these financial statements. This evaluation did not result in any additional subsequent events that necessitated disclosures and/or adjustments.
REPORT OF INDEPENDENT REGISTERED PUBLIC ACCOUNTING FIRM
To the Shareholders of the Roumell Opportunistic Value Fund and
The Board of Trustees of the Starboard Investment Trust
We have audited the accompanying statement of assets and liabilities of Roumell Opportunistic Value Fund (the "Fund"), a series of shares of beneficial interest of the Starboard Investment Trust, including the schedule of investments, as of August 31, 2013, and the related statements of operations and changes in net assets and the financial highlights for the year then ended. These financial statements and financial highlights are the responsibility of the Fund’s management. Our responsibility is to express an opinion on these financial statements and financial highlights based on our audit. The statement of changes in net assets for the year ended August 31, 2012 and the financial highlights for each year or period presented in the period December 31, 2010 (date of initial public investment) to August 31, 2012 have been audited by other auditors, whose report dated October 22, 2012, expressed an unqualified opinion on such financial statement and financial highlights.
We conducted our audit in accordance with the standards of the Public Company Accounting Oversight Board (United States). Those standards require that we plan and perform the audit to obtain reasonable assurance about whether the financial statements and financial highlights are free of material misstatement. An audit includes examining, on a test basis, evidence supporting the amounts and disclosures in the financial statements. Our procedures included confirmation of securities owned as of August 31, 2013 by correspondence with the custodian and brokers. An audit also includes assessing the accounting principles used and significant estimates made by management, as well as evaluating the overall financial statement presentation. We believe that our audit provides a reasonable basis for our opinion.
In our opinion, the financial statements and financial highlights referred to above present fairly, in all material respects, the financial position of Roumell Opportunistic Value Fund as of August 31, 2013, and the results of its operations, the changes in its net assets and its financial highlights for the year then ended, in conformity with accounting principles generally accepted in the United States of America.
BBD, LLP
Philadelphia, Pennsylvania
October 29, 2013
ROUMELL OPPORTUNISTIC VALUE FUND
Additional Information (Unaudited)
1. Proxy Voting Policies and Voting Record
A copy of the Trust’s Proxy Voting and Disclosure Policy and the Advisor’s Disclosure Policy are included as Appendix B to the Fund’s Statement of Additional Information and are available, without charge, upon request, by calling 1-800-773-3863, and on the website of the Security and Exchange Commission (“SEC”) at sec.gov. Information regarding how the Fund voted proxies relating to portfolio securities during the most recent period ended June 30, is available (1) without charge, upon request, by calling the Fund at the number above and (2) on the SEC’s website at sec.gov.
2. Quarterly Portfolio Holdings
The Fund files its complete schedule of portfolio holdings with the SEC for the first and third quarters of each fiscal year on Form N-Q. The Fund’s Forms N-Q are available on the SEC’s website at sec.gov. You may review and make copies at the SEC’s Public Reference Room in Washington, D.C. Information on the operation of the Public Reference Room may be obtained by calling the SEC at 202-942-8090. You may also obtain copies without charge, upon request, by calling the Fund at 1-800-773-3863.
3. Tax Information
We are required to advise you within 60 days of the Fund’s fiscal year-end regarding the federal tax status of certain distributions received by shareholders during each fiscal year. The following information is provided for the Fund’s fiscal year ended August 31, 2013.
During the fiscal year, no long-term capital gain distributions were paid from the Fund.
Dividend and distributions received by retirement plans such as IRAs, Keogh-type plans, and 403(b) plans need not be reported as taxable income. However, many retirement plans may need this information for their annual information meeting.
ROUMELL OPPORTUNISTIC VALUE FUND
Additional Information (Unaudited)
4. Schedule of Shareholder Expenses
As a shareholder of the Fund, you incur two types of costs: (1) transaction costs, which may include sales charges (loads) on purchase payments and (2) ongoing costs, including investment advisory fees; distribution (12b-1) fees; and other Fund expenses. This example is intended to help you understand your ongoing costs (in dollars) of investing in the Fund and to compare these costs with the ongoing costs of investing in other mutual funds. The example is based on an investment of $1,000 invested at the beginning of the period and held for the entire period as indicated below.
Actual Expenses – The first line of the table below provides information about the actual account values and actual expenses. You may use the information in this line, together with the amount you invested, to estimate the expenses that you paid over the period. Simply divide your account value by $1,000 (for example, an $8,600 account value divided by $1,000 = 8.6), then multiply the result by the number in the first line under the heading entitled “Expenses Paid During Period” to estimate the expenses you paid on your account during this period.
Hypothetical Example for Comparison Purposes – The last line of the table below provides information about hypothetical account values and hypothetical expenses based on the Fund’s actual expense ratio and an assumed annual rate of return of 5% before expenses, which is not the Fund’s actual return. The hypothetical account values and expenses may not be used to estimate the actual ending account balance or expenses you paid for the period. You may use this information to compare the ongoing costs of investing in the Fund and other funds by comparing this 5% hypothetical example with the 5% hypothetical examples that appear in the shareholder reports of other funds.
ROUMELL OPPORTUNISTIC VALUE FUND
Additional Information (Unaudited)
| Institutional Class Shares | Beginning Account Value March 1, 2013 | Ending Account Value August 31, 2013 | Expenses Paid During Period* |
Actual Hypothetical (5% annual return before expenses) | $1,000.00 | $1,035.30 | $6.31 |
| | | |
| $1,000.00 | $1,019.00 | $6.26 |
*Expenses are equal to the average account value over the period multiplied by the Fund’s annualized expense ratio of 1.23%, multiplied by 184/365 (to reflect the one-half year period).
| Class A Shares | Beginning Account Value March 1, 2013 | Ending Account Value August 31, 2013 | Expenses Paid During Period* |
Actual Hypothetical (5% annual return before expenses) | $1,000.00 | $ 1,034.50 | $7.59 |
| | | |
| $1,000.00 | $ 1,017.74 | $7.53 |
*Expenses are equal to the average account value over the period multiplied by the Fund’s annualized expense ratio of 1.48%, multiplied by 184/365 (to reflect the one-half year period).
| Class C Shares | Beginning Account Value July 30, 2013 | Ending Account Value August 31, 2013 | Expenses Paid During Period* |
Actual Hypothetical (5% annual return before expenses) | $1,000.00 | $ 995.00 | $1.96 |
| | | |
| $1,000.00 | $ 1,002.50 | $1.96 |
*Expenses are equal to the average account value over the period multiplied by the Fund’s annualized expense ratio of 2.23%, multiplied by 32/365 (to reflect the initial period).
5. Approval of Advisory Agreement
The Advisor supervises the investments of the Fund pursuant to an Investment Advisory Agreement. At the annual meeting of the Fund’s Board of Trustees held on July 25, 2013, the Trustees approved the renewal of the Investment Advisory Agreement for a one-year term. In considering whether to approve the Investment Advisory Agreement, the Trustees reviewed and considered the information they deemed reasonably necessary, including the following material factors: (i) the nature, extent, and quality of the services provided by the Advisor; (ii) the investment performance of the Fund and Advisor; (iii)
ROUMELL OPPORTUNISTIC VALUE FUND
Additional Information (Unaudited)
the costs of the services to be provided and profits to be realized by the Advisor and its affiliates from the relationship with the Fund; (iv) the extent to which economies of scale would be realized as the Fund grows and whether advisory fee levels reflect those economies of scale for the benefit of the Fund’s investors; (v) the Advisor’s practices regarding brokerage and portfolio transactions; and (vi) the Advisor’s practices regarding possible conflicts of interest.
At the meeting, the Trustees reviewed various informational materials including, without limitation, the Investment Advisory Agreement for the Fund; a memorandum from the Advisor to the Trustees containing information about the Advisor, its business, its finances, its personnel, its services to the Fund, and comparative expense ratio information for other mutual funds with a strategy similar to the Fund; and a memorandum from the Fund’s legal counsel that summarized the fiduciary duties and responsibilities of the Board of Trustees in reviewing and approving the Investment Advisory Agreement, including the types of information and factors that should be considered in order to make an informed decision.
In considering the nature, extent, and quality of the services provided by the Advisor, the Trustees reviewed the responsibilities of the Advisor under the Investment Advisory Agreement. The Trustees reviewed the services being provided by the Advisor to the Fund including, without limitation, the quality of its investment advisory services since the Fund’s inception (including research and recommendations with respect to portfolio securities); its procedures for formulating investment recommendations and assuring compliance with the Fund’s investment objectives and limitations; its coordination of services for the Fund among the Fund’s service providers; and its efforts to promote the Fund, grow the Fund’s assets, and assist in the distribution of Fund shares. The Trustees noted that the Advisor seeks to achieve the Fund’s investment objective by using an opportunistic investment strategy with a deep value bias in selecting individual securities. The Trustees further noted that the principal executive and financial officer of the Fund were provided by the Advisor and serve without additional compensation from the Fund. After reviewing the foregoing information and further information in the memorandum from the Advisor (e.g., descriptions of the Advisor’s business, the Advisor’s compliance program, and the Advisor’s Form ADV), the Board concluded that the nature, extent, and quality of the services provided by the Advisor were satisfactory and adequate for the Fund.
ROUMELL OPPORTUNISTIC VALUE FUND
Additional Information (Unaudited)
In considering the investment performance of the Fund and Advisor, the Trustees compared the performance of the Fund with the performance of its benchmark index, comparable funds with similar objectives managed by other investment advisors, and applicable peer group data (e.g., Bloomberg peer group average). The Trustees noted that the return for the one-year period ended June 30, 2013 for the Institutional Class Shares was 19.14%, which lagged the returns of most of the comparable funds, the peer group average, and the primary benchmark index. The Trustees then noted that the return for the six-month period ended June 30, 2013 for the Institutional Class Shares was 13.03%, which lagged the returns of most of the comparable funds, the peer group average, and the primary benchmark index. The Trustees also considered the consistency of the Advisor’s management of the Fund with its investment objective and policies. After reviewing the short and long-term investment performance of the Fund, the Advisor’s experience managing the Fund, the Advisor’s historical investment performance, and other factors, the Board of Trustees concluded that the investment performance of the Fund and the Advisor was satisfactory.
In considering the costs of the services to be provided and profits to be realized by the Advisor and its affiliates from the relationship with the Fund, including any benefits derived by the Advisor from the relationship with the Fund, the Trustees reviewed the Advisor’s staffing, personnel, and methods of operating; the education and experience of the Advisor’s personnel; the Advisor’s compliance program; the financial condition of the Advisor; the level of commitment to the Fund and the Advisor by the principals of the Advisor; the asset level of the Fund; and the overall expenses of the Fund, including certain prior fee waivers and reimbursements by the Advisor; and the nature and frequency of advisory fee payments. The Trustees reviewed the financial statements for the Advisor and discussed the financial stability and profitability of the firm. The Trustees noted that the Advisor either makes payments to the Administrator or directly pays for certain expenses of the Fund under an Operating Plan in order to help limit the Fund’s annual operating expenses. The Trustees agreed that excess profitability was not a concern at this time. The Trustees also considered potential benefits for the Advisor in managing the Fund, including promotion of the Advisor’s name, the ability for the Advisor to place small accounts into the Fund, and the potential for the Advisor to generate soft dollars from Fund trades that may benefit the Advisor as well. The Trustees then compared the fees and expenses of the Fund (including the management fee) to other funds comparable in terms of the type of fund, the nature of its investment strategy, and its style of investment management, among other factors. The Trustees determined that the Fund’s management fees were higher than some of the comparable funds and lower than others and
ROUMELL OPPORTUNISTIC VALUE FUND
Additional Information (Unaudited)
were higher than the peer group average. The Trustees also determined that the Fund’s net expense ratio was higher than some of the comparable funds and lower than others and was equal to the peer group average. The Trustees noted that the Fund was smaller than the peer group average. Following this comparison and upon further consideration and discussion of the foregoing, the Board of Trustees concluded that the fees to be paid to the Advisor by the Fund were fair and reasonable in relation to the nature and quality of the services provided by the Advisor and that they reflected charges that were within a range of what could have been negotiated at arm’s length.
In considering the extent to which economies of scale would be realized as the Fund grows and whether advisory fee levels reflect those economies of scale for the benefit of the Fund’s investors, the Trustees considered the Fund’s fee arrangements with the Advisor. The Trustees noted that although the maximum management fee under the Investment Advisory Agreement would stay the same regardless of the Fund’s asset levels, the Advisor had agreed to make payments to the Administrator at lower asset levels in order to help limit the Fund’s expenses. The Trustees pointed out that the Fund would benefit from economies of scale under agreements with service providers other than the Advisor. In particular, it was noted that the Fund’s administration fee was a significant component of the gross expense ratio and that the agreement utilized breakpoints in its fee schedule that allowed the Fund’s shareholders to benefit from economies of scale. The Trustees also noted that economies of scale were unlikely to be realized in the near future due to the size of the Fund. It was pointed out that breakpoints in the management fee could be reconsidered in the future. Following further discussion of the Fund’s asset level, expectations for growth, and fee levels, the Board of Trustees determined that the Fund’s fee arrangements with the Advisor were fair and reasonable in relation to the nature and quality of the services provided by the Advisor.
In considering the Advisor’s practices regarding brokerage and portfolio transactions, the Trustees reviewed the Advisor’s standards, and performance in utilizing those standards, for seeking best execution for Fund portfolio transactions. The Trustees also considered the portfolio turnover rate for the Fund; the process by which evaluations are made of the overall reasonableness of commissions paid; the method and basis for selecting and evaluating the broker-dealers used; any allocation of portfolio business to persons affiliated with the Advisor; and the extent to which the Fund allocates portfolio business
ROUMELL OPPORTUNISTIC VALUE FUND
Additional Information (Unaudited)
to broker-dealers who provide research, statistical, or other services (soft dollars). The Trustees noted, among other things, that the Fund rarely trades blocks of shares which require special handling and that the average commission rate for the Fund was approximately $0.003 per share. After further review and discussion, the Board of Trustees determined that the Advisor’s practices regarding brokerage and portfolio transactions were satisfactory.
In considering the Advisor’s practices regarding conflicts of interest, the Trustees evaluated the potential for conflicts of interest and considered such matters as the experience and ability of the advisory personnel assigned to the Fund; the basis of decisions to buy or sell securities for the Fund and the Advisor’s other accounts; the method for bunching of portfolio securities transactions; and the substance and administration of the Advisor’s code of ethics. Following further consideration and discussion, the Board of Trustees indicated that the Advisor’s standards and practices relating to the identification and mitigation of possible conflicts of interests were satisfactory.
Based upon all of the foregoing considerations, the Board of Trustees, including a majority of the Independent Trustees, approved the Investment Advisory Agreement for the Fund.
6. Information about Trustees and Officers
The business and affairs of the Fund and the Trust are managed under the direction of the Board of Trustees of the Trust. Information concerning the Trustees and officers of the Trust and Fund is set forth below. Generally, each Trustee and officer serves an indefinite term or until certain circumstances such as their resignation, death, or otherwise as specified in the Trust’s organizational documents. Any Trustee may be removed at a meeting of shareholders by a vote meeting the requirements of the Trust’s organizational documents. The Statement of Additional Information of the Fund includes additional information about the Trustees and officers and is available, without charge, upon request by calling the Fund toll-free at 1-800-773-3863. The address of each Trustee and officer, unless otherwise indicated below, is 116 South Franklin Street, Rocky Mount, North Carolina 27804. The Independent Trustees each received aggregate compensation of $2,500.00 during the fiscal year ended August 31, 2013 from the Administrator for their services to the Fund and Trust.
ROUMELL OPPORTUNISTIC VALUE FUND
Additional Information (Unaudited)
Name, Age and Address | Position held with Fund or Trust | Length of Time Served | Principal Occupation During Past 5 Years | Number of Portfolios in Fund Complex Overseen by Trustee | Other Directorships Held by Trustee During Past 5 Years |
| Independent Trustees |
Jack E. Brinson Age: 80 | Independent Trustee | Since 7/09 | Retired; previously, President of Brinson Investment Co. (personal investments) and President of Brinson Chevrolet, Inc. (auto dealership). | 23 | Independent Trustee of Brown Capital Management Funds for its three series, DGHM Investment Trust for its two series, Gardner Lewis Investment Trust for its two series, Hillman Capital Management Investment Trust for its one series, and Tilson Investment Trust for its one series (all registered investment companies); previously, Independent Trustee of de Leon Funds Trust for its one series from 2000 to 2005, Giordano Investment Trust for its one series during 2011, and New Providence Investment Trust for its one series from inception until 2011 (all registered investment companies). |
Michael G. Mosley Age: 60 | Independent Trustee | Since 7/10 | Owner of Commercial Realty Services (real estate) since 2004. | 23 | None. |
Theo H. Pitt, Jr. Age: 77 | Independent Trustee | Since 9/10 | Senior Partner, Community Financial Institutions Consulting (financial consulting) since 1999; Partner, Pikar Properties (real estate) since 2001; Account Administrator, Holden Wealth Management Group of Wachovia Securities (money management firm) from 2003-2008. | 23 | Independent Trustee of DGHM Investment Trust for its two series, Gardner Lewis Investment Trust for its two series, and Hanna Investment Trust for its one series (all registered investment companies); previously, Independent Trustee of Hillman Capital Management Investment Trust for its two series from 2000 to 2009, NCM Capital Investment Trust for its one series from 2007 to 2009, New Providence Investment Trust from 2008 to 2009, and Tilson Investment Trust for its one series from 2004 to 2009 (all registered investment companies). |
James H. Speed, Jr. Age: 59 | Independent Trustee, Chairman | Trustee since 7/09, Chair since 5/12 | President and CEO of NC Mutual Insurance Company (insurance company) since 2003; President of Speed Financial Group, Inc. (consulting and private investments) from 2000 to 2003. | 23 | Independent Trustee of the following; Brown Capital Management Funds for its three series, Hillman Capital Management Investment Trust for its one series, and Tilson Investment Trust for its one series (all registered investment companies). Member of Board of Directors of NC Mutual Life Insurance Company. Member of Board of Directors of M&F Bancorp. Previously, Independent Trustee of New Providence Investment Trust for its one series from 2009 until 2011 (registered investment company). |
ROUMELL OPPORTUNISTIC VALUE FUND
Additional Information (Unaudited)
Name, Age and Address | Position held with Fund or Trust | Length of Time Served | Principal Occupation During Past 5 Years | Number of Portfolios in Fund Complex Overseen by Trustee | Other Directorships Held by Trustee During Past 5 Years |
J. Buckley Strandberg Age: 53 | Independent Trustee | Since 7/09 | President of Standard Insurance and Realty (insurance and property management) since 1982. | 23 | None. |
| Other Officers |
James C. Roumell Age: 51 2 Wisconsin Circle Suite 660 Chevy Chase, MD 20815 | President (Roumell Opportunistic Value Fund) | Since 9/10 | President of Roumell Asset Management, LLC (advisor to the Roumell Opportunistic Value Fund) since 1998. | n/a | n/a |
Craig L. Lukin Age:45 2 Wisconsin Circle Suite 660 Chevy Chase, MD 20815 | Treasurer (Roumell Opportunistic Value Fund) | Since 9/10 | Chief Operating Officer and Chief Compliance Officer of Roumell Asset Management, LLC since 2007; Research Analyst at Roumell Asset Management, LLC from 2003-2007; Private Equity Analyst for Dent & Company, Inc. (investment services) from 2000-2002; Corporate Value Consulting Manager for PricewaterhouseCoopers, LLP (accountancy and professional services) from 1994-2000. | n/a | n/a |
T. Lee Hale, Jr. Age: 35 | Chief Compliance Officer; Assistant Treasurer; Treasurer (Matisse Discounted Closed-End Fund Strategy | Since 7/09, 4/10, and 5/12 | Financial Reporting Manager for The Nottingham Company (fund administrator) since 2009; previously, principal of Lee Hale Contracting (marine industry consulting). | n/a | n/a |
A. Vason Hamrick Age: 36 | Secretary | Since 7/09 | Corporate Counsel for The Nottingham Company since 2004. | n/a | n/a |
Annual Report 2013
August 31, 2013
SCS Tactical Allocation Fund
This report and the financial statements contained herein are submitted for the general information of the shareholders of the SCS Tactical Allocation Fund (the “Fund”). The Fund’s shares are not deposits or obligations of, or guaranteed by, any depository institution. The Fund’s shares are not insured by the FDIC, Federal Reserve Board or any other agency, and are subject to investment risks, including possible loss of principal amount invested. Neither the Fund nor the Fund’s distributor is a bank.
The SCS Tactical Allocation Fund is distributed by Capital Investment Group, Inc., Member FINRA/SIPC, 17 Glenwood Ave, Raleigh, NC, 27603. There is no affiliation between the SCS Tactical Allocation Fund, including its principals, and Capital Investment Group, Inc.
Statements in this Annual Report that reflect projections or expectations of future financial or economic performance of the SCS Tactical Allocation Fund (“Fund”) and of the market in general and statements of the Fund’s plans and objectives for future operations are forward-looking statements. No assurance can be given that actual results or events will not differ materially from those projected, estimated, assumed or anticipated in any such forward-looking statements. Important factors that could result in such differences, in addition to the other factors noted with such forward-looking statements, include, without limitation, general economic conditions such as inflation, recession and interest rates. Past performance is not a guarantee of future results.
An investment in the Fund is subject to investment risks, including the possible loss of some or the entire principal amount invested. There can be no assurance that the Fund will be successful in meeting its investment objective. Investment in the Fund is also subject to the following risks: depository receipts, fixed income risk, interest rate risk, large-cap company risk, management style risk, manager risk, market risk, new fund risk, new manager risk, risks of investing in corporate debt securities, risks of investing in municipal securities, risks related to investing in other investment companies, risks of investing in REITs, and small-cap and mid-cap securities risk. More information about these risks and other risks can be found in the Fund’s prospectus.
The performance information quoted in this annual report represents past performance, which is not a guarantee of future results. Investment return and principal value of an investment will fluctuate so that an investor’s shares, when redeemed, may be worth more or less than their original cost. Current performance may be lower or higher than the performance data quoted. An investor may obtain performance data current to the most recent month-end by visiting ncfunds.com.
An investor should consider the investment objectives, risks, charges, and expenses of the Fund carefully before investing. The prospectus contains this and other information about the Fund. A copy of the prospectus is available at ncfunds.com or by calling Shareholder Services at 800-773-3863. The prospectus should be read carefully before investing.
This Annual Report was first distributed to shareholders on or about October 30, 2013.
For More Information on Your SCS Tactical Allocation Fund:
See Our Web site at ncfunds.com
or
Call Our Shareholder Services Group at 800-773-3863.
Dear Shareholders of the SCS Tactical Allocation Fund,
I would like to thank all of our shareholders for their continued trust in our money management. We do not take that responsibility lightly.
Since taking the Fund live in February of 2012, our markets and economy have been anything but stable. This volatility is the reason we opened SCS Tactical Allocation, and we still believe that our approach - having the ability to invest in any sector, market or investment, whether it is fixed income, equities or cash - is the correct approach.
This past year has been a great year for our investors. The Fund’s performance was 11.42% (1 year) and 13.97% (YTD) compared to the fund’s benchmark - the 60/40 blend of the S&P 500 and the Barclays Aggregate Bond Index returned 10.33% (1 Year) and 8.73% (YTD). This past year, we have increased our overall equity position, while also increasing our weighting in the Consumer Staples and Consumer Discretionary sectors. Because of the interest rate environment, we have all but eliminated any fixed income with longer durations, replacing those positions with floating rate investments. The performance of our portfolio is a direct result of our flexibility and investment philosophy.
While this past year we have seen some good returns, there are still many obstacles ahead of us. We understand this and will continue to look for opportunities while trying to avoid risks.
Sincerely,
Cort Meinelschmidt
Sentinel Capital Solutions
Please see the table below for the Fund’s historical performance information through the calendar quarter ended September 30, 2013:
Average Annual Total Returns | | | Net | Gross |
Period Ended September 30, 2013 | One Year | Since Inception* | Expense Ratio** | Expense Ratio*** |
| SCS Tactical Allocation Fund | 17.34% | 12.37% | 4.00% | 13.28% |
60% S&P 500 and 40% Barclays Aggregate Bond Index**** | 11.15% | 10.69% | | |
The performance data quoted above represents past performance, which is not a guarantee of future results. Investment return and principal value of an investment in the Fund will fluctuate so that an investor's shares, when redeemed, may be worth more or less than their original cost. Current performance may be lower or higher than the performance data quoted. To obtain more current performance data regarding the Fund, including performance data current to the Fund’s most recent month-end, please visit ncfunds.com or call the Fund at (800)525-3863. Fee waivers and expenses reimbursements have positively impacted Fund performance.
*The Fund’s inception date is February 9, 2012.
**The net expense ratio reflects a contractual expense limitation that continues through January 1, 2014. Thereafter, the expense limitation may be changed or terminated at any time. Performance would have been lower without this expense limitation. The net expense ratio does not include acquired fund fees and expenses. More recent expense ratios are found in the Financial Highlights.
***Gross expense ratio is from the Fund’s prospectus dated December 31, 2012. More recent expense ratios are found in the Financial Highlights.
****You cannot invest directly in these indices. The indices do not have an investment advisor and do not pay any commissions, expenses, or taxes. If the indices did pay commissions, expenses, or taxes, the returns would be lower.
| SCS Tactical Allocation Fund | | | | | | | | | | | | | |
| | | | | | | | | | | | | | | | | | | | |
| Performance Update | | | | | | | | | | | | | | |
| (Unaudited) | | | | | | | | | | | | | | |
| | | | | | | | | | | | | | | | | | | | |
| For the period from February 9, 2012 (Date of Initial Public Investment) to August 31, 2013 | |
| | | | | | | | | | | | | | | | | | | | |
| Comparison of the Change in Value of a $10,000 Investment | | | | | | | | |
| | | | | | | | | | | | | | | | | | | | |
| | 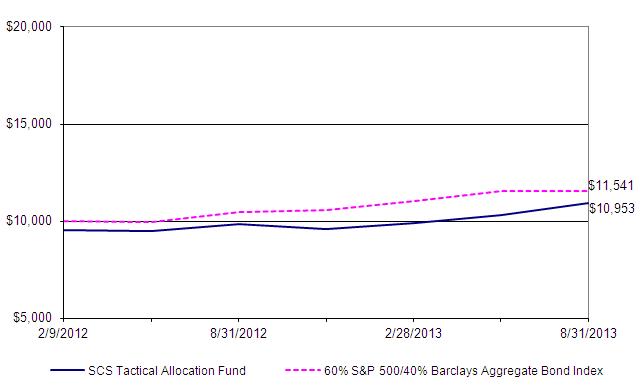 | |
| | | | | | | | | | | | | | | | | | | | |
| This graph assumes an initial investment of $10,000 ($9,525 after maximum sales load of 4.75%) at February 9, 2012 (Date of Initial Public Investment). All dividends and distributions are reinvested. This graph depicts the performance of the SCS Tactical Allocation Fund versus the 60% S&P 500/40% Barclays Aggregate Bond Index. It is important to note that the Fund is a professionally managed mutual fund while the indices are not available for investment and are unmanaged. The comparison is shown for illustrative purposes only. |
| | | | | | | | | | | | | | | | | | | | |
| | Average Annual Total Returns | | | | | | | | | | | | | |
| | | | | | | | | | | | | | | | | | Gross | | |
| | | As of | | | | | | | One | | Since | | Inception | | Expense | | |
| | | August 31, 2013 | | | | | | Year | | Inception | | Date | | Ratio* | | |
| | | SCS Tactical Allocation Fund - No Sales Load | | | 11.42% | | 9.37% | | 02/09/12 | | 13.28% | | |
| | | SCS Tactical Allocation Fund - 4.75% Maximum Sales Load | 5.00% | | 5.29% | | 02/09/12 | | 13.28% | | |
| | | 60% S&P 500/40% Barclays Aggregate Bond Index | | 10.33% | | 9.63% | | N/A | | N/A | | |
| | | | | | | | | | | | | | | | | | | | |
| * The gross expense ratio shown is from the Fund's prospectus dated December 31, 2012. | | | | |
| | | | | | | | | | | | | | | | | | | | |
| Performance quoted above represents past performance, which is no guarantee of future results. Investment return and principal value will fluctuate so that shares, when redeemed, may be worth more or less than their original cost. Current performance may be lower or higher than the performance data quoted. An investor may obtain performance data, current to the most recent month-end, by visiting ncfunds.com. |
| | | | | | | | | | | | | | | | | | | | |
| The graph and table do not reflect the deduction of taxes that a shareholder would pay on Fund distributions or the redemption of Fund shares. Average annual total returns are historical in nature and measure net investment income and capital gain or loss from portfolio investments assuming reinvestments of distributions. |
| | | | | | | | | | | | | | | | | | | | |
| | | | | | | | | | | | | | | | | | | | |
| SCS Tactical Allocation Fund | | | | | | | | | |
| | | | | | | | | | | | | |
| Schedule of Investments | | | | | | | | | |
| | | | | | | | | | | | | |
| | | | | | | | | | | | | |
| As of August 31, 2013 | | | | | | | | | |
| | | | | | | | | Shares | | | | Value (Note 1) |
| | | | | | | | | | | | | |
| COMMON STOCKS - 83.27% | | | | | | | | | |
| | | | | | | | | | | | | |
| | Consumer Discretionary - 18.85% | | | | | | | | |
| | | Coach, Inc. | | | | | | 2,625 | | | $ | 138,626 |
| | | Lowe's Cos, Inc. | | | | | 1,100 | | | | 50,402 |
| | | Mattel, Inc. | | | | | | 1,300 | | | | 52,650 |
| | * | Michael Kors Holdings Ltd. | | | | 710 | | | | 52,604 |
| | | Signet Jewelers Ltd. | | | | | 1,200 | | | | 79,680 |
| | | Target Corp. | | | | | | 1,380 | | | | 87,368 |
| | μ | The Swatch Group AG | | | | | 1,600 | | | | 46,144 |
| | | The Walt Disney Co. | | | | | 1,400 | | | | 85,162 |
| | | VF Corp. | | | | | | 250 | | | | 46,802 |
| | μ | Volkswagen AG | | | | | 2,400 | | | | 106,608 |
| | | | | | | | | | | | | 746,046 |
| | Consumer Staples - 20.19% | | | | | | | | | |
| | | Kimberly-Clark Corp. | | | | | 920 | | | | 86,002 |
| | | PepsiCo, Inc. | | | | | | 1,405 | | | | 112,021 |
| | * | PURE Bioscience, Inc. | | | | | 500,000 | | | | 410,000 |
| | | The Clorox Co. | | | | | | 900 | | | | 74,430 |
| | | The Procter & Gamble Co. | | | | 1,068 | | | | 83,186 |
| | | Walgreen Co. | | | | | | 700 | | | | 33,649 |
| | | | | | | | | | | | | 799,288 |
| | Energy - 2.78% | | | | | | | | | | |
| | | ConocoPhillips | | | | | | 700 | | | | 46,410 |
| | | Marathon Oil Corp. | | | | | 1,850 | | | | 63,695 |
| | | | | | | | | | | | | 110,105 |
| | Financials - 8.76% | | | | | | | | | | |
| | | Apollo Global Management LLC | | | | 3,600 | | | | 91,404 |
| | | Medley Capital Corp. | | | | | 7,750 | | | | 101,913 |
| | * | National Holdings Corp. | | | | | 333,333 | | | | 103,333 |
| | | The Chubb Corp. | | | | | 600 | | | | 49,902 |
| | | | | | | | | | | | | 346,552 |
| | Health Care - 9.86% | | | | | | | | | |
| | * | Gilead Sciences, Inc. | | | | | 2,600 | | | | 156,702 |
| | * | Heat Biologics, Inc. | | | | | 6,200 | | | | 61,938 |
| | | Johnson & Johnson | | | | | 1,100 | | | | 95,051 |
| | * | LCA-Vision, Inc. | | | | | 20,600 | | | | 76,632 |
| | | | | | | | | | | | | 390,323 |
| | Industrials - 3.95% | | | | | | | | | | |
| | | Textainer Group Holdings Ltd. | | | | 4,480 | | | | 156,173 |
| | | | | | | | | | | | | 156,173 |
| | | | | | | | | | | | | |
| | | | | | | | | | | | | |
| | | | | | | | | | | | | (Continued) |
| SCS Tactical Allocation Fund | | | | | | | | | |
| | | | | | | | | | | | | |
| Schedule of Investments | | | | | | | | | |
| | | | | | | | | | | | | |
| | | | | | | | | | | | | |
| As of August 31, 2013 | | | | | | | | | |
| | | | | | | | | Shares | | | | Value (Note 1) |
| | | | | | | | | | | | | |
| | Information Technology - 18.88% | | | | | | | | |
| | * | 3D Systems Corp. | | | | | 1,500 | | | $ | 77,100 |
| | | Apple, Inc. | | | | | | 449 | | | | 218,760 |
| | | Corning, Inc. | | | | | | 6,100 | | | | 85,644 |
| | * | IZEA, Inc. | | | | | | 86,000 | | | | 28,389 |
| | | Mastercard, Inc. | | | | | 180 | | | | 109,094 |
| | * | Professional Diversity Network | | | | 1,300 | | | | 5,785 |
| | * | Teradyne, Inc. | | | | | | 5,750 | | | | 88,263 |
| | | The Western Union Co. | | | | | 3,500 | | | | 61,355 |
| | * | Xplore Technologies Corp. | | | | | 17,214 | | | | 72,985 |
| | | | | | | | | | | | | 747,375 |
| | | | | | | | | | | | | |
| | | Total Common Stocks (Cost $3,017,713) | | | | | | | | 3,295,862 |
| | | | | | | | | | | | | |
| EXCHANGE TRADED PRODUCT- 3.62% | | | | | | | | |
| | | PowerShares Senior Loan Portfolio | | | | 5,790 | | | | 143,129 |
| | | | | | | | | | | | | |
| | | Total Exchange Traded Product (Cost $143,334) | | | | | | | 143,129 |
| | | | | | | | | | | | | |
| | | | | | | | | Interest | | Maturity | | |
| MUNICIPAL BONDS- 0.91% | | | Principal | | Rate | | Date | | |
| | Cathedral City Public Financing Authority | $ | 25,000 | | 4.125% | | 8/1/2016 | | 22,862 |
| | York County Industrial Development Authority | 15,000 | | 8.500% | | 12/1/2035 | | 13,099 |
| | | | | | | | | | | | | |
| | | Total Municipal Bonds (Cost $37,848) | | | | | | | | 35,961 |
| | | | | | | | | | | | | |
| CONVERTIBLE BONDS- 7.62% | | | | | | | | | |
| | Natixis US Medium-Term Note Program LLC | | 150,000 | | 13.600% | | 12/3/2013 | | 150,000 |
| | Natixis | | | | 150,000 | | 20.000% | | 9/24/2013 | | 151,545 |
| | | | | | | | | | | | | |
| | | Total Convertible Bonds (Cost $300,000) | | | | | | | | 301,545 |
| | | | | | | | | | | | | |
| | | | | | | | | Strike | | Exercise | | |
| WARRANTS- 1.07% | | | | Shares | | Price | | Date | | |
| | PURE Bioscience, Inc. | | | 250,000 | $ | 0.65 | | 10/24/2013 | | 42,500 |
| | | | | | | | | | | | | |
| | | Total Warrants (Cost $0) | | | | | | | | | 42,500 |
| | | | | | | | | | | | | |
| | | | | | | | | | | | | |
| | | | | | | | | | | | | |
| | | | | | | | | | | | | |
| | | | | | | | | | | | | |
| | | | | | | | | | | | | |
| | | | | | | | | | | | | (Continued) |
| SCS Tactical Allocation Fund | | | | | | | | | |
| | | | | | | | | | | | | |
| Schedule of Investments | | | | | | | | | |
| | | | | | | | | | | | | |
| | | | | | | | | | | | | |
| As of August 31, 2013 | | | | | | | | | |
| | | | | | | | | Shares | | | | Value (Note 1) |
| | | | | | | | | | | | | |
| SHORT-TERM INVESTMENT - 5.02% | | | | | | | | |
| | § | Fidelity Institutional Money Market Funds - | | | | | | | |
| | | Money Market Portfolio, 0.05% | | | | 198,610 | | | $ | 198,610 |
| | | | | | | | | | | | | |
| | | Total Short-Term Investment (Cost $198,610) | | | | | | | 198,610 |
| | | | | | | | | | | | | |
| Total Value of Investments (Cost $3,697,505) - 101.51% | | | | | | $ | 4,017,607 |
| | | | | | | | | | | | | |
| Liabilities in Excess of Other Assets - (1.51)% | | | | | | | | (59,674) |
| | | | | | | | | | | | | |
| | Net Assets - 100% | | | | | | | | $ | 3,957,933 |
| | | | | | | | | | | | | |
| § | Represents 7 day effective yield | | | | | | | | |
| * | Non-income producing investment | | | | | | | | |
| μ | American Depositary Receipt | | | | | | | | | |
| | | | | | | | | | | | | |
| | | | | | | | | | | | | |
| | | | | | | | | | | | | |
| | | | | | | | | | | | | |
| | | | | | | | | | | | | |
| | | | Summary of Investments | | |
| | | | | | | % of Net | | | | | | |
| | | | | | | Assets | | | | Value | | |
| | | | Consumer Discretionary | | 18.85% | | | $ | 746,046 | | |
| | | | Consumer Staples | | 20.19% | | | | 799,288 | | |
| | | | Energy | | | 2.78% | | | | 110,105 | | |
| | | | Exchange Traded Product | 3.62% | | | | 143,129 | | |
| | | | Financials | | | 8.76% | | | | 346,552 | | |
| | | | Health Care | | 9.86% | | | | 390,323 | | |
| | | | Industrials | | | 3.95% | | | | 156,173 | | |
| | | | Information Technology | | 18.88% | | | | 747,375 | | |
| | | | Municipal Bonds | | 0.91% | | | | 35,961 | | |
| | | | Convertible Bonds | | 7.62% | | | | 301,545 | | |
| | | | Warrants | | | 1.07% | | | | 42,500 | | |
| | | | Short-Term Investment | | 5.02% | | | | 198,610 | | |
| | | | Total | | | 101.51% | | | $ | 4,017,607 | | |
| | | | | | | | | | | | | |
| | | | | | | | | | | | | |
| | | | | | | | | | | | | |
| | | | | | | | | | | | | |
| | | | | | | | | | | | | |
| | | | | | | | | | | | | |
| | | | | | | | | | | | | |
| See Notes to Financial Statements | | | | | | | | |
| SCS Tactical Allocation Fund | | | |
| | | | | |
| Statement of Assets and Liabilities | | | |
| | | | | |
| | | | | |
| As of August 31, 2013 | | | |
| | | | | |
| Assets: | | | |
| | Investments, at value (cost $3,697,505) | $ | 4,017,607 | |
| | Receivables: | | | |
| | | Investments sold | | 139,897 | |
| | | Fund shares sold | | 195 | |
| | | Dividends and interest | | 7,318 | |
| | Prepaid expenses | | | |
| | | Fund accounting fees | | 2,250 | |
| | | Compliance services fees | | 483 | |
| | | Other expenses | | 573 | |
| | | | | | | |
| | Total assets | | 4,168,323 | |
| | | | | | | |
| Liabilities: | | | |
| | Payables: | | | |
| | | Investments purchased | | 169,748 | |
| | | Fund shares repurchased | | 19,967 | |
| | Accrued expenses | | | |
| | | Advisory fees | | 2,400 | |
| | | Administration fees | | 54 | |
| | | Other expenses | | 18,221 | |
| | | | | | | |
| | Total liabilities | | 210,390 | |
| | | | | | | |
| Total Net Assets | $ | 3,957,933 | |
| | | | | | | |
| Net Assets Consist of: | | | |
| | Paid in Capital | $ | 3,605,062 | |
| | Accumulated net investment loss | | (5,065) | |
| | Undistributed net realized gain on investments | | 37,834 | |
| | Net unrealized appreciation on investments | | 320,102 | |
| | | | | | | |
| Total Net Assets | $ | 3,957,933 | |
| | Shares Outstanding, no par value (unlimited authorized shares) | | 350,318 | |
| | Net Asset Value and Redemption Price Per Share | $ | 11.30 | |
| | | | | | | |
| Maximum Offering Price Per Share ($11.30 ÷ 95.25%) | $ | 11.86 | |
| | | | | | | |
| | | | | |
| | | | | |
| | | | | |
| | | | | |
| | | | | |
| | | | | |
| | | | | |
| | | | | |
| See Notes to Financial Statements | | | |
| SCS Tactical Allocation Fund | | |
| | | | |
| Statement of Operations | | |
| | | | |
| | | | |
| For the Year ended August 31, 2013 | | |
| | | | |
| Investment Income: | | |
| | Interest | $ | 29,433 |
| | Dividends | | 73,210 |
| | | | |
| | Total Investment Income | | 102,643 |
| | | | |
| Expenses: | | |
| | Advisory fees (note 2) | | 26,601 |
| | Administration fees (note 2) | | 24,029 |
| | Transfer agent fees (note 2) | | 22,012 |
| | Fund accounting fees (note 2) | | 27,266 |
| | Compliance service fees (note 2) | | 10,501 |
| | Custody fees (note 2) | | 3,697 |
| | Distribution and service fees (note 3) | | 6,650 |
| | Registration and filing administration fees (note 2) | | 874 |
| | Legal fees | | 3,948 |
| | Audit and tax preparation fees | | 13,006 |
| | Registration and filing expenses | | 6,446 |
| | Printing expenses | | 87 |
| | Trustee fees and meeting expenses | | 10,000 |
| | Securities pricing fees | | 796 |
| | Other operating expenses | | 9,296 |
| | | | |
| | Total Expenses | | 165,209 |
| | | | |
| | Expenses reimbursed by advisor (note 2) | | (48,502) |
| | Advisory fees waived (note 2) | | (24,202) |
| | | | |
| | Net Expenses | | 92,505 |
| | | | |
| Net Investment Income | | 10,138 |
| | | | |
| Realized and Unrealized Gain on Investments: | | |
| | | | |
| | Net realized gain from investment transactions | | 58,157 |
| | Net change in unrealized appreciation on investments | | 302,170 |
| | | | |
| Net Realized and Unrealized Gain on Investments | | 360,327 |
| | | | |
| Net Increase in Net Assets Resulting from Operations | $ | 370,465 |
| | | | |
| | | | |
| | | | |
| | | | |
| | | | |
| | | | |
| See Notes to Financial Statements | | |
| SCS Tactical Allocation Fund | | | | | | |
| | | | | | | | | | | |
| Statements of Changes in Net Assets | | | | | | |
| | | | | | | | | | | |
| | | | | | | | | | | |
| For the Year or Period ended August 31, | | | 2013 | | 2012 (a) | |
| | | | | | | | | | | |
| Operations: | | | | | | | |
| | Net investment income | | $ | 10,138 | $ | 17,008 | |
| | Net realized gain (loss) from investment transactions | | 58,157 | | (20,323) | |
| | Net change in unrealized appreciation on investments | | 302,170 | | 17,932 | |
| | | | | | | | | | | |
| Net Increase in Net Assets Resulting from Operations | | 370,465 | | 14,617 | |
| | | | | | | | | | | |
| Distributions to Shareholders: | | | | | | |
| | Net investment income | | | (32,211) | | - | |
| | | | | | | | | | | |
| Decrease in Net Assets Resulting from Distributions | | (32,211) | | - | |
| | | | | | | | | | | |
| Capital Share Transactions: | | | | | | |
| | Shares sold | | | | 2,473,933 | | 1,597,132 | |
| | Reinvested dividends and distributions | | | 32,211 | | - | |
| | Shares repurchased | | | (483,937) | | (14,277) | |
| | | | | | | | | | | |
| Increase from Capital Share Transactions | | | 2,022,207 | | 1,582,855 | |
| | | | | | | | | | | |
| Net Increase in Net Assets | | | 2,360,461 | | 1,597,472 | |
| | | | | | | | | | | |
| Net Assets: | | | | | | | |
| | Beginning of period | | | 1,597,472 | | - | |
| | End of period | | | $ | 3,957,933 | $ | 1,597,472 | |
| | | | | | | | | | | |
| Accumulated Net Investment Income (Loss) | | $ | (5,065) | $ | 17,008 | |
| | | | | | | | | | | |
| Share Information: | | | | | | |
| | Shares Sold | | | | 239,152 | | 156,120 | |
| | Reinvested Distributions | | | 3,313 | | - | |
| | Shares repurchased | | | (46,868) | | (1,399) | |
| | Net Increase in Capital Shares | | | 195,597 | | 154,721 | |
| | | | | | | | | | | |
| (a) | For the period from February 9, 2012 (Date of Initial Public Investment) to August 31, 2012. | | |
| | | | | | | | | | | |
| | | | | | | | | | | |
| | | | | | | | | | | |
| | | | | | | | | | | |
| | | | | | | | | | | |
| | | | | | | | | | | |
| | | | | | | | | | | |
| | | | | | | | | | | |
| | | | | | | | | | | |
| | | | | | | | | | | |
| | | | | | | | | | | |
| | | | | | | | | | | |
| See Notes to Financial Statements | | | | | | |
| SCS Tactical Allocation Fund | | | | | |
| | | | | | | | | | |
| Financial Highlights | | | | | |
| | | | | | | | | | |
| For a share outstanding during the | | | | | |
| fiscal year or period ended August 31, | | 2013 | | 2012 (f) | |
| | | | | | | | | | |
| Net Asset Value, Beginning of Period | $ | 10.32 | $ | 10.00 | |
| | | | | | | | | | |
| Income from Investment Operations | | | | | |
| | Net investment income | | 0.05 | | 0.11 | |
| | Net realized and unrealized gain on securities | | 1.10 | | 0.21 | |
| | | | | | | | | | |
| Total from Investment Operations | | 1.15 | | 0.32 | |
| | | | | | | | | | |
| Less Distributions to Shareholders: | | | | | |
| | Net investment income | | (0.17) | | - | |
| | | | | | | | | | |
| Total Distributions | | (0.17) | | - | |
| | | | | | | | | | |
| Net Asset Value, End of Period | $ | 11.30 | $ | 10.32 | |
| | | | | | | | | | |
| Total Return (c)(d) | | 11.42% | | 3.20% | (b) |
| | | | | | | | | | |
| Net Assets, End of Period (in thousands) | $ | 3,958 | $ | 1,597 | |
| | | | | | | | | | |
| Ratios of: | | | | | | | |
| Gross Expenses to Average Net Assets (e) | | 6.20% | | 13.24% | (a) |
| Net Expenses to Average Net Assets (e) | | 3.47% | | 1.65% | (a) |
| Net Investment Income to Average Net Assets | | 0.38% | | 2.46% | (a) |
| | | | | | | | | | |
| Portfolio turnover rate | | 116.45% | | 67.51% | (b) |
| | | | | | | | | | |
| | | | | | | | | | |
| | | | | | | | | | |
| | | | | | | | | | |
| (a) | Annualized. | | | | | | |
| (b) | Not annualized. | | | | | |
| (c) | Total return does not reflect sales charge, if any. | | | | | |
| (d) | Includes adjustments in accordance with accounting principles generally accepted in the United States of America |
| | and, consequently, the net asset value for financial reporting purposes and the returns based upon those net asset |
| | values may differ from the net asset values and returns for shareholder transactions. | | | |
| (e) | The expense ratios listed reflect total expenses prior to any waivers and reimbursements (gross expense ratio) |
| | and after any waivers and reimbursements (net expense ratio). | | | | | |
| (f) | For a share outstanding during the period from February 9, 2012 (Date of Initial Public Investment) | |
| | to August 31, 2012. | | | | | |
| | | | | | | | | | |
| | | | | | | | | | |
| | | | | | | | | | |
| | | | | | | | | | |
| | | | | | | | | | |
| | | | | | | | | | |
| | | | | | | | | | |
| See Notes to Financial Statements | | | | | |
SCS Tactical Allocation Fund
Notes to Financial Statements
1. Organization and Significant Accounting Policies
The SCS Tactical Allocation Fund (“Fund”) is a series of the Starboard Investment Trust (“Trust”). The Trust is organized as a Delaware statutory trust and is registered under the Investment Company Act of 1940, as amended (the “1940 Act”), as an open-end management investment company. The Fund is a separate diversified series of the Trust and commenced operations on February 9, 2012.
The Fund seeks to achieve its investment objective of capital appreciation by investing in a mix of equity securities and fixed income securities, which the Fund’s investment advisor, Sentinel Capital Solutions, Inc. (the “Advisor”), determines are undervalued, offer the potential for capital appreciation, or may offer appreciation with lower volatility than the overall market.
The following is a summary of significant accounting policies consistently followed by the Fund. The policies are in conformity with accounting principles generally accepted in the United States of America (“GAAP”).
Investment Valuation
The Fund’s investments in securities are carried at value. Securities listed on an exchange or quoted on a national market system are valued at the last sales price as of 4:00 p.m. Eastern Time. Securities traded in the NASDAQ over-the-counter market are generally valued at the NASDAQ Official Closing Price. Other securities traded in the over-the-counter market and listed securities for which no sale was reported on that date are valued at the most recent bid price. Securities and assets for which representative market quotations are not readily available (e.g., if the exchange on which the security is principally traded closes early or if trading of the particular security is halted during the day and does not resume prior to the Fund’s net asset value calculation) or which cannot be accurately valued using the Fund’s normal pricing procedures are valued at fair value as determined in good faith under policies approved by the Trustees. A security’s “fair value” price may differ from the price next available for that security using the Fund’s normal pricing procedures. Instruments with maturities of 60 days or less are valued at amortized cost, which approximates market value.
The Fund may invest in portfolios of open-end investment companies (the “Underlying Funds”). The Underlying Funds value securities in their portfolios for which market quotations are readily available at their market values (generally the last reported sale price) and all other securities and assets at their fair value to the methods established by the Board of Directors of the Underlying Funds. Open-ended funds are valued at their respective net asset values as reported by such investment companies.
Fair Value Measurement
Various inputs are used in determining the value of the Fund's investments. These inputs are summarized in the three broad levels listed below:
Level 1: quoted prices in active markets for identical securities
Level 2: other significant observable inputs (including quoted prices for similar securities and identical securities in inactive markets, interest rates, credit risk, etc.)
Level 3: significant unobservable inputs (including the Fund’s own assumptions in determining fair value of investments)
The availability of observable inputs can vary from security to security and is affected by a wide variety of factors, including, for example, the type of security, whether the security is new and not yet established in the marketplace, the liquidity of markets, and other characteristics particular to the security. To the extent that valuation is based on models or inputs that are less observable or unobservable in the market, the determination of fair value requires more judgment. Accordingly, the degree of judgment exercised in determining fair value is greatest for instruments categorized in Level 3.
The inputs used to measure fair value may fall into different levels of the fair value hierarchy. In such cases, for disclosure purposes, the level in the fair value hierarchy within which the fair value measurement falls in its entirety, is determined based on the lowest level input that is significant to the fair value measurement in its entirety.
SCS Tactical Allocation Fund
Notes to Financial Statements
The inputs or methodology used for valuing securities are not necessarily an indication of the risk associated with investing in those securities. The following table summarizes the inputs as of August 31, 2013 for the Fund’s assets measured at fair value:
| Investments in Securities (a) | | Total | | Level 1 | | Level 2 | | Level 3 |
| Assets | | | | | | | | |
| Common Stocks* | $ | 3,295,862 | $ | 3,295,862 | $ | - | $ | - |
| Exchange Traded Products | | 143,129 | | 143,129 | | - | | - |
| Municipal Bonds | | 35,961 | | - | | 35,961 | | - |
| Convertible Bonds | | 301,545 | | - | | 301,545 | | - |
| Warrants | | 42,500 | | - | | 42,500 | | - |
| Short-Term Investment | | 198,610 | | 198,610 | | - | | - |
| Total | $ | 4,017,607 | $ | 3,637,601 | $ | 380,006 | $ | - |
*Refer to Schedule of Investments for breakdown by Industry
(a) The Fund had no significant transfers into or out of Level 1, 2, or 3 during the year ended August 31, 2013. The Fund did not hold any Level 3 securities during the year.
Derivative Financial Instruments
The Fund may invest in derivative financial instruments (derivatives) in order to manage risk or gain exposure to various other investments or markets. Derivatives may contain various risks including the potential inability of the counterparty to fulfill their obligations under the terms of the contract, the potential for an illiquid secondary market, and the potential for market movements which may expose the Fund to gains or losses in excess of the amounts shown on the Statement of Assets and Liabilities.
Derivatives are marked to market daily based upon quotations from market makers or the Fund’s independent pricing services and the Fund’s net benefit or obligation under the contract, as measured by the fair market value of the contract, is included in net assets on the Statement of Assets and Liabilities. Realized gain and loss and changes in unrealized appreciation and depreciation on these contracts for the year are included in the Statement of Operations.
The derivative instruments outstanding as of August 31, 2013 as disclosed in the Notes to Financial Statements and the amounts of realized and changes in unrealized gains and losses on derivative instruments during the year as disclosed in the Statement of Operations serve as indicators of the volume of derivative activity for the Fund.
The following table sets forth the effect of the option contracts on the Statement of Assets and Liabilities for the fiscal year ended August 31, 2013:
| Derivative Type | Location | Value |
| Warrants | Investments, at value | $42,500 |
The following table sets forth the effect of the option contracts on the Statement of Operations for the fiscal year ended August 31, 2013:
| Derivative Type | Location | Gains |
| Warrants | Net change in unrealized appreciation on investments | $42,500 |
Investment Transactions and Investment Income
Investment transactions are accounted for as of the date purchased or sold (trade date). Dividend income is recorded on the ex-dividend date. Certain dividends from foreign securities will be recorded as soon as the Fund is informed of the dividend if such information is obtained subsequent to the ex-dividend date. Interest income is recorded on the accrual basis and includes amortization of discounts and premiums. Gains and losses are determined onthe identified cost basis, which is the same basis used for federal income tax purposes.
SCS Tactical Allocation Fund
Notes to Financial Statements
Expenses
The Fund bears expenses incurred specifically on its behalf as well as a portion of general Trust level expenses, which are allocated according to methods reviewed annually by the Trustees.
Distributions
The Fund may declare and distribute dividends from net investment income (if any) quarterly. Distributions from capital gains (if any) are generally declared and distributed annually. Dividends and distributions to shareholders are recorded on ex-date.
Estimates
The preparation of financial statements in conformity with accounting principles generally accepted in the United States of America requires management to make estimates and assumptions that affect the reported amounts of assets and liabilities and disclosure of contingent assets and liabilities at the date of the financial statements and the reported amounts of increases and decreases in the net assets from operations during the reported period. Actual results could differ from those estimates.
Federal Income Taxes
No provision for income taxes is included in the accompanying financial statements, as the Fund intends to distribute to shareholders all taxable investment income and realized gains and otherwise comply with Subchapter M of the Internal Revenue Code applicable to regulated investment companies.
| 2. | Transactions with Affiliates and Service Providers |
Advisor
The Fund pays a monthly advisory fee to the Advisor based upon the average daily net assets of the Fund and calculated at the annual rate as shown in Schedule A. The Advisor has contractually agreed to waive all or part of its advisory fee and to reimburse expenses to ensure that the Fund’s annual operating expenses (exclusive of interest, taxes, brokerage fees and commissions, extraordinary expenses, payments under the Rule 12b-1 distribution plan, and acquire fund fees and expenses) will not exceed a specified percentage of the daily average net assets for Fund shares. For the period from September 1, 2012 through December 31, 2012, the expense limitation percentage for the fund was 1.65%. The Board of Trustees approved an increase in the expense limitation percentage to 4.00%, and this new expense limitation percentage took effect on January 1, 2013. The advisory fee rate, as well as the advisory fees waived and expenses reimbursed for the fiscal year ended August 31, 2013, are included in Schedule A provided below.
Schedule A: | Rate | Advisor Fees Waived | Expenses Reimbursed |
| Average Net Assets | |
| All assets | | 1.00% | $24,202 | $48,502 |
SCS Tactical Allocation Fund
Notes to Financial Statements
Administrator
The Fund pays a monthly administration fee to the Administrator based upon the average daily net assets of the Fund and calculated at the annual rates as shown in the schedule below which is subject to a minimum of $2,000 per month. The Administrator also receives a fee to procure and pay the Fund’s custodian, additional compensation for fund accounting and recordkeeping services, and additional compensation for certain costs involved with the daily valuation of securities and as reimbursement for out-of-pocket expenses. A breakdown of these fees is provided below.
| Administration Fees* | Custody Fees* | Fund Accounting Fees (monthly) | Fund Accounting Fees | Blue Sky Administration Fees (annual) |
Average Net Assets | Annual Rate | Average Net Assets | Annual Rate |
| First $100 million | 0.100% | First $100 million | 0.020% | $2,250 | 0.01% | $150 per state |
| Next $150 million | 0.080% | Over $100 million | 0.009% | | | |
| Next $250 million | 0.060% | | | | | |
| Next $500 million | 0.050% | | | | | |
| Next $1 billion | 0.040% | *Minimum monthly fees of $2,000 and $417 for Administration and Custody, respectively. |
| Next $2 billion | 0.030% |
Compliance Services
Nottingham Compliance Services, LLC, a fully owned affiliate of the Administrator, provides services which assist the Trust’s Chief Compliance Officer in monitoring and testing the policies and procedures of the Trust in conjunction with requirements under Rule 38a-1 of the 1940 Act.
Transfer Agent
Nottingham Shareholder Services, LLC (“Transfer Agent”) serves as transfer, dividend paying, and shareholder servicing agent for the Fund. It receives compensation for its services based upon $21 per shareholder per year, subject to a minimum fee of $1,750 per month.
Distributor
Capital Investment Group, Inc. (the “Distributor”) serves as the Fund’s principal underwriter and distributor. The Distributor receives $5,000 per year paid in monthly installments for services provided and expenses assumed.
Certain Trustees and officers of the Trust are also officers of the Advisor or the Administrator.
| 3. | Distribution and Service Fees |
The Trustees, including a majority of the Trustees who are not “interested persons” of the Trust as defined in the 1940 Act and who have no direct or indirect financial interest in such plan or in any agreement related to such plan, adopted a distribution plan pursuant to Rule 12b-1 of the 1940 Act (the “Plan”). The 1940 Act regulates the manner in which a regulated investment company may assume expenses of distributing and promoting the sales of its shares and servicing of its shareholder accounts. The Plan provides that the Fund may incur certain expenses, which may not exceed 0.25% per annum of the Fund’s average daily net assets for each year elapsed subsequent to adoption of the Plan, for payment to the Distributor and others for items such as advertising expenses, selling expenses, commissions, travel or other expenses reasonably intended to result in sales of shares of the Fund or support servicing of shareholder accounts. For the fiscal year ended August 31, 2013, $6,650 in fees were incurred by the Fund.
| 4. | Purchases and Sales of Investment Securities |
For the fiscal year ended August 31, 2013, the aggregate cost of purchases and proceeds from sales of investment securities (excluding short-term securities) were as follows:
| Purchases of Securities | Proceeds from Sales of Securities |
| $5,082,264 | $2,915,671 |
SCS Tactical Allocation Fund
Notes to Financial Statements
There were no long-term purchases or sales of U.S Government Obligations during the fiscal year ended August 31, 2013.
Distributions are determined in accordance with Federal income tax regulations, which differ from GAAP, and, therefore, may differ significantly in amount or character from net investment income and realized gains for financial reporting purposes. Financial reporting records are adjusted for permanent book/tax differences to reflect tax character but are not adjusted for temporary differences.
Management reviewed the Fund’s tax positions taken on federal income tax returns for the open tax year/period of August 31, 2013 and August 31, 2012. As of and during the year ended August 31, 2013, the Fund does not have a liability for uncertain tax positions. The Fund recognizes interest and penalties, if any, related to unrecognized tax benefits as income tax expense in the Statement of Operations. During the year, the Fund did not incur any interest or penalties.
Distributions during the fiscal years ended were characterized for tax purposes as follows:
| | | Distributions from |
For the Fiscal Years Ended | | Ordinary Income | Long-Term- Capital Gains |
| 08/31/2013 | | $ 32,211 | $ - |
| 08/31/2012 | | $ - | $ - |
At August 31, 2013, the tax-basis cost of investments and components of distributable earnings were as follows:
| Cost of Investments | | $ 3,715,745 |
| | | |
| Unrealized Appreciation | | 432,311 |
| Unrealized Depreciation | | (130,449) |
| Net Unrealized Appreciation | | 301,862 |
| Undistributed Ordinary Income | | 60,615 |
| Other Book/Tax Differences | | (9,606) |
| | | |
| Distributable Earnings | | $ 352,871 |
| | | | | | |
The difference between book-basis and tax-basis net unrealized appreciation (depreciation) is attributable to the tax deferral of losses from wash sales. Realized losses reflected in the accompanying financial statements include net capital losses realized between November 1 and the Funds’ fiscal year-end that have not been recognized for tax purposes (Post-October loss deferrals). Late year losses incurred after December 31 within the fiscal year are deemed to arise on the first business day of the following fiscal year for tax purposes.
| 6. | Commitments and Contingencies |
Under the Trust’s organizational documents, its officers and Trustees are indemnified against certain liabilities arising out of the performance of their duties to the Fund. In addition, in the normal course of business, the Trust entered into contracts with its service providers, on behalf of the Fund, and others that provide for general indemnifications. The Fund’s maximum exposure under these arrangements is unknown, as this would involve future claims that may be made against the Fund. The Fund expects the risk of loss to be remote.
SCS Tactical Allocation Fund
Notes to Financial Statements
| 7. | New Accounting Pronouncements |
In December 2011, FASB issued ASU No. 2011-11 related to disclosures about offsetting assets and liabilities. The amendments in this ASU require an entity to disclose information about offsetting and related arrangements to enable users of its financial statements to understand the effect of those arrangements on its financial position. The ASU is effective for annual reporting periods beginning on or after January 1, 2013, and interim periods within those annual periods. The guidance requires retrospective application for all comparative periods presented.
In January 2013, the FASB issued ASU No. 2013-01 “Clarifying the Scope of Disclosures about Offsetting Assets and Liabilities.” ASU No. 2013-01 clarifies that ordinary trade receivables and payables are not included in the scope of ASU No. 2011-11. ASU No. 2011-11 applies only to derivatives, repurchase agreements and reverse repurchase agreements, and securities borrowing and lending that are offset in accordance with specific criteria contained in the FASB Accounting Standards codification.
Management is currently evaluating the impact ASU No. 2011-11 and ASU No. 2013-01 will have on the Fund’s financial statements and disclosures.
8. Change in Independent Registered Public Accounting Firm
On October 25, 2012, BBD, LLP was selected as the Trust’s independent registered public accounting firm for the 2013 fiscal year. The selection of BBD, LLP was recommended by the Trust’s Audit Committee, comprised of all non-interested Trustees, and was approved by the Board of Trustees. The report of the predecessor independent registered public accounting firm, on the financial statements of the Fund for the fiscal period ended August 31, 2012, did not contain any adverse opinion or disclaimer of opinion, nor was it qualified or modified as to uncertainty, audit scope or accounting principle. In addition, there were no disagreements between the Trust and the predecessor auditor on accounting principles, financial statement disclosures or audit scope, which, if not resolved to the satisfaction of the predecessor auditor would have caused them to make reference to the disagreement in their report on the financial statements for such period.
9. Subsequent Events
In accordance with the adoption of ASC Topic 855, Subsequent Events, and in preparing these financial statements, the Fund has evaluated the need for disclosures and/or adjustments resulting from subsequent events through the date of issuance of these financial statements. This evaluation did not result in any subsequent events that necessitated disclosures and/or adjustments.
REPORT OF INDEPENDENT REGISTERED PUBLIC ACCOUNTING FIRM
To the Shareholders of the SCS Tactical Allocation Fund and
The Board of Trustees of the Starboard Investment Trust
We have audited the accompanying statement of assets and liabilities of SCS Tactical Allocation Fund (the "Fund"), a series of shares of beneficial interest of the Starboard Investment Trust, including the schedule of investments, as of August 31, 2013, and the related statements of operations and changes in net assets and the financial highlights for the year then ended. These financial statements and financial highlights are the responsibility of the Fund’s management. Our responsibility is to express an opinion on these financial statements and financial highlights based on our audit. The statement of changes in net assets and the financial highlights for the period February 9, 2012 (date of initial public investment) through August 31, 2012 have been audited by other auditors, whose report dated October 22, 2012, expressed an unqualified opinion on such financial statement and financial highlights.
We conducted our audit in accordance with the standards of the Public Company Accounting Oversight Board (United States). Those standards require that we plan and perform the audit to obtain reasonable assurance about whether the financial statements and financial highlights are free of material misstatement. An audit includes examining, on a test basis, evidence supporting the amounts and disclosures in the financial statements. Our procedures included confirmation of securities owned as of August 31, 2013 by correspondence with the custodian and brokers. An audit also includes assessing the accounting principles used and significant estimates made by management, as well as evaluating the overall financial statement presentation. We believe that our audit provides a reasonable basis for our opinion.
In our opinion, the financial statements and financial highlights referred to above present fairly, in all material respects, the financial position of SCS Tactical Allocation Fund as of August 31, 2013, and the results of its operations, the changes in its net assets and its financial highlights for the year then ended, in conformity with accounting principles generally accepted in the United States of America.
BBD, LLP
Philadelphia, Pennsylvania
October 30, 2013
SCS Tactical Allocation Fund
Additional Information (Unaudited)
| 1. | Proxy Voting Policies and Voting Record |
A copy of the Trust’s Proxy Voting and Disclosure Policy and the Advisor’s Disclosure Policy are included as Appendix B to the Fund’s Statement of Additional Information and are available, without charge, upon request, by calling 1-800-773-3863, and on the website of the Security and Exchange Commission (“SEC”) at sec.gov. Information regarding how the Fund voted proxies relating to portfolio securities during the most recent period ended June 30, is available (1) without charge, upon request, by calling the Fund at the number above and (2) on the SEC’s website at sec.gov.
| 2. | Quarterly Portfolio Holdings |
The Fund files its complete schedule of portfolio holdings with the SEC for the first and third quarters of each fiscal year on Form N-Q. The Fund’s Forms N-Q are available on the SEC’s website at sec.gov. You may review and make copies at the SEC’s Public Reference Room in Washington, D.C. Information on the operation of the Public Reference Room may be obtained by calling the SEC at 202-942-8090. You may also obtain copies without charge, upon request, by calling the Fund at 1-800-773-3863.
We are required to advise you within 60 days of the Fund’s fiscal year-end regarding the federal tax status of certain distributions received by shareholders during each fiscal year. The following information is provided for the Fund’s fiscal year ended August 31, 2013.
During the fiscal year, no long-term capital gain distributions were paid from the Fund.
Dividend and distributions received by retirement plans such as IRAs, Keogh-type plans, and 403(b) plans need not be reported as taxable income. However, many retirement plans may need this information for their annual information meeting.
| 4. | Schedule of Shareholder Expenses |
As a shareholder of the Fund, you incur two types of costs: (1) transaction costs, which may include sales charges (loads) on purchase payments and (2) ongoing costs, including investment advisory fees; distribution (12b-1) fees; and other Fund expenses. This example is intended to help you understand your ongoing costs (in dollars) of investing in the Fund and to compare these costs with the ongoing costs of investing in other mutual funds. The example is based on an investment of $1,000 invested at the beginning of the period and held for the entire period as indicated below.
Actual Expenses – The first line of the table below provides information about the actual account values and actual expenses. You may use the information in this line, together with the amount you invested, to estimate the expenses that you paid over the period. Simply divide your account value by $1,000 (for example, an $8,600 account value divided by $1,000 = 8.6), then multiply the result by the number in the first line under the heading entitled “Expenses Paid During Period” to estimate the expenses you paid on your account during this period.
SCS Tactical Allocation Fund
Additional Information (Unaudited)
Hypothetical Example for Comparison Purposes – The last line of the table below provides information about hypothetical account values and hypothetical expenses based on the Fund’s actual expense ratio and an assumed annual rate of return of 5% before expenses, which is not the Fund’s actual return. The hypothetical account values and expenses may not be used to estimate the actual ending account balance or expenses you paid for the period. You may use this information to compare the ongoing costs of investing in the Fund and other funds by comparing this 5% hypothetical example with the 5% hypothetical examples that appear in the shareholder reports of other funds.
| Institutional Class Shares | Beginning Account Value March 1, 2013 | Ending Account Value August 31, 2013 | Expenses Paid During Period* |
Actual Hypothetical (5% annual return before expenses) | | | |
| $1,000.00 | $1,093.90 | $21.11 |
| $1,000.00 | $1,005.04 | $20.22 |
*Expenses are equal to the average account value over the period multiplied by the Fund’s annualized expense ratio of 4.00%, multiplied by 184/365 (to reflect the one-half year period).
| 5. | Information about Trustees and Officers |
The business and affairs of the Fund and the Trust are managed under the direction of the Board of Trustees of the Trust. Information concerning the Trustees and officers of the Trust and Fund is set forth below. Generally, each Trustee and officer serves an indefinite term or until certain circumstances such as their resignation, death, or otherwise as specified in the Trust’s organizational documents. Any Trustee may be removed at a meeting of shareholders by a vote meeting the requirements of the Trust’s organizational documents. The Statement of Additional Information of the Fund includes additional information about the Trustees and officers and is available, without charge, upon request by calling the Fund at 1-800-773-3863. The address of each Trustee and officer, unless otherwise indicated below, is 116 South Franklin Street, Rocky Mount, North Carolina 27804. The Independent Trustees each received aggregate compensation of $2,500.00 during the fiscal year ended August 31, 2013 from the Fund for their services to the Fund and Trust.
Name, Age and Address | Position held with Fund or Trust | Length of Time Served | Principal Occupation During Past 5 Years | Number of Portfolios in Fund Complex Overseen by Trustee | Other Directorships Held by Trustee During Past 5 Years |
| Independent Trustees |
Jack E. Brinson Age: 81 | Independent Trustee | Since 7/09 | Retired; previously, President of Brinson Investment Co. (personal investments) and President of Brinson Chevrolet, Inc. (auto dealership). | 23 | Independent Trustee of Brown Capital Management Funds for its three series, DGHM Investment Trust for its two series, Gardner Lewis Investment Trust for its two series, Hillman Capital Management Investment Trust for its one series, and Tilson Investment Trust for its one series (all registered investment companies); previously, Independent Trustee of de Leon Funds Trust for its one series from 2000 to 2005, Giordano Investment Trust for its one series during 2011, and New Providence Investment Trust for its one series from inception until 2011 (all registered investment companies). |
Michael G. Mosley Age: 60 | Independent Trustee | Since 7/10 | Owner of Commercial Realty Services (real estate) since 2004. | 23 | None. |
Theo H. Pitt, Jr. Age: 77 | Independent Trustee | Since 9/10 | Senior Partner, Community Financial Institutions Consulting (financial consulting) since 1999; Partner, Pikar Properties (real estate) since 2001; Account Administrator, Holden Wealth Management Group of Wachovia Securities (money management firm) from 2003-2008. | 23 | Independent Trustee of DGHM Investment Trust for its two series, Gardner Lewis Investment Trust for its two series, and Hanna Investment Trust for its one series (all registered investment companies); previously, Independent Trustee of Hillman Capital Management Investment Trust for its two series from 2000 to 2009, NCM Capital Investment Trust for its one series from 2007 to 2009, New Providence Investment Trust from 2008 to 2009, and Tilson Investment Trust for its one series from 2004 to 2009 (all registered investment companies). |
Name, Age and Address | Position held with Fund or Trust | Length of Time Served | Principal Occupation During Past 5 Years | Number of Portfolios in Fund Complex Overseen by Trustee | Other Directorships Held by Trustee During Past 5 Years |
James H. Speed, Jr. Age: 59 | Independent Trustee, Chairman | Trustee since 7/09, Chair since 5/12 | President and CEO of NC Mutual Insurance Company (insurance company) since 2003; President of Speed Financial Group, Inc. (consulting and private investments) from 2000 to 2003. | 23 | Independent Trustee of the following Brown Capital Management Funds for its three series, Hillman Capital Management Investment Trust for its one series, and Tilson Investment Trust for its one series (all registered investment companies). Member of Board of Directors of NC Mutual Life Insurance Company. Member of Board of Directors of M&F Bancorp. Previously, Independent Trustee of New Providence Investment Trust for its one series from 2009 until 2011 (registered investment company). |
J. Buckley Strandberg Age: 53 | Independent Trustee | Since 7/09 | President of Standard Insurance and Realty (insurance and property management) since 1982. | 23 | None. |
| Other Officers |
Cort F. Meinelschmidt Age: 34 38 S. Potomac Street Suite 304 Hagerstown, MD 21740 | President (SCS Tactical Allocation Fund) | Since 10/11 | President of Sentinel Capital Solutions, Inc. (advisor to the SCS Tactical Allocation Fund) since 2011; Financial Advisor for Centra Financial Services (investment services) from 2010-2011; Financial Advisor for Edward Jones (investment services) from 2004-2010. | n/a | n/a |
T. Lee Hale, Jr. Age: 35 | Chief Compliance Officer; Assistant Treasurer; Treasurer (Matisse Discounted Closed-End Fund Strategy | Since 7/09, 4/10, and 5/12 | Financial Reporting Manager for The Nottingham Company (fund administrator) since 2009; previously, principal of Lee Hale Contracting (marine industry consulting). | n/a | n/a |
A. Vason Hamrick Age: 36 | Secretary | Since 7/09 | Corporate Counsel for The Nottingham Company since 2004. | n/a | n/a |
SCS Tactical Allocation Fund
is a series of
Starboard Investment Trust
| For Shareholder Service Inquiries: | For Investment Advisor Inquiries: |
| Nottingham Shareholder Services, LLC | Sentinel Capital Solutions |
| 116 South Franklin Street | 38 S. Potomac Street |
Post Office Drawer 4365 Rocky Mount, North Carolina 27803 | Suite 304 Hagerstown, Maryland 21740 |
World Wide Web @: ncfunds.com | World Wide Web @: sentinelcapitalsolutions.com |
Item 2. CODE OF ETHICS.
| (a) | The registrant, as of the end of the period covered by this report, has adopted a code of ethics that applies to its Principal Executive Officer(s), Principal Financial Officer(s), and Principal Accounting Officer(s), or persons performing similar functions, regardless of whether these individuals are employed by the registrant or a third party. |
| (c) | There have been no substantive amendments during the period covered by this report. |
| (d) | The registrant has not granted, during the period covered by this report, any waivers, including an implicit waiver. |
| (f)(1) | A copy of the code of ethics that applies to the registrant’s Principal Executive Officers and Principal Financial Officers is filed pursuant to Item 12.(a)(1) below. |
| Item 3. | AUDIT COMMITTEE FINANCIAL EXPERT. |
The registrant’s Board of Trustees has determined that the registrant has an audit committee financial expert, as defined in Item 3 of Form N-CSR, serving on its audit committee.
As of the date of this report, August 31, 2013, the registrant’s audit committee financial expert is Mr. James H. Speed, Jr. Mr. Speed is “independent” for purposes of Item 3 of Form N-CSR.
| Item 4. | PRINCIPAL ACCOUNTANT FEES AND SERVICES. |
| (a) | Audit Fees – Audit fees billed for the registrant for the last two fiscal years are reflected in the table below. These amounts represent aggregate fees billed by the registrant’s independent accountant, BrookWeiner, LLC for 2012 and BBD, LLP for 2013 (“Accountant”), in connection with the annual audits of the registrant’s financial statements and for services normally provided by the Accountant in connection with the registrant’s statutory and regulatory filings for those fiscal years. |
| Fund | 2012 | 2013 |
| Roumell Opportunistic Value Fund | $12,000 | $11,000 |
| SCS Tactical Allocation Fund | $12,000 | $11,000 |
| (b) | Audit-Related Fees – There were no additional fees billed in the fiscal years ended August 31, 2012 and August 31, 2013 for assurance and related services by the Accountant that were reasonably related to the performance of the audit of the registrant’s financial statements that were not reported under paragraph (a) of this Item. |
| (c) | Tax Fees – The tax fees billed in each of the last two fiscal years ended for professional services rendered by the Accountant for tax compliance, tax advice, and tax planning are reflected in the table below. These services were for the completion of each fund’s federal and state income tax returns, excise tax returns, and assistance with distribution calculations. |
| Fund | 2012 | 2013 |
| Roumell Opportunistic Value Fund | $1,500 | $2,000 |
| SCS Tactical Allocation Fund | $1,500 | $2,000 |
| (d) | All Other Fees – There were no other fees paid to the Accountant which were not disclosed in Items (a) through (c) above during the last two fiscal years. |
| (e)(1) | The registrant’s Board of Trustees pre-approved the engagement of the Accountant for the last two fiscal years at an audit committee meeting of the Board of Trustees called for such purpose; and will pre-approve the Accountant for each fiscal year thereafter at an audit committee meeting called for such purpose. The charter of the audit committee states that the audit committee should pre-approve any audit services and, when appropriate, evaluate and pre-approve any non-audit services provided by the Accountant to the registrant and to pre-approve, when appropriate, any non-audit services provided by the Accountant to the registrant’s investment adviser, or any entity controlling, controlled by, or under common control with the investment adviser that provides ongoing services to the registrant if the engagement relates directly to the operations and financial reporting of the registrant. |
| (2) | There were no services as described in each of paragraph (b) through (d) of this Item that were approved by the audit committee pursuant to paragraph (c)(7)(i)(C) of Rule 2-01 of Regulation S-X. |
| (g) | Aggregate non-audit fees billed by the Accountant to the registrant for services rendered for the fiscal years ended August 31, 2012 and August 31, 2013 were $3,000 and $4,000, respectively. There were no fees billed by the Accountant for non-audit services rendered to the registrant’s investment adviser, or any other entity controlling, controlled by, or under common control with the registrant’s investment adviser. |
| Item 5. | AUDIT COMMITTEE OF LISTED REGISTRANTS. |
Not applicable.
| Item 6. | SCHEDULE OF INVESTMENTS. |
A copy of the schedule of investments of unaffiliated issuers as of the close of the reporting period is included as part of the report to shareholders filed under Item 1 of this Form.
| Item 7. | DISCLOSURE OF PROXY VOTING POLICIES AND PROCEDURES FOR CLOSED-END MANAGEMENT INVESTMENT COMPANIES. |
Not applicable.
| Item 8. | PORTFOLIO MANAGERS OF CLOSED-END MANAGEMENT INVESTMENT COMPANIES. |
Not applicable.
| Item 9. | PURCHASES OF EQUITY SECURITIES BY CLOSED-END MANAGEMENT INVESTMENT COMPANY AND AFFILIATED PURCHASERS. |
Not applicable.
| Item 10. | SUBMISSION OF MATTERS TO A VOTE OF SECURITY HOLDERS. |
None.
| Item 11. | CONTROLS AND PROCEDURES. |
| (a) | The Principal Executive Officer(s) and the Principal Financial Officer(s) have concluded that the registrant’s disclosure controls and procedures are effective based on their evaluation of the disclosure controls and procedures as of a date within 90 days of the filing of this report. |
| (b) | There were no changes in the registrant's internal control over financial reporting that occurred during the registrant’s second fiscal quarter of the period covered by this report that have materially affected, or are reasonably likely to materially affect, the registrant’s internal control over financial reporting. |
| (a)(1) | Code of Ethics required by Item 2 of Form N-CSR is filed herewith as Exhibit 12.(a)(1). |
| (a)(2) | Certifications required by Item 12.(a)(2) of Form N-CSR are filed herewith as Exhibit 12.(a)(2). |
| (b) | Certifications required by Item 12.(b) of Form N-CSR are filed herewith as Exhibit 12.(b). |
SIGNATURES
Pursuant to the requirements of the Securities Exchange Act of 1934 and the Investment Company Act of 1940, the registrant has duly caused this report to be signed on its behalf by the undersigned, thereunto duly authorized.
Starboard Investment Trust
| By: (Signature and Title) | /s/James C. Roumell |
Date: November 1, 2013 | James C. Roumell President and Principal Executive Officer Roumell Opportunistic Value Fund |
| By: (Signature and Title) | /s/Cort F. Meinelschmidt |
Date: November 1, 2013 | Cort F. Meinelschmidt President, Treasurer, Principal Executive Officer and Principal Financial Officer SCS Tactical Allocation Fund |
Pursuant to the requirements of the Securities Exchange Act of 1934 and the Investment Company Act of 1940, this report has been signed below by the following persons on behalf of the registrant and in the capacities and on the dates indicated.
| By: (Signature and Title) | /s/James C. Roumell |
Date: November 1, 2013 | James C. Roumell President, Principal Executive Officer Roumell Opportunistic Value Fund |
| By: (Signature and Title) | /s/Craig L. Lukin |
Date: November 1, 2013 | Craig L. Lukin Treasurer and Principal Financial Officer Roumell Opportunistic Value Fund |
| By: (Signature and Title) | /s/Cort F. Meinelschmidt |
Date: November 1, 2013 | Cort F. Meinelschmidt President, Treasurer, Principal Executive Officer and Principal Financial Officer SCS Tactical Allocation Fund |