UNITED STATES
SECURITIES AND EXCHANGE COMMISSION
Washington, D.C. 20549
FORM 6-K
REPORT OF FOREIGN PRIVATE ISSUER PURSUANT TO RULE 13a-16 OR 15d-16 UNDER THE SECURITIES EXCHANGE ACT OF 1934
For the month of September 2016
Commission File Number: 001-36298
GeoPark Limited
(Exact name of registrant as specified in its charter)
Nuestra Señora de los Ángeles 179
Las Condes, Santiago, Chile
(Address of principal executive office)
Indicate by check mark whether the registrant files or will file annual reports under cover of Form 20-F or Form 40-F:
| Form 20-F | X | Form 40-F |
Indicate by check mark if the registrant is submitting the Form 6-K in paper as permitted by Regulation S-T Rule 101(b)(1):
| Yes | No | X |
Indicate by check mark if the registrant is submitting the Form 6-K in paper as permitted by Regulation S-T Rule 101(b)(7):
| Yes | No | X |
GEOPARK LIMITED
TABLE OF CONTENTS
| ITEM | |
| 1. | Corporate Presentation – September 2016 |
Item 1
Proven Performance, Assets and Opportunity September 2016

ARGENTINA BRAZIL PERU COLOMBIA MEXICO 3 Latin American Platform: Track - Record, Value and Upside Base production and cash flow: ≈22,000 boepd, 75% oil Discovered oil and gas with development opportunities: 3P Reserves of 215 million boe High potential upside: Exploration Resources of 0.8 - 1.5 billion boe Unconventional resource potential: 220 – 600 million boe New project opportunities LARGE BALANCED PROJECT INVENTORY IN PROVEN HYDROCARBON BASINS SYSTEMATIC LONG TERM CONSERVATIVE APPROACH • Zero to 22,000+ boepd net, 40,000+ boepd operated • T rack - record of growing production, reserves and cash flow • Effective multi - country, multi - project, risk - balanced portfolio approach • Shareholders and Management aligned: 35+% of share ownership held by Board and Management Average Daily Production (boepd) PRODUCTION GROWTH: 45% / Year (CAGR ’06 – ’15 ) PRODUCTION MIX: 75% Oil / 25 % Gas 46 42 30 7 655 478 425 87 125 1,645 2P RESERVES 1 (MMBOE) 2P NPV 1 ($MM) Colombia Chile Brazil Peru 1 D&M December 2015 0 5,000 10,000 15,000 20,000 25,000 2006 2007 2008 2009 2010 2011 2012 2013 2014 2015 2016 E Colombia Chile Brazil
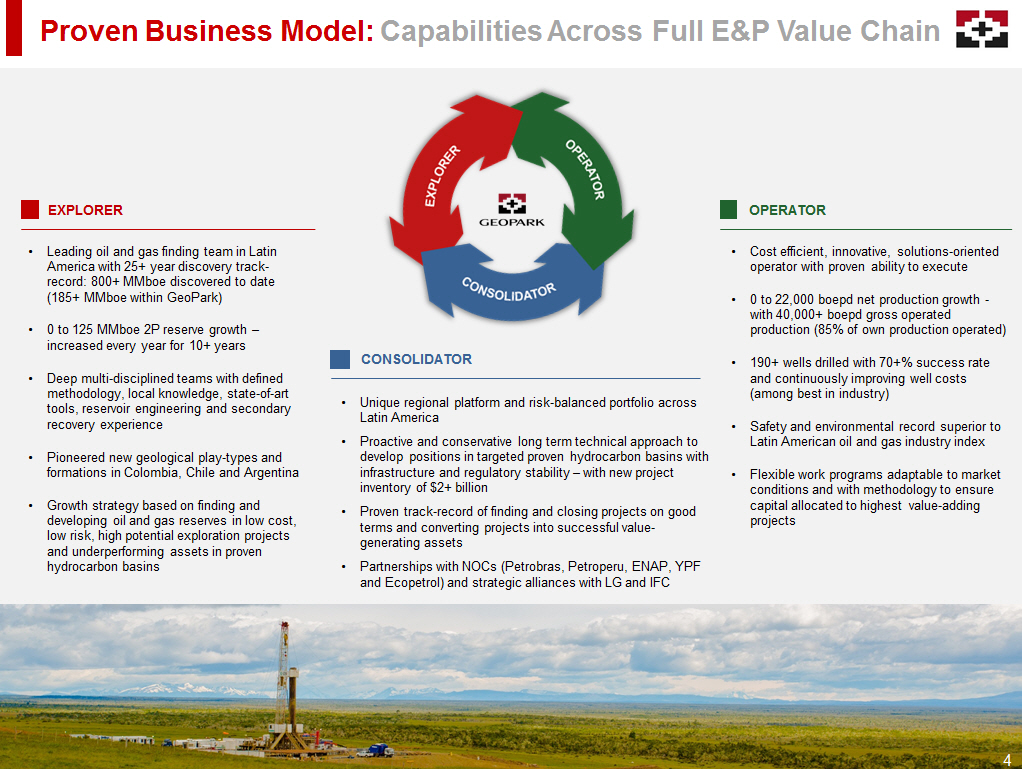
4 Proven Business Model: Capabilities Across Full E&P Value Chain • Leading oil and gas finding team in Latin America with 25+ year discovery track - record: 800+ MMboe discovered to date (185+ MMboe within GeoPark) • 0 to 125 MMboe 2P reserve growth – increased every year for 10+ years • Deep multi - disciplined teams with defined methodology, local knowledge, state - of - art tools, reservoir engineering and secondary recovery experience • Pioneered new geological play - types and formations in Colombia, Chile and Argentina • Growth strategy based on finding and developing oil and gas reserves in low cost, low risk, high potential exploration projects and underperforming assets in proven hydrocarbon basins EXPLORER • Cost efficient, innovative, solutions - oriented operator with proven ability to execute • 0 to 22,000 boepd net production growth - with 40,000+ boepd gross operated production (85% of own production operated) • 190+ wells drilled with 70+% success rate and continuously improving well costs (among best in industry) • Safety and environmental record superior to Latin American oil and gas industry index • Flexible work programs adaptable to market conditions and with methodology to ensure capital allocated to highest value - adding projects OPERATOR • Unique regional platform and risk - balanced portfolio across Latin America • Proactive and conservative long term technical approach to develop positions in targeted proven hydrocarbon basins with infrastructure and regulatory stability – with new project inventory of $2+ billion • Proven track - record of finding and closing projects on good terms and converting projects into successful value - generating assets • Partnerships with NOCs (Petrobras, Petroperu, ENAP, YPF and Ecopetrol) and strategic alliances with LG and IFC CONSOLIDATOR
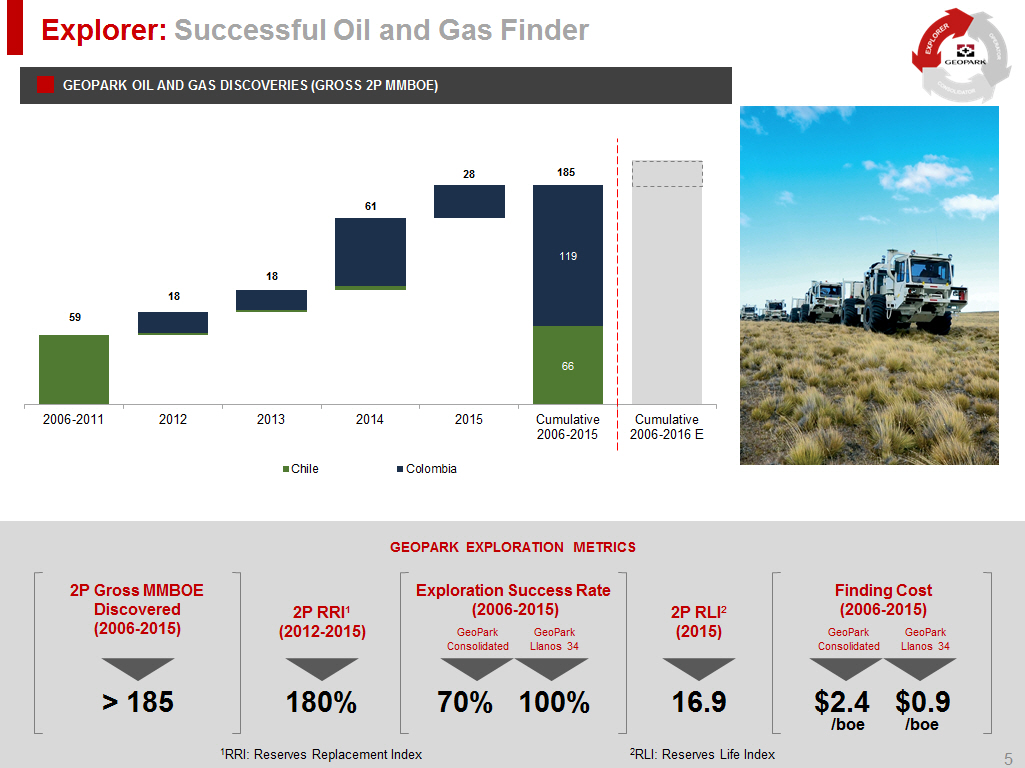
GEOPARK EXPLORATION METRICS > 185 2P Gross MMBOE Discovered (2006 - 2015) 180% 2P RRI 1 (2012 - 2015) 2P RLI 2 (2015) 16.9 Exploration Success Rate (2006 - 2015 ) 70% 100% Finding Cost (2006 - 2015 ) 1 RRI: Reserves Replacement Index GeoPark Llanos 34 GeoPark Consolidated GeoPark Llanos 34 GeoPark Consolidated $ 2.4 $0.9 /boe /boe 2 RLI: Reserves Life Index 66 119 2006-2011 2012 2013 2014 2015 Cumulative 2006-2015 Cumulative 2006-2016 E Chile Colombia Explorer: Successful Oil and Gas Finder GEOPARK OIL AND GAS DISCOVERIES (GROSS 2P MMBOE) 5 61 28 18 18 59 185
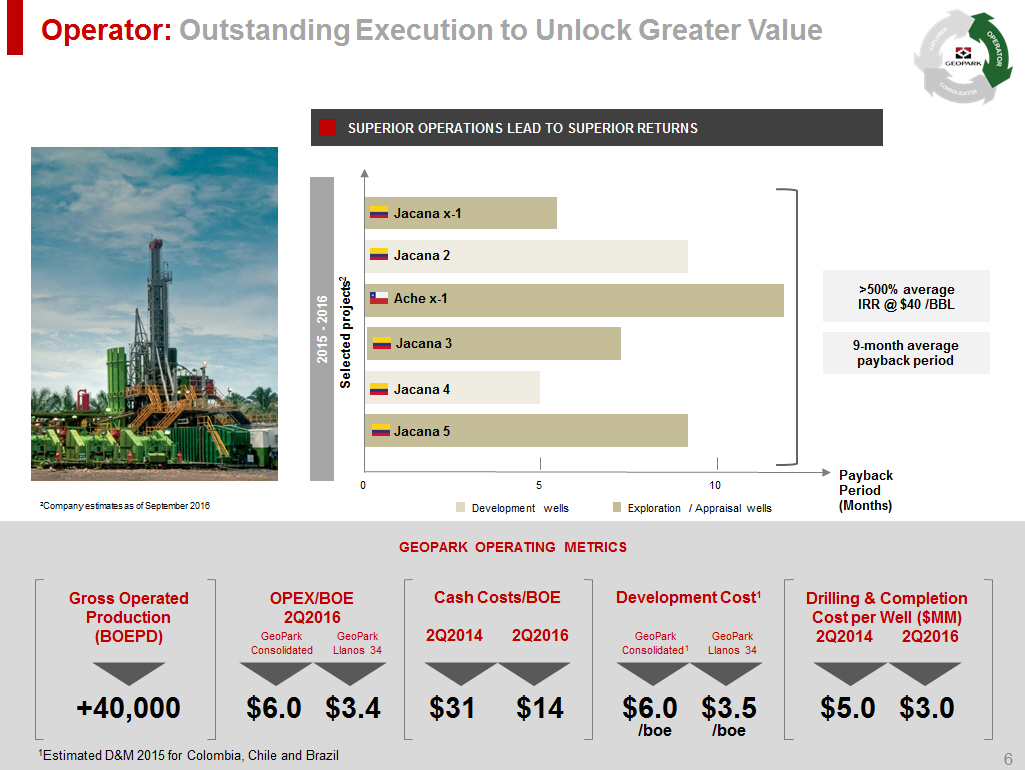
GEOPARK OPERATING METRICS +40,000 Gross Operated Production (BOEPD) Drilling & Completion Cost per Well ($MM ) 2Q2014 2Q2016 $6.0 $3.4 OPEX/BOE 2Q2016 Development Cost 1 $6.0 $3.5 /boe /boe GeoPark Llanos 34 GeoPark Consolidated 1 Cash Costs/BOE 2Q2014 2Q2016 $31 $14 GeoPark Llanos 34 GeoPark Consolidated $5.0 $ 3.0 1 Estimated D&M 2015 for Colombia, Chile and Brazil SUPERIOR OPERATIONS LEAD TO SUPERIOR RETURNS Selected projects 2 0 5 10 Payback Period (Months) Development wells Exploration / Appraisal wells Jacana 2 Jacana 4 Jacana 5 Ache x - 1 Jacana x - 1 2015 - 2016 Jacana 3 Operator: Outstanding Execution to Unlock Greater Value 6 2 Company estimates as of September 2016 >500% average IRR @ $40 / BBL 9 - month average payback period
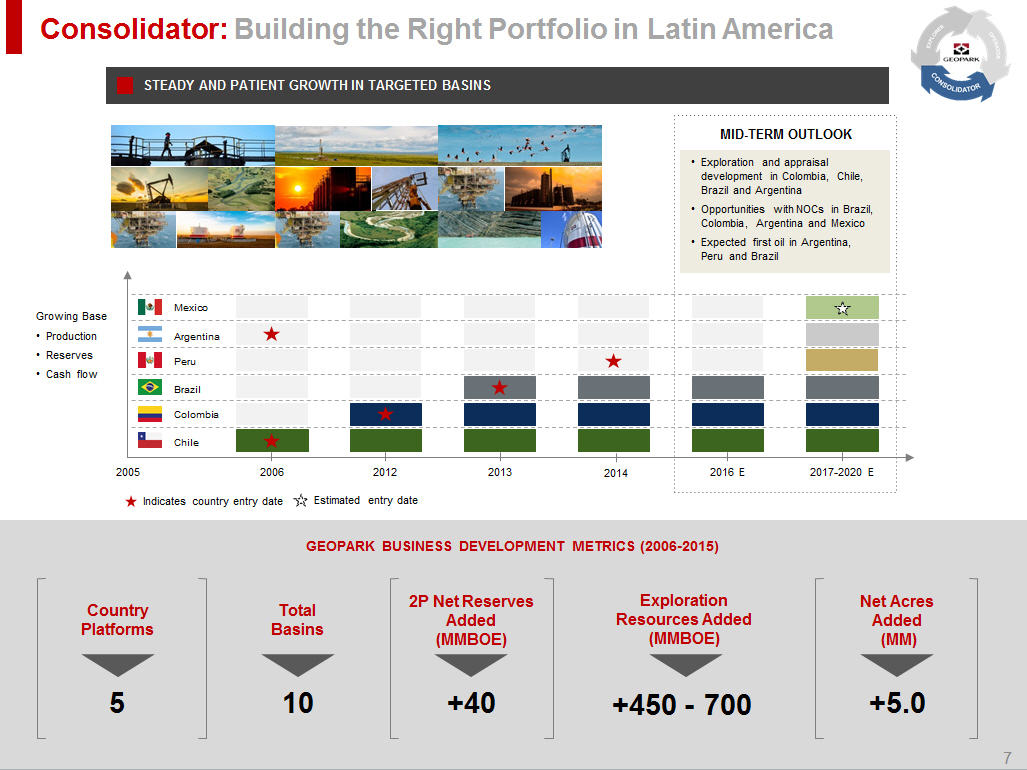
GEOPARK BUSINESS DEVELOPMENT METRICS (2006 - 2015) 5 Country Platforms 10 Total Basins 2P Net Reserves Added (MMBOE ) +40 +5.0 Net Acres Added (MM) Exploration Resources Added (MMBOE) +450 - 700 STEADY AND PATIENT GROWTH IN TARGETED BASINS Consolidator: Building the Right Portfolio in Latin America 7 2005 Growing Base • Production • Reserves • Cash flow • Exploration and appraisal development in Colombia, Chile , Brazil and Argentina • Opportunities with NOCs in Brazil, Colombia, Argentina and Mexico • Expected first oil in Argentina, Peru and Brazil MID - TERM OUTLOOK 2016 E 2017 - 2020 E Indicates country entry date Estimated entry date 2012 2013 2014 2006 Mexico Argentina Brazil Peru Colombia Chile
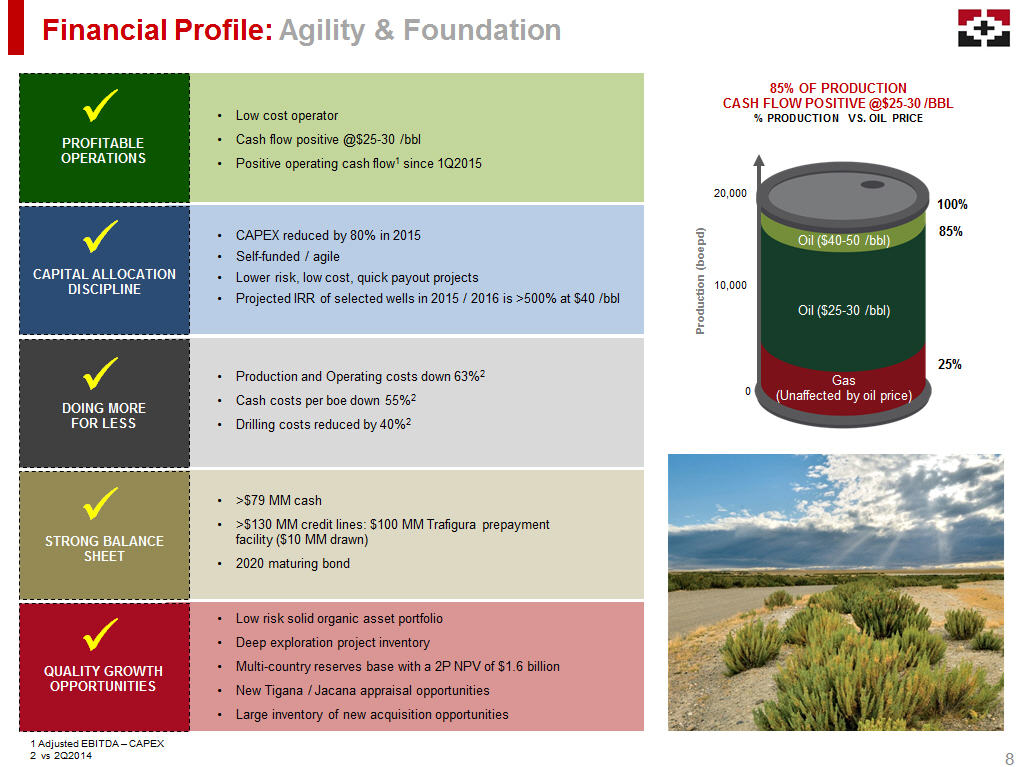
Financial Profile: Agility & Foundation 1 Adjusted EBITDA – CAPEX 2 vs 2Q2014 8 • Low cost operator • Cash flow positive @ $25 - 30 /bbl • Positive operating cash flow 1 since 1Q2015 x PROFITABLE OPERATIONS • CAPEX reduced by 80% in 2015 • Self - funded / agile • Lower risk, low cost, quick payout projects • Projected IRR of selected wells in 2015 / 2016 is >500 % at $ 40 / bbl CAPITAL ALLOCATION DISCIPLINE x • Production and Operating costs down 63% 2 • Cash costs per boe down 55% 2 • Drilling costs reduced by 40% 2 DOING MORE FOR LESS x • >$79 MM cash • >$130 MM credit lines: $100 MM Trafigura prepayment facility ($10 MM drawn) • 2020 maturing bond STRONG BALANCE SHEET x • Low risk solid organic asset portfolio • Deep exploration project inventory • Multi - country reserves base with a 2P NPV of $1.6 billion • New Tigana / Jacana appraisal opportunities • Large inventory of new acquisition opportunities QUALITY GROWTH OPPORTUNITIES x Production ( boepd ) 100% 85% 25% Oil ($40 - 50 /bbl) Oil ($25 - 30 /bbl) Gas (Unaffected by oil price) 20,000 10,000 0 85 % OF PRODUCTION CASH FLOW POSITIVE @$25 - 30 /BBL % PRODUCTION VS. OIL PRICE
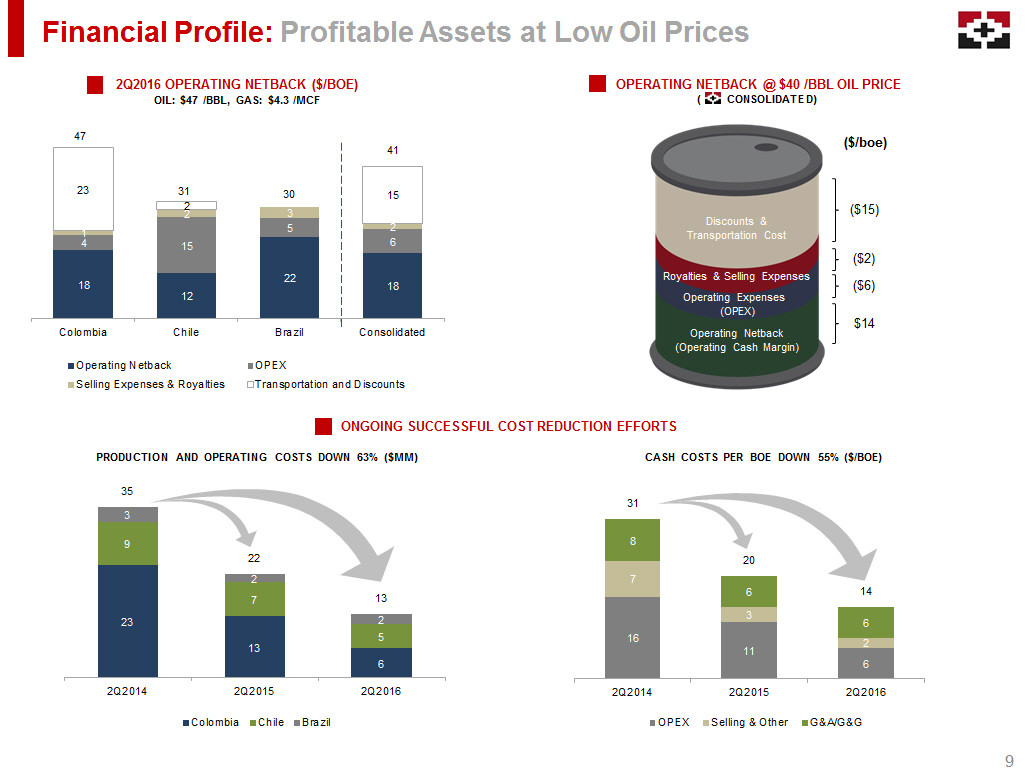
23 13 6 9 7 5 3 2 2 35 22 13 2Q2014 2Q2015 2Q2016 Colombia Chile Brazil Financial Profile: Profitable Assets at Low Oil Prices ONGOING SUCCESSFUL COST REDUCTION EFFORTS PRODUCTION AND OPERATING COSTS DOWN 63% ($MM) 18 12 22 18 4 15 5 6 1 2 3 2 23 2 15 47 31 30 41 Colombia Chile Brazil Consolidated Operating Netback OPEX Selling Expenses & Royalties Transportation and Discounts 16 11 6 7 3 2 8 6 6 31 20 14 2Q2014 2Q2015 2Q2016 OPEX Selling & Other G&A/G&G 2Q2016 OPERATING NETBACK ($/BOE) OIL: $47 /BBL, GAS: $4.3 /MCF 9 CASH COSTS PER BOE DOWN 55% ($/BOE) Operating Netback (Operating Cash Margin) Operating Expenses (OPEX) Royalties & Selling Expenses ($/boe) ($2) ($6) $14 Discounts & Transportation Cost ($15) OPERATING NETBACK @ $40 /BBL OIL PRICE ( CONSOLIDATED)
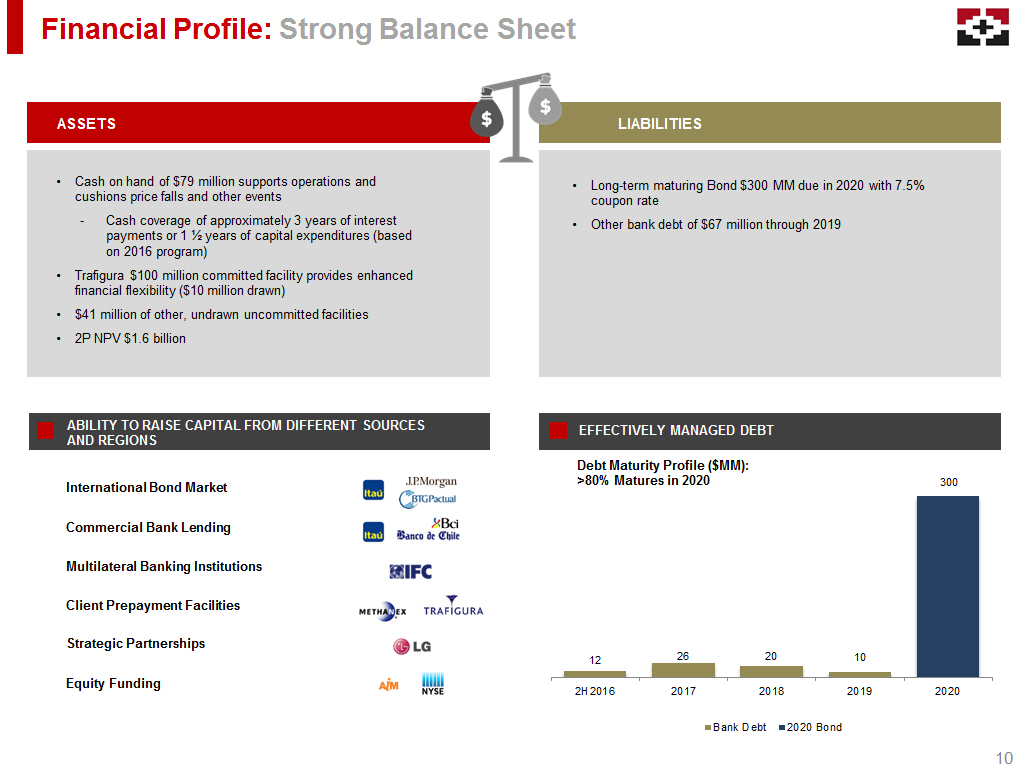
Financial Profile: Strong Balance Sheet Multilateral Banking Institutions Commercial Bank Lending International Bond Market Strategic Partnerships Client Prepayment Facilities Equity Funding ABILITY TO RAISE CAPITAL FROM DIFFERENT SOURCES AND REGIONS Debt Maturity Profile ($MM): >80% Matures in 2020 EFFECTIVELY MANAGED DEBT • Cash on hand of $79 million supports operations and cushions price falls and other events - Cash coverage of approximately 3 years of interest payments or 1 ½ years of capital expenditures (based on 2016 program) • Trafigura $100 million committed facility provides enhanced financial flexibility ($10 million drawn) • $41 million of other, undrawn uncommitted facilities • 2P NPV $1.6 billion ASSETS LIABILITIES • Long - term maturing Bond $300 MM due in 2020 with 7.5% coupon rate • Other bank debt of $67 million through 2019 10 12 26 20 10 300 2H2016 2017 2018 2019 2020 Bank Debt 2020 Bond
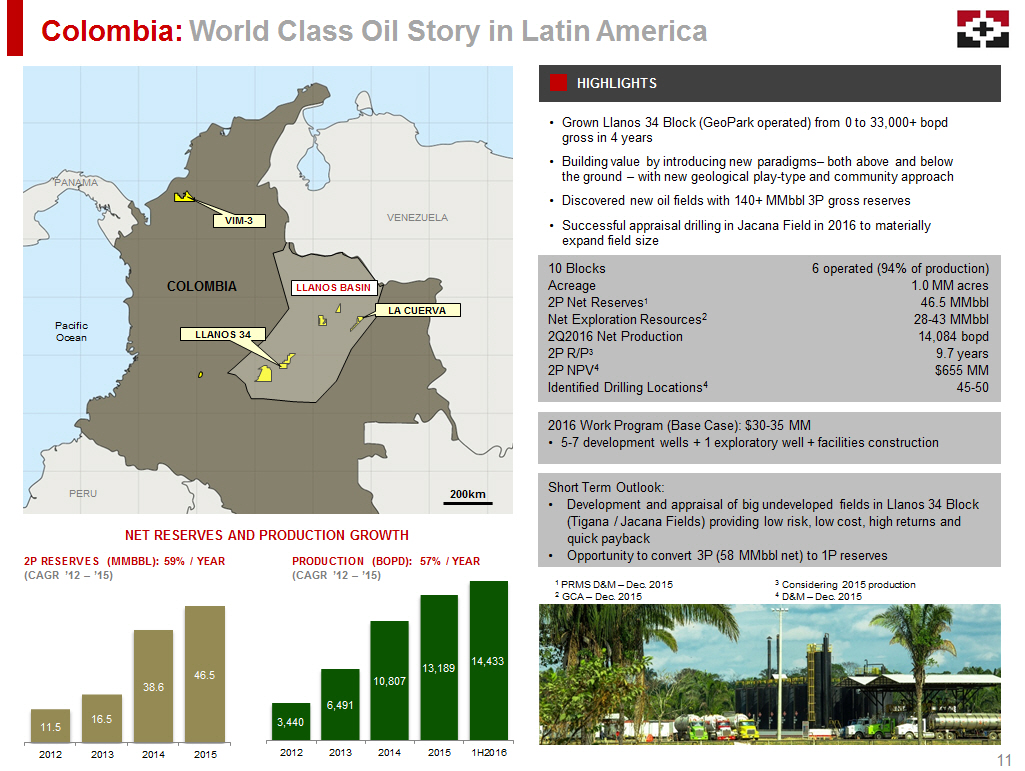
3,440 6,491 10,807 13,189 14,433 2012 2013 2014 2015 1H2016 Colombia: World Class Oil Story in Latin America 10 Blocks Acreage 2P Net Reserves 1 Net Exploration Resources 2 2Q2016 Net Production 2P R/P 3 2P NPV 4 Identified Drilling Locations 4 6 operated (94% of production) 1.0 MM acres 46.5 MMbbl 28 - 43 MMbbl 14,084 bopd 9.7 years $655 MM 45 - 50 1 PRMS D&M – Dec. 2015 2 GCA – Dec. 2015 3 Considering 2015 production 4 D&M – Dec. 2015 2016 Work Program (Base Case): $30 - 35 MM • 5 - 7 development wells + 1 exploratory well + facilities construction Pacific Ocean PANAMA VENEZUELA COLOMBIA 200km LLANOS BASIN PERU PRODUCTION (BOPD): 57% / YEAR (CAGR ’12 – ’15) NET RESERVES AND PRODUCTION GROWTH 2P RESERVES ( MMBBL): 59% / YEAR (CAGR ’12 – ’15) Short Term Outlook: • Development and appraisal of big undeveloped fields in Llanos 34 Block ( Tigana / Jacana F ields ) providing low risk, low cost, high returns and quick payback • Opportunity to convert 3P (58 MMbbl net) to 1P reserves LA CUERVA LLANOS 34 11.5 16.5 38.6 46.5 2012 2013 2014 2015 VIM - 3 11 • Grown Llanos 34 Block (GeoPark operated) from 0 to 33,000+ bopd gross in 4 years • Building value by introducing new paradigms – both above and below the ground – with new geological play - type and community approach • Discovered new oil fields with 140+ MMbbl 3P gross reserves • Successful appraisal drilling in Jacana Field in 2016 to materially expand field size HIGHLIGHTS
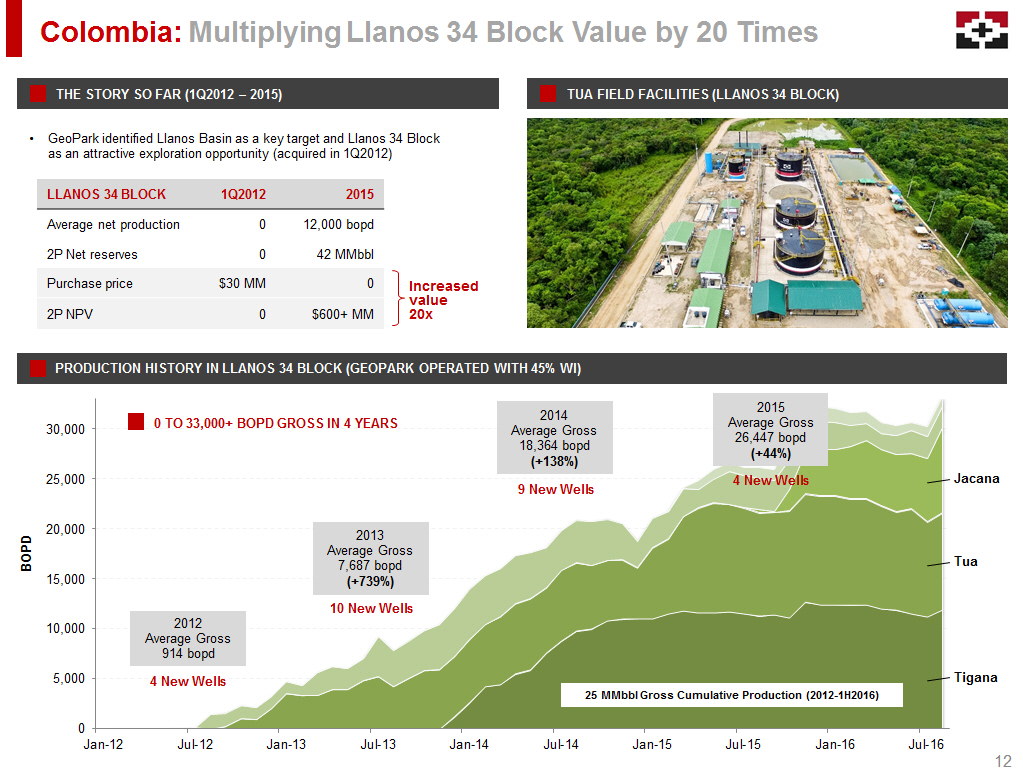
0 5,000 10,000 15,000 20,000 25,000 30,000 Jan-12 Jul-12 Jan-13 Jul-13 Jan-14 Jul-14 Jan-15 Jul-15 Jan-16 Jul-16 BOPD LLANOS 34 BLOCK 1Q2012 2015 Average net production 0 12,000 bopd 2P Net reserves 0 42 MMbbl Purchase price $ 30 MM 0 2P NPV 0 $600+ MM Colombia: Multiplying Llanos 34 Block Value by 20 Times • GeoPark identified Llanos Basin as a key target and Llanos 34 Block as an attractive exploration opportunity (acquired in 1Q2012) PRODUCTION HISTORY IN LLANOS 34 BLOCK (GEOPARK OPERATED WITH 45 % WI ) TUA FIELD FACILITIES (LLANOS 34 BLOCK) Increased value 20x 0 TO 33,000+ BOPD GROSS IN 4 YEARS THE STORY SO FAR (1Q2012 – 2015) 12 Tigana Tua Jacana 10 New Wells 2013 Average Gross 7,687 bopd ( +739%) 9 New Wells 2014 Average Gross 18,364 bopd ( +138%) 4 New Wells 2015 Average Gross 26,447 bopd ( +44%) 4 New Wells 2012 Average Gross 9 14 bopd 25 MMbbl Gross Cumulative Production ( 2012 - 1H2016 )
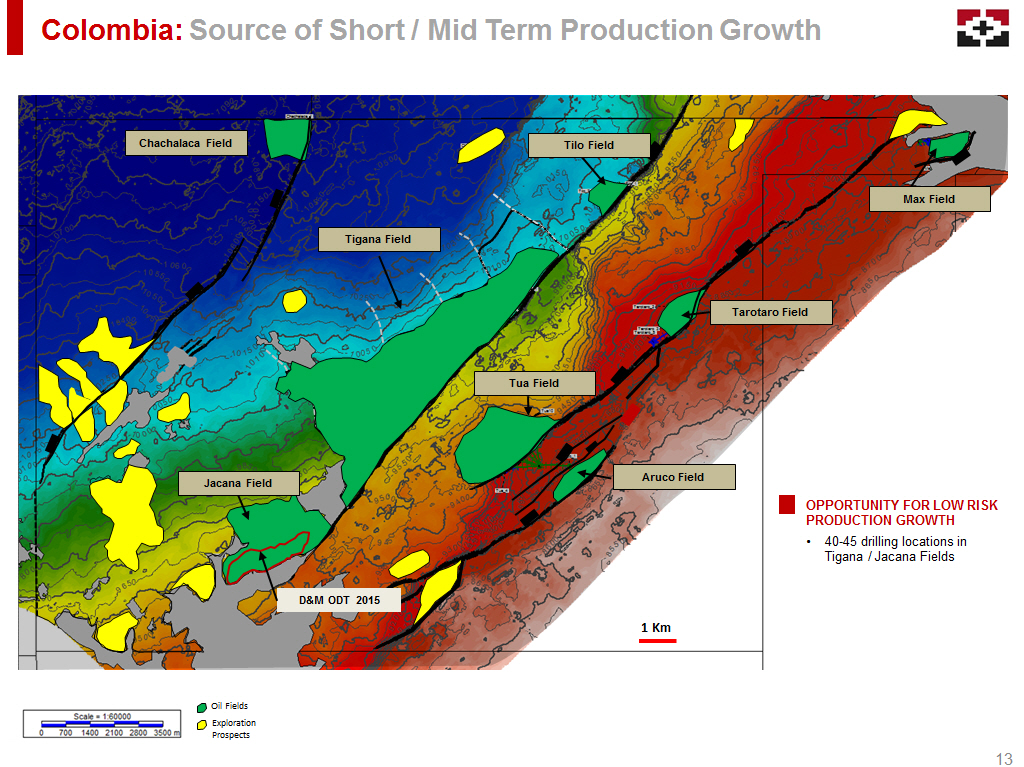
Colombia: Source of Short / Mid Term Production Growth Tigana Field 1 Km Jacana Field Aruco Field Max Field Tarotaro Field Tua Field Tilo Field Chachalaca Field D&M ODT 2015 • 40 - 45 drilling locations in Tigana / Jacana Fields OPPORTUNITY FOR LOW RISK PRODUCTION GROWTH 13 Oil Fields Exploration Prospects

Colombia : Tigana / Jacana Fields Quality Differentiators PRODUCTION PROFILES IN LLANOS 34 BLOCK • Large fields ( Tigana / Jacana / Tua ) represent 80% of Llanos 34 Block production • Conventional oil wells in large fields have moderate water - cut increase • Big inventory of wells to increase production, with >500% IRRs and 9 months paybacks at $40 /bbl oil price TIGANA / JACANA FIELDS GROSS PRODUCTION (BOPD ) 14 TIGANA / JACANA FIELDS KEY FEATURES • Full field appraisal and delineation still to be completed • Very attractive reservoir quality: 20 - 25% porosity; 0.5 - 2.0 Darcy permeability • 5% production decline experienced to date. Water encroachment of less than 25% after 10 MMbbl already produced (Dec 2013 - 2Q2016) • Low OPEX of $ 3 /bbl • Estimated average per well recovery of 1.5 - 2.5 MMbbl (some wells have already accumulated >2 MMbbl to date) 0 2 4 6 8 10 12 14 16 18 20 0 2,000 4,000 6,000 8,000 10,000 12,000 14,000 Dec-13 Aug-16 Apr-16 Dec-16 Aug-16 Well Count (BFPD) 7 wells on production Discovered in Dec - 2013 TIGANA 0 2 4 6 8 10 12 14 16 18 20 0 2,000 4,000 6,000 8,000 10,000 aug-15 Nov-15 Feb-16 May-16 Aug-16 Well Count Production (bbl/d) Water Production (bbl/d) Well Count Aug - 15 JACANA (BFPD) Discovered in Aug - 2015 5 wells on production Aug - 14 Apr - 15 Dec - 15
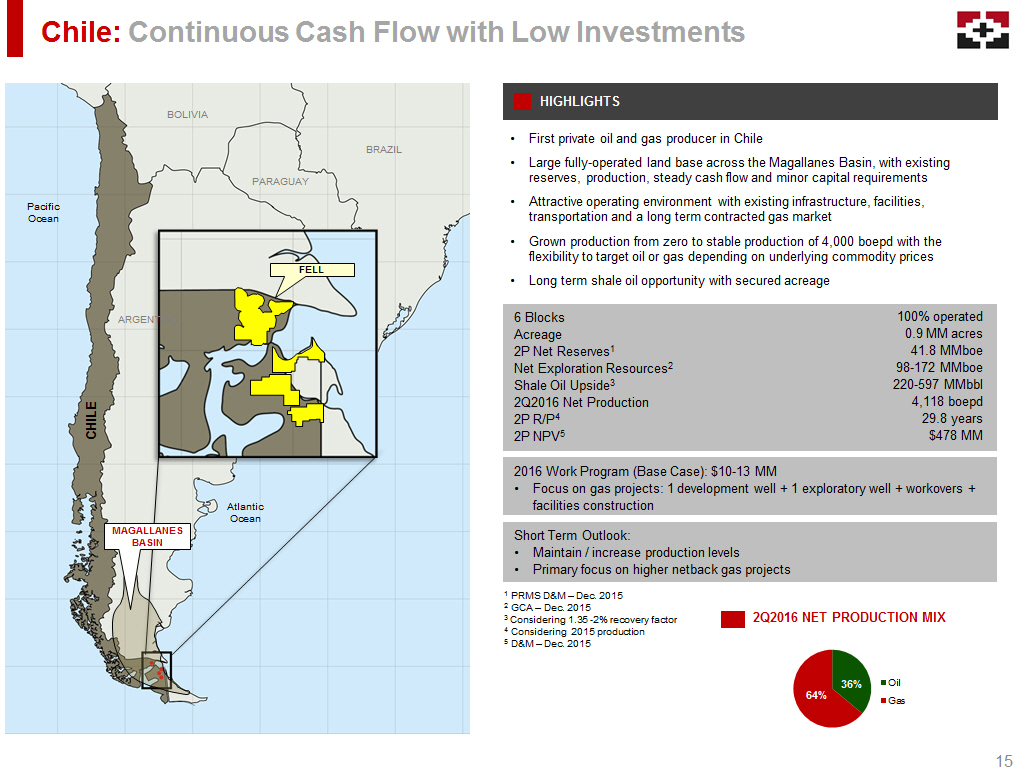
Chile: Continuous Cash Flow with Low Investments • First private oil and gas producer in Chile • Large fully - operated land base across the Magallanes Basin , with existing reserves, production, steady cash flow and minor capital requirements • Attractive operating environment with existing infrastructure, facilities, transportation and a long term contracted gas market • Grown production from zero to stable production of 4,000 boepd with the flexibility to target oil or gas depending on underlying commodity prices • Long term shale oil opportunity with secured acreage 6 Blocks Acreage 2P Net Reserves 1 Net Exploration Resources 2 Shale Oil Upside 3 2Q2016 Net Production 2P R/P 4 2P NPV 5 100% operated 0.9 MM acres 41.8 MMboe 98 - 172 MMboe 220 - 597 MMbbl 4,118 boepd 29.8 years $478 MM 2016 Work Program (Base Case): $10 - 13 MM • Focus on gas projects: 1 development well + 1 exploratory well + workovers + facilities construction 1 PRMS D&M – Dec. 2015 2 GCA – Dec. 2015 3 Considering 1.35 - 2% recovery factor 4 Considering 2015 production 5 D&M – Dec. 2015 2Q2016 NET PRODUCTION MIX Short Term Outlook: • Maintain / increase production levels • Primary focus on higher netback gas projects 36% 64% Oil Gas CHILE FELL MAGALLANES BASIN Pacific Ocean Atlantic Ocean BRAZIL PARAGUAY ARGENTINA BOLIVIA 15 HIGHLIGHTS
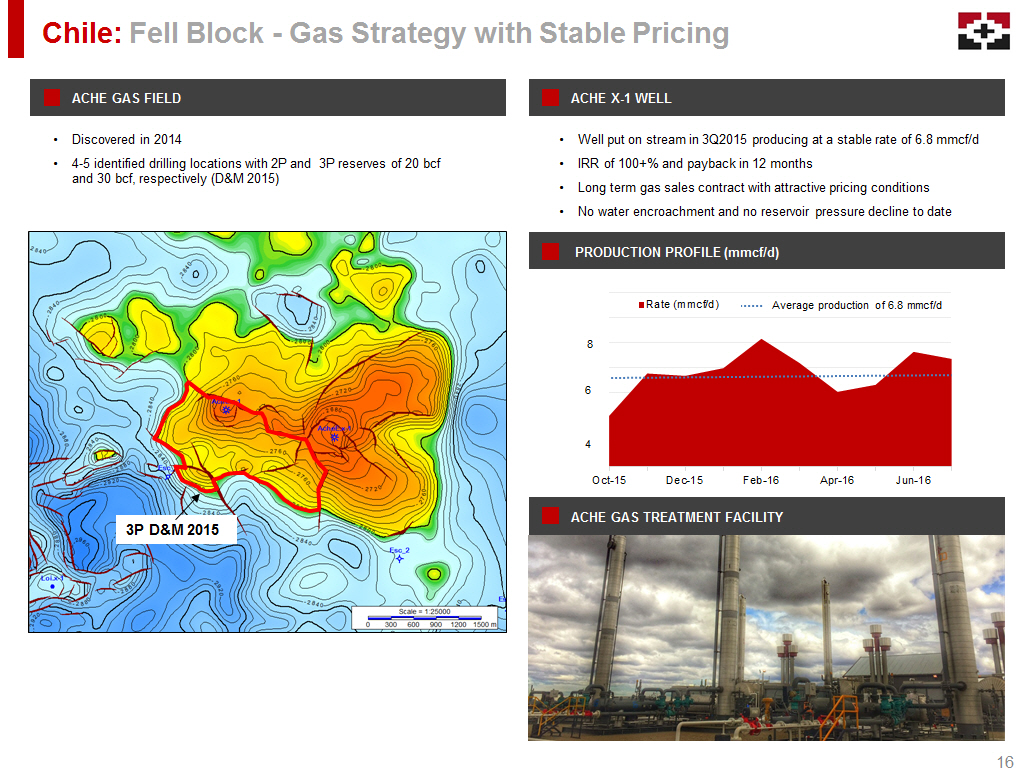
ACHE X - 1 WELL Chile: Fell Block - Gas Strategy with Stable Pricing • Discovered in 2014 • 4 - 5 identified drilling locations with 2P and 3P reserves of 20 bcf and 30 bcf, respectively ( D&M 2015 ) • Well put on stream in 3Q2015 producing at a stable rate of 6.8 mmcf/d • IRR of 100 +% and payback in 12 months • Long term gas sales contract with attractive pricing conditions • No water encroachment and n o reservoir pressure decline to date 16 Introduced new gas treating technology to Chile PRODUCTION PROFILE (mmcf/d) ACHE GAS FIELD ACHE GAS TREATMENT FACILITY 3,000 4,000 5,000 6,000 7,000 8,000 9,000 10,000 Oct-15 Dec-15 Feb-16 Apr-16 Jun-16 Rate (mmcf/d) Average production of 6.8 mmcf / d 3P D&M 2015 8 6 4
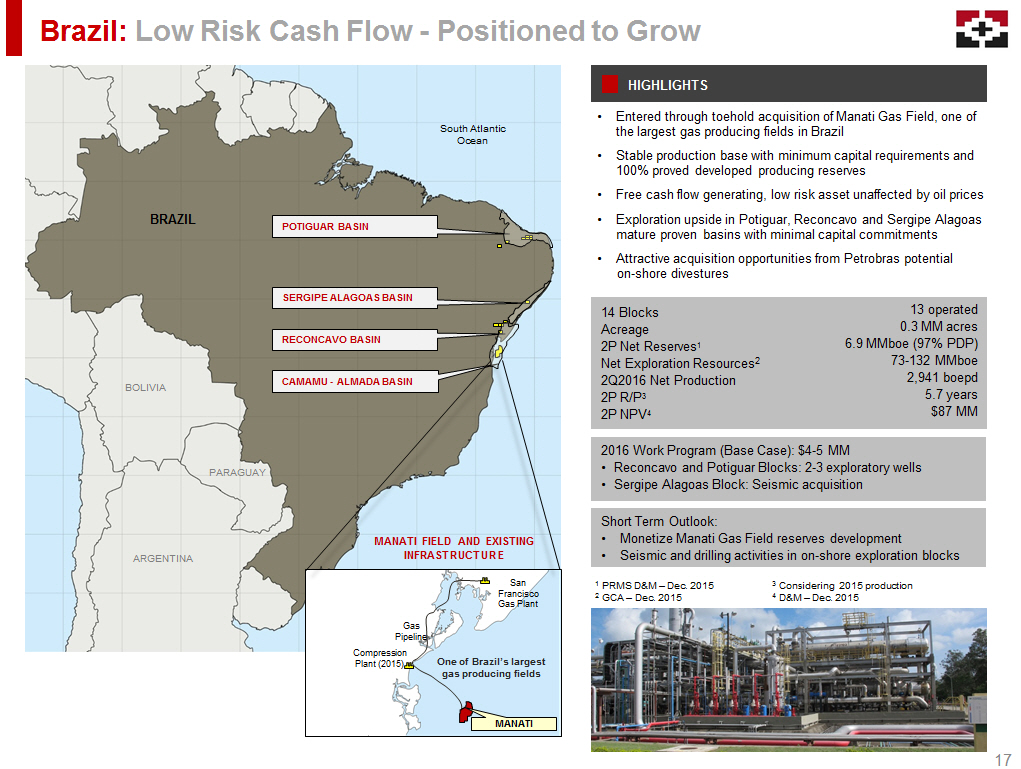
HIGHLIGHTS Brazil: Low Risk Cash Flow - Positioned to Grow • Entered through toehold acquisition of Manati Gas F ield , one of the largest gas producing fields in Brazil • Stable production base with minimum capital requirements and 100% proved developed producing reserves • Free cash flow generating, low risk asset unaffected by oil prices • Exploration upside in Potiguar, Reconcavo and Sergipe Alagoas mature proven basins with minimal capital commitments • Attractive acquisition opportunities from Petrobras potential on - shore divestures RECONCAVO BASIN POTIGUAR BASIN CAMAMU - ALMADA BASIN SERGIPE ALAGOAS BASIN South Atlantic Ocean BRAZIL MANATI FIELD AND EXISTING INFRASTRUCTURE 14 Blocks Acreage 2P Net Reserves 1 Net Exploration Resources 2 2Q2016 Net Production 2P R/P 3 2P NPV 4 13 operated 0.3 MM acres 6.9 MMboe (97% PDP) 73 - 132 MMboe 2,941 boepd 5.7 years $87 MM 2016 Work Program (Base Case): $4 - 5 MM • Reconcavo and Potiguar Blocks: 2 - 3 exploratory wells • Sergipe Alagoas Block: Seismic acquisition 1 PRMS D&M – Dec. 2015 2 GCA – Dec. 2015 3 Considering 2015 production 4 D&M – Dec. 2015 San Francisco Gas Plant Gas Pipeline One of Brazil’s largest gas producing fields Compression Plant (2015) Short Term Outlook: • Monetize Manati Gas Field reserves development • Seismic and drilling activities in on - shore exploration blocks MANATI ARGENTINA BOLIVIA PARAGUAY 17
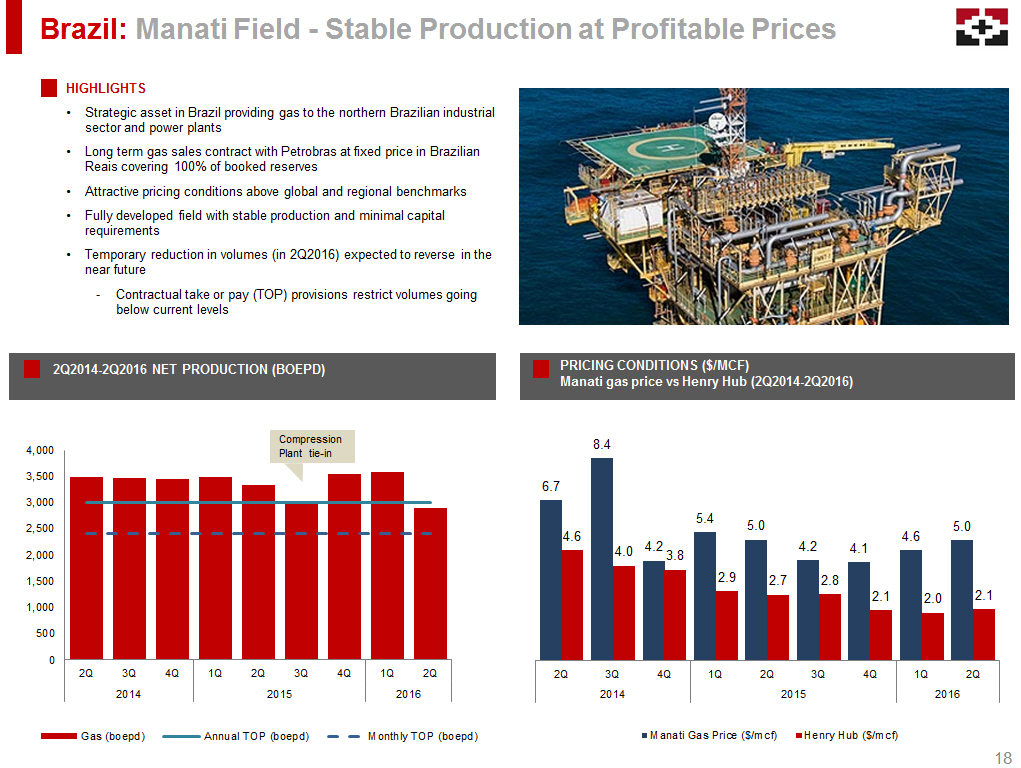
Brazil: Manati Field - Stable Production at Profitable Prices 18 HIGHLIGHTS • S trategic asset in Brazil providing gas to the northern B razilian industrial sector and power plants • Long term gas sales contract with Petrobras at fixed price in Brazilian Reais covering 100% of booked reserves • Attractive pricing conditions above global and regional benchmarks • Fully developed field with stable production and minimal capital requirements • Temporary reduction in volumes (in 2Q2016) expected to reverse in the near future - Contractual take or pay (TOP) provisions restrict volumes going below current levels 2Q2014 - 2Q2016 NET PRODUCTION (BOEPD) PRICING CONDITIONS ($/MCF) Manati gas price vs Henry Hub (2Q2014 - 2Q2016) Compression Plant tie - in 0 500 1,000 1,500 2,000 2,500 3,000 3,500 4,000 2Q 3Q 4Q 1Q 2Q 3Q 4Q 1Q 2Q 2014 2015 2016 Gas (boepd) Annual TOP (boepd) Monthly TOP (boepd) 6.7 8.4 4.2 5.4 5.0 4.2 4.1 4.6 5.0 4.6 4.0 3.8 2.9 2.7 2.8 2.1 2.0 2.1 2Q 3Q 4Q 1Q 2Q 3Q 4Q 1Q 2Q 2014 2015 2016 Manati Gas Price ($/mcf) Henry Hub ($/mcf)
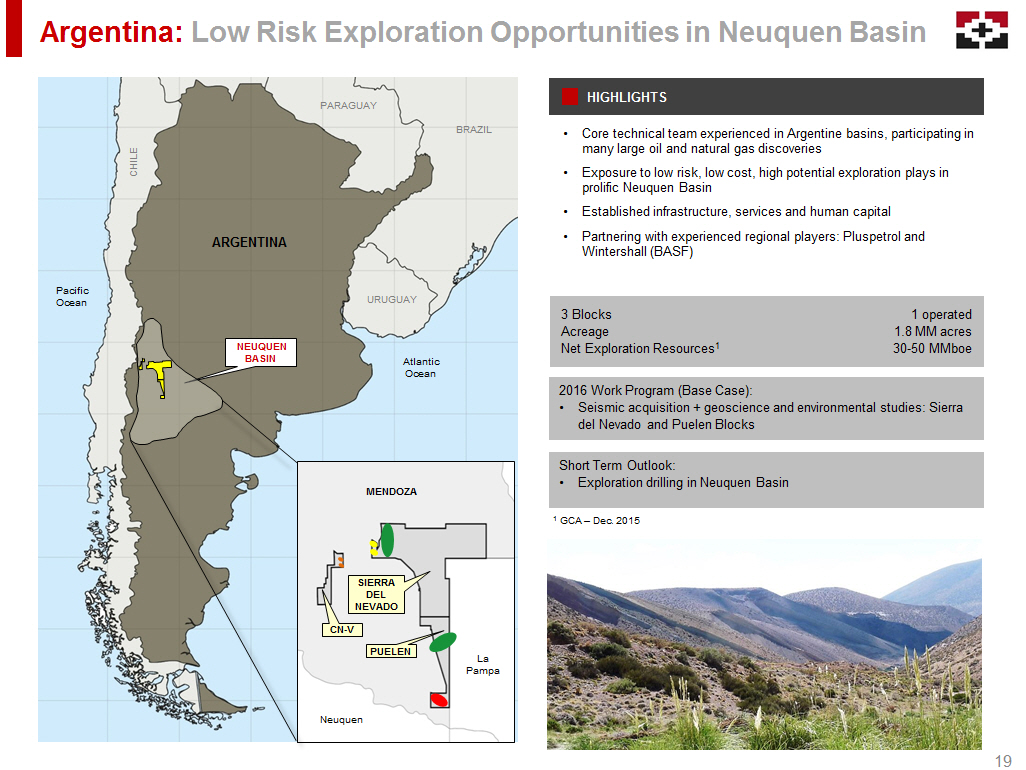
HIGHLIGHTS Argentina: Low Risk Exploration Opportunities in Neuquen Basin Atlantic Ocean Pacific Ocean ARGENTINA NEUQUEN BASIN MENDOZA La Pampa Neuquen CN - V PUELEN SIERRA DEL NEVADO URUGUAY CHILE BRAZIL PARAGUAY • C ore technical team experienced in Argentine basins , participating in many large oil and natural gas discoveries • Exposure to low risk, low cost, high potential exploration plays in prolific Neuquen Basin • Established infrastructure, services and human capital • Partnering with experienced regional players: Pluspetrol and Wintershall (BASF) 2016 Work Program (Base Case): • Seismic acquisition + geoscience and environmental studies: Sierra del Nevado and Puelen Blocks Short Term Outlook: • Exploration drilling in Neuquen Basin 19 3 Blocks Acreage Net Exploration Resources 1 1 operated 1.8 MM acres 30 - 50 MMboe 1 GCA – Dec. 2015
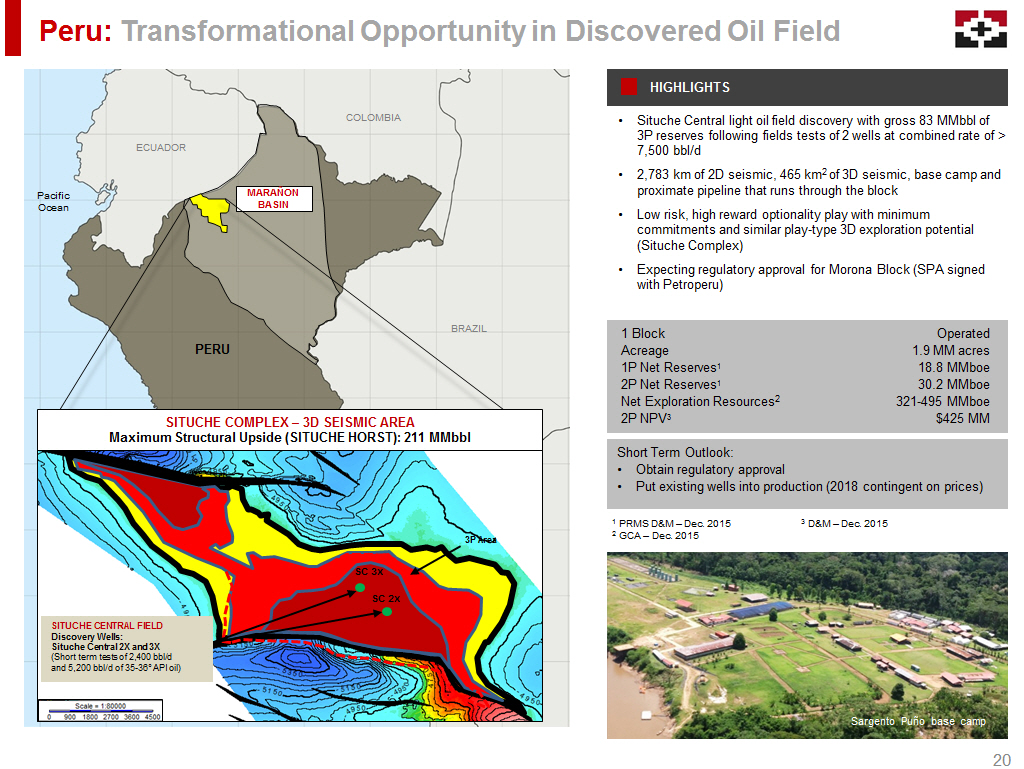
Peru: Transformational Opportunity in Discovered Oil Field MARAÑON BASIN Pacific Ocean BRAZIL COLOMBIA ECUADOR PERU BOLIVIA Sargento Puño base camp • Situche Central light oil field discovery with gross 83 MMbbl of 3P reserves following fields tests of 2 wells at combined rate of > 7,500 bbl/d • 2,783 km of 2D seismic, 465 km 2 of 3D seismic, base camp and proximate pipeline that runs through the block • Low risk, high reward optionality play with minimum commitments and similar play - type 3D exploration potential (Situche Complex) • Expecting regulatory approval for Morona Block (SPA signed with Petroperu ) 1 Block Acreage 1P Net Reserves 1 2P Net Reserves 1 Net Exploration Resources 2 2P NPV 3 Operated 1.9 MM acres 18.8 MMboe 30.2 MMboe 321 - 495 MMboe $425 MM 1 PRMS D&M – Dec. 2015 2 GCA – Dec. 2015 3 D&M – Dec. 2015 Short Term Outlook: • Obtain regulatory approval • Put existing wells into production ( 2018 contingent on prices) 20 HIGHLIGHTS 2P Area SITUCHE CENTRAL FIELD Discovery Wells: Situche Central 2X and 3X (Short term tests of 2,400 bbl/d and 5,200 bbl/d of 35 - 36 ƒ API oil) 3P Area SC 2 X SC 3 X SITUCHE COMPLEX – 3D SEISMIC AREA Maximum Structural Upside (SITUCHE HORST): 211 MMbbl
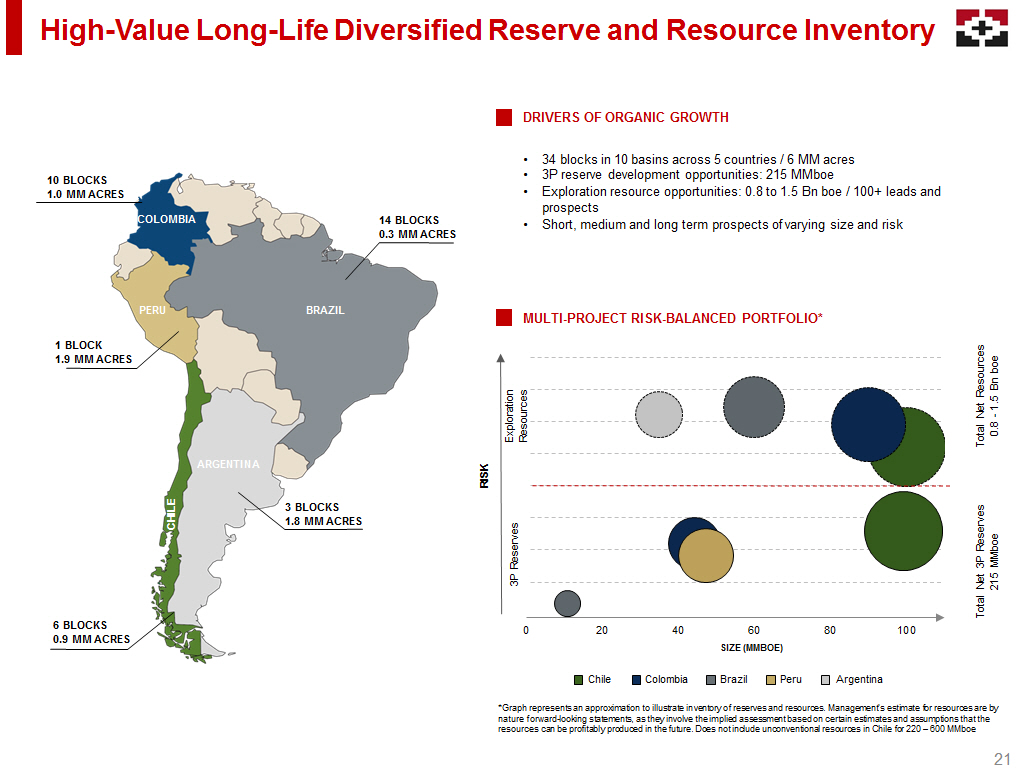
High - Value Long - Life Diversified Reserve and Resource Inventory *Graph represents an approximation to illustrate inventory of reserves and resources. Management’s estimate for resources are by nature forward - looking statements, as they involve the implied assessment based on certain estimates and assumptions that the resources can be profitably produced in the future . Does not include unconventional resources in Chile for 220 – 600 MMboe MULTI - PROJECT RISK - BALANCED PORTFOLIO* DRIVERS OF ORGANIC GROWTH • 34 blocks in 10 basins across 5 countries / 6 MM acres • 3P reserve development opportunities: 215 MMboe • Exploration resource opportunities: 0.8 to 1.5 Bn boe / 100+ leads and prospects • Short, medium and long term prospects of varying size and risk 0 20 40 60 80 100 Total Net Resources 0.8 - 1.5 Bn boe Total Net 3P Reserves 215 MMboe 108 Exploration Resources 3P Reserves RISK SIZE (MMBOE) Chile Colombia Brazil Peru Argentina 14 BLOCKS 0.3 MM ACRES ARGENTINA CHILE BRAZIL PERU 3 BLOCKS 1.8 MM ACRES 6 BLOCKS 0.9 MM ACRES 1 BLOCK 1.9 MM ACRES 10 BLOCKS 1.0 MM ACRES COLOMBIA 21
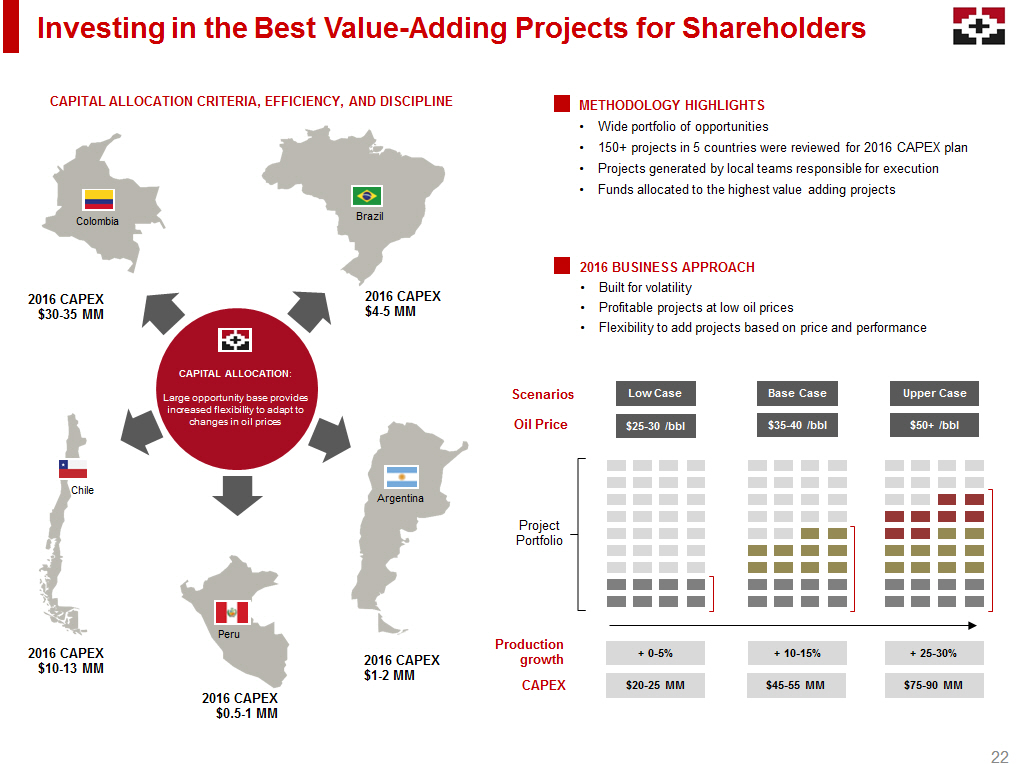
Investing in the Best Value - Adding Projects for Shareholders Colombia Brazil Chile Peru Argentina CAPITAL ALLOCATION : Large opportunity base provides increased flexibility to adapt to changes in oil prices 2016 CAPEX $30 - 35 MM 2016 CAPEX $4 - 5 MM 2016 CAPEX $0.5 - 1 MM 2016 CAPEX $1 - 2 MM 2016 CAPEX $10 - 13 MM CAPITAL ALLOCATION CRITERIA, EFFICIENCY, AND DISCIPLINE METHODOLOGY HIGHLIGHTS • Wide portfolio of opportunities • 150+ projects in 5 countries were reviewed for 2016 CAPEX plan • Projects generated by local teams responsible for execution • Funds allocated to the highest value adding projects 2016 BUSINESS APPROACH • Built for volatility • Profitable projects at low oil prices • Flexibility to add projects based on price and performance Project Portfolio $20 - 25 MM $45 - 55 MM $75 - 90 MM $25 - 30 /bbl $35 - 40 /bbl $50+ /bbl + 0 - 5% + 10 - 15% + 25 - 30% Production growth Oil Price CAPEX Low Case Base Case Upper Case Scenarios 22
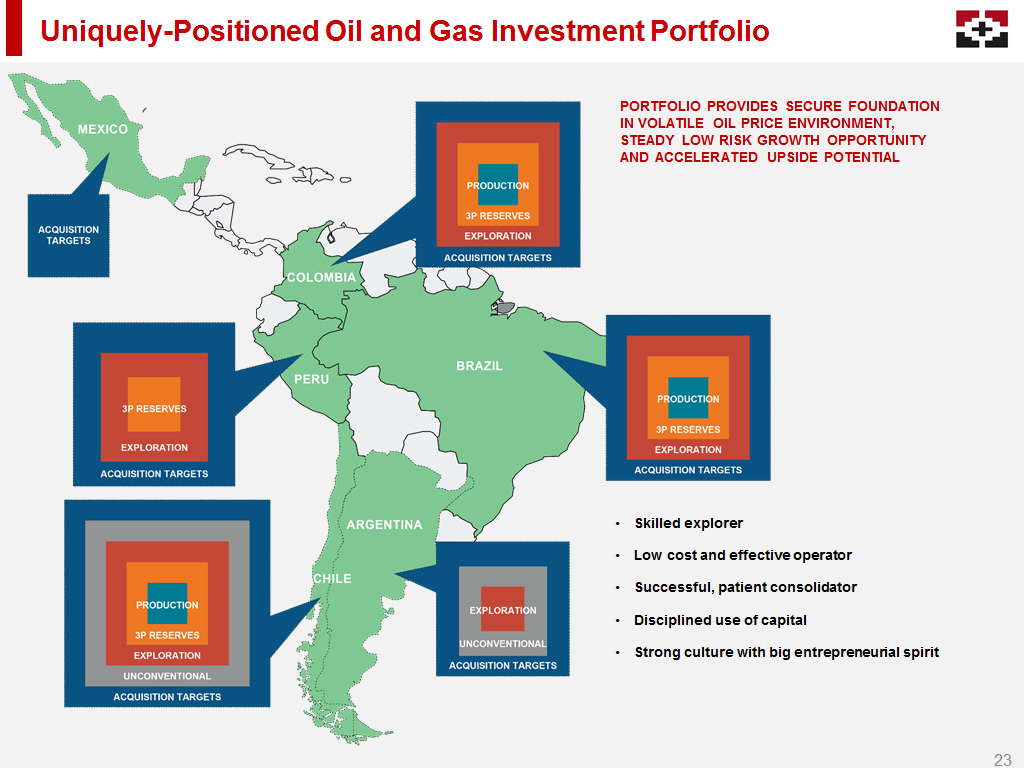
Uniquely - Positioned Oil and Gas Investment Portfolio • Skilled explorer • Low cost and effective operator • Successful, patient consolidator • Disciplined use of capital • Strong culture with big entrepreneurial spirit PORTFOLIO PROVIDES SECURE FOUNDATION IN VOLATILE OIL PRICE ENVIRONMENT, STEADY LOW RISK GROWTH OPPORTUNITY AND ACCELERATED UPSIDE POTENTIAL 23
Disclaimer The material that follows comprises information about GeoPark Limited (“GeoPark” or the “Company”) and its subsidiaries, as of the date of the presentation. It has been prepared solely for informational purposes and should not be treated as giving legal, tax, investment or other advice to potential investors. The information presented or contained herein is in summary form and does not purport to be complete. No representations or warranties, express or implied, are made as to, and no reliance should be placed on, the accuracy, fairness, or completeness of this information. Neither GeoPark nor any of its affiliates, advisers or representatives accepts any responsibility whatsoever for any loss or damage arising from any information presented or contained in this presentation. The information presented or contained in this presentation is current as of the date hereof and is subject to change without notice, and its accuracy is not guaranteed. Neither GeoPark nor any of its affiliates, advisers or representatives makes any undertaking to update any such information subsequent to the date hereof. This presentation contains forward - looking statements, which are based upon GeoPark and/or its management’s current expectations and projections about future events. When used in this presentation, the words “believe,” “anticipate,” “intend,” “estimate,” “expect,” “should,” “may” and similar expressions, or the negative of such words and expressions, are intended to identify forward - looking statements, although not all forward - looking statements contain such words or expressions. Additionally, all information, other than historical facts included in this presentation, regarding strategy, future operations, drilling plans, estimated reserves, estimated resources, future production, estimated capital expenditures, projected costs, the potential of drilling prospects and other plans and objectives of management is forward - looking information. Such statements and information are subject to a number of risks, uncertainties and assumptions. Forward - looking statements are not guarantees of future performance and actual results may differ materially from those anticipated due to many factors, including oil and natural gas prices, industry conditions, drilling results, uncertainties in estimating reserves and resources, availability and cost of drilling rigs, production equipment, supplies, personnel and oil field services, availability of capital resources and other factors. As for forward - looking statements that relate to future financial results and other projections, actual results may be different due to the inherent uncertainty of estimates, forecasts and projections. Because of these uncertainties, potential investors should not rely on these forward - looking statements. Neither GeoPark nor any of its affiliates, directors, officers, agents or employees, nor any of the shareholders or under shall be liable, in any event, before any third party (including investors) for any investment or business decision made or action taken in reliance on the information and statements contained in this presentation or for any consequential, special or similar damages. Statements related to resources are deemed forward - looking statements as they involve the implied assessment, based on certain estimates and assumptions, that the resources will be discovered and can be profitably produced in the future. Specifically, forward - looking information contained herein regarding "resources" may include: estimated volumes and value of the Company's oil and gas resources and the ability to finance future development; and, the conversion of a portion of resources into reserves. The information included in this presentation regarding estimated quantities of proved reserves in Chile, Colombia, Brazil, and Peru as of December 31, 2015; are derived, in part, from the reports prepared by DeGolyer and MacNaughton , or D&M, independent reserves engineers. Certified reserves refers to net reserves independently evaluated by the petroleum consulting firm, D&M. Certain reserves data, such as those based on the D&M report, were prepared under SEC standards, and certain other data were prepared under Petroleum Resources Management System (PRMS) standards. The information included in this presentation regarding estimated exploration resources in Chile, Colombia, Brazil, and Peru as of December 31, 2015; are derived, in part, from the reports prepared by Gaffney, Cline & Associates, or GCA. The accuracy of any resource estimate is a function of the quality of the available data and of engineering and geological interpretation. Results of drilling, testing and production that postdate the preparation of the estimates may justify revisions, some or all of which may be material. Accordingly, resource estimates are often different from the quantities of oil and gas that are ultimately recovered, and the timing and cost of those volumes that are recovered may vary from that assumed. Prospective Resources are those quantities of petroleum that are estimated, as of a given date, to be potentially recoverable from undiscovered accumulations by application of future development projects. Prospective Resources have both an associated “chance of discovery” and a “chance of development” (per PRMS). Prospective Resources are further subdivided in accordance with the level of certainty associated with recoverable estimates, assuming their discovery and development, and may be sub - classified based on project maturity. There is no certainty that any portion of the Prospective Resources will be discovered. If discovered, there is no certainty that it will be commercially viable to produce any portion of the resources. Prospective Resource volumes are presented as unrisked . The risk or chance of finding a minimum hydrocarbon volume that can flow to surface is presented as Geological Chance of Success ( GCoS ). Certain data in this presentation was obtained from various external sources, and neither GeoPark nor its affiliates, advisers or representatives has verified such data with independent sources. Accordingly, neither GeoPark nor any of its affiliates, advisers or representatives makes any representations as to the accuracy or completeness of that data, and such data involves risks and uncertainties and is subject to change based on various factors. This presentation contains a discussion of Adjusted EBITDA, which is not an IFRS measure. We define Adjusted EBITDA as profit for the period before net finance cost, income tax, depreciation, amortization and certain non - cash items such as impairments and write - offs of unsuccessful exploration and evaluation assets, accrual of stock options and stock awards and bargain purchase gain on acquisition of subsidiaries. Adjusted EBITDA is included in this presentation because it is a measure of our operating performance and our management believes that Adjusted EBITDA is useful to investors because it is frequently used by securities analysts, investors and other interested parties in their evaluation of the operating performance of companies in industries similar to ours. Adjusted EBITDA should not be considered a substitute for financial information presented or prepared in accordance with IFRS. Adjusted EBITDA, as determined and measured by us, should also not be compared to similarly titled measures reported by other companies. Rounding amounts and percentages: Certain amounts and percentages included in this document have been rounded for ease of presentation. Percentage figures included in this document have not in all cases been calculated on the basis of such rounded figures but on the basis of such amounts prior to rounding. For this reason, certain percentage amounts in this document may vary from those obtained by performing the same calculations using the figures in the financial statements. In addition, certain other amounts that appear in this document may not sum due to rounding. 24
CONTACTS Santiago, Chile Nuestra Señora de los Ángeles 179, Las Condes, Santiago, Chile Phone: +(56 2) 2242 9600 Email: ir@geo - park.com James F. Park Chief Executive Officer Andres Ocampo Chief Financial Officer Pablo Ducci Capital Markets Dolores Santamarina Investor Manager Company Directory 26

SIGNATURE
Pursuant to the requirements of the Securities Exchange Act of 1934, the registrant has duly caused this report to be signed on its behalf by the undersigned, thereunto duly authorized.
| GeoPark Limited | |||||
| By: | /s/ Andrés Ocampo | ||||
| Name: | Andrés Ocampo | ||||
| Title: | Chief FinancialOfficer | ||||
Date: September 6, 2016