UNITED STATES
SECURITIES AND EXCHANGE COMMISSION
Washington, D.C. 20549
SECURITIES AND EXCHANGE COMMISSION
Washington, D.C. 20549
FORM N-CSR
CERTIFIED SHAREHOLDER REPORT OF REGISTERED
MANAGEMENT INVESTMENT COMPANIES
Investment Company Act file number 811-22310
ETF Managers Trust
(Exact name of registrant as specified in charter)
(Exact name of registrant as specified in charter)
30 Maple Street, Suite 2
Summit, NJ 07901
(Address of principal executive offices) (Zip code)
(Address of principal executive offices) (Zip code)
U.S. Bancorp Fund Services, LLC
615 East Michigan Street
Milwaukee, WI 53202
(Name and address of agent for service)
(Name and address of agent for service)
(908)-897-0518
Registrant’s telephone number, including area code
Date of fiscal year end: September 30, 2017
Date of reporting period: September 30, 2017
Item 1. Reports to Stockholders.

Annual Report
September 30, 2017
ETFMG Prime Junior Silver ETF
Ticker: SILJ
ETFMG Prime Cyber Security ETF
Ticker: HACK
ETFMG Prime Mobile Payments ETF
Ticker: IPAY
ETFMG Drone Economy Strategy ETF
Ticker: IFLY
ETFMG Video Game Tech ETF
Ticker: GAMR
The Funds are individual series of ETF Managers Trust.
ETFMG™ ETFs
TABLE OF CONTENTS
September 30, 2017
September 30, 2017
| Page | |
| 2 | |
| 4 | |
| 14 | |
| 17 | |
| 18 | |
| 33 | |
| 34 | |
| 35 | |
| 40 | |
| 45 | |
| 58 | |
| 59 | |
| 66 | |
| 69 | |
| 71 | |
| 73 | |
| 74 | |
| 74 | |
| 75 |
1
ETFMG™ ETFs
Thank you for your interest in ETFMG Funds. The year ended September 30, 2017 marked a year of good performance for our four technology focused ETFs, the ETFMG Prime Cyber Security ETF (HACK); ETFMG Prime Mobile Payments ETF (IPAY); ETFMG Video Game Tech ETF (GAMR) and ETFMG Drone Economy Strategy ETF (IFLY), while the ETFMG Prime Junior Silver ETF (SILJ) performed negatively for the year.
During the year ended September 30, 2017, the S&P 500 Information Technology Sector Index, a broad measure of US listed technology companies, increased 28.88%. During the same period, the S&P Global 1200 Information Technology Sector Index, a broad measure of global technology companies, increased 30.73%. The fiscal year 2017 has been a period of strong performance for the broad technology sector. Two of the funds – GAMR and IFLY –outperformed both benchmarks, while a third (IPAY) outperformed the S&P 500 Information Technology Sector Index.
For all of the funds, the primary difference between fund returns and index returns were primarily the expenses of the funds, which are not part of the indexes that each of the funds track. On August 1, 2017, HACK, IPAY and SILJ began tracking new indexes developed by Prime Indexes (www.primeindexes.com).
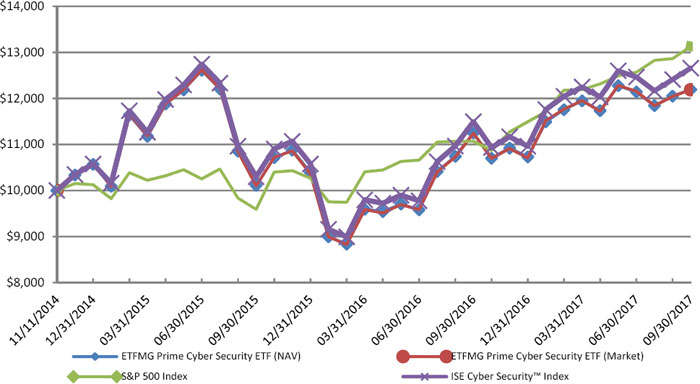
The NAV return for HACK over the full year ended September 30, 2017 was 8.42%. HACK began tracking a new index on August 1, 2017. Over the period from October 1, 2016 to July 31, 2017, the Fund NAV return for HACK was 5.30%. The index HACK tracked over the period, the ISE Cyber Security Index, posted a 5.91% increase. On August 1, 2017, HACK began tracking the Prime Cyber Defense Index (“Prime Cyber Index”), which increased 2.11% over the two-month period from August 1, 2017 to September 30, 2017. The Fund NAV return for HACK over the same two-month period was 2.05%, in line with the positive performance of the Prime Cyber Index. The best performing stocks in the Fund during the year ended September 30, 2017 were Sophos (up 112.22%), Mimecast (up 47.41%) and Check Point Software (up 46.99%). The worst performing stocks during the period were MobileIron (down -41.73%), Precise Biometrics (down -40.65%) and Vasco Data Security (down -33.09%).
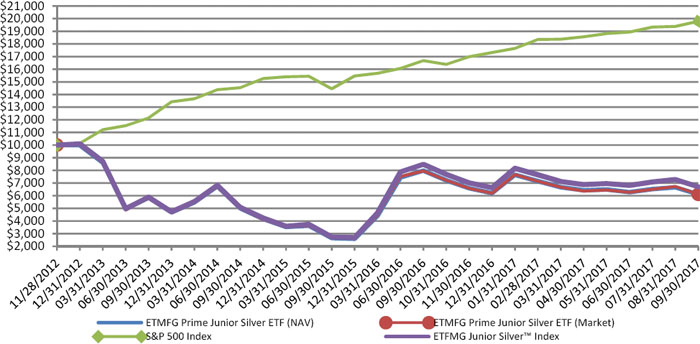
The NAV return for SILJ over the full year ended September 30, 2017 was down -23.53%. SILJ began tracking a new index on August 1, 2017. Over the period from October 1, 2016 to July 31, 2017, the Fund NAV return for SILJ was -18.29%. The index SILJ tracked over the period, the ISE Junior Silver Index, posted negative performance of -15.35%. On August 1, 2017, SILJ began tracking the Prime Junior Silver Miners & Explorers Index (“Prime Silver Index”), which posted negative performance of -5.55% over the two-month period from August 1, 2017 to September 30, 2017. The Fund NAV return for SILJ over the same two-month was negative -6.18%, in line with the negative performance of the Prime Silver Index. The total NAV return for the Fund over the full Fiscal Year was negative -23.53%. The best performing stocks in the Fund during the year ended September 30, 2017 were Cautivo Mining (up 252.72%), Sierra Metals (up 84.17%), and Sabina Gold & Silver (up 69.44%). The worst performing stocks during the period were Santa Cruz Silver Mining (down -60.46%), Mandalay Resources (down -59.67%), and Endeavour Mining (down -52.68%).
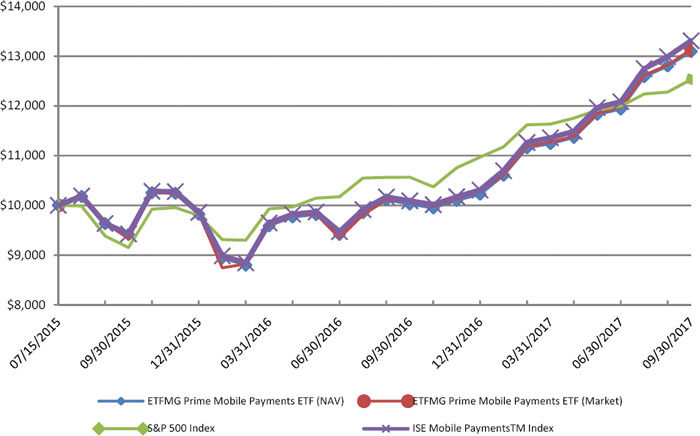
The NAV return for IPAY over the full year ended September 30, 2017 was 30.59%. IPAY began tracking a new index on August 1, 2017. Over the period from October 1, 2016 to July 31, 2017, the Fund NAV return for IPAY was 25.54%. The index IFLY tracked over the period, the ISE Mobile Payments Index, posted positive performance of 26.12%. On August 1, 2017, IPAY began tracking the Prime Mobile Payments Index (“Prime Mobile Index”), which increased 3.63% over the two-month period from August 1, 2017 to September 30, 2017. The Fund NAV return for IPAY over the same two-month period was 3.49%, in line with the positive performance of the Prime Mobile Index. The best performing stocks during the year ended September 30, 2017 were Square (up 146.87%), MoneyGram International (up 144.25%), and Green Dot Corporation (up 114.91%). The worst performing stocks during the period were CPI Card Group (down -81.89%), Pax Global Technology (down -27.58%), and Fleetcor (down -10.95%).
2
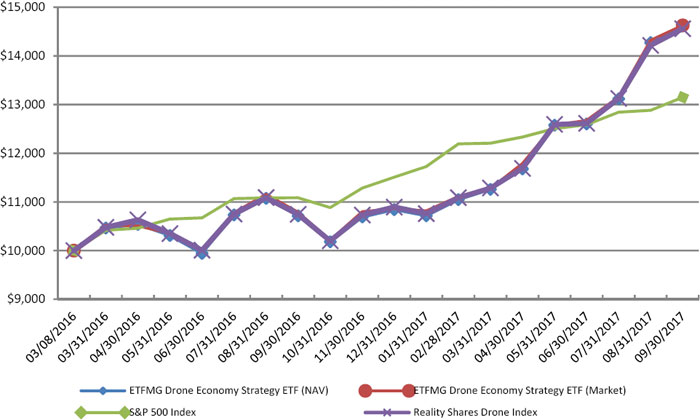
The Fund NAV return for IFLY for the year ended September 30, 2017 was 36.39%, in line with the performance of its index, the Reality Shares Drone Index, which increased 35.64%. The best performing stocks were Aselsan (up 137.12%), Aerovironment (up 120.54%), and IXYS Corporation (up 97.99%). The worst performing stocks during the year were Korea Aerospace Industries (down -44.30%), GoPro (down -34.23%), and Ambarella (down -33.69%).
The Fund NAV return for GAMR for the year was 37.67%, in line with the performance of the index, the EEFund Video Game Tech Index, which increased 38.56%. The best performing stocks during the year were Nvidia (up 162.38%), Take-Two Interactive (up 126.37%), and Advanced Micro Devices (up 83.45%). The worst performing stocks during the year ended September 30, 2017 were Jakks Pacific (down -55.43%), Mattel (down -46.94%), and DeNA Co. (down -37.28%).
On behalf of ETFMG and our industry leading partners, I would like to thank you for your continued interest in ETFMG and our unique suite of ETFs. We endeavor to provide our investors with new and innovative products and look forward to continuing this for years to come.
You can find further details about GAMR, HACK, IFLY, IPAY and SILJ by visiting www.etfmgfunds.com, or by calling 1-844-ETF-MGRS.
Sincerely,

Samuel Masucci III
Chairman of the Board
Chairman of the Board
Samuel Masucci III is a registered representative of ETFMG Financial, LLC.
3
| Since | |||||||||
| Average Annual Returns | 1 Year | 3 Year | Inception | ||||||
| Period Ended September 30, 2017 | Return | Return | (11/29/12) | ||||||
| ETFMG Prime Junior Silver ETF (NAV) | -23.53 | % | 6.83 | % | -9.71 | % | |||
| ETFMG Prime Junior Silver ETF (Market) | -23.21 | % | 6.75 | % | -9.69 | % | |||
| S&P 500 Index | 18.61 | % | 10.81 | % | 15.15 | % | |||
Prime Junior Silver (Small Cap Miners/Explorers)TM Index | -21.00 | % | 9.75 | % | -7.92 | % | |||
Total Fund Operating Expenses1 | 0.69 | % | |||||||
1. The expense ratio is taken from the Fund’s most recent prospectus dated September 8, 2017.
Performance data quoted represents past performance and does not guarantee future results. The investment return and principal value of an investment will fluctuate so that an investor’s shares, when redeemed, may be worth more or less than their original cost. Current performance of the Fund may be lower or higher than the performance quoted. All performance is historical and includes reinvestment of dividends and capital gains, if any. Performance data current to the most recent month end may be obtained by calling 1-844- ETF-MGRS (1-844-383-6477).
The chart illustrates the performance of a hypothetical $10,000 investment made on November 29, 2012, and is not intended to imply any future performance. The returns shown do not reflect the impact of taxes that a shareholder would pay on fund distributions from the sale of Fund shares. The chart assumes reinvestment of capital gains and dividends, if any. The unmanaged indices do not reflect fees and are not available for direct investment.
4
ETFMG Prime Junior Silver ETF
Top Ten Holdings*
| Security | % of Total Investments† | ||||
| 1 | Coeur Mining, Inc. | 13.15% | |||
| 2 | Hecla Mining Co. | 12.71% | |||
| 3 | Pan American Silver Corporation | 12.04% | |||
| 4 | Hochschild Mining PLC | 11.00% | |||
| 5 | First Majestic Silver Corp. | 4.68% | |||
| 6 | Hudbay Minerals, Inc. | 4.59% | |||
| 7 | Tahoe Resources, Inc. | 4.55% | |||
| 8 | MAG Silver Corporation | 4.35% | |||
| 9 | Yamana Gold, Inc. | 4.23% | |||
| 10 | Silvercorp Metals, Inc. | 3.70% | |||
Top Ten Holdings =75.00% of Total Investments†
* Current portfolio holdings may not be indicative of future Fund holdings.
† Percentage of total investments less cash.
5
ETFMG Prime Cyber Security ETF
Growth of $10,000
| Average Annual Returns | 1 Year | Since Inception | ||||
| Period Ended September 30, 2017 | Return | (11/11/14) | ||||
| ETFMG Prime Cyber Security ETF (NAV) | 8.42 | % | 7.11 | % | ||
| ETFMG Prime Cyber Security ETF (Market) | 8.43 | % | 7.10 | % | ||
| S&P 500 Index | 18.61 | % | 9.90 | % | ||
| ISE Cyber Security™ Index | 10.17 | % | 8.51 | % | ||
Total Fund Operating Expenses1 | 0.60 | % | ||||
1. The expense ratio is taken from the Fund’s most recent prospectus dated September 8, 2017.
Performance data quoted represents past performance and does not guarantee future results may be lower or higher than the performance quoted. All performance is historical and includes reinvestment of dividends and capital gains, if any. Performance The investment return and principal value of an investment will fluctuate so that an investor’s shares, when redeemed, may be worth more or less than their original cost. Current performance of the Fund data current to the most recent month end may be obtained by calling 1-844-ETF-MGRS (1-844-383-6477).
The chart illustrates the performance of a hypothetical $10,000 investment made on November 11, 2014, and is not intended to imply any future performance. The returns shown do not reflect the impact of taxes that a shareholder would pay on fund distributions from the sale of Fund shares. The chart assumes reinvestment of capital gains and dividends, if any. The unmanaged indices do not reflect fees and are not available for direct investment.
6
ETFMG Prime Cyber Security ETF
Top Ten Holdings*
| Security | % of Total Investments† | ||||
| 1 | Science Applications International Corp. | 3.91% | |||
| 2 | Cisco Systems, Inc. | 3.86% | |||
| 3 | Akamai Technologies, Inc. | 3.82% | |||
| 4 | FireEye, Inc. | 3.78% | |||
| 5 | Juniper Networks, Inc. | 3.77% | |||
| 6 | Trend Micro, Inc. | 3.76% | |||
| 7 | Symantec Corp. | 3.74% | |||
| 8 | Sophos Group PLC | 3.74% | |||
| 9 | Check Point Software Technologies Ltd. | 3.65% | |||
| 10 | Qualys, Inc. | 3.62% | |||
Top Ten Holdings =37.65% of Total Investments†
* Current portfolio holdings may not be indicative of future Fund holdings.
† Percentage of total investments less cash.
7
ETFMG Prime Mobile Payments ETF
Growth of $10,000
| Average Annual Returns | 1 Year | Since Inception | ||||
| Period Ended September 30, 2017 | Return | (7/15/15) | ||||
| ETFMG Prime Mobile Payments ETF (NAV) | 30.59 | % | 12.97 | % | ||
| ETFMG Prime Mobile Payments ETF (Market) | 30.20 | % | 13.12 | % | ||
| S&P 500 Index | 18.61 | % | 10.75 | % | ||
ISE Mobile PaymentsTM Index | 32.00 | % | 13.81 | % | ||
Total Fund Operating Expenses1 | 0.75 | % | ||||
1. The expense ratio is taken from the Fund’s most recent prospectus dated September 8, 2017.
Performance data quoted represents past performance and does not guarantee future results. The investment return and principal value of an investment will fluctuate so that an investor’s shares, when redeemed, may be worth more or less than their original cost. Current performance of the Fund may be lower or higher than the performance quoted. All performance is historical and includes reinvestment of dividends and capital gains, if any. Performance data current to the most recent month end may be obtained by calling 1-844-ETF-MGRS (1-844-383-6477).
The chart illustrates the performance of a hypothetical $10,000 investment made on July 15, 2015, and is not intended to imply any future performance. The returns shown do not reflect the impact of taxes that a shareholder would pay on fund distributions from the sale of Fund shares. The chart assumes reinvestment of capital gains and dividends, if any. The unmanaged indices do not reflect fees and are not available for direct investment.
8
ETFMG Prime Mobile Payments ETF
Top Ten Holdings*
| Security | % of Total Investments† | ||||
| 1 | American Express Co. | 5.24% | |||
| 2 | PayPal Holdings, Inc. | 5.12% | |||
| 3 | MasterCard, Inc. | 5.03% | |||
| 4 | Visa, Inc. | 4.93% | |||
| 5 | Fidelity National Information Services, Inc. | 4.80% | |||
| 6 | Fiserv, Inc. | 4.44% | |||
| 7 | Discover Financial Services | 4.20% | |||
| 8 | First Data Corp. | 3.21% | |||
| 9 | FleetCor Technologies, Inc. | 3.09% | |||
| 10 | Global Payments, Inc. | 3.01% | |||
Top Ten Holdings =43.07% of Total Investments†
* Current Fund holdings may not be indicative of future Fund holdings.
† Percentage of total investments less cash.
9
ETFMG Drone Economy Strategy ETF
Growth of $10,000
| Average Annual Returns | 1 Year | Since Inception | ||||
| Period Ended September 30, 2017 | Return | (3/8/2016) | ||||
| ETMFG Drone Economy Strategy ETF (NAV) | 36.39 | % | 27.44 | % | ||
| ETFMG Drone Economy Strategy ETF (Market) | 35.62 | % | 27.53 | % | ||
| S&P 500 Index | 18.61 | % | 19.12 | % | ||
| Reality Shares Drone Index | 35.64 | % | 27.20 | % | ||
Total Fund Operating Expenses1 | 0.75 | % | ||||
1. The expense ratio is taken from the Fund’s most recent prospectus dated September 8, 2017.
Performance data quoted represents past performance and does not guarantee future results. The investment return and principal value of an investment will fluctuate so that an investor’s shares, when redeemed, may be worth more or less than their original cost. Current performance of the Fund may be lower or higher than the performance quoted. All performance is historical and includes reinvestment of dividends and capital gains, if any. Performance data current to the most recent month end may be obtained by calling 1-844- ETF-MGRS (1-844-383-6477).
The chart illustrates the performance of a hypothetical $10,000 investment made on March 8, 2016, and is not intended to imply any future performance. The returns shown do not reflect the impact of taxes that a shareholder would pay on fund distributions from the sale of Fund shares. The chart assumes reinvestment of capital gains and dividends, if any. The unmanaged indices do not reflect fees and are not available for direct investment.
10
ETFMG Drone Economy Strategy ETF
Top Ten Holdings*
| Security | % of Total Investments† | ||||
| 1 | Aerovironment, Inc. | 14.34% | |||
| 2 | Parrot SA | 7.96% | |||
| 3 | Boeing Co. | 4.45% | |||
| 4 | GoPro, Inc. | 3.89% | |||
| 5 | Ambarella, Inc. | 2.48% | |||
| 6 | Kratos Defense & Security Solutions, Inc. | 1.85% | |||
| 7 | L3 Technologies, Inc. | 1.71% | |||
| 8 | IXYS Corp. | 1.67% | |||
| 9 | Textron, Inc. | 1.67% | |||
| 10 | Honeywell International, Inc. | 1.63% | |||
Top Ten Holdings = 41.65% of Total Investments†
* Current Fund holdings may not be indicative of future Fund holdings.
† Percentage of total investments less cash.
11
ETFMG Video Game Tech ETF
Growth of $10,000
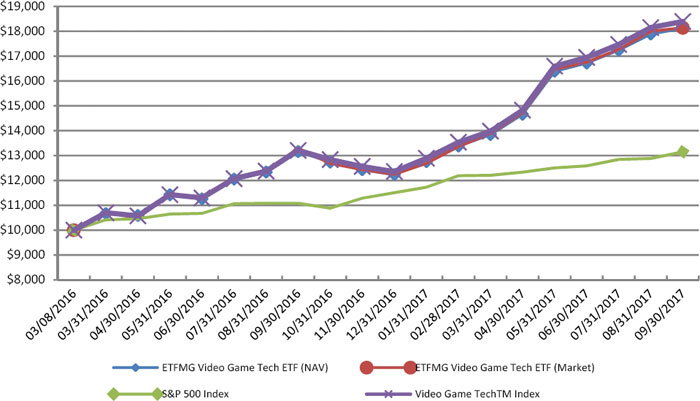
| Average Annual Returns | 1 Year | Since Inception | ||||
| Period Ended September 30, 2017 | Return | (3/8/2016) | ||||
| ETFMG Video Game Tech ETF (NAV) | 37.67 | % | 46.22 | % | ||
| ETFMG Video Game Tech ETF (Market) | 36.48 | % | 46.33 | % | ||
| S&P 500 Index | 18.61 | % | 19.12 | % | ||
EEFund Video Game TechTM Index | 38.56 | % | 47.73 | % | ||
Total Fund Operating Expenses1 | 0.75 | % | ||||
1. The expense ratio is taken from the Fund’s most recent prospectus dated September 8, 2017.
Performance data quoted represents past performance and does not guarantee future results. The investment return and principal value of an investment will fluctuate so that an investor’s shares, when redeemed, may be worth more or less than their original cost. Current performance of the Fund may be lower or higher than the performance quoted. All performance is historical and includes reinvestment of dividends and capital gains, if any. Performance data current to the most recent month end may be obtained by calling 1-844- ETF-MGRS (1-844-383-6477).
The chart illustrates the performance of a hypothetical $10,000 investment made on March 8, 2016, and is not intended to imply any future performance. The returns shown do not reflect the impact of taxes that a shareholder would pay on fund distributions from the sale of Fund shares. The chart assumes reinvestment of capital gains and dividends, if any. The unmanaged indices do not reflect fees and are not available for direct investment.
12
ETFMG Video Game Tech ETF
Top Ten Holdings*
| Security | % of Total Investments† | ||||
| 1 | Glu Mobile, Inc. | 4.92% | |||
| 2 | Nexon Co. Ltd | 4.59% | |||
| 3 | Take-Two Interactive Software, Inc. | 4.44% | |||
| 4 | Ubisoft Entertainment SA | 4.11% | |||
| 5 | Webzen, Inc. | 4.00% | |||
| 6 | NCSoft Corp. | 3.95% | |||
| 7 | Square Enix Holdings Co. Ltd | 3.93% | |||
| 8 | Nintendo Co. Ltd | 3.84% | |||
| 9 | Activision Blizzard, Inc. | 3.67% | |||
| 10 | Zynga, Inc. | 3.57% | |||
Top Ten Holdings =41.02% of Total Investments†
* Current Fund holdings may not be indicative of future Fund holdings.
† Percentage of total investments less cash.
13
ETFMG™ ETFs
Investing involves risk, including the possible loss of principal. Shares of any ETF are bought and sold at market price (not NAV), may trade at a discount or premium to NAV and are not individually redeemed from the Fund. Brokerage commissions will reduce returns. Narrowly focused investments typically exhibit higher volatility.
Past performance is no indicative of future return. A Fund’s performance for very short time periods may not be indicative of future performance.
SILJ
The ETFMG Prime Junior Silver ETF (the “Fund” or the “Junior Silver ETF”) seeks to provide investment results that, before fees and expenses, correspond generally to the price and yield performance of the Prime Junior Silver Miners & Explores Index (the “Index”).
Investments in foreign securities involve political, economic and currency risks, greater volatility and differences in accounting methods. These risks are greater for investments in emerging markets. The Fund is non-diversified, meaning it may concentrate its assets in fewer individual holdings than a diversified fund. Therefore, the Fund is more exposed to individual issuer volatility than a diversified fund. Funds that are less diversified across countries or geographic regions are generally riskier than more geographically diversified funds and risks associated with such countries or geographic regions may negatively affect a Fund. Investments in small-capitalization companies tend to have limited liquidity and greater price volatility than large-capitalization companies. The ETFMG Prime Junior Silver ETF is subject to risks associated with the worldwide price of silver and the costs of extraction and production. Worldwide silver prices may fluctuate substantially over short periods of time, so the Fund’s share price may be more volatile than other types of economic conditions, tax treatment, government regulation and intervention, and world events in the regions in which the companies operation. Several foreign countries have begun a process of privatizing certain entities and industries. Privatized entities may lose money or be renationalized. The Fund invests in some economies that are heavily dependent upon trading with key partners. Any reduction in this trading may cause an adverse impact on the economy in which the Fund invests. The Fund’s return may not match or achieve a high degree of correlation with the return of the Index. To the extent the Fund utilizes a sampling approach, it may experience tracking error to a greater extent than if the Fund had sought to replicate the Index. IOPV or indicative optimized portfolio value is an estimated intraday fair value of one share of an ETF determined by the last trade price of the fund’s underlying securities.
The Prime Junior Silver Miners & Explores Index is designed to reflect the performance of small-capitalization companies involved in the silver industry, including companies that mine, explore and refine silver. The stocks are screened for liquidity and weighted according to modified free-float market capitalization. The Index generally is comprised of 20-30 securities. The Index was created and is maintained by Prime Indexes. An investment cannot be made directly in an index.
HACK
The Fund seeks to provide investment results that, before fees and expenses, correspond generally to the price and yield performance of the Prime Cyber Defense Index (the “Index”).
The fund is concentrated in technology-related companies face intense competition, both domestically and internationally, which may have an adverse effect on profit margins. Such companies may have limited product lines, markets, financial resources or personnel. The products of such companies may face obsolescence due to rapid technological developments, frequent new product introduction, unpredictable changes in growth rates, competition for the services of qualified personnel, and competition from foreign competitors with lower production costs. Technology companies are heavily dependent on patent and intellectual property rights. The loss or impairment of these rights may adversely affect the profitability of these companies. Investments in foreign securities involve political, economic and currency risks, greater volatility and differences in accounting methods. The Funds are non-diversified, meaning they may concentrate its assets in fewer individual holdings than a diversified fund. Investments in smaller companies tend to have limited liquidity and greater price volatility than large-capitalization companies. The Fund’s return may not match or achieve a high degree of correlation with the return of the Index. To the extent the Fund utilizes a sampling approach, it may experience tracking error to a greater extent than if the Fund had sought to replicate the Index.
14
ETFMG™ ETFs
The Prime Cyber Defense Index is designed to reflect the performance of companies involved in the cyber security industry, including companies that provide cyber security related hardware/software and services. The stocks are screened for liquidity and weighted according to modified free-float market capitalization. The Index was created and is maintained by Prime Indexes. An investment cannot be made directly in an index.
IPAY
The ETFMG Prime Mobile Payments ETF (the “Fund” or the “Mobile Payments ETF”) seeks to provide investment results that, before fees and expenses, correspond generally to the price and yield performance of the Prime Mobile Payments Index (the “Index”).
Mobile Payment Companies face intense competition, both domestically and internationally, and are subject to increasing regulatory constraints, particularly with respect to fees, competition and antitrust matters, cybersecurity and privacy. Mobile Payment Companies may be highly dependent on their ability to enter into agreements with merchants and other third parties to utilize a particular payment method, system, software or service, and such agreements may be subject to increased regulatory scrutiny. Additionally, certain Mobile Payment Companies have recently faced increased costs related to class-action litigation challenging such agreements. Such factors may adversely affect the profitability and value of such companies. The Fund is non-diversified, meaning it may concentrate its assets in fewer individual holdings than a diversified fund. Investments in smaller companies tend to have limited liquidity and greater price volatility than large-capitalization companies. The Fund’s return may not match or achieve a high degree of correlation with the return of the Index. To the extent the Fund utilizes a sampling approach, it may experience tracking error to a greater extent than if the Fund had sought to replicate the Index. Diversification does not guarantee a profit, nor does it protect against a loss in a declining market.
The Prime Mobile Payments Index is designed to reflect the performance of companies involved in the mobile and electronic payments industry, including card networks, processors, infrastructure/software and solutions companies. The stocks are screened for liquidity and weighted according to a modified linear-based capitalization-weighted methodology. The Index was created and is maintained by Prime Indexes. An investment cannot be made directly in an index.
IFLY
The ETFMG Drone Economy Strategy ETF (the “Fund” or the “Drone Economy ETF”) seeks to provide investment results that, before fees and expenses, correspond generally to the price and yield performance of the Reality Shares DroneTM Index (the “Index”).
15
ETFMG™ ETFs
Drone Economy Companies face intense competition, both domestically and internationally and are heavily dependent on the protection of patent and intellectual property rights. In addition, Drone Economy Companies may be dependent on the U.S. government and its agencies for a significant portion of their sales, and their success and growth may be affected by budgetary constraints, spending reductions, congressional appropriations, and administrative allocations of funds that affect the U.S. government and its agencies. Such factors may adversely affect the profitability and value of such companies. Investments in foreign securities involve political, economic and currency risks, greater volatility and differences in accounting methods. The Fund is non-diversified, meaning it may concentrate its assets in fewer individual holdings than a diversified fund. Investments in smaller companies tend to have limited liquidity and greater price volatility than large-capitalization companies. The Fund’s return may not match or achieve a high degree of correlation with the return of the Reality Shares Drone™ Index. To the extent the Fund utilizes a sampling approach, it may experience tracking error to a greater extent than if the Fund had sought to replicate the Index. Diversification does not guarantee a profit, nor does it protect against a loss in a declining market.
The Reality Shares Drone™ Index provides a benchmark for investors interested in tracking companies actively involved in drone technology and services. The Index uses Modified Equal Weight capitalization-weighted methodology. The index was created and is maintained by Reality Shares Index Committee. You cannot invest directly in an index.
GAMR
The ETFMG Video Game Tech ETF (the “Fund” or the “Video Game Tech ETF”) seeks to provide investment results that, before fees and expenses, correspond generally to the price and yield performance of the EEFund Video Game Tech Index (the “Index”).
Video Game Tech Companies face intense competition, both domestically and internationally, may have limited product lines, markets, financial resources or personnel, may have products that face rapid obsolescence, and are heavily dependent on the protection of patent and intellectual property rights. Video Game Tech Companies are also subject to increasing regulatory constraints, particularly with respect to cybersecurity and privacy. Such factors may adversely affect the profitability and value of such companies. Investments in foreign securities involve political, economic and currency risks, greater volatility and differences in accounting methods. The Fund is non-diversified, meaning it may concentrate its assets in fewer individual holdings than a diversified fund. Investments in smaller companies tend to have limited liquidity and greater price volatility than large-capitalization companies. The Fund’s return may not match or achieve a high degree of correlation with the return of the EEFund Video Game Tech Index. To the extent the Fund utilizes a sampling approach, it may experience tracking error to a greater extent than if the Fund had sought to replicate the Index. Diversification does not guarantee a profit, nor does it protect against a loss in a declining market.
The EEFund Video Game Tech™ Index provides a benchmark for investors interested in tracking companies actively involved in the electronic gaming industry including the entertainment, education and simulation segments. The Index uses a market capitalization weighted allocation across the pure play and non-pure play sectors and a set weight for the conglomerate sector as well as an equal weighted allocation methodology for all components within each sector allocation. The index was created and is maintained by EEFund Management. You cannot invest directly in an index.
S&P 500: The S&P 500 Index is the Standard & Poor’s composite index of 500 stocks, a widely recognized, unmanaged index of common stock prices.
16
ETFMG™ ETFs
As of September 30, 2017 (Unaudited)
ETFMG Prime Junior Silver ETF | ETFMG Prime Cyber Security ETF | ETFMG Prime Mobile Payments ETF | ETFMG Drone Economy Strategy ETF | ETFMG Video Game Tech ETF | ||
| As a percent of Net Assets: | ||||||
| Canada | 62.5% | —% | —% | —% | —% | |
| Cayman Islands | — | — | — | 2.8 | 5.6 | |
| Cyprus | — | — | 1.8 | — | — | |
| Finland | — | 0.1 | — | — | — | |
| France | — | — | 5.0 | 12.6 | 4.5 | |
| Germany | — | — | 3.3 | 1.3 | 0.7 | |
| Hong Kong | — | — | 0.5 | — | 4.2 | |
| Israel | — | 9.7 | — | 1.4 | — | |
| Italy | — | — | — | 1.9 | — | |
| Japan | — | 5.9 | 0.7 | 8.9 | 31.0 | |
| Netherlands | — | 0.9 | — | 1.7 | — | |
| Norway | — | — | — | — | 0.9 | |
| Puerto Rico | — | — | 1.6 | — | — | |
| Republic of Korea | — | 0.5 | — | 1.0 | 10.4 | |
| Spain | — | — | — | 1.6 | — | |
| Sweden | — | — | — | 2.7 | 2.0 | |
| Switzerland | — | — | — | — | 1.1 | |
| Taiwan, Province of China | — | — | — | — | 3.2 | |
| Turkey | — | — | — | 2.7 | — | |
| United Kingdom | 11.0 | 8.9 | 3.9 | 4.8 | — | |
| United States | 26.4 | 73.9 | 83.0 | 56.3 | 35.5 | |
| Short-Term and other Net Assets (Liabilities) | 0.1 | 0.1 | 0.2 | 0.3 | 0.9 | |
| 100.0% | 100.0% | 100.0% | 100.0% | 100.0% |
17
ETFMG™ ETFs
ETFMG Prime Junior Silver ETF
September 30, 2017
| Shares | Fair Value | |||||||
| COMMON STOCKS - 99.9% | ||||||||
| Metals & Mining - 99.9% | ||||||||
| Canada - 62.5% | ||||||||
| Alexco Resource Corp. (a) | 634,322 | $ | 919,767 | |||||
| Americas Silver Corp. (a) | 243,985 | 1,005,075 | ||||||
| Aurcana Corp. (a) | 708,765 | 144,849 | ||||||
| Bear Creek Mining Corp. (a) | 602,356 | 989,645 | ||||||
| Cautivo Mining, Inc. (a) | 18,219 | — | ||||||
| Endeavour Silver Corp. (a) | 663,889 | 1,580,056 | ||||||
| Excellon Resources, Inc. (a) | 534,587 | 869,735 | ||||||
| First Majestic Silver Corp. (a) | 397,471 | 2,718,702 | ||||||
| Fortuna Silver Mines, Inc. (a) | 290,810 | 1,272,549 | ||||||
| Great Panther Silver Ltd. (a) | 516,477 | 640,431 | ||||||
| Hudbay Minerals, Inc. (a) | 359,407 | 2,664,408 | ||||||
| IMPACT Silver Corp. (a) | 574,882 | 156,650 | ||||||
| Kootenay Silver, Inc. (a) | 1,247,459 | 224,947 | ||||||
| MAG Silver Corp. (a) (Level 2) | 225,404 | 2,523,658 | ||||||
| Mandalay Resources Corp. (a) | 2,034,068 | 546,113 | ||||||
| Minco Silver Corp. (a) | 558,476 | 371,497 | ||||||
| Mirasol Resources Ltd. (a) | 339,263 | 429,602 | ||||||
| Pan American Silver Corp. (a) | 410,467 | 6,990,522 | ||||||
| Sabina Gold & Silver Corp. (a) | 489,389 | 866,800 | ||||||
| Santacruz Silver Mining Ltd. (a) | 1,082,875 | 138,858 | ||||||
| Sierra Metals, Inc. (a) | 354,444 | 894,809 | ||||||
| Silvercorp Metals, Inc. (a) | 792,251 | 2,146,110 | ||||||
| SSR Mining, Inc. (a) | 195,953 | 2,076,136 | ||||||
| Tahoe Resources, Inc. | 501,023 | 2,640,391 | ||||||
| Trevali Mining Corp. (a) | 875,934 | 989,835 | ||||||
| Yamana Gold, Inc. | 927,489 | 2,457,846 | ||||||
| Total Canada | 36,258,991 | |||||||
| United Kingdom - 11.0% | ||||||||
| Hochschild Mining PLC | 2,077,879 | 6,390,090 | ||||||
| United States - 26.4% | ||||||||
| Coeur Mining, Inc. (a) | 830,954 | 7,636,467 | ||||||
| Golden Minerals Co. (a) | 642,131 | 308,223 | ||||||
| Hecla Mining Co. | 1,471,007 | 7,384,455 | ||||||
| Total United States | 15,329,145 | |||||||
| Total Metals & Mining | 57,978,226 | |||||||
| TOTAL COMMON STOCKS (Cost $61,603,342) | 57,978,226 | |||||||
The accompanying notes are an integral part of these financial statements.
18
ETFMG™ ETFs
ETFMG Prime Junior Silver ETF
Schedule of Investments
September 30, 2017 (Continued)
| Shares | Fair Value | |||||||
| SHORT-TERM INVESTMENTS - 0.2% | ||||||||
| Money Market Funds - 0.2% | ||||||||
| Invesco Advisers, Inc. STIT - Treasury Portfolio - Institutional Class, 0.89% (b) | 102,269 | $ | 102,269 | |||||
| TOTAL SHORT-TERM INVESTMENTS (Cost $102,269) | 102,269 | |||||||
| Total Investments (Cost $61,705,611) - 100.1% | 58,080,495 | |||||||
| Liabilities in Excess of Other Assets - (0.1)% | (47,987 | ) | ||||||
| TOTAL NET ASSETS - 100.0% | $ | 58,032,508 | ||||||
Percentages are stated as a percent of net assets.
| (a) | Non-income producing security. |
| (b) | The rate quoted is the annualized seven-day yield at September 30, 2017. |
The Global Industry Classification Standard (GICS®) was developed by and/or is the exclusive property of MSCI, Inc. and Standard & Poor’s Financial Services LLC (“S&P”). GICS® is a service mark of MSCI, Inc. and S&P and has been licensed for use by the Fund’s Administrator, U.S. Bancorp Fund Services, LLC.
The accompanying notes are an integral part of these financial statements.
19
ETFMG™ ETFs
ETFMG Prime Cyber Security ETF
Schedule of Investments
September 30, 2017
| Shares | Fair Value | |||||||
| COMMON STOCKS - 99.9% | ||||||||
| Finland - 0.1% | ||||||||
| Software - 0.1% | ||||||||
| F-Secure OYJ | 297,180 | $ | 1,499,774 | |||||
| Israel - 9.7% | ||||||||
| Communications Equipment - 0.9% | ||||||||
| Radware Ltd. (a) | 589,228 | 9,934,384 | ||||||
| Software - 8.8% | ||||||||
| Check Point Software Technologies Ltd. (a) ^ | 428,085 | 48,810,252 | ||||||
| CyberArk Software Ltd. (a) ^ | 1,158,485 | 47,497,885 | ||||||
| Total Software | 96,308,137 | |||||||
| Total Israel | 106,242,521 | |||||||
| Japan - 5.9% | ||||||||
| Software - 5.9% | ||||||||
| Digital Arts, Inc. | 183,700 | 7,917,752 | ||||||
| FFRI, Inc. | 177,416 | 6,819,144 | ||||||
| Trend Micro, Inc. | 1,020,301 | 50,232,993 | ||||||
| Total Software | 64,969,889 | |||||||
| Netherlands - 0.9% | ||||||||
| Software - 0.9% | ||||||||
| Gemalto NV | 224,443 | 10,025,793 | ||||||
| Republic of Korea - 0.5% | ||||||||
| Internet Software & Services - 0.5% | ||||||||
| Ahnlab, Inc. | 146,504 | 5,922,325 | ||||||
| United Kingdom - 8.9% | ||||||||
| Aerospace & Defense - 2.4% | ||||||||
| BAE Systems PLC | 1,918,496 | 16,234,476 | ||||||
| Ultra Electronics Holdings PLC | 436,498 | 10,516,615 | ||||||
| Total Aerospace & Defense | 26,751,091 | |||||||
| Internet Software & Services - 1.0% | ||||||||
| Mimecast Ltd. (a) | 398,036 | 11,312,183 | ||||||
| IT Services - 0.9% | ||||||||
| NCC Group PLC | 3,292,202 | 9,550,990 | ||||||
| Software - 4.6% | ||||||||
| Sophos Group PLC | 6,790,012 | 49,996,805 | ||||||
| Total United Kingdom | 97,611,069 | |||||||
| United States - 73.9% | ||||||||
| Aerospace & Defense - 0.5% | ||||||||
| The KEYW Holding Corp. (a) ^ | 677,345 | 5,154,595 | ||||||
| Communications Equipment - 14.7% | ||||||||
| Cisco Systems, Inc. | 1,533,938 | 51,586,335 | ||||||
The accompanying notes are an integral part of these financial statements.
20
ETFMG™ ETFs
ETFMG Prime Cyber Security ETF
Schedule of Investments
September 30, 2017 (Continued)
| Shares | Fair Value | |||||||
| F5 Networks, Inc. (a) | 91,126 | $ | 10,986,151 | |||||
| Juniper Networks, Inc. | 1,813,990 | 50,483,342 | ||||||
| Palo Alto Networks, Inc. (a) | 335,267 | 48,311,975 | ||||||
| Total Communications Equipment | 161,367,803 | |||||||
| Internet Software & Services - 6.1% | ||||||||
| Akamai Technologies, Inc. (a) ^ | 1,049,753 | 51,143,966 | ||||||
| VeriSign, Inc. (a) ^ | 101,916 | 10,842,843 | ||||||
| Zix Corp. (a) ^ | 1,001,818 | 4,898,890 | ||||||
| Total Internet Software & Services | 66,885,699 | |||||||
| IT Services - 7.9% | ||||||||
| Booz Allen Hamilton Holding Corp. | 314,552 | 11,761,099 | ||||||
| Leidos Holdings, Inc. | 187,980 | 11,132,176 | ||||||
| ManTech International Corp. | 253,700 | 11,200,855 | ||||||
| Science Applications International Corp. | 782,496 | 52,309,858 | ||||||
| Total IT Services | 86,403,988 | |||||||
| Software - 44.7% | ||||||||
| A10 Networks, Inc. (a) | 996,167 | 7,531,022 | ||||||
| Barracuda Networks, Inc. (a) ^ | 1,992,767 | 48,284,744 | ||||||
| FireEye, Inc. (a) ^ | 3,016,135 | 50,580,584 | ||||||
| Fortinet, Inc. (a) | 1,285,636 | 46,077,194 | ||||||
| Gigamon, Inc. (a) ^ | 1,133,813 | 47,790,218 | ||||||
| Imperva, Inc. (a) | 1,059,279 | 45,972,709 | ||||||
| MobileIron, Inc. (a) | 1,673,056 | 6,190,307 | ||||||
| Proofpoint, Inc. (a) ^ | 521,383 | 45,475,025 | ||||||
| Qualys, Inc. (a) ^ | 934,162 | 48,389,592 | ||||||
| Rapid7, Inc. (a) | 583,710 | 10,273,296 | ||||||
| SecureWorks Corp. (a) (c) | 768,717 | 9,493,655 | ||||||
| Splunk, Inc. (a) ^ | 718,796 | 47,749,618 | ||||||
| Symantec Corp. ^ | 1,526,661 | 50,089,747 | ||||||
| Varonis Systems, Inc. (a) | 258,751 | 10,841,667 | ||||||
| VASCO Data Security International, Inc. (a) | 406,406 | 4,897,192 | ||||||
| Verint Systems, Inc. (a) ^ | 258,955 | 10,837,266 | ||||||
| Total Software | 490,473,836 | |||||||
| Total United States | 810,285,921 | |||||||
| TOTAL COMMON STOCKS (Cost $1,015,814,274) | 1,096,557,292 | |||||||
The accompanying notes are an integral part of these financial statements.
21
ETFMG™ ETFs
ETFMG Prime Cyber Security ETF
Schedule of Investments
September 30, 2017 (Continued)
| Shares | Fair Value | |||||||
| SHORT-TERM INVESTMENTS - 0.1% | ||||||||
| Money Market Funds - 0.1% | ||||||||
| Invesco Advisers, Inc. STIT - Treasury Portfolio - Institutional Class, 0.89% (b) | 1,346,853 | $ | 1,346,853 | |||||
| TOTAL SHORT-TERM INVESTMENTS (Cost $1,346,853) | 1,346,853 | |||||||
| INVESTMENTS PURCHASED WITH SECURITIES LENDING COLLATERAL - 21.9% | ||||||||
| Investment Companies - 21.9% | ||||||||
| Mount Vernon Liquid Assets Portfolio, LLC, 1.33% (b) + | 239,731,705 | |||||||
| TOTAL INVESTMENTS PURCHASED WITH SECURITIES LENDING COLLATERAL (Cost $239,731,705) | 239,731,705 | |||||||
| Total Investments (Cost $1,256,892,832) - 121.9% | 1,337,635,850 | |||||||
| Liabilities in Excess of Other Assets - (21.9)% | (240,275,963 | ) | ||||||
| TOTAL NET ASSETS - 100.0% | $ | 1,097,359,887 | ||||||
Percentages are stated as a percent of net assets.
| (a) | Non-income producing security. |
| (b) | The rate quoted is the annualized seven-day yield at September 30, 2017. |
| (c) | Affiliated security. Please refer to Note 9 of the Notes to Financial Statements. |
+ Investments purchased with cash proceeds from securities lending. Total cash collateral has a value of $239,731,705 as of September 30, 2017.
^ All or a portion of this security is out on loan as of September 30, 2017. Total value of securities out on loan is $233,713,782.
The Global Industry Classification Standard (GICS®) was developed by and/or is the exclusive property of MSCI, Inc. and Standard & Poor’s Financial Services LLC (“S&P”). GICS® is a service mark of MSCI, Inc. and S&P and has been licensed for use by the Fund’s Administrator, U.S. Bancorp Fund Services, LLC.
The accompanying notes are an integral part of these financial statements.
22
ETFMG™ ETFs
ETFMG Prime Mobile Payments ETF
Schedule of Investments
September 30, 2017
| Shares | Fair Value | |||||||
| COMMON STOCKS - 99.8% | ||||||||
| Cyprus - 1.8% | ||||||||
| IT Services - 1.8% | ||||||||
| QIWI PLC - ADR | 183,309 | $ | 3,105,254 | |||||
| France - 5.0% | ||||||||
| Electronic Equipment, Instruments & Components - 2.5% | ||||||||
| Ingenico Group SA | 44,410 | 4,209,529 | ||||||
| IT Services - 2.5% | ||||||||
| Worldline SA (a) | 99,954 | 4,236,320 | ||||||
| Total France | 8,445,849 | |||||||
| Germany - 3.3% | ||||||||
| IT Services - 3.3% | ||||||||
| Wirecard AG | 61,855 | 5,659,137 | ||||||
| Hong Kong - 0.5% | ||||||||
| Electronic Equipment, Instruments & Components - 0.5% | ||||||||
| PAX Global Technologies Ltd. | 1,692,427 | 901,287 | ||||||
| Japan - 0.7% | ||||||||
| Consumer Finance - 0.7% | ||||||||
| Jaccs Co Ltd | 49,000 | 1,210,140 | ||||||
| Puerto Rico - 1.6% | ||||||||
| IT Services - 1.6% | ||||||||
| EVERTEC, Inc. | 177,870 | 2,819,240 | ||||||
| United Kingdom - 3.9% | ||||||||
| Commercial Services & Supplies - 0.8% | ||||||||
| PayPoint PLC | 101,077 | 1,292,803 | ||||||
| IT Services - 3.1% | ||||||||
| Worldpay Group PLC | 983,394 | 5,363,225 | ||||||
| Total United Kingdom | 6,656,028 | |||||||
| United States - 83.0% | ||||||||
| Consumer Finance - 13.5% | ||||||||
| American Express Co. ^ | 118,790 | 10,745,743 | ||||||
| Discover Financial Services | 133,439 | 8,604,147 | ||||||
| Green Dot Corp. (a) | 74,036 | 3,670,705 | ||||||
| Total Consumer Finance | 23,020,595 | |||||||
| Electronic Equipment, Instruments & Components - 2.1% | ||||||||
| VeriFone Systems, Inc. (a) ^ | 178,054 | 3,610,935 | ||||||
| Internet Software & Services - 2.0% | ||||||||
| Q2 Holdings, Inc. (a) ^ | 82,387 | 3,431,418 | ||||||
| IT Services - 60.4% | ||||||||
| Blackhawk Network Holdings, Inc. (a) ^ | 79,950 | 3,501,810 | ||||||
| Euronet Worldwide, Inc. (a) | 42,446 | 4,023,456 | ||||||
| Fidelity National Information Services, Inc. | 105,214 | 9,825,935 | ||||||
The accompanying notes are an integral part of these financial statements.
23
ETFMG™ ETFs
ETFMG Prime Mobile Payments ETF
Schedule of Investments
September 30, 2017 (Continued)
| Shares | Fair Value | |||||||
| First Data Corp. (a) | 364,110 | $ | 6,568,544 | |||||
| Fiserv, Inc. (a) | 70,489 | 9,090,261 | ||||||
| FleetCor Technologies, Inc. (a) | 40,879 | 6,326,843 | ||||||
| Global Payments, Inc. | 64,923 | 6,169,633 | ||||||
| MasterCard, Inc. | 73,022 | 10,310,706 | ||||||
| Net 1 UEPS Technologies, Inc. (a) | 72,412 | 705,293 | ||||||
| PayPal Holdings, Inc. (a) | 163,998 | 10,500,793 | ||||||
| Planet Payment, Inc. (a) | 98,354 | 421,939 | ||||||
| Square, Inc. (a) ^ | 197,151 | 5,679,920 | ||||||
| Total System Services, Inc. | 83,576 | 5,474,228 | ||||||
| Vantiv, Inc. (a) ^ | 76,977 | 5,424,569 | ||||||
| Visa, Inc. ^ | 95,925 | 10,095,147 | ||||||
| Western Union Co. ^ | 261,916 | 5,028,787 | ||||||
| WEX, Inc. (a) | 37,095 | 4,162,801 | ||||||
| Total IT Services | 103,310,665 | |||||||
| Software - 2.1% | ||||||||
| ACI Worldwide, Inc. (a) ^ | 158,270 | 3,605,391 | ||||||
| Technology Hardware, Storage & Peripherals - 2.9% | ||||||||
| NCR Corp. (a) ^ | 111,074 | 4,167,496 | ||||||
| USA Technologies, Inc. (a) | 122,188 | 763,675 | ||||||
| Total Technology Hardware, Storage & Peripherals | 4,931,171 | |||||||
| Total United States | 141,910,175 | |||||||
| TOTAL COMMON STOCKS (Cost $148,689,891) | 170,707,110 | |||||||
| SHORT-TERM INVESTMENTS - 0.2% | ||||||||
| Money Market Funds - 0.2% | ||||||||
| Invesco Advisers, Inc. STIT - Treasury Portfolio - Institutional Class, 0.89% (b) | 381,513 | 381,513 | ||||||
| TOTAL SHORT-TERM INVESTMENTS (Cost $381,513) | 381,513 | |||||||
The accompanying notes are an integral part of these financial statements.
24
ETFMG™ ETFs
ETFMG Prime Mobile Payments ETF
Schedule of Investments
September 30, 2017 (Continued)
| Shares | Fair Value | |||||||
| INVESTMENTS PURCHASED WITH SECURITIES LENDING COLLATERAL - 19.8% | ||||||||
| Investment Companies - 19.8% | ||||||||
| Mount Vernon Liquid Assets Portfolio, LLC, 1.33% (b) + | $ | 33,828,336 | ||||||
| TOTAL INVESTMENTS PURCHASED WITH SECURITIES LENDING COLLATERAL (Cost $33,828,336) | 33,828,336 | |||||||
| Total Investments (Cost $182,899,740) - 119.8% | 204,916,959 | |||||||
| Liabilities in Excess of Other Assets - (19.8)% | (33,923,519 | ) | ||||||
| TOTAL NET ASSETS - 100.0% | $ | 170,993,440 | ||||||
Percentages are stated as a percent of net assets.
| ADR | American Depositary Receipt |
| (a) | Non-income producing security. |
| (b) | The rate quoted is the annualized seven-day yield at September 30, 2017. |
+ Investments purchased with cash proceeds from securities lending. Total cash collateral has a value of $33,828,336 as of September 30, 2017.
^ All or a portion of this security is out on loan as of September 30, 2017. Total value of securities out on loan is $33,191,067.
The Global Industry Classification Standard (GICS®) was developed by and/or is the exclusive property of MSCI, Inc. and Standard & Poor’s Financial Services LLC (“S&P”). GICS® is a service mark of MSCI, Inc. and S&P and has been licensed for use by the Fund’s Administrator, U.S. Bancorp Fund Services, LLC.
The accompanying notes are an integral part of these financial statements.
25
ETFMG™ ETFs
ETFMG Drone Economy Strategy ETF
Schedule of Investments
September 30, 2017
| Shares | Fair Value | |||||||
| COMMON STOCKS - 99.7% | ||||||||
| Cayman Islands - 2.8% | ||||||||
| Semiconductors & Semiconductor Equipment - 2.8% | ||||||||
| Ambarella, Inc. (a) ^ | 21,888 | $ | 1,072,731 | |||||
| France - 12.6% | ||||||||
| Aerospace & Defense - 3.5% | ||||||||
| Dassault Aviation SA | 387 | 625,919 | ||||||
| Thales SA | 6,218 | 703,888 | ||||||
| Total Aerospace & Defense | 1,329,807 | |||||||
| Communications Equipment - 9.1% | ||||||||
| Parrot SA ^ | 286,925 | 3,445,405 | ||||||
| Total France | 4,775,212 | |||||||
| Germany - 1.3% | ||||||||
| Industrial Conglomerates - 1.3% | ||||||||
| Rheinmetall AG | 4,435 | 499,848 | ||||||
| Israel - 1.4% | ||||||||
| Aerospace & Defense - 1.4% | ||||||||
| Elbit Systems Ltd. | 3,700 | 543,570 | ||||||
| Italy - 1.9% | ||||||||
| Aerospace & Defense - 1.9% | ||||||||
| Leonardo SpA | 37,641 | 705,129 | ||||||
| Japan - 8.9% | ||||||||
| Automobiles - 3.0% | ||||||||
| Subaru Corp. | 15,360 | 554,202 | ||||||
| Yamaha Motor Co. Ltd. | 19,920 | 596,582 | ||||||
| Total Automobiles | 1,150,784 | |||||||
| Electronic Equipment, Instruments & Components - 3.0% | ||||||||
| Hitachi Ltd. | 83,700 | 589,786 | ||||||
| TDK Corp. | 7,825 | 531,286 | ||||||
| Total Electronic Equipment, Instruments & Components | 1,121,072 | |||||||
| Household Durables - 1.3% | ||||||||
| Sony Corp. - ADR | 12,942 | 483,254 | ||||||
| Technology Hardware, Storage & Peripherals - 1.6% | ||||||||
| NEC Corp. | 22,350 | 605,799 | ||||||
| Total Japan | 3,360,909 | |||||||
| Netherlands - 1.7% | ||||||||
| Aerospace & Defense - 1.7% | ||||||||
| Airbus SE | 6,916 | 657,269 | ||||||
The accompanying notes are an integral part of these financial statements.
26
ETFMG™ ETFs
ETFMG Drone Economy Strategy ETF
Schedule of Investments
September 30, 2017 (Continued)
| Shares | Fair Value | |||||||
| Republic of Korea - 1.0% | ||||||||
| Aerospace & Defense - 1.0% | ||||||||
| Korea Aerospace Industries Ltd. | 10,442 | $ | 398,407 | |||||
| Spain - 1.6% | ||||||||
| IT Services - 1.6% | ||||||||
| Indra Sistemas SA | 39,253 | 620,041 | ||||||
| Sweden - 2.7% | ||||||||
| Aerospace & Defense - 1.1% | ||||||||
| Saab AB | 7,728 | 392,240 | ||||||
| Electronic Equipment, Instruments & Components - 1.6% | ||||||||
| Hexagon AB | 12,419 | 615,544 | ||||||
| Total Sweden | 1,007,784 | |||||||
| Turkey - 2.7% | ||||||||
| Aerospace & Defense - 1.4% | ||||||||
| Aselsan Elektronik Sanayi Ve Ticaret AS | 72,447 | 534,769 | ||||||
| Household Durables - 1.3% | ||||||||
| Vestel Elektronik Sanayi ve Ticaret AS | 231,606 | 488,180 | ||||||
| Total Turkey | 1,022,949 | |||||||
| United Kingdom - 4.8% | ||||||||
| Aerospace & Defense - 4.8% | ||||||||
| BAE Systems PLC | 80,060 | 677,475 | ||||||
| Cobham PLC | 192,190 | 375,227 | ||||||
| Meggitt PLC | 62,240 | 434,522 | ||||||
| QinetiQ Group PLC | 105,866 | 350,253 | ||||||
| Total United Kingdom | 1,837,477 | |||||||
| United States - 56.3% | ||||||||
| Aerospace & Defense - 40.3% | ||||||||
| Aerovironment, Inc. (a) ^ | 114,667 | 6,205,778 | ||||||
| Boeing Co. | 7,582 | 1,927,420 | ||||||
| General Dynamics Corp. | 2,797 | 575,007 | ||||||
| Kratos Defense & Security Solutions, Inc. | 61,305 | 801,869 | ||||||
| L3 Technologies, Inc. | 3,934 | 741,284 | ||||||
| Lockheed Martin Corp. (a)^ | 2,021 | 627,096 | ||||||
| Northrop Grumman Corp. | 2,190 | 630,107 | ||||||
| Orbital ATK, Inc. (a)^ | 4,432 | 590,165 | ||||||
| Raytheon Co. | 3,177 | 592,765 | ||||||
| Rockwell Collins, Inc. | 3,697 | 483,235 | ||||||
| Teledyne Technologies, Inc. | 2,697 | 429,308 | ||||||
| Textron, Inc. | 13,404 | 722,208 | ||||||
The accompanying notes are an integral part of these financial statements.
27
ETFMG™ ETFs
ETFMG Drone Economy Strategy ETF
Schedule of Investments
September 30, 2017 (Continued)
| Shares | Fair Value | |||||||
| TransDigm Group, Inc. (a)^ | 1,584 | $ | 404,950 | |||||
| United Technologies Corp. (a)^ | 4,689 | 544,299 | ||||||
| Total Aerospace & Defense | 15,275,491 | |||||||
| Electronic Equipment, Instruments & Components - 3.6% | ||||||||
| FLIR Systems, Inc. | 9,392 | 365,443 | ||||||
| Jabil, Inc. | 18,212 | 519,953 | ||||||
| Trimble, Inc. | 12,498 | 490,547 | ||||||
| Total Electronic Equipment, Instruments & Components | 1,375,943 | |||||||
| Household Durables - 4.4% | ||||||||
| GoPro, Inc. (a) ^ | 153,101 | 1,685,643 | ||||||
| Industrial Conglomerates - 1.9% | ||||||||
| Honeywell International, Inc. | 4,985 | 706,574 | ||||||
| Semiconductors & Semiconductor Equipment - 6.1% | ||||||||
| Intel Corp. (a)^ | 13,802 | 525,580 | ||||||
| IXYS Corp. | 30,539 | 723,774 | ||||||
| NVIDIA Corp. | 3,445 | 615,863 | ||||||
| QUALCOMM, Inc. | 8,702 | 451,112 | ||||||
| Total Semiconductors & Semiconductor Equipment | 2,316,329 | |||||||
| Total United States | 21,359,980 | |||||||
| TOTAL COMMON STOCKS (Cost $32,312,091) | 37,861,306 | |||||||
| SHORT-TERM INVESTMENTS - 0.4% | ||||||||
| Money Market Funds - 0.4% | ||||||||
| Invesco Advisers, Inc. STIT - Treasury Portfolio - Institutional Class, 0.89% (b) | 149,121 | 149,121 | ||||||
| TOTAL SHORT-TERM INVESTMENTS (Cost $149,121) | 149,121 | |||||||
The accompanying notes are an integral part of these financial statements.
28
ETFMG™ ETFs
ETFMG Drone Economy Strategy ETF
Schedule of Investments
September 30, 2017 (Continued)
| Shares | Fair Value | |||||||
| INVESTMENTS PURCHASED WITH SECURITIES LENDING COLLATERAL - 13.9% | ||||||||
| Investment Companies - 13.9% | ||||||||
| Mount Vernon Liquid Assets Portfolio, LLC, 1.33% (b) + | $ | 5,267,739 | ||||||
| TOTAL INVESTMENTS PURCHASED WITH SECURITIES LENDING COLLATERAL (Cost $5,267,739) | 5,267,739 | |||||||
| Total Investments (Cost $37,728,951) - 114.0% | 43,278,166 | |||||||
| Liabilities in Excess of Other Assets - (14.0)% | (5,329,972 | ) | ||||||
| TOTAL NET ASSETS - 100.0% | $ | 37,948,194 | ||||||
Percentages are stated as a percent of net assets.
| ADR | American Depositary Receipt |
| (a) | Non-income producing security. |
| (b) | The rate quoted is the annualized seven-day yield at September 30, 2017. |
+ Investments purchased with cash proceeds from securities lending. Total cash collateral has a value of $5,267,739 as of September 30, 2017.
^ All or a portion of this security is out on loan as of September 30, 2017. Total value of securities out on loan is $5,200,964.
The Global Industry Classification Standard (GICS®) was developed by and/or is the exclusive property of MSCI, Inc. and Standard & Poor’s Financial Services LLC (“S&P”). GICS® is a service mark of MSCI, Inc. and S&P and has been licensed for use by the Fund’s Administrator, U.S. Bancorp Fund Services, LLC.
The accompanying notes are an integral part of these financial statements.
29
ETFMG™ ETFs
ETFMG Video Game Tech ETF
Schedule of Investments
September 30, 2017
| Shares | Fair Value | |||||||
| COMMON STOCKS - 99.1% | ||||||||
| Cayman Islands - 5.6% | ||||||||
| Internet Software & Services - 1.9% | ||||||||
| Momo, Inc. - ADR (a) | 6,961 | $ | 218,158 | |||||
| NetEase, Inc. - ADR | 937 | 247,190 | ||||||
| SINA Corp. (a) | 2,725 | 312,421 | ||||||
| Total Internet Software & Services | 777,769 | |||||||
| Software - 3.7% | ||||||||
| Changyou.com Ltd. - ADR (a) | 36,975 | 1,464,580 | ||||||
| Total Cayman Islands | 2,242,349 | |||||||
| France - 4.5% | ||||||||
| Software - 4.5% | ||||||||
| Ubisoft Entertainment SA (a) | 25,856 | 1,777,314 | ||||||
| Germany - 0.7% | ||||||||
| Health Care Equipment & Supplies - 0.7% | ||||||||
| Carl Zeiss Meditec AG | 5,115 | 266,994 | ||||||
| Hong Kong - 4.2% | ||||||||
| Internet Software & Services - 0.8% | ||||||||
| Tencent Holdings Ltd. | 7,700 | 331,397 | ||||||
| Software - 3.4% | ||||||||
| NetDragon Websoft Holdings Ltd. | 407,065 | 1,360,079 | ||||||
| Total Hong Kong | 1,691,476 | |||||||
| Japan - 31.0% | ||||||||
| Household Durables - 1.2% | ||||||||
| Sony Corp. - ADR | 12,361 | 461,559 | ||||||
| Internet Software & Services - 3.6% | ||||||||
| DeNa Co. Ltd. | 11,700 | 262,230 | ||||||
| Gree, Inc. | 173,300 | 1,184,338 | ||||||
| Total Internet Software & Services | 1,446,568 | |||||||
| Leisure Products - 1.3% | ||||||||
| Bandai Namco Holdings, Inc. | 7,400 | 253,846 | ||||||
| Sega Sammy Holdings, Inc. | 20,700 | 289,184 | ||||||
| Total Leisure Products | 543,030 | |||||||
| Software - 24.9% | ||||||||
| Capcom Co. Ltd. | 60,500 | 1,487,163 | ||||||
| Gumi, Inc. | 115,605 | 1,148,602 | ||||||
| GungHo Online Entertainment, Inc. ^ | 106,440 | 287,561 | ||||||
| Koei Tecmo Holdings Co. Ltd. | 12,800 | 268,797 | ||||||
| Konami Holdings Corp. | 29,112 | 1,399,653 | ||||||
| Nexon Co. Ltd. | 76,000 | 1,982,990 | ||||||
| Nintendo Co. Ltd. | 4,500 | 1,662,031 | ||||||
The accompanying notes are an integral part of these financial statements.
30
ETFMG™ ETFs
ETFMG Video Game Tech ETF
Schedule of Investments
September 30, 2017 (Continued)
| Shares | Fair Value | |||||||
| Square Enix Holdings Co. Ltd. | 45,200 | $ | 1,699,142 | |||||
| Total Software | 9,935,939 | |||||||
| Total Japan | 12,387,096 | |||||||
| Norway - 0.9% | ||||||||
| Semiconductors & Semiconductor Equipment - 0.9% | ||||||||
| Nordic Semiconductor ASA (a) | 61,635 | 340,503 | ||||||
| Republic of Korea - 10.4% | ||||||||
| Software - 10.4% | ||||||||
| NCSoft Corp. | 4,215 | 1,709,405 | ||||||
| Neowiz (a) | 75,496 | 701,997 | ||||||
| Webzen, Inc. (a) | 79,444 | 1,727,119 | ||||||
| Total Software | 4,138,521 | |||||||
| Sweden - 2.0% | ||||||||
| Software - 2.0% | ||||||||
| G5 Entertainment AB | 20,706 | 804,608 | ||||||
| Switzerland - 1.1% | ||||||||
| Technology Hardware, Storage & Peripherals - 1.1% | ||||||||
| Logitech International SA ^ | 12,432 | 453,271 | ||||||
| Taiwan, Province of China - 3.2% | ||||||||
| Technology Hardware, Storage & Peripherals - 3.2% | ||||||||
| Micro-Star International Co. Ltd. | 589,000 | 1,266,415 | ||||||
| United States - 35.5% | ||||||||
| Household Durables - 0.6% | ||||||||
| Vuzix Corp. (a) ^ | 46,297 | 252,319 | ||||||
| Internet Software & Services - 1.1% | ||||||||
| Alphabet, Inc. (a) | 463 | 444,068 | ||||||
| Leisure Products - 1.1% | ||||||||
| Hasbro, Inc. ^ | 2,532 | 247,300 | ||||||
| Mattel, Inc. ^ | 11,616 | 179,816 | ||||||
| Total Leisure Products | 427,116 | |||||||
| Semiconductors & Semiconductor Equipment - 4.7% | ||||||||
| Advanced Micro Devices, Inc. (a) ^ | 40,429 | 515,470 | ||||||
| Intel Corp. ^ | 12,520 | 476,762 | ||||||
| Kopin Corp. (a) | 76,783 | 320,185 | ||||||
| NVIDIA Corp. | 3,140 | 561,338 | ||||||
| Total Semiconductors & Semiconductor Equipment | 1,873,755 | |||||||
| Software - 22.9% | ||||||||
| Activision Blizzard, Inc. | 24,576 | 1,585,398 | ||||||
| Electronic Arts, Inc. (a) | 12,692 | 1,498,418 | ||||||
| Glu Mobile, Inc. (a) ^ | 565,153 | 2,124,974 | ||||||
| Microsoft Corp. | 6,475 | 482,323 | ||||||
The accompanying notes are an integral part of these financial statements.
31
ETFMG™ ETFs
ETFMG Video Game Tech ETF
Schedule of Investments
September 30, 2017 (Continued)
| Shares | Fair Value | |||||||
| Take-Two Interactive Software, Inc. (a) | 18,756 | $ | 1,917,426 | |||||
| Zynga, Inc. (a) | 408,087 | 1,542,569 | ||||||
| Total Software | 9,151,108 | |||||||
| Specialty Retail - 3.3% | ||||||||
| GameStop Corp. ^ | 64,747 | 1,337,673 | ||||||
| Technology Hardware, Storage & Peripherals - 1.8% | ||||||||
| Apple, Inc. | 2,963 | 456,658 | ||||||
| Immersion Corp. (a) | 31,309 | 255,795 | ||||||
| Total Technology Hardware, Storage & Peripherals | 712,453 | |||||||
| Total United States | 14,198,492 | |||||||
| TOTAL COMMON STOCKS (Cost $36,465,917) | 39,567,039 | |||||||
| SHORT-TERM INVESTMENTS - 0.6% | ||||||||
| Money Market Funds - 0.6% | ||||||||
| Invesco Advisers, Inc. STIT - Treasury Portfolio - Institutional Class, 0.89% (b) | 253,817 | 253,817 | ||||||
| TOTAL SHORT-TERM INVESTMENTS (Cost $253,817) | 253,817 | |||||||
| INVESTMENTS PURCHASED WITH SECURITIES LENDING COLLATERAL - 8.5% | ||||||||
| Investment Companies - 8.5% | ||||||||
| Mount Vernon Liquid Assets Portfolio, LLC, 1.33% (b) + | 3,407,205 | |||||||
| TOTAL INVESTMENTS PURCHASED WITH SECURITIES LENDING COLLATERAL (Cost $3,407,205) | 3,407,205 | |||||||
| Total Investments (Cost $40,126,939) - 108.2% | 43,228,061 | |||||||
| Liabilities in Excess of Other Assets - (8.2)% | (3,294,385 | ) | ||||||
| TOTAL NET ASSETS - 100.0% | $ | 39,933,676 | ||||||
Percentages are stated as a percent of net assets.
| ADR | American Depositary Receipt |
| (a) | Non-income producing security. |
| (b) | The rate quoted is the annualized seven-day yield at September 30, 2017. |
+ Investments purchased with cash proceeds from securities lending. Total cash collateral has a value of $3,407,205 as of September 30, 2017.
^ All or a portion of this security is out on loan as of September 30, 2017. Total value of securities out on loan is $3,296,825.
The Global Industry Classification Standard (GICS®) was developed by and/or is the exclusive property of MSCI, Inc. and Standard & Poor’s Financial Services LLC (“S&P”). GICS® is a service mark of MSCI, Inc. and S&P and has been licensed for use by the Fund’s Administrator, U.S. Bancorp Fund Services, LLC.
The accompanying notes are an integral part of these financial statements.
32
ETFMG™ ETFs
As of September 30, 2017
ETFMG Prime Junior Silver ETF | ETFMG Prime Cyber Security ETF | ETFMG Prime Mobile Payments ETF | ETFMG Drone Economy Strategy ETF | ETFMG Video Game Tech ETF | ||||||||||||||||
| ASSETS | ||||||||||||||||||||
| Investments in unaffiliated securities, at fair value* | $ | 58,080,495 | $ | 1,328,142,195 | $ | 204,916,959 | $ | 43,278,166 | $ | 43,228,061 | ||||||||||
| Investments in affiliated securities, at fair value | — | 9,493,655 | — | — | — | |||||||||||||||
| Cash | — | 71,000 | 1,543 | 213,674 | 71 | |||||||||||||||
| Foreign currency | 382 | — | 957 | 3,410 | 55,182 | |||||||||||||||
| Receivables: | ||||||||||||||||||||
| Receivable for Fund shares issued | — | — | — | — | 2,218,520 | |||||||||||||||
| Dividends and interest receivable | 3,983 | 290,962 | 40,291 | 17,177 | 31,509 | |||||||||||||||
| Securities lending income receivable | — | 22,064 | 2,424 | 3,885 | 7,610 | |||||||||||||||
| Receivable for investments sold | — | 5,973,602 | — | — | — | |||||||||||||||
| Total Assets | 58,084,860 | 1,343,993,478 | 204,962,174 | 43,516,312 | 45,540,953 | |||||||||||||||
| LIABILITIES | ||||||||||||||||||||
| Collateral received for securities loaned (Note 7) | $ | — | $ | 239,731,705 | $ | 33,828,336 | $ | 5,267,739 | $ | 3,407,205 | ||||||||||
| Payables: | ||||||||||||||||||||
| Payable for investments purchased | — | — | — | 275,110 | 2,169,387 | |||||||||||||||
| Payable for fund shares redeemed | — | 5,997,160 | — | — | — | |||||||||||||||
| Unitary fees payable | 35,134 | 547,681 | 99,938 | 20,093 | 21,660 | |||||||||||||||
| Accrued legal expenses | 17,218 | 357,045 | 40,460 | 5,176 | 9,025 | |||||||||||||||
| Total Liabilities | 52,352 | 246,633,591 | 33,968,734 | 5,568,118 | 5,607,277 | |||||||||||||||
| Net Assets | $ | 58,032,508 | $ | 1,097,359,887 | $ | 170,993,440 | $ | 37,948,194 | $ | 39,933,676 | ||||||||||
| NET ASSETS CONSIST OF: | ||||||||||||||||||||
| Paid-in Capital | $ | 86,129,285 | $ | 1,249,565,674 | $ | 150,138,832 | $ | 32,365,408 | $ | 36,938,687 | ||||||||||
| Undistributed (accumulated) net investment income (loss) | (384,887 | ) | (933,484 | ) | 61,070 | 21,329 | 53,637 | |||||||||||||
| Accumulated net realized gain (loss) on investments | (24,086,769 | ) | (232,019,266 | ) | (1,223,810 | ) | 13,209 | (159,298 | ) | |||||||||||
| Net unrealized appreciation (depreciation) on: | ||||||||||||||||||||
| Investments in securities | (3,625,116 | ) | 80,743,018 | 22,017,219 | 5,549,215 | 3,101,122 | ||||||||||||||
| Foreign currency and translation of other assets and liabilities in foreign currency | (5 | ) | 3,945 | 129 | (967 | ) | (472 | ) | ||||||||||||
| Net Assets | $ | 58,032,508 | $ | 1,097,359,887 | $ | 170,993,440 | $ | 37,948,194 | $ | 39,933,676 | ||||||||||
| *Identified Cost: | ||||||||||||||||||||
| Investments in unaffiliated securities | $ | 61,705,611 | $ | 1,247,279,103 | $ | 182,899,740 | $ | 37,728,951 | $ | 40,126,939 | ||||||||||
| Investments in affiliated securities | — | 9,613,729 | — | — | — | |||||||||||||||
| Foreign currency | 387 | — | 828 | 4,377 | 55,654 | |||||||||||||||
| Shares Outstanding^ | 4,900,000 | 36,450,000 | 5,250,000 | 1,050,000 | 900,000 | |||||||||||||||
| Net Asset Value, Offering and Redemption Price per Share | $ | 11.84 | $ | 30.11 | $ | 32.57 | $ | 36.14 | $ | 44.37 | ||||||||||
^ No par value, unlimited number of shares authorized.
The accompanying notes are an integral part of these financial statements.
33
ETFMG™ ETFs
For the Year ended September 30, 2017
ETFMG Prime Junior Silver ETF | ETFMG Prime Cyber Security ETF | ETFMG Prime Mobile Payments ETF | ETFMG Drone Economy Strategy ETF | ETFMG Video Game Tech ETF | ||||||||||||||||
| INVESTMENT INCOME | ||||||||||||||||||||
| Income: | ||||||||||||||||||||
| Dividends from unaffiliated securities (net of foreign withholdings tax of $19,945, $185,638, $13,166, $7,523, $19,564) | $ | 149,763 | $ | 6,027,843 | $ | 761,600 | $ | 169,221 | $ | 204,992 | ||||||||||
| Interest | 283 | 6,541 | 1,019 | 315 | 889 | |||||||||||||||
| Securities lending income | — | 489,967 | 50,816 | 59,708 | 37,155 | |||||||||||||||
| Total Investment Income | 150,046 | 6,524,351 | 813,435 | 229,244 | 243,036 | |||||||||||||||
| Expenses: | ||||||||||||||||||||
| Unitary fees | 424,982 | 6,449,260 | 661,627 | 102,604 | 116,865 | |||||||||||||||
| Legal expense | 19,951 | 413,692 | 46,879 | 5,998 | 10,457 | |||||||||||||||
| Total Expenses | 444,933 | 6,862,952 | 708,506 | 108,602 | 127,322 | |||||||||||||||
| Net Investment Income (Loss) | (294,887 | ) | (338,601 | ) | 104,929 | 120,642 | 115,714 | |||||||||||||
| REALIZED & UNREALIZED GAIN (LOSS) ON INVESTMENTS | ||||||||||||||||||||
| Net Realized Gain (Loss) on: | ||||||||||||||||||||
| Unaffiliated Investments | (20,775,525 | ) | (117,664,886 | ) | (1,125,326 | ) | 19,407 | (121,319 | ) | |||||||||||
| Affiliated Investments | — | (2,584,530 | ) | — | — | — | ||||||||||||||
| In-Kind Redemptions | 5,310,795 | 65,176,937 | 5,631,840 | 260,396 | 2,650,372 | |||||||||||||||
| Foreign currency and foreign currency translation | (108,866 | ) | (110,287 | ) | (21,645 | ) | (8,197 | ) | (19,789 | ) | ||||||||||
| Net Realized Gain (Loss) on Investments and In-Kind redemptions | (15,573,596 | ) | (55,182,766 | ) | 4,484,869 | 271,606 | 2,509,264 | |||||||||||||
| Net Change in Unrealized Appreciation (Depreciation) of: | ||||||||||||||||||||
| Unaffiliated Investments | (5,426,911 | ) | 122,065,187 | 21,832,551 | 5,252,163 | 2,154,917 | ||||||||||||||
| Affiliated Investments | — | 694,071 | — | — | — | |||||||||||||||
| Foreign currency and foreign currency translation | 3,002 | (5,319 | ) | 146 | (903 | ) | (423 | ) | ||||||||||||
| Net change in Unrealized Appreciation (Depreciation) of Investments | (5,423,909 | ) | 122,753,939 | 21,832,697 | 5,251,260 | 2,154,494 | ||||||||||||||
| Net Realized and Unrealized Gain (Loss) on Investments | (20,997,505 | ) | 67,571,173 | 26,317,566 | 5,522,866 | 4,663,758 | ||||||||||||||
| NET INCREASE (DECREASE) IN NET ASSETS RESULTING FROM OPERATIONS | $ | (21,292,392 | ) | $ | 67,232,572 | $ | 26,422,495 | $ | 5,643,508 | $ | 4,779,472 | |||||||||
The accompanying notes are an integral part of these financial statements.
34
ETFMG Prime Junior Silver ETF
Year Ended September 30, 2017 | Year Ended September 30, 2016 | |||||||
| OPERATIONS | ||||||||
| Net investment loss | $ | (294,887 | ) | $ | (134,867 | ) | ||
| Net realized gain (loss) on investments and In-Kind Redemptions | (15,573,596 | ) | 7,115,839 | |||||
| Net change in unrealized appreciation (depreciation) of investments and foreign currency and foreign currency translation | (5,423,909 | ) | 4,713,347 | |||||
| Net increase (decrease) in net assets resulting from operations | (21,292,392 | ) | 11,694,319 | |||||
| DISTRIBUTIONS TO SHAREHOLDERS | ||||||||
| From net investment income | (258,169 | ) | (87,131 | ) | ||||
| CAPITAL SHARE TRANSACTIONS | ||||||||
| Net increase in net assets derived from net change in outstanding shares (a) | 2,518,035 | 62,026,105 | ||||||
| Net increase (decrease) in net assets | $ | (19,032,526 | ) | $ | 73,633,293 | |||
| NET ASSETS | ||||||||
| Beginning of Year | 77,065,034 | 3,431,741 | ||||||
| End of Year | $ | 58,032,508 | $ | 77,065,034 | ||||
| Accumulated net investment loss | $ | (384,887 | ) | $ | (120,937 | ) | ||
(a) Summary of share transactions is as follows:
Year Ended September 30, 2017 | Year Ended September 30, 2016 | ||||||||||||||||
| Shares | Amount | Shares | Amount | ||||||||||||||
| Shares Sold | 2,400,000 | $ | 33,356,410 | 5,400,000 | $ | 79,061,830 | |||||||||||
| Shares Redeemed | (2,450,000 | ) | (30,838,375 | ) | (1,100,000 | ) | (17,035,725 | ) | |||||||||
| Net Transactions in Fund Shares | (50,000 | ) | $ | 2,518,035 | 4,300,000 | $ | 62,026,105 | ||||||||||
| Beginning Shares | 4,950,000 | 650,000 | |||||||||||||||
| Ending Shares | 4,900,000 | 4,950,000 | |||||||||||||||
The accompanying notes are an integral part of these financial statements.
35
ETFMG Prime Cyber Security ETF
STATEMENTS OF CHANGES IN NET ASSETS
Year Ended September 30, 2017 | Year Ended September 30, 2016 | |||||||
| OPERATIONS | ||||||||
| Net investment income (loss) | $ | (338,601 | ) | $ | 10,006,317 | |||
| Net realized loss on investments and In-Kind Redemptions | (55,182,766 | ) | (123,324,117 | ) | ||||
| Net change in unrealized appreciation of investments | 122,753,939 | 170,473,814 | ||||||
| Net increase in net assets resulting from operations | 67,232,572 | 57,156,014 | ||||||
| DISTRIBUTIONS TO SHAREHOLDERS | ||||||||
| From net investment income | (3,740,625 | ) | (5,498,499 | ) | ||||
| CAPITAL SHARE TRANSACTIONS | ||||||||
| Net increase (decrease) in net assets derived from net change in outstanding shares (a) | 230,013,980 | (306,990,660 | ) | |||||
| Transaction fees (See Note 1) | 60,036 | 2,025 | ||||||
| Net increase (decrease) in net assets from capital share transactions | 230,074,016 | (306,988,635 | ) | |||||
| Total increase (decrease) in net assets | $ | 293,565,963 | $ | (255,331,120 | ) | |||
| NET ASSETS | ||||||||
| Beginning of Year | 803,793,924 | 1,059,125,044 | ||||||
| End of Year | $ | 1,097,359,887 | $ | 803,793,924 | ||||
| Undistributed net investment income (accumulated loss) | $ | (933,484 | ) | $ | 3,186,993 | |||
(a) Summary of share transactions is as follows:
Year Ended September 30, 2017 | Year Ended September 30, 2016 | ||||||||||||||||
| Shares | Amount | Shares | Amount | ||||||||||||||
| Shares Sold | 17,650,000 | $ | 522,222,875 | 2,200,000 | $ | 57,823,125 | |||||||||||
| Transaction Fees (See Note 1) | — | 60,036 | — | 2,025 | |||||||||||||
| Shares Redeemed | (10,000,000 | ) | (292,208,895 | ) | (15,300,000 | ) | (364,813,785 | ) | |||||||||
| Net Transactions in Fund Shares | 7,650,000 | $ | 230,074,016 | (13,100,000 | ) | $ | (306,988,635 | ) | |||||||||
| Beginning Shares | 28,800,000 | 41,900,000 | |||||||||||||||
| Ending Shares | 36,450,000 | 28,800,000 | |||||||||||||||
The accompanying notes are an integral part of these financial statements.
36
ETFMG Prime Mobile Payments ETF
STATEMENTS OF CHANGES IN NET ASSETS
Year Ended September 30, 2017 | Year Ended September 30, 2016 | |||||||
| OPERATIONS | ||||||||
| Net investment income | $ | 104,929 | $ | 50,012 | ||||
| Net realized gain on investments and In-Kind Redemptions | 4,484,869 | 13,529 | ||||||
| Net change in unrealized appreciation of investments | 21,832,697 | 385,037 | ||||||
| Net increase in net assets resulting from operations | 26,422,495 | 448,578 | ||||||
| DISTRIBUTIONS TO SHAREHOLDERS | ||||||||
| From net investment income | (31,641 | ) | (40,000 | ) | ||||
| CAPITAL SHARE TRANSACTIONS | ||||||||
| Net increase in net assets derived from net change in outstanding shares (a) | 135,868,135 | 3,618,915 | ||||||
| Transaction fees (See Note 1) | 21 | — | ||||||
| Net increase in net assets from capital share transactions | 135,868,156 | 3,618,915 | ||||||
| Total increase in net assets | $ | 162,259,010 | $ | 4,027,493 | ||||
| NET ASSETS | ||||||||
| Beginning of Year | 8,734,430 | 4,706,937 | ||||||
| End of Year | $ | 170,993,440 | $ | 8,734,430 | ||||
| Undistributed net investment income | $ | 61,070 | $ | 9,406 | ||||
(a) Summary of share transactions is as follows:
Year Ended September 30, 2017 | Year Ended September 30, 2016 | ||||||||||||||||
| Shares | Amount | Shares | Amount | ||||||||||||||
| Shares Sold | 5,550,000 | $ | 155,535,335 | 200,000 | $ | 4,842,235 | |||||||||||
| Transaction Fees (See Note 1) | — | 21 | — | — | |||||||||||||
| Shares Redeemed | (650,000 | ) | (19,667,200 | ) | (50,000 | ) | (1,223,320 | ) | |||||||||
| Net Transactions in Fund Shares | 4,900,000 | $ | 135,868,156 | 150,000 | $ | 3,618,915 | |||||||||||
| Beginning Shares | 350,000 | 200,000 | |||||||||||||||
| Ending Shares | 5,250,000 | 350,000 | |||||||||||||||
The accompanying notes are an integral part of these financial statements.
37
ETFMG Drone Economy Strategy ETF
STATEMENTS OF CHANGES IN NET ASSETS
Year Ended September 30, 2017 | Period Ended September 30, 2016* | |||||||
| OPERATIONS | ||||||||
| Net investment income | $ | 120,642 | $ | 14,519 | ||||
| Net realized gain on investments and In-Kind Redemptions | 271,606 | 14,147 | ||||||
Net change in unrealized appreciation of investments | 5,251,260 | 296,988 | ||||||
| Net increase in net assets resulting from operations | 5,643,508 | 325,654 | ||||||
| DISTRIBUTIONS TO SHAREHOLDERS | ||||||||
| From net investment income | (101,055 | ) | (4,000 | ) | ||||
| From net realized gain | (28,851 | ) | — | |||||
| Total Distributions to Shareholders | (129,906 | ) | (4,000 | ) | ||||
| CAPITAL SHARE TRANSACTIONS | ||||||||
| Net increase in net assets derived from net change in outstanding shares (a) | 25,745,485 | 6,364,770 | ||||||
| Transaction Fees (Note 1) | 2,630 | 53 | ||||||
| Net increase in net assets from capital share transactions | 25,748,115 | 6,364,823 | ||||||
| Total increase in net assets | $ | 31,261,717 | $ | 6,686,477 | ||||
| NET ASSETS | ||||||||
| Beginning of Year | 6,686,477 | — | ||||||
| End of Year | $ | 37,948,194 | $ | 6,686,477 | ||||
| Undistributed net investment income | $ | 21,329 | $ | 7,309 | ||||
(a) Summary of share transactions is as follows:
Year Ended September 30, 2017 | Period Ended September 30, 2016* | ||||||||||||||||
| Shares | Amount | Shares | Amount | ||||||||||||||
| Shares Sold | 850,000 | $ | 27,286,680 | 250,000 | $ | 6,364,770 | |||||||||||
| Transaction Fees (See Note 1) | — | 2,630 | — | 53 | |||||||||||||
| Shares Redeemed | (50,000 | ) | (1,541,195 | ) | — | — | |||||||||||
| Net Transactions in Fund Shares | 800,000 | $ | 25,748,115 | 250,000 | $ | 6,364,823 | |||||||||||
| Beginning Shares | 250,000 | — | |||||||||||||||
| Ending Shares | 1,050,000 | 250,000 | |||||||||||||||
*Fund commenced operations on March 8, 2016. The information presented is for the period from March 8, 2016 to September 30, 2016.
The accompanying notes are an integral part of these financial statements.
38
ETFMG Video Game Tech ETF
STATEMENTS OF CHANGES IN NET ASSETS
Year Ended September 30, 2017 | Period Ended September 30, 2016* | |||||||
| OPERATIONS | ||||||||
| Net investment income | $ | 115,714 | $ | 9,076 | ||||
| Net realized gain on investments and In-Kind Redemptions | 2,509,264 | 94,118 | ||||||
| Net change in unrealized appreciation of investments | 2,154,494 | 946,156 | ||||||
| Net increase in net assets resulting from operations | 4,779,472 | 1,049,350 | ||||||
| DISTRIBUTIONS TO SHAREHOLDERS | ||||||||
| From net investment income | (114,780 | ) | — | |||||
| From net realized gain | (96,540 | ) | — | |||||
| Total Distributions to Shareholders | (211,320 | ) | — | |||||
| CAPITAL SHARE TRANSACTIONS | ||||||||
| Net increase in net assets derived from net change in outstanding shares (a) | 28,765,980 | 5,531,370 | ||||||
| Transaction Fees (Note 1) | 18,631 | 193 | ||||||
| Net increase in net assets from capital share transactions | 28,784,611 | 5,531,563 | ||||||
| Net increase in net assets | $ | 33,352,763 | $ | 6,580,913 | ||||
| NET ASSETS | ||||||||
| Beginning of Year | 6,580,913 | — | ||||||
| End of Year | $ | 39,933,676 | $ | 6,580,913 | ||||
| Undistributed net investment income | $ | 53,637 | $ | 6,872 | ||||
(a) Summary of share transactions is as follows:
Year Ended September 30, 2017 | Period Ended September 30, 2016* | ||||||||||||||||
| Shares | Amount | Shares | Amount | ||||||||||||||
| Shares Sold | 900,000 | $ | 37,042,630 | 200,000 | $ | 5,531,370 | |||||||||||
| Transaction Fees (See Note 1) | — | 18,631 | — | 193 | |||||||||||||
| Shares Redeemed | (200,000 | ) | (8,276,650 | ) | — | — | |||||||||||
| Net Transactions in Fund Shares | 700,000 | $ | 28,784,611 | 200,000 | $ | 5,531,563 | |||||||||||
| Beginning Shares | 200,000 | — | |||||||||||||||
| Ending Shares | 900,000 | 200,000 | |||||||||||||||
*Fund commenced operations on March 8, 2016. The information presented is for the period from March 8, 2016 to September 30, 2016.
The accompanying notes are an integral part of these financial statements.
39
ETFMG Prime Junior Silver ETF
For a capital share outstanding throughout the year
Year Ended September 30, 2017 | Year Ended September 30, 2016 | Year Ended September 30, 2015 | Year Ended September 30, 2014 | Period Ended September 30, 20131 | ||||||||||||||||
| Net Asset Value, Beginning of Year | $ | 15.57 | $ | 5.28 | $ | 10.00 | $ | 11.71 | $ | 20.00 | ||||||||||
| Income (Loss) from Investment Operations: | ||||||||||||||||||||
Net investment income loss 2 | (0.06 | ) | (0.06 | ) | (0.03 | ) | (0.06 | ) | (0.02 | ) | ||||||||||
| Net realized and unrealized gain (loss) on investments | (3.61 | ) | 10.47 | (4.69 | ) | (1.64 | ) | (8.27 | ) | |||||||||||
| Total from investment operations | (3.67 | ) | 10.41 | (4.72 | ) | (1.70 | ) | (8.29 | ) | |||||||||||
| Less Distributions: | ||||||||||||||||||||
| Distributions from net investment income | (0.06 | ) | (0.12 | ) | — | (0.01 | ) | — | ||||||||||||
| Total distributions | (0.06 | ) | (0.12 | ) | — | (0.01 | ) | — | ||||||||||||
| Net asset value, end of year | $ | 11.84 | $ | 15.57 | $ | 5.28 | $ | 10.00 | $ | 11.71 | ||||||||||
| Total Return | -23.53 | % | 201.99 | % | -47.20 | % | -14.52 | % | -41.45 | %3 | ||||||||||
| Ratios/Supplemental Data: | ||||||||||||||||||||
| Net assets at end of year (000’s) | $ | 58,033 | $ | 77,065 | $ | 3,432 | $ | 6,997 | $ | 1,757 | ||||||||||
| Expenses to Average Net Assets before legal expense | 0.69 | % | 0.69 | % | 0.69 | % | 0.69 | % | 0.69 | %4 | ||||||||||
| Expenses to Average Net Assets after legal expense | 0.72 | %5 | 0.69 | % | 0.69 | % | 0.69 | % | 0.69 | %4 | ||||||||||
| Net Investment Loss to Average Net Assets | -0.48 | % | -0.45 | % | -0.39 | % | -0.52 | % | -0.21 | %4 | ||||||||||
| Portfolio Turnover Rate | 69 | % | 33 | % | 55 | % | 44 | % | 69 | %3 | ||||||||||
| 1 | Commencement of operations on November 29, 2012. |
| 2 | Calculated based on average shares outstanding during the year. |
| 3 | Not annualized. |
| 4 | Annualized. |
| 5 | The ratio of expenses to average net assets includes legal expense. See note 11 in the Notes to the Financial Statements. |
The accompanying notes are an integral part of these financial statements.
40
ETFMG Prime Cyber Security ETF
FINANCIAL HIGHLIGHTS
For a capital share outstanding throughout the year
Year Ended September 30, 2017 | Year Ended September 30, 2016 | Period Ended September 30, 20151 | ||||||||||
| Net Asset Value, Beginning of Year | $ | 27.91 | $ | 25.28 | $ | 25.00 | ||||||
| Income (Loss) from Investment Operations: | ||||||||||||
Net investment income (loss) 2 | (0.01 | ) | 0.30 | (0.05 | ) | |||||||
| Net realized and unrealized gain on investments | 2.34 | 2.52 | 0.33 | |||||||||
| Total from investment operations | 2.33 | 2.82 | 0.28 | |||||||||
| Less Distributions: | ||||||||||||
| Distributions from net investment income | (0.13 | ) | (0.19 | ) | — | |||||||
| Total distributions | (0.13 | ) | (0.19 | ) | — | |||||||
| Net asset value, end of year | $ | 30.11 | $ | 27.91 | $ | 25.28 | ||||||
| Total Return | 8.42 | % | 11.23 | % | 1.11 | %3 | ||||||
| Ratios/Supplemental Data: | ||||||||||||
| Net assets at end of year (000’s) | $ | 1,097,360 | $ | 803,794 | $ | 1,059,125 | ||||||
| Expenses to Average Net Assets before legal expense | 0.68 | % | 0.75 | % | 0.75 | %4 | ||||||
| Expenses to Average Net Assets after legal expense | 0.72 | %5 | 0.75 | % | 0.75 | %4 | ||||||
| Net Investment Income (Loss) to Average Net Assets | -0.03 | % | 1.21 | % | -0.19 | %4 | ||||||
| Portfolio Turnover Rate | 53 | % | 34 | % | 31 | %3 | ||||||
| 1 | Commencement of operations on November 11, 2014. |
| 2 | Calculated based on average shares outstanding during the year. |
| 3 | Not annualized. |
| 4 | Annualized. |
| 5 | The ratio of expenses to average net assets includes legal expense. See note 11 in the Notes to the Financial Statements. |
The accompanying notes are an integral part of these financial statements.
41
ETFMG Prime Mobile Payments ETF
FINANCIAL HIGHLIGHTS
For a capital share outstanding throughout the year
Year Ended September 30, 2017 | Year Ended September 30, 2016 | Period Ended September 30, 20151 | ||||||||||
| Net Asset Value, Beginning of Year | $ | 24.96 | $ | 23.53 | $ | 25.00 | ||||||
| Income (Loss) from Investment Operations: | ||||||||||||
Net investment income (loss) 2 | 0.03 | 0.15 | (0.01 | ) | ||||||||
| Net realized and unrealized gain (loss) on investments | 7.60 | 1.39 | (1.46 | ) | ||||||||
| Total from investment operations | 7.63 | 1.54 | (1.47 | ) | ||||||||
| Less Distributions: | ||||||||||||
| Distributions from net investment income | (0.02 | ) | (0.11 | ) | — | |||||||
| Total distributions | (0.02 | ) | (0.11 | ) | — | |||||||
| Net asset value, end of year | $ | 32.57 | $ | 24.96 | $ | 23.53 | ||||||
| Total Return | 30.59 | % | 6.51 | % | -5.86 | 3 | ||||||
| Ratios/Supplemental Data: | ||||||||||||
| Net assets at end of year (000’s) | $ | 170,993 | $ | 8,734 | $ | 4,707 | ||||||
| Expenses to Average Net Assets before legal expense | 0.75 | % | 0.75 | % | 0.75 | 4 | ||||||
| Expenses to Average Net Assets after legal expense | 0.80 | %5 | 0.75 | % | 0.75 | 4 | ||||||
| Net Investment Income (Loss) to Average Net Assets | 0.12 | % | 0.63 | % | -0.23 | 4 | ||||||
| Portfolio Turnover Rate | 31 | % | 32 | % | 8 | %3 | ||||||
| 1 | Commencement of operations on July 15, 2015. |
| 2 | Calculated based on average shares outstanding during the year. |
| 3 | Not annualized. |
| 4 | Annualized. |
| 5 | The ratio of expenses to average net assets includes legal expense. See note 11 in the Notes to the Financial Statements. |
The accompanying notes are an integral part of these financial statements.
42
ETFMG Drone Economy Strategy ETF
FINANCIAL HIGHLIGHTS
For a capital share outstanding throughout the year
Year Ended September 30, 2017 | Period Ended September 30, 20161 | |||||||
| Net Asset Value, Beginning of Year | $ | 26.75 | $ | 25.00 | ||||
| Income from Investment Operations: | ||||||||
Net investment income 2 | 0.27 | 0.11 | ||||||
| Net realized and unrealized gain on investments | 9.26 | 1.68 | ||||||
| Total from investment operations | 9.53 | 1.79 | ||||||
| Less Distributions: | ||||||||
| Distributions from net investment income | (0.04 | ) | (0.04 | ) | ||||
| Distributions from net realized gain | (0.10 | ) | — | |||||
| Total distributions | (0.14 | ) | (0.04 | ) | ||||
| Net asset value, end of year | $ | 36.14 | $ | 26.75 | ||||
| Total Return | 36.39 | % | 7.15 | %3 | ||||
| Ratios/Supplemental Data: | ||||||||
| Net assets at end of year (000’s) | $ | 37,948 | $ | 6,686 | ||||
| Expenses to Average Net Assets before legal expense | 0.75 | % | 0.75 | %4 | ||||
| Expenses to Average Net Assets after legal expense | 0.79 | %5 | 0.75 | %4 | ||||
| Net Investment Income to Average Net Assets | 0.87 | % | 0.68 | %4 | ||||
| Portfolio Turnover Rate | 21 | % | 13 | %3 | ||||
| 1 | Commencement of operations on March 8, 2016. |
| 2 | Calculated based on average shares outstanding during the year. |
| 3 | Not annualized. |
| 4 | Annualized. |
| 5 | The ratio of expenses to average net assets includes legal expense. See note 11 in the Notes to the Financial Statements. |
The accompanying notes are an integral part of these financial statements.
43
ETFMG Video Game Tech ETF
FINANCIAL HIGHLIGHTS
For a capital share outstanding throughout the year
Year Ended September 30, 2017 | Period Ended September 30, 20161 | |||||||
| Net Asset Value, Beginning of Year | $ | 32.90 | $ | 25.00 | ||||
| Income from Investment Operations: | ||||||||
Net investment income 2 | 0.33 | 0.08 | ||||||
| Net realized and unrealized gain on investments | 11.71 | 7.82 | ||||||
| Total from investment operations | 12.04 | 7.90 | ||||||
| Less Distributions: | ||||||||
| Distributions from net investment income | (0.18 | ) | — | |||||
| Distributions from net realized gain | (0.39 | ) | — | |||||
| Total distributions | (0.57 | ) | — | |||||
| Net asset value, end of year | $ | 44.37 | $ | 32.90 | ||||
| Total Return | 37.67 | % | 31.62 | %3 | ||||
| Ratios/Supplemental Data: | ||||||||
| Net assets at end of year (000’s) | $ | 39,934 | $ | 6,581 | ||||
| Expenses to Average Net Assets before legal expense | 0.75 | % | 0.74 | %4 | ||||
| Expenses to Average Net Assets after legal expense | 0.82 | %5 | 0.74 | %4 | ||||
| Net Investment Income to Average Net Assets | 0.86 | % | 0.44 | %4 | ||||
| Portfolio Turnover Rate | 49 | % | 10 | %3 | ||||
1 | Commencement of operations on March 8, 2016. |
2 | Calculated based on average shares outstanding during the year. |
3 | Not annualized. |
4 | Annualized. |
5 | The ratio of expenses to average net assets includes legal expense. See note 11 in the Notes to the Financial Statements. |
The accompanying notes are an integral part of these financial statements.
44
ETFMG™ ETFs
NOTE 1 – ORGANIZATION
ETFMG Prime Junior Silver ETF (formerly known as PureFundsTM ISE Junior Silver ETF), ETFMG Prime Cyber Security ETF (formerly known as PureFundsTM ISE Cyber Security ETF), ETFMG Prime Mobile Payments ETF (formerly known as PureFundsTM ISE Mobile Payments ETF), ETFMG Drone Economy Strategy ETF (formerly known as PureFundsTM ISE Drone Economy Strategy ETF), and ETFMG Video Game Tech ETF (formerly known as PureFundsTM ISE Video Game Tech ETF) (each a “Fund”, or collectively the “Funds”) are series of ETF Managers Trust (the “Trust”), an open-end management investment company consisting of multiple investment series, organized as a Delaware statutory trust on July 1, 2009. The Trust is registered with the SEC under the Investment Company Act of 1940, as amended (the “1940 Act”), as an open-end management investment company and the offering of the Funds’ shares (“Shares”) is registered under the Securities Act of 1933, as amended (the “Securities Act”).
The following table is a summary of the Strategy Commencement Date and Strategy of the Funds:
| Fund Ticker | Strategy Commencement Date | Strategy |
| SILJ | 8/1/2017 | Seeks to provide investment results that, before fees and expenses, correspond generally to the price and yield performance of the Prime Junior Silver Miners & Explorers Index (“Prime Silver Index”). |
| HACK | 8/1/2017 | Seeks to provide investment results that, before fees and expenses, correspond generally to the price and yield of the Prime Cyber Defense Index (“Prime Cyber Index”). |
| IPAY | 8/1/2017 | Seeks to provide investment results that, before fees and expenses, correspond generally to the price and yield performance of the Prime Mobile Payments Index (“Prime Mobile Index”). |
| IFLY | 3/8/2016 | Seeks to provide investment results that, before fees and expenses, correspond generally to the price and yield performance of the Reality Shares Drone™ Index. |
| GAMR | 3/8/2016 | Seeks to provide investment results that, before fees and expenses, correspond generally to the price and yield performance of the EEFund Video Game Tech™ Index. |
The Funds each currently offer one class of shares, which have no front end sales load, no deferred sales charges, and no redemption fees. The Funds may issue an unlimited number of shares of beneficial interest, with no par value. All shares of each Fund have equal rights and privileges.
Shares of the Funds are listed and traded on the NYSE Arca, Inc. Market prices for the Shares may be different from their net asset value (“NAV”). Each Fund issues and redeems Shares on a continuous basis at NAV only in blocks of 50,000 shares, called “Creation Units.” Creation Units are issued and redeemed principally in-kind for securities included in a specified Index. Once created, Shares generally trade in the secondary market at market prices that change throughout the day in quantities less than a Creation Unit. Except when aggregated in Creation Units, Shares are not redeemable securities of a Fund. Shares of a Fund may only be purchased or redeemed by certain financial institutions (“Authorized Participants”). An Authorized Participant is either (i) a broker-dealer or other participant in the clearing process through the Continuous Net Settlement System of the National Securities Clearing Corporation or (ii) a DTC participant and, in each case, must have executed a Participant Agreement with the Distributor. Most retail investors do not qualify as Authorized Participants nor have the resources to buy and sell whole Creation Units. Therefore, they are unable to purchase or redeem the Shares directly from a Fund. Rather, most retail investors may purchase Shares in the secondary market with the assistance of a broker and may be subject to customary brokerage commissions or fees.
45
ETFMG™ ETFs
NOTES TO FINANCIAL STATEMENTS
September 30, 2017 (Continued)
September 30, 2017 (Continued)
Authorized Participants transacting in Creation Units for cash may pay an additional variable charge to compensate the relevant Fund for certain transaction costs (i.e., brokerage costs) and market impact expenses relating to investing in portfolio securities. Such variable charges, if any, are included in “Transaction Fees” in the Statements of Changes in Net Assets.
NOTE 2 – SIGNIFICANT ACCOUNTING POLICIES
The following is a summary of significant accounting policies consistently followed by the Funds. These policies are in conformity with accounting principles generally accepted in the United States of America (“U.S. GAAP”).
The Fund follows the investment company accounting and reporting guidance of the Financial Accounting Standards Board Accounting Standard Codification Topic 946 Financial Services –Investment Companies.
The Fund may invest in certain other investment companies (underlying funds). For specific investments in underlying funds, please refer to the complete schedule of portfolio holdings on Form N-CSR(S) for this reporting period, which is filed with the U.S. Securities and Exchange Commission (SEC). For more information about the underlying Fund’s operations and policies, please refer to those Fund’s semiannual and annual reports, which are filed with the SEC.
| A. | Security Valuation. Securities listed on a securities exchange, market or automated quotation system for which quotations are readily available (except for securities traded on NASDAQ), including securities traded over the counter, are valued at the last quoted sale price on the primary exchange or market (foreign or domestic) on which they are traded on the valuation date (or at approximately 4:00 pm Eastern Time if a security’s primary exchange is normally open at that time), or, if there is no such reported sale on the valuation date, at the most recent quoted bid price. For securities traded on NASDAQ, the NASDAQ Official Closing Price will be used. |
Securities for which quotations are not readily available are valued at their respective fair values as determined in good faith by the Board of Trustees (the “Board”). When a security is “fair valued,” consideration is given to the facts and circumstances relevant to the particular situation, including a review of various factors set forth in the pricing procedures adopted by the Funds’ Board. The use of fair value pricing by a Fund may cause the net asset value of its shares to differ significantly from the net asset value that would be calculated without regard to such considerations. As of September 30, 2017, the Funds did not hold any fair valued securities.
As described above, the Funds utilize various methods to measure the fair value of their investments on a recurring basis. U.S. GAAP establishes a hierarchy that prioritizes inputs to valuation methods. The three levels of inputs are:
| Level 1 | Unadjusted quoted prices in active markets for identical assets or liabilities that the Funds have the ability to access. |
46
ETFMG™ ETFs
NOTES TO FINANCIAL STATEMENTS
September 30, 2017 (Continued)
September 30, 2017 (Continued)
Level 2 | Observable inputs other than quoted prices included in Level 1 that are observable for the asset or liability, either directly or indirectly. These inputs may include quoted prices for the identical instrument on an inactive market, prices for similar instruments, interest rates, prepayment speeds, credit risk, yield curves, default rates and similar data. |
| Level 3 | Unobservable inputs for the asset or liability to the extent relevant observable inputs are not available; representing the Funds’ own assumptions about the assumptions a market participant would use in valuing the asset or liability, and would be based on the best information available. |
The availability of observable inputs can vary from security to security and is affected by a wide variety of factors, including, for example, the type of security, whether the security is new and not yet established in the marketplace, the liquidity of markets, and other characteristics particular to the security. To the extent that valuation is based on models or inputs that are less observable or unobservable in the market, the determination of fair value requires more judgment. Accordingly, the degree of judgment exercised in determining fair value is greatest for instruments categorized in Level 3.
The inputs used to measure fair value may fall into different levels of the fair value hierarchy. In such cases, for disclosure purposes, the level in the fair value hierarchy within which the fair value measurement falls in its entirety, is determined based on the lowest level input that is significant to the fair value measurement in its entirety.
The following table presents a summary of the Funds’ investments in securities, at fair value, as of September 30, 2017:
| ETFMG Prime Junior Silver ETF | ||||||||||||||||
Assets^ | Level 1 | Level 2 | Level 3 | Total | ||||||||||||
| Common Stocks | $ | 57,606,729 | $ | 371,497 | $ | — | $ | 57,978,226 | ||||||||
| Short Term Investments | 102,269 | — | — | 102,269 | ||||||||||||
| Total Investments in Securities | $ | 57,708,998 | $ | 371,497 | $ | — | $ | 58,080,495 | ||||||||
| ETFMG Prime Cyber Security ETF | ||||||||||||||||
Assets^ | Level 1 | Level 2 | Level 3 | Total | ||||||||||||
| Common Stocks | $ | 1,096,557,292 | $ | — | $ | — | $ | 1,096,557,292 | ||||||||
| Short Term Investments | 1,346,853 | — | — | 1,346,853 | ||||||||||||
| Investments Purchased with Securities Lending Collateral* | — | — | — | 239,731,705 | ||||||||||||
| Total Investments in Securities | $ | 1,097,904,145 | $ | — | $ | — | $ | 1,337,635,850 | ||||||||
| ETFMG Prime Mobile Payments ETF | ||||||||||||||||
Assets^ | Level 1 | Level 2 | Level 3 | Total | ||||||||||||
| Common Stocks | $ | 170,707,110 | $ | — | $ | — | $ | 170,707,110 | ||||||||
| Short Term Investments | 381,513 | — | — | 381,513 | ||||||||||||
| Investments Purchased with Securities Lending Collateral* | — | — | — | 33,828,336 | ||||||||||||
| Total Investments in Securities | $ | 171,088,623 | $ | — | $ | — | $ | 204,916,959 | ||||||||
47
ETFMG™ ETFs
NOTES TO FINANCIAL STATEMENTS
September 30, 2017 (Continued)
September 30, 2017 (Continued)
| ETFMG Drone Economy Strategy ETF | ||||||||||||||||
Assets^ | Level 1 | Level 2 | Level 3 | Total | ||||||||||||
| Common Stocks | $ | 37,861,306 | $ | — | $ | — | $ | 37,861,306 | ||||||||
| Short Term Investments | 149,121 | — | — | 149,121 | ||||||||||||
| Investments Purchased with Securities Lending Collateral* | — | — | — | 5,267,739 | ||||||||||||
| Total Investments in Securities | $ | 38,010,427 | $ | — | $ | — | $ | 43,278,166 | ||||||||
| ETFMG Video Game Tech ETF | ||||||||||||||||
Assets^ | Level 1 | Level 2 | Level 3 | Total | ||||||||||||
| Common Stocks | $ | 39,567,039 | $ | — | $ | — | $ | 39,567,039 | ||||||||
| Short Term Investments | 253,817 | — | — | 253,817 | ||||||||||||
| Investments Purchased with Securities Lending Collateral* | — | — | — | 3,407,205 | ||||||||||||
| Total Investments in Securities | $ | 39,820,856 | $ | — | $ | — | $ | 43,228,061 | ||||||||
^ See Schedule of Investments for classifications by country and industry.
* Certain investments that are measured at fair value using the net asset value per share (or its equivalent) practical expedient have not been categorized in the fair value hierarchy. The fair value amounts presented in the table are intended to permit reconciliation of the fair value hierarchy to the amounts presented in the Schedules of Investments.
Below are the transfers into or out of Levels 1 and 2 during the year ended September 30, 2017:
| ETFMG Prime Junior Silver ETF | ||||
| Transfers into Level 1 | $ | 574,451 | ||
| Transfers out of Level 1 | (371,497 | ) | ||
| Net Transfers in and/(out) of Level 1 | $ | 202,954 | ||
| Transfers into Level 2 | $ | 371,497 | ||
| Transfers out of Level 2 | (574,451 | ) | ||
| Net Transfers in and/(out) of Level 2 | $ | (202,954 | ) | |
The transfers between Levels 1 and 2 are due to increased/decreased trading activity during the year ended September 30, 2017. Transfers between levels are recognized at the end of the reporting period.
Each of ETFMG Prime Cyber Security ETF, ETFMG Prime Mobile Payments ETF, ETFMG Drone Economy Strategy ETF, and ETFMG Video Game Tech ETF, did not have any transfers among Levels 1, 2, and 3 during the year ended September 30, 2017.
| B. | Federal Income Taxes. The Funds have each elected to be taxed as a “regulated investment company” and intend to distribute substantially all taxable income to their shareholders and otherwise comply with the provisions of the Internal Revenue Code applicable to regulated investment companies. Therefore, no provisions for federal income taxes or excise taxes have been made. |
48
ETFMG™ ETFs
NOTES TO FINANCIAL STATEMENTS
September 30, 2017 (Continued)
September 30, 2017 (Continued)
To avoid imposition of the excise tax applicable to regulated investment companies, each Fund intends to declare each year as dividends, in each calendar year, at least 98.0% of its net investment income (earned during the calendar year) and 98.2% of its net realized capital gains (earned during the twelve months ended October 31) plus undistributed amounts, if any, from prior years.
Net capital losses incurred after October 31, within the taxable year, are deemed to arise on the first business day of each Fund’s next taxable year.
Each Fund recognizes the tax benefits of uncertain tax positions only where the position is “more likely than not” to be sustained assuming examination by tax authorities. Each Fund has analyzed its tax position and has concluded that no liability for unrecognized tax benefits should be recorded related to uncertain tax positions expected to be taken in the Funds’ 2017 tax returns. The Funds identify their major tax jurisdictions as U.S. Federal, the State of New Jersey, and the State of Delaware; however the Funds are not aware of any tax positions for which it is reasonably possible that the total amounts of unrecognized tax benefits will change materially in the next twelve months.
As of September 30, 2017, management has reviewed the tax positions for open periods (for Federal purposes, three years from the date of filing and for state purposes, four years from the date of filing), as applicable to the Funds, and has determined that no provision for income tax is required in the Funds’ financial statements.
C. | Security Transactions and Investment Income. Investment securities transactions are accounted for on the trade date. Gains and losses realized on sales of securities are determined on a specific identification basis. Discounts/premiums on debt securities purchased are accreted/amortized over the life of the respective securities using the effective interest method. Dividend income is recorded on the ex-dividend date. Interest income is recorded on an accrual basis. Income, including gains, from investments in foreign securities received by the Funds may be subject to income, withholding or other taxes imposed by foreign countries. |
| D. | Foreign Currency Translations and Transactions. The Funds may engage in foreign currency transactions. Foreign currency transactions are translated into U.S. dollars on the following basis: (i) market value of investment securities, assets and liabilities at the daily rates of exchange, and (ii) purchases and sales of investment securities, dividend and interest income and certain expenses at the rates of exchange prevailing on the respective dates of such transactions. For financial reporting purposes, the Funds do not isolate changes in the exchange rate of investment securities from the fluctuations arising from changes in the market prices of securities for unrealized gains and losses. However, for federal income tax purposes, the Funds do isolate and treat as ordinary income the effect of changes in foreign exchange rates on realized gains or losses from the sale of investment securities and payables and receivables arising from trade-date and settlement-date differences. |
| E. | Distributions to Shareholders. Distributions to shareholders from net investment income are generally declared and paid by each of the Funds on a quarterly basis. Distributions to shareholders from realized gains on securities for each Fund normally are declared and paid on an annual basis. Distributions are recorded on the ex-dividend date. |
| F. | Use of Estimates. The preparation of financial statements in conformity with U.S. GAAP requires management to make estimates and assumptions that affect the reported amounts of assets and liabilities at the date of the financial statements, as well as the reported amounts of revenues and expenses during the reporting period. Actual results could differ from those estimates. |
49
ETFMG™ ETFs
NOTES TO FINANCIAL STATEMENTS
September 30, 2017 (Continued)
September 30, 2017 (Continued)
| G. | Share Valuation. The net asset value (“NAV”) per share of each Fund is calculated by dividing the sum of the value of the securities held by the Fund, plus cash and other assets, minus all liabilities (including estimated accrued expenses) by the total number of shares outstanding for the Fund, rounded to the nearest cent. The Funds’ shares will not be priced on the days on which the NYSE is closed for trading. For Authorized Participants, the offering and redemption price per share for the Funds are equal to the Funds’ respective net asset value per share. |
| H. | Guarantees and Indemnifications. In the normal course of business, the Funds enter into contracts with service providers that contain general indemnification clauses. The Funds’ maximum exposure under these arrangements is unknown as this would involve future claims that may be made against the Funds that have not yet occurred. However, based on experience, the Funds expect the risk of loss to be remote. |
NOTE 3 – RISK FACTORS
Investing in the Funds may involve certain risks, as discussed in the Funds’ prospectus, including, but not limited to, those described below. Any of these risks could cause an investor to lose money.
Market Risk. Financial markets rise and fall in response to a variety of factors, sometimes rapidly and unpredictably. As with any investment whose performance is tied to these markets, the value of an investment in a Fund will fluctuate, which means that an investor could lose money over short or long periods.
Investment Style Risk. The Funds are not actively managed. Therefore, the Funds follow the securities included in its respective index during upturns as well as downturns. Because of their indexing strategies, the Funds do not take steps to reduce market exposure or to lessen the effects of a declining market. In addition, because of the Funds’ expenses, the Funds’ performance may be below that of their respective index.
Equity Risk. The prices of equity securities rise and fall daily. These price movements may result from factors affecting individual companies, industries or the securities market as a whole. In addition, equity markets tend to move in cycles which may cause stock prices to fall over short or extended periods of time.
Securities Lending Risk. Securities lending involves the risk of loss of rights in, or delay in recovery of, the loaned securities if the borrower fails to return the security loaned or becomes insolvent.
Concentration Risk. To the extent that a Fund’s or an index’s portfolio is concentrated in the securities of issuers in a particular market, industry, group of industries, sector or asset class, the fund may be adversely affected by the performance of those securities, may be subject to increased price volatility and may be more vulnerable to adverse economic, market, political or regulatory occurrences affecting that market, industry, group of industries, sector or asset class.
50
ETFMG™ ETFs
NOTES TO FINANCIAL STATEMENTS
September 30, 2017 (Continued)
September 30, 2017 (Continued)
NOTE 4 – COMMITMENTS AND OTHER RELATED PARTY TRANSACTIONS.
ETF Managers Group, LLC (the “Advisor”), serves as the investment advisor to the Funds. Pursuant to an Investment Advisory Agreement (“Advisory Agreement”) between the Trust, on behalf of the Funds, and the Advisor, the Advisor provides investment advice to the Funds and oversees the day-to-day operations of the Funds, subject to the direction and control of the Board and the officers of the Trust.
Under the Investment Advisory Agreement the Advisor has overall responsibility for the general management and administration of the Funds and arranges for sub-advisory, transfer agency, custody, fund administration, securities lending, and all other non-distribution related services necessary for the Funds to operate. The Advisor bears the costs of all advisory and non-advisory services required to operate the Funds, in exchange for a single unitary fee at the following annual rates:
| ETFMG Prime Junior Silver ETF | 0.69% | |
| ETFMG Prime Cyber Security ETF* | 0.60% | |
| ETFMG Prime Mobile Payments ETF | 0.75% | |
| ETFMG Drone Economy Strategy ETF | 0.75% | |
| ETFMG Video Game Tech ETF | 0.75% |
*Effective May 1, 2017, ETFMG Prime Cyber Security ETF made permanent a reduction in unitary fees to ensure that total expenses do not exceed 0.60% of the Fund’s annual average net assets, from a previous unitary fee of 0.75%.
The Advisor has an agreement with, and is dependent on, a third party to pay the Funds’ expenses in excess of the annual expense rates of each Funds’ average daily net assets. Additionally, under the Investment Advisory Agreement, the Advisor has agreed to pay all expenses of the Funds, except for: the fee paid to the Advisor pursuant to the Investment Advisory Agreement, interest charges on any borrowings, taxes, brokerage commissions and other expenses incurred in placing orders for the purchase and sale of securities and other investment instruments, acquired fund fees and expenses, accrued deferred tax liability, extraordinary expenses, and distribution (12b-1) fees and expenses (collectively, “Excluded Expenses”). Effective April 1, 2017, ETFMG Financial, LLC (“the Sponsor”) began statutory distribution services to the Funds. The Sponsor provides marketing support for the Funds, including distributing marketing materials related to the Funds. Effective August 1, 2017, Level ETF Ventures, LLC serves as the index provider for SILJ, HACK, IPAY, and GAMR. Effective August 1, 2017 Reality Shares, LLC serves as the index provider for IFLY.
Effective April 1, 2017, the Funds changed their distributor from ALPS Distributors, Inc. to ETFMG Financial, LLC.
U.S. Bancorp Fund Services, LLC (the “Administrator”) provides fund accounting, fund administration, and transfer agency services to the Funds. The Advisor compensates the Administrator for these services under an administration agreement between the two parties.
The Advisor pays each independent Trustee a quarterly fee for service to the Funds. Each Trustee is also reimbursed by the Advisor for all reasonable out-of-pocket expenses incurred in connection with his duties as Trustee, including travel and related expenses incurred in attending Board meetings.
NOTE 5 – DISTRIBUTION PLAN
The Funds have each adopted a Plan of Distribution pursuant to Rule 12b-1 under the 1940 Act. Under the Plan, each Fund may pay compensation to the Distributor or any other distributor or financial institution with which the Trust has an agreement with respect to each Fund, with the amount of such compensation not to exceed an annual rate of 0.25% of each Fund’s average daily net assets. During the year ended September 30, 2017, the Funds did not incur any 12b-1 expenses.
51
ETFMG™ ETFs
NOTES TO FINANCIAL STATEMENTS
September 30, 2017 (Continued)
September 30, 2017 (Continued)
NOTE 6 – PURCHASES AND SALES OF SECURITIES
The costs of purchases and sales of securities, excluding short-term securities and in-kind transactions, during the year ended September 30, 2017 are as follows:
| Purchases | Sales | |||||||
| ETFMG Prime Junior Silver ETF | $ | 43,516,347 | $ | 42,624,624 | ||||
| ETFMG Prime Cyber Security ETF | 580,270,156 | 559,169,600 | ||||||
| ETFMG Prime Mobile Payments ETF | 27,716,414 | 28,188,667 | ||||||
| ETFMG Drone Economy Strategy ETF | 3,310,351 | 3,039,693 | ||||||
| ETFMG Video Game Tech ETF | 10,550,745 | 7,821,034 | ||||||
The costs of purchases and sales of in-kind transactions associated with creations and redemptions during the year ended September 30, 2017 are as follows:
Purchases In-Kind | Sales In-Kind | |||||||
| ETFMG Prime Junior Silver ETF | $ | 33,365,001 | $ | 30,380,921 | ||||
| ETFMG Prime Cyber Security ETF | 493,101,960 | 286,747,123 | ||||||
| ETFMG Prime Mobile Payments ETF | 154,955,495 | 18,426,806 | ||||||
| ETFMG Drone Economy Strategy ETF | 26,216,857 | 682,609 | ||||||
| ETFMG Video Game Tech ETF | 33,102,836 | 7,256,817 | ||||||
Purchases in-kind are the aggregate of all in-kind purchases and sales in-kind are the aggregate of all in-kind sales. Net capital gains or losses resulting from in-kind redemptions are excluded from the Funds’ determination of taxable gains and are not distributed to shareholders.
During the year ended September 30, 2017, the Funds paid broker commissions to Penserra Securities, LLC, an affiliated broker to the sub-advisor Penserra Capital Management, LLC, in the amount of $34,718.
There were no purchases or sales of U.S. Government obligations during the year ended September 30, 2017.
NOTE 7 – SECURITIES LENDING
The Funds, except for ETFMG Prime Junior Silver ETF, may lend up to 33 1/3% of the value of the securities in their portfolios to brokers, dealers and financial institutions (but not individuals) under terms of participation in a securities lending program administered by U.S. Bank N.A. (“the Custodian”). The securities lending agreement requires that loans are collateralized at all times in an amount equal to at least 102% of the value of any loaned securities at the time of the loan, plus accrued interest. The Funds receive compensation in the form of fees and earns interest on the cash collateral. The amount of fees depends on a number of factors including the type of security and length of the loan. The Funds continue to receive interest payments or dividends on the securities loaned during the borrowing period. Gain or loss on the fair value of securities loaned that may occur during the term of the loan will be for the account of the Funds. The Funds have the right under the terms of the securities lending agreement to recall the securities from the borrower on demand. During the year ended September 30, 2017, Funds had loaned securities and received cash collateral for the loans. The cash collateral is invested by the Custodian in accordance with approved investment guidelines. Those guidelines require the cash collateral to be invested in readily marketable, high quality, short-term obligations; however, such investments are subject to risk of payment delays or default on the part of the issuer or counterparty or otherwise may not generate sufficient interest to support the costs associated with securities lending. The Funds could also experience delays in recovering their securities and possible loss of income or value if the borrower fails to return the borrowed securities, although the Fund is indemnified from this risk by contract with the securities lending agent.
52
ETFMG™ ETFs
NOTES TO FINANCIAL STATEMENTS
September 30, 2017 (Continued)
September 30, 2017 (Continued)
As of the year ended September 30, 2017, the value of the securities on loan and payable for collateral due to broker were as follows:
Value of Securities on Loan Collateral Received
| Fund | Values of Securities on Loan | Fund Collateral Received* | ||
| ETFMG Prime Cyber Security ETF | $233,713,782 | $239,731,705 | ||
| ETFMG Prime Mobile Payments ETF | 33,191,067 | 33,828,336 | ||
| ETFMG Drone Economy Strategy ETF | 5,200,964 | 5,267,739 | ||
| ETFMG Video Game Tech ETF | 3,296,825 | 3,407,205 |
* The cash collateral received was invested in the Mount Vernon Liquid Assets Portfolio, an investment with an overnight and continuous maturity, as shown on the Schedule of Investments.
Net interest income earned on collateral investments and recognized by the Funds during the year ended September 30, 2017, were as follows:
Fees and Interest Income Earned
| Interest | ||
| income earned | ||
| including | ||
| Fund | applicable fees | |
| ETFMG Prime Cyber Security ETF | $489,967 | |
| ETFMG Prime Mobile Payments ETF | 50,816 | |
| ETFMG Drone Economy Strategy ETF | 59,708 | |
| ETFMG Video Game Tech ETF | 37,155 |
NOTE 8 – FEDERAL INCOME TAXES
The components of distributable earnings (losses) and cost basis of investments for federal income tax purposes at September 30, 2017 were as follows:
| Cost | Gross Unrealized Appreciation | Gross Unrealized Depreciation | Net Unrealized Depreciation (Appreciation) | |||||||||||||
| SILJ | $ | 67,360,521 | $ | 1,412,448 | $ | (10,692,092 | ) | $ | (9,279,644 | ) | ||||||
| HACK | 1,292,858,769 | 116,813,291 | (72,036,210 | ) | 44,777,081 | |||||||||||
| IPAY | 183,951,975 | 23,481,359 | (2,515,418 | ) | 20,965,941 | |||||||||||
| IFLY | 37,964,549 | 6,150,972 | (833,945 | ) | 5,317,027 | |||||||||||
| GAMR | 40,456,291 | 4,257,663 | (1,430,711 | ) | 2,826,952 | |||||||||||
53
ETFMG™ ETFs
NOTES TO FINANCIAL STATEMENTS
September 30, 2017 (Continued)
September 30, 2017 (Continued)
The difference between the tax cost of investments and the cost of investments for GAAP purposes is primarily due to the tax treatment of wash sale losses.
As of September 30, 2017, the components of distributable earnings (loss) on a tax basis were as follows:
| Undistributed Ordinary Income | Undistributed Long-term Gain | Total Distributable Earnings | Other Accumulated Loss | Undistributed Long-term Gain | Total Accumulated Gain (Loss) | |||||||||||||||||||
| SILJ | $ | — | $ | — | $ | — | $ | (18,817,133 | ) | $ | — | $ | (28,096,777 | ) | ||||||||||
| HACK | — | — | — | (196,892,868 | ) | — | (152,205,787 | ) | ||||||||||||||||
| IPAY | 61,070 | — | 61,070 | (172,403 | ) | — | 20,854,608 | |||||||||||||||||
| IFLY | 263,376 | 2,383 | 265,759 | — | — | 5,582,786 | ||||||||||||||||||
| GAMR | 168,037 | — | 168,037 | — | — | 2,994,989 | ||||||||||||||||||
The difference between the tax cost of investments and the cost of investments for GAAP purposes is primarily due to the tax treatment of wash sale losses.
As of September 30, 2017, the Funds had accumulated capital loss carryovers of:
| Capital Loss | ||||
| Carryover | Expires | |||
| SILJ | $ | 18,738,756 | Indefinite | |
| HACK | 196,049,384 | Indefinite | ||
| IPAY | 172,403 | Indefinite | ||
| IFLY | — | Indefinite | ||
| GAMR | — | Indefinite | ||
Under current tax law, capital and currency losses realized after October 31 of a Fund’s fiscal year may be deferred and treated as occurring on the first business day of the following fiscal year for tax purposes. The following Funds had deferred post-October capital and currency losses, which will be treated as arising on the first business day of the year ending September 30, 2017.
| Late | Post- | |||||||
| Year | October | |||||||
| Ordinary | Capital | |||||||
| Loss | Loss | |||||||
| SILJ | $ | 78,377 | $ | — | ||||
| HACK | 933,484 | — | ||||||
| IPAY | — | — | ||||||
| IFLY | — | — | ||||||
| GAMR | — | — | ||||||
54
ETFMG™ ETFs
NOTES TO FINANCIAL STATEMENTS
September 30, 2017 (Continued)
September 30, 2017 (Continued)
U.S. GAAP requires that certain components of net assets relating to permanent differences be reclassified between financial and tax reporting. These reclassifications have no effect on net assets or net asset value per share. For the fiscal year ended September 30, 2017, the following table shows the reclassifications made:
Undistributed Accumulated Net Investment Income/(Loss) | Accumulated Net Realized Loss | Paid-In Capital | |||||||
| ETFMG Prime Junior Silver ETF | $ | 289,106 | $ | (3,535,059) | $ | 3,245,953 | |||
| ETFMG Prime Cyber Security ETF | (41,251) | (60,487,918) | 60,529,169 | ||||||
| ETFMG Prime Mobile Payments ETF | (21,624) | (5,557,187) | 5,578,811 | ||||||
| ETFMG Drone Economy Strategy ETF | (5,567) | (246,956) | 252,523 | ||||||
| ETFMG Video Game Tech ETF | 45,831 | (2,668,537) | 2,622,706 | ||||||
NOTE 9 – DISTRIBUTIONS TO SHAREHOLDERS
The components of the distributions to shareholders during the year ended September 30, 2017, and the year ended September 30, 2016 were as follows:
| Year Ended September 30, 2017 | Year Ended September 30, 2016 | |||||||||||||||
| From Ordinary Income | From Capital Gains | From Ordinary Income | From Capital Gains | |||||||||||||
| SILJ | $ | 258,169 | $ | — | $ | 87,131 | $ | — | ||||||||
| HACK | 3,740,625 | — | 5,498,499 | — | ||||||||||||
| IPAY | 31,641 | — | 40,000 | — | ||||||||||||
| IFLY | 101,055 | 28,851 | 4,000 | — | ||||||||||||
| GAMR | 114,780 | 96,540 | — | — | ||||||||||||
NOTE 10 – INVESTMENTS IN AFFILIATES
ETFMG Prime Junior Silver ETF
ETFMG Prime Junior Silver ETF owned 5% or more of the voting securities of the following companies during the year ended September 30, 2017. After ETFMG Prime Junior Silver ETF sold some of their holdings in the companies, the companies were no longer deemed an affiliate of the Fund as defined by the Investment Company Act of 1940. Transactions during the year in these securities were as follows:
| Share Activity | ||||||||||||||||||||||||||||
| Security Name | Balance September 30, 2016 | Purchases | Sales | Balance September 30, 2017 | Realized Losses1 | Dividend Income | Value September 30, 2017 | |||||||||||||||||||||
| Kootenay Silver, Inc. | $ | 993,718 | $ | 3,088,005 | $ | (2,834,264 | ) | $ | 1,247,459 | $ | (245,629 | ) | $ | — | $ | 224,947 | ||||||||||||
| Santacruz Silver | ||||||||||||||||||||||||||||
| Mining Ltd. | 1,008,819 | 2,606,713 | (2,532,657 | ) | 1,082,875 | (285,813 | ) | — | 138,858 | |||||||||||||||||||
| Excellon | ||||||||||||||||||||||||||||
| Resources, Inc. | 362,439 | 3,229,115 | (3,056,967 | ) | 534,587 | (320,876 | ) | — | 869,735 | |||||||||||||||||||
55
ETFMG™ ETFs
NOTES TO FINANCIAL STATEMENTS
September 30, 2017 (Continued)
September 30, 2017 (Continued)
ETFMG Prime Cyber Security ETF
ETFMG Prime Cyber Security ETF owned 5% or more of the voting securities of the following companies during the year ended September 30, 2017. After ETFMG Prime Cyber Security ETF sold some of their holdings in the companies, the companies were no longer deemed an affiliate of the Fund as defined by the Investment Company Act of 1940. SecureWorks Corp. is deemed to be an affiliate of the Fund as defined by the Investment Company Act of 1940. Transactions during the year in these securities were as follows:
| Share Activity | ||||||||||||||||||||||||||||
| Security Name | Balance September 30, 2016 | Purchases | Sales | Balance September 30, 2017 | Realized Losses1 | Dividend Income | Value September 30, 2017 | |||||||||||||||||||||
| The KEYW Holding Corp. | $ | 1,558,899 | $ | 1,584,242 | $ | (2,465,796 | ) | $ | 677,345 | $ | (5,328,515 | ) | $ | — | $ | 5,154,595 | ||||||||||||
| Precise Biometrics AB | — | 23,538,057 | (23,538,057 | ) | — | (3,716,997 | ) | — | — | |||||||||||||||||||
| SecureWorks Corp.* | 341,301 | 1,311,185 | (883,769 | ) | 768,717 | (824,445 | ) | — | 9,493,655 | |||||||||||||||||||
| Radware, Ltd. | 1,590,920 | 1,201,245 | (2,202,937 | ) | 589,228 | (8,500,975 | ) | — | 9,934,384 | |||||||||||||||||||
| Zix Corp. | 2,236,742 | 2,071,643 | (3,306,567 | ) | 1,001,818 | (2,203,964 | ) | — | 4,898,890 | |||||||||||||||||||
*Affiliate as of September 30, 2017.
1 Realized Losses include transactions in affiliated investments and affiliated in-kind redemptions.
NOTE 11 – LEGAL MATTERS
The Trust, the trustees of the Trust, the Advisor and certain officers of the Advisor are defendants in an action filed May 2, 2017 in the Superior Court of New Jersey captioned PureShares, LLC d/b/a PureFunds et al. v. ETF Managers Group, LLC et al., Docket No. C-63-17. The PureShares action alleges claims based on disputes arising out of contractual relationships with the Advisor. The action seeks damages in unspecified amounts and injunctive relief based on breach of contract, wrongful termination, and several other theories. At the outset of the litigation, and again a few weeks later, plaintiffs sought temporary injunctive relief. Both motions were denied, and the matter is now proceeding through pretrial discovery. The defendants believe the lawsuit is without merit and intend to vigorously defend themselves against the allegations.
The Advisor, its parent, Exchange Traded Managers Group, LLC and its chief executive officer are defendants in a case filed on October 26, 2017 in the United States District Court for the Southern District of New York by NASDAQ, Inc. captioned Nasdaq, Inc. v. Exchange Traded Managers Group, LLC et al., Case 1:17-cv-08252. This action arises out of related facts and circumstances in the New Jersey litigation and asserts claims for breach of contract, wrongful termination and certain other theories with respect to the same exchange traded funds discussed above. The defendants in the Southern District actions believe the lawsuit is without merit and intend to vigorously defend themselves against the allegations and to assert counterclaims against NASDAQ for breaches of its duties under the related index license agreement and various other agreements.
Management of the Trust and the Funds, after consultation with legal counsel, believes that the resolution of these matters will not have a material adverse effect on the Funds’ financial statements.
56
ETFMG™ ETFs
NOTES TO FINANCIAL STATEMENTS
September 30, 2017 (Continued)
September 30, 2017 (Continued)
NOTE 12 – SUBSEQUENT EVENTS
In preparing these financial statements, the Funds have evaluated events and transactions for potential recognition or disclosure through the date the financial statements were issued. See Note 11.
57
ETFMG™ ETFs
To the Board of Trustees of ETF Managers Trust
and the Shareholders of ETFMG Prime Junior Silver ETF, ETFMG Prime Cyber Security ETF,
ETFMG Prime Mobile Payments ETF, ETFMG Drone Economy Strategy ETF and ETFMG Video Game Tech ETF:
We have audited the accompanying statements of assets and liabilities, including the schedules of investments, of ETFMG Prime Junior Silver ETF, ETFMG Prime Cyber Security ETF, ETFMG Prime Mobile Payments ETF, ETFMG Drone Economy Strategy ETF and ETFMG Video Game Tech ETF (collectively the “Funds”) (certain of the Funds comprising ETF Managers Trust) as of September 30, 2017, the related statements of operations for the year then ended, and the statements of changes in net assets and financial highlights for each of the periods presented. These financial statements and financial highlights are the responsibility of the Funds’ management. Our responsibility is to express an opinion on these financial statements and financial highlights based on our audits.
We conducted our audits in accordance with the standards of the Public Company Accounting Oversight Board (United States). Those standards require that we plan and perform the audit to obtain reasonable assurance about whether the financial statements and financial highlights are free of material misstatement. The Funds are not required to have, nor were we engaged to perform, an audit of their internal control over financial reporting. Our audits included consideration of internal control over financial reporting as a basis for designing audit procedures that are appropriate in the circumstances, but not for the purpose of expressing an opinion on the effectiveness of the Funds’ internal control over financial reporting. Accordingly, we express no such opinion. An audit includes examining, on a test basis, evidence supporting the amounts and disclosures in the financial statements. Our procedures included confirmation of securities owned as of September 30, 2017 by correspondence with the custodian. An audit also includes assessing the accounting principles used and significant estimates made by management, as well as evaluating the overall financial statement presentation. We believe that our audits provide a reasonable basis for our opinion.
In our opinion, the financial statements and financial highlights referred to above present fairly, in all material respects, the financial position of ETFMG Prime Junior Silver ETF, ETFMG Prime Cyber Security ETF, ETFMG Prime Mobile Payments ETF, ETFMG Drone Economy Strategy ETF and ETFMG Video Game Tech ETF as of September 30, 2017, the results of their operations for the year then ended, and the changes in their net assets and the financial highlights for each of the periods presented, in conformity with accounting principles generally accepted in the United States of America.
/s/WithumSmith+Brown, PC
New York, NY
November 29, 2017
November 29, 2017
58
ETFMG™ ETFs
ETFMG ETFs Closing Price vs. NAV
The following Frequency Distribution of Premiums and Discounts chart is provided to show the frequency at which the closing price for each Fund is at a premium or discount to its daily net asset value (NAV). The chart presented represents past performance and cannot be used to predict future results.
| ETFMG Prime Junior Silver ETF | Year Ended September 30, 2017 | |||||||
| Premium/Discount Range | Number of Days | Percentage of Total Days | ||||||
| Greater than 1.00% | 4 | 1.6 | ||||||
| Greater Than or equal to 0.75% And Less Than 1.00% | 4 | 1.6 | ||||||
| Greater Than or Equal to 0.50% And Less Than 0.75% | 17 | 6.8 | ||||||
| Greater Than or Equal to 0.25% And Less Than 0.50% | 34 | 13.5 | ||||||
| Greater Than or Equal to 0.00% And Less Than 0.25% | 45 | 17.9 | ||||||
| Less Than or Equal to 0.00% And Greater Than -0.25% | 58 | 23.1 | ||||||
| Less Than or Equal to -0.25% And Greater Than -0.50% | 53 | 21.1 | ||||||
| Less Than or Equal to -0.50% And Greater Than -0.75% | 26 | 10.4 | ||||||
| Less Than or Equal to -0.75% And Greater Than -1.00% | 7 | 2.8 | ||||||
| Less than -1.00% | 3 | 1.2 | ||||||
| ETFMG Prime Junior Silver ETF | Year Ended September 30, 2016 | |||||||
| Premium/Discount Range | Number of Days | Percentage of Total Days | ||||||
| Greater than 1.00% | 65 | 25.7 | ||||||
| Greater Than or equal to 0.75% And Less Than 1.00% | 24 | 9.5 | ||||||
| Greater Than or Equal to 0.50% And Less Than 0.75% | 44 | 17.4 | ||||||
| Greater Than or Equal to 0.25% And Less Than 0.50% | 40 | 15.8 | ||||||
| Greater Than or Equal to 0.00% And Less Than 0.25% | 15 | 5.9 | ||||||
| Less Than or Equal to 0.00% And Greater Than -0.25% | 19 | 7.5 | ||||||
| Less Than or Equal to -0.25% And Greater Than -0.50% | 20 | 7.9 | ||||||
| Less Than or Equal to -0.50% And Greater Than -0.75% | 9 | 3.6 | ||||||
| Less Than or Equal to -0.75% And Greater Than -1.00% | 9 | 3.6 | ||||||
| Less than -1.00% | 8 | 3.2 | ||||||
59
ETFMG™ ETFs
FREQUENCY DISTRIBUTION OF PREMIUMS AND DISCOUNTS (Unaudited) (Cont.)
| ETFMG Prime Junior Silver ETF | Year Ended September 30, 2015 | |||||||
| Premium/Discount Range | Number of Days | Percentage of Total Days | ||||||
| Greater than 1.50% | 21 | 8.3 | ||||||
| Greater Than or equal to 1.25% And Less Than 1.50% | 12 | 4.8 | ||||||
| Greater Than or Equal to 1.00% And Less Than 1.25% | 20 | 7.9 | ||||||
| Greater Than or Equal to 0.75% And Less Than 1.00% | 24 | 9.5 | ||||||
| Greater Than or Equal to 0.50% And Less Than 0.75% | 27 | 10.7 | ||||||
| Greater Than or Equal to 0.25% And Less Than 0.50% | 20 | 7.9 | ||||||
| Greater Than or Equal to 0.00% And Less Than 0.25% | 27 | 10.7 | ||||||
| Less Than or Equal to 0.00% And Greater Than -0.25% | 16 | 6.4 | ||||||
| Less Than or Equal to -0.25% And Greater Than -0.50% | 28 | 11.1 | ||||||
| Less Than or Equal to -0.50% And Greater Than -0.75% | 18 | 7.2 | ||||||
| Less Than or Equal to -0.75% And Greater Than -1.00% | 19 | 7.5 | ||||||
| Less Than or Equal to -1.00% And Greater Than -1.25% | 8 | 3.2 | ||||||
| Less Than or Equal to -1.25% And Greater Than -1.50% | 5 | 2.0 | ||||||
| Less than -1.50% | 7 | 2.8 | ||||||
| ETFMG Prime Junior Silver ETF | Year Ended September 30, 2014 | |||||||
| Premium/Discount Range | Number of Days | Percentage of Total Days | ||||||
| Greater than 1.50% | 28 | 11.1 | ||||||
| Greater Than or equal to 1.25% And Less Than 1.50% | 8 | 3.2 | ||||||
| Greater Than or Equal to 1.00% And Less Than 1.25% | 20 | 7.9 | ||||||
| Greater Than or Equal to 0.75% And Less Than 1.00% | 17 | 6.7 | ||||||
| Greater Than or Equal to 0.50% And Less Than 0.75% | 30 | 11.9 | ||||||
| Greater Than or Equal to 0.25% And Less Than 0.50% | 32 | 12.7 | ||||||
| Greater Than or Equal to 0.00% And Less Than 0.25% | 35 | 13.9 | ||||||
| Less Than or Equal to 0.00% And Greater Than -0.25% | 25 | 9.9 | ||||||
| Less Than or Equal to -0.25% And Greater Than -0.50% | 28 | 11.1 | ||||||
| Less Than or Equal to -0.50% And Greater Than -0.75% | 12 | 4.8 | ||||||
| Less Than or Equal to -0.75% And Greater Than -1.00% | 9 | 3.6 | ||||||
| Less Than or Equal to -1.00% And Greater Than -1.25% | 3 | 1.2 | ||||||
| Less Than or Equal to -1.25% And Greater Than -1.50% | 4 | 1.6 | ||||||
| Less than -1.50% | 1 | 0.4 | ||||||
60
ETFMG™ ETFs
FREQUENCY DISTRIBUTION OF PREMIUMS AND DISCOUNTS (Unaudited) (Cont.)
| ETFMG Prime Junior Silver ETF | November 29, 2012* through September 30, 2013 | |||||||
| Premium/Discount Range | Number of Days | Percentage of Total Days | ||||||
| Greater than 2.50% | 22 | 10.6 | ||||||
| Greater Than or Equal to 2.50% And Less Than 1.50% | 20 | 9.5 | ||||||
| Greater Than or Equal to 1.50% And Less Than 0.75% | 30 | 14.4 | ||||||
| Greater Than or Equal to 0.50% And Less Than 0.75% | 26 | 12.4 | ||||||
| Greater Than or Equal to 0.25% And Less Than 0.50% | 17 | 8.2 | ||||||
| Greater Than or Equal to 0.00% And Less Than 0.25% | 18 | 8.6 | ||||||
| Less Than or Equal to 0.00% And Greater Than -0.50% | 22 | 10.6 | ||||||
| Less Than or Equal to -0.50% And Greater Than -1.25% | 20 | 9.5 | ||||||
| Less Than or Equal to -1.25% And Greater Than -2.0% | 24 | 11.4 | ||||||
| Less than -2.0% | 10 | 4.8 | ||||||
*First day of secondary market trading
| ETFMG Prime Cyber Security ETF | Year Ended September 30, 2017 | |||||||
| Premium/Discount Range | Number of Days | Percentage of Total Days | ||||||
| Greater than 1.00% | 0 | 0.0 | ||||||
| Greater Than or Equal to 0.75% And Less Than 1.00% | 0 | 0.0 | ||||||
| Greater Than or Equal to 0.50% And Less Than 0.75% | 0 | 0.0 | ||||||
| Greater Than or Equal to 0.25% And Less Than 0.50% | 5 | 2.0 | ||||||
| Greater Than or Equal to 0.00% And Less Than 0.25% | 143 | 57.0 | ||||||
| Less Than or Equal to 0.00% And Greater Than -0.25% | 100 | 39.8 | ||||||
| Less Than or Equal to -0.25% And Greater Than -0.50% | 3 | 1.2 | ||||||
| Less Than or Equal to -0.50% And Greater Than -0.75% | 0 | 0.0 | ||||||
| Less Than or Equal to -0.75% And Greater Than -1.00% | 0 | 0.0 | ||||||
| Less than -1.00% | 0 | 0.0 | ||||||
| ETFMG Prime Cyber Security ETF | Year Ended September 30, 2016 | |||||||
| Premium/Discount Range | Number of Days | Percentage of Total Days | ||||||
| Greater than 1.00% | 0 | 0.0 | ||||||
| Greater Than or Equal to 0.75% And Less Than 1.00% | 0 | 0.0 | ||||||
| Greater Than or Equal to 0.50% And Less Than 0.75% | 0 | 0.0 | ||||||
| Greater Than or Equal to 0.25% And Less Than 0.50% | 1 | 0.4 | ||||||
| Greater Than or Equal to 0.00% And Less Than 0.25% | 80 | 31.6 | ||||||
| Less Than or Equal to 0.00% And Greater Than -0.25% | 142 | 56.1 | ||||||
| Less Than or Equal to -0.25% And Greater Than -0.50% | 26 | 10.3 | ||||||
| Less Than or Equal to -0.50% And Greater Than -0.75% | 3 | 1.2 | ||||||
| Less Than or Equal to -0.75% And Greater Than -1.00% | 1 | 0.4 | ||||||
| Less than -1.00% | 0 | 0.0 | ||||||
61
ETFMG™ ETFs
FREQUENCY DISTRIBUTION OF PREMIUMS AND DISCOUNTS (Unaudited) (Cont.)
| ETFMG Prime Cyber Security ETF | November 11, 2014* through September 30, 2015 | |||||||
| Premium/Discount Range | Number of Days | Percentage of Total Days | ||||||
| Greater than 1.50% | 0 | 0.0 | ||||||
| Greater than or equal to 1.25% And Less Than 1.50% | 0 | 0.0 | ||||||
| Greater Than or Equal to 1.00% And Less Than 1.25% | 1 | 0.4 | ||||||
| Greater Than or Equal to 0.75% And Less Than 1.00% | 0 | 0.0 | ||||||
| Greater Than or Equal to 0.50% And Less Than 0.75% | 4 | 1.8 | ||||||
| Greater Than or Equal to 0.25% And Less Than 0.50% | 17 | 7.6 | ||||||
| Greater Than or Equal to 0.00% And Less Than 0.25% | 162 | 72.7 | ||||||
| Less Than or Equal to 0.00% And Greater Than -0.25% | 33 | 14.8 | ||||||
| Less Than or Equal to -0.25% And Greater Than -0.50% | 6 | 2.7 | ||||||
| Less Than or Equal to -0.50% And Greater Than -0.75% | 0 | 0.0 | ||||||
| Less Than or Equal to -0.75% And Greater Than -1.00% | 0 | 0.0 | ||||||
| Less Than or Equal to -1.00% And Greater Than -1.25% | 0 | 0.0 | ||||||
| Less Than or Equal to -1.25% And Greater Than -1.50% | 0 | 0.0 | ||||||
| Less than -1.50% | 0 | 0.0 | ||||||
*First day of secondary market trading
| ETFMG Prime Mobile Payments ETF | Year Ended September 30, 2017 | |||||||
| Premium/Discount Range | Number of Days | Percentage of Total Days | ||||||
| Greater than 1.00% | 1 | 0.4 | ||||||
| Greater Than or Equal to 0.75% And Less Than 1.00% | 0 | 0.0 | ||||||
| Greater Than or Equal to 0.50% And Less Than 0.75% | 4 | 1.6 | ||||||
| Greater Than or Equal to 0.25% And Less Than 0.50% | 26 | 10.3 | ||||||
| Greater Than or Equal to 0.00% And Less Than 0.25% | 202 | 80.5 | ||||||
| Less Than or Equal to 0.00% And Greater Than -0.25% | 16 | 6.4 | ||||||
| Less Than or Equal to -0.25% And Greater Than -0.50% | 1 | 0.4 | ||||||
| Less Than or Equal to -0.50% And Greater Than -0.75% | 1 | 0.4 | ||||||
| Less Than or Equal to -0.75% And Greater Than -1.00% | 0 | 0.0 | ||||||
| Less than -1.00% | 0 | 0.0 | ||||||
62
ETFMG™ ETFs
FREQUENCY DISTRIBUTION OF PREMIUMS AND DISCOUNTS (Unaudited) (Cont.)
| ETFMG Prime Mobile Payments ETF | Year Ended September 30, 2016 | |||||||
| Premium/Discount Range | Number of Days | Percentage of Total Days | ||||||
| Greater than 1.00% | 3 | 1.2 | ||||||
| Greater Than or Equal to 0.75% And Less Than 1.00% | 6 | 2.4 | ||||||
| Greater Than or Equal to 0.50% And Less Than 0.75% | 13 | 5.1 | ||||||
| Greater Than or Equal to 0.25% And Less Than 0.50% | 36 | 14.2 | ||||||
| Greater Than or Equal to 0.00% And Less Than 0.25% | 80 | 31.6 | ||||||
| Less Than or Equal to 0.00% And Greater Than -0.25% | 56 | 22.1 | ||||||
| Less Than or Equal to -0.25% And Greater Than -0.50% | 21 | 8.3 | ||||||
| Less Than or Equal to -0.50% And Greater Than -0.75% | 16 | 6.3 | ||||||
| Less Than or Equal to -0.75% And Greater Than -1.00% | 11 | 4.4 | ||||||
| Less than -1.00% | 11 | 4.4 | ||||||
| ETFMG Prime Mobile Payments ETF | July 15, 2015* through September 30, 2015 | |||||||
| Premium/Discount Range | Number of Days | Percentage of Total Days | ||||||
| Greater than 1.50% | 1 | 1.8 | ||||||
| Greater than or equal to 1.25% And Less Than 1.50% | 1 | 1.8 | ||||||
| Greater Than or Equal to 1.00% And Less Than 1.25% | 0 | 0.0 | ||||||
| Greater Than or Equal to 0.75% And Less Than 1.00% | 1 | 1.8 | ||||||
| Greater Than or Equal to 0.50% And Less Than 0.75% | 1 | 1.8 | ||||||
| Greater Than or Equal to 0.25% And Less Than 0.50% | 4 | 7.3 | ||||||
| Greater Than or Equal to 0.00% And Less Than 0.25% | 27 | 49.1 | ||||||
| Less Than or Equal to 0.00% And Greater Than -0.25% | 14 | 25.5 | ||||||
| Less Than or Equal to -0.25% And Greater Than -0.50% | 3 | 5.5 | ||||||
| Less Than or Equal to -0.50% And Greater Than -0.75% | 1 | 1.8 | ||||||
| Less Than or Equal to -0.75% And Greater Than -1.00% | 2 | 3.6 | ||||||
| Less Than or Equal to -1.00% And Greater Than -1.25% | 0 | 0.0 | ||||||
| Less Than or Equal to -1.25% And Greater Than -1.50% | 0 | 0.0 | ||||||
| Less than -1.50% | 0 | 0.0 | ||||||
*First day of secondary market trading
63
ETFMG™ ETFs
FREQUENCY DISTRIBUTION OF PREMIUMS AND DISCOUNTS (Unaudited) (Cont.)
| ETFMG Drone Economy Strategy ETF | Year Ended September 30, 2017 | |||||||
| Premium/Discount Range | Number of Days | Percentage of Total Days | ||||||
| Greater than 1.00% | 14 | 5.6 | ||||||
| Greater Than or equal to 0.75% And Less Than 1.00% | 39 | 15.5 | ||||||
| Greater Than or Equal to 0.50% And Less Than 0.75% | 52 | 20.7 | ||||||
| Greater Than or Equal to 0.25% And Less Than 0.50% | 80 | 32.0 | ||||||
| Greater Than or Equal to 0.00% And Less Than 0.25% | 47 | 18.7 | ||||||
| Less Than or Equal to 0.00% And Greater Than -0.25% | 16 | 6.3 | ||||||
| Less Than or Equal to -0.25% And Greater Than -0.50% | 3 | 1.2 | ||||||
| Less Than or Equal to -0.50% And Greater Than -0.75% | 0 | 0 | ||||||
| Less Than or Equal to -0.75% And Greater Than -1.00% | 0 | 0 | ||||||
| Less than -1.00% | 0 | 0 | ||||||
| ETFMG Drone Economy Strategy ETF | March 8, 2016* through September 30, 2016 | |||||||
| Premium/Discount Range | Number of Days | Percentage of Total Days | ||||||
| Greater than 1.00% | 7 | 4.8 | ||||||
| Greater Than or Equal to 0.75% And Less Than 1.00% | 23 | 15.9 | ||||||
| Greater Than or Equal to 0.50% And Less Than 0.75% | 40 | 27.6 | ||||||
| Greater Than or Equal to 0.25% And Less Than 0.50% | 36 | 24.8 | ||||||
| Greater Than or Equal to 0.00% And Less Than 0.25% | 22 | 15.2 | ||||||
| Less Than or Equal to 0.00% And Greater Than -0.25% | 10 | 6.9 | ||||||
| Less Than or Equal to -0.25% And Greater Than -0.50% | 4 | 2.8 | ||||||
| Less Than or Equal to -0.50% And Greater Than -0.75% | 3 | 2.1 | ||||||
| Less Than or Equal to -0.75% And Greater Than -1.00% | 0 | 0.0 | ||||||
| Less than -1.00% | 0 | 0.0 | ||||||
*First day of secondary market trading
64
ETFMG™ ETFs
FREQUENCY DISTRIBUTION OF PREMIUMS AND DISCOUNTS (Unaudited) (Cont.)
| ETFMG Video Game Tech ETF | Year Ended September 30, 2017 | |||||||
| Premium/Discount Range | Number of Days | Percentage of Total Days | ||||||
| Greater than 1.00% | 4 | 1.6 | ||||||
| Greater Than or Equal to 0.75% And Less Than 1.00% | 5 | 2.0 | ||||||
| Greater Than or Equal to 0.50% And Less Than 0.75% | 30 | 12.0 | ||||||
| Greater Than or Equal to 0.25% And Less Than 0.50% | 76 | 30.3 | ||||||
| Greater Than or Equal to 0.00% And Less Than 0.25% | 66 | 26.3 | ||||||
| Less Than or Equal to 0.00% And Greater Than -0.25% | 41 | 16.3 | ||||||
| Less Than or Equal to -0.25% And Greater Than -0.50% | 22 | 8.8 | ||||||
| Less Than or Equal to -0.50% And Greater Than -0.75% | 5 | 2.0 | ||||||
| Less Than or Equal to -0.75% And Greater Than -1.00% | 1 | 0.4 | ||||||
| Less than -1.00% | 1 | 0.4 | ||||||
| ETFMG Video Game Tech ETF | March 8, 2016* through September 30, 2016 | |||||||
| Premium/Discount Range | Number of Days | Percentage of Total Days | ||||||
| Greater than 1.00% | 10 | 6.9 | ||||||
| Greater Than or Equal to 0.75% And Less Than 1.00% | 20 | 13.8 | ||||||
| Greater Than or Equal to 0.50% And Less Than 0.75% | 24 | 16.6 | ||||||
| Greater Than or Equal to 0.25% And Less Than 0.50% | 37 | 25.5 | ||||||
| Greater Than or Equal to 0.00% And Less Than 0.25% | 28 | 19.3 | ||||||
| Less Than or Equal to 0.00% And Greater Than -0.25% | 17 | 11.7 | ||||||
| Less Than or Equal to -0.25% And Greater Than -0.50% | 5 | 3.5 | ||||||
| Less Than or Equal to -0.50% And Greater Than -0.75% | 2 | 1.4 | ||||||
| Less Than or Equal to -0.75% And Greater Than -1.00% | 2 | 1.4 | ||||||
| Less than -1.00% | 0 | 0.0 | ||||||
*First day of secondary market trading
65
ETFMG™ ETFs
APPROVAL OF ADVISORY AGREEMENTS AND BOARD CONSIDERATIONS
For the Year Ended September 30, 2017 (Unaudited)
For the Year Ended September 30, 2017 (Unaudited)
Pursuant to Section 15(c) of the Investment Company Act of 1940 (the “1940 Act”), at a meeting held on September 21, 2017, the Board of Trustees (the “Board”) of ETF Managers Trust (the “Trust”) considered the renewal of the Investment Advisory Agreement (“Advisory Agreement”) between ETF Managers Group LLC (the “Adviser”) and the Trust, on behalf of ETFMG Prime Cyber Security ETF (“HACK”), ETFMG Drone Economy Strategy ETF (“IFLY”), and ETFMG Video Game Tech ETF (“GAMR”) (each a “Fund” and collectively the “Funds”).
Pursuant to Section 15(c) of the 1940 Act, the Board must annually review and approve the Advisory Agreement after its initial two-year term: (i) by the vote of the Trustees or by a vote of the shareholders of the Fund; and (ii) by the vote of a majority of the Trustees who are not parties to the Advisory Agreement or “interested persons” of any party thereto, as defined in the 1940 Act (the “Independent Trustees”), cast in person at a meeting called for the purpose of voting on such approval. Each year, the Board calls and holds a meeting to decide whether to renew the Advisory Agreement for an additional one-year term. In preparation for such meetings, the Board requests and reviews a wide variety of information from the Adviser.
In reaching this decision, the Board, including the Independent Trustees, considered all factors it believed relevant, including: (i) the nature, extent and quality of the services provided to the Funds’ shareholders by the Adviser; (ii) the investment performance of the Funds; (iii) the Adviser’s cost and profits they realize in providing their services, including any fall-out benefits enjoyed by the Adviser; (iv) comparative fee and expense data for the Funds in relation to other similar investment companies; (v) the extent to which economies of scale would be realized as the Funds grow and whether the advisory fees for the Funds reflect these economies of scale for the benefit of the Funds; and (vi) other financial benefits to the Adviser and its affiliates resulting from services rendered to the Funds. The Board’s review included written and oral information furnished to the Board prior to and at the meeting held on September 21, 2017, and throughout the year. Among other things, the Adviser provided overviews of its advisory business, including its personnel. The information provided discussed the services provided by the Adviser. The Board then discussed the written and oral information that it received before the meeting and throughout the year, and the Adviser’s oral presentations and any other information that the Board received at the meeting, and deliberated on the renewal of the Advisory Agreement in light of this information.
The Independent Trustees were assisted throughout the contract review process by Schiff Hardin LLP. The Independent Trustees relied upon the advice of such counsel and their own business judgment in determining the material factors to be considered in evaluating the Advisory Agreement, and the weight to be given to each such factor. The conclusions reached with respect to the Advisory Agreement were based on a comprehensive evaluation of all the information provided and not any single factor. Moreover, each Trustee may have placed varying emphasis on particular factors in reaching conclusions with respect to each Fund. The matters discussed were also considered separately by the Independent Trustees in executive session with Schiff Hardin LLP, at which no representatives of management were present.
Nature, Extent and Quality of Services Provided by the Adviser
The Trustees considered the scope of services provided under the Advisory Agreement, noting that the Adviser will be providing investment management services to the Funds. The Board discussed the responsibilities of the Adviser, including: responsibility for the general management of the day-to-day investment and reinvestment of the assets of the Funds; determining the daily baskets of deposit securities and cash components; executing portfolio security trades for purchases and redemptions of Fund shares conducted on a cash-in-lieu basis; responsibility for daily monitoring of tracking error and quarterly reporting to the Board; and implementation of Board directives as they relate to the Funds. In considering the nature, extent and quality of the services provided by the Adviser, the Board considered the quality of the Adviser’s compliance program. The Board also considered the Adviser’s experience managing ETFs. The Board considered the experience of the portfolio managers of the Funds.
66
ETFMG™ ETFs
APPROVAL OF ADVISORY AGREEMENTS AND BOARD CONSIDERATIONS
For the Year Ended September 30, 2017 (Unaudited) (Continued)
For the Year Ended September 30, 2017 (Unaudited) (Continued)
The Board also considered other services provided to the Funds, such as overseeing the Funds’ service providers, monitoring adherence to the Funds’ investment restrictions, and monitoring compliance with various policies and procedures and with applicable securities laws.
Based on the factors above, as well as those discussed below, the Board concluded that it was satisfied with the nature, extent and quality of the services to be provided to the Funds by the Adviser.
Historical Performance
The Board then considered the past performance of the Funds. The Board reviewed information regarding the performance history of the Funds over various time periods, including the year-to-date period, the most recent one-year period and the periods since each Fund’s inception, each as of August 31, 2017. The Board noted that the index-based investment objectives of HACK, IFLY and GAMR made analysis of investment performance, in absolute terms, less of a priority than that which normally attaches to the performance of actively managed funds. Instead, the Board focused on the extent to which HACK, IFLY and GAMR each tracked its underlying index. The Board noted that the Adviser began managing HACK on April 1, 2017 and IFLY and GAMR on January 1, 2017 The Board reviewed information regarding each Fund’s index tracking during the time it was managed by the Adviser, discussing, as applicable, factors which contributed to each Fund’s tracking error over certain periods of time. The Board concluded that, after taking these factors into account, each of HACK, IFLY and GAMR satisfactorily tracked its underlying index. The Board further noted that it had received and would continue to receive regular reports regarding each Fund’s performance at its quarterly meetings. The Board concluded that, given the capabilities and experience of the Adviser’s personnel in managing ETFs, the Adviser would be able to continue to keep the Funds’ tracking error within acceptable ranges.
Cost of Services Provided and Economies of Scale
The Board reviewed the advisory fees for the Funds and compared them to the total operating expenses of other funds in the industry falling within the same style category. The Board took into consideration management’s discussion of the fees, including that the Funds have niche investment strategies and limited peer ETFs.
The Board also noted the importance of the fact that the advisory fee for each Fund was a “unified fee,” meaning that the shareholders of the Funds pay no expenses other than the advisory fee and certain other costs such as interest, brokerage and extraordinary expenses and, to the extent it is implemented, fees pursuant to a Distribution and/or Shareholder Servicing (12b-1) Plan. The Board noted that the Adviser was responsible for compensating the Trust’s other service providers and paying the Funds’ other expenses out of its own fee and resources. The Board also evaluated the compensation and benefits received by the Adviser from its relationship with the Funds, taking into account an analysis of the Adviser’s profitability provided at the meeting. The Board concluded that the advisory fee for each of the Funds was fair and reasonable in light of the factors considered.
67
ETFMG™ ETFs
APPROVAL OF ADVISORY AGREEMENTS AND BOARD CONSIDERATIONS
For the Year Ended September 30, 2017 (Unaudited) (Continued)
For the Year Ended September 30, 2017 (Unaudited) (Continued)
In addition, the Board considered whether economies of scale had been realized for the Funds. The Board noted that the Adviser regularly considers whether fee reductions are appropriate as the Funds grow in size. The Board further noted that the advisory fee with respect to HACK had recently been reduced, effective May 1, 2017, and the Board concluded that neither IFLY nor GAMR had reached a size where it had realized economies of scale that would warrant a fee reduction. The Board noted that a unitary fee provides a level of certainty in expenses for the Funds. The Trustees concluded that the flat advisory fee was reasonable and appropriate.
Based on the Board’s deliberations and its evaluation of the information described above, the Board, including the Independent Trustees, unanimously: (a) concluded that the terms of the Advisory Agreement are fair and reasonable; (b) concluded that the Adviser’s fees are reasonable in light of the services that the Adviser provides to the Funds; and (c) agreed to renew the Advisory Agreement for another year.
68
ETFMG™ ETFs
For the Periods Ended September 30, 2017 (Unaudited)
As a shareholder of ETFMG Prime Junior Silver ETF, ETFMG Prime Cyber Security ETF, ETFMG Prime Mobile Payments ETF, ETFMG Drone Economy Strategy ETF, and ETFMG Video Game Tech ETF (the “Funds”) you incur two types of costs: (1) transaction costs, including brokerage commissions on purchases and sales of Fund shares, and (2) ongoing costs, including management fees and other Fund expenses. These examples are intended to help you understand your ongoing costs (in dollars) of investing in the Funds and to compare these costs with the ongoing costs of investing in other funds. The examples are based on an investment of $1,000 invested at the beginning of the period and held for the entire period (April 1, 2017 to September 30, 2017).
Actual Expenses
The first line of the table provides information about actual account values based on actual returns and actual expenses. You may use the information in this line, together with the amount you invested, to estimate the expenses that you paid over the period. Simply divide your account value by $1,000 (for example, an $8,600 account value divided by $1,000 = 8.6), then, multiply the result by the number in the first line under the heading entitled “Expenses Paid During Period’’ to estimate the expenses you paid on your account during this period.
Hypothetical Example for Comparison Purposes
The second line of the table provides information about hypothetical account values based on a hypothetical return and hypothetical expenses based on the Fund’s actual expense ratio and an assumed rate of return of 5% per year before expenses, which is not the Fund’s actual return. The hypothetical account values and expenses may not be used to estimate the actual ending account balance or expenses you paid for the period. You may use this information to compare the ongoing costs of investing in the Fund and other funds. To do so, compare this 5% hypothetical example with the 5% hypothetical examples that appear in the shareholder reports of the other funds. Please note that the expenses shown in the table are meant to highlight your ongoing costs only and do not reflect any transactional costs, such as brokerage commissions paid on purchases and sales of Fund shares. Therefore, the second line of the table is useful in comparing ongoing costs only and will not help you determine the relative total costs of owning different funds. If these transactional costs were included, your costs would have been higher.
69
ETFMG™ ETFs
EXPENSE EXAMPLES
For the Periods Ended September 30, 2017 (Unaudited) (Continued)
ETFMG Prime Junior Silver ETF
Beginning Account Value April 1, 2017 | Ending Account Value September 30, 2017 | Expenses Paid During the Period^ | |||
| Actual | $1,000.00 | $914.30 | $3.31 | ||
| Hypothetical (5% annual) | $1,000.00 | $1,021.61 | $3.50 |
ETFMG Prime Cyber Security ETF
Beginning Account Value April 1, 2017 | Ending Account Value September 30, 2017 | Expenses Paid During the Period^ | |||
| Actual | $1,000.00 | $1,020.60 | $3.80 | ||
| Hypothetical (5% annual) | $1,000.00 | $1,021.31 | $3.80 |
ETFMG Prime Mobile Payments ETF
Beginning Account Value April 1, 2017 | Ending Account Value September 30, 2017 | Expenses Paid During the Period^ | |||
| Actual | $1,000.00 | $1,164.50 | $4.07 | ||
| Hypothetical (5% annual) | $1,000.00 | $1,021.31 | $3.80 |
ETFMG Drone Economy Strategy ETF
Beginning Account Value April 1, 2017 | Ending Account Value September 30, 2017 | Expenses Paid During the Period^ | |||
| Actual | $1,000.00 | $1,050.60 | $3.83 | ||
| Hypothetical (5% annual) | $1,000.00 | $1,021.19 | $3.78 |
ETFMG Video Game Tech ETF
Beginning Account Value April 1, 2017 | Ending Account Value September 30, 2017 | Expenses Paid During the Period^ | |||
| Actual | $1,000.00 | $1,308.80 | $4.34 | ||
| Hypothetical (5% annual) | $1,000.00 | $1,021.31 | $3.80 |
^ The dollar amounts shown as expenses paid during the period are equal to the annualized six-month expense ratio multiplied by the average account value during the period, multiplied by 183/365 (to reflect the one-half year period in the case of ETFMG Prime Junior Silver ETF, ETFMG Prime Cyber Security ETF, ETFMG Prime Mobile Payments ETF, ETFMG Drone Economy Strategy ETF, and ETFMG Video Game Tech ETF.
70
ETFMG™ ETFs
Set forth below are the names, birth years, positions with the Trust, length of term of office, and the principal occupations and other directorships held during at least the last five years of each of the persons currently serving as a Trustee of the Trust, as well as information about each officer. The business address of each Trustee and officer is 30 Maple Street, Summit, New Jersey 07901.
Name and Year of Birth | Position(s) Held with the Trust, Term of Office and Length of Time Served | Principal Occupation(s) During Past 5 Years | Number of Portfolios in Fund Complex Overseen By Trustee | Other Directorships Held by Trustee During Past 5 Years |
| Interested Trustee* and Officers | ||||
Samuel Masucci, III (1962) | Trustee, Chairman of the Board and President (since 2012); Secretary (since 2014) | Chief Executive Officer, Exchange Traded Managers Group, LLC (since 2013); Chief Executive Officer and Chief Compliance Officer, Factor Advisors, LLC (since 2012); President and Chief Executive Officer, Factor Capital Management LLC (since 2012); President and Chief Executive Officer, GENCAP Ventures, LLC (holding company) (2012–2013); Chief Executive Officer, MacroMarkets LLC (exchange traded funds) (2005–2011); President, Chief Executive and Chief Compliance Officer, Macro Financial (financial services) (2005–2011). | 9 | None |
Reshma J. Amin (1978) | Chief Compliance Officer (since 2016) | Chief Compliance Officer, Exchange Traded Managers Group, LLC (since 2016); Partner, Crow & Cushing (2007–2016). | n/a | n/a |
John A. Flanagan (1946) | Treasurer (since 2015) | President, John A. Flanagan CPA, LLC (accounting services) (since 2010); Chief Financial Officer, Exchange Traded Managers Group, LLC (since 2015); Principal Financial Officer, ETF Managers Capital, LLC (commodity pool operator) (since 2014); Chief Financial Officer, Macromarkets LLC (exchange traded funds) (2007–2010) | n/a | n/a |
* Mr. Masucci is an interested Trustee by virtue of his role as the Chief Executive Officer of the Adviser.
71
ETFMG™ ETFs
Board of Trustees (Continued)
Name and Year of Birth | Position(s) Held with the Trust, Term of Office and Length of Time Served | Principal Occupation(s) During Past 5 Years | Number of Portfolios in Fund Complex Overseen By Trustee | Other Directorships Held by Trustee During Past 5 Years |
| Independent Trustees | ||||
John W. Southard (1969) | Trustee (since 2012) | Director and Co-Founder, T2 Capital Management, 2010 to present; Co-Founder and Head of Research and Trading, PowerShares Capital Management, 2002 to 2009. | 9 | None |
Terr0+y Loebs (1963) | Trustee (since 2014) | Founder and Managing Member, Pulsenomics LLC (index product development and consulting firm) (since 2011); Managing Director, MacroMarkets, LLC (exchange-traded products firm) (2006–2011). | 9 | None |
72
ETFMG™ ETFs
SUPPLEMENTARY INFORMATION
September 30, 2017
September 30, 2017
Qualified Dividend Income/Dividends Received Deduction
For the fiscal year ended September 30, 2017, certain dividends paid by the Funds may be subject to a maximum tax rate of 15%, as provided for by the Jobs and Growth Tax Reconciliation Act of 2003. The percentage of dividends declared from ordinary income designated as qualified dividend income was as follows:
| Fund Ticker | QDI |
| SILJ | 22.21% |
| HACK | 100.00% |
| IPAY | 100.00% |
| IFLY | 56.50% |
| GAMR | 33.25% |
For corporate shareholders, the percent of ordinary income distributions qualifying for the corporate dividends received deduction for the fiscal year ended September 30, 2017 was as follows:
| Fund Ticker | DRD |
| SILJ | 0.00% |
| HACK | 100.00% |
| IPAY | 96.16% |
| IFLY | 27.80% |
| GAMR | 20.07% |
Short Term Capital Gain
The percentage of taxable ordinary income distributions that are designated as short-term capital gain distributions under Internal Revenue Section 871 (k)(2)(C) for each Fund were as follows:
| Fund Ticker | Short-Term Capital Gain |
| SILJ | 0.00% |
| HACK | 0.00% |
| IPAY | 0.00% |
| IFLY | 22.21% |
| GAMR | 45.68% |
During the year ended September 30, 2017, the Funds did not declare any long-term realized gains distributions.
Pursuant to Section 853 of the Internal Revenue Code the Fund designated the following amounts as foreign taxes paid for the year ended September 30, 2017. Foreign taxes paid for purposes of Section 853 may be less than actual foreign taxes paid for financial statement purposes.
| Per Share | ||||||||||
| Fund | Gross Foreign Source Income | Foreign Taxes Passthrough | Gross Foreign Source Income | Foreign Taxes Passthrough | Shares Outstanding at 9/30/17 | |||||
| GAMR | 161,124 | 19,564 | 0.17902667 | 0.02173778 | 900,000 | |||||
73
ETFMG™ ETFs
SUPPLEMENTARY INFORMATION
September 30, 2017 (Continued)
September 30, 2017 (Continued)
Each Fund files its Form N-Q with the Securities and Exchange Commission (the ‘‘SEC’’) no more than sixty days after the Funds’ first and third fiscal quarters. For each Fund, this would be for the fiscal quarters ending June 30 and December 31. Form N-Q includes a complete schedule of the Funds’ portfolio holdings as of the end of those fiscal quarters. The Funds’ N-Q filings can be found free of charge on the SEC’s website at http://www.sec.gov, or they may be reviewed and copied at the SEC’s Public Reference Room in Washington, D.C. (call 800-SEC-0330 for information on the operation of the Public Reference Room). The Funds’ portfolio holdings are posted on the Funds’ website at www.ETFMG.com daily.
A description of the policies and procedures the Funds use to determine how to vote proxies relating to portfolio securities is provided in the Statement of Additional Information (“SAI”). The SAI is available without charge upon request by calling toll-free at (877) 756-7873, by accessing the SEC’s website at www.sec.gov, or by accessing the Funds’ website at www.etfmgfunds.com.
Information regarding how the Funds voted proxies relating to portfolio securities during the period ending June 30 is available by calling toll-free at (877) 756-7873 or by accessing the SEC’s website at www.sec.gov.
Carefully consider each Fund’s investment objectives, risk factors, charges, and expenses before investing. This and additional information can be found in each Fund’s prospectus, which may be obtained by calling 1-844-ETF-MGRS (1-844-383-6477) or by visiting www.pureetfs.com. Read the prospectus carefully before investing.
74
ETF MANAGERS TRUST
ETF Managers Trust, (the “Trust”) has adopted the following privacy policies in order to safeguard the personal information of the Trust’s customers and consumers in accordance with Regulation S-P as promulgated by the U.S. Securities and Exchange Commission.
Trust officers are responsible for ensuring that the following policies and procedures are implemented:
| 1) | The Trust is committed to protecting the confidentiality and security of the information they collect and will handle personal customer and consumer information only in accordance with Regulation S-P and any other applicable laws, rules and regulations1. The Trust will ensure: (a) the security and confidentiality of customer records and information; (b) that customer records and information are protected from any anticipated threats and hazards; and (c) that customer records and information are protected from unauthorized access or use. |
| 2) | The Trust conducts its business affairs through its trustees, officers and third parties that provide services pursuant to agreements with the Trust. The Trust has no employees. It is anticipated that the trustees and officers of the Trust who are not employees of service providers of the Trust will not have access to customer records and information in the performance of their normal responsibilities for the Trust. |
| 3) | The Trust may share customer information with its affiliates, subject to the customers’ right to prohibit such sharing. |
| 4) | The Trust may share customer information with unaffiliated third parties only in accordance with the requirements of Regulation S-P. Pursuant to this policy, the Trust will not share customer information with unaffiliated third parties other than as permitted by law, unless authorized to do so by the customer. |
Consistent with these policies, the Trust has adopted the following procedures:
| 1) | The Trust will determine that the policies and procedures of its affiliates and Service Providers are reasonably designed to safeguard customer information and only permit appropriate and authorized access to and use of customer information through the application of appropriate administrative, technical and physical protections. |
| 2) | The Trust will direct each of its Service Providers to adhere to the privacy policy of the Trust and to its privacy policies with respect to all customer information of the Trust and to take all actions reasonably necessary so that the Trust is in compliance with the provisions of Regulation S-P, including, as applicable, the development and delivery of privacy notices and the maintenance of appropriate and adequate records. |
| 3) | The Trust requires its Service Providers to provide periodic reports to the Trust’s Board of Trustees outlining their privacy policies and the implementation of such policies. Each Service Provider is required to promptly report to the Trust’s Board any material changes to its privacy policy before, or promptly after, the adoption of such changes. |
| 1 | Generally, the Funds have institutional clients which are not considered “customers” for purposes of regulation S-P. |
75
(This page intentionally left blank).
(This page intentionally left blank).
Advisor
ETF Managers Group, LLC
30 Maple Street, Suite 2, Summit, NJ 07901
30 Maple Street, Suite 2, Summit, NJ 07901
Distributor
ETFMG Financial, Inc.
30 Maple Street, Suite 2, Summit, NJ 07901
Custodian
U.S. Bank National Association
Custody Operations
Custody Operations
1555 North River Center Drive, Suite 302, Milwaukee, Wisconsin 53212
Transfer Agent
U.S. Bancorp Fund Services, LLC
615 East Michigan Street, Milwaukee, Wisconsin 53202
Securities Lending Agent
U.S Bank, National Association
Securities Lending
800 Nicolet Mall
Minneapolis, MN 55402-7020
Securities Lending
800 Nicolet Mall
Minneapolis, MN 55402-7020
Independent Registered Public Accounting Firm
WithumSmith + Brown, PC
1411 Broadway, 9th Floor, New York, NY 10018
Legal Counsel
Sullivan & Worcester LLP
1666 K Street NW, Washington, DC 20006
1666 K Street NW, Washington, DC 20006

Annual Report
September 30, 2017
Tierra XP Latin America Real Estate ETF
Ticker: LARE

The Fund is a series of ETF Managers Trust.
TierraXPTM Latin America Real Estate ETF
TABLE OF CONTENTS
September 30, 2017
| Page | |
| 2 | |
| 3 | |
| 4 | |
| 5 | |
| 6 | |
| 7 | |
| 10 | |
| 11 | |
| 12 | |
| 13 | |
| 14 | |
| 23 | |
| 24 | |
| 25 | |
| 28 | |
| 29 | |
| 29 | |
| 30 | |
| 31 | |
| 33 |
Dear Shareholder,
On behalf of the entire team, we want to express our appreciation for the confidence you have placed in the Tierra XP Latin America Real Estate Exchange-Traded Fund (“LARE” or the “Fund”). The following information pertains to the fiscal year ended September 30, 2017.
The Fund saw positive performance during the fiscal year ended September 30, 2017. The Fund NAV reflected a positive return of 20.23% in line with its benchmark, the Solactive Latin America Real Estate Index (“Index”), which posted positive performance of 21.54% over the same period. The primary difference between the Fund return and the Index return was attributable to Fund expenses, which are not a part of the Index.
For the year ended September 30, 2017, the best performing securities in the Fund were Paz Corp SA (up 81.26%), Socovesa SA (up 78.76%), and Grana Y Montero SA ADR (up 73.33%). The worst performing securities in the Fund were Brasil Brokers Participacoes SA (down -94.86%), Casas GEO (down -77.21 %), and Desarrolladora (down -46.75 %).
You can find further details about LARE by visiting www.tierrafunds.com, or by calling 1-844-ETF-MGRS (1-844-383-6477).
Sincerely,
Samuel Masucci III
Chairman of the Board
Samuel Masucci III is a registered representative of ETFMG Financial, LLC.
2
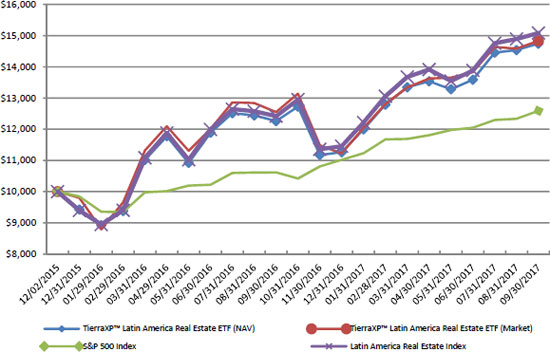
Average Annual Returns Period Ended September 30, 2017 | 1 Year Return | Since Inception (12/2/2015) | |||||
TierraXPTM Latin America Real Estate ETF (NAV) | 20.23 | % | 23.63 | % | |||
TierraXPTM Latin America Real Estate ETF (Market) | 18.15 | % | 24.03 | % | |||
| S&P 500 Index | 18.61 | % | 13.41 | % | |||
| Solactive Latin America Real Estate Index | 21.54 | % | 25.23 | % | |||
Total Fund Operating Expenses1 | 0.79 | % | |||||
1. The expense ratio is taken from the Fund’s most recent prospectus dated January 31, 2017.
Performance data quoted represents past performance and does not guarantee future results. The investment return and principal value of an investment will fluctuate so that an investor’s shares, when sold, may be worth more or less than their original cost. Current performance of the Fund may be lower or higher than the performance quoted. All performance is historical and includes reinvestment of dividends and capital gains. Performance data current to the most recent month end may be obtained by calling 1-844-ETF-MGRS (1-844-383-6477).
The chart illustrates the performance of a hypothetical $10,000 investment made on December 2, 2015, and is not intended to imply any future performance. The returns shown do not reflect a reduction for taxes that a shareholder would pay on Fund distributions from the sale of Fund shares. The chart assumes reinvestment of capital gains and dividends.
The unmanaged indices do not reflect fees and are not available for direct investment.
3
TierraXPTM Latin America Real Estate ETF
Top Ten Holdings*
| Security | % of Total Investments† | |||||
| 1 | PLA Administradora Industrial S de RL de CV | 3.16% | ||||
| 2 | Kinea Rendimentos Imobiliarios FII | 3.07% | ||||
| 3 | MRV Engenharia e Participacoes SA | 3.04% | ||||
| 4 | Fibra Uno Administracion SA de CV | 2.91% | ||||
| 5 | BB Progressivo II FII | 2.89% | ||||
| 6 | Macquarie Mexico Real Estate Management SA de CV | 2.87% | ||||
| 7 | Concentradora Hipotecaria SAPI de CV | 2.81% | ||||
| 8 | FII BTG Pactual Corporate Office Fund | 2.78% | ||||
| 9 | Concentradora Fibra Danhos SA de CV | 2.71% | ||||
| 10 | Grupo Aeroportuario del Pacifico SAB de CV | 2.67% | ||||
Top Ten Holdings = 28.91% of Total Investments† * Current Fund holdings may not be indicative of future Fund holdings. † Percentage of total investments less cash. | ||||||
4
TierraXPTM Latin America Real Estate ETF
Important Disclosures and Key Risk Factors
Investing involves risk, including the possible loss of principal. Shares of any ETF are bought and sold at market price (not NAV), may trade at a discount or premium to NAV and are not individually redeemed from the Fund. Brokerage commissions will reduce returns. Narrowly focused investments typically exhibit higher volatility.
The TierraXPTM Latin America Real Estate ETF (the “Fund”) seeks to provide investment results that, before fees and expenses, correspond generally to the total return performance of the Solactive Latin America Real Estate Index (the “Index”).
Foreign investing involves special risks such as currency fluctuations and political uncertainty. Investments in emerging markets accentuate these risks. The Fund is subject to the risks associated with investing in real estate, which may include possible declines in the value of real estate. Funds focusing on a single country or sector may experience greater price volatility. The Fund’s return may not match or achieve a high degree of correlation with the return of the Solactive Latin America Real Estate Index. To the extent the Fund utilizes a sampling approach, it may experience tracking error to a greater extent than if the Fund had sought to replicate the Index. Diversification does not guarantee a profit, nor does it protect against a loss in a declining market.
Real estate risk factors include, but are not limited to, the fact that direct ownership of real estate is subject to fluctuations in the value of underlying properties, the impact of economic conditions on real estate values, the strength of specific industries renting properties and defaults by borrowers or tenants. Real estate is a cyclical business, highly sensitive to general and local economic conditions and developments, and characterized by intense competition and periodic overbuilding. Changing interest rates and credit quality requirements may affect the cash flow of real estate companies and their ability to borrow or lend money or to meet capital needs.
LAREPR: The Solactive Latin America Real Estate Index screens for all listed equities with primary listings in the Latin America region and which derive substantially most of their income from real estate and real estate services.
MSCI EM: The MSCI Emerging Markets Index captures large and mid cap representation across 23 Emerging Markets (EM) countries*. With 836 constituents, the index covers approximately 85% of the free float-adjusted market capitalization in each country.
MSCI Mexico: The MSCI Mexico Index is designed to measure the performance of the large and mid cap segments of the Mexican market. With 27 constituents, the index covers approximately 85% of the free float-adjusted market capitalization in Mexico.
MSCI Brazil: The MSCI Brazil Index is designed to measure the performance of the large and mid cap segments of the Brazilian market. With 61 constituents, the index covers about 85% of the Brazilian equity universe.
S&P 500: The S&P 500 Index is the Standard & Poor’s composite index of 500 stocks, a widely recognized, unmanaged index of common stock prices.
5
TierraXPTM Latin America Real Estate ETF
As of September 30, 2017 (Unaudited)
TierraXPTM Latin America Real Estate ETF | ||||
| As a percent of Net Assets: | ||||
| Argentina | 2.5 | % | ||
| Brazil | 46.0 | |||
| Chile | 4.6 | |||
| Mexico | 37.2 | |||
| Peru | 0.9 | |||
| United States | 8.1 | |||
| Short-Term and other Net Assets (Liabilities) | 0.7 | |||
| 100.0 | % | |||
6
TierraXPTM Latin America Real Estate ETF
September 30, 2017
| Shares | Fair Value | |||||||
| COMMON STOCKS - 99.3% | ||||||||
| Argentina - 2.5% | ||||||||
| Real Estate Management & Development - 2.5% | ||||||||
| Cresud SACIF y A - ADR (a) | 3,982 | $ | 74,344 | |||||
| IRSA Inversiones y Representaciones SA - ADR (a) ^ | 3,232 | 79,346 | ||||||
| Total Real Estate Management & Development | 153,690 | |||||||
| Brazil - 46.0% | ||||||||
| Capital Markets - 0.1% | ||||||||
| GP Investments Ltd. (a) | 4,704 | 8,689 | ||||||
| Household Durables - 13.0% | ||||||||
| Construtora Tenda SA (a) | 13,640 | 70,415 | ||||||
| Cyrela Brazil Realty SA Empreendimentos e Participacoes | 30,466 | 132,074 | ||||||
| Direcional Engenharia SA (a) | 62,757 | 115,323 | ||||||
| Even Construtora e Incorporadora SA (a) | 36,964 | 64,774 | ||||||
| Ez Tec Empreendimentos e Participacoes SA | 23,102 | 167,111 | ||||||
| Gafisa SA (a) | 8,865 | 38,291 | ||||||
| MRV Engenharia e Participacoes SA | 44,637 | 192,944 | ||||||
| Tecnisa SA (a) | 48,492 | 35,215 | ||||||
| Total Household Durables | 816,147 | |||||||
| Real Estate Investment Trusts (REITs) - 19.8% | ||||||||
| BB Progressivo II FII | 3,758 | 183,322 | ||||||
| CSHG Brasil Shopping Investimento Imobiliario | 145 | 109,878 | ||||||
| CSHG Logistica FI Imobiliario | 212 | 87,311 | ||||||
| CSHG Real Estate FI Imobiliario | 226 | 112,745 | ||||||
| FII BTG Pactual Corporate Office Fund | 5,872 | 176,782 | ||||||
| FII TB Office | 1,225 | 28,119 | ||||||
| JS Real Estate Multigestao FII | 3,750 | 115,502 | ||||||
| Kinea Renda Imobiliaria FII | 2,509 | 133,921 | ||||||
| Kinea Rendimentos Imobiliarios FII | 5,905 | 195,096 | ||||||
| Santander Agencias FII | 2,188 | 98,790 | ||||||
| Total Real Estate Investment Trusts (REITs) | 1,241,466 | |||||||
| Real Estate Management & Development - 13.1% | ||||||||
| Aliansce Shopping Centers SA (a) | 17,422 | 102,041 | ||||||
| BR Malls Participacoes SA | 31,272 | 139,814 | ||||||
| BR Properties SA | 26,224 | 92,156 | ||||||
| Brasil Brokers Participacoes SA (a) | 61,910 | 24,239 | ||||||
| Helbor Empreendimentos SA (a) | 43,210 | 33,835 | ||||||
| Iguatemi Empresa de Shopping Centers SA | 12,781 | 157,787 | ||||||
| JHSF Participacoes SA (a) | 72,621 | 53,655 | ||||||
| Multiplan Empreendimentos Imobiliarios SA | 6,304 | 146,436 | ||||||
| Sao Carlos Empreendimentos e Participacoes SA | 5,446 | 70,054 | ||||||
| Total Real Estate Management & Development | 820,017 | |||||||
| Total Brazil | 2,886,319 | |||||||
| Chile - 4.6% | ||||||||
| Household Durables - 1.1% | ||||||||
| Socovesa SA | 122,332 | 68,839 | ||||||
The accompanying notes are an integral part of these financial statements.
7
TierraXPTM Latin America Real Estate ETF
Schedule of Investments
September 30, 2017 (Continued)
| Shares | Fair Value | |||||||
| Real Estate Management & Development - 3.5% | ||||||||
| Parque Arauco SA | 51,674 | $ | 141,317 | |||||
| PAZ Corporacion SA | 57,590 | 75,581 | ||||||
| Total Real Estate Management & Development | 216,898 | |||||||
| Total Chile | 285,737 | |||||||
| Mexico - 37.2% | ||||||||
| Construction & Engineering - 0.9% | ||||||||
| Empresas ICA SAB de CV (a) | 155,893 | 12,670 | ||||||
| Impulsora del Desarrollo y el Empleo en America Latina SAB de CV (a) | 24,617 | 45,963 | ||||||
| Total Construction & Engineering | 58,633 | |||||||
| Hotels, Restaurants & Leisure - 1.1% | ||||||||
| Grupo Hotelero Santa Fe SAB de CV (a) | 29,376 | 16,471 | ||||||
| Hoteles City Express SAB de CV (a) | 43,397 | 51,618 | ||||||
| Total Hotels, Restaurants & Leisure | 68,089 | |||||||
| Household Durables - 1.4% | ||||||||
| Consorcio ARA SAB de CV | 148,661 | 51,595 | ||||||
| Corporacion GEO SAB De CV (a) | 32,684 | 3,069 | ||||||
| Corpovael SA de CV | 38,680 | 25,468 | ||||||
| Desarrolladora Homex SAB de CV (a) | 135,540 | 7,220 | ||||||
| Total Household Durables | 87,352 | |||||||
| Real Estate Investment Trusts (REITs) - 23.1% | ||||||||
| Asesor de Activos Prisma SAPI de CV | 165,408 | 109,909 | ||||||
| Concentradora Fibra Danhos SA de CV | 100,806 | 172,494 | ||||||
| Concentradora Fibra Hotelera Mexicana SA de CV | 156,805 | 120,467 | ||||||
| Concentradora Hipotecaria SAPI de CV | 155,270 | 178,633 | ||||||
| Fibra Shop Portafolios Inmobiliarios SAPI de CV | 221,178 | 132,148 | ||||||
| Fibra Uno Administracion SA de CV | 109,641 | 184,963 | ||||||
| Macquarie Mexico Real Estate Management SA de CV | 137,932 | 182,470 | ||||||
| PLA Administradora Industrial S de RL de CV | 116,720 | 200,944 | ||||||
| Prologis Property Mexico SA de CV | 84,306 | 166,760 | ||||||
| Total Real Estate Investment Trusts (REITs) | 1,448,788 | |||||||
| Real Estate Management & Development - 3.1% | ||||||||
| Corporacion Inmobiliaria Vesta SAB de CV | 91,122 | 129,803 | ||||||
| Grupo GICSA SA de CV (a) | 98,260 | 64,589 | ||||||
| Total Real Estate Management & Development | 194,392 | |||||||
| Transportation Infrastructure - 7.6% | ||||||||
| Grupo Aeroportuario del Centro Norte SAB de CV | 28,982 | 160,316 | ||||||
| Grupo Aeroportuario del Pacifico SAB de CV | 16,542 | 169,416 | ||||||
| Grupo Aeroportuario del Sureste SAB de CV | 7,861 | 149,925 | ||||||
| Total Transportation Infrastructure | 479,657 | |||||||
| Total Mexico | 2,336,911 | |||||||
| Peru - 0.9% | ||||||||
| Construction & Engineering - 0.9% | ||||||||
| Grana y Montero SAA - ADR (a) | 11,642 | 55,998 | ||||||
The accompanying notes are an integral part of these financial statements.
8
TierraXPTM Latin America Real Estate ETF
Schedule of Investments
September 30, 2017 (Continued)
| Shares | Fair Value | |||||||
| United States - 8.1% | ||||||||
| Real Estate Investment Trusts (REITs) - 2.1% | ||||||||
| Prologis, Inc. | 2,092 | $ | 132,758 | |||||
| Real Estate Management & Development - 6.0% | ||||||||
| Brookfield Property Partners LP ^ | 6,652 | 155,324 | ||||||
| CBRE Group, Inc. (a) | 3,237 | 122,618 | ||||||
| Jones Lang LaSalle, Inc. | 784 | 96,824 | ||||||
| Total Real Estate Management & Development | 374,766 | |||||||
| Total United States | 507,524 | |||||||
| TOTAL COMMON STOCKS (Cost $5,440,851) | 6,226,179 | |||||||
| RIGHTS - 0.1% | ||||||||
| CSHG Logistica FII RTS (Level 2) | 206 | 6,446 | ||||||
| TOTAL RIGHTS (Cost $3,082) | 6,446 | |||||||
| SHORT-TERM INVESTMENTS - 0.6% | ||||||||
| Money Market Funds - 0.6% | ||||||||
| Invesco Advisers, Inc. STIT - Treasury Portfolio - Institutional Class, 0.89% (b) | 38,711 | 38,711 | ||||||
| TOTAL SHORT-TERM INVESTMENTS (Cost $38,711) | 38,711 | |||||||
| INVESTMENTS PURCHASED WITH SECURITIES LENDING COLLATERAL - 1.3% | ||||||||
| Investment Companies - 1.3% | ||||||||
| Mount Vernon Liquid Assets Portfolio, LLC, 1.33% (b) + | 82,850 | |||||||
| TOTAL INVESTMENTS PURCHASED WITH PROCEEDS FROM SECURITIES LENDING (Cost $82,850) | 82,850 | |||||||
| Total Investments (Cost $5,565,494) - 101.3% | 6,354,186 | |||||||
| Liabilities in Excess of Other Assets - (1.3)% | (82,779 | ) | ||||||
| TOTAL NET ASSETS - 100.0% | $ | 6,271,407 | ||||||
Percentages are stated as a percent of net assets.
| ADR | American Depositary Receipt |
| (a) | Non-income producing security. |
| (b) | The rate quoted is the annualized seven-day yield at September 30, 2017. |
| ^ | All or a portion of this security is out on loan as of September 30, 2017. Total value of securities out on loan is $79,870. |
| + | Investments purchased with cash proceeds from securities lending. Total cash collateral has a value of $82,850 as of September 30, 2017. |
The Global Industry Classification Standard (GICS®) was developed by and/or is the exclusive property of MSCI, Inc. and Standard & Poor’s Financial Services LLC (“S&P”). GICS® is a service mark of MSCI, Inc. and S&P and has been licensed for use by the Fund’s Administrator, U.S. Bancorp Fund Services, LLC.
The accompanying notes are an integral part of these financial statements.
9
TierraXPTM Latin America Real Estate ETF
As of September 30, 2017
TierraXPTM Latin America Real Estate ETF | ||||
| ASSETS | ||||
| Investments in securities, at fair value* | $ | 6,354,186 | ||
| Cash | 1,301 | |||
| Foreign currency | 684 | |||
| Recievables: | ||||
| Dividends and interest receivable | 1,627 | |||
| Securities lending income receivable | 160 | |||
| Total Assets | 6,357,958 | |||
| LIABILITIES | ||||
| Collateral received for securities loaned (Note 7) | 82,850 | |||
| Payables: | ||||
| Management fees payable | 3,701 | |||
| Total Liabilities | 86,551 | |||
| Net Assets | $ | 6,271,407 | ||
| NET ASSETS CONSIST OF: | ||||
| Paid-in Capital | $ | 5,584,064 | ||
| Undistributed (accumulated) net investment income (loss) | (94,843 | ) | ||
| Accumulated net realized gain (loss) on investments | (6,536 | ) | ||
| Net unrealized appreciation on: | ||||
| Investments in securities | 788,692 | |||
| Foreign currency and translation of other assets and liabilities in foreign currency | 30 | |||
| Net Assets | $ | 6,271,407 | ||
| *Identified Cost: | ||||
| Investments in unaffiliated securities | $ | 5,565,494 | ||
| Foreign currency | 654 | |||
| Shares Outstanding^ | 200,000 | |||
| Net Asset Value, Offering and Redemption Price per Share | $ | 31.36 | ||
^ No par value, unlimited number of shares authorized
The accompanying notes are an integral part of these financial statements.
10
TierraXPTM Latin America Real Estate ETF
Year ended September 30, 2017
TierraXPTM Latin America Real Estate ETF | ||||
| INVESTMENT INCOME | ||||
| Income: | ||||
| Dividends from unaffiliated securities (net of foreign withholdings tax of $15,911) | $ | 95,447 | ||
| Interest | 59 | |||
| Securities lending income | 1,095 | |||
| Total Investment Income | 96,601 | |||
| Expenses: | ||||
| Management fees | 27,597 | |||
| Total Expenses | 27,597 | |||
| Net Investment Income | 69,004 | |||
| REALIZED & UNREALIZED GAIN (LOSS) ON INVESTMENTS | ||||
| Net Realized Gain On: | ||||
| Unaffiliated investments | 37,995 | |||
| Foreign currency | 30,601 | |||
| Net Realized Gain on Investments and Foreign Currency | 68,596 | |||
| Net Change in Unrealized Appreciation (Depreciation) of: | ||||
| Unaffiliated investments in securities | 415,620 | |||
| Foreign currency and foreign currency translation | (159 | ) | ||
| Net Change in Unrealized Appreciation of Investments | 415,461 | |||
| Net Realized and Unrealized Gain on Investments | 484,057 | |||
| NET INCREASE IN NET ASSETS RESULTING FROM OPERATIONS | $ | 553,061 | ||
The accompanying notes are an integral part of these financial statements.
11
TierraXPTM Latin America Real Estate ETF
STATEMENTS OF CHANGES IN NET ASSETS
Year Ended September 30, 2017 | Period Ended September 30, 2016* | |||||||
| OPERATIONS | ||||||||
| Net investment income | $ | 69,004 | $ | 95,904 | ||||
| Net realized gain on investments | 68,596 | 54,830 | ||||||
| Net change in unrealized appreciation of investments | 415,461 | 373,261 | ||||||
| Net increase in net assets resulting from operations | 553,061 | 523,995 | ||||||
| DISTRIBUTIONS TO SHAREHOLDERS | ||||||||
| From net investment income | (263,218 | ) | (93,090 | ) | ||||
| From net realized gain | (70,581 | ) | — | |||||
| Total Distributions to Shareholders | (333,799 | ) | (93,090 | ) | ||||
| CAPITAL SHARE TRANSACTIONS | ||||||||
| Net increase in net assets derived from net change in outstanding shares (a) | 3,084,065 | 2,500,000 | ||||||
| Transaction Fees (Note 1) | 4,359 | 32,816 | ||||||
| Net increase in net assets from capital share transactions | 3,088,424 | 2,532,816 | ||||||
| Net increase in net assets | 3,307,686 | 2,963,721 | ||||||
| NET ASSETS | ||||||||
| Beginning of Year | 2,963,721 | — | ||||||
| End of Year | $ | 6,271,407 | $ | 2,963,721 | ||||
| Undistributed net investment loss | $ | (94,843 | ) | $ | (164 | ) | ||
(a) Summary of share transactions is as follows:
Year Ended September 30, 2017 | Period Ended September 30, 2016* | ||||||||||||||||
| Shares | Amount | Shares | Amount | ||||||||||||||
| Shares Sold | 100,000 | $ | 3,084,065 | 100,000 | $ | 2,500,000 | |||||||||||
| Transaction Fees (Note 1) | — | 4,359 | — | — | |||||||||||||
| Shares Redeemed | — | — | — | — | |||||||||||||
| Net Transactions in Fund Shares | 100,000 | $ | 3,088,424 | 100,000 | $ | 2,500,000 | |||||||||||
| Beginning Shares | 100,000 | — | |||||||||||||||
| Ending Shares | 200,000 | 100,000 | |||||||||||||||
* Fund commenced operations on December 2, 2015. The information presented is for the period from December 2, 2015 to September 30, 2016.
The accompanying notes are an integral part of these financial statements.
12
TierraXPTM Latin America Real Estate ETF
For a capital share outstanding throughout the year
Year Ended September 30, 2017 | Period Ended September 30, 20161 | |||||||
| Net Asset Value, Beginning of Period | $ | 29.64 | $ | 25.00 | ||||
| Income from Investment Operations: | ||||||||
Net investment income 2 | 0.57 | 0.98 | ||||||
| Net realized and unrealized gain on investments | 4.42 | 4.59 | ||||||
| Total from investment operations | 4.99 | 5.57 | ||||||
| Less Distributions: | ||||||||
| Distributions from net investment income | (2.56 | ) | (0.93 | ) | ||||
| Distributions from net realized gain | (0.71 | ) | — | |||||
| Total distributions | (3.27 | ) | (0.93 | ) | ||||
| Net asset value, end of year | $ | 31.36 | $ | 29.64 | ||||
| Total Return | 20.23 | % | 22.63 | %3 | ||||
| Ratios/Supplemental Data: | ||||||||
| Net assets at end of year (000’s) | $ | 6,271 | $ | 2,964 | ||||
| Expenses to Average Net Assets | 0.79 | % | 0.79 | %4 | ||||
| Net Investment Income to Average Net Assets | 1.98 | % | 5.88 | %4 | ||||
| Portfolio Turnover Rate | 44 | % | 44 | %3 | ||||
| 1 | Commencement of operations on December 2, 2015. |
| 2 | Calculated based on average shares outstanding during the year. |
| 3 | Not annualized. |
| 4 | Annualized. |
The accompanying notes are an integral part of these financial statements.
13
TierraXPTM Latin America Real Estate ETF
September 30, 2017
NOTE 1 – ORGANIZATION
TierraXPTM Latin America Real Estate ETF (the “Fund”) is a series of ETF Managers Trust (the “Trust”), an open-end management investment company consisting of multiple investment series, organized as a Delaware statutory trust on July 1, 2009. The Trust is registered with the SEC under the Investment Company Act of 1940, as amended (the “1940 Act”), as an open-end management investment company and the offering of the Fund’s shares (“Shares”) is registered under the Securities Act of 1933, as amended (the “Securities Act”). The Fund seeks to provide investment results that, before fees and expenses, correspond generally to the price and yield performance of the Solactive Latin America Real Estate Index (“The Index”). The Fund commenced operations on December 2, 2015.
The Fund currently offers one class of shares, which has no front end sales load, no deferred sales charges, and no redemption fees. The Fund may issue an unlimited number of shares of beneficial interest, with no par value. All shares of the Fund have equal rights and privileges.
Shares of the Fund are listed and traded on the NYSE Arca, Inc. Market prices for the Shares may be different from their net asset value (“NAV”). The Fund issues and redeems Shares on a continuous basis at NAV only in blocks of 50,000 shares, called “Creation Units.” Creation Units are issued and redeemed principally in-kind for securities included in the Index. Once created, Shares generally trade in the secondary market at market prices that change throughout the day in quantities less than a Creation Unit. Except when aggregated in Creation Units, Shares are not redeemable securities of the Fund. Shares of the Fund may only be purchased or redeemed by certain financial institutions (“Authorized Participants”). An Authorized Participant is either (i) a broker-dealer or other participant in the clearing process through the Continuous Net Settlement System of the National Securities Clearing Corporation or (ii) a DTC participant and, in each case, must have executed a Participant Agreement with the Distributor. Most retail investors do not qualify as Authorized Participants nor have the resources to buy and sell whole Creation Units. Therefore, they are unable to purchase or redeem the Shares directly from the Fund. Rather, most retail investors may purchase Shares in the secondary market with the assistance of a broker and are subject to customary brokerage commissions or fees.
Authorized Participants transacting in Creation Units for cash may pay an additional variable charge to compensate the relevant Fund for certain transaction costs (i.e., brokerage costs) and market impact expenses relating to investing in portfolio securities. Such variable charges, are included in “Transaction Fees” in the Statement of Changes in Net Assets.
NOTE 2 – SIGNIFICANT ACCOUNTING POLICIES
The following is a summary of significant accounting policies consistently followed by the Fund. These policies are in conformity with accounting principles generally accepted in the United States of America (“U.S. GAAP”). The Fund follows the investment company accounting and reporting guidance of the Financial Accounting Board Accounting Standard Codification Topic 946 Financial Services – Investment Companies.
The Fund may invest in certain other investment companies (underlying funds). For specific investments in underlying funds, please refer to the complete schedule of portfolio holdings on Form N-CSR(S) for this reporting period, which is filed with the U.S. Securities Exchange Commission (SEC). For more information about the underlying Fund’s operations and policies, please refer to those Funds’ semiannual and annual reports, which are filed with the SEC.
14
TierraXPTM Latin America Real Estate ETF
NOTES TO FINANCIAL STATEMENTS
September 30, 2017 (Continued)
| A. | Security Valuation. Securities listed on a securities exchange, market or automated quotation system for which quotations are readily available (except for securities traded on NASDAQ), including securities traded over the counter, are valued at the last quoted sale price on the primary exchange or market (foreign or domestic) on which they are traded on the valuation date (or at approximately 4:00 pm Eastern Time if a security’s primary exchange is normally open at that time), or, if there is no such reported sale on the valuation date, at the most recent quoted bid price. For securities traded on NASDAQ, the NASDAQ Official Closing Price will be used. |
Securities for which quotations are not readily available are valued at their respective fair values as determined in good faith by the Board of Trustees (the “Board”). When a security is “fair valued,” consideration is given to the facts and circumstances relevant to the particular situation, including a review of various factors set forth in the pricing procedures adopted by the Fund’s Board. The use of fair value pricing by the Fund may cause the net asset value of its shares to differ significantly from the net asset value that would be calculated without regard to such considerations. As of September 30, 2017, the Fund did not hold any fair valued securities.
As described above, the Fund utilizes various methods to measure the fair value of its investments on a recurring basis. U.S. GAAP establishes a hierarchy that prioritizes inputs to valuation methods. The three levels of inputs are:
| Level 1 | Unadjusted quoted prices in active markets for identical assets or liabilities that the Fund has the ability to access. |
| Level 2 | Observable inputs other than quoted prices included in Level 1 that are observable for the asset or liability, either directly or indirectly. These inputs may include quoted prices for the identical instrument on an inactive market, prices for similar instruments, interest rates, prepayment speeds, credit risk, yield curves, default rates and similar data. |
| Level 3 | Unobservable inputs for the asset or liability, to the extent relevant observable inputs are not available; representing the Fund’s own assumptions about the assumptions a market participant would use in valuing the asset or liability and would be based on the best information available. |
The availability of observable inputs can vary from security to security and is affected by a wide variety of factors, including, for example, the type of security, whether the security is new and not yet established in the marketplace, the liquidity of markets, and other characteristics particular to the security. To the extent that valuation is based on models or inputs that are less observable or unobservable in the market, the determination of fair value requires more judgment. Accordingly, the degree of judgment exercised in determining fair value is greatest for instruments categorized in Level 3.
The inputs used to measure fair value may fall into different levels of the fair value hierarchy. In such cases, for disclosure purposes, the level in the fair value hierarchy within which the fair value measurement falls in its entirety, is determined based on the lowest level input that is significant to the fair value measurement in its entirety.
15
TierraXPTM Latin America Real Estate ETF
NOTES TO FINANCIAL STATEMENTS
September 30, 2017 (Continued)
The following table presents a summary of the Fund’s investments in securities at fair value, as of September 30, 2017:
TierraXPTM Latin America Real Estate ETF
Assets^ | Level 1 | Level 2 | Level 3 | Total | ||||||||||||
| Common Stocks | $ | 6,226,179 | $ | — | $ | — | $ | 6,226,179 | ||||||||
| Rights | — | 6,446 | — | 6,446 | ||||||||||||
| Short-Term Investments | 38,711 | — | — | 38,711 | ||||||||||||
| Investments Purchased with Securities Lending Collateral* | — | — | — | 82,850 | ||||||||||||
| Total Investments in Securities | $ | 6,264,890 | $ | 6,446 | $ | — | $ | 6,354,186 | ||||||||
^ See Schedule of Investments for classifications by country and industry.
* Certain investments that are measured at fair value using the net asset value per share (or its equivalent) practical expedient have not been categorized in the fair value hierarchy. The fair value amounts presented in the table are intended to permit reconciliation of the fair value hierarchy to the amounts presented in the Schedule of Investments.
The Funds did not have any transfers into or out of Level 1, Level 2 or Level 3 during the year ended September 30, 2017.
| B. | Federal Income Taxes. The Fund has elected to be taxed as a “regulated investment company” and intends to distribute substantially all taxable income to its shareholders and otherwise comply with the provisions of the Internal Revenue Code applicable to regulated investment companies. Therefore, no provision for federal income taxes or excise taxes has been made. |
To avoid imposition of the excise tax applicable to regulated investment companies, the Fund intends to declare each year as dividends, in each calendar year, at least 98.0% of its net investment income (earned during the calendar year) and 98.2% of its net realized capital gains (earned during the twelve months ended October 31) plus undistributed amounts, if any, from prior years.
Net capital losses incurred after October 31, within the taxable year are deemed to arise on the first business day of the Fund’s next taxable year.
The Fund recognizes the tax benefits of uncertain tax positions only where the position is “more likely than not” to be sustained assuming examination by tax authorities. The Fund has analyzed its tax position and has concluded that no liability for unrecognized tax benefits should be recorded related to uncertain tax positions expected to be taken in the Fund’s 2017 tax returns. The Fund identifies its major tax jurisdictions as U.S. Federal, the State of New Jersey, and the State of Delaware; however the Fund is not aware of any tax positions for which it is reasonably possible that the total amounts of unrecognized tax benefits will change materially in the next twelve months.
As of September 30, 2017, management has reviewed the tax positions for open periods (for federal purposes, three years from the date of filing and for state purposes, four years from the date of filing) as applicable to the Fund, and has determined that no provision for income tax is required in the Fund’s financial statements.
C. | Security Transactions and Investment Income. Investment securities transactions are accounted for on the trade date. Gains and losses realized on sales of securities are determined on a specific identification basis. Discounts/premiums on debt securities purchased are accreted/amortized over the life of the respective securities using the effective interest method. Dividend income is recorded on the ex-dividend date. Interest income is recorded on an accrual basis. Income, including gains, from investments in foreign securities received by the Fund may be subject to income, withholding or other taxes imposed by foreign countries. |
16
TierraXPTM Latin America Real Estate ETF
NOTES TO FINANCIAL STATEMENTS
September 30, 2017 (Continued)
D. | Foreign Currency Translations and Transactions. The Fund may engage in foreign currency transactions. Foreign currency transactions are translated into U.S. dollars on the following basis: (i) market value of investment securities, assets and liabilities at the daily rates of exchange, and (ii) purchases and sales of investment securities, dividend and interest income and certain expenses at the rates of exchange prevailing on the respective dates of such transactions. For financial reporting purposes, the Fund does not isolate changes in the exchange rate of investment securities from the fluctuations arising from changes in the market prices of securities for unrealized gains and losses. However, for federal income tax purposes, the Fund does isolate and treat as ordinary income the effect of changes in foreign exchange rates on realized gains or losses from the sale of investment securities and payables and receivables arising from trade-date and settlement-date differences. |
| E. | Distributions to Shareholders. Distributions to shareholders from net investment income are declared and paid by the Fund on a monthly basis. Distributions to Shareholders from net realized gains on securities of the Fund normally are declared and paid on an annual basis. Distributions are recorded on the ex-dividend date. |
| F. | Use of Estimates. The preparation of financial statements in conformity with U.S. GAAP requires management to make estimates and assumptions that affect the reported amounts of assets and liabilities at the date of the financial statements, as well as the reported amounts of revenues and expenses during the period. Actual results could differ from those estimates. |
| G. | Share Valuation. The net asset value (“NAV”) per share of the Fund is calculated by dividing the sum of the value of the securities held by the Fund, plus cash and other assets, minus all liabilities (including estimated accrued expenses) by the total number of shares outstanding of the Fund, rounded to the nearest cent. The Fund’s shares will not be priced on the days on which the NYSE is closed for trading. The offering and redemption price per share for the Fund is equal to the Fund’s net asset value per share. |
| H. | Guarantees and Indemnifications. In the normal course of business, the Fund enters into contracts with service providers that contain general indemnification clauses. The Fund’s maximum exposure under these arrangements is unknown as this would involve future claims that may be made against the Fund that have not yet occurred. However, based on experience, the Fund expects the risk of loss to be remote. |
NOTE 3 – RISK FACTORS
Investing in the Tierra XP Latin America Real Estate ETF may involve certain risks, as discussed in the Fund’s prospectus, including, but not limited to, those described below. Any of these risks could cause an investor to lose money.
Market Risk. Financial markets rise and fall in response to a variety of factors, sometimes rapidly and unpredictably. As with any investment whose performance is tied to these markets, the value of an investment in the Fund will fluctuate, which means that an investor could lose money over short or long periods.
17
TierraXPTM Latin America Real Estate ETF
NOTES TO FINANCIAL STATEMENTS
September 30, 2017 (Continued)
Investment Style Risk. The Fund is not actively managed. Therefore, the Fund follows the securities included in its respective index during upturns as well as downturns. Because of its indexing strategy, the Fund does not take steps to reduce market exposure or to lessen the effects of a declining market. In addition, because of the Fund’s expenses, the Fund’s performance may be below that of its index.
Equity Risk. The prices of equity securities rise and fall daily. These price movements may result from factors affecting individual companies, industries or the securities market as a whole. In addition, equity markets tend to move in cycles which may cause stock prices to fall over short or extended periods of time.
Securities Lending Risk. Securities lending involves the risk of loss of rights in, or delay in recovery of, the loaned securities if the borrower fails to return the security loaned or becomes insolvent.
Concentration Risk. To the extent that the Fund’s or its underlying index’s portfolio is concentrated in the securities of issuers in a particular market, industry, group of industries, sector or asset class, the Fund may be adversely affected by the performance of those securities, may be subject to increased price volatility and may be more vulnerable to adverse economic, market, political or regulatory occurrences affecting that market, industry, group of industries, sector or asset class.
NOTE 4 – COMMITMENTS AND OTHER RELATED PARTY TRANSACTIONS.
ETF Managers Group, LLC (the “Advisor”), serves as the investment advisor to the Fund. Pursuant to an Investment Advisory Agreement (“Advisory Agreement”) between the Trust, on behalf of the Fund, and the Advisor, the Advisor provides investment advice to the Fund and oversees the day-today operations of the Fund, subject to the direction and control of the Board and the officers of the Trust.
Under the Investment Advisory Agreement with the Fund, the Advisor has overall responsibility for the general management and administration of the Fund and arranges for sub-advisory, transfer agency, custody, fund administration, securities lending, and all other non-distribution related services necessary for the Fund to operate. The Advisor bears the costs of all advisory and non-advisory services required to operate the Fund, in exchange for a single unitary fee. For services provided the Fund pays the Advisor at an annual rate of 0.79% of the Fund’s average daily net assets. The Advisor has an agreement with, and is dependent on, a third party to pay the Fund’s expenses in excess of 0.79% of the Fund’s average daily net assets. Additionally, under the Investment Advisory Agreement, the Advisor has agreed to pay all expenses of the Fund, except for: the fee paid to the Advisor pursuant to the Investment Advisory Agreement, interest charges on any borrowings, taxes, brokerage commissions and other expenses incurred in placing orders for the purchase and sale of securities and other investment instruments, acquired fund fees and expenses, accrued deferred tax liability, extraordinary expenses, and distribution (12b-1) fees and expenses (collectively, “Excluded Expenses”). The Advisor has entered into an Agreement with Tierra Funds, LLC (the “Sponsor”), under which the Sponsor agrees to sublicense the use of the Underlying Index to the Advisor. The Sponsor also provides marketing support for the Fund, including distributing marketing materials related to the Fund. Tierra Funds, LLC is a privately held business focused on bringing exchange-traded investment products to investors in the U.S. The Sponsor does not make investment decisions, provide investment advice, or otherwise act in the capacity of an investment adviser to the Fund. Additionally, the Sponsor is not involved in the maintenance of the Underlying Index and does not otherwise act in the capacity of an index provider.
18
TierraXPTM Latin America Real Estate ETF
NOTES TO FINANCIAL STATEMENTS
September 30, 2017 (Continued)
U.S. Bancorp Fund Services, LLC (the “Administrator”) provides fund accounting, fund administration, and transfer agency services to the Fund. The Advisor compensates the Administrator for these services under an administration agreement between the two parties.
The Advisor pays each independent Trustee a quarterly fee for service to the Fund. Each Trustee is also reimbursed by the Advisor for all reasonable out-of-pocket expenses incurred in connection with his duties as Trustee, including travel and related expenses incurred in attending Board meetings.
NOTE 5 – DISTRIBUTION PLAN
The Fund has adopted a Plan of Distribution pursuant to Rule 12b-1 under the 1940 Act. Under the Plan, the Fund may pay compensation to the Distributor or any other distributor or financial institution with which the Trust has an agreement with respect to the Fund, with the amount of such compensation not to exceed an annual rate of 0.25% of each Fund’s average daily net assets. For the year ended September 30, 2017, the Fund did not incur any 12b-1 expenses.
NOTE 6 – PURCHASES AND SALES OF SECURITIES
The costs of purchases and sales of securities, excluding short-term securities and in-kind transactions, for the year ended September 30, 2017 are as follows:
| Purchases | Sales | |||||||
TierraXPTM Latin America Real Estate ETF | $ | 2,874,811 | $ | 1,564,241 | ||||
The costs of purchases and sales of in-kind transactions associated with creations and redemptions for the year ended September 30, 2017 are as follows:
Purchases In-Kind | Sales In-Kind | |||||||
TierraXPTM Latin America Real Estate ETF | $ | 1,546,877 | $ | — | ||||
Purchases in-kind are the aggregate of all in-kind purchases and sales in-kind are the aggregate of all proceeds from in-kind sales. Net capital gains or losses resulting from in-kind redemptions are excluded from the determination of the Fund’s taxable gains and are not distributed to shareholders.
There were no purchases or sales of U.S. Government obligations for the year ended September 30, 2017.
NOTE 7 – SECURITIES LENDING
The Fund may lend up to 33 1/3% of the value of the securities in its portfolio to brokers, dealers and financial institutions (but not individuals) under terms of participation in a securities lending program administered by U.S. Bank N.A. (“the Custodian”). The securities lending agreement requires that loans are collateralized at all times in an amount equal to at least 102% of the value of any loaned securities at the time of the loan, plus accrued interest. The Fund receives compensation in the form of fees and earns interest on the cash collateral. The amount of fees depends on a number of factors including the type of security and length of the loan. The Fund continues to receive interest payments or dividends on the securities loaned during the borrowing period. Gain or loss in the fair value of securities loaned that may occur during the term of the loan will be for the account of the Fund. The Fund has the right under the terms of the securities lending agreement to recall the securities from the borrower on demand. The cash collateral is invested by the Custodian in accordance with approved investment guidelines. Those guidelines require the cash collateral to be invested in readily marketable, high quality, short-term obligations; however, such investments are subject to risk of payment delays or default on the part of the issuer or counterparty or otherwise may not generate sufficient interest to support the costs associated with securities lending. The Fund could also experience delays in recovering its securities and possible loss of income or value if the borrower fails to return the borrowed securities, although the Fund is indemnified from this risk by contract with the securities lending agent.
19
TierraXPTM Latin America Real Estate ETF
NOTES TO FINANCIAL STATEMENTS
September 30, 2017 (Continued)
As of September 30, 2017, the value of the securities on loan and payable for collateral due to broker were as follows:
Value of Securities on Loan Collateral Received
| Fund | Values of on LoanSecurities | Fund Received*Collateral | ||||||
TierraXPTM Latin America Real Estate ETF | $ | 79,870 | $ | 82,850 | ||||
* The cash collateral received was invested in the Mount Vernon Liquid Assets Portfolio, an investment with an overnight and continuous maturity, as shown on the Schedule of Investments.
Interest income earned on collateral investments (including applicable fees) and recognized by the Fund during the year ended September 30, 2017, aggregated $1,095.
NOTE 8 – FEDERAL INCOME TAXES
The components of distributable earnings (losses) and cost basis of investments for federal income tax purposes at September 30, 2017 were as follows:
| Cost | Gross Unrealized Appreciation | Gross Unrealized Depreciation | Net Unrealized Appreciation (Depreciation) | |||||||||||||
TierraXPTM Latin America Real Estate ETF | $ | 5,811,821 | $ | 930,946 | $ | (387,897 | ) | $ | 543,049 | |||||||
Undistributed Ordinary Income | Undistributed Long-term Gain | Total Distributable Earnings | Other Accumulated Loss | Total Accumulated Gain | ||||||||||||||||
TierraXPTM Latin America Real Estate ETF | $ | 112,470 | $ | 35,323 | $ | 147,793 | $ | (3,499 | ) | $ | 687,343 | |||||||||
As of September 30, 2017, the Fund had accumulated capital loss carryovers of:
Capital Loss Carryover | Expires | |||
TierraXPTM Latin America Real Estate ETF | None | Indefinite | ||
20
TierraXPTM Latin America Real Estate ETF
NOTES TO FINANCIAL STATEMENTS
September 30, 2017 (Continued)
Under current tax law, capital and currency losses realized after October 31 of a Fund’s fiscal year may be deferred and treated as occurring on the first business day of the following fiscal year for tax purposes. The Fund had deferred post-October capital and currency losses, which will be treated as arising on the first business day of the year ended September 30, 2017.
Late Year Ordinary Loss | Post-October Capital Loss | |||
TierraXPTM Latin America Real Estate ETF | None | None |
U.S. GAAP requires that certain components of net assets relating to permanent differences be reclassified between financial and tax reporting. These reclassifications have no effect on net assets or net asset value per share. For the fiscal year ended September 30, 2017, the following table shows the reclassifications made:
Undistributed Accumulated Net Investment Income | Accumulated Net Realized Loss | Paid-In Capital | |||||
| Tierra XP Latin America Real Estate ETF | $ 99,535 | $ (93,119) | $ (6,416) |
NOTE 9 – DISTRIBUTIONS TO SHAREHOLDERS
The Fund paid $263,218 from ordinary income and $70,581 from capital gains during the year ended September 30, 2017.
NOTE 10 – LEGAL MATTERS
The Trust, the trustees of the Trust, the Advisor and certain officers of the Advisor are defendants in an action filed May 2, 2017 in the Superior Court of New Jersey captioned PureShares, LLC d/b/a PureFunds et al. v. ETF Managers Group, LLC et al., Docket No. C-63-17. The PureShares action alleges claims based on disputes arising out of contractual relationships with the Advisor. The action seeks damages in unspecified amounts and injunctive relief based on breach of contract, wrongful termination, and several other theories. At the outset of the litigation, and again a few weeks later, plaintiffs sought temporary injunctive relief. Both motions were denied, and the matter is now proceeding through pretrial discovery. The defendants believe the lawsuit is without merit and intend to vigorously defend themselves against the allegations.
The Adviser, its parent, Exchange Traded Managers Group, LLC and its chief executive officer are defendants in a case filed on October 26, 2017 in the United States District Court for the Southern District of New York by NASDAQ, Inc. captioned Nasdaq, Inc. v. Exchange Traded Managers Group, LLC et al., Case 1:17-cv-08252. This action arises out of related facts and circumstances in the New Jersey litigation and asserts claims for breach of contract, wrongful termination and certain other theories with respect to the same exchange traded Fund discussed above. The defendants in the Southern District actions believe the lawsuit is without merit and intend to vigorously defend themselves against the allegations and to assert counterclaims against NASDAQ for breaches of its duties under the related index license agreement and various other agreements.
Management of the Trust and the Fund, after consultation with legal counsel, believes that the resolution of these matters will not have a material adverse effect on the Fund’s financial statements.
21
TierraXPTM Latin America Real Estate ETF
NOTES TO FINANCIAL STATEMENTS
September 30, 2017 (Continued)
NOTE 11 – SUBSEQUENT EVENTS
In preparing these financial statements, the Fund has evaluated events and transactions for potential recognition or disclosure through the date the financial statements were issued. (See Note 10). In addition, the Fund identified the following subsequent event for disclosure:
The Board of Trustees of ETF Managers Trust, on October 26, 2017, had approved the following changes to the Fund, effective on or about December 26, 2017: a) The Fund’s name will be changed to the Alternative Agroscience ETF, b) The Fund’s current underlying index, the Solactive Latin America Real Estate Index, will be replaced with the Alternative Agroscience Index, c) The Fund’s investment objective will be changed to the following: “The Alternative Agroscience ETF seeks to provide investment results that, before fees and expenses, correspond generally to the total return performance of the Alternative Agroscience Index”; and d) The non-fundamental policy that under normal circumstances, the Fund will not invest less than 80% of its net assets, plus the amount of any borrowings for investments purposes, in securities of real estate related companies in Latin America will be eliminated.
22
TierraXPTM Latin America Real Estate ETF
To the Board of Trustees of ETF Managers Trust
and the Shareholders of Tierra XP Latin America Real Estate ETF:
We have audited the accompanying statement of assets and liabilities, including the schedule of investments, of Tierra XP Latin America Real Estate ETF (the “Fund”) (a series of ETF Managers Trust), as of September 30, 2017, the related statement of operations for the year then ended, and the statements of changes in net assets and financial highlights for the year then ended and the period from December 2, 2015 (commencement of operations) to September 30, 2016. These financial statements and financial highlights are the responsibility of the Fund’s management. Our responsibility is to express an opinion on these financial statements and financial highlights based on our audits.
We conducted our audits in accordance with the standards of the Public Company Accounting Oversight Board (United States). Those standards require that we plan and perform the audit to obtain reasonable assurance about whether the financial statements and financial highlights are free of material misstatement. The Fund is not required to have, nor were we engaged to perform, an audit of its internal control over financial reporting. Our audit included consideration of internal control over financial reporting as a basis for designing audit procedures that are appropriate in the circumstances, but not for the purpose of expressing an opinion on the effectiveness of the Fund’s internal control over financial reporting. Accordingly, we express no such opinion. An audit includes examining, on a test basis, evidence supporting the amounts and disclosures in the financial statements. Our procedures included confirmation of securities owned as of September 30, 2017 by correspondence with the custodian. An audit also includes assessing the accounting principles used and significant estimates made by management, as well as evaluating the overall financial statement presentation. We believe that our audits provide a reasonable basis for our opinion.
In our opinion, the financial statements and financial highlights referred to above present fairly, in all material respects, the financial position of the Tierra XP Latin America Real Estate ETF series of ETF Managers Trust as of September 30, 2017, the results of its operations for the year then ended, and the changes in its net assets and its financial highlights for the year then ended and the period from December 2, 2015 (commencement of operations) to September 30, 2016, in conformity with accounting principles generally accepted in the United States of America.
/s/WithumSmith+Brown, PC
New York, NY
November 29, 2017
23
TierraXPTM Latin America Real Estate ETF
TierraXPTM Latin America Real Estate ETF Closing Price vs. NAV
The following Frequency Distribution of Premiums and Discounts chart is provided to show the frequency at which the closing price for each Fund is at a premium or discount to its daily net asset value (NAV). The chart presented represents past performance and cannot be used to predict future results.
TierraXPTM Latin America Real Estate ETF | Year Ended September 30, 2017 | |||||
| Premium/Discount Range | Number of Days | Percentage of Total Days | ||||
| 4.00% to 4.50% | 9 | 3.6 | ||||
| 3.50% to 4.00% | 11 | 4.4 | ||||
| 3.00% to 3.50% | 26 | 10.4 | ||||
| 2.50% to 3.00% | 35 | 13.9 | ||||
| 2.00% to 2.50% | 21 | 8.4 | ||||
| 1.50% to 2.00% | 49 | 19.5 | ||||
| 1.00% to 1.50% | 49 | 19.5 | ||||
| 1.00% or Less | 51 | 20.3 | ||||
TierraXPTM Latin America Real Estate ETF | December 2, 2015* through September 30, 2016 | |||||
| Premium/Discount Range | Number of Days | Percentage of Total Days | ||||
| Greater than 1.00% | 186 | 88.6 | ||||
| Greater Than or equal to 0.75% And Less Than 1.00% | 0 | 0.0 | ||||
| Greater Than or Equal to 0.50% And Less Than 0.75% | 3 | 1.4 | ||||
| Greater Than or Equal to 0.25% And Less Than 0.50% | 3 | 1.4 | ||||
| Greater Than or Equal to 0.00% And Less Than 0.25% | 3 | 1.4 | ||||
| Less Than or Equal to 0.0% And Greater Than -0.25% | 2 | 1.0 | ||||
| Less Than or Equal to -0.25% And Greater Than -0.50% | 4 | 1.9 | ||||
| Less Than or Equal to -0.50% And Greater Than -0.75% | 2 | 1.0 | ||||
| Less Than or Equal to -0.75% And Greater Than -1.00% | 3 | 1.4 | ||||
| Less than -1.00% | 4 | 1.9 | ||||
*First day of secondary market trading
24
TierraXPTM Latin America Real Estate ETF
For the Year Ended September 30, 2017 (Unaudited)
Pursuant to Section 15(c) of the Investment Company Act of 1940 (the “1940 Act”), at a meeting held on June 14, 2017, the Board of Trustees (the “Board”) of ETF Managers Trust (the “Trust”) considered the renewal of the Investment Advisory Agreement (“Advisory Agreement”) between ETF Managers Group LLC (the “Adviser”) and the Trust, on behalf of Tierra XP Latin America Real Estate ETF (“LARE”) (the “Fund”).
Pursuant to Section 15(c) of the 1940 Act, the Board must annually review and approve the Advisory Agreement after its initial two-year term: (i) by the vote of the Trustees or by a vote of the shareholders of the Fund; and (ii) by the vote of a majority of the Trustees who are not parties to the Advisory Agreement or “interested persons” of any party thereto, as defined in the 1940 Act (the “Independent Trustees”), cast in person at a meeting called for the purpose of voting on such approval. Each year, the Board calls and holds a meeting to decide whether to renew the Advisory Agreement for an additional one-year term. In preparation for such meetings, the Board requests and reviews a wide variety of information from the Adviser.
In reaching this decision, the Board, including the Independent Trustees, considered all factors it believed relevant, including: (i) the nature, extent and quality of the services provided to the Fund’s shareholders by the Adviser; (ii) the investment performance of the Fund; (iii) the Adviser’s cost and profits they realize in providing their services, including any fall-out benefits enjoyed by the Adviser; (iv) comparative fee and expense data for the Fund in relation to other similar investment companies; (v) the extent to which economies of scale would be realized as the Fund grows and whether the advisory fee for the Fund reflects these economies of scale for the benefit of the Fund; and (vi) other financial benefits to the Adviser and its affiliates resulting from services rendered to the Fund. The Board’s review included written and oral information furnished to the Board prior to and at the meeting held on June 14, 2017, and throughout the year. Among other things, the Adviser provided overviews of its advisory business, including its personnel. The information provided discussed the services provided by the Adviser. The Board then discussed the written and oral information that it received before the meeting and throughout the year, and the Adviser’s oral presentations and any other information that the Board received at the meeting, and deliberated on the renewal of the Advisory Agreement in light of this information.
The Independent Trustees were assisted throughout the contract review process by Schiff Hardin LLP. The Independent Trustees relied upon the advice of such counsel and their own business judgment in determining the material factors to be considered in evaluating the Advisory Agreement, and the weight to be given to each such factor. The conclusions reached with respect to the Advisory Agreement were based on a comprehensive evaluation of all the information provided and not any single factor. Moreover, each Trustee may have placed varying emphasis on particular factors in reaching conclusions. The matters discussed were also considered separately by the Independent Trustees in executive session with Schiff Hardin LLP, at which no representatives of management were present.
Nature, Extent and Quality of Services Provided by the Adviser
The Trustees considered the scope of services provided under the Advisory Agreement, noting that the Adviser will be providing investment management services to the Fund. The Board discussed the responsibilities of the Adviser, including: responsibility for the general management of the day-to-day investment and reinvestment of the assets of the Fund; determining the daily baskets of deposit securities and cash components; executing portfolio security trades for purchases and redemptions of Fund shares conducted on a cash-in-lieu basis; responsibility for daily monitoring of tracking error and quarterly reporting to the Board; and implementation of Board directives as they relate to the Fund. In considering the nature, extent and quality of the services provided by the Adviser, the Board considered the quality of the Adviser’s compliance program. The Board also considered the Adviser’s experience managing ETFs. The Board considered the experience of the portfolio managers of the Fund.
25
TierraXPTM Latin America Real Estate ETF
APPROVAL OF ADVISORY AGREEMENT AND BOARD CONSIDERATIONS
For the Year Ended September 30, 2017 (Unaudited) (Continued)
The Board also considered other services provided to the Fund, such as overseeing the Fund’s service providers, monitoring adherence to the Fund’s investment restrictions, and monitoring compliance with various policies and procedures and with applicable securities laws.
Based on the factors above, as well as those discussed below, the Board concluded that it was satisfied with the nature, extent and quality of the services to be provided to the Fund by the Adviser.
Historical Performance
The Board then considered the past performance of the Fund. The Board reviewed information regarding the performance history of the Fund over various time periods, including the year-to-date period, the most recent one-year period and the periods since the Fund’s inception, each as of May 31, 2017. The Board noted that the index-based investment objective of LARE made analysis of investment performance, in absolute terms, less of a priority than that which normally attaches to the performance of actively managed funds. Instead, the Board focused on the extent to which LARE tracked its underlying index. The Board noted that the Adviser began managing the Fund on April 1, 2017. The Board reviewed information regarding the Fund’s index tracking during the time it was managed by the Adviser, discussing, as applicable, factors which contributed to the Fund’s tracking error over certain periods of time. The Board concluded that, after taking these factors into account, the Fund satisfactorily tracked its underlying index. The Board further noted that it had received and would continue to receive regular reports regarding the Fund’s performance at its quarterly meetings. The Board concluded that, given the capabilities and experience of the Adviser’s personnel in managing ETFs, the Adviser would be able to continue to keep the Fund’s tracking error within acceptable ranges.
Cost of Services Provided and Economies of Scale
The Board reviewed the advisory fee for the Fund and compared it to the total operating expenses of other funds in the industry falling within the same style category. The Board took into consideration management’s discussion of the fees, including that the Fund has a niche investment strategy and limited peer ETFs.
The Board also noted the importance of the fact that the advisory fee for the Fund was a “unified fee,” meaning that the shareholders of the Fund pay no expenses other than the advisory fee and certain other costs such as interest, brokerage and extraordinary expenses and, to the extent it is implemented, fees pursuant to a Distribution and/or Shareholder Servicing (12b-1) Plan. The Board noted that the Adviser was responsible for compensating the Trust’s other service providers and paying the Fund’s other expenses out of its own fee and resources. The Board also evaluated the compensation and benefits received by the Adviser from its relationship with the Fund, taking into account an analysis of the Adviser’s profitability provided at the meeting. The Board concluded that the advisory fee for the Fund was fair and reasonable in light of the factors considered.
In addition, the Board considered whether economies of scale had been realized for the Fund. The Board noted that the Adviser regularly considers whether fee reductions are appropriate as the Funds grow in size. The Board concluded that the Fund had not reached a size where it had realized economies of scale that would warrant a fee reduction. The Board noted that a unitary fee provides a level of certainty in expenses for the Fund. The Trustees concluded that the flat advisory fee was reasonable and appropriate.
26
TierraXPTM Latin America Real Estate ETF
APPROVAL OF ADVISORY AGREEMENT AND BOARD CONSIDERATIONS
For the Year Ended September 30, 2017 (Unaudited) (Continued)
Based on the Board’s deliberations and its evaluation of the information described above, the Board, including the Independent Trustees, unanimously: (a) concluded that the terms of the Advisory Agreement are fair and reasonable; (b) concluded that the Adviser’s fees are reasonable in light of the services that the Adviser provides to the Fund; and (c) agreed to renew the Advisory Agreement for another year.
27
TierraXPTM Latin America Real Estate ETF
September 30, 2017 (Unaudited)
FEDERAL TAX INFORMATION
(Unaudited)
Qualified Dividend Income/Dividends Received Deduction
For the fiscal year ended September 30, 2017, certain dividends paid by the Fund may be subject to a maximum tax rate of 15%, as provided for by the Jobs and Growth Tax Reconciliation Act of 2003. The percentage of dividends declared from ordinary income designated as qualified dividend income was as follows:
| Fund Name | QDI |
TierraXPTM Latin America Real Estate ETF | 13.16% |
For corporate shareholders, the percent of ordinary income distributions qualifying for the corporate dividends received deduction for the fiscal year ended September 30, 2017 was as follows:
| Fund Name | DRD |
TierraXPTM Latin America Real Estate ETF | 0.00% |
Short Term Capital Gain
The percentage of taxable ordinary income distributions that are designated as short-term capital gain distributions under Internal Revenue Section 871 (k)(2)(C) for the Fund was as follows:
| Fund Name | Short-Term Capital Gain |
TierraXPTM Latin America Real Estate ETF | 20.80% |
Pursuant to Section 853 of the Internal Revenue Code the Fund designated the following amounts as foreign taxes paid for the year ended September 30, 2017. Foreign taxes paid for purposes of Section 853 may be less than actual foreign taxes paid for financial statement purposes.
| Per Share | ||||||||||
| Fund | Gross Foreign Source Income | Foreign Taxes Passthrough | Gross Foreign Source Income | Foreign Taxes Passthrough | Shares Outstanding at 9/30/17 | |||||
TierraXPTM Latin America Real Estate ETF | 109,649 | 15,762 | 0.54824590 | 0.07881245 | 200,000 | |||||
28
TierraXPTM Latin America Real Estate ETF
SUPPLEMENTARY INFORMATION
September 30, 2017 (Unaudited)
(Unaudited)
The Fund files a Form N-Q with the Securities and Exchange Commission (the ‘‘SEC’’) no more than sixty days after the Fund’s first and third fiscal quarters. For the Fund, this would be for the fiscal quarters ending June 30 and December 31. Form N-Q includes a complete schedule of the Funds’ portfolio holdings as of the end of those fiscal quarters. The Fund’s N-Q filings can be found free of charge on the SEC’s website at http://www.sec.gov, or they may be reviewed and copied at the SEC’s Public Reference Room in Washington, D.C. (call 800-SEC-0330 for information on the operation of the Public Reference Room). The Fund’s portfolio holdings are posted on the Fund’s website at www.tierrafunds.com daily.
(Unaudited)
A description of the policies and procedures the Fund uses to determine how to vote proxies relating to portfolio securities is provided in the Statement of Additional Information (“SAI”). The SAI is available without charge upon request by calling toll-free at 1-844-ETF-MGRS (1-844-383-6477), by accessing the SEC’s website at www.sec.gov, or by accessing the Fund’s website at www.tierrafunds.com.
Information regarding how the Fund voted proxies relating to portfolio securities during the period ending June 30 is available by calling toll-free at 1-844-ETF-MGRS (1-844-383-6477) or by accessing the SEC’s website at www.sec.gov.
Carefully consider the Fund’s investment objectives, risk factors, charges, and expenses before investing. This and additional information can be found in the Fund’s prospectus, which may be obtained by calling 1-844-ETF-MGRS (1-844-383-6477) or by visiting www.tierrafunds.com. Read the prospectus carefully before investing.
29
TierraXPTM Latin America Real Estate ETF
For the period Ended September 30, 2017 (Unaudited)
As a shareholder of TierraXPTM Latin America Real Estate ETF (the “Fund”) you incur two types of costs: (1) transaction costs, including brokerage commissions on purchases and sales of Fund shares, and (2) ongoing costs, including management fees and other Fund expenses. These examples are intended to help you understand your ongoing costs (in dollars) of investing in the Fund and to compare these costs with the ongoing costs of investing in other funds. The example is based on an investment of $1,000 invested at the beginning of the period and held for the entire period (April 1, 2017 to September 30, 2017).
Actual Expenses
The first line of the table provides information about actual account values based on actual returns and actual expenses. You may use the information in this line, together with the amount you invested, to estimate the expenses that you paid over the period. Simply divide your account value by $1,000 (for example, an $8,600 account value divided by $1,000 = 8.6), then, multiply the result by the number in the first line under the heading entitled “Expenses Paid During Period’’ to estimate the expenses you paid on your account during this period.
Hypothetical Example for Comparison Purposes
The second line of the table provides information about hypothetical account values based on a hypothetical return and hypothetical expenses based on the Fund’s actual expense ratio and an assumed rate of return of 5% per year before expenses, which is not the Fund’s actual return. The hypothetical account values and expenses may not be used to estimate the actual ending account balance or expenses you paid for the period. You may use this information to compare the ongoing costs of investing in the Fund and other funds. To do so, compare this 5% hypothetical example with the 5% hypothetical examples that appear in the shareholder reports of the other funds. Please note that the expenses shown in the table are meant to highlight your ongoing costs only and do not reflect any transactional costs, such as brokerage commissions paid on purchases and sales of Fund shares. Therefore, the second line of the table is useful in comparing ongoing costs only and will not help you determine the relative total costs of owning different funds. If these transactional costs were included, your costs would have been higher.
TierraXPTM Latin America Real Estate ETF
Beginning Account Value April 1, 2017 | Ending Account Value September 30, 2017 | Expenses Paid During the Period^ | |||||||
| Actual | $1,000.00 | $1,104.70 | $4.17 | ||||||
| Hypothetical (5% annual) | $1,000.00 | $1,021.11 | $4.00 |
^ The dollar amounts shown as expenses paid during the period are equal to the annualized six-month expense ratio multiplied by the average account value during the period, multiplied by 183/365 (to reflect the period from April 1, 2017 to September 30, 2017).
30
TierraXPTM Latin America Real Estate ETF
Set forth below are the names, birth years, positions with the Trust, length of term of office, and the principal occupations and other directorships held during at least the last five years of each of the persons currently serving as a Trustee of the Trust, as well as information about each officer. The business address of each Trustee and officer is 30 Maple Street, Summit, New Jersey 07901.
Name and Year of Birth | Position(s) Held with the Trust, Term of Office and Length of Time Served | Principal Occupation(s) During Past 5 Years | Number of Portfolios in Fund Complex Overseen By Trustee | Other Directorships Held by Trustee During Past 5 Years | ||||||||
| Interested Trustee* and Officers | ||||||||||||
| Samuel Masucci, III (1962) | Trustee, Chairman of the Board and President (since 2012); Secretary (since 2014) | Chief Executive Officer, Exchange Traded Managers Group, LLC (since 2013); Chief Executive Officer and Chief Compliance Officer, Factor Advisors, LLC (since 2012); President and Chief Executive Officer, Factor Capital Management LLC (since 2012); President and Chief Executive Officer, GENCAP Ventures, LLC (holding company) (2012–2013); Chief Executive Officer, MacroMarkets LLC (exchange traded funds) (2005–2011); President, Chief Executive and Chief Compliance Officer, Macro Financial (financial services) (2005–2011). | 9 | None | ||||||||
| Reshma J. Amin (1978) | Chief Compliance Officer (since 2016) | Chief Compliance Officer, Exchange Traded Managers Group, LLC (since 2016); Partner, Crow & Cushing (2007–2016). | n/a | n/a | ||||||||
| John A. Flanagan (1946) | Treasurer (since 2015) | President, John A. Flanagan CPA, LLC (accounting services) (since 2010); Chief Financial Officer, Exchange Traded Managers Group, LLC (since 2015); Principal Financial Officer, ETF Managers Capital, LLC (commodity pool operator) (since 2014); Chief Financial Officer, Macromarkets LLC (exchange traded funds) (2007–2010) | n/a | n/a | ||||||||
* Mr. Masucci is an interested Trustee by virtue of his role as the Chief Executive Officer of the Adviser.
31
TierraXPTM Latin America Real Estate ETF
Board of Trustees
Name and Year of Birth | Position(s) Held with the Trust, Term of Office and Length of Time Served | Principal Occupation(s) During Past 5 Years | Number of Portfolios in Fund Complex Overseen By Trustee | Other Directorships Held by Trustee During Past 5 Years | ||||||||
| Independent Trustees | ||||||||||||
John W. Southard (1969) | Trustee (since 2012) | Director and Co-Founder, T2 Capital Management, 2010 to present; Co-Founder and Head of Research and Trading, PowerShares Capital Management, 2002 to 2009. | 9 | None | ||||||||
Terry Loebs (1963) | Trustee (since 2014) | Founder and Managing Member, Pulsenomics LLC (index product development and consulting firm) (since 2011); Managing Director, MacroMarkets, LLC (exchange-traded products firm) (2006–2011). | 9 | None | ||||||||
32
TierraXPTM Latin America Real Estate ETF
ETF MANAGERS TRUST
ETF Managers Trust, (the “Trust”) has adopted the following privacy policies in order to safeguard the personal information of the Trust’s customers and consumers in accordance with Regulation S-P as promulgated by the U.S. Securities and Exchange Commission.
Trust officers are responsible for ensuring that the following policies and procedures are implemented:
| 1) | The Trust is committed to protecting the confidentiality and security of the information they collect and will handle personal customer and consumer information only in accordance with Regulation S-P and any other applicable laws, rules and regulations1. The Trust will ensure: (a) the security and confidentiality of customer records and information; (b) that customer records and information are protected from any anticipated threats and hazards; and (c) that customer records and information are protected from unauthorized access or use. |
| 2) | The Trust conducts its business affairs through its trustees, officers and third parties that provide services pursuant to agreements with the Trust. The Trust has no employees. It is anticipated that the trustees and officers of the Trust who are not employees of service providers of the Trust will not have access to customer records and information in the performance of their normal responsibilities for the Trust. |
| 3) | The Trust may share customer information with its affiliates, subject to the customers’ right to prohibit such sharing. |
| 4) | The Trust may share customer information with unaffiliated third parties only in accordance with the requirements of Regulation S-P. Pursuant to this policy, the Trust will not share customer information with unaffiliated third parties other than as permitted by law, unless authorized to do so by the customer. |
Consistent with these policies, the Trust has adopted the following procedures:
| 1) | The Trust will determine that the policies and procedures of its affiliates and Service Providers are reasonably designed to safeguard customer information and only permit appropriate and authorized access to and use of customer information through the application of appropriate administrative, technical and physical protections. |
| 2) | The Trust will direct each of its Service Providers to adhere to the privacy policy of the Trust and to its privacy policies with respect to all customer information of the Trust and to take all actions reasonably necessary so that the Trust is in compliance with the provisions of Regulation S-P, including, as applicable, the development and delivery of privacy notices and the maintenance of appropriate and adequate records. |
| 3) | The Trust requires its Service Providers to provide periodic reports to the Trust’s Board of Trustees outlining their privacy policies and the implementation of such policies. Each Service Provider is required to promptly report to the Trust’s Board any material changes to its privacy policy before, or promptly after, the adoption of such changes. |
| 1 | Generally, the Funds have institutional clients which are not considered “customers” for purposes of regulation S-P. |
33
Advisor
ETF Managers Group, LLC
30 Maple Street, Suite 2, Summit, NJ 07901
Distributor
ETFMG Financial, LLC
30 Maple Street, Suite 2, Summit, NJ 07901
Custodian
U.S. Bank National Association
Custody Operations
1555 North River Center Drive, Suite 302, Milwaukee, Wisconsin 53212
Transfer Agent
U.S. Bancorp Fund Services, LLC
615 East Michigan Street, Milwaukee, Wisconsin 53202
Securities Lending Agent
U.S Bank, National Association
Securities Lending
800 Nicolet Mall
Minneapolis, MN 55402-7020
Independent Registered Public Accounting Firm
WithumSmith + Brown, PC
1411 Broadway, 9th Floor, New York, NY 10018
Legal Counsel
Sullivan & Worcester LLP
1666 K Street NW, Washington, DC 20006

Annual Report
September 30, 2017
BlueStar TA-BIGITechTM Israel Technology ETF
Ticker: ITEQ

The Fund is a series of ETF Managers Trust.
BlueStar TA-BIGITechTM Israel Technology ETF
TABLE OF CONTENTS
September 30, 2017
September 30, 2017
| Page | |
| 2 | |
| 3 | |
| 4 | |
| 5 | |
| 6 | |
| 7 | |
| 11 | |
| 12 | |
| 13 | |
| 14 | |
| 15 | |
| 23 | |
| 24 | |
| 25 | |
| 27 | |
| 28 | |
| 28 | |
| 29 | |
| 30 | |
| 32 |
BlueStar TA-BIGITechTM Israel Technology ETF
On behalf of the entire team, we want to express our appreciation for the confidence you have placed in the BlueStar TA-BIGITech® Israel Technology ETF (“ITEQ®” or the “Fund”). ITEQ® is the only US-listed ETF providing broad exposure to Israeli Technology stocks listed worldwide. The following information pertains to the fiscal year ended September 30, 2017.
The Fund saw positive performance during the fiscal year ended September 30, 2017. The Fund NAV return was 23.16%, in line with its benchmark, the TASE-BlueStar Israel Global Technology Index (“Index”), which posted an increase of 24.18% over the same period. The difference was primarily attributable to Fund expenses that are not a part of the Index.
For the year ended September 30, 2017, the best performing securities in the Fund were Nova Measuring Instruments (up 127.39%), NeuroDerm (up 111.07%), and Tower Semiconductor (up 106.39%). The worst performing securities in the Fund were Aevi Genomic Medicine Inc. (down -77.09%), Protalix BioTherapeutics (down -61.84%), and Alcobra (down -55.77%).
We believe Israeli companies play an essential role in the global high technology value chain. Most technology users, from online shoppers to Fortune 500 companies, use Israeli technology applications and solutions every day, often without ever being aware of it. From cybersecurity and defense to clean energy and agriculture, Israeli innovations power some of the biggest names and innovations in the tech industry today.
Even in industries where Israeli companies do not have dominant individual market share, the collective footprint of Israeli companies is significant in many key technology subsectors, and Israel-based Research & Development and non-public companies are usually significant contributors to that same sub-industry’s ecosystem.
There is much innovation and achievements ahead for Israeli Technology companies and we are thankful you have joined us. You can find further details about ITEQ by visiting www.iteqetf.com, or by calling 1-844-ETF-MGRS. (1-844-383-6477).
Sincerely,
Samuel Masucci III
Chairman of the Board
Chairman of the Board
Samuel Masucci III is a registered representative of ETFMG Financial, LLC.
2
Growth of $10,000 (Unaudited)
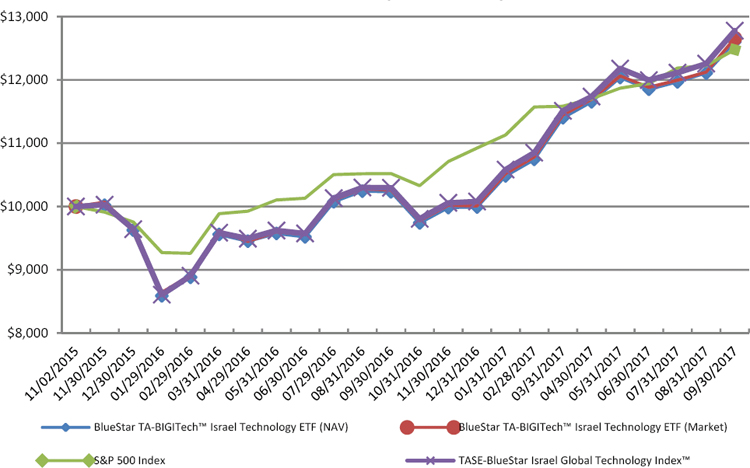
| Average Annual Returns Period Ended September 30, 2017 | 1 Year Return | Since Inception (11/2/2015) | ||||||
BlueStar TA-BIGITechTM Israel Technology ETF (NAV) | 23.16 | % | 12.85 | % | ||||
BlueStar TA-BIGITechTM Israel Technology ETF (Market) | 23.37 | % | 13.12 | % | ||||
| S&P 500 Index | 18.61 | % | 12.27 | % | ||||
TASE-BlueStar Israel Global Technology IndexTM | 24.18 | % | 13.70 | % | ||||
Total Fund Operating Expenses1 | 0.75 | % | ||||||
1. The expense ratio is taken from the Fund’s most recent prospectus dated January 31, 2017.
Performance data quoted represents past performance and does not guarantee future results. The investment return and principal value of an investment will fluctuate so that an investor’s shares, when sold, may be worth more or less than their original cost. Current performance of the Fund may be lower or higher than the performance quoted. All performance is historical and includes reinvestment of dividends and capital gains. Performance data current to the most recent month end may be obtained by calling 1-844-ETF-MGRS (1-844-383-6477).
The chart illustrates the performance of a hypothetical $10,000 investment made on November 2, 2015, and is not intended to imply any future performance. The returns shown do not reflect the reduction of taxes that a shareholder would pay on Fund distributions from the sale of Fund shares. The chart assumes reinvestment of capital gains and dividends.
The unmanaged indices do not reflect fees and are not available for direct investment.
3
BlueStar TA-BIGITechTM Israel Technology ETF
Security | % of Total Investments† | |||
| 1 | Check Point Software Technologies, Ltd. | 8.85% | ||
| 2 | Amdocs Ltd. | 8.66% | ||
| 3 | NICE-Systems Ltd. | 5.44% | ||
| 4 | Elbit Systems Ltd. | 3.99% | ||
| 5 | Tower Semiconductor Ltd. | 3.47% | ||
| 6 | Wix.com Ltd. | 3.23% | ||
| 7 | Verint Systems, Inc. | 3.18% | ||
| 8 | Ormat Technologies, Inc. | 2.93% | ||
| 9 | OPKO Health, Inc. | 2.70% | ||
| 10 | Mellanox Technologies Ltd. | 2.37% | ||
| Top Ten Holdings = 44.82% of Total Investments† | ||||
| * Current Fund holdings may not be indicative of future Fund holdings. | ||||
| † Percentage of total investments less cash. |
4
BlueStar TA-BIGITechTM Israel Technology ETF
Investing involves risk, including the possible loss of principal. Shares of any ETF are bought and sold at market price (not NAV), may trade at a discount or premium to NAV and are not individually redeemed from the Fund. Brokerage commissions will reduce returns. Narrowly focused investments typically exhibit higher volatility.
The BlueStar TA-BIGITechTM Israel Technology ETF (the “Fund”) seeks to provide investment results that, before fees and expenses, correspond generally to the total return performance of the TASE-BlueStar Israel Global Technology IndexTM (“TA-BIGITechTM” or the “Index”).
Investment in securities of Israeli companies involves risks that may negatively affect the value of your investment in the Fund. Among other things, Israel’s economy depends on imports of certain key items, such as crude oil, coal, grains, raw materials and military equipment. Foreign investing involves special risks such as currency fluctuations and political uncertainty. Funds that invest in smaller companies may experience greater volatility. Funds that emphasize investments in technology generally will experience greater price volatility. The Fund’s return may not match or achieve a high degree of correlation with the return of the TA-BIGITech™ Index. To the extent the Fund utilizes a sampling approach, it may experience tracking error to a greater extent than if the Fund had sought to replicate the Index. Diversification does not guarantee a profit, nor does it protect against a loss in a declining market.
The TASE- BlueStar Israel Technology Index™ (TA-BIGITech™) is an index of more than 60 Israeli technology companies listed on global stock exchanges in Tel Aviv, New York, London and elsewhere.
S&P 500: The S&P 500 Index is the Standard & Poor’s composite index of 500 stocks, a widely recognized, unmanaged index of common stock prices.
5
BlueStar TA-BIGITechTM Israel Technology ETF
As of September 30, 2017 (Unaudited)
BlueStar TA- BIGITechTM Israel Technology ETF | ||||
| As a percent of Net Assets: | ||||
| Australia | 0.6 | % | ||
| Guernsey | 11.0 | |||
| Israel | 59.2 | |||
| Jersey | 2.9 | |||
| Netherlands Antilles | 0.7 | |||
| United Kingdom | 3.7 | |||
| United States | 21.1 | |||
| Short-Term and other Net Assets (Liabilities) | 0.8 | |||
| 100.0 | % | |||
6
BlueStar TA-BIGITechTM Israel Technology ETF
September 30, 2017
| Shares | Fair Value | |||||||
| COMMON STOCKS - 99.2% | ||||||||
| Australia - 0.6% | ||||||||
| Commercial Services & Supplies - 0.3% | ||||||||
| Fluence Corp Ltd. (a) | 135,619 | $ | 71,274 | |||||
| Diversified Telecommunication Services - 0.3% | ||||||||
| Sky And Space Global Ltd. (a) | 509,776 | 71,976 | ||||||
| Total Australia | 143,250 | |||||||
| Guernsey - 11.0% | ||||||||
| IT Services - 11.0% | ||||||||
| Amdocs Ltd. ^ | 38,297 | 2,463,263 | ||||||
| SafeCharge International Group Ltd. | 32,070 | 122,905 | ||||||
| Total IT Services | 2,586,168 | |||||||
| Israel - 59.2% | ||||||||
| Aerospace & Defense - 4.8% | ||||||||
| Elbit Systems Ltd. | 7,712 | 1,132,976 | ||||||
| Auto Components - 0.2% | ||||||||
| Foresight Autonomous Holdings Ltd. (a) | 45,233 | 51,557 | ||||||
| Biotechnology - 2.1% | ||||||||
| BioLine RX Ltd. - ADR (a) | 95,636 | 107,112 | ||||||
| Enzymotec Ltd. (a) | 12,255 | 140,320 | ||||||
| Evogene Ltd. (a) | 17,693 | 77,884 | ||||||
| Kamada Ltd. (a) | 15,987 | 76,977 | ||||||
| Vascular Biogenics Ltd. (a) | 15,635 | 95,374 | ||||||
| Total Biotechnology | 497,667 | |||||||
| Communications Equipment - 4.3% | ||||||||
| AudioCodes Ltd. (a) | 15,433 | 110,192 | ||||||
| Ceragon Networks Ltd. (a) | 40,810 | 79,419 | ||||||
| Ituran Location & Control Ltd. | 7,780 | 280,470 | ||||||
| RADCOM Ltd. (a) ^ | 5,566 | 117,164 | ||||||
| Radware Ltd. (a) | 14,322 | 241,469 | ||||||
| Silicom Ltd. | 2,893 | 169,269 | ||||||
| Total Communications Equipment | 997,983 | |||||||
| Electronic Equipment, Instruments & Components - 3.4% | ||||||||
| Arad Ltd. | 7,677 | 78,686 | ||||||
| Magal Security Systems Ltd. (a) | 15,278 | 73,334 | ||||||
| Orbotech Ltd. (a) | 15,516 | 654,930 | ||||||
| Total Electronic Equipment, Instruments & Components | 806,950 | |||||||
| Health Care Equipment & Supplies - 1.7% | ||||||||
| Mazor Robotics Ltd. (a) | 16,520 | 393,979 | ||||||
| Household Durables - 0.5% | ||||||||
| Maytronics Ltd. | 26,307 | 123,097 | ||||||
| Independent Power and Renewable Electricity Producers - 0.8% | ||||||||
| Energix-Renewable Energies Ltd. (a) | 97,264 | 86,125 | ||||||
| Enlight Renewable Energy Ltd. (a) | 226,348 | 98,933 | ||||||
| Total Independent Power and Renewable Electricity | ||||||||
| Producers | 185,058 | |||||||
The accompanying notes are an integral part of these financial statements.
7
BlueStar TA-BIGITechTM Israel Technology ETF
Schedule of Investments
September 30, 2017 (Continued)
| Shares | Fair Value | |||||||
| Internet Software & Services - 3.9% | ||||||||
| Wix.com Ltd. (a) | 12,794 | $ | 919,250 | |||||
| IT Services - 2.0% | ||||||||
| Formula Systems (1985) Ltd. | 3,665 | 147,230 | ||||||
| Malam - Team Ltd. | 737 | 74,601 | ||||||
| Matrix IT Ltd. | 15,331 | 161,169 | ||||||
| One Software Technologies Ltd. | 2,263 | 88,797 | ||||||
| Total IT Services | 471,797 | |||||||
| Life Sciences Tools & Services - 0.5% | ||||||||
| Compugen Ltd. (a) | 28,865 | 108,117 | ||||||
| Machinery - 1.2% | ||||||||
| Kornit Digital Ltd. (a) ^ | 11,651 | 178,260 | ||||||
| Sarine Technologies Ltd. | 119,177 | 102,796 | ||||||
| Total Machinery | 281,056 | |||||||
| Pharmaceuticals - 2.3% | ||||||||
| Foamix Pharmaceuticals Ltd. (a) ^ | 22,340 | 123,987 | ||||||
| Neuroderm Ltd. (a) ^ | 7,483 | 291,088 | ||||||
| RedHill Biopharma Ltd. - ADR (a) ^ | 10,870 | 117,505 | ||||||
| Total Pharmaceuticals | 532,580 | |||||||
| Semiconductors & Semiconductor Equipment - 8.4% | ||||||||
| Camtek Ltd. (a) | 13,782 | 70,564 | ||||||
| Mellanox Technologies Ltd. (a) ^ | 14,267 | 672,689 | ||||||
| Nova Measuring Instruments Ltd. (a) | 9,796 | 261,722 | ||||||
| Tower Semiconductor Ltd. (a) | 32,137 | 987,348 | ||||||
| Total Semiconductors & Semiconductor Equipment | 1,992,323 | |||||||
| Software - 21.5% | ||||||||
| Allot Communications Ltd. (a) | 20,869 | 111,760 | ||||||
| Attunity Ltd. (a) | 12,585 | 85,075 | ||||||
| Check Point Software Technologies Ltd. (a) ^ | 22,076 | 2,517,106 | ||||||
| CyberArk Software Ltd. (a) ^ | 11,821 | 484,661 | ||||||
| Hilan Ltd. | 7,626 | 148,235 | ||||||
| Magic Software Enterprises Ltd. | 14,469 | 125,378 | ||||||
| NICE-Systems Ltd. | 19,397 | 1,546,360 | ||||||
| Total Software | 5,018,575 | |||||||
| Technology Hardware, Storage & Peripherals - 1.6% | ||||||||
| Stratasys Ltd. (a) ^ | 16,606 | 383,931 | ||||||
| Total Israel | 13,896,896 | |||||||
| Jersey - 2.9% | ||||||||
| Health Care Equipment & Supplies - 2.1% | ||||||||
| Novocure Ltd. (a) ^ | 25,360 | 503,396 | ||||||
| Internet Software & Services - 0.8% | ||||||||
| XLMedia PLC | 99,981 | 190,913 | ||||||
| Total Jersey | 694,309 | |||||||
The accompanying notes are an integral part of these financial statements.
8
BlueStar TA-BIGITechTM Israel Technology ETF
Schedule of Investments
September 30, 2017 (Continued)
| Shares | Fair Value | |||||||
| Netherlands Antilles - 0.7% | ||||||||
| Software - 0.7% | ||||||||
| Sapiens International Corporation NV (a) | 12,108 | $ | 157,704 | |||||
| United Kingdom - 3.7% | ||||||||
| Communications Equipment - 0.4% | ||||||||
| Telit Communications PLC | 43,816 | 102,748 | ||||||
| Diversified Financial Services - 1.6% | ||||||||
| Plus500 Ltd. | 31,991 | 384,525 | ||||||
| Hotels, Restaurants & Leisure - 1.1% | ||||||||
| 888 Holdings PLC | 73,392 | 252,550 | ||||||
| Media - 0.6% | ||||||||
| Taptica international Ltd. | 25,792 | 139,973 | ||||||
| Total United Kingdom | 879,796 | |||||||
| United States - 21.1% | ||||||||
| Aerospace & Defense - 0.4% | ||||||||
| Arotech Corp. (a) | 22,810 | 95,802 | ||||||
| Biotechnology - 4.5% | ||||||||
| Aevi Genomic Medicine, Inc. (a) | 58,967 | 74,298 | ||||||
| BrainStorm Cell Therapeutics, Inc. (a) ^ | 19,285 | 79,454 | ||||||
| OPKO Health, Inc. (a) | 111,521 | 768,860 | ||||||
| Pluristem Therapeutics, Inc. (a) | 65,302 | 101,626 | ||||||
| Protalix BioTherapeutics, Inc. (a) | 95,653 | 56,664 | ||||||
| Total Biotechnology | 1,080,902 | |||||||
| Communications Equipment - 0.5% | ||||||||
| Gilat Satellite Networks Ltd. (a) | 21,259 | 124,674 | ||||||
| Electric Utilities - 3.5% | ||||||||
| Ormat Technologies, Inc. | 13,637 | 831,769 | ||||||
| Internet Software & Services - 1.2% | ||||||||
| LivePerson, Inc. (a) | 20,394 | 271,858 | ||||||
| Pharmaceuticals - 0.4% | ||||||||
| Oramed Pharmaceuticals, Inc. (a) | 9,442 | 93,287 | ||||||
| Semiconductors & Semiconductor | ||||||||
| Equipment - 3.5% | ||||||||
| CEVA, Inc. (a) | 7,509 | 321,385 | ||||||
| DSP Group, Inc. (a) | 10,771 | 140,023 | ||||||
| SolarEdge Technologies, Inc. (a) | 12,082 | 344,941 | ||||||
| Total Semiconductors & Semiconductor Equipment | 806,349 | |||||||
| Software - 7.1% | ||||||||
| Imperva, Inc. (a) | 10,939 | 474,753 | ||||||
| Varonis Systems, Inc. (a) | 7,501 | 314,292 | ||||||
| Verint Systems, Inc. (a) | 21,584 | 903,290 | ||||||
| Total Software | 1,692,335 | |||||||
| Total United States | 4,996,976 | |||||||
| TOTAL COMMON STOCKS (Cost $20,716,335) | 23,355,099 | |||||||
The accompanying notes are an integral part of these financial statements.
9
BlueStar TA-BIGITechTM Israel Technology ETF
Schedule of Investments
September 30, 2017 (Continued)
| Shares | Fair Value | |||||||
| SHORT-TERM INVESTMENTS - 0.1% | ||||||||
| Money Market Funds - 0.1% | ||||||||
| Invesco Advisers, Inc. STIT - Treasury Portfolio - Institutional Class, 0.89% (b) | 14,521 | $ | 14,521 | |||||
| TOTAL SHORT-TERM INVESTMENTS (Cost $14,521) | 14,521 | |||||||
| INVESTMENTS PURCHASED WITH SECURITIES LENDING COLLATERAL - 21.5% | ||||||||
| Investment Companies - 21.5% | ||||||||
| Mount Vernon Liquid Assets Portfolio, LLC, 1.33% (b) + | 5,058,966 | |||||||
| TOTAL INVESTMENTS PURCHASED WITH SECURITIES LENDING COLLATERAL (Cost $5,058,966) | 5,058,966 | |||||||
| Total Investments (Cost $25,789,822) - 120.8% | 28,428,586 | |||||||
| Liabilities in Excess of Other Assets - (20.8)% | (4,890,335 | ) | ||||||
| TOTAL NET ASSETS - 100.0% | $ | 23,538,251 | ||||||
Percentages are stated as a percent of net assets.
| ADR | American Depositary Receipt. |
| (a) | Non-income producing security. |
| (b) | The rate quoted is the annualized seven-day yield at September 30, 2017. |
| ^ | All or a portion of this security is out on loan as of September 30, 2017. Total value of securities out on loan is $4,955,081. |
| + | Investments purchased with cash proceeds from securities lending. Total cash collateral has a value of $5,058,966 as of September 30, 2017. |
The Global Industry Classification Standard (GICS®) was developed by and/or is the exclusive property of MSCI, Inc. and Standard & Poor’s Financial Services LLC (“S&P”). GICS® is a service mark of MSCI, Inc. and S&P and has been licensed for use by the Fund’s Administrator, U.S. Bancorp Fund Services, LLC.
The accompanying notes are an integral part of these financial statements.
10
BlueStar TA-BIGITechTM Israel Technology ETF
As of September 30, 2017
BlueStar TA- BIGITechTM Israel Technology ETF | ||||
| ASSETS | ||||
| Investments in securities, at fair value* | $ | 28,428,586 | ||
| Receivables: | ||||
| Receivable for investments sold | 155,650 | |||
| Foreign currency | 114 | |||
| Dividends and interest receivable | 24,983 | |||
| Securities lending income receivable | 2,052 | |||
| Total Assets | 28,611,385 | |||
| LIABILITIES | ||||
| Collateral received for securities loaned (Note 7) | 5,058,966 | |||
| Payables: | ||||
| Management fees payable | 14,168 | |||
| Total Liabilities | 5,073,134 | |||
| Net Assets | $ | 23,538,251 | ||
| NET ASSETS CONSIST OF: | ||||
| Paid-in Capital | $ | 21,181,522 | ||
| Undistributed (accumulated) net investment income (loss) | (1,355 | ) | ||
| Accumulated net realized gain (loss) on investments | (280,685 | ) | ||
| Net unrealized appreciation on: | ||||
| Investments in securities | 2,638,764 | |||
| Foreign currency and translation of other assets and liabilities in foreign currency | 5 | |||
| Net Assets | $ | 23,538,251 | ||
| *Identified Cost: | ||||
| Investments in securities | $ | 25,789,822 | ||
| Foreign currency | 109 | |||
| Shares Outstanding^ | 750,000 | |||
| Net Asset Value, Offering and Redemption Price per Share | $ | 31.38 | ||
^ No par value, unlimited number of shares authorized
The accompanying notes are an integral part of these financial statements.
11
BlueStar TA-BIGITechTM Israel Technology ETF
Year ended September 30, 2017
BlueStar TA- BIGITechTM Israel Technology ETF | ||||
| INVESTMENT INCOME | ||||
| Income: | ||||
| Dividends from unaffiliated securities (net of foreign withholdings tax of $12,446) | $ | 84,274 | ||
| Interest | 91 | |||
| Securities lending income | 15,194 | |||
| Total Investment Income | 99,559 | |||
| Expenses: | ||||
| Management fees | 90,969 | |||
| Net Investment Income | 8,590 | |||
| REALIZED & UNREALIZED GAIN (LOSS) ON INVESTMENTS | ||||
| Net Realized Gain (Loss) on: | ||||
| Unaffiliated investments | (267,981 | ) | ||
| In-Kind redemptions | 488,230 | |||
| Foreign currency | 935 | |||
| Net Realized Gain on Investments and Foreign Currency | 221,184 | |||
| Net Change in Unrealized Appreciation of: | ||||
| Unaffiliated investments | 2,411,210 | |||
| Foreign currency and foreign currency translation | 8 | |||
| Net Change in Unrealized Appreciation of Investments and Foreign Currency | 2,411,218 | |||
| Net Realized and Unrealized Gain on Investments | 2,632,402 | |||
| NET INCREASE IN NET ASSETS RESULTING FROM OPERATIONS | $ | 2,640,992 | ||
The accompanying notes are an integral part of these financial statements.
12
BlueStar TA-BIGITechTM Israel Technology ETF
Year Ended September 30, 2017 | Period Ended September 30, 2016* | |||||||
| OPERATIONS | ||||||||
| Net investment income | $ | 8,590 | $ | 7,025 | ||||
| Net realized gain (loss) on investments | 221,184 | (20,932 | ) | |||||
| Net change in unrealized appreciation of investments | 2,411,218 | 227,551 | ||||||
| Net increase in net assets resulting from operations | 2,640,992 | 213,644 | ||||||
| DISTRIBUTIONS TO SHAREHOLDERS | ||||||||
| From net investment income | (18,370 | ) | — | |||||
| CAPITAL SHARE TRANSACTIONS | ||||||||
| Net increase in net assets derived | ||||||||
| from net change in outstanding shares (a) | 15,800,080 | 4,901,905 | ||||||
| Net increase in net assets | $ | 18,422,702 | $ | 5,115,549 | ||||
| NET ASSETS | ||||||||
| Beginning of Period | 5,115,549 | — | ||||||
| End of Period | $ | 23,538,251 | $ | 5,115,549 | ||||
| Undistributed net investment income (loss) | $ | (1,355 | ) | $ | 7,135 | |||
(a) Summary of share transactions is as follows:
Year Ended September 30, 2017 | Period Ended September 30, 2016* | ||||||||||||||||
| Shares | Amount | Shares | Amount | ||||||||||||||
| Shares Sold | 650,000 | $ | 18,752,200 | 200,000 | $ | 4,901,905 | |||||||||||
| Reinvested Dividends | — | — | — | — | |||||||||||||
| Shares Redeemed | (100,000 | ) | (2,952,120 | ) | — | — | |||||||||||
| Net Transactions in Fund Shares | 550,000 | $ | 15,800,080 | 200,000 | $ | 4,901,905 | |||||||||||
| Beginning Shares | 200,000 | — | |||||||||||||||
| Ending Shares | 750,000 | 200,000 | |||||||||||||||
* Fund commenced operations on November 2, 2015. The information presented is for the period from November 2, 2015 to September 30, 2016.
The accompanying notes are an integral part of these financial statements.
13
BlueStar TA-BIGITechTM Israel Technology ETF
For a capital share outstanding throughout the year
Year Ended September 30, 2017 | Period Ended September 30, 2016 1 | |||||||
| Net Asset Value, Beginning of Year | $ | 25.58 | $ | 25.00 | ||||
| Income from Investment Operations: | ||||||||
Net investment income 2 | 0.02 | 0.05 | ||||||
| Net realized and unrealized gain on investments | 5.87 | 0.53 | ||||||
| Total from investment operations | 5.89 | 0.58 | ||||||
| Less Distributions: | ||||||||
| Distributions from net investment income | (0.09 | ) | — | |||||
| Total distributions | (0.09 | ) | — | |||||
| Net asset value, end of year | $ | 31.38 | $ | 25.58 | ||||
| Total Return | 23.16 | % | 2.31 | %3 | ||||
| Ratios/Supplemental Data: | ||||||||
| Net assets at end of year (000’s) | $ | 23,538 | $ | 5,116 | ||||
| Expenses to Average Net Assets | 0.75 | % | 0.75 | %4 | ||||
| Net Investment Income to Average Net Assets | 0.07 | % | 0.23 | %4 | ||||
| Portfolio Turnover Rate | 19 | % | 14 | %3 | ||||
| 1 | Commencement of operations on November 2, 2015. |
| 2 | Calculated based on average shares outstanding during the year. |
| 3 | Not annualized. |
| 4 | Annualized. |
The accompanying notes are an integral part of these financial statements.
14
BlueStar TA-BIGITechTM Israel Technology ETF
NOTE 1 – ORGANIZATION
BlueStar TA-BIGITechTM Israel Technology ETF (the “Fund”) is a series of ETF Managers Trust (the “Trust”), an open-end management investment company consisting of multiple investment series, organized as a Delaware statutory trust on July 1, 2009. The Trust is registered with the SEC under the Investment Company Act of 1940, as amended (the “1940 Act”), as an open-end management investment company and the offering of the Fund’s shares (“Shares”) is registered under the Securities Act of 1933, as amended (the “Securities Act”). The Fund seeks to provide investment results that, before fees and expenses, correspond generally to the price and yield performance of the TASE-BlueStar Israel Technology Index™. The Fund commenced operations on November 2, 2015.
The Fund currently offers one class of shares, which has no front end sales load, no deferred sales charges, and no redemption fees. The Fund may issue an unlimited number of shares of beneficial interest, with no par value. All shares of the Fund have equal rights and privileges.
Shares of the Fund are listed and traded on the NASDAQ Stock Market, LLC. Market prices for the Shares may be different from their net asset value (“NAV”). The Fund issues and redeems Shares on a continuous basis at NAV only in blocks of 50,000 shares, called “Creation Units.” Creation Units are issued and redeemed principally in-kind for securities included in the Index. Once created, Shares generally trade in the secondary market at market prices that change throughout the day in quantities less than a Creation Unit. Except when aggregated in Creation Units, Shares are not redeemable securities of the Fund. Shares of the Fund may only be purchased or redeemed by certain financial institutions (“Authorized Participants”). An Authorized Participant is either (i) a broker-dealer or other participant in the clearing process through the Continuous Net Settlement System of the National Securities Clearing Corporation or (ii) a DTC participant and, in each case, must have executed a Participant Agreement with the Distributor. Most retail investors do not qualify as Authorized Participants nor have the resources to buy and sell whole Creation Units. Therefore, they are unable to purchase or redeem the Shares directly from the Fund. Rather, most retail investors may purchase Shares in the secondary market with the assistance of a broker and may be subject to customary brokerage commissions or fees.
NOTE 2 – SIGNIFICANT ACCOUNTING POLICIES
The following is a summary of significant accounting policies consistently followed by the Fund. These policies are in conformity with accounting principles generally accepted in the United States of America (“U.S. GAAP”).
The Fund follows the investment company accounting and reporting guidance of the Financial Accounting Standards Board Accounting Standard Codification Topic 946 Financial Services –Investment Companies.
The Fund may invest in certain other investment companies (underlying funds). For specific investments in underlying funds, please refer to the complete schedule of portfolio holdings on Form N-CSR(S) for this reporting period, which is filed with the U.S. Securities and Exchange Commission (SEC). For more information about the underlying Fund’s operations and policies, please refer to those Funds’ semiannual and annual reports, which are filed with the SEC.
| A. | Security Valuation. Securities listed on a securities exchange, market or automated quotation system for which quotations are readily available (except for securities traded on NASDAQ), including securities traded over the counter, are valued at the last quoted sale price on the primary exchange or market (foreign or domestic) on which they are traded on the valuation date (or at approximately 4:00 pm Eastern Time if a security’s primary exchange is normally open at that time), or, if there is no such reported sale on the valuation date, at the most recent quoted bid price. For securities traded on NASDAQ, the NASDAQ Official Closing Price will be used. |
15
BlueStar TA-BIGITechTM Israel Technology ETF
NOTES TO FINANCIAL STATEMENTS
September 30, 2017 (Continued)
September 30, 2017 (Continued)
Securities for which quotations are not readily available are valued at their respective fair values as determined in good faith by the Board of Trustees (the “Board”). When a security is “fair valued,” consideration is given to the facts and circumstances relevant to the particular situation, including a review of various factors set forth in the pricing procedures adopted by the Fund’s Board. The use of fair value pricing by the Fund may cause the net asset value of its shares to differ significantly from the net asset value that would be calculated without regard to such considerations. As of September 30, 2017, the Fund did not hold any fair valued securities.
As described above, the Fund utilizes various methods to measure the fair value of its investments on a recurring basis. U.S. GAAP establishes a hierarchy that prioritizes inputs to valuation methods. The three levels of inputs are:
| Level 1 | Unadjusted quoted prices in active markets for identical assets or liabilities that the Fund has the ability to access. |
| Level 2 | Observable inputs other than quoted prices included in Level 1 that are observable for the asset or liability, either directly or indirectly. These inputs may include quoted prices for the identical instrument on an inactive market, prices for similar instruments, interest rates, prepayment speeds, credit risk, yield curves, default rates and similar data. |
| Level 3 | Unobservable inputs for the asset or liability, to the extent relevant observable inputs are not available; representing the Fund’s own assumptions about the assumptions a market participant would use in valuing the asset or liability and would be based on the best information available. |
The availability of observable inputs can vary from security to security and is affected by a wide variety of factors, including, for example, the type of security, whether the security is new and not yet established in the marketplace, the liquidity of markets, and other characteristics particular to the security. To the extent that valuation is based on models or inputs that are less observable or unobservable in the market, the determination of fair value requires more judgment. Accordingly, the degree of judgment exercised in determining fair value is greatest for instruments categorized in Level 3.
The inputs used to measure fair value may fall into different levels of the fair value hierarchy. In such cases, for disclosure purposes, the level in the fair value hierarchy within which the fair value measurement falls in its entirety, is determined based on the lowest level input that is significant to the fair value measurement in its entirety.
The following table presents a summary of the Funds’ assets investments in securities, at fair value, as of September 30, 2017:
BlueStar TA-BIGITechTM Israel Technology ETF
Assets^ | Level 1 | Level 2 | Level 3 | Total | ||||||||||||
| Common Stocks | $ | 23,355,099 | $ | — | $ | — | $ | 23,355,099 | ||||||||
| Short-Term Investments | 14,521 | — | — | 14,521 | ||||||||||||
| Investments Purchased with Securities Lending Collateral* | — | — | — | 5,058,966 | ||||||||||||
| Total Investments in Securities | $ | 23,369,620 | $ | — | $ | — | $ | 28,428,586 | ||||||||
16
BlueStar TA-BIGITechTM Israel Technology ETF
NOTES TO FINANCIAL STATEMENTS
September 30, 2017 (Continued)
September 30, 2017 (Continued)
^ See Schedule of Investments for classifications by country and industry.
* Certain investments that are measured at fair value using the net asset value per share (or its equivalent) practical expedient have not been categorized in the fair value hierarchy. The fair value amounts presented in the table are intended to permit reconciliation of the fair value hierarchy to the amounts presented in the Schedule of Investments.
There were no transfers between Levels 1, 2 and 3 during the year ended September 30, 2017. Transfers between levels are recognized at the end of the reporting period.
| B. | Federal Income Taxes. The Fund has elected to be taxed as a “regulated investment company” and intends to distribute substantially all taxable income to its shareholders and otherwise comply with the provisions of the Internal Revenue Code applicable to regulated investment companies. Therefore, no provisions for federal income taxes or excise taxes have been made. |
To avoid imposition of the excise tax applicable to regulated investment companies, the Fund intends to declare each year as dividends, in each calendar year, at least 98.0% of its net investment income (earned during the calendar year) and 98.2% of its net realized capital gains (earned during the twelve months ended October 31) plus undistributed amounts, if any, from prior years.
Net capital losses incurred after October 31, within the taxable year are deemed to arise on the first business day of the Fund’s next taxable year.
The Fund recognizes the tax benefits of uncertain tax positions only where the position is “more likely than not” to be sustained assuming examination by tax authorities. The Fund has analyzed its tax position and has concluded that no liability for unrecognized tax benefits should be recorded related to uncertain tax positions expected to be taken in the Fund’s 2017 tax returns. The Fund identifies its major tax jurisdictions as U.S. Federal, the State of New Jersey, and the State of Delaware; however the Fund is not aware of any tax positions for which it is reasonably possible that the total amounts of unrecognized tax benefits will change materially in the next twelve months.
As of September 30, 2017, management has reviewed the tax positions for open periods (for federal purposes, three years from the date of filing and for state purposes, four years from the date of filing) as applicable to the Fund, and has determined that no provision for income tax is required in the Fund’s financial statements.
C. | Security Transactions and Investment Income. Investment securities transactions are accounted for on the trade date. Gains and losses realized on sales of securities are determined on a specific identification basis. Discounts/premiums on debt securities purchased are accreted/amortized over the life of the respective securities using the effective interest method. Dividend income is recorded on the ex-dividend date. Interest income is recorded on an accrual basis. Income, including gains, from investments in foreign securities received by the Fund may be subject to income, withholding or other taxes imposed by foreign countries. |
| D. | Foreign Currency Translations and Transactions. The Fund may engage in foreign currency transactions. Foreign currency transactions are translated into U.S. dollars on the following basis: (i) market value of investment securities, assets and liabilities at the daily rates of exchange, and (ii) purchases and sales of investment securities, dividend and interest income and certain expenses at the rates of exchange prevailing on the respective dates of such transactions. For financial reporting purposes, the Fund does not isolate changes in the exchange rate of investment securities from the fluctuations arising from changes in the market prices of securities for unrealized gains and losses. However, for federal income tax purposes, the Fund does isolate and treat as ordinary income the effect of changes in foreign exchange rates on realized gains or losses from the sale of investment securities and payables and receivables arising from trade-date and settlement-date differences. |
17
BlueStar TA-BIGITechTM Israel Technology ETF
NOTES TO FINANCIAL STATEMENTS
September 30, 2017 (Continued)
September 30, 2017 (Continued)
| E. | Distributions to Shareholders. Distributions to shareholders from net investment income, if any are generally declared and paid by the Fund on a quarterly basis. Net realized gains on securities of the Fund normally are declared and paid on an annual basis. Distributions are recorded on the ex-dividend date. |
| F. | Use of Estimates. The preparation of financial statements in conformity with U.S. GAAP requires management to make estimates and assumptions that affect the reported amounts of assets and liabilities at the date of the financial statements, as well as the reported amounts of revenues and expenses during the period. Actual results could differ from those estimates. |
| G. | Share Valuation. The net asset value (“NAV”) per share of the Fund is calculated by dividing the sum of the value of the securities held by the Fund, plus cash and other assets, minus all liabilities (including estimated accrued expenses) by the total number of shares outstanding of the Fund, rounded to the nearest cent. The Fund’s shares will not be priced on the days on which the NYSE is closed for trading. The offering and redemption price per share for the Fund is equal to the Fund’s net asset value per share. |
| H. | Guarantees and Indemnifications. In the normal course of business, the Fund enters into contracts with service providers that contain general indemnification clauses. The Fund’s maximum exposure under these arrangements is unknown as this would involve future claims that may be made against the Fund that have not yet occurred. However, based on experience, the Fund expects the risk of loss to be remote. |
NOTE 3 – RISK FACTORS
Investing in the BlueStar TA-BIGITech Israel Technology ETF may involve certain risks, as discussed in the Fund’s prospectus, including, but not limited to, those described below. Any of these risks could cause an investor to lose money.
Market Risk. Financial markets rise and fall in response to a variety of factors, sometimes rapidly and unpredictably. As with any investment whose performance is tied to these markets, the value of an investment in a fund will fluctuate, which means that an investor could lose money over short or long periods.
Investment Style Risk. The Fund is not actively managed. Therefore, the Fund follows the securities included in its respective index during upturns as well as downturns. Because of its indexing strategy, the Fund does not take steps to reduce market exposure or to lessen the effects of a declining market. In addition, because of the Fund’s expenses, the Fund’s performance may be below that of its index.
Equity Risk. The prices of equity securities rise and fall daily. These price movements may result from factors affecting individual companies, industries or the securities market as a whole. In addition, equity markets tend to move in cycles which may cause stock prices to fall over short or extended periods of time.
Securities Lending Risk. Securities lending involves the risk of loss of rights in, or delay in recovery of, the loaned securities if the borrower fails to return the security loaned or becomes insolvent.
Concentration Risk. To the extent that the Fund’s or its underlying index’s portfolio is concentrated in the securities of issuers in a particular market, industry, group of industries, sector or asset class, the Fund may be adversely affected by the performance of those securities, may be subject to increased price volatility and may be more vulnerable to adverse economic, market, political or regulatory occurrences affecting that market, industry, group of industries, sector or asset class.
18
BlueStar TA-BIGITechTM Israel Technology ETF
NOTES TO FINANCIAL STATEMENTS
September 30, 2017 (Continued)
September 30, 2017 (Continued)
NOTE 4 – COMMITMENTS AND OTHER RELATED PARTY TRANSACTIONS.
ETF Managers Group, LLC (the “Advisor”), serves as the investment advisor to the Fund. Pursuant to an Investment Advisory Agreement (“Advisory Agreement”) between the Trust, on behalf of the Fund, and the Advisor, the Advisor provides investment advice to the Fund and oversees the day-today operations of the Fund, subject to the direction and control of the Board and the officers of the Trust.
Under the Investment Advisory Agreement with the Fund, the Advisor has overall responsibility for the general management and administration of the Fund and arranges for sub-advisory, transfer agency, custody, fund administration, securities lending, and all other non-distribution related services necessary for the Fund to operate. The Advisor bears the costs of all advisory and non-advisory services required to operate the Fund, in exchange for a single unitary fee. For services provided the Fund pays the Advisor at an annual rate of 0.75% of the Fund’s average daily net assets. The Advisor has an agreement with, and is dependent on, a third party to pay the Fund’s expenses in excess of 0.75% of the Fund’s average daily net assets. Additionally, under the Investment Advisory Agreement, the Advisor has agreed to pay all expenses of the Fund, except for: the fee paid to the Advisor pursuant to the Investment Advisory Agreement, interest charges on any borrowings, taxes, brokerage commissions and other expenses incurred in placing orders for the purchase and sale of securities and other investment instruments, acquired fund fees and expenses, accrued deferred tax liability, extraordinary expenses, and distribution (12b-1) fees and expenses (collectively, “Excluded Expenses”). The Advisor has entered into an Agreement with ITEQ ETF Partners, LLC (the “Sponsor”), under which the Sponsor agrees to sublicense the use of the Underlying Index to the Advisor. The Sponsor also provides marketing support for the Fund, including distributing marketing materials related to the Fund. ITEQ ETF Partners, LLC is a privately held business focused on bringing exchange-traded investment products to investors in the U.S. The Sponsor does not make investment decisions, provide investment advice, or otherwise act in the capacity of an investment adviser to the Fund. Additionally, the Sponsor is not involved in the maintenance of the Underlying Index and does not otherwise act in the capacity of an index provider.
US Bancorp Fund Services, LLC (the “Administrator”) provides fund accounting, fund administration, and transfer agency services to the Fund. The Advisor compensates the Administrator for these services under an administration agreement between the two parties.
The Advisor pays each independent Trustee a quarterly fee for service to the Fund. Each Trustee is also reimbursed by the Advisor for all reasonable out-of-pocket expenses incurred in connection with his duties as Trustee, including travel and related expenses incurred in attending Board meetings.
NOTE 5 – DISTRIBUTION PLAN
The Fund has adopted a Plan of Distribution pursuant to Rule 12b-1 under the 1940 Act. Under the Plan, the Fund may pay compensation to the Distributor or any other distributor or financial institution with which the Trust has an agreement with respect to the Fund, with the amount of such compensation not to exceed an annual rate of 0.25% of each Fund’s average daily net assets. For the year ended September 30, 2017, the Fund did not incur any 12b-1 expenses.
19
BlueStar TA-BIGITechTM Israel Technology ETF
NOTES TO FINANCIAL STATEMENTS
September 30, 2017 (Continued)
September 30, 2017 (Continued)
NOTE 6 – PURCHASES AND SALES OF SECURITIES
The costs of purchases and sales of securities, excluding short-term securities and in-kind transactions, for the year ended September 30, 2017 are as follows:
| Purchases | Sales | ||
BlueStar TA-BIGITechTM Israel Technology ETF | $ 2,415,201 | $ 2,799,713 |
The costs of purchases and sales of in-kind transactions associated with creations and redemptions for the year ended September 30, 2017 are as follows:
Purchases In-Kind | Sales In-Kind | ||
BlueStar TA-BIGITechTM Israel Technology ETF | $ 18,709,319 | $ 2,707,801 |
Purchases in-kind are the aggregate of all in-kind purchases and sales in-kind are the aggregate of all proceeds from in-kind sales. Net capital gains or losses resulting from in-kind redemptions are excluded from the determination of the Fund’s taxable gains and are not distributed to shareholders.
During the year ended September 30, 2017, the Fund did not incur any broker commissions to an affiliated broker, Penserra Capital Management, LLC (the “sub-advisor”).
There were no purchases or sales of U.S. Government obligations for the year ended September 30, 2017.
NOTE 7 – SECURITIES LENDING
The Fund may lend up to 331/3% of the value of the securities in its portfolio to brokers, dealers and financial institutions (but not individuals) under terms of participation in a securities lending program administered by U.S. Bank N.A. (“the Custodian”). The securities lending agreement requires that loans are collateralized at all times in an amount equal to at least 102% of the value of any loaned securities at the time of the loan, plus accrued interest. The Fund receives compensation in the form of fees and earns interest on the cash collateral. The amount of fees depends on a number of factors including the type earns of security and length of the loan. The Fund continues to receive interest payments or dividends on the securities loaned during the borrowing period. Gain or loss in the fair value of securities loaned that may occur during the term of the loan will be for the account of the Fund. The Fund has the right under the terms of the securities lending agreement to recall the securities from the borrower on demand. As of September 30, 2017, the Fund had loaned securities and received cash collateral for the loans. The cash collateral is invested by the Custodian in accordance with approved investment guidelines. Those guidelines require the cash collateral to be invested in readily marketable, high quality, short-term obligations; however, such investments are subject to risk of payment delays or default on the part of the issuer or counterparty or otherwise may not generate sufficient interest to support the costs associated with securities lending. The Fund could also experience delays in recovering its securities and possible loss of income or value if the borrower fails to return the borrowed securities, although the Fund is indemnified from this risk by contract with the securities lending agent.
20
BlueStar TA-BIGITechTM Israel Technology ETF
NOTES TO FINANCIAL STATEMENTS
September 30, 2017 (Continued)
September 30, 2017 (Continued)
As of September 30, 2017, the value of the securities on loan and payable for collateral due to broker were as follows:
Value of Securities on Loan Collateral Received
| Fund | Values of Securities on Loan | Fund Collateral Received* | ||
BlueStar TA-BIGITechTM Israel Technology ETF | $4,955,081 | $5,058,966 |
* The cash collateral received was invested in the Mount Vernon Liquid Assets Portfolio, an investment with an overnight and continuous maturity, as shown on the Schedule of Investments.
Interest income earned on collateral investments (including applicable fees) and recognized by the Fund during the year ended September 30, 2017, aggregated $15,194.
NOTE 8 – FEDERAL INCOME TAXES
The components of distributable earnings (losses) and cost basis of investments for federal income tax purposes at September 30, 2017 were as follows:
| Cost | Gross Unrealized Appreciation | Gross Unrealized Depreciation | Net Unrealized Appreciation (Depreciation) | |||||||||||||
BlueStar TA-BIGITechTM Israel Technology ETF | $ | 26,134,679 | $ | 3,408,844 | $ | (1,114,823 | ) | $ | 2,294,021 | |||||||
| Undistributed Ordinary Income | Undistributed Long-term Gain | Total Distributable Earnings | Other Accumulated (Loss) | Total Accumulated Gain | ||||||||||||||||
BlueStar TA-BIGITechTM Israel Technology ETF | $ | 163,624 | $ | — | $ | 163,624 | $ | (100,916 | ) | $ | 2,356,729 | |||||||||
As of September 30, 2017, the Fund had accumulated capital loss carryovers of:
| Capital Loss Carryover | Expires | ||||||
BlueStar TA-BIGITechTM Israel Technology ETF | $ | 100,916 | Indefinite | ||||
Under current tax law, capital and currency losses realized after October 31 of a Fund’s fiscal year may be deferred and treated as occurring on the first business day of the following fiscal year for tax purposes. The following Funds had deferred post-October capital and currency losses, which will be treated as arising on the first business day of the year ended September 30, 2017.
| Late Year Ordinary Loss | Post-October Capital Loss | |||
BlueStar TA-BIGITechTM Israel Technology ETF | None | None |
21
BlueStar TA-BIGITechTM Israel Technology ETF
NOTES TO FINANCIAL STATEMENTS
September 30, 2017 (Continued)
September 30, 2017 (Continued)
U.S. GAAP requires that certain components of net assets relating to permanent differences be reclassified between financial and tax reporting. These reclassifications have no effect on net assets or net asset value per share. For the fiscal year ended September 30, 2017, the following table shows the reclassifications made:
| Undistributed Accumulated Net Investment Income | Accumulated Net Realized Loss | Paid-In Capital | |
| BlueStar TA-BIGITech Israel Technology ETF | $ 1,290 | $ (480,827) | $ 479,537 |
NOTE 9 – DISTRIBUTIONS TO SHAREHOLDERS
The Fund paid $18,370 from ordinary income during the year ended September 30, 2017.
NOTE 10 – LEGAL MATTERS
The Trust, the trustees of the Trust, the Advisor and certain officers of the Advisor are defendants in an action filed May 2, 2017 in the Superior Court of New Jersey captioned PureShares, LLC d/b/a PureFunds et al. v. ETF Managers Group, LLC et al., Docket No. C-63-17. The PureShares action alleges claims based on disputes arising out of contractual relationships with the Advisor. The action seeks damages in unspecified amounts and injunctive relief based on breach of contract, wrongful termination, and several other theories. At the outset of the litigation, and again a few weeks later, plaintiffs sought temporary injunctive relief. Both motions were denied, and the matter is now proceeding through pretrial discovery. The defendants believe the lawsuit is without merit and intend to vigorously defend themselves against the allegations.
The Adviser, its parent, Exchange Traded Managers Group, LLC and its chief executive officer are defendants in a case filed on October 26, 2017 in the United States District Court for the Southern District of New York by NASDAQ, Inc. captioned Nasdaq, Inc. v. Exchange Traded Managers Group, LLC et al., Case 1:17-cv-08252. This action arises out of related facts and circumstances in the New Jersey litigation and asserts claims for breach of contract, wrongful termination and certain other theories with respect to the same exchange traded Fund discussed above. The defendants in the Southern District actions believe the lawsuit is without merit and intend to vigorously defend themselves against the allegations and to assert counterclaims against NASDAQ for breaches of its duties under the related index license agreement and various other agreements.
Management of the Trust and the Fund, after consultation with legal counsel, believes that the resolution of these matters will not have a material adverse effect on the Fund’s financial statements.
NOTE 11 – SUBSEQUENT EVENTS
In preparing these financial statements, the Fund has evaluated events and transactions for potential recognition or disclosure through the date the financial statements were issued. See Note 10.
22
BlueStar TA-BIGITechTM Israel Technology ETF
To the Board of Trustees of ETF Managers Trust
and the Shareholders of BlueStar TA-BIGITech Israel Technology ETF:
We have audited the accompanying statement of assets and liabilities, including the schedule of investments, of BlueStar TA-BIGITech Israel Technology ETF (the “Fund”) (a series of ETF Managers Trust) as of September 30, 2017, the related statements of operations for the year then ended, and the statements of changes in net assets and financial highlights for the year then ended and the period from November 2, 2015 (commencement of operations) to September 30, 2016. These financial statements and financial highlights are the responsibility of the Fund’s management. Our responsibility is to express an opinion on these financial statements and financial highlights based on our audits.
We conducted our audits in accordance with the standards of the Public Company Accounting Oversight Board (United States). Those standards require that we plan and perform the audit to obtain reasonable assurance about whether the financial statements and financial highlights are free of material misstatement. The Fund is not required to have, nor were we engaged to perform, an audit of its internal control over financial reporting. Our audit included consideration of internal control over financial reporting as a basis for designing audit procedures that are appropriate in the circumstances, but not for the purpose of expressing an opinion on the effectiveness of the Fund’s internal control over financial reporting. Accordingly, we express no such opinion. An audit includes examining, on a test basis, evidence supporting the amounts and disclosures in the financial statements. Our procedures included confirmation of securities owned as of September 30, 2017 by correspondence with the custodian. An audit also includes assessing the accounting principles used and significant estimates made by management, as well as evaluating the overall financial statement presentation. We believe that our audits provide a reasonable basis for our opinion.
In our opinion, the financial statements and financial highlights referred to above present fairly, in all material respects, the financial position of the BlueStar TA-BIGITech Israel Technology ETF series of ETF Managers Trust as of September 30, 2017, the results of its operations for the year then ended, and the changes in its net assets and its financial highlights for the year then ended and the period from November 2, 2015 (commencement of operations) to September 30, 2016, in conformity with accounting principles generally accepted in the United States of America.
/s/ WithumSmith+Brown, PC
New York, NY
November 29, 2017
November 29, 2017
23
BlueStar TA-BIGITechTM Israel Technology ETF
BlueStar TA-BIGITechTM Israel Technology ETF Closing Price vs. NAV
The following Frequency Distribution of Premiums and Discounts chart is provided to show the frequency at which the closing price for each Fund is at a premium or discount to its daily net asset value (NAV). The chart presented represents past performance and cannot be used to predict future results.
BlueStar TA-BIGITechTM Israel Technology ETF | Year Ended September 30, 2017 | ||||
Premium/Discount Range | Number of Days | Percentage of Total Days | |||
| Greater than 1.00% | 0 | 0.0 | |||
| Greater Than or equal to 0.75% And Less Than 1.00% | 1 | 0.4 | |||
| Greater Than or Equal to 0.50% And Less Than 0.75% | 15 | 6.0 | |||
| Greater Than or Equal to 0.25% And Less Than 0.50% | 161 | 64.1 | |||
| Greater Than or Equal to 0.00% And Less Than 0.25% | 70 | 27.9 | |||
| Less Than or Equal to 0.0% And Greater Than -0.25% | 4 | 1.6 | |||
| Less Than or Equal to -0.25% And Greater Than -0.50% | 0 | 0.0 | |||
| Less Than or Equal to -0.50% And Greater Than -0.75% | 0 | 0.0 | |||
| Less Than or Equal to -0.75% And Greater Than -1.00% | 0 | 0.0 | |||
| Less than -1.00% | 0 | 0.0 | |||
BlueStar TA-BIGITechTM Israel Technology ETF | November 2, 2015* through September 30, 2016 | ||||
| Premium/Discount Range | Number of Days | Percentage of Total Days | |||
| Greater than 1.00% | 3 | 1.3 | |||
| Greater Than or equal to 0.75% And Less Than 1.00% | 8 | 3.5 | |||
| Greater Than or Equal to 0.50% And Less Than 0.75% | 70 | 30.3 | |||
| Greater Than or Equal to 0.25% And Less Than 0.50% | 103 | 44.6 | |||
| Greater Than or Equal to 0.00% And Less Than 0.25% | 38 | 16.5 | |||
| Less Than or Equal to 0.0% And Greater Than -0.25% | 8 | 3.5 | |||
| Less Than or Equal to -0.25% And Greater Than -0.50% | 1 | 0.4 | |||
| Less Than or Equal to -0.50% And Greater Than -0.75% | 0 | 0.0 | |||
| Less Than or Equal to -0.75% And Greater Than -1.00% | 0 | 0.0 | |||
| Less than -1.00% | 0 | 0.0 | |||
*First day of secondary market trading
24
BlueStar TA-BIGITechTM Israel Technology ETF
For the Year Ended September 30, 2017 (Unaudited)
Pursuant to Section 15(c) of the Investment Company Act of 1940 (the “1940 Act”), at a meeting held on June 14, 2017, the Board of Trustees (the “Board”) of ETF Managers Trust (the “Trust”) considered the renewal of the Investment Advisory Agreement (“Advisory Agreement”) between ETF Managers Group LLC (the “Adviser”) and the Trust, on behalf of BlueStar TA-BIGITechTM Israel Technology ETF (“ITEQ”) (the “Fund”).
Pursuant to Section 15(c) of the 1940 Act, the Board must annually review and approve the Advisory Agreement after its initial two-year term: (i) by the vote of the Trustees or by a vote of the shareholders of the Fund; and (ii) by the vote of a majority of the Trustees who are not parties to the Advisory Agreement or “interested persons” of any party thereto, as defined in the 1940 Act (the “Independent Trustees”), cast in person at a meeting called for the purpose of voting on such approval. Each year, the Board calls and holds a meeting to decide whether to renew the Advisory Agreement for an additional one-year term. In preparation for such meetings, the Board requests and reviews a wide variety of information from the Adviser.
In reaching this decision, the Board, including the Independent Trustees, considered all factors it believed relevant, including: (i) the nature, extent and quality of the services provided to the Fund’s shareholders by the Adviser; (ii) the investment performance of the Fund; (iii) the Adviser’s cost and profits they realize in providing their services, including any fall-out benefits enjoyed by the Adviser; (iv) comparative fee and expense data for the Fund in relation to other similar investment companies; (v) the extent to which economies of scale would be realized as the Fund grows and whether the advisory fee for the Fund reflects these economies of scale for the benefit of the Fund; and (vi) other financial benefits to the Adviser and its affiliates resulting from services rendered to the Fund. The Board’s review included written and oral information furnished to the Board prior to and at the meeting held on June 14, 2017, and throughout the year. Among other things, the Adviser provided overviews of its advisory business, including its personnel. The information provided discussed the services provided by the Adviser. The Board then discussed the written and oral information that it received before the meeting and throughout the year, and the Adviser’s oral presentations and any other information that the Board received at the meeting, and deliberated on the renewal of the Advisory Agreement in light of this information.
The Independent Trustees were assisted throughout the contract review process by Schiff Hardin LLP. The Independent Trustees relied upon the advice of such counsel and their own business judgment in determining the material factors to be considered in evaluating the Advisory Agreement, and the weight to be given to each such factor. The conclusions reached with respect to the Advisory Agreement were based on a comprehensive evaluation of all the information provided and not any single factor. Moreover, each Trustee may have placed varying emphasis on particular factors in reaching conclusions. The matters discussed were also considered separately by the Independent Trustees in executive session with Schiff Hardin LLP, at which no representatives of management were present.
Nature, Extent and Quality of Services Provided by the Adviser
The Trustees considered the scope of services provided under the Advisory Agreement, noting that the Adviser will be providing investment management services to the Fund. The Board discussed the responsibilities of the Adviser, including: responsibility for the general management of the day-to-day investment and reinvestment of the assets of the Fund; determining the daily baskets of deposit securities and cash components; executing portfolio security trades for purchases and redemptions of Fund shares conducted on a cash-in-lieu basis; responsibility for daily monitoring of tracking error and quarterly reporting to the Board; and implementation of Board directives as they relate to the Fund. In considering the nature, extent and quality of the services provided by the Adviser, the Board considered the quality of the Adviser’s compliance program. The Board also considered the Adviser’s experience managing ETFs. The Board considered the experience of the portfolio managers of the Fund.
25
BlueStar TA-BIGITechTM Israel Technology ETF
APPROVAL OF ADVISORY AGREEMENT AND BOARD CONSIDERATIONS
For the Year Ended September 30, 2017 (Unaudited)
The Board also considered other services provided to the Fund, such as overseeing the Fund’s service providers, monitoring adherence to the Fund’s investment restrictions, and monitoring compliance with various policies and procedures and with applicable securities laws.
Based on the factors above, as well as those discussed below, the Board concluded that it was satisfied with the nature, extent and quality of the services to be provided to the Fund by the Adviser.
Historical Performance
The Board then considered the past performance of the Fund. The Board reviewed information regarding the performance history of the Fund over various time periods, including the year-to-date period, the most recent one-year period and the periods since the Fund’s inception, each as of May 31, 2017. The Board noted that the index-based investment objective of ITEQ made analysis of investment performance, in absolute terms, less of a priority than that which normally attaches to the performance of actively managed funds. Instead, the Board focused on the extent to which ITEQ tracked its underlying index. The Board noted that the Adviser began managing the Fund on April 1, 2017. The Board reviewed information regarding the Fund’s index tracking during the time it was managed by the Adviser, discussing, as applicable, factors which contributed to the Fund’s tracking error over certain periods of time. The Board concluded that, after taking these factors into account, the Fund satisfactorily tracked its underlying index. The Board further noted that it had received and would continue to receive regular reports regarding the Fund’s performance at its quarterly meetings. The Board concluded that, given the capabilities and experience of the Adviser’s personnel in managing ETFs, the Adviser would be able to continue to keep the Fund’s tracking error within acceptable ranges.
Cost of Services Provided and Economies of Scale
The Board reviewed the advisory fee for the Fund and compared it to the total operating expenses of other funds in the industry falling within the same style category. The Board took into consideration management’s discussion of the fees, including that the Fund has a niche investment strategy and limited peer ETFs.
The Board also noted the importance of the fact that the advisory fee for the Fund was a “unified fee,” meaning that the shareholders of the Fund pay no expenses other than the advisory fee and certain other costs such as interest, brokerage and extraordinary expenses and, to the extent it is implemented, fees pursuant to a Distribution and/or Shareholder Servicing (12b-1) Plan. The Board noted that the Adviser was responsible for compensating the Trust’s other service providers and paying the Fund’s other expenses out of its own fee and resources. The Board also evaluated the compensation and benefits received by the Adviser from its relationship with the Fund, taking into account an analysis of the Adviser’s profitability provided at the meeting. The Board concluded that the advisory fee for the Fund was fair and reasonable in light of the factors considered.
In addition, the Board considered whether economies of scale had been realized for the Fund. The Board noted that the Adviser regularly considers whether fee reductions are appropriate as the Funds grow in size. The Board concluded that the Fund had not reached a size where it had realized economies of scale that would warrant a fee reduction. The Board noted that a unitary fee provides a level of certainty in expenses for the Fund. The Trustees concluded that the flat advisory fee was reasonable and appropriate.
Based on the Board’s deliberations and its evaluation of the information described above, the Board, including the Independent Trustees, unanimously: (a) concluded that the terms of the Advisory Agreement are fair and reasonable; (b) concluded that the Adviser’s fees are reasonable in light of the services that the Adviser provides to the Fund; and (c) agreed to renew the Advisory Agreement for another year.
26
BlueStar TA-BIGITechTM Israel Technology ETF
September 30, 2017 (Unaudited)
FEDERAL TAX INFORMATION
(Unaudited)
During the year ended September 30, 2017, the Funds did not declare any long-term realized gains distributions.
Qualified Dividend Income/Dividends Received Deduction
For the fiscal year ended September 30, 2017, certain dividends paid by the Fund may be subject to a maximum tax rate of 15%, as provided for by the Jobs and Growth Tax Reconciliation Act of 2003. The percentage of dividends declared from ordinary income designated as qualified dividend income was as follows:
| Fund Name | QDI |
BlueStar TA-BIGITechTM Israel Technology ETF | 94.57% |
For corporate shareholders, the percent of ordinary income distributions qualifying for the corporate dividends received deduction for the fiscal year ended September 30, 2017 was as follows:
| Fund Name | DRD |
BlueStar TA-BIGITechTM Israel Technology ETF | 7.19% |
Pursuant to Section 853 of the Internal Revenue Code the Fund designated the following amounts as foreign taxes paid for the year ended September 30, 2017. Foreign taxes paid for purposes of Section 853 may be less than actual foreign taxes paid for financial statement purposes.
| Per Share | ||||||||||
| Fund | Gross Foreign Source Income | Foreign Taxes Passthrough | Gross Foreign Source Income | Foreign Taxes Passthrough | Shares Outstanding at 9/30/2017 | |||||
BlueStar TA-BIGITechTM Israel | ||||||||||
| Technology ETF | 93,574 | 8,216 | 0.12476543 | 0.01095520 | 750,000 | |||||
27
BlueStar TA-BIGITechTM Israel Technology ETF
SUPPLEMENTARY INFORMATION
September 30, 2017 (Unaudited)
(Unaudited)
The Fund files a Form N-Q with the Securities and Exchange Commission (the ‘‘SEC’’) no more than sixty days after the Fund’s first and third fiscal quarters. For the Fund, this would be for the fiscal quarters ending June 30 and December 31. Form N-Q includes a complete schedule of the Funds’ portfolio holdings as of the end of those fiscal quarters. The Fund’s N-Q filings can be found free of charge on the SEC’s website at http://www.sec.gov, or they may be reviewed and copied at the SEC’s Public Reference Room in Washington, D.C. (call 800-SEC-0330 for information on the operation of the Public Reference Room). The Fund’s portfolio holdings are posted on the Fund’s website at www.iteqetf.com daily.
(Unaudited)
A description of the policies and procedures the Fund uses to determine how to vote proxies relating to portfolio securities is provided in the Statement of Additional Information (“SAI”). The SAI is available without charge upon request by calling toll-free at 1-844-ETF-MGRS (1-844-383-6477), by accessing the SEC’s website at www.sec.gov, or by accessing the Fund’s website at www.iteqetf.com.
Information regarding how the Fund voted proxies relating to portfolio securities during the period ending June 30 is available by calling toll-free at 1-844-ETF-MGRS (1-844-383-6477) or by accessing the SEC’s website at www.sec.gov.
Carefully consider the Fund’s investment objectives, risk factors, charges, and expenses before investing. This and additional information can be found in the Fund’s prospectus, which may be obtained by calling 1-844-ETF-MGRS (1-844-383-6477) or by visiting www.iteqetf.com. Read the prospectus carefully before investing.
28
BlueStar TA-BIGITechTM Israel Technology ETF
For the Period Ended September 30, 2017 (Unaudited)
As a shareholder of BlueStar TA-BIGITechTM Israel Technology ETF (the “Fund”) you incur two types of costs: (1) transaction costs, including brokerage commissions on purchases and sales of Fund shares, and (2) ongoing costs, including management fees and other Fund expenses. These examples are intended to help you understand your ongoing costs (in dollars) of investing in the Fund and to compare these costs with the ongoing costs of investing in other funds. The example is based on an investment of $1,000 invested at the beginning of the period and held for the entire period (April 1, 2017 to September 30, 2017).
Actual Expenses
The first line of the table provides information about actual account values based on actual returns and actual expenses. You may use the information in this line, together with the amount you invested, to estimate the expenses that you paid over the period. Simply divide your account value by $1,000 (for example, an $8,600 account value divided by $1,000 = 8.6), then, multiply the result by the number in the first line under the heading entitled “Expenses Paid During Period’’ to estimate the expenses you paid on your account during this period.
Hypothetical Example for Comparison Purposes
The second line of the table provides information about hypothetical account values based on a hypothetical return and hypothetical expenses based on the Fund’s actual expense ratio and an assumed rate of return of 5% per year before expenses, which is not the Fund’s actual return. The hypothetical account values and expenses may not be used to estimate the actual ending account balance or expenses you paid for the period. You may use this information to compare the ongoing costs of investing in the Fund and other funds. To do so, compare this 5% hypothetical example with the 5% hypothetical examples that appear in the shareholder reports of the other funds. Please note that the expenses shown in the table are meant to highlight your ongoing costs only and do not reflect any transactional costs, such as brokerage commissions paid on purchases and sales of Fund shares. Therefore, the second line of the table is useful in comparing ongoing costs only and will not help you determine the relative total costs of owning different funds. If these transactional costs were included, your costs would have been higher.
BlueStar TA-BIGITechTM Israel Technology ETF
Beginning Account Value April 1, 2017 | Ending Account Value September 30, 2017 | Expenses Paid During the Period^ | ||||
| Actual | $1,000.00 | $1,105.10 | $3.96 | |||
| Hypothetical (5% annual) | $1,000.00 | $1,021.31 | $3.80 |
^ The dollar amounts shown as expenses paid during the period are equal to the annualized six-month expense ratio multiplied by the average account value during the period, multiplied by 183/365 (to reflect the period from April 1, 2017 to September 30, 2017).
29
BlueStar TA‐BIGITech Israel Technology ETF
Set forth below are the names, birth years, positions with the Trust, length of term of office, and the principal occupations and other directorships held during at least the last five years of each of the persons currently serving as a Trustee of the Trust, as well as information about each officer. The business address of each Trustee and officer is 30 Maple Street, Summit, New Jersey 07901.
Name and Year of Birth | Position(s) Held with the Trust, Term of Office and Length of Time Served | Principal Occupation(s) During Past 5 Years | Number of Portfolios in Fund Complex Overseen By Trustee | Other Directorships Held by Trustee During Past 5 Years | ||||||||
| Interested Trustee* and Officers | ||||||||||||
| Samuel Masucci, III (1962) | Trustee, Chairman of the Board and President (since 2012); Secretary (since 2014) | Chief Executive Officer, Exchange Traded Managers Group, LLC (since 2013); Chief Executive Officer and Chief Compliance Officer, Factor Advisors, LLC (since 2012); President and Chief Executive Officer, Factor Capital Management LLC (since 2012); President and Chief Executive Officer, GENCAP Ventures, LLC (holding company) (2012–2013); Chief Executive Officer, MacroMarkets LLC (exchange traded funds) (2005–2011); President, Chief Executive and Chief Compliance Officer, Macro Financial (financial services) (2005–2011). | 9 | None | ||||||||
| Reshma J. Amin (1978) | Chief Compliance Officer (since 2016) | Chief Compliance Officer, Exchange Traded Managers Group, LLC (since 2016); Partner, Crow & Cushing (2007–2016). | n/a | n/a | ||||||||
| John A. Flanagan (1946) | Treasurer (since 2015) | President, John A. Flanagan CPA, LLC (accounting services) (since 2010); Chief Financial Officer, Exchange Traded Managers Group, LLC (since 2015); Principal Financial Officer, ETF Managers Capital, LLC (commodity pool operator) (since 2014); Chief Financial Officer, Macromarkets LLC (exchange traded funds) (2007–2010) | n/a | n/a | ||||||||
* Mr. Masucci is an interested Trustee by virtue of his role as the Chief Executive Officer of the Adviser.
30
BlueStar TA‐BIGITechTM Israel Technology ETF
Board of Trustees
Name and Year of Birth | Position(s) Held with the Trust, Term of Office and Length of Time Served | Principal Occupation(s) During Past 5 Years | Number of Portfolios in Fund Complex Overseen By Trustee | Other Directorships Held by Trustee During Past 5 Years | ||||||||
| Independent Trustees | ||||||||||||
| John W. Southard (1969) | Trustee (since 2012) | Director and Co-Founder, T2 Capital Management, 2010 to present; Co-Founder and Head of Research and Trading, PowerShares Capital Management, 2002 to 2009. | 9 | None | ||||||||
| Terry Loebs (1963) | Trustee (since 2014) | Founder and Managing Member, Pulsenomics LLC (index product development and consulting firm) (since 2011); Managing Director, MacroMarkets, LLC (exchange-traded products firm) (2006–2011). | 9 | None | ||||||||
31
BlueStar TA‐BIGITechTM Israel Technology ETF
ETF MANAGERS TRUST
ETF Managers Trust, (the “Trust”) has adopted the following privacy policies in order to safeguard the personal information of the Trust’s customers and consumers in accordance with Regulation S-P as promulgated by the U.S. Securities and Exchange Commission.
Trust officers are responsible for ensuring that the following policies and procedures are implemented:
| 1) | The Trust is committed to protecting the confidentiality and security of the information they collect and will handle personal customer and consumer information only in accordance with Regulation S-P and any other applicable laws, rules and regulations1. The Trust will ensure: (a) the security and confidentiality of customer records and information; (b) that customer records and information are protected from any anticipated threats and hazards; and (c) that customer records and information are protected from unauthorized access or use. |
| 2) | The Trust conducts its business affairs through its trustees, officers and third parties that provide services pursuant to agreements with the Trust. The Trust has no employees. It is anticipated that the trustees and officers of the Trust who are not employees of service providers of the Trust will not have access to customer records and information in the performance of their normal responsibilities for the Trust. |
| 3) | The Trust may share customer information with its affiliates, subject to the customers’ right to prohibit such sharing. |
| 4) | The Trust may share customer information with unaffiliated third parties only in accordance with the requirements of Regulation S-P. Pursuant to this policy, the Trust will not share customer information with unaffiliated third parties other than as permitted by law, unless authorized to do so by the customer. |
Consistent with these policies, the Trust has adopted the following procedures:
| 1) | The Trust will determine that the policies and procedures of its affiliates and Service Providers are reasonably designed to safeguard customer information and only permit appropriate and authorized access to and use of customer information through the application of appropriate administrative, technical and physical protections. |
| 2) | The Trust will direct each of its Service Providers to adhere to the privacy policy of the Trust and to its privacy policies with respect to all customer information of the Trust and to take all actions reasonably necessary so that the Trust is in compliance with the provisions of Regulation S-P, including, as applicable, the development and delivery of privacy notices and the maintenance of appropriate and adequate records. |
| 3) | The Trust requires its Service Providers to provide periodic reports to the Trust’s Board of Trustees outlining their privacy policies and the implementation of such policies. Each Service Provider is required to promptly report to the Trust’s Board any material changes to its privacy policy before, or promptly after, the adoption of such changes. |
1 Generally, the Funds have institutional clients which are not considered “customers” for purposes of regulation S-P.
32
(This page intentionally left blank).
Advisor
ETF Managers Group, LLC
30 Maple Street, Suite 2, Summit, NJ 07901
30 Maple Street, Suite 2, Summit, NJ 07901
Distributor
ETFMG Financial, Inc.
30 Maple Street, Suite 2, Summit, NJ 07901
Custodian
U.S. Bank National Association
Custody Operations
Custody Operations
1555 North River Center Drive, Suite 302, Milwaukee, Wisconsin 53212
Transfer Agent
U.S. Bancorp Fund Services, LLC
615 East Michigan Street, Milwaukee, Wisconsin 53202
Securities Lending Agent
U.S Bank, National Association
Securities Lending
800 Nicolet Mall
Minneapolis, MN 55402-7020
Securities Lending
800 Nicolet Mall
Minneapolis, MN 55402-7020
Independent Registered Public Accounting Firm
WithumSmith + Brown, PC
1411 Broadway, 9th Floor, New York, NY 10018
Legal Counsel
Sullivan & Worcester LLP
1666 K Street NW, Washington, DC 20006

Annual Report
September 30, 2017
Etho Climate Leadership U.S. ETF
Ticker: ETHO
The Fund is a series of ETF Managers Trust.
Etho Climate Leadership U.S. ETF
TABLE OF CONTENTS
September 30, 2017
September 30, 2017
| Page | ||
| 2 | ||
| 3 | ||
| 4 | ||
| 5 | ||
| 6 | ||
| 7 | ||
| 18 | ||
| 19 | ||
| 20 | ||
| 21 | ||
| 22 | ||
| 31 | ||
| 32 | ||
| 33 | ||
| 36 | ||
| 37 | ||
| 37 | ||
| 38 | ||
| 39 | ||
| 41 |
Dear Shareholder,
On behalf of the entire team, we want to express our appreciation for the confidence you have placed in the Etho Climate Leadership U.S. Exchange-Traded Fund (“ETHO” or the “Fund”). The following information pertains to the fiscal year ended September 30, 2017.
The Fund saw positive performance during the fiscal year ended September 30, 2017. The Fund NAV reflected a positive return of 20.14%, in line with its benchmark, the Etho Climate Leadership Index – U.S. (“Index”), which increased 19.39% over the same period. The difference was primarily attributable to Fund expenses that are not a part of the Index.
For the year ended September 30, 2017, the best performing securities in the Fund were Nvidia Corp (up 162.38%), Universal Display Corp (up 131.81%), and Brink’s (up 127.11%). The worst performing securities in the Fund were FuelCell Energy (down -65.20%), Hertz (down -59.42%), and Under Armour (down -55.89%).
As we have discussed previously, the Etho Climate Leadership U.S. ETF offers broad diversification across companies that have demonstrated efficiency and leadership with their use of resources and their supply chains when compared to industry peers. The Fund holds roughly 340 equities equally weighted and results in a carbon emissions profile that is, on average, 50-70% lower per dollar invested than conventional U.S. benchmark indices1. ETHO avoids investment in any direct fossil fuel companies, as well as enablers of that industry, along with a series of other unsustainable industries such as Tobacco/Weapons/Gambling, etc. Equal weighting of the Fund allows for the elimination of equities that do not meet ETHO’S standards without there being a significant impact on the diversification or performance of the Fund. It also creates broad exposure to both the sectors and factors that potentially make for greater stability and higher performance.
There is much ahead for environmentally sustainable and socially responsible investing. We are thankful you have joined us by investing in the Etho Climate Leadership U.S. ETF.
You can find further details about ETHO by visiting www.ethoetf.com, or by calling 1- 844-ETF-MGRS (1-844-383-6477).
Sincerely,
Samuel Masucci III
Chairman of the Board
Chairman of the Board
Samuel Masucci III is a registered representative of ETFMG Financial, LLC.
1 Etho Capital.
2
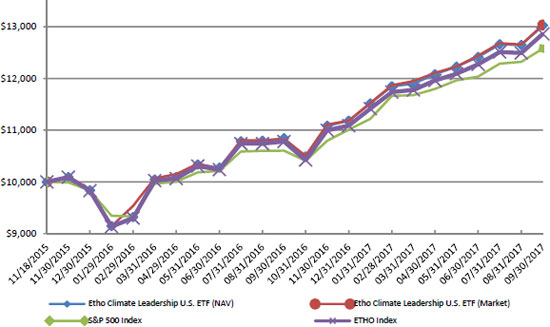
Average Annual Returns Period Ended September 30, 2017 | 1 Year Return | Since Inception (11/18/2015) | ||||||
| Etho Climate Leadership U.S. ETF (NAV) | 20.14 | % | 15.20 | % | ||||
| Etho Climate Leadership U.S. ETF (Market) | 20.41 | % | 15.24 | % | ||||
| S&P 500 Index | 18.61 | % | 13.06 | % | ||||
| Etho Climate Leadership Index - U.S. | 19.39 | % | 14.45 | % | ||||
Total Fund Operating Expenses1 | 0.45 | % | ||||||
1. The expense ratio is taken from the Fund’s most recent prospectus dated January 31, 2017.
Performance data quoted represents past performance and does not guarantee future results. The investment return and principal value of an investment will fluctuate so that an investor’s shares, when sold, may be worth more of less than their original cost. Current performance of the Fund may be lower or higher than the performance quoted. All performance is historical and includes reinvestment of dividends and capital gains. Performance data current to the most recent month end may be obtained by calling 1-844- ETF-MGRS (1-844-383-6477).
The chart illustrates the performance of a hypothetical $10,000 investment made on November 18, 2015, and is not intended to imply any future performance. The returns shown do not reflect a reduction of taxes that a shareholder would pay on Fund distributions from the sale of Fund shares. The chart assumes reinvestment of capital gains and dividends.
The unmanaged indices do not reflect fees and are not available for direct investment.
3
Etho Climate Leadership U.S. ETF
| Security | % of Total Investments† | |||||
| 1 | Alnylam Pharmaceuticals, Inc. | 0.55% | ||||
| 2 | First Solar, Inc. | 0.41% | ||||
| 3 | NVIDIA Corp. | 0.40% | ||||
| 4 | Align Technology, Inc. | 0.39% | ||||
| 5 | Brink’s Co. | 0.38% | ||||
| 6 | IPG Photonics Corp. | 0.37% | ||||
| 7 | Universal Display Corp. | 0.36% | ||||
| 8 | PayPal Holdings, Inc. | 0.36% | ||||
| 9 | CommerceHub, Inc. - Series A | 0.35% | ||||
| 10 | Lam Research Corp. | 0.35% | ||||
Top Ten Holdings = 3.92% of Total Investments† * Current Fund holdings may not be indicative of future Fund holdings. † Percentage of total investments less cash. | ||||||
4
Etho Climate Leadership U.S. ETF
Investing involves risk, including the possible loss of principal. Shares of any ETF are bought and sold at market price (not NAV), may trade at a discount or premium to NAV and are not individually redeemed from the Fund. Brokerage commissions will reduce returns. Narrowly focused investments typically exhibit higher volatility.
The Etho Climate Leadership U.S. ETF (the “Fund”) seeks to provide investment results that, before fees and expenses, correspond generally to the total return performance of the Etho Climate Leadership Index – US (the “Index”).
Funds that invest in smaller companies may experience greater volatility. The Fund’s return may not match or achieve a high degree of correlation with the return of the Etho Climate Leadership Index – US (ticker: ETHO INDEX). To the extent the Fund utilizes a sampling approach, it may experience tracking error to a greater extent than if the Fund had sought to replicate the Index. Diversification does not guarantee a profit, nor does it protect against a loss in a declining market.
The Etho Climate Leadership Index™ (ECLI™) is an index of more than 350 companies listed on the NYSE Arca stock exchange that have the smallest carbon footprint in their industries.
S&P 500: The S&P 500 Index is the Standard & Poor’s composite index of 500 stocks, a widely recognized, unmanaged index of common stock prices.
5
PORTFOLIO ALLOCATIONS
As of September 30, 2017 (Unaudited)
Etho Climate Leadership U.S. ETF | ||||
| As a percent of Net Assets: | ||||
| Bermuda | 2.1 | % | ||
| Canada | 0.3 | |||
| Ireland | 1.3 | |||
| Jersey | 0.3 | |||
| Netherlands | 0.3 | |||
| Switzerland | 0.6 | |||
| United Kingdom | 0.4 | |||
| United States | 93.9 | |||
| Virgin Islands (UK) | 0.4 | |||
| Short-Term and other Net Assets (Liabilities) | 0.4 | |||
| 100.0 | % | |||
6
Etho Climate Leadership U.S. ETF
September 30, 2017
| Shares | Fair Value | |||||||
| COMMON STOCKS - 99.6% | ||||||||
| Bermuda - 2.1% | ||||||||
| Chemicals - 0.2% | ||||||||
| Axalta Coating Systems Ltd. (a) | 1,637 | $ | 47,342 | |||||
| Insurance - 1.6% | ||||||||
| Arch Capital Group Ltd. (a) | 556 | 54,766 | ||||||
| Axis Capital Holdings Ltd. | 792 | 45,390 | ||||||
| Everest Re Group Ltd. | 226 | 51,616 | ||||||
| RenaissanceRe Holdings Ltd. | 365 | 49,326 | ||||||
| Validus Holdings Ltd. | 942 | 46,356 | ||||||
| White Mountains Insurance Group Ltd. | 60 | 51,420 | ||||||
| Total Insurance | 298,874 | |||||||
| Professional Services - 0.3% | ||||||||
| IHS Markit Ltd. (a) | 1,256 | 55,364 | ||||||
| Total Bermuda | 401,580 | |||||||
| Canada - 0.3% | ||||||||
| Commercial Services & Supplies - 0.3% | ||||||||
| Waste Connections, Inc. | 897 | 62,754 | ||||||
| Ireland - 1.3% | ||||||||
| Biotechnology - 0.2% | ||||||||
| Alkermes PLC (a) | 901 | 45,807 | ||||||
| Building Products - 0.3% | ||||||||
| Allegion PLC | 698 | 60,356 | ||||||
| Insurance - 0.3% | ||||||||
| Willis Towers Watson PLC ^ | 404 | 62,309 | ||||||
| Pharmaceuticals - 0.5% | ||||||||
| Allergan PLC | 221 | 45,294 | ||||||
| Jazz Pharmaceuticals PLC (a) | 363 | 53,089 | ||||||
| Total Pharmaceuticals | 98,383 | |||||||
| Total Ireland | 266,855 | |||||||
| Jersey - 0.3% | ||||||||
| Auto Components - 0.3% | ||||||||
| Delphi Automotive PLC | 657 | 64,649 | ||||||
| Netherlands - 0.3% | ||||||||
| Electrical Equipment - 0.3% | ||||||||
| Sensata Technologies Holding NV (a) | 1,207 | 58,020 | ||||||
| Switzerland - 0.6% | ||||||||
| Electronic Equipment, Instruments & Components - 0.3% | ||||||||
| TE Connectivity Ltd. | 710 | 58,973 | ||||||
| Household Durables - 0.3% | ||||||||
| Garmin Ltd. ^ | 1,039 | 56,075 | ||||||
| Total Switzerland | 115,048 | |||||||
The accompanying notes are an integral part of these financial statements.
7
Etho Climate Leadership U.S. ETF
Schedule of Investments
September 30, 2017 (Continued)
| Shares | Fair Value | |||||||
| United Kingdom - 0.4% | ||||||||
| Insurance - 0.3% | ||||||||
| Aon PLC | 446 | $ | 65,161 | |||||
| Software - 0.1% | ||||||||
| Micro Focus International PLC - ADR (a) | 306 | 9,761 | ||||||
| Total United Kingdom | 74,922 | |||||||
| United States - 93.9% | ||||||||
| Air Freight & Logistics - 0.3% | ||||||||
| CH Robinson Worldwide, Inc. ^ | 686 | 52,205 | ||||||
| Airlines - 0.5% | ||||||||
| Alaska Air Group, Inc. | 572 | 43,626 | ||||||
| Southwest Airlines Co. | 981 | 54,917 | ||||||
| Total Airlines | 98,543 | |||||||
| Auto Components - 0.6% | ||||||||
| BorgWarner, Inc. | 1,264 | 64,755 | ||||||
| Gentex Corp. | 2,480 | 49,104 | ||||||
| Total Auto Components | 113,859 | |||||||
| Automobiles - 0.9% | ||||||||
| Harley-Davidson, Inc. ^ | 877 | 42,280 | ||||||
| Tesla, Inc. (a) ^ | 189 | 64,468 | ||||||
| Thor Industries, Inc. | 549 | 69,125 | ||||||
| Total Automobiles | 175,873 | |||||||
| Banks - 5.2% | ||||||||
| Associated Banc-Corp | 2,170 | 52,623 | ||||||
| BancorpSouth, Inc. | 1,747 | 55,991 | ||||||
| Bank of Hawaii Corp. | 643 | 53,600 | ||||||
| BOK Financial Corp. | 676 | 60,219 | ||||||
| Citizens Financial Group, Inc. | 1,536 | 58,168 | ||||||
| Commerce Bancshares, Inc. | 942 | 54,419 | ||||||
| Cullen/Frost Bankers, Inc. | 595 | 56,477 | ||||||
| First Horizon National Corp. | 2,863 | 54,826 | ||||||
| First Republic Bank | 562 | 58,707 | ||||||
| Fulton Financial Corp. | 2,965 | 55,594 | ||||||
| M&T Bank Corp. | 342 | 55,076 | ||||||
| People’s United Financial, Inc. | 2,936 | 53,259 | ||||||
| Signature Bank (a) | 355 | 45,454 | ||||||
| South State Corp. | 592 | 53,310 | ||||||
| SVB Financial Group (a) | 283 | 52,946 | ||||||
| Synovus Financial Corp. | 1,289 | 59,372 | ||||||
| Valley National Bancorp | 4,501 | 54,237 | ||||||
| Zions Bancorporation ^ | 1,258 | 59,352 | ||||||
| Total Banks | 993,630 | |||||||
| Biotechnology - 2.4% | ||||||||
| Agios Pharmaceuticals, Inc. (a) | 903 | 60,275 | ||||||
| Alnylam Pharmaceuticals, Inc. (a) | 1,029 | 120,897 | ||||||
| BioMarin Pharmaceutical, Inc. (a) | 601 | 55,935 | ||||||
| Incyte Corp. (a) | 394 | 45,996 | ||||||
The accompanying notes are an integral part of these financial statements.
8
Etho Climate Leadership U.S. ETF
Schedule of Investments
September 30, 2017 (Continued)
| Shares | Fair Value | |||||||
| Ionis Pharmaceuticals, Inc. (a) | 1,313 | $ | 66,569 | |||||
| Seattle Genetics, Inc. (a) | 838 | 45,596 | ||||||
| Vertex Pharmaceuticals, Inc. (a) | 482 | 73,283 | ||||||
| Total Biotechnology | 468,551 | |||||||
| Building Products - 2.1% | ||||||||
| AO Smith Corp. | 1,034 | 61,450 | ||||||
| Apogee Enterprises, Inc | 888 | 42,855 | ||||||
| Fortune Brands Home & Security, Inc. | 869 | 58,423 | ||||||
| Lennox International, Inc. | 315 | 56,376 | ||||||
| Masco Corp. | 1,556 | 60,700 | ||||||
| Simpson Manufacturing Co., Inc. | 1,227 | 60,172 | ||||||
| Trex Co., Inc. (a) | 759 | 68,362 | ||||||
| Total Building Products | 408,338 | |||||||
| Capital Markets - 5.2% | ||||||||
| Ares Management LP | 2,799 | 52,201 | ||||||
| BlackRock, Inc. | 138 | 61,698 | ||||||
| Charles Schwab Corp. ^ | 1,294 | 56,600 | ||||||
| CME Group, Inc. | 446 | 60,513 | ||||||
| E*TRADE Financial Corp. (a) | 1,510 | 65,851 | ||||||
| Interactive Brokers Group, Inc. | 1,522 | 68,551 | ||||||
| Intercontinental Exchange, Inc. | 883 | 60,662 | ||||||
| KKR & Co. LP | 2,929 | 59,547 | ||||||
| Morningstar, Inc. | 672 | 57,113 | ||||||
| MSCI, Inc. | 544 | 63,594 | ||||||
| Northern Trust Corp. | 612 | 56,261 | ||||||
| S&P Global, Inc. | 404 | 63,149 | ||||||
| SEI Investments Co. | 1,050 | 64,113 | ||||||
| T Rowe Price Group, Inc. | 778 | 70,527 | ||||||
| TD Ameritrade Holding Corp. | 1,362 | 66,466 | ||||||
| Westwood Holdings Group, Inc. | 996 | 67,001 | ||||||
| Total Capital Markets | 993,847 | |||||||
| Chemicals - 3.1% | ||||||||
| Albemarle Corp. | 499 | 68,019 | ||||||
| Celanese Corp. | 591 | 61,624 | ||||||
| Ecolab, Inc. ^ | 422 | 54,273 | ||||||
| FMC Corp. | 759 | 67,786 | ||||||
| International Flavors & Fragrances, Inc. | 399 | 57,021 | ||||||
| PPG Industries, Inc. | 504 | 54,765 | ||||||
| RPM International, Inc. | 965 | 49,543 | ||||||
| Sherwin-Williams Co. | 170 | 60,867 | ||||||
| Westlake Chemical Corp. | 799 | 66,389 | ||||||
| WR Grace & Co. | 759 | 54,762 | ||||||
| Total Chemicals | 595,049 | |||||||
| Commercial Services & Supplies - 1.1% | ||||||||
| Brink’s Co. | 989 | 83,324 | ||||||
| Cintas Corp. | 416 | 60,020 | ||||||
| Copart, Inc. (a) | 1,702 | 58,498 | ||||||
| Total Commercial Services & Supplies | 201,842 | |||||||
The accompanying notes are an integral part of these financial statements.
9
Etho Climate Leadership U.S. ETF
Schedule of Investments
September 30, 2017 (Continued)
| Shares | Fair Value | |||||||
| Communications Equipment - 0.9% | ||||||||
| Cisco Systems, Inc. | 1,569 | $ | 52,765 | |||||
| F5 Networks, Inc. (a) | 369 | 44,487 | ||||||
| Palo Alto Networks, Inc. (a) | 468 | 67,439 | ||||||
| Total Communications Equipment | 164,691 | |||||||
| Construction & Engineering - 0.9% | ||||||||
| AECOM (a) | 1,481 | 54,516 | ||||||
| EMCOR Group, Inc. | 838 | 58,140 | ||||||
| Jacobs Engineering Group, Inc. | 956 | 55,706 | ||||||
| Total Construction & Engineering | 168,362 | |||||||
| Construction Materials - 0.5% | ||||||||
| Martin Marietta Materials, Inc. | 242 | 49,908 | ||||||
| Vulcan Materials Co. | 438 | 52,384 | ||||||
| Total Construction Materials | 102,292 | |||||||
| Containers & Packaging - 0.6% | ||||||||
| AptarGroup, Inc. | 687 | 59,295 | ||||||
| Sealed Air Corp. | 1,213 | 51,819 | ||||||
| Total Containers & Packaging | 111,114 | |||||||
| Distributors - 0.6% | ||||||||
| Genuine Parts Co. | 573 | 54,807 | ||||||
| LKQ Corp. (a) | 1,801 | 64,818 | ||||||
| Total Distributors | 119,625 | |||||||
| Diversified Consumer Services - 0.3% | ||||||||
| H&R Block, Inc. | 2,283 | 60,454 | ||||||
| Diversified Financial Services - 0.6% | ||||||||
| FNFV Group (a) | 3,978 | 68,223 | ||||||
| Voya Financial, Inc. | 1,388 | 55,367 | ||||||
| Total Diversified Financial Services | 123,590 | |||||||
| Diversified Telecommunication Services - 0.3% | ||||||||
| Zayo Group Holdings, Inc. (a) | 1,602 | 55,141 | ||||||
| Electric Utilities - 1.5% | ||||||||
| Avangrid, Inc. | 1,242 | 58,896 | ||||||
| Eversource Energy | 903 | 54,577 | ||||||
| IDACORP, Inc. | 641 | 56,363 | ||||||
| NextEra Energy, Inc. | 413 | 60,525 | ||||||
| PPL Corp. | 1,421 | 53,927 | ||||||
| Total Electric Utilities | 284,288 | |||||||
| Electrical Equipment - 1.8% | ||||||||
| Acuity Brands, Inc. | 258 | 44,190 | ||||||
| AMETEK, Inc. | 977 | 64,521 | ||||||
| Emerson Electric Co. | 886 | 55,676 | ||||||
| Generac Holdings, Inc. (a) ^ | 1,413 | 64,900 | ||||||
| Hubbell, Inc. | 441 | 51,165 | ||||||
| Rockwell Automation, Inc. | 340 | 60,591 | ||||||
| Total Electrical Equipment | 341,043 | |||||||
The accompanying notes are an integral part of these financial statements.
10
Etho Climate Leadership U.S. ETF
Schedule of Investments
September 30, 2017 (Continued)
| Shares | Fair Value | |||||||
| Electronic Equipment, Instruments & Components - 4.8% | ||||||||
| Amphenol Corp. | 741 | $ | 62,718 | |||||
| AVX Corp. | 3,237 | 59,011 | ||||||
| Badger Meter, Inc. | 1,438 | 70,462 | ||||||
| CDW Corp. | 916 | 60,456 | ||||||
| Dolby Laboratories, Inc. ^ | 1,010 | 58,095 | ||||||
| IPG Photonics Corp. (a) | 437 | 80,871 | ||||||
| Itron, Inc. (a) | 868 | 67,227 | ||||||
| Keysight Technologies, Inc. (a) | 1,458 | 60,740 | ||||||
| Littelfuse, Inc. | 330 | 64,640 | ||||||
| National Instruments Corp. | 1,627 | 68,611 | ||||||
| OSI Systems, Inc. (a) | 722 | 65,969 | ||||||
| Trimble, Inc. (a) | 1,647 | 64,645 | ||||||
| Universal Display Corp. | 613 | 78,985 | ||||||
| Zebra Technologies Corp. (a) | 578 | 62,759 | ||||||
| Total Electronic Equipment, Instruments & Components | 925,189 | |||||||
| Food & Staples Retailing - 0.8% | ||||||||
| Costco Wholesale Corp. | 324 | 53,229 | ||||||
| PriceSmart, Inc. | 571 | 50,962 | ||||||
| Walgreens Boots Alliance, Inc. | 637 | 49,189 | ||||||
| Total Food & Staples Retailing | 153,380 | |||||||
| Food Products - 0.8% | ||||||||
| Kraft Heinz Co. | 583 | 45,212 | ||||||
| McCormick & Co., Inc. | 542 | 55,630 | ||||||
| Pinnacle Foods, Inc. | 915 | 52,311 | ||||||
| Total Food Products | 153,153 | |||||||
| Health Care Equipment & Supplies - 2.7% | ||||||||
| Align Technology, Inc. (a) | 460 | 85,684 | ||||||
| Boston Scientific Corp. (a) | 2,119 | 61,811 | ||||||
| Cooper Cos. ^ | 264 | 62,597 | ||||||
| DexCom, Inc. (a) ^ | 621 | 30,382 | ||||||
| Edwards Lifesciences Corp. (a) | 560 | 61,214 | ||||||
| GenMark Diagnostics, Inc. (a) | 4,112 | 39,599 | ||||||
| IDEXX Laboratories, Inc. (a) ^ | 341 | 53,022 | ||||||
| Intuitive Surgical, Inc. (a) | 68 | 71,120 | ||||||
| Stryker Corp. | 401 | 56,950 | ||||||
| Total Health Care Equipment & Supplies | 522,379 | |||||||
| Health Care Providers & Services - 3.1% | ||||||||
| Aetna, Inc. | 415 | 65,989 | ||||||
| AMN Healthcare Services, Inc. (a) | 1,298 | 59,319 | ||||||
| Anthem, Inc. | 319 | 60,572 | ||||||
| Centene Corp. (a) ^ | 739 | 71,512 | ||||||
| Cigna Corp. | 360 | 67,298 | ||||||
| Humana, Inc. (a) | 256 | 62,369 | ||||||
| Laboratory Corporation of America Holdings (a) ^ | 367 | 55,406 | ||||||
| MEDNAX, Inc. (a) | 760 | 32,771 | ||||||
| Quest Diagnostics, Inc. | 538 | 50,378 | ||||||
The accompanying notes are an integral part of these financial statements.
11
Etho Climate Leadership U.S. ETF
Schedule of Investments
September 30, 2017 (Continued)
| Shares | Fair Value | |||||||
| UnitedHealth Group, Inc. | 322 | $ | 63,064 | |||||
| Total Health Care Providers & Services | 588,678 | |||||||
| Health Care Technology - 0.6% | ||||||||
| Allscripts Healthcare Solutions, Inc. (a) ^ | 4,157 | 59,154 | ||||||
| Cerner Corp. (a) | 895 | 63,832 | ||||||
| Total Health Care Technology | 122,986 | |||||||
| Hotels, Restaurants & Leisure - 0.5% | ||||||||
| Choice Hotels International, Inc. | 844 | 53,932 | ||||||
| Starbucks Corp. | 906 | 48,661 | ||||||
| Total Hotels, Restaurants & Leisure | 102,593 | |||||||
| Household Durables - 0.6% | ||||||||
| KB Home ^ | 2,656 | 64,062 | ||||||
| Newell Brands, Inc. | 1,122 | 47,876 | ||||||
| Total Household Durables | 111,938 | |||||||
| Household Products - 0.2% | ||||||||
| Spectrum Brands Holdings, Inc. | 379 | 40,144 | ||||||
| Independent Power and Renewable Electricity Producers - 1.3% | ||||||||
| NextEra Energy Partners LP | 1,613 | 64,988 | ||||||
| NRG Yield, Inc. | 3,067 | 58,181 | ||||||
| Ormat Technologies, Inc. | 924 | 56,410 | ||||||
| Pattern Energy Group, Inc. | 2,653 | 63,937 | ||||||
| Total Independent Power and Renewable Electricity Producers | 243,516 | |||||||
| Industrial Conglomerates - 1.4% | ||||||||
| 3M Co. ^ | 277 | 58,142 | ||||||
| Carlisle Cos, Inc. | 496 | 49,744 | ||||||
| General Electric Co. ^ | 1,781 | 43,065 | ||||||
| Honeywell International, Inc. | 423 | 59,956 | ||||||
| Roper Technologies, Inc. | 255 | 62,067 | ||||||
| Total Industrial Conglomerates | 272,974 | |||||||
| Insurance - 2.6% | ||||||||
| Aflac, Inc. | 732 | 59,577 | ||||||
| Alleghany Corp. (a) | 86 | 47,645 | ||||||
| Brown & Brown, Inc. | 1,267 | 61,057 | ||||||
| Cincinnati Financial Corp. | 734 | 56,202 | ||||||
| Citizens, Inc. (a) ^ | 7,095 | 52,148 | ||||||
| Markel Corp. (a) | 54 | 57,671 | ||||||
| Marsh & McLennan Cos, Inc. | 715 | 59,924 | ||||||
| Torchmark Corp. | 685 | 54,862 | ||||||
| Travelers Cos, Inc. | 439 | 53,786 | ||||||
| Total Insurance | 502,872 | |||||||
| Internet & Direct Marketing Retail - 1.5% | ||||||||
| Amazon.com, Inc. (a) | 60 | 57,681 | ||||||
| Expedia, Inc. | 418 | 60,167 | ||||||
| Netflix, Inc. (a) | 356 | 64,560 | ||||||
| Priceline Group, Inc. (a) ^ | 29 | 53,094 | ||||||
The accompanying notes are an integral part of these financial statements.
12
Etho Climate Leadership U.S. ETF
Schedule of Investments
September 30, 2017 (Continued)
| Shares | Fair Value | |||||||
| TripAdvisor, Inc. (a) ^ | 1,221 | $ | 49,487 | |||||
| Total Internet & Direct Marketing Retail | 284,989 | |||||||
| Internet Software & Services - 1.4% | ||||||||
| CommerceHub, Inc. - Series A (a) | 3,405 | 76,851 | ||||||
| Facebook, Inc. (a) | 372 | 63,564 | ||||||
| VeriSign, Inc. (a) | 605 | 64,366 | ||||||
| Zillow Group, Inc. (a) ^ | 1,567 | 63,009 | ||||||
| Total Internet Software & Services | 267,790 | |||||||
| IT Services - 3.9% | ||||||||
| Automatic Data Processing, Inc. | 517 | 56,518 | ||||||
| Broadridge Financial Solutions, Inc. | 778 | 62,878 | ||||||
| Cognizant Technology Solutions Corp. | 886 | 64,270 | ||||||
| Fidelity National Information Services, Inc. | 664 | 62,011 | ||||||
| Fiserv, Inc. (a) | 458 | 59,064 | ||||||
| FleetCor Technologies, Inc. (a) | 348 | 53,860 | ||||||
| Global Payments, Inc. | 653 | 62,055 | ||||||
| MasterCard, Inc. | 469 | 66,223 | ||||||
| Paychex, Inc. | 905 | 54,264 | ||||||
| PayPal Holdings, Inc. (a) | 1,225 | 78,437 | ||||||
| Vantiv, Inc. (a) ^ | 822 | 57,926 | ||||||
| Visa, Inc. ^ | 593 | 62,407 | ||||||
| Total IT Services | 739,913 | |||||||
| Leisure Products - 0.3% | ||||||||
| Hasbro, Inc. | 531 | 51,863 | ||||||
| Life Sciences Tools & Services - 1.3% | ||||||||
| Bio-Techne Corp. | 520 | 62,862 | ||||||
| Illumina, Inc. (a) | 309 | 61,553 | ||||||
| Quintiles IMS Holdings, Inc. (a) | 654 | 62,176 | ||||||
| Waters Corp. (a) | 338 | 60,678 | ||||||
| Total Life Sciences Tools & Services | 247,269 | |||||||
| Machinery - 4.7% | ||||||||
| Crane Co. | 708 | 56,633 | ||||||
| Donaldson Co., Inc. | 1,162 | 53,382 | ||||||
| Flowserve Corp. | 1,092 | 46,508 | ||||||
| Graco, Inc. | 562 | 69,514 | ||||||
| Hillenbrand, Inc. | 1,478 | 57,420 | ||||||
| IDEX Corp. | 566 | 68,752 | ||||||
| Illinois Tool Works, Inc. | 399 | 59,036 | ||||||
| ITT, Inc. | 1,288 | 57,020 | ||||||
| Lincoln Electric Holdings, Inc. | 609 | 55,833 | ||||||
| Middleby Corp. (a) ^ | 386 | 49,474 | ||||||
| Snap-on, Inc. ^ | 314 | 46,789 | ||||||
| Tennant Co. | 727 | 48,127 | ||||||
| Toro Co. | 846 | 52,503 | ||||||
| WABCO Holdings, Inc. (a) | 449 | 66,452 | ||||||
| Wabtec Corp. ^ | 676 | 51,207 | ||||||
| Xylem, Inc. | 1,053 | 65,949 | ||||||
| Total Machinery | 904,599 | |||||||
The accompanying notes are an integral part of these financial statements.
13
Etho Climate Leadership U.S. ETF
Schedule of Investments
September 30, 2017 (Continued)
| Shares | Fair Value | |||||||
| Media - 2.0% | ||||||||
| Charter Communications, Inc. (a) | 161 | $ | 58,510 | |||||
| Comcast Corp. | 1,406 | 54,103 | ||||||
| Liberty Broadband Corp. (a) | 619 | 58,297 | ||||||
| Scripps Networks Interactive, Inc. | 675 | 57,976 | ||||||
| Sirius XM Holdings, Inc. ^ | 10,251 | 56,586 | ||||||
| Time Warner, Inc. | 542 | 55,528 | ||||||
| Walt Disney Co. | 466 | 45,934 | ||||||
| Total Media | 386,934 | |||||||
| Metals & Mining - 1.2% | ||||||||
| Compass Minerals International, Inc. ^ | 784 | 50,881 | ||||||
| Nucor Corp. | 888 | 49,764 | ||||||
| Reliance Steel & Aluminum Co. | 662 | 50,425 | ||||||
| Schnitzer Steel Industries, Inc. | 2,584 | 72,739 | ||||||
| Total Metals & Mining | 223,809 | |||||||
| Multiline Retail - 0.3% | ||||||||
| Dollar Tree, Inc. (a) | 672 | 58,343 | ||||||
| Multi-Utilities - 0.8% | ||||||||
| CenterPoint Energy, Inc. | 1,927 | 56,288 | ||||||
| Consolidated Edison, Inc. | 684 | 55,185 | ||||||
| MDU Resources Group, Inc. | 1,937 | 50,265 | ||||||
| Total Multi-Utilities | 161,738 | |||||||
| Personal Products - 0.3% | ||||||||
| Coty, Inc. ^ | 2,924 | 48,334 | ||||||
| Pharmaceuticals - 1.5% | ||||||||
| Bristol-Myers Squibb Co. | 974 | 62,083 | ||||||
| Johnson & Johnson | 425 | 55,254 | ||||||
| Merck & Co., Inc. | 834 | 53,401 | ||||||
| Pfizer, Inc. | 1,562 | 55,763 | ||||||
| Zoetis, Inc. | 990 | 63,123 | ||||||
| Total Pharmaceuticals | 289,624 | |||||||
| Professional Services - 1.1% | ||||||||
| Dun & Bradstreet Corp. | 490 | 57,041 | ||||||
| Equifax, Inc. | 387 | 41,018 | ||||||
| Nielsen Holdings PLC ^ | 1,288 | 53,388 | ||||||
| Verisk Analytics, Inc. (a) | 650 | 54,074 | ||||||
| Total Professional Services | 205,521 | |||||||
| Real Estate Investment Trusts (REITs) - 3.8% | ||||||||
| Alexandria Real Estate Equities, Inc. ^ | 480 | 57,106 | ||||||
| AvalonBay Communities, Inc. | 289 | 51,563 | ||||||
| Crown Castle International Corp. | 562 | 56,189 | ||||||
| Digital Realty Trust, Inc. | 498 | 58,928 | ||||||
| Essex Property Trust, Inc. | 229 | 58,173 | ||||||
| Extra Space Storage, Inc. ^ | 714 | 57,063 | ||||||
| Federal Realty Investment Trust ^ | 397 | 49,311 | ||||||
| Hannon Armstrong Sustainable Infrastructure Capital, Inc. | 2,636 | 64,239 | ||||||
The accompanying notes are an integral part of these financial statements.
14
Etho Climate Leadership U.S. ETF
Schedule of Investments
September 30, 2017 (Continued)
| Shares | Fair Value | |||||||
| Kimco Realty Corp. ^ | 2,410 | $ | 47,116 | |||||
| Prologis, Inc. | 1,023 | 64,920 | ||||||
| Realty Income Corp. | 894 | 51,128 | ||||||
| Regency Centers Corp. | 799 | 49,570 | ||||||
| SBA Communications Corp. (a) | 437 | 62,949 | ||||||
| Total Real Estate Investment Trusts (REITs) | 728,255 | |||||||
| Road & Rail - 0.3% | ||||||||
| AMERCO | 138 | 51,736 | ||||||
| Semiconductors & Semiconductor Equipment - 6.8% | ||||||||
| Analog Devices, Inc. | 646 | 55,666 | ||||||
| Applied Materials, Inc. | 1,357 | 70,686 | ||||||
| Cypress Semiconductor Corp. ^ | 3,857 | 57,932 | ||||||
| First Solar, Inc. (a) | 1,947 | 89,329 | ||||||
| Integrated Device Technology, Inc. (a) | 2,227 | 59,194 | ||||||
| Intel Corp. ^ | 1,477 | 56,244 | ||||||
| KLA-Tencor Corp. | 557 | 59,042 | ||||||
| Lam Research Corp. (a) | 412 | 76,237 | ||||||
| Maxim Integrated Products, Inc. | 1,179 | 56,250 | ||||||
| Microchip Technology, Inc. ^ | 717 | 64,372 | ||||||
| NVIDIA Corp. | 485 | 86,704 | ||||||
| ON Semiconductor Corp. (a) ^ | 3,403 | 62,853 | ||||||
| Power Integrations, Inc. | 804 | 58,853 | ||||||
| Qorvo, Inc. (a) | 769 | 54,353 | ||||||
| QUALCOMM, Inc. | 927 | 48,056 | ||||||
| Rambus, Inc. (a) | 4,012 | 53,560 | ||||||
| Skyworks Solutions, Inc. | 540 | 55,026 | ||||||
| SunPower Corp. (a) ^ | 8,653 | 63,080 | ||||||
| Teradyne, Inc. | 1,697 | 63,281 | ||||||
| Texas Instruments, Inc. | 660 | 59,162 | ||||||
| Xilinx, Inc. ^ | 915 | 64,809 | ||||||
| Total Semiconductors & Semiconductor Equipment | 1,314,689 | |||||||
| Software - 3.3% | ||||||||
| Activision Blizzard, Inc. | 1,057 | 68,187 | ||||||
| Adobe Systems, Inc. (a) | 405 | 60,418 | ||||||
| ANSYS, Inc. (a) | 494 | 60,629 | ||||||
| Autodesk, Inc. (a) | 610 | 68,479 | ||||||
| Intuit, Inc. | 454 | 64,532 | ||||||
| Red Hat, Inc. (a) | 609 | 67,514 | ||||||
| salesforce.com, Inc. (a) | 640 | 59,789 | ||||||
| ServiceNow, Inc. (a) | 603 | 70,870 | ||||||
| Splunk, Inc. (a) ^ | 846 | 56,200 | ||||||
| Workday, Inc. (a) | 632 | 66,606 | ||||||
| Total Software | 643,224 | |||||||
| Specialty Retail - 2.8% | ||||||||
| Advance Auto Parts, Inc. | 355 | 35,216 | ||||||
| AutoZone, Inc. (a) | 73 | 43,443 | ||||||
| Foot Locker, Inc. | 710 | 25,006 | ||||||
| L Brands, Inc. | 1,130 | 47,019 | ||||||
The accompanying notes are an integral part of these financial statements.
15
Etho Climate Leadership U.S. ETF
Schedule of Investments
September 30, 2017 (Continued)
| Shares | Fair Value | |||||||
| O’Reilly Automotive, Inc. (a) | 195 | $ | 41,997 | |||||
| Ross Stores, Inc. | 801 | 51,721 | ||||||
| The Home Depot, Inc. | 361 | 59,045 | ||||||
| Tiffany & Co. | 556 | 51,030 | ||||||
| TJX Cos, Inc. | 668 | 49,252 | ||||||
| Tractor Supply Co. ^ | 766 | 48,480 | ||||||
| Ulta Beauty, Inc. (a) ^ | 185 | 41,821 | ||||||
| Williams-Sonoma, Inc. ^ | 993 | 49,511 | ||||||
| Total Specialty Retail | 543,541 | |||||||
| Technology Hardware, Storage & Peripherals - 1.0% | ||||||||
| 3D Systems Corp. (a) ^ | 3,523 | 47,173 | ||||||
| Apple, Inc. | 368 | 56,716 | ||||||
| Hewlett Packard Enterprise Co. ^ | 2,230 | 32,803 | ||||||
| NetApp, Inc. | 1,264 | 55,313 | ||||||
| Total Technology Hardware, Storage & Peripherals | 192,005 | |||||||
| Textiles, Apparel & Luxury Goods - 2.4% | ||||||||
| Coach, Inc. | 1,284 | 51,720 | ||||||
| Hanesbrands, Inc. ^ | 2,554 | 62,931 | ||||||
| Lululemon Athletica, Inc. (a) | 1,016 | 63,245 | ||||||
| NIKE, Inc. | 948 | 49,154 | ||||||
| PVH Corp. | 509 | 64,164 | ||||||
| Ralph Lauren Corp. | 650 | 57,389 | ||||||
| Under Armour, Inc. (a) ^ | 2,881 | 43,273 | ||||||
| VF Corp. ^ | 965 | 61,345 | ||||||
| Total Textiles, Apparel & Luxury Goods | 453,221 | |||||||
| Thrifts & Mortgage Finance - 1.4% | ||||||||
| Bear State Financial, Inc. | 5,633 | 57,795 | ||||||
| Capitol Federal Financial, Inc. | 3,677 | 54,052 | ||||||
| New York Community Bancorp, Inc. ^ | 3,843 | 49,536 | ||||||
| TFS Financial Corp. | 3,194 | 51,519 | ||||||
| Washington Federal, Inc. | 1,599 | 53,806 | ||||||
| Total Thrifts & Mortgage Finance | 266,708 | |||||||
| Trading Companies & Distributors - 1.8% | ||||||||
| Air Lease Corp. ^ | 1,362 | 58,048 | ||||||
| Fastenal Co. ^ | 1,034 | 47,130 | ||||||
| GATX Corp. | 869 | 53,496 | ||||||
| MSC Industrial Direct Co., Inc. | 517 | 39,070 | ||||||
| United Rentals, Inc. (a) | 421 | 58,409 | ||||||
| WESCO International, Inc. (a) | 758 | 44,154 | ||||||
| WW Grainger, Inc. ^ | 228 | 40,983 | ||||||
| Total Trading Companies & Distributors | 341,290 | |||||||
| Water Utilities - 1.2% | ||||||||
| American States Water Co. | 1,195 | 58,854 | ||||||
| American Water Works Co., Inc. | 682 | 55,181 | ||||||
| Aqua America, Inc. | 1,648 | 54,697 | ||||||
| Middlesex Water Co. | 1,434 | 56,312 | ||||||
| Total Water Utilities | 225,044 | |||||||
| Total United States | 18,002,578 | |||||||
The accompanying notes are an integral part of these financial statements.
16
Etho Climate Leadership U.S. ETF
Schedule of Investments
September 30, 2017 (Continued)
| Shares | Fair Value | |||||||
| Virgin Islands (UK) - 0.4% | ||||||||
| Textiles, Apparel & Luxury Goods - 0.4% | ||||||||
| Michael Kors Holdings Ltd. (a) | 1,383 | $ | 66,176 | |||||
| TOTAL COMMON STOCKS (Cost $17,129,663) | 19,112,582 | |||||||
| SHORT-TERM INVESTMENTS - 0.4% | ||||||||
| Money Market Funds - 0.4% | ||||||||
| Invesco Advisers, Inc. STIT - Treasury Portfolio - Institutional Class, 0.89% (b) | 84,870 | 84,870 | ||||||
| TOTAL SHORT-TERM INVESTMENTS (Cost $84,870) | 84,870 | |||||||
| INVESTMENTS PURCHASED WITH SECURITIES LENDING COLLATERAL - 14.2% | ||||||||
| Investment Companies - 14.2% | ||||||||
| Mount Vernon Liquid Assets Portfolio, LLC, 1.33% (b) + | 2,736,293 | |||||||
| TOTAL INVESTMENTS PURCHASED WITH SECURITIES LENDING COLLATERAL (Cost $2,736,293) | 2,736,293 | |||||||
| Total Investments (Cost $19,950,826) - 114.2% | 21,933,745 | |||||||
| Liabilities in Excess of Other Assets - (14.2)% | (2,725,942 | ) | ||||||
| TOTAL NET ASSETS - 100.0% | $ | 19,207,803 | ||||||
Percentages are stated as a percent of net assets.
| ADR | American Depositary Receipt |
| (a) | Non-income producing security. |
| (b) | The rate quoted is the annualized seven-day yield at September 30, 2017. |
| ^ | All or a portion of this security is out on loan as of September 30, 2017. Total value of securities out on loan is $2,684,574. |
| + | Investments purchased with cash proceeds from securities lending. Total cash collateral has a value of $2,736,293 as of September 30, 2017. |
The Global Industry Classification Standard (GICS®) was developed by and/or is the exclusive property of MSCI, Inc. and Standard & Poor’s Financial Services LLC (“S&P”). GICS® is a service mark of MSCI, Inc. and S&P and has been licensed for use by the Fund’s Administrator, U.S. Bancorp Fund Services, LLC.
The accompanying notes are an integral part of these financial statements.
17
Etho Climate Leadership U.S. ETF
As of September 30, 2017
Etho Climate Leadership U.S. ETF | ||||
| ASSETS | ||||
| Investments in securities, at fair value* | $ | 21,933,745 | ||
| Cash | 1,500 | |||
| Receivables: | ||||
| Dividends and interest receivable | 14,992 | |||
| Securities lending income receivable | 828 | |||
| Total Assets | 21,951,065 | |||
| LIABILITIES | ||||
| Collateral received for securities loaned (Note 7) | 2,736,293 | |||
| Payables: | ||||
| Management fees payable | 6,969 | |||
| Total Liabilities | 2,743,262 | |||
| Net Assets | $ | 19,207,803 | ||
| NET ASSETS CONSIST OF: | ||||
| Paid-in Capital | $ | 17,267,917 | ||
| Undistributed (accumulated) net investment income | 25,088 | |||
| Accumulated net realized gain (loss) on investments | (68,121 | ) | ||
| Net unrealized appreciation on: | ||||
| Investments in securities | 1,982,919 | |||
| Net Assets | $ | 19,207,803 | ||
| *Identified Cost: | ||||
| Investments in unaffiliated securities | $ | 19,950,826 | ||
| Shares Outstanding^ | 600,000 | |||
| Net Asset Value, Offering and Redemption Price per Share | $ | 32.01 | ||
^ No par value, unlimited number of shares authorized
The accompanying notes are an integral part of these financial statements.
18
Etho Climate Leadership U.S. ETF
Year ended September 30, 2017
Etho Climate Leadership U.S. ETF | ||||
| INVESTMENT INCOME | ||||
| Income: | ||||
| Dividends from unaffiliated securities | $ | 174,885 | ||
| Interest | 323 | |||
| Securities lending income | 9,093 | |||
| Total Investment Income | 184,301 | |||
| Expenses: | ||||
| Management fees | 55,862 | |||
| Net Investment Income | 128,439 | |||
| REALIZED & UNREALIZED GAIN ON INVESTMENTS | ||||
| Net Realized Gain (Loss) on: | ||||
| Unaffiliated investments | (67,546 | ) | ||
| In-Kind redemptions | 483,748 | |||
| Net Realized Gain (Loss) on Investments and In-Kind redemptions | 416,202 | |||
| Net Change in Unrealized Appreciation of: | ||||
| Unaffiliated investments | 1,768,693 | |||
| Net Realized and Unrealized Gain on Investments | 2,184,895 | |||
| NET INCREASE IN NET ASSETS RESULTING FROM OPERATIONS | $ | 2,313,334 | ||
The accompanying notes are an integral part of these financial statements.
19
Etho Climate Leadership U.S. ETF
Year Ended September 30, 2017 | Period Ended September 30, 2016* | |||||||
| OPERATIONS | ||||||||
| Net investment income | $ | 128,439 | $ | 28,916 | ||||
| Net realized gain on investments and In-Kind Redemptions | 416,202 | 84,401 | ||||||
| Net change in unrealized appreciation of investments | 1,768,693 | 214,226 | ||||||
| Net increase in net assets resulting from operations | $ | 2,313,334 | $ | 327,543 | ||||
| DISTRIBUTIONS TO SHAREHOLDERS | ||||||||
| From net investment income | (109,859 | ) | (22,000 | ) | ||||
| From net realized gain | (40,845 | ) | — | |||||
| Total Distributions to Shareholders | (150,704 | ) | (22,000 | ) | ||||
| CAPITAL SHARE TRANSACTIONS | ||||||||
| Net increase in net assets derived from net change in outstanding shares (a) | 10,294,350 | 6,445,280 | ||||||
| Net increase in net assets | $ | 12,456,980 | $ | 6,750,823 | ||||
| NET ASSETS | ||||||||
| Beginning of Period | 6,750,823 | — | ||||||
| End of Period | $ | 19,207,803 | $ | 6,750,823 | ||||
| Undistributed net investment income | $ | 25,088 | $ | 6,916 | ||||
(a) Summary of share transactions is as follows:
Year Ended September 30, 2017 | Period Ended September 30, 2016* | |||||||||||||||
| Shares | Amount | Shares | Amount | |||||||||||||
| Shares Sold | 450,000 | $ | 13,209,550 | 300,000 | $ | 7,688,910 | ||||||||||
| Shares Redeemed | (100,000 | ) | (2,915,200 | ) | (50,000 | ) | (1,243,630 | ) | ||||||||
| Net Transactions in Fund Shares | 350,000 | $ | 10,294,350 | 250,000 | $ | 6,445,280 | ||||||||||
| Beginning Shares | 250,000 | — | ||||||||||||||
| Ending Shares | 600,000 | 250,000 | ||||||||||||||
* Fund commenced operations on November 18, 2015. The information presented is for the period from November 18, 2015 to September 30, 2016.
The accompanying notes are an integral part of these financial statements.
20
Etho Climate Leadership U.S. ETF
For a capital share outstanding throughout the year
Year Ended September 30, 2017 | Period Ended September 30, 20161 | |||||||
| Net Asset Value, Beginning of Period | $ | 27.00 | $ | 25.00 | ||||
| Income from Investment Operations: | ||||||||
Net investment income 2 | 0.31 | 0.23 | ||||||
| Net realized and unrealized gain on investments | 5.09 | 1.87 | ||||||
| Total from investment operations | 5.40 | 2.10 | ||||||
| Less Distributions: | ||||||||
| Distributions from net investment income | (0.25 | ) | (0.10 | ) | ||||
| Distributions from net realized gain | (0.14 | ) | — | |||||
| Total distributions | (0.39 | ) | (0.10 | ) | ||||
| Net asset value, end of year | $ | 32.01 | $ | 27.00 | ||||
| Total Return | 20.14 | % | 8.43 | %3 | ||||
| Ratios/Supplemental Data: | ||||||||
| Net assets at end of year (000’s) | $ | 19,208 | $ | 6,751 | ||||
| Expenses to Average Net Assets | 0.45 | % | 0.50 | %4 | ||||
| Net Investment Income to Average Net Assets | 1.03 | % | 1.04 | %4 | ||||
| Portfolio Turnover Rate | 45 | % | 25 | %3 | ||||
1 | Commencement of operations on November 18, 2015. |
2 | Calculated based on average shares outstanding during the year. |
3 | Not annualized. |
4 | Annualized. |
The accompanying notes are an integral part of these financial statements.
21
Etho Climate Leadership U.S. ETF
September 30, 2017
NOTE 1 – ORGANIZATION
Etho Climate Leadership U.S. ETF (the “Fund”) is a series of ETF Managers Trust (the “Trust”), an open-end management investment company consisting of multiple investment series, organized as a Delaware statutory trust on July 1, 2009. The Trust is registered with the SEC under the Investment Company Act of 1940, as amended (the “1940 Act”), as an open-end management investment company and the offering of the Fund’s shares (“Shares”) is registered under the Securities Act of 1933, as amended (the “Securities Act”). The Fund seeks to provide investment results that, before fees and expenses, correspond generally to the price and yield performance of the Etho Climate Leadership Index™ Index (“the Index”). The Fund commenced operations on November 18, 2015.
The Fund currently offers one class of shares, which has no front end sales load, no deferred sales charges, and no redemption fees. The Fund may issue an unlimited number of shares of beneficial interest, with no par value. All shares of the Fund have equal rights and privileges.
Shares of the Fund are listed and traded on the NYSE Arca, Inc. Market prices for the Shares may be different from their net asset value (“NAV”). The Fund issues and redeems Shares on a continuous basis at NAV only in blocks of 50,000 shares, called “Creation Units.” Creation Units are issued and redeemed principally in-kind for securities included in the Index. Once created, Shares generally trade in the secondary market at market prices that change throughout the day in quantities less than a Creation Unit. Except when aggregated in Creation Units, Shares are not redeemable securities of the Fund. Shares of the Fund may only be purchased or redeemed by certain financial institutions (“Authorized Participants”). An Authorized Participant is either (i) a broker-dealer or other participant in the clearing process through the Continuous Net Settlement System of the National Securities Clearing Corporation or (ii) a DTC participant and, in each case, must have executed a Participant Agreement with the Distributor. Most retail investors do not qualify as Authorized Participants nor have the resources to buy and sell whole Creation Units. Therefore, they are unable to purchase or redeem the Shares directly from the Fund. Rather, most retail investors may purchase Shares in the secondary market with the assistance of a broker and may be subject to customary brokerage commissions or fees.
NOTE 2 – SIGNIFICANT ACCOUNTING POLICIES
The following is a summary of significant accounting policies consistently followed by the Fund. These policies are in conformity with accounting principles generally accepted in the United States of America (“U.S. GAAP”).
The Fund follows the investment company accounting and reporting guidance of the Financial Accounting Standards Board Accounting Standard Codification Topic 946 Financial Services –Investment Companies.
The Fund may invest in certain other investment companies (underlying funds). For specific investments in underlying funds, please refer to the complete schedule of portfolio holdings on Form N-CSR(S) for this reporting period, which is filed with the U.S. Securities and Exchange Commission (SEC). For more information about the underlying Fund’s operations and policies, please refer to those Funds’ semiannual and annual reports, which are filed with the SEC.
| A. | Security Valuation. Securities listed on a securities exchange, market or automated quotation system for which quotations are readily available (except for securities traded on NASDAQ), including securities traded over the counter, are valued at the last quoted sale price on the primary exchange or market (foreign or domestic) on which they are traded on the valuation date (or at approximately 4:00 pm Eastern Time if a security’s primary exchange is normally open at that time), or, if there is no such reported sale on the valuation date, at the most recent quoted bid price. For securities traded on NASDAQ, the NASDAQ Official Closing Price will be used. |
22
Etho Climate Leadership U.S. ETF
NOTES TO FINANCIAL STATEMENTS
September 30, 2017 (Continued)
Securities for which quotations are not readily available are valued at their respective fair values as determined in good faith by the Board of Trustees (the “Board”). When a security is “fair valued,” consideration is given to the facts and circumstances relevant to the particular situation, including a review of various factors set forth in the pricing procedures adopted by the Fund’s Board. The use of fair value pricing by the Fund may cause the net asset value of its shares to differ significantly from the net asset value that would be calculated without regard to such considerations. As of September 30, 2017, the Fund did not hold any fair valued securities.
As described above, the Fund utilizes various methods to measure the fair value of its investments on a recurring basis. U.S. GAAP establishes a hierarchy that prioritizes inputs to valuation methods. The three levels of inputs are:
| Level 1 | Unadjusted quoted prices in active markets for identical assets or liabilities that the Fund has the ability to access. |
| Level 2 | Observable inputs other than quoted prices included in Level 1 that are observable for the asset or liability, either directly or indirectly. These inputs may include quoted prices for the identical instrument on an inactive market, prices for similar instruments, interest rates, prepayment speeds, credit risk, yield curves, default rates and similar data. |
| Level 3 | Unobservable inputs for the asset or liability, to the extent relevant observable inputs are not available; representing the Fund’s own assumptions about the assumptions a market participant would use in valuing the asset or liability and would be based on the best information available. |
The availability of observable inputs can vary from security to security and is affected by a wide variety of factors, including, for example, the type of security, whether the security is new and not yet established in the marketplace, the liquidity of markets, and other characteristics particular to the security. To the extent that valuation is based on models or inputs that are less observable or unobservable in the market, the determination of fair value requires more judgment. Accordingly, the degree of judgment exercised in determining fair value is greatest for instruments categorized in Level 3.
The inputs used to measure fair value may fall into different levels of the fair value hierarchy. In such cases, for disclosure purposes, the level in the fair value hierarchy within which the fair value measurement falls in its entirety, is determined based on the lowest level input that is significant to the fair value measurement in its entirety.
23
Etho Climate Leadership U.S. ETF
NOTES TO FINANCIAL STATEMENTS
September 30, 2017 (Continued)
The following table presents a summary of the Funds’ investments in securities, at fair value, as of September 30, 2017:
Etho Climate Leadership U.S. ETF
Assets^ | Level 1 | Level 2 | Level 3 | Total | ||||||||||||
| Common Stocks | $ | 19,112,582 | $ | — | $ | — | $ | 19,112,582 | ||||||||
| Short-Term Investments | 84,870 | — | — | 84,870 | ||||||||||||
| Investments Purchased with Securities Lending Collateral* | — | — | — | 2,736,293 | ||||||||||||
| Total Investments in Securities | $ | 19,197,452 | $ | — | $ | — | $ | 21,933,745 | ||||||||
^ See Schedule of Investments for classifications by sector or country.
* Certain investments that are measured at fair value using the net asset value per share (or its equivalent) practical expedient have not been categorized in the fair value hierarchy. The fair value amounts presented in the table are intended to permit reconciliation of the fair value hierarchy to the amounts presented in the Schedule of Investments.
There were no transfers between Levels 1, 2 and 3 during the year ended September 30, 2017. Transfers between levels are recognized at the end of the reporting period.
| B. | Federal Income Taxes. The Fund has elected to be taxed as a “regulated investment company” and intends to distribute substantially all taxable income to its shareholders and otherwise comply with the provisions of the Internal Revenue Code applicable to regulated investment companies. Therefore, no provisions for federal income taxes or excise taxes have been made. |
To avoid imposition of the excise tax applicable to regulated investment companies, the Fund intends to declare each year as dividends, in each calendar year, at least 98.0% of its net investment income (earned during the calendar year) and 98.2% of its net realized capital gains (earned during the twelve months ended October 31) plus undistributed amounts, if any, from prior years.
Net capital losses incurred after October 31, within the taxable year are deemed to arise on the first business day of the Fund’s next taxable year.
The Fund recognizes the tax benefits of uncertain tax positions only where the position is “more likely than not” to be sustained assuming examination by tax authorities. The Fund has analyzed its tax position and has concluded that no liability for unrecognized tax benefits should be recorded related to uncertain tax positions expected to be taken in the Fund’s 2017 tax returns. The Fund identifies its major tax jurisdictions as U.S. Federal, the State of New Jersey, and the State of Delaware; however the Fund is not aware of any tax positions for which it is reasonably possible that the total amounts of unrecognized tax benefits will change materially in the next twelve months.
As of September 30, 2017, management has reviewed the tax positions for open periods (for federal purposes, three years from the date of filing and for state purposes, four years from the date of filing) as applicable to the Fund and has determined that no provision for income tax is required in the Fund’s financial statements.
C. | Security Transactions and Investment Income. Investment securities transactions are accounted for on the trade date. Gains and losses realized on sales of securities are determined on a specific identification basis. Discounts/premiums on debt securities purchased are accreted/amortized over the life of the respective securities using the effective interest method. Dividend income is recorded on the ex-dividend date. Interest income is recorded on an accrual basis. Income, including gains, from investments in foreign securities received by the Fund may be subject to income, withholding or other taxes imposed by foreign countries. |
24
Etho Climate Leadership U.S. ETF
NOTES TO FINANCIAL STATEMENTS
September 30, 2017 (Continued)
| D. | Foreign Currency Translations and Transactions. The Fund may engage in foreign currency transactions. Foreign currency transactions are translated into U.S. dollars on the following basis: (i) market value of investment securities, assets and liabilities at the daily rates of exchange, and (ii) purchases and sales of investment securities, dividend and interest income and certain expenses at the rates of exchange prevailing on the respective dates of such transactions. For financial reporting purposes, the Fund does not isolate changes in the exchange rate of investment securities from the fluctuations arising from changes in the market prices of securities for unrealized gains and losses. However, for federal income tax purposes, the Fund does isolate and treat as ordinary income the effect of changes in foreign exchange rates on realized gains or losses from the sale of investment securities and payables and receivables arising from trade-date and settlement-date differences. |
| E. | Distributions to Shareholders. Distributions to shareholders from net investment income, if any, are declared and paid by the Fund on a quarterly basis. Distributions to shareholders from net realized gains on securities of the Fund normally are declared and paid on an annual basis. Distributions are recorded on the ex-dividend date. |
| F. | Use of Estimates. The preparation of financial statements in conformity with U.S. GAAP requires management to make estimates and assumptions that affect the reported amounts of assets and liabilities at the date of the financial statements, as well as the reported amounts of revenues and expenes during the period. Actual results could differ from those estimates. |
| G. | Share Valuation. The net asset value (“NAV”) per share of the Fund is calculated by dividing the sum of the value of the securities held by the Fund, plus cash and other assets, minus all liabilities (including estimated accrued expenses) by the total number of shares outstanding by the Fund, rounded to the nearest cent. The Fund’s shares will not be priced on the days on which the NYSE is closed for trading. The offering and redemption price per share for the Fund is equal to the Fund’s net asset value per share. |
| H. | Guarantees and Indemnifications. In the normal course of business, the Fund enters into contracts with service providers that contain general indemnification clauses. The Fund’s maximum exposure under these arrangements is unknown as this would involve future claims that may be made against the Fund that have not yet occurred. However, based on experience, the Fund expects the risk of loss to be remote. |
25
Etho Climate Leadership U.S. ETF
NOTES TO FINANCIAL STATEMENTS
September 30, 2017 (Continued)
NOTE 3 – RISK FACTORS
Investing in the Etho Climate Leadership U.S. ETF may involve certain risks, as discussed in the Fund’s prospectus, including, but not limited to, those described below. Any of these risks could cause an investor to lose money.
Market Risk. Financial markets rise and fall in response to a variety of factors, sometimes rapidly and unpredictably. As with any investment whose performance is tied to these markets, the value of an investment in the Fund will fluctuate, which means that an investor could lose money over short or long periods.
Investment Style Risk. The Fund is not actively managed. Therefore, the Fund follows the securities included in its respective index during upturns as well as downturns. Because of its indexing strategy, the Fund does not take steps to reduce market exposure or to lessen the effects of a declining market. In addition, because of the Funds’ expenses, the Fund’s performance may be below that of its respective index.
Equity Risk. The prices of equity securities rise and fall daily. These price movements may result from factors affecting individual companies, industries or the securities market as a whole. In addition, equity markets tend to move in cycles which may cause stock prices to fall over short or extended periods of time.
Securities Lending Risk. Securities lending involves the risk of loss of rights in, or delay in recovery of, the loaned securities if the borrower fails to return the security loaned or becomes insolvent.
Concentration Risk. To the extent that the Fund’s or its underlying index’s portfolio is concentrated in the securities of issuers in a particular market, industry, group of industries, sector or asset class, the Fund may be adversely affected by the performance of those securities, may be subject to increased price volatility and may be more vulnerable to adverse economic, market, political or regulatory occurrences affecting that market, industry, group of industries, sector or asset class.
NOTE 4 – COMMITMENTS AND OTHER RELATED PARTY TRANSACTIONS.
ETF Managers Group, LLC (the “Advisor”), serves as the investment advisor to the Fund. Pursuant to an Investment Advisory Agreement (“Advisory Agreement”) between the Trust, on behalf of the Fund, and the Advisor, the Advisor provides investment advice to the Fund and oversees the day-today operations of the Fund, subject to the direction and control of the Board and the officers of the Trust.
Under the Investment Advisory Agreement with the Fund, the Advisor has overall responsibility for the general management and administration of the Fund and arranges for sub-advisory, transfer agency, custody, fund administration, securities lending, and all other non-distribution related services necessary for the Fund to operate. The Advisor bears the costs of all advisory and non-advisory services required to operate the Fund, in exchange for a single unitary fee. For services provided the Fund pays the Advisor at an annual rate of 0.45% of the Fund’s average daily net assets. The Advisor has an agreement with, and is dependent on, a third party to pay the Fund’s expenses in excess of 0.45% of the Fund’s average daily net assets. Additionally, under the Investment Advisory Agreement, the Advisor has agreed to pay all expenses of the Fund, except for: the fee paid to the Advisor pursuant to the Investment Advisory Agreement, interest charges on any borrowings, taxes, brokerage commissions and other expenses incurred in placing orders for the Purchase and sale of securities and other investment instruments, acquired fund fees and expenses, accrued deferred tax liability, extraordinary expenses, and distribution (12b-1) fees and expenses (collectively, “Excluded Expenses”). The Advisor has entered into an Agreement with Etho Climate Leadership U.S. (the “Sponsor”), under which the Sponsor agrees to sublicense the use of the Underlying Index to the Advisor. The Sponsor also provides marketing support for the Fund, including distributing marketing materials related to the Fund. Etho Climate Leadership U.S. is a privately held business focused on bringing exchange-traded investment products to investors in the U.S. The Sponsor does not make investment decisions, provide investment advice, or otherwise act in the capacity of an investment adviser to the Fund. Additionally, the Sponsor is not involved in the maintenance of the Underlying Index and does not otherwise act in the capacity of an index provider.
26
Etho Climate Leadership U.S. ETF
NOTES TO FINANCIAL STATEMENTS
September 30, 2017 (Continued)
U.S. Bancorp Fund Services, LLC (the “Administrator”) provides fund accounting, fund administration, and transfer agency services to the Fund. The Advisor compensates the Administrator for these services under an administration agreement between the two parties.
The Advisor pays each independent Trustee a quarterly fee for service to the Fund. Each Trustee is also reimbursed by the Advisor for all reasonable out-of-pocket expenses incurred in connection with his duties as Trustee, including travel and related expenses incurred in attending Board meetings.
NOTE 5 – DISTRIBUTION PLAN
The Fund has adopted a Plan of Distribution pursuant to Rule 12b-1 under the 1940 Act. Under the Plan, the Fund may pay compensation to the Distributor or any other distributor or financial institution with which the Trust has an agreement with respect to the Fund, with the amount of such compensation not to exceed an annual rate of 0.25% of each Fund’s average daily net assets. For the year ended September 30, 2017, the Fund did not incur any 12b-1 expenses.
NOTE 6 – PURCHASES AND SALES OF SECURITIES
The costs of purchases and sales of securities, excluding short-term securities and in-kind transactions, for the year ended September 30, 2017 are as follows:
| Purchases | Sales | |||||||
| Etho Climate Leadership U.S. ETF | $ | 5,609,601 | $ | 6,006,182 | ||||
The costs of purchases and sales of in-kind transactions associated with creations and redemptions for the year ended September 30, 2017 are as follows:
Purchases In-Kind | Sales In-Kind | |||||||
| Etho Climate Leadership U.S. ETF | $ | 13,027,430 | $ | 2,347,812 | ||||
Purchases in-kind are the aggregate of all in-kind purchases and sales in-kind are the aggregate of all proceeds from in-kind sales. Net capital gains or losses resulting from in-kind redemptions are excluded from the determination of the Fund’s taxable gains and are not distributed to shareholders.
There were no purchases or sales of U.S. Government obligations for the year ended September 30, 2017.
27
Etho Climate Leadership U.S. ETF
NOTES TO FINANCIAL STATEMENTS
September 30, 2017 (Continued)
NOTE 7 – SECURITIES LENDING
The Fund may lend up to 33 1/3% of the value of the securities in its portfolio to brokers, dealers and financial institutions (but not individuals) under terms of participation in a securities lending program administered by U.S. Bank N.A. (“the Custodian”). The securities lending agreement requires that loans are collateralized at all times in an amount equal to at least 102% of the value of any loaned securities at the time of the loan, plus accrued interest. The Fund receives compensation in the form of fees and earns interest on the cash collateral. The amount of fees depends on a number of factors including the type of security and length of the loan. The Fund continues to receive interest payments or dividends on the securities loaned during the borrowing period. Gain or loss in the fair value of securities loaned that may occur during the term of the loan will be for the account of the Fund. The Fund has the right under the terms of the securities lending agreement to recall the securities from the borrower on demand. As of September 30, 2017, the Fund had loaned securities and received cash collateral for the loans. The cash collateral is invested by the Custodian in accordance with approved investment guidelines. Those guidelines require the cash collateral to be invested in readily marketable, high quality, short-term obligations; however, such investments are subject to risk of payment delays or default on the part of the issuer or counterparty or otherwise may not generate sufficient interest to support the costs associated with securities lending. The Fund could also experience delays in recovering its securities and possible loss of income or value if the borrower fails to return the borrowed securities, although the Fund is indemnified from this risk by contract with the securities lending agent.
As of September 30, 2017, the value of the securities on loan and payable for collateral due to broker were as follows:
| Value of Securities on Loan Collateral Received | ||||||||
| Fund | Values of Securities on Loan | Fund Collateral Received* | ||||||
| Etho Climate Leadership U.S. ETF | $ | 2,684,574 | $ | 2,736,293 | ||||
* The cash collateral received was invested in the Mount Vernon Liquid Assets Portfolio, an investment with an overnight and continuous maturity, as shown on the Schedule of Investments.
Interest income earned on collateral investments (including applicable fees) and recognized by the Fund during the year ended September 30, 2017, aggregated $9,093.
28
Etho Climate Leadership U.S. ETF
NOTES TO FINANCIAL STATEMENTS
September 30, 2017 (Continued)
NOTE 8 – FEDERAL INCOME TAXES
The components of distributable earnings (losses) and cost basis of investments for federal income tax purposes at September 30, 2017 were as follows:
| Cost | Gross Unrealized Appreciation | Gross Unrealized Depreciation | Net Unrealized Appreciation (Depreciation) | |||||||||||||
| Etho Climate Leadership U.S. ETF | $ | 20,030,574 | $ | 2,438,061 | $ | (534,890 | ) | $ | 1,903,171 | |||||||
Undistributed Ordinary Income | Undistributed Long-term Gain | Total Distributable Earnings | Other Accumulated (Loss) | Total Accumulated Gain | ||||||||||||||||
| Etho Climate Leadership U.S. ETF | $ | 36,715 | $ | — | $ | 36,715 | $ | — | $ | 1,939,886 | ||||||||||
The difference between the tax cost of investments and the cost of investments for GAAP purposes is primarily due to the tax treatment of wash sale losses.
As of September 30, 2017, the Fund had accumulated capital loss carryovers of:
Capital Loss Carryover | Expires | ||
| Etho Climate Leadership U.S. ETF | None | Indefinite |
Under current tax law, capital and currency losses realized after October 31 of a Fund’s fiscal year may be deferred and treated as occurring on the first business day of the following fiscal year for tax purposes. The Fund had deferred post-October capital and currency losses, which will be treated as arising on the first business day of the year ended September 30, 2017.
Late Year Ordinary Loss | Post-October Capital Loss | ||
| Etho Climate Leadership U.S. ETF | None | None |
U.S. GAAP requires that certain components of net assets relating to permanent differences be reclassified between financial and tax reporting. These reclassifications have no effect on net assets or net asset value per share. For the fiscal year ended September 30, 2017, the following table shows the reclassifications made:
| Undistributed Accumulated Net Investment Loss | Accumulated Net Realized Loss | Paid-In Capital | ||||||||||||
| Etho Climate Leadership U.S. ETF | $ | (408 | ) | $ | (474,494 | ) | $ | 474,902 | ||||||
29
Etho Climate Leadership U.S. ETF
NOTES TO FINANCIAL STATEMENTS
September 30, 2017 (Continued)
NOTE 9 – DISTRIBUTIONS TO SHAREHOLDERS
The Fund paid $109,859 from ordinary income and $40,845 from capital gains during the year ended September 30, 2017.
NOTE 10 – LEGAL MATTERS
The Trust, the trustees of the Trust, the Advisor and certain officers of the Advisor are defendants in an action filed May 2, 2017 in the Superior Court of New Jersey captioned PureShares, LLC d/b/a PureFunds et al. v. ETF Managers Group, LLC et al., Docket No. C-63-17. The PureShares action alleges claims based on disputes arising out of contractual relationships with the Advisor. The action seeks damages in unspecified amounts and injunctive relief based on breach of contract, wrongful termination, and several other theories. At the outset of the litigation, and again a few weeks later, plaintiffs sought temporary injunctive relief. Both motions were denied, and the matter is now proceeding through pretrial discovery. The defendants believe the lawsuit is without merit and intend to vigorously defend themselves against the allegations.
The Adviser, its parent, Exchange Traded Managers Group, LLC and its chief executive officer are defendants in a case filed on October 26, 2017 in the United States District Court for the Southern District of New York by NASDAQ, Inc. captioned Nasdaq, Inc. v. Exchange Traded Managers Group, LLC et al., Case 1:17-cv-08252. This action arises out of related facts and circumstances in the New Jersey litigation and asserts claims for breach of contract, wrongful termination and certain other theories with respect to the same exchange traded Fund discussed above. The defendants in the Southern District actions believe the lawsuit is without merit and intend to vigorously defend themselves against the allegations and to assert counterclaims against NASDAQ for breaches of its duties under the related index license agreement and various other agreements.
Management of the Trust and the Fund, after consultation with legal counsel, believes that the resolution of these matters will not have a material adverse effect on the Fund’s financial statements.
NOTE 11 – SUBSEQUENT EVENTS
In preparing these financial statements, the Fund has evaluated events and transactions for potential recognition or disclosure through the date the financial statements were issued. See Note 10.
30
Etho Climate Leadership U.S. ETF
To the Board of Trustees of ETF Managers Trust
and the Shareholders of Etho Climate Leadership U.S. ETF:
We have audited the accompanying statement of assets and liabilities, including the schedule of investments, of Etho Climate Leadership U.S. ETF (the “Fund”) (a series of ETF Managers Trust) as of September 30, 2017, the related statement of operations for the year then ended, and the statements of changes in net assets and financial highlights for the year then ended and the period from November 18, 2015 (commencement of operations) to September 30, 2016. These financial statements and financial highlights are the responsibility of the Fund’s management. Our responsibility is to express an opinion on these financial statements and financial highlights based on our audits.
We conducted our audits in accordance with the standards of the Public Company Accounting Oversight Board (United States). Those standards require that we plan and perform the audit to obtain reasonable assurance about whether the financial statements and financial highlights are free of material misstatement. The Fund is not required to have, nor were we engaged to perform, an audit of its internal control over financial reporting. Our audit included consideration of internal control over financial reporting as a basis for designing audit procedures that are appropriate in the circumstances, but not for the purpose of expressing an opinion on the effectiveness of the Fund’s internal control over financial reporting. Accordingly, we express no such opinion. An audit includes examining, on a test basis, evidence supporting the amounts and disclosures in the financial statements. Our procedures included confirmation of securities owned as of September 30, 2017 by correspondence with the custodian. An audit also includes assessing the accounting principles used and significant estimates made by management, as well as evaluating the overall financial statement presentation. We believe that our audits provide a reasonable basis for our opinion.
In our opinion, the financial statements and financial highlights referred to above present fairly, in all material respects, the financial position of the Etho Climate Leadership U.S. ETF series of ETF Managers Trust as of September 30, 2017, the results of its operations for the year then ended, and the changes in its net assets and its financial highlights for the year then ended and the period from November 18, 2015 (commencement of operations) to September 30, 2016, in conformity with accounting principles generally accepted in the United States of America.
/s/WithumSmith+Brown, PC
New York, NY
November 27, 2017
31
Etho Climate Leadership U.S. ETF
Etho Climate Leadership U.S. ETF Closing Price vs. NAV
The following Frequency Distribution of Premiums and Discounts chart is provided to show the frequency at which the closing price for each Fund is at a premium or discount to its daily net asset value (NAV). The chart presented represents past performance and cannot be used to predict future results.
| Year Ended | ||||||
| Etho Climate Leadership U.S. ETF | September 30, 2017 | |||||
| Premium/Discount Range | Number of Days | Percentage of Total Days | ||||
| Greater than 1.00% | 0 | 0 | ||||
| Greater Than or equal to 0.75% And Less Than 1.00% | 1 | 0.4 | ||||
| Greater Than or Equal to 0.50% And Less Than 0.75% | 1 | 0.4 | ||||
| Greater Than or Equal to 0.25% And Less Than 0.50% | 27 | 10.7 | ||||
| Greater Than or Equal to 0.00% And Less Than 0.25% | 153 | 61.0 | ||||
| Less Than or Equal to 0.0% And Greater Than -0.25% | 63 | 25.1 | ||||
| Less Than or Equal to -0.25% And Greater Than -0.50% | 6 | 2.4 | ||||
| Less Than or Equal to -0.50% And Greater Than -0.75% | 0 | 0 | ||||
| Less Than or Equal to -0.75% And Greater Than -1.00% | 0 | 0 | ||||
| Less than -1.00% | 0 | 0 | ||||
| November 11, 2015* | ||||||
| through | ||||||
| Etho Climate Leadership U.S. ETF | September 30, 2016 | |||||
| Percentage | ||||||
| Number | of Total | |||||
| Premium/Discount Range | of Days | Days | ||||
| Greater than 1.00% | 16 | 7.3 | ||||
| Greater Than or equal to 0.75% And Less Than 1.00% | 2 | 0.9 | ||||
| Greater Than or Equal to 0.50% And Less Than 0.75% | 14 | 6.4 | ||||
| Greater Than or Equal to 0.25% And Less Than 0.50% | 24 | 11.0 | ||||
| Greater Than or Equal to 0.00% And Less Than 0.25% | 90 | 41.1 | ||||
| Less Than or Equal to 0.0% And Greater Than -0.25% | 55 | 25.1 | ||||
| Less Than or Equal to -0.25% And Greater Than -0.50% | 9 | 4.1 | ||||
| Less Than or Equal to -0.50% And Greater Than -0.75% | 5 | 2.3 | ||||
| Less Than or Equal to -0.75% And Greater Than -1.00% | 3 | 1.4 | ||||
| Less than -1.00% | 1 | 0.5 | ||||
*First day of secondary market trading
32
Etho Climate Leadership U.S. ETF
For the Year Ended September 30, 2017 (Unaudited)
Pursuant to Section 15(c) of the Investment Company Act of 1940 (the “1940 Act”), at a meeting held on June 14, 2017, the Board of Trustees (the “Board”) of ETF Managers Trust (the “Trust”) considered the renewal of the Investment Advisory Agreement (“Advisory Agreement”) between ETF Managers Group LLC (the “Adviser”) and the Trust, on behalf of Etho Climate Leadership U.S. ETF (“ETHO”) (the “Fund”).
Pursuant to Section 15(c) of the 1940 Act, the Board must annually review and approve the Advisory Agreement after its initial two-year term: (i) by the vote of the Trustees or by a vote of the shareholders of the Fund; and (ii) by the vote of a majority of the Trustees who are not parties to the Advisory Agreement or “interested persons” of any party thereto, as defined in the 1940 Act (the “Independent Trustees”), cast in person at a meeting called for the purpose of voting on such approval. Each year, the Board calls and holds a meeting to decide whether to renew the Advisory Agreement for an additional one-year term. In preparation for such meetings, the Board requests and reviews a wide variety of information from the Adviser.
In reaching this decision, the Board, including the Independent Trustees, considered all factors it believed relevant, including: (i) the nature, extent and quality of the services provided to the Fund’s shareholders by the Adviser; (ii) the investment performance of the Fund; (iii) the Adviser’s cost and profits they realize in providing their services, including any fall-out benefits enjoyed by the Adviser; (iv) comparative fee and expense data for the Fund in relation to other similar investment companies; (v) the extent to which economies of scale would be realized as the Fund grows and whether the advisory fee for the Fund reflects these economies of scale for the benefit of the Fund; and (vi) other financial benefits to the Adviser and its affiliates resulting from services rendered to the Fund. The Board’s review included written and oral information furnished to the Board prior to and at the meeting held on June 14, 2017, and throughout the year. Among other things, the Adviser provided overviews of its advisory business, including its personnel. The information provided discussed the services provided by the Adviser. The Board then discussed the written and oral information that it received before the meeting and throughout the year, and the Adviser’s oral presentations and any other information that the Board received at the meeting, and deliberated on the renewal of the Advisory Agreement in light of this information.
The Independent Trustees were assisted throughout the contract review process by Schiff Hardin LLP. The Independent Trustees relied upon the advice of such counsel and their own business judgment in determining the material factors to be considered in evaluating the Advisory Agreement, and the weight to be given to each such factor. The conclusions reached with respect to the Advisory Agreement were based on a comprehensive evaluation of all the information provided and not any single factor. Moreover, each Trustee may have placed varying emphasis on particular factors in reaching conclusions. The matters discussed were also considered separately by the Independent Trustees in executive session with Schiff Hardin LLP, at which no representatives of management were present.
Nature, Extent and Quality of Services Provided by the Adviser
The Trustees considered the scope of services provided under the Advisory Agreement, noting that the Adviser will be providing investment management services to the Fund. The Board discussed the responsibilities of the Adviser, including: responsibility for the general management of the day-to-day investment and reinvestment of the assets of the Fund; determining the daily baskets of deposit securities and cash components; executing portfolio security trades for purchases and redemptions of Fund shares conducted on a cash-in-lieu basis; responsibility for daily monitoring of tracking error and quarterly reporting to the Board; and implementation of Board directives as they relate to the Fund. In considering the nature, extent and quality of the services provided by the Adviser, the Board considered the quality of the Adviser’s compliance program. The Board also considered the Adviser’s experience managing ETFs. The Board considered the experience of the portfolio managers of the Fund.
33
Etho Climate Leadership U.S. ETF
APPROVAL OF ADVISORY AGREEMENT AND BOARD CONSIDERATIONS
For the Year Ended September 30, 2017 (Unaudited)
The Board also considered other services provided to the Fund, such as overseeing the Fund’s service providers, monitoring adherence to the Fund’s investment restrictions, and monitoring compliance with various policies and procedures and with applicable securities laws.
Based on the factors above, as well as those discussed below, the Board concluded that it was satisfied with the nature, extent and quality of the services to be provided to the Fund by the Adviser.
Historical Performance
The Board then considered the past performance of the Fund. The Board reviewed information regarding the performance history of the Fund over various time periods, including the year-to-date period, the most recent one-year period and the periods since the Fund’s inception, each as of May 31, 2017. The Board noted that the index-based investment objective of ETHO made analysis of investment performance, in absolute terms, less of a priority than that which normally attaches to the performance of actively managed funds. Instead, the Board focused on the extent to which ETHO tracked its underlying index. The Board noted that the Adviser began managing the Fund on January 1, 2017. The Board reviewed information regarding the Fund’s index tracking during the time it was managed by the Adviser, discussing, as applicable, factors which contributed to the Fund’s tracking error over certain periods of time. The Board concluded that, after taking these factors into account, the Fund satisfactorily tracked its underlying index. The Board further noted that it had received and would continue to receive regular reports regarding the Fund’s performance at its quarterly meetings. The Board concluded that, given the capabilities and experience of the Adviser’s personnel in managing ETFs, the Adviser would be able to continue to keep the Fund’s tracking error within acceptable ranges.
Cost of Services Provided and Economies of Scale
The Board reviewed the advisory fee for the Fund and compared it to the total operating expenses of other funds in the industry falling within the same style category. The Board took into consideration management’s discussion of the fees, including that the Fund has a niche investment strategy and limited peer ETFs.
The Board also noted the importance of the fact that the advisory fee for the Fund was a “unified fee,” meaning that the shareholders of the Fund pay no expenses other than the advisory fee and certain other costs such as interest, brokerage and extraordinary expenses and, to the extent it is implemented, fees pursuant to a Distribution and/or Shareholder Servicing (12b-1) Plan. The Board noted that the Adviser was responsible for compensating the Trust’s other service providers and paying the Fund’s other expenses out of its own fee and resources. The Board also evaluated the compensation and benefits received by the Adviser from its relationship with the Fund, taking into account an analysis of the Adviser’s profitability provided at the meeting. The Board concluded that the advisory fee for the Fund was fair and reasonable in light of the factors considered.
In addition, the Board considered whether economies of scale had been realized for the Fund. The Board noted that the Adviser regularly considers whether fee reductions are appropriate as the Funds grow in size. The Board concluded that the Fund had not reached a size where it had realized economies of scale that would warrant a fee reduction. The Board noted that a unitary fee provides a level of certainty in expenses for the Fund. The Trustees concluded that the flat advisory fee was reasonable and appropriate.
34
Etho Climate Leadership U.S. ETF
APPROVAL OF ADVISORY AGREEMENT AND BOARD CONSIDERATIONS
For the Year Ended September 30, 2017 (Unaudited)
Based on the Board’s deliberations and its evaluation of the information described above, the Board, including the Independent Trustees, unanimously: (a) concluded that the terms of the Advisory Agreement are fair and reasonable; (b) concluded that the Adviser’s fees are reasonable in light of the services that the Adviser provides to the Fund; and (c) agreed to renew the Advisory Agreement for another year.
35
Etho Climate Leadership U.S. ETF
September 30, 2017 (Unaudited)
FEDERAL TAX INFORMATION
(Unaudited)
Qualified Dividend Income/Dividends Received Deduction
For the fiscal year ended September 30, 2017, certain dividends paid by the Fund may be subject to a maximum tax rate of 15%, as provided for by the Jobs and Growth Tax Reconciliation Act of 2003. The percentage of dividends declared from ordinary income designated as qualified dividend income was as follows:
| Fund Name | QDI |
| Etho Climate Leadership U.S. ETF | 86.38% |
For corporate shareholders, the percent of ordinary income distributions qualifying for the corporate dividends received deduction for the fiscal year ended September 30, 2017 was as follows:
| Fund Name | DRD |
| Etho Climate Leadership U.S. ETF | 85.09% |
Short Term Capital Gain
The percentage of taxable ordinary income distributions that are designated as short-term capital gain distributions under Internal Revenue Section 871 (k)(2)(C) for the Fund was as follows:
| Fund Name | Short-Term Capital Gain |
| Etho Climate Leadership U.S. ETF | 26.42% |
36
Etho Climate Leadership U.S. ETF
SUPPLEMENTARY INFORMATION
September 30, 2017 (Unaudited)
(Unaudited)
The Fund files a Form N-Q with the Securities and Exchange Commission (the ‘‘SEC’’) no more than sixty days after the Fund’s first and third fiscal quarters. For the Fund, this would be for the fiscal quarters ending June 30 and December 31. Form N-Q includes a complete schedule of the Funds’ portfolio holdings as of the end of those fiscal quarters. The Fund’s N-Q filings can be found free of charge on the SEC’s website at http://www.sec.gov, or they may be reviewed and copied at the SEC’s Public Reference Room in Washington, D.C. (call 800-SEC-0330 for information on the operation of the Public Reference Room). The Fund’s portfolio holdings are posted on the Fund’s website at www.ethoetf.com daily.
(Unaudited)
A description of the policies and procedures the Fund uses to determine how to vote proxies relating to portfolio securities is provided in the Statement of Additional Information (“SAI”). The SAI is available without charge upon request by calling toll-free at 1-844-ETF-MGRS (1-844-383-6477), by accessing the SEC’s website at www.sec.gov, or by accessing the Fund’s website at www.ethoetf.com.
Information regarding how the Fund voted proxies relating to portfolio securities during the period ending June 30 is available by calling toll-free at 1-844-ETF-MGRS (1-844-383-6477) or by accessing the SEC’s website at www.sec.gov.
Carefully consider the Fund’s investment objectives, risk factors, charges, and expenses before investing. This and additional information can be found in the Fund’s prospectus, which may be obtained by calling 1-844-ETF-MGRS (1-844-383-6477) or by visiting www.ethoetf.com. Read the prospectus carefully before investing.
37
Etho Climate Leadership U.S. ETF
For the Period Ended September 30, 2017 (Unaudited)
As a shareholder of Etho Climate Leadership U.S. ETF (the “Fund”) you incur two types of costs: (1) transaction costs, including brokerage commissions on purchases and sales of Fund shares, and (2) ongoing costs, including management fees and other Fund expenses. These examples are intended to help you understand your ongoing costs (in dollars) of investing in the Fund and to compare these costs with the ongoing costs of investing in other funds. The example is based on an investment of $1,000 invested at the beginning of the period and held for the entire period (April 1, 2017 to September 30, 2017).
Actual Expenses
The first line of the table provides information about actual account values based on actual returns and actual expenses. You may use the information in this line, together with the amount you invested, to estimate the expenses that you paid over the period. Simply divide your account value by $1,000 (for example, an $8,600 account value divided by $1,000 = 8.6), then, multiply the result by the number in the first line under the heading entitled “Expenses Paid During Period” to estimate the expenses you paid on your account during this period.
Hypothetical Example for Comparison Purposes
The second line of the table provides information about hypothetical account values based on a hypothetical return and hypothetical expenses based on the Fund’s actual expense ratio and an assumed rate of return of 5% per year before expenses, which is not the Fund’s actual return. The hypothetical account values and expenses may not be used to estimate the actual ending account balance or expenses you paid for the period. You may use this information to compare the ongoing costs of investing in the Fund and other funds. To do so, compare this 5% hypothetical example with the 5% hypothetical examples that appear in the shareholder reports of the other funds. Please note that the expenses shown in the table are meant to highlight your ongoing costs only and do not reflect any transactional costs, such as brokerage commissions paid on purchases and sales of Fund shares. Therefore, the second line of the table is useful in comparing ongoing costs only and will not help you determine the relative total costs of owning different funds. If these transactional costs were included, your costs would have been higher.
Etho Climate Leadership U.S. ETF
Beginning Account Value April 1, 2017 | Ending Account Value September 30, 2017 | Expenses Paid During the Period^ | |||||||
| Actual | $1,000.00 | $1,094.80 | $2.36 | ||||||
| Hypothetical (5% annual) | $1,000.00 | $1,022.81 | $2.28 |
^ The dollar amounts shown as expenses paid during the period are equal to the annualized six-month expense ratio multiplied by the average account value during the period, multiplied by 183/365 (to reflect the period from April 1, 2017 to September 30, 2017).
38
Etho Climate Leadership U.S. ETF
Set forth below are the names, birth years, positions with the Trust, length of term of office, and the principal occupations and other directorships held during at least the last five years of each of the persons currently serving as a Trustee of the Trust, as well as information about each officer. The business address of each Trustee and officer is 30 Maple Street, Summit, New Jersey 07901.
Name and Year of Birth | Position(s) Held with the Trust, Term of Office and Length of Time Served | Principal Occupation(s) During Past 5 Years | Number of Portfolios in Fund Complex Overseen By Trustee | Other Directorships Held by Trustee During Past 5 Years | |||||
| Interested Trustee* and Officers | |||||||||
| Samuel Masucci, III (1962) | Trustee, Chairman of the Board and President (since 2012); Secretary (since 2014) | Chief Executive Officer, Exchange Traded Managers Group, LLC (since 2013); Chief Executive Officer and Chief Compliance Officer, Factor Advisors, LLC (since 2012); President and Chief Executive Officer, Factor Capital Management LLC (since 2012); President and Chief Executive Officer, GENCAP Ventures, LLC (holding company) (2012–2013); Chief Executive Officer, MacroMarkets LLC (exchange traded funds) (2005–2011); President, Chief Executive and Chief Compliance Officer, Macro Financial (financial services) (2005–2011). | 9 | None | |||||
| Reshma J. Amin (1978) | Chief Compliance Officer (since 2016) | Chief Compliance Officer, Exchange Traded Managers Group, LLC (since 2016); Partner, Crow & Cushing (2007–2016). | n/a | n/a | |||||
| John A. Flanagan (1946) | Treasurer (since 2015) | President, John A. Flanagan CPA, LLC (accounting services) (since 2010); Chief Financial Officer, Exchange Traded Managers Group, LLC (since 2015); Principal Financial Officer, ETF Managers Capital, LLC (commodity pool operator) (since 2014); Chief Financial Officer, Macromarkets LLC (exchange traded funds) (2007–2010) | n/a | n/a |
* Mr. Masucci is an interested Trustee by virtue of his role as the Chief Executive Officer of the Adviser.
39
Etho Climate Leadership U.S. ETF
Board of Trustees (Continued)
Name and Year of Birth | Position(s) Held with the Trust, Term of Office and Length of Time Served | Principal Occupation(s) During Past 5 Years | Number of Portfolios in Fund Complex Overseen By Trustee | Other Directorships Held by Trustee During Past 5 Years | |||||
| Independent Trustees | |||||||||
| John W. Southard (1969) | Trustee (since 2012) | Director and Co-Founder, T2 Capital Management, 2010 to present; Co-Founder and Head of Research and Trading, PowerShares Capital Management, 2002 to 2009. | 9 | None | |||||
| Terry Loebs (1963) | Trustee (since 2014) | Founder and Managing Member, Pulsenomics LLC (index product development and consulting firm) (since 2011); Managing Director, MacroMarkets, LLC (exchange-traded products firm) (2006–2011). | 9 | None |
40
ETF MANAGERS TRUST
ETF Managers Trust, (the “Trust”) has adopted the following privacy policies in order to safeguard the personal information of the Trust’s customers and consumers in accordance with Regulation S-P as promulgated by the U.S. Securities and Exchange Commission.
Trust officers are responsible for ensuring that the following policies and procedures are implemented:
| 1) | The Trust is committed to protecting the confidentiality and security of the information they collect and will handle personal customer and consumer information only in accordance with Regulation S-P and any other applicable laws, rules and regulations2. The Trust will ensure: (a) the security and confidentiality of customer records and information; (b) that customer records and information are protected from any anticipated threats and hazards; and (c) that customer records and information are protected from unauthorized access or use. |
| 2) | The Trust conducts its business affairs through its trustees, officers and third parties that provide services pursuant to agreements with the Trust. The Trust has no employees. It is anticipated that the trustees and officers of the Trust who are not employees of service providers of the Trust will not have access to customer records and information in the performance of their normal responsibilities for the Trust. |
| 3) | The Trust may share customer information with its affiliates, subject to the customers’ right to prohibit such sharing. |
| 4) | The Trust may share customer information with unaffiliated third parties only in accordance with the requirements of Regulation S-P. Pursuant to this policy, the Trust will not share customer information with unaffiliated third parties other than as permitted by law, unless authorized to do so by the customer. |
Consistent with these policies, the Trust has adopted the following procedures:
| 1) | The Trust will determine that the policies and procedures of its affiliates and Service Providers are reasonably designed to safeguard customer information and only permit appropriate and authorized access to and use of customer information through the application of appropriate administrative, technical and physical protections. |
| 2) | The Trust will direct each of its Service Providers to adhere to the privacy policy of the Trust and to its privacy policies with respect to all customer information of the Trust and to take all actions reasonably necessary so that the Trust is in compliance with the provisions of Regulation S-P, including, as applicable, the development and delivery of privacy notices and the maintenance of appropriate and adequate records. |
| 3) | The Trust requires its Service Providers to provide periodic reports to the Trust’s Board of Trustees outlining their privacy policies and the implementation of such policies. Each Service Provider is required to promptly report to the Trust’s Board any material changes to its privacy policy before, or promptly after, the adoption of such changes. |
2 Generally, the Funds have institutional clients which are not considered “customers” for purposes of regulation S-P.
41
Advisor
ETF Managers Group, LLC
30 Maple Street, Suite 2, Summit, NJ 07901
Distributor
ETFMG Financial, Inc.
30 Maple Street, Suite 2, Summit, NJ 07901
Custodian
U.S. Bank National Association
Custody Operations
1555 North River Center Drive, Suite 302, Milwaukee, Wisconsin 53212
Transfer Agent
U.S. Bancorp Fund Services, LLC
615 East Michigan Street, Milwaukee, Wisconsin 53202
Securities Lending Agent
U.S Bank, National Association
Securities Lending
800 Nicolet Mall, Minneapolis, MN 55402-7020
Independent Registered Public Accounting Firm
WithumSmith + Brown, PC
1411 Broadway, 9th Floor, New York, NY 10018
Legal Counsel
Sullivan & Worcester LLP
1666 K Street NW, Washington, DC 20006

Annual Report
September 30, 2017
Spirited Funds/ETFMG Whiskey & Spirits ETF
Ticker: WSKY

The Fund is a series of ETF Managers Trust.
Spirited Funds/ETFMG Whiskey & Spirits ETF
TABLE OF CONTENTS
September 30, 2017
September 30, 2017
| Page | |
| 3 | |
| 4 | |
| 6 | |
| 7 | |
| 8 | |
| 10 | |
| 11 | |
| 12 | |
| 13 | |
| 14 | |
| 22 | |
| 23 | |
| 24 | |
| 25 | |
| 27 | |
| 28 | |
| 28 | |
| 29 |
1
(This Page Intentionally Left Blank)
2
Dear Shareholder,
On behalf of the entire team, we want to express our appreciation for the confidence you have placed in the Spirited Funds/ETFMG Whiskey & Spirits Exchange-Traded Fund (“WSKY” or the “Fund”). The following information pertains to the Fund’s initial fiscal period from October 11, 2016, the Fund’s inception, to September 30, 2017.
The Fund saw positive performance during the fiscal year ended September 30, 2017. The Fund NAV reflected a positive return of 18.22% while the Spirited Funds/ETFMG Whiskey & Spirits Index (“Index”), the Fund’s benchmark, was up 19.96% over the same period. The difference was primarily attributable to Fund expenses that are not a part of the Index.
For the period ended September 30, 2017, the best performing securities in the Fund were Stock Spirits Group (up 86.20%), LMVH Moet Hennessy (up 56.69%), and MGP Ingredients (up 48.55%). The worst performing securities in the Fund were Bohae Brewery (down -20.33%), Distell Group Ltd. (down -18.07%), and Kook Soon Dang Brewery (down -10.34%).
You can find further details about WSKY by visiting www.spiritedfunds.com, or by calling 1-844-ETF-MGRS. (1-844-383-6477).
Sincerely,
Samuel Masucci III
Chairman of the Board
Chairman of the Board
Samuel Masucci III is a registered representative of ETFMG Financial, LLC.
3
Growth of $10,000 (Unaudited)
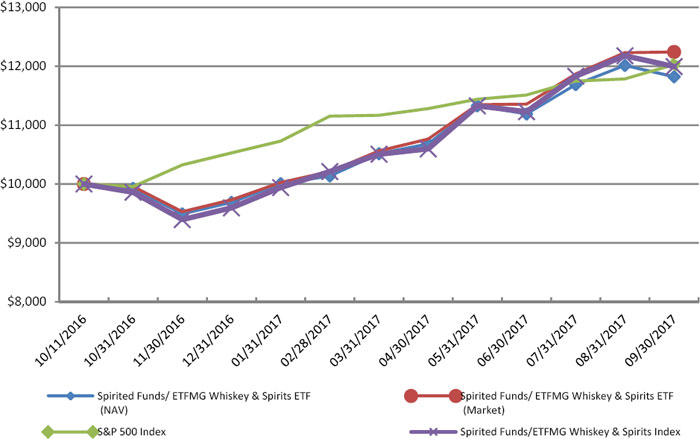
| Since | ||||||||
| Cumulative Returns | 6 Months | Inception | ||||||
| Period Ended September 30, 2017 | Return | (10/11/2016) | ||||||
| Spirited Funds/ ETFMG Whiskey & Spirits ETF (NAV) | 12.42 | % | 18.22 | % | ||||
| Spirited Funds/ ETFMG Whiskey & Spirits ETF (Market) | 15.92 | % | 22.44 | % | ||||
| S&P 500 Index | 7.71 | % | 20.28 | % | ||||
| Spirited Funds/ETFMG Whiskey & Spirits Index | 14.18 | % | 19.96 | % | ||||
Total Fund Operating Expenses1 | 0.60 | % | ||||||
1. The expense ratio is taken from the Fund’s most recent prospectus dated May 1, 2017. Effective May 1, 2017, the Fund’s Unitary fees went from 0.75% to 0.60%
Performance data quoted represents past performance and does not guarantee future results. The investment return and principal value of an investment will fluctuate so that an investor’s shares, when sold, may be worth more or less than their original cost. Current performance of the Fund may be lower or higher than the performance quoted. All performance is historical and includes reinvestment of dividends and capital gains. Performance data current to the most recent month end may be obtained by calling 1-844-ETF-MGRS (1-844-383-6477).
The chart illustrates the performance of a hypothetical $10,000 investment made on October 11, 2016, and is not intended to imply any future performance. The returns shown do not reflect the reduction of taxes that a shareholder would pay on Fund distributions from the sale of Fund shares. The chart assumes reinvestment of capital gains and dividends, if any. The unmanaged indices do not reflect fees and are not available for direct investment.
4
Spirited Funds/ETFMG Whiskey & Spirits ETF
Top Ten Holdings*
| Security | % of Total Investments† | ||||
| 1 | Diageo PLC | 18.42% | |||
| 2 | Pernod Ricard SA | 8.17% | |||
| 3 | LVMH Moet Hennessy Louis Vuitton SE | 5.34% | |||
| 4 | MGP Ingredients, Inc. | 5.22% | |||
| 5 | Brick Brewing Co. Ltd. | 5.12% | |||
| 6 | Thai Beverage PLC | 4.75% | |||
| 7 | Remy Cointreau SA | 4.75% | |||
| 8 | Corby Spirit and Wine Ltd. | 4.74% | |||
| 9 | Radico Khaitan Ltd. | 4.74% | |||
| 10 | United Spirits Ltd. | 4.72% | |||
Top Ten Holdings = 65.97% of Total Investments†
* Current portfolio holdings may not be indicative of future fund holdings.
† Percentage of total investments less cash.
5
Spirited Funds/ETFMG Whiskey & Spirits ETF
Investing involves risk, including the possible loss of principal. Shares of any ETF are bought and sold at market price (not NAV), may trade at a discount or premium to NAV and are not individually redeemed from the Fund. Brokerage commissions will reduce returns. Narrowly focused investments typically exhibit higher volatility.
Spirited Funds/ETFMG Whiskey & Spirits ETF seeks to provide investment results that, before fees and expenses, correspond generally to the total return performance of the Spirited Funds/ETFMG Whiskey & Spirits Index (the “Index”). The Index is comprised of core companies that are principally engaged in the production, distillation, storage, or aging of whiskey and non-core companies that derive a portion of their revenue from whiskey and spirits.
The industries in which Bourbon and Whiskey Economy Companies operate are very competitive and companies in such industries are subject to a number of risks. Demographic and product trends, changing consumer preferences, nutritional and health-related concerns, competitive pricing, marketing campaigns, environmental factors, adverse changes in general economic conditions, government regulation, food inspection and processing control, consumer boycotts, risks of product tampering, product liability claims, and the availability and expense of liability insurance can affect the demand for, and success of, such companies’ products in the marketplace. Such companies also face risks associated with changing market prices as a result of, among other things, changes in government support and trading policies and agricultural conditions influencing the growth and harvest seasons.
ETF shares are not individually redeemable and owners of the shares may acquire those shares from the Fund and tender those shares for redemption to the Fund in Creation Units only, typically consisting of aggregations of 50,000 shares.
6
Spirited Funds/ETFMG Whiskey & Spirits ETF
| Spirited | ||||
| Funds/ETFMG | ||||
| Whiskey & | ||||
| Spirits ETF | ||||
| As a percent of Net Assets: | ||||
| Canada | 9.8 | % | ||
| Chile | 1.0 | |||
| France | 22.7 | |||
| India | 9.4 | |||
| Ireland | 1.0 | |||
| Italy | 4.6 | |||
| Japan | 3.7 | |||
| Mexico | 1.0 | |||
| Philippines | 1.1 | |||
| Republic of Korea | 4.0 | |||
| South Africa | 4.6 | |||
| Thailand | 4.7 | |||
| United Kingdom | 19.5 | |||
| United States | 12.4 | |||
| Short-Term and other Net Assets (Liabilities) | 0.5 | |||
| 100.0 | % | |||
7
Spirited Funds/ETFMG Whiskey & Spirits ETF
September 30, 2017
| Shares | Fair Value | |||||||
| COMMON STOCKS - 99.5% | ||||||||
| Canada - 9.8% | ||||||||
| Beverages - 9.8% | ||||||||
| Brick Brewing Co. Ltd. (a) | 101,087 | $ | 299,757 | |||||
| Corby Spirit and Wine Ltd. (a) | 16,038 | 277,508 | ||||||
| Total Beverages | 577,265 | |||||||
| Chile - 1.0% | ||||||||
| Beverages - 1.0% | ||||||||
| Cia Cervecerias Unidas SA - ADR | 2,210 | 59,515 | ||||||
| France - 22.7% | ||||||||
| Beverages - 17.4% | ||||||||
| Marie Brizard Wine & Spirits SA (a) | 15,818 | 265,098 | ||||||
| Pernod Ricard SA | 3,457 | 478,244 | ||||||
| Remy Cointreau SA | 2,348 | 278,064 | ||||||
| Total Beverages | 1,021,406 | |||||||
| Textiles, Apparel & Luxury Goods - 5.3% | ||||||||
| LVMH Moet Hennessy Louis Vuitton SE | 1,133 | 312,609 | ||||||
| Total France | 1,334,015 | |||||||
| India - 9.4% | ||||||||
| Beverages - 9.4% | ||||||||
| Radico Khaitan Ltd. | 108,592 | 277,132 | ||||||
| United Spirits Ltd. (a) | 7,530 | 276,398 | ||||||
| Total Beverages | 553,530 | |||||||
| Ireland - 1.0% | ||||||||
| Beverages - 1.0% | ||||||||
| C&C Group PLC | 16,507 | 59,504 | ||||||
| Italy - 4.6% | ||||||||
| Beverages - 4.6% | ||||||||
| Davide Campari-Milano SpA | 37,537 | 272,399 | ||||||
| Japan - 3.7% | ||||||||
| Beverages - 3.7% | ||||||||
| Asahi Group Holdings Ltd. | 1,800 | 72,880 | ||||||
| Kirin Holdings Co. Ltd. | 3,400 | 80,011 | ||||||
| Takara Holdings, Inc. | 7,000 | 63,888 | ||||||
| Total Beverages | 216,779 | |||||||
| Mexico - 1.0% | ||||||||
| Beverages - 1.0% | ||||||||
| Becle SAB de CV (a) | 35,956 | 60,302 | ||||||
| Philippines - 1.1% | ||||||||
| Beverages - 1.1% | ||||||||
| Emperador, Inc. | 442,600 | 63,080 | ||||||
The accompanying notes are an integral part of these financial statements.
8
Spirited Funds/ETFMG Whiskey & Spirits ETF
Schedule of Investments
September 30, 2017 (Continued)
| Fair | ||||||||
| Shares | Value | |||||||
| Republic of Korea - 4.0% | ||||||||
| Beverages - 4.0% | ||||||||
| Bohae Brewery Co Ltd. (a) | 72,379 | $ | 59,339 | |||||
| Hite Jinro Co Ltd. | 2,735 | 62,802 | ||||||
| Kook Soon Dang Brewery Co Ltd. | 11,602 | 58,752 | ||||||
| Lotte Chilsung Beverage Co Ltd. | 45 | 53,198 | ||||||
| Total Beverages | 234,091 | |||||||
| South Africa - 4.6% | ||||||||
| Beverages - 4.6% | ||||||||
| Distell Group Ltd. | 28,805 | 270,715 | ||||||
| Thailand - 4.7% | ||||||||
| Beverages - 4.7% | ||||||||
| Thai Beverage PLC | 419,131 | 278,092 | ||||||
| United Kingdom - 19.5% | ||||||||
| Beverages - 19.5% | ||||||||
| Diageo PLC | 32,800 | 1,078,141 | ||||||
| Stock Spirits Group PLC | 20,822 | 66,963 | ||||||
| Total Beverages | 1,145,104 | |||||||
| United States - 12.4% | ||||||||
| Beverages - 12.4% | ||||||||
| Brown-Forman Corp. | 5,069 | 275,247 | ||||||
| Constellation Brands, Inc. (a) | 738 | 147,194 | ||||||
| MGP Ingredients, Inc. | 5,035 | 305,272 | ||||||
| Total Beverages | 727,713 | |||||||
| TOTAL COMMON STOCKS (Cost $5,548,551) | 5,852,104 | |||||||
| Total Investments (Cost $5,548,551) - 99.5% | 5,852,104 | |||||||
| Other Assets in Excess of Liabilities - 0.5% | 28,291 | |||||||
| TOTAL NET ASSETS - 100.0% | $ | 5,880,395 | ||||||
Percentages are stated as a percent of net assets.
| ADR | American Depositary Receipt |
| (a) | Non-income producing security. |
The Global Industry Classification Standard (GICS®) was developed by and/or is the exclusive property of MSCI, Inc. and Standard & Poor’s Financial Services LLC (“S&P”). GICS® is a service mark of MSCI, Inc. and S&P and has been licensed for use by the Fund’s Administrator, U.S. Bancorp Fund Services, LLC.
The accompanying notes are an integral part of these financial statements.
9
Spirited Funds/ETFMG Whiskey & Spirits ETF
As of September 30, 2017
Spirited Funds/ ETFMG Whiskey & Spirits ETF | ||||
| ASSETS | ||||
| Investments in securities, at fair value* | $ | 5,852,104 | ||
| Foreign currency | 3,918 | |||
| Receivables: | ||||
| Dividends and interest receivable | 19,319 | |||
| Receivable for investments sold | 86,203 | |||
| Total Assets | 5,961,544 | |||
| LIABILITIES | ||||
| Payables: | ||||
| Payable for investments purchased | 78,343 | |||
| Management fees payable | 2,806 | |||
| Total Liabilities | 81,149 | |||
| Net Assets | $ | 5,880,395 | ||
| NET ASSETS CONSIST OF: | ||||
| Paid-in Capital | $ | 5,559,637 | ||
| Undistributed net investment income | 8,766 | |||
| Accumulated net realized gain on investments | 7,867 | |||
| Net unrealized appreciation on: | ||||
| Investments in securities | 303,553 | |||
| Foreign currency and translation of other assets and liabilities in foreign currency | 572 | |||
| Net Assets | $ | 5,880,395 | ||
| *Identified Cost: | ||||
| Investments in securities | $ | 5,548,551 | ||
| Foreign currency | 3,346 | |||
| Shares Outstanding^ | 200,000 | |||
| Net Asset Value, Offering and Redemption Price per Share | $ | 29.40 | ||
^No par value, unlimited number of shares authorized.
The accompanying notes are an integral part of these financial statements.
10
Spirited Funds/ETFMG Whiskey & Spirits ETF
For the period ended September 30, 2017
Spirited Funds/ ETFMG Whiskey & Spirits ETF1 | ||||
| INVESTMENT INCOME | ||||
| Income: | ||||
| Dividends from unaffiliated securities (net of foreign withholdings tax of $5,078) | $ | 62,191 | ||
| Interest | 45 | |||
| Securities lending income | 93 | |||
| Total Investment Income | 62,329 | |||
| Expenses: | ||||
| Management fees | 20,247 | |||
| Net Investment Income | 42,082 | |||
| REALIZED & UNREALIZED GAIN ON INVESTMENTS | ||||
| Net Realized Gain (Loss) on: | ||||
| Unaffiliated investments | 1,446 | |||
| In-Kind redemptions | 198,439 | |||
| Foreign currency and foreign currency translation | (21,384 | ) | ||
| Net Realized Gain on Investments and Foreign Currency | 178,501 | |||
| Net Change in Unrealized Appreciation of: | ||||
| Unaffiliated investments | 303,553 | |||
| Foreign currency and foreign currency translation | 572 | |||
| Net Change in Unrealized Appreciation of Investments and Foreign Currency | 304,125 | |||
| Net Realized and Unrealized Gain on Investments | 482,626 | |||
| NET INCREASE IN NET ASSETS RESULTING FROM OPERATIONS | $ | 524,708 | ||
| 1 | Fund commenced operations on October 11, 2016. The information presented is for the period from October 11, 2016 to September 30, 2017. |
The accompanying notes are an integral part of these financial statements.
11
Spirited Funds/ETFMG Whiskey & Spirits ETF
Period Ended September 30, 2017* | ||||
| OPERATIONS | ||||
| Net investment income | $ | 42,082 | ||
| Net realized gain on investments | 178,501 | |||
| Net change in unrealized appreciation of investments | 304,125 | |||
| Net increase in net assets resulting from operations | 524,708 | |||
| DISTRIBUTIONS TO SHAREHOLDERS | ||||
| From net investment income | (22,801 | ) | ||
| CAPITAL SHARE TRANSACTIONS | ||||
| Net increase in net assets derived from net change in outstanding shares (a) | 5,373,635 | |||
| Transaction Fees (Note 1) | 4,853 | |||
| Net increase in net assets from capital chare transactions | 5,378,488 | |||
| Net increase in net assets | 5,880,395 | |||
| NET ASSETS | ||||
| Beginning of Period | — | |||
| End of Period | $ | 5,880,395 | ||
| Undistributed net investment income | $ | 8,766 | ||
(a) Summary of share transactions is as follows:
| Period Ended | ||||||||
September 30, 2017* | ||||||||
| Shares | Amount | |||||||
| Shares Sold | 350,000 | $ | 9,624,840 | |||||
| Transaction Fees (Note 1) | — | 4,853 | ||||||
| Shares Redeemed | (150,000 | ) | (4,251,205 | ) | ||||
| Net Transactions in Fund Shares | 200,000 | $ | 5,378,488 | |||||
| Beginning Shares | — | |||||||
| Ending Shares | 200,000 | |||||||
| * | Fund commenced operations on October 11, 2016. The information presented is for the period from October 11, 2016 to September 30, 2017. |
The accompanying notes are an integral part of these financial statements.
12
Spirited Funds/ETFMG Whiskey & Spirits ETF
For a capital share outstanding throughout the period
Period Ended September 30, 20171 | ||||
| Net Asset Value, Beginning of Period | $ | 25.00 | ||
| Income from Investment Operations: | ||||
Net investment income2 | 0.36 | |||
| Net realized and unrealized gain on investments | 4.06 | |||
| Total from investment operations | 4.42 | |||
| Less Distributions: | ||||
| Distributions from net investment income | (0.02 | ) | ||
| Total distributions | (0.02 | ) | ||
| Net asset value, end of period | $ | 29.40 | ||
| Total Return | 18.22 | % 3 | ||
| Ratios/Supplemental Data: | ||||
| Net assets at end of period (000’s) | $ | 5,880 | ||
| Expenses to Average Net Assets | 0.67 | % 4 | ||
| Net Investment Income to Average Net Assets | 1.40 | % 4 | ||
| Portfolio Turnover Rate | 96 | % 3 | ||
| 1 | Commencement of operations on October 11, 2016. |
| 2 | Calculated based on average shares outstanding during the period. |
| 3 | Not annualized. |
| 4 | Annualized. |
The accompanying notes are an integral part of these financial statements.
13
Spirited Funds/ETFMG Whiskey & Spirits ETF
September 30, 2017 (Continued)
NOTE 1 – ORGANIZATION
The Spirited Funds/ETFMG Whiskey & Spirits ETF (the “Fund”) is a series of ETF Managers Trust (the “Trust”), an open-end management investment company consisting of multiple investment series, organized as a Delaware statutory trust on July 1, 2009. The Trust is registered with the SEC under the Investment Company Act of 1940, as amended (the “1940 Act”), as an open-end management investment company and the offering of the Fund’s shares (“Shares”) is registered under the Securities Act of 1933, as amended (the “Securities Act”). The Fund seeks to provide investment results that, before fees and expenses, correspond generally to the total return performance of the Spirited Funds/ETFMG Whiskey & Spirits Index. The Fund’s inception was on October 11, 2016.
The Fund currently offers one class of shares, which has no front end sales load, no deferred sales charges, and no redemption fees. The Fund may issue an unlimited number of shares of beneficial interest, with no par value. All shares of the Fund have equal rights and privileges.
Shares of the Fund are listed and traded on the NYSE Arca, Inc. Market prices for the Shares may be different from their net asset value (“NAV”). The Fund issues and redeems Shares on a continuous basis at NAV only in blocks of 50,000 shares, called “Creation Units.” Creation Units are issued and redeemed principally in-kind for securities included in a specified Index. Once created, Shares generally trade in the secondary market at market prices that change throughout the day in quantities less than a Creation Unit. Except when aggregated in Creation Units, Shares are not redeemable securities of a Fund. Shares of a Fund may only be purchased or redeemed by certain financial institutions (“Authorized Participants”). An Authorized Participant is either (i) a broker-dealer or other participant in the clearing process through the Continuous Net Settlement System of the National Securities Clearing Corporation or (ii) a DTC participant and, in each case, must have executed a Participant Agreement with the Distributor. Most retail investors do not qualify as Authorized Participants nor have the resources to buy and sell whole Creation Units. Therefore, they are unable to purchase or redeem the Shares directly from a Fund. Rather, most retail investors may purchase Shares in the secondary market with the assistance of a broker and are subject to customary brokerage commissions or fees.
Authorized Participants transacting in Creation Units for cash may pay an additional variable charge to compensate the relevant Fund for certain transaction costs (i.e., brokerage costs) and market impact expenses relating to investing in portfolio securities. Such variable charges, if any, are included in “Transaction Fees” in the statement of changes in net assets.
NOTE 2 – SIGNIFICANT ACCOUNTING POLICIES
The following is a summary of significant accounting policies consistently followed by the Fund. These policies are in conformity with accounting principles generally accepted in the United States of America (“U.S. GAAP”).
The Fund follows the investment company accounting and reporting guidance of the Financial Accounting Standards Board Accounting Standard Codification Topic 946 Financial Services – Investment Companies.
The Fund may invest in certain other investment companies (underlying funds). For specific investments in underlying funds, please refer to the complete schedule of portfolio holdings on Form N-CSR(S) for this reporting period, which is filed with the U.S. Securities and Exchange Commission (SEC). For more information about the underlying Fund’s operations and policies, please refer to those Funds’ semiannual and annual reports, which are filed with the SEC.
14
Spirited Funds/ETFMG Whiskey & Spirits ETF
NOTES TO FINANCIAL STATEMENTS
September 30, 2017 (Continued)
| A. | Security Valuation. Securities listed on a securities exchange, market or automated quotation system for which quotations are readily available (except for securities traded on NASDAQ), including securities traded over the counter, are valued at the last quoted sale price on the primary exchange or market (foreign or domestic) on which they are traded on the valuation date (or at approximately 4:00 pm Eastern Time if a security’s primary exchange is normally open at that time), or, if there is no such reported sale on the valuation date, at the most recent quoted bid price. For securities traded on NASDAQ, the NASDAQ Official Closing Price will be used. |
| Securities for which quotations are not readily available are valued at their respective fair values as determined in good faith by the Board of Trustees (the “Board”). When a security is “fair valued,” consideration is given to the facts and circumstances relevant to the particular situation, including a review of various factors set forth in the pricing procedures adopted by the Fund’s Board. The use of fair value pricing by a fund may cause the net asset value of its shares to differ significantly from the net asset value that would be calculated without regard to such considerations. As of September 30, 2017, the Fund did not hold any fair valued securities. |
| As described above, the Fund utilizes various methods to measure the fair value of its investments on a recurring basis. U.S. GAAP establishes a hierarchy that prioritizes inputs to valuation methods. The three levels of inputs are: |
| Level 1 | Unadjusted quoted prices in active markets for identical assets or liabilities that the Fund has the ability to access. |
| Level 2 | Observable inputs other than quoted prices included in Level 1 that are observable for the asset or liability, either directly or indirectly. These inputs may include quoted prices for the identical instrument on an inactive market, prices for similar instruments, interest rates, prepayment speeds, credit risk, yield curves, default rates and similar data. |
| Level 3 | Unobservable inputs for the asset or liability, to the extent relevant observable inputs are not available; representing the Fund’s own assumptions about the assumptions a market participant would use in valuing the asset or liability and would be based on the best information available. |
| The availability of observable inputs can vary from security to security and is affected by a wide variety of factors, including, for example, the type of security, whether the security is new and not yet established in the marketplace, the liquidity of markets, and other characteristics particular to the security. To the extent that valuation is based on models or inputs that are less observable or unobservable in the market, the determination of fair value requires more judgment. Accordingly, the degree of judgment exercised in determining fair value is greatest for instruments categorized in Level 3. |
| The inputs used to measure fair value may fall into different levels of the fair value hierarchy. In such cases, for disclosure purposes, the level in the fair value hierarchy within which the fair value measurement falls in its entirety, is determined based on the lowest level input that is significant to the fair value measurement in its entirety. |
15
Spirited Funds/ETFMG Whiskey & Spirits ETF
NOTES TO FINANCIAL STATEMENTS
September 30, 2017 (Continued)
| The following is a table that presents a summary of the Fund’s investments in securities, at fair value as of September 30, 2017: |
Spirited Funds/ETFMG Whiskey & Spirits ETF
Assets^ | Level 1 | Level 2 | Level 3 | Total | ||||||||||||
| Common Stocks | $ | 5,852,104 | $ | — | $ | — | $ | 5,852,104 | ||||||||
| Short-Term Investments | — | — | — | — | ||||||||||||
| Total Investments in Securities | $ | 5,852,104 | $ | — | $ | — | $ | 5,852,104 | ||||||||
^ See Schedule of Investments for classifications by sector or country.
There were no transfers between Levels 1, 2 and 3 during the period ended September 30, 2017. Transfers between levels are recognized at the end of the reporting period.
| B. | Federal Income Taxes. The Fund intends to elect to be taxed as a “regulated investment company” and intends to distribute substantially all taxable income to its shareholders and otherwise comply with the provisions of the Internal Revenue Code applicable to regulated investment companies. Therefore, no provisions for federal income taxes or excise taxes have been made. |
| To avoid imposition of the excise tax applicable to regulated investment companies, the Fund intends to declare each year as dividends, in each calendar year, at least 98.0% of its net investment income (earned during the calendar year) and 98.2% of its net realized capital gains (earned during the twelve months ended October 31) plus undistributed amounts, if any, from prior years. |
| Net capital losses incurred after October 31, within the taxable year are deemed to arise on the first business day of the Fund’s next taxable year. |
| The Fund recognizes the tax benefits of uncertain tax positions only where the position is “more likely than not” to be sustained assuming examination by tax authorities. The Fund has analyzed its tax position and has concluded that no liability for unrecognized tax benefits should be recorded related to uncertain tax positions expected to be taken in the Fund’s 2017 tax returns. The Fund identifies its major tax jurisdictions as U.S. Federal, the State of New Jersey, and the State of Delaware; however the Fund is not aware of any tax positions for which it is reasonably possible that the total amounts of unrecognized tax benefits will change materially in the next twelve months. |
| As of September 30, 2017, management has reviewed the tax positions for open periods (for federal purposes, three years from the date of filing and for state purposes, four years from the date of filing) as applicable to the Fund and has determined that no provision for income tax is required in the Fund’s financial statements. |
C. | Security Transactions and Investment Income. Investment securities transactions are accounted for on the trade date. Gains and losses realized on sales of securities are determined on a specific identification basis. Discounts/premiums on debt securities purchased are accreted/amortized over the life of the respective securities using the effective interest method. Dividend income is recorded on the ex-dividend date. Interest income is recorded on an accrual basis. Income, including gains, from investments in foreign securities received by the Fund may be subject to income, withholding or other taxes imposed by foreign countries. |
16
Spirited Funds/ETFMG Whiskey & Spirits ETF
NOTES TO FINANCIAL STATEMENTS
September 30, 2017 (Continued)
| D. | Foreign Currency Translations and Transactions. The Fund may engage in foreign currency transactions. Foreign currency transactions are translated into U.S. dollars on the following basis: (i) market value of investment securities, assets and liabilities at the daily rates of exchange, and (ii) purchases and sales of investment securities, dividend and interest income and certain expenses at the rates of exchange prevailing on the respective dates of such transactions. For financial reporting purposes, the Fund does not isolate changes in the exchange rate of investment securities from the fluctuations arising from changes in the market prices of securities for unrealized gains and losses. However, for federal income tax purposes, the Fund does isolate and treat as ordinary income the effect of changes in foreign exchange rates on realized gains or losses from the sale of investment securities and payables and receivables arising from trade-date and settlement-date differences. |
| E. | Distributions to Shareholders. Distributions to shareholders from net investment income may be declared and paid from the Fund on a quarterly basis. Net realized gains on securities of the Fund normally are declared and paid on an annual basis. Distributions are recorded on the ex-dividend date. |
| F. | Use of Estimates. The preparation of financial statements in conformity with U.S. GAAP requires management to make estimates and assumptions that affect the reported amounts of assets and liabilities at the date of the financial statements, as well as the reported amounts of revenues and expenses during the period. Actual results could differ from those estimates. |
| G. | Share Valuation. The net asset value (“NAV”) per share of the Fund is calculated by dividing the sum of the value of the securities held by the Fund, plus cash and other assets, minus all liabilities (including estimated accrued expenses) by the total number of shares outstanding for the Fund, rounded to the nearest cent. The Fund’s shares will not be priced on the days on which the NYSE is closed for trading. The offering and redemption price per share for the Fund is equal to the Fund’s net asset value per share. |
| H. | Guarantees and Indemnifications. In the normal course of business, the Fund enters into contracts with service providers that contain general indemnification clauses. The Fund’s maximum exposure under these arrangements is unknown as this would involve future claims that may be made against the Fund that have not yet occurred. However, based on experience, the Fund expects the risk of loss to be remote. |
NOTE 3 – RISK FACTORS
Investing in Spirited Funds/ETFMG Whiskey & Spirits ETF may involve certain risks, as discussed in the Fund’s prospectus, including, but not limited to, those described below. Any of these risks could cause an investor to lose money.
Market Risk. Financial markets rise and fall in response to a variety of factors, sometimes rapidly and unpredictably. As with any investment whose performance is tied to these markets, the value of an investment in the Fund will fluctuate, which means that an investor could lose money over short or long periods.
Investment Style Risk. The Fund is not actively managed. Therefore, the Fund follows the securities included in its respective index during upturns as well as downturns. Because of its indexing strategy, the Fund does not take steps to reduce market exposure or to lessen the effects of a declining market. In addition, because of the Fund’s expenses, the Fund’s performance may be below that of its respective index.
17
Spirited Funds/ETFMG Whiskey & Spirits ETF
NOTES TO FINANCIAL STATEMENTS
September 30, 2017 (Continued)
Equity Risk. The prices of equity securities rise and fall daily. These price movements may result from factors affecting individual companies, industries or the securities market as a whole. In addition, equity markets tend to move in cycles which may cause stock prices to fall over short or extended periods of time.
Concentration Risk. To the extent that the Fund or its working index’s portfolio is concentrated in the securities of issuers in a particular market, industry, group of industries, sector or asset class, the Fund may be adversely affected by the performance of those securities, may be subject to increased price volatility and may be more vulnerable to adverse economic, market, political or regulatory occurrences affecting that market, industry, group of industries, sector or asset class.
NOTE 4 – COMMITMENTS AND OTHER RELATED PARTY TRANSACTIONS.
ETF Managers Group, LLC (the “Advisor”), serves as the investment advisor to the Fund. Pursuant to an Investment Advisory Agreement (“Advisory Agreement”) between the Trust, on behalf of the Fund, and the Advisor, the Advisor provides investment advice to the Fund and oversees the day-today operations of the Fund, subject to the direction and control of the Board and the officers of the Trust.
Under the Investment Advisory Agreement with the Fund, the Advisor has overall responsibility for the general management and administration of the Fund and arranges for sub-advisory, transfer agency, custody, fund administration, securities lending, and all other non-distribution related services necessary for the Fund to operate. The Advisor bears the costs of all advisory and non-advisory services required to operate the Fund, in exchange for a single unitary fee. For services provided the Fund pays the Advisor at an annual rate of, previously at 0.75% from October 12, 2016 to May 1, 2017, of the Fund’s average daily net assets. The Advisor has an agreement with, and is dependent on, a third party to pay the Fund’s expenses in excess of 0.60% of the Fund’s average daily net assets. Additionally, under the Investment Advisory Agreement, the Advisor has agreed to pay all expenses of the Fund, except for: the fee paid to the Advisor pursuant to the Investment Advisory Agreement, interest charges on any borrowings, taxes, brokerage commissions and other expenses incurred in placing orders for the purchase and sale of securities and other investment instruments, acquired fund fees and expenses, accrued deferred tax liability, extraordinary expenses, and distribution (12b-1) fees and expenses (collectively, “Excluded Expenses”). The Advisor has entered into an Agreement with with Spirited Funds, LLC (the “Sponsor”), under which the Sponsor agrees to sublicense the use of the Underlying Index to the Advisor. The Sponsor also provides marketing support for the Fund, including distributing marketing materials related to the Fund. Spirited Funds, LLC is a privately held business focused on bringing exchange-traded investment products to investors in the U.S. The Sponsor does not make investment decisions, provide investment advice, or otherwise act in the capacity of an investment adviser to the Fund. Additionally, the Sponsor is not involved in the maintenance of the Underlying Index and does not otherwise act in the capacity of an index provider.
US Bancorp Fund Services, LLC (the “Administrator”) provides fund accounting, fund administration, and transfer agency services to the Fund. The Advisor compensates the Administrator for these services under an administration agreement between the two entities.
The Advisor pays each independent Trustee a quarterly fee for service to the Fund. Each Trustee is also reimbursed by the Advisor for all reasonable out-of-pocket expenses incurred in connection with his duties as Trustee, including travel and related expenses incurred in attending Board meetings.
18
Spirited Funds/ETFMG Whiskey & Spirits ETF
NOTES TO FINANCIAL STATEMENTS
September 30, 2017 (Continued)
NOTE 5 – DISTRIBUTION PLAN
The Fund has adopted a Plan of Distribution pursuant to Rule 12b-1 under the 1940 Act. Under the Plan, the Fund may pay compensation to the Distributor or any other distributor or financial institution with which the Trust has an agreement with respect to the Fund, with the amount of such compensation not to exceed an annual rate of 0.25% of each Fund’s daily average net assets. For the period ended September 30, 2017, the Fund did not incur any 12b-1 expenses.
NOTE 6 – PURCHASES AND SALES OF SECURITIES
The costs of purchases and sales of securities, excluding short-term securities and in-kind transactions, for the period ended September 30, 2017 are as follows:
| Purchases | Sales | |||||||
| Spirited Funds/ETFMG Whiskey & Spirits ETF | $ | 3,034,629 | $ | 5,232,879 | ||||
The costs of purchases and sales of in-kind transactions associated with creations and redemptions for the period ended September 30, 2017 are as follows:
Purchases In-Kind | Sales In-Kind | |||||||
| Spirited Funds/ETFMG Whiskey & Spirits ETF | $ | 8,708,015 | $ | 1,161,099 | ||||
Purchases in-kind are the aggregate of all in-kind purchases and sales in-kind are the aggregate of all proceeds from in-kind sales. Net capital gains or losses resulting from in-kind redemptions are excluded from the Fund’s taxable gains and are not distributed to shareholders.
There were no purchases or sales of U.S. Government obligations for the period ended September 30, 2017.
NOTE 7 – SECURITIES LENDING
The Fund may lend up to 331/3% of the value of the securities in its portfolio to brokers, dealers and financial institutions (but not individuals) under terms of participation in a securities lending program administered by U.S. Bank N.A. (“the Custodian”). The securities lending agreement requires that loans are collateralized at all times in an amount equal to at least 102% of the value of any loaned securities at the time of the loan, plus accrued interest. The Fund receives compensation in the form of fees and earns interest on the cash collateral. The amount of fees depends on a number of factors including the type of security and length of the loan. The Fund continues to receive interest payments or dividends on the securities loaned during the borrowing period. Gain or loss in the fair value of securities loaned that may occur during the term of the loan will be for the account of the Fund. The Fund has the right under the terms of the securities lending agreement to recall the securities from the borrower on demand. The cash collateral is invested by the Custodian in accordance with approved investment guidelines. Those guidelines require the cash collateral to be invested in readily marketable, high quality, short-term obligations; however, such investments are subject to risk of payment delays or default on the part of the issuer or counterparty or otherwise may not generate sufficient interest to support the costs associated with securities lending. The Fund could also experience delays in recovering its securities and possible loss of income or value if the borrower fails to return the borrowed securities, although the Fund is indemnified from this risk by contract with the securities lending agent.
19
Spirited Funds/ETFMG Whiskey & Spirits ETF
NOTES TO FINANCIAL STATEMENTS
September 30, 2017 (Continued)
As of September 30, 2017, the Fund did not have any securities on loan.
Interest income earned on collateral investments (including applicable fees) and recognized by the Fund during the period ended September 30, 2017 aggregated $93.
NOTE 8 – FEDERAL INCOME TAXES
The components of distributable earnings (losses) and cost basis of investments for federal income tax purposes at September 30, 2017 were as follows:
| Cost | Gross Unrealized Appreciation | Gross Unrealized Depreciation | Net Unrealized Appreciation (Depreciation) | |||||||||||||
| Spirited Funds/ETFMG Whiskey & Spirits ETF | $ | 5,603,751 | $ | 460,979 | $ | (208,708 | ) | $ | 252,271 | |||||||
Undistributed Ordinary Income | Undistributed Long-term Gain | Total Distributable Earnings | Other Accumulated (Loss) | Total Accumulated Gain | ||||||||||||||
| Spirited Funds/ETFMG Whiskey & Spirits ETF | $ | 68,487 | $ | — | $ | 68,487 | $ | — | $ | 320,758 | ||||||||
As of September 30, 2017, the Fund had accumulated capital loss carryovers of:
| Capital Loss Carryover | Expires | ||||
| Spirited Funds/ETFMG Whiskey & Spirits ETF | $ | None | Indefinite | ||
Under current tax law, capital and currency losses realized after October 31 of a Fund’s fiscal year may be deferred and treated as occurring on the first business day of the following fiscal year for tax purposes. The following Funds had deferred post-October capital and currency losses, which will be treated as arising on the first business day of the year ended September 30, 2017.
Late Year Ordinary Loss | Post- October Capital Loss | ||||
| Spirited Funds/ETFMG Whiskey & Spirits ETF | $ | None | $ | None | |
U.S. GAAP requires that certain components of net assets relating to permanent differences be reclassified between financial and tax reporting. These reclassifications have no effect on net assets or net asset value per share. For the fiscal year ended September 30, 2017, the following table shows the reclassifications made:
Undistributed Accumulated Net Investment Loss | Accumulated Net Realized Loss | Paid-In Capital | |||||
| Spirited Funds/ETFMG Whiskey & Spirits ETF | $ (10,515) | $ (170,634) | $ 181,149 |
20
Spirited Funds/ETFMG Whiskey & Spirits ETF
NOTES TO FINANCIAL STATEMENTS
September 30, 2017 (Continued)
NOTE 9 – DISTRIBUTIONS TO SHAREHOLDERS
The Fund paid $22,801 from ordinary income during the period ended September 30, 2017.
NOTE 10 – LEGAL MATTERS
The Trust, the trustees of the Trust, the Advisor and certain officers of the Advisor are defendants in an action filed May 2, 2017 in the Superior Court of New Jersey captioned PureShares, LLC d/b/a PureFunds et al. v. ETF Managers Group, LLC et al., Docket No. C-63-17. The PureShares action alleges claims based on disputes arising out of contractual relationships with the Advisor. The action seeks damages in unspecified amounts and injunctive relief based on breach of contract, wrongful termination, and several other theories. At the outset of the litigation, and again a few weeks later, plaintiffs sought temporary injunctive relief. Both motions were denied, and the matter is now proceeding through pretrial discovery. The defendants believe the lawsuit is without merit and intend to vigorously defend themselves against the allegations.
The Adviser, its parent, Exchange Traded Managers Group, LLC and its chief executive officer are defendants in a case filed on October 26, 2017 in the United States District Court for the Southern District of New York by NASDAQ, Inc. captioned Nasdaq, Inc. v. Exchange Traded Managers Group, LLC et al., Case 1:17-cv-08252. This action arises out of related facts and circumstances in the New Jersey litigation and asserts claims for breach of contract, wrongful termination and certain other theories with respect to the same exchange traded Fund discussed above. The defendants in the Southern District actions believe the lawsuit is without merit and intend to vigorously defend themselves against the allegations and to assert counterclaims against NASDAQ for breaches of its duties under the related index license agreement and various other agreements.
Management of the Trust and the Fund, after consultation with legal counsel, believes that the resolution of these matters will not have a material adverse effect on the Fund’s financial statements.
NOTE 11 – SUBSEQUENT EVENTS
In preparing these financial statements, the Fund has evaluated events and transactions for potential recognition or disclosure through the date the financial statements were issued. See Note 10.
21
Spirited Funds/ETFMG Whiskey & Spirits ETF
To the Board of Trustees of ETF Managers Trust
and the Shareholders of the Spirited Funds/ETFMG Whiskey & Spirits ETF:
We have audited the accompanying statement of assets and liabilities, including the schedule of investments, of the Spirited Funds/ETFMG Whiskey & Spirits ETF (the “Fund”)( a series of ETF Managers Trust), as of September 30, 2017, and the related statement of operations, statement of changes in net assets and financial highlights for the period from October 11, 2016 (commencement of operations) to September 30, 2017. These financial statements and financial highlights are the responsibility of the Fund’s management. Our responsibility is to express an opinion on these financial statements and financial highlights based on our audit.
We conducted our audit in accordance with the standards of the Public Company Accounting Oversight Board (United States). Those standards require that we plan and perform the audit to obtain reasonable assurance about whether the financial statements and financial highlights are free of material misstatement. The Fund is not required to have, nor were we engaged to perform, an audit of its internal control over financial reporting. Our audit included consideration of internal control over financial reporting as a basis for designing audit procedures that are appropriate in the circumstances, but not for the purpose of expressing an opinion on the effectiveness of the Fund’s internal control over financial reporting. Accordingly, we express no such opinion. An audit includes examining, on a test basis, evidence supporting the amounts and disclosures in the financial statements. Our procedures included confirmation of securities owned as of September 30, 2017 by correspondence with the custodian. An audit also includes assessing the accounting principles used and significant estimates made by management, as well as evaluating the overall financial statement presentation. We believe that our audit provides a reasonable basis for our opinion.
In our opinion, the financial statements and financial highlights referred to above present fairly, in all material respects, the financial position of the Spirited Funds/ETFMG Whiskey & Spirits ETF series of ETF Managers Trust as of September 30, 2017, and the results of its operations, changes in its net assets and its financial highlights for the period from October 11, 2016 (commencement of operations) to September 30, 2017, in conformity with accounting principles generally accepted in the United States of America.
/s/WithumSmith+Brown, PC
New York, NY
November 29, 2017
November 29, 2017
22
Spirited Funds/ETFMG Whiskey & Spirits ETF
Spirited Funds/ETFMG Whiskey & Spirits ETF Closing Price vs. NAV
The following Frequency Distribution of Premiums and Discounts chart is provided to show the frequency at which the closing price of the Fund is at a premium or discount to its daily net asset value (NAV). The chart presented represents past performance and cannot be used to predict future results.
| Spirited Funds/ETFMG Whiskey & Spirits ETF | October 11, 2016* through September 30, 2017 | |||||||
| Premium/Discount Range | Number of Days | Percentage of Total Days | ||||||
| Greater than 1.00% | 58 | 23.7 | ||||||
| Greater Than or equal to 0.75% And Less Than 1.00% | 29 | 11.9 | ||||||
| Greater Than or Equal to 0.50% And Less Than 0.75% | 55 | 22.5 | ||||||
| Greater Than or Equal to 0.25% And Less Than 0.50% | 52 | 21.2 | ||||||
| Greater Than or Equal to 0.00% And Less Than 0.25% | 30 | 12.2 | ||||||
| Less Than or Equal to 0.0% And Greater Than -0.25% | 13 | 5.3 | ||||||
| Less Than or Equal to -0.25% And Greater Than -0.50% | 3 | 1.2 | ||||||
| Less Than or Equal to -0.50% And Greater Than -0.75% | 3 | 1.2 | ||||||
| Less Than or Equal to -0.75% And Greater Than -1.00% | 1 | 0.4 | ||||||
| Less than -1.00% | 1 | 0.4 | ||||||
*First day of secondary market trading
23
Spirited Funds/ETFMG Whiskey & Spirits ETF
For the Period Ended September 30, 2017 (Unaudited)
As a shareholder of Spirited Funds/ETFMG Whiskey & Spirits ETF (the “Fund”) you incur two types of costs: (1) transaction costs, including brokerage commissions on purchases and sales of Fund shares, and (2) ongoing costs, including management fees and other Fund expenses. These examples are intended to help you understand your ongoing costs (in dollars) of investing in the Fund and to compare these costs with the ongoing costs of investing in other funds. The example is based on an investment of $1,000 invested at the beginning of the period and held for the entire period (September 30, 2017).
Actual Expenses
The first line of the table provides information about actual account values based on actual returns and actual expenses. You may use the information in this line, together with the amount you invested, to estimate the expenses that you paid over the period. Simply divide your account value by $1,000 (for example, an $8,600 account value divided by $1,000 = 8.6), then, multiply the result by the number in the first line under the heading entitled “Expenses Paid During Period” to estimate the expenses you paid on your account during this period.
Hypothetical Example for Comparison Purposes
The second line of the table provides information about hypothetical account values based on a hypothetical return and hypothetical expenses based on the Fund’s actual expense ratio and an assumed rate of return of 5% per year before expenses, which is not the Fund’s actual return. The hypothetical account values and expenses may not be used to estimate the actual ending account balance or expenses you paid for the period. You may use this information to compare the ongoing costs of investing in the Fund and other funds. To do so, compare this 5% hypothetical example with the 5% hypothetical examples that appear in the shareholder reports of the other funds. Please note that the expenses shown in the table are meant to highlight your ongoing costs only and do not reflect any transactional costs, such as brokerage commissions paid on purchases and sales of Fund shares. Therefore, the second line of the table is useful in comparing ongoing costs only and will not help you determine the relative total costs of owning different funds. If these transactional costs were included, your costs would have been higher.
Spirited Funds/ETFMG Whiskey & Spirits ETF
Beginning Account Value | Ending Account Value September 30, 2017 | Expenses Paid During the Period^ | ||||
| Actual | $1,000.00 | $1,124.20 | $3.99 | |||
| Hypothetical (5% annual) | $1,000.00 | $1,021.31 | $3.80 |
^ The dollar amounts shown as expenses paid during the period are equal to the annualized six-month expense ratio multiplied by the average account value during the period, multiplied by 183/365 (to reflect the one-half year period from April 1, 2017 to September 30, 2017).
24
Spirited Funds/ETFMG Whiskey & Spirits ETF
Set forth below are the names, birth years, positions with the Trust, length of term of office, and the principal occupations and other directorships held during at least the last five years of each of the persons currently serving as a Trustee of the Trust, as well as information about each officer. The business address of each Trustee and officer is 30 Maple Street, Summit, New Jersey 07901.
Name and Year of Birth | Position(s) Held with the Trust, Term of Office and Length of Time Served | Principal Occupation(s) During Past 5 Years | Number of Portfolios in Fund Complex Overseen By Trustee | Other Directorships Held by Trustee During Past 5 Years |
| Interested Trustee* and Officers | ||||
| Samuel Masucci, III (1962) | Trustee, Chairman of the Board and President (since 2012); Secretary (since 2014) | Chief Executive Officer, Exchange Traded Managers Group, LLC (since 2013); Chief Executive Officer and Chief Compliance Officer, Factor Advisors, LLC (since 2012); President and Chief Executive Officer, Factor Capital Management LLC (since 2012); President and Chief Executive Officer, GENCAP Ventures, LLC (holding company) (2012–2013); Chief Executive Officer, MacroMarkets LLC (exchange traded funds) (2005–2011); President, Chief Executive and Chief Compliance Officer, Macro Financial (financial services) (2005–2011). | 9 | None |
| Reshma J. Amin (1978) | Chief Compliance Officer (since 2016) | Chief Compliance Officer, Exchange Traded Managers Group, LLC (since 2016); Partner, Crow & Cushing (2007–2016). | n/a | n/a |
| John A. Flanagan (1946) | Treasurer (since 2015) | President, John A. Flanagan CPA, LLC (accounting services) (since 2010); Chief Financial Officer, Exchange Traded Managers Group, LLC (since 2015); Principal Financial Officer, ETF Managers Capital, LLC (commodity pool operator) (since 2014); Chief Financial Officer, Macromarkets LLC (exchange traded funds) (2007–2010) | n/a | n/a |
* Mr. Masucci is an interested Trustee by virtue of his role as the Chief Executive Officer of the Adviser.
25
Spirited Funds/ETFMG Whiskey & Spirits ETF
Board of Trustees (Cont’d)
Name and Year of Birth | Position(s) Held with the Trust, Term of Office and Length of Time Served | Principal Occupation(s) During Past 5 Years | Number of Portfolios in Fund Complex Overseen By Trustee | Other Directorships Held by Trustee During Past 5 Years |
| Independent Trustees | ||||
| John W. Southard (1969) | Trustee (since 2012) | Director and Co-Founder, T2 Capital Management, 2010 to present; Co-Founder and Head of Research and Trading, PowerShares Capital Management, 2002 to 2009. | 9 | None |
| Terry Loebs (1963) | Trustee (since 2014) | Founder and Managing Member, Pulsenomics LLC (index product development and consulting firm) (since 2011); Managing Director, MacroMarkets, LLC (exchange-traded products firm) (2006–2011). | 9 | None |
26
Spirited Funds/ETFMG Whiskey & Spirits ETF
(Unaudited)
During the year ended September 30, 2017, the Funds did not declare any long-term realized gains distributions.
Qualified Dividend Income/Dividends Received Deduction
For the fiscal year ended September 30, 2017, certain dividends paid by the Fund may be subject to a maximum tax rate of 15%, as provided for by the Jobs and Growth Tax Reconciliation Act of 2003. The percentage of dividends declared from ordinary income designated as qualified dividend income was as follows:
| Fund Name | QDI |
| Spirited Funds/ETFMG Whiskey & Spirits ETF | 69.77% |
For corporate shareholders, the percent of ordinary income distributions qualifying for the corporate dividends received deduction for the fiscal year ended September 30, 2017 was as follows:
| Fund Name | DRD |
| Spirited Funds/ETFMG Whiskey & Spirits ETF | 8.45% |
Pursuant to Section 853 of the Internal Revenue Code the Fund designated the following amounts as foreign taxes paid for the year ended September 30, 2017. Foreign taxes paid for purposes of Section 853 may be less than actual foreign taxes paid for financial statement purposes.
| Fund | Gross Foreign Source Income | Foreign Taxes Passthrough | Gross Foreign Source Income | Foreign Taxes Passthrough | Shares Outstanding at 9/30/17 | |||||
| Spirited Funds/ETFMG Whiskey & Spirits ETF | 59,554 | 3,044 | 0.29777015 | 0.01521800 | 200.0 |
27
Spirited Funds/ETFMG Whiskey & Spirits ETF
SUPPLEMENTARY INFORMATION
September 30, 2017 (continued)
(Unaudited)
The Fund files a Form N-Q with the Securities and Exchange Commission (the ‘‘SEC’’) no more than sixty days after the Fund’s first and third fiscal quarters. For the Fund, this would be for the fiscal quarters ending June 30 and December 31. Form N-Q includes a complete schedule of the Funds’ portfolio holdings as of the end of those fiscal quarters. The Fund’s N-Q filings can be found free of charge on the SEC’s website at http://www.sec.gov, or they may be reviewed and copied at the SEC’s Public Reference Room in Washington, D.C. (call 800-SEC-0330 for information on the operation of the Public Reference Room). The Fund’s portfolio holdings are posted on the Fund’s website at www.spiritedfunds.com daily.
(Unaudited)
A description of the policies and procedures the Fund uses to determine how to vote proxies relating to portfolio securities is provided in the Statement of Additional Information (“SAI”). The SAI is available without charge upon request by calling toll-free at 1-844-ETF-MGRS (1-844-383-6477), by accessing the SEC’s website at www.sec.gov, or by accessing the Fund’s website at www.spiritedfunds.com.
Information regarding how the Fund voted proxies relating to portfolio securities during the period ending June 30 is available by calling toll-free at 1-844-ETF-MGRS (1-844-383-6477) or by accessing the SEC’s website at www.sec.gov.
Carefully consider the Fund’s investment objectives, risk factors, charges, and expenses before investing. This and additional information can be found in the Fund’s prospectus, which may be obtained by calling 1-844-ETF-MGRS (1-844-383-6477) or by visiting www.spiritedfunds.com. Read the prospectus carefully before investing.
28
Spirited Funds/ETFMG Whiskey & Spirits ETF
ETF MANAGERS TRUST
ETF Managers Trust, (the “Trust”) has adopted the following privacy policies in order to safeguard the personal information of the Trust’s customers and consumers in accordance with Regulation S-P as promulgated by the U.S. Securities and Exchange Commission.
Trust officers are responsible for ensuring that the following policies and procedures are implemented:
| 1) | The Trust is committed to protecting the confidentiality and security of the information they collect and will handle personal customer and consumer information only in accordance with Regulation S-P and any other applicable laws, rules and regulations1. The Trust will ensure: (a) the security and confidentiality of customer records and information; (b) that customer records and information are protected from any anticipated threats and hazards; and (c) that customer records and information are protected from unauthorized access or use. |
| 2) | The Trust conducts its business affairs through its trustees, officers and third parties that provide services pursuant to agreements with the Trust. The Trust has no employees. It is anticipated that the trustees and officers of the Trust who are not employees of service providers of the Trust will not have access to customer records and information in the performance of their normal responsibilities for the Trust. |
| 3) | The Trust may share customer information with its affiliates, subject to the customers’ right to prohibit such sharing. |
| 4) | The Trust may share customer information with unaffiliated third parties only in accordance with the requirements of Regulation S-P. Pursuant to this policy, the Trust will not share customer information with unaffiliated third parties other than as permitted by law, unless authorized to do so by the customer. |
Consistent with these policies, the Trust has adopted the following procedures:
| 1) | The Trust will determine that the policies and procedures of its affiliates and Service Providers are reasonably designed to safeguard customer information and only permit appropriate and authorized access to and use of customer information through the application of appropriate administrative, technical and physical protections. |
| 2) | The Trust will direct each of its Service Providers to adhere to the privacy policy of the Trust and to its privacy policies with respect to all customer information of the Trust and to take all actions reasonably necessary so that the Trust is in compliance with the provisions of Regulation S-P, including, as applicable, the development and delivery of privacy notices and the maintenance of appropriate and adequate records. |
| 3) | The Trust requires its Service Providers to provide periodic reports to the Trust’s Board of Trustees outlining their privacy policies and the implementation of such policies. Each Service Provider is required to promptly report to the Trust’s Board any material changes to its privacy policy before, or promptly after, the adoption of such changes. |
1 Generally, the Funds have institutional clients which are not considered “customers” for purposes of regulation S-P.
29
Advisor
ETF Managers Group, LLC
30 Maple Street, Suite 2, Summit, NJ 07901
Distributor
ETFMG Financial, Inc.
30 Maple Street, Suite 2, Summit, NJ 07901
Custodian
U.S. Bank National Association
Custody Operations
1555 North River Center Drive, Suite 302, Milwaukee, Wisconsin 53212
Transfer Agent
U.S. Bancorp Fund Services, LLC
615 East Michigan Street, Milwaukee, Wisconsin 53202
Securities Lending Agent
U.S Bank, National Association
Securities Lending
800 Nicolet Mall
Minneapolis, MN 55402-7020
Independent Registered Public Accounting Firm
WithumSmith + Brown, PC
1411 Broadway, 9th Floor, New York, NY 10018
Legal Counsel
Sullivan & Worcester LLP
1666 K Street NW, Washington, DC 20006
Item 2. Code of Ethics.
The registrant has adopted a code of ethics that applies to the registrant’s principal executive officer and principal financial officer. The registrant has not made any amendments to its code of ethics during the period covered by this report. The registrant has not granted any waivers from any provisions of the code of ethics during the period covered by this report.
A copy of the registrant’s Code of Ethics is filed herewith.
Item 3. Audit Committee Financial Expert.
The Board believes that the collective knowledge and experience of the members of the audit committee enable the committee to provide appropriate oversight given the Trust’s level of financial complexity. In addition, the Board notes that the audit committee has the authority to retain any experts necessary to carry out its duties.
Item 4. Principal Accountant Fees and Services.
The registrant has engaged its principal accountant to perform audit services, audit-related services, tax services and other services during the past fiscal year. “Audit services” refer to performing an audit of the registrant’s annual financial statements or services that are normally provided by the accountant in connection with statutory and regulatory filings or engagements for those fiscal years. “Audit-related services” refer to the assurance and related services by the principal accountant that are reasonably related to the performance of the audit. “Tax services” refer to professional services rendered by the principal accountant for tax compliance, tax advice, and tax planning. There were no “Other services” provided by the principal accountant. The following table details the aggregate fees billed or expected to be billed for the last fiscal year for audit fees, audit-related fees, tax fees and other fees by the principal accountant.
| FYE 9/30/2017 | FYE 9/30/2016 | |
| Audit Fees | $194,500 | $218,000 |
| Audit-Related Fees | N/A | N/A |
| Tax Fees | $32,500 | $30,000 |
| All Other Fees | N/A | N/A |
The audit committee has adopted pre-approval policies and procedures that require the audit committee to pre‑approve all audit and non‑audit services of the registrant, including services provided to any entity affiliated with the registrant.
The percentage of fees billed by WithumSmith+Brown, PC applicable to non-audit services pursuant to waiver of pre-approval requirement were as follows:
| FYE 9/30/2017 | FYE 9/30/2016 | |
| Audit-Related Fees | 0% | 0% |
| Tax Fees | 0% | 0% |
| All Other Fees | 0% | 0% |
All of the principal accountant’s hours spent on auditing the registrant’s financial statements were attributed to work performed by full‑time permanent employees of the principal accountant. The following table indicates the non-audit fees billed or expected to be billed by the registrant’s accountant for services to the registrant and to the registrant’s investment adviser (and any other controlling entity, etc.—not sub-adviser) for the past year. The audit committee of the board of trustees/directors has considered whether the provision of non-audit services that were rendered to the registrant’s investment adviser is compatible with maintaining the principal accountant’s independence and has concluded that the provision of such non-audit services by the accountant has not compromised the accountant’s independence.
| Non-Audit Related Fees | FYE 9/30/2017 | FYE 9/30/2016 |
| Registrant | N/A | N/A |
| Registrant’s Investment Adviser | N/A | N/A |
Item 5. Audit Committee of Listed Registrants.
Not applicable to registrants who are not listed issuers (as defined in Rule 10A-3 under the Securities Exchange Act of 1934).
Item 6. Investments.
Schedule of Investments is included as part of the report to shareholders filed under Item 1 of this Form.
Item 7. Disclosure of Proxy Voting Policies and Procedures for Closed-End Management Investment Companies.
Not applicable to open-end investment companies.
Item 8. Portfolio Managers of Closed-End Management Investment Companies.
Not applicable to open-end investment companies.
Item 9. Purchases of Equity Securities by Closed‑End Management Investment Company and Affiliated Purchasers.
Not applicable to open-end investment companies.
Item 10. Submission of Matters to a Vote of Security Holders.
There have been no material changes to the procedures by which shareholders may recommend nominees to the registrant’s board of trustees.
Item 11. Controls and Procedures.
| (a) | The Registrant’s Principal Executive Officer and Principal Financial Officer/Treasurer have reviewed the Registrant’s disclosure controls and procedures (as defined in Rule 30a-3(c) under the Investment Company Act of 1940 (the “Act”)) as of a date within 90 days of the filing of this report, as required by Rule 30a-3(b) under the Act and Rules 13a-15(b) or 15d‑15(b) under the Securities Exchange Act of 1934. Based on their review, such officers have concluded that the disclosure controls and procedures are effective in ensuring that information required to be disclosed in this report is appropriately recorded, processed, summarized and reported and made known to them by others within the Registrant and by the Registrant’s service provider. |
| (b) | There were no changes in the Registrant’s internal control over financial reporting (as defined in Rule 30a-3(d) under the Act) that occurred during the second fiscal quarter of the period covered by this report that has materially affected, or is reasonably likely to materially affect, the Registrant’s internal control over financial reporting. |
Item 12. Exhibits.
| (a) | (1) Any code of ethics or amendment thereto, that is the subject of the disclosure required by Item 2, to the extent that the registrant intends to satisfy Item 2 requirements through filing an exhibit. Filed herewith. |
(2) A separate certification for each principal executive and Treasurer pursuant to Section 302 of the Sarbanes-Oxley Act of 2002. Filed herewith.
(3) Any written solicitation to purchase securities under Rule 23c‑1 under the Act sent or given during the period covered by the report by or on behalf of the registrant to 10 or more persons. Not applicable to open-end investment companies.
| (b) | Certifications pursuant to Section 906 of the Sarbanes‑Oxley Act of 2002. Furnished herewith. |
SIGNATURES
Pursuant to the requirements of the Securities Exchange Act of 1934 and the Investment Company Act of 1940, the registrant has duly caused this report to be signed on its behalf by the undersigned, thereunto duly authorized.
(Registrant) ETF Managers Trust
By (Signature and Title /s/ Samuel Masucci III
Samuel Masucci III, Principal Executive Officer
Date December 7, 2017
Pursuant to the requirements of the Securities Exchange Act of 1934 and the Investment Company Act of 1940, this report has been signed below by the following persons on behalf of the registrant and in the capacities and on the dates indicated.
By (Signature and Title)* /s/ Samuel Masucci III
Samuel Masucci III, Principal Executive Officer
Date December 7, 2017
By (Signature and Title)* /s/ John Flanagan
John Flanagan, Principal Financial Officer/Treasurer
Date December 7, 2017
* Print the name and title of each signing officer under his or her signature.