UNITED STATES
SECURITIES AND EXCHANGE COMMISSION
Washington, D.C. 20549
FORM N-CSR
CERTIFIED SHAREHOLDER REPORT OF REGISTERED
MANAGEMENT INVESTMENT COMPANIES
Investment Company Act file number 811-22338
Legg Mason Global Asset Management Trust
(Exact name of registrant as specified in charter)
620 Eighth Avenue, 49th Floor, New York, NY 10018
(Address of principal executive offices) (Zip code)
Robert I. Frenkel, Esq.
Legg Mason & Co., LLC
100 First Stamford Place
Stamford, CT 06902
(Name and address of agent for service)
Registrant’s telephone number, including area code: 1-877-721-1926
Date of fiscal year end: October 31
Date of reporting period: October 31, 2015
| ITEM 1. | REPORT TO STOCKHOLDERS |
The Annual Report to Stockholders is filed herewith.

| | |
| Annual Report | | October 31, 2015 |
CLEARBRIDGE
GLOBAL GROWTH TRUST

|
| INVESTMENT PRODUCTS: NOT FDIC INSURED • NO BANK GUARANTEE • MAY LOSE VALUE |
Fund objective
The Fund seeks long-term growth of capital.
Letter from the president

Dear Shareholder,
We are pleased to provide the annual report of ClearBridge Global Growth Trust for the twelve-month reporting period ended October 31, 2015. Please read on for a detailed look at prevailing economic and market conditions during the Fund’s reporting period and to learn how those conditions have affected Fund performance.
Special shareholder notice
On October 15, 2015, the Board of Trustees approved changes to the Fund’s principal investment strategy, name, benchmark and other related changes. Effective December 31, 2015, the Fund will adopt a new investment strategy. The Fund’s current global growth strategy will be replaced with an international growth strategy. The Fund currently invests primarily in common stocks of U.S. and foreign companies. Pursuant to the new international growth strategy, the Fund will normally invest primarily in common stocks of foreign companies. However, the Fund is not precluded from purchasing stocks of U.S. companies. In addition, at this time, the Fund’s name will change to ClearBridge International Growth Fund, and the Fund’s benchmark will change from the MSCI All Country World Index to the MSCI EAFE (Europe, Australia, Far East) Index. The benchmark change is consistent with the Fund’s name and investment strategy changes as described above. The Fund’s investment objective remains unchanged.
Effective December 31, 2015, Elisa Mazen, Michael Testorf, CFA, Pawel Wroblewski, CFA and Thor Olsson are the portfolio managers responsible for the day-to-day management of the Fund. Ms. Mazen and Mr. Testorf are Managing Directors and Portfolio Managers at ClearBridge Investments, and have been responsible for the day-to-day portfolio management of the Fund since 2013 and since October 2015, respectively. Mr. Wroblewski and Mr. Olsson are Directors and Portfolio Managers at ClearBridge Investments, and have been engaged in the day-to-day portfolio management of the Fund since
| | |
| II | | ClearBridge Global Growth Trust |
December 2015. ClearBridge Investments consists of ClearBridge Investments, LLC and ClearBridge, LLC. For additional information, please see the prospectus supplements dated October 16, 2015 and December 1, 2015.
As always, we remain committed to providing you with excellent service and a full spectrum of investment choices. We also remain committed to supplementing the support you receive from your financial advisor. One way we accomplish this is through our website, www.leggmason.com/individualinvestors. Here you can gain immediate access to market and investment information, including:
| • | | Fund prices and performance, |
| • | | Market insights and commentaries from our portfolio managers, and |
| • | | A host of educational resources. |
We look forward to helping you meet your financial goals.
Sincerely,

Jane Trust, CFA
President and Chief Executive Officer
December 7, 2015
| | |
| ClearBridge Global Growth Trust | | III |
Investment commentary
Economic review
The pace of U.S. economic activity was mixed during the twelve months ended October 31, 2015 (the “reporting period”). Looking back, the U.S. Department of Commerce’s revised figures showed that fourth quarter 2014 U.S. gross domestic product (“GDP”)i growth was 2.1%. First quarter 2015 GDP growth then moderated to 0.6%. This was attributed to a number of factors, including a deceleration in personal consumption expenditures (“PCE”), along with negative contributions from exports, nonresidential fixed investment, and state and local government spending. Economic activity then accelerated, as second quarter 2015 GDP growth was 3.9%. The upturn was driven by increasing exports, accelerating PCE, declining imports, expanding state and local government spending, and rising nonresidential fixed investment. The U.S. Department of Commerce’s second reading for third quarter 2015 GDP growth — released after the reporting period ended — was 2.1%. Decelerating growth was primarily due to a downturn in private inventory investment and decelerations in exports, PCE, nonresidential fixed investment, state and local government spending, and residential fixed investment.
The labor market significantly improved and was a tailwind for the economy during the reporting period. When the period began, unemployment was 5.8%, as reported by the U.S. Department of Labor. By October 2015, unemployment was 5.0%, its lowest level since April 2008.
Turning to the global economy, in its October 2015 World Economic Outlook Update, the International Monetary Fund (“IMF”) said “Prospects across the main countries and regions remain uneven. Relative to last year, the recovery in advanced economies is expected to pick up slightly, while activity in emerging market and developing economies is projected to slow for the fifth year in a row, primarily reflecting weaker prospects for some large emerging market economies and oil-exporting countries.” From a regional perspective, the IMF projects that 2015 growth in the Eurozone will be 1.5%, versus 0.9% in 2014. Japan’s economy is expected to expand 0.6% in 2015, compared to a contraction of -0.1% in 2014. Elsewhere, the IMF said that overall growth in emerging market countries will decelerate in 2015, with growth of 4.0% versus 4.6% in 2014.
The Federal Reserve Board (“Fed”)ii took a number of actions as it sought to meet its dual mandate of fostering maximum employment and price stability. As it has since December 2008, the Fed maintained the federal funds rateiii at a historically low range between zero and 0.25% during the twelve months ended October 31, 2015. However, in October 2014 the Fed ended its asset purchase program that was announced in December 2012. In December 2014, the Fed said that “…it can be patient in beginning to normalize the stance of monetary policy.” At its meeting that concluded on July 29, 2015, the Fed said, “The Committee currently anticipates that, even after employment and inflation are near mandate-consistent levels, economic conditions may, for some time, warrant keeping the target federal funds rate below levels the Committee views as normal in the longer run.” At its meeting that concluded on October 28, 2015, the Fed said, “In determining whether it will be appropriate to raise the target range at its next meeting,
| | |
| IV | | ClearBridge Global Growth Trust |
the Committee will assess progress — both realized and expected — toward its objectives of maximum employment and 2 percent inflation.”
Given the economic challenges in the Eurozone, the European Central Bank (“ECB”)iv took a number of actions to stimulate growth and ward off deflation. The ECB reduced rates in June and September 2014, prior to the reporting period. Then, in January 2015 the ECB announced that, beginning in March 2015, it would start a €60 billion-a-month bond buying program that is expected to run until September 2016. In other developed countries, the Bank of England kept rates on hold at 0.50% during the reporting period, as did Japan at a range of zero to 0.10%, its lowest level since 2006. At the end of October 2014, the Bank of Japan announced that it would increase its asset purchases between 10 trillion yen and 20 trillion yen ($90.7 billion to $181.3 billion) to approximately 80 trillion yen ($725 billion) annually, in an attempt to stimulate growth. Elsewhere, after holding rates steady at 6.0% since July 2012, the People’s Bank of China lowered rates six times from November 23, 2014 through the end of the reporting period. The last reduction on October 23, 2015 pushed the rate down to 4.35%.
As always, thank you for your confidence in our stewardship of your assets.
Sincerely,
Jane Trust, CFA
President and Chief Executive Officer
December 7, 2015
All investments are subject to risk including the possible loss of principal. Past performance is no guarantee of future results. Forecasts and predictions are inherently limited and should not be relied upon as an indication of actual or future performance.
| i | Gross domestic product (“GDP”) is the market value of all final goods and services produced within a country in a given period of time. |
| ii | The Federal Reserve Board (“Fed”) is responsible for the formulation of U.S. policies designed to promote economic growth, full employment, stable prices and a sustainable pattern of international trade and payments. |
| iii | The federal funds rate is the rate charged by one depository institution on an overnight sale of immediately available funds (balances at the Federal Reserve) to another depository institution; the rate may vary from depository institution to depository institution and from day to day. |
| iv | The European Central Bank (“ECB”) is responsible for the monetary system of the European Union and the euro currency. |
| | |
| ClearBridge Global Growth Trust | | V |
Fund overview
Q. What is the Fund’s investment strategy?
A. The Fund seeks to provide long-term growth of capital. The Fund normally invests primarily in common stocks of U.S. and foreign companies that, in our opinion, appear to offer above average growth potential and trade at a significant discount to the portfolio managers’ assessment of their intrinsic value. The Fund may invest in companies of any size located throughout the world, including companies located, or with substantial operations in, emerging markets.
Effective December 31, 2015, the Fund will adopt a new investment strategy. The Fund’s current global growth strategy will be replaced with an international growth strategy. The Fund will normally invest primarily in common stocks of foreign companies that, in our opinion, appear to offer above average growth potential and trade at a significant discount to our assessment of their intrinsic value. The Fund may invest in common stocks of foreign companies of any size located throughout the world. These foreign companies may be located, or have substantial operations, in emerging markets, provided that the Fund will not invest more than 10% of its net assets, at the time of purchase, in securities of companies domiciled in emerging markets. However, the Fund is not precluded from purchasing stocks of U.S. companies.
Q. What were the overall market conditions during the Fund’s reporting period?
A. During the twelve-month reporting period ended October 31, 2015, international markets were mostly lower, with Japan delivering strong gains, developed markets in Europe straddling breakeven and Asian and emerging markets suffering steep losses. Quantitative easing from central banks continued to support growth across Europe but was not as successful in Japan and China. The surprise move by China to devalue its currency in August exacerbated global growth concerns, sparking a sharp sell-off in global equities and a spike in volatility. Markets partially recovered at the end of the reporting period on the promise of more stimulus from central banks in China and the Eurozone.
Economic weakness across markets and declining commodity prices led to equity losses during the fourth quarter of 2014. Europe endured losses due to softness across many of its economies while the United Kingdom (“UK”) and most of Asia and emerging markets suffered from their exposure to commodities and weak global demand. Japan also struggled due to a loss of confidence in the ability of its financial policies, dubbed Abenomics, to spur growth.
Equity returns improved during the first quarter of 2015, led by healthy reaction to stimulus measures. Japanese equities rallied as a new focus on corporate governance continued to drive up returns on capital, earnings and dividends. European stocks were boosted by the start of a massive bond buying program by the European Central Bank (“ECB”)i and growing signs of economic improvement that were boosted by falling interest rates and a weakening euro. In China, moves by the central bank to stabilize the slowing rate of growth paid off in equity gains.
Stocks continued to enjoy positive momentum for most of the second quarter of 2015, but gave back most of their progress
| | |
| ClearBridge Global Growth Trust 2015 Annual Report | | 1 |
Fund overview (cont’d)
in late June as the Greek debt crisis flared up again. The possibility of Greece leaving the Eurozone hurt German stocks most tied to a possible bailout, while other Eurozone countries held up better. The largest Asian markets also managed gains. Any remaining positive price trends were wiped out during the China-induced sell-off in the third quarter. The fallout from China’s decision to devalue its currency exacerbated global growth concerns, hitting commodity and materials-related sectors and emerging markets especially hard. Europe held up better than Japan and Asia during the downdraft, supported by improvements in economic growth, bank lending and consumer spending. Another performance driver, both in Europe and the U.S., has been robust mergers and acquisitions activity as larger companies in the Health Care, Information Technology (“IT”) and other sectors have been putting their cash to work to buy growth.
Q. How did we respond to these changing market conditions?
A. Disruption of business models is occurring everywhere, across sectors and geographies, and, in our view, will provide a long-term source of growth for companies leading change. We are already seeing this in e-commerce where Fund holding, Amazon.com, has become the world’s largest retailer, surpassing traditional brick and mortar merchants. E-commerce has grown from 5% to 13% of retail sales in the UK over the last several years and is expected to grow at even faster rates in markets like China that never developed a traditional store-based retail infrastructure. We believe this setup should benefit companies like top holding Alibaba. We are also seeing disruption in gene therapy and other breakthrough research techniques in the Health Care sector that are allowing companies like Vertex Pharmaceuticals to develop new treatments for existing conditions like cystic fibrosis and BioMarin Pharmaceuticals to target rare diseases.
The Fund is also targeting disruption in sectors not traditionally known for innovation. We established a new position in London Stock Exchange Group plc in the Financials sector that is evolving from a transaction-based exchange into a provider and licenser of index data for ETFs and other investment customers. Low-cost airline Ryanair is taking share from Europe’s flag carriers through strong execution and by flying into smaller airports where it can turn its planes faster and at lower costs.
As long-term investors, we prefer to stick with our highest conviction names and count on the strength of their businesses to carry us through short-term difficulties such as the August market correction. Given our expectations for a subdued growth environment, however, we did make several moves during the year to upgrade the quality of the Fund’s portfolio. We sold stocks whose risk profile had increased including food suppliers Amira Nature Foods Ltd. and Aryzta AG, where questionable allocation decisions caused us to lose confidence in the stocks; as well as exploration & production company California Resources Corp., which took on more debt in a cyclical downturn for commodity prices. We also reduced our positions in diamond stocks including Petra Diamonds Ltd. as the industry is experiencing financing issues and supply chain disruptions, as well as selectively took profits in the Health Care sector.
| | |
| 2 | | ClearBridge Global Growth Trust 2015 Annual Report |
We made few changes to our regional allocations, which are a byproduct of bottom-up stock selection. We continue to overweight the United States as it continues to produce the world’s most consistent growth, and underweight emerging markets, which have been punished by commodity weakness. The Fund is also underweight Europe but we are encouraged that reforms are taking hold and producing growth in Ireland, Spain and Italy and to a lesser extent, France. We continue to like Japan, which is benefiting from a corporate focus on profitability and return on equity and is starting to consolidate away weaker companies.
Performance review
For the twelve months ended October 31, 2015, Class C shares of ClearBridge Global Growth Trust, excluding sales charges, returned -0.16%. The Fund’s unmanaged benchmark, the MSCI All Country World Index (MSCI ACWI)ii, returned -0.03% for the same period. The Lipper Global Multi-Cap Growth Funds Category Average1 returned 2.19% over the same time frame.
| | | | | | | | |
Performance Snapshot as of October 31, 2015
(unaudited) | |
| (excluding sales charges) | | 6 months† | | | 12 months‡ | |
| ClearBridge Global Growth Trust: | | | | | | | | |
Class A | | | -5.53 | % | | | 0.61 | % |
Class C | | | -5.92 | % | | | -0.16 | % |
Class FI | | | -5.53 | % | | | 0.62 | % |
Class R | | | -5.69 | % | | | 0.33 | % |
Class I | | | -5.41 | % | | | 0.86 | % |
| MSCI All Country World Index (MSCI ACWI) | | | -4.77 | % | | | -0.03 | % |
| Lipper Global Multi-Cap Growth Funds Category Average1 | | | -3.12 | % | | | 2.19 | % |
The performance shown represents past performance. Past performance is no guarantee of future results and current performance may be higher or lower than the performance shown above. Principal value and investment returns will fluctuate and investors’ shares, when redeemed, may be worth more or less than their original cost. To obtain performance data current to the most recent month-end, please visit our website at www.leggmason.com/individualinvestors.
All share class returns assume the reinvestment of all distributions at net asset value and the deduction of all Fund expenses. Returns have not been adjusted
| 1 | Lipper, Inc., a wholly-owned subsidiary of Reuters, provides independent insight on global collective investments. Returns are based on the period ended October 31, 2015, including the reinvestment of all distributions, including returns of capital, if any, calculated among the 239 funds for the six-month period and among the 229 funds for the twelve-month period in the Fund’s Lipper category, and excluding sales charges. |
| † | The total return includes gains from settlement of security litigations. Without these gains, the total return for Class A, Class C, Class FI, Class R and Class I shares for the six months ended October 31, 2015 would have been -5.85%, -6.25%, -5.98%, -5.80% and -5.73%, respectively. The total return also includes the refund of withholding taxes on dividends, plus interest, previously paid by the Fund. Without this refund, the total return for Class A, Class C, Class FI, Class R and Class I shares for the six months ended October 31, 2015 would have been -5.88%, -6.25%, -6.03%, -6.03% and -5.76%, respectively. In the aggregate, without these two items, the total return for Class A, Class C, Class FI, Class R and Class I shares for the six months ended October 31, 2015 would have been -6.19%, -6.58%, -6.47%, -6.14% and -6.08%, respectively. |
| ‡ | The total return includes gains from settlement of security litigations. Without these gains, the total return for Class A, Class C, Class FI, Class R and Class I shares for the twelve months ended October 31, 2015 would have been 0.12%, -0.67%, 0.00%, 0.18% and 0.37%, respectively. The total return also includes the refund of withholding taxes on dividends, plus interest, previously paid by the Fund. Without this refund, the total return for Class A, Class C, Class FI, Class R and Class I shares for the twelve months ended October 31, 2015 would have been 0.25%, -0.51%, 0.09%, -0.03% and 0.49%, respectively. In the aggregate, without these two items, the total return for Class A, Class C, Class FI, Class R and Class I shares for the twelve months ended October 31, 2015 would have been -0.25%, -1.06%, -0.56%, -0.18% and 0.00%, respectively. |
| | |
| ClearBridge Global Growth Trust 2015 Annual Report | | 3 |
Fund overview (cont’d)
to include sales charges that may apply or the deduction of taxes that a shareholder would pay on Fund distributions. If sales charges were reflected, the performance quoted would be lower. Performance figures for periods shorter than one year represent cumulative figures and are not annualized.
Fund performance figures reflect fee waivers and/or expense reimbursements, without which the performance would have been lower.
|
| Total Annual Operating Expenses (unaudited) |
As of the Fund’s current prospectus dated March 1, 2015, the gross total annual operating expense ratios for Class A, Class C, Class FI, Class R and Class I shares were 1.29%, 2.06%, 1.39%, 1.83% and 1.02%, respectively.
Actual expenses may be higher. For example, expenses may be higher than those shown if average net assets decrease. Net assets are more likely to decrease and Fund expense ratios are more likely to increase when markets are volatile.
As a result of expense limitation arrangements, the ratio of expenses, other than interest, brokerage commissions, dividend expense on short sales, taxes, extraordinary expenses and acquired fund fees and expenses, to average net assets is not expected to exceed 1.15% for Class A shares, 1.90% for Class C shares, 1.15% for Class FI shares, 1.40% for Class R shares and 0.90% for Class I shares. These expense limitation arrangements cannot be terminated prior to December 31, 2017 without the Board of Trustees’ consent.
The manager is permitted to recapture amounts waived and/or reimbursed to a class within three years after the fiscal year in which the manager earned the fee or incurred the expense if the class’ total annual operating expenses have fallen to a level below the expense limitation (“expense cap”) in effect at the time the fees were earned or the expenses incurred. In no case will the manager recapture any amount that would result, on any particular business day of the Fund, in the class’ total annual operating expenses exceeding the expense cap or any other lower limit then in effect.
Q. What were the leading contributors to performance?
A. Relative to the benchmark, overall sector allocation contributed to the Fund’s relative performance. In particular, overweights to the Consumer Discretionary and IT sectors, an underweight to the Financials sector as well as stock selection within the Industrials, Health Care and Materials sectors contributed to relative returns. In terms of individual stocks, Amazon.com Inc., Starbucks Corp., Red Hat Inc., Imperva Inc. and ONO Pharmaceutical Co., Ltd. contributed the most to absolute returns.
From a regional perspective, stock selection in North America was a significant contributor to performance.
Q. What were the leading detractors from performance?
A. Relative to the benchmark, overall stock selection detracted from the Fund’s relative performance. In particular, stock selection within the Consumer Discretionary, Consumer Staples, Financials and IT sectors hurt results. In terms of individual positions, Petra Diamonds Ltd., Amira Nature Foods Ltd., On Deck Capital Inc., Aryzta AG and Hitachi Ltd. detracted from returns.
From a regional perspective, stock selection in Emerging Markets, Asia Ex-Japan and the UK all detracted from performance.
| | |
| 4 | | ClearBridge Global Growth Trust 2015 Annual Report |
Q. Were there any significant changes to the Fund during the reporting period?
A. Overall, the Fund purchased twenty-one and sold out of twenty-five positions. The Fund’s portfolio was most active in the IT, Health Care and Financials sectors. The most notable purchases included Salesforce.com Inc., London Stock Exchange Group PLC, Novozymes A/S, Class B shares, Reckitt Benckiser Group PLC and Hong Kong Exchanges & Clearing Ltd. Meanwhile, notable positions we sold included Amgen Inc., Boeing Co., E*Trade Financial Corp., Aryzta AG and Adobe Systems Inc.
Thank you for your investment in ClearBridge Global Growth Trust. As always, we appreciate that you have chosen us to manage your assets and we remain focused on achieving the Fund’s investment goals.
Sincerely,

Michael Testorf, CFA
Portfolio Manager
ClearBridge Investments

Elisa Mazen
Portfolio Manager
ClearBridge Investments
November 17, 2015
RISKS: Equity securities are subject to price fluctuation and possible loss of principal. The manager’s investment style may become out of favor and/or the manager’s selection process may prove incorrect, which may have a negative impact on the Fund’s performance. Growth stocks as a group can be more volatile than value stocks and may be out of favor and underperform the overall equity market while the market concentrates on value stocks. As a non-diversified fund, it is permitted to invest a higher percentage of its assets in any one issuer than a diversified fund, which may magnify the Fund’s losses from events affecting a particular issuer. The Fund may focus its investments in certain regions or industries, increasing its vulnerability to market volatility. International investments are subject to special risks including currency fluctuations and social, economic and political uncertainties, which could increase volatility. These risks are magnified in emerging markets. The Fund may engage in derivative transactions, which involve special risks and costs and may increase losses and have a potentially large impact on Fund performance. Please see the Fund’s prospectus for a more complete discussion of these and other risks, and the Fund’s investment strategies.
Portfolio holdings and breakdowns are as of October 31, 2015 and are subject to change and may not be representative of the portfolio managers’ current or future investments. The Fund’s top ten holdings (as a percentage of net assets) as of October 31, 2015 were: Apple Inc. (3.4%), Alibaba Group Holding Ltd., Sponsored ADR (3.3%), Brown-Forman Corp., Class B Shares (3.1%), Starbucks Corp. (2.7%), Shiseido Co., Ltd. (2.7%), Salesforce.com Inc. (2.6%), Red Hat Inc. (2.6%), Diageo PLC, Sponsored ADR. (2.5%), United Continental Holdings Inc. (2.4%) and Ono Pharmaceutical Co., Ltd. (2.4%). Please refer to pages 12 through 16 for a list and percentage breakdown of the Fund’s holdings.
| | |
| ClearBridge Global Growth Trust 2015 Annual Report | | 5 |
Fund overview (cont’d)
The mention of sector breakdowns is for informational purposes only and should not be construed as a recommendation to purchase or sell any securities. The information provided regarding such sectors is not a sufficient basis upon which to make an investment decision. Investors seeking financial advice regarding the appropriateness of investing in any securities or investment strategies discussed should consult their financial professional. The Fund’s top five sector holdings (as a percentage of net assets) as of October 31, 2015 were: Information Technology (24.8%), Consumer Discretionary (17.4%), Health Care (13.8%), Consumer Staples (11.4%) and Financials (9.8%). The Fund’s portfolio composition is subject to change at any time.
All investments are subject to risk including the possible loss of principal. Past performance is no guarantee of future results. All index performance reflects no deduction for fees, expenses or taxes. Please note that an investor cannot invest directly in an index.
The information provided is not intended to be a forecast of future events, a guarantee of future results or investment advice. Views expressed may differ from those of the firm as a whole. Forecasts and predictions are inherently limited and should not be relied upon as an indication of actual or future performance.
| i | The European Central Bank (“ECB”) is responsible for the monetary system of the European Union and the euro currency. |
| ii | The MSCI All Country World Index is a free float-adjusted market capitalization weighted index that is designed to measure the equity market performance of developed and emerging markets. |
| | |
| 6 | | ClearBridge Global Growth Trust 2015 Annual Report |
Fund at a glance† (unaudited)
Investment breakdown (%) as a percent of total investments
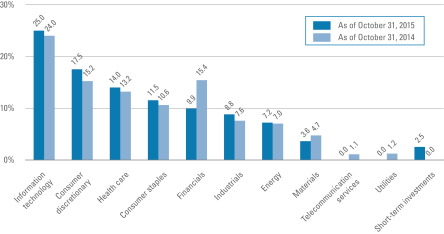
| † | The bar graph above represents the composition of the Fund’s investments as of October 31, 2015 and October 31, 2014. The Fund is actively managed. As a result, the composition of the Fund’s investments is subject to change at any time. |
| | |
| ClearBridge Global Growth Trust 2015 Annual Report | | 7 |
Fund expenses (unaudited)
Example
As a shareholder of the Fund, you may incur two types of costs: (1) transaction costs, including front-end and back-end sales charges (loads) on purchase payments; and (2) ongoing costs, including management fees; service and/or distribution (12b-1) fees; and other Fund expenses. This example is intended to help you understand your ongoing costs (in dollars) of investing in the Fund and to compare these costs with the ongoing costs of investing in other mutual funds.
This example is based on an investment of $1,000 invested on May 1, 2015 and held for the six months ended October 31, 2015.
Actual expenses
The table below titled “Based on Actual Total Return” provides information about actual account values and actual expenses. You may use the information provided in this table, together with the amount you invested, to estimate the expenses that you paid over the period. To estimate the expenses you paid on your account, divide your ending account value by $1,000 (for example, an $8,600 ending account value divided by $1,000 = 8.6), then multiply the result by the number under the heading entitled “Expenses Paid During the Period”.
Hypothetical example for comparison purposes
The table below titled “Based on Hypothetical Total Return” provides information about hypothetical account values and hypothetical expenses based on the actual expense ratio and an assumed rate of return of 5.00% per year before expenses, which is not the Fund’s actual return. The hypothetical account values and expenses may not be used to estimate the actual ending account balance or expenses you paid for the period. You may use the information provided in this table to compare the ongoing costs of investing in the Fund and other funds. To do so, compare the 5.00% hypothetical example relating to the Fund with the 5.00% hypothetical examples that appear in the shareholder reports of the other funds.
Please note that the expenses shown in the table below are meant to highlight your ongoing costs only and do not reflect any transactional costs, such as front-end or back-end sales charges (loads). Therefore, the table is useful in comparing ongoing costs only, and will not help you determine the relative total costs of owning different funds. In addition, if these transaction costs were included, your costs would have been higher.
| | | | | | | | | | | | | | | | | | | | | | | | | | | | | | | | | | | | | | | | | | | | |
| Based on actual total return1 | | | | | | | | Based on hypothetical total return1 | |
| | | Actual Total Return
Without
Sales
Charge2,3 | | | Beginning
Account
Value | | | Ending
Account
Value | | | Annualized
Expense
Ratio | | | Expenses
Paid
During
the
Period4 | | | | | | | Hypothetical
Annualized
Total Return | | | Beginning
Account
Value | | | Ending
Account
Value | | | Annualized
Expense
Ratio | | | Expenses
Paid
During
the
Period4 | |
| Class A | | | -5.53 | % | | $ | 1,000.00 | | | $ | 944.70 | | | | 1.15 | % | | $ | 5.64 | | | | | Class A | | | 5.00 | % | | $ | 1,000.00 | | | $ | 1,019.41 | | | | 1.15 | % | | $ | 5.85 | |
| Class C | | | -5.92 | | | | 1,000.00 | | | | 940.80 | | | | 1.90 | | | | 9.29 | | | | | Class C | | | 5.00 | | | | 1,000.00 | | | | 1,015.63 | | | | 1.90 | | | | 9.65 | |
| Class FI | | | -5.53 | | | | 1,000.00 | | | | 944.70 | | | | 1.15 | | | | 5.64 | | | | | Class FI | | | 5.00 | | | | 1,000.00 | | | | 1,019.41 | | | | 1.15 | | | | 5.85 | |
| Class R | | | -5.69 | | | | 1,000.00 | | | | 943.10 | | | | 1.40 | | | | 6.86 | | | | | Class R | | | 5.00 | | | | 1,000.00 | | | | 1,018.15 | | | | 1.40 | | | | 7.12 | |
| Class I | | | -5.41 | | | | 1,000.00 | | | | 945.90 | | | | 0.90 | | | | 4.41 | | | | | Class I | | | 5.00 | | | | 1,000.00 | | | | 1,020.67 | | | | 0.90 | | | | 4.58 | |
| | |
| 8 | | ClearBridge Global Growth Trust 2015 Annual Report |
| 1 | For the six months ended October 31, 2015. |
| 2 | Assumes the reinvestment of all distributions, including returns of capital, if any, at net asset value and does not reflect the deduction of the applicable sales charge with respect to Class A shares or the applicable contingent deferred sales charge (“CDSC”) with respect to Class C shares. Total return is not annualized, as it may not be representative of the total return for the year. Performance figures may reflect compensating balance arrangements, fee waivers and/or expense reimbursements. In the absence of compensating balance arrangements, fee waivers and/or expense reimbursements, the total return would have been lower. Past performance is no guarantee of future results. |
| 3 | The total returns include gains from settlement of security litigations and the refund of withholding taxes on dividends, plus interest, previously paid by the Fund. Without these amounts, the total return would have been lower. |
| 4 | Expenses (net of compensating balance arrangements, fee waivers and/or expense reimbursements) are equal to each class’ respective annualized expense ratio multiplied by the average account value over the period, multiplied by the number of days in the most recent fiscal half-year (184), then divided by 365. |
| | |
| ClearBridge Global Growth Trust 2015 Annual Report | | 9 |
Fund performance (unaudited)
| | | | | | | | | | | | | | | | | | | | |
| Average annual total returns | | | | | | | | | | | | | |
| Without sales charges1 | | Class A† | | | Class C† | | | Class FI† | | | Class R† | | | Class I† | |
| Twelve Months Ended 10/31/15 | | | 0.61 | % | | | -0.16 | % | | | 0.62 | % | | | 0.33 | % | | | 0.86 | % |
| Five Years Ended 10/31/15 | | | 10.61 | | | | 9.79 | | | | 10.62 | | | | 10.32 | | | | 10.89 | |
| Ten Years Ended 10/31/15 | | | N/A | | | | 1.64 | | | | 2.40 | | | | N/A | | | | 2.69 | |
| Inception* through 10/31/15 | | | 15.74 | | | | — | | | | — | | | | 1.46 | | | | — | |
| | | | | |
| With sales charges2 | | Class A† | | | Class C† | | | Class FI† | | | Class R† | | | Class I† | |
| Twelve Months Ended 10/31/15 | | | -5.17 | % | | | -1.16 | % | | | 0.62 | % | | | 0.33 | % | | | 0.86 | % |
| Five Years Ended 10/31/15 | | | 9.31 | | | | 9.79 | | | | 10.62 | | | | 10.32 | | | | 10.89 | |
| Ten Years Ended 10/31/15 | | | N/A | | | | 1.64 | | | | 2.40 | | | | N/A | | | | 2.69 | |
| Inception* through 10/31/15 | | | 14.73 | | | | — | | | | — | | | | 1.46 | | | | — | |
| | | | |
| Cumulative total returns | |
| Without sales charges1 | | | |
| Class A (Inception date of 2/3/09 through 10/31/15) | | | 167.97 | % |
| Class C (10/31/05 through 10/31/15) | | | 17.63 | |
| Class FI (10/31/05 through 10/31/15) | | | 26.77 | |
| Class R (Inception date of 12/28/06 through 10/31/15) | | | 13.67 | |
| Class I (10/31/05 through 10/31/15) | | | 30.44 | |
All figures represent past performance and are not a guarantee of future results. Investment return and principal value of an investment will fluctuate so that an investor’s shares, when redeemed, may be worth more or less than their original cost. The returns shown do not reflect the deduction of taxes that a shareholder would pay on Fund distributions or the redemption of Fund shares. Performance figures may reflect compensating balance arrangements, fee waivers and/or expense reimbursements. In the absence of compensating balance arrangements, fee waivers and/or expense reimbursements, the total return would have been lower.
| † | The total returns include gains from settlement of security litigations and the refund of withholding taxes on dividends, plus interest, previously paid by the Fund. Without those amounts, total returns would have been lower. |
| 1 | Assumes the reinvestment of all distributions, including returns of capital, if any, at net asset value and does not reflect the deduction of the applicable sales charge with respect to Class A shares or the applicable contingent deferred sales charge (“CDSC”) with respect to Class C shares. |
| 2 | Assumes the reinvestment of all distributions, including returns of capital, if any, at net asset value. In addition, Class A shares reflect the deduction of the maximum initial sales charge of 5.75%. Class C shares reflect the deduction of a 1.00% CDSC, which applies if shares are redeemed within one year from purchase payment. |
| * | Inception dates for Class A, C, FI, R and I shares are February 3, 2009, April 17, 1995, January 29, 2004, December 28, 2006 and March 4, 2004, respectively. |
| | |
| 10 | | ClearBridge Global Growth Trust 2015 Annual Report |
Historical performance
Value of $10,000 invested in
Class C Shares of ClearBridge Global Growth Trust vs. MSCI All Country World Index† — October 2005 - October 2015
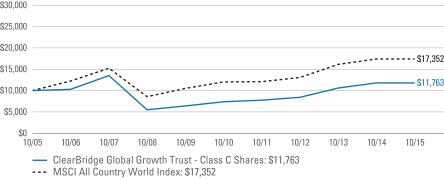
All figures represent past performance and are not a guarantee of future results. Investment return and principal value of an investment will fluctuate so that an investor’s shares, when redeemed, may be worth more or less than their original cost. The returns shown do not reflect the deduction of taxes that a shareholder would pay on Fund distributions or the redemption of Fund shares. Performance figures may reflect compensating balance arrangements, fee waivers and/or expense reimbursements. In the absence of compensating balance arrangements, fee waivers and/or expense reimbursements, the total return would have been lower.
| † | Hypothetical illustration of $10,000 invested in Class C shares of ClearBridge Global Growth Trust on October 31, 2005, assuming the reinvestment of all distributions, including returns of capital, if any, at net asset value through October 31, 2015. The hypothetical illustration also assumes a $10,000 investment in the MSCI All Country World Index. The MSCI All Country World Index is a free float-adjusted market capitalization weighted index that is designed to measure the equity market performance of developed and emerging markets. The Index is unmanaged and is not subject to the same management and trading expenses as a mutual fund. Please note that an investor cannot invest directly in an index. The performance of the Fund’s other classes may be greater or less than the Class C shares performance indicated on this chart, depending on whether greater or lower sales charges and fees were incurred by shareholders investing in the other classes. |
| | |
| ClearBridge Global Growth Trust 2015 Annual Report | | 11 |
Schedule of investments
October 31, 2015
ClearBridge Global Growth Trust
| | | | | | | | | | | | |
| Security | | | | | | Shares | | | Value | |
| Common Stocks — 96.3% | | | | | | | | | | | | |
| Consumer Discretionary — 17.4% | | | | | | | | | | | | |
Automobiles — 0.9% | | | | | | | | | | | | |
Tesla Motors Inc. | | | | | | | 5,600 | | | $ | 1,158,808 | * |
Hotels, Restaurants & Leisure — 3.9% | | | | | | | | | | | | |
Las Vegas Sands Corp. | | | | | | | 32,140 | | | | 1,591,251 | |
Starbucks Corp. | | | | | | | 58,820 | | | | 3,680,368 | |
Total Hotels, Restaurants & Leisure | | | | | | | | | | | 5,271,619 | |
Internet & Catalog Retail — 4.8% | | | | | | | | | | | | |
Amazon.com Inc. | | | | | | | 4,960 | | | | 3,104,464 | * |
ASOS PLC | | | | | | | 27,600 | | | | 1,382,262 | *(a) |
Vipshop Holdings Ltd., ADR | | | | | | | 93,600 | | | | 1,920,672 | * |
Total Internet & Catalog Retail | | | | | | | | | | | 6,407,398 | |
Specialty Retail — 2.0% | | | | | | | | | | | | |
L’Occitane International SA | | | | | | | 1,337,700 | | | | 2,682,581 | (a) |
Textiles, Apparel & Luxury Goods — 5.8% | | | | | | | | | | | | |
Compagnie Financiere Richemont SA | | | | | | | 26,900 | | | | 2,300,808 | (a) |
Pandora A/S | | | | | | | 20,300 | | | | 2,336,804 | (a) |
Prada SpA | | | | | | | 332,500 | | | | 1,350,732 | (a) |
Ralph Lauren Corp. | | | | | | | 15,850 | | | | 1,755,705 | |
Total Textiles, Apparel & Luxury Goods | | | | | | | | | | | 7,744,049 | |
Total Consumer Discretionary | | | | | | | | | | | 23,264,455 | |
| Consumer Staples — 11.4% | | | | | | | | | | | | |
Beverages — 7.0% | | | | | | | | | | | | |
Brown-Forman Corp., Class B Shares | | | | | | | 39,060 | | | | 4,147,391 | |
Diageo PLC, Sponsored ADR | | | | | | | 29,380 | | | | 3,381,050 | |
Fomento Economico Mexicano SAB de CV, Sponsored ADR | | | | | | | 18,520 | | | | 1,835,147 | |
Total Beverages | | | | | | | | | | | 9,363,588 | |
Household Products — 1.8% | | | | | | | | | | | | |
Reckitt Benckiser Group PLC | | | | | | | 24,460 | | | | 2,386,522 | (a) |
Personal Products — 2.6% | | | | | | | | | | | | |
Shiseido Co., Ltd. | | | | | | | 151,000 | | | | 3,561,530 | (a) |
Total Consumer Staples | | | | | | | | | | | 15,311,640 | |
| Energy — 7.1% | | | | | | | | | | | | |
Energy Equipment & Services — 1.3% | | | | | | | | | | | | |
Schlumberger Ltd. | | | | | | | 21,700 | | | | 1,696,072 | |
Oil, Gas & Consumable Fuels — 5.8% | | | | | | | | | | | | |
Cabot Oil & Gas Corp. | | | | | | | 45,600 | | | | 989,976 | |
Encana Corp. | | | | | | | 124,000 | | | | 943,560 | |
See Notes to Financial Statements.
| | |
| 12 | | ClearBridge Global Growth Trust 2015 Annual Report |
ClearBridge Global Growth Trust
| | | | | | | | | | | | |
| Security | | | | | | Shares | | | Value | |
Oil, Gas & Consumable Fuels — continued | | | | | | | | | | | | |
EOG Resources Inc. | | | | | | | 24,260 | | | $ | 2,082,721 | |
Occidental Petroleum Corp. | | | | | | | 30,650 | | | | 2,284,651 | |
Suncor Energy Inc. | | | | | | | 50,800 | | | | 1,511,646 | |
Total Oil, Gas & Consumable Fuels | | | | | | | | | | | 7,812,554 | |
Total Energy | | | | | | | | | | | 9,508,626 | |
| Financials — 9.4% | | | | | | | | | | | | |
Banks — 1.8% | | | | | | | | | | | | |
Banco Bilbao Vizcaya Argentaria SA, Sponsored ADR | | | | | | | 192,886 | | | | 1,662,677 | |
Credicorp Ltd. | | | | | | | 7,300 | | | | 826,214 | |
Total Banks | | | | | | | | | | | 2,488,891 | |
Consumer Finance — 1.8% | | | | | | | | | | | | |
ORIX Corp. | | | | | | | 162,800 | | | | 2,380,145 | (a) |
Diversified Financial Services — 4.9% | | | | | | | | | | | | |
Grupo BTG Pactual | | | | | | | 73,600 | | | | 547,723 | |
Hong Kong Exchanges & Clearing Ltd. | | | | | | | 90,700 | | | | 2,360,931 | (a) |
London Stock Exchange Group PLC | | | | | | | 76,000 | | | | 2,973,054 | (a) |
On Deck Capital Inc. | | | | | | | 67,400 | | | | 641,648 | * |
Total Diversified Financial Services | | | | | | | | | | | 6,523,356 | |
Real Estate Investment Trusts (REITs) — 0.9% | | | | | | | | | | | | |
American Homes 4 Rent, Class A Shares | | | | | | | 74,600 | | | | 1,230,900 | |
Total Financials | | | | | | | | | | | 12,623,292 | |
| Health Care — 13.8% | | | | | | | | | | | | |
Biotechnology — 6.3% | | | | | | | | | | | | |
Aduro Biotech Inc. | | | | | | | 1,340 | | | | 36,193 | * |
Alexion Pharmaceuticals Inc. | | | | | | | 13,500 | | | | 2,376,000 | * |
BioMarin Pharmaceutical Inc. | | | | | | | 12,900 | | | | 1,509,816 | * |
Celgene Corp. | | | | | | | 20,340 | | | | 2,495,922 | * |
ProQR Therapeutics NV | | | | | | | 18,100 | | | | 263,717 | * |
Vertex Pharmaceuticals Inc. | | | | | | | 13,900 | | | | 1,733,886 | * |
Total Biotechnology | | | | | | | | | | | 8,415,534 | |
Life Sciences Tools & Services — 2.3% | | | | | | | | | | | | |
ICON PLC | | | | | | | 15,570 | | | | 994,456 | * |
Mettler-Toledo International Inc. | | | | | | | 6,730 | | | | 2,092,962 | * |
Total Life Sciences Tools & Services | | | | | | | | | | | 3,087,418 | |
Pharmaceuticals — 5.2% | | | | | | | | | | | | |
Eisai Co., Ltd. | | | | | | | 19,100 | | | | 1,188,260 | (a) |
Ono Pharmaceutical Co., Ltd. | | | | | | | 23,200 | | | | 3,161,261 | (a) |
Roche Holding AG, ADR | | | | | | | 78,960 | | | | 2,677,534 | |
Total Pharmaceuticals | | | | | | | | | | | 7,027,055 | |
Total Health Care | | | | | | | | | | | 18,530,007 | |
See Notes to Financial Statements.
| | |
| ClearBridge Global Growth Trust 2015 Annual Report | | 13 |
Schedule of investments (cont’d)
October 31, 2015
ClearBridge Global Growth Trust
| | | | | | | | | | | | |
| Security | | | | | | Shares | | | Value | |
| Industrials — 8.8% | | | | | | | | | | | | |
Aerospace & Defense — 1.5% | | | | | | | | | | | | |
Safran SA | | | | | | | 25,730 | | | $ | 1,952,604 | (a) |
Airlines — 5.2% | | | | | | | | | | | | |
Ryanair Holdings PLC, Sponsored ADR | | | | | | | 27,885 | | | | 2,180,328 | |
United Continental Holdings Inc. | | | | | | | 54,300 | | | | 3,274,833 | * |
Virgin America Inc. | | | | | | | 41,500 | | | | 1,477,815 | * |
Total Airlines | | | | | | | | | | | 6,932,976 | |
Electrical Equipment — 1.0% | | | | | | | | | | | | |
Vestas Wind Systems A/S | | | | | | | 23,060 | | | | 1,339,991 | (a) |
Trading Companies & Distributors — 1.1% | | | | | | | | | | | | |
Wolseley PLC | | | | | | | 25,920 | | | | 1,521,199 | (a) |
Total Industrials | | | | | | | | | | | 11,746,770 | |
| Information Technology — 24.8% | | | | | | | | | | | | |
Electronic Equipment, Instruments & Components — 2.0% | | | | | | | | | | | | |
Hitachi Ltd. | | | | | | | 477,840 | | | | 2,744,946 | (a) |
Internet Software & Services — 5.6% | | | | | | | | | | | | |
Alibaba Group Holding Ltd., Sponsored ADR | | | | | | | 52,600 | | | | 4,409,458 | * |
Apigee Corp. | | | | | | | 68,400 | | | | 660,060 | * |
Rackspace Hosting Inc. | | | | | | | 49,000 | | | | 1,266,650 | * |
Twitter Inc. | | | | | | | 39,500 | | | | 1,124,170 | * |
Total Internet Software & Services | | | | | | | | | | | 7,460,338 | |
Semiconductors & Semiconductor Equipment — 3.2% | | | | | | | | | | | | |
ARM Holdings PLC | | | | | | | 133,000 | | | | 2,102,228 | (a) |
NXP Semiconductors NV | | | | | | | 28,000 | | | | 2,193,800 | * |
Total Semiconductors & Semiconductor Equipment | | | | | | | | | | | 4,296,028 | |
Software — 10.6% | | | | | | | | | | | | |
FireEye Inc. | | | | | | | 56,210 | | | | 1,469,892 | * |
Imperva Inc. | | | | | | | 21,400 | | | | 1,511,268 | * |
Mobileye NV | | | | | | | 34,800 | | | | 1,584,096 | * |
Red Hat Inc. | | | | | | | 43,930 | | | | 3,475,302 | * |
Salesforce.com Inc. | | | | | | | 45,600 | | | | 3,543,576 | * |
ServiceNow Inc. | | | | | | | 31,650 | | | | 2,584,223 | * |
Total Software | | | | | | | | | | | 14,168,357 | |
Technology Hardware, Storage & Peripherals — 3.4% | | | | | | | | | | | | |
Apple Inc. | | | | | | | 38,350 | | | | 4,582,825 | |
Total Information Technology | | | | | | | | | | | 33,252,494 | |
See Notes to Financial Statements.
| | |
| 14 | | ClearBridge Global Growth Trust 2015 Annual Report |
ClearBridge Global Growth Trust
| | | | | | | | | | | | | | |
| Security | | | | | | | Shares | | | Value | |
| Materials — 3.6% | | | | | | | | | | | | | | |
Chemicals — 2.1% | | | | | | | | | | | | | | |
Novozymes A/S, Class B Shares | | | | | | | | | 62,000 | | | $ | 2,867,369 | (a) |
Metals & Mining — 1.5% | | | | | | | | | | | | | | |
Dominion Diamond Corp. | | | | | | | | | 116,800 | | | | 1,233,408 | * |
Petra Diamonds Ltd. | | | | | | | | | 616,000 | | | | 707,317 | (a) |
Total Metals & Mining | | | | | | | | | | | | | 1,940,725 | |
Total Materials | | | | | | | | | | | | | 4,808,094 | |
Total Common Stocks (Cost — $111,122,247) | | | | | | | | | | | | | 129,045,378 | |
| Preferred Stocks — 0.4% | | | | | | | | | | | | | | |
| Financials — 0.4% | | | | | | | | | | | | | | |
Banks — 0.4% | | | | | | | | | | | | | | |
Itau Unibanco Holding SA, Sponsored ADR (Cost — $1,002,039) | | | | | | | | | 75,493 | | | | 517,127 | |
Total Investments before Short-Term Investments (Cost — $112,124,286) | | | | 129,562,505 | |
| | | | |
| | | Rate | | | | | | | | | |
| Short-Term Investments — 2.5% | | | | | | | | | | | | | | |
State Street Institutional Liquid Reserves Fund, Premier Class (Cost — $3,372,826) | | | 0.137 | % | | | | | 3,372,826 | | | | 3,372,826 | |
Total Investments — 99.2% (Cost — $115,497,112#) | | | | 132,935,331 | |
Other Assets in Excess of Liabilities — 0.8% | | | | | | | | | | | | | 1,053,288 | |
Total Net Assets — 100.0% | | | | | | | | | | | | $ | 133,988,619 | |
| * | Non-income producing security. |
| (a) | Security is valued in good faith in accordance with procedures approved by the Board of Trustees (See Note 1). |
| # | Aggregate cost for federal income tax purposes is $115,815,303. |
| | |
Abbreviation used in this schedule: |
| ADR | | — American Depositary Receipts |
See Notes to Financial Statements.
| | |
| ClearBridge Global Growth Trust 2015 Annual Report | | 15 |
Schedule of investments (cont’d)
October 31, 2015
ClearBridge Global Growth Trust
| | | | |
| Summary of Investments by Country** (unaudited) | |
| United States | | | 46.8 | % |
| Japan | | | 9.8 | |
| United Kingdom | | | 9.2 | |
| Denmark | | | 4.9 | |
| China | | | 4.8 | |
| Switzerland | | | 3.7 | |
| Canada | | | 2.8 | |
| Luxembourg | | | 2.0 | |
| Netherlands | | | 1.9 | |
| Hong Kong | | | 1.8 | |
| Ireland | | | 1.6 | |
| France | | | 1.5 | |
| Mexico | | | 1.4 | |
| Spain | | | 1.3 | |
| Swaziland | | | 1.1 | |
| Italy | | | 1.0 | |
| Brazil | | | 0.8 | |
| Peru | | | 0.6 | |
| South Africa | | | 0.5 | |
| Short-Term Investments | | | 2.5 | |
| | | | 100.0 | % |
| ** | As a percentage of total investments. Please note that the Fund holdings are as of October 31, 2015 and are subject to change. |
See Notes to Financial Statements.
| | |
| 16 | | ClearBridge Global Growth Trust 2015 Annual Report |
Statement of assets and liabilities
October 31, 2015
| | | | |
| |
| Assets: | | | | |
Investments, at value (Cost — $115,497,112) | | $ | 132,935,331 | |
Foreign currency, at value (Cost — $32) | | | 32 | |
Receivable for securities sold | | | 1,688,770 | |
Dividends and interest receivable | | | 271,896 | |
Receivable for Fund shares sold | | | 110,411 | |
Other assets | | | 100,206 | |
Prepaid expenses | | | 34,096 | |
Total Assets | | | 135,140,742 | |
| |
| Liabilities: | | | | |
Payable for securities purchased | | | 542,724 | |
Payable for Fund shares repurchased | | | 234,452 | |
Trustees’ fees payable | | | 101,353 | |
Service and/or distribution fees payable | | | 81,230 | |
Investment management fee payable | | | 65,931 | |
Accrued expenses | | | 126,433 | |
Total Liabilities | | | 1,152,123 | |
| Total Net Assets | | $ | 133,988,619 | |
| |
| Net Assets: | | | | |
Par value (Note 6) | | $ | 42 | |
Paid-in capital in excess of par value | | | 430,964,641 | |
Accumulated net investment loss | | | (420,926) | |
Accumulated net realized loss on investments and foreign currency transactions | | | (313,988,116) | |
Net unrealized appreciation on investments and foreign currencies | | | 17,432,978 | |
| Total Net Assets | | $ | 133,988,619 | |
See Notes to Financial Statements.
| | |
| ClearBridge Global Growth Trust 2015 Annual Report | | 17 |
Statement of assets and liabilities (cont’d)
October 31, 2015
| | | | |
| |
| Net Assets: | | | | |
Class A | | | $10,477,052 | |
Class C | | | $92,105,490 | |
Class FI | | | $10,883,556 | |
Class R | | | $120,941 | |
Class I | | | $20,401,580 | |
| |
| Shares Outstanding: | | | | |
Class A | | | 319,406 | |
Class C | | | 2,954,406 | |
Class FI | | | 318,651 | |
Class R | | | 3,626 | |
Class I | | | 577,929 | |
| |
| Net Asset Value: | | | | |
Class A (and redemption price) | | | $32.80 | |
Class C* | | | $31.18 | |
Class FI (and redemption price) | | | $34.16 | |
Class R (and redemption price) | | | $33.35 | |
Class I (and redemption price) | | | $35.30 | |
| Maximum Public Offering Price Per Share: | | | | |
Class A (based on maximum initial sales charge of 5.75%) | | | $34.80 | |
| * | Redemption price per share is NAV of Class C shares reduced by a 1.00% CDSC, if shares are redeemed within one year from purchase payment (See Note 2). |
See Notes to Financial Statements.
| | |
| 18 | | ClearBridge Global Growth Trust 2015 Annual Report |
Statement of operations
For the Year Ended October 31, 2015
| | | | |
| |
| Investment Income: | | | | |
Dividends | | $ | 1,845,675 | |
Interest | | | 1,941 | |
Less: Foreign taxes withheld | | | (108,952) | |
Refund of foreign taxes withheld (Note 1) | | | 516,403 | |
Total Investment Income | | | 2,255,067 | |
| |
| Expenses: | | | | |
Service and/or distribution fees (Notes 2 and 5) | | | 1,066,669 | |
Investment management fee (Note 2) | | | 1,011,793 | |
Transfer agent fees (Note 5) | | | 184,448 | |
Registration fees | | | 74,598 | |
Audit and tax fees | | | 35,136 | |
Custody fees | | | 31,727 | |
Fund accounting fees | | | 28,147 | |
Legal fees | | | 27,000 | |
Shareholder reports | | | 22,847 | |
Trustees’ fees | | | 12,666 | |
Insurance | | | 3,206 | |
Fees recaptured by investment manager (Note 2) | | | 172 | |
Miscellaneous expenses | | | 5,759 | |
Total Expenses | | | 2,504,168 | |
Less: Fee waivers and/or expense reimbursements (Notes 2 and 5) | | | (136,623) | |
Net Expenses | | | 2,367,545 | |
| Net Investment Loss | | | (112,478) | |
| |
Realized and Unrealized Gain (Loss) on Investments
and Foreign Currency Transactions (Notes 1, 3 and 4): | | | | |
Net Realized Gain From: | | | | |
Investment transactions | | | 13,966,133 | |
Foreign currency transactions | | | 8,129 | |
Net Realized Gain | | | 13,974,262 | |
Change in Net Unrealized Appreciation (Depreciation) From: | | | | |
Investments | | | (14,200,376) | |
Foreign currencies | | | (1,546) | |
Change in Net Unrealized Appreciation (Depreciation) | | | (14,201,922) | |
| Net Loss on Investments and Foreign Currency Transactions | | | (227,660) | |
| Decrease in Net Assets from Operations | | $ | (340,138) | |
See Notes to Financial Statements.
| | |
| ClearBridge Global Growth Trust 2015 Annual Report | | 19 |
Statements of changes in net assets
| | | | | | | | |
| For the Years Ended October 31, | | 2015 | | | 2014 | |
| | |
| Operations: | | | | | | | | |
Net investment loss | | $ | (112,478) | | | $ | (518,410) | |
Net realized gain | | | 13,974,262 | | | | 21,843,273 | |
Change in net unrealized appreciation (depreciation) | | | (14,201,922) | | | | (4,661,652) | |
Increase (Decrease) in Net Assets from Operations | | | (340,138) | | | | 16,663,211 | |
| | |
| Fund Share Transactions (Note 6): | | | | | | | | |
Net proceeds from sale of shares | | | 19,868,086 | | | | 9,810,016 | |
Cost of shares repurchased | | | (29,415,580) | | | | (29,366,022) | |
Decrease in Net Assets from Fund Share Transactions | | | (9,547,494) | | | | (19,556,006) | |
Decrease in Net Assets | | | (9,887,632) | | | | (2,892,795) | |
| | |
| Net Assets: | | | | | | | | |
Beginning of year | | | 143,876,251 | | | | 146,769,046 | |
End of year* | | $ | 133,988,619 | | | $ | 143,876,251 | |
*Includesaccumulated net investment loss of: | | | $(420,926) | | | | $(1,003,322) | |
See Notes to Financial Statements.
| | |
| 20 | | ClearBridge Global Growth Trust 2015 Annual Report |
Financial highlights
| | | | | | | | | | | | | | | | | | | | |
| For a share of each class of beneficial interest outstanding throughout each year ended October 31: | |
| Class A Shares1 | | 2015 | | | 2014 | | | 2013 | | | 2012 | | | 20112 | |
| | | | | |
| Net asset value, beginning of year | | | $32.60 | | | | $28.95 | | | | $22.81 | | | | $20.80 | | | | $19.81 | |
| | | | | |
| Income from operations: | | | | | | | | | | | | | | | | | | | | |
Net investment income | | | 0.14 | | | | 0.05 | | | | 0.12 | | | | 0.04 | | | | 0.06 | |
Net realized and unrealized gain | | | 0.06 | | | | 3.60 | | | | 6.02 | | | | 1.97 | | | | 0.93 | |
Total income from operations | | | 0.20 | | | | 3.65 | | | | 6.14 | | | | 2.01 | | | | 0.99 | |
| | | | | |
| Net asset value, end of year | | | $32.80 | | | | $32.60 | | | | $28.95 | | | | $22.81 | | | | $20.80 | |
Total return3 | | | 0.61 | %4 | | | 12.61 | % | | | 26.92 | % | | | 9.61 | % | | | 5.05 | % |
| | | | | |
| Net assets, end of year (000s) | | | $10,477 | | | | $10,021 | | | | $8,596 | | | | $9,425 | | | | $11,158 | |
| | | | | |
| Ratios to average net assets: | | | | | | | | | | | | | | | | | | | | |
Gross expenses | | | 1.19 | %5 | | | 1.29 | % | | | 1.33 | % | | | 1.26 | % | | | 1.24 | % |
Net expenses6,7 | | | 1.15 | 5 | | | 1.15 | | | | 1.15 | | | | 1.15 | | | | 1.15 | |
Net investment income | | | 0.42 | | | | 0.16 | | | | 0.46 | | | | 0.17 | | | | 0.30 | |
| | | | | |
| Portfolio turnover rate | | | 39 | % | | | 45 | % | | | 43 | % | | | 51 | % | | | 54 | % |
| 1 | Per share amounts have been calculated using the average shares method. |
| 2 | Represents a share of capital stock outstanding prior to February 29, 2012. |
| 3 | Performance figures, exclusive of sales charges, may reflect compensating balance arrangements, fee waivers and/or expense reimbursements. In the absence of compensating balance arrangements, fee waivers and/or expense reimbursements, the total return would have been lower. Past performance is no guarantee of future results. |
| 4 | The total return includes gains from settlement of security litigations. Without these gains, the total return would have been 0.12% for the year ended October 31, 2015. The total return also includes the refund of withholding taxes on dividends, plus interest, previously paid by the Fund. Without this refund, the total return would have been 0.25% for the year ended October 31, 2015. In the aggregate, without these two items, the total return would have been -0.25% for the year ended October 31, 2015. |
| 5 | Reflects recapture of expenses waived/reimbursed from prior fiscal years. |
| 6 | As a result of an expense limitation arrangement, the ratio of expenses, other than interest, brokerage commissions, dividend expense on short sales, taxes, extraordinary expenses and acquired fund fees and expenses, to average net assets of Class A shares did not exceed 1.15%. This expense limitation arrangement cannot be terminated prior to December 31, 2017 without the Board of Trustees’ consent. |
| 7 | Reflects fee waivers and/or expense reimbursements. |
See Notes to Financial Statements.
| | |
| ClearBridge Global Growth Trust 2015 Annual Report | | 21 |
Financial highlights (cont’d)
| | | | | | | | | | | | | | | | | | | | |
| For a share of each class of beneficial interest outstanding throughout each year ended October 31: | |
| Class C Shares1 | | 2015 | | | 2014 | | | 2013 | | | 2012 | | | 20112 | |
| | | | | |
| Net asset value, beginning of year | | | $31.22 | | | | $27.93 | | | | $22.17 | | | | $20.37 | | | | $19.54 | |
| | | | | |
| Income (loss) from operations: | | | | | | | | | | | | | | | | | | | | |
Net investment loss | | | (0.11) | | | | (0.17) | | | | (0.07) | | | | (0.12) | | | | (0.09) | |
Net realized and unrealized gain | | | 0.07 | | | | 3.46 | | | | 5.83 | | | | 1.92 | | | | 0.92 | |
Total income (loss) from operations | | | (0.04) | | | | 3.29 | | | | 5.76 | | | | 1.80 | | | | 0.83 | |
| | | | | |
| Net asset value, end of year | | | $31.18 | | | | $31.22 | | | | $27.93 | | | | $22.17 | | | | $20.37 | |
Total return3 | | | (0.16) | %4 | | | 11.78 | % | | | 25.98 | % | | | 8.78 | % | | | 4.30 | % |
| | | | | |
| Net assets, end of year (000s) | | | $92,105 | | | | $104,110 | | | | $108,598 | | | | $112,266 | | | | $139,175 | |
| | | | | |
| Ratios to average net assets: | | | | | | | | | | | | | | | | | | | | |
Gross expenses | | | 2.00 | % | | | 2.06 | % | | | 2.07 | % | | | 2.01 | % | | | 1.97 | % |
Net expenses5,6 | | | 1.90 | | | | 1.90 | | | | 1.90 | | | | 1.90 | | | | 1.90 | |
Net investment loss | | | (0.36) | | | | (0.58) | | | | (0.30) | | | | (0.58) | | | | (0.45) | |
| | | | | |
| Portfolio turnover rate | | | 39 | % | | | 45 | % | | | 43 | % | | | 51 | % | | | 54 | % |
| 1 | Per share amounts have been calculated using the average shares method. |
| 2 | Represents a share of capital stock outstanding prior to February 29, 2012. |
| 3 | Performance figures, exclusive of CDSC, may reflect compensating balance arrangements, fee waivers and/or expense reimbursements. In the absence of compensating balance arrangements, fee waivers and/or expense reimbursements, the total return would have been lower. Past performance is no guarantee of future results. |
| 4 | The total return includes gains from settlement of security litigations. Without these gains, the total return would have been -0.67% for the year ended October 31, 2015. The total return also includes the refund of withholding taxes on dividends, plus interest, previously paid by the Fund. Without this refund, the total return would have been -0.51% for the year ended October 31, 2015. In the aggregate, without these two items, the total return would have been -1.06% for the year ended October 31, 2015. |
| 5 | As a result of an expense limitation arrangement, the ratio of expenses, other than interest, brokerage commissions, dividend expense on short sales, taxes, extraordinary expenses and acquired fund fees and expenses, to average net assets of Class C shares did not exceed 1.90%. This expense limitation arrangement cannot be terminated prior to December 31, 2017 without the Board of Trustees’ consent. |
| 6 | Reflects fee waivers and/or expense reimbursements. |
See Notes to Financial Statements.
| | |
| 22 | | ClearBridge Global Growth Trust 2015 Annual Report |
| | | | | | | | | | | | | | | | | | | | |
| For a share of each class of beneficial interest outstanding throughout each year ended October 31: | |
| Class FI Shares1 | | 2015 | | | 2014 | | | 2013 | | | 2012 | | | 20112 | |
| | | | | |
| Net asset value, beginning of year | | | $33.94 | | | | $30.15 | | | | $23.75 | | | | $21.66 | | | | $20.62 | |
| | | | | |
| Income from operations: | | | | | | | | | | | | | | | | | | | | |
Net investment income | | | 0.16 | | | | 0.05 | | | | 0.12 | | | | 0.04 | | | | 0.06 | |
Net realized and unrealized gain | | | 0.06 | | | | 3.74 | | | | 6.28 | | | | 2.05 | | | | 0.98 | |
Total income from operations | | | 0.22 | | | | 3.79 | | | | 6.40 | | | | 2.09 | | | | 1.04 | |
| | | | | |
| Net asset value, end of year | | | $34.16 | | | | $33.94 | | | | $30.15 | | | | $23.75 | | | | $21.66 | |
Total return3 | | | 0.62 | %4 | | | 12.57 | % | | | 26.95 | % | | | 9.65 | % | | | 5.04 | % |
| | | | | |
| Net assets, end of year (000s) | | | $10,884 | | | | $11,157 | | | | $11,108 | | | | $10,680 | | | | $13,110 | |
| | | | | |
| Ratios to average net assets: | | | | | | | | | | | | | | | | | | | | |
Gross expenses | | | 1.27 | %5 | | | 1.39 | % | | | 1.27 | % | | | 1.33 | % | | | 1.18 | % |
Net expenses6,7 | | | 1.15 | 5 | | | 1.15 | | | | 1.15 | | | | 1.15 | | | | 1.15 | |
Net investment income | | | 0.47 | | | | 0.16 | | | | 0.45 | | | | 0.17 | | | | 0.29 | |
| | | | | |
| Portfolio turnover rate | | | 39 | % | | | 45 | % | | | 43 | % | | | 51 | % | | | 54 | % |
| 1 | Per share amounts have been calculated using the average shares method. |
| 2 | Represents a share of capital stock outstanding prior to February 29, 2012. |
| 3 | Performance figures may reflect compensating balance arrangements, fee waivers and/or expense reimbursements. In the absence of compensating balance arrangements, fee waivers and/or expense reimbursements, the total return would have been lower. Past performance is no guarantee of future results. |
| 4 | The total return includes gains from settlement of security litigations. Without these gains, the total return would have been 0.00% for the year ended October 31, 2015. The total return also includes the refund of withholding taxes on dividends, plus interest, previously paid by the Fund. Without this refund, the total return would have been 0.09% for the year ended October 31, 2015. In the aggregate, without these two items, the total return would have been -0.56% for the year ended October 31, 2015. |
| 5 | Reflects recapture of expenses waived/reimbursed from prior fiscal years. |
| 6 | As a result of an expense limitation arrangement, the ratio of expenses, other than interest, brokerage commissions, dividend expense on short sales, taxes, extraordinary expenses and acquired fund fees and expenses, to average net assets of Class FI shares did not exceed 1.15%. This expense limitation arrangement cannot be terminated prior to December 31, 2017 without the Board of Trustees’ consent. |
| 7 | Reflects fee waivers and/or expense reimbursements. |
See Notes to Financial Statements.
| | |
| ClearBridge Global Growth Trust 2015 Annual Report | | 23 |
Financial highlights (cont’d)
| | | | | | | | | | | | | | | | | | | | |
| For a share of each class of beneficial interest outstanding throughout each year ended October 31: | |
| Class R Shares1 | | 2015 | | | 2014 | | | 2013 | | | 2012 | | | 20112 | |
| | | | | |
| Net asset value, beginning of year | | | $33.23 | | | | $29.60 | | | | $23.37 | | | | $21.37 | | | | $20.40 | |
| | | | | |
| Income (loss) from operations: | | | | | | | | | | | | | | | | | | | | |
Net investment income (loss) | | | 0.26 | | | | (0.01) | | | | 0.05 | | | | (0.02) | | | | 0.01 | |
Net realized and unrealized gain (loss) | | | (0.14) | | | | 3.64 | | | | 6.18 | | | | 2.02 | | | | 0.96 | |
Total income from operations | | | 0.12 | | | | 3.63 | | | | 6.23 | | | | 2.00 | | | | 0.97 | |
| | | | | |
| Net asset value, end of year | | | $33.35 | | | | $33.23 | | | | $29.60 | | | | $23.37 | | | | $21.37 | |
Total return3 | | | 0.33 | %4 | | | 12.26 | % | | | 26.66 | % | | | 9.36 | % | | | 4.75 | % |
| | | | | |
| Net assets, end of year (000s) | | | $121 | | | | $34 | | | | $690 | | | | $1,421 | | | | $1,324 | |
| | | | | |
| Ratios to average net assets: | | | | | | | | | | | | | | | | | | | | |
Gross expenses | | | 1.52 | %5 | | | 1.83 | % | | | 1.85 | % | | | 1.71 | % | | | 1.91 | % |
Net expenses6,7 | | | 1.40 | 5 | | | 1.40 | | | | 1.40 | | | | 1.40 | | | | 1.40 | |
Net investment income (loss) | | | 0.79 | | | | (0.04) | | | | 0.19 | | | | (0.07) | | | | 0.05 | |
| | | | | |
| Portfolio turnover rate | | | 39 | % | | | 45 | % | | | 43 | % | | | 51 | % | | | 54 | % |
| 1 | Per share amounts have been calculated using the average shares method. |
| 2 | Represents a share of capital stock outstanding prior to February 29, 2012. |
| 3 | Performance figures may reflect compensating balance arrangements, fee waivers and/or expense reimbursements. In the absence of compensating balance arrangements, fee waivers and/or expense reimbursements, the total return would have been lower. Past performance is no guarantee of future results. |
| 4 | The total return includes gains from settlement of security litigations. Without these gains, the total return would have been 0.18% for the year ended October 31, 2015. The total return also includes the refund of withholding taxes on dividends, plus interest, previously paid by the Fund. Without this refund, the total return would have been -0.03% for the year ended October 31, 2015. In the aggregate, without these two items, the total return would have been -0.18% for the year ended October 31, 2015. |
| 5 | Reflects recapture of expenses waived/reimbursed from prior fiscal years. |
| 6 | As a result of an expense limitation arrangement, the ratio of expenses, other than interest, brokerage commissions, dividend expense on short sales, taxes, extraordinary expenses and acquired fund fees and expenses, to average net assets of Class R shares did not exceed 1.40%. This expense limitation arrangement cannot be terminated prior to December 31, 2017 without the Board of Trustees’ consent. |
| 7 | Reflects fee waivers and/or expense reimbursements. |
See Notes to Financial Statements.
| | |
| 24 | | ClearBridge Global Growth Trust 2015 Annual Report |
| | | | | | | | | | | | | | | | | | | | |
| For a share of each class of beneficial interest outstanding throughout each year ended October 31: | |
| Class I Shares1 | | 2015 | | | 2014 | | | 2013 | | | 2012 | | | 20112 | |
| | | | | |
| Net asset value, beginning of year | | | $35.00 | | | | $31.00 | | | | $24.36 | | | | $22.17 | | | | $21.05 | |
| | | | | |
| Income from operations: | | | | | | | | | | | | | | | | | | | | |
Net investment income | | | 0.25 | | | | 0.14 | | | | 0.19 | | | | 0.10 | | | | 0.13 | |
Net realized and unrealized gain | | | 0.05 | | | | 3.86 | | | | 6.45 | | | | 2.09 | | | | 0.99 | |
Total income from operations | | | 0.30 | | | | 4.00 | | | | 6.64 | | | | 2.19 | | | | 1.12 | |
| | | | | |
| Net asset value, end of year | | | $35.30 | | | | $35.00 | | | | $31.00 | | | | $24.36 | | | | $22.17 | |
Total return3 | | | 0.86 | %4 | | | 12.90 | % | | | 27.26 | % | | | 9.88 | % | | | 5.32 | % |
| | | | | |
| Net assets, end of year (000s) | | | $20,402 | | | | $18,554 | | | | $17,777 | | | | $18,424 | | | | $19,572 | |
| | | | | |
| Ratios to average net assets: | | | | | | | | | | | | | | | | | | | | |
Gross expenses | | | 0.96 | %5 | | | 1.02 | % | | | 1.06 | % | | | 0.96 | % | | | 0.90 | % |
Net expenses6,7 | | | 0.90 | 5 | | | 0.90 | | | | 0.90 | | | | 0.90 | | | | 0.88 | |
Net investment income | | | 0.69 | | | | 0.41 | | | | 0.70 | | | | 0.43 | | | | 0.58 | |
| | | | | |
| Portfolio turnover rate | | | 39 | % | | | 45 | % | | | 43 | % | | | 51 | % | | | 54 | % |
| 1 | Per share amounts have been calculated using the average shares method. |
| 2 | Represents a share of capital stock outstanding prior to February 29, 2012. |
| 3 | Performance figures may reflect compensating balance arrangements, fee waivers and/or expense reimbursements. In the absence of compensating balance arrangements, fee waivers and/or expense reimbursements, the total return would have been lower. Past performance is no guarantee of future results. |
| 4 | The total return includes gains from settlement of security litigations. Without these gains, the total return would have been 0.37% for the year ended October 31, 2015. The total return also includes the refund of withholding taxes on dividends, plus interest, previously paid by the Fund. Without this refund, the total return would have been 0.49% for the year ended October 31, 2015. In the aggregate, without these two items, the total return would have been 0.00% for the year ended October 31, 2015. |
| 5 | Reflects recapture of expenses waived/reimbursed from prior fiscal years. |
| 6 | As a result of an expense limitation arrangement, the ratio of expenses, other than interest, brokerage commissions, dividend expense on short sales, taxes, extraordinary expenses and acquired fund fees and expenses, to average net assets of Class I shares did not exceed 0.90%. This expense limitation arrangement cannot be terminated prior to December 31, 2017 without the Board of Trustees’ consent. |
| 7 | Reflects fee waivers and/or expense reimbursements. |
See Notes to Financial Statements.
| | |
| ClearBridge Global Growth Trust 2015 Annual Report | | 25 |
Notes to financial statements
1. Organization and significant accounting policies
ClearBridge Global Growth Trust (the “Fund”) is a separate non-diversified investment series of Legg Mason Global Asset Management Trust (the “Trust”). The Trust, a Maryland statutory trust, is registered under the Investment Company Act of 1940, as amended (the “1940 Act”), as an open-end management investment company.
The following are significant accounting policies consistently followed by the Fund and are in conformity with U.S. generally accepted accounting principles (“GAAP”). Estimates and assumptions are required to be made regarding assets, liabilities and changes in net assets resulting from operations when financial statements are prepared. Changes in the economic environment, financial markets and any other parameters used in determining these estimates could cause actual results to differ. Subsequent events have been evaluated through the date the financial statements were issued.
(a) Investment valuation. Equity securities for which market quotations are available are valued at the last reported sales price or official closing price on the primary market or exchange on which they trade. The valuations for fixed income securities (which may include, but are not limited to, corporate, government, municipal, mortgage-backed, collateralized mortgage obligations and asset-backed securities) and certain derivative instruments are typically the prices supplied by independent third party pricing services, which may use market prices or broker/dealer quotations or a variety of valuation techniques and methodologies. The independent third party pricing services use inputs that are observable such as issuer details, interest rates, yield curves, prepayment speeds, credit risks/spreads, default rates and quoted prices for similar securities. Short-term fixed income securities that will mature in 60 days or less are valued at amortized cost, unless it is determined that using this method would not reflect an investment’s fair value. Investments in open-end funds are valued at the closing net asset value per share of each fund on the day of valuation. When the Fund holds securities or other assets that are denominated in a foreign currency, the Fund will normally use the currency exchange rates as of 4:00 p.m. (Eastern Time). If independent third party pricing services are unable to supply prices for a portfolio investment, or if the prices supplied are deemed by the manager to be unreliable, the market price may be determined by the manager using quotations from one or more broker/dealers or at the transaction price if the security has recently been purchased and no value has yet been obtained from a pricing service or pricing broker. When reliable prices are not readily available, such as when the value of a security has been significantly affected by events after the close of the exchange or market on which the security is principally traded, but before the Fund calculates its net asset value, the Fund values these securities as determined in accordance with procedures approved by the Fund’s Board of Trustees.
The Board of Trustees is responsible for the valuation process and has delegated the supervision of the daily valuation process to the Legg Mason North Atlantic Fund Valuation Committee (formerly, Legg Mason North American Fund Valuation Committee) (the “Valuation Committee”). The Valuation Committee, pursuant to the policies adopted by the
| | |
| 26 | | ClearBridge Global Growth Trust 2015 Annual Report |
Board of Trustees, is responsible for making fair value determinations, evaluating the effectiveness of the Fund’s pricing policies, and reporting to the Board of Trustees. When determining the reliability of third party pricing information for investments owned by the Fund, the Valuation Committee, among other things, conducts due diligence reviews of pricing vendors, monitors the daily change in prices and reviews transactions among market participants.
The Valuation Committee will consider pricing methodologies it deems relevant and appropriate when making fair value determinations. Examples of possible methodologies include, but are not limited to, multiple of earnings; discount from market of a similar freely traded security; discounted cash-flow analysis; book value or a multiple thereof; risk premium/yield analysis; yield to maturity; and/or fundamental investment analysis. The Valuation Committee will also consider factors it deems relevant and appropriate in light of the facts and circumstances. Examples of possible factors include, but are not limited to, the type of security; the issuer’s financial statements; the purchase price of the security; the discount from market value of unrestricted securities of the same class at the time of purchase; analysts’ research and observations from financial institutions; information regarding any transactions or offers with respect to the security; the existence of merger proposals or tender offers affecting the security; the price and extent of public trading in similar securities of the issuer or comparable companies; and the existence of a shelf registration for restricted securities.
For each portfolio security that has been fair valued pursuant to the policies adopted by the Board of Trustees, the fair value price is compared against the last available and next available market quotations. The Valuation Committee reviews the results of such back testing monthly and fair valuation occurrences are reported to the Board of Trustees quarterly.
The Fund uses valuation techniques to measure fair value that are consistent with the market approach and/or income approach, depending on the type of security and the particular circumstance. The market approach uses prices and other relevant information generated by market transactions involving identical or comparable securities. The income approach uses valuation techniques to discount estimated future cash flows to present value.
GAAP establishes a disclosure hierarchy that categorizes the inputs to valuation techniques used to value assets and liabilities at measurement date. These inputs are summarized in the three broad levels listed below:
| • | | Level 1 — quoted prices in active markets for identical investments |
| • | | Level 2 — other significant observable inputs (including quoted prices for similar investments, interest rates, prepayment speeds, credit risk, etc.) |
| • | | Level 3 — significant unobservable inputs (including the Fund’s own assumptions in determining the fair value of investments) |
| | |
| ClearBridge Global Growth Trust 2015 Annual Report | | 27 |
Notes to financial statements (cont’d)
The inputs or methodologies used to value securities are not necessarily an indication of the risk associated with investing in those securities.
The following is a summary of the inputs used in valuing the Fund’s assets carried at fair value:
| | | | | | | | | | | | | | | | |
| ASSETS | |
| Description | | Quoted Prices
(Level 1) | | | Other Significant
Observable Inputs
(Level 2) | | | Significant
Unobservable
Inputs (Level 3) | | | Total | |
| Long-term investments†: | | | | | | | | | | | | | | | | |
Common stocks: | | | | | | | | | | | | | | | | |
Consumer discretionary | | $ | 13,211,268 | | | $ | 10,053,187 | | | | — | | | $ | 23,264,455 | |
Consumer staples | | | 9,363,588 | | | | 5,948,052 | | | | — | | | | 15,311,640 | |
Energy | | | 9,508,626 | | | | — | | | | — | | | | 9,508,626 | |
Financials | | | 4,909,162 | | | | 7,714,130 | | | | — | | | | 12,623,292 | |
Health care | | | 14,180,486 | | | | 4,349,521 | | | | — | | | | 18,530,007 | |
Industrials | | | 6,932,976 | | | | 4,813,794 | | | | — | | | | 11,746,770 | |
Information technology | | | 28,405,320 | | | | 4,847,174 | | | | — | | | | 33,252,494 | |
Materials | | | 1,233,408 | | | | 3,574,686 | | | | — | | | | 4,808,094 | |
Preferred stocks | | | 517,127 | | | | — | | | | — | | | | 517,127 | |
| Total long-term investments | | $ | 88,261,961 | | | $ | 41,300,544 | | | | — | | | $ | 129,562,505 | |
| Short-term investments† | | | 3,372,826 | | | | — | | | | — | | | | 3,372,826 | |
| Total investments | | $ | 91,634,787 | | | $ | 41,300,544 | | | | — | | | $ | 132,935,331 | |
| † | See Schedule of Investments for additional detailed categorizations. |
For the year ended October 31, 2015, as a result of the fair value pricing procedures for international equities utilized by the Fund, certain securities have transferred in and out of Level 1 and Level 2 measurements during the period. The Fund’s policy is to recognize transfers between levels as of the end of the reporting period. At October 31, 2015, securities valued at $41,300,544 were classified as Level 2 within the fair value hierarchy because fair value procedures were applied when the change in value of a domestic equity security index suggested that the closing prices on foreign exchanges may no longer have represented the value of those securities at the time of closing of the NYSE.
(b) Repurchase agreements. The Fund may enter into repurchase agreements with institutions that its investment manager has determined are creditworthy. Each repurchase agreement is recorded at cost. Under the terms of a typical repurchase agreement, the Fund acquires a debt security subject to an obligation of the seller to repurchase, and of the Fund to resell, the security at an agreed-upon price and time, thereby determining the yield during the Fund’s holding period. When entering into repurchase agreements, it is the Fund’s policy that its custodian or a third party custodian, acting on the Fund’s behalf, take possession of the underlying collateral securities, the market value of which, at all times, at least equals the principal amount of the repurchase transaction, including accrued interest. To the extent that any repurchase transaction maturity exceeds one business day, the value
| | |
| 28 | | ClearBridge Global Growth Trust 2015 Annual Report |
of the collateral is marked-to-market and measured against the value of the agreement in an effort to ensure the adequacy of the collateral. If the counterparty defaults, the Fund generally has the right to use the collateral to satisfy the terms of the repurchase transaction. However, if the market value of the collateral declines during the period in which the Fund seeks to assert its rights or if bankruptcy proceedings are commenced with respect to the seller of the security, realization of the collateral by the Fund may be delayed or limited.
(c) Forward foreign currency contracts. The Fund enters into a forward foreign currency contract to hedge against foreign currency exchange rate risk on its non-U.S. dollar denominated securities or to facilitate settlement of a foreign currency denominated portfolio transaction. A forward foreign currency contract is an agreement between two parties to buy and sell a currency at a set price with delivery and settlement at a future date. The contract is marked-to-market daily and the change in value is recorded by the Fund as an unrealized gain or loss. When a forward foreign currency contract is closed, through either delivery or offset by entering into another forward foreign currency contract, the Fund recognizes a realized gain or loss equal to the difference between the value of the contract at the time it was opened and the value of the contract at the time it is closed.
Forward foreign currency contracts involve elements of market risk in excess of the amounts reflected on the Statement of Assets and Liabilities. The Fund bears the risk of an unfavorable change in the foreign exchange rate underlying the forward foreign currency contract. Risks may also arise upon entering into these contracts from the potential inability of the counterparties to meet the terms of their contracts.
(d) Foreign currency translation. Investment securities and other assets and liabilities denominated in foreign currencies are translated into U.S. dollar amounts based upon prevailing exchange rates on the date of valuation. Purchases and sales of investment securities and income and expense items denominated in foreign currencies are translated into U.S. dollar amounts based upon prevailing exchange rates on the respective dates of such transactions.
The Fund does not isolate that portion of the results of operations resulting from fluctuations in foreign exchange rates on investments from the fluctuations arising from changes in market prices of securities held. Such fluctuations are included with the net realized and unrealized gain or loss on investments.
Net realized foreign exchange gains or losses arise from sales of foreign currencies, including gains and losses on forward foreign currency contracts, currency gains or losses realized between the trade and settlement dates on securities transactions, and the difference between the amounts of dividends, interest, and foreign withholding taxes recorded on the Fund’s books and the U.S. dollar equivalent of the amounts actually received or paid. Net unrealized foreign exchange gains and losses arise from changes in the values of assets and liabilities, other than investments in securities, on the date of valuation, resulting from changes in exchange rates.
| | |
| ClearBridge Global Growth Trust 2015 Annual Report | | 29 |
Notes to financial statements (cont’d)
Foreign security and currency transactions may involve certain considerations and risks not typically associated with those of U.S. dollar denominated transactions as a result of, among other factors, the possibility of lower levels of governmental supervision and regulation of foreign securities markets and the possibility of political or economic instability.
(e) Foreign investment risks. The Fund’s investments in foreign securities may involve risks not present in domestic investments. Since securities may be denominated in foreign currencies, may require settlement in foreign currencies or pay interest or dividends in foreign currencies, changes in the relationship of these foreign currencies to the U.S. dollar can significantly affect the value of the investments and earnings of the Fund. Foreign investments may also subject the Fund to foreign government exchange restrictions, expropriation, taxation or other political, social or economic developments, all of which affect the market and/or credit risk of the investments.
(f) Counterparty risk and credit-risk-related contingent features of derivative instruments. The Fund may invest in certain securities or engage in other transactions, where the Fund is exposed to counterparty credit risk in addition to broader market risks. The Fund may invest in securities of issuers, which may also be considered counterparties as trading partners in other transactions. This may increase the risk of loss in the event of default or bankruptcy by the counterparty or if the counterparty otherwise fails to meet its contractual obligations. The Fund’s investment manager attempts to mitigate counterparty risk by (i) periodically assessing the creditworthiness of its trading partners, (ii) monitoring and/or limiting the amount of its net exposure to each individual counterparty based on its assessment and (iii) requiring collateral from the counterparty for certain transactions. Market events and changes in overall economic conditions may impact the assessment of such counterparty risk by the investment manager. In addition, declines in the values of underlying collateral received may expose the Fund to increased risk of loss.
The Fund has entered into master agreements with certain of its derivative counterparties that provide for general obligations, representations, agreements, collateral, events of default or termination and credit related contingent features. The credit related contingent features include, but are not limited to, a percentage decrease in the Fund’s net assets or NAV over a specified period of time. If these credit related contingent features were triggered, the derivatives counterparty could terminate the positions and demand payment or require additional collateral.
Collateral requirements differ by type of derivative. Collateral or margin requirements are set by the broker or exchange clearinghouse for exchange traded derivatives while collateral terms are contract specific for over-the-counter traded derivatives. Cash collateral that has been pledged to cover obligations of the Fund under derivative contracts, if any, will be reported separately in the Statement of Assets and Liabilities. Securities pledged as collateral, if any, for the same purpose are noted in the Schedule of Investments.
| | |
| 30 | | ClearBridge Global Growth Trust 2015 Annual Report |
Absent an event of default by the counterparty or a termination of the agreement, the terms of the master agreements do not result in an offset of reported amounts of financial assets and financial liabilities in the Statement of Assets and Liabilities across transactions between the Fund and the applicable counterparty. The enforceability of the right to offset may vary by jurisdiction.
As of October 31, 2015, the Fund did not have any open derivative transactions with credit related contingent features in a net liability position.
(g) Security transactions and investment income. Security transactions are accounted for on a trade date basis. Interest income, adjusted for amortization of premium and accretion of discount, is recorded on the accrual basis. Dividend income is recorded on the ex-dividend date. Foreign dividend income is recorded on the ex-dividend date or as soon as practicable after the Fund determines the existence of a dividend declaration after exercising reasonable due diligence. The cost of investments sold is determined by use of the specific identification method. To the extent any issuer defaults or a credit event occurs that impacts the issuer, the Fund may halt any additional interest income accruals and consider the realizability of interest accrued up to the date of default or credit event.
(h) REIT distributions. The character of distributions received from Real Estate Investment Trusts (‘‘REITs’’) held by the Fund is generally comprised of net investment income, capital gains, and return of capital. It is the policy of the Fund to estimate the character of distributions received from underlying REITs based on historical data provided by the REITs. After each calendar year end, REITs report the actual tax character of these distributions. Differences between the estimated and actual amounts reported by the REITs are reflected in the Fund’s records in the year in which they are reported by the REITs by adjusting related investment cost basis, capital gains and income, as necessary.
(i) Distributions to shareholders. Distributions from net investment income and distributions of net realized gains, if any, are declared at least annually. Distributions to shareholders of the Fund are recorded on the ex-dividend date and are determined in accordance with income tax regulations, which may differ from GAAP.
(j) Share class accounting. Investment income, common expenses and realized/unrealized gains (losses) on investments are allocated to the various classes of the Fund on the basis of daily net assets of each class. Fees relating to a specific class are charged directly to that share class.
(k) Compensating balance arrangements. The Fund has an arrangement with its custodian bank whereby a portion of the custodian’s fees is paid indirectly by credits earned on the Fund’s cash on deposit with the bank.
(l) Commission recapture. The Fund has entered into an agreement with State Street Bank, its custodian, whereby a portion of commissions paid on investment transactions may be rebated to the Fund. Such payments are included with realized gain (loss) on investment transactions. During the year ended October 31, 2015, the Fund did not receive any commission rebates.
| | |
| ClearBridge Global Growth Trust 2015 Annual Report | | 31 |
Notes to financial statements (cont’d)
(m) Federal and other taxes. It is the Fund’s policy to comply with the federal income and excise tax requirements of the Internal Revenue Code of 1986 (the “Code”), as amended, applicable to regulated investment companies. Accordingly, the Fund intends to distribute its taxable income and net realized gains, if any, to shareholders in accordance with timing requirements imposed by the Code. Therefore, no federal or state income tax provision is required in the Fund’s financial statements.
Management has analyzed the Fund’s tax positions taken on income tax returns for all open tax years and has concluded that as of October 31, 2015, no provision for income tax is required in the Fund’s financial statements. The Fund’s federal and state income and federal excise tax returns for tax years for which the applicable statutes of limitations have not expired are subject to examination by the Internal Revenue Service and state departments of revenue.
Under the applicable foreign tax laws, a withholding tax may be imposed on interest, dividends and capital gains at various rates.
On September 22, 2015, the Fund received $516,403 from the Finnish Tax Administration for the refund of withholding taxes on dividends, plus interest, previously paid by the Fund.
(n) Reclassification. GAAP requires that certain components of net assets be reclassified to reflect permanent differences between financial and tax reporting. These reclassifications have no effect on net assets or net asset value per share. During the current year, the following reclassifications have been made:
| | | | | | | | | | | | |
| | | Accumulated Net
Investment Loss | | | Accumulated Net Realized Loss | | | Paid-in
Capital | |
| (a) | | $ | 664,535 | | | | — | | | $ | (664,535) | |
| (b) | | | 30,339 | | | $ | (30,339) | | | | — | |
| (a) | Reclassifications are due to a tax net operating loss. |
| (b) | Reclassifications are due to foreign currency transactions treated as ordinary income for tax purposes and book/tax differences in the treatment of partnership investments. |
2. Investment advisory and management agreement and other transactions with affiliates
The Fund has an investment advisory and management agreement with ClearBridge, LLC (“ClearBridge”). Pursuant to the agreement, ClearBridge provides the Fund with investment advisory, management and administrative services for which the Fund pays a fee, computed daily and payable monthly, at annual rates based on the Fund’s average daily net assets. Western Asset Management Company (“Western Asset”) manages the portion of the Fund’s cash and short-term instruments allocated to it. The following chart shows the annual advisory fee rates for the Fund:
| | | | |
| Average Daily Net Assets | | Annual Rate | |
| First $1 billion | | | 0.700 | % |
| Next $1 billion | | | 0.680 | |
| Next $3 billion | | | 0.650 | |
| Next $5 billion | | | 0.620 | |
| Over $10 billion | | | 0.590 | |
| | |
| 32 | | ClearBridge Global Growth Trust 2015 Annual Report |
Legg Mason Partners Fund Advisor, LLC (“LMPFA”) provides certain administrative and oversight services to the Fund. For LMPFA’s services to the Fund, ClearBridge (not the Fund) pays LMPFA a fee, calculated daily and payable monthly, at an annual rate of 0.05% of the average daily net assets of the Fund. For Western Asset’s services to the Fund, ClearBridge (not the Fund) pays Western Asset 0.02% of the portion of the Fund’s average daily net assets that are allocated to them by ClearBridge. ClearBridge, LMPFA and Western Asset are wholly owned subsidiaries of Legg Mason, Inc. (“Legg Mason”).
As a result of expense limitation arrangements between the Fund and ClearBridge, the ratio of expenses, other than interest, brokerage commissions, dividend expenses on short sales, taxes, extraordinary expenses and acquired fund fees and expenses, to average net assets of Class A, Class C, Class FI, Class R and Class I shares did not exceed 1.15%, 1.90%, 1.15%, 1.40% and 0.90%, respectively. These expense limitation arrangements cannot be terminated prior to December 31, 2017 without the Board of Trustees’ consent.
During the year ended October 31, 2015, fees waived and/or expenses reimbursed amounted to $136,623.
ClearBridge is permitted to recapture amounts waived and/or reimbursed to a class within three years after the fiscal year in which ClearBridge earned the fee or incurred the expense if the class’ total annual operating expenses have fallen to a level below the expense limitation (“expense cap”) in effect at the time the fees were earned or the expenses incurred. In no case will ClearBridge recapture any amount that would result, on any particular business day of the Fund, in the class’ total annual operating expenses exceeding the expense cap or any other lower limit then in effect.
Pursuant to these arrangements, at October 31, 2015, the Fund had remaining fee waivers and/or expense reimbursements subject to recapture by ClearBridge and respective dates of expiration as follows:
| | | | | | | | | | | | | | | | | | | | |
| | | Class A | | | Class C | | | Class FI | | | Class R | | | Class I | |
| Expires October 31, 2016 | | $ | 15,898 | | | $ | 187,812 | | | $ | 13,769 | | | $ | 4,143 | | | $ | 28,070 | |
| Expires October 31, 2017 | | | 13,576 | | | | 166,781 | | | | 26,789 | | | | 2,224 | | | | 21,541 | |
| Expires October 31, 2018 | | | 4,511 | | | | 104,825 | | | | 16,238 | | | | 68 | | | | 10,981 | |
| Total fee waivers/expense reimbursements subject to recapture | | $ | 33,985 | | | $ | 459,418 | | | $ | 56,796 | | | $ | 6,435 | | | $ | 60,592 | |
For the year ended October 31, 2015, ClearBridge recaptured $34, $62, $29 and $47 for Class A, Class FI, Class R and Class I shares, respectively.
Legg Mason Investor Services, LLC (“LMIS”), a wholly-owned broker-dealer subsidiary of Legg Mason, serves as the Fund’s sole and exclusive distributor.
There is a maximum initial sales charge of 5.75% for Class A shares. There is a contingent deferred sales charge (“CDSC”) of 1.00% on Class C shares, which applies if redemption occurs within 12 months from purchase payment. In certain cases, Class A shares have a
| | |
| ClearBridge Global Growth Trust 2015 Annual Report | | 33 |
Notes to financial statements (cont’d)
1.00% CDSC, which applies if redemption occurs within 18 months from purchase payment. This CDSC only applies to those purchases of Class A shares, which, when combined with current holdings of other shares of funds sold by LMIS, equal or exceed $1,000,000 in the aggregate. These purchases do not incur an initial sales charge.
For the year ended October 31, 2015, LMIS and its affiliates retained sales charges of $5,959 on sales of the Fund’s Class A shares. In addition, for the year ended October 31, 2015, CDSCs paid to LMIS and its affiliates were:
| | | | | | | | |
| | | Class A | | | Class C | |
| CDSCs | | $ | 716 | | | $ | 1,389 | |
Under a Deferred Compensation Plan (the “Plan”), Trustees may elect to defer receipt of all or a specified portion of their compensation. A participating Trustee may select one or more funds managed by affiliates of Legg Mason in which his or her deferred trustee’s fees will be deemed to be invested. Deferred amounts remain in the Fund until distributed in accordance with the Plan. In May 2015, the Board of Trustees approved an amendment to the Plan so that effective January 1, 2016, no compensation earned after that date may be deferred under the Plan.
All officers and one Trustee of the Trust are employees of Legg Mason or its affiliates and do not receive compensation from the Trust.
3. Investments
During the year ended October 31, 2015, the aggregate cost of purchases and proceeds from sales of investments (excluding short-term investments) were as follows:
| | | | |
| Purchases | | $ | 54,853,302 | |
| Sales | | | 67,368,311 | |
At October 31, 2015, the aggregate gross unrealized appreciation and depreciation of investments for federal income tax purposes were as follows:
| | | | |
| Gross unrealized appreciation | | $ | 27,171,613 | |
| Gross unrealized depreciation | | | (10,051,585) | |
| Net unrealized appreciation | | $ | 17,120,028 | |
4. Derivative instruments and hedging activities
At October 31, 2015, the Fund did not have derivative instruments outstanding.
The following table provides information about the effect of derivatives and hedging activities on the Fund’s Statement of Operations for the year ended October 31, 2015. The table provides additional detail about the amounts and sources of gains (losses) realized on derivatives during the period.
| | | | |
| AMOUNT OF REALIZED GAIN (LOSS) ON DERIVATIVES RECOGNIZED | |
| | | Foreign Exchange
Risk | |
| Forward foreign currency contracts1 | | $ | (3,862) | |
| 1 | Net realized gain (loss) from forward foreign currency contracts is reported in net realized gain (loss) from foreign currency transactions in the Statement of Operations. |
| | |
| 34 | | ClearBridge Global Growth Trust 2015 Annual Report |
During the year ended October 31, 2015, the volume of derivative activity for the Fund was as follows:
| | | | |
| | | Average Market
Value | |
| Forward foreign currency contracts (to buy)† | | $ | 30,839 | |
| † | At October 31, 2015, there were no open positions held in this derivative. |
5. Class specific expenses, waivers and/or expense reimbursements
The Fund has adopted a Rule 12b-1 shareholder services and distribution plan and under that plan the Fund pays service and/or distribution fees with respect to its Class A, Class C, Class FI and Class R shares calculated at the annual rate of 0.25%, 1.00% 0.25% and 0.50% of the average daily net assets of each class, respectively. Service and/or distribution fees are accrued daily and paid monthly.
For the year ended October 31, 2015, class specific expenses were as follows:
| | | | | | | | |
| | | Service and/or
Distribution Fees | | | Transfer Agent
Fees | |
| Class A | | $ | 26,327 | | | $ | 7,908 | |
| Class C | | | 1,006,777 | | | | 138,558 | |
| Class FI | | | 33,278 | | | | 20,589 | |
| Class R | | | 287 | | | | 50 | |
| Class I | | | — | | | | 17,343 | |
| Total | | $ | 1,066,669 | | | $ | 184,448 | |
For the year ended October 31, 2015, waivers and/or expense reimbursements by class were as follows:
| | | | |
| | | Waivers/Expense
Reimbursements | |
| Class A | | $ | 4,511 | |
| Class C | | | 104,825 | |
| Class FI | | | 16,238 | |
| Class R | | | 68 | |
| Class I | | | 10,981 | |
| Total | | $ | 136,623 | |
6. Shares of beneficial interest
At October 31, 2015, the Trust had an unlimited number of shares of beneficial interest authorized with a par value of $0.00001 per share. The Fund has the ability to issue multiple classes of shares. Each class of shares represents an identical interest and has the same rights, except that each class bears certain direct expenses, including those specifically related to the distribution of its shares.
| | |
| ClearBridge Global Growth Trust 2015 Annual Report | | 35 |
Notes to financial statements (cont’d)
Transactions in shares of each class were as follows:
| | | | | | | | | | | | | | | | |
| | | Year Ended
October 31, 2015 | | | Year Ended
October 31, 2014 | |
| | | Shares | | | Amount | | | Shares | | | Amount | |
| Class A | | | | | | | | | | | | | | | | |
| Shares sold | | | 95,036 | | | $ | 3,197,744 | | | | 50,850 | | | $ | 1,594,575 | |
| Shares repurchased | | | (83,019) | | | | (2,785,266) | | | | (40,348) | | | | (1,263,511) | |
| Net increase | | | 12,017 | | | $ | 412,478 | | | | 10,502 | | | $ | 331,064 | |
| | | | |
| Class C | | | | | | | | | | | | | | | | |
| Shares sold | | | 127,215 | | | $ | 4,036,300 | | | | 118,175 | | | $ | 3,490,778 | |
| Shares repurchased | | | (507,660) | | | | (16,191,377) | | | | (671,011) | | | | (19,956,339) | |
| Net decrease | | | (380,445) | | | $ | (12,155,077) | | | | (552,836) | | | $ | (16,465,561) | |
| | | | |
| Class FI | | | | | | | | | | | | | | | | |
| Shares sold | | | 189,919 | | | $ | 6,921,562 | | | | 40,677 | | | $ | 1,318,782 | |
| Shares repurchased | | | (199,943) | | | | (6,611,216) | | | | (80,504) | | | | (2,600,954) | |
| Net decrease | | | (10,024) | | | $ | 310,346 | | | | (39,827) | | | $ | (1,282,172) | |
| | | | |
| Class R | | | | | | | | | | | | | | | | |
| Shares sold | | | 2,960 | | | $ | 103,257 | | | | 19,781 | | | $ | 638,731 | |
| Shares repurchased | | | (359) | | | | (12,251) | | | | (42,047) | | | | (1,364,145) | |
| Net increase (decrease) | | | 2,601 | | | $ | 91,006 | | | | (22,266) | | | $ | (725,414) | |
| | | | |
| Class I | | | | | | | | | | | | | | | | |
| Shares sold | | | 155,370 | | | $ | 5,609,223 | | | | 83,084 | | | $ | 2,767,150 | |
| Shares repurchased | | | (107,550) | | | | (3,815,470) | | | | (126,328) | | | | (4,181,073) | |
| Net increase (decrease) | | | 47,820 | | | $ | 1,793,753 | | | | (43,244) | | | $ | (1,413,923) | |
7. Income tax information and distributions to shareholders
The Fund did not make any distributions during the fiscal years ended October 31, 2015 and 2014.
As of October 31, 2015, the components of accumulated earnings (losses) on a tax basis were as follows:
| | | | |
| Capital loss carryforward** | | $ | (313,972,097) | |
| Other book/tax temporary differences(a) | | | (118,754) | |
| Unrealized appreciation (depreciation)(b) | | | 17,114,787 | |
| Total accumulated earnings (losses) — net | | $ | (296,976,064) | |
| ** | During the taxable year ended October 31, 2015, the Fund utilized $14,074,639 of its capital loss carryforward available from prior years. As of October 31, 2015, the Fund had the following net capital loss carryforwards remaining: |
| | | | |
| Year of Expiration | | Amount | |
| 10/31/2016 | | $ | (143,267,607 | ) |
| 10/31/2017 | | | (170,704,490 | ) |
| | | $ | (313,972,097 | ) |
These amounts will be available to offset any future taxable capital gains.
| (a) | Other book/tax temporary differences are attributable to book/tax differences in the treatment of distributions from real estate investments and book/tax differences in the timing of the deductibility of various expenses. |
| (b) | The difference between book-basis and tax-basis unrealized appreciation (depreciation) is attributable to the realization for tax purposes of unrealized gains on investments in passive foreign investment companies and the book/tax differences in the treatment of distributions from partnerships. |
| | |
| 36 | | ClearBridge Global Growth Trust 2015 Annual Report |
8. Subsequent event
On October 15, 2015, the Board of Trustees approved changes to the Fund’s principal investment strategy, name, benchmark and other related changes. Effective December 31, 2015, the Fund will adopt a new investment strategy. The Fund’s current global growth investment strategy will be replaced with an international growth strategy. The Fund currently invests “primarily in common stocks of U.S. and foreign companies”. Pursuant to the new international growth strategy, the Fund will “normally invest primarily in common stocks of foreign companies”. However, the Fund is not precluded from purchasing stocks of U.S. companies. In addition, at this time, the Fund’s name will change to ClearBridge International Growth Fund, and the Fund’s benchmark will change from the MSCI All Country World Index to the MSCI EAFE (Europe, Australia, Far East) Index. The benchmark change is consistent with the Fund’s name and investment strategy changes as described above. The Fund’s investment objective remains unchanged.
| | |
| ClearBridge Global Growth Trust 2015 Annual Report | | 37 |
Report of independent registered public accounting firm
To the Board of Trustees of Legg Mason Global Asset Management Trust and to the Shareholders of ClearBridge Global Growth Trust:
In our opinion, the accompanying statement of assets and liabilities, including the schedule of investments, and the related statements of operations and of changes in net assets and the financial highlights present fairly, in all material respects, the financial position of the ClearBridge Global Growth Trust (one of the funds comprising Legg Mason Global Asset Management Trust, the “Fund”) at October 31, 2015, the results of its operations, the changes in its net assets and the financial highlights for each of the periods presented, in conformity with accounting principles generally accepted in the United States of America. These financial statements and financial highlights (hereafter referred to as “financial statements”) are the responsibility of the Fund’s management. Our responsibility is to express an opinion on these financial statements based on our audits. We conducted our audits of these financial statements in accordance with the standards of the Public Company Accounting Oversight Board (United States). Those standards require that we plan and perform the audit to obtain reasonable assurance about whether the financial statements are free of material misstatement. An audit includes examining, on a test basis, evidence supporting the amounts and disclosures in the financial statements, assessing the accounting principles used and significant estimates made by management, and evaluating the overall financial statement presentation. We believe that our audits, which included confirmation of securities at October 31, 2015 by correspondence with the custodian and brokers, provide a reasonable basis for our opinion.
PricewaterhouseCoopers LLP
Baltimore, Maryland
December 21, 2015
| | |
| 38 | | ClearBridge Global Growth Trust 2015 Annual Report |
Additional information (unaudited)
Information about Trustees and Officers
The business and affairs of ClearBridge Global Growth Trust (the “Fund”) are conducted by management under the supervision and subject to the direction of its Board of Trustees. The business address of each Trustee is c/o Jane Trust, Legg Mason, 100 International Drive, 11th Floor, Baltimore, Maryland 21202. Information pertaining to the Trustees and officers of the Fund is set forth below.
The Statement of Additional Information includes additional information about Trustees and is available, without charge, upon request by calling the Fund at 1-877-721-1926.
| | |
| Independent Trustees† |
| Ruby P. Hearn |
| Year of birth | | 1940 |
| Position(s) with Trust | | Trustee |
| Term of office1 and length of time served2 | | Since 2004 |
| Principal occupation(s) during past five years | | Senior Vice President Emerita of The Robert Wood Johnson Foundation (non-profit) since 2001; Member of the Institute of Medicine since 1982; formerly, Trustee of the New York Academy of Medicine (2004 to 2012); Director of the Institute for Healthcare Improvement (2002 to 2012); Senior Vice President of The Robert Wood Johnson Foundation (1996 to 2001); Fellow of The Yale Corporation (1992 to 1998) |
| Number of funds in fund complex overseen by Trustee | | 19 |
| Other board memberships held by Trustee during past five years | | None |
|
| Arnold L. Lehman |
| Year of birth | | 1944 |
| Position(s) with Trust | | Trustee and Chairman |
| Term of office1 and length of time served2 | | Since 1982 and since 2015 |
| Principal occupation(s) during past five years | | Retired. Trustee of American Federation of Arts since 1998; formerly, Director of the Brooklyn Museum (1997 to 2015); Director of The Baltimore Museum of Art (1979 to 1997) |
| Number of funds in fund complex overseen by Trustee | | 19 |
| Other board memberships held by Trustee during past five years | | None |
|
| Robin J.W. Masters |
| Year of birth | | 1955 |
| Position(s) with Trust | | Trustee |
| Term of office1 and length of time served2 | | Since 2002 |
| Principal occupation(s) during past five years | | Retired; formerly, Chief Investment Officer of ACE Limited (insurance) (1986 to 2000) |
| Number of funds in fund complex overseen by Trustee | | 19 |
| Other board memberships held by Trustee during past five years | | Director of Cheyne Capital International Limited (investment advisory firm); formerly, Director/Trustee of Legg Mason Institutional Funds plc, WA Fixed Income Funds plc and Western Asset Debt Securities Fund plc. (2007 to 2011) |
| | |
| ClearBridge Global Growth Trust | | 39 |
Additional information (unaudited) (cont’d)
Information about Trustees and Officers
| | |
| Independent Trustees† cont’d |
| Jill E. McGovern |
| Year of birth | | 1944 |
| Position(s) with Trust | | Trustee |
| Term of office1 and length of time served2 | | Since 1989 |
| Principal occupation(s) during past five years | | Senior Consultant, American Institute for Contemporary German Studies (AICGS) since 2007; formerly, Chief Executive Officer of The Marrow Foundation (non-profit) (1993 to 2007); Executive Director of the Baltimore International Festival (1991 to 1993); Senior Assistant to the President of The Johns Hopkins University (1986 to 1990) |
| Number of funds in fund complex overseen by Trustee | | 19 |
| Other board memberships held by Trustee during past five years | | Director of International Biomedical Research Alliance; Director of Lois Roth Endowment |
|
| Arthur S. Mehlman |
| Year of birth | | 1942 |
| Position(s) with Trust | | Trustee |
| Term of office1 and length of time served2 | | Since 2002 |
| Principal occupation(s) during past five years | | Retired. Director, The University of Maryland Foundation since 1992; Director, The League for People with Disabilities since 2003; formerly, Director, Municipal Mortgage & Equity LLC (2004 to 2011); Partner, KPMG LLP (international accounting firm) (1972 to 2002) |
| Number of funds in fund complex overseen by Trustee | | Director/Trustee of all Legg Mason Funds consisting of 18 portfolios; Director/Trustee of the Royce Family of Funds consisting of 26 portfolios |
| Other board memberships held by Trustee during past five years | | Director of Municipal Mortgage & Equity, LLC. (2004 to 2011) |
|
| G. Peter O’Brien |
| Year of birth | | 1945 |
| Position(s) with Trust | | Trustee |
| Term of office1 and length of time served2 | | Since 1999 |
| Principal occupation(s) during past five years | | Retired. Trustee Emeritus of Colgate University; Board Member, Hill House, Inc. (residential home care); Board Member, Bridges School (pre- school); formerly, Managing Director, Equity Capital Markets Group of Merrill Lynch & Co. (1971 to 1999) |
| Number of funds in fund complex overseen by Trustee | | Director/Trustee of all Legg Mason funds consisting of 18 portfolios; Director/Trustee of the Royce Family of Funds consisting of 26 portfolios |
| Other board memberships held by Trustee during past five years | | Director of TICC Capital Corp. |
| | |
| 40 | | ClearBridge Global Growth Trust |
| | |
| Independent Trustees† cont’d |
| S. Ford Rowan |
| Year of birth | | 1943 |
| Position(s) with Trust | | Trustee |
| Term of office1 and length of time served2 | | Since 2002 |
| Principal occupation(s) during past five years | | Chairman, National Center for Critical Incident Analysis, since 2004; Consultant to University of Maryland University College, since 2013; formerly, Lecturer in Organizational Sciences, George Washington University (2000 to 2014); Trustee, St. John’s College (2006 to 2012); Consultant, Rowan & Blewitt Inc. (management consulting) (1984 to 2007); Lecturer in Journalism, Northwestern University (1980 to 1993); Director, Santa Fe Institute (1999 to 2008) |
| Number of funds in fund complex overseen by Trustee | | 19 |
| Other board memberships held by Trustee during past five years | | None |
|
| Robert M. Tarola |
| Year of birth | | 1950 |
| Position(s) with Trust | | Trustee |
| Term of office1 and length of time served2 | | Since 2004 |
| Principal occupation(s) during past five years | | Executive Vice President and Chief Financial Officer, Southcoast Health System, Inc. (healthcare provider network) since 2015; President of Right Advisory LLC (corporate finance and governance consulting) since 2008; Member, Investor Advisory Group of the Public Company Accounting Oversight Board since 2009; formerly, Senior Vice President and Chief Financial Officer of The Howard University (2009 to 2013) (higher education and health care); Senior Vice President and Chief Financial Officer of W.R. Grace & Co. (specialty chemicals) (1999 to 2008) and MedStar Health, Inc. (healthcare) (1996 to 1999); Partner, Price Waterhouse, LLP (accounting and auditing) (1984 to 1996) |
| Number of funds in fund complex overseen by Trustee | | 19 |
| Other board memberships held by Trustee during past five years | | Director of American Kidney Fund (renal disease assistance); Director of XBRL International, Inc. (global data standard setting); Director of Vista Outdoor, Inc. (sporting goods); formerly, Director of TeleTech Holdings, Inc. (business process outsourcing) |
| | |
| | |
| ClearBridge Global Growth Trust | | 41 |
Additional information (unaudited) (cont’d)
Information about Trustees and Officers
| | |
| Interested Trustee |
Jane Trust3 | | |
| Year of birth | | 1962 |
| Position(s) with Trust | | Trustee, President and Chief Executive Officer |
| Term of office1 and length of time served2 | | Since 2015 |
| Principal occupation(s) during past five years | | Managing Director of Legg Mason & Co., LLC (“Legg Mason & Co.”) (since 2015); Officer and/or Trustee/Director of 156 funds associated with Legg Mason Partners Fund Advisor, LLC (“LMPFA”) or its affiliates (since 2015); President and Chief Executive Officer of LMPFA (since 2015); formerly, Senior Vice President of LMPFA (2015); formerly, Director of ClearBridge, LLC (formerly, Legg Mason Capital Management, LLC) (2007 to 2014); formerly, Managing Director of Legg Mason Investment Counsel & Trust Co. (2000 to 2007) |
| Number of funds in fund complex overseen by Trustee | | 147 |
Other board memberships held by Trustee during past
five years | | None |
| | |
| Executive Officers |
Richard F. Sennett Legg Mason 100 International Drive, 7th Floor, Baltimore, MD 21202 | | |
| Year of birth | | 1970 |
| Position(s) with Trust | | Principal Financial Officer |
| Term of office1 and length of time served2 | | Since 2011 |
| Principal occupation(s) during past five years | | Principal Financial Officer and Treasurer of certain mutual funds associated with Legg Mason & Co. or its affiliates (since 2011 and since 2013); Managing Director of Legg Mason & Co. and Senior Manager of the Treasury Policy group for Legg Mason & Co.’s Global Fiduciary Platform (since 2011); formerly, Chief Accountant within the SEC’s Division of Investment Management (2007 to 2011); formerly, Assistant Chief Accountant within the SEC’s Division of Investment Management (2002 to 2007) |
| |
Robert I. Frenkel Legg Mason 100 First Stamford Place, 6th Floor, Stamford, CT 06902 | | |
| Year of birth | | 1954 |
| Position(s) with Trust | | Secretary and Chief Legal Officer |
| Term of office1 and length of time served2 | | Since 2007 |
| Principal occupation(s) during past five years | | Vice President and Deputy General Counsel of Legg Mason (since 2006); Managing Director and General Counsel of — U.S. Mutual Funds for Legg Mason & Co. (since 2006) and Legg Mason & Co. predecessors (since 1994); Secretary and Chief Legal Officer of certain mutual funds associated with Legg Mason & Co. or its affiliates (since 2006) and Legg Mason & Co. predecessors (prior to 2006) |
| | |
| 42 | | ClearBridge Global Growth Trust |
| | |
| Executive Officers cont’d |
Ted P. Becker Legg Mason 620 Eighth Avenue, 49th Floor, New York, NY 10018 | | |
| Year of birth | | 1951 |
| Position(s) with Trust | | Vice President and Chief Compliance Officer |
| Term of office1 and length of time served2 | | Since 2007 |
| Principal occupation(s) during past five years | | Director of Global Compliance at Legg Mason (since 2006); Chief Compliance Officer of LMPFA (since 2006); Managing Director of Compliance of Legg Mason & Co. (since 2005); Chief Compliance Officer of certain mutual funds associated with Legg Mason & Co. or its affiliates (since 2006) and Legg Mason & Co. predecessors (prior to 2006) |
| |
Christopher Berarducci Legg Mason 620 Eighth Avenue, 49th Floor, New York, NY 10018 | | |
| Year of birth | | 1974 |
| Position(s) with Trust | | Treasurer |
| Term of office1 and length of time served2 | | Since 2010 |
| Principal occupation(s) during past five years | | Director of Legg Mason & Co. (since 2015); Treasurer of certain mutual funds associated with Legg Mason & Co. or its affiliates (since 2010); formerly, Vice President of Legg Mason & Co. (2011 to 2015); formerly, Assistant Controller of certain mutual funds associated with Legg Mason & Co. or its affiliates (prior to 2010) |
| |
Susan Kerr Legg Mason 620 Eighth Avenue, 49th Floor, New York, NY 10018 | | |
| Year of birth | | 1949 |
| Position(s) with Trust | | Chief Anti-Money Laundering Compliance Officer |
| Term of office1 and length of time served2 | | Since 2013 |
| Principal occupation(s) during past five years | | Assistant Vice President of Legg Mason & Co. and Legg Mason Investor Services, LLC (“LMIS”) (since 2010); Chief Anti-Money Laundering Compliance Officer of certain mutual funds associated with Legg Mason & Co. or its affiliates (since 2013) and Anti-Money Laundering Compliance Officer of LMIS (since 2012); Senior Compliance Officer of LMIS (since 2011); formerly, AML Consultant, DTCC (2010); formerly, AML Consultant, Rabobank Netherlands, (2009); formerly, First Vice President, Director of Marketing & Advertising Compliance and Manager of Communications Review Group at Citigroup Inc. (1996 to 2008) |
| | |
| ClearBridge Global Growth Trust | | 43 |
Additional information (unaudited) (cont’d)
Information about Trustees and Officers
| | |
| Executive Officers cont’d |
Vanessa A. Williams Legg Mason 100 First Stamford Place, 6th Floor, Stamford, CT 06902 | | |
| Year of birth | | 1979 |
| Position(s) with Trust | | Identity Theft Prevention Officer |
| Term of office1 and length of time served2 | | Since 2011 |
| Principal occupation(s) during past five years | | Vice President of Legg Mason & Co. (since 2012); Identity Theft Prevention Officer of certain mutual funds associated with Legg Mason & Co. or its affiliates (since 2011); formerly, Chief Anti-Money Laundering Compliance Officer of certain mutual funds associated with Legg Mason & Co. or its affiliates (2011 to 2013); formerly, Senior Compliance Officer of Legg Mason & Co. (2008 to 2011); formerly, Compliance Analyst of Legg Mason & Co. (2006 to 2008) and Legg Mason & Co. predecessors (prior to 2006) |
| † | Trustees who are not “interested persons” of the Fund within the meaning of Section 2(a)(19) of the Investment Company Act of 1940, as amended (the “1940 Act”). Each of the Independent Trustees serves on the standing committees of the Board of Trustees, which include the Audit Committee (chair:
Arthur S. Mehlman), the Nominating Committee (co-chairs: G. Peter O’Brien and Jill E. McGovern), and the Independent Trustees Committee (chair: Arnold L. Lehman). |
| 1 | Each Trustee and officer serves until his or her respective successor has been duly elected and qualified or until his or her earlier death, resignation, retirement or removal. |
| 2 | Indicates the earliest year in which the Trustee became a board member for a fund in the Legg Mason fund complex or the officer took such office. |
| 3 | Effective June 1, 2015, Ms. Trust became a Trustee. In addition, Ms. Trust is an “interested person” of the Fund, as defined in the 1940 Act, because of her position with LMPFA and/or certain of its affiliates. |
| | |
| 44 | | ClearBridge Global Growth Trust |
ClearBridge
Global Growth Trust
Trustees
Ruby P. Hearn
Arnold L. Lehman*
Chairman
Robin J.W. Masters
Jill E. McGovern
Arthur S. Mehlman
G. Peter O’Brien
S. Ford Rowan
Robert M. Tarola
Jane Trust*
| * | Effective June 1, 2015, Mr. Lehman became Chairman and Ms. Trust became a Trustee, President and Chief Executive Officer. |
Investment manager/adviser
ClearBridge, LLC
Distributor
Legg Mason Investor Services, LLC
Custodian
State Street Bank & Trust Company
Transfer agent
BNY Mellon Investment Servicing (US) Inc.
4400 Computer Drive
Westborough, MA 01581
Independent registered public accounting firm
PricewaterhouseCoopers LLP
Baltimore, MD
ClearBridge Global Growth Trust
The Fund is a separate investment series of Legg Mason Global Asset Management Trust, a Maryland statutory trust.
ClearBridge Global Growth Trust
Legg Mason Funds
620 Eighth Avenue, 49th Floor
New York, NY 10018
The Fund files its complete schedule of portfolio holdings with the Securities and Exchange Commission (“SEC”) for the first and third quarters of each fiscal year on Form N-Q. The Fund’s Forms N-Q are available on the SEC’s website at www.sec.gov. The Fund’s Forms N-Q may be reviewed and copied at the SEC’s Public Reference Room in Washington, D.C., and information on the operation of the Public Reference Room may be obtained by calling 1-800-SEC-0330. To obtain information on Form N-Q, shareholders can call the Fund at 1-877-721-1926.
Information on how the Fund voted proxies relating to portfolio securities during the prior 12-month period ended June 30th of each year and a description of the policies and procedures that the Fund uses to determine how to vote proxies related to portfolio transactions are available (1) without charge, upon request, by calling the Fund at 1-877-721-1926, (2) on the Fund’s website at www.leggmason.com/individualinvestors and (3) on the SEC’s website at www.sec.gov.
This report is submitted for the general information of the shareholders of ClearBridge Global Growth Trust. This report is not authorized for distribution to prospective investors in the Fund unless preceded or accompanied by a current prospectus.
Investors should consider the Fund’s investment objectives, risks, charges and expenses carefully before investing. The prospectus contains this and other important information about the Fund. Please read the prospectus carefully before investing.
www.leggmason.com/individualinvestors
© 2015 Legg Mason Investor Services, LLC
Member FINRA, SIPC
Legg Mason Funds Privacy and Security Notice
Your Privacy and the Security of Your Personal Information is Very Important to the Legg Mason Funds
This Privacy and Security Notice (the “Privacy Notice”) addresses the Legg Mason Funds’ privacy and data protection practices with respect to nonpublic personal information the Funds receive. The Legg Mason Funds include any funds sold by the Funds’ distributor, Legg Mason Investor Services, LLC, as well as Legg Mason-sponsored closed-end funds and certain closed-end funds managed or sub-advised by Legg Mason or its affiliates. The provisions of this Privacy Notice apply to your information both while you are a shareholder and after you are no longer invested with the Funds.
The Type of Nonpublic Personal Information the Funds Collect About You
The Funds collect and maintain nonpublic personal information about you in connection with your shareholder account. Such information may include, but is not limited to:
| • | | Personal information included on applications or other forms; |
| • | | Account balances, transactions, and mutual fund holdings and positions; |
| • | | Online account access user IDs, passwords, security challenge question responses; and |
| • | | Information received from consumer reporting agencies regarding credit history and creditworthiness (such as the amount of an individual’s total debt, payment history, etc.). |
How the Funds Use Nonpublic Personal Information About You
The Funds do not sell or share your nonpublic personal information with third parties or with affiliates for their marketing purposes, or with other financial institutions or affiliates for joint marketing purposes, unless you have authorized the Funds to do so. The Funds do not disclose any nonpublic personal information about you except as may be required to perform transactions or services you have authorized or as permitted or required by law. The Funds may disclose information about you to:
| • | | Employees, agents, and affiliates on a “need to know” basis to enable the Funds to conduct ordinary business or comply with obligations to government regulators; |
| • | | Service providers, including the Funds’ affiliates, who assist the Funds as part of the ordinary course of business (such as printing, mailing services, or processing or servicing your account with us) or otherwise perform services on the Funds’ behalf, including companies that may perform marketing services solely for the Funds; |
| • | | The Funds’ representatives such as legal counsel, accountants and auditors; and |
| • | | Fiduciaries or representatives acting on your behalf, such as an IRA custodian or trustee of a grantor trust. |
|
| NOT PART OF THE ANNUAL REPORT |
Legg Mason Funds Privacy and Security Notice (cont’d)
Except as otherwise permitted by applicable law, companies acting on the Funds’ behalf are contractually obligated to keep nonpublic personal information the Funds provide to them confidential and to use the information the Funds share only to provide the services the Funds ask them to perform.
The Funds may disclose nonpublic personal information about you when necessary to enforce their rights or protect against fraud, or as permitted or required by applicable law, such as in connection with a law enforcement or regulatory request, subpoena, or similar legal process. In the event of a corporate action or in the event a Fund service provider changes, the Funds may be required to disclose your nonpublic personal information to third parties. While it is the Funds’ practice to obtain protections for disclosed information in these types of transactions, the Funds cannot guarantee their privacy policy will remain unchanged.
Keeping You Informed of the Funds’ Privacy and Security Practices
The Funds will notify you annually of their privacy policy as required by federal law. While the Funds reserve the right to modify this policy at any time they will notify you promptly if this privacy policy changes.
The Funds’ Security Practices
The Funds maintain appropriate physical, electronic and procedural safeguards designed to guard your nonpublic personal information. The Funds’ internal data security policies restrict access to your nonpublic personal information to authorized employees, who may use your nonpublic personal information for Fund business purposes only.
Although the Funds strive to protect your nonpublic personal information, they cannot ensure or warrant the security of any information you provide or transmit to them, and you do so at your own risk. In the event of a breach of the confidentiality or security of your nonpublic personal information, the Funds will attempt to notify you as necessary so you can take appropriate protective steps. If you have consented to the Funds using electronic communications or electronic delivery of statements, they may notify you under such circumstances using the most current email address you have on record with them.
In order for the Funds to provide effective service to you, keeping your account information accurate is very important. If you believe that your account information is incomplete, not accurate or not current, or if you have questions about the Funds’ privacy practices, write the Funds using the contact information on your account statements, email the Funds by clicking on the Contact Us section of the Funds’ website at www.leggmason.com, or contact the Fund at
1-877-721-1926.
|
| NOT PART OF THE ANNUAL REPORT |
www.leggmason.com/individualinvestors
© 2015 Legg Mason Investor Services, LLC Member FINRA, SIPC
LMF-222/A 12/15 SR15-2655
The registrant has adopted a code of ethics that applies to the registrant’s principal executive officer, principal financial officer, principal accounting officer or controller.
| ITEM 3. | AUDIT COMMITTEE FINANCIAL EXPERT. |
The Board of Trustees of the registrant has determined that Arthur S. Mehlman the Chairman of the Board’s Audit Committee and Robert M. Tarola, possess the technical attributes identified in Instruction 2(b) of Item 3 to Form N- to qualify as “audit committee financial experts,” and have designated Mr. Mehlman and Mr. Tarola CSR as the Audit Committee’s financial experts. Mr. Mehlman and Mr. Tarola are “independent” Trustees pursuant to paragraph (a) (2) of Item 3 to Form N-CSR.
| ITEM 4. | PRINCIPAL ACCOUNTANT FEES AND SERVICES. |
a) Audit Fees. The aggregate fees billed in the last two fiscal years ending October 31, 2014 and October 31, 2015 (the “Reporting Periods”) for professional services rendered by the Registrant’s principal accountant (the “Auditor”) for the audit of the Registrant’s annual financial statements, or services that are normally provided by the Auditor in connection with the statutory and regulatory filings or engagements for the Reporting Periods, were $276,738 in 2014 and $268,854 in 2015.
b) Audit-Related Fees. The aggregate fees billed in the Reporting Period for assurance and related services by the Auditor that are reasonably related to the performance of the Registrant’s financial statements were $6,500 in October 31, 2014 and $0 in October 31, 2015.
(c) Tax Fees. The aggregate fees billed in the Reporting Periods for professional services rendered by the Auditor for tax compliance, tax advice and tax planning (“Tax Services”) were $60,804 in October 31, 2014 and $56,048 in October 31, 2015. These services consisted of (i) review or preparation of U.S. federal, state, local and excise tax returns; (ii) U.S. federal, state and local tax planning, advice and assistance regarding statutory, regulatory or administrative developments, and (iii) tax advice regarding tax qualification matters and/or treatment of various financial instruments held or proposed to be acquired or held.
There were no fees billed for tax services by the service affiliates during the Reporting Periods that required pre-approval by the Audit Auditors Committee.
d) All Other Fees. The aggregate fees for other fees billed in the Reporting Periods for products and services provided by the Auditor were $9,195 in October 31, 2014 and $3,234 in October 31, 2015, other than the services reported in paragraphs (a) through (c) of this item for the Legg Mason Global Asset Management Trust.
All Other Fees. There were no other non-audit services rendered by the Auditor to Legg Mason Partners Fund Advisors, LLC (“LMPFA”), and any entity controlling, controlled by or under common control with LMPFA that provided ongoing services to Legg Mason Global Asset Management Trust requiring pre-approval by the Audit Committee in the Reporting Period.
(e) Audit Committee’s pre–approval policies and procedures described in paragraph (c)
(7) of Rule 2-01 of Regulation S-X.
(1) The Charter for the Audit Committee (the “Committee”) of the Board of each registered investment company (the “Fund”) advised by LMPFA or one of their affiliates (each, an “Adviser”) requires that the Committee shall approve (a) all audit and permissible non-audit services to be provided to the Fund and (b) all permissible non-audit services to be provided by the Fund’s independent auditors to the Adviser and any Covered Service Providers if the engagement relates directly to the operations and financial reporting of the Fund. The Committee may implement policies and procedures by which such services are approved other than by the full Committee.
The Committee shall not approve non-audit services that the Committee believes may impair the independence of the auditors. As of the date of the approval of this Audit Committee Charter, permissible non-audit services include any professional services (including tax services), that are not prohibited services as described below, provided to the Fund by the independent auditors, other than those provided to the Fund in connection with an audit or a review of the financial statements of the Fund. Permissible non-audit services may not include: (i) bookkeeping or other services related to the accounting records or financial statements of the Fund; (ii) financial information systems design and implementation; (iii) appraisal or valuation services, fairness opinions or contribution-in-kind reports; (iv) actuarial services; (v) internal audit outsourcing services; (vi) management functions or human resources; (vii) broker or dealer, investment adviser or investment banking services; (viii) legal services and expert services unrelated to the audit; and (ix) any other service the Public Company Accounting Oversight Board determines, by regulation, is impermissible.
Pre-approval by the Committee of any permissible non-audit services is not required so long as: (i) the aggregate amount of all such permissible non-audit services provided to the Fund, the Adviser and any service providers controlling, controlled by or under common control with the Adviser that provide ongoing services to the Fund (“Covered Service Providers”) constitutes not more than 5% of the total amount of revenues paid to the independent auditors during the fiscal year in which the permissible non-audit services are provided to (a) the Fund, (b) the Adviser and (c) any entity controlling, controlled by or under common control with the Adviser that provides ongoing services to the Fund during the fiscal year in which the services are provided that would have to be approved by the Committee; (ii) the permissible non-audit services were not recognized by the Fund at the time of the engagement to be non-audit services; and (iii) such services are promptly brought to the attention of the Committee and approved by the Committee (or its delegate(s)) prior to the completion of the audit.
(2) For the Legg Mason Global Asset Management Trust, the percentage of fees that were approved by the audit committee, with respect to: Audit-Related Fees were 100% and 100% for October 31, 2014 and October 31, 2015; Tax Fees were 100% and 100% for October 31, 2014 and October 31, 2015; and Other Fees were 100% and 100% for October 31, 2014 and October 31, 2015.
(f) N/A
(g) Non-audit fees billed by the Auditor for services rendered to Legg Mason Global Asset Management Trust, LMPFA and any entity controlling, controlled by, or under common control with LMPFA that provides ongoing services to Legg Mason Global Asset Management Trust during the reporting period were $277,092 in October 31, 2014 and $330,948 in October 31, 2015.
(h) Yes. Legg Mason Global Asset Management Trust’s Audit Committee has considered whether the provision of non-audit services that were rendered to Service Affiliates, which were not pre-approved (not requiring pre-approval), is compatible with maintaining the Accountant’s independence. All services provided by the Auditor to the Legg Mason Global Asset Management Trust or to Service Affiliates, which were required to be pre-approved, were pre-approved as required.
| ITEM 5. | AUDIT COMMITTEE OF LISTED REGISTRANTS. |
| | a) | The independent board members are acting as the registrant’s audit committee as specified in Section 3(a)(58)(B) of the Exchange Act. The Audit Committee consists of the following Board members: |
Ruby P. Hearn
Arnold L. Lehman
Robin J.W. Masters
Jill E. McGovern
Arthur S. Mehlman
G. Peter O’Brien
S. Ford Rowan
Robert M. Tarola
| ITEM 6. | SCHEDULE OF INVESTMENTS. |
Included herein under Item 1.
| ITEM 7. | DISCLOSURE OF PROXY VOTING POLICIES AND PROCEDURES FOR CLOSED-END MANAGEMENT INVESTMENT COMPANIES. |
Not applicable.
| ITEM 8. | PORTFOLIO MANAGERS OF CLOSED-END MANAGEMENT INVESTMENT COMPANIES. |
Not applicable.
| ITEM 9. | PURCHASES OF EQUITY SECURITIES BY CLOSED-END MANAGEMENT INVESTMENT COMPANY AND AFFILIATED PURCHASERS. |
Not applicable.
| ITEM 10. | SUBMISSION OF MATTERS TO A VOTE OF SECURITY HOLDERS. |
Not applicable.
| ITEM 11. | CONTROLS AND PROCEDURES. |
| | (a) | The registrant’s principal executive officer and principal financial officer have concluded that the registrant’s disclosure controls and procedures (as defined in Rule 30a- 3(c) under the Investment Company Act of 1940, as amended (the “1940 Act”)) are effective as of a date within 90 days of the filing date of this report that includes the disclosure required by this paragraph, based on their evaluation of the disclosure controls and procedures required by Rule 30a-3(b) under the 1940 Act and 15d-15(b) under the Securities Exchange Act of 1934. |
| | (b) | There were no changes in the registrant’s internal control over financial reporting (as defined in Rule 30a-3(d) under the 1940 Act) that occurred during the second fiscal quarter of the period covered by this report that have materially affected, or are likely to materially affect the registrant’s internal control over financial reporting. |
(a) (1) Code of Ethics attached hereto.
Exhibit 99.CODE ETH
(a) (2) Certifications pursuant to section 302 of the Sarbanes-Oxley Act of 2002 attached hereto.
Exhibit 99.CERT
(b) Certifications pursuant to Section 906 of the Sarbanes-Oxley Act of 2002 attached hereto.
Exhibit 99.906CERT
SIGNATURES
Pursuant to the requirements of the Securities Exchange Act of 1934 and the Investment Company Act of 1940, the registrant has duly caused this Report to be signed on its behalf by the undersigned, there unto duly authorized.
Legg Mason Global Asset Management Trust
| | |
| By: | | /s/ Jane Trust |
| | Jane Trust |
| | Chief Executive Officer |
| |
| Date: | | December 22, 2015 |
Pursuant to the requirements of the Securities Exchange Act of 1934 and the Investment Company Act of 1940, this report has been signed below by the following persons on behalf of the registrant and in the capacities and on the dates indicated.
| | |
| By: | | /s/ Jane Trust |
| | Jane Trust |
| | Chief Executive Officer |
| |
| Date: | | December 22, 2015 |
| |
| By: | | /s/ Richard F. Sennett |
| | Richard F. Sennett |
| | Principal Financial Officer |
| |
| Date: | | December 22, 2015 |