UNITED STATES
SECURITIES AND EXCHANGE COMMISSION
Washington, D.C. 20549
FORM N-CSR
CERTIFIED SHAREHOLDER REPORT OF REGISTERED
MANAGEMENT INVESTMENT COMPANIES
Investment Company Act file number 811-22338
Legg Mason Global Asset Management Trust
(Exact name of registrant as specified in charter)
620 Eighth Avenue, 49th Floor, New York, NY 10018
(Address of principal executive offices) (Zip code)
Robert I. Frenkel, Esq.
Legg Mason & Co., LLC
100 First Stamford Place
Stamford, CT 06902
(Name and address of agent for service)
Registrant’s telephone number, including area code: 1-877-721-1926
Date of fiscal year end: October 31
Date of reporting period: October 31, 2015
| ITEM 1. | REPORT TO STOCKHOLDERS |
The Annual Report to Stockholders is filed herewith.

| | |
| Annual Report | | October 31, 2015 |
CLEARBRIDGE
VALUE TRUST

|
| INVESTMENT PRODUCTS: NOT FDIC INSURED • NO BANK GUARANTEE • MAY LOSE VALUE |
Fund objective
The Fund seeks long-term growth of capital.
Letter from the president

Dear Shareholder,
We are pleased to provide the annual report of ClearBridge Value Trust for the twelve-month reporting period ended October 31, 2015. Please read on for a detailed look at prevailing economic and market conditions during the Fund’s reporting period and to learn how those conditions have affected Fund performance.
As always, we remain committed to providing you with excellent service and a full spectrum of investment choices. We also remain committed to supplementing the support you receive from your financial advisor. One way we accomplish this is through our website, www.leggmason.com/individualinvestors. Here you can gain immediate access to market and investment information, including:
| • | | Fund prices and performance, |
| • | | Market insights and commentaries from our portfolio managers, and |
| • | | A host of educational resources. |
We look forward to helping you meet your financial goals.
Sincerely,

Jane Trust, CFA
President and Chief Executive Officer
November 27, 2015
| | |
| II | | ClearBridge Value Trust |
Investment commentary
Economic review
The pace of U.S. economic activity was mixed during the twelve months ended October 31, 2015 (the “reporting period”). Looking back, the U.S. Department of Commerce’s revised figures showed that fourth quarter 2014 U.S. gross domestic product (“GDP”)i growth was 2.1%. First quarter 2015 GDP growth then moderated to 0.6%. This was attributed to a number of factors, including a deceleration in personal consumption expenditures (“PCE”), along with negative contributions from exports, nonresidential fixed investment, and state and local government spending. Economic activity then accelerated, as second quarter 2015 GDP growth was 3.9%. The upturn was driven by increasing exports, accelerating PCE, declining imports, expanding state and local government spending, and rising nonresidential fixed investment. The U.S. Department of Commerce’s second reading for third quarter 2015 GDP growth — released after the reporting period ended — was 2.1%. Decelerating growth was primarily due to a downturn in private inventory investment and decelerations in exports, PCE, nonresidential fixed investment, state and local government spending, and residential fixed investment.
The labor market significantly improved and was a tailwind for the economy during the reporting period. When the period began, unemployment was 5.8%, as reported by the U.S. Department of Labor. By October 2015, unemployment was 5.0%, its lowest level since April 2008.
The Federal Reserve Board (“Fed”)ii took a number of actions as it sought to meet its dual mandate of fostering maximum employment and price stability. As it has since December 2008, the Fed maintained the federal funds rateiii at a historically low range between zero and 0.25% during the twelve months ended October 31, 2015. However, in October 2014 the Fed ended its asset purchase program that was announced in December 2012. In December 2014, the Fed said that “…it can be patient in beginning to normalize the stance of monetary policy.” At its meeting that concluded on July 29, 2015, the Fed said, “The Committee currently anticipates that, even after employment and inflation are near mandate-consistent levels, economic conditions may, for some time, warrant keeping the target federal funds rate below levels the Committee views as normal in the longer run.” At its meeting that concluded on October 28, 2015, the Fed said, “In determining whether it will be appropriate to raise the target range at its next meeting, the Committee will assess progress — both realized and expected — toward its objectives of maximum employment and 2 percent inflation.”
As always, thank you for your confidence in our stewardship of your assets.
Sincerely,
Jane Trust, CFA
President and Chief Executive Officer
November 27, 2015
All investments are subject to risk including the possible loss of principal. Past performance is no guarantee of future results.
| | |
| ClearBridge Value Trust | | III |
Investment commentary (cont’d)
| i | Gross domestic product (“GDP”) is the market value of all final goods and services produced within a country in a given period of time. |
| ii | The Federal Reserve Board (“Fed”) is responsible for the formulation of U.S. policies designed to promote economic growth, full employment, stable prices and a sustainable pattern of international trade and payments. |
| iii | The federal funds rate is the rate charged by one depository institution on an overnight sale of immediately available funds (balances at the Federal Reserve) to another depository institution; the rate may vary from depository institution to depository institution and from day to day. |
| | |
| IV | | ClearBridge Value Trust |
Fund overview
Q. What is the Fund’s investment strategy?
A. The Fund seeks long-term growth of capital. The Fund invests primarily in equity securities that, in our opinion, offer the potential for capital growth. We follow a value discipline in selecting securities and, therefore, seek to purchase securities at large discounts to our assessment of their issuers’ intrinsic value. We take a long-term approach to investing, and the Fund’s portfolio turnover has tended to be lower than the average equity mutual fund. The Fund generally invests in companies with market capitalizations greater than $5 billion, but may invest in companies of any size. The Fund may invest in foreign securities, including securities of emerging market issuers. The Fund may also invest in debt securities. The Fund may invest up to 25% of its total assets in long-term debt securities. Up to 10% of its total assets may be invested in debt securities rated below investment grade (i.e. below BBB/Baa), and unrated securities that we judge to be below investment grade.
Q. What were the overall market conditions during the Fund’s reporting period?
A. Major U.S. indices posted positive returns for the twelve-month period ended October 31, 2015, as the NASDAQ Composite Indexi gained 10.6% while the S&P 500 Indexii and Dow Jones Industrial Average (“DJIA”)iii trailed, up 5.20% and 4.06%, respectively. Throughout the reporting period, investors focused on the Federal Reserve Board’s (“Fed”)iv rate strategy, mixed economic reports, suppressed crude prices, and the climbing dollar, as well as a wave of mergers and acquisitions (“M&A”) announcements. The equity market appreciated through the first half of the year, but the third quarter of 2015 saw sharp declines erase gains. Growing concern for global growth combined with sliding domestic crude prices appeared to drive the volatility.
The International Monetary Fund (“IMF”) twice lowered its global growth projections for 2015, most recently forecasting a 3.1% expansion and pointing to a weak first quarter 2015 in the U.S. as well as lower commodity prices and question marks about the Chinese economy as causes for the tempered expectations. Crude oil futures slid throughout the reporting period on oversupply concerns, dropping below $40 per barrel in mid-August and closing above $46 at the end of October 2015. The selling was indiscriminate and the Chicago Board Options Exchange Volatility Indexv, commonly referred to as the VIX, spiked to the highest level since the U.S. lost its AAA credit rating in late 2011. Over the last several years, the market has appreciated significantly and has experienced very little volatility. Until late August, the broad averages had not seen a 10% correction in over three years — rare from a historical perspective.
As most predicted, the Fed wrapped up its bond-buying program in October of 2014, but every month thereafter failed to raise the target lending rate from the low range between zero and 0.25%. Fed officials continue to fixate on tepid inflation in the U.S. despite decent economic expansion and meaningful improvement in the labor market. Aside from a disappointing 0.6% annualized rate of expansion in the first quarter of 2015, U.S. gross domestic product (“GDP”)vi growth reports have been moderately strong over the past year. Notably the economy expanded 2.1% and
| | |
| ClearBridge Value Trust 2015 Annual Report | | 1 |
Fund overview (cont’d)
3.9% in the fourth quarter of 2014 and the second quarter of 2015, respectively. Meanwhile, U.S. employers added 2.8 million jobs throughout the reporting year and the unemployment rate fell to 5.0% at the end of October 2015 from 5.7% a year ago. Fed Chair Janet Yellen commented that we should see an “initial increase in the federal funds ratevii later this [calendar] year, followed by a gradual pace of tightening thereafter.” However, she cautioned that they could delay further “if the economy surprises us.” After opening November 2014 at 2.34%, the ten-year Treasury note yield dropped as low as 1.64% in January but recovered to close above 2% at the end of October 2015. Corporations continued to take advantage of low borrowing rates as M&A remained a steady bid for stocks throughout the period. Dealogic, a provider of Global Investment Banking analysis and systems, reports that there were 45 deals worth $10 billion or more for a combined total of $1.2 trillion in the first nine months of 2015. On the other hand, the U.S. dollar strengthened 12% against a broad basket of foreign currencies over the past twelve months, driving material foreign exchange headwinds to U.S. corporate earnings.
Q. How did we respond to these changing market conditions?
A. Even with a core focus of getting paid for the risks we take, and constantly trying to optimize our portfolio construction, as concentrated managers we are subject to periods of underperformance. These challenging episodes typically coincide with the deflationary storms that precipitate risk-off selling. In our opinion, the majority of performance headwinds in this cycle resulted from our valuation discipline favoring the much more attractive price-to-value gaps in cyclical industries: financials, enterprise technology, merchant power, and selectively in the currently much-hated materials and energy space. Besides getting amply paid for this cyclical risk in a world scared by deflation and anemic global growth, we also balance our portfolio construction with mispriced health care and consumer names that have done well in this deflationary environment. Finally, we are focused on balance sheet strength and cash flow generation across the portfolio, with a key goal of avoiding solvency or liquidity issues should an emerging markets credit event surface in the next few quarters.
We don’t think the dynamics of this market cycle have changed. Even with the rising risks of an emerging market credit event, the odds of a near-term U.S. recession still look low to us over the next twelve months. The banking system is in great shape, the critical housing cycle remains slow and steady, lower commodity prices are a massive wealth transfer to U.S. consumers, and the job market is still improving. We also expect companies to remain the steady bid for U.S. stocks as buyback activity remains robust, coupled and greatly boosted by historically-elevated deal activity. Most important, with the recent elevation in the Equity Risk Premium and the indiscriminate selling, we are seeing valuation upside back at 2012 levels.
Performance review
For the twelve months ended October 31, 2015, Class C shares of ClearBridge Value Trust, excluding sales charges, returned -2.27%. The Fund’s unmanaged primary benchmark, the S&P 500 Index returned 5.20% for the same period. The Russell 1000 Value Indexviii and the Lipper Large-Cap
| | |
| 2 | | ClearBridge Value Trust 2015 Annual Report |
Core Funds Category Average1 returned 0.53% and 3.33%, respectively, over the same time frame.
| | | | | | | | |
Performance Snapshot as of October 31, 2015
(unaudited) | |
| (excluding sales charges) | | 6 months | | | 12 months | |
| ClearBridge Value Trust: | | | | | | | | |
Class A | | | -6.56 | % | | | -1.55 | % |
Class C | | | -6.89 | % | | | -2.27 | % |
Class FI | | | -6.54 | % | | | -1.63 | % |
Class R | | | -6.75 | % | | | -1.93 | % |
Class I | | | -6.45 | % | | | -1.34 | % |
| S&P 500 Index | | | 0.77 | % | | | 5.20 | % |
| Russell 1000 Value Index | | | -2.29 | % | | | 0.53 | % |
| Lipper Large-Cap Core Funds Category Average1 | | | -0.55 | % | | | 3.33 | % |
The performance shown represents past performance. Past performance is no guarantee of future results and current performance may be higher or lower than the performance shown above. Principal value and investment returns will fluctuate and investors’ shares, when redeemed, may be worth more or less than their original cost. To obtain performance data current to the most recent month-end, please visit our website at www.leggmason.com/individualinvestors.
All share class returns assume the reinvestment of all distributions at net asset value and the deduction of all Fund expenses. Returns have not been adjusted to include sales charges that may apply or the deduction of taxes that a shareholder would pay on Fund distributions. If sales charges were reflected, the performance quoted would be lower. Performance figures for periods shorter than one year represent cumulative figures and are not annualized.
Fund performance figures reflect fee waivers and/or expense reimbursements, without which the performance would have been lower.
|
| Total Annual Operating Expenses (unaudited) |
As of the Fund’s current prospectus dated March 1, 2015, as supplemented August 7, 2015, the gross total annual operating expense ratios for Class A, Class C, Class FI, Class R and Class I shares were 1.02%, 1.77%, 1.09%, 1.46% and 0.82%, respectively.
Actual expenses may be higher. For example, expenses may be higher than those shown if average net assets decrease. Net assets are more likely to decrease and Fund expense ratios are more likely to increase when markets are volatile.
As a result of expense limitation arrangements, the ratio of expenses, other than interest, brokerage commissions, dividend expense on short sales, taxes, extraordinary expenses and acquired fund fees and expenses, to average net assets is not expected to exceed 1.15% for Class A shares, 1.90% for Class C shares, 1.15% for Class FI shares, 1.40% for Class R shares and 0.80% for Class I shares. These expense limitation arrangements cannot be terminated prior to December 31, 2017 without the Board of Trustees’ consent.
The manager is permitted to recapture amounts waived and/or reimbursed to a class within three years after the fiscal year in which the manager earned the fee or incurred the expense if the class’ total annual operating expenses have fallen to a level below the expense limitation (“expense cap”) in effect at the time the fees were earned or the expenses incurred. In no case will the manager recapture any amount that would result, on any particular
| 1 | Lipper, Inc., a wholly-owned subsidiary of Reuters, provides independent insight on global collective investments. Returns are based on the period ended October 31, 2015, including the reinvestment of all distributions, including returns of capital, if any, calculated among the 880 funds for the six-month period and among the 861 funds for the twelve-month period in the Fund’s Lipper category, and excluding sales charges. |
| | |
| ClearBridge Value Trust 2015 Annual Report | | 3 |
Fund overview (cont’d)
business day of the Fund, in the class’ total annual operating expenses exceeding the expense cap or any other lower limit then in effect.
Q. What were the leading contributors to performance?
A. The Fund’s stock selection within the Consumer Discretionary sector contributed positively to relative performance, as did the Fund’s underweight to the Telecommunication Services sector which underperformed the benchmark. In terms of individual securities, Amazon.com Inc., Expedia Inc., Microsoft Corp., UnitedHealth Group Inc. and Broadcom Corp. were the largest contributors to performance.
Q. What were the leading detractors from performance?
A. Relative portfolio underperformance was driven by both security selection effects and sector allocation effects. In terms of sector allocation, underweight exposure to the Consumer Staples sector and an overweight position in the Energy sector hurt relative performance the most as the former sector outperformed, while the latter underperformed the benchmark. Stock selection within these sectors also weighed on relative performance. At the security level, CONSOL Energy Inc., Keurig Green Mountain Inc., Genworth Financial Inc., Class A Shares, Calpine Corp. and Apache Corp. were the greatest detractors from returns.
Q. Were there any significant changes to the Fund during the reporting period?
A. We initiated fifteen new positions during the year and eliminated seventeen positions, ending the period with forty-six positions. Several notable purchases included Oracle Corp., McDonald’s Corp., Rockwell Automation Inc., Albemarle Corp. and AbbVie Inc., while notable eliminated positions included Chevron Corp., Broadcom Corp., Target Corp., Norfolk Southern Corp. and Apple Inc.
Thank you for your investment in ClearBridge Value Trust. As always, we appreciate that you have chosen us to manage your assets and we remain focused on achieving the Fund’s investment goals.
Sincerely,

Sam Peters, CFA
Portfolio Manager
ClearBridge, LLC

Jean Yu, CFA
Portfolio Manager
ClearBridge, LLC
November 17, 2015
RISKS: Equity securities are subject to price fluctuation and possible loss of principal. The manager’s investment style may become out of favor and/or the manager’s selection process may prove incorrect, which may have a negative impact on the Fund’s performance. The Fund may focus its investments in certain regions or industries, increasing its vulnerability to market volatility. Additional risks may include those risks associated with investing in fixed-income and high-yield securities, small- and mid-sized companies and foreign investments. Please see the Fund’s prospectus for a more complete discussion of these and other risks, and the Fund’s investment strategies.
| | |
| 4 | | ClearBridge Value Trust 2015 Annual Report |
Portfolio holdings and breakdowns are as of October 31, 2015 and are subject to change and may not be representative of the portfolio managers’ current or future investments. The Fund’s top ten holdings (as a percentage of net assets) as of October 31, 2015 were: Microsoft Corp. (5.1%), Citigroup Inc. (3.9%), Amazon.com Inc. (3.8%), Cisco Systems Inc. (3.4%), JPMorgan Chase & Co. (3.4%), Calpine Corp. (3.3%), Merck & Co. Inc. (3.1%), Wells Fargo & Co. (3.1%), American International Group Inc. (3.1%) and AES Corp. (2.9%). Please refer to pages 11 through 13 for a list and percentage breakdown of the Fund’s holdings.
The mention of sector breakdowns is for informational purposes only and should not be construed as a recommendation to purchase or sell any securities. The information provided regarding such sectors is not a sufficient basis upon which to make an investment decision. Investors seeking financial advice regarding the appropriateness of investing in any securities or investment strategies discussed should consult their financial professional. The Fund’s top five sector holdings (as a percentage of net assets) as of October 31, 2015 were: Financials (21.9%), Information Technology (19.7%), Health Care (17.1%), Consumer Discretionary (13.9%) and Industrials (7.8%). The Fund’s portfolio composition is subject to change at any time.
All investments are subject to risk including the possible loss of principal. Past performance is no guarantee of future results. All index performance reflects no deduction for fees, expenses or taxes. Please note that an investor cannot invest directly in an index.
The information provided is not intended to be a forecast of future events, a guarantee of future results or investment advice. Views expressed may differ from those of the firm as a whole. Forecasts and predictions are inherently limited and should not be relied upon as an indication of actual or future performance.
| i | The NASDAQ Composite Index is a market-value weighted index, which measures all securities listed on the NASDAQ stock market. |
| ii | The S&P 500 Index is an unmanaged index of 500 stocks and is generally representative of the performance of larger companies in the U.S. |
| iii | The Dow Jones Industrial Average (“DJIA”) is a widely followed measurement of the stock market. The average is comprised of thirty stocks that represent leading companies in major industries. These stocks, widely held by both individual and institutional investors, are considered to be all blue-chip companies. |
| iv | The Federal Reserve Board (“Fed”) is responsible for the formulation of U.S. policies designed to promote economic growth, full employment, stable prices and a sustainable pattern of international trade and payments. |
| v | The Chicago Board Options Exchange Volatility Index (“VIX”) reflects a market estimate of future volatility, based on the weighted average of the implied volatilities for a wide range of strikes. |
| vi | Gross domestic product (“GDP”) is the market value of all final goods and services produced within a country in a given period of time. |
| vii | The federal funds rate is the rate charged by one depository institution on an overnight sale of immediately available funds (balances at the Federal Reserve) to another depository institution; the rate may vary from depository institution to depository institution and from day to day. |
| viii | The Russell 1000 Value Index measures the performance of the large-cap value segment of the U.S. equity universe. It includes those Russell 1000 Index companies with lower price-to-book ratios and lower expected growth values. (A price-to-book ratio is the price of a stock compared to the difference between a company’s assets and liabilities.) The Russell 1000 Index measures the performance of the large-cap segment of the U.S. equity universe. It is a subset of the Russell 3000 Index and includes approximately 1,000 of the largest securities based on a combination of their market cap and current index membership. The Russell 1000 represents approximately 92% of the U.S. market. The Russell 3000 Index measures the performance of the 3,000 largest U.S. companies based on total market capitalization, which represents approximately 98% of the U.S. equity market. |
| | |
| ClearBridge Value Trust 2015 Annual Report | | 5 |
Fund at a glance† (unaudited)
Investment breakdown (%) as a percent of total investments
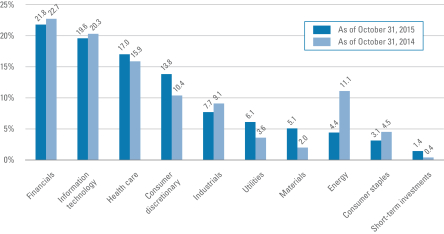
| † | The bar graph above represents the composition of the Fund’s investments as of October 31, 2015 and October 31, 2014. The Fund is actively managed. As a result, the composition of the Fund’s investments is subject to change at any time. |
| | |
| 6 | | ClearBridge Value Trust 2015 Annual Report |
Fund expenses (unaudited)
Example
As a shareholder of the Fund, you may incur two types of costs: (1) transaction costs, including front-end and back-end sales charges (loads) on purchase payments; and (2) ongoing costs, including management fees; service and/or distribution (12b-1) fees; and other Fund expenses. This example is intended to help you understand your ongoing costs (in dollars) of investing in the Fund and to compare these costs with the ongoing costs of investing in other mutual funds.
This example is based on an investment of $1,000 invested on May 1, 2015 and held for the six months ended October 31, 2015.
Actual expenses
The table below titled “Based on Actual Total Return” provides information about actual account values and actual expenses. You may use the information provided in this table, together with the amount you invested, to estimate the expenses that you paid over the period. To estimate the expenses you paid on your account, divide your ending account value by $1,000 (for example, an $8,600 ending account value divided by $1,000 = 8.6), then multiply the result by the number under the heading entitled “Expenses Paid During the Period”.
Hypothetical example for comparison purposes
The table below titled “Based on Hypothetical Total Return” provides information about hypothetical account values and hypothetical expenses based on the actual expense ratio and an assumed rate of return of 5.00% per year before expenses, which is not the Fund’s actual return. The hypothetical account values and expenses may not be used to estimate the actual ending account balance or expenses you paid for the period. You may use the information provided in this table to compare the ongoing costs of investing in the Fund and other funds. To do so, compare the 5.00% hypothetical example relating to the Fund with the 5.00% hypothetical examples that appear in the shareholder reports of the other funds.
Please note that the expenses shown in the table below are meant to highlight your ongoing costs only and do not reflect any transactional costs, such as front-end or back-end sales charges (loads). Therefore, the table is useful in comparing ongoing costs only, and will not help you determine the relative total costs of owning different funds. In addition, if these transaction costs were included, your costs would have been higher.
| | | | | | | | | | | | | | | | | | | | | | | | | | | | | | | | | | | | | | | | | | | | |
| Based on actual total return1 | | | | | Based on hypothetical total return1 | |
| | | Actual Total Return Without Sales Charge2 | | | Beginning Account Value | | | Ending Account Value | | | Annualized Expense Ratio | | | Expenses Paid During the Period3 | | | | | | | Hypothetical Annualized Total Return | | | Beginning Account Value | | | Ending Account Value | | | Annualized Expense Ratio | | | Expenses Paid During the Period3 | |
| Class A | | | -6.56 | % | | $ | 1,000.00 | | | $ | 934.40 | | | | 1.01 | % | | $ | 4.92 | | | | | Class A | | | 5.00 | % | | $ | 1,000.00 | | | $ | 1,020.11 | | | | 1.01 | % | | $ | 5.14 | |
| Class C | | | -6.89 | | | | 1,000.00 | | | | 931.10 | | | | 1.73 | | | | 8.42 | | | | | Class C | | | 5.00 | | | | 1,000.00 | | | | 1,016.48 | | | | 1.73 | | | | 8.79 | |
| Class FI | | | -6.54 | | | | 1,000.00 | | | | 934.60 | | | | 0.99 | | | | 4.83 | | | | | Class FI | | | 5.00 | | | | 1,000.00 | | | | 1,020.21 | | | | 0.99 | | | | 5.04 | |
| Class R | | | -6.75 | | | | 1,000.00 | | | | 932.50 | | | | 1.41 | | | | 6.87 | | | | | Class R | | | 5.00 | | | | 1,000.00 | | | | 1,018.10 | | | | 1.41 | | | | 7.17 | |
| Class I | | | -6.45 | | | | 1,000.00 | | | | 935.50 | | | | 0.80 | | | | 3.90 | | | | | Class I | | | 5.00 | | | | 1,000.00 | | | | 1,021.17 | | | | 0.80 | | | | 4.08 | |
| | |
| ClearBridge Value Trust 2015 Annual Report | | 7 |
Fund expenses (unaudited) (cont’d)
| 1 | For the six months ended October 31, 2015. |
| 2 | Assumes the reinvestment of all distributions, including returns of capital, if any, at net asset value and does not reflect the deduction of the applicable sales charge with respect to Class A shares or the applicable contingent deferred sales charge (“CDSC”) with respect to Class C shares. Total return is not annualized, as it may not be representative of the total return for the year. Performance figures may reflect compensating balance arrangements, fee waivers and/or expense reimbursements. In the absence of compensating balance arrangements, fee waivers and/or expense reimbursements, the total return would have been lower. Past performance is no guarantee of future results. |
| 3 | Expenses (net of compensating balance arrangements, fee waivers and/or expense reimbursements) are equal to each class’ respective annualized expense ratio multiplied by the average account value over the period, multiplied by the number of days in the most recent fiscal half-year (184), then divided by 365. |
| | |
| 8 | | ClearBridge Value Trust 2015 Annual Report |
Fund performance (unaudited)
| | | | | | | | | | | | | | | | | | | | |
| Average annual total returns | | | | |
| Without sales charges1 | | Class A | | | Class C | | | Class FI | | | Class R | | | Class I | |
| Twelve Months Ended 10/31/15 | | | -1.55 | % | | | -2.27 | % | | | -1.63 | % | | | -1.93 | % | | | -1.34 | % |
| Five Years Ended 10/31/15 | | | 12.02 | | | | 11.18 | | | | 11.96 | | | | 11.56 | | | | 12.27 | |
| Five Years Ended 10/31/15 | | | N/A | | | | 1.62 | | | | 2.31 | | | | N/A | | | | 2.62 | |
| Inception* through 10/31/15 | | | 16.56 | | | | — | | | | — | | | | 0.69 | | | | — | |
| | | | | |
| With sales charges2 | | Class A | | | Class C | | | Class FI | | | Class R | | | Class I | |
| Twelve Months Ended 10/31/15 | | | -7.21 | % | | | -3.20 | % | | | -1.63 | % | | | -1.93 | % | | | -1.34 | % |
| Five Years Ended 10/31/15 | | | 10.71 | | | | 11.18 | | | | 11.96 | | | | 11.56 | | | | 12.27 | |
| Ten Years Ended 10/31/15 | | | N/A | | | | 1.62 | | | | 2.31 | | | | N/A | | | | 2.62 | |
| Inception* through 10/31/15 | | | 15.53 | | | | — | | | | — | | | | 0.69 | | | | — | |
| | | | |
| Cumulative total returns | | | |
| Without sales charges1 | | | |
| Class A (Inception date of 2/2/09 through 10/31/15) | | | 181.04 | % |
| Class C (10/31/05 through 10/31/15) | | | 17.45 | |
| Class FI (10/31/05 through 10/31/15) | | | 25.65 | |
| Class R (Inception date of 12/28/06 through 10/31/15) | | | 6.28 | |
| Class I (10/31/05 through 10/31/15) | | | 29.46 | |
All figures represent past performance and are not a guarantee of future results. Investment return and principal value of an investment will fluctuate so that an investor’s shares, when redeemed, may be worth more or less than their original cost. The returns shown do not reflect the deduction of taxes that a shareholder would pay on Fund distributions or the redemption of Fund shares. Performance figures may reflect compensating balance arrangements, fee waivers and/or expense reimbursements. In the absence of compensating balance arrangements, fee waivers and/or expense reimbursements, the total return would have been lower.
| 1 | Assumes the reinvestment of all distributions, including returns of capital, if any, at net asset value and does not reflect the deduction of the applicable sales charge with respect to Class A shares or the applicable contingent deferred sales charge (“CDSC”) with respect to Class C shares. |
| 2 | Assumes the reinvestment of all distributions, including returns of capital, if any, at net asset value. In addition, Class A shares reflect the deduction of the maximum initial sales charge of 5.75%. Class C shares reflect the deduction of a 0.95% CDSC, which applies if shares are redeemed within one year from purchase payment. |
| * | Inception dates for Class A, C, FI, R and I shares are February 2, 2009, April 16, 1982, March 23, 2001, December 28, 2006 and December 1, 1994, respectively. |
| | |
| ClearBridge Value Trust 2015 Annual Report | | 9 |
Fund performance (unaudited) (cont’d)
Historical performance
Value of $10,000 invested in
Class C Shares of ClearBridge Value Trust vs. S&P 500 Index and Russell 1000 Value Index† — October 2005 - October 2015
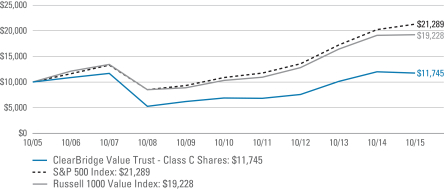
All figures represent past performance and are not a guarantee of future results. Investment return and principal value of an investment will fluctuate so that an investor’s shares, when redeemed, may be worth more or less than their original cost. The returns shown do not reflect the deduction of taxes that a shareholder would pay on Fund distributions or the redemption of Fund shares. Performance figures may reflect compensating balance arrangements, fee waivers and/or expense reimbursements. In the absence of compensating balance arrangements, fee waivers and/or expense reimbursements, the total return would have been lower.
| † | Hypothetical illustration of $10,000 invested in C shares of ClearBridge Value Trust on October 31, 2005, assuming the reinvestment of all distributions, including returns of capital, if any, at net asset value through October 31, 2015. The hypothetical illustration also assumes a $10,000 investment, in the S&P 500 Index and Russell 1000 Value Index. The S&P 500 Index, the Fund’s primary benchmark, is an unmanaged index of 500 stocks and is generally representative of the performance of larger companies in the U.S. The Russell 1000 Value Index measures the performance of the large-cap value segment of the U.S. equity universe. It includes those Russell 1000 Index companies with lower price-to-book ratios and lower expected growth values. The Indices are unmanaged and are not subject to the same management and trading expenses as a mutual fund. Please note that an investor cannot invest directly in an index. The performance of the Fund’s other classes may be greater or less than the Class C shares performance indicated on this chart, depending on whether greater or lesser sales charges and fees were incurred by shareholders investing in the other classes. |
| | |
| 10 | | ClearBridge Value Trust 2015 Annual Report |
Schedule of investments
October 31, 2015
ClearBridge Value Trust
| | | | | | | | | | | | |
| Security | | | | | | Shares | | | Value | |
| Common Stocks — 99.1% | | | | | | | | | | | | |
| Consumer Discretionary — 13.9% | | | | | | | | | | | | |
Hotels, Restaurants & Leisure — 2.3% | | | | | | | | | | | | |
McDonald’s Corp. | | | | | | | 500,000 | | | $ | 56,125,000 | |
Household Durables — 2.6% | | | | | | | | | | | | |
PulteGroup Inc. | | | | | | | 3,500,000 | | | | 64,155,000 | |
Internet & Catalog Retail — 5.2% | | | | | | | | | | | | |
Amazon.com Inc. | | | | | | | 150,000 | | | | 93,885,000 | * |
Expedia Inc. | | | | | | | 250,000 | | | | 34,075,000 | |
Total Internet & Catalog Retail | | | | | | | | | | | 127,960,000 | |
Specialty Retail — 2.2% | | | | | | | | | | | | |
Lowe’s Cos. Inc. | | | | | | | 750,000 | | | | 55,372,500 | |
Textiles, Apparel & Luxury Goods — 1.6% | | | | | | | | | | | | |
Ralph Lauren Corp. | | | | | | | 350,000 | | | | 38,769,500 | |
Total Consumer Discretionary | | | | | | | | | | | 342,382,000 | |
| Consumer Staples — 3.1% | | | | | | | | | | | | |
Food Products — 1.3% | | | | | | | | | | | | |
Keurig Green Mountain Inc. | | | | | | | 650,000 | | | | 32,987,500 | |
Household Products — 1.8% | | | | | | | | | | | | |
Colgate-Palmolive Co. | | | | | | | 650,000 | | | | 43,127,500 | |
Total Consumer Staples | | | | | | | | | | | 76,115,000 | |
| Energy — 4.4% | | | | | | | | | | | | |
Oil, Gas & Consumable Fuels — 4.4% | | | | | | | | | | | | |
Apache Corp. | | | | | | | 1,200,000 | | | | 56,556,000 | |
CONSOL Energy Inc. | | | | | | | 2,400,000 | | | | 15,984,000 | |
Devon Energy Corp. | | | | | | | 900,000 | | | | 37,737,000 | |
Total Energy | | | | | | | | | | | 110,277,000 | |
| Financials — 21.9% | | | | | | | | | | | | |
Banks — 10.3% | | | | | | | | | | | | |
Citigroup Inc. | | | | | | | 1,800,000 | | | | 95,706,000 | |
JPMorgan Chase & Co. | | | | | | | 1,300,000 | | | | 83,525,000 | |
Wells Fargo & Co. | | | | | | | 1,400,000 | | | | 75,796,000 | |
Total Banks | | | | | | | | | | | 255,027,000 | |
Capital Markets — 1.3% | | | | | | | | | | | | |
KKR & Co. LP | | | | | | | 1,800,000 | | | | 30,870,000 | |
Consumer Finance — 1.2% | | | | | | | | | | | | |
American Express Co. | | | | | | | 400,000 | | | | 29,304,000 | |
See Notes to Financial Statements.
| | |
| ClearBridge Value Trust 2015 Annual Report | | 11 |
Schedule of investments (cont’d)
October 31, 2015
ClearBridge Value Trust
| | | | | | | | | | | | |
| Security | | | | | | Shares | | | Value | |
Insurance — 5.9% | | | | | | | | | | | | |
American International Group Inc. | | | | | | | 1,200,000 | | | $ | 75,672,000 | |
Genworth Financial Inc., Class A Shares | | | | | | | 5,000,000 | | | | 23,400,000 | * |
Hartford Financial Services Group Inc. | | | | | | | 1,000,000 | | | | 46,260,000 | |
Total Insurance | | | | | | | | | | | 145,332,000 | |
Real Estate Investment Trusts (REITs) — 2.1% | | | | | | | | | | | | |
American Homes 4 Rent, Class A Shares | | | | | | | 3,200,000 | | | | 52,800,000 | |
Real Estate Management & Development — 1.1% | | | | | | | | | | | | |
Realogy Holdings Corp. | | | | | | | 700,000 | | | | 27,370,000 | * |
Total Financials | | | | | | | | | | | 540,703,000 | |
| Health Care — 17.1% | | | | | | | | | | | | |
Biotechnology — 6.9% | | | | | | | | | | | | |
AbbVie Inc. | | | | | | | 700,000 | | | | 41,685,000 | |
Alexion Pharmaceuticals Inc. | | | | | | | 200,000 | | | | 35,200,000 | * |
Amgen Inc. | | | | | | | 400,000 | | | | 63,272,000 | |
Biogen Inc. | | | | | | | 100,000 | | | | 29,051,000 | * |
Total Biotechnology | | | | | | | | | | | 169,208,000 | |
Health Care Equipment & Supplies — 2.5% | |
Medtronic PLC | | | | | | | 850,000 | | | | 62,832,000 | |
Health Care Providers & Services — 4.6% | |
Express Scripts Holding Co. | | | | | | | 700,000 | | | | 60,466,000 | * |
UnitedHealth Group Inc. | | | | | | | 450,000 | | | | 53,001,000 | |
Total Health Care Providers & Services | | | | | | | | | | | 113,467,000 | |
Pharmaceuticals — 3.1% | |
Merck & Co. Inc. | | | | | | | 1,400,000 | | | | 76,524,000 | |
Total Health Care | | | | 422,031,000 | |
| Industrials — 7.8% | | | | | | | | | | | | |
Aerospace & Defense — 1.8% | |
Boeing Co. | | | | | | | 300,000 | | | | 44,421,000 | |
Airlines — 2.3% | |
United Continental Holdings Inc. | | | | | | | 950,000 | | | | 57,294,500 | * |
Electrical Equipment — 1.8% | |
Rockwell Automation Inc. | | | | | | | 400,000 | | | | 43,664,000 | |
Machinery — 1.3% | |
PACCAR Inc. | | | | | | | 600,000 | | | | 31,590,000 | |
Trading Companies & Distributors — 0.6% | |
United Rentals Inc. | | | | | | | 200,000 | | | | 14,972,000 | * |
Total Industrials | | | | 191,941,500 | |
See Notes to Financial Statements.
| | |
| 12 | | ClearBridge Value Trust 2015 Annual Report |
ClearBridge Value Trust
| | | | | | | | | | | | | | |
| Security | | | | | | | Shares | | | Value | |
| Information Technology — 19.7% | | | | | | | | | | | | | | |
Communications Equipment — 3.4% | |
Cisco Systems Inc. | | | | | | | | | 2,900,000 | | | $ | 83,665,000 | |
Internet Software & Services — 3.7% | |
eBay Inc. | | | | | | | | | 1,000,000 | | | | 27,900,000 | * |
Yahoo! Inc. | | | | | | | | | 1,800,000 | | | | 64,116,000 | * |
Total Internet Software & Services | | | | | | | | | | | | | 92,016,000 | |
Semiconductors & Semiconductor Equipment — 2.1% | |
NXP Semiconductors NV | | | | | | | | | 650,000 | | | | 50,927,500 | * |
Software — 7.6% | |
Microsoft Corp. | | | | | | | | | 2,400,000 | | | | 126,336,000 | |
Oracle Corp. | | | | | | | | | 1,600,000 | | | | 62,144,000 | |
Total Software | | | | | | | | | | | | | 188,480,000 | |
Technology Hardware, Storage & Peripherals — 2.9% | |
EMC Corp. | | | | | | | | | 2,700,000 | | | | 70,794,000 | |
Total Information Technology | | | | 485,882,500 | |
| Materials — 5.1% | | | | | | | | | | | | | | |
Chemicals — 3.4% | |
Albemarle Corp. | | | | | | | | | 800,000 | | | | 42,816,000 | |
LyondellBasell Industries NV, Class A Shares | | | | | | | | | 450,000 | | | | 41,809,500 | |
Total Chemicals | | | | | | | | | | | | | 84,625,500 | |
Metals & Mining — 1.7% | |
Steel Dynamics Inc. | | | | | | | | | 2,200,000 | | | | 40,634,000 | |
Total Materials | | | | 125,259,500 | |
| Utilities — 6.1% | | | | | | | | | | | | | | |
Independent Power and Renewable Electricity Producers — 6.1% | |
AES Corp. | | | | | | | | | 6,500,000 | | | | 71,175,000 | |
Calpine Corp. | | | | | | | | | 5,200,000 | | | | 80,652,000 | * |
Total Utilities | | | | | | | | | | | | | 151,827,000 | |
Total Investments before Short-Term Investments (Cost — $2,072,574,379) | | | | 2,446,418,500 | |
| | | | |
| | | Rate | | | | | | | | | |
| Short-Term Investments — 1.4% | | | | | | | | | | | | | | |
State Street Institutional Liquid Reserves Fund, Premier Class
(Cost — $33,580,968) | | | 0.137 | % | | | | | 33,580,968 | | | | 33,580,968 | |
Total Investments — 100.5% (Cost — $2,106,155,347#) | | | | 2,479,999,468 | |
Liabilities in Excess of Other Assets — (0.5)% | | | | | | | | | | | | | (11,321,319 | ) |
Total Net Assets — 100.0% | | | | | | | | | | | | $ | 2,468,678,149 | |
| * | Non-income producing security. |
| # | Aggregate cost for federal income tax purposes is $2,104,768,444. |
See Notes to Financial Statements.
| | |
| ClearBridge Value Trust 2015 Annual Report | | 13 |
Statement of assets and liabilities
October 31, 2015
| | | | |
| |
| Assets: | | | | |
Investments, at value (Cost — $2,106,155,347) | | $ | 2,479,999,468 | |
Receivable for securities sold | | | 31,365,367 | |
Dividends and interest receivable | | | 2,546,130 | |
Receivable for Fund shares sold | | | 811,643 | |
Prepaid expenses | | | 43,808 | |
Other assets | | | 115,796 | |
Total Assets | | | 2,514,882,212 | |
| |
| Liabilities: | | | | |
Payable for securities purchased | | | 40,897,268 | |
Service and/or distribution fees payable | | | 1,413,770 | |
Investment management fee payable | | | 1,357,860 | |
Payable for Fund shares repurchased | | | 1,325,198 | |
Trustees’ fees payable | | | 20,178 | |
Accrued expenses | | | 1,189,789 | |
Total Liabilities | | | 46,204,063 | |
| Total Net Assets | | $ | 2,468,678,149 | |
| |
| Net Assets: | | | | |
Par value (Note 7) | | $ | 375 | |
Paid-in capital in excess of par value | | | 2,972,618,948 | |
Undistributed net investment income | | | 6,557,128 | |
Accumulated net realized loss on investments and foreign currency transactions | | | (884,342,423) | |
Net unrealized appreciation on investments | | | 373,844,121 | |
| Total Net Assets | | $ | 2,468,678,149 | |
See Notes to Financial Statements.
| | |
| 14 | | ClearBridge Value Trust 2015 Annual Report |
| | | | |
| |
| Net Assets: | | | | |
Class A | | | $127,039,120 | |
Class C | | | $1,744,698,956 | |
Class FI | | | $19,233,332 | |
Class R | | | $9,454,806 | |
Class I | | | $568,251,935 | |
| |
| Shares Outstanding: | | | | |
Class A | | | 1,967,682 | |
Class C | | | 27,570,632 | |
Class FI | | | 263,350 | |
Class R | | | 131,300 | |
Class I | | | 7,521,835 | |
| |
| Net Asset Value: | | | | |
Class A (and redemption price) | | | $64.56 | |
Class C* | | | $63.28 | |
Class FI (and redemption price) | | | $73.03 | |
Class R (and redemption price) | | | $72.01 | |
Class I (and redemption price) | | | $75.55 | |
| Maximum Public Offering Price Per Share: | | | | |
Class A (based on maximum initial sales charge of 5.75%) | | | $68.50 | |
| * | Redemption price per share is NAV of Class C shares reduced by a 0.95% CDSC, if shares are redeemed within one year from purchase payment (See Note 2). |
See Notes to Financial Statements.
| | |
| ClearBridge Value Trust 2015 Annual Report | | 15 |
Statement of operations
For the Year Ended October 31, 2015
| | | | |
| |
| Investment Income: | | | | |
Dividends | | $ | 44,704,760 | |
Return of capital (Note 1(e)) | | | (1,010,000) | |
Net Dividends and Distributions | | | 43,694,760 | |
Refund of foreign taxes withheld (Note 1(j)) | | | 189,823 | |
Interest | | | 30,244 | |
Total Investment Income | | | 43,914,827 | |
| |
| Expenses: | | | | |
Service and/or distribution fees (Notes 2 and 5) | | | 18,461,025 | |
Investment management fee (Note 2) | | | 18,078,718 | |
Transfer agent fees (Note 5) | | | 2,496,301 | |
Trustees’ fees | | | 235,122 | |
Fund accounting fees | | | 199,440 | |
Legal fees | | | 183,167 | |
Registration fees | | | 101,875 | |
Shareholder reports | | | 55,147 | |
Audit and tax fees | | | 43,343 | |
Custody fees | | | 12,892 | |
Insurance | | | 1,930 | |
Miscellaneous expenses | | | 15,933 | |
Total Expenses | | | 39,884,893 | |
Less: Fee waivers and/or expense reimbursements (Notes 2 and 5) | | | (338,081) | |
Net Expenses | | | 39,546,812 | |
| Net Investment Income | | | 4,368,015 | |
| |
Realized and Unrealized Gain (Loss) on Investments and
Foreign Currency Transactions (Notes 1 and 3): | | | | |
Net Realized Gain (Loss) From: | | | | |
Investment transactions | | | 452,954,126 | |
Foreign currency transactions | | | (1,716) | |
Net Realized Gain | | | 452,952,410 | |
Change in Net Unrealized Appreciation (Depreciation) from Investments | | | (505,874,842) | |
| Net Loss on Investments and Foreign Currency Transactions | | | (52,922,432) | |
| Decrease in Net Assets from Operations | | $ | (48,554,417) | |
See Notes to Financial Statements.
| | |
| 16 | | ClearBridge Value Trust 2015 Annual Report |
Statements of changes in net assets
| | | | | | | | |
| For the Years Ended October 31, | | 2015 | | | 2014 | |
| | |
| Operations: | | | | | | | | |
Net investment income | | $ | 4,368,015 | | | $ | 6,401,637 | |
Net realized gain | | | 452,952,410 | | | | 320,943,368 | |
Change in net unrealized appreciation (depreciation) | | | (505,874,842) | | | | 129,728,719 | |
Increase (Decrease) in Net Assets from Operations | | | (48,554,417) | | | | 457,073,724 | |
| | |
| Distributions to Shareholders From (Notes 1 and 6): | | | | | | | | |
Net investment income | | | (3,250,024) | | | | (11,000,031) | |
Decrease in Net Assets from Distributions to Shareholders | | | (3,250,024) | | | | (11,000,031) | |
| | |
| Fund Share Transactions (Note 7): | | | | | | | | |
Net proceeds from sale of shares | | | 182,693,786 | | | | 253,611,217 | |
Reinvestment of distributions | | | 2,887,890 | | | | 10,156,471 | |
Cost of shares repurchased | | | (449,628,654) | | | | (417,293,849) | |
Decrease in Net Assets from Fund Share Transactions | | | (264,046,978) | | | | (153,526,161) | |
Increase (Decrease) in Net Assets | | | (315,851,419) | | | | 292,547,532 | |
| | |
| Net Assets: | | | | | | | | |
Beginning of year | | | 2,784,529,568 | | | | 2,491,982,036 | |
End of year* | | $ | 2,468,678,149 | | | $ | 2,784,529,568 | |
*Includes undistributed net investment income of: | | | $6,557,128 | | | | $5,505,959 | |
See Notes to Financial Statements.
| | |
| ClearBridge Value Trust 2015 Annual Report | | 17 |
Financial highlights
| | | | | | | | | | | | | | | | | | | | |
| For a share of each class of beneficial interest outstanding throughout each year ended October 31: | |
| Class A Shares1 | | 2015 | | | 2014 | | | 2013 | | | 2012 | | | 20112 | |
| | | | | |
| Net asset value, beginning of year | | | $65.81 | | | | $55.63 | | | | $42.02 | | | | $37.86 | | | | $37.91 | |
| | | | | |
| Income (loss) from operations: | | | | | | | | | | | | | | | | | | | | |
Net investment income | | | 0.43 | | | | 0.46 | | | | 0.48 | | | | 0.52 | | | | 0.25 | |
Net realized and unrealized gain (loss) | | | (1.45) | | | | 10.28 | | | | 13.75 | | | | 3.94 | | | | (0.30) | |
Total income (loss) from operations | | | (1.02) | | | | 10.74 | | | | 14.23 | | | | 4.46 | | | | (0.05) | |
| | | | | |
| Less distributions from: | | | | | | | | | | | | | | | | | | | | |
Net investment income | | | (0.23) | | | | (0.56) | | | | (0.62) | | | | (0.30) | | | | — | |
Total distributions | | | (0.23) | | | | (0.56) | | | | (0.62) | | | | (0.30) | | | | — | |
| | | | | |
| Net asset value, end of year | | | $64.56 | | | | $65.81 | | | | $55.63 | | | | $42.02 | | | | $37.86 | |
Total return3 | | | (1.55) | % | | | 19.32 | % | | | 34.44 | % | | | 11.87 | % | | | (0.13) | %4 |
| | | | | |
| Net assets, end of year (000s) | | | $127,039 | | | | $125,291 | | | | $103,438 | | | | $85,746 | | | | $104,812 | |
| | | | | |
| Ratios to average net assets: | | | | | | | | | | | | | | | | | | | | |
Gross expenses | | | 1.02 | % | | | 1.02 | % | | | 1.03 | % | | | 1.04 | % | | | 1.01 | % |
Net expenses5 | | | 1.01 | 6 | | | 1.01 | | | | 1.02 | | | | 1.03 | | | | 1.01 | |
Net investment income | | | 0.65 | | | | 0.75 | | | | 0.99 | | | | 1.29 | | | | 0.64 | |
| | | | | |
| Portfolio turnover rate | | | 33 | % | | | 37 | % | | | 40 | % | | | 40 | % | | | 47 | % |
| 1 | Per share amounts have been calculated using the average shares method. |
| 2 | Represents a share of capital stock outstanding prior to February 29, 2012. |
| 3 | Performance figures, exclusive of sales charges, may reflect compensating balance arrangements, fee waivers and/or expense reimbursements. In the absence of compensating balance arrangements, fee waivers and/or expense reimbursements, the total return would have been lower. Past performance is no guarantee of future results. |
| 4 | The total return includes gains from settlement of investment litigations. Without these gains, the total return would have been (0.76)%. |
| 5 | Reflects expense reimbursements. |
| 6 | As a result of an expense limitation arrangement, effective August 3, 2015, the ratio of expenses, other than interest, brokerage commissions, dividend expense on short sales, taxes, extraordinary expenses and acquired fund fees and expenses, to average net assets of Class A shares did not exceed 1.15%. This expense limitation arrangement cannot be terminated prior to December 31, 2017 without the Board of Trustees’ consent. |
See Notes to Financial Statements.
| | |
| 18 | | ClearBridge Value Trust 2015 Annual Report |
| | | | | | | | | | | | | | | | | | | | |
| For a share of each class of beneficial interest outstanding throughout each year ended October 31: | |
| Class C Shares1 | | 2015 | | | 2014 | | | 2013 | | | 2012 | | | 20112 | |
| | | | | |
| Net asset value, beginning of year | | | $64.75 | | | | $54.77 | | | | $41.35 | | | | $37.26 | | | | $37.60 | |
| | | | | |
| Income (loss) from operations: | | | | | | | | | | | | | | | | | | | | |
Net investment income (loss) | | | (0.06) | | | | 0.00 | 3 | | | 0.12 | | | | 0.21 | | | | (0.05) | |
Net realized and unrealized gain (loss) | | | (1.41) | | | | 10.13 | | | | 13.58 | | | | 3.89 | | | | (0.29) | |
Total income (loss) from operations | | | (1.47) | | | | 10.13 | | | | 13.70 | | | | 4.10 | | | | (0.34) | |
| | | | | |
| Less distributions from: | | | | | | | | | | | | | | | | | | | | |
Net investment income | | | — | | | | (0.15) | | | | (0.28) | | | | (0.01) | | | | — | |
Total distributions | | | — | | | | (0.15) | | | | (0.28) | | | | (0.01) | | | | — | |
| | | | | |
| Net asset value, end of year | | | $63.28 | | | | $64.75 | | | | $54.77 | | | | $41.35 | | | | $37.26 | |
Total return4 | | | (2.27) | % | | | 18.43 | % | | | 33.42 | % | | | 11.00 | % | | | (0.90) | %5 |
| | | | | |
| Net assets, end of year (000s) | | | $1,744,699 | | | | $1,986,538 | | | | $1,889,713 | | | | $1,717,247 | | | | $2,007,207 | |
| | | | | |
| Ratios to average net assets: | | | | | | | | | | | | | | | | | | | | |
Gross expenses | | | 1.75 | % | | | 1.77 | % | | | 1.79 | % | | | 1.80 | % | | | 1.78 | % |
Net expenses6 | | | 1.74 | 7 | | | 1.76 | | | | 1.78 | | | | 1.79 | | | | 1.77 | |
Net investment income (loss) | | | (0.09) | | | | 0.01 | | | | 0.25 | | | | 0.54 | | | | (0.14) | |
| | | | | |
| Portfolio turnover rate | | | 33 | % | | | 37 | % | | | 40 | % | | | 40 | % | | | 47 | % |
| 1 | Per share amounts have been calculated using the average shares method. |
| 2 | Represents a share of capital stock outstanding prior to February 29, 2012. |
| 3 | Amount represents less than $0.005 per share. |
| 4 | Performance figures, exclusive of CDSC, may reflect compensating balance arrangements, fee waivers and/or expense reimbursements. In the absence of compensating balance arrangements, fee waivers and/or expense reimbursements, the total return would have been lower. Past performance is no guarantee of future results. |
| 5 | The total return includes gains from settlement of investment litigations. Without these gains, the total return would have been (1.60)%. |
| 6 | Reflects expense reimbursements. |
| 7 | As a result of an expense limitation arrangement, effective August 3, 2015, the ratio of expenses, other than interest, brokerage commissions, dividend expense on short sales, taxes, extraordinary expenses and acquired fund fees and expenses, to average net assets of Class C shares did not exceed 1.90%. This expense limitation arrangement cannot be terminated prior to December 31, 2017 without the Board of Trustees’ consent. |
See Notes to Financial Statements.
| | |
| ClearBridge Value Trust 2015 Annual Report | | 19 |
Financial highlights (cont’d)
| | | | | | | | | | | | | | | | | | | | |
| For a share of each class of beneficial interest outstanding throughout each year ended October 31: | |
| Class FI Shares1 | | 2015 | | | 2014 | | | 2013 | | | 2012 | | | 20112 | |
| | | | | |
| Net asset value, beginning of year | | | $74.24 | | | | $62.70 | | | | $47.22 | | | | $42.49 | | | | $42.58 | |
| | | | | |
| Income (loss) from operations: | | | | | | | | | | | | | | | | | | | | |
Net investment income | | | 0.41 | | | | 0.50 | | | | 0.55 | | | | 0.60 | | | | 0.22 | |
Net realized and unrealized gain (loss) | | | (1.62) | | | | 11.54 | | | | 15.48 | | | | 4.40 | | | | (0.31) | |
Total income (loss) from operations | | | (1.21) | | | | 12.04 | | | | 16.03 | | | | 5.00 | | | | (0.09) | |
| | | | | |
| Less distributions from: | | | | | | | | | | | | | | | | | | | | |
Net investment income | | | — | | | | (0.50) | | | | (0.55) | | | | (0.27) | | | | — | |
Total distributions | | | — | | | | (0.50) | | | | (0.55) | | | | (0.27) | | | | — | |
| | | | | |
| Net asset value, end of year | | | $73.03 | | | | $74.24 | | | | $62.70 | | | | $47.22 | | | | $42.49 | |
Total return3 | | | (1.63) | % | | | 19.23 | % | | | 34.39 | % | | | 11.83 | % | | | (0.21) | %4 |
| | | | | |
| Net assets, end of year (000s) | | | $19,233 | | | | $38,161 | | | | $48,922 | | | | $50,658 | | | | $128,233 | |
| | | | | |
| Ratios to average net assets: | | | | | | | | | | | | | | | | | | | | |
Gross expenses | | | 1.11 | % | | | 1.09 | % | | | 1.07 | % | | | 1.07 | % | | | 1.10 | % |
Net expenses5 | | | 1.09 | 6 | | | 1.07 | | | | 1.06 | | | | 1.07 | | | | 1.09 | |
Net investment income | | | 0.54 | | | | 0.72 | | | | 1.00 | | | | 1.33 | | | | 0.50 | |
| | | | | |
| Portfolio turnover rate | | | 33 | % | | | 37 | % | | | 40 | % | | | 40 | % | | | 47 | % |
| 1 | Per share amounts have been calculated using the average shares method. |
| 2 | Represents a share of capital stock outstanding prior to February 29, 2012. |
| 3 | Performance figures may reflect compensating balance arrangements, fee waivers and/or expense reimbursements. In the absence of compensating balance arrangements, fee waivers and/or expense reimbursements, the total return would have been lower. Past performance is no guarantee of future results. |
| 4 | The total return includes gains from settlement of investment litigations. Without these gains, the total return would have been (1.29)%. |
| 5 | Reflects expense reimbursements. |
| 6 | As a result of an expense limitation arrangement, effective August 3, 2015, the ratio of expenses, other than interest, brokerage commissions, dividend expense on short sales, taxes, extraordinary expenses and acquired fund fees and expenses, to average net assets of Class FI shares did not exceed 1.15%. This expense limitation arrangement cannot be terminated prior to December 31, 2017 without the Board of Trustees’ consent. |
See Notes to Financial Statements.
| | |
| 20 | | ClearBridge Value Trust 2015 Annual Report |
| | | | | | | | | | | | | | | | | | | | |
| For a share of each class of beneficial interest outstanding throughout each year ended October 31: | |
| Class R Shares1 | | 2015 | | | 2014 | | | 2013 | | | 2012 | | | 20112 | |
| | | | | |
| Net asset value, beginning of year | | | $73.43 | | | | $61.99 | | | | $46.64 | | | | $41.99 | | | | $42.22 | |
| | | | | |
| Income (loss) from operations: | | | | | | | | | | | | | | | | | | | | |
Net investment income | | | 0.19 | | | | 0.22 | | | | 0.30 | | | | 0.41 | | | | 0.09 | |
Net realized and unrealized gain (loss) | | | (1.61) | | | | 11.46 | | | | 15.35 | | | | 4.37 | | | | (0.32) | |
Total income (loss) from operations | | | (1.42) | | | | 11.68 | | | | 15.65 | | | | 4.78 | | | | (0.23) | |
| | | | | |
| Less distributions from: | | | | | | | | | | | | | | | | | | | | |
Net investment income | | | — | | | | (0.24) | | | | (0.30) | | | | (0.13) | | | | — | |
Total distributions | | | — | | | | (0.24) | | | | (0.30) | | | | (0.13) | | | | — | |
| | | | | |
| Net asset value, end of year | | | $72.01 | | | | $73.43 | | | | $61.99 | | | | $46.64 | | | | $41.99 | |
Total return3 | | | (1.93) | % | | | 18.80 | % | | | 33.84 | % | | | 11.41 | % | | | (0.54) | %4 |
| | | | | |
| Net assets, end of year (000s) | | | $9,455 | | | | $10,773 | | | | $10,702 | | | | $11,428 | | | | $18,152 | |
| | | | | |
| Ratios to average net assets: | | | | | | | | | | | | | | | | | | | | |
Gross expenses | | | 1.42 | % | | | 1.46 | % | | | 1.47 | % | | | 1.44 | % | | | 1.39 | % |
Net expenses5 | | | 1.39 | 6 | | | 1.45 | | | | 1.46 | | | | 1.44 | | | | 1.39 | |
Net investment income | | | 0.26 | | | | 0.32 | | | | 0.56 | | | | 0.92 | | | | 0.19 | |
| | | | | |
| Portfolio turnover rate | | | 33 | % | | | 37 | % | | | 40 | % | | | 40 | % | | | 47 | % |
| 1 | Per share amounts have been calculated using the average shares method. |
| 2 | Represents a share of capital stock outstanding prior to February 29, 2012. |
| 3 | Performance figures may reflect compensating balance arrangements, fee waivers and/or expense reimbursements. In the absence of compensating balance arrangements, fee waivers and/or expense reimbursements, the total return would have been lower. Past performance is no guarantee of future results. |
| 4 | The total return includes gains from settlement of investment litigations. Without these gains, the total return would have been (1.52)%. |
| 5 | Reflects fee waivers and/or expense reimbursements. |
| 6 | As a result of an expense limitation arrangement, effective August 3, 2015, the ratio of expenses, other than interest, brokerage commissions, dividend expense on short sales, taxes, extraordinary expenses and acquired fund fees and expenses, to average net assets of Class R shares did not exceed 1.40%. This expense limitation arrangement cannot be terminated prior to December 31, 2017 without the Board of Trustees’ consent. |
See Notes to Financial Statements.
| | |
| ClearBridge Value Trust 2015 Annual Report | | 21 |
Financial highlights (cont’d)
| | | | | | | | | | | | | | | | | | | | |
| For a share of each class of beneficial interest outstanding throughout each year ended October 31: | |
| Class I Shares1 | | 2015 | | | 2014 | | | 2013 | | | 2012 | | | 20112 | |
| | | | | |
| Net asset value, beginning of year | | | $76.92 | | | | $64.90 | | | | $48.92 | | | | $44.04 | | | | $43.99 | |
| | | | | |
| Income (loss) from operations: | | | | | | | | | | | | | | | | | | | | |
Net investment income | | | 0.66 | | | | 0.67 | | | | 0.67 | | | | 0.72 | | | | 0.38 | |
Net realized and unrealized gain (loss) | | | (1.69) | | | | 12.00 | | | | 16.03 | | | | 4.57 | | | | (0.33) | |
Total income (loss) from operations | | | (1.03) | | | | 12.67 | | | | 16.70 | | | | 5.29 | | | | 0.05 | |
| | | | | |
| Less distributions from: | | | | | | | | | | | | | | | | | | | | |
Net investment income | | | (0.34) | | | | (0.65) | | | | (0.72) | | | | (0.41) | | | | — | |
Total distributions | | | (0.34) | | | | (0.65) | | | | (0.72) | | | | (0.41) | | | | — | |
| | | | | |
| Net asset value, end of year | | | $75.55 | | | | $76.92 | | | | $64.90 | | | | $48.92 | | | | $44.04 | |
Total return3 | | | (1.34) | % | | | 19.56 | % | | | 34.70 | % | | | 12.12 | % | | | 0.11 | %4 |
| | | | | |
| Net assets, end of year (000s) | | | $568,252 | | | | $623,767 | | | | $439,207 | | | | $327,747 | | | | $548,740 | |
| | | | | |
| Ratios to average net assets: | | | | | | | | | | | | | | | | | | | | |
Gross expenses | | | 0.82 | % | | | 0.82 | % | | | 0.83 | % | | | 0.81 | % | | | 0.77 | % |
Net expenses5 | | | 0.80 | 6 | | | 0.81 | | | | 0.82 | | | | 0.80 | | | | 0.77 | |
Net investment income | | | 0.85 | | | | 0.94 | | | | 1.17 | | | | 1.55 | | | | 0.82 | |
| | | | | |
| Portfolio turnover rate | | | 33 | % | | | 37 | % | | | 40 | % | | | 40 | % | | | 47 | % |
| 1 | Per share amounts have been calculated using the average shares method. |
| 2 | Represents a share of capital stock outstanding prior to February 29, 2012. |
| 3 | Performance figures may reflect compensating balance arrangements, fee waivers and/or expense reimbursements. In the absence of compensating balance arrangements, fee waivers and/or expense reimbursements, the total return would have been lower. Past performance is no guarantee of future results. |
| 4 | The total return includes gains from settlement of investment litigations. Without these gains, the total return would have been (1.00)%. |
| 5 | Reflects expense reimbursements. |
| 6 | As a result of an expense limitation arrangement, effective August 3, 2015, the ratio of expenses, other than interest, brokerage commissions, dividend expense on short sales, taxes, extraordinary expenses and acquired fund fees and expenses, to average net assets of Class I shares did not exceed 0.80%. This expense limitation arrangement cannot be terminated prior to December 31, 2017 without the Board of Trustees’ consent. |
See Notes to Financial Statements.
| | |
| 22 | | ClearBridge Value Trust 2015 Annual Report |
Notes to financial statements
1. Organization and significant accounting policies
ClearBridge Value Trust (the “Fund”) is a separate diversified investment series of Legg Mason Global Asset Management Trust (the “Trust”). The Trust, a Maryland statutory trust, is registered under the Investment Company Act of 1940, as amended (the “1940 Act”), as an open-end management investment company.
The following are significant accounting policies consistently followed by the Fund and are in conformity with U.S. generally accepted accounting principles (“GAAP”). Estimates and assumptions are required to be made regarding assets, liabilities and changes in net assets resulting from operations when financial statements are prepared. Changes in the economic environment, financial markets and any other parameters used in determining these estimates could cause actual results to differ. Subsequent events have been evaluated through the date the financial statements were issued.
(a) Investment valuation. Equity securities for which market quotations are available are valued at the last reported sales price or official closing price on the primary market or exchange on which they trade. The valuations for fixed income securities (which may include, but are not limited to, corporate, government, municipal, mortgage-backed, collateralized mortgage obligations and asset-backed securities) and certain derivative instruments are typically the prices supplied by independent third party pricing services, which may use market prices or broker/dealer quotations or a variety of valuation techniques and methodologies. The independent third party pricing services use inputs that are observable such as issuer details, interest rates, yield curves, prepayment speeds, credit risks/spreads, default rates and quoted prices for similar securities. Short-term fixed income securities that will mature in 60 days or less are valued at amortized cost, unless it is determined that using this method would not reflect an investment’s fair value. Investments in open-end funds are valued at the closing net asset value per share of each fund on the day of valuation. When the Fund holds securities or other assets that are denominated in a foreign currency, the Fund will normally use the currency exchange rates as of 4:00 p.m. (Eastern Time). If independent third party pricing services are unable to supply prices for a portfolio investment, or if the prices supplied are deemed by the manager to be unreliable, the market price may be determined by the manager using quotations from one or more broker/dealers or at the transaction price if the security has recently been purchased and no value has yet been obtained from a pricing service or pricing broker. When reliable prices are not readily available, such as when the value of a security has been significantly affected by events after the close of the exchange or market on which the security is principally traded, but before the Fund calculates its net asset value, the Fund values these securities as determined in accordance with procedures approved by the Fund’s Board of Trustees.
The Board of Trustees is responsible for the valuation process and has delegated the supervision of the daily valuation process to the Legg Mason North Atlantic Fund Valuation Committee (formerly, Legg Mason North American Fund Valuation Committee) (the “Valuation Committee”). The Valuation Committee, pursuant to the policies adopted by the
| | |
| ClearBridge Value Trust 2015 Annual Report | | 23 |
Notes to financial statements (cont’d)
Board of Trustees, is responsible for making fair value determinations, evaluating the effectiveness of the Fund’s pricing policies, and reporting to the Board of Trustees. When determining the reliability of third party pricing information for investments owned by the Fund, the Valuation Committee, among other things, conducts due diligence reviews of pricing vendors, monitors the daily change in prices and reviews transactions among market participants.
The Valuation Committee will consider pricing methodologies it deems relevant and appropriate when making fair value determinations. Examples of possible methodologies include, but are not limited to, multiple of earnings; discount from market of a similar freely traded security; discounted cash-flow analysis; book value or a multiple thereof; risk premium/yield analysis; yield to maturity; and/or fundamental investment analysis. The Valuation Committee will also consider factors it deems relevant and appropriate in light of the facts and circumstances. Examples of possible factors include, but are not limited to, the type of security; the issuer’s financial statements; the purchase price of the security; the discount from market value of unrestricted securities of the same class at the time of purchase; analysts’ research and observations from financial institutions; information regarding any transactions or offers with respect to the security; the existence of merger proposals or tender offers affecting the security; the price and extent of public trading in similar securities of the issuer or comparable companies; and the existence of a shelf registration for restricted securities.
For each portfolio security that has been fair valued pursuant to the policies adopted by the Board of Trustees, the fair value price is compared against the last available and next available market quotations. The Valuation Committee reviews the results of such back testing monthly and fair valuation occurrences are reported to the Board of Trustees quarterly.
The Fund uses valuation techniques to measure fair value that are consistent with the market approach and/or income approach, depending on the type of security and the particular circumstance. The market approach uses prices and other relevant information generated by market transactions involving identical or comparable securities. The income approach uses valuation techniques to discount estimated future cash flows to present value.
GAAP establishes a disclosure hierarchy that categorizes the inputs to valuation techniques used to value assets and liabilities at measurement date. These inputs are summarized in the three broad levels listed below:
| • | | Level 1 — quoted prices in active markets for identical investments |
| • | | Level 2 — other significant observable inputs (including quoted prices for similar investments, interest rates, prepayment speeds, credit risk, etc.) |
| • | | Level 3 — significant unobservable inputs (including the Fund’s own assumptions in determining the fair value of investments) |
The inputs or methodologies used to value securities are not necessarily an indication of the risk associated with investing in those securities.
| | |
| 24 | | ClearBridge Value Trust 2015 Annual Report |
The following is a summary of the inputs used in valuing the Fund’s assets carried at fair value:
| | | | | | | | | | | | | | | | |
| ASSETS | |
| Description | | Quoted Prices (Level 1) | | | Other Significant
Observable Inputs
(Level 2) | | | Significant Unobservable Inputs (Level 3) | | | Total | |
| Common stocks† | | $ | 2,446,418,500 | | | | — | | | | — | | | $ | 2,446,418,500 | |
| Short-term investments† | | | 33,580,968 | | | | — | | | | — | | | | 33,580,968 | |
| Total investments | | $ | 2,479,999,468 | | | | — | | | | — | | | $ | 2,479,999,468 | |
| † | See Schedule of Investments for additional detailed categorizations. |
(b) Repurchase agreements. The Fund may enter into repurchase agreements with institutions that its investment manager has determined are creditworthy. Each repurchase agreement is recorded at cost. Under the terms of a typical repurchase agreement, the Fund acquires a debt security subject to an obligation of the seller to repurchase, and of the Fund to resell, the security at an agreed-upon price and time, thereby determining the yield during the Fund’s holding period. When entering into repurchase agreements, it is the Fund’s policy that its custodian or a third party custodian, acting on the Fund’s behalf, take possession of the underlying collateral securities, the market value of which, at all times, at least equals the principal amount of the repurchase transaction, including accrued interest. To the extent that any repurchase transaction maturity exceeds one business day, the value of the collateral is marked-to-market and measured against the value of the agreement in an effort to ensure the adequacy of the collateral. If the counterparty defaults, the Fund generally has the right to use the collateral to satisfy the terms of the repurchase transaction. However, if the market value of the collateral declines during the period in which the Fund seeks to assert its rights or if bankruptcy proceedings are commenced with respect to the seller of the security, realization of the collateral by the Fund may be delayed or limited.
(c) Foreign currency translation. Investment securities and other assets and liabilities denominated in foreign currencies are translated into U.S. dollar amounts based upon prevailing exchange rates on the date of valuation. Purchases and sales of investment securities and income and expense items denominated in foreign currencies are translated into U.S. dollar amounts based upon prevailing exchange rates on the respective dates of such transactions.
The Fund does not isolate that portion of the results of operations resulting from fluctuations in foreign exchange rates on investments from the fluctuations arising from changes in market prices of securities held. Such fluctuations are included with the net realized and unrealized gain or loss on investments.
Net realized foreign exchange gains or losses arise from sales of foreign currencies, including gains and losses on forward foreign currency contracts, currency gains or losses realized between the trade and settlement dates on securities transactions, and the
| | |
| ClearBridge Value Trust 2015 Annual Report | | 25 |
Notes to financial statements (cont’d)
difference between the amounts of dividends, interest, and foreign withholding taxes recorded on the Fund’s books and the U.S. dollar equivalent of the amounts actually received or paid. Net unrealized foreign exchange gains and losses arise from changes in the values of assets and liabilities, other than investments in securities, on the date of valuation, resulting from changes in exchange rates.
Foreign security and currency transactions may involve certain considerations and risks not typically associated with those of U.S. dollar denominated transactions as a result of, among other factors, the possibility of lower levels of governmental supervision and regulation of foreign securities markets and the possibility of political or economic instability.
(d) Security transactions and investment income. Security transactions are accounted for on a trade date basis. Interest income, adjusted for amortization of premium and accretion of discount, is recorded on the accrual basis. Dividend income is recorded on the ex-dividend date. The cost of investments sold is determined by use of the specific identification method. To the extent any issuer defaults or a credit event occurs that impacts the issuer, the Fund may halt any additional interest income accruals and consider the realizability of interest accrued up to the date of default or credit event.
(e) REIT distributions. The character of distributions received from Real Estate Investment Trusts (‘‘REITs’’) held by the Fund is generally comprised of net investment income, capital gains, and return of capital. It is the policy of the Fund to estimate the character of distributions received from underlying REITs based on historical data provided by the REITs. After each calendar year end, REITs report the actual tax character of these distributions. Differences between the estimated and actual amounts reported by the REITs are reflected in the Fund’s records in the year in which they are reported by the REITs by adjusting related investment cost basis, capital gains and income, as necessary.
(f) Distributions to shareholders. Distributions from net investment income and distributions of net realized gains, if any, are declared at least annually. Distributions to shareholders of the Fund are recorded on the ex-dividend date and are determined in accordance with income tax regulations, which may differ from GAAP.
(g) Share class accounting. Investment income, common expenses and realized/unrealized gains (losses) on investments are allocated to the various classes of the Fund on the basis of daily net assets of each class. Fees relating to a specific class are charged directly to that share class.
(h) Compensating balance arrangements. The Fund has an arrangement with its custodian bank whereby a portion of the custodian’s fees is paid indirectly by credits earned on the Fund’s cash on deposit with the bank.
(i) Commission recapture. The Fund has entered into an agreement with State Street Bank, its custodian, whereby a portion of commissions paid on investment transactions may be rebated to the Fund. Such payments are included with realized gain (loss) on investment transactions. During the year ended October 31, 2015, the Fund did not receive any commission rebates.
| | |
| 26 | | ClearBridge Value Trust 2015 Annual Report |
(j) Federal and other taxes. It is the Fund’s policy to comply with the federal income and excise tax requirements of the Internal Revenue Code of 1986 (the “Code”), as amended, applicable to regulated investment companies. Accordingly, the Fund intends to distribute its taxable income and net realized gains, if any, to shareholders in accordance with timing requirements imposed by the Code. Therefore, no federal or state income tax provision is required in the Fund’s financial statements.
Management has analyzed the Fund’s tax positions taken on income tax returns for all open tax years and has concluded that as of October 31, 2015, no provision for income tax is required in the Fund’s financial statements. The Fund’s federal and state income and federal excise tax returns for tax years for which the applicable statutes of limitations have not expired are subject to examination by the Internal Revenue Service and state departments of revenue.
Under the applicable foreign tax laws, a withholding tax may be imposed on interest, dividends and capital gains at various rates.
On September 21, 2015, the Fund received $189,823 from the Finnish Tax Administration for the refund of withholding taxes on dividends, plus interest, previously paid by the Fund.
(k) Reclassification. GAAP requires that certain components of net assets be reclassified to reflect permanent differences between financial and tax reporting. These reclassifications have no effect on net assets or net asset value per share. During the current year, the following reclassifications have been made:
| | | | | | | | |
| | | Undistributed Net
Investment Income | | | Accumulated Net
Realized Loss | |
| (a) | | $ | (66,822) | | | $ | 66,822 | |
| (a) | Reclassifications are due to foreign currency transactions treated as ordinary income for tax purposes and book/tax differences in the treatment of gains recognized on certain investments. |
2. Investment advisory and management agreement and other transactions with affiliates
The Fund has an investment advisory and management agreement with ClearBridge, LLC (“ClearBridge”). Pursuant to the agreement, ClearBridge provides the Fund with investment advisory, management and administrative services for which the Fund pays a fee, computed daily and payable monthly, at annual rates based on the Fund’s average daily net assets. Western Asset Management Company (“Western Asset”) manages the portion of the Fund’s cash and short-term instruments allocated to it. The following chart shows the annual advisory fee rates for the Fund:
| | | | |
| Average Daily Net Assets | | Annual Rate | |
| First $1 billion | | | 0.700 | % |
| Next $1 billion | | | 0.680 | |
| Next $3 billion | | | 0.650 | |
| Next $5 billion | | | 0.620 | |
| Over $10 billion | | | 0.590 | |
Legg Mason Partners Fund Advisor, LLC (“LMPFA”) provides certain administrative and oversight services to the Fund. For LMPFA’s services to the Fund, ClearBridge (not the Fund)
| | |
| ClearBridge Value Trust 2015 Annual Report | | 27 |
Notes to financial statements (cont’d)
pays LMPFA a fee, calculated daily and payable monthly, at an annual rate of 0.05% of the average daily net assets of the Fund. For Western Asset’s services to the Fund, ClearBridge (not the Fund) pays Western Asset 0.02% of the portion of the Fund’s average daily net assets that are allocated to them by ClearBridge. ClearBridge, LMPFA and Western Asset are wholly owned subsidiaries of Legg Mason, Inc. (“Legg Mason”).
The Fund’s agreement with ClearBridge provides that expense reimbursements be made to the Fund for audit fees, compensation of the Fund’s independent trustees and certain other expenses. These expense reimbursements are not subject to recapture.
As a result of expense limitation arrangements, effective August 3, 2015, between the Fund and ClearBridge, the ratio of expenses, other than interest, brokerage commissions, dividend expense on short sales, taxes, extraordinary expenses and acquired fund fees and expenses, to average net assets of Class A, Class C, Class FI, Class R and Class I shares did not exceed 1.15%, 1.90%, 1.15%, 1.40% and 0.80%, respectively. These expense limitation arrangements cannot be terminated prior to December 31, 2017 without the Board of Trustees’ consent.
During the year ended October 31, 2015, fees waived and/or expenses reimbursed amounted to $338,081.
ClearBridge is permitted to recapture amounts waived and/or reimbursed to a class within three years after the fiscal year in which ClearBridge earned the fee or incurred the expense if the class’ total annual operating expenses have fallen to a level below the expense limitation (“expense cap”) in effect at the time the fees were earned or the expenses incurred. In no case will ClearBridge recapture any amount that would result, on any particular business day of the Fund, in the class’ total annual operating expenses exceeding the expense cap or any other lower limit then in effect.
Pursuant to these arrangements, at October 31, 2015, the Fund had remaining fee waivers and/or expense reimbursements subject to recapture by ClearBridge and respective dates of expiration as follows:
| | | | | | | | | | | | | | | | | | | | |
| | | Class A | | | Class C | | | Class FI | | | Class R | | | Class I | |
| Expires October 31, 2018 | | | — | | | | — | | | | — | | | $ | 1,982 | | | $ | 37,634 | |
Total fee waivers/expense
reimbursements subject to recapture | | | — | | | | — | | | | — | | | $ | 1,982 | | | $ | 37,634 | |
Legg Mason Investor Services, LLC (“LMIS”), a wholly-owned broker-dealer subsidiary of Legg Mason, serves as the Fund’s sole and exclusive distributor.
There is a maximum initial sales charge of 5.75% for Class A shares. There is a contingent deferred sales charge (“CDSC”) of 0.95% on Class C shares, which applies if redemption occurs within 12 months from purchase payment. In certain cases, Class A shares have a 1.00% CDSC, which applies if redemption occurs within 18 months from purchase payment. This CDSC only applies to those purchases of Class A shares, which, when combined with current holdings of other shares of funds sold by LMIS, equal or exceed $1,000,000 in the aggregate. These purchases do not incur an initial sales charge.
| | |
| 28 | | ClearBridge Value Trust 2015 Annual Report |
For the year ended October 31, 2015, LMIS and its affiliates retained sales charges of $13,009 on sales of the Fund’s Class A shares. In addition, for the year ended October 31, 2015, CDSCs paid to LMIS and its affiliates were:
| | | | | | | | |
| | | Class A | | | Class C | |
| CDSCs | | $ | 82 | | | $ | 14,010 | |
Under a Deferred Compensation Plan (the “Plan”), Trustees may elect to defer receipt of all or a specified portion of their compensation. A participating Trustee may select one or more funds managed by affiliates of Legg Mason in which his or her deferred trustee’s fees will be deemed to be invested. Deferred amounts remain in the Fund until distributed in accordance with the Plan. In May 2015, the Board of Trustees approved an amendment to the Plan so that effective January 1, 2016, no compensation earned after that date may be deferred under the Plan.
All officers and one Trustee of the Trust are employees of Legg Mason or its affiliates and did not receive compensation from the Trust.
3. Investments
During the year ended October 31, 2015, the aggregate cost of purchases and proceeds from sales of investments (excluding short-term investments) were as follows:
| | | | |
| Purchases | | $ | 869,259,163 | |
| Sales | | | 1,133,283,607 | |
At October 31, 2015, the aggregate gross unrealized appreciation and depreciation of investments for federal income tax purposes were as follows:
| | | | |
| Gross unrealized appreciation | | $ | 615,997,479 | |
| Gross unrealized depreciation | | | (240,766,455) | |
| Net unrealized appreciation | | $ | 375,231,024 | |
4. Derivative instruments and hedging activities
During the year ended October 31, 2015, the Fund did not invest in derivative instruments.
5. Class specific expenses, waivers and/or expense reimbursements
The Fund has adopted Rule 12b-1 shareholder services and distribution plan and under that plan the Fund pays service and/or distribution fees with respect to its Class A, Class C, Class FI and Class R shares calculated at the annual rate of 0.25%, 0.95%, 0.25% and 0.50% of the average daily net assets of each class, respectively. Service and/or distribution fees are accrued daily and paid monthly.
For the year ended October 31, 2015, class specific expenses were as follows:
| | | | | | | | |
| | | Service and/or
Distribution Fees | | | Transfer Agent
Fees | |
| Class A | | $ | 324,579 | | | $ | 70,282 | |
| Class C | | | 18,035,309 | | | | 1,742,998 | |
| Class FI | | | 50,923 | | | | 29,548 | |
| Class R | | | 50,214 | | | | 21,192 | |
| Class I | | | — | | | | 632,281 | |
| Total | | $ | 18,461,025 | | | $ | 2,496,301 | |
| | |
| ClearBridge Value Trust 2015 Annual Report | | 29 |
Notes to financial statements (cont’d)
For the year ended October 31, 2015, waivers and/or expense reimbursements by class were as follows:
| | | | |
| | | Waivers/Expense
Reimbursements | |
| Class A | | $ | 14,602 | |
| Class C | | | 213,125 | |
| Class FI | | | 2,280 | |
| Class R | | | 3,107 | |
| Class I | | | 104,967 | |
| Total | | $ | 338,081 | |
6. Distributions to shareholders by class
| | | | | | | | |
| | | Year Ended
October 31, 2015 | | | Year Ended
October 31, 2014 | |
| Net Investment Income: | | | | | | | | |
| Class A | | $ | 449,276 | | | $ | 1,037,107 | |
| Class C | | | — | | | | 4,952,291 | |
| Class FI | | | — | | | | 389,313 | |
| Class R | | | — | | | | 40,559 | |
| Class I | | | 2,800,748 | | | | 4,580,761 | |
| Total | | $ | 3,250,024 | | | $ | 11,000,031 | |
7. Shares of beneficial interest
At October 31, 2015, the Trust had an unlimited number of shares of beneficial interest authorized with a par value of $0.00001 per share. The Funds have the ability to issue multiple classes of shares. Each class of shares represents an identical interest and has the same rights, except that each class bears certain direct expenses, including those specifically related to the distribution of its shares.
Transactions in shares of each class were as follows
| | | | | | | | | | | | | | | | |
| | | Year Ended
October 31, 2015 | | | Year Ended
October 31, 2014 | |
| | | Shares | | | Amount | | | Shares | | | Amount | |
| Class A | | | | | | | | | | | | | | | | |
| Shares sold | | | 366,500 | | | $ | 24,114,209 | | | | 351,566 | | | $ | 21,492,121 | |
| Shares issued on reinvestment | | | 6,002 | | | | 393,278 | | | | 15,942 | | | | 935,640 | |
| Shares repurchased | | | (308,685) | | | | (20,467,482) | | | | (322,881) | | | | (19,613,338) | |
| Net increase | | | 63,817 | | | $ | 4,040,005 | | | | 44,627 | | | $ | 2,814,423 | |
| | | | |
| Class C | | | | | | | | | | | | | | | | |
| Shares sold | | | 435,610 | | | $ | 28,430,788 | | | | 444,180 | | | $ | 26,635,545 | |
| Shares issued on reinvestment | | | — | | | | — | | | | 82,747 | | | | 4,808,450 | |
| Shares repurchased | | | (3,544,904) | | | | (231,804,436) | | | | (4,347,091) | | | | (260,991,093) | |
| Net decrease | | | (3,109,294) | | | $ | (203,373,648) | | | | (3,820,164) | | | $ | (229,547,098) | |
| | |
| 30 | | ClearBridge Value Trust 2015 Annual Report |
| | | | | | | | | | | | | | | | |
| | | Year Ended
October 31, 2015 | | | Year Ended
October 31, 2014 | |
| | | Shares | | | Amount | | | Shares | | | Amount | |
| Class FI | | | | | | | | | | | | | | | | |
| Shares sold | | | 98,163 | | | $ | 7,473,303 | | | | 124,780 | | | $ | 8,576,064 | |
| Shares issued on reinvestment | | | — | | | | — | | | | 5,867 | | | | 388,705 | |
| Shares repurchased | | | (348,806) | | | | (26,061,267) | | | | (396,966) | | | | (28,580,928) | |
| Net decrease | | | (250,643) | | | $ | (18,587,964) | | | | (266,319) | | | $ | (19,616,159) | |
| | | | |
| Class R | | | | | | | | | | | | | | | | |
| Shares sold | | | 22,456 | | | $ | 1,667,836 | | | | 40,696 | | | $ | 2,747,879 | |
| Shares issued on reinvestment | | | — | | | | — | | | | 617 | | | | 40,559 | |
| Shares repurchased | | | (37,874) | | | | (2,879,250) | | | | (67,249) | | | | (4,647,617) | |
| Net decrease | | | (15,418) | | | $ | (1,211,414) | | | | (25,936) | | | $ | (1,859,179) | |
| | | | |
| Class I | | | | | | | | | | | | | | | | |
| Shares sold | | | 1,558,281 | | | $ | 121,007,650 | | | | 2,736,649 | | | $ | 194,159,608 | |
| Shares issued on reinvestment | | | 32,601 | | | | 2,494,612 | | | | 58,165 | | | | 3,983,117 | |
| Shares repurchased | | | (2,178,368) | | | | (168,416,219) | | | | (1,452,815) | | | | (103,460,873) | |
| Net increase (decrease) | | | (587,486) | | | $ | (44,913,957) | | | | 1,341,999 | | | $ | 94,681,852 | |
8. Income tax information and distributions to shareholders
The tax character of distributions paid during the fiscal years ended October 31, was as follows:
| | | | | | | | |
| | | 2015 | | | 2014 | |
| Distributions paid from: | | | | | | | | |
| Ordinary income | | $ | 3,250,024 | | | $ | 11,000,031 | |
As of October 31, 2015, the components of accumulated earnings (losses) on a tax basis were as follows:
| | | | |
| Undistributed ordinary income — net | | $ | 2,335,478 | |
| Capital loss carryforward* | | | (881,099,814) | |
| Other book/tax temporary differences(a) | | | (407,862) | |
| Unrealized appreciation (depreciation)(b) | | | 375,231,024 | |
| Total accumulated earnings (losses) — net | | $ | (503,941,174) | |
| * | During the taxable year ended October 31, 2015, the Fund utilized $ 457,021,428 of its capital loss carryforward available from prior years. As of October 31, 2015, the Fund had the following net capital loss carryforward remaining: |
| | | | |
| Year of Expiration | | Amount | |
| 10/31/2017 | | $ | (881,099,814 | ) |
This amount will be available to offset any future taxable capital gains.
| (a) | Other book/tax temporary differences are attributable to book/tax differences in the timing of the deductibility of various expenses. |
| (b) | The difference between book-basis and tax-basis unrealized appreciation (depreciation) is attributable to the tax deferral of losses on wash sales and book/tax differences in the basis of partnership interests and other investments. |
| | |
| ClearBridge Value Trust 2015 Annual Report | | 31 |
Report of independent registered public accounting firm
To the Board of Trustees of Legg Mason Global Asset Management Trust and to the Shareholders of ClearBridge Value Trust:
In our opinion, the accompanying statement of assets and liabilities, including the schedule of investments, and the related statements of operations and of changes in net assets and the financial highlights present fairly, in all material respects, the financial position of the ClearBridge Value Trust (one of the funds comprising Legg Mason Global Asset Management Trust, the “Fund”) at October 31, 2015, the results of its operations, the changes in its net assets and the financial highlights for each of the periods presented, in conformity with accounting principles generally accepted in the United States of America. These financial statements and financial highlights (hereafter referred to as “financial statements”) are the responsibility of the Fund’s management. Our responsibility is to express an opinion on these financial statements based on our audits. We conducted our audits of these financial statements in accordance with the standards of the Public Company Accounting Oversight Board (United States). Those standards require that we plan and perform the audit to obtain reasonable assurance about whether the financial statements are free of material misstatement. An audit includes examining, on a test basis, evidence supporting the amounts and disclosures in the financial statements, assessing the accounting principles used and significant estimates made by management, and evaluating the overall financial statement presentation. We believe that our audits, which included confirmation of securities at October 31, 2015 by correspondence with the custodian and brokers, provide a reasonable basis for our opinion.
PricewaterhouseCoopers LLP
Baltimore, Maryland
December 21, 2015
| | |
| 32 | | ClearBridge Value Trust 2015 Annual Report |
Additional information (unaudited)
Information about Trustees and Officers
The business and affairs of ClearBridge Value Trust (the “Fund”) are conducted by management under the supervision and subject to the direction of its Board of Trustees. The business address of each Trustee is c/o Jane Trust, Legg Mason, 100 International Drive, 11th Floor, Baltimore, Maryland 21202. Information pertaining to the Trustees and officers of the Fund is set forth below.
The Statement of Additional Information includes additional information about Trustees and is available, without charge, upon request by calling the Fund at 1-877-721-1926.
| | |
| Independent Trustees† |
| Ruby P. Hearn |
| Year of birth | | 1940 |
| Position(s) with Trust | | Trustee |
| Term of office1 and length of time served2 | | Since 2004 |
| Principal occupation(s) during past five years | | Senior Vice President Emerita of The Robert Wood Johnson Foundation (non-profit) since 2001; Member of the Institute of Medicine since 1982; formerly, Trustee of the New York Academy of Medicine (2004 to 2012); Director of the Institute for Healthcare Improvement (2002 to 2012); Senior Vice President of The Robert Wood Johnson Foundation (1996 to 2001); Fellow of The Yale Corporation (1992 to 1998) |
| Number of funds in fund complex overseen by Trustee | | 19 |
| Other board memberships held by Trustee during past five years | | None |
|
| Arnold L. Lehman |
| Year of birth | | 1944 |
| Position(s) with Trust | | Trustee and Chairman |
| Term of office1 and length of time served2 | | Since 1982 and since 2015 |
| Principal occupation(s) during past five years | | Retired. Trustee of American Federation of Arts since 1998; formerly, Director of the Brooklyn Museum (1997 to 2015); Director of The Baltimore Museum of Art (1979 to 1997) |
| Number of funds in fund complex overseen by Trustee | | 19 |
| Other board memberships held by Trustee during past five years | | None |
|
| Robin J.W. Masters |
| Year of birth | | 1955 |
| Position(s) with Trust | | Trustee |
| Term of office1 and length of time served2 | | Since 2002 |
| Principal occupation(s) during past five years | | Retired; formerly, Chief Investment Officer of ACE Limited (insurance) (1986 to 2000) |
| Number of funds in fund complex overseen by Trustee | | 19 |
| Other board memberships held by Trustee during past five years | | Director of Cheyne Capital International Limited (investment advisory firm); formerly, Director/Trustee of Legg Mason Institutional Funds plc, WA Fixed Income Funds plc and Western Asset Debt Securities Fund plc. (2007 to 2011) |
| | |
| ClearBridge Value Trust | | 33 |
Additional information (unaudited) (cont’d)
Information about Trustees and Officers
| | |
| Independent Trustees† cont’d |
| Jill E. McGovern |
| Year of birth | | 1944 |
| Position(s) with Trust | | Trustee |
| Term of office1 and length of time served2 | | Since 1989 |
| Principal occupation(s) during past five years | | Senior Consultant, American Institute for Contemporary German Studies (AICGS) since 2007; formerly, Chief Executive Officer of The Marrow Foundation (non-profit) (1993 to 2007); Executive Director of the Baltimore International Festival (1991 to 1993); Senior Assistant to the President of The Johns Hopkins University (1986 to 1990) |
| Number of funds in fund complex overseen by Trustee | | 19 |
| Other board memberships held by Trustee during past five years | | Director of International Biomedical Research Alliance; Director of Lois Roth Endowment |
|
| Arthur S. Mehlman |
| Year of birth | | 1942 |
| Position(s) with Trust | | Trustee |
| Term of office1 and length of time served2 | | Since 2002 |
| Principal occupation(s) during past five years | | Retired. Director, The University of Maryland Foundation since 1992; Director, The League for People with Disabilities since 2003; formerly, Director, Municipal Mortgage & Equity LLC (2004 to 2011); Partner, KPMG LLP (international accounting firm) (1972 to 2002) |
| Number of funds in fund complex overseen by Trustee | | Director/Trustee of all Legg Mason Funds consisting of 18 portfolios; Director/Trustee of the Royce Family of Funds consisting of 26 portfolios |
| Other board memberships held by Trustee during past five years | | Director of Municipal Mortgage & Equity, LLC. (2004 to 2011) |
|
| G. Peter O’Brien |
| Year of birth | | 1945 |
| Position(s) with Trust | | Trustee |
| Term of office1 and length of time served2 | | Since 1999 |
| Principal occupation(s) during past five years | | Retired. Trustee Emeritus of Colgate University; Board Member, Hill House, Inc. (residential home care); Board Member, Bridges School (pre- school); formerly, Managing Director, Equity Capital Markets Group of Merrill Lynch & Co. (1971 to 1999) |
| Number of funds in fund complex overseen by Trustee | | Director/Trustee of all Legg Mason funds consisting of 18 portfolios; Director/Trustee of the Royce Family of Funds consisting of 26 portfolios |
| Other board memberships held by Trustee during past five years | | Director of TICC Capital Corp. |
| | |
| 34 | | ClearBridge Value Trust |
| | |
| Independent Trustees† cont’d |
| S. Ford Rowan |
| Year of birth | | 1943 |
| Position(s) with Trust | | Trustee |
| Term of office1 and length of time served2 | | Since 2002 |
| Principal occupation(s) during past five years | | Chairman, National Center for Critical Incident Analysis, since 2004; Consultant to University of Maryland University College, since 2013; formerly, Lecturer in Organizational Sciences, George Washington University (2000 to 2014); Trustee, St. John’s College (2006 to 2012); Consultant, Rowan & Blewitt Inc. (management consulting) (1984 to 2007); Lecturer in Journalism, Northwestern University (1980 to 1993); Director, Santa Fe Institute (1999 to 2008) |
| Number of funds in fund complex overseen by Trustee | | 19 |
| Other board memberships held by Trustee during past five years | | None |
|
| Robert M. Tarola |
| Year of birth | | 1950 |
| Position(s) with Trust | | Trustee |
| Term of office1 and length of time served2 | | Since 2004 |
| Principal occupation(s) during past five years | | Executive Vice President and Chief Financial Officer, Southcoast Health System, Inc. (healthcare provider network) since 2015; President of Right Advisory LLC (corporate finance and governance consulting) since 2008; Member, Investor Advisory Group of the Public Company Accounting Oversight Board since 2009; formerly, Senior Vice President and Chief Financial Officer of The Howard University (2009 to 2013) (higher education and health care); Senior Vice President and Chief Financial Officer of W.R. Grace & Co. (specialty chemicals) (1999 to 2008) and MedStar Health, Inc. (healthcare) (1996 to 1999); Partner, Price Waterhouse, LLP (accounting and auditing) (1984 to 1996) |
| Number of funds in fund complex overseen by Trustee | | 19 |
| Other board memberships held by Trustee during past five years | | Director of American Kidney Fund (renal disease assistance); Director of XBRL International, Inc. (global data standard setting); Director of Vista Outdoor, Inc. (sporting goods); formerly, Director of TeleTech Holdings, Inc. (business process outsourcing) |
| | |
| ClearBridge Value Trust | | 35 |
Additional information (unaudited) (cont’d)
Information about Trustees and Officers
| | |
| Interested Trustee |
Jane Trust3 | | |
| Year of birth | | 1962 |
| Position(s) with Trust | | Trustee, President and Chief Executive Officer |
| Term of office1 and length of time served2 | | Since 2015 |
| Principal occupation(s) during past five years | | Managing Director of Legg Mason & Co., LLC (“Legg Mason & Co.”) (since 2015); Officer and/or Trustee/Director of 156 funds associated with Legg Mason Partners Fund Advisor, LLC (“LMPFA”) or its affiliates (since 2015); President and Chief Executive Officer of LMPFA (since 2015); formerly, Senior Vice President of LMPFA (2015); formerly, Director of ClearBridge, LLC (formerly, Legg Mason Capital Management, LLC) (2007 to 2014); formerly, Managing Director of Legg Mason Investment Counsel & Trust Co. (2000 to 2007) |
| Number of funds in fund complex overseen by Trustee | | 147 |
Other board memberships held by Trustee during past
five years | | None |
| | |
| Executive Officers |
Richard F. Sennett Legg Mason 100 International Drive, 7th Floor, Baltimore, MD 21202 | | |
| Year of birth | | 1970 |
| Position(s) with Trust | | Principal Financial Officer |
| Term of office1 and length of time served2 | | Since 2011 |
| Principal occupation(s) during past five years | | Principal Financial Officer and Treasurer of certain mutual funds associated with Legg Mason & Co. or its affiliates (since 2011 and since 2013); Managing Director of Legg Mason & Co. and Senior Manager of the Treasury Policy group for Legg Mason & Co.’s Global Fiduciary Platform (since 2011); formerly, Chief Accountant within the SEC’s Division of Investment Management (2007 to 2011); formerly, Assistant Chief Accountant within the SEC’s Division of Investment Management (2002 to 2007) |
| |
Robert I. Frenkel Legg Mason 100 First Stamford Place, 6th Floor, Stamford, CT 06902 | | |
| Year of birth | | 1954 |
| Position(s) with Trust | | Secretary and Chief Legal Officer |
| Term of office1 and length of time served2 | | Since 2007 |
| Principal occupation(s) during past five years | | Vice President and Deputy General Counsel of Legg Mason (since 2006); Managing Director and General Counsel — U.S. Mutual Funds for Legg Mason & Co. (since 2006) and Legg Mason & Co. predecessors (since 1994); Secretary and Chief Legal Officer of certain mutual funds associated with Legg Mason & Co. or its affiliates (since 2006) and Legg Mason & Co. predecessors (prior to 2006) |
| | |
| 36 | | ClearBridge Value Trust |
| | |
| Executive Officers cont’d |
Ted P. Becker Legg Mason 620 Eighth Avenue, 49th Floor, New York, NY 10018 | | |
| Year of birth | | 1951 |
| Position(s) with Trust | | Vice President and Chief Compliance Officer |
| Term of office1 and length of time served2 | | Since 2007 |
| Principal occupation(s) during past five years | | Director of Global Compliance at Legg Mason (since 2006); Chief Compliance Officer of LMPFA (since 2006); Managing Director of Compliance of Legg Mason & Co. (since 2005); Chief Compliance Officer of certain mutual funds associated with Legg Mason & Co. or its affiliates (since 2006) and Legg Mason & Co. predecessors (prior to 2006) |
| |
Christopher Berarducci Legg Mason 620 Eighth Avenue, 49th Floor, New York, NY 10018 | | |
| Year of birth | | 1974 |
| Position(s) with Trust | | Treasurer |
| Term of office1 and length of time served2 | | Since 2010 |
| Principal occupation(s) during past five years | | Director of Legg Mason & Co. (since 2015); Treasurer of certain mutual funds associated with Legg Mason & Co. or its affiliates (since 2010); formerly, Vice President of Legg Mason & Co. (2011 to 2015); formerly, Assistant Controller of certain mutual funds associated with Legg Mason & Co. or its affiliates (prior to 2010) |
| |
Susan Kerr Legg Mason 620 Eighth Avenue, 49th Floor, New York, NY 10018 | | |
| Year of birth | | 1949 |
| Position(s) with Trust | | Chief Anti-Money Laundering Compliance Officer |
| Term of office1 and length of time served2 | | Since 2013 |
| Principal occupation(s) during past five years | | Assistant Vice President of Legg Mason & Co. and Legg Mason Investor Services, LLC (“LMIS”) (since 2010); Chief Anti-Money Laundering Compliance Officer of certain mutual funds associated with Legg Mason & Co. or its affiliates (since 2013) and Anti-Money Laundering Compliance Officer of LMIS (since 2012); Senior Compliance Officer of LMIS (since 2011); formerly, AML Consultant, DTCC (2010); formerly, AML Consultant, Rabobank Netherlands, (2009); formerly, First Vice President, Director of Marketing & Advertising Compliance and Manager of Communications Review Group at Citigroup Inc. (1996 to 2008) |
| | |
| ClearBridge Value Trust | | 37 |
Additional information (unaudited) (cont’d)
Information about Trustees and Officers
| | |
| Executive Officers cont’d |
Vanessa A. Williams Legg Mason 100 First Stamford Place, 6th Floor, Stamford, CT 06902 | | |
| Year of birth | | 1979 |
| Position(s) with Trust | | Identity Theft Prevention Officer |
| Term of office1 and length of time served2 | | Since 2011 |
| Principal occupation(s) during past five years | | Vice President of Legg Mason & Co. (since 2012); Identity Theft Prevention Officer of certain mutual funds associated with Legg Mason & Co. or its affiliates (since 2011); formerly, Chief Anti-Money Laundering Compliance Officer of certain mutual funds associated with Legg Mason & Co. or its affiliates (2011 to 2013); formerly, Senior Compliance Officer of Legg Mason & Co. (2008 to 2011); formerly, Compliance Analyst of Legg Mason & Co. (2006 to 2008) and Legg Mason & Co. predecessors (prior to 2006) |
| † | Trustees who are not “interested persons” of the Fund within the meaning of Section 2(a)(19) of the Investment Company Act of 1940, as amended (the “1940 Act”). Each of the Independent Trustees serves on the standing committees of the Board of Trustees, which include the Audit Committee (chair: Arthur S. Mehlman), the Nominating Committee (co-chairs: G. Peter O’Brien and Jill E. McGovern), and the Independent Trustees Committee (chair: Arnold L. Lehman). |
| 1 | Each Trustee and officer serves until his or her respective successor has been duly elected and qualified or until his or her earlier death, resignation, retirement or removal. |
| 2 | Indicates the earliest year in which the Trustee became a board member for a fund in the Legg Mason fund complex or the officer took such office. |
| 3 | Effective June 1, 2015, Ms. Trust became a Trustee. In addition, Ms. Trust is an “interested person” of the Fund, as defined in the 1940 Act, because of her position with LMPFA and/or certain of its affiliates. |
| | |
| 38 | | ClearBridge Value Trust |
Important tax information (unaudited)
The following information is provided with respect to the distributions paid during the taxable year ended October 31, 2015:
| | | | |
| Record date: | | | 12/9/2014 | |
| Payable date: | | | 12/10/2014 | |
| Ordinary income: | | | | |
Qualified dividend income for individuals | | | 100.00 | % |
Dividends qualifying for the dividends | | | | |
Received deduction for corporations | | | 100.00 | % |
Please retain this information for your records.
| | |
| ClearBridge Value Trust | | 39 |
ClearBridge
Value Trust
Trustees
Ruby P. Hearn
Arnold L. Lehman*
Chairman
Robin J.W. Masters
Jill E. McGovern
Arthur S. Mehlman
G. Peter O’Brien
S. Ford Rowan
Robert M. Tarola
Jane Trust*
| * | Effective June 1, 2015, Mr. Lehman became Chairman and Ms. Trust became a Trustee, President and Chief Executive Officer. |
Investment manager/adviser
ClearBridge, LLC
Distributor
Legg Mason Investor Services, LLC
Custodian
State Street Bank & Trust Company
Transfer agent
BNY Mellon Investment Servicing (US) Inc.
4400 Computer Drive
Westborough, MA 01581
Independent registered public accounting firm
PricewaterhouseCoopers LLP
Baltimore, MD
ClearBridge Value Trust
The Fund is a separate investment series of Legg Mason Global Asset Management Trust, a Maryland statutory trust.
ClearBridge Value Trust
Legg Mason Funds
620 Eighth Avenue, 49th Floor
New York, NY 10018
The Fund files its complete schedule of portfolio holdings with the Securities and Exchange Commission (“SEC”) for the first and third quarters of each fiscal year on Form N-Q. The Fund’s Forms N-Q are available on the SEC’s website at www.sec.gov. The Fund’s Forms N-Q may be reviewed and copied at the SEC’s Public Reference Room in Washington, D.C., and information on the operation of the Public Reference Room may be obtained by calling 1-800-SEC-0330. To obtain information on Form N-Q, shareholders can call the Fund at 1-877-721-1926.
Information on how the Fund voted proxies relating to portfolio securities during the prior 12-month period ended June 30th of each year and a description of the policies and procedures that the Fund uses to determine how to vote proxies related to portfolio transactions are available (1) without charge, upon request, by calling the Fund at 1-877-721-1926, (2) on the Fund’s website at www.leggmason.com/individualinvestors and (3) on the SEC’s website at www.sec.gov.
This report is submitted for the general information of the shareholders of ClearBridge Value Trust. This report is not authorized for distribution to prospective investors in the Fund unless preceded or accompanied by a current prospectus.
Investors should consider the Fund’s investment objectives, risks, charges and expenses carefully before investing. The prospectus contains this and other important information about the Fund. Please read the prospectus carefully before investing.
www.leggmason.com/individualinvestors
© 2015 Legg Mason Investor Services, LLC
Member FINRA, SIPC
Legg Mason Funds Privacy and Security Notice
Your Privacy and the Security of Your Personal Information is Very Important to the Legg Mason Funds
This Privacy and Security Notice (the “Privacy Notice”) addresses the Legg Mason Funds’ privacy and data protection practices with respect to nonpublic personal information the Funds receive. The Legg Mason Funds include any funds sold by the Funds’ distributor, Legg Mason Investor Services, LLC, as well as Legg Mason-sponsored closed-end funds and certain closed-end funds managed or sub-advised by Legg Mason or its affiliates. The provisions of this Privacy Notice apply to your information both while you are a shareholder and after you are no longer invested with the Funds.
The Type of Nonpublic Personal Information the Funds Collect About You
The Funds collect and maintain nonpublic personal information about you in connection with your shareholder account. Such information may include, but is not limited to:
| • | | Personal information included on applications or other forms; |
| • | | Account balances, transactions, and mutual fund holdings and positions; |
| • | | Online account access user IDs, passwords, security challenge question responses; and |
| • | | Information received from consumer reporting agencies regarding credit history and creditworthiness (such as the amount of an individual’s total debt, payment history, etc.). |
How the Funds Use Nonpublic Personal Information About You
The Funds do not sell or share your nonpublic personal information with third parties or with affiliates for their marketing purposes, or with other financial institutions or affiliates for joint marketing purposes, unless you have authorized the Funds to do so. The Funds do not disclose any nonpublic personal information about you except as may be required to perform transactions or services you have authorized or as permitted or required by law. The Funds may disclose information about you to:
| • | | Employees, agents, and affiliates on a “need to know” basis to enable the Funds to conduct ordinary business or comply with obligations to government regulators; |
| • | | Service providers, including the Funds’ affiliates, who assist the Funds as part of the ordinary course of business (such as printing, mailing services, or processing or servicing your account with us) or otherwise perform services on the Funds’ behalf, including companies that may perform marketing services solely for the Funds; |
| • | | The Funds’ representatives such as legal counsel, accountants and auditors; and |
| • | | Fiduciaries or representatives acting on your behalf, such as an IRA custodian or trustee of a grantor trust. |
|
| NOT PART OF THE ANNUAL REPORT |
Legg Mason Funds Privacy and Security Notice (cont’d)
Except as otherwise permitted by applicable law, companies acting on the Funds’ behalf are contractually obligated to keep nonpublic personal information the Funds provide to them confidential and to use the information the Funds share only to provide the services the Funds ask them to perform.
The Funds may disclose nonpublic personal information about you when necessary to enforce their rights or protect against fraud, or as permitted or required by applicable law, such as in connection with a law enforcement or regulatory request, subpoena, or similar legal process. In the event of a corporate action or in the event a Fund service provider changes, the Funds may be required to disclose your nonpublic personal information to third parties. While it is the Funds’ practice to obtain protections for disclosed information in these types of transactions, the Funds cannot guarantee their privacy policy will remain unchanged.
Keeping You Informed of the Funds’ Privacy and Security Practices
The Funds will notify you annually of their privacy policy as required by federal law. While the Funds reserve the right to modify this policy at any time they will notify you promptly if this privacy policy changes.
The Funds’ Security Practices
The Funds maintain appropriate physical, electronic and procedural safeguards designed to guard your nonpublic personal information. The Funds’ internal data security policies restrict access to your nonpublic personal information to authorized employees, who may use your nonpublic personal information for Fund business purposes only.
Although the Funds strive to protect your nonpublic personal information, they cannot ensure or warrant the security of any information you provide or transmit to them, and you do so at your own risk. In the event of a breach of the confidentiality or security of your nonpublic personal information, the Funds will attempt to notify you as necessary so you can take appropriate protective steps. If you have consented to the Funds using electronic communications or electronic delivery of statements, they may notify you under such circumstances using the most current email address you have on record with them.
In order for the Funds to provide effective service to you, keeping your account information accurate is very important. If you believe that your account information is incomplete, not accurate or not current, or if you have questions about the Funds’ privacy practices, write the Funds using the contact information on your account statements, email the Funds by clicking on the Contact Us section of the Funds’ website at www.leggmason.com, or contact the Fund at 1-877-721-1926.
|
| NOT PART OF THE ANNUAL REPORT |
www.leggmason.com/individualinvestors
© 2015 Legg Mason Investor Services, LLC Member FINRA, SIPC
LMF-002/A 12/15 SR15-2654
The registrant has adopted a code of ethics that applies to the registrant’s principal executive officer, principal financial officer, principal accounting officer or controller.
| ITEM 3. | AUDIT COMMITTEE FINANCIAL EXPERT. |
The Board of Trustees of the registrant has determined that Arthur S. Mehlman the Chairman of the Board’s Audit Committee and Robert M. Tarola, possess the technical attributes identified in Instruction 2(b) of Item 3 to Form N- to qualify as “audit committee financial experts,” and have designated Mr. Mehlman and Mr. Tarola CSR as the Audit Committee’s financial experts. Mr. Mehlman and Mr. Tarola are “independent” Trustees pursuant to paragraph (a) (2) of Item 3 to Form N-CSR.
| ITEM 4. | PRINCIPAL ACCOUNTANT FEES AND SERVICES. |
a) Audit Fees. The aggregate fees billed in the last two fiscal years ending October 31, 2014 and October 31, 2015 (the “Reporting Periods”) for professional services rendered by the Registrant’s principal accountant (the “Auditor”) for the audit of the Registrant’s annual financial statements, or services that are normally provided by the Auditor in connection with the statutory and regulatory filings or engagements for the Reporting Periods, were $276,738 in 2014 and $268,854 in 2015.
b) Audit-Related Fees. The aggregate fees billed in the Reporting Period for assurance and related services by the Auditor that are reasonably related to the performance of the Registrant’s financial statements were $6,500 in October 31, 2014 and $0 in October 31, 2015.
(c) Tax Fees. The aggregate fees billed in the Reporting Periods for professional services rendered by the Auditor for tax compliance, tax advice and tax planning (“Tax Services”) were $60,804 in October 31, 2014 and $56,048 in October 31, 2015. These services consisted of (i) review or preparation of U.S. federal, state, local and excise tax returns; (ii) U.S. federal, state and local tax planning, advice and assistance regarding statutory, regulatory or administrative developments, and (iii) tax advice regarding tax qualification matters and/or treatment of various financial instruments held or proposed to be acquired or held.
There were no fees billed for tax services by the service affiliates during the Reporting Periods that required pre-approval by the Audit Auditors Committee.
d) All Other Fees. The aggregate fees for other fees billed in the Reporting Periods for products and services provided by the Auditor were $9,195 in October 31, 2014 and $3,234 in October 31, 2015, other than the services reported in paragraphs (a) through (c) of this item for the Legg Mason Global Asset Management Trust.
All Other Fees. There were no other non-audit services rendered by the Auditor to Legg Mason Partners Fund Advisors, LLC (“LMPFA”), and any entity controlling, controlled by or under common control with LMPFA that provided ongoing services to Legg Mason Global Asset Management Trust requiring pre-approval by the Audit Committee in the Reporting Period.
(e) Audit Committee’s pre–approval policies and procedures described in paragraph (c)
(7) of Rule 2-01 of Regulation S-X.
(1) The Charter for the Audit Committee (the “Committee”) of the Board of each registered investment company (the “Fund”) advised by LMPFA or one of their affiliates (each, an “Adviser”) requires that the Committee shall approve (a) all audit and permissible non-audit services to be provided to the Fund and (b) all permissible non-audit services to be provided by the Fund’s independent auditors to the Adviser and any Covered Service Providers if the engagement relates directly to the operations and financial reporting of the Fund. The Committee may implement policies and procedures by which such services are approved other than by the full Committee.
The Committee shall not approve non-audit services that the Committee believes may impair the independence of the auditors. As of the date of the approval of this Audit Committee Charter, permissible non-audit services include any professional services (including tax services), that are not prohibited services as described below, provided to the Fund by the independent auditors, other than those provided to the Fund in connection with an audit or a review of the financial statements of the Fund. Permissible non-audit services may not include: (i) bookkeeping or other services related to the accounting records or financial statements of the Fund; (ii) financial information systems design and implementation; (iii) appraisal or valuation services, fairness opinions or contribution-in-kind reports; (iv) actuarial services; (v) internal audit outsourcing services; (vi) management functions or human resources; (vii) broker or dealer, investment adviser or investment banking services; (viii) legal services and expert services unrelated to the audit; and (ix) any other service the Public Company Accounting Oversight Board determines, by regulation, is impermissible.
Pre-approval by the Committee of any permissible non-audit services is not required so long as: (i) the aggregate amount of all such permissible non-audit services provided to the Fund, the Adviser and any service providers controlling, controlled by or under common control with the Adviser that provide ongoing services to the Fund (“Covered Service Providers”) constitutes not more than 5% of the total amount of revenues paid to the independent auditors during the fiscal year in which the permissible non-audit services are provided to (a) the Fund, (b) the Adviser and (c) any entity controlling, controlled by or under common control with the Adviser that provides ongoing services to the Fund during the fiscal year in which the services are provided that would have to be approved by the Committee; (ii) the permissible non-audit services were not recognized by the Fund at the time of the engagement to be non-audit services; and (iii) such services are promptly brought to the attention of the Committee and approved by the Committee (or its delegate(s)) prior to the completion of the audit.
(2) For the Legg Mason Global Asset Management Trust, the percentage of fees that were approved by the audit committee, with respect to: Audit-Related Fees were 100% and 100% for October 31, 2014 and October 31, 2015; Tax Fees were 100% and 100% for October 31, 2014 and October 31, 2015; and Other Fees were 100% and 100% for October 31, 2014 and October 31, 2015.
(f) N/A
(g) Non-audit fees billed by the Auditor for services rendered to Legg Mason Global Asset Management Trust, LMPFA and any entity controlling, controlled by, or under common control with LMPFA that provides ongoing services to Legg Mason Global Asset Management Trust during the reporting period were $277,092 in October 31, 2014 and $330,948 in October 31, 2015.
(h) Yes. Legg Mason Global Asset Management Trust’s Audit Committee has considered whether the provision of non-audit services that were rendered to Service Affiliates, which were not pre-approved (not requiring pre-approval), is compatible with maintaining the Accountant’s independence. All services provided by the Auditor to the Legg Mason Global Asset Management Trust or to Service Affiliates, which were required to be pre-approved, were pre-approved as required.
| ITEM 5. | AUDIT COMMITTEE OF LISTED REGISTRANTS. |
| | a) | The independent board members are acting as the registrant’s audit committee as specified in Section 3(a)(58)(B) of the Exchange Act .The Audit Committee consists of the following Board members: |
Ruby P. Hearn
Arnold L. Lehman
Robin J.W. Masters
Jill E. McGovern
Arthur S. Mehlman
G. Peter O’Brien
S. Ford Rowan
Robert M. Tarola
| ITEM 6. | SCHEDULE OF INVESTMENTS. |
Included herein under Item 1.
| ITEM 7. | DISCLOSURE OF PROXY VOTING POLICIES AND PROCEDURES FOR CLOSED-END MANAGEMENT INVESTMENT COMPANIES. |
Not applicable.
| ITEM 8. | PORTFOLIO MANAGERS OF CLOSED-END MANAGEMENT INVESTMENT COMPANIES. |
Not applicable.
| ITEM 9. | PURCHASES OF EQUITY SECURITIES BY CLOSED-END MANAGEMENT INVESTMENT COMPANY AND AFFILIATED PURCHASERS. |
Not applicable.
| ITEM 10. | SUBMISSION OF MATTERS TO A VOTE OF SECURITY HOLDERS. |
Not applicable.
| ITEM 11. | CONTROLS AND PROCEDURES. |
| | (a) | The registrant’s principal executive officer and principal financial officer have concluded that the registrant’s disclosure controls and procedures (as defined in Rule 30a- 3(c) under the Investment Company Act of 1940, as amended (the “1940 Act”)) are effective as of a date within 90 days of the filing date of this report that includes the disclosure required by this paragraph, based on their evaluation of the disclosure controls and procedures required by Rule 30a-3(b) under the 1940 Act and 15d-15(b) under the Securities Exchange Act of 1934. |
| | (b) | There were no changes in the registrant’s internal control over financial reporting (as defined in Rule 30a-3(d) under the 1940 Act) that occurred during the second fiscal quarter of the period covered by this report that have materially affected, or are likely to materially affect the registrant’s internal control over financial reporting. |
(a) (1) Code of Ethics attached hereto.
Exhibit 99.CODE ETH
(a) (2) Certifications pursuant to section 302 of the Sarbanes-Oxley Act of 2002 attached hereto.
Exhibit 99.CERT
(b) Certifications pursuant to Section 906 of the Sarbanes-Oxley Act of 2002 attached hereto.
Exhibit 99.906CERT
SIGNATURES
Pursuant to the requirements of the Securities Exchange Act of 1934 and the Investment Company Act of 1940, the registrant has duly caused this Report to be signed on its behalf by the undersigned, there unto duly authorized.
Legg Mason Global Asset Management Trust
| | |
| By: | | /s/ Jane Trust |
| | Jane Trust |
| | Chief Executive Officer |
| |
| Date: | | December 22, 2015 |
Pursuant to the requirements of the Securities Exchange Act of 1934 and the Investment Company Act of 1940, this report has been signed below by the following persons on behalf of the registrant and in the capacities and on the dates indicated.
| | |
| By: | | /s/ Jane Trust |
| | Jane Trust |
| | Chief Executive Officer |
| |
| Date: | | December 22, 2015 |
| |
| By: | | /s/ Richard F. Sennett |
| | Richard F. Sennett |
| | Principal Financial Officer |
| |
| Date: | | December 22, 2015 |