UNITED STATES
SECURITIES AND EXCHANGE COMMISSION
Washington, D.C. 20549
FORM N-CSR
CERTIFIED SHAREHOLDER REPORT OF REGISTERED
MANAGEMENT INVESTMENT COMPANIES
Investment Company Act file number 811-22338
Legg Mason Global Asset Management Trust
(Exact name of registrant as specified in charter)
620 Eighth Avenue, 49th Floor, New York, NY 10018
(Address of principal executive offices) (Zip code)
Robert I. Frenkel, Esq.
Legg Mason & Co., LLC
100 First Stamford Place
Stamford, CT 06902
(Name and address of agent for service)
Registrant’s telephone number, including area code: 1-877-721-1926
Date of fiscal year end: October 31
Date of reporting period: October 31, 2016
| ITEM 1. | REPORT TO STOCKHOLDERS |
The Annual Report to Stockholders is filed herewith.

| | |
| Annual Report | | October 31, 2016 |
CLEARBRIDGE
SMALL CAP FUND

|
| PRODUCTS: NOT FDIC INSURED • NO BANK GUARANTEE • MAY LOSE VALUE |
Fund objective
The Fund seeks capital appreciation.
Letter from the president

Dear Shareholder,
We are pleased to provide the annual report of ClearBridge Small Cap Fund for the twelve-month reporting period ended October 31, 2016. Please read on for a detailed look at prevailing economic and market conditions during the Fund’s reporting period and to learn how those conditions have affected Fund performance.
As always, we remain committed to providing you with excellent service and a full spectrum of investment choices. We also remain committed to supplementing the support you receive from your financial advisor. One way we accomplish this is through our website, www.leggmason.com. Here you can gain immediate access to market and investment information, including:
| • | | Fund prices and performance, |
| • | | Market insights and commentaries from our portfolio managers, and |
| • | | A host of educational resources. |
We look forward to helping you meet your financial goals.
Sincerely,

Jane Trust, CFA
President and Chief Executive Officer
November 30, 2016
| | |
| II | | ClearBridge Small Cap Fund |
Investment commentary
Economic review
The pace of U.S. economic activity fluctuated during the twelve months ended October 31, 2016 (the “reporting period”). Looking back, the U.S. Department of Commerce reported that fourth quarter 2015 U.S. gross domestic product (“GDP”)i growth was 0.9%. First and second quarter 2016 GDP growth was 0.8% and 1.4%, respectively. The U.S. Department of Commerce’s second reading for third quarter 2016 GDP growth — released after the reporting period ended — was 3.2%. The improvement in GDP growth in the third quarter 2016 reflected an increase in private inventory investment, an acceleration in exports, an upturn in federal government spending and smaller decreases in state and local government spending.
While there was a pocket of weakness in May 2016, job growth in the U.S. was solid overall and a tailwind for the economy during the reporting period. When the period ended on October 31, 2016, the unemployment rate was 4.9%, as reported by the U.S. Department of Labor. The percentage of longer-term unemployed modestly declined over the period. In October 2016, 25.2% of Americans looking for a job had been out of work for more than six months, versus 25.7% when the period began.
After an extended period of maintaining the federal funds rateii at a historically low range between zero and 0.25%, the Federal Reserve Board (the “Fed”)iii increased the rate at its meeting on December 16, 2015. This marked the first rate hike since 2006. In particular, the U.S. central bank raised the federal funds rate to a range between 0.25% and 0.50%. At its meeting that concluded on November 2, 2016 (after the reporting period ended), as well as during the prior meetings of the year, the Fed kept rates on hold. In the Fed’s statement after the November meeting it said, “The Committee judges that the case for an increase in the federal funds rate has continued to strengthen but decided, for the time being, to wait for some further evidence of continued progress toward its objectives. The stance of monetary policy remains accommodative, thereby supporting further improvement in labor market conditions and a return to 2 percent inflation.”
As always, thank you for your confidence in our stewardship of your assets.
Sincerely,
Jane Trust, CFA
President and Chief Executive Officer
November 30, 2016
All investments are subject to risk including the possible loss of principal. Past performance is no guarantee of future results.
| i | Gross domestic product (“GDP”) is the market value of all final goods and services produced within a country in a given period of time. |
| ii | The federal funds rate is the rate charged by one depository institution on an overnight sale of immediately available funds (balances at the Federal Reserve) to another depository institution; the rate may vary from depository institution to depository institution and from day to day. |
| iii | The Federal Reserve Board (the “Fed”) is responsible for the formulation of U.S. policies designed to promote economic growth, full employment, stable prices and a sustainable pattern of international trade and payments. |
| | |
| ClearBridge Small Cap Fund | | III |
Fund overview
Q. What is the Fund’s investment strategy?
A. The Fund seeks capital appreciation. Under normal circumstances, the Fund invests at least 80% of its net assets plus borrowings for investment purposes, if any, in common stocks and other equity securities of small capitalization companies or in other investments that we believe have similar economic characteristics. (The Fund does not currently intend to borrow for investment purposes.) Small capitalization companies are those companies whose market capitalizations at the time of investment do not exceed the highest month-end market capitalization value of any stock in the Russell 2000 Index for the previous 12 months.
The Fund may invest up to 20% of its net assets in equity securities of companies with larger market capitalizations. Under normal circumstances, the Fund’s investments may include equity securities of companies that we consider to be “special situations,” at the time of purchase. We define special situations as companies undergoing unusual or possibly one-time developments that, in our opinion, make them attractive for investment. The Fund will not invest more than 20% of its total assets in securities of companies that, at the time of investment, are involved in reorganizations or restructurings in connection with bankruptcy proceedings. We follow a value discipline in selecting securities, and therefore seek to purchase securities at discounts to our assessment of their intrinsic value. The Fund may invest in foreign equity securities, including securities of emerging market issuers.
Q. What were the overall market conditions during the Fund’s reporting period?
A. Major U.S. equity indices posted positive returns for the twelve-month reporting period ended October 31, 2016, as the Dow Jones Industrial Averagei, S&P 500 Indexii and NASDAQ Composite Indexiii gained, 5.49%, 4.51% and 3.97%, respectively. Small cap stocks, as measured by the Russell 2000 Indexiv returned 4.11% during the reporting period, slightly underperforming the S&P 500 index. Throughout the reporting period, investors focused on the Federal Reserve Board’s (the “Fed”)v rate strategy, mixed economic reports and suppressed crude oil prices, as well as the potential for more merger and acquisition (“M&A”) activity, which began to accelerate toward the end of the period. The market traded roughly flat until a correction in the early part of 2016, as the price of oil dropped to $26 per barrel on concerns over supply-demand imbalance. Combined with ongoing worries about the rate of global economic growth, persistently low interest rates and political risks —highlighted in late June 2016 by “Brexit”, the United Kingdom’s surprise vote to leave the European Union — there were numerous potential pitfalls for the market. But by-and-large, the market shook off these concerns after hitting a February 11, 2016 low to rise to record highs in August 2016. In the last month of the reporting period, concerns about the economic implications of the volatile presidential election hurt stocks, as most major indices experienced a small drop.
The U.S. economy continued to expand during the period, though gross domestic product (“GDP”)vi growth as measured by the U.S. Department of Commerce remained tepid in the early part of the reporting period, averaging just above 1%. The initial
| | |
| ClearBridge Small Cap Fund 2016 Annual Report | | 1 |
Fund overview (cont’d)
reading for third quarter 2016 GDP growth picked up substantially, however, hitting 2.9% on strong consumer spending and better-than-expected net exports. The employment situation continued to improve as well. Despite some slowing in non-farm payroll increases in the last three months of the reporting period, the overall picture of employment appeared strong, with the average number of new jobs created each month during the year ended October 31, 2016 coming in at roughly 196,000. Meanwhile, the Fed’s preferred measure of inflation — core personal consumption expenditures — continued its slow march upward to the central bank’s long-term target of 2%.
After the Fed raised interest rates in late 2015, mixed economic data convinced the Fed to keep rates static for the remainder of the reporting period. Persistently low rates contributed to a further flattening of the yield curvevii in the United States, and with trillions of dollars in negative-yielding sovereign debt in Japan and Europe, investors sought returns in income-generating equities in the Consumer Staples, Real Estate, Telecommunication Services and Utilities sectors. At its bottom, the ten-year Treasury yield hit 1.37% in early July 2016, the lowest level in decades. But this dynamic began to shift toward the end of the third calendar quarter and into October 2016, as cyclical sectors began to make a comeback and the ten-year Treasury yield inched up to 1.84% by October 31, 2016 its highest level since June 1, 2016. Meanwhile, an ever-increasing cash pile at major U.S. corporations has brought M&A activity back into focus, as a flurry of mega-deals in the Energy, Telecommunication Services and Information Technology sectors were announced in October 2016.
Q. How did we respond to these changing market conditions?
A. These uncertain times emphasize the importance of our research process, which focuses on evaluating investment options under a variety of scenarios, and investing only when the probability-weighted value of the security in these scenarios can produce upside to the current price with a margin of safety.
This approach inherently acknowledges two facts: (1) economies and markets are difficult-to-predict, complex, adaptive systems, and (2) predicting their future is a probabilistic enterprise, not a deterministic one. While this may sound esoteric to some, our probabilistic approach to investing can be found in realms beyond financial markets. In horse racing, there may be a favorite, but every horse in the field has some odds (set by the bettors) to win. It’s a fact that the value of a bet is the probability of the horse to win multiplied by the price of the bet. Yet even in that arena, experienced bettors and novices alike very often pick the horse they think will win, then bet on it no matter what the price, believing that knowing the horse is the important part.
We approach investing with a similar framework. For example, during the second quarter of 2016 we initiated a position in United Natural Foods Inc. (UNFI), a North American natural, organic, and specialty foods distributor whose stock was dropping alongside eroding growth and profitability. The factors negatively impacting United Natural Foods Inc. ranged from macroeconomic trends to industry maturation and an adjustment in the strategic direction of the company. At the time of purchase, the stock was discounting high odds that recently observed, lower fundamentals were the company’s new
| | |
| 2 | | ClearBridge Small Cap Fund 2016 Annual Report |
economic reality. We assessed the various factors affecting United Natural Foods Inc. and concluded that additional degradation and thus downside in
the stock was unlikely and limited, while the upside to any improvement over time was substantial and considerably more likely than what was discounted in the price of the stock given United Natural Food Inc.’s market position and strategy.
Our approach to stock selection and portfolio construction reduces the importance of correctly predicting the future as we do not believe it is critical to succeed as an investor. In fact, we see it a fool’s errand with little chance for repeatable success. Instead, we believe greater odds of success over time come from understanding how both individual stock values and the overall portfolio value change under different conditions combined with gauging and updating probabilities of these conditions coming to bear. Surprising events occur all the time and none of us hold perfect knowledge of the future. We endeavor to offset this fundamental reality and build a resilient portfolio that can withstand the risk of high-impact events like Brexit through probabilistic analysis and portfolio construction.
Performance review
For the twelve months ended October 31, 2016, Class C shares of ClearBridge Small Cap Fund, excluding sales charges, returned 8.75%. The Fund’s unmanaged benchmark, the Russell 2000 Index, returned 4.11% for the same period. The Lipper Small-Cap Core Funds Category Average1 returned 3.01% over the same time frame.
| | | | | | | | |
Performance Snapshot as of October 31, 2016 (unaudited) | |
| (excluding sales charges) | | 6 months | | | 12 months | |
| ClearBridge Small Cap Fund: | | | | | | | | |
Class A | | | 6.76 | % | | | 9.60 | % |
Class A2 | | | 6.66 | % | | | 9.37 | % |
Class C | | | 6.38 | % | | | 8.75 | % |
Class FI | | | 6.78 | % | | | 9.47 | % |
Class R | | | 6.61 | % | | | 9.17 | % |
Class I | | | 6.91 | % | | | 9.86 | % |
| Russell 2000 Index | | | 6.13 | % | | | 4.11 | % |
| Lipper Small-Cap Core Funds Category Average1 | | | 4.20 | % | | | 3.01 | % |
The performance shown represents past performance. Past performance is no guarantee of future results and current performance may be higher or lower than the performance shown above. Principal value and investment returns will fluctuate and investors’ shares, when redeemed, may be worth more or less than their original cost. To obtain performance data current to the most recent month-end, please visit our website at www.leggmason.com/mutualfunds.
All share class returns assume the reinvestment of all distributions at net asset value and the deduction of all Fund expenses. Returns have not been adjusted to include sales charges that may apply or the deduction of taxes that a shareholder would pay on Fund distributions. If sales charges were reflected, the performance quoted would be lower. Performance figures for periods shorter than one year represent cumulative figures and are not annualized.
Fund performance figures reflect fee waivers and/or expense reimbursements, without which the performance would have been lower.
| 1 | Lipper, Inc., a wholly-owned subsidiary of Reuters, provides independent insight on global collective investments. Returns are based on the period ended October 31, 2016, including the reinvestment of all distributions, including returns of capital, if any, calculated among the 881 funds for the six-month period and among the 852 funds for the twelve-month period in the Fund’s Lipper category, and excluding sales charges, if any. |
| | |
| ClearBridge Small Cap Fund 2016 Annual Report | | 3 |
Fund overview (cont’d)
|
| Total Annual Operating Expenses (unaudited) |
As of the Fund’s current prospectus dated March 1, 2016, the gross total annual fund operating expense ratios for Class A, Class A2, Class C, Class FI, Class R and Class I shares were 1.26%, 1.96%, 2.06%, 1.40%, 1.67% and 1.07%, respectively.
Actual expenses may be higher. For example, expenses may be higher than those shown if average net assets decrease. Net assets are more likely to decrease and Fund expense ratios are more likely to increase when markets are volatile.
Q. What were the leading contributors to performance?
A. Relative Fund outperformance was primarily driven by security selection effects. In particular, stock selection within the Health Care, Materials and Producer Durables1 sectors contributed substantially to relative returns. Stock selection in the Financials and Consumer Discretionary sectors also had a meaningful positive impact on relative performance during the reporting period. Meanwhile, underweights to the Health Care and Energy sectors also contributed positively to returns, as the two sectors underperformed the benchmark. In terms of individual securities, U.S. Silica Holdings Inc., Steel Dynamics Inc., HealthEquity Inc., Hi-Crush Partners LP and 2U were the top contributors to absolute returns.
Q. What were the leading detractors from performance?
A. Sector allocation effects had a negative impact on relative performance. In particular, an overweight to the Consumer Discretionary sector, which underperformed the benchmark, and an underweight to the Utilities sector detracted from relative returns. Meanwhile, stock selection in the Information Technology and Utilities sectors also had a negative impact on relative performance during the reporting period. At the security level, OneMain Holdings Inc., Quotient Ltd., PRA Group Inc., DHI Group Inc. and Red Robin Gourmet Burgers Inc. detracted the most from returns.
Q. Were there any significant changes to the Fund during the reporting period?
A. We made a number of changes to the Fund’s composition this year, with notable initiated positions including HealthEquity Inc., Sprouts Farmers Markets Inc., Gray Television Inc., Bankrate Inc. and Hi-Crush Partners LP. Among the securities we sold, the largest were LivaNova PLC, Portland General Electric Co., MarketAxess Holdings Inc., Talmer Bancorp Inc., Class A Shares and AVG Technologies NV.
Thank you for your investment in ClearBridge Small Cap Fund. As always, we appreciate that you have chosen us to manage your assets and we remain focused on achieving the Fund’s investment goals.
Sincerely,

Albert Grossman
Portfolio Manager
ClearBridge, LLC
| 1 | Producer Durables consists of the following industries: Commercial Services, Machinery, Manufacturing & Production, Scientific Instruments & Services and Transportation & Freight. |
| | |
| 4 | | ClearBridge Small Cap Fund 2016 Annual Report |

Brian Lund, CFA
Portfolio Manager
ClearBridge, LLC
November 20, 2016
RISKS: Equity securities are subject to market and price fluctuations. Small-cap stocks involve greater risks and volatility than mid- and large-cap stocks. The managers’ investment style may become out of favor and/or the managers’ selection process may prove incorrect, which may have a negative impact on the Fund’s performance. The value approach to investing involves the risk that those stocks deemed to be undervalued by the portfolio managers may remain undervalued. International investments are subject to special risks including currency fluctuations and social, economic and political uncertainties, which could increase volatility. These risks are magnified in emerging markets. Please see the Fund’s prospectus for a more complete discussion of these and other risks, and the Fund’s investment strategies.
Portfolio holdings and breakdowns are as of October 31, 2016 and are subject to change and may not be representative of the portfolio managers’ current or future investments. The Fund’s top ten holdings (as a percentage of net assets) as of October 31, 2016 were: HealthEquity Inc. (2.3%), LegacyTexas Financial Group Inc. (2.1%), Service Corporation International (2.0%), Gentex Corp. (2.0%), First Interstate BancSystem Inc., Class A Shares (1.8%), Washington Federal Inc. (1.8%), OneMain Holdings Inc. (1.8%), Sprouts Farmers Market Inc. (1.7%), ICF International Inc. (1.7%) and ProAssurance Corp. (1.7%). Please refer to pages 12 through 16 for a list and percentage breakdown of the Fund’s holdings.
The mention of sector breakdowns is for informational purposes only and should not be construed as a recommendation to purchase or sell any securities. The information provided regarding such sectors is not a sufficient basis upon which to make an investment decision. Investors seeking financial advice regarding the appropriateness of investing in any securities or investment strategies discussed should consult their financial professional. The Fund’s top five sector holdings (as a percentage of net assets) as of October 31, 2016 were: Financials (21.6%), Information Technology (19.7%), Industrials (14.8%), Consumer Discretionary (13.4%), and Health Care (10.4%). The Fund’s portfolio composition is subject to change at any time.
All investments are subject to risk including the possible loss of principal. Past performance is no guarantee of future results. All index performance reflects no deduction for fees, expenses or taxes. Please note that an investor cannot invest directly in an index.
The information provided is not intended to be a forecast of future events, a guarantee of future results or investment advice. Views expressed may differ from those of the firm as a whole.
| | |
| ClearBridge Small Cap Fund 2016 Annual Report | | 5 |
Fund overview (cont’d)
| i | The Dow Jones Industrial Average (“DJIA”) is a widely followed measurement of the stock market. The average is comprised of thirty stocks that represent leading companies in major industries. These stocks, widely held by both individual and institutional investors, are considered to be all blue-chip companies. |
| ii | The S&P 500 Index is an unmanaged index of 500 stocks and is generally representative of the performance of larger companies in the U.S. |
| iii | The NASDAQ Composite Index is a market-value weighted index, which measures all securities listed on the NASDAQ stock market. |
| iv | The Russell 2000 Index measures the performance of the small-cap segment of the U.S. equity universe. The Russell 2000 is a subset of the Russell 3000 Index representing approximately 10% of the total market capitalization of that index. It includes approximately 2,000 of the smallest securities based on a combination of their market cap and current index membership. The Russell 3000 Index measures the performance of the 3,000 largest U.S. companies based on total market capitalization, which represents approximately 98% of the U.S. equity market. |
| v | The Federal Reserve Board (the “Fed”) is responsible for the formulation of U.S. policies designed to promote economic growth, full employment, stable prices and a sustainable pattern of international trade and payments. |
| vi | Gross domestic product (“GDP”) is the market value of all final goods and services produced within a country in a given period of time. |
| vii | The yield curve is the graphical depiction of the relationship between the yield on bonds of the same credit quality but different maturities. |
| | |
| 6 | | ClearBridge Small Cap Fund 2016 Annual Report |
Fund at a glance† (unaudited)
Investment breakdown (%) as a percent of total investments
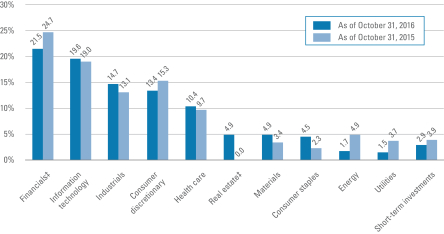
| † | The bar graph above represents the composition of the Fund’s investments as of October 31, 2016 and October 31, 2015. The Fund is actively managed. As a result, the composition of the Fund’s investments is subject to change at any time. |
| ‡ | Effective August 31, 2016, the Financials sector was redefined to exclude real estate and a Real Estate sector was created. |
| | |
| ClearBridge Small Cap Fund 2016 Annual Report | | 7 |
Fund expenses (unaudited)
Example
As a shareholder of the Fund, you may incur two types of costs: (1) transaction costs, including front-end and back-end sales charges (loads) on purchase payments; and (2) ongoing costs, including management fees; service and/or distribution (12b-1) fees; and other Fund expenses. This example is intended to help you understand your ongoing costs (in dollars) of investing in the Fund and to compare these costs with the ongoing costs of investing in other mutual funds.
This example is based on an investment of $1,000 invested on May 1, 2016 and held for the six months ended October 31, 2016.
Actual expenses
The table below titled “Based on Actual Total Return” provides information about actual account values and actual expenses. You may use the information provided in this table, together with the amount you invested, to estimate the expenses that you paid over the period. To estimate the expenses you paid on your account, divide your ending account value by $1,000 (for example, an $8,600 ending account value divided by $1,000 = 8.6), then multiply the result by the number under the heading entitled “Expenses Paid During the Period”.
Hypothetical example for comparison purposes
The table below titled “Based on Hypothetical Total Return” provides information about hypothetical account values and hypothetical expenses based on the actual expense ratio and an assumed rate of return of 5.00% per year before expenses, which is not the Fund’s actual return. The hypothetical account values and expenses may not be used to estimate the actual ending account balance or expenses you paid for the period. You may use the information provided in this table to compare the ongoing costs of investing in the Fund and other funds. To do so, compare the 5.00% hypothetical example relating to the Fund with the 5.00% hypothetical examples that appear in the shareholder reports of the other funds.
Please note that the expenses shown in the table below are meant to highlight your ongoing costs only and do not reflect any transactional costs, such as front-end or back-end sales charges (loads). Therefore, the table is useful in comparing ongoing costs only, and will not help you determine the relative total costs of owning different funds. In addition, if these transaction costs were included, your costs would have been higher.
| | | | | | | | | | | | | | | | | | | | | | | | | | | | | | | | | | | | | | | | | | | | | | |
| Based on actual total return1 | | | | | | | | | Based on actual total return1 | |
| | | Actual
Total Return
Without
Sales
Charge2 | | | Beginning
Account
Value | | | Ending
Account
Value | | | Annualized
Expense
Ratio | | | Expenses
Paid
During
the
Period3 | | | | | | | | Hypothetical
Annualized
Total Return | | | Beginning
Account
Value | | | Ending
Account
Value | | | Annualized
Expense
Ratio | | | Expenses
Paid
During
the
Period3 | |
| Class A | | | 6.76 | % | | $ | 1,000.00 | | | $ | 1,067.60 | | | | 1.05 | % | | $ | 5.46 | | | | | | | Class A | | | 5.00 | % | | $ | 1,000.00 | | | $ | 1,019.86 | | | | 1.05 | % | | $ | 5.33 | |
| Class A2 | | | 6.66 | | | | 1,000.00 | | | | 1,066.60 | | | | 1.29 | | | | 6.70 | | | | | | | Class A2 | | | 5.00 | | | | 1,000.00 | | | | 1,018.65 | | | | 1.29 | | | | 6.55 | |
| Class C | | | 6.38 | | | | 1,000.00 | | | | 1,063.80 | | | | 1.81 | | | | 9.39 | | | | | | | Class C | | | 5.00 | | | | 1,000.00 | | | | 1,016.04 | | | | 1.81 | | | | 9.17 | |
| Class FI | | | 6.78 | | | | 1,000.00 | | | | 1,067.80 | | | | 1.04 | | | | 5.41 | | | | | | | Class FI | | | 5.00 | | �� | | 1,000.00 | | | | 1,019.91 | | | | 1.04 | | | | 5.28 | |
| Class R | | | 6.61 | | | | 1,000.00 | | | | 1,066.10 | | | | 1.36 | | | | 7.06 | | | | | | | Class R | | | 5.00 | | | | 1,000.00 | | | | 1,018.30 | | | | 1.36 | | | | 6.90 | |
| Class I | | | 6.91 | | | | 1,000.00 | | | | 1,069.10 | | | | 0.81 | | | | 4.21 | | | | | | | Class I | | | 5.00 | | | | 1,000.00 | | | | 1,021.06 | | | | 0.81 | | | | 4.12 | |
| | |
| 8 | | ClearBridge Small Cap Fund 2016 Annual Report |
| 1 | For the six months ended October 31, 2016. |
| 2 | Assumes the reinvestment of all distributions, including returns of capital, if any, at net asset value and does not reflect the deduction of the applicable sales charge with respect to Class A and Class A2 shares or the applicable contingent deferred sales charge (“CDSC”) with respect to Class C shares. Total return is not annualized, as it may not be representative of the total return for the year. Performance figures may reflect compensating balance arrangements, fee waivers and/or expense reimbursements. In the absence of compensating balance arrangements, fee waivers and/or expense reimbursements, the total return would have been lower. Past performance is no guarantee of future results. |
| 3 | Expenses (net of compensating balance arrangements, fee waivers and/or expense reimbursements) are equal to each class’ respective annualized expense ratio multiplied by the average account value over the period, multiplied by the number of days in the most recent fiscal half-year (184), then divided by 366. |
| | |
| ClearBridge Small Cap Fund 2016 Annual Report | | 9 |
Fund performance (unaudited)
| | | | | | | | | | | | | | | | | | | | | | | | |
| Average annual total returns | | | | | | | | | | | | | |
| Without sales charges1 | | Class A | | | Class A2 | | | Class C | | | Class FI | | | Class R | | | Class I | |
| Twelve Months Ended 10/31/16 | | | 9.60 | % | | | 9.37 | % | | | 8.75 | % | | | 9.47 | % | | | 9.17 | % | | | 9.86 | % |
| Five Years Ended 10/31/16 | | | 12.93 | | | | N/A | | | | 12.04 | | | | 12.72 | | | | 12.43 | | | | 13.18 | |
| Ten Years Ended 10/31/16 | | | N/A | | | | N/A | | | | 3.90 | | | | 4.57 | | | | N/A | | | | 4.98 | |
| Inception* through 10/31/16 | | | 17.02 | | | | 6.59 | | | | — | | | | — | | | | 3.76 | | | | — | |
| | | | | | |
| With sales charges2 | | Class A | | | Class A2 | | | Class C | | | Class FI | | | Class R | | | Class I | |
| Twelve Months Ended 10/31/16 | | | 3.31 | % | | | 3.08 | % | | | 7.75 | % | | | 9.47 | % | | | 9.17 | % | | | 9.86 | % |
| Five Years Ended 10/31/16 | | | 11.60 | | | | N/A | | | | 12.04 | | | | 12.72 | | | | 12.43 | | | | 13.18 | |
| Ten Years Ended 10/31/16 | | | N/A | | | | N/A | | | | 3.90 | | | | 4.57 | | | | N/A | | | | 4.98 | |
| Inception* through 10/31/16 | | | 16.12 | | | | 3.81 | | | | — | | | | — | | | | 3.76 | | | | — | |
| | | | |
| Cumulative total returns | |
| Without sales charges1 | | | |
| Class A (Inception date of 2/3/09 through 10/31/16) | | | 237.62 | % |
| Class A2 (Inception date of 8/1/14 through 10/31/16) | | | 15.39 | |
| Class C (10/31/06 through 10/31/16) | | | 46.67 | |
| Class FI (10/31/06 through 10/31/16) | | | 56.27 | |
| Class R (Inception date of 12/28/06 through 10/31/16) | | | 43.88 | |
| Class I (10/31/06 through 10/31/16) | | | 62.60 | |
All figures represent past performance and are not a guarantee of future results. Investment return and principal value of an investment will fluctuate so that an investor’s shares, when redeemed, may be worth more or less than their original cost. The returns shown do not reflect the deduction of taxes that a shareholder would pay on Fund distributions or the redemption of Fund shares. Performance figures may reflect compensating balance arrangements, fee waivers and/or expense reimbursements. In the absence of compensating balance arrangements, fee waivers and/or expense reimbursements, the total return would have been lower.
| 1 | Assumes the reinvestment of all distributions, including returns of capital, if any, at net asset value and does not reflect the deduction of the applicable sales charge with respect to Class A and Class A2 shares or the applicable contingent deferred sales charges (“CDSC”) with respect to Class C shares. |
| 2 | Assumes the reinvestment of all distributions, including returns of capital, if any, at net asset value. In addition, Class A and Class A2 shares reflect the deduction of the maximum initial sales charge of 5.75%. Class C shares reflect the deduction of a |
1.00% CDSC, which applies if shares are redeemed within one year from purchase payment.
| * | Inception dates for Class A, A2, C, FI, R and I shares are February 3, 2009, August 1, 2014, December 30, 1985, July 30, 2004, December 28, 2006 and December 1, 1994, respectively. |
| | |
| 10 | | ClearBridge Small Cap Fund 2016 Annual Report |
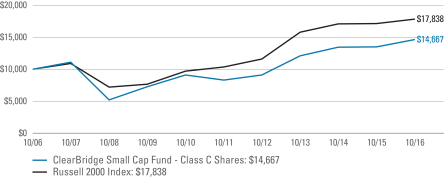
Historical performance
Value of $10,000 invested in
Class C Shares of ClearBridge Small Cap Fund vs. Russell 2000 Index† — October 2006 - October 2016
All figures represent past performance and are not a guarantee of future results. Investment return and principal value of an investment will fluctuate so that an investor’s shares, when redeemed, may be worth more or less than their original cost. The returns shown do not reflect the deduction of taxes that a shareholder would pay on Fund distributions or the redemption of Fund shares. Performance figures may reflect compensating balance arrangements, fee waivers and/or expense reimbursements. In the absence of compensating balance arrangements, fee waivers and/or expense reimbursements, the total return would have been lower.
| † | Hypothetical illustration of $10,000 invested in Class C shares of ClearBridge Small Cap Fund on October 31, 2006, assuming the reinvestment of all distributions, including returns of capital, if any, at net asset value through October 31, 2016. The hypothetical illustration also assumes a $10,000 investment in the Russell 2000 Index. The Russell 2000 Index measures the performance of the small-cap segment of the U.S. equity market. This index is unmanaged and is not subject to the same management and trading expenses as a mutual fund. Please note that an investor cannot invest directly in an index. The performance of the Fund’s other classes may be greater or less than the Class C shares’ performance indicated on this chart, depending on whether greater or lesser sales charges and fees were incurred by shareholders investing in these other classes. |
| | |
| ClearBridge Small Cap Fund 2016 Annual Report | | 11 |
Schedule of investments
October 31, 2016
ClearBridge Small Cap Fund
| | | | | | | | | | | | | | | | |
| Security | | | | | | | | Shares | | | Value | |
| Common Stocks — 94.3% | | | | | | | | | | | | | | | | |
| Consumer Discretionary — 13.4% | | | | | | | | | | | | | | | | |
| Auto Components — 2.0% | | | | | | | | | | | | |
Gentex Corp. | | | | | | | | | | | 743,000 | | | $ | 12,564,130 | |
| Diversified Consumer Services — 2.1% | | | | | | | | | | | | |
Service Corporation International | | | | | | | | | | | 500,000 | | | | 12,800,000 | |
| Hotels, Restaurants & Leisure — 3.8% | | | | | | | | | | | | |
Chuy’s Holdings Inc. | | | | | | | | | | | 212,004 | | | | 6,020,914 * | |
Planet Fitness Inc., Class A Shares | | | | | | | | | | | 260,000 | | | | 5,512,000 * | |
Potbelly Corp. | | | | | | | | | | | 515,000 | | | | 6,720,750 * | |
Red Robin Gourmet Burgers Inc. | | | | | | | | | | | 120,000 | | | | 5,520,000 * | |
Total Hotels, Restaurants & Leisure | | | | | | | | | | | | | | | 23,773,664 | |
| Household Durables — 1.0% | | | | | | | | | | | | |
Taylor Morrison Home Corp., Class A Shares | | | | | | | | | | | 362,270 | | | | 6,180,326 | * |
| Media — 1.6% | | | | | | | | | | | | |
Gray Television Inc. | | | | | | | | | | | 1,150,000 | | | | 10,235,000 | * |
| Specialty Retail — 2.9% | | | | | | | | | | | | |
Monro Muffler Brake Inc. | | | | | | | | | | | 160,000 | | | | 8,800,000 | |
Murphy USA Inc. | | | | | | | | | | | 140,000 | | | | 9,629,200 * | |
Total Specialty Retail | | | | | | | | | | | | | | | 18,429,200 | |
Total Consumer Discretionary | | | | | | | | | | | | | | | 83,982,320 | |
| Consumer Staples — 4.5% | | | | | | | | | | | | | | | | |
| Food & Staples Retailing — 2.8% | | | | | | | | | | | | |
Sprouts Farmers Market Inc.
| | | | | | | | | | | 490,000 | | | | 10,853,500
* | |
United Natural Foods Inc. | | | | | | | | | | | 165,000 | | | | 6,887,100 * | |
Total Food & Staples Retailing | | | | | | | | | | | | | | | 17,740,600 | |
| Food Products — 1.1% | | | | | | | | | | | | |
TreeHouse Foods Inc. | | | | | | | | | | | 80,000 | | | | 6,998,400 | * |
| Personal Products — 0.6% | | | | | | | | | | | | |
Inter Parfums Inc. | | | | | | | | | | | 105,000 | | | | 3,423,000 | |
Total Consumer Staples | | | | | | | | | | | | | | | 28,162,000 | |
| Energy — 1.7% | | | | | | | | | | | | | | | | |
| Oil, Gas & Consumable Fuels — 1.7% | | | | | | | | | | | | |
Extraction Oil & Gas Inc. | | | | | | | | | | | 265,780 | | | | 5,677,061 * | |
Sanchez Energy Corp. | | | | | | | | | | | 820,000 | | | | 5,223,400 * | |
Total Energy | | | | | | | | | | | | | | | 10,900,461 | |
| Financials — 18.5% | | | | | | | | | | | | | | | | |
| Banks — 6.7% | | | | | | | | | | | | |
First Interstate BancSystem Inc., Class A Shares | | | | | | | | | | | 360,000 | | | | 11,484,000 | |
See Notes to Financial Statements.
| | |
| 12 | | ClearBridge Small Cap Fund 2016 Annual Report |
ClearBridge Small Cap Fund
| | | | | | | | | | | | | | | | |
| Security | | | | | | | | Shares | | | Value | |
| Banks — continued | | | | | | | | | | | | |
Hancock Holding Co. | | | | | | | | | | | 279,000 | | | $ | 9,360,450 | |
LegacyTexas Financial Group Inc. | | | | | | | | | | | 377,000 | | | | 12,897,170 | |
Popular Inc. | | | | | | | | | | | 228,000 | | | | 8,276,400 | |
Total Banks | | | | | | | | | | | | | | | 42,018,020 | |
| Consumer Finance — 3.1% | | | | | | | | | | | | |
OneMain Holdings Inc. | | | | | | | | | | | 400,000 | | | | 11,336,000 * | |
PRA Group Inc. | | | | | | | | | | | 244,000 | | | | 7,783,600 * | |
Total Consumer Finance | | | | | | | | | | | | | | | 19,119,600 | |
| Insurance — 3.9% | | | | | | | | | | | | |
Assured Guaranty Ltd. | | | | | | | | | | | 255,000 | | | | 7,621,950 | |
Kinsale Capital Group Inc. | | | | | | | | | | | 250,000 | | | | 6,012,500 | |
ProAssurance Corp. | | | | | | | | | | | 200,000 | | | | 10,660,000 | |
Total Insurance | | | | | | | | | | | | | | | 24,294,450 | |
| Thrifts & Mortgage Finance — 4.8% | | | | | | | | | | | | |
Beneficial Bancorp Inc. | | | | | | | | | | | 465,000 | | | | 6,742,500 | |
NMI Holdings Inc., Class A Shares | | | | | | | | | | | 625,000 | | | | 4,781,250 | * |
Radian Group Inc. | | | | | | | | | | | 545,000 | | | | 7,406,550 | |
Washington Federal Inc. | | | | | | | | | | | 420,000 | | | | 11,445,000 | |
Total Thrifts & Mortgage Finance | | | | | | | | | | | | | | | 30,375,300 | |
Total Financials | | | | | | | | | | | | | | | 115,807,370 | |
| Health Care — 10.4% | | | | | | | | | | | | | | | | |
| Biotechnology — 2.9% | | | | | | | | | | | | |
Amarin Corp. PLC, ADR | | | | | | | | | | | 2,300,000 | | | | 7,176,000 | * |
Ironwood Pharmaceuticals Inc. | | | | | | | | | | | 335,000 | | | | 4,277,950 | * |
Ligand Pharmaceuticals Inc. | | | | | | | | | | | 57,000 | | | | 5,456,610 | * |
Radius Health Inc. | | | | | | | | | | | 30,000 | | | | 1,287,600 | * |
Total Biotechnology | | | | | | | | | | | | | | | 18,198,160 | |
| Health Care Equipment & Supplies — 1.8% | | | | | | | | | | | | |
Endologix Inc. | | | | | | | | | | | 626,000 | | | | 6,547,960 | * |
Quotient Ltd. | | | | | | | | | | | 912,319 | | | | 4,935,646 | * |
Total Health Care Equipment & Supplies | | | | | | | | | | | | | | | 11,483,606 | |
| Health Care Providers & Services — 4.1% | | | | | | | | | | | | |
HealthEquity Inc. | | | | | | | | | | | 425,000 | | | | 14,122,750 | * |
Molina Healthcare Inc. | | | | | | | | | | | 106,000 | | | | 5,767,460 | * |
Surgical Care Affiliates Inc. | | | | | | | | | | | 140,000 | | | | 5,990,600 | * |
Total Health Care Providers & Services | | | | | | | | | | | | | | | 25,880,810 | |
| Life Sciences Tools & Services — 1.6% | | | | | | | | | | | | |
INC Research Holdings Inc., Class A Shares | | | | | | | | | | | 100,000 | | | | 4,570,000 | * |
See Notes to Financial Statements.
| | |
| ClearBridge Small Cap Fund 2016 Annual Report | | 13 |
Schedule of investments (cont’d)
October 31, 2016
ClearBridge Small Cap Fund
| | | | | | | | | | | | | | | | |
| Security | | | | | | | | Shares | | | Value | |
| Life Sciences Tools & Services — continued | | | | | | | | | | | | |
Medpace Holdings Inc. | | | | | | | | | | | 178,480 | | | $ | 5,179,489 | * |
Total Life Sciences Tools & Services | | | | | | | | | | | | | | | 9,749,489 | |
Total Health Care | | | | | | | | | | | | | | | 65,312,065 | |
| Industrials — 14.8% | | | | | | | | | | | | | | | | |
| Aerospace & Defense — 1.4% | | | | | | | | | | | | |
HEICO Corp. | | | | | | | | | | | 127,002 | | | | 8,580,255 | |
| Airlines — 0.8% | | | | | | | | | | | | |
Allegiant Travel Co. | | | | | | | | | | | 37,000 | | | | 5,102,300 | |
| Building Products — 1.3% | | | | | | | | | | | | |
Continental Building Products Inc. | | | | | | | | | | | 398,000 | | | | 8,139,100 | * |
| Commercial Services & Supplies — 1.4% | | | | | | | | | | | | |
Copart Inc. | | | | | | | | | | | 159,000 | | | | 8,342,730 | * |
| Machinery — 0.9% | | | | | | | | | | | | |
CIRCOR International Inc. | | | | | | | | | | | 104,000 | | | | 5,593,120 | |
| Marine — 1.3% | | | | | | | | | | | | |
Matson Inc. | | | | | | | | | | | 200,000 | | | | 7,988,000 | |
| Professional Services — 1.7% | | | | | | | | | | | | |
ICF International Inc. | | | | | | | | | | | 232,150 | | | | 10,771,760 | * |
| Road & Rail — 2.2% | | | | | | | | | | | | |
Landstar System Inc. | | | | | | | | | | | 120,000 | | | | 8,538,000 | |
Marten Transport Ltd. | | | | | | | | | | | 265,000 | | | | 5,432,500 | |
Total Road & Rail | | | | | | | | | | | | | | | 13,970,500 | |
| Trading Companies & Distributors — 3.8% | | | | | | | | | | | | |
GATX Corp. | | | | | | | | | | | 240,000 | | | | 10,504,800 | |
Rush Enterprises Inc., Class A Shares | | | | | | | | | | | 318,000 | | | | 8,347,500 | * |
Triton International Ltd. | | | | | | | | | | | 425,000 | | | | 5,129,750 | |
Total Trading Companies & Distributors | | | | | | | | | | | | | | | 23,982,050 | |
Total Industrials | | | | | | | | | | | | | | | 92,469,815 | |
| Information Technology — 19.7% | | | | | | | | | | | | | | | | |
| Electronic Equipment, Instruments & Components — 3.9% | | | | | | | | | | | | |
ePlus Inc. | | | | | | | | | | | 90,000 | | | | 8,239,500 * | |
Methode Electronics Inc. | | | | | | | | | | | 290,000 | | | | 9,048,000 | |
MTS System Corp. | | | | | | | | | | | 145,000 | | | | 6,894,750 | |
Total Electronic Equipment, Instruments & Components | | | | | | | | | | | | | | | 24,182,250 | |
| Internet Software & Services — 7.5% | | | | | | | | | | | | |
2U Inc. | | | | | | | | | | | 300,000 | | | | 10,458,000 * | |
Bankrate Inc. | | | | | | | | | | | 1,095,000 | | | | 8,541,000 * | |
Criteo SA, ADR | | | | | | | | | | | 148,000 | | | | 5,350,200 * | |
See Notes to Financial Statements.
| | |
| 14 | | ClearBridge Small Cap Fund 2016 Annual Report |
ClearBridge Small Cap Fund
| | | | | | | | | | | | | | | | |
| Security | | | | | | | | Shares | | | Value | |
| Internet Software & Services — continued | | | | | | | | | | | | |
DHI Group Inc. | | | | | | | | | | | 775,000 | | | $ | 4,417,500 | * |
Q2 Holdings Inc. | | | | | | | | | | | 372,000 | | | | 10,453,200 * | |
WebMD Health Corp. | | | | | | | | | | | 154,000 | | | | 7,566,020 * | |
Total Internet Software & Services | | | | | | | | | | | | | | | 46,785,920 | |
| IT Services — 2.6% | | | | | | | | | | | | |
CSG Systems International Inc. | | | | | | | | | | | 234,000 | | | | 8,899,020 | |
EVERTEC Inc. | | | | | | | | | | | 504,000 | | | | 7,635,600 | |
Total IT Services | | | | | | | | | | | | | | | 16,534,620 | |
| Semiconductors & Semiconductor Equipment — 4.9% | | | | | | | | | | | | |
Applied Micro Circuits Corp. | | | | | | | | | | | 1,061,000 | | | | 7,851,400 * | |
Power Integrations Inc. | | | | | | | | | | | 98,000 | | | | 6,316,100 | |
Semtech Corp. | | | | | | | | | | | 339,510 | | | | 8,216,142 * | |
Veeco Instruments Inc. | | | | | | | | | | | 380,000 | | | | 8,246,000 * | |
Total Semiconductors & Semiconductor Equipment | | | | | | | | | | | | | | | 30,629,642 | |
| Software — 0.8% | | | | | | | | | | | | |
Manhattan Associates Inc. | | | | | | | | | | | 105,000 | | | | 5,317,200 | * |
Total Information Technology | | | | | | | | | | | | | | | 123,449,632 | |
| Materials — 4.9% | | | | | | | | | | | | | | | | |
| Chemicals — 1.3% | | | | | | | | | | | | |
Balchem Corp. | | | | | | | | | | | 110,000 | | | | 8,349,000 | |
| Metals & Mining — 2.4% | | | | | | | | | | | | |
Hi-Crush Partners LP | | | | | | | | | | | 488,401 | | | | 8,278,397 * | |
Steel Dynamics Inc. | | | | | | | | | | | 233,000 | | | | 6,398,180 | |
Total Metals & Mining | | | | | | | | | | | | | | | 14,676,577 | |
| Paper & Forest Products — 1.2% | | | | | | | | | | | | |
Clearwater Paper Corp. | | | | | | | | | | | 145,000 | | | | 7,699,500 | * |
Total Materials | | | | | | | | | | | | | | | 30,725,077 | |
| Real Estate — 4.9% | | | | | | | | | | | | | | | | |
| Equity Real Estate Investment Trusts (REITs) — 4.9% | | | | | | | | | | | | |
American Homes 4 Rent, Class A Shares | | | | | | | | | | | 380,000 | | | | 8,021,800 | |
Lexington Realty Trust | | | | | | | | | | | 590,000 | | | | 5,982,600 | |
Potlatch Corp. | | | | | | | | | | | 240,000 | | | | 9,216,000 | |
Summit Hotel Properties Inc. | | | | | | | | | | | 585,000 | | | | 7,599,150 | |
Total Real Estate | | | | | | | | | | | | | | | 30,819,550 | |
| Utilities — 1.5% | | | | | | | | | | | | | | | | |
| Electric Utilities — 1.5% | | | | | | | | | | | | |
PNM Resources Inc. | | | | | | | | | | | 285,000 | | | | 9,362,250 | |
Total Common Stocks (Cost — $511,847,314) | | | | | | | | | | | | | | | 590,990,540 | |
See Notes to Financial Statements.
| | |
| ClearBridge Small Cap Fund 2016 Annual Report | | 15 |
Schedule of investments (cont’d)
October 31, 2016
ClearBridge Small Cap Fund
| | | | | | | | | | | | | | | | |
| Security | | | | | | | | Shares | | | Value | |
| Investments in Underlying Funds — 3.1% | | | | | | | | | | | | | | | | |
| Financials — 3.1% | | | | | | | | | | | | | | | | |
Main Street Capital Corp. | | | | | | | | | | | 230,571 | | | $ | 7,737,962 | (a) |
PennantPark Investment Corp. | | | | | | | | | | | 655,872 | | | | 4,938,716 (a) | |
Triangle Capital Corp. | | | | | | | | | | | 350,967 | | | | 6,745,586 (a) | |
Total Investments in Underlying Funds (Cost — $19,398,103) | | | | | | | | | | | | | | | 19,422,264 | |
Total Investments before Short-Term Investments (Cost — $531,245,417) | | | | 610,412,804 | |
| | | | |
| | | Rate | | | | | | | | | | |
| Short-Term Investments — 3.0% | |
State Street Institutional Treasury Money Market Fund, Premier Class (Cost — $18,414,180) | | | 0.215 | % | | | | | | | 18,414,180 | | | | 18,414,180 | |
Total Investments — 100.4% (Cost — $549,659,597#) | | | | 628,826,984 | |
Liabilities in Excess of Other Assets — (0.4)% | | | | (2,298,600 | ) |
Total Net Assets — 100.0% | | | $ | 626,528,384 | |
| * | Non-income producing security. |
| (a) | Security is a business development company (See Note 1). |
| # | Aggregate cost for federal income tax purposes is $553,239,486. |
| | |
Abbreviation used in this schedule: |
| ADR | | — American Depositary Receipts |
See Notes to Financial Statements.
| | |
| 16 | | ClearBridge Small Cap Fund 2016 Annual Report |
Statement of assets and liabilities
October 31, 2016
| | | | |
|
| Assets: | |
Investments, at value (Cost — $549,659,597) | | $ | 628,826,984 | |
Receivable for Fund shares sold | | | 292,295 | |
Dividends and interest receivable | | | 271,251 | |
Prepaid expenses | | | 36,968 | |
Other assets | | | 10,303 | |
Total Assets | | | 629,437,801 | |
|
| Liabilities: | |
Payable for securities purchased | | | 1,286,634 | |
Payable for Fund shares repurchased | | | 527,674 | |
Service and/or distribution fees payable | | | 381,541 | |
Investment management fee payable | | | 364,669 | |
Trustees’ fees payable | | | 5,874 | |
Accrued expenses | | | 343,025 | |
Total Liabilities | | | 2,909,417 | |
| Total Net Assets | | $ | 626,528,384 | |
|
| Net Assets: | |
Par value (Note 7) | | $ | 171 | |
Paid-in capital in excess of par value | | | 531,310,654 | |
Accumulated net investment loss | | | (1,856,718) | |
Accumulated net realized gain on investments | | | 17,906,890 | |
Net unrealized appreciation on investments | | | 79,167,387 | |
| Total Net Assets | | $ | 626,528,384 | |
See Notes to Financial Statements.
| | |
| ClearBridge Small Cap Fund 2016 Annual Report | | 17 |
Statement of assets and liabilities (cont’d)
October 31, 2016
| | | | |
|
| Net Assets: | |
Class A | | | $62,782,716 | |
Class A2 | | | $1,474,092 | |
Class C | | | $418,166,120 | |
Class FI | | | $10,013,528 | |
Class R | | | $3,388,060 | |
Class I | | | $130,703,868 | |
|
| Shares Outstanding: | |
Class A | | | 1,791,064 | |
Class A2 | | | 42,242 | |
Class C | | | 12,413,165 | |
Class FI | | | 205,637 | |
Class R | | | 70,965 | |
Class I | | | 2,582,971 | |
|
| Net Asset Value: | |
Class A (and redemption price) | | | $35.05 | |
Class A2 (and redemption price) | | | $34.90 | |
Class C* | | | $33.69 | |
Class FI (and redemption price) | | | $48.70 | |
Class R (and redemption price) | | | $47.74 | |
Class I (and redemption price) | | | $50.60 | |
| Maximum Public Offering Price Per Share: | |
Class A (based on maximum initial sales charge of 5.75%) | | | $37.19 | |
Class A2 (based on maximum initial sales charge of 5.75%) | | | $37.03 | |
| * | Redemption price per share is NAV of Class C shares reduced by a 1.00% CDSC, if shares are redeemed within one year from purchase payment (See Note 2). |
See Notes to Financial Statements.
| | |
| 18 | | ClearBridge Small Cap Fund 2016 Annual Report |
Statement of operations
For the Year Ended October 31, 2016
| | | | |
|
| Investment Income: | |
Dividends | | $ | 8,078,934 | |
Return of capital (Note 1(g)) | | | (140,212) | |
Net Dividends and Distributions | | | 7,938,722 | |
Interest | | | 34,754 | |
Less: Foreign taxes withheld | | | (45,829) | |
Total Investment Income | | | 7,927,647 | |
|
| Expenses: | |
Service and/or distribution fees (Notes 2 and 5) | | | 4,498,890 | |
Investment management fee (Note 2) | | | 4,131,728 | |
Transfer agent fees (Note 5) | | | 546,655 | |
Registration fees | | | 94,506 | |
Trustees’ fees | | | 66,713 | |
Fund accounting fees | | | 60,562 | |
Audit and tax fees | | | 46,742 | |
Shareholder reports | | | 32,069 | |
Legal fees | | | 30,825 | |
Custody fees | | | 7,180 | |
Insurance | | | 6,190 | |
Miscellaneous expenses | | | 10,593 | |
Total Expenses | | | 9,532,653 | |
Less: Fee waivers and/or expense reimbursements (Notes 2 and 5) | | | (116,969) | |
Net Expenses | | | 9,415,684 | |
| Net Investment Loss | | | (1,488,037) | |
|
| Realized and Unrealized Gain on Investments (Notes 1 and 3): | |
Net Realized Gain From: | |
Investment transactions | | | 24,492,499 | |
REIT distributions | | | 669,542 | |
Net Realized Gain | | | 25,162,041 | |
Change in Net Unrealized Appreciation (Depreciation) From Investments | | | 26,711,525 | |
| Net Gain on Investments | | | 51,873,566 | |
| Increase in Net Assets From Operations | | $ | 50,385,529 | |
See Notes to Financial Statements.
| | |
| ClearBridge Small Cap Fund 2016 Annual Report | | 19 |
Statements of changes in net assets
| | | | | | | | |
| For the Years Ended October 31, | | 2016 | | | 2015 | |
|
| Operations: | |
Net investment loss | | $ | (1,488,037) | | | $ | (4,027,403) | |
Net realized gain | | | 25,162,041 | | | | 41,224,284 | |
Change in net unrealized appreciation (depreciation) | | | 26,711,525 | | | | (33,735,743) | |
Increase in Net Assets From Operations | | | 50,385,529 | | | | 3,461,138 | |
|
| Distributions to Shareholders From (Notes 1 and 6): | |
Net realized gains | | | (29,170,060) | | | | (118,741,091) | |
Decrease in Net Assets From Distributions to Shareholders | | | (29,170,060) | | | | (118,741,091) | |
|
| Fund Share Transactions (Note 7): | |
Net proceeds from sale of shares | | | 114,142,334 | | | | 52,679,741 | |
Reinvestment of distributions | | | 27,469,089 | | | | 111,416,165 | |
Cost of shares repurchased | | | (144,173,264) | | | | (145,559,489) | |
Increase (Decrease) in Net Assets From Fund Share Transactions | | | (2,561,841) | | | | 18,536,417 | |
Increase (Decrease) in Net Assets | | | 18,653,628 | | | | (96,743,536) | |
|
| Net Assets: | |
Beginning of year | | | 607,874,756 | | | | 704,618,292 | |
End of year* | | $ | 626,528,384 | | | $ | 607,874,756 | |
*Includes accumulated net investment loss of: | | | $(1,856,718) | | | | $(3,168,508) | |
See Notes to Financial Statements.
| | |
| 20 | | ClearBridge Small Cap Fund 2016 Annual Report |
Financial highlights
| | | | | | | | | | | | | | | | | | | | |
For a share of each class of beneficial interest outstanding throughout each year ended October 31: | |
| Class A Shares1 | | 2016 | | | 2015 | | | 2014 | | | 2013 | | | 2012 | |
| | | | | |
| Net asset value, beginning of year | | | $33.68 | | | | $40.51 | | | | $39.24 | | | | $29.66 | | | | $27.28 | |
| | | | | |
| Income (loss) from operations: | | | | | | | | | | | | | | | | | | | | |
Net investment income (loss) | | | 0.10 | | | | 0.01 | | | | (0.00) | 2 | | | 0.15 | | | | 0.22 | |
Net realized and unrealized gain | | | 2.95 | | | | 0.29 | | | | 4.38 | | | | 9.94 | | | | 2.58 | |
Total income from operations | | | 3.05 | | | | 0.30 | | | | 4.38 | | | | 10.09 | | | | 2.80 | |
| | | | | |
| Less distributions from: | | | | | | | | | | | | | | | | | | | | |
Net investment income | | | — | | | | — | | | | (0.72) | | | | (0.51) | | | | (0.42) | |
Net realized gains | | | (1.68) | | | | (7.13) | | | | (2.39) | | | | — | | | | — | |
Total distributions | | | (1.68) | | | | (7.13) | | | | (3.11) | | | | (0.51) | | | | (0.42) | |
| | | | | |
| Net asset value, end of year | | | $35.05 | | | | $33.68 | | | | $40.51 | | | | $39.24 | | | | $29.66 | |
Total return3 | | | 9.60 | % | | | 0.95 | %4 | | | 11.97 | % | | | 34.41 | % | | | 10.30 | % |
| | | | | |
| Net assets, end of year (000s) | | | $62,783 | | | | $34,913 | | | | $42,798 | | | | $40,382 | | | | $32,573 | |
| | | | | |
| Ratios to average net assets: | | | | | | | | | | | | | | | | | | | | |
Gross expenses | | | 1.07 | % | | | 1.07 | % | | | 1.07 | % | | | 1.09 | % | | | 1.11 | % |
Net expenses5 | | | 1.05 | | | | 1.05 | | | | 1.05 | | | | 1.06 | | | | 1.09 | |
Net investment income (loss) | | | 0.29 | | | | 0.02 | | | | (0.01) | | | | 0.43 | | | | 0.74 | |
| | | | | |
| Portfolio turnover rate | | | 35 | % | | | 29 | % | | | 52 | % | | | 39 | % | | | 30 | % |
| 1 | Per share amounts have been calculated using the average shares method. |
| 2 | Amount represents less than $0.005 per share. |
| 3 | Performance figures, exclusive of sales charges, may reflect compensating balance arrangements, fee waivers and/or expense reimbursements. In the absence of compensating balance arrangements, fee waivers and/or expense reimbursements, the total return would have been lower. Past performance is no guarantee of future results. |
| 4 | The total return includes gains from settlement of security litigations. Without these gains, the total return would have been 0.53% for the year ended October 31, 2015. |
| 5 | Reflects expense reimbursements. |
See Notes to Financial Statements.
| | |
| ClearBridge Small Cap Fund 2016 Annual Report | | 21 |
Financial highlights (cont’d)
| | | | | | | | | | | | |
For a share of each class of beneficial interest outstanding throughout each year ended October 31,
unless otherwise noted: | |
| Class A2 Shares1 | | 2016 | | | 2015 | | | 20142 | |
| | | |
| Net asset value, beginning of year | | | $33.61 | | | | $40.50 | | | | $38.68 | |
|
| Income (loss) from operations: | |
Net investment income (loss) | | | 0.01 | | | | (0.10) | | | | (0.03) | |
Net realized and unrealized gain | | | 2.96 | | | | 0.34 | | | | 1.85 | |
Total income from operations | | | 2.97 | | | | 0.24 | | | | 1.82 | |
|
| Less distributions from: | |
Net realized gains | | | (1.68) | | | | (7.13) | | | | — | |
Total distributions | | | (1.68) | | | | (7.13) | | | | — | |
| | | |
| Net asset value, end of year | | | $34.90 | | | | $33.61 | | | | $40.50 | |
Total return3 | | | 9.37 | % | | | 0.77 | %4 | | | 4.71 | % |
| | | |
| Net assets, end of year (000s) | | | $1,474 | | | | $504 | | | | $75 | |
|
| Ratios to average net assets: | |
Gross expenses | | | 1.68 | % | | | 1.77 | % | | | 1.10 | %5 |
Net expenses6,7 | | | 1.29 | | | | 1.29 | | | | 1.07 | 5 |
Net investment income (loss) | | | 0.03 | | | | (0.30) | | | | (0.36) | 5 |
| | | |
| Portfolio turnover rate | | | 35 | % | | | 29 | % | | | 52 | %8 |
| 1 | Per share amounts have been calculated using the average shares method. |
| 2 | For the period August 1, 2014 (inception date) to October 31, 2014. |
| 3 | Performance figures, exclusive of sales charges, may reflect compensating balance arrangements, fee waivers and/or expense reimbursements. In the absence of compensating balance arrangements, fee waivers and/or expense reimbursements, the total return would have been lower. Past performance is no guarantee of future results. Total returns for periods of less than one year are not annualized. |
| 4 | The total return includes gains from settlement of security litigations. Without these gains, the total return would have been 0.56% for the year ended October 31, 2015. |
| 6 | As a result of a voluntary expense limitation arrangement, the ratio of total annual fund operating expenses, other than interest, brokerage commissions, dividend expense on short sales, taxes, extraordinary expenses and acquired fund fees and expenses, to average net assets of Class A2 shares did not exceed 1.29%. This voluntary expense limitation arrangement may be terminated at any time by the manager. |
| 7 | Reflects fee waivers and/or expense reimbursements. |
| 8 | For the year ended October 31, 2014. |
See Notes to Financial Statements.
| | |
| 22 | | ClearBridge Small Cap Fund 2016 Annual Report |
| | | | | | | | | | | | | | | | | | | | |
For a share of each class of beneficial interest outstanding throughout each year ended October 31: | |
| Class C Shares1 | | 2016 | | | 2015 | | | 2014 | | | 2013 | | | 2012 | |
| | | | | |
| Net asset value, beginning of year | | | $32.68 | | | | $39.78 | | | | $38.61 | | | | $29.17 | | | | $26.72 | |
| | | | | |
| Income (loss) from operations: | | | | | | | | | | | | | | | | | | | | |
Net investment loss | | | (0.16) | | | | (0.27) | | | | (0.31) | | | | (0.12) | | | | (0.01) | |
Net realized and unrealized gain | | | 2.85 | | | | 0.30 | | | | 4.30 | | | | 9.82 | | | | 2.53 | |
Total income from operations | | | 2.69 | | | | 0.03 | | | | 3.99 | | | | 9.70 | | | | 2.52 | |
| | | | | |
| Less distributions from: | | | | | | | | | | | | | | | | | | | | |
Net investment income | | | — | | | | — | | | | (0.43) | | | | (0.26) | | | | (0.07) | |
Net realized gains | | | (1.68) | | | | (7.13) | | | | (2.39) | | | | — | | | | — | |
Total distributions | | | (1.68) | | | | (7.13) | | | | (2.82) | | | | (0.26) | | | | (0.07) | |
| | | | | |
| Net asset value, end of year | | | $33.69 | | | | $32.68 | | | | $39.78 | | | | $38.61 | | | | $29.17 | |
Total return2 | | | 8.75 | % | | | 0.16 | %3 | | | 11.06 | % | | | 33.37 | % | | | 9.45 | % |
| | | | | |
| Net assets, end of year (000s) | | | $418,166 | | | | $486,052 | | | | $581,681 | | | | $605,286 | | | | $559,450 | |
| | | | | |
| Ratios to average net assets: | | | | | | | | | | | | | | | | | | | | |
Gross expenses | | | 1.86 | % | | | 1.87 | % | | | 1.87 | % | | | 1.88 | % | | | 1.88 | % |
Net expenses4 | | | 1.84 | | | | 1.85 | | | | 1.85 | | | | 1.85 | | | | 1.86 | |
Net investment loss | | | (0.49) | | | | (0.78) | | | | (0.80) | | | | (0.35) | | | | (0.04) | |
| | | | | |
| Portfolio turnover rate | | | 35 | % | | | 29 | % | | | 52 | % | | | 39 | % | | | 30 | % |
| 1 | Per share amounts have been calculated using the average shares method. |
| 2 | Performance figures, exclusive of CDSC, may reflect compensating balance arrangements, fee waivers and/or expense reimbursements. In the absence of compensating balance arrangements, fee waivers and/or expense reimbursements, the total return would have been lower. Past performance is no guarantee of future results. |
| 3 | The total return includes gains from settlement of security litigations. Without these gains, the total return would have been (0.24)% for the year ended October 31, 2015. |
| 4 | Reflects expense reimbursements. |
See Notes to Financial Statements.
| | |
| ClearBridge Small Cap Fund 2016 Annual Report | | 23 |
Financial highlights (cont’d)
| | | | | | | | | | | | | | | | | | | | |
For a share of each class of beneficial interest outstanding throughout each year ended October 31: | |
| Class FI Shares1 | | 2016 | | | 2015 | | | 2014 | | | 2013 | | | 2012 | |
| | | | | |
| Net asset value, beginning of year | | | $46.17 | | | | $52.95 | | | | $50.11 | | | | $37.79 | | | | $34.61 | |
|
| Income (loss) from operations: | |
Net investment income (loss) | | | (0.00) | 2 | | | (0.05) | | | | (0.18) | | | | 0.25 | | | | 0.24 | |
Net realized and unrealized gain | | | 4.21 | | | | 0.40 | | | | 5.69 | | | | 12.54 | | | | 3.28 | |
Total income from operations | | | 4.21 | | | | 0.35 | | | | 5.51 | | | | 12.79 | | | | 3.52 | |
|
| Less distributions from: | |
Net investment income | | | — | | | | — | | | | (0.28) | | | | (0.47) | | | | (0.34) | |
Net realized gains | | | (1.68) | | | | (7.13) | | | | (2.39) | | | | — | | | | — | |
Total distributions | | | (1.68) | | | | (7.13) | | | | (2.67) | | | | (0.47) | | | | (0.34) | |
| | | | | |
| Net asset value, end of year | | | $48.70 | | | | $46.17 | | | | $52.95 | | | | $50.11 | | | | $37.79 | |
Total return3 | | | 9.47 | % | | | 0.83 | %4 | | | 11.55 | % | | | 34.10 | % | | | 10.23 | % |
| | | | | |
| Net assets, end of year (000s) | | | $10,014 | | | | $1,154 | | | | $1,591 | | | | $1,864 | | | | $9,986 | |
|
| Ratios to average net assets: | |
Gross expenses | | | 1.12 | % | | | 1.21 | % | | | 1.41 | % | | | 1.25 | % | | | 1.19 | % |
Net expenses5 | | | 1.10 | | | | 1.19 | | | | 1.39 | | | | 1.23 | | | | 1.17 | |
Net investment income (loss) | | | (0.01) | | | | (0.11) | | | | (0.35) | | | | 0.61 | | | | 0.66 | |
| | | | | |
| Portfolio turnover rate | | | 35 | % | | | 29 | % | | | 52 | % | | | 39 | % | | | 30 | % |
| 1 | Per share amounts have been calculated using the average shares method. |
| 2 | Amount represents less than $0.005 per share. |
| 3 | Performance figures may reflect compensating balance arrangements, fee waivers and/or expense reimbursements. In the absence of compensating balance arrangements, fee waivers and/or expense reimbursements, the total return would have been lower. Past performance is no guarantee of future results. |
| 4 | The total return includes gains from settlement of security litigations. Without these gains, the total return would have been 0.41% for the year ended October 31, 2015. |
| 5 | Reflects expense reimbursements. |
See Notes to Financial Statements.
| | |
| 24 | | ClearBridge Small Cap Fund 2016 Annual Report |
| | | | | | | | | | | | | | | | | | | | |
For a share of each class of beneficial interest outstanding throughout each year ended October 31: | |
| Class R Shares1 | | 2016 | | | 2015 | | | 2014 | | | 2013 | | | 2012 | |
| | | | | |
| Net asset value, beginning of year | | | $45.43 | | | | $52.34 | | | | $49.78 | | | | $37.38 | | | | $34.15 | |
| | | | | |
| Income (loss) from operations: | | | | | | | | | | | | | | | | | | | | |
Net investment income (loss) | | | (0.04) | | | | (0.18) | | | | (0.25) | | | | 0.01 | | | | 0.09 | |
Net realized and unrealized gain | | | 4.03 | | | | 0.40 | | | | 5.64 | | | | 12.61 | | | | 3.24 | |
Total income from operations | | | 3.99 | | | | 0.22 | | | | 5.39 | | | | 12.62 | | | | 3.33 | |
| | | | | |
| Less distributions from: | | | | | | | | | | | | | | | | | | | | |
Net investment income | | | — | | | | — | | | | (0.44) | | | | (0.22) | | | | (0.10) | |
Net realized gains | | | (1.68) | | | | (7.13) | | | | (2.39) | | | | — | | | | — | |
Total distributions | | | (1.68) | | | | (7.13) | | | | (2.83) | | | | (0.22) | | | | (0.10) | |
| | | | | |
| Net asset value, end of year | | | $47.74 | | | | $45.43 | | | | $52.34 | | | | $49.78 | | | | $37.38 | |
Total return2 | | | 9.17 | % | | | 0.53 | %3 | | | 11.42 | % | | | 33.81 | % | | | 9.77 | % |
| | | | | |
| Net assets, end of year (000s) | | | $3,388 | | | | $3,691 | | | | $4,983 | | | | $6,181 | | | | $7,449 | |
| | | | | |
| Ratios to average net assets: | | | | | | | | | | | | | | | | | | | | |
Gross expenses | | | 1.46 | % | | | 1.48 | % | | | 1.55 | % | | | 1.54 | % | | | 1.60 | % |
Net expenses4 | | | 1.44 | | | | 1.47 | | | | 1.54 | | | | 1.51 | | | | 1.58 | |
Net investment income (loss) | | | (0.10) | | | | (0.39) | | | | (0.49) | | | | 0.02 | | | | 0.26 | |
| | | | | |
| Portfolio turnover rate | | | 35 | % | | | 29 | % | | | 52 | % | | | 39 | % | | | 30 | % |
| 1 | Per share amounts have been calculated using the average shares method. |
| 2 | Performance figures may reflect compensating balance arrangements, fee waivers and/or expense reimbursements. In the absence of compensating balance arrangements, fee waivers and/or expense reimbursements, the total return would have been lower. Past performance is no guarantee of future results. |
| 3 | The total return includes gains from settlement of security litigations. Without these gains, the total return would have been 0.11% for the year ended October 31, 2015. |
| 4 | Reflects expense reimbursements. |
See Notes to Financial Statements.
| | |
| ClearBridge Small Cap Fund 2016 Annual Report | | 25 |
Financial highlights (cont’d)
| | | | | | | | | | | | | | | | | | | | |
| For a share of each class of beneficial interest outstanding throughout each year ended October 31: | |
| Class I Shares1 | | 2016 | | | 2015 | | | 2014 | | | 2013 | | | 2012 | |
| | | | | |
| Net asset value, beginning of year | | $ | 47.76 | | | $ | 54.36 | | | $ | 51.56 | | | $ | 38.84 | | | $ | 35.57 | |
| | | | | |
| Income from operations: | | | | | | | | | | | | | | | | | | | | |
Net investment income | | | 0.25 | | | | 0.10 | | | | 0.10 | | | | 0.28 | | | | 0.38 | |
Net realized and unrealized gain | | | 4.27 | | | | 0.43 | | | | 5.86 | | | | 13.04 | | | | 3.39 | |
Total income from operations | | | 4.52 | | | | 0.53 | | | | 5.96 | | | | 13.32 | | | | 3.77 | |
| | | | | |
| Less distributions from: | | | | | | | | | | | | | | | | | | | | |
Net investment income | | | — | | | | — | | | | (0.77) | | | | (0.60) | | | | (0.50) | |
Net realized gains | | | (1.68) | | | | (7.13) | | | | (2.39) | | | | — | | | | — | |
Total distributions | | | (1.68) | | | | (7.13) | | | | (3.16) | | | | (0.60) | | | | (0.50) | |
| | | | | |
| Net asset value, end of year | | $ | 50.60 | | | $ | 47.76 | | | $ | 54.36 | | | $ | 51.56 | | | $ | 38.84 | |
Total return2 | | | 9.86 | % | | | 1.15 | %3 | | | 12.18 | % | | | 34.67 | % | | | 10.65 | % |
| | | | | |
| Net assets, end of year (000s) | | $ | 130,704 | | | $ | 81,560 | | | $ | 73,490 | | | $ | 73,273 | | | $ | 66,160 | |
| | | | | |
| Ratios to average net assets: | | | | | | | | | | | | | | | | | | | | |
Gross expenses | | | 0.84 | % | | | 0.88 | % | | | 0.86 | % | | | 0.91 | % | | | 0.82 | % |
Net expenses4 | | | 0.82 | | | | 0.86 | | | | 0.84 | | | | 0.89 | | | | 0.81 | |
Net investment income | | | 0.52 | | | | 0.21 | | | | 0.20 | | | | 0.62 | | | | 1.01 | |
| | | | | |
| Portfolio turnover rate | | | 35 | % | | | 29 | % | | | 52 | % | | | 39 | % | | | 30 | % |
| 1 | Per share amounts have been calculated using the average shares method. |
| 2 | Performance figures may reflect compensating balance arrangements, fee waivers and/or expense reimbursements. In the absence of compensating balance arrangements, fee waivers and/or expense reimbursements, the total return would have been lower. Past performance is no guarantee of future results. |
| 3 | The total return includes gains from settlement of security litigations. Without these gains, the total return would have been 0.81% for the year ended October 31, 2015. |
| 4 | Reflects expense reimbursements. |
See Notes to Financial Statements.
| | |
| 26 | | ClearBridge Small Cap Fund 2016 Annual Report |
Notes to financial statements
1. Organization and significant accounting policies
ClearBridge Small Cap Fund (the “Fund”) is a separate diversified investment series of Legg Mason Global Asset Management Trust (the “Trust”). The Trust, a Maryland statutory trust, is registered under the Investment Company Act of 1940, as amended (the “1940 Act”), as an open-end management investment company.
The following are significant accounting policies consistently followed by the Fund and are in conformity with U.S. generally accepted accounting principles (“GAAP”). Estimates and assumptions are required to be made regarding assets, liabilities and changes in net assets resulting from operations when financial statements are prepared. Changes in the economic environment, financial markets and any other parameters used in determining these estimates could cause actual results to differ. Subsequent events have been evaluated through the date the financial statements were issued.
(a) Investment valuation. Equity securities for which market quotations are available are valued at the last reported sales price or official closing price on the primary market or exchange on which they trade. The valuations for fixed income securities (which may include, but are not limited to, corporate, government, municipal, mortgage-backed, collateralized mortgage obligations and asset-backed securities) and certain derivative instruments are typically the prices supplied by independent third party pricing services, which may use market prices or broker/dealer quotations or a variety of valuation techniques and methodologies. The independent third party pricing services use inputs that are observable such as issuer details, interest rates, yield curves, prepayment speeds, credit risks/spreads, default rates and quoted prices for similar securities. Short-term fixed income securities that will mature in 60 days or less are valued at amortized cost, unless it is determined that using this method would not reflect an investment’s fair value. Investments in open-end funds are valued at the closing net asset value per share of each fund on the day of valuation. When the Fund holds securities or other assets that are denominated in a foreign currency, the Fund will normally use the currency exchange rates as of 4:00 p.m. (Eastern Time). If independent third party pricing services are unable to supply prices for a portfolio investment, or if the prices supplied are deemed by the manager to be unreliable, the market price may be determined by the manager using quotations from one or more broker/dealers or at the transaction price if the security has recently been purchased and no value has yet been obtained from a pricing service or pricing broker. When reliable prices are not readily available, such as when the value of a security has been significantly affected by events after the close of the exchange or market on which the security is principally traded, but before the Fund calculates its net asset value, the Fund values these securities as determined in accordance with procedures approved by the Fund’s Board of Trustees.
The Board of Trustees is responsible for the valuation process and has delegated the supervision of the daily valuation process to the Legg Mason North Atlantic Fund Valuation Committee (the “Valuation Committee”). The Valuation Committee, pursuant to the policies adopted by the Board of Trustees, is responsible for making fair value determinations,
| | |
| ClearBridge Small Cap Fund 2016 Annual Report | | 27 |
Notes to financial statements (cont’d)
evaluating the effectiveness of the Fund’s pricing policies, and reporting to the Board of Trustees. When determining the reliability of third party pricing information for investments owned by the Fund, the Valuation Committee, among other things, conducts due diligence reviews of pricing vendors, monitors the daily change in prices and reviews transactions among market participants.
The Valuation Committee will consider pricing methodologies it deems relevant and appropriate when making fair value determinations. Examples of possible methodologies include, but are not limited to, multiple of earnings; discount from market of a similar freely traded security; discounted cash-flow analysis; book value or a multiple thereof; risk premium/yield analysis; yield to maturity; and/or fundamental investment analysis. The Valuation Committee will also consider factors it deems relevant and appropriate in light of the facts and circumstances. Examples of possible factors include, but are not limited to, the type of security; the issuer’s financial statements; the purchase price of the security; the discount from market value of unrestricted securities of the same class at the time of purchase; analysts’ research and observations from financial institutions; information regarding any transactions or offers with respect to the security; the existence of merger proposals or tender offers affecting the security; the price and extent of public trading in similar securities of the issuer or comparable companies; and the existence of a shelf registration for restricted securities.
For each portfolio security that has been fair valued pursuant to the policies adopted by the Board of Trustees, the fair value price is compared against the last available and next available market quotations. The Valuation Committee reviews the results of such back testing monthly and fair valuation occurrences are reported to the Board of Trustees quarterly.
The Fund uses valuation techniques to measure fair value that are consistent with the market approach and/or income approach, depending on the type of security and the particular circumstance. The market approach uses prices and other relevant information generated by market transactions involving identical or comparable securities. The income approach uses valuation techniques to discount estimated future cash flows to present value.
GAAP establishes a disclosure hierarchy that categorizes the inputs to valuation techniques used to value assets and liabilities at measurement date. These inputs are summarized in the three broad levels listed below:
| • | | Level 1 — quoted prices in active markets for identical investments |
| • | | Level 2 — other significant observable inputs (including quoted prices for similar investments, interest rates, prepayment speeds, credit risk, etc.) |
| • | | Level 3 — significant unobservable inputs (including the Fund’s own assumptions in determining the fair value of investments) |
The inputs or methodologies used to value securities are not necessarily an indication of the risk associated with investing in those securities.
| | |
| 28 | | ClearBridge Small Cap Fund 2016 Annual Report |
The following is a summary of the inputs used in valuing the Fund’s assets carried at fair value:
| | | | | | | | | | | | | | | | |
| ASSETS | |
| Description | | Quoted Prices
(Level 1) | | | Other Significant
Observable Inputs
(Level 2) | | | Significant
Unobservable
Inputs
(Level 3) | | | Total | |
| Long-term investments†: | | | | | | | | | | | | | | | | |
Common stocks | | $ | 590,990,540 | | | | — | | | | — | | | $ | 590,990,540 | |
Investments in underlying funds | | | 19,422,264 | | | | — | | | | — | | | | 19,422,264 | |
| Total long-term investments | | $ | 610,412,804 | | | | — | | | | — | | | $ | 610,412,804 | |
| Short-term investments† | | | 18,414,180 | | | | — | | | | — | | | | 18,414,180 | |
| Total investments | | $ | 628,826,984 | | | | — | | | | — | | | $ | 628,826,984 | |
| † | See Schedule of Investments for additional detailed categorizations. |
(b) Business development companies. The Fund may invest in securities of closed-end investment companies that have elected to be treated as a business development company under the 1940 Act. A business development company operates similar to an exchange-traded fund and represents a portfolio of securities. The Fund may purchase a business development company to gain exposure to the securities in the underlying portfolio. The risks of owning a business development company generally reflect the risks of owning the underlying securities. Business development companies have expenses that reduce their value.
(c) Foreign currency translation. Investment securities and other assets and liabilities denominated in foreign currencies are translated into U.S. dollar amounts based upon prevailing exchange rates on the date of valuation. Purchases and sales of investment securities and income and expense items denominated in foreign currencies are translated into U.S. dollar amounts based upon prevailing exchange rates on the respective dates of such transactions.
The Fund does not isolate that portion of the results of operations resulting from fluctuations in foreign exchange rates on investments from the fluctuations arising from changes in market prices of securities held. Such fluctuations are included with the net realized and unrealized gain or loss on investments.
Net realized foreign exchange gains or losses arise from sales of foreign currencies, including gains and losses on forward foreign currency contracts, currency gains or losses realized between the trade and settlement dates on securities transactions, and the difference between the amounts of dividends, interest, and foreign withholding taxes recorded on the Fund’s books and the U.S. dollar equivalent of the amounts actually received or paid. Net unrealized foreign exchange gains and losses arise from changes in the values of assets and liabilities, other than investments in securities, on the date of valuation, resulting from changes in exchange rates.
| | |
| ClearBridge Small Cap Fund 2016 Annual Report | | 29 |
Notes to financial statements (cont’d)
Foreign security and currency transactions may involve certain considerations and risks not typically associated with those of U.S. dollar denominated transactions as a result of, among other factors, the possibility of lower levels of governmental supervision and regulation of foreign securities markets and the possibility of political or economic instability.
(d) Foreign investment risks. The Fund’s investments in foreign securities may involve risks not present in domestic investments. Since securities may be denominated in foreign currencies, may require settlement in foreign currencies or pay interest or dividends in foreign currencies, changes in the relationship of these foreign currencies to the U.S. dollar can significantly affect the value of the investments and earnings of the Fund. Foreign investments may also subject the Fund to foreign government exchange restrictions, expropriation, taxation or other political, social or economic developments, all of which affect the market and/or credit risk of the investments.
(e) Security transactions and investment income. Security transactions are accounted for on a trade date basis. Interest income, adjusted for amortization of premium and accretion of discount, is recorded on the accrual basis. Dividend income is recorded on the ex-dividend date. Foreign dividend income is recorded on the ex-dividend date or as soon as practicable after the Fund determines the existence of a dividend declaration after exercising reasonable due diligence. The cost of investments sold is determined by use of the specific identification method. To the extent any issuer defaults or a credit event occurs that impacts the issuer, the Fund may halt any additional interest income accruals and consider the realizability of interest accrued up to the date of default or credit event.
(f) Distributions to shareholders. Distributions from net investment income and distributions of net realized gains, if any, are declared at least annually. Distributions to shareholders of the Fund are recorded on the ex-dividend date and are determined in accordance with income tax regulations, which may differ from GAAP.
(g) REIT distributions. The character of distributions received from Real Estate Investment Trusts (‘‘REITs’’) held by the Fund is generally comprised of net investment income, capital gains, and return of capital. It is the policy of the Fund to estimate the character of distributions received from underlying REITs based on historical data provided by the REITs. After each calendar year end, REITs report the actual tax character of these distributions. Differences between the estimated and actual amounts reported by the REITs are reflected in the Fund’s records in the year in which they are reported by the REITs by adjusting related investment cost basis, capital gains and income, as necessary.
(h) Share class accounting. Investment income, common expenses and realized/unrealized gains (losses) on investments are allocated to the various classes of the Fund on the basis of daily net assets of each class. Fees relating to a specific class are charged directly to that share class.
(i) Compensating balance arrangements. The Fund has an arrangement with its custodian bank whereby a portion of the custodian’s fees is paid indirectly by credits earned on the Fund’s cash on deposit with the bank.
| | |
| 30 | | ClearBridge Small Cap Fund 2016 Annual Report |
(j) Commission recapture. The Fund has entered into an agreement with State Street Bank, its custodian, whereby a portion of commissions paid on investment transactions may be rebated to the Fund. Such payments are included with realized gain (loss) on investment transactions. During the year ended October 31, 2016, the Fund did not receive any commission rebates.
(k) Federal and other taxes. It is the Fund’s policy to comply with the federal income and excise tax requirements of the Internal Revenue Code of 1986 (the “Code”), as amended, applicable to regulated investment companies. Accordingly, the Fund intends to distribute its taxable income and net realized gains, if any, to shareholders in accordance with timing requirements imposed by the Code. Therefore, no federal or state income tax provision is required in the Fund’s financial statements.
Management has analyzed the Fund’s tax positions taken on income tax returns for all open tax years and has concluded that as of October 31, 2016, no provision for income tax is required in the Fund’s financial statements. The Fund’s federal and state income and federal excise tax returns for tax years for which the applicable statutes of limitations have not expired are subject to examination by the Internal Revenue Service and state departments of revenue.
Under the applicable foreign tax laws, a withholding tax may be imposed on interest, dividends and capital gains at various rates.
(l) Reclassification. GAAP requires that certain components of net assets be reclassified to reflect permanent differences between financial and tax reporting. These reclassifications have no effect on net assets or net asset value per share. During the current year, the following reclassifications have been made:
| | | | | | | | |
| | | Accumulated Net
Investment Loss | | | Accumulated
Net Realized
Gain | |
| (a) | | $ | 2,799,827 | | | $ | (2,799,827) | |
| (a) | Reclassifications are due to a tax net operating loss which offsets short-term capital gains for tax purposes and book/tax differences in the treatment of partnership investments. |
2. Investment advisory and management agreement and other transactions with affiliates
The Fund has an investment advisory and management agreement with ClearBridge, LLC (“ClearBridge”). Pursuant to the agreement, ClearBridge provides the Fund with investment advisory, management and administrative services for which the Fund pays a fee, computed daily and payable monthly, at annual rates based on the Fund’s average daily net assets.
| | |
| ClearBridge Small Cap Fund 2016 Annual Report | | 31 |
Notes to financial statements (cont’d)
Western Asset Management Company (“Western Asset”) manages the portion of the Fund’s cash and short-term instruments allocated to it. The following chart shows the annual advisory fee rates for the Fund:
| | | | |
| Average Daily Net Assets | | Annual Rate | |
| First $1 billion | | | 0.700 | % |
| Next $1 billion | | | 0.680 | |
| Next $3 billion | | | 0.650 | |
| Next $5 billion | | | 0.620 | |
| Over $10 billion | | | 0.590 | |
Legg Mason Partners Fund Advisor, LLC (“LMPFA”) provides certain administrative and oversight services to the Fund. For LMPFA’s services to the Fund, ClearBridge (not the Fund) pays LMPFA a fee, calculated daily and payable monthly, at an annual rate of 0.05% of the average daily net assets of the Fund. For Western Asset’s services to the Fund, ClearBridge (not the Fund) pays Western Asset 0.02% of the portion of the Fund’s average daily net assets that are allocated to them by ClearBridge. ClearBridge, LMPFA and Western Asset are wholly owned subsidiaries of Legg Mason, Inc. (“Legg Mason”).
The Fund’s agreement with ClearBridge provides that expense reimbursements be made to the Fund for audit fees and compensation of the Fund’s independent trustees. These expense reimbursements are not subject to recapture.
As a result of a voluntary expense limitation arrangement, the ratio of total annual fund operating expenses, other than interest, brokerage commissions, dividend expense on short sales, taxes, extraordinary expenses and acquired fund fees and expenses, to average net assets of the Fund’s Class A2 shares did not exceed 1.29%. This voluntary expense limitation arrangement may be terminated at any time by ClearBridge.
During the year ended October 31, 2016, fees waived and/or expenses reimbursed amounted to $116,969.
ClearBridge is permitted to recapture amounts waived and/or reimbursed to a class within three years after the fiscal year in which ClearBridge earned the fee or incurred the expense if the class’ total annual operating expenses have fallen to a level below the expense limitation (“expense cap”) in effect at the time the fees were earned or the expenses incurred. In no case will ClearBridge recapture any amount that would result, on any particular business day of the Fund, in the class’ total annual operating expenses exceeding the expense cap or any other lower limit then in effect.
| | |
| 32 | | ClearBridge Small Cap Fund 2016 Annual Report |
Pursuant to these arrangements, at October 31, 2016, the Fund had remaining fee waivers and/or expense reimbursements subject to recapture by ClearBridge and respective dates of expiration as follows:
| | | | |
| | | Class A2 | |
| Expires October 31, 2017 | | | — | |
| Expires October 31, 2018 | | $ | 1,005 | |
| Expires October 31, 2019 | | | 3,513 | |
| Total fee waivers subject to recapture | | $ | 4,518 | |
For the year ended October 31, 2016, ClearBridge did not recapture any fees.
Legg Mason Investor Services, LLC (‘‘LMIS’’), a wholly-owned broker-dealer subsidiary of Legg Mason, serves as the Fund’s sole and exclusive distributor.
There is a maximum initial sales charge of 5.75% for Class A and Class A2 shares. There is a contingent deferred sales charge (“CDSC”) of 1.00% on Class C shares, which applies if redemption occurs within 12 months from purchase payment. In certain cases, Class A and Class A2 shares have a 1.00% CDSC, which applies if redemption occurs within 18 months from purchase payment. This CDSC only applies to those purchases of Class A and Class A2 shares, which, when combined with current holdings of other shares of funds sold by LMIS, equal or exceed $1,000,000 in the aggregate. These purchases do not incur an initial sales charge.
For the year ended October 31, 2016, LMIS and its affiliates retained sales charges of $1,901 and $4,295 on sales of the Fund’s Class A and Class A2 shares, respectively. In addition, for the year ended October 31, 2016, CDSCs paid to LMIS and its affiliates were:
| | | | | | | | |
| | | Class A | | | Class C | |
| CDSCs | | $ | 36 | | | $ | 2,044 | |
Under a Deferred Compensation Plan (the “Plan”), Trustees may have elected to defer receipt of all or a specified portion of their compensation. A participating Trustee selected one or more funds managed by affiliates of Legg Mason in which his or her deferred trustee’s fees were deemed to be invested. Deferred amounts remain in the Fund until distributed in accordance with the Plan. In May 2015, the Board of Trustees approved an amendment to the Plan so that effective January 1, 2016, no compensation earned after that date may be deferred under the Plan.
All officers and one Trustee of the Trust are employees of Legg Mason or its affiliates and do not receive compensation from the Trust.
The Fund is permitted to purchase or sell securities from or to certain other affiliated funds or portfolios under specified conditions outlined in procedures adopted by the Board of Trustees. The procedures have been designed to provide assurance that any purchase or sale of securities by the Fund from or to another fund or portfolio that is, or could be considered, an affiliate by virtue of having a common investment manager or subadviser (or affiliated investment manager or subadviser), common Trustees and/or common officers complies with Rule 17a-7 under the 1940 Act. Further, as defined under the procedures, each transaction is effected at the current market price. For the year ended October 31,
| | |
| ClearBridge Small Cap Fund 2016 Annual Report | | 33 |
Notes to financial statements (cont’d)
2016, such purchase and sale transactions were $0 and $1,317,500, respectively, with a net realized loss of $201,280.
3. Investments
During the year ended October 31, 2016, the aggregate cost of purchases and proceeds from sales of investments (excluding short-term investments) were as follows:
| | | | |
| Purchases | | $ | 201,669,598 | |
| Sales | | | 222,073,322 | |
At October 31, 2016, the aggregate gross unrealized appreciation and depreciation of investments for federal income tax purposes were as follows:
| | | | |
| Gross unrealized appreciation | | $ | 110,170,388 | |
| Gross unrealized depreciation | | | (34,582,890) | |
| Net unrealized appreciation | | $ | 75,587,498 | |
4. Derivative instruments and hedging activities
During the year ended October 31, 2016, the Fund did not invest in derivative instruments.
5. Class specific expenses, waivers and/or expense reimbursements
The Fund has adopted a Rule 12b-1 shareholder services and distribution plan and under that plan the Fund pays service and/or distribution fees with respect to its Class A, Class A2, Class C, Class FI and Class R shares calculated at the annual rate of 0.25%, 0.25%, 1.00%, 0.25% and 0.50% of the average daily net assets of each class, respectively. Service and/or distribution fees are accrued daily and paid monthly.
For the year ended October 31, 2016, class specific expenses were as follows:
| | | | | | | | |
| | | Service and/or
Distribution Fees | | | Transfer Agent
Fees | |
| Class A | | $ | 128,895 | | | $ | 30,267 | |
| Class A2 | | | 2,363 | | | | 6,341 | |
| Class C | | | 4,346,548 | | | | 426,200 | |
| Class FI | | | 3,875 | | | | 1,511 | |
| Class R | | | 17,209 | | | | 6,782 | |
| Class I | | | — | | | | 75,554 | |
| Total | | $ | 4,498,890 | | | $ | 546,655 | |
For the year ended October 31, 2016, waivers and/or expense reimbursements by class were as follows:
| | | | |
| | | Waivers/Expense
Reimbursements | |
| Class A | | $ | 10,018 | |
| Class A2 | | | 3,700 | |
| Class C | | | 83,122 | |
| Class FI | | | 352 | |
| Class R | | | 658 | |
| Class I | | | 19,119 | |
| Total | | $ | 116,969 | |
| | |
| 34 | | ClearBridge Small Cap Fund 2016 Annual Report |
6. Distributions to shareholders by class
| | | | | | | | |
| | | Year Ended
October 31, 2016 | | | Year Ended
October 31, 2015 | |
| Net Realized Gains: | | | | | | | | |
| Class A | | $ | 1,725,223 | | | $ | 7,360,464 | |
| Class A2 | | | 29,272 | | | | 16,445 | |
| Class C | | | 24,455,851 | | | | 100,994,825 | |
| Class FI | | | 38,295 | | | | 176,063 | |
| Class R | | | 138,013 | | | | 670,375 | |
| Class I | | | 2,783,406 | | | | 9,522,919 | |
| Total | | $ | 29,170,060 | | | $ | 118,741,091 | |
7. Shares of beneficial interest
At October 31, 2016, the Trust had an unlimited number of shares of beneficial interest authorized with a par value of $0.00001 per share. The Fund has the ability to issue multiple classes of shares. Each class of shares represents an identical interest and has the same rights, except that each class bears certain direct expenses, including those specifically related to the distribution of its shares.
Transactions in shares of each class were as follows:
| | | | | | | | | | | | | | | | |
| | | Year Ended
October 31, 2016 | | | Year Ended
October 31, 2015 | |
| | | Shares | | | Amount | | | Shares | | | Amount | |
| Class A | | | | | | | | | | | | | | | | |
| Shares sold | | | 916,829 | | | $ | 27,688,674 | | | | 100,115 | | | $ | 3,456,920 | |
| Shares issued on reinvestment | | | 53,735 | | | | 1,695,340 | | | | 218,201 | | | | 7,274,452 | |
| Shares repurchased | | | (216,157) | | | | (7,099,189) | | | | (338,258) | | | | (11,643,319) | |
| Net increase (decrease) | | | 754,407 | | | $ | 22,284,825 | | | | (19,942) | | | $ | (911,947) | |
| | | | |
| Class A2 | | | | | | | | | | | | | | | | |
| Shares sold | | | 31,468 | | | $ | 1,037,460 | | | | 13,910 | | | $ | 476,809 | |
| Shares issued on reinvestment | | | 930 | | | | 29,272 | | | | 493 | | | | 16,445 | |
| Shares repurchased | | | (5,153) | | | | (175,395) | | | | (1,253) | | | | (45,057) | |
| Net increase | | | 27,245 | | | $ | 891,337 | | | | 13,150 | | | $ | 448,197 | |
| | | | |
| Class C | | | | | | | | | | | | | | | | |
| Shares sold | | | 135,316 | | | $ | 4,200,410 | | | | 301,221 | | | $ | 10,068,934 | |
| Shares issued on reinvestment | | | 777,784 | | | | 23,745,760 | | | | 3,002,973 | | | | 97,832,770 | |
| Shares repurchased | | | (3,374,023) | | | | (104,431,576) | | | | (3,051,705) | | | | (105,509,581) | |
| Net increase (decrease) | | | (2,460,923) | | | $ | (76,485,406) | | | | 252,489 | | | $ | 2,392,123 | |
| | | | |
| Class FI | | | | | | | | | | | | | | | | |
| Shares sold | | | 199,822 | | | $ | 10,031,434 | | | | 2,680 | | | $ | 127,008 | |
| Shares issued on reinvestment | | | 873 | | | | 38,295 | | | | 3,851 | | | | 176,063 | |
| Shares repurchased | | | (20,046) | | | | (923,955) | | | | (11,584) | | | | (579,037) | |
| Net increase (decrease) | | | 180,649 | | | $ | 9,145,774 | | | | (5,053) | | | $ | (275,966) | |
| | |
| ClearBridge Small Cap Fund 2016 Annual Report | | 35 |
Notes to financial statements (cont’d)
| | | | | | | | | | | | | | | | |
| | | Year Ended
October 31, 2016 | | | Year Ended
October 31, 2015 | |
| | | Shares | | | Amount | | | Shares | | | Amount | |
| Class R | | | | | | | | | | | | | | | | |
| Shares sold | | | 15,555 | | | $ | 694,200 | | | | 20,627 | | | $ | 974,074 | |
| Shares issued on reinvestment | | | 3,168 | | | | 136,584 | | | | 14,838 | | | | 669,343 | |
| Shares repurchased | | | (29,013) | | | | (1,268,180) | | | | (49,420) | | | | (2,304,075) | |
| Net decrease | | | (10,290) | | | $ | (437,396) | | | | (13,955) | | | $ | (660,658) | |
| | | | |
| Class I | | | | | | | | | | | | | | | | |
| Shares sold | | | 1,467,352 | | | $ | 70,490,156 | | | | 765,420 | | | $ | 37,575,996 | |
| Shares issued on reinvestment | | | 40,128 | | | | 1,823,838 | | | | 115,464 | | | | 5,447,092 | |
| Shares repurchased | | | (632,364) | | | | (30,274,969) | | | | (525,019) | | | | (25,478,420) | |
| Net increase | | | 875,116 | | | $ | 42,039,025 | | | | 355,865 | | | $ | 17,544,668 | |
8. Income tax information and distributions to shareholders
The tax character of distributions paid during the fiscal years ended October 31, was as follows:
| | | | | | | | |
| | | 2016 | | | 2015 | |
| Distributions paid from: | | | | | | | | |
| Ordinary income | | $ | 10,000,000 | | | $ | 3,000,045 | |
| Net long-term capital gains | | | 19,170,060 | | | | 115,741,046 | |
| Total distributions paid | | $ | 29,170,060 | | | $ | 118,741,091 | |
As of October 31, 2016, the components of accumulated earnings (losses) on a tax basis were as follows:
| | | | |
| Undistributed long-term capital gains — net | | $ | 21,486,779 | |
| Other book/tax temporary differences(a) | | | (1,856,718) | |
| Unrealized appreciation (depreciation)(b) | | | 75,587,498 | |
| Total accumulated earnings (losses) — net | | $ | 95,217,559 | |
| (a) | Other book/tax temporary differences are attributable to the deferral of certain late year losses for tax purposes and book/tax differences in the timing of the deductibility of various expenses. |
| (b) | The difference between book-basis and tax-basis unrealized appreciation (depreciation) is attributable to the tax deferral of losses on wash sales. |
9. Recent accounting pronouncement
In October 2016, the U.S. Securities and Exchange Commission adopted new rules and amended existing rules (together, the “final rules”) intended to modernize the reporting and disclosure of information by registered investment companies. In part, the final rules amend Regulation S-X and require standardized, enhanced disclosure about derivatives in investment company financial statements, as well as other amendments. The compliance date for the amendments to Regulation S-X is August 1, 2017. Management is currently evaluating the impact that the adoption of the amendments to Regulation S-X will have on the Fund’s financial statements and related disclosures.
| | |
| 36 | | ClearBridge Small Cap Fund 2016 Annual Report |
Report of independent registered public accounting firm
To the Board of Trustees of Legg Mason Global Asset Management Trust and to the Shareholders of ClearBridge Small Cap Fund:
In our opinion, the accompanying statement of assets and liabilities, including the schedule of investments, and the related statements of operations and of changes in net assets and the financial highlights present fairly, in all material respects, the financial position of the ClearBridge Small Cap Fund (one of the funds comprising Legg Mason Global Asset Management Trust, the “Fund”) as of October 31, 2016, the results of its operations, the changes in its net assets and the financial highlights for each of the periods presented, in conformity with accounting principles generally accepted in the United States of America. These financial statements and financial highlights (hereafter referred to as “financial statements”) are the responsibility of the Fund’s management. Our responsibility is to express an opinion on these financial statements based on our audits. We conducted our audits of these financial statements in accordance with the standards of the Public Company Accounting Oversight Board (United States). Those standards require that we plan and perform the audit to obtain reasonable assurance about whether the financial statements are free of material misstatement. An audit includes examining, on a test basis, evidence supporting the amounts and disclosures in the financial statements, assessing the accounting principles used and significant estimates made by management, and evaluating the overall financial statement presentation. We believe that our audits, which included confirmation of securities as of October 31, 2016 by correspondence with the custodian and brokers, provide a reasonable basis for our opinion.
Baltimore, MD
December 19, 2016
| | |
| ClearBridge Small Cap Fund 2016 Annual Report | | 37 |
Additional information (unaudited)
Information about Trustees and Officers
The business and affairs of ClearBridge Small Cap Fund (the “Fund”) are conducted by management under the supervision and subject to the direction of its Board of Trustees. The business address of each Trustee is c/o Jane Trust, Legg Mason, 100 International Drive, 11th Floor, Baltimore, Maryland 21202. Information pertaining to the Trustees and officers of the Fund is set forth below.
The Statement of Additional Information includes additional information about Trustees and is available, without charge, upon request by calling the Fund at 1-877-721-1926.
| | |
| Independent Trustees† |
| Ruby P. Hearn |
| Year of birth | | 1940 |
| Position(s) with Trust | | Trustee |
| Term of office1 and length of time served2 | | Since 2004 |
| Principal occupation(s) during past five years | | Senior Vice President Emerita of The Robert Wood Johnson Foundation (non-profit) since 2001; Member of the Institute of Medicine since 1982; formerly, Trustee of the New York Academy of Medicine (2004 to 2012); Director of the Institute for Healthcare Improvement (2002 to 2012); Senior Vice President of The Robert Wood Johnson Foundation (1996 to 2001); Fellow of The Yale Corporation (1992 to 1998) |
| Number of funds in fund complex overseen by Trustee | | 21 |
| Other board memberships held by Trustee during past five years | | None |
|
| Arnold L. Lehman |
| Year of birth | | 1944 |
| Position(s) with Trust | | Trustee and Chairman |
| Term of office1 and length of time served2 | | Since 1982 and since 2015 |
| Principal occupation(s) during past five years | | Senior Advisor, Phillips Auctioneer since 2015; Trustee of American Federation of Arts since 1998; formerly, Fellow, Ford Foundation (2015 to 2016); Director of the Brooklyn Museum (1997 to 2015); Director of The Baltimore Museum of Art (1979 to 1997) |
| Number of funds in fund complex overseen by Trustee | | 21 |
| Other board memberships held by Trustee during past five years | | None |
|
| Robin J.W. Masters |
| Year of birth | | 1955 |
| Position(s) with Trust | | Trustee |
| Term of office1 and length of time served2 | | Since 2002 |
| Principal occupation(s) during past five years | | Retired; formerly, Chief Investment Officer of ACE Limited (insurance) (1986 to 2000) |
| Number of funds in fund complex overseen by Trustee | | 21 |
| Other board memberships held by Trustee during past five years | | Director of Cheyne Capital International Limited (investment advisory firm); formerly, Director/Trustee of Legg Mason Institutional Funds plc, WA Fixed Income Funds plc and Western Asset Debt Securities Fund plc. (2007 to 2011) |
| | |
| 38 | | ClearBridge Small Cap Fund |
| | |
| Independent Trustees† cont’d |
| Jill E. McGovern |
| Year of birth | | 1944 |
| Position(s) with Trust | | Trustee |
| Term of office1 and length of time served2 | | Since 1989 |
| Principal occupation(s) during past five years | | Senior Consultant, American Institute for Contemporary German Studies (AICGS) since 2007; formerly, Chief Executive Officer of The Marrow Foundation (non-profit) (1993 to 2007); Executive Director of the Baltimore International Festival (1991 to 1993); Senior Assistant to the President of The Johns Hopkins University (1986 to 1990) |
| Number of funds in fund complex overseen by Trustee | | 21 |
| Other board memberships held by Trustee during past five years | | Director of International Biomedical Research Alliance; Director of Lois Roth Endowment |
|
| Arthur S. Mehlman |
| Year of birth | | 1942 |
| Position(s) with Trust | | Trustee |
| Term of office1 and length of time served2 | | Since 2002 |
| Principal occupation(s) during past five years | | Retired. Director, The University of Maryland Foundation since 1992; Director, The League for People with Disabilities since 2003; formerly, Director, Municipal Mortgage & Equity LLC (2004 to 2011); Partner, KPMG LLP (international accounting firm) (1972 to 2002) |
| Number of funds in fund complex overseen by Trustee | | Director/Trustee of all Legg Mason Funds consisting of 21 portfolios; Director/Trustee of the Royce Family of Funds consisting of 23 portfolios |
| Other board memberships held by Trustee during past five years | | Director of Municipal Mortgage & Equity, LLC. (2004 to 2011) |
|
| G. Peter O’Brien |
| Year of birth | | 1945 |
| Position(s) with Trust | | Trustee |
| Term of office1 and length of time served2 | | Since 1999 |
| Principal occupation(s) during past five years | | Retired. Trustee Emeritus of Colgate University; Board Member, Hill House, Inc. (residential home care); Board Member, Bridges School (pre- school); formerly, Managing Director, Equity Capital Markets Group of Merrill Lynch & Co. (1971 to 1999) |
| Number of funds in fund complex overseen by Trustee | | Director/Trustee of all Legg Mason funds consisting of 21 portfolios; Director/Trustee of the Royce Family of Funds consisting of 23 portfolios |
| Other board memberships held by Trustee during past five years | | Director of TICC Capital Corp. |
| | |
| ClearBridge Small Cap Fund | | 39 |
Additional information (unaudited) (cont’d)
Information about Trustees and Officers
| | |
| Independent Trustees† cont’d |
| S. Ford Rowan |
| Year of birth | | 1943 |
| Position(s) with Trust | | Trustee |
| Term of office1 and length of time served2 | | Since 2002 |
| Principal occupation(s) during past five years | | Chairman, National Center for Critical Incident Analysis, since 2004; Consultant to University of Maryland University College, since 2013; formerly, Lecturer in Organizational Sciences, George Washington University (2000 to 2014); Trustee, St. John’s College (2006 to 2012); Consultant, Rowan & Blewitt Inc. (management consulting) (1984 to 2007); Lecturer in Journalism, Northwestern University (1980 to 1993); Director, Santa Fe Institute (1999 to 2008) |
| Number of funds in fund complex overseen by Trustee | | 21 |
| Other board memberships held by Trustee during past five years | | None |
|
| Robert M. Tarola |
| Year of birth | | 1950 |
| Position(s) with Trust | | Trustee |
| Term of office1 and length of time served2 | | Since 2004 |
| Principal occupation(s) during past five years | | Executive Vice President and Chief Financial Officer, Southcoast Health System, Inc. (healthcare provider network) since 2015; President of Right Advisory LLC (corporate finance and governance consulting) since 2008; Member, Investor Advisory Group of the Public Company Accounting Oversight Board since 2009; formerly, Senior Vice President and Chief Financial Officer of The Howard University (2009 to 2013) (higher education and health care); Senior Vice President and Chief Financial Officer of W.R. Grace & Co. (specialty chemicals) (1999 to 2008) and MedStar Health, Inc. (healthcare) (1996 to 1999); Partner, Price Waterhouse, LLP (accounting and auditing) (1984 to 1996) |
| Number of funds in fund complex overseen by Trustee | | 21 |
| Other board memberships held by Trustee during past five years | | Director of American Kidney Fund (renal disease assistance); Director of XBRL International, Inc. (global data standard setting); Director of Vista Outdoor, Inc. (sporting goods) |
| | |
| | |
| 40 | | ClearBridge Small Cap Fund |
| | |
| Interested Trustee |
| Jane Trust3 | | |
| Year of birth | | 1962 |
| Position(s) with Trust | | Trustee, President and Chief Executive Officer |
| Term of office1 and length of time served2 | | Since 2015 |
| Principal occupation(s) during past five years | | Managing Director of Legg Mason & Co., LLC (“Legg Mason & Co.”) (since 2016); Officer and/or Trustee/Director of 159 funds associated with Legg Mason Partners Fund Advisor, LLC (“LMPFA”) or its affiliates (since 2015); President and Chief Executive Officer of LMPFA (since 2015); formerly, Senior Vice President of LMPFA (2015); Director of ClearBridge, LLC (formerly, Legg Mason Capital Management, LLC) (2007 to 2014); Managing Director of Legg Mason Investment Counsel & Trust Co. (2000 to 2007) |
| Number of funds in fund complex overseen by Trustee | | 152 |
Other board memberships held by Trustee during past
five years | | None |
| | |
| Executive Officers |
Richard F. Sennett Legg Mason 100 International Drive, 7th Floor, Baltimore, MD 21202 | | |
| Year of birth | | 1970 |
| Position(s) with Trust | | Principal Financial Officer |
| Term of office1 and length of time served2 | | Since 2011 |
| Principal occupation(s) during past five years | | Principal Financial Officer and Treasurer of certain mutual funds associated with Legg Mason & Co. or its affiliates (since 2011 and since 2013); Managing Director of Legg Mason & Co. and Senior Manager of the Treasury Policy group for Legg Mason & Co.’s Global Fiduciary Platform (since 2011); formerly, Chief Accountant within the SEC’s Division of Investment Management (2007 to 2011); Assistant Chief Accountant within the SEC’s Division of Investment Management (2002 to 2007) |
| |
Robert I. Frenkel Legg Mason 100 First Stamford Place, 6th Floor, Stamford, CT 06902 | | |
| Year of birth | | 1954 |
| Position(s) with Trust | | Secretary and Chief Legal Officer |
| Term of office1 and length of time served2 | | Since 2007 |
| Principal occupation(s) during past five years | | Vice President and Deputy General Counsel of Legg Mason (since 2006); Managing Director and General Counsel of — U.S. Mutual Funds for Legg Mason & Co. (since 2006) and Legg Mason & Co. predecessors (since 1994); Secretary and Chief Legal Officer of certain mutual funds associated with Legg Mason & Co. or its affiliates (since 2006) and Legg Mason & Co. predecessors (prior to 2006) |
| | |
| ClearBridge Small Cap Fund | | 41 |
Additional information (unaudited) (cont’d)
Information about Trustees and Officers
| | |
| Executive Officers cont’d |
Ted P. Becker
Legg Mason 620 Eighth Avenue, 49th Floor, New York, NY 10018 | | |
| Year of birth | | 1951 |
| Position(s) with Trust | | Vice President and Chief Compliance Officer |
| Term of office1 and length of time served2 | | Since 2007 |
| Principal occupation(s) during past five years | | Director of Global Compliance at Legg Mason (since 2006); Chief Compliance Officer of LMPFA (since 2006); Managing Director of Compliance of Legg Mason & Co. (since 2005); Chief Compliance Officer of certain mutual funds associated with Legg Mason & Co. or its affiliates (since 2006) and Legg Mason & Co. predecessors (prior to 2006) |
| |
Christopher Berarducci Legg Mason 620 Eighth Avenue, 49th Floor, New York, NY 10018 | | |
| Year of birth | | 1974 |
| Position(s) with Trust | | Treasurer |
| Term of office1 and length of time served2 | | Since 2010 |
| Principal occupation(s) during past five years | | Director of Legg Mason & Co. (since 2015); Treasurer of certain mutual funds associated with Legg Mason & Co. or its affiliates (since 2010); formerly, Vice President of Legg Mason & Co. (2011 to 2015); Assistant Controller of certain mutual funds associated with Legg Mason & Co. or its affiliates (prior to 2010) |
| |
Susan Kerr Legg Mason 620 Eighth Avenue, 49th Floor, New York, NY 10018 | | |
| Year of birth | | 1949 |
| Position(s) with Trust | | Chief Anti-Money Laundering Compliance Officer |
| Term of office1 and length of time served2 | | Since 2013 |
| Principal occupation(s) during past five years | | Assistant Vice President of Legg Mason & Co. and Legg Mason Investor Services, LLC (“LMIS”) (since 2010); Chief Anti-Money Laundering Compliance Officer of certain mutual funds associated with Legg Mason & Co. or its affiliates (since 2013) and Anti-Money Laundering Compliance Officer of LMIS (since 2012); Senior Compliance Officer of LMIS (since 2011); formerly, AML Consultant, DTCC (2010); AML Consultant, Rabobank Netherlands, (2009); First Vice President, Director of Marketing & Advertising Compliance and Manager of Communications Review Group at Citigroup Inc. (1996 to 2008) |
| | |
| 42 | | ClearBridge Small Cap Fund |
| | |
| Executive Officers cont’d |
Jenna Bailey Legg Mason 100 First Stamford Place, 6th Floor, Stamford, CT 06902 | | |
| Year of birth | | 1978 |
| Position(s) with Trust | | Identity Theft Prevention Officer |
| Term of office1 and length of time served2 | | Since 2015 |
| Principal occupation(s) during past five years | | Identity Theft Prevention Officer of certain mutual funds associated with Legg Mason & Co. or its affiliates (since 2015); Compliance Officer of Legg Mason & Co. (since 2013); Assistant Vice President of Legg Mason & Co. (since 2011); formerly, Associate Compliance Officer of Legg Mason & Co. (2011 to 2013); Risk Manager of U.S. Distribution of Legg Mason & Co. (2007 to 2011). |
Jeanne M. Kelly Legg Mason 620 Eighth Avenue, 49th Floor, New York, NY 10018 | | |
| Year of birth | | 1951 |
| Position(s) with Trust | | Senior Vice President |
| Term of office1 and length of time served2 | | Since 2007 |
| Principal occupation(s) during past five years | | Senior Vice President of certain mutual funds associated with Legg Mason & Co. or its affiliates (since 2007); Senior Vice President of LMPFA (since 2006); President and Chief Executive Officer of LMAS and LMFAM (since 2015); Managing Director of Legg Mason & Co. (since 2005) and Legg Mason & Co. predecessors (prior to 2005); formerly, Senior Vice President of LMFAM (2013 to 2015) |
| † | Trustees who are not “interested persons” of the Fund within the meaning of Section 2(a)(19) of the Investment Company Act of 1940, as amended (the “1940 Act”). Each of the Independent Trustees serves on the standing committees of the Board of Trustees, which include the Audit Committee (chair: Arthur S. Mehlman), the Nominating Committee (co-chairs: G. Peter O’Brien and Jill E. McGovern), and the Independent Trustees Committee (chair: Arnold L. Lehman). |
| 1 | Each Trustee and officer serves until his or her respective successor has been duly elected and qualified or until his or her earlier death, resignation, retirement or removal. |
| 2 | Indicates the earliest year in which the Trustee became a board member for a fund in the Legg Mason fund complex or the officer took such office. |
| 3 | Ms. Trust is an “interested person” of the Fund, as defined in the 1940 Act, because of her position with LMPFA and/or certain of its affiliates. |
| | |
| ClearBridge Small Cap Fund | | 43 |
Important tax information (unaudited)
The following information is provided with respect to the distributions paid during the taxable year ended October 31, 2016:
| | | | |
| Record date: | | | 12/8/2015 | |
| Payable date: | | | 12/9/2015 | |
| Ordinary income: | | | | |
Qualified dividend income for individuals | | | 45.22 | % |
Dividends qualifying for the dividends | | | | |
received deduction for corporations | | | 39.11 | % |
| Qualified short-capital gain dividend* | | $ | 0.597914 | |
| Long-term capital gain dividend | | $ | 1.078896 | |
| * | Represents the ordinary income distribution that is eligible for exemption from U.S. witholding tax for non resident aliens and foreign corporations. |
Please retain this information for your records.
| | |
| 44 | | ClearBridge Small Cap Fund |
ClearBridge
Small Cap Fund
Trustees
Ruby P. Hearn
Arnold L. Lehman
Chairman
Robin J.W. Masters
Jill E. McGovern
Arthur S. Mehlman
G. Peter O’Brien
S. Ford Rowan
Robert M. Tarola
Jane Trust
Investment manager/adviser
ClearBridge, LLC
Distributor
Legg Mason Investor Services, LLC
Custodian
State Street Bank & Trust Company
Transfer agent
BNY Mellon Investment Servicing (US) Inc.
4400 Computer Drive
Westborough, MA 01581
Independent registered public accounting firm
PricewaterhouseCoopers LLP
Baltimore, MD
ClearBridge Small Cap Fund
The Fund is a separate series of Legg Mason Global Asset Management Trust, a Maryland statutory trust.
ClearBridge Small Cap Fund
Legg Mason Funds
620 Eighth Avenue, 49th Floor
New York, NY 10018
The Fund files its complete schedule of portfolio holdings with the Securities and Exchange Commission (“SEC”) for the first and third quarters of each fiscal year on Form N-Q. The Fund’s Forms N-Q are available on the SEC’s website at www.sec.gov. The Fund’s Forms N-Q may be reviewed and copied at the SEC’s Public Reference Room in Washington, D.C., and information on the operation of the Public Reference Room may be obtained by calling 1-800-SEC-0330. To obtain information on Form N-Q, shareholders can call the Fund at 1-877-721-1926.
Information on how the Fund voted proxies relating to portfolio securities during the prior 12-month period ended June 30th of each year and a description of the policies and procedures that the Fund uses to determine how to vote proxies related to portfolio transactions are available (1) without charge, upon request, by calling the Fund at 1-877-721-1926, (2) at www.leggmason.com/mutualfunds and (3) on the SEC’s website at www.sec.gov.
This report is submitted for the general information of the shareholders of ClearBridge Small Cap Fund. This report is not authorized for distribution to prospective investors in the Fund unless preceded or accompanied by a current prospectus.
Investors should consider the Fund’s investment objectives, risks, charges and expenses carefully before investing. The prospectus contains this and other important information about the Fund. Please read the prospectus carefully before investing.
www.leggmason.com
© 2016 Legg Mason Investor Services, LLC
Member FINRA, SIPC
Legg Mason Funds Privacy and Security Notice
Your Privacy and the Security of Your Personal Information is Very Important to the Legg Mason Funds
This Privacy and Security Notice (the “Privacy Notice”) addresses the Legg Mason Funds’ privacy and data protection practices with respect to nonpublic personal information the Funds receive. The Legg Mason Funds include any funds sold by the Funds’ distributor, Legg Mason Investor Services, LLC, as well as Legg Mason-sponsored closed-end funds and certain closed-end funds managed or sub-advised by Legg Mason or its affiliates. The provisions of this Privacy Notice apply to your information both while you are a shareholder and after you are no longer invested with the Funds.
The Type of Nonpublic Personal Information the Funds Collect About You
The Funds collect and maintain nonpublic personal information about you in connection with your shareholder account. Such information may include, but is not limited to:
| • | | Personal information included on applications or other forms; |
| • | | Account balances, transactions, and mutual fund holdings and positions; |
| • | | Online account access user IDs, passwords, security challenge question responses; and |
| • | | Information received from consumer reporting agencies regarding credit history and creditworthiness (such as the amount of an individual’s total debt, payment history, etc.). |
How the Funds Use Nonpublic Personal Information About You
The Funds do not sell or share your nonpublic personal information with third parties or with affiliates for their marketing purposes, or with other financial institutions or affiliates for joint marketing purposes, unless you have authorized the Funds to do so. The Funds do not disclose any nonpublic personal information about you except as may be required to perform transactions or services you have authorized or as permitted or required by law. The Funds may disclose information about you to:
| • | | Employees, agents, and affiliates on a “need to know” basis to enable the Funds to conduct ordinary business or comply with obligations to government regulators; |
| • | | Service providers, including the Funds’ affiliates, who assist the Funds as part of the ordinary course of business (such as printing, mailing services, or processing or servicing your account with us) or otherwise perform services on the Funds’ behalf, including companies that may perform marketing services solely for the Funds; |
| • | | The Funds’ representatives such as legal counsel, accountants and auditors; and |
| • | | Fiduciaries or representatives acting on your behalf, such as an IRA custodian or trustee of a grantor trust. |
|
| NOT PART OF THE ANNUAL REPORT |
Legg Mason Funds Privacy and Security Notice (cont’d)
Except as otherwise permitted by applicable law, companies acting on the Funds’ behalf are contractually obligated to keep nonpublic personal information the Funds provide to them confidential and to use the information the Funds share only to provide the services the Funds ask them to perform.
The Funds may disclose nonpublic personal information about you when necessary to enforce their rights or protect against fraud, or as permitted or required by applicable law, such as in connection with a law enforcement or regulatory request, subpoena, or similar legal process. In the event of a corporate action or in the event a Fund service provider changes, the Funds may be required to disclose your nonpublic personal information to third parties. While it is the Funds’ practice to obtain protections for disclosed information in these types of transactions, the Funds cannot guarantee their privacy policy will remain unchanged.
Keeping You Informed of the Funds’ Privacy and Security Practices
The Funds will notify you annually of their privacy policy as required by federal law. While the Funds reserve the right to modify this policy at any time they will notify you promptly if this privacy policy changes.
The Funds’ Security Practices
The Funds maintain appropriate physical, electronic and procedural safeguards designed to guard your nonpublic personal information. The Funds’ internal data security policies restrict access to your nonpublic personal information to authorized employees, who may use your nonpublic personal information for Fund business purposes only.
Although the Funds strive to protect your nonpublic personal information, they cannot ensure or warrant the security of any information you provide or transmit to them, and you do so at your own risk. In the event of a breach of the confidentiality or security of your nonpublic personal information, the Funds will attempt to notify you as necessary so you can take appropriate protective steps. If you have consented to the Funds using electronic communications or electronic delivery of statements, they may notify you under such circumstances using the most current email address you have on record with them.
In order for the Funds to provide effective service to you, keeping your account information accurate is very important. If you believe that your account information is incomplete, not accurate or not current, or if you have questions about the Funds’ privacy practices, write the Funds using the contact information on your account statements, email the Funds by clicking on the Contact Us section of the Funds’ website at www.leggmason.com, or contact the Fund at 1-877-721-1926.
|
| NOT PART OF THE ANNUAL REPORT |
www.leggmason.com
© 2016 Legg Mason Investor Services, LLC Member FINRA, SIPC
LMF-285/A 12/16 SR16-2939
The registrant has adopted a code of ethics that applies to the registrant’s principal executive officer, principal financial officer, principal accounting officer or controller.
| ITEM 3. | AUDIT COMMITTEE FINANCIAL EXPERT. |
The Board of Trustees of the registrant has determined that Arthur S. Mehlman the Chairman of the Board’s Audit Committee and Robert M. Tarola, possess the technical attributes identified in Instruction 2(b) of Item 3 to Form N- to qualify as “audit committee financial experts,” and have designated Mr. Mehlman and Mr. Tarola CSR as the Audit Committee’s financial experts. Mr. Mehlman and Mr. Tarola are “independent” Trustees pursuant to paragraph (a) (2) of Item 3 to Form N-CSR.
| ITEM 4. | PRINCIPAL ACCOUNTANT FEES AND SERVICES. |
a) Audit Fees. The aggregate fees billed in the last two fiscal years ending October 31, 2015 and October 31, 2016 (the “Reporting Periods”) for professional services rendered by the Registrant’s principal accountant (the “Auditor”) for the audit of the Registrant’s annual financial statements, or services that are normally provided by the Auditor in connection with the statutory and regulatory filings or engagements for the Reporting Periods, were $268,854 in 2015 and $164,788 in 2016.
b) Audit-Related Fees. The aggregate fees billed in the Reporting Period for assurance and related services by the Auditor that are reasonably related to the performance of the Registrant’s financial statements were $0 in October 31, 2015 and $0 in October 31, 2016.
(c) Tax Fees. The aggregate fees billed in the Reporting Periods for professional services rendered by the Auditor for tax compliance, tax advice and tax planning (“Tax Services”) were $56,048 in October 31, 2015 and $81,401 in October 31, 2016. These services consisted of (i) review or preparation of U.S. federal, state, local and excise tax returns; (ii) U.S. federal, state and local tax planning, advice and assistance regarding statutory, regulatory or administrative developments, and (iii) tax advice regarding tax qualification matters and/or treatment of various financial instruments held or proposed to be acquired or held.
There were no fees billed for tax services by the service affiliates during the Reporting Periods that required pre-approval by the Audit Auditors Committee.
d) All Other Fees. The aggregate fees for other fees billed in the Reporting Periods for products and services provided by the Auditor were $3,234 in October 31, 2015 and $2,369 in October 31, 2016, other than the services reported in paragraphs (a) through (c) of this item for the Legg Mason Global Asset Management Trust.
All Other Fees. There were no other non-audit services rendered by the Auditor to Legg Mason Partners Fund Advisors, LLC (“LMPFA”), and any entity controlling, controlled by or under common control with LMPFA that provided ongoing services to Legg Mason Global Asset Management Trust requiring pre-approval by the Audit Committee in the Reporting Period.
(e) Audit Committee’s pre–approval policies and procedures described in paragraph (c)
(7) of Rule 2-01 of Regulation S-X.
(1) The Charter for the Audit Committee (the “Committee”) of the Board of each registered investment company (the “Fund”) advised by LMPFA or one of their affiliates (each, an “Adviser”) requires that the Committee shall approve (a) all audit and permissible non-audit services to be provided to the Fund and (b) all permissible non-audit services to be provided by the Fund’s independent auditors to the Adviser and any Covered Service Providers if the engagement relates directly to the operations and financial reporting of the Fund. The Committee may implement policies and procedures by which such services are approved other than by the full Committee.
The Committee shall not approve non-audit services that the Committee believes may impair the independence of the auditors. As of the date of the approval of this Audit Committee Charter, permissible non-audit services include any professional services (including tax services), that are not prohibited services as described below, provided to the Fund by the independent auditors, other than those provided to the Fund in connection with an audit or a review of the financial statements of the Fund. Permissible non-audit services may not include: (i) bookkeeping or other services related to the accounting records or financial statements of the Fund; (ii) financial information systems design and implementation; (iii) appraisal or valuation services, fairness opinions or contribution-in-kind reports; (iv) actuarial services; (v) internal audit outsourcing services; (vi) management functions or human resources; (vii) broker or dealer, investment adviser or investment banking services; (viii) legal services and expert services unrelated to the audit; and (ix) any other service the Public Company Accounting Oversight Board determines, by regulation, is impermissible.
Pre-approval by the Committee of any permissible non-audit services is not required so long as: (i) the aggregate amount of all such permissible non-audit services provided to the Fund, the Adviser and any service providers controlling, controlled by or under common control with the Adviser that provide ongoing services to the Fund (“Covered Service Providers”) constitutes not more than 5% of the total amount of revenues paid to the independent auditors during the fiscal year in which the permissible non-audit services are provided to (a) the Fund, (b) the Adviser and (c) any entity controlling, controlled by or under common control with the Adviser that provides ongoing services to the Fund during the fiscal year in which the services are provided that would have to be approved by the Committee; (ii) the permissible non-audit services were not recognized by the Fund at the time of the engagement to be non-audit services; and (iii) such services are promptly brought to the attention of the Committee and approved by the Committee (or its delegate(s)) prior to the completion of the audit.
(2) For the Legg Mason Global Asset Management Trust, the percentage of fees that were approved by the audit committee, with respect to: Audit-Related Fees were 100% and 100% for October 31, 2015 and October 31, 2016; Tax Fees were 100% and 100% for October 31, 2015 and October 31, 2016; and Other Fees were 100% and 100% for October 31, 2015 and October 31, 2016.
(f) N/A
(g) Non-audit fees billed by the Auditor for services rendered to Legg Mason Global Asset Management Trust, LMPFA and any entity controlling, controlled by, or under common control with LMPFA that provides ongoing services to Legg Mason Global Asset Management Trust during the reporting period were $330,948 in October 31, 2015 and $217,714 in October 31, 2016.
(h) Yes. Legg Mason Global Asset Management Trust’s Audit Committee has considered whether the provision of non-audit services that were rendered to Service Affiliates, which were not pre-approved (not requiring pre-approval), is compatible with maintaining the Accountant’s independence. All services provided by the Auditor to the Legg Mason Global Asset Management Trust or to Service Affiliates, which were required to be pre-approved, were pre-approved as required.
| ITEM 5. | AUDIT COMMITTEE OF LISTED REGISTRANTS. |
| | a) | The independent board members are acting as the registrant’s audit committee as specified in Section 3(a)(58)(B)
of the Exchange Act . The Audit Committee consists of the following Board members: |
Ruby P. Hearn
Arnold L. Lehman
Robin J.W. Masters
Jill E. McGovern
Arthur S. Mehlman
G. Peter O’Brien
S. Ford Rowan
Robert M. Tarola
| ITEM 6. | SCHEDULE OF INVESTMENTS. |
Included herein under Item 1.
| ITEM 7. | DISCLOSURE OF PROXY VOTING POLICIES AND PROCEDURES FOR CLOSED-END MANAGEMENT INVESTMENT COMPANIES. |
Not applicable.
| ITEM 8. | PORTFOLIO MANAGERS OF CLOSED-END MANAGEMENT INVESTMENT COMPANIES. |
Not applicable.
| ITEM 9. | PURCHASES OF EQUITY SECURITIES BY CLOSED-END MANAGEMENT INVESTMENT COMPANY AND AFFILIATED PURCHASERS. |
Not applicable.
| ITEM 10. | SUBMISSION OF MATTERS TO A VOTE OF SECURITY HOLDERS. |
Not applicable.
| ITEM 11. | CONTROLS AND PROCEDURES. |
| | (a) | The registrant’s principal executive officer and principal financial officer have concluded that the registrant’s disclosure controls and procedures (as defined in Rule 30a- 3(c) under the Investment Company Act of 1940, as amended (the “1940 Act”)) are effective as of a date within 90 days of the filing date of this report that includes the disclosure required by this paragraph, based on their evaluation of the disclosure controls and procedures required by Rule 30a-3(b) under the 1940 Act and 15d-15(b) under the Securities Exchange Act of 1934. |
| | (b) | There were no changes in the registrant’s internal control over financial reporting (as defined in Rule 30a-3(d) under the 1940 Act) that occurred during the second fiscal quarter of the period covered by this report that have materially affected, or are likely to materially affect the registrant’s internal control over financial reporting. |
(a) (1) Code of Ethics attached hereto.
Exhibit 99.CODE ETH
(a) (2) Certifications pursuant to section 302 of the Sarbanes-Oxley Act of 2002 attached hereto.
Exhibit 99.CERT
(b) Certifications pursuant to Section 906 of the Sarbanes-Oxley Act of 2002 attached hereto.
Exhibit 99.906CERT
SIGNATURES
Pursuant to the requirements of the Securities Exchange Act of 1934 and the Investment Company Act of 1940, the registrant has duly caused this Report to be signed on its behalf by the undersigned, there unto duly authorized.
Legg Mason Global Asset Management Trust
| | |
| By: | | /s/ Jane Trust |
| | Jane Trust |
| | Chief Executive Officer |
| |
| Date: | | December 27, 2016 |
Pursuant to the requirements of the Securities Exchange Act of 1934 and the Investment Company Act of 1940, this report has been signed below by the following persons on behalf of the registrant and in the capacities and on the dates indicated.
| | |
| By: | | /s/ Jane Trust |
| | Jane Trust |
| | Chief Executive Officer |
| |
| Date: | | December 27, 2016 |
| |
| By: | | /s/ Richard F. Sennett |
| | Richard F. Sennett |
| | Principal Financial Officer |
| |
| Date: | | December 27, 2016 |