UNITED STATES
SECURITIES AND EXCHANGE COMMISSION
Washington, D.C. 20549
FORM N-CSR
CERTIFIED SHAREHOLDER REPORT OF REGISTERED
MANAGEMENT INVESTMENT COMPANIES
Investment Company Act file number 811-22338
Legg Mason Global Asset Management Trust
(Exact name of registrant as specified in charter)
620 Eighth Avenue, 49th Floor, New York, NY 10018
(Address of principal executive offices) (Zip code)
Robert I. Frenkel, Esq.
Legg Mason & Co., LLC
100 First Stamford Place
Stamford, CT 06902
(Name and address of agent for service)
Registrant’s telephone number, including area code: 1-877-721-1926
Date of fiscal year end: October 31
Date of reporting period: October 31, 2016
| ITEM 1. | REPORT TO STOCKHOLDERS |
The Annual Report to Stockholders is filed herewith.

| | |
| Annual Report | | October 31, 2016 |
LEGG MASON BW
ALTERNATIVE CREDIT FUND
|
| INVESTMENT PRODUCTS: NOT FDIC INSURED • NO BANK GUARANTEE • MAY LOSE VALUE |
Fund objective
The Fund’s objective is to provide positive returns independent of market cycles through a high level of income and capital appreciation.
Letter from the president

Dear Shareholder,
We are pleased to provide the annual report of Legg Mason BW Alternative Credit Fund for the twelve-month reporting period ended October 31, 2016. Please read on for a detailed look at prevailing economic and market conditions during the Fund’s reporting period and to learn how those conditions have affected Fund performance.
As always, we remain committed to providing you with excellent service and a full spectrum of investment choices. We also remain committed to supplementing the support you receive from your financial advisor. One way we accomplish this is through our website, www.leggmason.com. Here you can gain immediate access to market and investment information, including:
| • | | Fund prices and performance, |
| • | | Market insights and commentaries from our portfolio managers, and |
| • | | A host of educational resources. |
We look forward to helping you meet your financial goals.
Sincerely,

Jane Trust, CFA
President and Chief Executive Officer
November 30, 2016
| | |
| II | | Legg Mason BW Alternative Credit Fund |
Investment commentary
Economic review
The pace of U.S. economic activity fluctuated during the twelve months ended October 31, 2016 (the “reporting period”). Looking back, the U.S. Department of Commerce reported that fourth quarter 2015 U.S. gross domestic product (“GDP”)i growth was 0.9%. First and second quarter 2016 GDP growth was 0.8% and 1.4%, respectively. The U.S. Department of Commerce’s second reading for third quarter 2016 GDP growth — released after the reporting period ended — was 3.2%. The improvement in GDP growth in the third quarter 2016 reflected an increase in private inventory investment, an acceleration in exports, an upturn in federal government spending and smaller decreases in state and local government spending.
While there was a pocket of weakness in May 2016, job growth in the U.S. was solid overall and a tailwind for the economy during the reporting period. When the period ended on October 31, 2016, the unemployment rate was 4.9%, as reported by the U.S. Department of Labor. The percentage of longer-term unemployed modestly declined over the period. In October 2016, 25.2% of Americans looking for a job had been out of work for more than six months, versus 25.7% when the period began.
Turning to the global economy, in its October 2016 World Economic Outlook Update, the International Monetary Fund (“IMF”)ii said, “The forces shaping the global outlook — both those operating over the short term and those operating over the long term — point to subdued growth for 2016 and a gradual recovery thereafter, as well as to downside risks.” From a regional perspective, the IMF currently estimates 2016 growth in the Eurozone will be 1.7%, versus 2.0% in 2015. Japan’s economy is expected to expand 0.5% in 2016, the same as in 2015. Elsewhere, the IMF projects that overall growth in emerging market countries will tick up to 4.2% in 2016, versus 4.0% in 2015.
After an extended period of maintaining the federal funds rateiii at a historically low range between zero and 0.25%, the Federal Reserve Board (the “Fed”)iv increased the rate at its meeting on December 16, 2015. This marked the first rate hike since 2006. In particular, the U.S. central bank raised the federal funds rate to a range between 0.25% and 0.50%. At its meeting that concluded on November 2, 2016 (after the reporting period ended), as well as during the prior meetings of the year, the Fed kept rates on hold. In the Fed’s statement after the November meeting it said, “The Committee judges that the case for an increase in the federal funds rate has continued to strengthen but decided, for the time being, to wait for some further evidence of continued progress toward its objectives. The stance of monetary policy remains accommodative, thereby supporting further improvement in labor market conditions and a return to 2 percent inflation.”
Given the economic challenges in the Eurozone, the European Central Bank (“ECB”)v took a number of actions to stimulate growth and ward off deflation. In January 2015, before the reporting period began, the ECB announced that, beginning in March 2015, it would start a €60 billion-per-month bond buying program that was expected to run until September 2016. In December 2015, the ECB extended its monthly bond buying program until at least March 2017. Finally, in March 2016, the ECB announced that it would increase its bond purchasing
| | |
| Legg Mason BW Alternative Credit Fund | | III |
Investment commentary (cont’d)
program to €80 billion-per-month. It also lowered its deposit rate to -0.4% and its main interest rate to 0%. Looking at other developed countries, in the aftermath of the June 2016 U.K. referendum to leave the European Union (“Brexit”), the Bank of England (“BoE”)vi lowered rates in October 2016 from 0.50% to 0.25% — an all-time low. After holding rates steady at 0.10% for more than five years, in January 2016, the Bank of Japanvii announced that it lowered the rate on current accounts that commercial banks hold with it to -0.10%. Elsewhere, the People’s Bank of Chinaviii kept rates steady at 4.35%.
As always, thank you for your confidence in our stewardship of your assets.
Sincerely,
Jane Trust, CFA
President and Chief Executive Officer
November 30, 2016
All investments are subject to risk including the possible loss of principal. Past performance is no guarantee of future results. Forecasts and predictions are inherently limited and should not be relied upon as an indication of actual or future performance.
| i | Gross domestic product (“GDP”) is the market value of all final goods and services produced within a country in a given period of time. |
| ii | The International Monetary Fund (“IMF”) is an organization of 189 countries, working to foster global monetary cooperation, secure financial stability, facilitate international trade, promote high employment and sustainable economic growth, and reduce poverty around the world. |
| iii | The federal funds rate is the rate charged by one depository institution on an overnight sale of immediately available funds (balances at the Federal Reserve) to another depository institution; the rate may vary from depository institution to depository institution and from day to day. |
| iv | The Federal Reserve Board (the “Fed”) is responsible for the formulation of U.S. policies designed to promote economic growth, full employment, stable prices and a sustainable pattern of international trade and payments. |
| v | The European Central Bank (“ECB”) is responsible for the monetary system of the European Union and the euro currency. |
| vi | The Bank of England (“BoE”), formally the Governor and Company of the BoE, is the central bank of the United Kingdom. The BoE’s purpose is to maintain monetary and financial stability. |
| vii | The Bank of Japan is the central bank of Japan. The bank is responsible for issuing and handling currency and treasury securities, implementing monetary policy, maintaining the stability of the Japanese financial system and the yen currency. |
| viii | The People’s Bank of China (“PBoC”) is the central bank of the People’s Republic of China with the power to carry out monetary policy and regulate financial institutions in mainland China. |
| | |
| IV | | Legg Mason BW Alternative Credit Fund |
Fund overview
Q. What is the Fund’s investment strategy?
A. The Fund seeks to provide positive returns independent of market cycles through a high level of income and capital appreciation. Under normal circumstances, the Fund seeks to achieve its investment objective taking a flexible, long and short global credit approach. The Fund will rotate amongst the global credit opportunities (long or short) that we, at Brandywine Global Investment Management, LLC (“Brandywine”), the Fund’s subadviser, find most attractive and navigate the credit quality spectrum throughout the different phases of the business cycle. The Fund also has the flexibility to hedge or increase exposure to certain risks based on Brandywine’s macroeconomic views. The Fund expects to trade actively.
The Fund may invest in securities, derivatives and other financial instruments of issuers located anywhere in the world. The Fund may focus a significant portion of its investments in a single country or currency and may change a country or currency focus at any time based on the opportunities we find most attractive. In selecting investment opportunities, we may consider whether the security is denominated in a currency that we expect to appreciate versus the U.S. dollar.
The Fund may hold debt securities of any credit quality, whether rated or unrated. As a general guideline, the Fund over the long term normally will average at least 50% of its total assets in high yield securities (commonly known as “junk bonds”); however, this allocation may range from 0%-100% at any time. High yield bonds are those rated below investment grade (that is, securities rated below the Baa/BBB categories by at least one Nationally Recognized Statistical Rating Organization) or, if unrated, that we determined to be of comparable credit quality. The Fund’s investments may be rated either below investment grade or investment grade and may include, but are not limited to: corporate bonds; sovereign or government debt securities, including U.S. municipal securities; debt of supranational agencies; convertible securities; agency and non-agency mortgage-backed securities; asset-backed securities; bank loans; common and preferred stock; and currencies.
The Fund may invest a significant portion of its investments in certain types of investments, including agency and non-agency mortgage-backed securities. The Fund may invest in stripped mortgage-backed securities and other stripped securities. The Fund may enter into dollar rolls (sometimes referred to as mortgage dollar rolls). The Fund may hold instruments of any maturity or durationi, and the securities may have fixed, floating or variable rates of interest. The weighted average effective durationii of the Fund’s portfolio, including derivatives, is expected to range from -10 to 10 years. The Fund may invest in the equities of issuers of any market capitalization. It will not invest more than 20% of its total assets in equity securities.
The Fund may also enter into various derivative transactions for both hedging and non-hedging purposes, including as a substitute for buying or selling securities, for purposes of enhancing returns, which transactions may be regarded as speculative. These derivative transactions include, but are not limited to, forwards, futures, options, swaps, credit default swaps and commodity-linked investments. Further, the Fund may establish short positions, mainly
| | |
| Legg Mason BW Alternative Credit Fund 2016 Annual Report | | 1 |
Fund overview (cont’d)
through, but not limited to derivatives, to a substantial degree. Derivatives will not be used in a way that would cause the Fund to violate its investment guidelines, but there are no other percentage limits on the use of derivatives. The Fund may use one or more types of these instruments without limit. The Fund will not be leveraged through borrowing. However, certain types of derivatives have a leverage-like effect on the portfolio, in that they require a relatively small premium or margin payment in relation to the size of the investment exposure the Fund acquires.
Q. What were the overall market conditions during the Fund’s reporting period?
A. Exogenous geopolitical and global macroeconomic factors drove credit market performance during the twelve-month reporting period ended October 31, 2016, rather than a singular credit event. Investor uncertainty played a significant role throughout the performance period. The Federal Reserve Board (the “Fed”)iii liftoff in December 2015 gave floating-rate securities in the U.S. a temporary boost, however, the broader U.S. high yield credit market was hit particularly hard as energy prices resumed their decline. Questions surrounding China’s economic viability also weighed heavily on market conditions — the aftershocks of fragile Chinese growth continued to resurface in early 2016, and negatively impacted commodity-exporting emerging markets. These domestic issues had far-reaching consequences that reverberated throughout global capital markets. Equities, credit markets, and emerging market assets bore the brunt of this era of uncertainty. We had expected the global economy to reflate in 2015 and instead, the combination of a strong dollar and weak Chinese growth created a global disinflationary environment at a time when many developed market central banks already could not reach their respective inflation targets. During this period of volatility, both European and U.S. mortgage-backed securities (“MBS”) outperformed other credit sectors.
Despite a volatile January 2016, the first two quarters of 2016 were relatively placid from a volatility perspective as the Fed, the European Central Bank (“ECB”)iv and the People’s Bank of China (“PBoC”)v met before the G-20vi summit in Shanghai to coordinate a policy response to the appreciating U.S. dollar. As the dollar stabilized, risk assets globally responded positively for most of the first and second quarters of 2016. Securitized debt markets in the U.S. and Europe also enjoyed a moderate rally during this period. European credit received a boost after the ECB announced the expansion of its quantitative easing program, which included cutting its key policy rate, introducing more long-term refinancing, and expanding its purchase program to include non-financial investment grade corporate debt beginning in June 2016. The ECB’s decision drove record investment grade corporate issuance and forced investors to focus on cross-over credit along with higher-quality European high yield. In light of the unprecedented amount of global bonds in low- or negative-yielding territory at the time, we were not surprised to see record inflows coming into these European sectors during the second quarter of 2016.
However, the second calendar quarter ended in a watershed moment, when the U.K. populace voted to exit the European Union, an event colloquially known as “Brexit.” The referendum results sent the British pound
| | |
| 2 | | Legg Mason BW Alternative Credit Fund 2016 Annual Report |
sterling to multi-decade lows while ultra-high quality yields plummeted — longer-term German Bund and Japanese Government Bond (“JGB”) yields fell deeper into negative territory. These wild swings in investor sentiment ultimately drove safe-haven valuations higher, while risk assets sold off sharply in the days and weeks immediately following the referendum. After market volatility tapered off in the first few weeks of the third quarter of 2016, risk assets rallied given a benign macroeconomic environment supported by stabilized growth in China, and a continuation of accommodative monetary policy from developed market central banks. Eurozone bonds — from both core and peripheral countries — rallied during the third quarter as both regional and national current-account surpluses grew. The ECB left rates and stimulus measures unchanged given the optimism regarding the Eurozone’s growth prospects, although future easing has not been ruled out. European financials may have suffered from the negative rate environment, but we believe they will be more resilient with higher capital requirements and a more stringent regulatory environment following the financial crisis. As for emerging market assets, sovereign bonds and currencies reflected improving country fundamentals, investor optimism, and stability in underlying commodity prices — the Indonesian rupiah and the country’s government bonds illustrate the emerging market rally. While the rally in Brazilian assets lost some momentum during the quarter, the real was up considerably for the year at 21% versus the U.S. dollar. Some developed market currencies also rose against the U.S. dollar, including the Australian and New Zealand dollars.
Global credit markets have been the net beneficiaries of investors’ search for yield, global central bank easing, and stabilizing commodity prices. Although markets welcomed the decision by the Organization of Petroleum Exporting Countries (“OPEC”) to cut oil production, it remains to be seen how the cut will be allocated and whether it is too small. Since the Fed did not tighten in September 2016, investors will instead look to its December 2016 meeting, particularly if the monthly U.S. jobs reports remain strong. However, market volatility leading up to the U.S. presidential election and the uncertainty overhang of the vote could give the Fed pause for tightening.
Q. How did we respond to these changing market conditions?
A. The allocation to residential mortgage-backed securities (“RMBS”) was the Fund’s largest position throughout the reporting period. We continued to rotate out of European RMBS and into U.S. housing securities throughout the reporting period, as we believed the U.S. market offered higher yields backed by solid fundamentals. Our outlook for U.S. real estate remained positive and therefore we allocated across several related sectors, including commercial mortgage-backed securities (“CMBS”), and synthetic U.S. CMBS indices. Prior to the Brexit referendum, we were also positive on European RMBS, an exposure that had performed well leading up to the vote. These securities sold off along with other credit assets after the U.K. vote, but managed to recover some of the spread widening. We remain mindful of the unforeseen political risks unleashed by the Brexit vote and have pared down our European RMBS positions accordingly. We believe the euro may come under additional pressure and therefore we transitioned from a partial currency hedge to a net short position during the reporting period. Conversely, we
| | |
| Legg Mason BW Alternative Credit Fund 2016 Annual Report | | 3 |
Fund overview (cont’d)
removed the currency hedge on the British pound sterling and put a small long position in the currency following the June 2016 referendum. We believe the pound’s massive sell-off in June 2016 created an additional investment opportunity for us. The pound sterling hit a 30-year low following the referendum, while the British economy remained largely intact, and the Bank of Englandvii resumed easing a couple of months later. As a result, we believe sterling is now attractively valued. Elsewhere in developed markets, the Fund started off the reporting period by hedging New Zealand dollar exposure and gradually exited the position. We believe the New Zealand economy needs to reflate, the currency needs to weaken, and the government needs to address the country’s growing real estate bubble.
The Fund’s exposure to emerging markets was the second largest allocation, via a mix of sovereign bonds and corporate credit in countries like Argentina, Brazil, and Indonesia — although we held both local- and hard-currency debt. We believed select opportunities in these countries were attractive based on nominal yields and improving fundamentals. For example, the Brazilian real and the country’s government bonds rallied after hitting all-time lows in 2015. Brazilian assets exemplify our idea that emerging market currencies could strengthen against the U.S. dollar, and that countries with improving fundamentals would attract fixed income investors. Brazil managed to move beyond a budget impasse and political scandal; these problems were only compounded by commodity price volatility last year. The Fund maintained unhedged exposure to the Mexican peso, and exited the position by the end of the reporting period.
Given the era of uncertainty, the Fund held several defensive positions as a hedge against global market volatility and economic slowdown. We maintained an overarching position in U.S. Treasury futures to balance the long emerging market exposure within the Fund, as deflationary pressures affected risk assets. We significantly reduced the Fund’s duration in the third quarter of 2016 by selling higher-quality sovereign bonds. The Fund also held long credit default swap (“CDS”) protection. We adjusted this CDS protection throughout the reporting period given the ebb and flow of investor risk aversion.
Performance review
For the twelve months ended October 31, 2016, Class IS shares of Legg Mason BW Alternative Credit Fund returned 4.27%. The Fund’s unmanaged benchmarks, the Citigroup 3-Month U.S. Treasury Bill Indexviii and the Bloomberg Barclays Global High Yield Indexix, returned 0.22% and 9.83%, respectively, for the same period. The Lipper Alternative Credit Focus Funds Category Average1 returned 3.39% over the same time frame.
| 1 | Lipper, Inc., a wholly-owned subsidiary of Reuters, provides independent insight on global collective investments. Returns are based on the period ended October 31, 2016, including the reinvestment of all distributions, including returns of capital, if any, calculated among the 279 funds for the twelve-month period in the Fund’s Lipper category, and excluding sales charges, if any. |
| | |
| 4 | | Legg Mason BW Alternative Credit Fund 2016 Annual Report |
| | | | | | | | |
Performance Snapshot as of October 31, 2016
(unaudited) | |
| (excluding sales charges) | | 6 months | | | 12 months | |
Legg Mason BW Alternative
Credit Fund: | | | | | | | | |
Class A | | | 4.26 | % | | | 3.85 | % |
Class C | | | 3.94 | % | | | 3.15 | % |
Class FI | | | 4.26 | % | | | 3.83 | % |
Class I | | | 4.47 | % | | | 4.22 | % |
Class IS | | | 4.46 | % | | | 4.27 | % |
Citigroup 3-Month U.S. Treasury
Bill Index | | | 0.14 | % | | | 0.22 | % |
Bloomberg Barclays Global High
Yield Index | | | 5.97 | % | | | 9.83 | % |
Lipper Alternative Credit Focus Funds
Category Average1 | | | 3.26 | % | | | 3.39 | % |
The performance shown represents past performance. Past performance is no guarantee of future results and current performance may be higher or lower than the performance shown above. Principal value, investment returns and yields will fluctuate and investors’ shares, when redeemed, may be worth more or less than their original cost. To obtain performance data current to the most recent month-end, please visit our website at www.leggmason.com/mutualfunds.
All share class returns assume the reinvestment of all distributions, including returns of capital, at net asset value and the deduction of all Fund expenses. Returns have not been adjusted to include sales charges that may apply or the deduction of taxes that a shareholder would pay on Fund distributions. If sales charges were reflected, the performance quoted would have been lower. Performance figures for periods shorter than one year represent cumulative figures and are not annualized.
Fund performance figures reflect fee waivers and/or expense reimbursements, without which the performance would have been lower.
The 30-Day SEC Yields for the period ended October 31, 2016 for Class A, Class C, Class FI, Class I and Class IS shares were 2.25%, 1.65%, 2.37%, 2.66% and 2.76%, respectively. Absent current fee waivers and/or expense reimbursements, the 30-Day SEC Yield for Class IS shares would have been 2.68%. The 30-Day SEC Yield is subject to change and is based on the yield to maturity of the Fund’s investments over a 30-day period and not on the dividends paid by the Fund, which may differ.
The Fund is the successor to an institutional account (the “Predecessor”). On November 29, 2013, the Predecessor transferred its assets to the Fund in exchange for the Fund’s Class IS shares.
|
| Total Annual Operating Expenses (unaudited) |
As of the Fund’s current prospectus dated March 1, 2016, the gross total annual fund operating expense ratios for Class A, Class C, Class FI, Class I and Class IS shares were 1.63%, 2.32%, 1.65%, 1.32% and 1.23%, respectively.
Actual expenses may be higher. For example, expenses may be higher than those shown if average net assets decrease. Net assets are more likely to decrease and Fund expense ratios are more likely to increase when markets are volatile.
Q. What were the leading contributors to performance?
A. Exposure to the U.S. securitized debt markets, including agency CMBS and non-agency RMBS was accretive to
| 1 | Lipper, Inc., a wholly-owned subsidiary of Reuters, provides independent insight on global collective investments. Returns are based on the period ended October 31, 2016, including the reinvestment of all distributions, including returns of capital, if any, calculated among the 303 funds for the six-month period and among the 279 funds for the twelve-month period in the Fund’s Lipper category, and excluding sales charges, if any. |
| | |
| Legg Mason BW Alternative Credit Fund 2016 Annual Report | | 5 |
Fund overview (cont’d)
performance, given the relative strength of the U.S. housing market. A stronger jobs market and a lower-than-expected interest rate environment also bolstered the U.S. real estate market during this timeframe.
The Fund’s derivatives exposures were the greatest contributors to absolute performance for the period under review. Realized gains from European and U.S. CDS, along with U.S. Treasury futures positions all provided a significant benefit to performance. A position in an exchange-traded fund also contributed to performance.
Q. What were the leading detractors from performance?
A. The lower-for-longer rate environment negatively affected the U.S. collateralized loan obligation (“CLO”) market, as floating-rate loans remained in a holding pattern. We expected for bank loans, and therefore CLOs, to benefit from a rising rate environment; however, this position underperformed as the Fed continued to delay its rate hikes in 2016. A futures position in Italian equity markets also detracted from performance. The Fund closed its position in Italian BTPs, the country’s sovereign bonds. This exposure underperformed during the period, although we also took the rise in non-performing loans and the general deterioration within the Italian banking industry into consideration when deciding whether to exit the position. Our position in U.K. MBS detracted from performance; the country’s housing market started to deteriorate following the referendum, as London’s fate as the financial epicenter of the European Union — if not the world — hangs in the balance.
Long exposure to the Mexican peso was also a detractor to relative performance. We also saw signs of improving economic conditions in Mexico, such as the liberalization of its state-controlled oil industry, stabilization of crude oil prices, and the correlation with U.S. economic growth. Despite these positive factors, the Mexican economy’s failure to launch remained an outlier to our emerging market growth thesis. Unhedged exposure to the Mexican peso was a significant detractor from performance. We believe the peso’s weakness can be attributed to short selling and its use by investors to hedge Latin American exposures. The rise in protectionism, the future of multilateral trade agreements, and a general slowdown in global trade have also had deleterious effects on the peso.
Thank you for your investment in Legg Mason BW Alternative Credit Fund. As always, we appreciate that you have chosen us to manage your assets and we remain focused on achieving the Fund’s investment goals.
Sincerely,

Gary P. Herbert, CFA
Portfolio Manager
Brandywine Global Investment Management, LLC

Brian L. Kloss, JD, CPA
Portfolio Manager
Brandywine Global Investment Management, LLC
| | |
| 6 | | Legg Mason BW Alternative Credit Fund 2016 Annual Report |

Regina Borromeo
Portfolio Manager
Brandywine Global Investment Management, LLC

Tracy Chen, CFA, CAIA
Portfolio Manager
Brandywine Global Investment Management, LLC
November 20, 2016
RISKS: Fixed income securities involve interest rate, credit, inflation and reinvestment risks. As interest rates rise, the value of fixed income securities falls. High-yield bonds, known as “junk bonds”, possess greater price volatility, illiquidity and possibility of default than higher-grade bonds. Asset-backed, mortgage-backed or mortgage related securities are subject to prepayment and extension risks. International investments are subject to special risks, including currency fluctuations, as well as social, economic and political uncertainties, which could increase volatility. These risks are magnified in emerging markets. To the extent the Fund focuses its investments in a single country or only a few countries in a particular geographic region, economic, political, regulatory or other conditions affecting such country or region may have a greater impact on fund performance relative to a more geographically diversified fund. Equity securities are subject to market and price fluctuations. The Fund may use derivatives to a significant extent, which could result in substantial losses and greater volatility in the Fund’s net assets. Derivatives, such as options and futures, can be illiquid, may disproportionately increase losses and have a potentially large impact on Fund performance. Potential active and frequent trading may result in higher transaction costs and increased investor liability. The use of leverage may increase volatility and possibility of loss. The Fund is non-diversified and may invest its assets in a limited number of issuers or strategies. The managers’ investment style may become out of favor and/or the managers’ selection process may prove incorrect; which may have a negative impact on the Fund’s performance. Please see the Fund’s prospectus for a more complete discussion of these and other risks, and the Fund’s investment strategies.
All investments are subject to risk including the possible loss of principal. Past performance is no guarantee of future results. All index performance reflects no deduction for fees, expenses or taxes. Please note that an investor cannot invest directly in an index.
The information provided is not intended to be a forecast of future events, a guarantee of future results or investment advice. Views expressed may differ from those of the firm as a whole.
| | |
| Legg Mason BW Alternative Credit Fund 2016 Annual Report | | 7 |
Fund overview (cont’d)
| i | Duration is the measure of the price sensitivity of a fixed-income security to an interest rate change of 100 basis points. Calculation is based on the weighted average of the present values for all cash flows. |
| ii | Effective duration is a duration calculation for bonds with embedded options. Effective duration takes into account that expected cash flows will fluctuate as interest rates change. Please note, duration measures the sensitivity of price (the value of principal) of a fixed-income investment to a change in interest rates. |
| iii | The Federal Reserve Board (the “Fed”) is responsible for the formulation of U.S. policies designed to promote economic growth, full employment, stable prices and a sustainable pattern of international trade and payments. |
| iv | The European Central Bank (“ECB”) is responsible for the monetary system of the European Union and the euro currency. |
| v | The People’s Bank of China (“PBoC”) is the central bank of the People’s Republic of China with the power to carry out monetary policy and regulate financial institutions in mainland China. |
| vi | The Group of Twenty (“G-20”) Finance Ministers and Central Bank Governors was established in 1999 to bring together systemically important industrialized and developing economies to discuss key issues in the global economy. |
| vii | The Bank of England (“BoE”), formally the Governor and Company of the BoE, is the central bank of the United Kingdom. The BoE’s purpose is to maintain monetary and financial stability. |
| viii | The Citigroup 3-Month U.S. Treasury Bill Index is an unmanaged index generally representative of the average yield of 3-month U.S. Treasury bills. |
| ix | The Bloomberg Barclays Global High Yield Index is a multi-currency measure of the global high-yield debt market. The Index represents the union of the U.S. High-Yield, Pan-European High-Yield, U.S. Emerging Markets (EM) Hard Currency High Yield Indices. |
| | |
| 8 | | Legg Mason BW Alternative Credit Fund 2016 Annual Report |
Fund at a glance† (unaudited)
Investment breakdown (%) as a percent of total investments
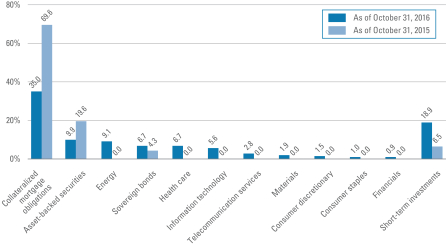
| † | The bar graph above represents the composition of the Fund’s investments as of October 31, 2016 and October 31, 2015 and does not include derivatives, such as forward foreign currency contracts and swap contracts. The Fund is actively managed. As a result, the composition of the Fund’s investments is subject to change at any time. |
| | |
| Legg Mason BW Alternative Credit Fund 2016 Annual Report | | 9 |
Fund expenses (unaudited)
Example
As a shareholder of the Fund, you may incur two types of costs: (1) transaction costs, including front-end and back-end sales charges (loads) on purchase payments; and (2) ongoing costs, including management fees; service and/or distribution (12b-1) fees; and other Fund expenses. This example is intended to help you understand your ongoing costs (in dollars) of investing in the Fund and to compare these costs with the ongoing costs of investing in other mutual funds.
This example is based on an investment of $1,000 invested on May 1, 2016 and held for the six months ended October 31, 2016.
Actual expenses
The table below titled “Based on Actual Total Return” provides information about actual account values and actual expenses. You may use the information provided in this table, together with the amount you invested, to estimate the expenses that you paid over the period. To estimate the expenses you paid on your account, divide your ending account value by $1,000 (for example, an $8,600 ending account value divided by $1,000 = 8.6), then multiply the result by the number under the heading entitled “Expenses Paid During the Period”.
Hypothetical example for comparison purposes
The table below titled “Based on Hypothetical Total Return” provides information about hypothetical account values and hypothetical expenses based on the actual expense ratio and an assumed rate of return of 5.00% per year before expenses, which is not the Fund’s actual return. The hypothetical account values and expenses may not be used to estimate the actual ending account balance or expenses you paid for the period. You may use the information provided in this table to compare the ongoing costs of investing in the Fund and other funds. To do so, compare the 5.00% hypothetical example relating to the Fund with the 5.00% hypothetical examples that appear in the shareholder reports of the other funds.
Please note that the expenses shown in the table below are meant to highlight your ongoing costs only and do not reflect any transactional costs, such as front-end or back-end sales charges (loads). Therefore, the table is useful in comparing ongoing costs only, and will not help you determine the relative total costs of owning different funds. In addition, if these transaction costs were included, your costs would have been higher.
| | | | | | | | | | | | | | | | | | | | | | | | | | | | | | | | | | | | | | | | | | | | | | |
| Based on actual total return1 | | | | | | Based on hypothetical total return1 | |
| | | Actual
Total Return
Without
Sales
Charge2 | | | Beginning
Account
Value | | | Ending
Account
Value | | | Annualized
Expense
Ratio | | | Expenses
Paid
During
the
Period3 | | | | | | | | Hypothetical
Annualized
Total Return | | | Beginning
Account
Value | | | Ending
Account
Value | | | Annualized
Expense
Ratio | | | Expenses
Paid
During
the
Period3 | |
| Class A | | | 4.26 | % | | $ | 1,000.00 | | | $ | 1,042.60 | | | | 1.46 | % | | $ | 7.50 | | | | | | | Class A | | | 5.00 | % | | $ | 1,000.00 | | | $ | 1,017.80 | | | | 1.46 | % | | $ | 7.41 | |
| Class C | | | 3.94 | | | | 1,000.00 | | | | 1,039.40 | | | | 2.18 | | | | 11.18 | | | | | | | Class C | | | 5.00 | | | | 1,000.00 | | | | 1,014.18 | | | | 2.18 | | | | 11.04 | |
| Class FI | | | 4.26 | | | | 1,000.00 | | | | 1,042.60 | | | | 1.65 | | | | 8.47 | | | | | | | Class FI | | | 5.00 | | | | 1,000.00 | | | | 1,016.84 | | | | 1.65 | | | | 8.36 | |
| Class I | | | 4.47 | | | | 1,000.00 | | | | 1,044.70 | | | | 1.22 | | | | 6.27 | | | | | | | Class I | | | 5.00 | | | | 1,000.00 | | | | 1,019.00 | | | | 1.22 | | | | 6.19 | |
| Class IS | | | 4.46 | | | | 1,000.00 | | | | 1,044.60 | | | | 1.15 | | | | 5.91 | | | | | | | Class IS | | | 5.00 | | | | 1,000.00 | | | | 1,019.36 | | | | 1.15 | | | | 5.84 | |
| | |
| 10 | | Legg Mason BW Alternative Credit Fund 2016 Annual Report |
| 1 | For the six months ended October 31, 2016. |
| 2 | Assumes the reinvestment of all distributions, including returns of capital, if any, at net asset value and does not reflect the deduction of the applicable sales charge with respect to Class A shares or the applicable contingent deferred sales charge (“CDSC”) with respect to Class C shares. Total return is not annualized, as it may not be representative of the total return for the year. Performance figures may reflect compensating balance arrangements, fee waivers and/or expense reimbursements. In the absence of compensating balance arrangements, fee waivers and/or expense reimbursements, the total return would have been lower. Past performance is no guarantee of future results. |
| 3 | Expenses (net of compensating balance arrangements, fee waivers and/or expense reimbursements) are equal to each class’ respective annualized expense ratio multiplied by the average account value over the period, multiplied by the number of days in the most recent fiscal half-year (184), then divided by 366. |
| | |
| Legg Mason BW Alternative Credit Fund 2016 Annual Report | | 11 |
Fund performance (unaudited)
Legg Mason BW Alternative Credit Fund (the “Fund”) is the successor to an institutional account (the “Predecessor”). The performance in the accompanying table and line graph includes performance of the Predecessor. The Predecessor’s inception date was August 31, 2010. On November 29, 2013, the Predecessor transferred its assets to the Fund in exchange for the Fund’s Class IS shares. The investment policies, objectives, guidelines and restrictions of the Fund are in all material respects equivalent to those of the Predecessor. In addition, the Predecessor’s portfolio managers are the current portfolio managers of the Fund. As a mutual fund registered under the Investment Company Act of 1940, the Fund is subject to certain restrictions under the 1940 Act and the Internal Revenue Code to which the Predecessor was not subject. Had the Predecessor been registered under the 1940 Act and been subject to the provisions of the 1940 Act and the Code, its investment performance may have been adversely affected. The performance was achieved by the Predecessor when fund assets were relatively small; the same strategies may not be available, and similar performance may not be achieved, when the fund’s assets are larger. The performance information reflects the expenses of the Predecessor adjusted to reflect the highest management fees paid by an investor of the Predecessor which fees were separately paid by such investors. The performance shown includes an annual management fee of 1.75% and does not include any expenses paid by the Predecessor’s adviser.
The Predecessor did not have distribution policies. The Predecessor was an unregistered separately managed account, did not qualify as a regulated investment company for federal income tax purposes and did not pay dividends or distributions.
| | | | | | | | | | | | | | | | | | | | |
| Average annual total returns | |
| Without sales charges1 | | Class A | | | Class C | | | Class FI | | | Class I | | | Class IS | |
| Twelve Months Ended 10/31/16 | | | 3.85 | % | | | 3.15 | % | | | 3.83 | % | | | 4.22 | % | | | 4.27 | % |
| Five Years Ended 10/31/16 | | | N/A | | | | N/A | | | | N/A | | | | N/A | | | | 7.26 | |
| Inception* through 10/31/16 | | | 3.02 | | | | 2.32 | | | | 2.99 | | | | 3.30 | | | | 12.79 | |
| | | | | |
| With sales charges2 | | Class A | | | Class C | | | Class FI | | | Class I | | | Class IS | |
| Twelve Months Ended 10/31/16 | | | -0.57 | % | | | 2.15 | % | | | 3.83 | % | | | 4.22 | % | | | 4.27 | % |
| Five Years Ended 10/31/16 | | | N/A | | | | N/A | | | | N/A | | | | N/A | | | | 7.26 | |
| Inception* through 10/31/16 | | | 1.49 | | | | 2.32 | | | | 2.99 | | | | 3.30 | | | | 12.79 | |
| | | | |
| Cumulative total returns | |
| Without sales charges1 | | | |
| Class A (Inception date of 12/2/13 through 10/31/16) | | | 9.05 | % |
| Class C (Inception date of 12/2/13 through 10/31/16) | | | 6.91 | |
| Class FI (Inception date of 12/2/13 through 10/31/16) | | | 8.96 | |
| Class I (Inception date of 12/2/13 through 10/31/16) | | | 9.94 | |
| Class IS (Inception date of 8/31/10 through 10/31/16) | | | 110.10 | |
All figures represent past performance and are not a guarantee of future results. Investment return and principal value of an investment will fluctuate so that an investor’s shares, when
| | |
| 12 | | Legg Mason BW Alternative Credit Fund 2016 Annual Report |
redeemed, may be worth more or less than their original cost. The returns shown do not reflect the deduction of taxes that a shareholder would pay on Fund distributions or the redemption of Fund shares. Performance figures may reflect compensating balance arrangements, fee waivers and/or expense reimbursements. In the absence of compensating balance arrangements, fee waivers and/or expense reimbursements, the total return would have been lower.
| 1 | Assumes the reinvestment of all distributions, including returns of capital, if any, at net asset value and does not reflect the deduction of the applicable sales charge with respect to Class A shares or the applicable contingent deferred sales charge (“CDSC”) with respect to Class C shares. |
| 2 | Assumes the reinvestment of all distributions, including returns of capital, if any, at net asset value. In addition, Class A shares reflect the deduction of the maximum initial sales charge of 4.25%. Class C shares reflect the deduction of a 1.00% CDSC, which applies if shares are redeemed within one year from purchase payment. |
| * | Inception dates for Class A, C, FI, I and IS shares are December 2, 2013, December 2, 2013, December 2, 2013, December 2, 2013 and August 31, 2010, respectively. |
| | |
| Legg Mason BW Alternative Credit Fund 2016 Annual Report | | 13 |
Fund performance (unaudited) (cont’d)
Historical performance
Value of $1,000,000 invested in
Class IS Shares of Legg Mason BW Alternative Credit Fund vs. Citigroup 3-Month U.S. Treasury Bill Index and Bloomberg Barclays Global High Yield Index† — August 31, 2010 - October 2016
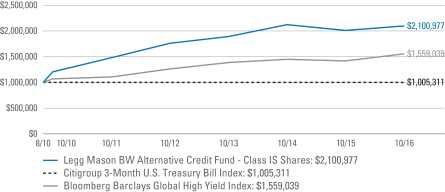
All figures represent past performance and are not a guarantee of future results. Investment return and principal value of an investment will fluctuate so that an investor’s shares, when redeemed, may be worth more or less than their original cost. The returns shown do not reflect the deduction of taxes that a shareholder would pay on Fund distributions or the redemption of Fund shares. Performance figures may reflect compensating balance arrangements, fee waivers and/or expense reimbursements. In the absence of compensating balance arrangements, fee waivers and/or expense reimbursements, the total return would have been lower.
| † | Hypothetical illustration of $1,000,000 invested in Class IS shares of Legg Mason BW Alternative Credit Fund at inception on August 31, 2010 (inception date of the Predecessor), assuming the reinvestment of all distributions, including returns of capital, if any, at net asset value through October 31, 2016. The hypothetical illustration also assumes a $1,000,000 investment in the Citigroup 3-Month U.S. Treasury Bill Index and the Bloomberg Barclays Global High Yield Index. The Citigroup 3-Month U.S. Treasury Bill Index is an unmanaged index generally representative of the average yield of 3-month U.S. Treasury bills. The Bloomberg Barclays Global High Yield Index is a multicurrency measure of the global high-yield debt market. The index represents the union of the U.S. High-Yield, Pan-European High-Yield, U.S. Emerging Markets (EM) Hard Currency High Yield Indices. The indices are unmanaged and are not subject to the same management and trading expenses as a mutual fund. Please note that an investor cannot invest directly in an index. The performance of the Fund’s other classes may be greater or less than the Class IS shares’ performance indicated on this chart, depending on whether greater or lesser sales charges and fees were incurred by shareholders investing in the other classes. |
| | |
| 14 | | Legg Mason BW Alternative Credit Fund 2016 Annual Report |
Schedule of investments
October 31, 2016
Legg Mason BW Alternative Credit Fund
| | | | | | | | | | | | | | | | |
| Security | | Rate | | | Maturity
Date | | | Face
Amount† | | | Value | |
| Collateralized Mortgage Obligations — 36.8% | | | | | | | | | | | | | | | | |
Bank of America Merrill Lynch Large Loan Inc., 2014-FRR9 C | | | 5.444 | % | | | 12/26/46 | | | | 6,462,000 | | | $ | 6,302,990 | (a)(b) |
Bank of America Merrill Lynch Large Loan Inc., 2016-FR15 A | | | 5.314 | % | | | 10/26/47 | | | | 2,916,081 | | | | 2,896,995 | (a)(b) |
Connecticut Avenue Securities, 2015-C02 2M2 | | | 4.534 | % | | | 5/25/25 | | | | 8,000,000 | | | | 8,271,708 | (a) |
Connecticut Avenue Securities, 2016-C04 1M2 | | | 4.784 | % | | | 1/25/29 | | | | 5,625,000 | | | | 5,675,062 | (a)(b) |
FREMF Mortgage Trust, 2013-K31 C | | | 3.628 | % | | | 7/25/46 | | | | 4,610,000 | | | | 4,415,298 | (a)(b) |
FREMF Mortgage Trust, 2014-K36 C | | | 4.359 | % | | | 12/25/46 | | | | 6,000,000 | | | | 5,967,776 | (a)(b) |
FREMF Mortgage Trust, 2014-K715 C | | | 4.127 | % | | | 2/25/46 | | | | 6,885,200 | | | | 6,916,776 | (a)(b) |
FREMF Mortgage Trust, 2015-K44 B | | | 3.685 | % | | | 1/25/48 | | | | 7,353,000 | | | | 7,270,120 | (a)(b) |
FREMF Mortgage Trust, 2015-K720 B | | | 3.389 | % | | | 7/25/22 | | | | 5,000,000 | | | | 4,916,157 | (a)(b) |
FREMF Mortgage Trust, 2015-K721 B | | | 3.565 | % | | | 11/25/47 | | | | 8,565,000 | | | | 8,496,723 | (a)(b) |
GCCFC Commercial Mortgage Trust, 2007-GG9 AJ | | | 5.505 | % | | | 3/10/39 | | | | 4,745,000 | | | | 4,484,304 | (a) |
Hipocat Fondo de Titulizacion de Activos, HIPO-8 B | | | 1.225 | % | | | 3/15/38 | | | | 10,016,799 | EUR | | | 8,698,825 | (a)(c) |
LSTAR Securities Investment Ltd., 2015-8 A1 | | | 2.533 | % | | | 8/1/20 | | | | 4,532,833 | | | | 4,526,011 | (a)(b) |
LSTAR Securities Investment Ltd., 2015-9 A1 | | | 2.533 | % | | | 10/1/20 | | | | 5,245,256 | | | | 5,193,782 | (a)(b) |
Newgate Funding PLC, 2006-2 DB | | | 0.599 | % | | | 12/1/50 | | | | 1,995,262 | EUR | | | 1,723,428 | (a)(c) |
Newgate Funding PLC, 2007-3X CB | | | 1.198 | % | | | 12/15/50 | | | | 9,089,850 | EUR | | | 8,354,263 | (a)(c) |
RMAC Securities PLC, 2006-NS1X B1C | | | 0.576 | % | | | 6/12/44 | | | | 5,202,822 | EUR | | | 4,706,016 | (a)(c) |
RMAC Securities PLC, 2006-NS4X B1C | | | 0.546 | % | | | 6/12/44 | | | | 11,093,824 | EUR | | | 9,693,849 | (a)(c) |
Structured Agency Credit Risk Debt Notes, 2016-DNA2 M3 | | | 5.184 | % | | | 10/25/28 | | | | 12,605,000 | | | | 13,114,789 | (a) |
Structured Agency Credit Risk Debt Notes, 2016-HQA1 M3 | | | 6.884 | % | | | 9/25/28 | | | | 5,460,000 | | | | 6,068,258 | (a) |
TDA Fondo de Titulizacion de Activos, 2024-A1 | | | 0.093 | % | | | 6/22/40 | | | | 1,328,777 | EUR | | | 1,386,034 | (a)(c) |
Wachovia Bank Commercial Mortgage Trust, 2006-C27 AJ | | | 5.825 | % | | | 7/15/45 | | | | 3,790,000 | | | | 3,810,352 | (a) |
Total Collateralized Mortgage Obligations (Cost — $138,162,968) | | | | 132,889,516 | |
| Asset-Backed Securities — 10.3% | | | | | | | | | | | | | | | | |
Accredited Mortgage Loan Trust, 2006-2 A3 | | | 0.684 | % | | | 9/25/36 | | | | 1,510,385 | | | | 1,502,452 | (a) |
Ellington Loan Acquisition Trust, 2007-1 A2B | | | 1.434 | % | | | 5/25/37 | | | | 2,762,834 | | | | 2,755,480 | (a)(b) |
Ellington Loan Acquisition Trust, 2007-2 A2B | | | 1.484 | % | | | 5/25/37 | | | | 11,719,363 | | | | 11,690,716 | (a)(b) |
Merrill Lynch Mortgage Investors Trust, 2007-MLN1 A2B | | | 0.714 | % | | | 3/25/37 | | | | 2,178,037 | | | | 2,172,910 | (a) |
Option One Mortgage Loan Trust, 2005-4 M1 | | | 0.974 | % | | | 11/25/35 | | | | 5,190,000 | | | | 5,092,868 | (a) |
Residential Asset Securities Corp., 2006-KS1 A4 | | | 0.834 | % | | | 2/25/36 | | | | 1,894,317 | | | | 1,875,855 | (a) |
Tryon Park CLO Ltd., 2013-1A C | | | 4.380 | % | | | 7/15/25 | | | | 4,225,000 | | | | 4,139,511 | (a)(b) |
Vericrest Opportunity Loan Transferee, 2015-NPL4 A2 | | | 4.250 | % | | | 2/25/55 | | | | 8,473,799 | | | | 8,194,573 | (b) |
Total Asset-Backed Securities (Cost — $37,515,634) | | | | 37,424,365 | |
| Corporate Bonds & Notes — 19.3% | | | | | | | | | | | | | | | | |
| Consumer Staples — 1.1% | | | | | | | | | | | | | | | | |
Food Products — 1.1% | | | | | | | | | | | | | | | | |
Marfrig Holding Europe BV, Senior Notes | | | 8.000 | % | | | 6/8/23 | | | | 3,880,000 | | | | 4,006,100 | (b) |
See Notes to Financial Statements.
| | |
| Legg Mason BW Alternative Credit Fund 2016 Annual Report | | 15 |
Schedule of investments (cont’d)
October 31, 2016
Legg Mason BW Alternative Credit Fund
| | | | | | | | | | | | | | | | |
| Security | | Rate | | | Maturity
Date | | | Face
Amount† | | | Value | |
| Energy — 7.1% | | | | | | | | | | | | | | | | |
Oil, Gas & Consumable Fuels — 7.1% | | | | | | | | | | | | | | | | |
Chesapeake Energy Corp., Secured Notes | | | 8.000 | % | | | 12/15/22 | | | | 1,855,000 | | | $ | 1,881,666 | (b) |
Petrobras Global Finance BV, Senior Notes | | | 5.750 | % | | | 1/20/20 | | | | 9,435,000 | | | | 9,736,920 | |
Petrobras Global Finance BV, Senior Notes | | | 5.375 | % | | | 1/27/21 | | | | 3,050,000 | | | | 3,020,110 | |
Petrobras Global Finance BV, Senior Notes | | | 8.750 | % | | | 5/23/26 | | | | 9,880,000 | | | | 11,129,820 | |
Total Energy | | | | | | | | | | | | | | | 25,768,516 | |
| Financials — 1.0% | | | | | | | | | | | | | | | | |
Banks — 1.0% | | | | | | | | | | | | | | | | |
Banco do Brasil SA, Junior Subordinated Notes | | | 9.000 | % | | | 6/18/24 | | | | 3,860,000 | | | | 3,574,360 | (a)(c)(d) |
| Health Care — 2.2% | | | | | | | | | | | | | | | | |
Pharmaceuticals — 2.2% | | | | | | | | | | | | | | | | |
Valeant Pharmaceuticals International Inc., Senior Notes | | | 6.750 | % | | | 8/15/18 | | | | 4,265,000 | | | | 4,162,640 | (b) |
Valeant Pharmaceuticals International Inc., Senior Notes | | | 6.375 | % | | | 10/15/20 | | | | 4,270,000 | | | | 3,682,875 | (b) |
Total Health Care | | | | | | | | | | | | | | | 7,845,515 | |
| Information Technology — 3.0% | | | | | | | | | | | | | | | | |
Technology Hardware, Storage & Peripherals — 3.0% | | | | | | | | | | | | | | | | |
Diamond 1 Finance Corp./Diamond 2 Finance Corp., Senior Secured Notes | | | 6.020 | % | | | 6/15/26 | | | | 6,745,000 | | | | 7,352,421 | (b) |
Diamond 1 Finance Corp./Diamond 2 Finance Corp., Senior Secured Notes | | | 8.350 | % | | | 7/15/46 | | | | 2,765,000 | | | | 3,350,325 | (b) |
Total Information Technology | | | | | | | | | | | | | | | 10,702,746 | |
| Materials — 2.0% | | | | | | | | | | | | | | | | |
Chemicals — 2.0% | | | | | | | | | | | | | | | | |
Hexion Inc., Senior Secured Notes | | | 6.625 | % | | | 4/15/20 | | | | 8,215,000 | | | | 7,188,125 | |
| Telecommunication Services — 2.9% | | | | | | | | | | | | | | | | |
Diversified Telecommunication Services — 2.9% | | | | | | | | | | | | | | | | |
Digicel Group Ltd., Senior Notes | | | 8.250 | % | | | 9/30/20 | | | | 5,985,000 | | | | 5,296,725 | (b) |
Digicel Group Ltd., Senior Notes | | | 7.125 | % | | | 4/1/22 | | | | 6,565,000 | | | | 5,200,793 | (b) |
Total Telecommunication Services | | | | | | | | | | | | | | | 10,497,518 | |
Total Corporate Bonds & Notes (Cost — $66,815,204) | | | | | | | | | | | | | | | 69,582,880 | |
| Senior Loans — 11.7% | | | | | | | | | | | | | | | | |
| Consumer Discretionary — 1.5% | | | | | | | | | | | | | | | | |
Media — 1.5% | | | | | | | | | | | | | | | | |
WMG Acquisition Corp., Term Loan B | | | — | | | | 10/20/23 | | | | 5,550,000 | | | | 5,536,125 | (e) |
| Energy — 2.4% | | | | | | | | | | | | | | | | |
Oil, Gas & Consumable Fuels — 2.4% | | | | | | | | | | | | | | | | |
Chesapeake Energy Corp., Term Loan | | | 8.500 | % | | | 8/23/21 | | | | 8,170,000 | | | | 8,709,220 | (e)(f)(g) |
See Notes to Financial Statements.
| | |
| 16 | | Legg Mason BW Alternative Credit Fund 2016 Annual Report |
Legg Mason BW Alternative Credit Fund
| | | | | | | | | | | | | | | | |
| Security | | Rate | | | Maturity
Date | | | Face
Amount† | | | Value | |
| Health Care — 4.8% | | | | | | | | | | | | | | | | |
Pharmaceuticals — 4.8% | | | | | | | | | | | | | | | | |
Capsugel Holdings U.S. Inc., USD Term Loan B | | | 4.000 | % | | | 7/31/21 | | | | 17,362,750 | | | $ | 17,412,355 | (f)(g) |
| Information Technology — 3.0% | | | | | | | | | | | | | | | | |
Internet Software & Services — 0.9% | | | | | | | | | | | | | | | | |
Rackspace Hosting Inc., First Lien Term Loan | | | — | | | | 10/26/23 | | | | 3,080,000 | | | | 3,097,051 | (e) |
IT Services — 2.1% | | | | | | | | | | | | | | | | |
First Data Corp., 2016 USD Term Loan | | | — | | | | 3/24/21 | | | | 7,475,000 | | | | 7,513,930 | (e) |
Total Information Technology | | | | | | | | | | | | | | | 10,610,981 | |
Total Senior Loans (Cost — $41,883,481) | | | | | | | | | | | | | | | 42,268,681 | |
| Sovereign Bonds — 7.0% | | | | | | | | | | | | | | | | |
Argentina — 1.8% | | | | | | | | | | | | | | | | |
Republic of Argentina, Bonds | | | 18.200 | % | | | 10/3/21 | | | | 90,996,000 | ARS | | | 6,401,698 | |
Brazil — 2.0% | | | | | | | | | | | | | | | | |
Federative Republic of Brazil, Notes | | | 10.000 | % | | | 1/1/27 | | | | 25,605,000 | BRL | | | 7,397,824 | |
Indonesia — 3.2% | | | | | | | | | | | | | | | | |
Republic of Indonesia, Senior Bonds | | | 8.375 | % | | | 9/15/26 | | | | 141,000,000,000 | IDR | | | 11,497,303 | |
Total Sovereign Bonds (Cost — $24,975,964) | | | | | | | | | | | | | | | 25,296,825 | |
Total Investments before Short-Term Investments (Cost — $309,353,251) | | | | 307,462,267 | |
| | | | |
| | | | | | | | | Shares | | | | |
| Short-Term Investments — 19.9% | | | | | | | | | | | | | | | | |
State Street Institutional U.S. Government Money Market Fund, Premier Class (Cost — $71,843,488) | | | 0.251 | % | | | | | | | 71,843,488 | | | | 71,843,488 | |
Total Investments — 105.0% (Cost — $381,196,739#) | | | | | | | | 379,305,755 | |
Liabilities in Excess of Other Assets — (5.0)% | | | | | | | | | | | | | | | (17,992,803 | ) |
Total Net Assets — 100.0% | | | | | | | | | | | | | | $ | 361,312,952 | |
| † | Face amount denominated in U.S. dollars, unless otherwise noted. |
| (a) | Variable rate security. Interest rate disclosed is as of the most recent information available. |
| (b) | Security is exempt from registration under Rule 144A of the Securities Act of 1933. This security may be resold in transactions that are exempt from registration, normally to qualified institutional buyers. This security has been deemed liquid pursuant to guidelines approved by the Board of Trustees, unless otherwise noted. |
| (c) | Security is exempt from registration under Regulation S of the Securities Act of 1933. Regulation S applies to securities offerings that are made outside of the United States and do not involve direct selling efforts in the United States. This security has been deemed liquid pursuant to guidelines approved by the Board of Trustees, unless otherwise noted. |
| (d) | Security has no maturity date. The date shown represents the next call date. |
| (e) | All or a portion of this loan is unfunded as of October 31, 2016. The interest rate for fully unfunded term loans is to be determined. |
| (f) | Senior loans may be considered restricted in that the Fund ordinarily is contractually obligated to receive approval from the agent bank and/or borrower prior to the disposition of a senior loan. |
See Notes to Financial Statements.
| | |
| Legg Mason BW Alternative Credit Fund 2016 Annual Report | | 17 |
Schedule of investments (cont’d)
October 31, 2016
Legg Mason BW Alternative Credit Fund
| (g) | Interest rates disclosed represent the effective rates on senior loans. Ranges in interest rates are attributable to multiple contracts under the same loan. |
| # | Aggregate cost for federal income tax purposes is $383,906,888. |
| | |
Abbreviation used in this schedule: |
| ARS | | — Argentine Peso |
| BRL | | — Brazilian Real |
| CLO | | — Collateral Loan Obligation |
| EUR | | — Euro |
| IDR | | — Indonesian Rupiah |
| | | | |
| Summary of Investments by Country** (unaudited) | | | |
| United States | | | 53.1 | % |
| Brazil | | | 10.2 | |
| United Kingdom | | | 6.5 | |
| Indonesia | | | 3.0 | |
| Jamaica | | | 2.8 | |
| Spain | | | 2.7 | |
| Argentina | | | 1.7 | |
| Cayman Islands | | | 1.1 | |
| Short-Term Investments | | | 18.9 | |
| | | | 100.0 | % |
| ** | As a percentage of total investments. Please note that the Fund holdings are as of October 31, 2016 and are subject to change. |
See Notes to Financial Statements.
| | |
| 18 | | Legg Mason BW Alternative Credit Fund 2016 Annual Report |
Statement of assets and liabilities
October 31, 2016
| | | | |
| |
| Assets: | | | | |
Investments, at value (Cost — $381,196,739) | | $ | 379,305,755 | |
Cash | | | 12,642 | |
Unrealized appreciation on forward foreign currency contracts | | | 3,206,527 | |
Interest receivable | | | 2,263,975 | |
Deposits with brokers for OTC swap contracts | | | 1,960,000 | |
OTC swaps, at value (premiums paid — $796,503) | | | 1,037,820 | |
Deposits with brokers for centrally cleared swap contracts | | | 929,470 | |
Receivable for Fund shares sold | | | 647,220 | |
Receivable from broker — variation margin on centrally cleared swaps | | | 466,674 | |
Receivable for open OTC swap contracts | | | 66,821 | |
Prepaid expenses | | | 21,251 | |
Total Assets | | | 389,918,155 | |
| |
| Liabilities: | | | | |
Payable for securities purchased | | | 21,093,695 | |
OTC swaps, at value (premiums received — $2,157,068) | | | 2,433,411 | |
Unrealized depreciation on forward foreign currency contracts | | | 1,946,177 | |
Payable for Fund shares repurchased | | | 1,549,755 | |
Deposits from brokers for OTC swap contracts | | | 1,080,000 | |
Investment management fee payable | | | 110,518 | |
Service and/or distribution fees payable | | | 21,556 | |
Payable for open OTC swap contracts | | | 6,533 | |
Trustees’ fees payable | | | 6,043 | |
Foreign currency overdraft, at value (Cost — $39) | | | 39 | |
Accrued expenses | | | 357,476 | |
Total Liabilities | | | 28,605,203 | |
| Total Net Assets | | $ | 361,312,952 | |
| |
| Net Assets: | | | | |
Par value (Note 7) | | $ | 368 | |
Paid-in capital in excess of par value | | | 454,245,134 | |
Undistributed net investment income | | | 246,998 | |
Accumulated net realized loss on investments, futures contracts, written options,
swap contracts and foreign currency transactions | | | (92,372,158) | |
Net unrealized depreciation on investments, swap contracts and foreign currencies | | | (807,390) | |
| Total Net Assets | | $ | 361,312,952 | |
See Notes to Financial Statements.
| | |
| Legg Mason BW Alternative Credit Fund 2016 Annual Report | | 19 |
Statement of assets and liabilities (cont’d)
October 31, 2016
| | | | |
|
| Net Assets: | |
Class A | | | $28,168,232 | |
Class C | | | $17,396,401 | |
Class FI | | | $831,004 | |
Class I | | | $214,413,413 | |
Class IS | | | $100,503,902 | |
|
| Shares Outstanding: | |
Class A | | | 2,872,967 | |
Class C | | | 1,782,267 | |
Class FI | | | 84,836 | |
Class I | | | 21,836,260 | |
Class IS | | | 10,226,325 | |
|
| Net Asset Value: | |
Class A (and redemption price) | | | $9.80 | |
Class C* | | | $9.76 | |
Class FI (and redemption price) | | | $9.80 | |
Class I (and redemption price) | | | $9.82 | |
Class IS (and redemption price) | | | $9.83 | |
| Maximum Public Offering Price Per Share: | |
Class A (based on maximum initial sales charge of 4.25%) | | | $10.23 | |
| * | Redemption price per share is NAV of Class C shares reduced by a 1.00% CDSC if shares are redeemed within one year from purchase payment (See Note 2). |
See Notes to Financial Statements.
| | |
| 20 | | Legg Mason BW Alternative Credit Fund 2016 Annual Report |
Statement of operations
For the Year Ended October 31, 2016
| | | | |
|
| Investment Income: | |
Interest | | $ | 16,976,536 | |
Dividends | | | 27,403 | |
Less: Foreign taxes withheld | | | (92,483) | |
Total Investment Income | | | 16,911,456 | |
|
| Expenses: | |
Investment management fee (Note 2) | | | 6,256,464 | |
Transfer agent fees (Note 5) | | | 483,889 | |
Service and/or distribution fees (Notes 2 and 5) | | | 392,951 | |
Audit and tax fees | | | 209,953 | |
Registration fees | | | 112,497 | |
Legal fees | | | 95,260 | |
Trustees’ fees | | | 58,414 | |
Fund accounting fees | | | 53,772 | |
Custody fees | | | 52,339 | |
Shareholder reports | | | 39,049 | |
Fees recaptured by investment manager (Note 2) | | | 30,286 | |
Commitment fees (Note 8) | | | 20,667 | |
Insurance | | | 15,153 | |
Miscellaneous expenses | | | 39,294 | |
Total Expenses | | | 7,859,988 | |
Less: Fee waivers and/or expense reimbursements (Notes 2 and 5) | | | (494,045) | |
Net Expenses | | | 7,365,943 | |
| Net Investment Income | | | 9,545,513 | |
|
Realized and Unrealized Gain (Loss) on Investments, Futures Contracts,
Written Options, Swap Contracts and Foreign Currency Transactions (Notes 1, 3 and 4): | |
Net Realized Gain (Loss) From: | |
Investment transactions | | | (102,542,340) | |
Futures contracts | | | 6,267,636 | |
Written options | | | 137,033 | |
Swap contracts | | | 9,586,130 | |
Foreign currency transactions | | | (7,220,786) | |
Net Realized Loss | | | (93,772,327) | |
Change in Net Unrealized Appreciation (Depreciation) From: | |
Investments | | | 90,984,200 | |
Swap contracts | | | 318,680 | |
Foreign currencies | | | 6,051,438 | |
Change in Net Unrealized Appreciation (Depreciation) | | | 97,354,318 | |
Net Gain on Investments, Futures Contracts, Written Options, Swap Contracts
and Foreign Currency Transactions | | | 3,581,991 | |
| Increase in Net Assets From Operations | | $ | 13,127,504 | |
See Notes to Financial Statements.
| | |
| Legg Mason BW Alternative Credit Fund 2016 Annual Report | | 21 |
Statements of changes in net assets
| | | | | | | | |
| For the Years Ended October 31, | | 2016 | | | 2015 | |
|
| Operations: | |
Net investment income | | $ | 9,545,513 | | | $ | 18,276,753 | |
Net realized gain (loss) | | | (93,772,327) | | | | 22,027,461 | |
Change in net unrealized appreciation (depreciation) | | | 97,354,318 | | | | (96,943,655) | |
Increase (Decrease) in Net Assets From Operations | | | 13,127,504 | | | | (56,639,441) | |
|
| Distributions to Shareholders From (Notes 1 and 6): | |
Net investment income | | | (23,361,965) | | | | (20,640,994) | |
Net realized gains | | | — | | | | (20,978,064) | |
Return of capital | | | (1,772,793) | | | | — | |
Decrease in Net Assets From Distributions to Shareholders | | | (25,134,758) | | | | (41,619,058) | |
|
| Fund Share Transactions (Note 7): | |
Net proceeds from sale of shares | | | 177,452,537 | | | | 1,052,134,154 | |
Reinvestment of distributions | | | 23,853,760 | | | | 40,135,456 | |
Cost of shares repurchased | | | (650,529,301) | | | | (712,622,402) | |
Increase (Decrease) in Net Assets From Fund Share Transactions | | | (449,223,004) | | | | 379,647,208 | |
Increase (Decrease) in Net Assets | | | (461,230,258) | | | | 281,388,709 | |
|
| Net Assets: | |
Beginning of year | | | 822,543,210 | | | | 541,154,501 | |
End of year* | | $ | 361,312,952 | | | $ | 822,543,210 | |
*Includes undistributed net investment income of: | | | $246,998 | | | | $23,164,733 | |
See Notes to Financial Statements.
| | |
| 22 | | Legg Mason BW Alternative Credit Fund 2016 Annual Report |
Financial highlights
| | | | | | | | | | | | |
For a share of each class of beneficial interest outstanding throughout each year ended October 31,
unless otherwise noted: | |
| Class A Shares1 | | 2016 | | | 2015 | | | 20142 | |
| | | |
| Net asset value, beginning of year | | | $9.77 | | | | $10.89 | | | | $10.00 | |
|
| Income (loss) from operations: | |
Net investment income | | | 0.16 | | | | 0.18 | | | | 0.19 | |
Net realized and unrealized gain (loss) | | | 0.20 | | | | (0.74) | | | | 0.91 | |
Total income (loss) from operations | | | 0.36 | | | | (0.56) | | | | 1.10 | |
|
| Less distributions from: | |
Net investment income | | | (0.31) | | | | (0.21) | | | | (0.21) | |
Net realized gains | | | — | | | | (0.35) | | | | — | |
Return of capital | | | (0.02) | | | | — | | | | — | |
Total distributions | | | (0.33) | | | | (0.56) | | | | (0.21) | |
| | | |
| Net asset value, end of year | | | $9.80 | | | | $9.77 | | | | $10.89 | |
Total return3 | | | 3.85 | % | | | (5.45) | % | | | 11.06 | % |
| | | |
| Net assets, end of year (000s) | | | $28,168 | | | | $112,382 | | | | $108,210 | |
|
| Ratios to average net assets: | |
Gross expenses | | | 1.68 | %4 | | | 1.65 | %4 | | | 1.69 | %5 |
Net expenses6, 7 | | | 1.59 | 4 | | | 1.65 | 4 | | | 1.38 | 5 |
Net investment income | | | 1.63 | | | | 1.75 | | | | 1.90 | 5 |
| | | |
| Portfolio turnover rate | | | 156 | % | | | 72 | % | | | 131 | %8 |
| 1 | Per share amounts have been calculated using the average shares method. |
| 2 | For the period December 2, 2013 (inception date) to October 31, 2014. |
| 3 | Performance figures, exclusive of sales charges, may reflect compensating balance arrangements, fee waivers and/or expense reimbursements. In the absence of compensating balance arrangements, fee waivers and/or expense reimbursements, the total return would have been lower. Past performance is no guarantee of future results. Total returns for periods of less than one year are not annualized. |
| 4 | Reflects recapture of expenses waived/reimbursed from prior fiscal years. |
| 6 | As a result of an expense limitation arrangement, the ratio of total annual fund operating expenses, other than interest, brokerage commissions, dividend expense on short sales, taxes, extraordinary expenses and acquired fund fees and expenses, to average net assets of Class A shares did not exceed 1.65%. This expense limitation arrangement cannot be terminated prior to December 31, 2018 without the Board of Trustees’ consent. |
| 7 | Reflects fee waivers and/or expense reimbursements. |
| 8 | Excludes securities received as a result of a contribution in-kind. |
See Notes to Financial Statements.
| | |
| Legg Mason BW Alternative Credit Fund 2016 Annual Report | | 23 |
Financial highlights (cont’d)
| | | | | | | | | | | | |
For a share of each class of beneficial interest outstanding throughout each year ended October 31,
unless otherwise noted: | |
| Class C Shares1 | | 2016 | | | 2015 | | | 20142 | |
| | | |
| Net asset value, beginning of year | | | $9.77 | | | | $10.89 | | | | $10.00 | |
|
| Income (loss) from operations: | |
Net investment income | | | 0.08 | | | | 0.11 | | | | 0.13 | |
Net realized and unrealized gain (loss) | | | 0.22 | | | | (0.74) | | | | 0.90 | |
Total income (loss) from operations | | | 0.30 | | | | (0.63) | | | | 1.03 | |
|
| Less distributions from: | |
Net investment income | | | (0.30) | | | | (0.14) | | | | (0.14) | |
Net realized gains | | | — | | | | (0.35) | | | | — | |
Return of capital | | | (0.01) | | | | — | | | | — | |
Total distributions | | | (0.31) | | | | (0.49) | | | | (0.14) | |
| | | |
| Net asset value, end of year | | | $9.76 | | | | $9.77 | | | | $10.89 | |
Total return3 | | | 3.15 | % | | | (6.09) | % | | | 10.38 | % |
| | | |
| Net assets, end of year (000s) | | | $17,396 | | | | $36,012 | | | | $14,500 | |
|
| Ratios to average net assets: | |
Gross expenses | | | 2.39 | %4 | | | 2.34 | %4 | | | 2.35 | %5 |
Net expenses6, 7 | | | 2.29 | 4 | | | 2.34 | 4 | | | 2.02 | 5 |
Net investment income | | | 0.81 | | | | 1.07 | | | | 1.31 | 5 |
| | | |
| Portfolio turnover rate | | | 156 | % | | | 72 | % | | | 131 | %8 |
| 1 | Per share amounts have been calculated using the average shares method. |
| 2 | For the period December 2, 2013 (inception date) to October 31, 2014. |
| 3 | Performance figures, exclusive of CDSC, may reflect compensating balance arrangements, fee waivers and/or expense reimbursements. In the absence of compensating balance arrangements, fee waivers and/or expense reimbursements, the total return would have been lower. Past performance is no guarantee of future results. Total returns for periods of less than one year are not annualized. |
| 4 | Reflects recapture of expenses waived/reimbursed from prior fiscal years. |
| 6 | As a result of an expense limitation arrangement, the ratio of total annual fund operating expenses, other than interest, brokerage commissions, dividend expense on short sales, taxes, extraordinary expenses and acquired fund fees and expenses, to average net assets of Class C shares did not exceed 2.40%. This expense limitation arrangement cannot be terminated prior to December 31, 2018 without the Board of Trustees’ consent. |
| 7 | Reflects fee waivers and/or expense reimbursements. |
| 8 | Excludes securities received as a result of a contribution in-kind. |
See Notes to Financial Statements.
| | |
| 24 | | Legg Mason BW Alternative Credit Fund 2016 Annual Report |
| | | | | | | | | | | | |
For a share of each class of beneficial interest outstanding throughout each year ended October 31,
unless otherwise noted: | |
| Class FI Shares1 | | 2016 | | | 2015 | | | 20142 | |
| | | |
| Net asset value, beginning of year | | | $9.77 | | | | $10.89 | | | | $10.00 | |
|
| Income (loss) from operations: | |
Net investment income | | | 0.17 | | | | 0.19 | | | | 0.20 | |
Net realized and unrealized gain (loss) | | | 0.19 | | | | (0.76) | | | | 0.90 | |
Total income (loss) from operations | | | 0.36 | | | | (0.57) | | | | 1.10 | |
|
| Less distributions from: | |
Net investment income | | | (0.31) | | | | (0.20) | | | | (0.21) | |
Net realized gains | | | — | | | | (0.35) | | | | — | |
Return of capital | | | (0.02) | | | | — | | | | — | |
Total distributions | | | (0.33) | | | | (0.55) | | | | (0.21) | |
| | | |
| Net asset value, end of year | | | $9.80 | | | | $9.77 | | | | $10.89 | |
Total return3 | | | 3.83 | % | | | (5.53) | % | | | 11.09 | % |
| | | |
| Net assets, end of year (000s) | | | $831 | | | | $3,191 | | | | $22,027 | |
|
| Ratios to average net assets: | |
Gross expenses | | | 2.01 | %4 | | | 1.65 | %4 | | | 1.58 | %5 |
Net expenses6,7 | | | 1.65 | 4 | | | 1.65 | 4 | | | 1.26 | 5 |
Net investment income | | | 1.77 | | | | 1.77 | | | | 2.05 | 5 |
| | | |
| Portfolio turnover rate | | | 156 | % | | | 72 | % | | | 131 | %8 |
| 1 | Per share amounts have been calculated using the average shares method. |
| 2 | For the period December 2, 2013 (inception date) to October 31, 2014. |
| 3 | Performance figures may reflect compensating balance arrangements, fee waivers and/or expense reimbursements. In the absence of compensating balance arrangements, fee waivers and/or expense reimbursements, the total return would have been lower. Past performance is no guarantee of future results. Total returns for periods of less than one year are not annualized. |
| 4 | Reflects recapture of expenses waived/reimbursed from prior fiscal years. |
| 6 | As a result of an expense limitation arrangement, the ratio of total annual fund operating expenses, other than interest, brokerage commissions, dividend expense on short sales, taxes, extraordinary expenses and acquired fund fees and expenses, to average net assets of Class FI shares did not exceed 1.65%. This expense limitation arrangement cannot be terminated prior to December 31, 2018 without the Board of Trustees’ consent. |
| 7 | Reflects fee waivers and/or expense reimbursements. |
| 8 | Excludes securities received as a result of a contribution in-kind. |
See Notes to Financial Statements.
| | |
| Legg Mason BW Alternative Credit Fund 2016 Annual Report | | 25 |
Financial highlights (cont’d)
| | | | | | | | | | | | |
For a share of each class of beneficial interest outstanding throughout each year ended October 31,
unless otherwise noted: | |
| Class I Shares1 | | 2016 | | | 2015 | | | 20142 | |
| | | |
| Net asset value, beginning of year | | | $9.77 | | | | $10.89 | | | | $10.00 | |
|
| Income (loss) from operations: | |
Net investment income | | | 0.17 | | | | 0.22 | | | | 0.20 | |
Net realized and unrealized gain (loss) | | | 0.23 | | | | (0.75) | | | | 0.91 | |
Total income (loss) from operations | | | 0.40 | | | | (0.53) | | | | 1.11 | |
|
| Less distributions from: | |
Net investment income | | | (0.32) | | | | (0.24) | | | | (0.22) | |
Net realized gains | | | — | | | | (0.35) | | | | — | |
Return of capital | | | (0.03) | | | | — | | | | — | |
Total distributions | | | (0.35) | | | | (0.59) | | | | (0.22) | |
| | | |
| Net asset value, end of year | | | $9.82 | | | | $9.77 | | | | $10.89 | |
Total return3 | | | 4.22 | % | | | (5.15) | % | | | 11.22 | % |
| | | |
| Net assets, end of year (000s) | | | $214,413 | | | | $566,915 | | | | $245,187 | |
|
| Ratios to average net assets: | |
Gross expenses | | | 1.39 | %4 | | | 1.32 | %4 | | | 1.39 | %5 |
Net expenses6,7 | | | 1.30 | 4 | | | 1.32 | 4 | | | 1.25 | 5 |
Net investment income | | | 1.79 | | | | 2.10 | | | | 2.04 | 5 |
| | | |
| Portfolio turnover rate | | | 156 | % | | | 72 | % | | | 131 | %8 |
| 1 | Per share amounts have been calculated using the average shares method. |
| 2 | For the period December 2, 2013 (inception date) to October 31, 2014. |
| 3 | Performance figures may reflect compensating balance arrangements, fee waivers and/or expense reimbursements. In the absence of compensating balance arrangements, fee waivers and/or expense reimbursements, the total return would have been lower. Past performance is no guarantee of future results. Total returns for periods of less than one year are not annualized. |
| 4 | Reflects recapture of expenses waived/reimbursed from prior fiscal years. |
| 6 | As a result of an expense limitation arrangement, the ratio of total annual fund operating expenses, other than interest, brokerage commissions, dividend expense on short sales, taxes, extraordinary expenses and acquired fund fees and expenses, to average net assets of Class I shares did not exceed 1.35%. This expense limitation arrangement cannot be terminated prior to December 31, 2018 without the Board of Trustees’ consent. |
| 7 | Reflects fee waivers and/or expense reimbursements. |
| 8 | Excludes securities received as a result of a contribution in-kind. |
See Notes to Financial Statements.
| | |
| 26 | | Legg Mason BW Alternative Credit Fund 2016 Annual Report |
| | | | | | | | | | | | |
For a share of each class of beneficial interest outstanding throughout each year ended October 31,
unless otherwise noted: | |
| Class IS Shares1 | | 2016 | | | 2015 | | | 20142 | |
| | | |
| Net asset value, beginning of year | | | $9.78 | | | | $10.90 | | | | $10.00 | |
|
| Income (loss) from operations: | |
Net investment income | | | 0.18 | | | | 0.22 | | | | 0.24 | |
Net realized and unrealized gain (loss) | | | 0.22 | | | | (0.74) | | | | 0.89 | |
Total income (loss) from operations | | | 0.40 | | | | (0.52) | | | | 1.13 | |
|
| Less distributions from: | |
Net investment income | | | (0.32) | | | | (0.25) | | | | (0.23) | |
Net realized gains | | | — | | | | (0.35) | | | | — | |
Return of capital | | | (0.03) | | | | — | | | | — | |
Total distributions | | | (0.35) | | | | (0.60) | | | | (0.23) | |
| | | |
| Net asset value, end of year | | | $9.83 | | | | $9.78 | | | | $10.90 | |
Total return3 | | | 4.27 | % | | | (5.09) | % | | | 11.35 | % |
| | | |
| Net assets, end of year (000s) | | | $100,504 | | | | $104,042 | | | | $151,231 | |
|
| Ratios to average net assets: | |
Gross expenses | | | 1.30 | %4 | | | 1.25 | %4 | | | 1.59 | %5 |
Net expenses6,7 | | | 1.20 | 4 | | | 1.25 | 4 | | | 1.25 | 5 |
Net investment income | | | 1.92 | | | | 2.11 | | | | 2.48 | 5 |
| | | |
| Portfolio turnover rate | | | 156 | % | | | 72 | % | | | 131 | %8 |
| 1 | Per share amounts have been calculated using the average shares method. |
| 2 | For the period November 29, 2013 (inception date) to October 31, 2014. |
| 3 | Performance figures may reflect compensating balance arrangements, fee waivers and/or expense reimbursements. In the absence of compensating balance arrangements, fee waivers and/or expense reimbursements, the total return would have been lower. Past performance is no guarantee of future results. Total returns for periods of less than one year are not annualized. |
| 4 | Reflects recapture of expenses waived/reimbursed from prior fiscal years. |
| 6 | As a result of an expense limitation arrangement, the ratio of total annual fund operating expenses, other than interest, brokerage commissions, dividend expense on short sales, taxes, extraordinary expenses and acquired fund fees and expenses, to average net assets of Class IS shares did not exceed 1.25%. In addition, the ratio of total annual fund operating expenses for Class IS shares did not exceed the ratio of total annual fund operating expenses for Class I shares. These expense limitation arrangements cannot be terminated prior to December 31, 2018 without the Board of Trustees’ consent. |
| 7 | Reflects fee waivers and/or expense reimbursements. |
| 8 | Excludes securities received as a result of a contribution in-kind. |
See Notes to Financial Statements.
| | |
| Legg Mason BW Alternative Credit Fund 2016 Annual Report | | 27 |
Notes to financial statements
1. Organization and significant accounting policies
Legg Mason BW Alternative Credit Fund (the “Fund”) is a separate non-diversified investment series of Legg Mason Global Asset Management Trust (the “Trust”). The Trust, a Maryland statutory trust, is registered under the Investment Company Act of 1940, as amended (the “1940 Act”), as an open-end management investment company.
The following are significant accounting policies consistently followed by the Fund and are in conformity with U.S. generally accepted accounting principles (“GAAP”). Estimates and assumptions are required to be made regarding assets, liabilities and changes in net assets resulting from operations when financial statements are prepared. Changes in the economic environment, financial markets and any other parameters used in determining these estimates could cause actual results to differ. Subsequent events have been evaluated through the date the financial statements were issued.
(a) Investment valuation. The valuations for fixed income securities (which may include, but are not limited to, corporate, government, municipal, mortgage-backed, collateralized mortgage obligations and asset-backed securities) and certain derivative instruments are typically the prices supplied by independent third party pricing services, which may use market prices or broker/dealer quotations or a variety of valuation techniques and methodologies. The independent third party pricing services use inputs that are observable such as issuer details, interest rates, yield curves, prepayment speeds, credit risks/spreads, default rates and quoted prices for similar securities. Short-term fixed income securities that will mature in 60 days or less are valued at amortized cost, unless it is determined that using this method would not reflect an investment’s fair value. Investments in open-end funds are valued at the closing net asset value per share of each fund on the day of valuation. Futures contracts are valued daily at the settlement price established by the board of trade or exchange on which they are traded. Equity securities for which market quotations are available are valued at the last reported sales price or official closing price on the primary market or exchange on which they trade. When the Fund holds securities or other assets that are denominated in a foreign currency, the Fund will normally use the currency exchange rates as of 4:00 p.m. (Eastern Time). If independent third party pricing services are unable to supply prices for a portfolio investment, or if the prices supplied are deemed by the manager to be unreliable, the market price may be determined by the manager using quotations from one or more broker/dealers or at the transaction price if the security has recently been purchased and no value has yet been obtained from a pricing service or pricing broker. When reliable prices are not readily available, such as when the value of a security has been significantly affected by events after the close of the exchange or market on which the security is principally traded, but before the Fund calculates its net asset value, the Fund values these securities as determined in accordance with procedures approved by the Fund’s Board of Trustees.
The Board of Trustees is responsible for the valuation process and has delegated the supervision of the daily valuation process to the Legg Mason North Atlantic Fund Valuation Committee (the “Valuation Committee”). The Valuation Committee, pursuant to the policies
| | |
| 28 | | Legg Mason BW Alternative Credit Fund 2016 Annual Report |
adopted by the Board of Trustees, is responsible for making fair value determinations, evaluating the effectiveness of the Fund’s pricing policies, and reporting to the Board of Trustees. When determining the reliability of third party pricing information for investments owned by the Fund, the Valuation Committee, among other things, conducts due diligence reviews of pricing vendors, monitors the daily change in prices and reviews transactions among market participants.
The Valuation Committee will consider pricing methodologies it deems relevant and appropriate when making fair value determinations. Examples of possible methodologies include, but are not limited to, multiple of earnings; discount from market of a similar freely traded security; discounted cash-flow analysis; book value or a multiple thereof; risk premium/yield analysis; yield to maturity; and/or fundamental investment analysis. The Valuation Committee will also consider factors it deems relevant and appropriate in light of the facts and circumstances. Examples of possible factors include, but are not limited to, the type of security; the issuer’s financial statements; the purchase price of the security; the discount from market value of unrestricted securities of the same class at the time of purchase; analysts’ research and observations from financial institutions; information regarding any transactions or offers with respect to the security; the existence of merger proposals or tender offers affecting the security; the price and extent of public trading in similar securities of the issuer or comparable companies; and the existence of a shelf registration for restricted securities.
For each portfolio security that has been fair valued pursuant to the policies adopted by the Board of Trustees, the fair value price is compared against the last available and next available market quotations. The Valuation Committee reviews the results of such back testing monthly and fair valuation occurrences are reported to the Board of Trustees quarterly.
The Fund uses valuation techniques to measure fair value that are consistent with the market approach and/or income approach, depending on the type of security and the particular circumstance. The market approach uses prices and other relevant information generated by market transactions involving identical or comparable securities. The income approach uses valuation techniques to discount estimated future cash flows to present value.
GAAP establishes a disclosure hierarchy that categorizes the inputs to valuation techniques used to value assets and liabilities at measurement date. These inputs are summarized in the three broad levels listed below:
| • | | Level 1 — quoted prices in active markets for identical investments |
| • | | Level 2 — other significant observable inputs (including quoted prices for similar investments, interest rates, prepayment speeds, credit risk, etc.) |
| • | | Level 3 — significant unobservable inputs (including the Fund’s own assumptions in determining the fair value of investments) |
| | |
| Legg Mason BW Alternative Credit Fund 2016 Annual Report | | 29 |
Notes to financial statements (cont’d)
The inputs or methodologies used to value securities are not necessarily an indication of the risk associated with investing in those securities.
The following is a summary of the inputs used in valuing the Fund’s assets and liabilities carried at fair value:
| | | | | | | | | | | | | | | | |
| ASSETS | |
| Description | | Quoted Prices
(Level 1) | | | Other Significant
Observable Inputs
(Level 2) | | | Significant
Unobservable
Inputs
(Level 3) | | | Total | |
| Long-term investments†: | |
Collateralized mortgage obligations | | | — | | | $ | 132,889,516 | | | | — | | | $ | 132,889,516 | |
Asset-backed securities | | | — | | | | 37,424,365 | | | | — | | | | 37,424,365 | |
Corporate bonds & notes | | | — | | | | 69,582,880 | | | | — | | | | 69,582,880 | |
Senior loans | | | — | | | | 42,268,681 | | | | — | | | | 42,268,681 | |
Sovereign bonds | | | — | | | | 25,296,825 | | | | — | | | | 25,296,825 | |
| Total long-term investments | | | — | | | | 307,462,267 | | | | — | | | | 307,462,267 | |
| Short-term investments† | | $ | 71,843,488 | | | | — | | | | — | | | | 71,843,488 | |
| Total investments | | $ | 71,843,488 | | | $ | 307,462,267 | | | | — | | | $ | 379,305,755 | |
| Other financial instruments: | |
Forward foreign currency contracts | | | — | | | | 3,206,527 | | | | — | | | | 3,206,527 | |
OTC credit default swaps on credit indices — buy protection‡ | | | — | | | | 1,037,820 | | | | — | | | | 1,037,820 | |
| Total other financial instruments | | | — | | | $ | 4,244,347 | | | | — | | | $ | 4,244,347 | |
| Total | | $ | 71,843,488 | | | $ | 311,706,614 | | | | — | | | $ | 383,550,102 | |
|
| LIABILITIES | |
| Description | | Quoted Prices
(Level 1) | | | Other Significant
Observable Inputs
(Level 2) | | | Significant
Unobservable
Inputs
(Level 3) | | | Total | |
| Other financial instruments: | | | | | | | | | | | | | | | | |
Forward foreign currency contracts | | | — | | | $ | 1,946,177 | | | | — | | | $ | 1,946,177 | |
Centrally cleared credit default swaps on credit indices — sell protection | | | — | | | | 139,625 | | | | — | | | | 139,625 | |
OTC credit default swaps on corporate issues — sell protection‡ | | | — | | | | 1,395,591 | | | | — | | | | 1,395,591 | |
OTC credit default swaps on credit indices — sell protection‡ | | | — | | | | 1,037,820 | | | | — | | | | 1,037,820 | |
| Total | | | — | | | $ | 4,519,213 | | | | — | | | $ | 4,519,213 | |
| † | See Schedule of Investments for additional detailed categorizations. |
| ‡ | Value includes any premium paid or received with respect to swap contracts. |
(b) Futures contracts. The Fund uses futures contracts generally to gain exposure to, or hedge against, changes in interest rates or gain exposure to, or hedge against, changes in certain asset classes. A futures contract represents a commitment for the future purchase or sale of an asset at a specified price on a specified date.
| | |
| 30 | | Legg Mason BW Alternative Credit Fund 2016 Annual Report |
Upon entering into a futures contract, the Fund is required to deposit cash or cash equivalents with a broker in an amount equal to a certain percentage of the contract amount. This is known as the ‘‘initial margin’’ and subsequent payments (‘‘variation margin’’) are made or received by the Fund each day, depending on the daily fluctuation in the value of the contract. For certain futures, including foreign denominated futures, variation margin is not settled daily, but is recorded as a net variation margin payable or receivable. The daily changes in contract value are recorded as unrealized gains or losses in the Statement of Operations and the Fund recognizes a realized gain or loss when the contract is closed.
Futures contracts involve, to varying degrees, risk of loss in excess of the amounts reflected in the financial statements. In addition, there is the risk that the Fund may not be able to enter into a closing transaction because of an illiquid secondary market.
(c) Written options. When the Fund writes an option, an amount equal to the premium received by the Fund is recorded as a liability, the value of which is marked-to-market daily to reflect the current market value of the option written. If the option expires, the premium received is recorded as a realized gain. When a written call option is exercised, the difference between the premium received plus the option exercise price and the Fund’s basis in the underlying security (in the case of a covered written call option), or the cost to purchase the underlying security (in the case of an uncovered written call option), including brokerage commission, is recognized as a realized gain or loss. When a written put option is exercised, the amount of the premium received is subtracted from the cost of the security purchased by the Fund from the exercise of the written put option to form the Fund’s basis in the underlying security purchased. The writer or buyer of an option traded on an exchange can liquidate the position before the exercise of the option by entering into a closing transaction. The cost of a closing transaction is deducted from the original premium received resulting in a realized gain or loss to the Fund.
The risk in writing a covered call option is that the Fund may forego the opportunity of profit if the market price of the underlying security increases and the option is exercised. The risk in writing a put option is that the Fund may incur a loss if the market price of the underlying security decreases and the option is exercised. The risk in writing an uncovered call option is that the Fund is exposed to the risk of loss if the market price of the underlying security increases. In addition, there is the risk that the Fund may not be able to enter into a closing transaction because of an illiquid secondary market.
(d) Forward foreign currency contracts. The Fund enters into a forward foreign currency contract to hedge exposure of bond positions or in an attempt to increase the Fund’s return. A forward foreign currency contract is an agreement between two parties to buy and sell a currency at a set price with delivery and settlement at a future date. The contract is marked-to-market daily and the change in value is recorded by the Fund as an unrealized gain or loss. When a forward foreign currency contract is closed, through either delivery or offset by entering into another forward foreign currency contract, the Fund recognizes a realized gain or loss equal to the difference between the value of the contract at the time it was opened and the value of the contract at the time it is closed.
| | |
| Legg Mason BW Alternative Credit Fund 2016 Annual Report | | 31 |
Notes to financial statements (cont’d)
Forward foreign currency contracts involve elements of market risk in excess of the amounts reflected on the Statement of Assets and Liabilities. The Fund bears the risk of an unfavorable change in the foreign exchange rate underlying the forward foreign currency contract. Risks may also arise upon entering into these contracts from the potential inability of the counterparties to meet the terms of their contracts.
(e) Swap agreements. The Fund invests in swaps for the purpose of managing its exposure to interest rate, credit or market risk, or for other purposes. The use of swaps involves risks that are different from those associated with other portfolio transactions. Swap agreements are privately negotiated in the over-the-counter market and may be entered into as a bilateral contract (“OTC Swaps”) or centrally cleared (“Centrally Cleared Swaps”). Unlike Centrally Cleared Swaps, the Fund has credit exposure to the counterparties of OTC Swaps.
In a Centrally Cleared Swap, immediately following execution of the swap, the swap agreement is submitted to a clearinghouse or central counterparty (the “CCP”) and the CCP becomes the ultimate counterparty of the swap agreement. The Fund is required to interface with the CCP through a broker, acting in an agency capacity. All payments are settled with the CCP through the broker. Upon entering into a Centrally Cleared Swap, the Fund is required to deposit initial margin with the broker in the form of cash or securities.
Swap contracts are marked-to-market daily and changes in value are recorded as unrealized appreciation (depreciation). The daily change in valuation of Centrally Cleared Swaps, if any, is recorded as a receivable or payable for variation margin on the Statement of Assets and Liabilities. Gains or losses are realized upon termination of the swap agreement. Collateral, in the form of restricted cash or securities, may be required to be held in segregated accounts with the Fund’s custodian in compliance with the terms of the swap contracts. Securities posted as collateral for swap contracts are identified in the Schedule of Investments and restricted cash, if any, is identified on the Statement of Assets and Liabilities. Risks may exceed amounts recorded in the Statement of Assets and Liabilities. These risks include changes in the returns of the underlying instruments, failure of the counterparties to perform under the contracts’ terms, and the possible lack of liquidity with respect to the swap agreements.
OTC swap payments received or made at the beginning of the measurement period are reflected as a premium or deposit, respectively, on the Statement of Assets and Liabilities. These upfront payments are amortized over the life of the swap and are recognized as realized gain or loss in the Statement of Operations. Net periodic payments received or paid by the Fund are recognized as a realized gain or loss in the Statement of Operations.
The Fund’s maximum exposure in the event of a defined credit event on a credit default swap to sell protection is the notional amount. As of October 31, 2016, the total notional value of all credit default swaps to sell protection was $34,802,000. This amount would be offset by the value of the swap’s reference entity, upfront premiums received on the swap and any amounts received from the settlement of a credit default swap where the Fund bought protection for the same referenced security/entity.
| | |
| 32 | | Legg Mason BW Alternative Credit Fund 2016 Annual Report |
For average notional amounts of swaps held during the year ended October 31, 2016, see Note 4.
Credit default swaps
The Fund enters into credit default swap (“CDS”) contracts for investment purposes, to manage its credit risk or to add leverage. CDS agreements involve one party making a stream of payments to another party in exchange for the right to receive a specified return in the event of a default by a third party, typically corporate or sovereign issuers, on a specified obligation, or in the event of a write-down, principal shortfall, interest shortfall or default of all or part of the referenced entities comprising a credit index. The Fund may use a CDS to provide protection against defaults of the issuers (i.e., to reduce risk where the Fund has exposure to an issuer) or to take an active long or short position with respect to the likelihood of a particular issuer’s default. As a seller of protection, the Fund generally receives an upfront payment or a stream of payments throughout the term of the swap provided that there is no credit event. If the Fund is a seller of protection and a credit event occurs, as defined under the terms of that particular swap agreement, the maximum potential amount of future payments (undiscounted) that the Fund could be required to make under a credit default swap agreement would be an amount equal to the notional amount of the agreement. These amounts of potential payments will be partially offset by any recovery of values from the respective referenced obligations. As a seller of protection, the Fund effectively adds leverage to its portfolio because, in addition to its total net assets, the Fund is subject to investment exposure on the notional amount of the swap. As a buyer of protection, the Fund generally receives an amount up to the notional value of the swap if a credit event occurs.
Implied spreads are the theoretical prices a lender receives for credit default protection. When spreads rise, market perceived credit risk rises and when spreads fall, market perceived credit risk falls. The implied credit spread of a particular referenced entity reflects the cost of buying/selling protection and may include upfront payments required to enter into the agreement. Wider credit spreads and decreasing market values, when compared to the notional amount of the swap, represent a deterioration of the referenced entity’s credit soundness and a greater likelihood or risk of default or other credit event occurring as defined under the terms of the agreement. Credit spreads utilized in determining the period end market value of credit default swap agreements on corporate or sovereign issues are disclosed in the Notes to Financial Statements and serve as an indicator of the current status of the payment/performance risk and represent the likelihood or risk of default for credit derivatives. For credit default swap agreements on asset-backed securities and credit indices, the quoted market prices and resulting values, particularly in relation to the notional amount of the contract as well as the annual payment rate, serve as an indication of the current status of the payment/performance risk.
The Fund’s maximum risk of loss from counterparty risk, as the protection buyer, is the fair value of the contract (this risk is mitigated by the posting of collateral by the counterparty to the Fund to cover the Fund’s exposure to the counterparty). As the protection seller, the
| | |
| Legg Mason BW Alternative Credit Fund 2016 Annual Report | | 33 |
Notes to financial statements (cont’d)
Fund’s maximum risk is the notional amount of the contract. Credit default swaps are considered to have credit risk-related contingent features since they require payment by the protection seller to the protection buyer upon the occurrence of a defined credit event.
Entering into a CDS agreement involves, to varying degrees, elements of credit, market and documentation risk in excess of the related amounts recognized on the Statement of Assets and Liabilities. Such risks involve the possibility that there will be no liquid market for these agreements, that the counterparty to the agreement may default on its obligation to perform or disagree as to the meaning of the contractual terms in the agreement, and that there will be unfavorable changes in net interest rates.
(f) Loan participations. The Fund may invest in loans arranged through private negotiation between one or more financial institutions. The Fund’s investment in any such loan may be in the form of a participation in or an assignment of the loan. In connection with purchasing participations, the Fund generally will have no right to enforce compliance by the borrower with the terms of the loan agreement related to the loan, or any rights of off-set against the borrower and the Fund may not benefit directly from any collateral supporting the loan in which it has purchased the participation.
The Fund assumes the credit risk of the borrower, the lender that is selling the participation and any other persons interpositioned between the Fund and the borrower. In the event of the insolvency of the lender selling the participation, the Fund may be treated as a general creditor of the lender and may not benefit from any off-set between the lender and the borrower.
(g) Unfunded loan commitments. The Fund may enter into certain credit agreements where all or a portion of which may be unfunded. The Fund is obligated to fund these commitments at the borrower’s discretion. The commitments are disclosed in the accompanying Schedule of Investments. At October 31, 2016, the Fund had sufficient cash and/or securities to cover these commitments.
(h) Foreign currency translation. Investment securities and other assets and liabilities denominated in foreign currencies are translated into U.S. dollar amounts based upon prevailing exchange rates on the date of valuation. Purchases and sales of investment securities and income and expense items denominated in foreign currencies are translated into U.S. dollar amounts based upon prevailing exchange rates on the respective dates of such transactions.
The Fund does not isolate that portion of the results of operations resulting from fluctuations in foreign exchange rates on investments from the fluctuations arising from changes in market prices of securities held. Such fluctuations are included with the net realized and unrealized gain or loss on investments.
Net realized foreign exchange gains or losses arise from sales of foreign currencies, including gains and losses on forward foreign currency contracts, currency gains or losses realized between the trade and settlement dates on securities transactions, and the difference
| | |
| 34 | | Legg Mason BW Alternative Credit Fund 2016 Annual Report |
between the amounts of dividends, interest, and foreign withholding taxes recorded on the Fund’s books and the U.S. dollar equivalent of the amounts actually received or paid. Net unrealized foreign exchange gains and losses arise from changes in the values of assets and liabilities, other than investments in securities, on the date of valuation, resulting from changes in exchange rates.
Foreign security and currency transactions may involve certain considerations and risks not typically associated with those of U.S. dollar denominated transactions as a result of, among other factors, the possibility of lower levels of governmental supervision and regulation of foreign securities markets and the possibility of political or economic instability.
(i) Credit and market risk. Investments in securities that are collateralized by real estate mortgages are subject to certain credit and liquidity risks. When market conditions result in an increase in default rates of the underlying mortgages and the foreclosure values of underlying real estate properties are materially below the outstanding amount of these underlying mortgages, collection of the full amount of accrued interest and principal on these investments may be doubtful. Such market conditions may significantly impair the value and liquidity of these investments and may result in a lack of correlation between their credit ratings and values.
The Fund invests in high-yield and emerging market instruments that are subject to certain credit and market risks. The yields of high-yield and emerging market debt obligations reflect, among other things, perceived credit and market risks. The Fund’s investments in securities rated below investment grade typically involve risks not associated with higher rated securities including, among others, greater risk related to timely and ultimate payment of interest and principal, greater market price volatility and less liquid secondary market trading. The consequences of political, social, economic or diplomatic changes may have disruptive effects on the market prices of investments held by the Fund. The Fund’s investments in non-U.S. dollar denominated securities may also result in foreign currency losses caused by devaluations and exchange rate fluctuations.
(j) Foreign investment risks. The Fund’s investments in foreign securities may involve risks not present in domestic investments. Since securities may be denominated in foreign currencies, may require settlement in foreign currencies or pay interest or dividends in foreign currencies, changes in the relationship of these foreign currencies to the U.S. dollar can significantly affect the value of the investments and earnings of the Fund. Foreign investments may also subject the Fund to foreign government exchange restrictions, expropriation, taxation or other political, social or economic developments, all of which affect the market and/or credit risk of the investments.
(k) Counterparty risk and credit-risk-related contingent features of derivative instruments. The Fund may invest in certain securities or engage in other transactions, where the Fund is exposed to counterparty credit risk in addition to broader market risks. The Fund may invest in securities of issuers, which may also be considered counterparties as trading partners in other transactions. This may increase the risk of loss in the event of
| | |
| Legg Mason BW Alternative Credit Fund 2016 Annual Report | | 35 |
Notes to financial statements (cont’d)
default or bankruptcy by the counterparty or if the counterparty otherwise fails to meet its contractual obligations. The Fund’s subadviser attempts to mitigate counterparty risk by (i) periodically assessing the creditworthiness of its trading partners, (ii) monitoring and/or limiting the amount of its net exposure to each individual counterparty based on its assessment and (iii) requiring collateral from the counterparty for certain transactions. Market events and changes in overall economic conditions may impact the assessment of such counterparty risk by the subadviser. In addition, declines in the values of underlying collateral received may expose the Fund to increased risk of loss.
The Fund has entered into master agreements with certain of its derivative counterparties that provide for general obligations, representations, agreements, collateral, events of default or termination and credit related contingent features. The credit related contingent features include, but are not limited to, a percentage decrease in the Fund’s net assets or NAV over a specified period of time. If these credit related contingent features were triggered, the derivatives counterparty could terminate the positions and demand payment or require additional collateral.
Collateral requirements differ by type of derivative. Collateral or margin requirements are set by the broker or exchange clearinghouse for exchange traded derivatives while collateral terms are contract specific for over-the-counter traded derivatives. Cash collateral that has been pledged to cover obligations of the Fund under derivative contracts, if any, will be reported separately in the Statement of Assets and Liabilities. Securities pledged as collateral, if any, for the same purpose are noted in the Schedule of Investments.
Absent an event of default by the counterparty or a termination of the agreement, the terms of the master agreements do not result in an offset of reported amounts of financial assets and financial liabilities in the Statement of Assets and Liabilities across transactions between the Fund and the applicable counterparty. The enforceability of the right to offset may vary by jurisdiction.
As of October 31, 2016, the Fund held forward foreign currency contracts and OTC credit default swaps with credit related contingent features which had a liability position of $4,379,588. If a contingent feature in the master agreements would have been triggered, the Fund would have been required to pay this amount to its derivatives counterparties. As of October 31, 2016, the Fund had posted with its counterparties cash and/or securities as collateral to cover the net liability of these derivatives amounting to $1,960,000, which could be used to reduce the required payment.
(I) Security transactions and investment income. Security transactions are accounted for on a trade date basis. Interest income, adjusted for amortization of premium and accretion of discount, is recorded on the accrual basis. Effective April 1, 2016, the Fund changed its methodology for accreting market discounts and amortizing market premiums on debt securities, primarily due to changes in the Fund’s portfolio composition. Prior to April 1, 2016, the Fund accreted market discounts and amortized market premiums on debt securities using the effective yield method. The accretion of market discounts and amortization of market premiums required the application of several assumptions including, but not limited to,
| | |
| 36 | | Legg Mason BW Alternative Credit Fund 2016 Annual Report |
prepayment assumptions and default rate assumptions, which were re-evaluated not less than quarterly and required the use of a significant amount of judgment. Principal write-offs were generally treated as realized losses. Paydown gains and losses on mortgage- and asset-backed securities were recorded as capital gains and losses. The Fund’s accretion of discounts and amortization of premiums for U.S. federal and other tax purposes was likely to differ from the financial accounting treatment under GAAP of these items as described above. Beginning April 1, 2016, the Fund is accreting market discounts and amortizing market premiums on debt securities using the effective interest method. Paydown gains and losses on mortgage- and asset-backed securities are recorded as adjustments to interest income. Dividend income is recorded on the ex-dividend date. Foreign dividend income is recorded on the ex-dividend date or as soon as practicable after the Fund determines the existence of a dividend declaration after exercising reasonable due diligence. The cost of investments sold is determined by use of the specific identification method. To the extent an issuer defaults or a credit event occurs that impacts the issuer, the Fund may halt any additional interest income accruals and consider the realizability of interest accrued up to the date of default or credit event.
(m) Distributions to shareholders. Distributions from net investment income of the Fund, if any, are declared and paid on a quarterly basis. Prior to April 1, 2016, distributions from net investment income of the Fund were declared daily and paid on a monthly basis. Distributions of net realized gains, if any, are declared at least annually. Distributions to shareholders of the Fund are recorded on the ex-dividend date and are determined in accordance with income tax regulations, which may differ from GAAP.
(n) Share class accounting. Investment income, common expenses and realized/unrealized gains (losses) on investments are allocated to the various classes of the Fund on the basis of daily net assets of each class. Fees relating to a specific class are charged directly to that share class.
(o) Compensating balance arrangements. The Fund has an arrangement with its custodian bank whereby a portion of the custodian’s fees is paid indirectly by credits earned on the Fund’s cash on deposit with the bank.
(p) Federal and other taxes. It is the Fund’s policy to comply with the federal income and excise tax requirements of the Internal Revenue Code of 1986 (the “Code”), as amended, applicable to regulated investment companies. Accordingly, the Fund intends to distribute its taxable income and net realized gains, if any, to shareholders in accordance with timing requirements imposed by the Code. Therefore, no federal or state income tax provision is required in the Fund’s financial statements.
Management has analyzed the Fund’s tax positions taken on income tax returns for all open tax years and has concluded that as of October 31, 2016, no provision for income tax is required in the Fund’s financial statements. The Fund’s federal and state income and federal excise tax returns for tax years for which the applicable statutes of limitations have not expired are subject to examination by the Internal Revenue Service and state departments of revenue.
Under the applicable foreign tax laws, a withholding tax may be imposed on interest, dividends and capital gains at various rates.
| | |
| Legg Mason BW Alternative Credit Fund 2016 Annual Report | | 37 |
Notes to financial statements (cont’d)
(q) Reclassification. GAAP requires that certain components of net assets be reclassified to reflect permanent differences between financial and tax reporting. These reclassifications have no effect on net assets or net asset value per share. During the current year, the following reclassifications have been made:
| | | | | | | | | | | | |
| | | Undistributed Net
Investment Income | | | Accumulated Net
Realized Loss | | | Paid-in
Capital | |
| (a) | | $ | 12,454,845 | | | | — | | | $ | (12,454,845) | |
| (b) | | | (21,556,128) | | | $ | 21,556,128 | | | | — | |
| (a) | Reclassifications are due to a tax net operating loss and a taxable overdistribution. |
| (b) | Reclassifications are due to foreign currency transactions treated as ordinary income for tax purposes, differences between book and tax accretion of market discount on fixed income securities and book/tax differences in the treatment of swap contracts. |
2. Investment management agreement and other transactions with affiliates
Legg Mason Partners Fund Advisor, LLC (“LMPFA”) is the Fund’s investment manager and Brandywine Global Investment Management, LLC (“Brandywine Global”) is the Fund’s subadviser. LMPFA and Brandywine Global are wholly-owned subsidiaries of Legg Mason, Inc. (“Legg Mason”).
Under the investment management agreement, the Fund pays an investment management fee, calculated daily and paid monthly, at an annual rate of 1.15% of the Fund’s average daily net assets.
LMPFA provides administrative and certain oversight services to the Fund. LMPFA delegates to the subadviser the day-to-day portfolio management of the Fund. LMPFA pays Brandywine Global 90% of the net management fee it receives from the Fund.
As a result of expense limitation arrangements between the Fund and LMPFA, the ratio of total annual fund operating expenses, other than interest, brokerage commissions, dividend expense on short sales, taxes, extraordinary expenses and acquired fund fees and expenses, to average net assets of Class A, Class C, Class FI, Class I and Class IS shares did not exceed 1.65%, 2.40%, 1.65%, 1.35% and 1.25%, respectively. In addition, the ratio of total annual fund operating expenses for Class IS shares did not exceed the ratio of total annual fund operating expenses for Class I shares. These expense limitation arrangements cannot be terminated prior to December 31, 2018 without the Board of Trustees’ consent.
During the year ended October 31, 2016, fees waived and/or expenses reimbursed amounted to $494,045.
LMPFA is permitted to recapture amounts waived and/or reimbursed to a class within three years after the fiscal year in which LMPFA earned the fee or incurred the expense if the class’ total annual operating expenses have fallen to a level below the expense limitation (“expense cap”) in effect at the time the fees were earned or the expenses incurred. In no case will LMPFA recapture any amount that would result, on any particular business day of the Fund, in the class’ total annual operating expenses exceeding the expense cap or any other lower limit then in effect.
| | |
| 38 | | Legg Mason BW Alternative Credit Fund 2016 Annual Report |
Pursuant to these arrangements, at October 31, 2016, the Fund had remaining fee waivers and/or expense reimbursements subject to recapture by LMPFA and respective dates of expiration as follows:
| | | | | | | | | | | | | | | | | | | | |
| | | Class A | | | Class C | | | Class FI | | | Class I | | | Class IS | |
| Expires October 31, 2017 | | | — | | | | — | | | $ | 4,665 | | | | — | | | $ | 181,364 | |
| Expires October 31, 2018 | | | — | | | | — | | | | 3 | | | | — | | | | 3,745 | |
| Expires October 31, 2019 | | $ | 48,665 | | | $ | 25,188 | | | | 5,262 | | | $ | 303,519 | | | | 111,411 | |
| Total fee waivers/expense reimbursements subject to recapture | | $ | 48,665 | | | $ | 25,188 | | | $ | 9,930 | | | $ | 303,519 | | | $ | 296,520 | |
For the year ended October 31, 2016, LMPFA recaptured $20,776, $2, $7,056, $35 and $2,417 for Class A, Class C, Class FI, Class I and Class IS shares, respectively.
Legg Mason Investor Services, LLC (‘‘LMIS’’), a wholly-owned broker-dealer subsidiary of Legg Mason, serves as the Fund’s sole and exclusive distributor.
There is a maximum initial sales charge of 4.25% for Class A shares. There is a contingent deferred sales charge (“CDSC”) of 1.00% on Class C shares, which applies if redemption occurs within 12 months from purchase payment. In certain cases, Class A shares have a 1.00% CDSC, which applies if redemption occurs within 18 months from purchase payment. This CDSC only applies to those purchases of Class A shares, which, when combined with current holdings of other shares of funds sold by LMIS, equal or exceed $1,000,000 in the aggregate. These purchases do not incur an initial sales charge.
For the year ended October 31, 2016, LMIS and its affiliates retained sales charges of $888 on sales of the Fund’s Class A shares. In addition, for the year ended October 31, 2016, CDSCs paid to LMIS and its affiliates were:
Under a Deferred Compensation Plan (the “Plan”), Trustees may have elected to defer receipt of all or a specified portion of their compensation. A participating Trustee selected one or more funds managed by affiliates of Legg Mason in which his or her deferred trustee’s fees were deemed to be invested. Deferred amounts remain in the Fund until distributed in accordance with the Plan. In May 2015, the Board of Trustees approved an amendment to the Plan so that effective January 1, 2016, no compensation earned after that date may be deferred under the Plan.
All officers and one Trustee of the Trust are employees of Legg Mason or its affiliates and do not receive compensation from the Trust.
3. Investments
During the year ended October 31, 2016, the aggregate cost of purchases and proceeds from sales of investments (excluding short-term investments) were as follows:
| | | | |
| Purchases | | $ | 722,054,764 | |
| Sales | | | 1,172,871,141 | |
| | |
| Legg Mason BW Alternative Credit Fund 2016 Annual Report | | 39 |
Notes to financial statements (cont’d)
At October 31, 2016, the aggregate gross unrealized appreciation and depreciation of investments for federal income tax purposes were as follows:
| | | | |
| Gross unrealized appreciation | | $ | 6,671,660 | |
| Gross unrealized depreciation | | | (11,272,793) | |
| Net unrealized depreciation | | $ | (4,601,133) | |
During the year ended October 31, 2016, written option transactions for the Fund were as follows:
| | | | | | | | |
| | | Number of Contracts | | | Premiums | |
| Written options, outstanding as of October 31, 2015 | | | — | | | | — | |
| Options written | | | 4,146 | | | $ | 137,033 | |
| Options closed | | | — | | | | — | |
| Options exercised | | | — | | | | — | |
| Options expired | | | (4,146) | | | | (137,033) | |
| Written options, outstanding as of October 31, 2016 | | | — | | | | — | |
At October 31, 2016, the Fund had the following open forward foreign currency contracts:
| | | | | | | | | | | | | | | | | | | | |
Currency
Purchased | | | Currency
Sold | | | Counterparty | | Settlement
Date | | | Unrealized
Appreciation
(Depreciation) | |
| BRL | | | 13,715,000 | | | USD | | | 4,044,530 | | | HSBC Bank USA, N.A. | | | 11/8/16 | | | $ | 245,238 | |
| BRL | | | 69,490,000 | | | USD | | | 20,768,702 | | | HSBC Bank USA, N.A. | | | 11/8/16 | | | | 966,329 | |
| BRL | | | 67,065,000 | | | USD | | | 20,426,096 | | | HSBC Bank USA, N.A. | | | 11/8/16 | | | | 550,446 | |
| USD | | | 16,910,198 | | | BRL | | | 55,550,000 | | | HSBC Bank USA, N.A. | | | 11/8/16 | | | | (464,690) | |
| USD | | | 77,361,683 | | | EUR | | | 69,640,000 | | | Citibank N.A. | | | 11/10/16 | | | | 890,377 | |
| EUR | | | 640,000 | | | USD | | | 714,010 | | | Morgan Stanley & Co. Inc. | | | 11/10/16 | | | | (11,230) | |
| EUR | | | 3,710,000 | | | USD | | | 4,213,061 | | | Morgan Stanley & Co. Inc. | | | 11/10/16 | | | | (139,130) | |
| EUR | | | 13,450,000 | | | USD | | | 15,093,118 | | | Morgan Stanley & Co. Inc. | | | 11/10/16 | | | | (323,746) | |
| EUR | | | 6,460,000 | | | USD | | | 7,217,581 | | | Morgan Stanley & Co. Inc. | | | 11/10/16 | | | | (123,890) | |
| USD | | | 8,201,681 | | | EUR | | | 7,260,000 | | | Morgan Stanley & Co. Inc. | | | 11/10/16 | | | | 229,514 | |
| NZD | | | 11,850,000 | | | USD | | | 8,658,771 | | | Barclays Bank PLC | | | 11/16/16 | | | | (189,744) | |
| USD | | | 8,559,611 | | | NZD | | | 11,850,000 | | | Morgan Stanley & Co. Inc. | | | 11/16/16 | | | | 90,584 | |
| USD | | | 7,216,422 | | | GBP | | | 5,700,000 | | | Barclays Bank PLC | | | 12/9/16 | | | | 234,039 | |
| GBP | | | 5,640,000 | | | USD | | | 7,587,943 | | | Morgan Stanley & Co. Inc. | | | 12/9/16 | | | | (679,059) | |
| USD | | | 11,420,476 | | | IDR | | | 151,150,000,000 | | | HSBC Bank USA, N.A. | | | 1/27/17 | | | | (14,688) | |
| Total | | | $ | 1,260,350 | |
| | |
Abbreviations used in this table: |
| BRL | | — Brazilian Real |
| EUR | | — Euro |
| GBP | | — British Pound |
| IDR | | — Indonesian Rupiah |
| NZD | | — New Zealand Dollar |
| USD | | — United States Dollar |
| | |
| 40 | | Legg Mason BW Alternative Credit Fund 2016 Annual Report |
At October 31, 2016, the Fund had the following open swap contracts:
| | | | | | | | | | | | | | | | | | | | | | |
| CENTRALLY CLEARED CREDIT DEFAULT SWAPS ON CREDIT INDICES — SELL PROTECTION1 | |
Central Counterparty
(Reference Entity) | | Notional
Amount2 | | | Termination
Date | | | Periodic
Payments
Received by
the Fund† | | Market
Value3 | | | Upfront
Premiums
Paid
(Received) | | | Unrealized
Depreciation | |
| InterContinental Exchange (Markit CDX.NA.HY.27 Index) | | $ | 17,747,000 | | | | 12/20/21 | | | 5.000% quarterly | | $ | 596,210 | | | $ | 735,835 | | | $ | (139,625) | |
| | | | | | | | | | | | | | | | | | | | | | | | | | |
| OTC CREDIT DEFAULT SWAPS ON CORPORATE ISSUES — SELL PROTECTION1 | |
Swap Counterparty
(Reference Entity) | | Notional
Amount2 | | | Termination
Date | | | Implied
Credit
Spread at
October 31,
20164 | | | Periodic
Payments
Received by
the Fund† | | Market
Value | | | Upfront
Premiums
Paid
(Received) | | | Unrealized
Appreciation | |
| Citigroup Global Markets Inc. (Chesapeake Energy Corp., 6.625%, due 8/15/20) | | $ | 5,740,000 | | | | 12/20/21 | | | | 8.20% | | | 5.000% quarterly | | $ | (775,103) | | | $ | (932,675) | | | $ | 157,572 | |
Morgan Stanley & Co. Inc. (Chesapeake Energy Corp., 6.625%, due 8/15/20) | | | 4,595,000 | | | | 12/20/21 | | | | 8.20% | | | 5.000% quarterly | | | (620,488) | | | | (752,283) | | | | 131,795 | |
| Total | | $ | 10,335,000 | | | | | | | | | | | | | $ | (1,395,591) | | | $ | (1,684,958) | | | $ | 289,367 | |
| | | | | | | | | | | | | | | | | | | | | | |
| OTC CREDIT DEFAULT SWAPS ON CREDIT INDICES — SELL PROTECTION1 | |
Swap Counterparty
(Reference Entity) | | Notional
Amount2 | | | Termination
Date | | | Periodic
Payments
Received by
the Fund† | | Market
Value3 | | | Upfront
Premiums
Paid
(Received) | | |
Unrealized
Depreciation | |
| Morgan Stanley & Co. Inc. (Markit CMBX.NA.BB.6 Index) | | $ | 6,720,000 | | | | 5/11/63 | | | 5.000% monthly | | $ | (1,037,820) | | | $ | (472,110) | | | $ | (565,710) | |
|
| OTC CREDIT DEFAULT SWAPS ON CREDIT INDICES — BUY PROTECTION5 | |
Swap Counterparty
(Reference Entity) | | Notional
Amount2 | | | Termination
Date | | | Periodic
Payments
Made by
the Fund† | | Market
Value3 | | | Upfront
Premiums
Paid
(Received) | | | Unrealized
Appreciation | |
| JPMorgan Securities Inc. (CMBX.NA.BB.6 Index) | | $ | 6,720,000 | | | | 5/11/63 | | | 5.000% monthly | | $ | 1,037,820 | | | $ | 796,503 | | | $ | 241,317 | |
| 1 | If the Fund is a seller of protection and a credit event occurs, as defined under the terms of that particular swap agreement, the Fund will either (i) pay to the buyer of protection an amount equal to the notional amount of the swap and take delivery of the referenced obligation or underlying securities comprising the referenced index or (ii) pay a net settlement amount in the form of cash or securities equal to the notional amount of the swap less the recovery value of the referenced obligation or underlying securities comprising the referenced index. |
| 2 | The maximum potential amount the Fund could be required to pay as a seller of credit protection or receive as a buyer of credit protection if a credit event occurs as defined under the terms of that particular swap agreement. |
| 3 | The quoted market prices and resulting values for credit default swap agreements on asset-backed securities and credit indices serve as an indicator of the current status of the payment/performance risk and represent the likelihood of an expected liability (or profit) for the credit derivative had the notional amount of the swap agreement been closed/sold as of the period end. Decreasing market values (sell protection) or increasing market values (buy protection) when compared to the notional amount of the swap, represent a deterioration of the referenced entity’s credit soundness and a greater likelihood or risk of default or other credit event occurring as defined under the terms of the agreement. |
| | |
| Legg Mason BW Alternative Credit Fund 2016 Annual Report | | 41 |
Notes to financial statements (cont’d)
| 4 | Implied credit spreads, utilized in determining the market value of credit default swap agreements on corporate or sovereign issues as of period end, serve as an indicator of the current status of the payment/performance risk and represent the likelihood or risk of default for the credit derivative. The implied credit spread of a particular referenced entity reflects the cost of buying/selling protection and may include upfront payments required to be made to enter into the agreement. Wider credit spreads represent a deterioration of the referenced entity’s credit soundness and a greater likelihood or risk of default or other credit event occurring as defined under the terms of the agreement. A credit spread identified as “Defaulted” indicates a credit event has occurred for the referenced entity or obligation. |
| 5 | If the Fund is a buyer of protection and a credit event occurs, as defined under the terms of that particular swap agreement, the Fund will either (i) receive from the seller of protection an amount equal to the notional amount of the swap and deliver the referenced obligation or the underlying securities comprising the referenced index or (ii) receive a net settlement amount in the form of cash or securities equal to the notional amount of the swap less the recovery value of the referenced obligation or the underlying securities comprising the referenced index. |
| † | Percentage shown is an annual percentage rate. |
4. Derivative instruments and hedging activities
Below is a table, grouped by derivative type, that provides information about the fair value and the location of derivatives within the Statement of Assets and Liabilities at October 31, 2016.
| | | | | | | | | | | | |
| ASSET DERIVATIVES1 | |
| | | Foreign
Exchange Risk | | | Credit Risk | | | Total | |
| OTC swap contracts2 | | | — | | | $ | 1,037,820 | | | $ | 1,037,820 | |
| Forward foreign currency contracts | | $ | 3,206,527 | | | | — | | | | 3,206,527 | |
| Total | | $ | 3,206,527 | | | $ | 1,037,820 | | | $ | 4,244,347 | |
| | | | | | | | | | | | |
| LIABILITY DERIVATIVES1 | |
| | | Foreign
Exchange Risk | | | Credit Risk | | | Total | |
| OTC swap contracts2 | | | — | | | $ | 2,433,411 | | | $ | 2,433,411 | |
| Centrally cleared swap contracts3 | | | — | | | | 139,625 | | | | 139,625 | |
| Forward foreign currency contracts | | $ | 1,946,177 | | | | — | | | | 1,946,177 | |
| Total | | $ | 1,946,177 | | | $ | 2,573,036 | | | $ | 4,519,213 | |
| 1 | Generally, the balance sheet location for asset derivatives is receivables/net unrealized appreciation (depreciation) and for liability derivatives is payables/net unrealized appreciation (depreciation). |
| 2 | Values include premiums paid (received) on swap contracts which are shown separately in the Statement of Assets and Liabilities. |
| 3 | Includes cumulative appreciation (depreciation) of centrally cleared swap contracts as reported in the footnotes. Only variation margin is reported within the receivables and/or payables on the Statement of Assets and Liabilities. |
The following tables provide information about the effect of derivatives and hedging activities on the Fund’s Statement of Operations for the year ended October 31, 2016. The first table provides additional detail about the amounts and sources of gains (losses) realized on derivatives during the period. The second table provides additional information about the change in unrealized appreciation (depreciation) resulting from the Fund’s derivatives and hedging activities during the period.
| | |
| 42 | | Legg Mason BW Alternative Credit Fund 2016 Annual Report |
| | | | | | | | | | | | | | | | | | | | |
| AMOUNT OF REALIZED GAIN (LOSS) ON DERIVATIVES RECOGNIZED | |
| | | Interest
Rate Risk | | | Foreign
Exchange Risk | | | Credit Risk | | | Equity Risk | | | Total | |
| Futures contracts | | $ | 9,475,276 | | | | — | | | | — | | | $ | (3,207,640) | | | $ | 6,267,636 | |
| Written options | | | — | | | | — | | | | — | | | | 137,033 | | | | 137,033 | |
| Swap contracts | | | — | | | | — | | | $ | 9,586,130 | | | | — | | | | 9,586,130 | |
| Forward foreign currency contracts1 | | | — | | | $ | (6,543,046) | | | | — | | | | — | | | | (6,543,046) | |
| Total | | $ | 9,475,276 | | | $ | (6,543,046) | | | $ | 9,586,130 | | | $ | (3,070,607) | | | $ | 9,447,753 | |
| 1 | Net realized gain (loss) from forward foreign currency contracts is reported in net realized gain (loss) from foreign currency transactions in the Statement of Operations. |
| | | | | | | | | | | | |
| CHANGE IN UNREALIZED APPRECIATION (DEPRECIATION) ON DERIVATIVES RECOGNIZED | |
| | | Foreign
Exchange Risk | | | Credit Risk | | | Total | |
| Swap contracts | | | — | | | $ | 318,680 | | | $ | 318,680 | |
| Forward foreign currency contracts1 | | $ | 6,042,899 | | | | — | | | | 6,042,899 | |
| Total | | $ | 6,042,899 | | | $ | 318,680 | | | $ | 6,361,579 | |
| 1 | The change in unrealized appreciation (depreciation) from forward foreign currency contracts is reported in the change in net unrealized appreciation (depreciation) from foreign currencies in the Statement of Operations. |
During the year ended October 31, 2016, the volume of derivative activity for the Fund was as follows:
| | | | |
| | | Average Market
Value | |
| Written options† | | $ | 33,963 | |
| Futures contracts (to buy)† | | | 80,728,523 | |
| Futures contracts (to sell)† | | | 4,391,624 | |
| Forward foreign currency contracts (to buy) | | | 179,050,624 | |
| Forward foreign currency contracts (to sell) | | | 393,962,702 | |
| |
| | | Average Notional
Balance | |
| Credit default swap contracts (to buy protection) | | $ | 20,553,751 | |
| Credit default swap contracts (to sell protection) | | | 91,396,331 | |
| † | At October 31, 2016, there were no open positions held in this derivative. |
The following table presents by financial instrument, the Fund’s derivative assets net of the related collateral received by the Fund at October 31, 2016:
| | | | | | | | | | | | |
| | | Gross Amount of Derivative
Assets in the Statement of
Assets and Liabilities1 | | | Collateral
Received2,3 | | | Net
Amount | |
| Centrally cleared swap contracts4 | | $ | 466,674 | | | | — | | | $ | 466,674 | |
| OTC swap contracts | | | 1,037,820 | | | $ | (1,037,820) | | | | — | |
| Forward foreign currency contracts | | | 3,206,527 | | | | — | | | | 3,206,527 | |
| Total | | $ | 4,711,021 | | | $ | (1,037,820) | | | $ | 3,673,201 | |
| | |
| Legg Mason BW Alternative Credit Fund 2016 Annual Report | | 43 |
Notes to financial statements (cont’d)
The following table presents by financial instrument, the Fund’s derivative liabilities net of the related collateral pledged by the Fund at October 31, 2016:
| | | | | | | | | | | | |
| | | Gross Amount of Derivative
Liabilities in the Statement
of Assets and Liabilities1 | | | Collateral
Pledged2,3 | | | Net
Amount | |
| Forward foreign currency contracts | | $ | 1,946,177 | | | | — | | | $ | 1,946,177 | |
| OTC swap contracts | | | 2,433,411 | | | $ | (1,960,000) | | | | 473,411 | |
| Total | | $ | 4,379,588 | | | $ | (1,960,000) | | | $ | 2,419,588 | |
| 1 | Absent an event of default or early termination, derivative assets and liabilities are presented gross and not offset in the Statement of Assets and Liabilities. |
| 2 | Gross amounts are not offset in the Statement of Assets and Liabilities. |
| 3 | In some instances, the actual collateral received and/or pledged may be more than the amount shown here due to overcollateralization. |
| 4 | Amount represents the current day’s variation margin as reported in the Statement of Assets and Liabilities. It differs from the cumulative appreciation (depreciation) presented in the previous table. |
5. Class specific expenses, waivers and/or expense reimbursements
The Fund has adopted a Rule 12b-1 shareholder services and distribution plan and under that plan the Fund pays service and/or distribution fees with respect to its Class A, Class C and Class FI shares calculated at the annual rate of 0.25%, 1.00% and 0.25% of the average daily net assets of each class, respectively. Service and/or distribution fees are accrued daily and paid monthly.
For the year ended October 31, 2016, class specific expenses were as follows:
| | | | | | | | |
| | | Service and/or
Distribution Fees | | | Transfer Agent
Fees | |
| Class A | | $ | 134,059 | | | $ | 62,967 | |
| Class C | | | 255,250 | | | | 26,777 | |
| Class FI | | | 3,642 | | | | 100 | |
| Class I | | | — | | | | 391,910 | |
| Class IS | | | — | | | | 2,135 | |
| Total | | $ | 392,951 | | | $ | 483,889 | |
For the year ended October 31, 2016, waivers and/or expense reimbursements by class were as follows:
| | | | |
| | | Waivers/Expense
Reimbursements | |
| Class A | | $ | 48,665 | |
| Class C | | | 25,188 | |
| Class FI | | | 5,262 | |
| Class I | | | 303,519 | |
| Class IS | | | 111,411 | |
| Total | | $ | 494,045 | |
| | |
| 44 | | Legg Mason BW Alternative Credit Fund 2016 Annual Report |
6. Distributions to shareholders by class
| | | | | | | | |
| | | Year Ended
October 31, 2016 | | | Year Ended
October 31, 2015 | |
| Net Investment Income: | |
| Class A | | $ | 2,817,138 | | | $ | 2,611,494 | |
| Class C | | | 1,016,057 | | | | 480,347 | |
| Class FI | | | 91,938 | | | | 347,758 | |
| Class I | | | 16,087,269 | | | | 13,981,785 | |
| Class IS | | | 3,349,563 | | | | 3,219,610 | |
| Total | | $ | 23,361,965 | | | $ | 20,640,994 | |
|
| Net Realized Gains: | |
| Class A | | | — | | | $ | 4,051,941 | |
| Class C | | | `— | | | | 631,123 | |
| Class FI | | | — | | | | 667,353 | |
| Class I | | | — | | | | 10,878,812 | |
| Class IS | | | — | | | | 4,748,835 | |
| Total | | | — | | | $ | 20,978,064 | |
| | |
| Return of Capital: | | | | | | | | |
| Class A | | $ | 141,019 | | | | — | |
| Class C | | | 19,321 | | | | — | |
| Class FI | | | 3,553 | | | | — | |
| Class I | | | 1,284,273 | | | | — | |
| Class IS | | | 324,627 | | | | — | |
| Total | | $ | 1,772,793 | | | | — | |
7. Shares of beneficial interest
At October 31, 2016, the Trust had an unlimited number of shares of beneficial interest authorized with a par value of $0.00001 per share. The Fund has the ability to issue multiple classes of shares. Each class of shares represents an identical interest and has the same rights, except that each class bears certain direct expenses, including those specifically related to the distribution of its shares.
Transactions in shares of each class were as follows:
| | | | | | | | | | | | | | | | |
| | | Year Ended
October 31, 2016 | | | Year Ended
October 31, 2015 | |
| | | Shares | | | Amount | | | Shares | | | Amount | |
| Class A | | | | | | | | | | | | | | | | |
| Shares sold | | | 740,160 | | | $ | 7,099,103 | | | | 11,683,558 | | | $ | 123,590,289 | |
| Shares issued on reinvestment | | | 309,343 | | | | 2,907,228 | | | | 626,566 | | | | 6,553,559 | |
| Shares repurchased | | | (9,680,049) | | | | (91,722,131) | | | | (10,741,900) | | | | (111,622,109) | |
| Net increase (decrease) | | | (8,630,546) | | | $ | (81,715,800) | | | | 1,568,224 | | | $ | 18,521,739 | |
| | |
| Legg Mason BW Alternative Credit Fund 2016 Annual Report | | 45 |
Notes to financial statements (cont’d)
| | | | | | | | | | | | | | | | |
| | | Year Ended
October 31, 2016 | | | Year Ended
October 31, 2015 | |
| | | Shares | | | Amount | | | Shares | | | Amount | |
| Class C | | | | | | | | | | | | | | | | |
| Shares sold | | | 116,190 | | | $ | 1,110,180 | | | | 3,670,033 | | | $ | 38,977,065 | |
| Shares issued on reinvestment | | | 108,299 | | | | 1,017,597 | | | | 104,781 | | | | 1,091,683 | |
| Shares repurchased | | | (2,128,729) | | | | (20,137,659) | | | | (1,419,520) | | | | (14,551,679) | |
| Net increase (decrease) | | | (1,904,240) | | | $ | (18,009,882) | | | | 2,355,294 | | | $ | 25,517,069 | |
| | | | |
| Class FI | | | | | | | | | | | | | | | | |
| Shares sold | | | 11,553 | | | $ | 109,037 | | | | 1,587,717 | | | $ | 16,660,592 | |
| Shares issued on reinvestment | | | 10,160 | | | | 95,491 | | | | 96,581 | | | | 1,014,821 | |
| Shares repurchased | | | (263,685) | | | | (2,461,828) | | | | (3,379,335) | | | | (34,802,691) | |
| Net decrease | | | (241,972) | | | $ | (2,257,300) | | | | (1,695,037) | | | $ | (17,127,278) | |
| | | | |
| Class I | | | | | | | | | | | | | | | | |
| Shares sold | | | 12,362,295 | | | $ | 117,042,126 | | | | 77,350,882 | | | $ | 815,957,129 | |
| Shares issued on reinvestment | | | 1,756,839 | | | | 16,506,609 | | | | 2,351,715 | | | | 24,488,924 | |
| Shares repurchased | | | (50,304,109) | | | | (475,904,929) | | | | (44,194,086) | | | | (455,075,783) | |
| Net increase (decrease) | | | (36,184,975) | | | $ | (342,356,194) | | | | 35,508,511 | | | $ | 385,370,270 | |
| | | | |
| Class IS | | | | | | | | | | | | | | | | |
| Shares sold | | | 5,581,700 | | | $ | 52,092,091 | | | | 5,384,536 | | | $ | 56,949,079 | |
| Shares issued on reinvestment | | | 353,873 | | | | 3,326,835 | | | | 667,141 | | | | 6,986,469 | |
| Shares repurchased | | | (6,350,084) | | | | (60,302,754) | | | | (9,288,805) | | | | (96,570,140) | |
| Net decrease | | | (414,511) | | | $ | (4,883,828) | | | | (3,237,128) | | | $ | (32,634,592) | |
8. Redemption facility
Effective November 24, 2015, the Fund and certain other participating funds within the Trust (the “Participating Funds”), have available an unsecured revolving credit facility (the “Redemption Facility”) from the lenders and The Bank of New York Mellon (“BNY Mellon”), as administrative agent for the lenders. The Redemption Facility is to be used for temporary or emergency purposes as an additional source of liquidity to fund redemptions of shares. Under the agreement, BNY Mellon provides a 364-day revolving credit facility, in the aggregate amount of $190 million. Unless renewed, the agreement will terminate on November 22, 2016. Any borrowings under the Redemption Facility will bear interest at current market rates as set forth in the credit agreement. The annual commitment fee to maintain the Redemption Facility is 0.10% and is incurred on the unused portion of the facility and is allocated to all Participating Funds pro rata based on net assets. For the period ended October 31, 2016, the Fund incurred a commitment fee in the amount of $20,667. The Fund did not utilize the Redemption Facility during the period ended October 31, 2016.
| | |
| 46 | | Legg Mason BW Alternative Credit Fund 2016 Annual Report |
9. Income tax information and distributions to shareholders
The tax character of distributions paid during the fiscal years ended October 31, was as follows:
| | | | | | | | |
| | | 2016 | | | 2015 | |
| Distributions paid from: | | | | | | | | |
| Ordinary Income | | $ | 23,361,965 | | | $ | 30,279,716 | |
| Net long-term capital gains | | | — | | | | 11,339,342 | |
| Total taxable distributions | | $ | 23,361,965 | | | $ | 41,619,058 | |
| Tax return of capital | | | 1,772,793 | | | | — | |
| Total distributions paid | | $ | 25,134,758 | | | $ | 41,619,058 | |
As of October 31, 2016, the components of accumulated earnings on a tax basis were as follows:
| | | | |
| Deferred capital losses* | | $ | (87,922,281) | |
| Other book/tax temporary differences(a) | | | (1,492,730) | |
| Unrealized appreciation (depreciation)(b) | | | (3,517,539) | |
| Total accumulated earnings (losses) — net | | $ | (92,932,550) | |
| * | These capital losses have been deferred in the current year as either short-term or long-term losses. The losses will be deemed to occur on the first day of the next taxable year in the same character as they were originally deferred and will be available to offset future taxable capital gains. |
| (a) | Other book/tax temporary differences are attributable to the tax deferral of losses on straddles, the realization for tax purposes of unrealized gains (losses) on foreign currency contracts and book/tax differences in the timing of the deductibility of various expenses. |
| (b) | The difference between book-basis and tax-basis unrealized appreciation (depreciation) is attributable to the difference between book and tax accretion of market discount on fixed income securities. |
10. Recent accounting pronouncement
In October 2016, the U.S. Securities and Exchange Commission adopted new rules and amended existing rules (together, the “final rules”) intended to modernize the reporting and disclosure of information by registered investment companies. In part, the final rules amend Regulation S-X and require standardized, enhanced disclosure about derivatives in investment company financial statements, as well as other amendments. The compliance date for the amendments to Regulation S-X is August 1, 2017. Management is currently evaluating the impact that the adoption of the amendments to Regulation S-X will have on the Fund’s financial statements and related disclosures.
11. Subsequent event
Effective November 21, 2016, the Redemption Facility was renewed for a 364-day term. Under the agreement, BNY Mellon provides a 364-day revolving credit facility, in the aggregate amount of $190 million. Unless renewed, the agreement will terminate on November 20, 2017. Any borrowings under the Redemption Facility will bear interest at current market rates as set forth in the credit agreement. The annual commitment fee to maintain the Redemption Facility is 0.10% and is incurred on the unused portion of the facility and is allocated to all Participating Funds pro rata based on net assets.
| | |
| Legg Mason BW Alternative Credit Fund 2016 Annual Report | | 47 |
Report of independent registered public accounting firm
To the Trustees of Legg Mason Global Asset Management Trust and to the Shareholders of Legg Mason BW Alternative Credit Fund:
In our opinion, the accompanying statement of assets and liabilities, including the schedule of investments, and the related statements of operations and of changes in net assets and the financial highlights present fairly, in all material respects, the financial position of the Legg Mason BW Alternative Credit Fund (one of the funds comprising Legg Mason Global Asset Management Trust, the “Fund”) as of October 31, 2016, the results of its operations, the changes in its net assets and the financial highlights for each of the periods presented, in conformity with accounting principles generally accepted in the United States of America. These financial statements and financial highlights (hereafter referred to as “financial statements”) are the responsibility of the Fund’s management. Our responsibility is to express an opinion on these financial statements based on our audits. We conducted our audits of these financial statements in accordance with the standards of the Public Company Accounting Oversight Board (United States). Those standards require that we plan and perform the audit to obtain reasonable assurance about whether the financial statements are free of material misstatement. An audit includes examining, on a test basis, evidence supporting the amounts and disclosures in the financial statements, assessing the accounting principles used and significant estimates made by management, and evaluating the overall financial statement presentation. We believe that our audits, which included confirmation of securities as of October 31, 2016 by correspondence with the custodian and brokers, provide a reasonable basis for our opinion.
PricewaterhouseCoopers LLP
Baltimore, MD
December 19, 2016
| | |
| 48 | | Legg Mason BW Alternative Credit Fund 2016 Annual Report |
Additional information (unaudited)
Information about Trustees and Officers
The business and affairs of Legg Mason BW Alternative Credit Fund (the “Fund”) are conducted by management under the supervision and subject to the direction of its Board of Trustees. The business address of each Trustee is c/o Jane Trust, Legg Mason, 100 International Drive, 11th Floor, Baltimore, Maryland 21202. Information pertaining to the Trustees and officers of the Fund is set forth below.
The Statement of Additional Information includes additional information about Trustees and is available, without charge, upon request by calling the Fund at 1-877-721-1926.
| | |
| Independent Trustees† |
| Ruby P. Hearn |
| Year of birth | | 1940 |
| Position(s) with Trust | | Trustee |
| Term of office1 and length of time served2 | | Since 2004 |
| Principal occupation(s) during past five years | | Senior Vice President Emerita of The Robert Wood Johnson Foundation (non-profit) since 2001; Member of the Institute of Medicine since 1982; formerly, Trustee of the New York Academy of Medicine (2004 to 2012); Director of the Institute for Healthcare Improvement (2002 to 2012); Senior Vice President of The Robert Wood Johnson Foundation (1996 to 2001); Fellow of The Yale Corporation (1992 to 1998) |
| Number of funds in fund complex overseen by Trustee | | 21 |
| Other board memberships held by Trustee during past five years | | None |
|
| Arnold L. Lehman |
| Year of birth | | 1944 |
| Position(s) with Trust | | Trustee and Chairman |
| Term of office1 and length of time served2 | | Since 1982 and since 2015 |
| Principal occupation(s) during past five years | | Senior Advisor, Phillips Auctioneer since 2015; Trustee of American Federation of Arts since 1998; formerly, Fellow, Ford Foundation (2015 to 2016); Director of the Brooklyn Museum (1997 to 2015); Director of The Baltimore Museum of Art (1979 to 1997) |
| Number of funds in fund complex overseen by Trustee | | 21 |
| Other board memberships held by Trustee during past five years | | None |
|
| Robin J.W. Masters |
| Year of birth | | 1955 |
| Position(s) with Trust | | Trustee |
| Term of office1 and length of time served2 | | Since 2002 |
| Principal occupation(s) during past five years | | Retired; formerly, Chief Investment Officer of ACE Limited (insurance) (1986 to 2000) |
| Number of funds in fund complex overseen by Trustee | | 21 |
| Other board memberships held by Trustee during past five years | | Director of Cheyne Capital International Limited (investment advisory firm); formerly, Director/Trustee of Legg Mason Institutional Funds plc, WA Fixed Income Funds plc and Western Asset Debt Securities Fund plc. (2007 to 2011) |
| | |
| Legg Mason BW Alternative Credit Fund | | 49 |
Additional information (unaudited) (cont’d)
Information about Trustees and Officers
| | |
| Independent Trustees† cont’d |
| Jill E. McGovern |
| Year of birth | | 1944 |
| Position(s) with Trust | | Trustee |
| Term of office1 and length of time served2 | | Since 1989 |
| Principal occupation(s) during past five years | | Senior Consultant, American Institute for Contemporary German Studies (AICGS) since 2007; formerly, Chief Executive Officer of The Marrow Foundation (non-profit) (1993 to 2007); Executive Director of the Baltimore International Festival (1991 to 1993); Senior Assistant to the President of The Johns Hopkins University (1986 to 1990) |
| Number of funds in fund complex overseen by Trustee | | 21 |
| Other board memberships held by Trustee during past five years | | Director of International Biomedical Research Alliance; Director of Lois Roth Endowment |
|
| Arthur S. Mehlman |
| Year of birth | | 1942 |
| Position(s) with Trust | | Trustee |
| Term of office1 and length of time served2 | | Since 2002 |
| Principal occupation(s) during past five years | | Retired. Director, The University of Maryland Foundation since 1992; Director, The League for People with Disabilities since 2003; formerly, Director, Municipal Mortgage & Equity LLC (2004 to 2011); Partner, KPMG LLP (international accounting firm) (1972 to 2002) |
| Number of funds in fund complex overseen by Trustee | | Director/Trustee of all Legg Mason Funds consisting of 21 portfolios; Director/Trustee of the Royce Family of Funds consisting of 23 portfolios |
| Other board memberships held by Trustee during past five years | | Director of Municipal Mortgage & Equity, LLC. (2004 to 2011) |
|
| G. Peter O’Brien |
| Year of birth | | 1945 |
| Position(s) with Trust | | Trustee |
| Term of office1 and length of time served2 | | Since 1999 |
| Principal occupation(s) during past five years | | Retired. Trustee Emeritus of Colgate University; Board Member, Hill House, Inc. (residential home care); Board Member, Bridges School (pre- school); formerly, Managing Director, Equity Capital Markets Group of Merrill Lynch & Co. (1971 to 1999) |
| Number of funds in fund complex overseen by Trustee | | Director/Trustee of all Legg Mason funds consisting of 21 portfolios; Director/Trustee of the Royce Family of Funds consisting of 23 portfolios |
| Other board memberships held by Trustee during past five years | | Director of TICC Capital Corp. |
| | |
| 50 | | Legg Mason BW Alternative Credit Fund |
| | |
| Independent Trustees† cont’d |
| S. Ford Rowan |
| Year of birth | | 1943 |
| Position(s) with Trust | | Trustee |
| Term of office1 and length of time served2 | | Since 2002 |
| Principal occupation(s) during past five years | | Chairman, National Center for Critical Incident Analysis, since 2004; Consultant to University of Maryland University College, since 2013; formerly, Lecturer in Organizational Sciences, George Washington University (2000 to 2014); Trustee, St. John’s College (2006 to 2012); Consultant, Rowan & Blewitt Inc. (management consulting) (1984 to 2007); Lecturer in Journalism, Northwestern University (1980 to 1993); Director, Santa Fe Institute (1999 to 2008) |
| Number of funds in fund complex overseen by Trustee | | 21 |
| Other board memberships held by Trustee during past five years | | None |
|
| Robert M. Tarola |
| Year of birth | | 1950 |
| Position(s) with Trust | | Trustee |
| Term of office1 and length of time served2 | | Since 2004 |
| Principal occupation(s) during past five years | | Executive Vice President and Chief Financial Officer, Southcoast Health System, Inc. (healthcare provider network) since 2015; President of Right Advisory LLC (corporate finance and governance consulting) since 2008; Member, Investor Advisory Group of the Public Company Accounting Oversight Board since 2009; formerly, Senior Vice President and Chief Financial Officer of The Howard University (2009 to 2013) (higher education and health care); Senior Vice President and Chief Financial Officer of W.R. Grace & Co. (specialty chemicals) (1999 to 2008) and MedStar Health, Inc. (healthcare) (1996 to 1999); Partner, Price Waterhouse, LLP (accounting and auditing) (1984 to 1996) |
| Number of funds in fund complex overseen by Trustee | | 21 |
| Other board memberships held by Trustee during past five years | | Director of American Kidney Fund (renal disease assistance); Director of XBRL International, Inc. (global data standard setting); Director of Vista Outdoor, Inc. (sporting goods) |
| | |
| Legg Mason BW Alternative Credit Fund | | 51 |
Additional information (unaudited) (cont’d)
Information about Trustees and Officers
| | |
| Interested Trustee |
| Jane Trust3 | | |
| Year of birth | | 1962 |
| Position(s) with Trust | | Trustee, President and Chief Executive Officer |
| Term of office1 and length of time served2 | | Since 2015 |
| Principal occupation(s) during past five years | | Managing Director of Legg Mason & Co., LLC (“Legg Mason & Co.”) (since 2016); Officer and/or Trustee/Director of 159 funds associated with Legg Mason Partners Fund Advisor, LLC (“LMPFA”) or its affiliates (since 2015); President and Chief Executive Officer of LMPFA (since 2015); formerly, Senior Vice President of LMPFA (2015); Director of ClearBridge, LLC (formerly, Legg Mason Capital Management, LLC) (2007 to 2014); Managing Director of Legg Mason Investment Counsel & Trust Co. (2000 to 2007) |
| Number of funds in fund complex overseen by Trustee | | 152 |
Other board memberships held by Trustee during past
five years | | None |
| | |
| Executive Officers |
Richard F. Sennett Legg Mason 100 International Drive, 7th Floor, Baltimore, MD 21202 | | |
| Year of birth | | 1970 |
| Position(s) with Trust | | Principal Financial Officer |
| Term of office1 and length of time served2 | | Since 2011 |
| Principal occupation(s) during past five years | | Principal Financial Officer and Treasurer of certain mutual funds associated with Legg Mason & Co. or its affiliates (since 2011 and since 2013); Managing Director of Legg Mason & Co. and Senior Manager of the Treasury Policy group for Legg Mason & Co.’s Global Fiduciary Platform (since 2011); formerly, Chief Accountant within the SEC’s Division of Investment Management (2007 to 2011); Assistant Chief Accountant within the SEC’s Division of Investment Management (2002 to 2007) |
| |
Robert I. Frenkel Legg Mason 100 First Stamford Place, 6th Floor, Stamford, CT 06902 | | |
| Year of birth | | 1954 |
| Position(s) with Trust | | Secretary and Chief Legal Officer |
| Term of office1 and length of time served2 | | Since 2007 |
| Principal occupation(s) during past five years | | Vice President and Deputy General Counsel of Legg Mason (since 2006); Managing Director and General Counsel of — U.S. Mutual Funds for Legg Mason & Co. (since 2006) and Legg Mason & Co. predecessors (since 1994); Secretary and Chief Legal Officer of certain mutual funds associated with Legg Mason & Co. or its affiliates (since 2006) and Legg Mason & Co. predecessors (prior to 2006) |
| | |
| 52 | | Legg Mason BW Alternative Credit Fund |
| | |
| Executive Officers cont’d |
Ted P. Becker
Legg Mason 620 Eighth Avenue, 49th Floor, New York, NY 10018 | | |
| Year of birth | | 1951 |
| Position(s) with Trust | | Vice President and Chief Compliance Officer |
| Term of office1 and length of time served2 | | Since 2007 |
| Principal occupation(s) during past five years | | Director of Global Compliance at Legg Mason (since 2006); Chief Compliance Officer of LMPFA (since 2006); Managing Director of Compliance of Legg Mason & Co. (since 2005); Chief Compliance Officer of certain mutual funds associated with Legg Mason & Co. or its affiliates (since 2006) and Legg Mason & Co. predecessors (prior to 2006) |
| |
Christopher Berarducci Legg Mason 620 Eighth Avenue, 49th Floor, New York, NY 10018 | | |
| Year of birth | | 1974 |
| Position(s) with Trust | | Treasurer |
| Term of office1 and length of time served2 | | Since 2010 |
| Principal occupation(s) during past five years | | Director of Legg Mason & Co. (since 2015); Treasurer of certain mutual funds associated with Legg Mason & Co. or its affiliates (since 2010); formerly, Vice President of Legg Mason & Co. (2011 to 2015); Assistant Controller of certain mutual funds associated with Legg Mason & Co. or its affiliates (prior to 2010) |
| |
Susan Kerr Legg Mason 620 Eighth Avenue, 49th Floor, New York, NY 10018 | | |
| Year of birth | | 1949 |
| Position(s) with Trust | | Chief Anti-Money Laundering Compliance Officer |
| Term of office1 and length of time served2 | | Since 2013 |
| Principal occupation(s) during past five years | | Assistant Vice President of Legg Mason & Co. and Legg Mason Investor Services, LLC (“LMIS”) (since 2010); Chief Anti-Money Laundering Compliance Officer of certain mutual funds associated with Legg Mason & Co. or its affiliates (since 2013) and Anti-Money Laundering Compliance Officer of LMIS (since 2012); Senior Compliance Officer of LMIS (since 2011); formerly, AML Consultant, DTCC (2010); AML Consultant, Rabobank Netherlands, (2009); First Vice President, Director of Marketing & Advertising Compliance and Manager of Communications Review Group at Citigroup Inc. (1996 to 2008) |
| | |
| Legg Mason BW Alternative Credit Fund | | 53 |
Additional information (unaudited) (cont’d)
Information about Trustees and Officers
| | |
| Executive Officers cont’d |
Jenna Bailey Legg Mason 100 First Stamford Place, 6th Floor, Stamford, CT 06902 | | |
| Year of birth | | 1978 |
| Position(s) with Trust | | Identity Theft Prevention Officer |
| Term of office1 and length of time served2 | | Since 2015 |
| Principal occupation(s) during past five years | | Identity Theft Prevention Officer of certain mutual funds associated with Legg Mason & Co. or its affiliates (since 2015); Compliance Officer of Legg Mason & Co. (since 2013); Assistant Vice President of Legg Mason & Co. (since 2011); formerly, Associate Compliance Officer of Legg Mason & Co. (2011 to 2013); Risk Manager of U.S. Distribution of Legg Mason & Co. (2007 to 2011). |
| |
Jeanne M. Kelly Legg Mason 620 Eighth Avenue, 49th Floor, New York, NY 10018 | | |
| Year of birth | | 1951 |
| Position(s) with Trust | | Senior Vice President |
| Term of office1 and length of time served2 | | Since 2007 |
| Principal occupation(s) during past five years | | Senior Vice President of certain mutual funds associated with Legg Mason & Co. or its affiliates (since 2007); Senior Vice President of LMPFA (since 2006); President and Chief Executive Officer of LMAS and LMFAM (since 2015); Managing Director of Legg Mason & Co. (since 2005) and Legg Mason & Co. predecessors (prior to 2005); formerly, Senior Vice President of LMFAM (2013 to 2015) |
| † | Trustees who are not “interested persons” of the Fund within the meaning of Section 2(a)(19) of the Investment Company Act of 1940, as amended (the “1940 Act”). Each of the Independent Trustees serves on the standing committees of the Board of Trustees, which include the Audit Committee (chair: Arthur S. Mehlman), the Nominating Committee (co-chairs: G. Peter O’Brien and Jill E. McGovern), and the Independent Trustees Committee (chair: Arnold L. Lehman). |
| 1 | Each Trustee and officer serves until his or her respective successor has been duly elected and qualified or until his or her earlier death, resignation, retirement or removal. |
| 2 | Indicates the earliest year in which the Trustee became a board member for a fund in the Legg Mason fund complex or the officer took such office. |
| 3 | Ms. Trust is an “interested person” of the Fund, as defined in the 1940 Act, because of her position with LMPFA and/or certain of its affiliates. |
| | |
| 54 | | Legg Mason BW Alternative Credit Fund |
Important tax information (unaudited)
The following information is provided with respect to the distributions paid during the taxable year ended October 31, 2016:
| | | | |
| Record date: | | Daily | | Daily |
| Payable date: | | November 2015 through
December 2015 | | January 2016 through
March 2016 |
| Return of capital | | — | | 100.00% |
Please retain this information for your records.
| | |
| Legg Mason BW Alternative Credit Fund | | 55 |
Legg Mason BW
Alternative Credit Fund
Trustees
Ruby P. Hearn
Arnold L. Lehman
Chairman
Robin J.W. Masters
Jill E. McGovern
Arthur S. Mehlman
G. Peter O’Brien
S. Ford Rowan
Robert M. Tarola
Jane Trust
Investment manager
Legg Mason Partners Fund Advisor, LLC
Subadviser
Brandywine Global Investment Management, LLC
Distributor
Legg Mason Investor Services, LLC
Custodian
State Street Bank and Trust Company
Transfer agent
BNY Mellon Investment
Servicing (US) Inc.
4400 Computer Drive
Westborough, MA 01581
Independent registered public accounting firm
PricewaterhouseCoopers LLP
Baltimore, MD
Legg Mason BW Alternative Credit Fund
The Fund is a separate investment series of Legg Mason Global Asset Management Trust, a Maryland statutory trust.
Legg Mason BW Alternative Credit Fund
Legg Mason Funds
620 Eighth Avenue, 49th Floor
New York, NY 10018
The Fund files its complete schedule of portfolio holdings with the Securities and Exchange Commission (“SEC”) for the first and third quarters of each fiscal year on Form N-Q. The Fund’s Forms N-Q are available on the SEC’s website at www.sec.gov. The Fund’s Forms N-Q may be reviewed and copied at the SEC’s Public Reference Room in Washington, D.C., and information on the operation of the Public Reference Room may be obtained by calling 1-800-SEC-0330. To obtain information on Form N-Q, shareholders can call the Fund at 1-877-721-1926.
Information on how the Fund voted proxies relating to portfolio securities during the prior 12-month period ended June 30th of each year and a description of the policies and procedures that the Fund uses to determine how to vote proxies relating to portfolio transactions are available (1) without charge, upon request, by calling the Fund at 1-877-721-1926, (2) at www.leggmason.com/mutualfunds and (3) on the SEC’s website at www.sec.gov.
This report is submitted for the general information of the shareholders of Legg Mason BW Alternative Credit Fund. This report is not authorized for distribution to prospective investors in the Fund unless preceded or accompanied by a current prospectus.
Investors should consider the Fund’s investment objectives, risks, charges and expenses carefully before investing. The prospectus contains this and other important information about the Fund. Please read the prospectus carefully before you invest.
www.leggmason.com
© 2016 Legg Mason Investor Services, LLC
Member FINRA, SIPC
Legg Mason Funds Privacy and Security Notice
Your Privacy and the Security of Your Personal Information is Very Important to the Legg Mason Funds
This Privacy and Security Notice (the “Privacy Notice”) addresses the Legg Mason Funds’ privacy and data protection practices with respect to nonpublic personal information the Funds receive. The Legg Mason Funds include any funds sold by the Funds’ distributor, Legg Mason Investor Services, LLC, as well as Legg Mason-sponsored closed-end funds and certain closed-end funds managed or sub-advised by Legg Mason or its affiliates. The provisions of this Privacy Notice apply to your information both while you are a shareholder and after you are no longer invested with the Funds.
The Type of Nonpublic Personal Information the Funds Collect About You
The Funds collect and maintain nonpublic personal information about you in connection with your shareholder account. Such information may include, but is not limited to:
| • | | Personal information included on applications or other forms; |
| • | | Account balances, transactions, and mutual fund holdings and positions; |
| • | | Online account access user IDs, passwords, security challenge question responses; and |
| • | | Information received from consumer reporting agencies regarding credit history and creditworthiness (such as the amount of an individual’s total debt, payment history, etc.). |
How the Funds Use Nonpublic Personal Information About You
The Funds do not sell or share your nonpublic personal information with third parties or with affiliates for their marketing purposes, or with other financial institutions or affiliates for joint marketing purposes, unless you have authorized the Funds to do so. The Funds do not disclose any nonpublic personal information about you except as may be required to perform transactions or services you have authorized or as permitted or required by law. The Funds may disclose information about you to:
| • | | Employees, agents, and affiliates on a “need to know” basis to enable the Funds to conduct ordinary business or comply with obligations to government regulators; |
| • | | Service providers, including the Funds’ affiliates, who assist the Funds as part of the ordinary course of business (such as printing, mailing services, or processing or servicing your account with us) or otherwise perform services on the Funds’ behalf, including companies that may perform marketing services solely for the Funds; |
| • | | The Funds’ representatives such as legal counsel, accountants and auditors; and |
| • | | Fiduciaries or representatives acting on your behalf, such as an IRA custodian or trustee of a grantor trust. |
|
| NOT PART OF THE ANNUAL REPORT |
Legg Mason Funds Privacy and Security Notice (cont’d)
Except as otherwise permitted by applicable law, companies acting on the Funds’ behalf are contractually obligated to keep nonpublic personal information the Funds provide to them confidential and to use the information the Funds share only to provide the services the Funds ask them to perform.
The Funds may disclose nonpublic personal information about you when necessary to enforce their rights or protect against fraud, or as permitted or required by applicable law, such as in connection with a law enforcement or regulatory request, subpoena, or similar legal process. In the event of a corporate action or in the event a Fund service provider changes, the Funds may be required to disclose your nonpublic personal information to third parties. While it is the Funds’ practice to obtain protections for disclosed information in these types of transactions, the Funds cannot guarantee their privacy policy will remain unchanged.
Keeping You Informed of the Funds’ Privacy and Security Practices
The Funds will notify you annually of their privacy policy as required by federal law. While the Funds reserve the right to modify this policy at any time they will notify you promptly if this privacy policy changes.
The Funds’ Security Practices
The Funds maintain appropriate physical, electronic and procedural safeguards designed to guard your nonpublic personal information. The Funds’ internal data security policies restrict access to your nonpublic personal information to authorized employees, who may use your nonpublic personal information for Fund business purposes only.
Although the Funds strive to protect your nonpublic personal information, they cannot ensure or warrant the security of any information you provide or transmit to them, and you do so at your own risk. In the event of a breach of the confidentiality or security of your nonpublic personal information, the Funds will attempt to notify you as necessary so you can take appropriate protective steps. If you have consented to the Funds using electronic communications or electronic delivery of statements, they may notify you under such circumstances using the most current email address you have on record with them.
In order for the Funds to provide effective service to you, keeping your account information accurate is very important. If you believe that your account information is incomplete, not accurate or not current, or if you have questions about the Funds’ privacy practices, write the Funds using the contact information on your account statements, email the Funds by clicking on the Contact Us section of the Funds’ website at www.leggmason.com, or contact the Fund at 1-877-721-1926.
|
| NOT PART OF THE ANNUAL REPORT |
www.leggmason.com
© 2016 Legg Mason Investor Services, LLC Member FINRA, SIPC
BWXX107352 12/16 SR16-2948
The registrant has adopted a code of ethics that applies to the registrant’s principal executive officer, principal financial officer, principal accounting officer or controller.
| ITEM 3. | AUDIT COMMITTEE FINANCIAL EXPERT. |
The Board of Trustees of the registrant has determined that Arthur S. Mehlman the Chairman of the Board’s Audit Committee and Robert M. Tarola, possess the technical attributes identified in Instruction 2(b) of Item 3 to Form N- to qualify as “audit committee financial experts,” and have designated Mr. Mehlman and Mr. Tarola CSR as the Audit Committee’s financial experts. Mr. Mehlman and Mr. Tarola are “independent” Trustees pursuant to paragraph (a) (2) of Item 3 to Form N-CSR.
| ITEM 4. | PRINCIPAL ACCOUNTANT FEES AND SERVICES. |
a) Audit Fees. The aggregate fees billed in the last two fiscal years ending October 31, 2015 and October 31, 2016 (the “Reporting Periods”) for professional services rendered by the Registrant’s principal accountant (the “Auditor”) for the audit of the Registrant’s annual financial statements, or services that are normally provided by the Auditor in connection with the statutory and regulatory filings or engagements for the Reporting Periods, were $268,854 in 2015 and $164,788 in 2016.
b) Audit-Related Fees. The aggregate fees billed in the Reporting Period for assurance and related services by the Auditor that are reasonably related to the performance of the Registrant’s financial statements were $0 in October 31, 2015 and $0 in October 31, 2016.
(c) Tax Fees. The aggregate fees billed in the Reporting Periods for professional services rendered by the Auditor for tax compliance, tax advice and tax planning (“Tax Services”) were $56,048 in October 31, 2015 and $81,401 in October 31, 2016. These services consisted of (i) review or preparation of U.S. federal, state, local and excise tax returns; (ii) U.S. federal, state and local tax planning, advice and assistance regarding statutory, regulatory or administrative developments, and (iii) tax advice regarding tax qualification matters and/or treatment of various financial instruments held or proposed to be acquired or held.
There were no fees billed for tax services by the service affiliates during the Reporting Periods that required pre-approval by the Audit Auditors Committee.
d) All Other Fees. The aggregate fees for other fees billed in the Reporting Periods for products and services provided by the Auditor were $3,234 in October 31, 2015 and $2,369 in October 31, 2016, other than the services reported in paragraphs (a) through (c) of this item for the Legg Mason Global Asset Management Trust.
All Other Fees. There were no other non-audit services rendered by the Auditor to Legg Mason Partners Fund Advisors, LLC (“LMPFA”), and any entity controlling, controlled by or under common control with LMPFA that provided ongoing services to Legg Mason Global Asset Management Trust requiring pre-approval by the Audit Committee in the Reporting Period.
(e) Audit Committee’s pre–approval policies and procedures described in paragraph (c)
(7) of Rule 2-01 of Regulation S-X.
(1) The Charter for the Audit Committee (the “Committee”) of the Board of each registered investment company (the “Fund”) advised by LMPFA or one of their affiliates (each, an “Adviser”) requires that the Committee shall approve (a) all audit and permissible non-audit services to be provided to the Fund and (b) all permissible non-audit services to be provided by the Fund’s independent auditors to the Adviser and any Covered Service Providers if the engagement relates directly to the operations and financial reporting of the Fund. The Committee may implement policies and procedures by which such services are approved other than by the full Committee.
The Committee shall not approve non-audit services that the Committee believes may impair the independence of the auditors. As of the date of the approval of this Audit Committee Charter, permissible non-audit services include any professional services (including tax services), that are not prohibited services as described below, provided to the Fund by the independent auditors, other than those provided to the Fund in connection with an audit or a review of the financial statements of the Fund. Permissible non-audit services may not include: (i) bookkeeping or other services related to the accounting records or financial statements of the Fund; (ii) financial information systems design and implementation; (iii) appraisal or valuation services, fairness opinions or contribution-in-kind reports; (iv) actuarial services; (v) internal audit outsourcing services; (vi) management functions or human resources; (vii) broker or dealer, investment adviser or investment banking services; (viii) legal services and expert services unrelated to the audit; and (ix) any other service the Public Company Accounting Oversight Board determines, by regulation, is impermissible.
Pre-approval by the Committee of any permissible non-audit services is not required so long as: (i) the aggregate amount of all such permissible non-audit services provided to the Fund, the Adviser and any service providers controlling, controlled by or under common control with the Adviser that provide ongoing services to the Fund (“Covered Service Providers”) constitutes not more than 5% of the total amount of revenues paid to the independent auditors during the fiscal year in which the permissible non-audit services are provided to (a) the Fund, (b) the Adviser and (c) any entity controlling, controlled by or under common control with the Adviser that provides ongoing services to the Fund during the fiscal year in which the services are provided that would have to be approved by the Committee; (ii) the permissible non-audit services were not recognized by the Fund at the time of the engagement to be non-audit services; and (iii) such services are promptly brought to the attention of the Committee and approved by the Committee (or its delegate(s)) prior to the completion of the audit.
(2) For the Legg Mason Global Asset Management Trust, the percentage of fees that were approved by the audit committee, with respect to: Audit-Related Fees were 100% and 100% for October 31, 2015 and October 31, 2016; Tax Fees were 100% and 100% for October 31, 2015 and October 31, 2016; and Other Fees were 100% and 100% for October 31, 2015 and October 31, 2016.
(f) N/A
(g) Non-audit fees billed by the Auditor for services rendered to Legg Mason Global Asset Management Trust, LMPFA and any entity controlling, controlled by, or under common control with LMPFA that provides ongoing services to Legg Mason Global Asset Management Trust during the reporting period were $330,948 in October 31, 2015 and $217,714 in October 31, 2016.
(h) Yes. Legg Mason Global Asset Management Trust’s Audit Committee has considered whether the provision of non-audit services that were rendered to Service Affiliates, which were not pre-approved (not requiring pre-approval), is compatible with maintaining the Accountant’s independence. All services provided by the Auditor to the Legg Mason Global Asset Management Trust or to Service Affiliates, which were required to be pre-approved, were pre-approved as required.
| ITEM 5. | AUDIT COMMITTEE OF LISTED REGISTRANTS. |
| | a) | The independent board members are acting as the registrant’s audit committee as specified in Section 3(a)(58)(B) of the Exchange Act. The Audit Committee consists of the following Board members: |
Ruby P. Hearn
Arnold L. Lehman
Robin J.W. Masters
Jill E. McGovern
Arthur S. Mehlman
G. Peter O’Brien
S. Ford Rowan
Robert M. Tarola
| ITEM 6. | SCHEDULE OF INVESTMENTS. |
Included herein under Item 1.
| ITEM 7. | DISCLOSURE OF PROXY VOTING POLICIES AND PROCEDURES FOR CLOSED-END MANAGEMENT INVESTMENT COMPANIES. |
Not applicable.
| ITEM 8. | PORTFOLIO MANAGERS OF CLOSED-END MANAGEMENT INVESTMENT COMPANIES. |
Not applicable.
| ITEM 9. | PURCHASES OF EQUITY SECURITIES BY CLOSED-END MANAGEMENT INVESTMENT COMPANY AND AFFILIATED PURCHASERS. |
Not applicable.
| ITEM 10. | SUBMISSION OF MATTERS TO A VOTE OF SECURITY HOLDERS. |
Not applicable.
| ITEM 11. | CONTROLS AND PROCEDURES. |
| | (a) | The registrant’s principal executive officer and principal financial officer have concluded that the registrant’s disclosure controls and procedures (as defined in Rule 30a- 3(c) under the Investment Company Act of 1940, as amended (the “1940 Act”)) are effective as of a date within 90 days of the filing date of this report that includes the disclosure required by this paragraph, based on their evaluation of the disclosure controls and procedures required by Rule 30a-3(b) under the 1940 Act and 15d-15(b) under the Securities Exchange Act of 1934. |
| | (b) | There were no changes in the registrant’s internal control over financial reporting (as defined in Rule 30a-3(d) under the 1940 Act) that occurred during the second fiscal quarter of the period covered by this report that have materially affected, or are likely to materially affect the registrant’s internal control over financial reporting. |
(a) (1) Code of Ethics attached hereto.
Exhibit 99.CODE ETH
(a) (2) Certifications pursuant to section 302 of the Sarbanes-Oxley Act of 2002 attached hereto.
Exhibit 99.CERT
(b) Certifications pursuant to Section 906 of the Sarbanes-Oxley Act of 2002 attached hereto.
Exhibit 99.906CERT
SIGNATURES
Pursuant to the requirements of the Securities Exchange Act of 1934 and the Investment Company Act of 1940, the registrant has duly caused this Report to be signed on its behalf by the undersigned, there unto duly authorized.
Legg Mason Global Asset Management Trust
| | |
| By: | | /s/ Jane Trust |
| | Jane Trust |
| | Chief Executive Officer |
| |
| Date: | | December 28, 2016 |
Pursuant to the requirements of the Securities Exchange Act of 1934 and the Investment Company Act of 1940, this report has been signed below by the following persons on behalf of the registrant and in the capacities and on the dates indicated.
| | |
| By: | | /s/ Jane Trust |
| | Jane Trust |
| | Chief Executive Officer |
| |
| Date: | | December 28, 2016 |
| |
| By: | | /s/ Richard F. Sennett |
| | Richard F. Sennett |
| | Principal Financial Officer |
| |
| Date: | | December 28, 2016 |