UNITED STATES
SECURITIES AND EXCHANGE COMMISSION
Washington, D.C. 20549
FORM N-CSR
CERTIFIED SHAREHOLDER REPORT OF REGISTERED
MANAGEMENT INVESTMENT COMPANIES
Investment Company Act file number 811-22338
Legg Mason Global Asset Management Trust
(Exact name of registrant as specified in charter)
620 Eighth Avenue, 49th Floor, New York, NY 10018
(Address of principal executive offices) (Zip code)
Robert I. Frenkel, Esq.
Legg Mason & Co., LLC
100 First Stamford Place
Stamford, CT 06902
(Name and address of agent for service)
Registrant’s telephone number, including area code: 1-877-721-1926
Date of fiscal year end: December 31
Date of reporting period: December 31, 2016
| ITEM 1. | REPORT TO STOCKHOLDERS |
The Annual Report to Stockholders is filed herewith.

| | |
| Annual Report | | December 31, 2016 |
LEGG MASON BW
GLOBAL OPPORTUNITIES BOND FUND
|
| INVESTMENT PRODUCTS: NOT FDIC INSURED • NO BANK GUARANTEE • MAY LOSE VALUE |
Fund objective
The Fund’s objective is to maximize total return consisting of income and capital appreciation.
Letter from the president

Dear Shareholder,
We are pleased to provide the annual report of Legg Mason BW Global Opportunities Bond Fund for the twelve-month reporting period ended December 31, 2016. Please read on for a detailed look at prevailing economic and market conditions during the Fund’s reporting period and to learn how those conditions have affected Fund performance.
Special shareholder notice
Effective immediately, Stephen S. Smith, David F. Hoffman, CFA, John P. McIntyre, CFA and Anujeet Sareen, CFA are the Fund’s portfolio managers and are responsible for the day-to-day portfolio management of the Fund. Mr. Smith and Mr. Hoffman, CFA, have been the Fund’s portfolio managers since 2006. Mr. McIntyre, CFA, was the Fund’s Associate Portfolio Manager/Senior Research Analyst until 2006 and became the Fund’s Portfolio Manager/Senior Research Analyst in 2012. Mr. Sareen, CFA, has been the Fund’s portfolio manager since January 2017. These investment professionals are all employed by Brandywine Global Investment Management, LLC. For additional information, please see the prospectus supplement dated February 2, 2017.
As always, we remain committed to providing you with excellent service and a full spectrum of investment choices. We also remain committed to supplementing the support you receive from your financial advisor. One way we accomplish this is through our website, www.leggmason.com. Here you can gain immediate access to market and investment information, including:
| • | | Fund prices and performance, |
| • | | Market insights and commentaries from our portfolio managers, and |
| • | | A host of educational resources. |
| | |
| II | | Legg Mason BW Global Opportunities Bond Fund |
We look forward to helping you meet your financial goals.
Sincerely,

Jane Trust, CFA
President and Chief Executive Officer
February 2, 2017
| | |
| Legg Mason BW Global Opportunities Bond Fund | | III |
Investment commentary
Economic review
The pace of U.S. economic activity fluctuated during the twelve months ended December 31, 2016 (the “reporting period”). Looking back, the U.S. Department of Commerce reported that first and second quarter 2016 U.S. gross domestic product (“GDP”)i growth was 0.8% and 1.4%, respectively. GDP growth for the third quarter of 2016 was 3.5%, the strongest reading in two years. The U.S. Department of Commerce’s initial reading for fourth quarter 2016 GDP growth — released after the reporting period ended — was 1.9%. The deceleration in growth reflected a downturn in exports, an acceleration in imports, a deceleration in personal consumption expenditures and a downturn in federal government spending.
While there was a pocket of weakness in May 2016, job growth in the U.S. was solid overall and a tailwind for the economy during the reporting period. When the reporting period ended on December 31, 2016, the unemployment rate was 4.7%, as reported by the U.S. Department of Labor. The percentage of longer-term unemployed also declined over the period. In December 2016, 24.2% of Americans looking for a job had been out of work for more than six months, versus 26.9% when the period began.
Turning to the global economy, in its January 2017 World Economic Outlook Update, released after the reporting period ended, the International Monetary Fund (“IMF”)ii said, “After a lackluster outturn in 2016, economic activity is projected to pick up pace in 2017 and 2018, especially in emerging market and developing economies. However, there is a wide dispersion of possible outcomes around the projections, given uncertainty surrounding the policy stance of the incoming U.S. administration and its global ramifications.” From a regional perspective, the IMF estimates 2017 growth in the Eurozone will be 1.6%, versus 1.7% in 2016. Japan’s economy is expected to expand 0.8% in 2017, compared to 0.9% in 2016. Elsewhere, the IMF projects that overall growth in emerging market countries will accelerate to 4.5% in 2017, versus 4.1% in 2016.
After an extended period of maintaining the federal funds rateiii at a historically low range between zero and 0.25%, the Federal Reserve Board (the “Fed”)iv increased the rate at its meeting on December 16, 2015. This marked the first rate hike since 2006. In particular, the U.S. central bank raised the federal funds rate to a range between 0.25% and 0.50%. The Fed then kept rates on hold at each meeting prior to its meeting in mid-December 2016. On December 14, 2016, the Fed raised rates to a range between 0.50% and 0.75%. In the Fed’s statement after the December meeting it said, “The Committee expects that economic conditions will evolve in a manner that will warrant only gradual increases in the federal funds rate; the federal funds rate is likely to remain, for some time, below levels that are expected to prevail in the longer run. However, the actual path of the federal funds rate will depend on the economic outlook as informed by incoming data.”
Given the economic challenges in the Eurozone, the European Central Bank (“ECB”)v took a number of actions to stimulate growth and ward off deflation. In January 2015, before the reporting period began, the ECB announced that, beginning in March 2015, it would start a €60 billion-per-month bond buying program that was expected to run until September 2016. In December 2015,
| | |
| IV | | Legg Mason BW Global Opportunities Bond Fund |
the ECB extended its monthly bond buying program until at least March 2017. In March 2016, the ECB announced that it would increase its bond purchasing program to €80 billion-per-month. It also lowered its deposit rate to -0.4% and its main interest rate to 0%. Finally, in December 2016 — the ECB again extended its bond buying program until December 2017. From April 2017 through December 2017, the ECB will purchase €60 billion-per-month of bonds. Looking at other developed countries, in the aftermath of the June 2016 U.K. referendum to leave the European Union (“Brexit”), the Bank of England (“BoE”)vi lowered rates in October 2016 from 0.50% to 0.25% — an all-time low. After holding rates steady at 0.10% for more than five years, in January 2016, the Bank of Japanvii announced that it lowered the rate on current accounts that commercial banks hold with it to -0.10%. Elsewhere, the People’s Bank of Chinaviii kept rates steady at 4.35%.
As always, thank you for your confidence in our stewardship of your assets.
Sincerely,
Jane Trust, CFA
President and Chief Executive Officer
January 31, 2017
All investments are subject to risk including the possible loss of principal. Past performance is no guarantee of future results. Forecasts and predictions are inherently limited and should not be relied upon as an indication of actual or future performance.
| i | Gross domestic product (“GDP”) is the market value of all final goods and services produced within a country in a given period of time. |
| ii | The International Monetary Fund (“IMF”) is an organization of 189 countries, working to foster global monetary cooperation, secure financial stability, facilitate international trade, promote high employment and sustainable economic growth, and reduce poverty around the world. |
| iii | The federal funds rate is the rate charged by one depository institution on an overnight sale of immediately available funds (balances at the Federal Reserve) to another depository institution; the rate may vary from depository institution to depository institution and from day to day. |
| iv | The Federal Reserve Board (the “Fed”) is responsible for the formulation of U.S. policies designed to promote economic growth, full employment, stable prices and a sustainable pattern of international trade and payments. |
| v | The European Central Bank (“ECB”) is responsible for the monetary system of the European Union and the euro currency. |
| vi | The Bank of England (“BoE”), formally the Governor and Company of the BoE, is the central bank of the United Kingdom. The BoE’s purpose is to maintain monetary and financial stability. |
| vii | The Bank of Japan is the central bank of Japan. The bank is responsible for issuing and handling currency and treasury securities, implementing monetary policy, maintaining the stability of the Japanese financial system and the yen currency. |
| viii | The People’s Bank of China (“PBoC”) is the central bank of the People’s Republic of China with the power to carry out monetary policy and regulate financial institutions in mainland China. |
| | |
| Legg Mason BW Global Opportunities Bond Fund | | V |
Fund overview
Q. What is the Fund’s investment strategy?
A. The Fund seeks to maximize total return consisting of income and capital appreciation. Under normal market conditions, the Fund will invest at least 80% of its net assets in fixed-income securities of issuers located in developed market countries. Any country that, at the time of purchase, has a sovereign debt rating of A- or better from at least one nationally recognized statistical ratings organization (“NRSRO”) or is included in the Citigroup World Government Bond Indexi is considered a developed country.
The Fund will invest in both investment grade and below investment grade fixed income securities, and intends to invest less than 35% of its net assets in below investment grade fixed-income securities (commonly known as “high yield debt” or “junk bonds”). We intend to maintain an average weighted portfolio quality of A- or better, whether composed of rated securities or unrated securities deemed to be of comparable quality. The Fund’s investments may include securities of sovereign governments. The Fund may invest up to 25% of its net assets in convertible debt securities.
The Fund invests in currency forwards, in order to hedge its currency exposure in bond positions or to gain currency exposure. In addition, the Fund may engage in a variety of transactions using derivatives such as bond futures, interest rate futures, swaps and credit default swaps. The Fund may use derivatives to enhance total return, to hedge against fluctuations in securities prices, interest rates or currency exchange rates, to change the effective durationii of its portfolio, to manage certain investment risks and/or as a substitute for the purchase or sale of securities or currencies. These investments may be significant at times. Although we have the flexibility to use these instruments for hedging purposes, we may choose not to for a variety of reasons, even under very volatile market conditions. The Fund will normally hold a portfolio of fixed income securities of issuers located in a minimum of six countries
The Fund may invest in securities of any maturity. The weighted average effective duration of the Fund’s portfolio, including derivatives, is expected to range from one to ten years, but for individual markets may be greater or lesser depending on our view of the prospects for lower interest rates and potential capital gains.
We follow a value approach to investing and, therefore, seek to identify relative value in the global bond markets. We define as undervalued, those markets where we believe real interest rates are high and the currency is undervalued with the potential to appreciate. We will concentrate investments in those undervalued markets where we believe cyclical business conditions as well as secular economic and political trends provide the best opportunity for declining interest rates and a return to lower real rates over time. We believe that such economic conditions provide the best potential to achieve capital appreciation.
Q. What were the overall market conditions during the Fund’s reporting period?
A. While markets alternated between “risk-on” and “risk-off” sentiment during the twelve-month reporting period ended December 31, 2016, several themes were relatively constant and impacted both bond yields and currencies. These influential macro trends included concerns over global growth, central bank actions, the search for
| | |
| Legg Mason BW Global Opportunities Bond Fund 2016 Annual Report | | 1 |
Fund overview (cont’d)
yield amid ultra-low and negative rates, geopolitical events, currency volatility, and stabilization in commodity prices. The year began with weak growth expectations and doubts regarding the efficacy of central bank policies, driving risk-averse investors into traditionally “safe-haven” assets. These fears abated and gave way to a strong rally in risk assets, helped by stabilizing commodity prices, stronger U.S. economic data, and improving sentiment. However, the unexpected outcome of the U.K. referendum, known as “Brexit,” abruptly changed the market environment and highlighted growing global risks around populist and protectionist trends. With investors again seeking relative safety, high-quality sovereign bonds rallied considerably and yields found new lows, with some venturing into negative territory by mid-year.
Against this backdrop, central banks looked to new ways to stimulate growth, including unconventional policy tools. The Bank of Japan (“BoJ”)iii surprised markets by first taking its deposit rate negative in late January 2016, next issuing benchmark ten- year bonds at negative yields for the first time in early March 2016, and finally shifting to yield curveiv control in November 2016. The European Central Bank (“ECB”)v lent aggressive support to the Eurozone with cuts to all key rates, new long-term refinancing operations for banks, and an expansion of its asset purchase program to include some lower-rated corporate debt. As a result, European credit, particularly within the peripheral countries of Ireland, Italy, Portugal, and Spain, received a lift from the news that investment grade corporates would be eligible for the ECB program. The Bank of England (“BoE”)vi cut its key benchmark rate and expanded stimulus to spur domestic growth to combat anticipated Brexit headwinds. Against mixed domestic economic data and growing global uncertainty, the Federal Reserve Board (the “Fed”)vii moved away from its plans to tighten monetary policy, holding rates steady until a widely anticipated 25 basis pointviii hike in December 2016.
In addition to Brexit, financial markets navigated heightened uncertainty created by the Italian referendum and particularly by the U.S. election and Donald Trump’s surprise electoral victory, which jolted the Mexican peso and trade-dependent Asian currencies. At the same time, prospects for higher U.S. rates supported renewed strength in the U.S. dollar. Better economic data continued to emerge, with gross domestic product growth stronger than predicted in both the U.S. and the Eurozone, and U.K. economic data continuing to surprise on the upside. Another bright spot was the improvement in oil and commodity prices, with oil reaching new highs for the year following an agreement by the Organization of the Petroleum Exporting Countries (“OPEC”) to cut production. As 2016 entered its final quarter, rising interest rates and the improving macroeconomic backdrop prompted a sharp sell-off in global bond markets. All told, developed bond market yields remained low at the end of the period, with some finishing 2016 only slightly higher than at the start.
Q. How did we respond to these changing market conditions?
A. To counter the prevailing low-yield environment, a relatively high yield positioning was embedded in the Fund throughout the period. The Fund employed a barbell-structured weighting between lower-yielding U.S. Treasury bonds and higher-yielding sovereign bonds in the developed and developing world, along with an
| | |
| 2 | | Legg Mason BW Global Opportunities Bond Fund 2016 Annual Report |
increase in U.S. corporate credit. In keeping with this strategy, there were no positions in German or Japanese bonds. As we perceived fear in the corporate bond market to be an opportunity, we began buying corporate bonds in early February 2016 as spreads widened past levels associated with recession. At the time, we considered spreads to be overly pessimistic relative to our outlook for reflation and more stable economic growth globally. At the same time, the heavy weighting in U.S. Treasuries was intended to provide ballast to the rest of the durationix exposure and support in the Fund if the macro story of deflation persisted. The U.S. dollar remained the single largest absolute weighting, but was significantly below benchmark, as were weightings in the yen and euro. Instead, we deployed currency exposure across a wide range of other developed economies, like Australia, and many emerging market countries, including Brazil, India, Indonesia, and South Africa. Even after their rally in the first quarter of 2016, we believed that many of these currencies were trading at substantial discounts to their intrinsic values based on our research.
Going into the latter half of the reporting period, the Fund was positioned for a fairly significant shift in relative performance away from developed country bond markets to the developing markets, consistent with where we saw value and the outcome of macro trends. In general terms, the Fund was underweight benchmark duration in the developed world and overweight duration skewed to emerging market sovereign bonds. We continue to believe the “safe haven” bonds are among the riskiest bonds in the global bond universe and represent low relative value. As the year progressed, we sold U.S. Treasury duration and took advantage of the global uncertainty to fade bonds in the developed world, leaving the Fund with few investments in core Europe and none in Japan. These changes left the Fund underweight duration and not exposed to what we considered the riskiest segments of developed market global bonds.
The biggest pricing anomaly was the spread widening of corporate bonds in the oil sector. The spreads on the investment grade bonds that we purchased initially were as wide as 900 basis points (bps). As oil prices recovered and financial repression abated toward year end, spreads narrowed significantly, prompting us to reduce exposure to this sector. We also purchased one year of long Treasury bonds late in the year, representing a tactical portfolio change based on the conviction that the sell-off in the bond market had moved too far, too fast relative to the underlying changes likely to be forthcoming in the U.S. economy.
At the end of the period, the Fund remained underweight yen and euro, with currency exposure concentrated in Scandinavia, Eastern Europe, and the U.K., where we saw favorable growth prospects and less onerous fiscal constraints. The Fund also remained overweight a range of emerging market currencies, including the Mexican peso. We feel the peso currently offers one of the biggest discounts in price relative to almost every measure of intrinsic value. The balance of our emerging market exposure was in Indonesia, South Africa, and Brazil, where we owned longer-duration bonds. These positions support our view that better global growth and higher commodity prices should narrow the risk premium embedded in the yield curve and provide a better setting for strong foreign direct investment
| | |
| Legg Mason BW Global Opportunities Bond Fund 2016 Annual Report | | 3 |
Fund overview (cont’d)
flows into these economies — which we believe will push bond yields lower and firm up the currency markets in the year ahead.
Performance review
For the twelve months ended December 31, 2016, Class IS shares of Legg Mason BW Global Opportunities Bond Fund returned 5.02%. The Fund’s unmanaged benchmark, the Citigroup World Government Bond Index (unhedged)x, returned 1.60% for the same period. The Lipper Global Income Funds Category Average1 returned 3.54% over the same time frame.
| | | | | | | | |
Performance Snapshot as of December 31, 2016
(unaudited) | |
| (excluding sales charges) | | 6 months | | | 12 months | |
| Legg Mason BW Global Opportunities Bond Fund: | | | | | | | | |
Class A | | | -5.17 | % | | | 4.57 | % |
Class A2 | | | -5.18 | % | | | 4.47 | % |
Class C | | | -5.51 | % | | | 3.89 | % |
Class C12 | | | -5.40 | % | | | 4.08 | % |
Class FI | | | -5.14 | % | | | 4.62 | % |
Class R | | | -5.29 | % | | | 4.38 | % |
Class I | | | -5.02 | % | | | 4.91 | % |
Class IS | | | -5.02 | % | | | 5.02 | % |
| Citigroup World Government Bond Index (unhedged) | | | -8.26 | % | | | 1.60 | % |
Lipper Global Income Funds
Category Average1 | | | -2.43 | % | | | 3.54 | % |
The performance shown represents past performance. Past performance is no guarantee of future results and current performance may be higher or lower than the performance shown above. Principal value, investment returns and yields will fluctuate and investors’ shares, when redeemed, may be worth more or less than their original cost. To obtain performance data current to the most recent month-end, please visit our web-site at www.leggmason.com/mutualfunds.
All share class returns assume the reinvestment of all distributions at net asset value and the deduction of all Fund expenses. Returns have not been adjusted to include sales charges that may apply or the deduction of taxes that a shareholder would pay on Fund distributions. If sales charges were reflected, the performance quoted would be lower. Performance figures for periods shorter than one year represent cumulative figures and are not annualized.
Fund performance figures reflect fee waivers and/or expense reimbursements, without which the performance would have been lower.
The 30-Day SEC Yields for the period ended December 31, 2016 for Class A, Class A2, Class C, Class C1, Class FI, Class R, Class I and Class IS shares 3.07%, 3.10%, 2.43%, 2.83%, 3.17%, 2.90%, 3.45% and 3.57%, respectively. Absent fee waivers and/or expense reimbursements, the 30-Day SEC Yields for Class R shares would have been 2.71%. The 30-Day SEC Yield is subject to change and is based on the yield to maturity of the Fund’s investments over a 30-day period and not on the dividends paid by the Fund, which may differ.
|
| Total Annual Operating Expenses (unaudited) |
As of the Fund’s current prospectus dated May 1, 2016, the gross total annual fund operating expense ratios for Class A, Class A2, Class C, Class C1, Class FI,
| 1 | Lipper, Inc., a wholly-owned subsidiary of Reuters, provides independent insight on global collective investments. Returns are based on the period ended December 31, 2016, including the reinvestment of all distributions, including returns of capital, if any, calculated among the 217 funds for the six-month period and among the 215 funds for the twelve-month period in the Fund’s Lipper category, and excluding sales charges, if any. |
| 2 | Class C1 shares are not available for purchase by new or existing investors (except for certain retirement plan programs). Class C1 shares continue to be available for dividend reinvestment and incoming exchanges. |
| | |
| 4 | | Legg Mason BW Global Opportunities Bond Fund 2016 Annual Report |
Class R, Class I and Class IS shares were 0.92%, 1.10%, 1.68%, 1.35%, 0.95%, 1.26%, 0.69% and 0.56%, respectively.
Actual expenses may be higher. For example, expenses may be higher than those shown if average net assets decrease. Net assets are more likely to decrease and Fund expense ratios are more likely to increase when markets are volatile.
As a result of expense limitation arrangements, the ratio of total annual fund operating expenses, other than interest, brokerage commissions, dividend expense on short sales, taxes, extraordinary expenses and acquired fund fees and expenses, to average net assets will not exceed 1.00% for Class A shares, 1.20% for Class A2 shares, 1.75% for Class C shares, 1.45% for Class C1 shares, 1.00% for Class FI shares, 1.25% for Class R shares, 0.75% for Class I shares and 0.65% for Class IS shares. In addition, the ratio of total annual fund operating expenses for Class IS shares will not exceed the ratio of total annual fund operating expenses for Class I shares. These expense limitation arrangements cannot be terminated prior to December 31, 2018 without the Board of Trustees’ consent.
The manager is permitted to recapture amounts waived and/or reimbursed to a class within three years after the fiscal year in which the manager earned the fee or incurred the expense if the class’ total annual operating expenses have fallen to a level below the expense limitation (“expense cap”) in effect at the time the fees were earned or the expenses incurred. In no case will the manager recapture any amount that would result, on any particular business day of the Fund, in the class’ total annual operating expenses exceeding the expense cap or any other lower limit then in effect.
Q. What were the leading contributors to performance?
A. The Fund’s outperformance relative to its benchmark during the twelve months ending December 31, 2016, was driven by duration decisions in U.S. Treasuries and exposure to U.S. corporate bonds. Long, unhedged exposure to sovereign bonds in several emerging markets also added to returns, including government bonds denominated in the Brazilian real, Indonesian rupiah, Hungarian forint, and South African rand. Additionally, positions in Australian government agency bonds contributed to relative outperformance. Unhedged exposure to the real contributed most of the relative gains from currency decisions, however, actively managing exposure to the euro throughout the period also contributed favorably to results. The use of derivatives, which consisted solely of currency forward contracts in the Fund, contributed to relative performance through long exposure to the Chilean peso and Indian rupee. Similarly, a long currency position via currency forward contracts on the yen in the first half of the year benefited from strong appreciation in the currency and added to returns, although the overall impact relative to the benchmark was affected by our underweighting.
Q. What were the leading detractors from performance?
A. An unhedged, overweight position in Mexican bonds was the most significant detractor from performance. Despite a variety of positive factors — attractive real yields, a low unemployment rate, strong retail sales, and a credible central bank — Mexican assets have been at the mercy of the speculation regarding the country’s
| | |
| Legg Mason BW Global Opportunities Bond Fund 2016 Annual Report | | 5 |
Fund overview (cont’d)
trade relationship with the U.S. We believe the peso currently offers one of the biggest discounts in price relative to almost every measure of intrinsic value, and the structure of Mexico’s economy is much better than it was several decades ago. However, the uncertainty surrounding the Trump administration’s position on trade policy and its open antagonism toward companies outsourcing production to Mexico, as well as the prospect of dwindling foreign direct investment (“FDI”), have all undermined the peso. As a result, the peso depreciated more than 16% against the U.S. dollar for the period.
Unhedged exposure to short-dated U.K. gilts and currency decisions regarding British pound sterling, including incremental long currency positions through currency forward contracts, also detracted from returns. The pound sterling fell significantly against the U.S. dollar given the elevated risks resulting from Brexit. However, we believe the currency’s depreciation has potentially been overdone, particularly in light of the stronger-than-expected economic data and robust consumer spending in the U.K. Results were also impacted by an independent currency position in the Swedish krona, which has been held low by loose monetary policy on the part of its central bank, the Riksbank. However, recent hawkish disagreement among Riksbank members and solid economic fundamentals suggest a stronger currency going forward. A lack of exposure to core, developed market sovereigns, namely in Japan, Germany, and France, also affected full-year results. Despite the broad sell-off in global bonds at the end of the period, strong overall performance from safe-haven assets as investors periodically sought relative safety throughout the year detracted moderately from relative performance.
Thank you for your investment in Legg Mason BW Global Opportunities Bond Fund. As always, we appreciate that you have chosen us to manage your assets and we remain focused on achieving the Fund’s investment goals.
Sincerely,

David F. Hoffman, CFA
Portfolio Manager
Brandywine Global Investment Management, LLC

Stephen S. Smith
Portfolio Manager
Brandywine Global Investment Management, LLC

John P. McIntyre, CFA
Portfolio Manager
Brandywine Global Investment Management, LLC

Anujeet Sareen, CFA
Portfolio Manager
Brandywine Global Investment Management, LLC
February 2, 2017
| | |
| 6 | | Legg Mason BW Global Opportunities Bond Fund 2016 Annual Report |
RISKS: Foreign securities involve special risks such as currency fluctuations and social, political and economic uncertainties, which could increase volatility. These risks are magnified in emerging markets. Sovereign government and supranational debt involve many of the risks of foreign and emerging markets investments as well as the risk of debt moratorium, repudiation or renegotiation and the Fund may be unable to enforce its rights against the issuers. Fixed income securities involve interest rate, credit, inflation, and reinvestment risks. The Fund’s share price may decline as interest rates rise. Below investment grade debt securities (commonly known as “high yield debt” or “junk bonds”) involve greater volatility than higher-rated securities. To the extent that the Fund invests in asset- and mortgage-backed securities, its exposure to prepayment and extension risks may be greater than investment in other fixed-income securities. The Fund may engage in derivative transactions, which involve special risks and costs and may increase losses and have a potentially large impact on Fund performance. As a non-diversified fund, the Fund is permitted to invest a higher percentage of its assets in any one issuer than a diversified fund, which may magnify the Fund’s losses from events affecting a particular issuer. Please see the Fund’s prospectus for a more complete discussion of these and other risks, and the Fund’s investment strategies.
All investments are subject to risk including the possible loss of principal. Past performance is no guarantee of future results. All index performance reflects no deduction for fees, expenses or taxes. Please note that an investor cannot invest directly in an index.
The information provided is not intended to be a forecast of future events, a guarantee of future results or investment advice. Views expressed may differ from those of the firm as a whole. Forecasts and predictions are inherently limited and should not be relied upon as an indication of actual or future performance.
| i | The Citigroup World Government Bond Index is a market capitalization-weighted benchmark that tracks the performance of bonds issued by governments in the U.S., Europe and Asia. |
| ii | Effective duration is a duration calculation for bonds with embedded options. Effective duration takes into account that expected cash flows will fluctuate as interest rates change. Please note, duration measures the sensitivity of price (the value of principal) of a fixed-income investment to a change in interest rates. |
| iii | The Bank of Japan (“BoJ”) is the central bank of Japan. The bank is responsible for issuing and handling currency and treasury securities, implementing monetary policy, maintaining the stability of the Japanese financial system and the yen currency. |
| iv | The yield curve is the graphical depiction of the relationship between the yield on bonds of the same credit quality but different maturities. |
| v | The European Central Bank (“ECB”) is responsible for the monetary system of the European Union and the euro currency. |
| vi | The Bank of England (“BOE”), formally the Governor and Company of the Bank of England, is the central bank of the United Kingdom. The Bank of England’s purpose is to maintain monetary and financial stability. |
| vii | The Federal Reserve Board (the “Fed”) is responsible for the formulation of U.S. policies designed to promote economic growth, full employment, stable prices and a sustainable pattern of international trade and payments. |
| viii | A basis point is one-hundredth (1/100 or 0.01) of one percent. |
| ix | Duration is the measure of the price sensitivity of a fixed-income security to an interest rate change of 100 basis points. Calculation is based on the weighted average of the present values for all cash flows. |
| x | The Citigroup World Government Bond Index (unhedged) is a market-capitalization-weighted index consisting of the government bond markets of 23 countries. |
| | |
| Legg Mason BW Global Opportunities Bond Fund 2016 Annual Report | | 7 |
Fund at a glance† (unaudited)
Investment breakdown (%) as a percent of total investments
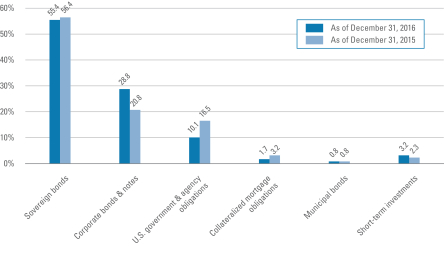
| † | The bar graph above represents the composition of the Fund’s investments as of December 31, 2016 and December 31, 2015 and does not include derivatives such as forward foreign currency contracts. The Fund is actively managed. As a result, the composition of the Fund’s investments is subject to change at any time. |
| | |
| 8 | | Legg Mason BW Global Opportunities Bond Fund 2016 Annual Report |
Fund expenses (unaudited)
Example
As a shareholder of the Fund, you may incur two types of costs: (1) transaction costs, including front-end and back-end sales charges (loads) on purchase payments; and (2) ongoing costs, including management fees; service and/or distribution (12b-1) fees; and other Fund expenses. This example is intended to help you understand your ongoing costs (in dollars) of investing in the Fund and to compare these costs with the ongoing costs of investing in other mutual funds.
This example is based on an investment of $1,000 invested on July 1, 2016 and held for the six months ended December 31, 2016.
Actual expenses
The table below titled “Based on Actual Total Return” provides information about actual account values and actual expenses. You may use the information provided in this table, together with the amount you invested, to estimate the expenses that you paid over the period. To estimate the expenses you paid on your account, divide your ending account value by $1,000 (for example, an $8,600 ending account value divided by $1,000 = 8.6), then multiply the result by the number under the heading entitled “Expenses Paid During the Period”.
Hypothetical example for comparison purposes
The table below titled “Based on Hypothetical Total Return” provides information about hypothetical account values and hypothetical expenses based on the actual expense ratio and an assumed rate of return of 5.00% per year before expenses, which is not the Fund’s actual return. The hypothetical account values and expenses may not be used to estimate the actual ending account balance or expenses you paid for the period. You may use the information provided in this table to compare the ongoing costs of investing in the Fund and other funds. To do so, compare the 5.00% hypothetical example relating to the Fund with the 5.00% hypothetical examples that appear in the shareholder reports of the other funds.
Please note that the expenses shown in the table below are meant to highlight your ongoing costs only and do not reflect any transactional costs, such as front-end or back-end sales charges (loads). Therefore, the table is useful in comparing ongoing costs only, and will not help you determine the relative total costs of owning different funds. In addition, if these transaction costs were included, your costs would have been higher.
| | | | | | | | | | | | | | | | | | | | | | | | | | | | | | | | | | | | | | | | | | | | | | |
| Based on actual total return1 | | | | | | Based on hypothetical total return1 | |
| | | Actual
Total Return
Without
Sales
Charge2 | | | Beginning
Account
Value | | | Ending
Account
Value | | | Annualized
Expense
Ratio | | | Expenses
Paid
During
the
Period3 | | | | | | | | Hypothetical
Annualized
Total Return | | | Beginning
Account
Value | | | Ending
Account
Value | | | Annualized
Expense
Ratio | | | Expenses
Paid
During
the
Period3 | |
| Class A | | | -5.17 | % | | $ | 1,000.00 | | | $ | 948.30 | | | | 0.95 | % | | $ | 4.65 | | | | | | | Class A | | | 5.00 | % | | $ | 1,000.00 | | | $ | 1,020.36 | | | | 0.95 | % | | $ | 4.82 | |
| Class A2 | | | -5.18 | | | | 1,000.00 | | | | 948.20 | | | | 1.06 | | | | 5.19 | | | | | | | Class A2 | | | 5.00 | | | | 1,000.00 | | | | 1,019.81 | | | | 1.06 | | | | 5.38 | |
| Class C | | | -5.51 | | | | 1,000.00 | | | | 944.90 | | | | 1.71 | | | | 8.36 | | | | | | | Class C | | | 5.00 | | | | 1,000.00 | | | | 1,016.54 | | | | 1.71 | | | | 8.67 | |
| Class C1 | | | -5.40 | | | | 1,000.00 | | | | 946.00 | | | | 1.36 | | | | 6.65 | | | | | | | Class C1 | | | 5.00 | | | | 1,000.00 | | | | 1,018.30 | | | | 1.36 | | | | 6.90 | |
| Class FI | | | -5.14 | | | | 1,000.00 | | | | 948.60 | | | | 0.96 | | | | 4.70 | | | | | | | Class FI | | | 5.00 | | | | 1,000.00 | | | | 1,020.31 | | | | 0.96 | | | | 4.88 | |
| Class R | | | -5.29 | | | | 1,000.00 | | | | 947.10 | | | | 1.25 | | | | 6.12 | | | | | | | Class R | | | 5.00 | | | | 1,000.00 | | | | 1,018.85 | | | | 1.25 | | | | 6.34 | |
| Class I | | | -5.02 | | | | 1,000.00 | | | | 949.80 | | | | 0.69 | | | | 3.38 | | | | | | | Class I | | | 5.00 | | | | 1,000.00 | | | | 1,021.67 | | | | 0.69 | | | | 3.51 | |
| Class IS | | | -5.02 | | | | 1,000.00 | | | | 949.80 | | | | 0.58 | | | | 2.84 | | | | | | | Class IS | | | 5.00 | | | | 1,000.00 | | | | 1,022.22 | | | | 0.58 | | | | 2.95 | |
| | |
| Legg Mason BW Global Opportunities Bond Fund 2016 Annual Report | | 9 |
Fund expenses (unaudited) (cont’d)
| 1 | For the six months ended December 31, 2016. |
| 2 | Assumes the reinvestment of all distributions at net asset value and does not reflect the deduction of the applicable sales charge with respect to Class A shares and Class A2 shares or the applicable contingent deferred sales charge (“CDSC”) with respect to Class C shares and Class C1 shares. Total return is not annualized, as it may not be representative of the total return for the year. Performance figures may reflect compensating balance arrangements, fee waivers and/or expense reimbursements. In the absence of compensating balance arrangements, fee waivers and/or expense reimbursements, the total return would have been lower. Past performance is no guarantee of future results. |
| 3 | Expenses (net of compensating balance arrangements, fee waivers and/or expense reimbursements) are equal to each class’ respective annualized expense ratio multiplied by the average account value over the period, multiplied by the number of days in the most recent fiscal half-year (184), then divided by 366. |
| | |
| 10 | | Legg Mason BW Global Opportunities Bond Fund 2016 Annual Report |
Fund performance (unaudited)
| | | | | | | | | | | | | | | | | | | | | | | | | | | | | | | | |
| Average annual total returns | |
| Without sales charges1 | | Class A | | | Class A2 | | | Class C | | | Class C13 | | | Class FI | | | Class R | | | Class I | | | Class IS | |
| Twelve Months Ended 12/31/16 | | | 4.57 | % | | | 4.47 | % | | | 3.89 | % | | | 4.08 | % | | | 4.62 | % | | | 4.38 | % | | | 4.91 | % | | | 5.02 | % |
| Five Years Ended 12/31/16 | | | 1.77 | | | | N/A | | | | N/A | | | | 1.30 | | | | 1.72 | | | | 1.45 | | | | 2.01 | | | | 2.12 | |
| Ten Years Ended 12/31/16 | | | N/A | | | | N/A | | | | N/A | | | | N/A | | | | N/A | | | | N/A | | | | N/A | | | | 5.07 | |
| Inception* through 12/31/16 | | | 4.05 | | | | -0.42 | | | | -0.28 | | | | 3.47 | | | | 6.80 | | | | 1.50 | | | | 6.79 | | | | — | |
| | | | | | | | |
| With sales charges2 | | Class A | | | Class A2 | | | Class C | | | Class C13 | | | Class FI | | | Class R | | | Class I | | | Class IS | |
| Twelve Months Ended 12/31/16 | | | 0.09 | % | | | -0.01 | % | | | 2.89 | % | | | 3.08 | % | | | 4.62 | % | | | 4.38 | % | | | 4.91 | % | | | 5.02 | % |
| Five Years Ended 12/31/16 | | | 0.90 | | | | N/A | | | | N/A | | | | 1.30 | | | | 1.72 | | | | 1.45 | | | | 2.01 | | | | 2.12 | |
| Ten Years Ended 12/31/16 | | | N/A | | | | N/A | | | | N/A | | | | N/A | | | | N/A | | | | N/A | | | | N/A | | | | 5.07 | |
| Inception* through 12/31/16 | | | 3.39 | | | | -1.46 | | | | -0.28 | | | | 3.47 | | | | 6.80 | | | | 1.50 | | | | 6.79 | | | | — | |
| | | | |
| Cumulative total returns | | | |
| Without sales charges1 | | | |
| Class A (Inception date of 3/10/10 through 12/31/16) | | | 31.06 | % |
| Class A2 (Inception date of 10/31/12 through 12/31/16) | | | -1.76 | |
| Class C (Inception date of 8/1/12 through 12/31/16) | | | -1.25 | |
| Class C13 (Inception date of 3/11/10 through 12/31/16) | | | 26.18 | |
| Class FI (Inception date of 2/26/09 through 12/31/16) | | | 67.62 | |
| Class R (Inception date of 9/30/11 through 12/31/16) | | | 8.13 | |
| Class I (Inception date of 3/19/09 through 12/31/16) | | | 66.84 | |
| Class IS (12/31/06 through 12/31/16) | | | 64.01 | |
All figures represent past performance and are not a guarantee of future results. Investment return and principal value of an investment will fluctuate so that an investor’s shares, when redeemed, may be worth more or less than their original cost. The returns shown do not reflect the deduction of taxes that a shareholder would pay on Fund distributions or the redemption of Fund shares. Performance figures may reflect compensating balance arrangements, fee waivers and/or expense reimbursements. In the absence of compensating balance arrangements, fee waivers and/or expense reimbursements, the total return would have been lower.
| 1 | Assumes the reinvestment of all distributions, including returns of capital, if any, at net asset value and does not reflect the deduction of the applicable sales charge with respect to Class A shares and Class A2 shares or the applicable contingent deferred sales charge (“CDSC”) with respect to Class C shares and Class C1 shares. |
| 2 | Assumes the reinvestment of all distributions, including returns of capital, if any, at net asset value. In addition, Class A shares and Class A2 shares reflect the deduction of the maximum initial sales charge of 4.25%. Class C shares and Class C1 shares reflect the deduction of a 1.00% CDSC, which applies if shares are redeemed within one year from purchase payment. |
| 3 | On August 1, 2012, Class C shares were reclassified as Class C1 shares. |
| * | Inception dates for Class A, A2, C, C1, FI, R, I and IS shares are March 10, 2010, October 31, 2012, August 1, 2012, March 11, 2010, February 26, 2009, September 30, 2011, March 19, 2009 and November 1, 2006, respectively. |
| | |
| Legg Mason BW Global Opportunities Bond Fund 2016 Annual Report | | 11 |
Fund performance (unaudited) (cont’d)
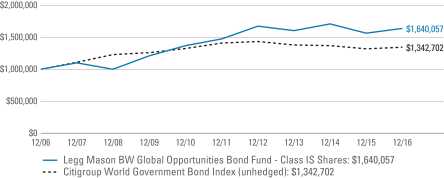
Historical performance
Value of $1,000,000 invested in
Class IS Shares of Legg Mason BW Global Opportunities Bond Fund vs. Citigroup World Government Bond Index (unhedged)† — December 2006 - December 2016
All figures represent past performance and are not a guarantee of future results. Investment return and principal value of an investment will fluctuate so that an investor’s shares, when redeemed, may be worth more or less than their original cost. The returns shown do not reflect the deduction of taxes that a shareholder would pay on Fund distributions or the redemption of Fund shares. Performance figures may reflect compensating balance arrangements, fee waivers and/or expense reimbursements. In the absence of compensating balance arrangements, fee waivers and/or expense reimbursements, the total return would have been lower.
| † | Hypothetical illustration of $1,000,000 invested in Class IS shares of Legg Mason BW Global Opportunities Bond Fund on December 31, 2006 assuming the reinvestment of all distributions, including returns of capital, if any, at net asset value through December 31, 2016. The hypothetical illustration also assumes a $1,000,000 investment in the Citigroup World Government Bond Index (unhedged). The Citigroup World Government Bond Index is a market capitalization-weighted benchmark that tracks the performance of the government bond markets of fourteen countries. The index is unmanaged and is not subject to the same management and trading expenses as a mutual fund. Please note that an investor cannot invest directly in an index. The performance of the Fund’s other classes may be greater or less than Class IS shares’ performance indicated on this chart, depending on whether greater or lesser charges and fees were incurred by shareholders investing in the other classes. |
| | |
| 12 | | Legg Mason BW Global Opportunities Bond Fund 2016 Annual Report |
Schedule of investments
December 31, 2016
Legg Mason BW Global Opportunities Bond Fund
| | | | | | | | | | | | | | | | |
| Security | | Rate | | | Maturity
Date | | | Face
Amount† | | | Value | |
| Sovereign Bonds — 55.1% | | | | | | | | | | | | | | | | |
Australia — 6.8% | | | | | | | | | | | | | | | | |
New South Wales Treasury Corp., Senior Notes | | | 5.000 | % | | | 8/20/24 | | | | 86,905,000 | AUD | | $ | 72,275,846 | |
Queensland Treasury Corp., Senior Bonds | | | 4.750 | % | | | 7/21/25 | | | | 55,180,000 | AUD | | | 44,846,062 | (a) |
Queensland Treasury Corp., Senior Bonds | | | 3.250 | % | | | 7/21/26 | | | | 60,780,000 | AUD | | | 44,067,916 | (a) |
Queensland Treasury Corp., Senior Notes | | | 6.000 | % | | | 7/21/22 | | | | 42,310,000 | AUD | | | 35,826,955 | (a) |
Total Australia | | | | | | | | | | | | | | | 197,016,779 | |
Brazil — 5.2% | | | | | | | | | | | | | | | | |
Federative Republic of Brazil, Notes | | | 10.000 | % | | | 1/1/25 | | | | 172,630,000 | BRL | | | 49,302,422 | |
Federative Republic of Brazil, Notes | | | 10.000 | % | | | 1/1/27 | | | | 363,905,000 | BRL | | | 103,187,590 | |
Total Brazil | | | | | | | | | | | | | | | 152,490,012 | |
Hungary — 3.8% | | | | | | | | | | | | | | | | |
Republic of Hungary, Bonds | | | 7.000 | % | | | 6/24/22 | | | | 3,770,000,000 | HUF | | | 16,220,179 | |
Republic of Hungary, Bonds | | | 6.000 | % | | | 11/24/23 | | | | 17,144,780,000 | HUF | | | 71,969,208 | |
Republic of Hungary, Bonds | | | 5.500 | % | | | 6/24/25 | | | | 5,744,490,000 | HUF | | | 23,391,147 | |
Total Hungary | | | | | | | | | | | | | | | 111,580,534 | |
Indonesia — 4.7% | | | | | | | | | | | | | | | | |
Republic of Indonesia, Senior Bonds | | | 8.375 | % | | | 3/15/24 | | | | 317,700,000,000 | IDR | | | 24,111,951 | |
Republic of Indonesia, Senior Bonds | | | 9.000 | % | | | 3/15/29 | | | | 772,400,000,000 | IDR | | | 60,427,508 | |
Republic of Indonesia, Senior Bonds | | | 8.375 | % | | | 3/15/34 | | | | 71,600,000,000 | IDR | | | 5,341,102 | |
Republic of Indonesia, Senior Bonds | | | 8.750 | % | | | 2/15/44 | | | | 609,200,000,000 | IDR | | | 46,035,850 | |
Total Indonesia | | | | | | | | | | | | | | | 135,916,411 | |
Malaysia — 4.2% | | | | | | | | | | | | | | | | |
Federation of Malaysia, Senior Bonds | | | 3.659 | % | | | 10/15/20 | | | | 231,170,000 | MYR | | | 51,494,328 | |
Federation of Malaysia, Senior Bonds | | | 4.048 | % | | | 9/30/21 | | | | 101,200,000 | MYR | | | 22,646,083 | |
Federation of Malaysia, Senior Bonds | | | 3.620 | % | | | 11/30/21 | | | | 42,960,000 | MYR | | | 9,550,604 | |
Federation of Malaysia, Senior Bonds | | | 3.480 | % | | | 3/15/23 | | | | 181,645,000 | MYR | | | 38,847,209 | |
Total Malaysia | | | | | | | | | | | | | | | 122,538,224 | |
Mexico — 12.1% | | | | | | | | | | | | | | | | |
United Mexican States, Senior Bonds | | | 8.500 | % | | | 5/31/29 | | | | 1,843,570,000 | MXN | | | 94,591,856 | |
United Mexican States, Senior Bonds | | | 7.750 | % | | | 11/23/34 | | | | 432,900,000 | MXN | | | 20,700,049 | |
United Mexican States, Senior Bonds | | | 8.500 | % | | | 11/18/38 | | | | 1,929,900,000 | MXN | | | 98,887,120 | |
United Mexican States, Senior Bonds | | | 7.750 | % | | | 11/13/42 | | | | 2,936,800,000 | MXN | | | 139,543,282 | |
Total Mexico | | | | | | | | | | | | | | | 353,722,307 | |
New Zealand — 1.9% | | | | | | | | | | | | | | | | |
Government of New Zealand, Senior Bonds | | | 5.500 | % | | | 4/15/23 | | | | 68,965,000 | NZD | | | 54,805,728 | (a) |
Poland — 2.0% | | | | | | | | | | | | | | | | |
Republic of Poland, Bonds | | | 4.000 | % | | | 10/25/23 | | | | 89,276,000 | PLN | | | 22,187,528 | |
Republic of Poland, Bonds | | | 3.250 | % | | | 7/25/25 | | | | 152,470,000 | PLN | | | 35,755,657 | |
Total Poland | | | | | | | | | | | | | | | 57,943,185 | |
See Notes to Financial Statements.
| | |
| Legg Mason BW Global Opportunities Bond Fund 2016 Annual Report | | 13 |
Schedule of investments (cont’d)
December 31, 2016
Legg Mason BW Global Opportunities Bond Fund
| | | | | | | | | | | | | | | | |
| Security | | Rate | | | Maturity
Date | | | Face
Amount† | | | Value | |
Portugal — 2.7% | | | | | | | | | | | | | | | | |
Portugal Obrigacoes do Tesouro OT, Senior Bonds | | | 3.850 | % | | | 4/15/21 | | | | 10,435,080 | EUR | | $ | 11,848,355 | (a) |
Portugal Obrigacoes do Tesouro OT, Senior Bonds | | | 4.950 | % | | | 10/25/23 | | | | 56,774,848 | EUR | | | 66,570,598 | (a) |
Total Portugal | | | | | | | | | | | | | | | 78,418,953 | |
South Africa — 5.1% | | | | | | | | | | | | | | | | |
Republic of South Africa, Bonds | | | 6.750 | % | | | 3/31/21 | | | | 349,255,969 | ZAR | | | 24,043,509 | |
Republic of South Africa, Bonds | | | 6.500 | % | | | 2/28/41 | | | | 1,045,409,535 | ZAR | | | 54,157,676 | |
Republic of South Africa, Bonds | | | 8.750 | % | | | 2/28/48 | | | | 1,058,999,612 | ZAR | | | 70,416,968 | |
Total South Africa | | | | | | | | | | | | | | | 148,618,153 | |
United Kingdom — 6.6% | | | | | | | | | | | | | | | | |
United Kingdom Gilt, Bonds | | | 1.250 | % | | | 7/22/18 | | | | 152,095,000 | GBP | | | 190,912,894 | (a) |
Total Sovereign Bonds (Cost — $1,969,600,200) | | | | | | | | 1,603,963,180 | |
| Collateralized Mortgage Obligations — 1.7% | | | | | | | | | | | | | | | | |
Bancaja Fondo de Titulizacion de Activos, 2011 A2 | | | 0.015 | % | | | 4/27/50 | | | | 2,173,186 | EUR | | | 2,236,550 | (a)(b) |
Countrywide Alternative Loan Trust, 2005-26CB A6 | | | 5.500 | % | | | 7/25/35 | | | | 1,917,429 | | | | 1,731,948 | |
Fondo de Titulizacion de Activos UCI, 2017 A2 | | | 0.000 | % | | | 12/17/49 | | | | 6,646,736 | EUR | | | 5,363,634 | (a)(b) |
IM Pastor Fondo de Titulizacion de Activos, 2004 A | | | 0.000 | % | | | 3/22/44 | | | | 10,568,041 | EUR | | | 8,857,568 | (a)(b) |
Marche Mutui Srl, 2006 A2 | | | 0.000 | % | | | 1/27/64 | | | | 16,600,000 | EUR | | | 17,363,456 | (a)(b) |
MASTR Resecuritization Trust, 2008-1 A1 | | | 6.000 | % | | | 9/27/37 | | | | 1,713,791 | | | | 1,665,428 | (c) |
Pastor GC Hipotecario, 2005 A2 | | | 0.037 | % | | | 6/21/46 | | | | 16,125,608 | EUR | | | 12,858,552 | (a)(b) |
Washington Mutual Inc., Mortgage Pass-Through Certificates, 2005-6 2A1 | | | 5.500 | % | | | 8/25/35 | | | | 408,285 | | | | 371,209 | |
Total Collateralized Mortgage Obligations (Cost — $63,939,045) | | | | | | | | 50,448,345 | |
| Corporate Bonds & Notes — 28.7% | | | | | | | | | | | | | | | | |
| Consumer Discretionary — 2.0% | | | | | | | | | | | | | | | | |
Automobiles — 2.0% | | | | | | | | | | | | | | | | |
Ford Motor Credit Co., LLC, Senior Notes | | | 1.627 | % | | | 3/27/17 | | | | 24,436,000 | | | | 24,454,865 | (b) |
Ford Motor Credit Co., LLC, Senior Notes | | | 1.863 | % | | | 6/15/18 | | | | 33,935,000 | | | | 34,016,817 | (b) |
Total Consumer Discretionary | | | | | | | | | | | | | | | 58,471,682 | |
| Energy — 1.9% | | | | | | | | | | | | | | | | |
Oil, Gas & Consumable Fuels — 1.9% | | | | | | | | | | | | | | | | |
Devon Energy Corp., Senior Notes | | | 5.600 | % | | | 7/15/41 | | | | 10,817,000 | | | | 11,141,467 | |
Devon Financing Co., LLC, Debentures | | | 7.875 | % | | | 9/30/31 | | | | 5,207,000 | | | | 6,606,871 | |
Hess Corp., Notes | | | 7.875 | % | | | 10/1/29 | | | | 4,045,000 | | | | 4,877,174 | |
Hess Corp., Notes | | | 7.300 | % | | | 8/15/31 | | | | 3,817,000 | | | | 4,445,729 | |
Hess Corp., Senior Bonds | | | 6.000 | % | | | 1/15/40 | | | | 4,114,000 | | | | 4,243,941 | |
Hess Corp., Senior Notes | | | 7.125 | % | | | 3/15/33 | | | | 2,520,000 | | | | 2,875,252 | |
Marathon Oil Corp., Senior Notes | | | 6.800 | % | | | 3/15/32 | | | | 3,504,000 | | | | 3,902,429 | |
Marathon Oil Corp., Senior Notes | | | 6.600 | % | | | 10/1/37 | | | | 5,466,000 | | | | 5,973,370 | |
See Notes to Financial Statements.
| | |
| 14 | | Legg Mason BW Global Opportunities Bond Fund 2016 Annual Report |
Legg Mason BW Global Opportunities Bond Fund
| | | | | | | | | | | | | | | | |
| Security | | Rate | | | Maturity
Date | | | Face
Amount† | | | Value | |
Oil, Gas & Consumable Fuels — continued | | | | | | | | | | | | | | | | |
Marathon Oil Corp., Senior Notes | | | 5.200 | % | | | 6/1/45 | | | | 11,896,000 | | | $ | 11,212,598 | |
Total Energy | | | | | | | | | | | | | | | 55,278,831 | |
| Financials — 20.2% | | | | | | | | | | | | | | | | |
Banks — 14.0% | | | | | | | | | | | | | | | | |
Bank Nederlandse Gemeenten NV, Senior Notes | | | 0.951 | % | | | 7/14/17 | | | | 25,300,000 | | | | 25,301,569 | (b)(c) |
Citigroup Inc., Senior Bonds | | | 1.493 | % | | | 3/10/17 | | | | 9,779,000 | | | | 9,785,073 | (b) |
Citigroup Inc., Senior Bonds | | | 1.576 | % | | | 4/27/18 | | | | 29,028,000 | | | | 29,147,915 | (b) |
Corporacion Andina de Fomento, Senior Bonds | | | 2.000 | % | | | 5/10/19 | | | | 24,860,000 | | | | 24,697,987 | |
Corporacion Andina de Fomento, Senior Notes | | | 1.437 | % | | | 1/29/18 | | | | 44,980,000 | | | | 45,029,478 | (b) |
Dexia Credit Local SA, Senior Notes | | | 1.276 | % | | | 1/11/17 | | | | 24,476,000 | | | | 24,477,346 | (b)(c) |
Dexia Credit Local SA, Senior Notes | | | 1.142 | % | | | 6/5/18 | | | | 46,769,000 | | | | 46,578,790 | (b)(c) |
Export-Import Bank of Korea, Senior Notes | | | 1.631 | % | | | 1/17/17 | | | | 15,558,000 | | | | 15,559,649 | (b) |
Export-Import Bank of Korea, Senior Notes | | | 1.502 | % | | | 5/12/17 | | | | 61,908,000 | | | | 61,918,772 | (b) |
Export-Import Bank of Korea, Senior Notes | | | 1.527 | % | | | 8/14/17 | | | | 59,273,000 | | | | 59,222,499 | (b)(c) |
JPMorgan Chase Bank N.A., Senior Bonds | | | 1.444 | % | | | 9/21/18 | | | | 19,415,000 | | | | 19,442,492 | (b) |
Wells Fargo & Co., Senior Notes | | | 1.909 | % | | | 7/26/21 | | | | 45,335,000 | | | | 45,710,510 | (b) |
Total Banks | | | | | | | | | | | | | | | 406,872,080 | |
Capital Markets — 4.8% | | | | | | | | | | | | | | | | |
Goldman Sachs Group Inc., Senior Notes | | | 2.006 | % | | | 11/15/18 | | | | 112,757,000 | | | | 113,828,868 | (b) |
Macquarie Bank Ltd., Senior Notes | | | 1.516 | % | | | 10/27/17 | | | | 26,717,000 | | | | 26,746,629 | (b)(c) |
Total Capital Markets | | | | | | | | | | | | | | | 140,575,497 | |
Diversified Financial Services — 1.4% | | | | | | | | | | | | | | | | |
Svensk Exportkredit AB, Senior Notes | | | 1.087 | % | | | 9/28/17 | | | | 40,142,000 | | | | 40,154,123 | (b) |
Total Financials | | | | | | | | | | | | | | | 587,601,700 | |
| Information Technology — 4.6% | | | | | | | | | | | | | | | | |
Technology Hardware, Storage & Peripherals — 4.6% | | | | | | | | | | | | | | | | |
Apple Inc., Senior Notes | | | 4.500 | % | | | 2/23/36 | | | | 22,234,000 | | | | 23,744,422 | |
Apple Inc., Senior Notes | | | 4.650 | % | | | 2/23/46 | | | | 56,529,000 | | | | 61,042,784 | |
Dell Inc., Senior Notes | | | 6.500 | % | | | 4/15/38 | | | | 12,721,000 | | | | 11,989,542 | |
Hewlett Packard Enterprise Co., Senior Notes | | | 6.350 | % | | | 10/15/45 | | | | 36,026,000 | | | | 36,389,899 | |
Total Information Technology | | | | | | | | | | | | | | | 133,166,647 | |
Total Corporate Bonds & Notes (Cost — $819,284,380) | | | | | | | | 834,518,860 | |
| Municipal Bonds — 0.9% | | | | | | | | | | | | | | | | |
Georgia — 0.9% | | | | | | | | | | | | | | | | |
Municipal Electric Authority, GA, Build America Bonds, Plant Vogtle Units 3&4 Project J | | | 6.637 | % | | | 4/1/57 | | | | 5,143,000 | | | | 6,378,400 | |
Municipal Electric Authority, GA, Build America Bonds, Plant Vogtle Units 3&4 Project M | | | 6.655 | % | | | 4/1/57 | | | | 14,721,000 | | | | 17,990,681 | |
Total Municipal Bonds (Cost — $21,154,152) | | | | | | | | 24,369,081 | |
See Notes to Financial Statements.
| | |
| Legg Mason BW Global Opportunities Bond Fund 2016 Annual Report | | 15 |
Schedule of investments (cont’d)
December 31, 2016
Legg Mason BW Global Opportunities Bond Fund
| | | | | | | | | | | | | | | | |
| Security | | Rate | | | Maturity
Date | | | Face
Amount† | | | Value | |
| U.S. Government & Agency Obligations — 10.0% | | | | | | | | | | | | | | | | |
U.S. Government Obligations — 10.0% | | | | | | | | | | | | | | | | |
U.S. Treasury Bonds | | | 3.000 | % | | | 11/15/45 | | | | 74,057,300 | | | $ | 73,044,789 | |
U.S. Treasury Bonds | | | 2.875 | % | | | 11/15/46 | | | | 148,905,000 | | | | 143,763,161 | |
U.S. Treasury Notes | | | 0.746 | % | | | 4/30/18 | | | | 74,855,000 | | | | 74,986,221 | (b) |
Total U.S. Government & Agency Obligations (Cost — $293,959,110) | | | | | | | | 291,794,171 | |
Total Investments before Short-Term Investments (Cost — $3,167,936,887) | | | | 2,805,093,637 | |
| | | | |
| | | | | | | | | Shares | | | | |
| Short-Term Investments — 3.2% | | | | | | | | | | | | | | | | |
State Street Institutional U.S. Government Money Market Fund, Premier Class (Cost — $92,062,164) | | | 0.411 | % | | | | | | | 92,062,164 | | | | 92,062,164 | |
Total Investments — 99.6% (Cost — $3,259,999,051#) | | | | | | | | 2,897,155,801 | |
Other Assets in Excess of Liabilities — 0.4% | | | | | | | | | | | | | | | 12,085,712 | |
Total Net Assets — 100.0% | | | | | | | | | | | | | | $ | 2,909,241,513 | |
| † | Face amount denominated in U.S. dollars, unless otherwise noted. |
| (a) | Security is exempt from registration under Regulation S of the Securities Act of 1933. Regulation S applies to securities offerings that are made outside of the United States and do not involve direct selling efforts in the United States. This security has been deemed liquid pursuant to guidelines approved by the Board of Trustees, unless otherwise noted. |
| (b) | Variable rate security. Interest rate disclosed is as of the most recent information available. |
| (c) | Security is exempt from registration under Rule 144A of the Securities Act of 1933. This security may be resold in transactions that are exempt from registration, normally to qualified institutional buyers. This security has been deemed liquid pursuant to guidelines approved by the Board of Trustees, unless otherwise noted. |
| # | Aggregate cost for federal income tax purposes is $3,261,309,608. |
| | |
Abbreviations used in this schedule: |
| AUD | | — Australian Dollar |
| BRL | | — Brazilian Real |
| EUR | | — Euro |
| GBP | | — British Pound |
| HUF | | — Hungarian Forint |
| IDR | | — Indonesian Rupiah |
| MXN | | — Mexican Peso |
| MYR | | — Malaysian Ringgit |
| NZD | | — New Zealand Dollar |
| PLN | | — Polish Zloty |
| ZAR | | — South African Rand |
See Notes to Financial Statements.
| | |
| 16 | | Legg Mason BW Global Opportunities Bond Fund 2016 Annual Report |
Legg Mason BW Global Opportunities Bond Fund
| | | | |
| Summary of Investments by Country* (unaudited) | |
| United States | | | 27.1 | % |
| Mexico | | | 12.2 | |
| Australia | | | 7.7 | |
| United Kingdom | | | 6.6 | |
| Brazil | | | 5.3 | |
| South Africa | | | 5.1 | |
| South Korea | | | 4.7 | |
| Indonesia | | | 4.7 | |
| Malaysia | | | 4.2 | |
| Hungary | | | 3.8 | |
| Portugal | | | 2.7 | |
| France | | | 2.5 | |
| Supranational | | | 2.4 | |
| Poland | | | 2.0 | |
| New Zealand | | | 1.9 | |
| Sweden | | | 1.4 | |
| Spain | | | 1.0 | |
| Netherlands | | | 0.9 | |
| Italy | | | 0.6 | |
| Short-Term Investments | | | 3.2 | |
| | | | 100.0 | % |
| * | As a percentage of total investments. Please note that the Fund holdings are as of December 31, 2016 and are subject to change. |
See Notes to Financial Statements.
| | |
| Legg Mason BW Global Opportunities Bond Fund 2016 Annual Report | | 17 |
Statement of assets and liabilities
December 31, 2016
| | | | |
|
| Assets: | |
Investments, at value (Cost — $3,259,999,051) | | $ | 2,897,155,801 | |
Interest receivable | | | 32,611,953 | |
Unrealized appreciation on forward foreign currency contracts | | | 10,575,440 | |
Receivable for Fund shares sold | | | 5,334,469 | |
Deposits with brokers for centrally cleared swap contracts | | | 800 | |
Prepaid expenses | | | 248,296 | |
Total Assets | | | 2,945,926,759 | |
|
| Liabilities: | |
Unrealized depreciation on forward foreign currency contracts | | | 22,781,488 | |
Payable for Fund shares repurchased | | | 10,998,518 | |
Investment management fee payable | | | 1,223,941 | |
Accrued foreign capital gains tax | | | 195,521 | |
Service and/or distribution fees payable | | | 105,525 | |
Trustees’ fees payable | | | 61,065 | |
Accrued expenses | | | 1,319,188 | |
Total Liabilities | | | 36,685,246 | |
| Total Net Assets | | $ | 2,909,241,513 | |
|
| Net Assets: | |
Par value (Note 7) | | $ | 2,896 | |
Paid-in capital in excess of par value | | | 3,290,826,099 | |
Accumulated net investment loss | | | (11,321,142) | |
Accumulated net realized gain on investments and foreign currency transactions | | | 5,594,769 | |
Net unrealized depreciation on investments and foreign currencies | | | (375,861,109 | )† |
| Total Net Assets | | $ | 2,909,241,513 | |
See Notes to Financial Statements.
| | |
| 18 | | Legg Mason BW Global Opportunities Bond Fund 2016 Annual Report |
| | | | |
|
| Net Assets: | |
Class A | | | $256,047,883 | |
Class A2 | | | $12,666,156 | |
Class C | | | $22,874,409 | |
Class C1 | | | $11,594,702 | |
Class FI | | | $69,454,953 | |
Class R | | | $15,776,093 | |
Class I | | | $1,356,926,321 | |
Class IS | | | $1,163,900,996 | |
|
| Shares Outstanding: | |
Class A | | | 25,371,708 | |
Class A2 | | | 1,257,974 | |
Class C | | | 2,302,062 | |
Class C1 | | | 1,159,141 | |
Class FI | | | 6,970,333 | |
Class R | | | 1,571,886 | |
Class I | | | 135,190,259 | |
Class IS | | | 115,797,597 | |
|
| Net Asset Value: | |
Class A (and redemption price) | | | $10.09 | |
Class A2 (and redemption price) | | | $10.07 | |
Class C* | | | $9.94 | |
Class C1* | | | $10.00 | |
Class FI (and redemption price) | | | $9.96 | |
Class R (and redemption price) | | | $10.04 | |
Class I (and redemption price) | | | $10.04 | |
Class IS (and redemption price) | | | $10.05 | |
| Maximum Public Offering Price Per Share: | |
Class A (based on maximum initial sales charge of 4.25%) | | | $10.54 | |
Class A2 (based on maximum initial sales charge of 4.25%) | | | $10.52 | |
| † | Net of accrued foreign capital gains tax of $195,521. |
| * | Redemption price per share is NAV of Class C and Class C1 shares reduced by a 1.00% CDSC if shares are redeemed within one year from purchase payment (See Note 2). |
See Notes to Financial Statements.
| | |
| Legg Mason BW Global Opportunities Bond Fund 2016 Annual Report | | 19 |
Statement of operations
For the Year Ended December 31, 2016
| | | | |
|
| Investment Income: | |
Interest | | $ | 128,496,872 | |
Less: Foreign taxes withheld | | | (2,263,646) | |
Total Investment Income | | | 126,233,226 | |
|
| Expenses: | |
Investment management fee (Note 2) | | | 15,703,259 | |
Transfer agent fees (Note 5) | | | 2,578,048 | |
Service and/or distribution fees (Notes 2 and 5) | | | 1,367,173 | |
Custody fees | | | 909,156 | |
Trustees’ fees | | | 364,498 | |
Legal fees | | | 251,113 | |
Fund accounting fees | | | 232,099 | |
Registration fees | | | 171,761 | |
Commitment fees (Note 8) | | | 110,838 | |
Shareholder reports | | | 59,910 | |
Audit and tax fees | | | 56,255 | |
Insurance | | | 48,363 | |
Fees recaptured by investment manager (Note 2) | | | 10 | |
Miscellaneous expenses | | | 156,035 | |
Total Expenses | | | 22,008,518 | |
Less: Fee waivers and/or expense reimbursements (Notes 2 and 5) | | | (7,092) | |
Net Expenses | | | 22,001,426 | |
| Net Investment Income | | | 104,231,800 | |
|
Realized and Unrealized Gain (Loss) on Investments
and Foreign Currency Transactions (Notes 1, 3 and 4): | |
Net Realized Gain (Loss) From: | |
Investment transactions | | | (41,247,118) | |
Foreign currency transactions | | | 458,105 | |
Net Realized Loss | | | (40,789,013) | |
Change in Net Unrealized Appreciation (Depreciation) From: | |
Investments | | | 85,018,048 | † |
Foreign currencies | | | 6,985,990 | |
Change in Net Unrealized Appreciation (Depreciation) | | | 92,004,038 | |
| Net Gain on Investments and Foreign Currency Transactions | | | 51,215,025 | |
| Increase in Net Assets From Operations | | $ | 155,446,825 | |
| † | Net of change in accrued foreign capital gains tax of $195,521. |
See Notes to Financial Statements.
| | |
| 20 | | Legg Mason BW Global Opportunities Bond Fund 2016 Annual Report |
Statements of changes in net assets
| | | | | | | | |
| For the Years Ended December 31, | | 2016 | | | 2015 | |
|
| Operations: | |
Net investment income | | $ | 104,231,800 | | | $ | 112,019,240 | |
Net realized loss | | | (40,789,013) | | | | (13,809,880) | |
Change in net unrealized appreciation (depreciation) | | | 92,004,038 | | | | (436,525,147) | |
Increase (Decrease) in Net Assets From Operations | | | 155,446,825 | | | | (338,315,787) | |
|
| Distributions to Shareholders From (Notes 1 and 6): | |
Net investment income | | | — | | | | (72,554,285) | |
Net realized gains | | | (53,770,585) | | | | (12,200,317) | |
Decrease in Net Assets From Distributions to Shareholders | | | (53,770,585) | | | | (84,754,602) | |
|
| Fund Share Transactions (Note 7): | |
Net proceeds from sale of shares | | | 851,761,670 | | | | 1,493,411,553 | |
Reinvestment of distributions | | | 52,034,206 | | | | 79,259,381 | |
Cost of shares repurchased | | | (1,222,853,742) | | | | (1,570,141,976) | |
Cost of shares redeemed in-kind (Note 11) | | | (39,749,972) | | | | — | |
Increase (Decrease) in Net Assets From Fund Share Transactions | | | (358,807,838) | | | | 2,528,958 | |
Decrease in Net Assets | | | (257,131,598) | | | | (420,541,431) | |
|
| Net Assets: | |
Beginning of year | | | 3,166,373,111 | | | | 3,586,914,542 | |
End of year* | | $ | 2,909,241,513 | | | $ | 3,166,373,111 | |
*Includes overdistributed net investment income of: | | | $(11,321,142) | | | | $(10,934,261) | |
See Notes to Financial Statements.
| | |
| Legg Mason BW Global Opportunities Bond Fund 2016 Annual Report | | 21 |
Financial highlights
| | | | | | | | | | | | | | | | | | | | |
| For a share of each class of beneficial interest outstanding throughout each year ended December 31: | |
| Class A Shares1 | | 2016 | | | 2015 | | | 2014 | | | 2013 | | | 20122 | |
| | | | | |
| Net asset value, beginning of year | | | $9.83 | | | | $11.00 | | | | $10.87 | | | | $11.79 | | | | $10.92 | |
|
| Income (loss) from operations: | |
Net investment income | | | 0.32 | | | | 0.30 | | | | 0.36 | | | | 0.32 | | | | 0.34 | |
Net realized and unrealized gain (loss) | | | 0.13 | | | | (1.26) | | | | 0.27 | | | | (0.81) | | | | 1.04 | |
Total income (loss) from operations | | | 0.45 | | | | (0.96) | | | | 0.63 | | | | (0.49) | | | | 1.38 | |
|
| Less distributions from: | |
Net investment income | | | — | | | | (0.18) | | | | (0.47) | | | | (0.09) | | | | (0.34) | |
Net realized gains | | | (0.19) | | | | (0.03) | | | | (0.03) | | | | (0.25) | | | | (0.17) | |
Return of capital | | | — | | | | — | | | | — | | | | (0.09) | | | | — | |
Total distributions | | | (0.19) | | | | (0.21) | | | | (0.50) | | | | (0.43) | | | | (0.51) | |
| | | | | |
| Net asset value, end of year | | | $10.09 | | | | $9.83 | | | | $11.00 | | | | $10.87 | | | | $11.79 | |
Total return3 | | | 4.57 | % | | | (8.78) | % | | | 5.83 | % | | | (4.22) | % | | | 12.90 | % |
| | | | | |
| Net assets, end of year (000s) | | | $256,048 | | | | $290,093 | | | | $395,225 | | | | $420,837 | | | | $417,763 | |
|
| Ratios to average net assets: | |
Gross expenses | | | 0.95 | % | | | 0.92 | % | | | 0.94 | %4 | | | 0.95 | %4 | | | 0.96 | %4 |
Net expenses5 | | | 0.95 | | | | 0.92 | | | | 0.94 | 4 | | | 0.95 | 4,6 | | | 0.92 | 4,6 |
Net investment income | | | 3.07 | | | | 2.82 | | | | 3.17 | | | | 2.82 | | | | 3.00 | |
| | | | | |
| Portfolio turnover rate | | | 53 | %7 | | | 59 | % | | | 52 | % | | | 59 | % | | | 41 | % |
| 1 | Per share amounts have been calculated using the average shares method. |
| 2 | Represents a share of capital stock outstanding prior to April 30, 2012. |
| 3 | Performance figures, exclusive of sales charges, may reflect compensating balance arrangements, fee waivers and/or expense reimbursements. In the absence of compensating balance arrangements, fee waivers and/or expense reimbursements, the total return would have been lower. Past performance is no guarantee of future results. |
| 4 | Reflects recapture of expenses waived/reimbursed from prior fiscal years. |
| 5 | As a result of an expense limitation arrangement, the ratio of total annual fund operating expenses, other than interest, brokerage commissions, dividend expense on short sales, taxes, extraordinary expenses and acquired fund fees and expenses, to average net assets of Class A shares did not exceed 1.00%. This expense limitation arrangement cannot be terminated prior to December 31, 2018 without the Board of Trustees’ consent. |
| 6 | Reflects fee waivers and/or expense reimbursements. |
| 7 | Excludes securities delivered as a result of a redemption in-kind. |
See Notes to Financial Statements.
| | |
| 22 | | Legg Mason BW Global Opportunities Bond Fund 2016 Annual Report |
| | | | | | | | | | | | | | | | | | | | |
For a share of each class of beneficial interest outstanding throughout each year ended December 31,
unless otherwise noted: | |
| Class A2 Shares1 | | 2016 | | | 2015 | | | 2014 | | | 2013 | | | 20122 | |
| | | | | |
| Net asset value, beginning of year | | | $9.82 | | | | $11.00 | | | | $10.86 | | | | $11.78 | | | | $11.73 | |
|
| Income (loss) from operations: | |
Net investment income | | | 0.31 | | | | 0.28 | | | | 0.33 | | | | 0.31 | | | | 0.06 | |
Net realized and unrealized gain (loss) | | | 0.13 | | | | (1.27) | | | | 0.29 | | | | (0.80) | | | | 0.20 | |
Total income (loss) from operations | | | 0.44 | | | | (0.99) | | | | 0.62 | | | | (0.49) | | | | 0.26 | |
|
| Less distributions from: | |
Net investment income | | | — | | | | (0.16) | | | | (0.45) | | | | (0.09) | | | | (0.06) | |
Net realized gains | | | (0.19) | | | | (0.03) | | | | (0.03) | | | | (0.25) | | | | (0.15) | |
Return of capital | | | — | | | | — | | | | — | | | | (0.09) | | | | — | |
Total distributions | | | (0.19) | | | | (0.19) | | | | (0.48) | | | | (0.43) | | | | (0.21) | |
| | | | | |
| Net asset value, end of year | | | $10.07 | | | | $9.82 | | | | $11.00 | | | | $10.86 | | | | $11.78 | |
Total return3 | | | 4.47 | % | | | (9.03) | % | | | 5.66 | % | | | (4.32) | % | | | 2.24 | % |
| | | | | |
| Net assets, end of year (000s) | | | $12,666 | | | | $12,846 | | | | $13,548 | | | | $10,704 | | | | $1,491 | |
|
| Ratios to average net assets: | |
Gross expenses | | | 1.10 | % | | | 1.11 | %4 | | | 1.21 | %4 | | | 1.18 | %4 | | | 1.07 | %5 |
Net expenses6 | | | 1.10 | | | | 1.11 | 4 | | | 1.20 | 4,7 | | | 1.10 | 4,7 | | | 0.99 | 5,7 |
Net investment income | | | 2.93 | | | | 2.64 | | | | 2.89 | | | | 2.83 | | | | 3.09 | 5 |
| | | | | |
| Portfolio turnover rate | | | 53 | %8 | | | 59 | % | | | 52 | % | | | 59 | % | | | 41 | % |
| 1 | Per share amounts have been calculated using the average shares method. |
| 2 | For the period October 31, 2012 (inception date) to December 31, 2012. |
| 3 | Performance figures, exclusive of sales charges, may reflect compensating balance arrangements, fee waivers and/or expense reimbursements. In the absence of compensating balance arrangements, fee waivers and/or expense reimbursements, the total return would have been lower. Past performance is no guarantee of future results. Total returns for period of less than one year are not annualized. |
| 4 | Reflects recapture of expenses waived/reimbursed from prior fiscal years. |
| 6 | As a result of an expense limitation arrangement, the ratio of total annual fund operating expenses, other than interest, brokerage commissions, dividend expense on short sales, taxes, extraordinary expenses and acquired fund fees and expenses, to average net assets of Class A2 shares did not exceed 1.20%. This expense limitation arrangement cannot be terminated prior to December 31, 2018 without the Board of Trustees’ consent. |
| 7 | Reflects fee waivers and/or expense reimbursements. |
| 8 | Excludes securities delivered as a result of a redemption in-kind. |
See Notes to Financial Statements.
| | |
| Legg Mason BW Global Opportunities Bond Fund 2016 Annual Report | | 23 |
Financial highlights (cont’d)
| | | | | | | | | | | | | | | | | | | | |
For a share of each class of beneficial interest outstanding throughout each year ended December 31,
unless otherwise noted: | |
| Class C Shares1 | | 2016 | | | 2015 | | | 2014 | | | 2013 | | | 20122 | |
| | | | | |
| Net asset value, beginning of year | | | $9.75 | | | | $10.92 | | | | $10.79 | | | | $11.70 | | | | $11.37 | |
|
| Income (loss) from operations: | |
Net investment income | | | 0.24 | | | | 0.21 | | | | 0.27 | | | | 0.23 | | | | 0.10 | |
Net realized and unrealized gain (loss) | | | 0.14 | | | | (1.25) | | | | 0.28 | | | | (0.80) | | | | 0.49 | |
Total income (loss) from operations | | | 0.38 | | | | (1.04) | | | | 0.55 | | | | (0.57) | | | | 0.59 | |
|
| Less distributions from: | |
Net investment income | | | — | | | | (0.10) | | | | (0.39) | | | | (0.06) | | | | (0.11) | |
Net realized gains | | | (0.19) | | | | (0.03) | | | | (0.03) | | | | (0.25) | | | | (0.15) | |
Return of capital | | | — | | | | — | | | | — | | | | (0.03) | | | | — | |
Total distributions | | | (0.19) | | | | (0.13) | | | | (0.42) | | | | (0.34) | | | | (0.26) | |
| | | | | |
| Net asset value, end of year | | | $9.94 | | | | $9.75 | | | | $10.92 | | | | $10.79 | | | | $11.70 | |
Total return3 | | | 3.89 | % | | | (9.58) | % | | | 5.05 | % | | | (4.90) | % | | | 5.23 | % |
| | | | | |
| Net assets, end of year (000s) | | | $22,874 | | | | $31,634 | | | | $43,164 | | | | $44,240 | | | | $20,034 | |
|
| Ratios to average net assets: | |
Gross expenses | | | 1.71 | % | | | 1.68 | % | | | 1.73 | %4 | | | 1.72 | %4 | | | 1.70 | %5 |
Net expenses6 | | | 1.71 | | | | 1.68 | | | | 1.73 | 4 | | | 1.70 | 4,7 | | | 1.65 | 5,7 |
Net investment income | | | 2.30 | | | | 2.06 | | | | 2.37 | | | | 2.09 | | | | 2.21 | 5 |
| | | | | |
| Portfolio turnover rate | | | 53 | %8 | | | 59 | % | | | 52 | % | | | 59 | % | | | 41 | % |
| 1 | Per share amounts have been calculated using the average shares method. |
| 2 | For the period August 1, 2012 (inception date) through December 31, 2012. |
| 3 | Performance figures, exclusive of CDSC, may reflect compensating balance arrangements, fee waivers and/or expense reimbursements. In the absence of compensating balance arrangements, fee waivers and/or expense reimbursements, the total return would have been lower. Past performance is no guarantee of future results. Total returns for periods of less than one year are not annualized. |
| 4 | Reflects recapture of expenses waived/reimbursed from prior fiscal years. |
| 6 | As a result of an expense limitation arrangement, the ratio of total annual fund operating expenses, other than interest, brokerage commissions, dividend expense on short sales, taxes, extraordinary expenses and acquired fund fees and expenses, to average net assets of Class C shares did not exceed 1.75%. This expense limitation arrangement cannot be terminated prior to December 31, 2018 without the Board of Trustees’ consent. |
| 7 | Reflects fee waivers and/or expense reimbursements. |
| 8 | Excludes securities delivered as a result of a redemption in-kind. |
See Notes to Financial Statements.
| | |
| 24 | | Legg Mason BW Global Opportunities Bond Fund 2016 Annual Report |
| | | | | | | | | | | | | | | | | | | | |
| For a share of each class of beneficial interest outstanding throughout each year ended December 31: | |
| Class C1 Shares1,2 | | 2016 | | | 2015 | | | 2014 | | | 2013 | | | 20123 | |
| | | | | |
| Net asset value, beginning of year | | | $9.78 | | | | $10.94 | | | | $10.80 | | | | $11.72 | | | | $10.86 | |
|
| Income (loss) from operations: | |
Net investment income | | | 0.28 | | | | 0.25 | | | | 0.31 | | | | 0.26 | | | | 0.28 | |
Net realized and unrealized gain (loss) | | | 0.13 | | | | (1.25) | | | | 0.28 | | | | (0.80) | | | | 1.04 | |
Total income (loss) from operations | | | 0.41 | | | | (1.00) | | | | 0.59 | | | | (0.54) | | | | 1.32 | |
|
| Less distributions from: | |
Net investment income | | | — | | | | (0.13) | | | | (0.42) | | | | (0.08) | | | | (0.29) | |
Net realized gains | | | (0.19) | | | | (0.03) | | | | (0.03) | | | | (0.25) | | | | (0.17) | |
Return of capital | | | — | | | | — | | | | — | | | | (0.05) | | | | — | |
Total distributions | | | (0.19) | | | | (0.16) | | | | (0.45) | | | | (0.38) | | | | (0.46) | |
| | | | | |
| Net asset value, end of year | | | $10.00 | | | | $9.78 | | | | $10.94 | | | | $10.80 | | | | $11.72 | |
Total return4 | | | 4.08 | % | | | (9.19) | % | | | 5.46 | % | | | (4.71) | % | | | 12.32 | % |
| | | | | |
| Net assets, end of year (000s) | | | $11,595 | | | | $15,697 | | | | $25,307 | | | | $33,570 | | | | $60,610 | |
|
| Ratios to average net assets: | |
Gross expenses | | | 1.38 | % | | | 1.35 | % | | | 1.40 | % | | | 1.43 | %5 | | | 1.42 | %5 |
Net expenses6 | | | 1.38 | | | | 1.35 | | | | 1.40 | | | | 1.43 | 5 | | | 1.39 | 5,7 |
Net investment income | | | 2.64 | | | | 2.38 | | | | 2.73 | | | | 2.31 | | | | 2.52 | |
| | | | | |
| Portfolio turnover rate | | | 53 | %8 | | | 59 | % | | | 52 | % | | | 59 | % | | | 41 | % |
| 1 | On August 1, 2012, Class C shares were reclassified as Class C1 shares. |
| 2 | Per share amounts have been calculated using the average shares method. |
| 3 | Represents a share of capital stock outstanding prior to April 30, 2012. |
| 4 | Performance figures, exclusive of CDSC, may reflect compensating balance arrangements, fee waivers and/or expense reimbursements. In the absence of compensating balance arrangements, fee waivers and/or expense reimbursements, the total return would have been lower. Past performance is no guarantee of future results. |
| 5 | Reflects recapture of expenses waived/reimbursed from prior fiscal years. |
| 6 | As a result of an expense limitation arrangement, the ratio of total annual fund operating expenses, other than interest, brokerage commissions, dividend expense on short sales, taxes, extraordinary expenses and acquired fund fees and expenses, to average net assets of Class C1 shares did not exceed 1.45%. This expense limitation arrangement cannot be terminated prior to December 31, 2018 without the Board of Trustees’ consent. |
| 7 | Reflects fee waivers and/or expense reimbursements. |
| 8 | Excludes securities delivered as a result of a redemption in-kind. |
See Notes to Financial Statements.
| | |
| Legg Mason BW Global Opportunities Bond Fund 2016 Annual Report | | 25 |
Financial highlights (cont’d)
| | | | | | | | | | | | | | | | | | | | |
| For a share of each class of beneficial interest outstanding throughout each year ended December 31: | |
| Class FI Shares1,2 | | 2016 | | | 2015 | | | 2014 | | | 2013 | | | 20123 | |
| | | | | |
| Net asset value, beginning of year | | | $9.71 | | | | $10.88 | | | | $10.75 | | | | $11.66 | | | | $10.81 | |
|
| Income (loss) from operations: | |
Net investment income | | | 0.32 | | | | 0.29 | | | | 0.34 | | | | 0.31 | | | | 0.34 | |
Net realized and unrealized gain (loss) | | | 0.12 | | | | (1.25) | | | | 0.29 | | | | (0.80) | | | | 1.01 | |
Total income (loss) from operations | | | 0.44 | | | | (0.96) | | | | 0.63 | | | | (0.49) | | | | 1.35 | |
|
| Less distributions from: | |
Net investment income | | | — | | | | (0.18) | | | | (0.47) | | | | (0.09) | | | | (0.33) | |
Net realized gains | | | (0.19) | | | | (0.03) | | | | (0.03) | | | | (0.25) | | | | (0.17) | |
Return of capital | | | — | | | | — | | | | — | | | | (0.08) | | | | — | |
Total distributions | | | (0.19) | | | | (0.21) | | | | (0.50) | | | | (0.42) | | | | (0.50) | |
| | | | | |
| Net asset value, end of year | | | $9.96 | | | | $9.71 | | | | $10.88 | | | | $10.75 | | | | $11.66 | |
Total return4 | | | 4.62 | % | | | (8.94) | % | | | 5.85 | % | | | (4.24) | % | | | 12.73 | % |
| | | | | |
| Net assets, end of year (000s) | | | $69,455 | | | | $66,227 | | | | $55,430 | | | | $42,378 | | | | $12,128 | |
|
| Ratios to average net assets: | |
Gross expenses | | | 0.97 | % | | | 0.98 | %5 | | | 1.01 | %5 | | | 1.04 | %5 | | | 1.05 | %5 |
Net expenses6 | | | 0.97 | | | | 0.98 | 5 | | | 1.00 | 5,7 | | | 0.98 | 5,7 | | | 0.97 | 5,7 |
Net investment income | | | 3.06 | | | | 2.77 | | | | 3.07 | | | | 2.79 | | | | 2.97 | |
| | | | | |
| Portfolio turnover rate | | | 53 | %8 | | | 59 | % | | | 52 | % | | | 59 | % | | | 41 | % |
| 1 | On October 5, 2009, Financial Intermediary Class shares were renamed as Class FI shares. |
| 2 | Per share amounts have been calculated using the average shares method. |
| 3 | Represents a share of capital stock outstanding prior to April 30, 2012. |
| 4 | Performance figures may reflect compensating balance arrangements, fee waivers and/or expense reimbursements. In the absence of compensating balance arrangements, fee waivers and/or expense reimbursements, the total return would have been lower. Past performance is no guarantee of future results. |
| 5 | Reflects recapture of expenses waived/reimbursed from prior fiscal years. |
| 6 | As a result of an expense limitation arrangement, the ratio of total annual fund operating expenses, other than interest, brokerage commissions, dividend expense on short sales, taxes, extraordinary expenses and acquired fund fees and expenses, to average net assets of Class FI shares did not exceed 1.00%. This expense limitation arrangement cannot be terminated prior to December 31, 2018 without the Board of Trustees’ consent. |
| 7 | Reflects fee waivers and/or expense reimbursements. |
| 8 | Excludes securities delivered as a result of a redemption in-kind. |
See Notes to Financial Statements.
| | |
| 26 | | Legg Mason BW Global Opportunities Bond Fund 2016 Annual Report |
| | | | | | | | | | | | | | | | | | | | |
| For a share of each class of beneficial interest outstanding throughout each year ended December 31: | |
| Class R Shares1 | | 2016 | | | 2015 | | | 2014 | | | 2013 | | | 20122 | |
| | | | | |
| Net asset value, beginning of year | | | $9.80 | | | | $10.98 | | | | $10.85 | | | | $11.77 | | | | $10.92 | |
|
| Income (loss) from operations: | |
Net investment income | | | 0.29 | | | | 0.26 | | | | 0.32 | | | | 0.30 | | | | 0.32 | |
Net realized and unrealized gain (loss) | | | 0.14 | | | | (1.26) | | | | 0.28 | | | | (0.81) | | | | 1.01 | |
Total income (loss) from operations | | | 0.43 | | | | (1.00) | | | | 0.60 | | | | (0.51) | | | | 1.33 | |
|
| Less distributions from: | |
Net investment income | | | — | | | | (0.15) | | | | (0.44) | | | | (0.09) | | | | (0.31) | |
Net realized gains | | | (0.19) | | | | (0.03) | | | | (0.03) | | | | (0.25) | | | | (0.17) | |
Return of capital | | | — | | | | — | | | | — | | | | (0.07) | | | | — | |
Total distributions | | | (0.19) | | | | (0.18) | | | | (0.47) | | | | (0.41) | | | | (0.48) | |
| | | | | |
| Net asset value, end of year | | | $10.04 | | | | $9.80 | | | | $10.98 | | | | $10.85 | | | | $11.77 | |
Total return3 | | | 4.38 | % | | | (9.14) | % | | | 5.54 | % | | | (4.48) | % | | | 12.42 | % |
| | | | | |
| Net assets, end of year (000s) | | | $15,776 | | | | $14,739 | | | | $9,717 | | | | $6,415 | | | | $783 | |
|
| Ratios to average net assets: | |
Gross expenses | | | 1.29 | %4 | | | 1.27 | %4 | | | 1.36 | % | | | 1.45 | %4 | | | 1.24 | %4 |
Net expenses5,6 | | | 1.25 | 4 | | | 1.25 | 4 | | | 1.25 | | | | 1.23 | 4 | | | 1.15 | 4 |
Net investment income | | | 2.77 | | | | 2.53 | | | | 2.80 | | | | 2.67 | | | | 2.80 | |
| | | | | |
| Portfolio turnover rate | | | 53 | %7 | | | 59 | % | | | 52 | % | | | 59 | % | | | 41 | % |
| 1 | Per share amounts have been calculated using the average shares method. |
| 2 | Represents a share of capital stock outstanding prior to April 30, 2012. |
| 3 | Performance figures may reflect compensating balance arrangements, fee waivers and/or expense reimbursements. In the absence of compensating balance arrangements, fee waivers and/or expense reimbursements, the total return would have been lower. Past performance is no guarantee of future results. |
| 4 | Reflects recapture of expenses waived/reimbursed from prior fiscal years. |
| 5 | Reflects fee waivers and/or expense reimbursements. |
| 6 | As a result of an expense limitation arrangement, the ratio of total annual fund operating expenses, other than interest, brokerage commissions, dividend expense on short sales, taxes, extraordinary expenses and acquired fund fees and expenses, to average net assets of Class R shares did not exceed 1.25%. This expense limitation arrangement cannot be terminated prior to December 31, 2018 without the Board of Trustees’ consent. |
| 7 | Excludes securities delivered as a result of a redemption in-kind. |
See Notes to Financial Statements.
| | |
| Legg Mason BW Global Opportunities Bond Fund 2016 Annual Report | | 27 |
Financial highlights (cont’d)
| | | | | | | | | | | | | | | | | | | | |
| For a share of each class of beneficial interest outstanding throughout each year ended December 31: | |
| Class I Shares1,2 | | 2016 | | | 2015 | | | 2014 | | | 2013 | | | 20123 | |
| | | | | |
| Net asset value, beginning of year | | | $9.75 | | | | $10.92 | | | | $10.79 | | | | $11.71 | | | | $10.85 | |
|
| Income (loss) from operations: | |
Net investment income | | | 0.35 | | | | 0.32 | | | | 0.38 | | | | 0.34 | | | | 0.37 | |
Net realized and unrealized gain (loss) | | | 0.13 | | | | (1.25) | | | | 0.28 | | | | (0.81) | | | | 1.03 | |
Total income (loss) from operations | | | 0.48 | | | | (0.93) | | | | 0.66 | | | | (0.47) | | | | 1.40 | |
|
| Less distributions from: | |
Net investment income | | | — | | | | (0.21) | | | | (0.50) | | | | (0.10) | | | | (0.37) | |
Net realized gains | | | (0.19) | | | | (0.03) | | | | (0.03) | | | | (0.25) | | | | (0.17) | |
Return of capital | | | — | | | | — | | | | — | | | | (0.10) | | | | — | |
Total distributions | | | (0.19) | | | | (0.24) | | | | (0.53) | | | | (0.45) | | | | (0.54) | |
| | | | | |
| Net asset value, end of year | | | $10.04 | | | | $9.75 | | | | $10.92 | | | | $10.79 | | | | $11.71 | |
Total return4 | | | 4.91 | % | | | (8.63) | % | | | 6.13 | % | | | (4.05) | % | | | 13.16 | % |
| | | | | |
| Net assets, end of year (000s) | | | $1,356,926 | | | | $1,522,203 | | | | $1,866,549 | | | | $1,466,799 | | | | $1,316,934 | |
|
| Ratios to average net assets: | |
Gross expenses | | | 0.71 | % | | | 0.69 | % | | | 0.70 | %5 | | | 0.73 | %5 | | | 0.70 | % |
Net expenses6 | | | 0.71 | | | | 0.69 | | | | 0.70 | 5 | | | 0.72 | 5,7 | | | 0.67 | 7 |
Net investment income | | | 3.31 | | | | 3.06 | | | | 3.38 | | | | 3.06 | | | | 3.25 | |
| | | | | |
| Portfolio turnover rate | | | 53 | %8 | | | 59 | % | | | 52 | % | | | 59 | % | | | 41 | % |
| 1 | On October 5, 2009, Institutional Class shares were renamed Class I shares. |
| 2 | Per share amounts have been calculated using the average shares method. |
| 3 | Represents a share of capital stock outstanding prior to April 30, 2012. |
| 4 | Performance figures may reflect compensating balance arrangements, fee waivers and/or expense reimbursements. In the absence of compensating balance arrangements, fee waivers and/or expense reimbursements, the total return would have been lower. Past performance is no guarantee of future results. |
| 5 | Reflects recapture of fees waived/reimbursed from prior fiscal years. |
| 6 | As a result of an expense limitation arrangement, the ratio of total annual fund operating expenses, other than interest, brokerage commissions, dividend expense on short sales, taxes, extraordinary expenses and acquired fund fees and expenses, to average net assets of Class I shares did not exceed 0.75%. This expense limitation arrangement cannot be terminated prior to December 31, 2018 without the Board of Trustees’ consent. |
| 7 | Reflects fee waivers and/or expense reimbursements. |
| 8 | Excludes securities delivered as a result of a redemption in-kind. |
See Notes to Financial Statements.
| | |
| 28 | | Legg Mason BW Global Opportunities Bond Fund 2016 Annual Report |
| | | | | | | | | | | | | | | | | | | | |
| For a share of each class of beneficial interest outstanding throughout each year ended December 31: | |
| Class IS Shares1,2 | | 2016 | | | 2015 | | | 2014 | | | 2013 | | | 20123 | |
| | | | | |
| Net asset value, beginning of year | | | $9.75 | | | | $10.92 | | | | $10.79 | | | | $11.71 | | | | $10.85 | |
|
| Income (loss) from operations: | |
Net investment income | | | 0.36 | | | | 0.33 | | | | 0.39 | | | | 0.36 | | | | 0.38 | |
Net realized and unrealized gain (loss) | | | 0.13 | | | | (1.25) | | | | 0.29 | | | | (0.81) | | | | 1.03 | |
Total income (loss) from operations | | | 0.49 | | | | (0.92) | | | | 0.68 | | | | (0.45) | | | | 1.41 | |
|
| Less distributions from: | |
Net investment income | | | — | | | | (0.22) | | | | (0.52) | | | | (0.10) | | | | (0.38) | |
Net realized gains | | | (0.19) | | | | (0.03) | | | | (0.03) | | | | (0.25) | | | | (0.17) | |
Return of capital | | | — | | | | — | | | | — | | | | (0.12) | | | | — | |
Total distributions | | | (0.19) | | | | (0.25) | | | | (0.55) | | | | (0.47) | | | | (0.55) | |
| | | | | |
| Net asset value, end of year | | | $10.05 | | | | $9.75 | | | | $10.92 | | | | $10.79 | | | | $11.71 | |
Total return4 | | | 5.02 | % | | | (8.50) | % | | | 6.26 | % | | | (3.92) | % | | | 13.22 | % |
| | | | | |
| Net assets, end of year (000s) | | | $1,163,901 | | | | $1,212,935 | | | | $1,177,975 | | | | $943,877 | | | | $865,444 | |
|
| Ratios to average net assets: | |
Gross expenses | | | 0.58 | % | | | 0.56 | % | | | 0.58 | % | | | 0.59 | %5 | | | 0.62 | %5 |
Net expenses6 | | | 0.58 | | | | 0.56 | | | | 0.58 | | | | 0.59 | 5 | | | 0.60 | 5,7 |
Net investment income | | | 3.45 | | | | 3.20 | | | | 3.51 | | | | 3.20 | | | | 3.33 | |
| | | | | |
| Portfolio turnover rate | | | 53 | %8 | | | 59 | % | | | 52 | % | | | 59 | % | | | 41 | % |
| 1 | On October 5, 2009, Institutional Select Class shares were renamed Class IS shares. |
| 2 | Per share amounts have been calculated using the average shares method. |
| 3 | Represents a share of capital stock outstanding prior to April 30, 2012. |
| 4 | Performance figures may reflect compensating balance arrangements, fee waivers and/or expense reimbursements. In the absence of compensating balance arrangements, fee waivers and/or expense reimbursements, the total return would have been lower. Past performance is no guarantee of future results. |
| 5 | Reflects recapture of expenses waived/reimbursed from prior fiscal years. |
| 6 | As a result of an expense limitation arrangement, the ratio of total annual fund operating expenses, other than interest, brokerage commissions, dividend expense on short sales, taxes, extraordinary expenses and acquired fund fees and expenses, to average net assets of Class IS shares did not exceed 0.65%. In addition, the ratio of total annual fund operating expenses for Class IS shares did not exceed the ratio of total annual fund operating expenses for Class I shares. These expense limitation arrangements cannot be terminated prior to December 31, 2018 without the Board of Trustees’ consent. |
| 7 | Reflects fee waivers and/or expense reimbursements. |
| 8 | Excludes securities delivered as a result of a redemption in-kind. |
See Notes to Financial Statements.
| | |
| Legg Mason BW Global Opportunities Bond Fund 2016 Annual Report | | 29 |
Notes to financial statements
1. Organization and significant accounting policies
Legg Mason BW Global Opportunities Bond Fund (the “Fund”) is a separate non-diversified investment series of Legg Mason Global Asset Management Trust (the “Trust”). The Trust, a Maryland statutory trust, is registered under the Investment Company Act of 1940, as amended (the “1940 Act”), as an open-end management investment company.
The following are significant accounting policies consistently followed by the Fund and are in conformity with U.S. generally accepted accounting principles (“GAAP”). Estimates and assumptions are required to be made regarding assets, liabilities and changes in net assets resulting from operations when financial statements are prepared. Changes in the economic environment, financial markets and any other parameters used in determining these estimates could cause actual results to differ. Subsequent events have been evaluated through the date the financial statements were issued.
(a) Investment valuation. The valuations for fixed income securities (which may include, but are not limited to, corporate, government, municipal, mortgage-backed, collateralized mortgage obligations and asset-backed securities) and certain derivative instruments are typically the prices supplied by independent third party pricing services, which may use market prices or broker/dealer quotations or a variety of valuation techniques and methodologies. The independent third party pricing services use inputs that are observable such as issuer details, interest rates, yield curves, prepayment speeds, credit risks/spreads, default rates and quoted prices for similar securities. Short-term fixed income securities that will mature in 60 days or less are valued at amortized cost, unless it is determined that using this method would not reflect an investment’s fair value. Investments in open-end funds are valued at the closing net asset value per share of each fund on the day of valuation. Equity securities for which market quotations are available are valued at the last reported sales price or official closing price on the primary market or exchange on which they trade. When the Fund holds securities or other assets that are denominated in a foreign currency, the Fund will normally use the currency exchange rates as of 4:00 p.m. (Eastern Time). If independent third party pricing services are unable to supply prices for a portfolio investment, or if the prices supplied are deemed by the manager to be unreliable, the market price may be determined by the manager using quotations from one or more broker/dealers or at the transaction price if the security has recently been purchased and no value has yet been obtained from a pricing service or pricing broker. When reliable prices are not readily available, such as when the value of a security has been significantly affected by events after the close of the exchange or market on which the security is principally traded, but before the Fund calculates its net asset value, the Fund values these securities as determined in accordance with procedures approved by the Fund’s Board of Trustees.
The Board of Trustees is responsible for the valuation process and has delegated the supervision of the daily valuation process to the Legg Mason North Atlantic Fund Valuation Committee (the “Valuation Committee”). The Valuation Committee, pursuant to the policies adopted by the Board of Trustees, is responsible for making fair value determinations, evaluating the effectiveness of the Fund’s pricing policies, and reporting to the Board of
| | |
| 30 | | Legg Mason BW Global Opportunities Bond Fund 2016 Annual Report |
Trustees. When determining the reliability of third party pricing information for investments owned by the Fund, the Valuation Committee, among other things, conducts due diligence reviews of pricing vendors, monitors the daily change in prices and reviews transactions among market participants.
The Valuation Committee will consider pricing methodologies it deems relevant and appropriate when making fair value determinations. Examples of possible methodologies include, but are not limited to, multiple of earnings; discount from market of a similar freely traded security; discounted cash-flow analysis; book value or a multiple thereof; risk premium/yield analysis; yield to maturity; and/or fundamental investment analysis. The Valuation Committee will also consider factors it deems relevant and appropriate in light of the facts and circumstances. Examples of possible factors include, but are not limited to, the type of security; the issuer’s financial statements; the purchase price of the security; the discount from market value of unrestricted securities of the same class at the time of purchase; analysts’ research and observations from financial institutions; information regarding any transactions or offers with respect to the security; the existence of merger proposals or tender offers affecting the security; the price and extent of public trading in similar securities of the issuer or comparable companies; and the existence of a shelf registration for restricted securities.
For each portfolio security that has been fair valued pursuant to the policies adopted by the Board of Trustees, the fair value price is compared against the last available and next available market quotations. The Valuation Committee reviews the results of such back testing monthly and fair valuation occurrences are reported to the Board of Trustees quarterly.
The Fund uses valuation techniques to measure fair value that are consistent with the market approach and/or income approach, depending on the type of security and the particular circumstance. The market approach uses prices and other relevant information generated by market transactions involving identical or comparable securities. The income approach uses valuation techniques to discount estimated future cash flows to present value.
GAAP establishes a disclosure hierarchy that categorizes the inputs to valuation techniques used to value assets and liabilities at measurement date. These inputs are summarized in the three broad levels listed below:
| • | | Level 1 — quoted prices in active markets for identical investments |
| • | | Level 2 — other significant observable inputs (including quoted prices for similar investments, interest rates, prepayment speeds, credit risk, etc.) |
| • | | Level 3 — significant unobservable inputs (including the Fund’s own assumptions in determining the fair value of investments) |
The inputs or methodologies used to value securities are not necessarily an indication of the risk associated with investing in those securities.
| | |
| Legg Mason BW Global Opportunities Bond Fund 2016 Annual Report | | 31 |
Notes to financial statements (cont’d)
The following is a summary of the inputs used in valuing the Fund’s assets and liabilities carried at fair value:
| | | | | | | | | | | | | | | | |
| ASSETS | |
| Description | | Quoted Prices
(Level 1) | | | Other Significant
Observable Inputs
(Level 2) | | | Significant
Unobservable
Inputs
(Level 3) | | | Total | |
| Long-term investments†: | |
Sovereign bonds | | | — | | | $ | 1,603,963,180 | | | | — | | | $ | 1,603,963,180 | |
Collateralized mortgage obligations | | | — | | | | 50,448,345 | | | | — | | | | 50,448,345 | |
Corporate bonds & notes | | | — | | | | 834,518,860 | | | | — | | | | 834,518,860 | |
Municipal bonds | | | — | | | | 24,369,081 | | | | — | | | | 24,369,081 | |
U.S. government & agency obligations | | | — | | | | 291,794,171 | | | | — | | | | 291,794,171 | |
| Total long-term investments | | | — | | | | 2,805,093,637 | | | | — | | | | 2,805,093,637 | |
| Short-term investments† | | $ | 92,062,164 | | | | — | | | | — | | | | 92,062,164 | |
| Total investments | | $ | 92,062,164 | | | $ | 2,805,093,637 | | | | — | | | $ | 2,897,155,801 | |
| Other financial instruments: | |
Forward foreign currency contracts | | | — | | | | 10,575,440 | | | | — | | | | 10,575,440 | |
| Total | | $ | 92,062,164 | | | $ | 2,815,669,077 | | | | — | | | $ | 2,907,731,241 | |
|
| LIABILITIES | |
| Description | | Quoted Prices
(Level 1) | | | Other Significant
Observable Inputs
(Level 2) | | | Significant
Unobservable
Inputs
(Level 3) | | | Total | |
| Other financial instruments: | |
Forward foreign currency contracts | | | — | | | $ | 22,781,488 | | | | — | | | $ | 22,781,488 | |
| † | See Schedule of Investments for additional detailed categorizations. |
(b) Forward foreign currency contracts. The Fund enters into a forward foreign currency contract to hedge exposure of bond positions or in an attempt to increase the Fund’s return. A forward foreign currency contract is an agreement between two parties to buy and sell a currency at a set price with delivery and settlement at a future date. The contract is marked-to-market daily and the change in value is recorded by the Fund as an unrealized gain or loss. When a forward foreign currency contract is closed, through either delivery or offset by entering into another forward foreign currency contract, the Fund recognizes a realized gain or loss equal to the difference between the value of the contract at the time it was opened and the value of the contract at the time it is closed.
Forward foreign currency contracts involve elements of market risk in excess of the amounts reflected on the Statement of Assets and Liabilities. The Fund bears the risk of an unfavorable change in the foreign exchange rate underlying the forward foreign currency contract. Risks may also arise upon entering into these contracts from the potential inability of the counterparties to meet the terms of their contracts.
(c) Foreign currency translation. Investment securities and other assets and liabilities denominated in foreign currencies are translated into U.S. dollar amounts based upon
| | |
| 32 | | Legg Mason BW Global Opportunities Bond Fund 2016 Annual Report |
prevailing exchange rates on the date of valuation. Purchases and sales of investment securities and income and expense items denominated in foreign currencies are translated into U.S. dollar amounts based upon prevailing exchange rates on the respective dates of such transactions.
The Fund does not isolate that portion of the results of operations resulting from fluctuations in foreign exchange rates on investments from the fluctuations arising from changes in market prices of securities held. Such fluctuations are included with the net realized and unrealized gain or loss on investments.
Net realized foreign exchange gains or losses arise from sales of foreign currencies, including gains and losses on forward foreign currency contracts, currency gains or losses realized between the trade and settlement dates on securities transactions, and the difference between the amounts of dividends, interest, and foreign withholding taxes recorded on the Fund’s books and the U.S. dollar equivalent of the amounts actually received or paid. Net unrealized foreign exchange gains and losses arise from changes in the values of assets and liabilities, other than investments in securities, on the date of valuation, resulting from changes in exchange rates.
Foreign security and currency transactions may involve certain considerations and risks not typically associated with those of U.S. dollar denominated transactions as a result of, among other factors, the possibility of lower levels of governmental supervision and regulation of foreign securities markets and the possibility of political or economic instability.
(d) Credit and market risk. The Fund invests in high-yield and emerging market instruments that are subject to certain credit and market risks. The yields of high-yield and emerging market debt obligations reflect, among other things, perceived credit and market risks. The Fund’s investments in securities rated below investment grade typically involve risks not associated with higher rated securities including, among others, greater risk related to timely and ultimate payment of interest and principal, greater market price volatility and less liquid secondary market trading. The consequences of political, social, economic or diplomatic changes may have disruptive effects on the market prices of investments held by the Fund. The Fund’s investments in non-U.S. dollar denominated securities may also result in foreign currency losses caused by devaluations and exchange rate fluctuations.
Investments in securities that are collateralized by real estate mortgages are subject to certain credit and liquidity risks. When market conditions result in an increase in default rates of the underlying mortgages and the foreclosure values of underlying real estate properties are materially below the outstanding amount of these underlying mortgages, collection of the full amount of accrued interest and principal on these investments may be doubtful. Such market conditions may significantly impair the value and liquidity of these investments and may result in a lack of correlation between their credit ratings and values.
(e) Foreign investment risks. The Fund’s investments in foreign securities may involve risks not present in domestic investments. Since securities may be denominated in foreign
| | |
| Legg Mason BW Global Opportunities Bond Fund 2016 Annual Report | | 33 |
Notes to financial statements (cont’d)
currencies, may require settlement in foreign currencies or pay interest or dividends in foreign currencies, changes in the relationship of these foreign currencies to the U.S. dollar can significantly affect the value of the investments and earnings of the Fund. Foreign investments may also subject the Fund to foreign government exchange restrictions, expropriation, taxation or other political, social or economic developments, all of which affect the market and/or credit risk of the investments.
(f) Counterparty risk and credit-risk-related contingent features of derivative instruments. The Fund may invest in certain securities or engage in other transactions, where the Fund is exposed to counterparty credit risk in addition to broader market risks. The Fund may invest in securities of issuers, which may also be considered counterparties as trading partners in other transactions. This may increase the risk of loss in the event of default or bankruptcy by the counterparty or if the counterparty otherwise fails to meet its contractual obligations. The Fund’s subadviser attempts to mitigate counterparty risk by (i) periodically assessing the creditworthiness of its trading partners, (ii) monitoring and/or limiting the amount of its net exposure to each individual counterparty based on its assessment and (iii) requiring collateral from the counterparty for certain transactions. Market events and changes in overall economic conditions may impact the assessment of such counterparty risk by the subadviser. In addition, declines in the values of underlying collateral received may expose the Fund to increased risk of loss.
The Fund has entered into master agreements with certain of its derivative counterparties that provide for general obligations, representations, agreements, collateral, events of default or termination and credit related contingent features. The credit related contingent features include, but are not limited to, a percentage decrease in the Fund’s net assets or NAV over a specified period of time. If these credit related contingent features were triggered, the derivatives counterparty could terminate the positions and demand payment or require additional collateral.
Collateral requirements differ by type of derivative. Collateral or margin requirements are set by the broker or exchange clearing house for exchange traded derivatives while collateral terms are contract specific for over-the-counter traded derivatives. Cash collateral that has been pledged to cover obligations of the Fund under derivative contracts, if any, will be reported separately in the Statement of Assets and Liabilities. Securities pledged as collateral, if any, for the same purpose are noted in the Schedule of Investments.
Absent an event of default by the counterparty or a termination of the agreement, the terms of the master agreements do not result in an offset of reported amounts of financial assets and financial liabilities in the Statement of Assets and Liabilities across transactions between the Fund and the applicable counterparty. The enforceability of the right to offset may vary by jurisdiction.
As of December 31, 2016, the Fund held forward foreign currency contracts with credit related contingent features which had a liability position of $22,781,488. If a contingent feature in the master agreements would have been triggered, the Fund would have been required to pay this amount to its derivatives counterparties.
| | |
| 34 | | Legg Mason BW Global Opportunities Bond Fund 2016 Annual Report |
(g) Security transactions and investment income. Security transactions are accounted for on a trade date basis. Interest income, adjusted for amortization of premium and accretion of discount, is recorded on the accrual basis. Paydown gains and losses on mortgage and asset-backed securities are recorded as adjustments to interest income. Dividend income is recorded on the ex-dividend date. Foreign dividend income is recorded on the ex-dividend date or as soon as practicable after the Fund determines the existence of a dividend declaration after exercising reasonable due diligence. The cost of investments sold is determined by use of the specific identification method. To the extent any issuer defaults or a credit event occurs that impacts the issuer, the Fund may halt any additional interest income accruals and consider the realizability of interest accrued up to the date of default or credit event.
(h) Distributions to shareholders. Distributions from net investment income of the Fund, if any, are declared and paid on a quarterly basis. Distributions of net realized gains, if any, are declared at least annually. Distributions to shareholders of the Fund are recorded on the ex-dividend date and are determined in accordance with income tax regulations, which may differ from GAAP.
(i) Share class accounting. Investment income, common expenses and realized/unrealized gains (losses) on investments are allocated to the various classes of the Fund on the basis of daily net assets of each class. Fees relating to a specific class are charged directly to that share class.
(j) Compensating balance arrangements. The Fund has an arrangement with its custodian bank whereby a portion of the custodian’s fees is paid indirectly by credits earned on the Fund’s cash on deposit with the bank.
(k) Federal and other taxes. It is the Fund’s policy to comply with the federal income and excise tax requirements of the Internal Revenue Code of 1986 (the “Code”), as amended, applicable to regulated investment companies. Accordingly, the Fund intends to distribute its taxable income and net realized gains, if any, to shareholders in accordance with timing requirements imposed by the Code. Therefore, no federal or state income tax provision is required in the Fund’s financial statements.
Management has analyzed the Fund’s tax positions taken on income tax returns for all open tax years and has concluded that as of December 31, 2016, no provision for income tax is required in the Fund’s financial statements. The Fund’s federal and state income and federal excise tax returns for tax years for which the applicable statutes of limitations have not expired are subject to examination by the Internal Revenue Service and state departments of revenue.
Under the applicable foreign tax laws, a withholding tax may be imposed on interest, dividends and capital gains at various rates. Realized gains upon disposition of securities issued in or by certain foreign countries are subject to capital gains tax imposed by those countries. As of December 31, 2016, there were $195,521 of capital gains tax liabilities accrued on unrealized gains.
| | |
| Legg Mason BW Global Opportunities Bond Fund 2016 Annual Report | | 35 |
Notes to financial statements (cont’d)
(l) Reclassification. GAAP requires that certain components of net assets be reclassified to reflect permanent differences between financial and tax reporting. These reclassifications have no effect on net assets or net asset value per share. During the current year, the following reclassifications have been made:
| | | | | | | | | | | | |
| | | Accumulated Net
Investment Loss | | | Accumulated Net
Realized Gain | | | Paid-in
Capital | |
| (a) | | | — | | | $ | 355,079 | | | $ | (355,079) | |
| (b) | | $ | (104,618,681) | | | | 104,618,681 | | | | — | |
| (a) | Reclassifications are due to book/tax differences in the treatment of an in-kind distribution of securities. |
| (b) | Reclassifications are due to foreign currency transactions treated as ordinary income for tax purposes, losses from mortgage backed securities treated as capital losses for tax purposes and a tax net operating loss which offsets short-term capital gains for tax purposes. |
2. Investment management agreement and other transactions with affiliates
Legg Mason Partners Fund Advisor, LLC (“LMPFA”) is the Fund’s investment manager and Brandywine Global Investment Management, LLC (“Brandywine Global”) is the Fund’s subadviser. LMPFA and Brandywine Global are wholly-owned subsidiaries of Legg Mason, Inc. (“Legg Mason”).
LMPFA provides administrative and certain oversight services to the Fund. The Fund pays an investment management fee, calculated daily and paid monthly, at an annual rate of 0.50% of the Fund’s average daily net assets. LMPFA delegates to the subadviser the day-to-day portfolio management of the Fund. For its services, LMPFA pays Brandywine Global monthly 90% of the net management fee.
As a result of expense limitation arrangements between the Fund and LMPFA, the ratio of total annual fund operating expenses, other than interest, brokerage commissions, dividend expense on short sales, taxes, extraordinary expenses and acquired fund fees and expenses, to average net assets of Class A, Class A2, Class C, Class C1, Class FI, Class R, Class I and Class IS shares did not exceed 1.00%, 1.20%, 1.75%, 1.45%, 1.00%, 1.25%, 0.75% and 0.65%, respectively. In addition, the ratio of total annual fund operating expenses for Class IS shares of the Fund did not exceed the ratio of total annual fund operating expenses for Class I shares. These expense limitation arrangements cannot be terminated prior to December 31, 2018 without the Board of Trustees’ consent.
During the year ended December 31, 2016, fees waived and/or expenses reimbursed amounted to $7,092.
LMPFA is permitted to recapture amounts waived and/or reimbursed to a class within three years after the fiscal year in which LMPFA earned the fee or incurred the expense if the class’ total annual operating expenses have fallen to a level below the expense limitation (“expense cap”) in effect at the time the fees were earned or the expenses incurred. In no case will LMPFA recapture any amount that would result, on any particular business day of the Fund, in the class’ total annual operating expenses exceeding the expense cap or any other lower limit then in effect.
| | |
| 36 | | Legg Mason BW Global Opportunities Bond Fund 2016 Annual Report |
Pursuant to these arrangements, at December 31, 2016, the Fund had remaining fee waivers and/or expense reimbursements subject to recapture by LMPFA and respective dates of expiration as follows:
| | | | |
| | | Class R | |
| Expires December 31, 2017 | | $ | 8,867 | |
| Expires December 31, 2018 | | | 2,873 | |
| Expires December 31, 2019 | | | 7,092 | |
| Total fee waivers/expense reimbursements subject to recapture | | $ | 18,832 | |
For the year ended December 31, 2016, LMPFA recaptured $10 for Class R shares.
Legg Mason Investor Services, LLC (‘‘LMIS’’), a wholly-owned broker-dealer subsidiary of Legg Mason, serves as the Fund’s sole and exclusive distributor.
There is a maximum initial sales charge of 4.25% for Class A shares and A2 shares. There is a contingent deferred sales charge (“CDSC”) of 1.00% on Class C shares, Class C1 shares which applies if redemption occurs within 12 months from purchase payment. In certain cases, Class A and Class A2 shares have a 1.00% CDSC, which applies if redemption occurs within 18 months from purchase payment. This CDSC only applies to those purchases of Class A and Class A2 shares, which, when combined with current holdings of other shares of funds sold by LMIS, equal or exceed $1,000,000 in the aggregate. These purchases do not incur an initial sales charge.
For the year ended December 31, 2016, LMIS and its affiliates retained sales charges of $11,696 and $4,976 on sales of the Fund’s Class A and Class A2 shares, respectively. In addition, for the year ended December 31, 2016, CDSCs paid to LMIS and its affiliates were:
| | | | | | | | | | | | |
| | | Class A | | | Class A2 | | | Class C | |
| CDSCs | | $ | 2,250 | | | $ | 63 | | | $ | 3,946 | |
Under a Deferred Compensation Plan (the “Plan”), Trustees may have elected to defer receipt of all or a specified portion of their compensation. A participating Trustee selected one or more funds managed by affiliates of Legg Mason in which his or her deferred trustee’s fees were deemed to be invested. Deferred amounts remain in the Fund until distributed in accordance with the Plan. In May 2015, the Board of Trustees approved an amendment to the Plan so that effective January 1, 2016, no compensation earned after that date may be deferred under the Plan.
All officers and one Trustee of the Trust are employees of Legg Mason or its affiliates and do not receive compensation from the Trust.
| | |
| Legg Mason BW Global Opportunities Bond Fund 2016 Annual Report | | 37 |
Notes to financial statements (cont’d)
3. Investments
During the year ended December 31, 2016, the aggregate cost of purchases and proceeds from sales of investments (excluding short-term investments) and U.S. Government & Agency Obligations were as follows:
| | | | | | | | |
| | | Investments | | | U.S. Government &
Agency Obligations | |
| Purchases | | $ | 794,347,655 | | | $ | 811,458,347 | |
| Sales | | | 791,598,966 | * | | | 1,081,780,557 | * |
| * | Excludes the value of securities (minus accrued interest) delivered as a result of a redemption in-kind totaling $39,352,907 (see Note 11). |
At December 31, 2016, the aggregate gross unrealized appreciation and depreciation of investments for federal income tax purposes were as follows:
| | | | |
| Gross unrealized appreciation | | $ | 49,959,819 | |
| Gross unrealized depreciation | | | (414,113,626) | |
| Net unrealized depreciation | | $ | (364,153,807) | |
At December 31, 2016, the Fund had the following open forward foreign currency contracts:
| | | | | | | | | | | | | | | | | | | | |
Currency
Purchased | | | Currency
Sold | | | Counterparty | | Settlement
Date | | | Unrealized
Appreciation
(Depreciation) | |
| USD | | | 8,346,705 | | | NOK | | | 70,500,000 | | | Barclays Bank PLC | | | 1/13/17 | | | $ | 181,356 | |
| NOK | | | 731,400,000 | | | USD | | | 89,884,050 | | | HSBC Bank USA, N.A. | | | 1/13/17 | | | | (5,172,898) | |
| USD | | | 55,070,144 | | | NZD | | | 76,670,000 | | | Morgan Stanley Capital Services, LLC | | | 1/17/17 | | | | 1,829,991 | |
| USD | | | 11,706,752 | | | SEK | | | 107,300,000 | | | Barclays Bank PLC | | | 1/23/17 | | | | (86,042) | |
| SEK | | | 861,200,000 | | | USD | | | 98,106,115 | | | HSBC Bank USA, N.A. | | | 1/23/17 | | | | (3,456,031) | |
| USD | | | 134,018,654 | | | EUR | | | 120,890,000 | | | Citibank N.A. | | | 2/10/17 | | | | 6,530,108 | |
| EUR | | | 6,250,000 | | | USD | | | 6,657,900 | | | Goldman Sachs Group Inc. | | | 2/10/17 | | | | (66,756) | |
| NOK | | | 598,400,000 | | | USD | | | 72,039,101 | | | HSBC Bank USA, N.A. | | | 2/14/17 | | | | (2,719,761) | |
| CLP | | | 32,540,000,000 | | | USD | | | 48,228,842 | | | HSBC Bank USA, N.A. | | | 2/17/17 | | | | 203,622 | |
| USD | | | 8,049,155 | | | CLP | | | 5,240,000,000 | | | HSBC Bank USA, N.A. | | | 2/17/17 | | | | 249,950 | |
| AUD | | | 88,550,000 | | | USD | | | 65,999,414 | | | Morgan Stanley Capital Services, LLC | | | 2/17/17 | | | | (2,166,590) | |
| SEK | | | 954,100,000 | | | USD | | | 103,813,721 | | | HSBC Bank USA, N.A. | | | 3/6/17 | | | | 1,281,659 | |
| CLP | | | 44,310,000,000 | | | USD | | | 67,212,742 | | | HSBC Bank USA, N.A. | | | 3/7/17 | | | | (1,346,370) | |
| GBP | | | 211,390,000 | | | USD | | | 268,689,373 | | | Citibank N.A. | | | 3/9/17 | | | | (7,767,040) | |
| INR | | | 9,510,000,000 | | | USD | | | 138,810,839 | | | Barclays Bank PLC | | | 3/15/17 | | | | 222,847 | |
| CLP | | | 27,650,000,000 | | | USD | | | 40,978,140 | | | HSBC Bank USA, N.A. | | | 3/24/17 | | | | 75,907 | |
| Total | | | $ | (12,206,048) | |
| | |
| 38 | | Legg Mason BW Global Opportunities Bond Fund 2016 Annual Report |
| | |
Abbreviations used in this table: |
| AUD | | — Australian Dollar |
| CLP | | — Chilean Peso |
| EUR | | — Euro |
| GBP | | — British Pound |
| INR | | — Indian Rupee |
| NOK | | — Norwegian Krone |
| NZD | | — New Zealand Dollar |
| SEK | | — Swedish Krona |
| USD | | — United States Dollar |
4. Derivative instruments and hedging activities
Below is a table, grouped by derivative type, that provides information about the fair value and the location of derivatives within the Statement of Assets and Liabilities at December 31, 2016.
| | | | |
| ASSET DERIVATIVES1 | |
| | | Foreign
Exchange Risk | |
| Forward foreign currency contracts | | $ | 10,575,440 | |
| | | | |
| LIABILITY DERIVATIVES1 | |
| | | Foreign
Exchange Risk | |
| Forward foreign currency contracts | | $ | 22,781,488 | |
| 1 | Generally, the balance sheet location for asset derivatives is receivables/net unrealized appreciation (depreciation) and for liability derivatives is payables/net unrealized appreciation (depreciation). |
The following tables provide information about the effect of derivatives and hedging activities on the Fund’s Statement of Operations for the year ended December 31, 2016. The first table provides additional detail about the amounts and sources of gains (losses) realized on derivatives during the period. The second table provides additional information about the change in unrealized appreciation (depreciation) resulting from the Fund’s derivatives and hedging activities during the period.
| | | | |
| AMOUNT OF REALIZED GAIN (LOSS) ON DERIVATIVES RECOGNIZED | |
| | | Foreign
Exchange Risk | |
| Forward foreign currency contracts1 | | $ | 3,056,893 | |
| 1 | Net realized gain (loss) from forward foreign currency contracts is reported in net realized gain (loss) from foreign currency transactions in the Statement of Operations. |
| | | | |
| CHANGE IN UNREALIZED APPRECIATION (DEPRECIATION) ON DERIVATIVES RECOGNIZED | |
| | | Foreign
Exchange Risk | |
| Forward foreign currency contracts1 | | $ | 6,385,171 | |
| 1 | The change in unrealized appreciation (depreciation) from forward foreign currency contracts is reported in the change in net unrealized appreciation (depreciation) from foreign currencies in the Statement of Operations. |
| | |
| Legg Mason BW Global Opportunities Bond Fund 2016 Annual Report | | 39 |
Notes to financial statements (cont’d)
During the year ended December 31, 2016, the volume of derivative activity for the Fund was as follows:
| | | | |
| | | Average Market
Value | |
| Forward foreign currency contracts (to buy) | | $ | 1,048,074,006 | |
| Forward foreign currency contracts (to sell) | | | 255,782,879 | |
The following table presents by financial instrument, the Fund’s derivative assets net of the related collateral received by the Fund at December 31, 2016:
| | | | | | | | | | | | |
| | | Gross Amount of Derivative
Assets in the Statement of
Assets and Liabilities1 | | | Collateral
Received | | | Net
Amount | |
| Forward foreign currency contracts | | $ | 10,575,440 | | | | — | | | $ | 10,575,440 | |
The following table presents by financial instrument, the Fund’s derivative liabilities net of the related collateral pledged by the Fund at December 31, 2016:
| | | | | | | | | | | | |
| | | Gross Amount of Derivative
Liabilities in the Statement of
Assets and Liabilities1 | | | Collateral
Pledged | | | Net
Amount | |
| Forward foreign currency contracts | | $ | 22,781,488 | | | | — | | | $ | 22,781,488 | |
| 1 | Absent an event of default or early termination, derivative assets and liabilities are presented gross and not offset in the Statement of Assets and Liabilities. |
5. Class specific expenses, waivers and/or expense reimbursements
The Fund has adopted a Rule 12b-1 shareholder services and distribution plan and under that plan the Fund pays service and/or distribution fees with respect to its Class A, Class A2, Class C, Class C1, Class FI and Class R shares calculated at the annual rate of 0.25%, 0.25%, 1.00%, 0.70%, 0.25% and 0.50% of the average daily net assets of each class, respectively. Service and/or distribution fees are accrued daily and paid monthly.
For the year ended December 31, 2016, class specific expenses were as follows:
| | | | | | | | |
| | | Service and/or
Distribution Fees | | | Transfer Agent
Fees | |
| Class A | | $ | 687,955 | | | $ | 348,350 | |
| Class A2 | | | 33,131 | | | | 35,721 | |
| Class C | | | 291,012 | | | | 40,643 | |
| Class C1 | | | 99,450 | | | | 14,869 | |
| Class FI | | | 173,573 | | | | 97,781 | |
| Class R | | | 82,052 | | | | 35,663 | |
| Class I | | | — | | | | 1,987,892 | |
| Class IS | | | — | | | | 17,129 | |
| Total | | $ | 1,367,173 | | | $ | 2,578,048 | |
| | |
| 40 | | Legg Mason BW Global Opportunities Bond Fund 2016 Annual Report |
For the year ended December 31, 2016, waivers and/or expense reimbursements by class were as follows:
| | | | |
| | | Waivers/Expense
Reimbursements | |
| Class A | | | — | |
| Class A2 | | | — | |
| Class C | | | — | |
| Class C1 | | | — | |
| Class FI | | | — | |
| Class R | | $ | 7,092 | |
| Class I | | | — | |
| Class IS | | | — | |
| Total | | $ | 7,092 | |
6. Distributions to shareholders by class
| | | | | | | | |
| | | Year Ended
December 31, 2016 | | | Year Ended
December 31, 2015 | |
| Net Investment Income: | |
| Class A | | | — | | | $ | 6,313,113 | |
| Class A2 | | | — | | | | 210,108 | |
| Class C | | | — | | | | 383,153 | |
| Class C1 | | | — | | | | 271,284 | |
| Class FI | | | — | | | | 1,369,394 | |
| Class R | | | — | | | | 191,066 | |
| Class I | | | — | | | | 36,960,918 | |
| Class IS | | | — | | | | 26,855,249 | |
| Total | | | — | | | $ | 72,554,285 | |
|
| Net Realized Gains: | |
| Class A | | $ | 4,692,815 | | | $ | 1,201,745 | |
| Class A2 | | | 232,131 | | | | 43,362 | |
| Class C | | | 428,243 | | | | 127,761 | |
| Class C1 | | | 216,941 | | | | 69,978 | |
| Class FI | | | 1,244,886 | | | | 263,003 | |
| Class R | | | 290,600 | | | | 41,620 | |
| Class I | | | 25,183,806 | | | | 6,380,379 | |
| Class IS | | | 21,481,163 | | | | 4,072,469 | |
| Total | | $ | 53,770,585 | | | $ | 12,200,317 | |
7. Shares of beneficial interest
At December 31, 2016, the Fund had an unlimited number of shares of beneficial interest authorized with a par value of $0.00001 per share. The Fund has the ability to issue multiple classes of shares. Each class of shares represents an identical interest and has the same rights, except that each class bears certain direct expenses, including those specifically related to the distribution of its shares.
| | |
| Legg Mason BW Global Opportunities Bond Fund 2016 Annual Report | | 41 |
Notes to financial statements (cont’d)
Transactions in shares of each class were as follows:
| | | | | | | | | | | | | | | | |
| | | Year Ended
December 31, 2016 | | | Year Ended
December 31, 2015 | |
| | | Shares | | | Amount | | | Shares | | | Amount | |
| Class A | |
| Shares sold | | | 7,429,858 | | | $ | 77,455,616 | | | | 11,567,825 | | | $ | 122,736,962 | |
| Shares issued on reinvestment | | | 427,700 | | | | 4,285,555 | | | | 669,758 | | | | 7,009,645 | |
| Shares repurchased | | | (12,006,376) | | | | (125,813,117) | | | | (18,640,666) | | | | (193,956,357) | |
| Net decrease | | | (4,148,818) | | | $ | (44,071,946) | | | | (6,403,083) | | | $ | (64,209,750) | |
|
| Class A2 | |
| Shares sold | | | 158,977 | | | $ | 1,674,964 | | | | 303,711 | | | $ | 3,184,026 | |
| Shares issued on reinvestment | | | 23,218 | | | | 232,131 | | | | 24,272 | | | | 253,468 | |
| Shares repurchased | | | (232,543) | | | | (2,436,465) | | | | (251,806) | | | | (2,622,342) | |
| Net increase (decrease) | | | (50,348) | | | $ | (529,370) | | | | 76,177 | | | $ | 815,152 | |
|
| Class��C | |
| Shares sold | | | 308,668 | | | $ | 3,213,626 | | | | 850,343 | | | $ | 8,898,705 | |
| Shares issued on reinvestment | | | 39,091 | | | | 385,827 | | | | 44,019 | | | | 461,721 | |
| Shares repurchased | | | (1,288,743) | | | | (13,319,036) | | | | (1,604,972) | | | | (16,504,959) | |
| Net decrease | | | (940,984) | | | $ | (9,719,583) | | | | (710,610) | | | $ | (7,144,533) | |
|
| Class C1 | |
| Shares sold | | | 7,697 | | | $ | 78,994 | | | | 9,613 | | | $ | 102,700 | |
| Shares issued on reinvestment | | | 19,626 | | | | 194,689 | | | | 28,815 | | | | 301,620 | |
| Shares repurchased | | | (473,778) | | | | (4,909,667) | | | | (746,292) | | | | (7,647,235) | |
| Net decrease | | | (446,455) | | | $ | (4,635,984) | | | | (707,864) | | | $ | (7,242,915) | |
|
| Class FI | |
| Shares sold | | | 2,104,831 | | | $ | 21,795,921 | | | | 5,511,059 | | | $ | 58,742,515 | |
| Shares issued on reinvestment | | | 125,464 | | | | 1,242,093 | | | | 156,725 | | | | 1,622,319 | |
| Shares repurchased | | | (2,079,376) | | | | (21,500,223) | | | | (3,944,822) | | | | (40,549,215) | |
| Net increase | | | 150,919 | | | $ | 1,537,791 | | | | 1,722,962 | | | $ | 19,815,619 | |
|
| Class R | |
| Shares sold | | | 604,691 | | | $ | 6,356,637 | | | | 870,755 | | | $ | 9,183,084 | |
| Shares issued on reinvestment | | | 27,094 | | | | 270,132 | | | | 20,546 | | | | 214,065 | |
| Shares repurchased | | | (563,198) | | | | (5,936,853) | | | | (272,700) | | | | (2,835,067) | |
| Net increase | | | 68,587 | | | $ | 689,916 | | | | 618,601 | | | $ | 6,562,082 | |
|
| Class I | |
| Shares sold | | | 42,892,963 | | | $ | 454,760,362 | | | | 63,835,696 | | | $ | 674,456,728 | |
| Shares issued on reinvestment | | | 2,425,475 | | | | 24,181,984 | | | | 3,757,976 | | | | 38,952,589 | |
| Shares repurchased | | | (66,187,568) | | | | (686,067,353) | | | | (82,411,424) | | | | (843,089,119) | |
| Net decrease | | | (20,869,130) | | | $ | (207,125,007) | | | | (14,817,752) | | | $ | (129,679,802) | |
| | |
| 42 | | Legg Mason BW Global Opportunities Bond Fund 2016 Annual Report |
| | | | | | | | | | | | | | | | |
| | | Year Ended
December 31, 2016 | | | Year Ended
December 31, 2015 | |
| | | Shares | | | Amount | | | Shares | | | Amount | |
| Class IS | |
| Shares sold | | | 27,396,947 | | | $ | 286,425,550 | | | | 58,810,476 | | | $ | 616,106,833 | |
| Shares issued on reinvestment | | | 2,128,436 | | | | 21,241,795 | | | | 2,947,225 | | | | 30,443,954 | |
| Shares repurchased | | | (34,337,547) | | | | (362,871,028) | | | | (45,234,459) | | | | (462,937,682) | |
| Shares redeemed in-kind | | | (3,757,086) | | | | (39,749,972) | | | | — | | | | — | |
| Net increase (decrease) | | | (8,569,250) | | | $ | (94,953,655) | | | | 16,523,242 | | | $ | 183,613,105 | |
8. Redemption facility
The Fund and certain other participating funds within the Trust (the “Participating Funds”), have available an unsecured revolving credit facility (the “Redemption Facility”) from the lenders and The Bank of New York Mellon (“BNY Mellon”), as administrative agent for the lenders. The Redemption Facility is to be used for temporary or emergency purposes as an additional source of liquidity to fund redemptions of shares. Under the agreement, BNY Mellon provides a 364-day revolving credit facility, in the aggregate amount of $190 million. Unless renewed, the agreement will terminate on November 20, 2017. Any borrowings under the Redemption Facility will bear interest at current market rates as set forth in the credit agreement. The annual commitment fee to maintain the Redemption Facility is 0.10% and is incurred on the unused portion of the facility and is allocated to all Participating Funds pro rata based on net assets. For the year ended December 31, 2016, the Fund incurred a commitment fee in the amount of $110,838. The Fund did not utilize the Redemption Facility during the year ended December 31, 2016.
9. Income tax information and distributions to shareholders
The tax character of distributions paid during the fiscal years ended December 31, was as follows:
| | | | | | | | |
| | | 2016 | | | 2015 | |
| Distributions paid from: | | | | | | | | |
| Ordinary income | | $ | 42,800,107 | | | $ | 72,554,285 | |
| Net long-term capital gains | | | 10,970,478 | | | | 12,200,317 | |
| Total distributions paid | | $ | 53,770,585 | | | $ | 84,754,602 | |
As of December 31, 2016, the components of accumulated earnings (losses) on a tax basis were as follows:
| | | | |
| Deferred capital losses* | | $ | (8,467,284) | |
| Other book/tax temporary differences(a) | | | 4,051,468 | |
| Unrealized appreciation (depreciation)(b) | | | (377,171,666) | |
| Total accumulated earnings (losses) — net | | $ | (381,587,482) | |
| * | These capital losses have been deferred in the current year as either short-term or long-term losses. The losses will be deemed to occur on the first day of the next taxable year in the same character as they were originally deferred and will be available to offset future taxable capital gains. |
| | |
| Legg Mason BW Global Opportunities Bond Fund 2016 Annual Report | | 43 |
Notes to financial statements (cont’d)
| (a) | Other book/tax temporary differences are attributable to the tax deferral of losses on straddles, the realization for tax purposes of unrealized gains (losses) on certain foreign currency contracts, the deferral of certain late year losses for tax purposes and book/tax differences in the timing of the deductibility of various expenses. |
| (b) | The difference between book-basis and tax-basis unrealized appreciation (depreciation) is attributable to the tax deferral of losses on wash sales. |
10. Recent accounting pronouncement
In October 2016, the U.S. Securities and Exchange Commission adopted new rules and amended existing rules (together, the “final rules”) intended to modernize the reporting and disclosure of information by registered investment companies. In part, the final rules amend Regulation S-X and require standardized, enhanced disclosure about derivatives in investment company financial statements, as well as other amendments. The compliance date for the amendments to Regulation S-X is August 1, 2017. Management is currently evaluating the impact that the adoption of the amendments to Regulation S-X will have on the Fund’s financial statements and related disclosures.
11. Redemptions-in-kind
The Fund may make payment for Fund shares redeemed wholly or in part by distributing portfolio securities to shareholders. For the year ended December 31, 2016, the Fund had redemptions in-kind with total proceeds in the amount of $39,749,972. The net realized loss on these redemptions in-kind amounted to $(353,211), which was not realized for tax purposes.
| | |
| 44 | | Legg Mason BW Global Opportunities Bond Fund 2016 Annual Report |
Report of independent registered public
accounting firm
To the Board of Trustees of Legg Mason Global Asset Management Trust and to the Shareholders of Legg Mason BW Global Opportunities Bond Fund:
In our opinion, the accompanying statement of assets and liabilities, including the schedule of investments, and the related statements of operations and of changes in net assets and the financial highlights present fairly, in all material respects, the financial position of the Legg Mason BW Global Opportunities Bond Fund (one of the funds comprising Legg Mason Global Asset Management Trust, the “Fund”) as of December 31, 2016, the results of its operations, the changes in its net assets and the financial highlights for each of the periods presented, in conformity with accounting principles generally accepted in the United States of America. These financial statements and financial highlights (hereafter referred to as “financial statements”) are the responsibility of the Fund’s management. Our responsibility is to express an opinion on these financial statements based on our audits. We conducted our audits of these financial statements in accordance with the standards of the Public Company Accounting Oversight Board (United States). Those standards require that we plan and perform the audit to obtain reasonable assurance about whether the financial statements are free of material misstatement. An audit includes examining, on a test basis, evidence supporting the amounts and disclosures in the financial statements, assessing the accounting principles used and significant estimates made by management, and evaluating the overall financial statement presentation. We believe that our audits, which included confirmation of securities at December 31, 2016 by correspondence with the custodian and brokers, provide a reasonable basis for our opinion.
PricewaterhouseCoopers LLP
Baltimore, Maryland
February 21, 2017
| | |
| Legg Mason BW Global Opportunities Bond Fund 2016 Annual Report | | 45 |
Board approval of management and subadvisory agreements (unaudited)
At its November 2016 meeting, the Fund’s Board of Trustees (the “Board”) approved the continuation of the management agreement (the “Management Agreement”) with Legg Mason Partners Fund Advisor, LLC (the “Manager”) and the investment advisory agreement (the “Advisory Agreement”) between the Manager and Brandywine Global Investment Management, LLC (the “Adviser”). (The Management Agreement and the Advisory Agreement are jointly referred to as the “Agreements.”) The trustees who are not “interested persons” of the Fund (as defined in the Investment Company Act of 1940, as amended) (the “Independent Trustees”), met on October 13, 2016, with the assistance of their independent legal counsel, to review and evaluate the materials provided by the Manager to assist the Board, and in particular the Independent Trustees, in considering continuation of the Agreements. At such October meeting the Independent Trustees received a presentation from senior Fund management and reviewed the information provided, as well as a memorandum from their independent legal counsel. The Board, including the Independent Trustees, at its November 2016 meeting, reviewed and evaluated the supplemental materials provided to assist the Board in considering continuation of the Agreements. The Independent Trustees further discussed continuation of the Agreements in an executive session with independent legal counsel on November 2, 2016.
In voting to approve continuation of the Agreements, the Board, including the Independent Trustees, considered whether continuation of the Agreements would be in the best interests of the Fund and its shareholders. No single factor or item of information reviewed by the Board was identified as the principal factor in determining whether to approve the Agreements. Based upon its evaluation of all material factors, including those described below, the Board concluded that the terms of each of the Agreements are reasonable and fair and that it was in the best interests of the Fund and its shareholders to approve continuation of the Agreements.
The Board received and considered information regarding the nature, extent and quality of services provided to the Fund by the Manager and the Adviser, under the Management Agreement and Advisory Agreement, respectively. The Board also considered the Manager’s supervisory activities over the Adviser. In addition, the Board received and considered other information regarding the administrative and other services rendered to the Fund and its shareholders by the Manager and its affiliates. The Board noted information received at regular meetings throughout the year related to the services rendered by the Manager in its management of the Fund’s affairs and the Manager’s role in coordinating the activities of the Adviser and the Fund’s other service providers. The Board’s evaluation of the services provided by the Manager and the Adviser took into account the Board’s knowledge and familiarity gained as Board members of funds in the Legg Mason fund complex, including the scope and quality of the investment management and other capabilities of the Manager and the Adviser, and the quality of the Manager’s administrative and other services.
The Board reviewed the qualifications, backgrounds and responsibilities of the senior personnel serving the Fund and the portfolio management team primarily responsible for the
| | |
| 46 | | Legg Mason BW Global Opportunities Bond Fund |
day-to-day portfolio management of the Fund. The Board also considered the financial strength of the Manager’s parent organization, Legg Mason, Inc.
The Board considered the division of responsibilities between the Manager and the Adviser and the oversight provided by the Manager. The Board also considered the Adviser’s brokerage policies and practices, the standards applied in seeking best execution, the policies regarding soft dollar usage and the existence of quality controls applicable to brokerage allocation procedures.
The Board received and reviewed performance information for the Fund and for a group of funds (the “Performance Universe”) selected by Broadridge, an independent provider of investment company data. The Board was provided a description of the methodology Broadridge used to determine the similarity of the Fund with the funds included in the Performance Universe. The Broadridge data also included a comparison of the Fund’s performance to the Fund’s designated benchmark. In addition, the trustees noted that they also had received and discussed at periodic intervals information comparing the Fund’s performance to that of its Performance Universe and benchmark, as well as other performance measures, such as Morningstar rankings, and had met with the Fund’s portfolio managers at in-person meetings during the year.
The Board noted that the Fund’s Class IS Shares outperformed for the one, three- and five-year periods ended June 30, 2016, placing the Fund’s Class IS Shares in the third, third and first quintiles, respectively (the first quintile being the best performers and the fifth quintile being the worst performers). The Board reviewed the subadvisory fee, noting that its evaluation of the factors of the nature, extent and quality of services and investment performance led it to conclude that, with respect to these factors, it was in the best interests of the Fund to approve continuation of the Agreements.
The Board reviewed and considered the contractual management fee (the “Contractual Management Fee”) payable by the Fund to the Manager in light of the nature, extent and quality of the management and advisory services provided by the Manager and the Adviser, respectively. The Board reviewed the subadvisory fee, noting that the Manager, and not the Fund, pays the fee to the Adviser. In addition, the Board reviewed and considered the actual management fee (the “Actual Management Fee”).
The Board also reviewed information regarding the fees the Manager and the Adviser charged any of their U.S. clients investing primarily in an asset class similar to that of the Fund including, where applicable, separate accounts. The Manager reviewed with the Board the significant differences in the scope of services provided to the Fund and to such other clients, and that the Manager coordinates and oversees the provision of services to the Fund by other fund service providers, including the Adviser. The Board considered the fee comparisons in light of the scope of services required to manage these different types of accounts.
The Board received an analysis of complex-wide management fees provided by the Manager, which, among other things, sets out the range of fees based on asset classes. In
| | |
| Legg Mason BW Global Opportunities Bond Fund | | 47 |
Board approval of management and subadvisory agreements (unaudited) (cont’d)
addition, the Manager provided and discussed with the Board a comparison with the fees of other registered investment companies managed in the same asset class, including any subadvisory relationships with unaffiliated registered investment companies.
Additionally, the Board received and considered information comparing the Fund’s Contractual Management Fee, Actual Management Fee and the Fund’s overall expense ratio with those of a group of funds selected by Broadridge as comparable to the Fund and with a broader universe of funds also selected by Broadridge. With respect to the Fund, the Board noted that Contractual and Actual Management Fees were lower than median (first and second quintiles, respectively), and that the actual total expense ratio for the Class IS Shares was lower than the Broadridge expense group median (first quintile) and average and lower than the Broadridge expense universe median. The Board also reviewed the expense ratios for each class of shares of the Fund.
The Board was provided an overview of the process followed in conducting the profitability study and received a report on the profitability of Legg Mason in providing services to the Fund, based on financial information and business data for the 12 months ended March 31, 2016 and 2015, which corresponds to Legg Mason’s fiscal year end. The Board also reviewed certain information showing historical profitability for fiscal years 2012 through 2016. The Board also received a report by an independent consultant regarding its assessment of the methodologies used by Legg Mason for its profitability study. The Board considered the profitability study along with the other materials previously provided to the Board and determined that the profitability was not excessive in light of the nature, extent and quality of the services provided to the Fund.
The Board received and considered information regarding whether there have been economies of scale with respect to the management of the Fund as the Fund’s assets have grown, whether the Fund has appropriately benefited from any economies of scale, and whether there is potential for realization of any further economies of scale. Given the asset size of the Fund and the complex, as well as the Contractual Management Fee, the Board concluded that although there currently are no breakpoints, any economies of scale currently being realized were appropriately being reflected in the Actual Management Fee paid by the Fund.
The Board considered other benefits received by the Manager and its affiliates, as a result of the Manager’s relationship with the Fund, including the opportunity to offer additional products and services to Fund shareholders. The Board also considered the information provided by the Manager regarding amounts received by the Fund’s distributor and intermediary arrangements.
In light of the structure of the fees, the costs of providing investment management and other services to the Fund, the Manager’s ongoing commitment to the Fund and the ancillary benefits received, the Board concluded that the Management Fees were reasonable.
After evaluation of all material factors, the Board concluded that the continuation of each Agreement is in the best interests of the Fund.
| | |
| 48 | | Legg Mason BW Global Opportunities Bond Fund |
Additional information (unaudited)
Information about Trustees and Officers
The business and affairs of Legg Mason BW Global Opportunities Bond Fund (the “Fund”) are conducted by management under the supervision and subject to the direction of its Board of Trustees. The business address of each Trustee is c/o Jane Trust, Legg Mason, 100 International Drive, 11th Floor, Baltimore, Maryland 21202. Information pertaining to the Trustees and officers of the Fund is set forth below.
The Statement of Additional Information includes additional information about Trustees and is available, without charge, upon request by calling the Fund at 1-877-721-1926.
| | |
| Independent Trustees† |
| Ruby P. Hearn |
| Year of birth | | 1940 |
| Position(s) with Trust | | Trustee |
| Term of office1 and length of time served2 | | Since 2004 |
| Principal occupation(s) during past five years | | Senior Vice President Emerita of The Robert Wood Johnson Foundation (non-profit) since 2001; Member of the Institute of Medicine since 1982; formerly, Trustee of the New York Academy of Medicine (2004 to 2012); Director of the Institute for Healthcare Improvement (2002 to 2012); Senior Vice President of The Robert Wood Johnson Foundation (1996 to 2001); Fellow of The Yale Corporation (1992 to 1998) |
| Number of funds in fund complex overseen by Trustee | | 20 |
| Other board memberships held by Trustee during past five years | | None |
|
| Arnold L. Lehman |
| Year of birth | | 1944 |
| Position(s) with Trust | | Trustee and Chairman |
| Term of office1 and length of time served2 | | Since 1982 and since 2015 |
| Principal occupation(s) during past five years | | Senior Advisor, Phillips Auctioneer since 2015; Trustee of American Federation of Arts since 1998; formerly, Fellow, Ford Foundation (2015 to 2016); Director of the Brooklyn Museum (1997 to 2015); Director of The Baltimore Museum of Art (1979 to 1997) |
| Number of funds in fund complex overseen by Trustee | | 20 |
| Other board memberships held by Trustee during past five years | | None |
|
| Robin J.W. Masters |
| Year of birth | | 1955 |
| Position(s) with Trust | | Trustee |
| Term of office1 and length of time served2 | | Since 2002 |
| Principal occupation(s) during past five years | | Retired; formerly, Chief Investment Officer of ACE Limited (insurance) (1986 to 2000) |
| Number of funds in fund complex overseen by Trustee | | 20 |
| Other board memberships held by Trustee during past five years | | Director of Cheyne Capital International Limited (investment advisory firm); formerly, Director/Trustee of Legg Mason Institutional Funds plc, WA Fixed Income Funds plc and Western Asset Debt Securities Fund plc. (2007 to 2011) |
| | |
| Legg Mason BW Global Opportunities Bond Fund | | 49 |
Additional information (unaudited) (cont’d)
Information about Trustees and Officers
| | |
| Independent Trustees† cont’d |
| Jill E. McGovern |
| Year of birth | | 1944 |
| Position(s) with Trust | | Trustee |
| Term of office1 and length of time served2 | | Since 1989 |
| Principal occupation(s) during past five years | | Senior Consultant, American Institute for Contemporary German Studies (AICGS) since 2007; formerly, Chief Executive Officer of The Marrow Foundation (non-profit) (1993 to 2007); Executive Director of the Baltimore International Festival (1991 to 1993); Senior Assistant to the President of The Johns Hopkins University (1986 to 1990) |
| Number of funds in fund complex overseen by Trustee | | 20 |
| Other board memberships held by Trustee during past five years | | Director of International Biomedical Research Alliance; Director of Lois Roth Endowment |
|
| Arthur S. Mehlman |
| Year of birth | | 1942 |
| Position(s) with Trust | | Trustee |
| Term of office1 and length of time served2 | | Since 2002 |
| Principal occupation(s) during past five years | | Retired. Director, The University of Maryland Foundation since 1992; Director, The League for People with Disabilities since 2003; formerly, Director, Municipal Mortgage & Equity LLC (2004 to 2011); Partner, KPMG LLP (international accounting firm) (1972 to 2002) |
| Number of funds in fund complex overseen by Trustee | | Director/Trustee of all Legg Mason Funds consisting of 20 portfolios; Director/Trustee of the Royce Family of Funds consisting of 23 portfolios |
| Other board memberships held by Trustee during past five years | | Director of Municipal Mortgage & Equity, LLC. (2004 to 2011) |
|
| G. Peter O’Brien |
| Year of birth | | 1945 |
| Position(s) with Trust | | Trustee |
| Term of office1 and length of time served2 | | Since 1999 |
| Principal occupation(s) during past five years | | Retired. Trustee Emeritus of Colgate University; Board Member, Hill House, Inc. (residential home care); Board Member, Bridges School (pre- school); formerly, Managing Director, Equity Capital Markets Group of Merrill Lynch & Co. (1971 to 1999) |
| Number of funds in fund complex overseen by Trustee | | Director/Trustee of all Legg Mason funds consisting of 20 portfolios; Director/Trustee of the Royce Family of Funds consisting of 23 portfolios |
| Other board memberships held by Trustee during past five years | | Director of TICC Capital Corp. |
| | |
| 50 | | Legg Mason BW Global Opportunities Bond Fund |
| | |
| Independent Trustees† cont’d |
| S. Ford Rowan |
| Year of birth | | 1943 |
| Position(s) with Trust | | Trustee |
| Term of office1 and length of time served2 | | Since 2002 |
| Principal occupation(s) during past five years | | Chairman, National Center for Critical Incident Analysis, since 2004; Consultant to University of Maryland University College, since 2013; formerly, Lecturer in Organizational Sciences, George Washington University (2000 to 2014); Trustee, St. John’s College (2006 to 2012); Consultant, Rowan & Blewitt Inc. (management consulting) (1984 to 2007); Lecturer in Journalism, Northwestern University (1980 to 1993); Director, Santa Fe Institute (1999 to 2008) |
| Number of funds in fund complex overseen by Trustee | | 20 |
| Other board memberships held by Trustee during past five years | | None |
|
| Robert M. Tarola |
| Year of birth | | 1950 |
| Position(s) with Trust | | Trustee |
| Term of office1 and length of time served2 | | Since 2004 |
| Principal occupation(s) during past five years | | Executive Vice President and Chief Financial Officer, Southcoast Health System, Inc. (healthcare provider network) since 2015; President of Right Advisory LLC (corporate finance and governance consulting) since 2008; Member, Investor Advisory Group of the Public Company Accounting Oversight Board since 2009; formerly, Senior Vice President and Chief Financial Officer of The Howard University (2009 to 2013) (higher education and health care); Senior Vice President and Chief Financial Officer of W.R. Grace & Co. (specialty chemicals) (1999 to 2008) and MedStar Health, Inc. (healthcare) (1996 to 1999); Partner, Price Waterhouse, LLP (accounting and auditing) (1984 to 1996) |
| Number of funds in fund complex overseen by Trustee | | 20 |
| Other board memberships held by Trustee during past five years | | Director of American Kidney Fund (renal disease assistance); Director of XBRL International, Inc. (global data standard setting); Director of Vista Outdoor, Inc. (sporting goods) |
| | |
| | |
| Legg Mason BW Global Opportunities Bond Fund | | 51 |
Additional information (unaudited) (cont’d)
Information about Trustees and Officers
| | |
| Interested Trustee |
| Jane Trust3 | | |
| Year of birth | | 1962 |
| Position(s) with Trust | | Trustee, President and Chief Executive Officer |
| Term of office1 and length of time served2 | | Since 2015 |
| Principal occupation(s) during past five years | | Managing Director of Legg Mason & Co., LLC (“Legg Mason & Co.”) (since 2016); Officer and/or Trustee/Director of 156 funds associated with Legg Mason Partners Fund Advisor, LLC (“LMPFA”) or its affiliates (since 2015); President and Chief Executive Officer of LMPFA (since 2015); formerly, Senior Vice President of LMPFA (2015); Director of ClearBridge, LLC (formerly, Legg Mason Capital Management, LLC) (2007 to 2014); Managing Director of Legg Mason Investment Counsel & Trust Co. (2000 to 2007) |
| Number of funds in fund complex overseen by Trustee | | 149 |
Other board memberships held by Trustee during past
five years | | None |
| | |
| Executive Officers |
Richard F. Sennett Legg Mason 100 International Drive, 7th Floor, Baltimore, MD 21202 | | |
| Year of birth | | 1970 |
| Position(s) with Trust | | Principal Financial Officer |
| Term of office1 and length of time served2 | | Since 2011 |
| Principal occupation(s) during past five years | | Principal Financial Officer and Treasurer of certain mutual funds associated with Legg Mason & Co. or its affiliates (since 2011 and since 2013); Managing Director of Legg Mason & Co. and Senior Manager of the Treasury Policy group for Legg Mason & Co.’s Global Fiduciary Platform (since 2011); formerly, Chief Accountant within the SEC’s Division of Investment Management (2007 to 2011); Assistant Chief Accountant within the SEC’s Division of Investment Management (2002 to 2007) |
| |
Robert I. Frenkel Legg Mason 100 First Stamford Place, 6th Floor, Stamford, CT 06902 | | |
| Year of birth | | 1954 |
| Position(s) with Trust | | Secretary and Chief Legal Officer |
| Term of office1 and length of time served2 | | Since 2007 |
| Principal occupation(s) during past five years | | Vice President and Deputy General Counsel of Legg Mason (since 2006); Managing Director and General Counsel of — U.S. Mutual Funds for Legg Mason & Co. (since 2006) and Legg Mason & Co. predecessors (since 1994); Secretary and Chief Legal Officer of certain mutual funds associated with Legg Mason & Co. or its affiliates (since 2006) and Legg Mason & Co. predecessors (prior to 2006) |
| | |
| 52 | | Legg Mason BW Global Opportunities Bond Fund |
| | |
| Executive Officers cont’d |
Ted P. Becker
Legg Mason 620 Eighth Avenue, 49th Floor, New York, NY 10018 | | |
| Year of birth | | 1951 |
| Position(s) with Trust | | Vice President and Chief Compliance Officer |
| Term of office1 and length of time served2 | | Since 2007 |
| Principal occupation(s) during past five years | | Director of Global Compliance at Legg Mason (since 2006); Chief Compliance Officer of LMPFA (since 2006); Managing Director of Compliance of Legg Mason & Co. (since 2005); Chief Compliance Officer of certain mutual funds associated with Legg Mason & Co. or its affiliates (since 2006) and Legg Mason & Co. predecessors (prior to 2006) |
| |
Christopher Berarducci Legg Mason 620 Eighth Avenue, 49th Floor, New York, NY 10018 | | |
| Year of birth | | 1974 |
| Position(s) with Trust | | Treasurer |
| Term of office1 and length of time served2 | | Since 2010 |
| Principal occupation(s) during past five years | | Director of Legg Mason & Co. (since 2015); Treasurer of certain mutual funds associated with Legg Mason & Co. or its affiliates (since 2010); formerly, Vice President of Legg Mason & Co. (2011 to 2015); Assistant Controller of certain mutual funds associated with Legg Mason & Co. or its affiliates (prior to 2010) |
| |
Susan Kerr Legg Mason 620 Eighth Avenue, 49th Floor, New York, NY 10018 | | |
| Year of birth | | 1949 |
| Position(s) with Trust | | Chief Anti-Money Laundering Compliance Officer |
| Term of office1 and length of time served2 | | Since 2013 |
| Principal occupation(s) during past five years | | Assistant Vice President of Legg Mason & Co. and Legg Mason Investor Services, LLC (“LMIS”) (since 2010); Chief Anti-Money Laundering Compliance Officer of certain mutual funds associated with Legg Mason & Co. or its affiliates (since 2013) and Anti-Money Laundering Compliance Officer of LMIS (since 2012); Senior Compliance Officer of LMIS (since 2011); formerly, AML Consultant, DTCC (2010); AML Consultant, Rabobank Netherlands, (2009); First Vice President, Director of Marketing & Advertising Compliance and Manager of Communications Review Group at Citigroup Inc. (1996 to 2008) |
| | |
| Legg Mason BW Global Opportunities Bond Fund | | 53 |
Additional information (unaudited) (cont’d)
Information about Trustees and Officers
| | |
| Executive Officers cont’d |
Jenna Bailey Legg Mason 100 First Stamford Place, 6th Floor, Stamford, CT 06902 | | |
| Year of birth | | 1978 |
| Position(s) with Trust | | Identity Theft Prevention Officer |
| Term of office1 and length of time served2 | | Since 2015 |
| Principal occupation(s) during past five years | | Identity Theft Prevention Officer of certain mutual funds associated with Legg Mason & Co. or its affiliates (since 2015); Compliance Officer of Legg Mason & Co. (since 2013); Assistant Vice President of Legg Mason & Co. (since 2011); formerly, Associate Compliance Officer of Legg Mason & Co. (2011 to 2013); Risk Manager of U.S. Distribution of Legg Mason & Co. (2007 to 2011). |
Jeanne M. Kelly Legg Mason 620 Eighth Avenue, 49th Floor, New York, NY 10018 | | |
| Year of birth | | 1951 |
| Position(s) with Trust | | Senior Vice President |
| Term of office1 and length of time served2 | | Since 2007 |
| Principal occupation(s) during past five years | | Senior Vice President of certain mutual funds associated with Legg Mason & Co. or its affiliates (since 2007); Senior Vice President of LMPFA (since 2006); President and Chief Executive Officer of LMAS and LMFAM (since 2015); Managing Director of Legg Mason & Co. (since 2005) and Legg Mason & Co. predecessors (prior to 2005); formerly, Senior Vice President of LMFAM (2013 to 2015) |
| † | Trustees who are not “interested persons” of the Fund within the meaning of Section 2(a)(19) of the Investment Company Act of 1940, as amended (the “1940 Act”). Each of the Independent Trustees serves on the standing committees of the Board of Trustees, which include the Audit Committee (chair: Arthur S. Mehlman), the Nominating Committee (co-chairs: G. Peter O’Brien and Jill E. McGovern), and the Independent Trustees Committee (chair: Arnold L. Lehman). |
| 1 | Each Trustee and officer serves until his or her respective successor has been duly elected and qualified or until his or her earlier death, resignation, retirement or removal. |
| 2 | Indicates the earliest year in which the Trustee became a board member for a fund in the Legg Mason fund complex or the officer took such office. |
| 3 | Ms. Trust is an “interested person” of the Fund, as defined in the 1940 Act, because of her position with LMPFA and/or certain of its affiliates. |
| | |
| 54 | | Legg Mason BW Global Opportunities Bond Fund |
Important tax information (unaudited)
The following information is provided with respect to the distributions paid during the taxable year ended December 31, 2016:
| | | | |
| Record date: | | | 12/21/2016 | |
| Payable date: | | | 12/22/2016 | |
| Interest from Federal Obligations | | | 12.26 | % |
| Foreign source income | | | 100.00 | %* |
| Foreign taxes paid per share | | | $0.007904 | |
| Long-term capital gain dividend | | | $0.038310 | |
| * | Expressed as a percentage of the cash distribution grossed-up for foreign taxes. |
The law varies in each state as to whether and what percentage of dividend income attributable to Federal obligations is exempt from state income tax. We recommend that you consult with your tax adviser to determine if any portion of the dividends you received is exempt from state income taxes.
The foreign taxes paid represent taxes incurred by the Fund on income received by the Fund from foreign sources. Foreign taxes paid may be included in taxable income with an offsetting deduction from gross income or may be taken as a credit for taxes paid to foreign governments. You should consult your tax adviser regarding the appropriate treatment of foreign taxes paid.
The following information is applicable to non-U.S. resident shareholders:
The following distributions represent Qualified Short-Term Capital Gains eligible for exemption from U.S. withholding tax for nonresident aliens and foreign corporations:
| | | | |
Record
Date | | Payable
Date | | Short-term
Capital Gains
Per Share |
| 12/21/2016 | | 12/22/2016 | | $0.149440 |
Please retain this information for your records.
| | |
| Legg Mason BW Global Opportunities Bond Fund | | 55 |
Legg Mason BW
Global Opportunities Bond Fund
Trustees
Ruby P. Hearn
Arnold L. Lehman
Chairman
Robin J. W. Masters
Jill E. McGovern
Arthur S. Mehlman
G. Peter O’Brien
S. Ford Rowan
Robert M. Tarola
Jane Trust
Investment manager
Legg Mason Partners Fund Advisor, LLC
Subadviser
Brandywine Global Investment Management, LLC
Custodian
State Street Bank and Trust Company
Transfer agent
BNY Mellon Investment Servicing (US) Inc.
4400 Computer Drive
Westborough, MA 01581
Independent registered public accounting firm
PricewaterhouseCoopers LLP
Baltimore, MD
Legg Mason BW Global Opportunities Bond Fund
The Fund is a separate investment series of Legg Mason Global Asset Management Trust, a Maryland statutory trust.
Legg Mason BW Global Opportunities Bond Fund
Legg Mason Funds
620 Eighth Avenue, 49th Floor
New York, NY 10018
The Fund files its complete schedule of portfolio holdings with the Securities and Exchange Commission (“SEC”) for the first and third quarters of each fiscal year on Form N-Q. The Fund’s Forms N-Q are available on the SEC’s website at www.sec.gov. The Fund’s Forms N-Q may be reviewed and copied at the SEC’s Public Reference Room in Washington, D.C., and information on the operation of the Public Reference Room may be obtained by calling 1-800-SEC-0330. To obtain information on Form N-Q, shareholders can call the Fund at 1-877-721-1926.
Information on how the Fund voted proxies relating to portfolio securities during the prior 12-month period ended June 30th of each year and a description of the policies and procedures that the Fund uses to determine how to vote proxies related to portfolio transactions are available (1) without charge, upon request, by calling the Fund at 1-877-721-1926, (2) at www.leggmason.com/mutualfund and (3) on the SEC’s website at www.sec.gov.
This report is submitted for the general information of the shareholders of Legg Mason BW Global Opportunities Bond Fund. This report is not authorized for distribution to prospective investors in the Fund unless preceded or accompanied by a current prospectus.
Investors should consider the Fund’s investment objectives, risks, charges and expenses carefully before investing. The prospectus contains this and other important information about the Fund. Please read the prospectus carefully before investing.
www.leggmason.com
© 2017 Legg Mason Investor Services, LLC
Member FINRA, SIPC
Legg Mason Funds Privacy and Security Notice
Your Privacy and the Security of Your Personal Information is Very Important to the Legg Mason Funds
This Privacy and Security Notice (the “Privacy Notice”) addresses the Legg Mason Funds’ privacy and data protection practices with respect to nonpublic personal information the Funds receive. The Legg Mason Funds include any funds sold by the Funds’ distributor, Legg Mason Investor Services, LLC, as well as Legg Mason-sponsored closed-end funds and certain closed-end funds managed or sub-advised by Legg Mason or its affiliates. The provisions of this Privacy Notice apply to your information both while you are a shareholder and after you are no longer invested with the Funds.
The Type of Nonpublic Personal Information the Funds Collect About You
The Funds collect and maintain nonpublic personal information about you in connection with your shareholder account. Such information may include, but is not limited to:
| • | | Personal information included on applications or other forms; |
| • | | Account balances, transactions, and mutual fund holdings and positions; |
| • | | Online account access user IDs, passwords, security challenge question responses; and |
| • | | Information received from consumer reporting agencies regarding credit history and creditworthiness (such as the amount of an individual’s total debt, payment history, etc.). |
How the Funds Use Nonpublic Personal Information About You
The Funds do not sell or share your nonpublic personal information with third parties or with affiliates for their marketing purposes, or with other financial institutions or affiliates for joint marketing purposes, unless you have authorized the Funds to do so. The Funds do not disclose any nonpublic personal information about you except as may be required to perform transactions or services you have authorized or as permitted or required by law. The Funds may disclose information about you to:
| • | | Employees, agents, and affiliates on a “need to know” basis to enable the Funds to conduct ordinary business or comply with obligations to government regulators; |
| • | | Service providers, including the Funds’ affiliates, who assist the Funds as part of the ordinary course of business (such as printing, mailing services, or processing or servicing your account with us) or otherwise perform services on the Funds’ behalf, including companies that may perform marketing services solely for the Funds; |
| • | | The Funds’ representatives such as legal counsel, accountants and auditors; and |
| • | | Fiduciaries or representatives acting on your behalf, such as an IRA custodian or trustee of a grantor trust. |
|
| NOT PART OF THE ANNUAL REPORT |
Legg Mason Funds Privacy and Security Notice (cont’d)
Except as otherwise permitted by applicable law, companies acting on the Funds’ behalf are contractually obligated to keep nonpublic personal information the Funds provide to them confidential and to use the information the Funds share only to provide the services the Funds ask them to perform.
The Funds may disclose nonpublic personal information about you when necessary to enforce their rights or protect against fraud, or as permitted or required by applicable law, such as in connection with a law enforcement or regulatory request, subpoena, or similar legal process. In the event of a corporate action or in the event a Fund service provider changes, the Funds may be required to disclose your nonpublic personal information to third parties. While it is the Funds’ practice to obtain protections for disclosed information in these types of transactions, the Funds cannot guarantee their privacy policy will remain unchanged.
Keeping You Informed of the Funds’ Privacy and Security Practices
The Funds will notify you annually of their privacy policy as required by federal law. While the Funds reserve the right to modify this policy at any time they will notify you promptly if this privacy policy changes.
The Funds’ Security Practices
The Funds maintain appropriate physical, electronic and procedural safeguards designed to guard your nonpublic personal information. The Funds’ internal data security policies restrict access to your nonpublic personal information to authorized employees, who may use your nonpublic personal information for Fund business purposes only.
Although the Funds strive to protect your nonpublic personal information, they cannot ensure or warrant the security of any information you provide or transmit to them, and you do so at your own risk. In the event of a breach of the confidentiality or security of your nonpublic personal information, the Funds will attempt to notify you as necessary so you can take appropriate protective steps. If you have consented to the Funds using electronic communications or electronic delivery of statements, they may notify you under such circumstances using the most current email address you have on record with them.
In order for the Funds to provide effective service to you, keeping your account information accurate is very important. If you believe that your account information is incomplete, not accurate or not current, or if you have questions about the Funds’ privacy practices, write the Funds using the contact information on your account statements, email the Funds by clicking on the Contact Us section of the Funds’ website at www.leggmason.com, or contact the Fund at 1-877-721-1926.
|
| NOT PART OF THE ANNUAL REPORT |
www.leggmason.com
© 2017 Legg Mason Investor Services, LLC Member FINRA, SIPC
LMFX013158 2/17 SR17-2997
The registrant has adopted a code of ethics that applies to the registrant’s principal executive officer, principal financial officer, principal accounting officer or controller.
| ITEM 3. | AUDIT COMMITTEE FINANCIAL EXPERT. |
The Board of Trustees of the registrant has determined that Arthur S. Mehlman the Chairman of the Board’s Audit Committee and Robert M. Tarola, possess the technical attributes identified in Instruction 2(b) of Item 3 to Form N-CSR to qualify as “audit committee financial experts,” and have designated Mr. Mehlman and Mr. Tarola as the Audit Committee’s financial experts. Mr. Mehlman and Mr. Tarola are “independent” Trustees pursuant to paragraph (a) (2) of Item 3 to Form N-CSR.
| ITEM 4. | PRINCIPAL ACCOUNTANT FEES AND SERVICES. |
a) Audit Fees. The aggregate fees billed in the last two fiscal years ending December 31, 2015 and December 31, 2016 (the “Reporting Periods”) for professional services rendered by the Registrant’s principal accountant (the “Auditor”) for the audit of the Registrant’s annual financial statements, or services that are normally provided by the Auditor in connection with the statutory and regulatory filings or engagements for the Reporting Periods, were $141,474 in December 31, 2015 and $133,424 in December 31, 2016.
b) Audit-Related Fees. The aggregate fees billed in the Reporting Period for assurance and related services by the Auditor that are reasonably related to the performance of the Registrant’s financial statements were $0 in December 31, 2015 and $0 in December 31, 2016.
(c) Tax Fees. The aggregate fees billed in the Reporting Periods for professional services rendered by the Auditor for tax compliance, tax advice and tax planning (“Tax Services”) were $17,370 in December 31, 2015 and $17,540 in December 31, 2016. These services consisted of (i) review or preparation of U.S. federal, state, local and excise tax returns; (ii) U.S. federal, state and local tax planning, advice and assistance regarding statutory, regulatory or administrative developments, and (iii) tax advice regarding tax qualification matters and/or treatment of various financial instruments held or proposed to be acquired or held.
There were no fees billed for tax services by to the service affiliates during the Reporting Periods that required pre-approval by the Audit Auditors Committee.
d) All Other Fees. The aggregate fees for other fees billed in the Reporting Periods for products and services provided by the Auditor were $1,522 in December 31, 2015 and $1,539 in December 31, 2016, other than the services reported in paragraphs (a) through (c) of this item for the Legg Mason Global Asset Management Trust.
All Other Fees. There were no other non-audit services rendered by the Auditor to Legg Mason Partners Fund Advisors, LLC (“LMPFA”), and any entity controlling, controlled by or under common control with LMPFA that provided ongoing services to Legg Mason Global Asset Management Trust requiring pre-approval by the Audit Committee in the Reporting Period.
(e) Audit Committee’s pre–approval policies and procedures described in paragraph (c)
(7) of Rule 2-01 of Regulation S-X.
(1) The Charter for the Audit Committee (the “Committee”) of the Board of each registered investment company (the “Fund”) advised by LMPFA or one of their affiliates (each, an “Adviser”) requires that the Committee shall approve (a) all audit and permissible non-audit services to be provided to the Fund and (b) all permissible non-audit services to be provided by the Fund’s independent auditors to the Adviser and any Covered Service Providers if the engagement relates directly to the operations and financial reporting of the Fund. The Committee may implement policies and procedures by which such services are approved other than by the full Committee.
The Committee shall not approve non-audit services that the Committee believes may impair the independence of the auditors. As of the date of the approval of this Audit Committee Charter, permissible non-audit services include any professional services (including tax services), that are not prohibited services as described below, provided to the Fund by the independent auditors, other than those provided to the Fund in connection with an audit or a review of the financial statements of the Fund. Permissible non-audit services may not include: (i) bookkeeping or other services related to the accounting records or financial statements of the Fund; (ii) financial information systems design and implementation; (iii) appraisal or valuation services, fairness opinions or contribution-in-kind reports; (iv) actuarial services; (v) internal audit outsourcing services; (vi) management functions or human resources; (vii) broker or dealer, investment adviser or investment banking services; (viii) legal services and expert services unrelated to the audit; and (ix) any other service the Public Company Accounting Oversight Board determines, by regulation, is impermissible.
Pre-approval by the Committee of any permissible non-audit services is not required so long as: (i) the aggregate amount of all such permissible non-audit services provided to the Fund, the Adviser and any service providers controlling, controlled by or under common control with the Adviser that provide ongoing services to the Fund (“Covered Service Providers”) constitutes not more than 5% of the total amount of revenues paid to the independent auditors during the fiscal year in which the permissible non-audit services are provided to (a) the Fund, (b) the Adviser and (c) any entity controlling, controlled by or under common control with the Adviser that provides ongoing services to the Fund during the fiscal year in which the services are provided that would have to be approved by the Committee; (ii) the permissible non-audit services were not recognized by the Fund at the time of the engagement to be non-audit services; and (iii) such services are promptly brought to the attention of the Committee and approved by the Committee (or its delegate(s)) prior to the completion of the audit.
(2) For the Legg Mason Global Asset Management Trust, the percentage of fees that were approved by the audit committee, with respect to: Audit-Related Fees were 100% and 100% for December 31, 2015 and December 31, 2016; Tax Fees were 100% and 100% for December 31, 2015 and December 31, 2016; and Other Fees were 100% and 100% for December 31, 2015 and December 31, 2016.
(f) N/A
(g) Non-audit fees billed by the Auditor for services rendered to Legg Mason Global Asset Management Trust, LMPFA and any entity controlling, controlled by, or under common control with LMPFA that provides ongoing services to Legg Mason Global Asset Management Trust during the reporting period were $330,248 in December 31, 2015 and $188,614 in December 31, 2016.
(h) Yes. Legg Mason Global Asset Management Trust’s Audit Committee has considered whether the provision of non-audit services that were rendered to Service Affiliates, which were not pre-approved (not requiring pre-approval), is compatible with maintaining the Accountant’s independence. All services provided by the Auditor to the Legg Mason Global Asset Management Trust or to Service Affiliates, which were required to be pre-approved, were pre-approved as required.
| ITEM 5. | AUDIT COMMITTEE OF LISTED REGISTRANTS. |
| | a) | The independent board members are acting as the registrant’s audit committee as specified in Section 3(a)(58)(B) of the Exchange Act .The Audit Committee consists of the following Board members: |
Ruby P. Hearn
Arnold L. Lehman
Robin J.W. Masters
Jill E. McGovern
Arthur S. Mehlman
G. Peter O’Brien
S. Ford Rowan
Robert M. Tarola
| ITEM 6. | SCHEDULE OF INVESTMENTS. |
Included herein under Item 1.
| ITEM 7. | DISCLOSURE OF PROXY VOTING POLICIES AND PROCEDURES FOR CLOSED-END MANAGEMENT INVESTMENT COMPANIES. |
Not applicable.
| ITEM 8. | PORTFOLIO MANAGERS OF CLOSED-END MANAGEMENT INVESTMENT COMPANIES. |
Not applicable.
| ITEM 9. | PURCHASES OF EQUITY SECURITIES BY CLOSED-END MANAGEMENT INVESTMENT COMPANY AND AFFILIATED PURCHASERS. |
Not applicable.
| ITEM 10. | SUBMISSION OF MATTERS TO A VOTE OF SECURITY HOLDERS. |
Not applicable.
| ITEM 11. | CONTROLS AND PROCEDURES. |
| | (a) | The registrant’s principal executive officer and principal financial officer have concluded that the registrant’s disclosure controls and procedures (as defined in Rule 30a- 3(c) under the Investment Company Act of 1940, as amended (the “1940 Act”)) are effective as of a date within 90 days of the filing date of this report that includes the disclosure required by this paragraph, based on their evaluation of the disclosure controls and procedures required by Rule 30a-3(b) under the 1940 Act and 15d-15(b) under the Securities Exchange Act of 1934. |
| | (b) | There were no changes in the registrant’s internal control over financial reporting (as defined in Rule 30a-3(d) under the 1940 Act) that occurred during the second fiscal quarter of the period covered by this report that have materially affected, or are likely to materially affect the registrant’s internal control over financial reporting. |
(a) (1) Code of Ethics attached hereto.
Exhibit 99.CODE ETH
(a) (2) Certifications pursuant to section 302 of the Sarbanes-Oxley Act of 2002 attached hereto.
Exhibit 99.CERT
(b) Certifications pursuant to Section 906 of the Sarbanes-Oxley Act of 2002 attached hereto.
Exhibit 99.906CERT
SIGNATURES
Pursuant to the requirements of the Securities Exchange Act of 1934 and the Investment Company Act of 1940, the registrant has duly caused this Report to be signed on its behalf by the undersigned, there unto duly authorized.
| | |
| Legg Mason Global Asset Management Trust |
| |
| By: | | /s/ Jane Trust |
| | Jane Trust |
| | Chief Executive Officer |
| |
| Date: | | February 28, 2017 |
Pursuant to the requirements of the Securities Exchange Act of 1934 and the Investment Company Act of 1940, this report has been signed below by the following persons on behalf of the registrant and in the capacities and on the dates indicated.
| | |
| By: | | /s/ Jane Trust |
| | Jane Trust |
| | Chief Executive Officer |
| |
| Date: | | February 28, 2017 |
| |
| By: | | /s/ Richard F. Sennett |
| | Richard F. Sennett |
| | Principal Financial Officer |
| |
| Date: | | February 28, 2017 |