UNITED STATES
SECURITIES AND EXCHANGE COMMISSION
Washington, D.C. 20549
FORM N-CSR
CERTIFIED SHAREHOLDER REPORT OF REGISTERED
MANAGEMENT INVESTMENT COMPANIES
Investment Company Act file number 811-22338
Legg Mason Global Asset Management Trust
(Exact name of registrant as specified in charter)
620 Eighth Avenue, 49th Floor, New York, NY 10018
(Address of principal executive offices) (Zip code)
Robert I. Frenkel, Esq.
Legg Mason & Co., LLC
100 First Stamford Place
Stamford, CT 06902
(Name and address of agent for service)
Registrant’s telephone number, including area code: 1-877-721-1926
Date of fiscal year end: September 30
Date of reporting period: September 30, 2017
| ITEM 1. | REPORT TO STOCKHOLDERS |
The Annual Report to Stockholders is filed herewith.

| | |
| Annual Report | | September 30, 2017 |
LEGG MASON BW
DYNAMIC
LARGE CAP
VALUE FUND
|
| INVESTMENT PRODUCTS: NOT FDIC INSURED • NO BANK GUARANTEE • MAY LOSE VALUE |
Fund objective
The Fund seeks to provide long-term capital appreciation by quantitatively investing in U.S. equities.
Letter from the president

Dear Shareholder,
We are pleased to provide the annual report of Legg Mason BW Dynamic Large Cap Value Fund for the twelve-month reporting period ended September 30, 2017. Please read on for a detailed look at prevailing economic and market conditions during the Fund’s reporting period and to learn how those conditions have affected Fund performance.
Special shareholder notice
Effective December 29, 2017, the Fund will be renamed BrandywineGLOBAL — Dynamic US Large Cap Value Fund. The change to the Fund’s name is being effected as part of a rebranding of Legg Mason funds subadvised by Brandywine Global Investment Management, LLC (“Brandywine Global”). Legg Mason Partners Fund Advisor, LLC continues to serve as the investment manager to the Fund, and Brandywine Global continues to serve as subadviser.
Additionally, effective December 29, 2017, the Fund normally invests at least 80% of its net assets, plus the amount of borrowings for investment purposes, if any, in issuers domiciled, or having their principal activities, in the United States, at the time of investment or other instruments with similar economic characteristics. In addition, the Fund normally invests at least 80% of its net assets in equity securities of large capitalization companies. The Fund’s 80% investment policies may be changed by the Board of Trustees upon 60 days’ prior notice to shareholders.
Neither the name change nor the adoption of the new investment policy is anticipated to materially change the manner in which the Fund is currently managed. For more information, please see the prospectus supplement dated November 2, 2017.
As always, we remain committed to providing you with excellent service and a full spectrum of investment choices. We also remain committed to supplementing the support you receive from your financial advisor. One way we accomplish this is through our website, www.leggmason.com. Here you
| | |
| II | | Legg Mason BW Dynamic Large Cap Value Fund |
can gain immediate access to market and investment information, including:
| • | | Fund prices and performance, |
| • | | Market insights and commentaries from our portfolio managers, and |
| • | | A host of educational resources. |
We look forward to helping you meet your financial goals.
Sincerely,

Jane Trust, CFA
President and Chief Executive Officer
November 2, 2017
| | |
| Legg Mason BW Dynamic Large Cap Value Fund | | III |
Investment commentary
Economic review
The pace of U.S. economic activity fluctuated during the twelve months ended September 30, 2017 (the “reporting period”). Looking back, the U.S. Department of Commerce reported that third quarter 2016 U.S. gross domestic product (“GDP”)i growth was revised to 2.8%. GDP growth then decelerated to 1.8% and 1.2%, as revised, for the fourth quarter of 2016 and the first quarter of 2017, respectively. Second quarter 2017 GDP growth then accelerated to 3.1%, the strongest reading in two years. Finally, the U.S. Department of Commerce’s initial estimate for third quarter 2017 GDP growth — released after the reporting period ended — was 3.0%. Slightly slower growth was attributed to a number of factors, including decelerations in personal consumption expenditures, in nonresidential fixed investment and in exports that were partly offset by an acceleration in private inventory investment and a downturn in imports.
Job growth in the U.S. was solid overall and a tailwind for the economy during the reporting period. When the reporting period ended on September 30, 2017, the unemployment rate was 4.2%, as reported by the U.S. Department of Labor. This represented the lowest unemployment rate since February 2001. However, the percentage of longer-term unemployed ticked up over the reporting period. In September 2017, 25.5% of Americans looking for a job had been out of work for more than six months, versus 25.2% when the period began.
Looking back, after an extended period of maintaining the federal funds rateii at a historically low range between zero and 0.25%, the Federal Reserve Board (the “Fed”)iii increased the rate at its meeting on December 16, 2015. In particular, the U.S. central bank raised the federal funds rate to a range between 0.25% and 0.50%. The Fed then kept rates on hold at each meeting prior to its meeting on December 14, 2016, at which time, the Fed raised rates to a range between 0.50% and 0.75%.
After holding rates steady at its meeting that concluded on February 1, 2017, the Fed raised rates to a range between 0.75% and 1.00% at its meeting that ended on March 15, 2017. At its meeting that concluded on June 14, 2017, the Fed raised rates to a range between 1.00% and 1.25%. At its meeting that concluded on July 26, 2017, the Fed kept rates on hold, as expected. Finally, at its meeting that concluded on September 20, 2017, the Fed again kept rates on hold, but reiterated its intention to begin reducing its balance sheet, saying, “In October, the Committee will initiate the balance sheet normalization program….”
As always, thank you for your confidence in our stewardship of your assets.
Sincerely,
Jane Trust, CFA
President and Chief Executive Officer
October 31, 2017
All investments are subject to risk including the possible loss of principal. Past performance is no guarantee of future results.
| | |
| IV | | Legg Mason BW Dynamic Large Cap Value Fund |
| i | Gross domestic product (“GDP”) is the market value of all final goods and services produced within a country in a given period of time. |
| ii | The federal funds rate is the rate charged by one depository institution on an overnight sale of immediately available funds (balances at the Federal Reserve) to another depository institution; the rate may vary from depository institution to depository institution and from day to day. |
| iii | The Federal Reserve Board (the “Fed”) is responsible for the formulation of U.S. policies designed to promote economic growth, full employment, stable prices, and a sustainable pattern of international trade and payments. |
| | |
| Legg Mason BW Dynamic Large Cap Value Fund | | V |
Fund overview
Q. What is the Fund’s investment strategy?
A. The Fund seeks to provide long-term capital appreciation by quantitatively investing in U.S. equities. The Fund normally invests at least 80% of its net assets in equity securities of large capitalization companies. The Fund will only invest in U.S. traded companies, which may include companies incorporated outside the U.S. which conduct a significant portion of their activities in the U.S. and are considered U.S. companies in the Russell U.S. indices. The Fund may have significant positions in particular sectors from time to time. In addition, the Fund may engage in active and frequent trading to achieve its investment objective.
We, at Brandywine Global Investment Management, LLC, the Fund’s subadviser, use a proprietary quantitative model to identify investments for the Fund. To identify investments, the model evaluates multiple quantitative characteristics for each potential stock investment and applies specific rules to select stocks for investment based on these characteristics. The Fund will typically invest in a stock when the large capitalization threshold and its price-to-earnings (“P/E”)i or price-to-book (“P/B”)ii ratios indicate a potentially attractive valuation and the quantitative model ranks it with a high multifactor score.
Our quantitative model seeks to identify stocks that appear to have upside potential and relatively low downside risk to the Russell 1000 Value Indexiii. The quantitative model analyzes factors regarding a stock’s valuation and quality, as well as market sentiment toward a stock, to select stocks that may have the potential to outperform, the Russell 1000 Value Index. The Fund expects to hold approximately 75-175 stocks under normal market conditions.
Q. What were the overall market conditions during the Fund’s reporting period?
A. The broad U.S. stock market posted solid gains as the S&P 500 Indexiv returned 18.61% for the twelve-month reporting period ended September 30, 2017, closing at an all-time high. Equity markets have been in a steady uptrend since the surprising U.S. presidential election results of last year. In addition to the prospect for pro-growth policies such as tax reform, deregulation, and infrastructure spending, strong corporate earnings and improved economic momentum supported this strong rally. Although expected to dip during the hurricane impacted third quarter 2017, second quarter 2017 U.S. gross domestic product (“GDP”)v growth accelerated to 3.1% after readings below 2% in the fourth quarter of 2016 and the first quarter of 2017. The labor market tightened significantly over the reporting period. During the reporting period ended September 30, 2017, the employment report showed a decline in the unemployment rate to a sixteen-year low of 4.2%, as reported by the U.S. Department of Labor, compared to 4.9% in September 2016. Wage growth had been relatively benign until the recent jobs report accelerated to 2.9% in the past year. Housing has not been a recent driver of growth, especially compared to the last market cycle, and has been impacted by a lack of affordable inventory and high prices. Pending home sales have declined in six of eight months so far, this calendar year through August 2017.
During the reporting period, the Federal Reserve Board (the “Fed”)vi remained on a gradual path of normalizing monetary policy,
| | |
| Legg Mason BW Dynamic Large Cap Value Fund 2017 Annual Report | | 1 |
Fund overview (cont’d)
raising interest rates 0.25% during the December 2016, March 2017 and June 2017 Federal Open Market Committee (“FOMC”)vii meetings. Additionally, the Fed has signaled a likely tapering of the balance sheet in October 2017 and expectations have been rising for another rate hike in December 2017 despite relatively low levels of inflation. During this period, the yield on the ten-year Treasury rose substantially from 1.63% to 2.33%. Oil prices were range bound — hovering around $50 per barrel. Although volatility spiked at times, markets generally shrugged off geopolitical tensions during the period particularly with North Korea and the Middle East.
Q. How did we respond to these changing market conditions?
A. Our investment strategy utilizes a dynamic shifting tool which is a timing model that quantitatively evaluates market conditions to shift the Fund between investment models appropriate for broad value and for deep value environments. The dynamic shifting tool triggers changes at relatively infrequent intervals historically ranging from two to seven years. The shifts result from quantitative signals that we believe indicate whether market valuations are compressed and likely to expand or valuations are wide and likely to contract. Our investment models for the different environments are all value based, sharing many of the same factors with differing exposures. By shifting investment models based on the expected market environment, we improve the odds that we capture the appropriate factor exposures to enhance excess return and minimize underperformance against the Russell 1000 Value Index. We last shifted the model on August 3, 2015 from the deep value to the broad value model. Typically, we expect the model to shift every 3 to 7 years.
Our investment strategy is based on the consistent application of our investment philosophy which relies on long term equity factors and market relationships, while avoiding emotional reactions to near term events. We respond to volatile environments by the consistent, disciplined execution of our investment strategy. This process has been backtested over forty years of varied conditions, and while we recognize it will not excel in every situation, we do believe it will outperform over most 3 to 5 year periods. We are aware of the macro implications of events for specific securities, but do not alter our primary focus on value, quality, and favorable sentiment factors.
Performance review
For the twelve months ended September 30, 2017, Class IS shares of Legg Mason BW Dynamic Large Cap Value Fund returned 18.07%. The Fund’s unmanaged benchmarks, the Russell 1000 Value Index and the S&P 500 Index, returned 15.12% and 18.61%, respectively, for the same period. The Lipper Large-Cap Value Funds Category Average1 returned 17.16% over the same time frame.
| 1 | Lipper, Inc., a wholly-owned subsidiary of Reuters, provides independent insight on global collective investments. Returns are based on the for the twelve-month period ended September 30, 2017, including the reinvestment of all distributions, including returns of capital, if any, calculated among the 457 funds in the Fund’s Lipper category, and excluding sales charges, if any. |
| | |
| 2 | | Legg Mason BW Dynamic Large Cap Value Fund 2017 Annual Report |
| | | | | | | | |
Performance Snapshot as of September 30, 2017
(unaudited) | |
| (excluding sales charges) | | 6 months | | | 12 months | |
| Legg Mason BW Dynamic Large Cap Value Fund: | | | | | | | | |
Class A | | | 9.47 | % | | | 17.70 | % |
Class C | | | 9.07 | % | | | 16.76 | % |
Class R | | | 9.26 | % | | | 17.25 | % |
Class I | | | 9.64 | % | | | 18.10 | % |
Class IS | | | 9.64 | % | | | 18.07 | % |
| Russell 1000 Value Index | | | 4.50 | % | | | 15.12 | % |
| S&P 500 Index | | | 7.71 | % | | | 18.61 | % |
| Lipper Large-Cap Value Funds Category Average1 | | | 5.79 | % | | | 17.16 | % |
The performance shown represents past performance. Past performance is no guarantee of future results and current performance may be higher or lower than the performance shown above. Principal value and investment returns will fluctuate and investors’ shares, when redeemed, may be worth more or less than their original cost. To obtain performance data current to the most recent month-end, please visit our website at www.leggmason.com/mutualfunds.
All share class returns assume the reinvestment of all distributions at net asset value and the deduction of all Fund expenses. Returns have not been adjusted to include sales charges that may apply or the deduction of taxes that a shareholder would pay on Fund distributions. If sales charges were reflected, the performance quoted would be lower. Performance figures for periods shorter than one year represent cumulative figures and are not annualized.
The Fund is the successor to a private fund (the “Predecessor”). On October 31, 2014, the Predecessor transferred its assets to the Fund in exchange for the Fund’s Class IS shares.
Fund performance figures reflect fee waivers and/or expense reimbursements, without which the performance would have been lower.
|
| Total Annual Operating Expenses (unaudited) |
As of the Fund’s current prospectus dated February 1, 2017, the gross total annual fund operating expense ratios for Class A, Class C, Class R, Class I and Class IS shares were 1.44%, 2.22%, 1.89%, 1.19% and 1.10%, respectively.
Actual expenses may be higher. For example, expenses may be higher than those shown if average net assets decrease. Net assets are more likely to decrease and Fund expense ratios are more likely to increase when markets are volatile.
As a result of expense limitation arrangements, the ratio of total annual fund operating expenses, other than interest, brokerage commissions, dividend expense on short sales, taxes, extraordinary expenses and acquired fund fees and expenses, to average net assets will not exceed 1.10% for Class A shares, 1.85% for Class C shares, 1.35% for Class R shares, 0.75% for Class I shares and 0.65% for Class IS shares. In addition, the ratio of total annual fund operating expenses for Class IS shares will not exceed the ratio of total annual fund operating expenses for Class I shares. These expense limitation arrangements cannot be terminated prior to December 31, 2018 without the Board of Trustees’ consent.
The manager is permitted to recapture amounts waived and/or reimbursed to a class within three years after the fiscal year in which the manager earned the fee or incurred the expense if the class’ total
| 1 | Lipper, Inc., a wholly-owned subsidiary of Reuters, provides independent insight on global collective investments. Returns are based on the period ended September 30, 2017, including the reinvestment of all distributions, including returns of capital, if any, calculated among the 479 funds for the six-month period and among the 457 funds for the twelve-month period in the Fund’s Lipper category, and excluding sales charges, if any. |
| | |
| Legg Mason BW Dynamic Large Cap Value Fund 2017 Annual Report | | 3 |
Fund overview (cont’d)
annual operating expenses have fallen to a level below the expense limitation (“expense cap”) in effect at the time the fees were earned or the expenses incurred. In no case will the manager recapture any amount that would result, on any particular business day of the Fund, in the class’ total annual operating expenses exceeding the expense cap or any other lower limit then in effect.
Q. What were the leading contributors to performance?
A. The Fund’s significant overweight in the Industrials sector and both the overweight and positive stock selection within aerospace & defense was a significant contributor to excess return during the reporting period. Our significant underweight in the Energy sector also materially contributed to performance as drillers and exploration & production companies struggled amid a global oversupply, even though oil prices rose slightly during this period. Not holding real estate investment trusts (“REITs”)viii also benefited, as this interest rate sensitive segment of the market lagged as interest rates climbed during this period. From a factor perspective, our overweight in companies with low price-to-earnings ratios and companies reducing their shares outstanding through buy backs were the main contributors to performance for the period.
Q. What were the leading detractors from performance?
A. After the U.S. presidential election, bank stocks significantly outperformed. At the time, we were substantially underweight in these stocks which detracted from performance. Poor stock selection in biotechnology names within the Health Care sector also significantly detracted from performance during the reporting period. Within the Consumer Discretionary sector, our overweight in multiline retail was also a negative to performance as consumers pivoted toward online shopping. From a factor perspective, our underweight stocks with low price-to-book ratios was a detractor as the banks outperformed as higher interest rates tend to boost lenders profitability during this period.
Q. Were there any significant changes to the Fund during the period?
A. Within sectors, our largest reduction came in the Information Technology sector as we sold names in semiconductors & semiconductor equipment. The second largest reduction came in the Health Care sector from the sale of names in biotechnology. We also materially reduced our Consumer Staples sector weight through the sale of names in food products. The most significant change to the Fund was a large increase in the weight of the Financials sector from the purchases of banks and diversified financials. We significantly increased our weight in this sector due to banks and capital market institutions reducing their shares outstanding and their positive price momentum after the election. We also increased our weights in the Energy sector.
Thank you for your investment in Legg Mason BW Dynamic Large Cap Value Fund. As always, we appreciate that you have chosen us to manage your assets and we remain focused on achieving the Fund’s investment goals.
| | |
| 4 | | Legg Mason BW Dynamic Large Cap Value Fund 2017 Annual Report |
Sincerely,

Henry F. Otto
Portfolio Manager
Brandywine Global Investment
Management, LLC

Steven M. Tonkovich
Portfolio Manager
Brandywine Global Investment
Management, LLC

Michael Fleisher
Portfolio Manager
Brandywine Global Investment
Management, LLC
October 20, 2017
RISKS: Equity securities are subject to market and price fluctuations. Large-capitalization value stocks may underperform the overall equity market for long periods. The manager’s selection process may prove incorrect, which may have a negative impact on the Fund’s performance. The subadviser’s quantitative investment model may not adequately take into account certain factors and may result in the Fund having a lower return than if the Fund were managed using another model or investment strategy. In addition, the investment model used by the subadviser to evaluate securities or securities markets are based on certain assumptions concerning the interplay of market factors. The markets or the prices of individual securities may be affected by factors not foreseen in developing the model. The value of the Fund’s investments held for cash management or defensive investing purposes may be affected by changing interest rates and changes in the underlying investments’ credit ratings. Please see the Fund’s prospectus for a more complete discussion of these and other risks and the Fund’s investment strategies.
Portfolio holdings and breakdowns are as of September 30, 2017 and are subject to change and may not be representative of the portfolio managers’ current or future investments. The Fund’s top ten holdings (as a percentage of net assets) as of September 30, 2017 were: Apple Inc. (4.4%), Bank of America Corp. (4.3%), Citigroup Inc. (4.2%), JPMorgan Chase & Co. (3.8%), Walt Disney Co. (3.0%), LyondellBasell Industries NV, Class A Shares (2.7%), Lockheed Martin Corp. (2.6%), United Technologies Corp. (2.5%), Morgan Stanley (2.4%) and Goldman Sachs Group Inc. (2.4%). Please refer to pages 13 through 18 for a list and percentage breakdown of the Fund’s holdings.
The mention of sector breakdowns is for informational purposes only and should not be construed as a recommendation to purchase or sell any securities. The information provided regarding such sectors is not a sufficient basis upon which to make an investment decision. Investors seeking financial advice regarding the appropriateness of investing in any securities or investment strategies discussed should consult their financial professional. The Fund’s top five sector holdings (as a percentage of net assets) as of September 30, 2017 were: Financials (39.6%), Industrials (19.4%), Consumer Discretionary (14.7%), Information Technology (9.5%) and Materials (5.6%). The Fund’s portfolio composition is subject to change at any time.
All investments are subject to risk including the possible loss of principal. Past performance is no guarantee of future results. All index performance reflects no deduction for fees, expenses or taxes. Please note that an investor cannot invest directly in an index.
The information provided is not intended to be a forecast of future events, a guarantee of future results or investment advice. Views expressed may differ from those of the firm as a whole.
| | |
| Legg Mason BW Dynamic Large Cap Value Fund 2017 Annual Report | | 5 |
Fund overview (cont’d)
| i | The price-to-earnings (“P/E”) ratio is a stock’s price divided by its earnings per share. |
| ii | The price-to-book (“P/B”) ratio is a stock’s price divided by the stock’s per share book value. |
| iii | The Russell 1000 Value Index measures the performance of the large-cap value segment of the U.S. equity universe. It includes those Russell 1000 Index companies with lower price-to-book ratios and lower expected growth values. The Russell 1000 Index measures the performance of the large-cap segment of the U.S. equity universe. It is a subset of the Russell 3000 Index and includes approximately 1,000 of the largest securities based on a combination of their market cap and current index membership. The Russell 1000 represents approximately 92% of the U.S. market. The Russell 3000 Index measures the performance of the 3,000 largest U.S. companies based on total market capitalization, which represents approximately 98% of the U.S. equity market. |
| iv | The S&P 500 Index is an unmanaged index of 500 stocks and is generally representative of the performance of larger companies in the U.S. |
| v | Gross domestic product (“GDP”) is the market value of all final goods and services produced within a country in a given period of time. |
| vi | The Federal Reserve Board (the “Fed”) is responsible for the formulation of U.S. policies designed to promote economic growth, full employment, stable prices, and a sustainable pattern of international trade and payments. |
| vii | The Federal Open Market Committee (“FOMC”) is a policy-making body of the Federal Reserve System responsible for the formulation of a policy designed to promote economic growth, full employment, stable prices and a sustainable pattern of international trade and payments. |
| viii | Real estate investment trusts (“REITs”) invest in real estate or loans secured by real estate and issue shares in such investments, which can be illiquid. |
| | |
| 6 | | Legg Mason BW Dynamic Large Cap Value Fund 2017 Annual Report |
Fund at a glance† (unaudited)
Investment breakdown (%) as a percent of total investments
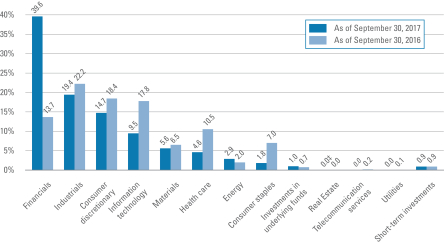
| † | The bar graph above represents the composition of the Fund’s investments as of September 30, 2017 and September 30, 2016. The Fund is actively managed. As a result, the composition of the Fund’s investments is subject to change at any time. |
| ‡ | Represents less than 0.1%. |
| | |
| Legg Mason BW Dynamic Large Cap Value Fund 2017 Annual Report | | 7 |
Fund expenses (unaudited)
Example
As a shareholder of the Fund, you may incur two types of costs: (1) transaction costs, including front-end and back-end sales charges (loads) on purchase payments; and (2) ongoing costs, including management fees; service and/or distribution (12b-1) fees, and other Fund expenses. This example is intended to help you understand your ongoing costs (in dollars) of investing in the Fund and to compare these costs with the ongoing costs of investing in other mutual funds.
This example is based on an investment of $1,000 invested on April 1, 2017 and held for the six months ended September 30, 2017.
Actual expenses
The table below titled “Based on Actual Total Return” provides information about actual account values and actual expenses. You may use the information provided in this table, together with the amount you invested, to estimate the expenses that you paid over the period. To estimate the expenses you paid on your account, divide your ending account value by $1,000 (for example, an $8,600 ending account value divided by $1,000 = 8.6), then multiply the result by the number under the heading entitled “Expenses Paid During the Period”.
Hypothetical example for comparison purposes
The table below titled “Based on Hypothetical Total Return” provides information about hypothetical account values and hypothetical expenses based on the actual expense ratio and an assumed rate of return of 5.00% per year before expenses, which is not the Fund’s actual return. The hypothetical account values and expenses may not be used to estimate the actual ending account balance or expenses you paid for the period. You may use the information provided in this table to compare the ongoing costs of investing in the Fund and other funds. To do so, compare the 5.00% hypothetical example relating to the Fund with the 5.00% hypothetical examples that appear in the shareholder reports of the other funds.
Please note that the expenses shown in the table below are meant to highlight your ongoing costs only and do not reflect any transactional costs, such as front-end or back-end sales charges (loads). Therefore, the table is useful in comparing ongoing costs only, and will not help you determine the relative total costs of owning different funds. In addition, if these transaction costs were included, your costs would have been higher.
| | | | | | | | | | | | | | | | | | | | | | | | | | | | | | | | | | | | | | | | | | | | | | |
| Based on actual total return1 | | | | | | Based on hypothetical total return1 | |
| | | Actual
Total Return
Without
Sales
Charge2 | | | Beginning
Account
Value | | | Ending
Account
Value | | | Annualized
Expense
Ratio | | | Expenses
Paid
During
the
Period3 | | | | | | | | Hypothetical
Annualized
Total Return | | | Beginning
Account
Value | | | Ending
Account
Value | | | Annualized
Expense
Ratio | | | Expenses
Paid
During
the
Period3 | |
| Class A | | | 9.47 | % | | $ | 1,000.00 | | | $ | 1,094.70 | | | | 1.09 | % | | $ | 5.72 | | | | | | | Class A | | | 5.00 | % | | $ | 1,000.00 | | | $ | 1,019.60 | | | | 1.09 | % | | $ | 5.52 | |
| Class C | | | 9.07 | | | | 1,000.00 | | | | 1,090.70 | | | | 1.82 | | | | 9.54 | | | | | | | Class C | | | 5.00 | | | | 1,000.00 | | | | 1,015.94 | | | | 1.82 | | | | 9.20 | |
| Class R | | | 9.26 | | | | 1,000.00 | | | | 1,092.60 | | | | 1.33 | | | | 6.98 | | | | | | | Class R | | | 5.00 | | | | 1,000.00 | | | | 1,018.40 | | | | 1.33 | | | | 6.73 | |
| Class I | | | 9.64 | | | | 1,000.00 | | | | 1,096.40 | | | | 0.74 | | | | 3.89 | | | | | | | Class I | | | 5.00 | | | | 1,000.00 | | | | 1,021.36 | | | | 0.74 | | | | 3.75 | |
| Class IS | | | 9.64 | | | | 1,000.00 | | | | 1,096.40 | | | | 0.65 | | | | 3.42 | | | | | | | Class IS | | | 5.00 | | | | 1,000.00 | | | | 1,021.81 | | | | 0.65 | | | | 3.29 | |
| | |
| 8 | | Legg Mason BW Dynamic Large Cap Value Fund 2017 Annual Report |
| 1 | For the six months ended September 30, 2017. |
| 2 | Assumes the reinvestment of all distributions, including returns of capital, if any, at net asset value and does not reflect the deduction of the applicable sales charge with respect to Class A shares or the applicable contingent deferred sales charge (“CDSC”) with respect to Class C shares. Total return is not annualized, as it may not be representative of the total return for the year. Performance figures may reflect compensating balance arrangements, fee waivers and/or expense reimbursements. In the absence of compensating balance arrangements, fee waivers and/or expense reimbursements, the total return would have been lower. Past performance is no guarantee of future results. |
| 3 | Expenses (net of compensating balance arrangements, fee waivers and/or expense reimbursements) are equal to each class’ respective annualized expense ratio multiplied by the average account value over the period, multiplied by the number of days in the most recent fiscal half-year (183), then divided by 365. |
| | |
| Legg Mason BW Dynamic Large Cap Value Fund 2017 Annual Report | | 9 |
Fund performance (unaudited)
Legg Mason BW Dynamic Large Cap Value Fund (the “Fund”) is the successor to a private fund (the “Predecessor”). The performance in the accompanying table and line graph for Class IS shares includes performance of the Predecessor. The Predecessor’s inception date was December 27, 2006. On October 31, 2014, the Predecessor transferred its assets to the Fund in exchange for the Fund’s Class IS shares. The investment policies, objectives, guidelines and restrictions of the Fund are in all material respects equivalent to those of the Predecessor. In addition, the Predecessor’s portfolio managers are the current portfolio managers of the Fund. As a mutual fund registered under the Investment Company Act of 1940, the Fund is subject to certain restrictions under the 1940 Act and the Internal Revenue Code to which the Predecessor was not subject. Had the Predecessor been registered under the 1940 Act and been subject to the provisions of the 1940 Act and the Code, its investment performance could have been adversely affected, but these restrictions are not expected to have a material effect on the Fund’s investment program. The performance information reflects the gross expenses of the Predecessor adjusted to reflect the higher fees and expenses of Class IS of the Fund. The performance is shown net of an annual management fee of 0.55% and other expenses of 0.10% which reflects the application of the Class IS expense limitation agreement. If the expense limitation agreement were not applicable, expenses would be higher and performance lower.
The Predecessor did not have distribution policies. The Predecessor was an unregistered private fund, did not qualify as a regulated investment company for federal income tax purposes and did not pay dividends or distributions.
| | | | | | | | | | | | | | | | | | | | |
| Average annual total returns | |
| Without sales charges1 | | Class A | | | Class C | | | Class R | | | Class I | | | Class IS | |
| Twelve Months Ended 9/30/17 | | | 17.70 | % | | | 16.76 | % | | | 17.25 | % | | | 18.10 | % | | | 18.07 | % |
| Five Years Ended 9/30/17 | | | N/A | | | | N/A | | | | N/A | | | | N/A | | | | 15.17 | |
| Ten Years Ended 9/30/17 | | | N/A | | | | N/A | | | | N/A | | | | N/A | | | | 9.17 | |
| Inception* through 9/30/17 | | | 7.12 | | | | 6.30 | | | | 6.76 | | | | 7.37 | | | | — | |
| | | | | |
| With sales charges2 | | Class A | | | Class C | | | Class R | | | Class I | | | Class IS | |
| Twelve Months Ended 9/30/17 | | | 10.93 | % | | | 15.76 | % | | | 17.25 | % | | | 18.10 | % | | | 18.07 | % |
| Five Years Ended 9/30/17 | | | N/A | | | | N/A | | | | N/A | | | | N/A | | | | 15.17 | |
| Ten Years Ended 9/30/17 | | | N/A | | | | N/A | | | | N/A | | | | N/A | | | | 9.17 | |
| Inception* through 9/30/17 | | | 4.96 | | | | 6.30 | | | | 6.76 | | | | 7.37 | | | | — | |
| | | | |
| Cumulative total returns | | | |
| Without sales charges1 | | | |
| Class A (Inception date of 11/3/14 through 9/30/17) | | | 22.16 | % |
| Class C (Inception date of 11/3/14 through 9/30/17) | | | 19.46 | |
| Class R (Inception date of 11/3/14 through 9/30/17) | | | 20.95 | |
| Class I (Inception date of 11/3/14 through 9/30/17) | | | 23.00 | |
| Class IS (9/30/07 through 9/30/17) | | | 140.49 | |
| | |
| 10 | | Legg Mason BW Dynamic Large Cap Value Fund 2017 Annual Report |
All figures represent past performance and are not a guarantee of future results. Investment return and principal value of an investment will fluctuate so that an investor’s shares, when redeemed, may be worth more or less than their original cost. The returns shown do not reflect the deduction of taxes that a shareholder would pay on Fund distributions or the redemption of Fund shares. Performance figures may reflect compensating balance arrangements, fee waivers and/or expense reimbursements. In the absence of compensating balance arrangements, fee waivers and/or expense reimbursements, the total return would have been lower.
| 1 | Assumes the reinvestment of all distributions, including returns of capital, if any, at net asset value and does not reflect the deduction of the applicable sales charge with respect to Class A shares or the applicable contingent deferred sales charge (“CDSC”) with respect to Class C shares. |
| 2 | Assumes the reinvestment of all distributions, including returns of capital, if any, at net asset value. In addition, Class A shares reflect the deduction of the maximum initial sales charge of 5.75%. Class C shares reflect the deduction of a 1.00% CDSC, which applies if shares are redeemed within one year from purchase payment. |
| * | Inception dates for Class A, C, R, I and IS shares are November 3, 2014, November 3, 2014, November 3, 2014, November 3, 2014 and December 27, 2006, respectively. |
| | |
| Legg Mason BW Dynamic Large Cap Value Fund 2017 Annual Report | | 11 |
Fund performance (unaudited) (cont’d)
Historical performance
Value of $1,000,000 invested in
Class IS Shares of Legg Mason BW Dynamic Large Cap Value Fund vs. Russell 1000 Value Index and S&P 500 Index† — September 30, 2007 - September 30, 2017
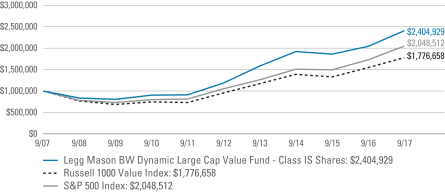
All figures represent past performance and are not a guarantee of future results. Investment return and principal value of an investment will fluctuate so that an investor’s shares, when redeemed, may be worth more or less than their original cost. The returns shown do not reflect the deduction of taxes that a shareholder would pay on Fund distributions or the redemption of Fund shares. Performance figures may reflect compensating balance arrangements, fee waivers and/or expense reimbursements. In the absence of compensating balance arrangements, fee waivers and/or expense reimbursements, the total return would have been lower.
| † | Hypothetical illustration of $1,000,000 invested in Class IS shares of Legg Mason BW Dynamic Large Cap Value Fund on September 30, 2007 assuming the reinvestment of all distributions, including returns of capital, if any, at net asset value through September 30, 2017 (Performance prior to October 31, 2014 on this chart is that of the Fund’s Predecessor). The hypothetical illustration also assumes a $1,000,000 investment in the Russell 1000 Value Index and the S&P 500 Index. The Russell 1000 Value Index measures the performance of the large-cap value segment of the U.S. equity universe. It includes those Russell 1000 Index companies with lower price-to-book ratios and lower expected growth values. (A price-to-book ratio is the price of a stock compared to the difference between a company’s assets and liabilities). The S&P 500 Index is an unmanaged index of 500 stocks and is generally representative of the performance of larger companies in the U.S. The indices are unmanaged and are not subject to the same management and trading expenses as a mutual fund. Please note that an investor cannot invest directly in an index. The performance of the Fund’s other classes may be greater or less than the Class IS shares’ performance indicated on this chart, depending on whether greater or lesser sales charges and fees were incurred by shareholders investing in the other classes. |
| | |
| 12 | | Legg Mason BW Dynamic Large Cap Value Fund 2017 Annual Report |
Schedule of investments
September 30, 2017
Legg Mason BW Dynamic Large Cap Value Fund
| | | | | | | | | | | | | | | | |
| Security | | | | | | | | Shares | | | Value | |
| Common Stocks — 98.1% | | | | | | | | | | | | | | | | |
| Consumer Discretionary — 14.7% | | | | | | | | | | | | | | | | |
Auto Components — 0.2% | | | | | | | | | | | | | | | | |
Goodyear Tire & Rubber Co. | | | | | | | | | | | 10,334 | | | $ | 343,606 | |
Automobiles — 0.9% | | | | | | | | | | | | | | | | |
General Motors Co. | | | | | | | | | | | 36,024 | | | | 1,454,649 | |
Diversified Consumer Services — 0.2% | | | | | | | | | | | | | | | | |
Service Corporation International | | | | | | | | | | | 6,786 | | | | 234,117 | |
Hotels, Restaurants & Leisure — 2.1% | | | | | | | | | | | | | | | | |
Carnival Corp. | | | | | | | | | | | 31,511 | | | | 2,034,665 | |
Wendy’s Co. | | | | | | | | | | | 7,639 | | | | 118,634 | |
Wyndham Worldwide Corp. | | | | | | | | | | | 10,514 | | | | 1,108,281 | |
Total Hotels, Restaurants & Leisure | | | | | | | | | | | | | | | 3,261,580 | |
Household Durables — 0.3% | | | | | | | | | | | | | | | | |
PulteGroup Inc. | | | | | | | | | | | 13,543 | | | | 370,130 | |
Tempur Sealy International Inc. | | | | | | | | | | | 746 | | | | 48,132 | * |
Total Household Durables | | | | | | | | | | | | | | | 418,262 | |
Internet & Direct Marketing Retail — 0.1% | | | | | | | | | | | | | | | | |
Liberty Ventures, Series A Shares | | | | | | | | | | | 3,284 | | | | 188,994 | * |
Media — 6.4% | | | | | | | | | | | | | | | | |
CBS Corp., Class B Shares, Non Voting Shares | | | | | | | | | | | 37,529 | | | | 2,176,682 | |
Comcast Corp., Class A Shares | | | | | | | | | | | 54,488 | | | | 2,096,698 | |
Interpublic Group of Cos. Inc. | | | | | | | | | | | 9,700 | | | | 201,663 | |
Omnicom Group Inc. | | | | | | | | | | | 10,400 | | | | 770,328 | |
Walt Disney Co. | | | | | | | | | | | 46,592 | | | | 4,592,574 | |
Total Media | | | | | | | | | | | | | | | 9,837,945 | |
Multiline Retail — 2.4% | | | | | | | | | | | | | | | | |
Kohl’s Corp. | | | | | | | | | | | 8,781 | | | | 400,853 | |
Nordstrom Inc. | | | | | | | | | | | 13,516 | | | | 637,279 | |
Target Corp. | | | | | | | | | | | 44,609 | | | | 2,632,377 | |
Total Multiline Retail | | | | | | | | | | | | | | | 3,670,509 | |
Specialty Retail — 1.3% | | | | | | | | | | | | | | | | |
Best Buy Co. Inc. | | | | | | | | | | | 19,637 | | | | 1,118,523 | |
O’Reilly Automotive Inc. | | | | | | | | | | | 2,169 | | | | 467,138 | * |
Signet Jewelers Ltd. | | | | | | | | | | | 3,393 | | | | 225,804 | |
Tractor Supply Co. | | | | | | | | | | | 3,142 | | | | 198,857 | |
Total Specialty Retail | | | | | | | | | | | | | | | 2,010,322 | |
See Notes to Financial Statements.
| | |
| Legg Mason BW Dynamic Large Cap Value Fund 2017 Annual Report | | 13 |
Schedule of investments (cont’d)
September 30, 2017
Legg Mason BW Dynamic Large Cap Value Fund
| | | | | | | | | | | | | | | | |
| Security | | | | | | | | Shares | | | Value | |
Textiles, Apparel & Luxury Goods — 0.8% | | | | | | | | | | | | | | | | |
Carter’s Inc. | | | | | | | | | | | 2,393 | | | $ | 236,309 | |
Hanesbrands Inc. | | | | | | | | | | | 12,629 | | | | 311,179 | |
Michael Kors Holdings Ltd. | | | | | | | | | | | 14,044 | | | | 672,005 | * |
Total Textiles, Apparel & Luxury Goods | | | | | | | | | | | | | | | 1,219,493 | |
Total Consumer Discretionary | | | | | | | | | | | | | | | 22,639,477 | |
| Consumer Staples — 1.8% | | | | | | | | | | | | | | | | |
Beverages — 0.5% | | | | | | | | | | | | | | | | |
Brown-Forman Corp., Class B Shares | | | | | | | | | | | 15,065 | | | | 818,029 | |
Food & Staples Retailing — 0.2% | | | | | | | | | | | | | | | | |
Kroger Co. | | | | | | | | | | | 12,602 | | | | 252,796 | |
Food Products — 1.1% | | | | | | | | | | | | | | | | |
Tyson Foods Inc., Class A Shares | | | | | | | | | | | 24,324 | | | | 1,713,626 | |
Total Consumer Staples | | | | | | | | | | | | | | | 2,784,451 | |
| Energy — 2.9% | | | | | | | | | | | | | | | | |
Oil, Gas & Consumable Fuels — 2.9% | | | | | | | | | | | | | | | | |
Chevron Corp. | | | | | | | | | | | 17,393 | | | | 2,043,677 | |
Exxon Mobil Corp. | | | | | | | | | | | 30,412 | | | | 2,493,176 | |
Total Energy | | | | | | | | | | | | | | | 4,536,853 | |
| Financials — 39.6% | | | | | | | | | | | | | | | | |
Banks — 18.0% | | | | | | | | | | | | | | | | |
Bank of America Corp. | | | | | | | | | | | 260,201 | | | | 6,593,493 | |
Citigroup Inc. | | | | | | | | | | | 89,232 | | | | 6,490,736 | |
Citizens Financial Group Inc. | | | | | | | | | | | 20,061 | | | | 759,710 | |
Fifth Third Bancorp | | | | | | | | | | | 47,055 | | | | 1,316,599 | |
JPMorgan Chase & Co. | | | | | | | | | | | 61,707 | | | | 5,893,635 | |
M&T Bank Corp. | | | | | | | | | | | 3,925 | | | | 632,082 | |
PNC Financial Services Group Inc. | | | | | | | | | | | 6,039 | | | | 813,876 | |
Regions Financial Corp. | | | | | | | | | | | 59,342 | | | | 903,779 | |
SunTrust Banks Inc. | | | | | | | | | | | 19,175 | | | | 1,146,090 | |
Synovus Financial Corp. | | | | | | | | | | | 11,117 | | | | 512,049 | |
U.S. Bancorp | | | | | | | | | | | 43,037 | | | | 2,306,353 | |
Zions Bancorp | | | | | | | | | | | 7,051 | | | | 332,666 | |
Total Banks | | | | | | | | | | | | | | | 27,701,068 | |
Capital Markets — 9.1% | | | | | | | | | | | | | | | | |
Ameriprise Financial Inc. | | | | | | | | | | | 17,420 | | | | 2,587,044 | |
Bank of New York Mellon Corp. | | | | | | | | | | | 37,823 | | | | 2,005,376 | |
Goldman Sachs Group Inc. | | | | | | | | | | | 15,570 | | | | 3,693,048 | |
Morgan Stanley | | | | | | | | | | | 78,223 | | | | 3,768,002 | |
See Notes to Financial Statements.
| | |
| 14 | | Legg Mason BW Dynamic Large Cap Value Fund 2017 Annual Report |
Legg Mason BW Dynamic Large Cap Value Fund
| | | | | | | | | | | | | | | | |
| Security | | | | | | | | Shares | | | Value | |
Capital Markets — continued | | | | | | | | | | | | | | | | |
State Street Corp. | | | | | | | | | | | 15,419 | | | $ | 1,473,131 | |
T. Rowe Price Group Inc. | | | | | | | | | | | 5,589 | | | | 506,643 | |
Total Capital Markets | | | | | | | | | | | | | | | 14,033,244 | |
Consumer Finance — 5.0% | | | | | | | | | | | | | | | | |
American Express Co. | | | | | | | | | | | 36,458 | | | | 3,297,990 | |
Capital One Financial Corp. | | | | | | | | | | | 15,245 | | | | 1,290,642 | |
Discover Financial Services | | | | | | | | | | | 38,758 | | | | 2,499,116 | |
Navient Corp. | | | | | | | | | | | 36,442 | | | | 547,359 | |
Total Consumer Finance | | | | | | | | | | | | | | | 7,635,107 | |
Insurance — 7.5% | | | | | | | | | | | | | | | | |
AFLAC Inc. | | | | | | | | | | | 9,209 | | | | 749,521 | |
Allstate Corp. | | | | | | | | | | | 4,551 | | | | 418,282 | |
American Financial Group Inc. | | | | | | | | | | | 1,996 | | | | 206,486 | |
Aon PLC | | | | | | | | | | | 10,080 | | | | 1,472,688 | |
Assurant Inc. | | | | | | | | | | | 5,273 | | | | 503,677 | |
Assured Guaranty Ltd. | | | | | | | | | | | 6,132 | | | | 231,483 | |
Axis Capital Holdings Ltd. | | | | | | | | | | | 2,675 | | | | 153,304 | |
CNA Financial Corp. | | | | | | | | | | | 8,710 | | | | 437,678 | |
CNO Financial Group Inc. | | | | | | | | | | | 3,931 | | | | 91,750 | |
Everest Re Group Ltd. | | | | | | | | | | | 1,441 | | | | 329,110 | |
Lincoln National Corp. | | | | | | | | | | | 7,165 | | | | 526,484 | |
Primerica Inc. | | | | | | | | | | | 2,223 | | | | 181,286 | |
Prudential Financial Inc. | | | | | | | | | | | 13,749 | | | | 1,461,794 | |
Travelers Cos. Inc. | | | | | | | | | | | 29,918 | | | | 3,665,553 | |
Unum Group | | | | | | | | | | | 18,810 | | | | 961,755 | |
XL Group Ltd. | | | | | | | | | | | 6,003 | | | | 236,818 | |
Total Insurance | | | | | | | | | | | | | | | 11,627,669 | |
Total Financials | | | | | | | | | | | | | | | 60,997,088 | |
| Health Care — 4.6% | | | | | | | | | | | | | | | | |
Health Care Equipment & Supplies — 1.9% | | | | | | | | | | | | | | | | |
Baxter International Inc. | | | | | | | | | | | 45,836 | | | | 2,876,209 | |
Health Care Providers & Services — 2.7% | | | | | | | | | | | | | | | | |
DaVita Inc. | | | | | | | | | | | 10,161 | | | | 603,462 | * |
Express Scripts Holding Co. | | | | | | | | | | | 48,463 | | | | 3,068,677 | * |
Humana Inc. | | | | | | | | | | | 2,027 | | | | 493,838 | |
Total Health Care Providers & Services | | | | | | | | | | | | | | | 4,165,977 | |
Total Health Care | | | | | | | | | | | | | | | 7,042,186 | |
See Notes to Financial Statements.
| | |
| Legg Mason BW Dynamic Large Cap Value Fund 2017 Annual Report | | 15 |
Schedule of investments (cont’d)
September 30, 2017
Legg Mason BW Dynamic Large Cap Value Fund
| | | | | | | | | | | | | | | | |
| Security | | | | | | | | Shares | | | Value | |
| Industrials — 19.4% | | | | | | | | | | | | | | | | |
Aerospace & Defense — 9.6% | | | | | | | | | | | | | | | | |
General Dynamics Corp. | | | | | | | | | | | 12,699 | | | $ | 2,610,660 | |
Huntington Ingalls Industries Inc. | | | | | | | | | | | 637 | | | | 144,242 | |
Lockheed Martin Corp. | | | | | | | | | | | 12,787 | | | | 3,967,678 | |
Northrop Grumman Corp. | | | | | | | | | | | 11,950 | | | | 3,438,254 | |
Orbital ATK Inc. | | | | | | | | | | | 1,702 | | | | 226,638 | |
Spirit AeroSystems Holdings Inc., Class A Shares | | | | | | | | | | | 6,530 | | | | 507,512 | |
United Technologies Corp. | | | | | | | | | | | 33,256 | | | | 3,860,357 | |
Total Aerospace & Defense | | | | | | | | | | | | | | | 14,755,341 | |
Air Freight & Logistics — 0.1% | | | | | | | | | | | | | | | | |
Expeditors International of Washington Inc. | | | | | | | | | | | 2,647 | | | | 158,449 | |
Airlines — 3.0% | | | | | | | | | | | | | | | | |
American Airlines Group Inc. | | | | | | | | | | | 18,837 | | | | 894,569 | |
Delta Air Lines Inc. | | | | | | | | | | | 48,468 | | | | 2,337,127 | |
Southwest Airlines Co. | | | | | | | | | | | 8,400 | | | | 470,232 | |
United Continental Holdings Inc. | | | | | | | | | | | 14,527 | | | | 884,404 | * |
Total Airlines | | | | | | | | | | | | | | | 4,586,332 | |
Construction & Engineering — 0.1% | | | | | | | | | | | | | | | | |
EMCOR Group Inc. | | | | | | | | | | | 1,299 | | | | 90,125 | |
Electrical Equipment — 0.3% | | | | | | | | | | | | | | | | |
Rockwell Automation Inc. | | | | | | | | | | | 2,589 | | | | 461,386 | |
Machinery — 1.9% | | | | | | | | | | | | | | | | |
Allison Transmission Holdings Inc. | | | | | | | | | | | 3,701 | | | | 138,899 | |
Cummins Inc. | | | | | | | | | | | 9,524 | | | | 1,600,318 | |
Lincoln Electric Holdings Inc. | | | | | | | | | | | 2,756 | | | | 252,670 | |
Nordson Corp. | | | | | | | | | | | 2,343 | | | | 277,645 | |
Parker Hannifin Corp. | | | | | | | | | | | 902 | | | | 157,868 | |
WABCO Holdings Inc. | | | | | | | | | | | 637 | | | | 94,276 | * |
Wabtec Corp. | | | | | | | | | | | 5,534 | | | | 419,200 | |
Total Machinery | | | | | | | | | | | | | | | 2,940,876 | |
Professional Services — 0.5% | | | | | | | | | | | | | | | | |
Manpowergroup Inc. | | | | | | | | | | | 5,676 | | | | 668,746 | |
Robert Half International Inc. | | | | | | | | | | | 3,121 | | | | 157,111 | |
Total Professional Services | | | | | | | | | | | | | | | 825,857 | |
Road & Rail — 3.4% | | | | | | | | | | | | | | | | |
Norfolk Southern Corp. | | | | | | | | | | | 13,684 | | | | 1,809,572 | |
Union Pacific Corp. | | | | | | | | | | | 29,070 | | | | 3,371,248 | |
Total Road & Rail | | | | | | | | | | | | | | | 5,180,820 | |
See Notes to Financial Statements.
| | |
| 16 | | Legg Mason BW Dynamic Large Cap Value Fund 2017 Annual Report |
Legg Mason BW Dynamic Large Cap Value Fund
| | | | | | | | | | | | | | | | |
| Security | | | | | | | | Shares | | | Value | |
Trading Companies & Distributors — 0.5% | | | | | | | | | | | | | | | | |
W. W. Grainger Inc. | | | | | | | | | | | 4,582 | | | $ | 823,615 | |
Total Industrials | | | | | | | | | | | | | | | 29,822,801 | |
| Information Technology — 9.5% | | | | | | | | | | | | | | | | |
Communications Equipment — 0.3% | | | | | | | | | | | | | | | | |
Harris Corp. | | | | | | | | | | | 3,012 | | | | 396,620 | |
Electronic Equipment, Instruments & Components — 1.9% | | | | | | | | | | | | | | | | |
CDW Corp. | | | | | | | | | | | 9,483 | | | | 625,878 | |
Corning Inc. | | | | | | | | | | | 74,401 | | | | 2,226,078 | |
Total Electronic Equipment, Instruments & Components | | | | | | | | | | | | | | | 2,851,956 | |
Internet Software & Services — 1.1% | | | | | | | | | | | | | | | | |
eBay Inc. | | | | | | | | | | | 45,853 | | | | 1,763,506 | * |
Software — 0.3% | | | | | | | | | | | | | | | | |
Micro Focus International PLC, ADR | | | | | | | | | | | 15,919 | | | | 507,816 | * |
Technology Hardware, Storage & Peripherals — 5.9% | | | | | | | | | | | | | | | | |
Apple Inc. | | | | | | | | | | | 43,836 | | | | 6,756,005 | |
Hewlett Packard Enterprise Co. | | | | | | | | | | | 115,904 | | | | 1,704,948 | |
NetApp Inc. | | | | | | | | | | | 4,812 | | | | 210,573 | |
Xerox Corp. | | | | | | | | | | | 11,156 | | | | 371,383 | |
Total Technology Hardware, Storage & Peripherals | | | | | | | | | | | | | | | 9,042,909 | |
Total Information Technology | | | | | | | | | | | | | | | 14,562,807 | |
| Materials — 5.6% | | | | | | | | | | | | | | | | |
Chemicals — 4.0% | | | | | | | | | | | | | | | | |
Albemarle Corp. | | | | | | | | | | | 7,752 | | | | 1,056,675 | |
Celanese Corp., Series A Shares | | | | | | | | | | | 5,900 | | | | 615,193 | |
Huntsman Corp. | | | | | | | | | | | 12,423 | | | | 340,639 | |
LyondellBasell Industries NV, Class A Shares | | | | | | | | | | | 42,189 | | | | 4,178,820 | |
Total Chemicals | | | | | | | | | | | | | | | 6,191,327 | |
Containers & Packaging — 1.4% | | | | | | | | | | | | | | | | |
Avery Dennison Corp. | | | | | | | | | | | 5,768 | | | | 567,225 | |
International Paper Co. | | | | | | | | | | | 28,118 | | | | 1,597,665 | |
Total Containers & Packaging | | | | | | | | | | | | | | | 2,164,890 | |
Metals & Mining — 0.2% | | | | | | | | | | | | | | | | |
Steel Dynamics Inc. | | | | | | | | | | | 5,927 | | | | 204,304 | |
Total Materials | | | | | | | | | | | | | | | 8,560,521 | |
| Real Estate — 0.0% | | | | | | | | | | | | | | | | |
Real Estate Management & Development — 0.0% | | | | | | | | | | | | | | | | |
Realogy Holdings Corp. | | | | | | | | | | | 1,884 | | | | 62,078 | |
Total Common Stocks (Cost — $140,684,679) | | | | | | | | | | | | | | | 151,008,262 | |
See Notes to Financial Statements.
| | |
| Legg Mason BW Dynamic Large Cap Value Fund 2017 Annual Report | | 17 |
Schedule of investments (cont’d)
September 30, 2017
Legg Mason BW Dynamic Large Cap Value Fund
| | | | | | | | | | | | | | | | |
| Security | | | | | | | | Shares | | | Value | |
| Investments in Underlying Funds — 1.0% | | | | | | | | | | | | | | | | |
iShares Trust — iShares Russell 1000 Value Index Fund (Cost — $1,489,200) | | | | | | | | 12,690 | | | $ | 1,503,892 | |
Total Investments before Short-Term Investments (Cost — $142,173,879) | | | | 152,512,154 | |
| | | | |
| | | Rate | | | | | | | | | | |
| Short-Term Investments — 0.9% | | | | | | | | | | | | | | | | |
State Street Institutional U.S. Government Money Market Fund, Premier Class (Cost — $1,342,492) | | | 0.907 | % | | | | | | | 1,342,492 | | | | 1,342,492 | |
Total Investments — 100.0% (Cost — $143,516,371) | | | | | | | | | | | | | | | 153,854,646 | |
Other Assets in Excess of Liabilities — 0.0% | | | | | | | | | | | | | | | 56,181 | |
Total Net Assets — 100.0% | | | | | | | | | | | | | | $ | 153,910,827 | |
| * | Non-income producing security. |
| | |
Abbreviation used in this schedule: |
| ADR | | — American Depositary Receipts |
See Notes to Financial Statements.
| | |
| 18 | | Legg Mason BW Dynamic Large Cap Value Fund 2017 Annual Report |
Statement of assets and liabilities
September 30, 2017
| | | | |
|
| Assets: | |
Investments, at value (Cost — $143,516,371) | | $ | 153,854,646 | |
Dividends and interest receivable | | | 72,376 | |
Receivable for Fund shares sold | | | 26,776 | |
Prepaid expenses | | | 54,998 | |
Total Assets | | | 154,008,796 | |
|
| Liabilities: | |
Investment management fee payable | | | 38,533 | |
Trustees’ fees payable | | | 3,329 | |
Service and/or distribution fees payable | | | 1,729 | |
Payable for Fund shares repurchased | | | 77 | |
Accrued expenses | | | 54,301 | |
Total Liabilities | | | 97,969 | |
| Total Net Assets | | $ | 153,910,827 | |
|
| Net Assets: | |
Par value (Note 7) | | $ | 131 | |
Paid-in capital in excess of par value | | | 140,457,990 | |
Undistributed net investment income | | | 696,327 | |
Accumulated net realized gain on investments | | | 2,418,104 | |
Net unrealized appreciation on investments | | | 10,338,275 | |
| Total Net Assets | | $ | 153,910,827 | |
See Notes to Financial Statements.
| | |
| Legg Mason BW Dynamic Large Cap Value Fund 2017 Annual Report | | 19 |
Statement of assets and liabilities (cont’d)
September 30, 2017
| | | | |
|
| Net Assets: | |
Class A | | | $5,306,113 | |
Class C | | | $725,898 | |
Class R | | | $264,074 | |
Class I | | | $1,417,794 | |
Class IS | | | $146,196,948 | |
|
| Shares Outstanding: | |
Class A | | | 454,461 | |
Class C | | | 62,868 | |
Class R | | | 22,603 | |
Class I | | | 121,008 | |
Class IS | | | 12,474,237 | |
|
| Net Asset Value: | |
Class A (and redemption price) | | | $11.68 | |
Class C* | | | $11.55 | |
Class R (and redemption price) | | | $11.68 | |
Class I (and redemption price) | | | $11.72 | |
Class IS (and redemption price) | | | $11.72 | |
| Maximum Public Offering Price Per Share: | |
Class A (based on maximum initial sales charge of 5.75%) | | | $12.39 | |
| * | Redemption price per share is NAV of Class C shares reduced by a 1.00% CDSC if shares are redeemed within one year from purchase payment (See Note 2). |
See Notes to Financial Statements.
| | |
| 20 | | Legg Mason BW Dynamic Large Cap Value Fund 2017 Annual Report |
Statement of operations
For the Year Ended September 30, 2017
| | | | |
|
| Investment Income: | |
Dividends | | $ | 1,309,422 | |
Interest | | | 6,688 | |
Less: Foreign taxes withheld | | | (71) | |
Total Investment Income | | | 1,316,039 | |
|
| Expenses: | |
Investment management fee (Note 2) | | | 349,119 | |
Registration fees | | | 70,175 | |
Audit and tax fees | | | 34,194 | |
Shareholder reports | | | 28,892 | |
Legal fees | | | 25,098 | |
Fund accounting fees | | | 22,878 | |
Service and/or distribution fees (Notes 2 and 5) | | | 20,073 | |
Transfer agent fees (Note 5) | | | 13,128 | |
Trustees’ fees | | | 9,609 | |
Custody fees | | | 1,650 | |
Insurance | | | 1,057 | |
Fees recaptured by investment manager (Note 2) | | | 932 | |
Interest expense | | | 378 | |
Miscellaneous expenses | | | 5,702 | |
Total Expenses | | | 582,885 | |
Less: Fee waivers and/or expense reimbursements (Notes 2 and 5) | | | (139,193) | |
Net Expenses | | | 443,692 | |
| Net Investment Income | | | 872,347 | |
|
| Realized and Unrealized Gain on Investments (Notes 1 and 3): | |
Net Realized Gain From Investment Transactions | | | 3,891,116 | |
Change in Net Unrealized Appreciation (Depreciation) From Investments | | | 8,817,749 | |
| Net Gain on Investments | | | 12,708,865 | |
| Increase in Net Assets From Operations | | $ | 13,581,212 | |
See Notes to Financial Statements.
| | |
| Legg Mason BW Dynamic Large Cap Value Fund 2017 Annual Report | | 21 |
Statements of changes in net assets
| | | | | | | | |
| For the Years Ended September 30, | | 2017 | | | 2016 | |
|
| Operations: | |
Net investment income | | $ | 872,347 | | | $ | 487,332 | |
Net realized gain (loss) | | | 3,891,116 | | | | (1,379,008) | |
Change in net unrealized appreciation (depreciation) | | | 8,817,749 | | | | 2,696,736 | |
Increase in Net Assets From Operations | | | 13,581,212 | | | | 1,805,060 | |
|
| Distributions to Shareholders From (Notes 1 and 6): | |
Net investment income | | | (560,000) | | | | (325,001) | |
Net realized gains | | | — | | | | (448,334) | |
Decrease in Net Assets From Distributions to Shareholders | | | (560,000) | | | | (773,335) | |
|
| Fund Share Transactions (Note 7): | |
Net proceeds from sale of shares | | | 110,619,841 | | | | 23,940,628 | |
Reinvestment of distributions | | | 554,772 | | | | 760,858 | |
Cost of shares repurchased | | | (5,402,043) | | | | (7,377,670) | |
Increase in Net Assets From Fund Share Transactions | | | 105,772,570 | | | | 17,323,816 | |
Increase in Net Assets | | | 118,793,782 | | | | 18,355,541 | |
|
| Net Assets: | |
Beginning of year | | | 35,117,045 | | | | 16,761,504 | |
End of year* | | $ | 153,910,827 | | | $ | 35,117,045 | |
*Includes undistributed net investment income of: | | | $696,327 | | | | $384,230 | |
See Notes to Financial Statements.
| | |
| 22 | | Legg Mason BW Dynamic Large Cap Value Fund 2017 Annual Report |
Financial highlights
| | | | | | | | | | | | |
For a share of each class of beneficial interest outstanding throughout each year ended September 30,
unless otherwise noted: | |
| Class A Shares1 | | 2017 | | | 2016 | | | 20152 | |
| | | |
| Net asset value, beginning of year | | | $10.04 | | | | $9.50 | | | | $10.00 | |
| | | |
| Income (loss) from operations: | | | | | | | | | | | | |
Net investment income | | | 0.11 | | | | 0.14 | | | | 0.11 | |
Net realized and unrealized gain (loss) | | | 1.65 | | | | 0.69 | | | | (0.57) | |
Total income (loss) from operations | | | 1.76 | | | | 0.83 | | | | (0.46) | |
| | | |
| Less distributions from: | | | | | | | | | | | | |
Net investment income | | | (0.12) | | | | (0.10) | | | | (0.04) | |
Net realized gains | | | — | | | | (0.19) | | | | — | |
Total distributions | | | (0.12) | | | | (0.29) | | | | (0.04) | |
| | | |
| Net asset value, end of year | | | $11.68 | | | | $10.04 | | | | $9.50 | |
Total return3 | | | 17.70 | % | | | 8.87 | % | | | (4.67) | % |
| | | |
| Net assets, end of year (000s) | | | $5,306 | | | | $4,424 | | | | $362 | |
| | | |
| Ratios to average net assets: | | | | | | | | | | | | |
Gross expenses | | | 1.35 | %4 | | | 1.44 | % | | | 2.58 | %5 |
Net expenses6,7 | | | 1.07 | 4 | | | 1.00 | | | | 1.02 | 5 |
Net investment income | | | 1.04 | | | | 1.40 | | | | 1.16 | 5 |
| | | |
| Portfolio turnover rate | | | 83 | % | | | 112 | % | | | 110 | %8 |
| 1 | Per share amounts have been calculated using the average shares method. |
| 2 | For the period November 3, 2014 (inception date) to September 30, 2015. |
| 3 | Performance figures, exclusive of sales charges, may reflect compensating balance arrangements, fee waivers and/or expense reimbursements. In the absence of compensating balance arrangements, fee waivers and/or expense reimbursements, the total return would have been lower. Past performance is no guarantee of future results. Total returns for periods of less than one year are not annualized. |
| 4 | Reflects recapture of expenses waived/reimbursed from prior fiscal years. |
| 6 | As a result of an expense limitation arrangement, the ratio of total annual fund operating expenses, other than interest, brokerage commissions, dividend expense on short sales, taxes, extraordinary expenses and acquired fund fees and expenses, to average net assets of Class A shares did not exceed 1.10%. This expense limitation arrangement cannot be terminated prior to December 31, 2018 without the Board of Trustees’ consent. |
| 7 | Reflects fee waivers and/or expense reimbursements. |
| 8 | Excludes securities received as a result of a contribution in-kind. |
See Notes to Financial Statements.
| | |
| Legg Mason BW Dynamic Large Cap Value Fund 2017 Annual Report | | 23 |
Financial highlights (cont’d)
| | | | | | | | | | | | |
For a share of each class of beneficial interest outstanding throughout each year ended September 30,
unless otherwise noted: | |
| Class C Shares1 | | 2017 | | | 2016 | | | 20152 | |
| | | |
| Net asset value, beginning of year | | | $9.92 | | | | $9.44 | | | | $10.00 | |
| | | |
| Income (loss) from operations: | | | | | | | | | | | | |
Net investment income | | | 0.03 | | | | 0.07 | | | | 0.05 | |
Net realized and unrealized gain (loss) | | | 1.63 | | | | 0.69 | | | | (0.59) | |
Total income (loss) from operations | | | 1.66 | | | | 0.76 | | | | (0.54) | |
| | | |
| Less distributions from: | | | | | | | | | | | | |
Net investment income | | | (0.03) | | | | (0.09) | | | | (0.02) | |
Net realized gains | | | — | | | | (0.19) | | | | — | |
Total distributions | | | (0.03) | | | | (0.28) | | | | (0.02) | |
| | | |
| Net asset value, end of year | | | $11.55 | | | | $9.92 | | | | $9.44 | |
Total return3 | | | 16.76 | % | | | 8.12 | % | | | (5.38) | % |
| | | |
| Net assets, end of year (000s) | | | $726 | | | | $784 | | | | $361 | |
| | | |
| Ratios to average net assets: | | | | | | | | | | | | |
Gross expenses | | | 2.01 | %4 | | | 2.22 | % | | | 3.14 | %5 |
Net expenses6,7 | | | 1.79 | 4 | | | 1.78 | | | | 1.83 | 5 |
Net investment income | | | 0.32 | | | | 0.70 | | | | 0.54 | 5 |
| | | |
| Portfolio turnover rate | | | 83 | % | | | 112 | % | | | 110 | %8 |
| 1 | Per share amounts have been calculated using the average shares method. |
| 2 | For the period November 3, 2014 (inception date) to September 30, 2015. |
| 3 | Performance figures, exclusive of CDSC, may reflect compensating balance arrangements, fee waivers and/or expense reimbursements. In the absence of compensating balance arrangements, fee waivers and/or expense reimbursements, the total return would have been lower. Past performance is no guarantee of future results. Total returns for periods of less than one year are not annualized. |
| 4 | Reflects recapture of expenses waived/reimbursed from prior fiscal years. |
| 6 | As a result of an expense limitation arrangement, the ratio of total annual fund operating expenses, other than interest, brokerage commissions, dividend expense on short sales, taxes, extraordinary expenses and acquired fund fees and expenses, to average net assets of Class C shares did not exceed 1.85%. This expense limitation arrangement cannot be terminated prior to December 31, 2018 without the Board of Trustees’ consent. |
| 7 | Reflects fee waivers and/or expense reimbursements. |
| 8 | Excludes securities received as a result of a contribution in-kind. |
See Notes to Financial Statements.
| | |
| 24 | | Legg Mason BW Dynamic Large Cap Value Fund 2017 Annual Report |
| | | | | | | | | | | | |
For a share of each class of beneficial interest outstanding throughout each year ended September 30,
unless otherwise noted: | |
| Class R Shares1 | | 2017 | | | 2016 | | | 20152 | |
| | | |
| Net asset value, beginning of year | | | $10.03 | | | | $9.47 | | | | $10.00 | |
| | | |
| Income (loss) from operations: | | | | | | | | | | | | |
Net investment income | | | 0.06 | | | | 0.11 | | | | 0.09 | |
Net realized and unrealized gain (loss) | | | 1.66 | | | | 0.70 | | | | (0.59) | |
Total income (loss) from operations | | | 1.72 | | | | 0.81 | | | | (0.50) | |
| | | |
| Less distributions from: | | | | | | | | | | | | |
Net investment income | | | (0.07) | | | | (0.06) | | | | (0.03) | |
Net realized gains | | | — | | | | (0.19) | | | | — | |
Total distributions | | | (0.07) | | | | (0.25) | | | | (0.03) | |
| | | |
| Net asset value, end of year | | | $11.68 | | | | $10.03 | | | | $9.47 | |
Total return3 | | | 17.25 | % | | | 8.60 | % | | | (5.02) | % |
| | | |
| Net assets, end of year (000s) | | | $264 | | | | $10 | | | | $10 | |
| | | |
| Ratios to average net assets: | | | | | | | | | | | | |
Gross expenses | | | 1.65 | % | | | 1.89 | % | | | 2.78 | %4 |
Net expenses5,6 | | | 1.33 | | | | 1.35 | | | | 1.20 | 4 |
Net investment income | | | 0.54 | | | | 1.11 | | | | 0.92 | 4 |
| | | |
| Portfolio turnover rate | | | 83 | % | | | 112 | % | | | 110 | %7 |
| 1 | Per share amounts have been calculated using the average shares method. |
| 2 | For the period November 3, 2014 (inception date) to September 30, 2015. |
| 3 | Performance figures may reflect compensating balance arrangements, fee waivers and/or expense reimbursements. In the absence of compensating balance arrangements, fee waivers and/or expense reimbursements, the total return would have been lower. Past performance is no guarantee of future results. Total returns for periods of less than one year are not annualized. |
| 5 | As a result of an expense limitation arrangement, the ratio of total annual fund operating expenses, other than interest, brokerage commissions, dividend expense on short sales, taxes, extraordinary expenses and acquired fund fees and expenses, to average net assets of Class R shares did not exceed 1.35%. This expense limitation arrangement cannot be terminated prior to December 31, 2018 without the Board of Trustees’ consent. |
| 6 | Reflects fee waivers and/or expense reimbursements. |
| 7 | Excludes securities received as a result of a contribution in-kind. |
See Notes to Financial Statements.
| | |
| Legg Mason BW Dynamic Large Cap Value Fund 2017 Annual Report | | 25 |
Financial highlights (cont’d)
| | | | | | | | | | | | |
For a share of each class of beneficial interest outstanding throughout each year ended September 30,
unless otherwise noted: | |
| Class I Shares1 | | 2017 | | | 2016 | | | 20152 | |
| | | |
| Net asset value, beginning of year | | | $10.05 | | | | $9.51 | | | | $10.00 | |
| | | |
| Income (loss) from operations: | | | | | | | | | | | | |
Net investment income | | | 0.15 | | | | 0.17 | | | | 0.15 | |
Net realized and unrealized gain (loss) | | | 1.66 | | | | 0.68 | | | | (0.60) | |
Total income (loss) from operations | | | 1.81 | | | | 0.85 | | | | (0.45) | |
| | | |
| Less distributions from: | | | | | | | | | | | | |
Net investment income | | | (0.14) | | | | (0.12) | | | | (0.04) | |
Net realized gains | | | — | | | | (0.19) | | | | — | |
Total distributions | | | (0.14) | | | | (0.31) | | | | (0.04) | |
| | | |
| Net asset value, end of year | | | $11.72 | | | | $10.05 | | | | $9.51 | |
Total return3 | | | 18.10 | % | | | 9.10 | % | | | (4.54) | % |
| | | |
| Net assets, end of year (000s) | | | $1,418 | | | | $1,187 | | | | $748 | |
| | | |
| Ratios to average net assets: | | | | | | | | | | | | |
Gross expenses | | | 1.00 | %4 | | | 1.19 | % | | | 2.02 | %5 |
Net expenses6,7 | | | 0.74 | 4 | | | 0.73 | | | | 0.73 | 5 |
Net investment income | | | 1.39 | | | | 1.73 | | | | 1.73 | 5 |
| | | |
| Portfolio turnover rate | | | 83 | % | | | 112 | % | | | 110 | %8 |
| 1 | Per share amounts have been calculated using the average shares method. |
| 2 | For the period November 3, 2014 (inception date) to September 30, 2015. |
| 3 | Performance figures may reflect compensating balance arrangements, fee waivers and/or expense reimbursements. In the absence of compensating balance arrangements, fee waivers and/or expense reimbursements, the total return would have been lower. Past performance is no guarantee of future results. Total returns for periods of less than one year are not annualized. |
| 4 | Reflects recapture of expenses waived/reimbursed from prior fiscal years. |
| 6 | As a result of an expense limitation arrangement, the ratio of total annual fund operating expenses, other than interest, brokerage commissions, dividend expense on short sales, taxes, extraordinary expenses and acquired fund fees and expenses, to average net assets of Class I shares did not exceed 0.75%. This expense limitation arrangement cannot be terminated prior to December 31, 2018 without the Board of Trustees’ consent. |
| 7 | Reflects fee waivers and/or expense reimbursements. |
| 8 | Excludes securities received as a result of a contribution in-kind. |
See Notes to Financial Statements.
| | |
| 26 | | Legg Mason BW Dynamic Large Cap Value Fund 2017 Annual Report |
| | | | | | | | | | | | |
For a share of each class of beneficial interest outstanding throughout each year ended September 30,
unless otherwise noted: | |
| Class IS Shares1 | | 2017 | | | 2016 | | | 20152 | |
| | | |
| Net asset value, beginning of year | | | $10.06 | | | | $9.50 | | | | $10.00 | |
| | | |
| Income (loss) from operations: | | | | | | | | | | | | |
Net investment income | | | 0.15 | | | | 0.17 | | | | 0.14 | |
Net realized and unrealized gain (loss) | | | 1.65 | | | | 0.70 | | | | (0.60) | |
Total income (loss) from operations | | | 1.80 | | | | 0.87 | | | | (0.46) | |
| | | |
| Less distributions from: | | | | | | | | | | | | |
Net investment income | | | (0.14) | | | | (0.12) | | | | (0.04) | |
Net realized gains | | | — | | | | (0.19) | | | | — | |
Total distributions | | | (0.14) | | | | (0.31) | | | | (0.04) | |
| | | |
| Net asset value, end of year | | | $11.72 | | | | $10.06 | | | | $9.50 | |
Total return3 | | | 18.07 | % | | | 9.34 | % | | | (4.60) | % |
| | | |
| Net assets, end of year (000s) | | | $146,197 | | | | $28,712 | | | | $15,281 | |
| | | |
| Ratios to average net assets: | | | | | | | | | | | | |
Gross expenses | | | 0.86 | %4 | | | 1.10 | % | | | 2.26 | %5 |
Net expenses6,7 | | | 0.65 | 4 | | | 0.65 | | | | 0.65 | 5 |
Net investment income | | | 1.42 | | | | 1.80 | | | | 1.53 | 5 |
| | | |
| Portfolio turnover rate | | | 83 | % | | | 112 | % | | | 110 | %8 |
| 1 | Per share amounts have been calculated using the average shares method. |
| 2 | For the period October 31, 2014 (inception date) to September 30, 2015. |
| 3 | Performance figures may reflect compensating balance arrangements, fee waivers and/or expense reimbursements. In the absence of compensating balance arrangements, fee waivers and/or expense reimbursements, the total return would have been lower. Past performance is no guarantee of future results. Total returns for periods of less than one year are not annualized. |
| 4 | Reflects recapture of expenses waived/reimbursed from prior fiscal years. |
| 6 | As a result of an expense limitation arrangement, the ratio of total annual fund operating expenses, other than interest, brokerage commissions, dividend expense on short sales, taxes, extraordinary expenses and acquired fund fees and expenses, to average net assets of Class IS shares did not exceed 0.65%. In addition, the ratio of total annual fund operating expenses for Class IS shares did not exceed the ratio of total annual fund operating expenses for Class I shares. These expense limitation arrangements cannot be terminated prior to December 31, 2018 without the Board of Trustees’ consent. |
| 7 | Reflects fee waivers and/or expense reimbursements. |
| 8 | Excludes securities received as a result of a contribution in-kind. |
See Notes to Financial Statements.
| | |
| Legg Mason BW Dynamic Large Cap Value Fund 2017 Annual Report | | 27 |
Notes to financial statements
1. Organization and significant accounting policies
Legg Mason BW Dynamic Large Cap Value Fund (the “Fund”) is a separate diversified investment series of Legg Mason Global Asset Management Trust (the “Trust”). The Trust, a Maryland statutory trust, is registered under the Investment Company Act of 1940, as amended (the “1940 Act”), as an open-end management investment company.
The following are significant accounting policies consistently followed by the Fund and are in conformity with U.S. generally accepted accounting principles (“GAAP”). Estimates and assumptions are required to be made regarding assets, liabilities and changes in net assets resulting from operations when financial statements are prepared. Changes in the economic environment, financial markets and any other parameters used in determining these estimates could cause actual results to differ. Subsequent events have been evaluated through the date the financial statements were issued.
(a) Investment valuation. Equity securities for which market quotations are available are valued at the last reported sales price or official closing price on the primary market or exchange on which they trade. The valuations for fixed income securities (which may include, but are not limited to, corporate, government, municipal, mortgage-backed, collateralized mortgage obligations and asset-backed securities) and certain derivative instruments are typically the prices supplied by independent third party pricing services, which may use market prices or broker/dealer quotations or a variety of valuation techniques and methodologies. The independent third party pricing services use inputs that are observable such as issuer details, interest rates, yield curves, prepayment speeds, credit risks/spreads, default rates and quoted prices for similar securities. Short-term fixed income securities that will mature in 60 days or less are valued at amortized cost, unless it is determined that using this method would not reflect an investment’s fair value. Investments in open-end funds are valued at the closing net asset value per share of each fund on the day of valuation. When the Fund holds securities or other assets that are denominated in a foreign currency, the Fund will normally use the currency exchange rates as of 4:00 p.m. (Eastern Time). If independent third party pricing services are unable to supply prices for a portfolio investment, or if the prices supplied are deemed by the manager to be unreliable, the market price may be determined by the manager using quotations from one or more broker/dealers or at the transaction price if the security has recently been purchased and no value has yet been obtained from a pricing service or pricing broker. When reliable prices are not readily available, such as when the value of a security has been significantly affected by events after the close of the exchange or market on which the security is principally traded, but before the Fund calculates its net asset value, the Fund values these securities as determined in accordance with procedures approved by the Fund’s Board of Trustees.
The Board of Trustees is responsible for the valuation process and has delegated the supervision of the daily valuation process to the Legg Mason North Atlantic Fund Valuation Committee (the “Valuation Committee”). The Valuation Committee, pursuant to the policies adopted by the Board of Trustees, is responsible for making fair value determinations,
| | |
| 28 | | Legg Mason BW Dynamic Large Cap Value Fund 2017 Annual Report |
evaluating the effectiveness of the Fund’s pricing policies, and reporting to the Board of Trustees. When determining the reliability of third party pricing information for investments owned by the Fund, the Valuation Committee, among other things, conducts due diligence reviews of pricing vendors, monitors the daily change in prices and reviews transactions among market participants.
The Valuation Committee will consider pricing methodologies it deems relevant and appropriate when making fair value determinations. Examples of possible methodologies include, but are not limited to, multiple of earnings; discount from market of a similar freely traded security; discounted cash-flow analysis; book value or a multiple thereof; risk premium/yield analysis; yield to maturity; and/or fundamental investment analysis. The Valuation Committee will also consider factors it deems relevant and appropriate in light of the facts and circumstances. Examples of possible factors include, but are not limited to, the type of security; the issuer’s financial statements; the purchase price of the security; the discount from market value of unrestricted securities of the same class at the time of purchase; analysts’ research and observations from financial institutions; information regarding any transactions or offers with respect to the security; the existence of merger proposals or tender offers affecting the security; the price and extent of public trading in similar securities of the issuer or comparable companies; and the existence of a shelf registration for restricted securities.
For each portfolio security that has been fair valued pursuant to the policies adopted by the Board of Trustees, the fair value price is compared against the last available and next available market quotations. The Valuation Committee reviews the results of such back testing monthly and fair valuation occurrences are reported to the Board of Trustees quarterly.
The Fund uses valuation techniques to measure fair value that are consistent with the market approach and/or income approach, depending on the type of security and the particular circumstance. The market approach uses prices and other relevant information generated by market transactions involving identical or comparable securities. The income approach uses valuation techniques to discount estimated future cash flows to present value.
GAAP establishes a disclosure hierarchy that categorizes the inputs to valuation techniques used to value assets and liabilities at measurement date. These inputs are summarized in the three broad levels listed below:
| • | | Level 1 — quoted prices in active markets for identical investments |
| • | | Level 2 — other significant observable inputs (including quoted prices for similar investments, interest rates, prepayment speeds, credit risk, etc.) |
| • | | Level 3 — significant unobservable inputs (including the Fund’s own assumptions in determining the fair value of investments) |
The inputs or methodologies used to value securities are not necessarily an indication of the risk associated with investing in those securities.
| | |
| Legg Mason BW Dynamic Large Cap Value Fund 2017 Annual Report | | 29 |
Notes to financial statements (cont’d)
The following is a summary of the inputs used in valuing the Fund’s assets carried at fair value:
| | | | | | | | | | | | | | | | |
| ASSETS | |
| Description | | Quoted Prices
(Level 1) | | | Other Significant
Observable Inputs
(Level 2) | | | Significant
Unobservable
Inputs
(Level 3) | | | Total | |
| Long-term investments†: | | | | | | | | | | | | | | | | |
Common stocks | | $ | 151,008,262 | | | | — | | | | — | | | $ | 151,008,262 | |
Investments in underlying funds | | | 1,503,892 | | | | — | | | | — | | | | 1,503,892 | |
| Total long-term investments | | | 152,512,154 | | | | — | | | | — | | | | 152,512,154 | |
| Short-term investments† | | | 1,342,492 | | | | — | | | | — | | | | 1,342,492 | |
| Total investments | | $ | 153,854,646 | | | | — | | | | — | | | $ | 153,854,646 | |
| † | See Schedule of Investments for additional detailed categorizations. |
(b) Security transactions and investment income. Security transactions are accounted for on a trade date basis. Interest income (including interest income from payment-in-kind securities), adjusted for amortization of premium and accretion of discount, is recorded on the accrual basis. Dividend income is recorded on the ex-dividend date for dividends received in cash and/or securities. Foreign dividend income is recorded on the ex-dividend date or as soon as practicable after the Fund determines the existence of a dividend declaration after exercising reasonable due diligence. The cost of investments sold is determined by use of the specific identification method. To the extent any issuer defaults or a credit event occurs that impacts the issuer, the Fund may halt any additional interest income accruals and consider the realizability of interest accrued up to the date of default or credit event.
(c) Distributions to shareholders. Distributions from net investment income and distributions of net realized gains, if any, are declared at least annually. Distributions to shareholders of the Fund are recorded on the ex-dividend date and are determined in accordance with income tax regulations, which may differ from GAAP.
(d) Share class accounting. Investment income, common expenses and realized/unrealized gains (losses) on investments are allocated to the various classes of the Fund on the basis of daily net assets of each class. Fees relating to a specific class are charged directly to that share class.
(e) Compensating balance arrangements. The Fund has an arrangement with its custodian bank whereby a portion of the custodian’s fees is paid indirectly by credits earned on the Fund’s cash on deposit with the bank.
(f) Federal and other taxes. It is the Fund’s policy to comply with the federal income and excise tax requirements of the Internal Revenue Code of 1986 (the “Code”), as amended, applicable to regulated investment companies. Accordingly, the Fund intends to distribute its taxable income and net realized gains, if any, to shareholders in accordance
| | |
| 30 | | Legg Mason BW Dynamic Large Cap Value Fund 2017 Annual Report |
with timing requirements imposed by the Code. Therefore, no federal or state income tax provision is required in the Fund’s financial statements.
Management has analyzed the Fund’s tax positions taken on income tax returns for all open tax years and has concluded that as of September 30, 2017, no provision for income tax is required in the Fund’s financial statements. The Fund’s federal and state income and federal excise tax returns for tax years for which the applicable statutes of limitations have not expired are subject to examination by the Internal Revenue Service and state departments of revenue.
Under the applicable foreign tax laws, a withholding tax may be imposed on interest, dividends and capital gains at various rates.
(g) Reclassification. GAAP requires that certain components of net assets be reclassified to reflect permanent differences between financial and tax reporting. These reclassifications have no effect on net assets or net asset value per share. During the current year, the following reclassifications have been made:
| | | | | | | | |
| | | Undistributed Net
Investment Income | | | Accumulated Net
Realized Gain | |
| (a) | | $ | (250) | | | $ | 250 | |
| (a) | Reclassifications are due to book/tax differences in the treatment of partnership investments. |
2. Investment management agreement and other transactions with affiliates
Legg Mason Partners Fund Advisor, LLC (“LMPFA”) is the Fund’s investment manager and Brandywine Global Investment Management, LLC (“Brandywine Global”) is the Fund’s subadviser. LMPFA and Brandywine Global are wholly-owned subsidiaries of Legg Mason, Inc. (“Legg Mason”).
Under the investment management agreement, the Fund pays an investment management fee, calculated daily and paid monthly, at an annual rate of 0.55% of the Fund’s average daily net assets.
LMPFA provides administrative and certain oversight services to the Fund. LMPFA delegates to the subadviser the day-to-day portfolio management of the Fund. LMPFA pays Brandywine Global monthly 90% of the net management fee it receives from the Fund.
As a result of expense limitation arrangements between the Fund and LMPFA, the ratio of total annual fund operating expenses, other than interest, brokerage commissions, dividend expense on short sales, taxes, extraordinary expenses and acquired fund fees and expenses, to average net assets of Class A, Class C, Class R, Class I and Class IS shares did not exceed 1.10%, 1.85%, 1.35%, 0.75% and 0.65%, respectively. In addition, the ratio of total annual fund operating expenses for Class IS shares did not exceed the ratio of total annual fund operating expenses for Class I shares. These expense limitation arrangements cannot be terminated prior to December 31, 2018 without the Board of Trustees’ consent.
During the year ended September 30, 2017, fees waived and/or expenses reimbursed amounted to $139,193.
| | |
| Legg Mason BW Dynamic Large Cap Value Fund 2017 Annual Report | | 31 |
Notes to financial statements (cont’d)
LMPFA is permitted to recapture amounts waived and/or reimbursed to a class within three years after the fiscal year in which LMPFA earned the fee or incurred the expense if the class’ total annual operating expenses have fallen to a level below the expense limitation (“expense cap”) in effect at the time the fees were earned or the expenses incurred. In no case will LMPFA recapture any amount that would result, on any particular business day of the Fund, in the class’ total annual operating expenses exceeding the expense cap or any other lower limit then in effect.
Pursuant to these arrangements, at September 30, 2017, the Fund had remaining fee waivers and/or expense reimbursements subject to recapture by LMPFA and respective dates of expiration as follows:
| | | | | | | | | | | | | | | | | | | | |
| | | Class A | | | Class C | | | Class R | | | Class I | | | Class IS | |
| Expires September 30, 2018 | | $ | 2,606 | | | $ | 1,080 | | | $ | 148 | | | $ | 1,351 | | | $ | 260,020 | |
| Expires September 30, 2019 | | | 7,737 | | | | 2,820 | | | | 54 | | | | 4,852 | | | | 109,435 | |
| Expires September 30, 2020 | | | 13,806 | | | | 1,590 | | | | 278 | | | | 3,201 | | | | 120,318 | |
| Total fee waivers/expense reimbursements subject to recapture | | $ | 24,149 | | | $ | 5,490 | | | $ | 480 | | | $ | 9,404 | | | $ | 489,773 | |
For the year ended September 30, 2017, LMPFA recaptured $119, $36, $35 and $742 for Class A, C, I and IS shares, respectively.
Legg Mason Investor Services, LLC (‘‘LMIS’’), a wholly-owned broker-dealer subsidiary of Legg Mason, serves as the Fund’s sole and exclusive distributor.
There is a maximum initial sales charge of 5.75% for Class A shares. There is a contingent deferred sales charge (“CDSC”) of 1.00% on Class C shares, which applies if redemption occurs within 12 months from purchase payment. In certain cases, Class A shares have a 1.00% CDSC, which applies if redemption occurs within 18 months from purchase payment. This CDSC only applies to those purchases of Class A shares, which, when combined with current holdings of other shares of funds sold by LMIS, equal or exceed $1,000,000 in the aggregate. These purchases do not incur an initial sales charge.
For the year ended September 30, 2017, LMIS and its affiliates retained sales charges of $1,312 on sales of the Fund’s Class A shares. In addition, for the year ended September 30, 2017, CDSCs paid to LMIS and its affiliates were:
| | | | | | | | |
| | | Class A | | | Class C | |
| CDSCs | | | — | | | $ | 50 | |
Under a Deferred Compensation Plan (the “Plan”), Trustees may have elected to defer receipt of all or a specified portion of their compensation. A participating Trustee selected one or more funds managed by affiliates of Legg Mason in which his or her deferred trustee’s fees were deemed to be invested. Deferred amounts remain in the Fund until distributed in accordance with the Plan. In May 2015, the Board of Trustees approved an amendment to the Plan so that effective January 1, 2016, no compensation earned after that date may be deferred under the Plan.
| | |
| 32 | | Legg Mason BW Dynamic Large Cap Value Fund 2017 Annual Report |
All officers and one Trustee of the Trust are employees of Legg Mason or its affiliates and do not receive compensation from the Trust.
As of September 30, 2017, Legg Mason and its affiliates owned 70% of the Fund.
3. Investments
During the year ended September 30, 2017, the aggregate cost of purchases and proceeds from sales of investments (excluding short-term investments) were as follows:
| | | | |
| Purchases | | $ | 158,624,943 | |
| Sales | | | 53,611,907 | |
At September 30, 2017, the aggregate cost of investments and the aggregate gross unrealized appreciation and depreciation of investments for federal income tax purposes were as follows:
| | | | | | | | | | | | | | | | |
| | | Cost | | | Gross
Unrealized
Appreciation | | | Gross
Unrealized
Depreciation | | | Net
Unrealized
Appreciation | |
| Securities | | $ | 143,779,436 | | | $ | 11,178,473 | | | $ | (1,103,263) | | | $ | 10,075,210 | |
4. Derivative instruments and hedging activities
During the year ended September 30, 2017, the Fund did not invest in derivative instruments.
5. Class specific expenses, waivers and/or expense reimbursements
The Fund has adopted a Rule 12b-1 shareholder services and distribution plan and under that plan the Fund pays service and/or distribution fees with respect to its Class A, Class C and Class R shares calculated at the annual rate of 0.25%, 1.00% and 0.50% of the average daily net assets of each class, respectively. Service and/or distribution fees are accrued daily and paid monthly.
For the year ended September 30, 2017, class specific expenses were as follows:
| | | | | | | | |
| | | Service and/or
Distribution Fees | | | Transfer Agent
Fees | |
| Class A | | $ | 12,462 | | | $ | 9,400 | |
| Class C | | | 7,174 | | | | 707 | |
| Class R | | | 437 | | | | 295 | |
| Class I | | | — | | | | 1,113 | |
| Class IS | | | — | | | | 1,613 | |
| Total | | $ | 20,073 | | | $ | 13,128 | |
For the year ended September 30, 2017, waivers and/or expense reimbursements by class were as follows:
| | | | |
| | | Waivers/Expense
Reimbursements | |
| Class A | | $ | 13,806 | |
| Class C | | | 1,590 | |
| Class R | | | 278 | |
| Class I | | | 3,201 | |
| Class IS | | | 120,318 | |
| Total | | $ | 139,193 | |
| | |
| Legg Mason BW Dynamic Large Cap Value Fund 2017 Annual Report | | 33 |
Notes to financial statements (cont’d)
6. Distributions to shareholders by class
| | | | | | | | |
| | | Year Ended
September 30, 2017 | | | Year Ended
September 30, 2016 | |
| Net Investment Income: | | | | | | | | |
| Class A | | $ | 67,575 | | | $ | 5,512 | |
| Class C | | | 2,182 | | | | 5,057 | |
| Class R | | | 76 | | | | 58 | |
| Class I | | | 15,835 | | | | 11,838 | |
| Class IS | | | 474,332 | | | | 302,536 | |
| Total | | $ | 560,000 | | | $ | 325,001 | |
| | |
| Net Realized Gains: | | | | | | | | |
| Class A | | | — | | | $ | 9,815 | |
| Class C | | | — | | | | 10,208 | |
| Class R | | | — | | | | 191 | |
| Class I | | | — | | | | 17,970 | |
| Class IS | | | — | | | | 410,150 | |
| Total | | | — | | | $ | 448,334 | |
7. Shares of beneficial interest
At September 30, 2017, the Trust had an unlimited number of shares of beneficial interest authorized with a par value of $0.00001 per share. The Fund has the ability to issue multiple classes of shares. Each class of shares represents an identical interest and has the same rights, except that each class bears certain direct expenses, including those specifically related to the distribution of its shares.
Transactions in shares of each class were as follows:
| | | | | | | | | | | | | | | | |
| | | Year Ended
September 30, 2017 | | | Year Ended
September 30, 2016 | |
| | | Shares | | | Amount | | | Shares | | | Amount | |
| Class A | | | | | | | | | | | | | | | | |
| Shares sold | | | 150,136 | | | $ | 1,601,113 | | | | 451,357 | | | $ | 4,380,854 | |
| Shares issued on reinvestment | | | 6,356 | | | | 67,562 | | | | 1,570 | | | | 15,327 | |
| Shares repurchased | | | (142,543) | | | | (1,530,897) | | | | (50,567) | | | | (479,166) | |
| Net increase | | | 13,949 | | | $ | 137,778 | | | | 402,360 | | | $ | 3,917,015 | |
| | | | |
| Class C | | | | | | | | | | | | | | | | |
| Shares sold | | | 1,218 | | | $ | 13,115 | | | | 39,717 | | | $ | 377,725 | |
| Shares issued on reinvestment | | | 163 | | | | 1,724 | | | | 1,360 | | | | 13,202 | |
| Shares repurchased | | | (17,552) | | | | (181,378) | | | | (244) | | | | (2,413) | |
| Net increase (decrease) | | | (16,171) | | | $ | (166,539) | | | | 40,833 | | | $ | 388,514 | |
| | | | |
| Class R | | | | | | | | | | | | | | | | |
| Shares sold | | | 21,570 | | | $ | 235,479 | | | | — | | | | — | |
| Shares issued on reinvestment | | | 7 | | | | 76 | | | | 25 | | | $ | 249 | |
| Shares repurchased | | | (2) | | | | (22) | | | | — | | | | — | |
| Net increase | | | 21,575 | | | $ | 235,533 | | | | 25 | | | $ | 249 | |
| | |
| 34 | | Legg Mason BW Dynamic Large Cap Value Fund 2017 Annual Report |
| | | | | | | | | | | | | | | | |
| | | Year Ended
September 30, 2017 | | | Year Ended
September 30, 2016 | |
| | | Shares | | | Amount | | | Shares | | | Amount | |
| Class I | | | | | | | | | | | | | | | | |
| Shares sold | | | 27,063 | | | $ | 294,306 | | | | 54,645 | | | $ | 524,392 | |
| Shares issued on reinvestment | | | 1,488 | | | | 15,835 | | | | 3,055 | | | | 29,808 | |
| Shares repurchased | | | (25,610) | | | | (272,602) | | | | (18,273) | | | | (173,377) | |
| Net increase | | | 2,941 | | | $ | 37,539 | | | | 39,427 | | | $ | 380,823 | |
| | | | |
| Class IS | | | | | | | | | | | | | | | | |
| Shares sold | | | 9,884,594 | | | $ | 108,475,828 | | | | 1,909,725 | | | $ | 18,657,657 | |
| Shares issued on reinvestment | | | 44,133 | | | | 469,575 | | | | 72,059 | | | | 702,272 | |
| Shares repurchased | | | (309,333) | | | | (3,417,144) | | | | (734,828) | | | | (6,722,714) | |
| Net increase | | | 9,619,394 | | | $ | 105,528,259 | | | | 1,246,956 | | | $ | 12,637,215 | |
8. Income tax information and distributions to shareholders
The tax character of distributions paid during the fiscal years ended September 30, was as follows:
| | | | | | | | |
| | | 2017 | | | 2016 | |
| Distributions paid from: | | | | | | | | |
| Ordinary income | | $ | 560,000 | | | $ | 773,335 | |
As of September 30, 2017, the components of accumulated earnings (losses) on a tax basis were as follows:
| | | | |
| Undistributed ordinary income — net | | $ | 2,246,911 | |
| Undistributed long-term capital gains — net | | | 1,178,683 | |
| Total undistributed earnings | | | 3,425,594 | |
| Other book/tax temporary differences(a) | | | (48,098) | |
| Unrealized appreciation (depreciation)(b) | | | 10,075,210 | |
| Total accumulated earnings (losses) — net | | $ | 13,452,706 | |
| (a) | Other book/tax temporary differences are attributable to book/tax differences in the timing of the deductibility of various expenses. |
| (b) | The difference between book-basis and tax-basis unrealized appreciation (depreciation) is attributable to the tax deferral of losses on wash sales and book/tax basis differences on partnership investments. |
9. Recent accounting pronouncement
In October 2016, the U.S. Securities and Exchange Commission adopted new rules and amended existing rules (together, the “final rules”) intended to modernize the reporting and disclosure of information by registered investment companies. In part, the final rules amend Regulation S-X and require standardized, enhanced disclosure about derivatives in investment company financial statements, as well as other amendments. The compliance date for the amendments to Regulation S-X was August 1, 2017. The Fund has adopted the amendments to Regulation S-X and, upon evaluation, has concluded that the amendments do not materially impact the financial statement amounts; however, as required, additional or enhanced disclosure has been included.
| | |
| Legg Mason BW Dynamic Large Cap Value Fund 2017 Annual Report | | 35 |
Notes to financial statements (cont’d)
10. Subsequent event
On November 2, 2017, the Fund announced that effective December 29, 2017, the Fund will be renamed BrandywineGLOBAL — Dynamic US Large Cap Value Fund. The change to the Fund’s name is being effected as part of a rebranding of Legg Mason funds subadvised by Brandywine Global. LMPFA continues to serve as the investment manager to the Fund, and Brandywine Global continues to serve as subadviser. Additionally, effective December 29, 2017, the Fund normally invests at least 80% of its net assets, plus the amount of borrowings for investment purposes, if any, in issuers domiciled, or having their principal activities, in the United States, at the time of investment or other instruments with similar economic characteristics. In addition, the Fund normally invests at least 80% of its net assets in equity securities of large capitalization companies. The Fund’s 80% investment policies may be changed by the Board of Trustees upon 60 days’ prior notice to shareholders. Neither the name change nor the adoption of the new investment policy is anticipated to materially change the manner in which the Fund is currently managed.
| | |
| 36 | | Legg Mason BW Dynamic Large Cap Value Fund 2017 Annual Report |
Report of independent registered public
accounting firm
To the Board of Trustees of Legg Mason Global Asset Management Trust and Shareholders of the Legg Mason BW Dynamic Large Cap Value Fund
In our opinion, the accompanying statement of assets and liabilities, including the schedule of investments, and the related statements of operations and of changes in net assets and the financial highlights present fairly, in all material respects, the financial position of the Legg Mason BW Dynamic Large Cap Value Fund (the “Fund”), a series of Legg Mason Global Asset Management Trust, as of September 30, 2017, the results of its operations for the year then ended, the changes in its net assets for each of the two years in the period then ended and the financial highlights for each of the periods indicated therein, in conformity with accounting principles generally accepted in the United States of America. These financial statements and financial highlights (hereafter referred to as “financial statements”) are the responsibility of the Fund’s management. Our responsibility is to express an opinion on these financial statements based on our audits. We conducted our audits of these financial statements in accordance with the standards of the Public Company Accounting Oversight Board (United States). Those standards require that we plan and perform the audit to obtain reasonable assurance about whether the financial statements are free of material misstatement. An audit includes examining, on a test basis, evidence supporting the amounts and disclosures in the financial statements, assessing the accounting principles used and significant estimates made by management, and evaluating the overall financial statement presentation. We believe that our audits, which included confirmation of securities as of September 30, 2017 by correspondence with the custodian and brokers, provide a reasonable basis for our opinion.
/s/PricewaterhouseCoopers LLP
Baltimore, Maryland
November 21, 2017
| | |
| Legg Mason BW Dynamic Large Cap Value Fund 2017 Annual Report | | 37 |
Additional information (unaudited)
Information about Trustees and Officers
The business and affairs of Legg Mason BW Dynamic Large Cap Value Fund (the “Fund”) are conducted by management under the supervision and subject to the direction of its Board of Trustees. The business address of each Trustee is c/o Jane Trust, Legg Mason, 100 International Drive, 11th Floor, Baltimore, Maryland 21202. Information pertaining to the Trustees and officers of the Fund is set forth below.
The Statement of Additional Information includes additional information about Trustees and is available, without charge, upon request by calling the Fund at 1-877-721-1926.
| | |
| Independent Trustees† |
| Ruby P. Hearn |
| Year of birth | | 1940 |
| Position(s) with Trust | | Trustee |
| Term of office1 and length of time served2 | | Since 2004 |
| Principal occupation(s) during past five years | | Senior Vice President Emerita of The Robert Wood Johnson Foundation (non-profit) since 2001; Member of the Institute of Medicine since 1982; formerly, Trustee of the New York Academy of Medicine (2004 to 2012); Director of the Institute for Healthcare Improvement (2002 to 2012); Senior Vice President of The Robert Wood Johnson Foundation (1996 to 2001); Fellow of The Yale Corporation (1992 to 1998) |
| Number of funds in fund complex overseen by Trustee | | 18 |
| Other board memberships held by Trustee during past five years | | None |
|
| Arnold L. Lehman |
| Year of birth | | 1944 |
| Position(s) with Trust | | Trustee and Chairman |
| Term of office1 and length of time served2 | | Since 1982 and since 2015 |
| Principal occupation(s) during past five years | | Senior Advisor, Phillips Auctioneer since 2015; Trustee of American Federation of Arts since 1998; formerly, Fellow, Ford Foundation (2015 to 2016); Director of the Brooklyn Museum (1997 to 2015); Director of The Baltimore Museum of Art (1979 to 1997) |
| Number of funds in fund complex overseen by Trustee | | 18 |
| Other board memberships held by Trustee during past five years | | None |
|
| Robin J.W. Masters |
| Year of birth | | 1955 |
| Position(s) with Trust | | Trustee |
| Term of office1 and length of time served2 | | Since 2002 |
| Principal occupation(s) during past five years | | Retired; formerly, Chief Investment Officer of ACE Limited (insurance) (1986 to 2000) |
| Number of funds in fund complex overseen by Trustee | | 18 |
| Other board memberships held by Trustee during past five years | | Director of Cheyne Capital International Limited (investment advisory firm); formerly, Director/Trustee of Legg Mason Institutional Funds plc, WA Fixed Income Funds plc and Western Asset Debt Securities Fund plc. (2007 to 2011) |
| | |
| 38 | | Legg Mason BW Dynamic Large Cap Value Fund |
| | |
| Independent Trustees† cont’d |
| Jill E. McGovern |
| Year of birth | | 1944 |
| Position(s) with Trust | | Trustee |
| Term of office1 and length of time served2 | | Since 1989 |
| Principal occupation(s) during past five years | | Senior Consultant, American Institute for Contemporary German Studies (AICGS) since 2007; formerly, Chief Executive Officer of The Marrow Foundation (non-profit) (1993 to 2007); Executive Director of the Baltimore International Festival (1991 to 1993); Senior Assistant to the President of The Johns Hopkins University (1986 to 1990) |
| Number of funds in fund complex overseen by Trustee | | 18 |
| Other board memberships held by Trustee during past five years | | Director of International Biomedical Research Alliance; Director of Lois Roth Endowment |
|
| Arthur S. Mehlman |
| Year of birth | | 1942 |
| Position(s) with Trust | | Trustee |
| Term of office1 and length of time served2 | | Since 2002 |
| Principal occupation(s) during past five years | | Retired. Director, The University of Maryland Foundation since 1992; Director, The League for People with Disabilities since 2003; formerly, Director, Municipal Mortgage & Equity LLC (2004 to 2011); Partner, KPMG LLP (international accounting firm) (1972 to 2002) |
| Number of funds in fund complex overseen by Trustee | | Director/Trustee of all Legg Mason Funds consisting of 18 portfolios; Director/Trustee of the Royce Family of Funds consisting of 22 portfolios |
| Other board memberships held by Trustee during past five years | | Director of Municipal Mortgage & Equity, LLC. (2004 to 2011) |
|
| G. Peter O’Brien |
| Year of birth | | 1945 |
| Position(s) with Trust | | Trustee |
| Term of office1 and length of time served2 | | Since 1999 |
| Principal occupation(s) during past five years | | Retired. Trustee Emeritus of Colgate University; Board Member, Hill House, Inc. (residential home care); Board Member, Bridges School (pre- school); formerly, Managing Director, Equity Capital Markets Group of Merrill Lynch & Co. (1971 to 1999) |
| Number of funds in fund complex overseen by Trustee | | Director/Trustee of all Legg Mason funds consisting of 18 portfolios; Director/Trustee of the Royce Family of Funds consisting of 22 portfolios |
| Other board memberships held by Trustee during past five years | | Director of TICC Capital Corp. (2003 to 2017) |
| | |
| Legg Mason BW Dynamic Large Cap Value Fund | | 39 |
Additional information (unaudited) (cont’d)
Information about Trustees and Officers
| | |
| Independent Trustees† cont’d |
| S. Ford Rowan |
| Year of birth | | 1943 |
| Position(s) with Trust | | Trustee |
| Term of office1 and length of time served2 | | Since 2002 |
| Principal occupation(s) during past five years | | Chairman, National Center for Critical Incident Analysis, since 2004; Consultant to University of Maryland University College, since 2013; formerly, Lecturer in Organizational Sciences, George Washington University (2000 to 2014); Trustee, St. John’s College (2006 to 2012); Consultant, Rowan & Blewitt Inc. (management consulting) (1984 to 2007); Lecturer in Journalism, Northwestern University (1980 to 1993); Director, Santa Fe Institute (1999 to 2008) |
| Number of funds in fund complex overseen by Trustee | | 18 |
| Other board memberships held by Trustee during past five years | | None |
|
| Robert M. Tarola |
| Year of birth | | 1950 |
| Position(s) with Trust | | Trustee |
| Term of office1 and length of time served2 | | Since 2004 |
| Principal occupation(s) during past five years | | President of Rights Advisory LLC (corporate finance and governance consulting) since 2008; Member, Investor Advisory Group of the Public Company Accounting Oversight Board since 2009; formerly, Executive Vice President and Chief Financial Officer, Southcoast Health System, Inc. (healthcare provider network) (2015 to 2017); Senior Vice President and Chief Financial Officer of The Howard University (2009 to 2013) (higher education and health care); Senior Vice President and Chief Financial Officer of W.R. Grace & Co. (specialty chemicals) (1999 to 2008) and MedStar Health, Inc. (healthcare) (1996 to 1999); Partner, Price Waterhouse, LLP (accounting and auditing) (1984 to 1996) |
| Number of funds in fund complex overseen by Trustee | | 18 |
| Other board memberships held by Trustee during past five years | | Director of American Kidney Fund (renal disease assistance); Director of XBRL International, Inc. (global data standard setting); Director of Vista Outdoor, Inc. (consumer outdoor recreation brands); formerly, Director of TeleTech Holdings, Inc. (business processing outsourcing) |
| | |
| | |
| 40 | | Legg Mason BW Dynamic Large Cap Value Fund |
| | |
| Interested Trustee |
| Jane Trust3 | | |
| Year of birth | | 1962 |
| Position(s) with Trust | | Trustee, President and Chief Executive Officer |
| Term of office1 and length of time served2 | | Since 2015 |
| Principal occupation(s) during past five years | | Managing Director of Legg Mason & Co., LLC (“Legg Mason & Co.”) (since 2016); Officer and/or Trustee/Director of 150 funds associated with Legg Mason Partners Fund Advisor, LLC (“LMPFA”) or its affiliates (since 2015); President and Chief Executive Officer of LMPFA (since 2015); formerly, Senior Vice President of LMPFA (2015); Director of ClearBridge, LLC (formerly, Legg Mason Capital Management, LLC) (2007 to 2014); Managing Director of Legg Mason Investment Counsel & Trust Co. (2000 to 2007) |
| Number of funds in fund complex overseen by Trustee | | 143 |
Other board memberships held by Trustee during past
five years | | None |
| | |
| Executive Officers |
Richard F. Sennett Legg Mason 100 International Drive, 7th Floor, Baltimore, MD 21202 | | |
| Year of birth | | 1970 |
| Position(s) with Trust | | Principal Financial Officer |
| Term of office1 and length of time served2 | | Since 2011 |
| Principal occupation(s) during past five years | | Principal Financial Officer and Treasurer of certain mutual funds associated with Legg Mason & Co. or its affiliates (since 2011 and since 2013); Managing Director of Legg Mason & Co. and Senior Manager of the Treasury Policy group for Legg Mason & Co.’s Global Fiduciary Platform (since 2011); formerly, Chief Accountant within the SEC’s Division of Investment Management (2007 to 2011); Assistant Chief Accountant within the SEC’s Division of Investment Management (2002 to 2007) |
| |
Robert I. Frenkel Legg Mason 100 First Stamford Place, 6th Floor, Stamford, CT 06902 | | |
| Year of birth | | 1954 |
| Position(s) with Trust | | Secretary and Chief Legal Officer |
| Term of office1 and length of time served2 | | Since 2007 |
| Principal occupation(s) during past five years | | Vice President and Deputy General Counsel of Legg Mason (since 2006); Managing Director and General Counsel of — U.S. Mutual Funds for Legg Mason & Co. (since 2006) and Legg Mason & Co. predecessors (since 1994); Secretary and Chief Legal Officer of certain mutual funds associated with Legg Mason & Co. or its affiliates (since 2006) and Legg Mason & Co. predecessors (prior to 2006) |
| | |
| Legg Mason BW Dynamic Large Cap Value Fund | | 41 |
Additional information (unaudited) (cont’d)
Information about Trustees and Officers
| | |
| Executive Officers cont’d |
Ted P. Becker
Legg Mason 620 Eighth Avenue, 49th Floor, New York, NY 10018 | | |
| Year of birth | | 1951 |
| Position(s) with Trust | | Vice President and Chief Compliance Officer |
| Term of office1 and length of time served2 | | Since 2007 |
| Principal occupation(s) during past five years | | Director of Global Compliance at Legg Mason (since 2006); Chief Compliance Officer of LMPFA (since 2006); Managing Director of Compliance of Legg Mason & Co. (since 2005); Chief Compliance Officer of certain mutual funds associated with Legg Mason & Co. or its affiliates (since 2006) and Legg Mason & Co. predecessors (prior to 2006) |
| |
Christopher Berarducci Legg Mason 620 Eighth Avenue, 49th Floor, New York, NY 10018 | | |
| Year of birth | | 1974 |
| Position(s) with Trust | | Treasurer |
| Term of office1 and length of time served2 | | Since 2010 |
| Principal occupation(s) during past five years | | Director of Legg Mason & Co. (since 2015); Treasurer of certain mutual funds associated with Legg Mason & Co. or its affiliates (since 2010); formerly, Vice President of Legg Mason & Co. (2011 to 2015); Assistant Controller of certain mutual funds associated with Legg Mason & Co. or its affiliates (prior to 2010) |
| |
Susan Kerr Legg Mason 620 Eighth Avenue, 49th Floor, New York, NY 10018 | | |
| Year of birth | | 1949 |
| Position(s) with Trust | | Chief Anti-Money Laundering Compliance Officer |
| Term of office1 and length of time served2 | | Since 2013 |
| Principal occupation(s) during past five years | | Assistant Vice President of Legg Mason & Co. and Legg Mason Investor Services, LLC (“LMIS”) (since 2010); Chief Anti-Money Laundering Compliance Officer of certain mutual funds associated with Legg Mason & Co. or its affiliates (since 2013) and Anti-Money Laundering Compliance Officer of LMIS (since 2012); Senior Compliance Officer of LMIS (since 2011); formerly, AML Consultant, DTCC (2010); AML Consultant, Rabobank Netherlands, (2009); First Vice President, Director of Marketing & Advertising Compliance and Manager of Communications Review Group at Citigroup Inc. (1996 to 2008) |
| | |
| 42 | | Legg Mason BW Dynamic Large Cap Value Fund |
| | |
| Executive Officers cont’d |
Jenna Bailey Legg Mason 100 First Stamford Place, 6th Floor, Stamford, CT 06902 | | |
| Year of birth | | 1978 |
| Position(s) with Trust | | Identity Theft Prevention Officer |
| Term of office1 and length of time served2 | | Since 2015 |
| Principal occupation(s) during past five years | | Identity Theft Prevention Officer of certain mutual funds associated with Legg Mason & Co. or its affiliates (since 2015); Compliance Officer of Legg Mason & Co. (since 2013); Assistant Vice President of Legg Mason & Co. (since 2011); formerly, Associate Compliance Officer of Legg Mason & Co. (2011 to 2013) |
Jeanne M. Kelly Legg Mason 620 Eighth Avenue, 49th Floor, New York, NY 10018 | | |
| Year of birth | | 1951 |
| Position(s) with Trust | | Senior Vice President |
| Term of office1 and length of time served2 | | Since 2007 |
| Principal occupation(s) during past five years | | Senior Vice President of certain mutual funds associated with Legg Mason & Co. or its affiliates (since 2007); Senior Vice President of LMPFA (since 2006); President and Chief Executive Officer of LMAS and LMFAM (since 2015); Managing Director of Legg Mason & Co. (since 2005) and Legg Mason & Co. predecessors (prior to 2005); formerly, Senior Vice President of LMFAM (2013 to 2015) |
| † | Trustees who are not “interested persons” of the Fund within the meaning of Section 2(a)(19) of the Investment Company Act of 1940, as amended (the “1940 Act”). Each of the Independent Trustees serves on the standing committees of the Board of Trustees, which include the Audit Committee (chair: Arthur S. Mehlman), the Nominating Committee (co-chairs: G. Peter O’Brien and Jill E. McGovern), and the Independent Trustees Committee (chair: Arnold L. Lehman). |
| 1 | Each Trustee and officer serves until his or her respective successor has been duly elected and qualified or until his or her earlier death, resignation, retirement or removal. |
| 2 | Indicates the earliest year in which the Trustee became a board member for a fund in the Legg Mason fund complex or the officer took such office. |
| 3 | Ms. Trust is an “interested person” of the Fund, as defined in the 1940 Act, because of her position with LMPFA and/or certain of its affiliates. |
| | |
| Legg Mason BW Dynamic Large Cap Value Fund | | 43 |
Important tax information (unaudited)
The following information is provided with respect to the distributions paid during the taxable year ended September 30, 2017:
| | | | |
| Record date: | | | 12/20/2016 | |
| Payable date: | | | 12/21/2016 | |
| Ordinary income: | | | | |
Qualified dividend income for individuals | | | 100.00 | % |
Dividends qualifying for the dividends | | | | |
received deduction for corporations | | | 100.00 | % |
Please retain this information for your records.
| | |
| 44 | | Legg Mason BW Dynamic Large Cap Value Fund |
Legg Mason BW
Dynamic Large Cap Value Fund
Trustees
Ruby P. Hearn
Arnold L. Lehman
Chairman
Robin J.W. Masters
Jill E. McGovern
Arthur S. Mehlman
G. Peter O’Brien
S. Ford Rowan
Robert M. Tarola
Jane Trust
Investment manager
Legg Mason Partners Fund Advisor, LLC
Subadviser
Brandywine Global Investment Management, LLC
Distributor
Legg Mason Investor Services, LLC
Custodian
State Street Bank and Trust Company
Transfer agent
BNY Mellon Investment
Servicing (US) Inc.
4400 Computer Drive
Westborough, MA 01581
Independent registered public accounting firm
PricewaterhouseCoopers LLP
Baltimore, MD
Legg Mason BW Dynamic Large Cap Value Fund
The Fund is a separate investment series of Legg Mason Global Asset Management Trust, a Maryland statutory trust.
Legg Mason BW Dynamic Large Cap Value Fund
Legg Mason Funds
620 Eighth Avenue, 49th Floor
New York, NY 10018
The Fund files its complete schedule of portfolio holdings with the Securities and Exchange Commission (“SEC”) for the first and third quarters of each fiscal year on Form N-Q. The Fund’s Forms N-Q are available on the SEC’s website at www.sec.gov. The Fund’s Forms N-Q may be reviewed and copied at the SEC’s Public Reference Room in Washington, D.C., and information on the operation of the Public Reference Room may be obtained by calling 1-800-SEC-0330. To obtain information on Form N-Q, shareholders can call the Fund at 1-877-721-1926.
Information on how the Fund voted proxies relating to portfolio securities during the prior 12-month period ended June 30th of each year and a description of the policies and procedures that the Fund uses to determine how to vote proxies relating to portfolio transactions are available (1) without charge, upon request, by calling the Fund at 1-877-721-1926, (2) at www.leggmason.com/mutualfunds and (3) on the SEC’s website at www.sec.gov.
This report is submitted for the general information of the shareholders of Legg Mason BW Dynamic Large Cap Value Fund. This report is not authorized for distribution to prospective investors in the Fund unless preceded or accompanied by a current prospectus.
Investors should consider the Fund’s investment objectives, risks, charges and expenses carefully before investing. The prospectus contains this and other important information about the Fund. Please read the prospectus carefully before you invest.
www.leggmason.com
© 2017 Legg Mason Investor Services, LLC
Member FINRA, SIPC
Legg Mason Funds Privacy and Security Notice
Your Privacy and the Security of Your Personal Information is Very Important to the Legg Mason Funds
This Privacy and Security Notice (the “Privacy Notice”) addresses the Legg Mason Funds’ privacy and data protection practices with respect to nonpublic personal information the Funds receive. The Legg Mason Funds include any funds sold by the Funds’ distributor, Legg Mason Investor Services, LLC, as well as Legg Mason-sponsored closed-end funds and certain closed-end funds managed or sub-advised by Legg Mason or its affiliates. The provisions of this Privacy Notice apply to your information both while you are a shareholder and after you are no longer invested with the Funds.
The Type of Nonpublic Personal Information the Funds Collect About You
The Funds collect and maintain nonpublic personal information about you in connection with your shareholder account. Such information may include, but is not limited to:
| • | | Personal information included on applications or other forms; |
| • | | Account balances, transactions, and mutual fund holdings and positions; |
| • | | Online account access user IDs, passwords, security challenge question responses; and |
| • | | Information received from consumer reporting agencies regarding credit history and creditworthiness (such as the amount of an individual’s total debt, payment history, etc.). |
How the Funds Use Nonpublic Personal Information About You
The Funds do not sell or share your nonpublic personal information with third parties or with affiliates for their marketing purposes, or with other financial institutions or affiliates for joint marketing purposes, unless you have authorized the Funds to do so. The Funds do not disclose any nonpublic personal information about you except as may be required to perform transactions or services you have authorized or as permitted or required by law. The Funds may disclose information about you to:
| • | | Employees, agents, and affiliates on a “need to know” basis to enable the Funds to conduct ordinary business or comply with obligations to government regulators; |
| • | | Service providers, including the Funds’ affiliates, who assist the Funds as part of the ordinary course of business (such as printing, mailing services, or processing or servicing your account with us) or otherwise perform services on the Funds’ behalf, including companies that may perform marketing services solely for the Funds; |
| • | | The Funds’ representatives such as legal counsel, accountants and auditors; and |
| • | | Fiduciaries or representatives acting on your behalf, such as an IRA custodian or trustee of a grantor trust. |
|
| NOT PART OF THE ANNUAL REPORT |
Legg Mason Funds Privacy and Security Notice (cont’d)
Except as otherwise permitted by applicable law, companies acting on the Funds’ behalf are contractually obligated to keep nonpublic personal information the Funds provide to them confidential and to use the information the Funds share only to provide the services the Funds ask them to perform.
The Funds may disclose nonpublic personal information about you when necessary to enforce their rights or protect against fraud, or as permitted or required by applicable law, such as in connection with a law enforcement or regulatory request, subpoena, or similar legal process. In the event of a corporate action or in the event a Fund service provider changes, the Funds may be required to disclose your nonpublic personal information to third parties. While it is the Funds’ practice to obtain protections for disclosed information in these types of transactions, the Funds cannot guarantee their privacy policy will remain unchanged.
Keeping You Informed of the Funds’ Privacy and Security Practices
The Funds will notify you annually of their privacy policy as required by federal law. While the Funds reserve the right to modify this policy at any time they will notify you promptly if this privacy policy changes.
The Funds’ Security Practices
The Funds maintain appropriate physical, electronic and procedural safeguards designed to guard your nonpublic personal information. The Funds’ internal data security policies restrict access to your nonpublic personal information to authorized employees, who may use your nonpublic personal information for Fund business purposes only.
Although the Funds strive to protect your nonpublic personal information, they cannot ensure or warrant the security of any information you provide or transmit to them, and you do so at your own risk. In the event of a breach of the confidentiality or security of your nonpublic personal information, the Funds will attempt to notify you as necessary so you can take appropriate protective steps. If you have consented to the Funds using electronic communications or electronic delivery of statements, they may notify you under such circumstances using the most current email address you have on record with them.
In order for the Funds to provide effective service to you, keeping your account information accurate is very important. If you believe that your account information is incomplete, not accurate or not current, or if you have questions about the Funds’ privacy practices, write the Funds using the contact information on your account statements, email the Funds by clicking on the Contact Us section of the Funds’ website at www.leggmason.com, or contact the Fund at 1-877-721-1926.
|
| NOT PART OF THE ANNUAL REPORT |
www.leggmason.com
© 2017 Legg Mason Investor Services, LLC Member FINRA, SIPC
BWXX211448 11/17 SR17-3199
The registrant has adopted a code of ethics that applies to the registrant’s principal executive officer, principal financial officer, principal accounting officer or controller.
| ITEM 3. | AUDIT COMMITTEE FINANCIAL EXPERT. |
The Board of Trustees of the registrant has determined that Arthur S. Mehlman the Chairman of the Board’s Audit Committee and Robert M. Tarola, possess the technical attributes identified in Instruction 2(b) of Item 3 to Form N-CSR to qualify as “audit committee financial experts,” and have designated Mr. Mehlman and Mr. Tarola as the Audit Committee’s financial experts. Mr. Mehlman and Mr. Tarola are “independent” Trustees pursuant to paragraph (a) (2) of Item 3 to Form N-CSR.
| ITEM 4. | PRINCIPAL ACCOUNTANT FEES AND SERVICES. |
a) Audit Fees. The aggregate fees billed in the last two fiscal years ending September 30, 2016 and September 30, 2017 (the “Reporting Periods”) for professional services rendered by the Registrant’s principal accountant (the “Auditor”) for the audit of the Registrant’s annual financial statements, or services that are normally provided by the Auditor in connection with the statutory and regulatory filings or engagements for the Reporting Periods, were $ 89,074 in September 30, 2016 and $214,935 in September 30, 2017.
b) Audit-Related Fees. The aggregate fees billed in the Reporting Period for assurance and related services by the Auditor that are reasonably related to the performance of the Registrant’s financial statements were $3,250 in September 30, 2016 and $0 in September 30, 2017.
In addition, there were no Audit-Related Fees billed in the Reporting Period for assurance and related services by the Auditor to the Registrant’s investment adviser (not including any sub-adviser whose role is primarily portfolio management and is subcontracted with or overseen by another investment adviser), and any entity controlling, controlled by or under common control with the investment adviser that provides ongoing services to the Legg Mason Global Asset Management Trust (“service affiliates”), that were reasonably related to the performance of the annual audit of the service affiliates. Accordingly, there were no such fees that required pre-approval by the Audit Committee for the Reporting Period.
(c) Tax Fees. The aggregate fees billed in the Reporting Periods for professional services rendered by the Auditor for tax compliance, tax advice and tax planning (“Tax Services”) were $42,737 in September 30, 2016 and $27,852 in September 30, 2017. These services consisted of (i) review or preparation of U.S. federal, state, local and excise tax returns; (ii) U.S. federal, state and local tax planning, advice and assistance regarding statutory, regulatory or administrative developments, and (iii) tax advice regarding tax qualification matters and/or treatment of various financial instruments held or proposed to be acquired or held.
There were no fees billed for tax services by to the service affiliates during the Reporting Periods that required pre-approval by the Audit Auditors Committee.
d) All Other Fees. The aggregate fees for other fees billed in the Reporting Periods for products and services provided by the Auditor were $2,599 in September 30, 2016 and $0 in September 30, 2017, other than the services reported in paragraphs (a) through (c) of this item for the Legg Mason Global Asset Management Trust.
All Other Fees. There were no other non-audit services rendered by the Auditor to Legg Mason Partners Fund Advisors, LLC (“LMPFA”), and any entity controlling, controlled by or under common control with LMPFA that provided ongoing services to Legg Mason Global Asset Management Trust requiring pre-approval by the Audit Committee in the Reporting Period.
(e) Audit Committee’s pre–approval policies and procedures described in paragraph (c)
(7) of Rule 2-01 of Regulation S-X.
(1) The Charter for the Audit Committee (the “Committee”) of the Board of each registered investment company (the “Fund”) advised by LMPFA or one of their affiliates (each, an “Adviser”) requires that the Committee shall approve (a) all audit and permissible non-audit services to be provided to the Fund and (b) all permissible non-audit services to be provided by the Fund’s independent auditors to the Adviser and any Covered Service Providers if the engagement relates directly to the operations and financial reporting of the Fund. The Committee may implement policies and procedures by which such services are approved other than by the full Committee.
The Committee shall not approve non-audit services that the Committee believes may impair the independence of the auditors. As of the date of the approval of this Audit Committee Charter, permissible non-audit services include any professional services (including tax services), that are not prohibited services as described below, provided to the Fund by the independent auditors, other than those provided to the Fund in connection with an audit or a review of the financial statements of the Fund. Permissible non-audit services may not include: (i) bookkeeping or other services related to the accounting records or financial statements of the Fund; (ii) financial information systems design and implementation; (iii) appraisal or valuation services, fairness opinions or contribution-in-kind reports; (iv) actuarial services; (v) internal audit outsourcing services; (vi) management functions or human resources; (vii) broker or dealer, investment adviser or investment banking services; (viii) legal services and expert services unrelated to the audit; and (ix) any other service the Public Company Accounting Oversight Board determines, by regulation, is impermissible.
Pre-approval by the Committee of any permissible non-audit services is not required so long as: (i) the aggregate amount of all such permissible non-audit services provided to the Fund, the Adviser and any service providers controlling, controlled by or under common control with the Adviser that provide ongoing services to the Fund (“Covered Service Providers”) constitutes not more than 5% of the total amount of revenues paid to the independent auditors during the fiscal year in which the permissible non-audit services are provided to (a) the Fund, (b) the Adviser and (c) any entity controlling, controlled by or under common control with the Adviser that provides ongoing services to the Fund during the fiscal year in which the services are provided that would have to be approved by the Committee; (ii) the permissible non-audit services were not recognized by the Fund at the time of the engagement to be non-audit services; and (iii) such services are promptly brought to the attention of the Committee and approved by the Committee (or its delegate(s)) prior to the completion of the audit.
(2) For the Legg Mason Global Asset Management Trust, the percentage of fees that were approved by the audit committee, with respect to: Audit-Related Fees were 100% and 100% for September 30, 2016 and September 30, 2017; Tax Fees were 100% and 100% for September 30, 2016 and September 30, 2017; and Other Fees were 100% and 100% for September 30, 2016 and September 30, 2017.
(f) N/A
(g) Non-audit fees billed by the Auditor for services rendered to Legg Mason Global Asset Management Trust, LMPFA and any entity controlling, controlled by, or under common control with LMPFA that provides ongoing services to Legg Mason Global Asset Management Trust during the reporting period were $197,515 in September 30, 2016 and $271,895 in September 30, 2017.
(h) Yes. Legg Mason Global Asset Management Trust’s Audit Committee has considered whether the provision of non-audit services that were rendered to Service Affiliates, which were not pre-approved (not requiring pre-approval), is compatible with maintaining the Accountant’s independence. All services provided by the Auditor to the Legg Mason Global Asset Management Trust or to Service Affiliates, which were required to be pre-approved, were pre-approved as required.
| ITEM 5. | AUDIT COMMITTEE OF LISTED REGISTRANTS. |
| | a) | The independent board members are acting as the registrant’s audit committee as specified in Section 3(a)(58)(B) of the Exchange Act .The Audit Committee consists of the following Board members: |
Ruby P. Hearn
Arnold L. Lehman
Robin J.W. Masters
Jill E. McGovern
Arthur S. Mehlman
G. Peter O’Brien
S. Ford Rowan
Robert M. Tarola
| ITEM 6. | SCHEDULE OF INVESTMENTS. |
Included herein under Item 1.
| ITEM 7. | DISCLOSURE OF PROXY VOTING POLICIES AND PROCEDURES FOR CLOSED-END MANAGEMENT INVESTMENT COMPANIES. |
Not applicable.
| ITEM 8. | PORTFOLIO MANAGERS OF CLOSED-END MANAGEMENT INVESTMENT COMPANIES. |
Not applicable.
| ITEM 9. | PURCHASES OF EQUITY SECURITIES BY CLOSED-END MANAGEMENT INVESTMENT COMPANY AND AFFILIATED PURCHASERS. |
Not applicable.
| ITEM 10. | SUBMISSION OF MATTERS TO A VOTE OF SECURITY HOLDERS. |
Not applicable.
| ITEM 11. | CONTROLS AND PROCEDURES. |
| | (a) | The registrant’s principal executive officer and principal financial officer have concluded that the registrant’s disclosure controls and procedures (as defined in Rule 30a- 3(c) under the Investment Company Act of 1940, as amended (the “1940 Act”)) are effective as of a date within 90 days of the filing date of this report that includes the disclosure required by this paragraph, based on their evaluation of the disclosure controls and procedures required by Rule 30a-3(b) under the 1940 Act and 15d-15(b) under the Securities Exchange Act of 1934. |
| | (b) | There were no changes in the registrant’s internal control over financial reporting (as defined in Rule 30a-3(d) under the 1940 Act) that occurred during the second fiscal quarter of the period covered by this report that have materially affected, or are likely to materially affect the registrant’s internal control over financial reporting. |
(a) (1) Code of Ethics attached hereto.
Exhibit 99.CODE ETH
(a) (2) Certifications pursuant to section 302 of the Sarbanes-Oxley Act of 2002 attached hereto.
Exhibit 99.CERT
(b) Certifications pursuant to Section 906 of the Sarbanes-Oxley Act of 2002 attached hereto.
Exhibit 99.906CERT
SIGNATURES
Pursuant to the requirements of the Securities Exchange Act of 1934 and the Investment Company Act of 1940, the registrant has duly caused this Report to be signed on its behalf by the undersigned, there unto duly authorized.
Legg Mason Global Asset Management Trust
| | |
| By: | | /s/ Jane Trust |
| | Jane Trust |
| | Chief Executive Officer |
| |
| Date: | | November 30, 2017 |
Pursuant to the requirements of the Securities Exchange Act of 1934 and the Investment Company Act of 1940, this report has been signed below by the following persons on behalf of the registrant and in the capacities and on the dates indicated.
| | |
| By: | | /s/ Jane Trust |
| | Jane Trust |
| | Chief Executive Officer |
| |
| Date: | | November 30, 2017 |
| |
| By: | | /s/ Richard F. Sennett |
| | Richard F. Sennett |
| | Principal Financial Officer |
| |
| Date: | | November 30, 2017 |