UNITED STATES
SECURITIES AND EXCHANGE COMMISSION
Washington, D.C. 20549
FORM N-CSR
CERTIFIED SHAREHOLDER REPORT OF REGISTERED
MANAGEMENT INVESTMENT COMPANIES
Investment Company Act file number 811-22338
Legg Mason Global Asset Management Trust
(Exact name of registrant as specified in charter)
100 International Drive,
Baltimore, MD, 21202
(Address of principal executive offices) (Zip code)
Marc A. De Oliveira
Franklin Templeton
100 First Stamford Place
Stamford, CT 06902
(Name and address of agent for service)
Registrant’s telephone number, including area code: 877-6LM-FUND/656-3863
Date of fiscal year end: September 30
Date of reporting period: March 31, 2024
| ITEM 1. | REPORT TO STOCKHOLDERS. |
The Semi-Annual Report to Stockholders is filed herewith.

Semi-Annual Report
| March 31, 2024
|
BrandywineGLOBAL —
DIVERSIFIED US LARGE CAP VALUE FUND
The Securities and Exchange Commission has adopted new regulations that will result in changes to the design and delivery of annual and semi-annual shareholder reports beginning in July 2024.
If you have previously elected to receive shareholder reports electronically, you will continue to do so and need not take any action.
Otherwise, paper copies of the Fund’s shareholder reports will be mailed to you beginning in July 2024. If you would like to receive shareholder reports and other communications from the Fund electronically instead of by mail, you may make that request at any time by contacting your financial intermediary (such as a broker-dealer or bank) or, if you are a direct investor, enrolling at franklintempleton.com.
You may access franklintempleton.com by scanning the code below.
|


| INVESTMENT PRODUCTS: NOT FDIC INSURED • NO BANK GUARANTEE • MAY LOSE VALUE |
Fund objective
The Fund seeks long-term capital appreciation.

Dear Shareholder,
We are pleased to provide the semi-annual report of BrandywineGLOBAL — Diversified US Large Cap Value Fund for the six-month reporting period ended March 31, 2024. Please read on for Fund performance information during the Fund’s reporting period.
As always, we remain committed to providing you with excellent service and a full spectrum of investment choices. We also remain committed to supplementing the support you receive from your financial advisor. One way we accomplish this is through our website, www.franklintempleton.com. Here you can gain immediate access to market and investment information, including:
| • | Fund prices and performance, |
| • | Market insights and commentaries from our portfolio managers, and |
| • | A host of educational resources. |
We look forward to helping you meet your financial goals.
Sincerely,

Jane Trust, CFA
President and Chief Executive Officer
April 30, 2024
II | BrandywineGLOBAL — Diversified US Large Cap Value Fund |
For the six months ended March 31, 2024, Class A shares of BrandywineGLOBAL — Diversified US Large Cap Value Fund, excluding sales charges, returned 20.49%. The Fund’s unmanaged benchmark, the Russell 1000 Value Indexi, returned 19.34% for the same period.
| Performance Snapshot as of March 31, 2024 (unaudited) | ||||
| (excluding sales charges) | 6 months | |||
| BrandywineGLOBAL — Diversified US Large Cap Value Fund: | ||||
Class A | 20.49 | % | ||
Class C | 20.02 | % | ||
Class R | 20.39 | % | ||
Class I | 20.67 | % | ||
Class IS | 20.72 | % | ||
| Russell 1000 Value Index | 19.34 | % | ||
The performance shown represents past performance. Past performance is no guarantee of future results and current performance may be higher or lower than the performance shown above. Principal value and investment returns will fluctuate and investors’ shares, when redeemed, may be worth more or less than their original cost. To obtain performance data current to the most recent month-end, please visit our website at www.franklintempleton.com.
All share class returns assume the reinvestment of all distributions, including returns of capital, if any, at net asset value and the deduction of all Fund expenses. Returns have not been adjusted to include sales charges that may apply or the deduction of taxes that a shareholder would pay on Fund distributions. If sales charges were reflected, the performance quoted would be lower. Performance figures for periods shorter than one year represent cumulative figures and are not annualized.
Fund performance figures reflect fee waivers and/or expense reimbursements, without which the performance would have been lower.
| Total Annual Operating Expenses (unaudited) |
As of the Fund’s current prospectus dated January 31, 2024, the gross total annual fund operating expense ratios for Class A, Class C, Class R, Class I and Class IS shares were 1.22%, 1.92%, 1.58%, 0.89% and 0.80%, respectively.
Actual expenses may be higher. For example, expenses may be higher than those shown if average net assets decrease. Net assets are more likely to decrease and Fund expense ratios are more likely to increase when markets are volatile.
As a result of expense limitation arrangements, the ratio of total annual fund operating expenses, other than interest, brokerage commissions, dividend expense on short sales, taxes, extraordinary expenses and acquired fund fees and expenses, to average net assets will not exceed 1.15% for Class A shares, 1.90% for Class C shares, 1.40% for Class R shares, 0.80% for Class I shares and 0.70% for Class IS shares. In addition, the ratio of total annual fund operating expenses of Class IS shares will not exceed the ratio of total annual fund operating expenses for Class I shares. Total annual fund operating expenses after waiving fees and/or reimbursing expenses exceed the expense limitation (“expense cap”)
| BrandywineGLOBAL — Diversified US Large Cap Value Fund |
III |
Performance review (cont’d)
for each class as a result of acquired fund fees and expenses. These expense limitation arrangements cannot be terminated prior to December 31, 2025 without the Board of Trustees’ consent. In addition, the manager has agreed to waive the Fund’s management fee to an extent sufficient to offset the net management fee payable in connection with any investment in an affiliated money market fund. This management fee waiver is not subject to the recapture provision discussed below.
The manager is permitted to recapture amounts waived and/or reimbursed to a class within three years after the fiscal year in which the manager earned the fee or incurred the expense if the class’ total annual fund operating expenses have fallen to a level below the expense cap in effect at the time the fees were earned or the expenses incurred. In no case will the manager recapture any amount that would result, on any particular business day of the Fund, in the class’ total annual fund operating expenses exceeding the expense cap or any other lower limit then in effect.
The manager has also agreed to voluntarily waive fees and/or reimburse operating expenses, other than interest, brokerage commissions, dividend expense on short sales, taxes, extraordinary expenses and acquired fund fees and expenses, so that the ratio of total annual fund operating expenses to average net assets of Class A, Class C and Class R shares will not exceed 1.10%, 1.85% and 1.35%, respectively. These expense limitation arrangements are expected to continue until December 31, 2025 but may be terminated at any time by the manager.
As always, thank you for your confidence in our stewardship of your assets.
Sincerely,
Jane Trust, CFA
President and Chief Executive Officer
April 30, 2024
RISKS: Equity securities are subject to market and price fluctuations. Large capitalization companies may fall out of favor with investors based on market and economic conditions. In return for the relative stability and low volatility of large capitalization companies, the Fund’s value may not rise as much as the value of funds that invest in companies with smaller market capitalizations. In addition, the value approach to investing involves the risk that stocks may remain undervalued. Value stocks may underperform the overall equity market while the market concentrates on growth stocks. The market values of securities or other assets will fluctuate, sometimes sharply and unpredictably, due to changes in general market conditions, overall economic trends or events, governmental actions or intervention, actions taken by the U.S. Federal Reserve or foreign central banks, market disruptions caused by trade disputes or other factors, political developments, armed conflicts, economic sanctions and countermeasures in
IV | BrandywineGLOBAL — Diversified US Large Cap Value Fund |
response to sanctions, major cybersecurity events, investor sentiment, the global and domestic effects of a pandemic, and other factors that may or may not be related to the issuer of the security or other asset. Please see the Fund’s prospectus for a more complete discussion of these and other risks and the Fund’s investment strategies.
All investments are subject to risk including the possible loss of principal. Past performance is no guarantee of future results. All index performance reflects no deduction for fees, expenses or taxes. Please note that an investor cannot invest directly in an index.
| i | The Russell 1000 Value Index measures the performance of the large-cap value segment of the U.S. equity universe. It includes those Russell 1000 Index companies with lower price-to-book ratios and lower expected growth values. (A price-to-book ratio is the price of a stock compared to the difference between a company’s assets and liabilities). The Russell 1000 Index measures the performance of the large-cap segment of the U.S. equity universe. It is a subset of the Russell 3000 Index and includes approximately 1,000 of the largest securities based on a combination of their market cap and current index membership. The Russell 1000 represents approximately 93% of the U.S. equity market. The Russell 3000 Index measures the performance of the 3,000 largest U.S. companies based on total market capitalization, which represents approximately 98% of the U.S. equity market. |
| BrandywineGLOBAL — Diversified US Large Cap Value Fund |
V |
Investment breakdown (%) as a percent of total investments
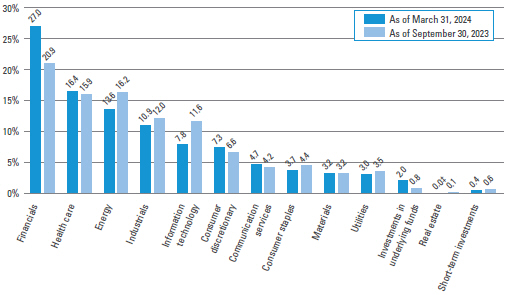
| † | The bar graph above represents the composition of the Fund’s investments as of March 31, 2024 and September 30, 2023. The Fund is actively managed. As a result, the composition of the Fund’s investments is subject to change at any time. |
| ‡ | Represents less than 0.1%. |
| BrandywineGLOBAL — Diversified US Large Cap Value Fund 2024 Semi-Annual Report |
1 |
Example
As a shareholder of the Fund, you may incur two types of costs: (1) transaction costs, including front-end and back-end sales charges (loads) on purchase payments; and (2) ongoing costs, including management fees; service and/or distribution (12b-1) fees; and other Fund expenses. This example is intended to help you understand your ongoing costs (in dollars) of investing in the Fund and to compare these costs with the ongoing costs of investing in other mutual funds.
This example is based on an investment of $1,000 invested on October 1, 2023 and held for the six months ended March 31, 2024.
Actual expenses
The table below titled “Based on actual total return” provides information about actual account values and actual expenses. You may use the information provided in this table, together with the amount you invested, to estimate the expenses that you paid over the period. To estimate the expenses you paid on your account, divide your ending account value by $1,000 (for example, an $8,600 ending account value divided by $1,000 = 8.6), then multiply the result by the number under the heading entitled “Expenses Paid During the Period”.
Hypothetical example for comparison purposes
The table below titled “Based on hypothetical total return” provides information about hypothetical account values and hypothetical expenses based on the actual expense ratio and an assumed rate of return of 5.00% per year before expenses, which is not the Fund’s actual return. The hypothetical account values and expenses may not be used to estimate the actual ending account balance or expenses you paid for the period. You may use the information provided in this table to compare the ongoing costs of investing in the Fund and other funds. To do so, compare the 5.00% hypothetical example relating to the Fund with the 5.00% hypothetical examples that appear in the shareholder reports of the other funds.
Please note that the expenses shown in the table below are meant to highlight your ongoing costs only and do not reflect any transactional costs, such as front-end or back-end sales charges (loads). Therefore, the table is useful in comparing ongoing costs only, and will not help you determine the relative total costs of owning different funds. In addition, if these transaction costs were included, your costs would have been higher.
| Based on actual total return1 | Based on hypothetical total return1 | |||||||||||||||||||||||||||||||||||||||||||||
Actual Total Return Without Sales Charge2 | Beginning Account Value | Ending Account Value | Annualized Expense Ratio | Expenses Paid During the | Hypothetical Annualized | Beginning Account Value | Ending Account Value | Annualized Expense Ratio | Expenses Paid During the Period3 | |||||||||||||||||||||||||||||||||||||
| Class A | 20.49 | % | $ | 1,000.00 | $ | 1,204.90 | 1.10 | % | $ | 6.06 | Class A | 5.00 | % | $ | 1,000.00 | $ | 1,019.50 | 1.10 | % | $ | 5.55 | |||||||||||||||||||||||||
| Class C | 20.02 | 1,000.00 | 1,200.20 | 1.85 | 10.18 | Class C | 5.00 | 1,000.00 | 1,015.75 | 1.85 | 9.32 | |||||||||||||||||||||||||||||||||||
| Class R | 20.39 | 1,000.00 | 1,203.90 | 1.35 | 7.44 | Class R | 5.00 | 1,000.00 | 1,018.25 | 1.35 | 6.81 | |||||||||||||||||||||||||||||||||||
| Class I | 20.67 | 1,000.00 | 1,206.70 | 0.80 | 4.41 | Class I | 5.00 | 1,000.00 | 1,021.00 | 0.80 | 4.04 | |||||||||||||||||||||||||||||||||||
| Class IS | 20.72 | 1,000.00 | 1,207.20 | 0.70 | 3.86 | Class IS | 5.00 | 1,000.00 | 1,021.50 | 0.70 | 3.54 | |||||||||||||||||||||||||||||||||||
2 | BrandywineGLOBAL — Diversified US Large Cap Value Fund 2024 Semi-Annual Report |
| 1 | For the six months ended March 31, 2024. |
| 2 | Assumes the reinvestment of all distributions, including returns of capital, if any, at net asset value and does not reflect the deduction of the applicable sales charge with respect to Class A shares or the applicable contingent deferred sales charge (“CDSC”) with respect to Class C shares. Total return is not annualized, as it may not be representative of the total return for the year. Performance figures may reflect compensating balance arrangements, fee waivers and/or expense reimbursements. In the absence of compensating balance arrangements, fee waivers and/or expense reimbursements, the total return would have been lower. Past performance is no guarantee of future results. |
| 3 | Expenses (net of compensating balance arrangements, fee waivers and/or expense reimbursements) are equal to each class’ respective annualized expense ratio multiplied by the average account value over the period, multiplied by the number of days in the most recent fiscal half-year (183), then divided by 366. |
| BrandywineGLOBAL — Diversified US Large Cap Value Fund 2024 Semi-Annual Report |
3 |
Schedule of investments (unaudited)
March 31, 2024
BrandywineGLOBAL — Diversified US Large Cap Value Fund
(Percentages shown based on Fund net assets)
| Security | Shares | Value | ||||||||||||||
| Common Stocks — 97.5% | ||||||||||||||||
| Communication Services — 4.7% | ||||||||||||||||
Diversified Telecommunication Services — 2.4% | ||||||||||||||||
AT&T Inc. | 146,600 | $ | 2,580,160 | |||||||||||||
Verizon Communications Inc. | 97,100 | 4,074,316 | ||||||||||||||
Total Diversified Telecommunication Services | 6,654,476 | |||||||||||||||
Media — 2.3% | ||||||||||||||||
Charter Communications Inc., Class A Shares | 2,200 | 639,386 | * | |||||||||||||
Comcast Corp., Class A Shares | 108,500 | 4,703,475 | ||||||||||||||
Fox Corp., Class A Shares | 10,200 | 318,954 | ||||||||||||||
Omnicom Group Inc. | 6,500 | 628,940 | ||||||||||||||
Total Media | 6,290,755 | |||||||||||||||
Total Communication Services | 12,945,231 | |||||||||||||||
| Consumer Discretionary — 7.3% | ||||||||||||||||
Automobile Components — 0.1% | ||||||||||||||||
Lear Corp. | 1,500 | 217,320 | ||||||||||||||
Automobiles — 1.1% | ||||||||||||||||
Ford Motor Co. | 118,400 | 1,572,352 | ||||||||||||||
General Motors Co. | 35,100 | 1,591,785 | ||||||||||||||
Total Automobiles | 3,164,137 | |||||||||||||||
Broadline Retail — 0.3% | ||||||||||||||||
Dillard’s Inc., Class A Shares | 200 | 94,328 | ||||||||||||||
eBay Inc. | 12,400 | 654,472 | ||||||||||||||
Total Broadline Retail | 748,800 | |||||||||||||||
Diversified Consumer Services — 0.2% | ||||||||||||||||
H&R Block Inc. | 2,000 | 98,220 | ||||||||||||||
Service Corp. International | 5,200 | 385,892 | ||||||||||||||
Total Diversified Consumer Services | 484,112 | |||||||||||||||
Hotels, Restaurants & Leisure — 0.4% | ||||||||||||||||
Boyd Gaming Corp. | 2,500 | 168,300 | ||||||||||||||
Darden Restaurants Inc. | 1,600 | 267,440 | ||||||||||||||
Expedia Group Inc. | 2,700 | 371,925 | * | |||||||||||||
MGM Resorts International | 6,600 | 311,586 | * | |||||||||||||
Total Hotels, Restaurants & Leisure | 1,119,251 | |||||||||||||||
Household Durables — 1.8% | ||||||||||||||||
DR Horton Inc. | 11,000 | 1,810,050 | ||||||||||||||
Lennar Corp., Class A Shares | 8,300 | 1,427,434 | ||||||||||||||
NVR Inc. | 60 | 485,998 | * | |||||||||||||
PulteGroup Inc. | 8,000 | 964,960 | ||||||||||||||
Toll Brothers Inc. | 1,400 | 181,118 | ||||||||||||||
Total Household Durables | 4,869,560 | |||||||||||||||
See Notes to Financial Statements.
4 | BrandywineGLOBAL — Diversified US Large Cap Value Fund 2024 Semi-Annual Report |
BrandywineGLOBAL — Diversified US Large Cap Value Fund
(Percentages shown based on Fund net assets)
| Security | Shares | Value | ||||||||||||||
Leisure Products — 0.1% | ||||||||||||||||
Brunswick Corp. | 2,300 | $ | 221,996 | |||||||||||||
Mattel Inc. | 7,300 | 144,613 | * | |||||||||||||
Total Leisure Products | 366,609 | |||||||||||||||
Specialty Retail — 3.0% | ||||||||||||||||
AutoNation Inc. | 2,400 | 397,392 | * | |||||||||||||
Bath & Body Works Inc. | 4,700 | 235,094 | ||||||||||||||
Best Buy Co. Inc. | 5,500 | 451,165 | ||||||||||||||
CarMax Inc. | 3,300 | 287,463 | * | |||||||||||||
Dick’s Sporting Goods Inc. | 800 | 179,888 | ||||||||||||||
Lithia Motors Inc. | 600 | 180,516 | ||||||||||||||
Lowe’s Cos. Inc. | 22,200 | 5,655,006 | ||||||||||||||
Murphy USA Inc. | 500 | 209,600 | ||||||||||||||
Penske Automotive Group Inc. | 1,700 | 275,383 | ||||||||||||||
Williams-Sonoma Inc. | 1,600 | 508,048 | ||||||||||||||
Total Specialty Retail | 8,379,555 | |||||||||||||||
Textiles, Apparel & Luxury Goods — 0.3% | ||||||||||||||||
Crocs Inc. | 1,300 | 186,940 | * | |||||||||||||
Levi Strauss & Co., Class A Shares | 2,300 | 45,977 | ||||||||||||||
PVH Corp. | 800 | 112,488 | ||||||||||||||
Ralph Lauren Corp. | 1,000 | 187,760 | ||||||||||||||
Skechers U.S.A. Inc., Class A Shares | 3,100 | 189,906 | * | |||||||||||||
Total Textiles, Apparel & Luxury Goods | 723,071 | |||||||||||||||
Total Consumer Discretionary | 20,072,415 | |||||||||||||||
| Consumer Staples — 3.7% | ||||||||||||||||
Beverages — 0.2% | ||||||||||||||||
Coca-Cola Consolidated Inc. | 100 | 84,641 | ||||||||||||||
Molson Coors Beverage Co., Class B Shares | 5,000 | 336,250 | ||||||||||||||
Total Beverages | 420,891 | |||||||||||||||
Consumer Staples Distribution & Retail — 1.0% | ||||||||||||||||
BJ’s Wholesale Club Holdings Inc. | 1,800 | 136,170 | * | |||||||||||||
Kroger Co. | 17,400 | 994,062 | ||||||||||||||
Sysco Corp. | 7,400 | 600,732 | ||||||||||||||
Target Corp. | 6,100 | 1,080,981 | ||||||||||||||
Total Consumer Staples Distribution & Retail | 2,811,945 | |||||||||||||||
Food Products — 0.6% | ||||||||||||||||
Bunge Global SA | 2,400 | 246,048 | ||||||||||||||
Ingredion Inc. | 1,700 | 198,645 | ||||||||||||||
Kraft Heinz Co. | 30,200 | 1,114,380 | ||||||||||||||
Total Food Products | 1,559,073 | |||||||||||||||
See Notes to Financial Statements.
| BrandywineGLOBAL — Diversified US Large Cap Value Fund 2024 Semi-Annual Report |
5 |
Schedule of investments (unaudited) (cont’d)
March 31, 2024
BrandywineGLOBAL — Diversified US Large Cap Value Fund
(Percentages shown based on Fund net assets)
| Security | Shares | Value | ||||||||||||||
Tobacco — 1.9% | ||||||||||||||||
Altria Group Inc. | 43,500 | $ | 1,897,470 | |||||||||||||
Philip Morris International Inc. | 36,600 | 3,353,292 | ||||||||||||||
Total Tobacco | 5,250,762 | |||||||||||||||
Total Consumer Staples | 10,042,671 | |||||||||||||||
| Energy — 13.6% | ||||||||||||||||
Energy Equipment & Services — 0.6% | ||||||||||||||||
Baker Hughes Co. | 20,500 | 686,750 | ||||||||||||||
Halliburton Co. | 20,800 | 819,936 | ||||||||||||||
NOV Inc. | 5,800 | 113,216 | ||||||||||||||
Total Energy Equipment & Services | 1,619,902 | |||||||||||||||
Oil, Gas & Consumable Fuels — 13.0% | ||||||||||||||||
APA Corp. | 8,100 | 278,478 | ||||||||||||||
Cheniere Energy Inc. | 5,600 | 903,168 | ||||||||||||||
Chevron Corp. | 43,173 | 6,810,109 | ||||||||||||||
Chord Energy Corp. | 600 | 106,944 | ||||||||||||||
ConocoPhillips | 30,700 | 3,907,496 | ||||||||||||||
Coterra Energy Inc. | 17,500 | 487,900 | ||||||||||||||
Devon Energy Corp. | 8,300 | 416,494 | ||||||||||||||
EOG Resources Inc. | 17,500 | 2,237,200 | ||||||||||||||
Exxon Mobil Corp. | 94,500 | 10,984,680 | ||||||||||||||
Kinder Morgan Inc. | 55,600 | 1,019,704 | ||||||||||||||
Marathon Oil Corp. | 17,100 | 484,614 | ||||||||||||||
Marathon Petroleum Corp. | 9,300 | 1,873,950 | ||||||||||||||
Murphy Oil Corp. | 2,000 | 91,400 | ||||||||||||||
New Fortress Energy Inc. | 3,000 | 91,770 | ||||||||||||||
Occidental Petroleum Corp. | 22,400 | 1,455,776 | ||||||||||||||
Phillips 66 | 10,300 | 1,682,402 | ||||||||||||||
Range Resources Corp. | 5,500 | 189,365 | ||||||||||||||
Valero Energy Corp. | 9,500 | 1,621,555 | ||||||||||||||
Williams Cos. Inc. | 24,900 | 970,353 | ||||||||||||||
Total Oil, Gas & Consumable Fuels | 35,613,358 | |||||||||||||||
Total Energy | 37,233,260 | |||||||||||||||
| Financials — 26.9% | ||||||||||||||||
Banks — 11.3% | ||||||||||||||||
Bank of America Corp. | 161,300 | 6,116,496 | ||||||||||||||
Citigroup Inc. | 44,600 | 2,820,504 | ||||||||||||||
Citizens Financial Group Inc. | 9,400 | 341,126 | ||||||||||||||
Commerce Bancshares Inc. | 1,800 | 95,760 | ||||||||||||||
Cullen/Frost Bankers Inc. | 1,400 | 157,598 | ||||||||||||||
East-West Bancorp Inc. | 2,900 | 229,419 | ||||||||||||||
See Notes to Financial Statements.
6 | BrandywineGLOBAL — Diversified US Large Cap Value Fund 2024 Semi-Annual Report |
BrandywineGLOBAL — Diversified US Large Cap Value Fund
(Percentages shown based on Fund net assets)
| Security | Shares | Value | ||||||||||||||
Banks — continued | ||||||||||||||||
Fifth Third Bancorp | 14,000 | $ | 520,940 | |||||||||||||
Huntington Bancshares Inc. | 21,600 | 301,320 | ||||||||||||||
JPMorgan Chase & Co. | 68,400 | 13,700,520 | ||||||||||||||
KeyCorp | 14,000 | 221,340 | ||||||||||||||
M&T Bank Corp. | 3,500 | 509,040 | ||||||||||||||
PNC Financial Services Group Inc. | 8,100 | 1,308,960 | ||||||||||||||
Regions Financial Corp. | 18,800 | 395,552 | ||||||||||||||
Webster Financial Corp. | 3,500 | 177,695 | ||||||||||||||
Wells Fargo & Co. | 73,200 | 4,242,672 | ||||||||||||||
Total Banks | 31,138,942 | |||||||||||||||
Capital Markets — 5.1% | ||||||||||||||||
Ameriprise Financial Inc. | 2,600 | 1,139,944 | ||||||||||||||
Bank of New York Mellon Corp. | 20,900 | 1,204,258 | ||||||||||||||
Carlyle Group Inc. | 8,400 | 394,044 | ||||||||||||||
Goldman Sachs Group Inc. | 8,300 | 3,466,827 | ||||||||||||||
Invesco Ltd. | 11,400 | 189,126 | ||||||||||||||
Jefferies Financial Group Inc. | 6,400 | 282,240 | ||||||||||||||
LPL Financial Holdings Inc. | 1,800 | 475,560 | ||||||||||||||
Morgan Stanley | 41,900 | 3,945,304 | ||||||||||||||
Northern Trust Corp. | 4,200 | 373,464 | ||||||||||||||
Raymond James Financial Inc. | 4,800 | 616,416 | ||||||||||||||
Robinhood Markets Inc., Class A Shares | 10,000 | 201,300 | * | |||||||||||||
SEI Investments Co. | 1,500 | 107,850 | ||||||||||||||
State Street Corp. | 8,500 | 657,220 | ||||||||||||||
Stifel Financial Corp. | 2,400 | 187,608 | ||||||||||||||
T. Rowe Price Group Inc. | 5,300 | 646,176 | ||||||||||||||
Total Capital Markets | 13,887,337 | |||||||||||||||
Consumer Finance — 2.6% | ||||||||||||||||
Ally Financial Inc. | 7,000 | 284,130 | ||||||||||||||
American Express Co. | 18,300 | 4,166,727 | ||||||||||||||
Capital One Financial Corp. | 8,900 | 1,325,121 | ||||||||||||||
Discover Financial Services | 7,100 | 930,739 | ||||||||||||||
Synchrony Financial | 10,800 | 465,696 | ||||||||||||||
Total Consumer Finance | 7,172,413 | |||||||||||||||
Financial Services — 1.5% | ||||||||||||||||
Equitable Holdings Inc. | 10,500 | 399,105 | ||||||||||||||
Fiserv Inc. | 12,700 | 2,029,714 | * | |||||||||||||
Global Payments Inc. | 6,100 | 815,326 | ||||||||||||||
PayPal Holdings Inc. | 14,100 | 944,559 | * | |||||||||||||
Total Financial Services | 4,188,704 | |||||||||||||||
See Notes to Financial Statements.
| BrandywineGLOBAL — Diversified US Large Cap Value Fund 2024 Semi-Annual Report |
7 |
Schedule of investments (unaudited) (cont’d)
March 31, 2024
BrandywineGLOBAL — Diversified US Large Cap Value Fund
(Percentages shown based on Fund net assets)
| Security | Shares | Value | ||||||||||||||
Insurance — 6.4% | ||||||||||||||||
Aflac Inc. | 16,500 | $ | 1,416,690 | |||||||||||||
American Financial Group Inc. | 1,800 | 245,664 | ||||||||||||||
American International Group Inc. | 16,500 | 1,289,805 | ||||||||||||||
Arch Capital Group Ltd. | 9,500 | 878,180 | * | |||||||||||||
Assurant Inc. | 1,200 | 225,888 | ||||||||||||||
Chubb Ltd. | 10,700 | 2,772,691 | ||||||||||||||
Cincinnati Financial Corp. | 3,900 | 484,263 | ||||||||||||||
Fidelity National Financial Inc. | 6,800 | 361,080 | ||||||||||||||
First American Financial Corp. | 2,400 | 146,520 | ||||||||||||||
Globe Life Inc. | 2,200 | 256,014 | ||||||||||||||
Hartford Financial Services Group Inc. | 8,300 | 855,315 | ||||||||||||||
Loews Corp. | 6,300 | 493,227 | ||||||||||||||
Markel Group Inc. | 290 | 441,229 | * | |||||||||||||
MetLife Inc. | 21,200 | 1,571,132 | ||||||||||||||
Old Republic International Corp. | 7,200 | 221,184 | ||||||||||||||
Primerica Inc. | 700 | 177,072 | ||||||||||||||
Principal Financial Group Inc. | 6,500 | 561,015 | ||||||||||||||
Prudential Financial Inc. | 9,200 | 1,080,080 | ||||||||||||||
Reinsurance Group of America Inc. | 1,500 | 289,320 | ||||||||||||||
Travelers Cos. Inc. | 10,600 | 2,439,484 | ||||||||||||||
Unum Group | 4,800 | 257,568 | ||||||||||||||
Willis Towers Watson PLC | 1,500 | 412,500 | ||||||||||||||
WR Berkley Corp. | 6,500 | 574,860 | ||||||||||||||
Total Insurance | 17,450,781 | |||||||||||||||
Total Financials | 73,838,177 | |||||||||||||||
| Health Care — 16.4% | ||||||||||||||||
Biotechnology — 5.0% | ||||||||||||||||
AbbVie Inc. | 41,500 | 7,557,150 | ||||||||||||||
Amgen Inc. | 13,200 | 3,753,024 | ||||||||||||||
Gilead Sciences Inc. | 31,000 | 2,270,750 | ||||||||||||||
Total Biotechnology | 13,580,924 | |||||||||||||||
Health Care Equipment & Supplies — 0.9% | ||||||||||||||||
Medtronic PLC | 27,300 | 2,379,195 | ||||||||||||||
Health Care Providers & Services — 7.5% | ||||||||||||||||
Cardinal Health Inc. | 6,600 | 738,540 | ||||||||||||||
Cencora Inc. | 6,200 | 1,506,538 | ||||||||||||||
Centene Corp. | 11,000 | 863,280 | * | |||||||||||||
Cigna Group | 8,100 | 2,941,839 | ||||||||||||||
CVS Health Corp. | 25,800 | 2,057,808 | ||||||||||||||
DaVita Inc. | 2,100 | 289,905 | * | |||||||||||||
See Notes to Financial Statements.
8 | BrandywineGLOBAL — Diversified US Large Cap Value Fund 2024 Semi-Annual Report |
BrandywineGLOBAL — Diversified US Large Cap Value Fund
(Percentages shown based on Fund net assets)
| Security | Shares | Value | ||||||||||||||
Health Care Providers & Services — continued | ||||||||||||||||
Elevance Health Inc. | 7,500 | $ | 3,889,050 | |||||||||||||
HCA Healthcare Inc. | 10,100 | 3,368,653 | ||||||||||||||
Henry Schein Inc. | 3,300 | 249,216 | * | |||||||||||||
Laboratory Corp. of America Holdings | 2,900 | 633,534 | ||||||||||||||
McKesson Corp. | 4,900 | 2,630,565 | ||||||||||||||
Molina Healthcare Inc. | 800 | 328,664 | * | |||||||||||||
Quest Diagnostics Inc. | 4,100 | 545,751 | ||||||||||||||
Tenet Healthcare Corp. | 2,000 | 210,220 | * | |||||||||||||
Universal Health Services Inc., Class B Shares | 2,200 | 401,412 | ||||||||||||||
Total Health Care Providers & Services | 20,654,975 | |||||||||||||||
Pharmaceuticals — 3.0% | ||||||||||||||||
Jazz Pharmaceuticals PLC | 1,200 | 144,504 | * | |||||||||||||
Johnson & Johnson | 49,400 | 7,814,586 | ||||||||||||||
Viatris Inc. | 27,700 | 330,738 | ||||||||||||||
Total Pharmaceuticals | 8,289,828 | |||||||||||||||
Total Health Care | 44,904,922 | |||||||||||||||
| Industrials — 10.9% | ||||||||||||||||
Aerospace & Defense — 2.2% | ||||||||||||||||
Huntington Ingalls Industries Inc. | 1,000 | 291,470 | ||||||||||||||
L3Harris Technologies Inc. | 3,900 | 831,090 | ||||||||||||||
Lockheed Martin Corp. | 5,900 | 2,683,733 | ||||||||||||||
RTX Corp. | 17,400 | 1,697,022 | ||||||||||||||
Textron Inc. | 6,800 | 652,324 | ||||||||||||||
Total Aerospace & Defense | 6,155,639 | |||||||||||||||
Air Freight & Logistics — 0.7% | ||||||||||||||||
FedEx Corp. | 6,300 | 1,825,362 | ||||||||||||||
Building Products — 1.3% | ||||||||||||||||
Allegion PLC | 2,000 | 269,420 | ||||||||||||||
Builders FirstSource Inc. | 3,700 | 771,635 | * | |||||||||||||
Fortune Brands Innovations Inc. | 3,300 | 279,411 | ||||||||||||||
Johnson Controls International PLC | 15,800 | 1,032,056 | ||||||||||||||
Masco Corp. | 7,900 | 623,152 | ||||||||||||||
Owens Corning | 3,200 | 533,760 | ||||||||||||||
UFP Industries Inc. | 1,200 | 147,612 | ||||||||||||||
Total Building Products | 3,657,046 | |||||||||||||||
Electrical Equipment — 0.1% | ||||||||||||||||
Regal Rexnord Corp. | 900 | 162,090 | ||||||||||||||
Ground Transportation — 0.7% | ||||||||||||||||
CSX Corp. | 46,400 | 1,720,048 | ||||||||||||||
See Notes to Financial Statements.
| BrandywineGLOBAL — Diversified US Large Cap Value Fund 2024 Semi-Annual Report |
9 |
Schedule of investments (unaudited) (cont’d)
March 31, 2024
BrandywineGLOBAL — Diversified US Large Cap Value Fund
(Percentages shown based on Fund net assets)
| Security | Shares | Value | ||||||||||||||
Ground Transportation — continued | ||||||||||||||||
U-Haul Holding Co. | 400 | $ | 27,016 | * | ||||||||||||
U-Haul Holding Co., Non Voting Shares | 4,600 | 306,728 | ||||||||||||||
Total Ground Transportation | 2,053,792 | |||||||||||||||
Machinery — 4.9% | ||||||||||||||||
AGCO Corp. | 1,800 | 221,436 | ||||||||||||||
Caterpillar Inc. | 11,800 | 4,323,874 | ||||||||||||||
Cummins Inc. | 3,500 | 1,031,275 | ||||||||||||||
Deere & Co. | 6,800 | 2,793,032 | ||||||||||||||
Dover Corp. | 3,300 | 584,727 | ||||||||||||||
Middleby Corp. | 1,300 | 209,027 | * | |||||||||||||
Oshkosh Corp. | 1,500 | 187,065 | ||||||||||||||
PACCAR Inc. | 12,850 | 1,591,986 | ||||||||||||||
Parker-Hannifin Corp. | 3,000 | 1,667,370 | ||||||||||||||
Pentair PLC | 4,000 | 341,760 | ||||||||||||||
Snap-on Inc. | 1,400 | 414,708 | ||||||||||||||
Timken Co. | 1,400 | 122,402 | ||||||||||||||
Total Machinery | 13,488,662 | |||||||||||||||
Passenger Airlines — 0.2% | ||||||||||||||||
Delta Air Lines Inc. | 9,600 | 459,552 | ||||||||||||||
Professional Services — 0.3% | ||||||||||||||||
CACI International Inc., Class A Shares | 300 | 113,649 | * | |||||||||||||
Leidos Holdings Inc. | 3,400 | 445,706 | ||||||||||||||
Robert Half Inc. | 2,400 | 190,272 | ||||||||||||||
Science Applications International Corp. | 1,000 | 130,390 | ||||||||||||||
Total Professional Services | 880,017 | |||||||||||||||
Trading Companies & Distributors — 0.5% | ||||||||||||||||
United Rentals Inc. | 1,600 | 1,153,776 | ||||||||||||||
WESCO International Inc. | 700 | 119,896 | ||||||||||||||
Total Trading Companies & Distributors | 1,273,672 | |||||||||||||||
Total Industrials | 29,955,832 | |||||||||||||||
| Information Technology — 7.8% | ||||||||||||||||
Communications Equipment — 1.9% | ||||||||||||||||
Cisco Systems Inc. | 101,900 | 5,085,829 | ||||||||||||||
Electronic Equipment, Instruments & Components — 0.7% | ||||||||||||||||
Arrow Electronics Inc. | 2,300 | 297,758 | * | |||||||||||||
Corning Inc. | 20,900 | 688,864 | ||||||||||||||
Jabil Inc. | 4,500 | 602,775 | ||||||||||||||
TD SYNNEX Corp. | 2,200 | 248,820 | ||||||||||||||
Total Electronic Equipment, Instruments & Components | 1,838,217 | |||||||||||||||
See Notes to Financial Statements.
10 | BrandywineGLOBAL — Diversified US Large Cap Value Fund 2024 Semi-Annual Report |
BrandywineGLOBAL — Diversified US Large Cap Value Fund
(Percentages shown based on Fund net assets)
| Security | Shares | Value | ||||||||||||||
IT Services — 1.7% | ||||||||||||||||
Cognizant Technology Solutions Corp., Class A Shares | 11,700 | $ | 857,493 | |||||||||||||
International Business Machines Corp. | 19,800 | 3,781,008 | ||||||||||||||
Twilio Inc., Class A Shares | 2,600 | 158,990 | * | |||||||||||||
Total IT Services | 4,797,491 | |||||||||||||||
Semiconductors & Semiconductor Equipment — 2.3% | ||||||||||||||||
Amkor Technology Inc. | 3,200 | 103,168 | ||||||||||||||
Microchip Technology Inc. | 11,100 | 995,781 | ||||||||||||||
QUALCOMM Inc. | 27,600 | 4,672,680 | ||||||||||||||
Skyworks Solutions Inc. | 4,000 | 433,280 | ||||||||||||||
Total Semiconductors & Semiconductor Equipment | 6,204,909 | |||||||||||||||
Software — 0.1% | ||||||||||||||||
Gen Digital Inc. | 13,100 | 293,440 | ||||||||||||||
Technology Hardware, Storage & Peripherals — 1.1% | ||||||||||||||||
Dell Technologies Inc., Class C Shares | 5,900 | 673,249 | ||||||||||||||
Hewlett Packard Enterprise Co. | 39,200 | 695,016 | ||||||||||||||
HP Inc. | 38,900 | 1,175,558 | ||||||||||||||
NetApp Inc. | 4,800 | 503,856 | ||||||||||||||
Total Technology Hardware, Storage & Peripherals | 3,047,679 | |||||||||||||||
Total Information Technology | 21,267,565 | |||||||||||||||
| Materials — 3.2% | ||||||||||||||||
Chemicals — 1.1% | ||||||||||||||||
CF Industries Holdings Inc. | 3,900 | 324,519 | ||||||||||||||
Dow Inc. | 16,700 | 967,431 | ||||||||||||||
Eastman Chemical Co. | 2,900 | 290,638 | ||||||||||||||
LyondellBasell Industries NV, Class A Shares | 8,100 | 828,468 | ||||||||||||||
Olin Corp. | 3,200 | 188,160 | ||||||||||||||
PPG Industries Inc. | 3,100 | 449,190 | ||||||||||||||
Total Chemicals | 3,048,406 | |||||||||||||||
Construction Materials — 0.1% | ||||||||||||||||
Eagle Materials Inc. | 900 | 244,575 | ||||||||||||||
Containers & Packaging — 0.6% | ||||||||||||||||
Berry Global Group Inc. | 2,900 | 175,392 | ||||||||||||||
Crown Holdings Inc. | 4,200 | 332,892 | ||||||||||||||
Graphic Packaging Holding Co. | 7,600 | 221,768 | ||||||||||||||
International Paper Co. | 8,000 | 312,160 | ||||||||||||||
Packaging Corp. of America | 2,700 | 512,406 | ||||||||||||||
Total Containers & Packaging | 1,554,618 | |||||||||||||||
Metals & Mining — 1.4% | ||||||||||||||||
Cleveland-Cliffs Inc. | 11,800 | 268,332 | * | |||||||||||||
Commercial Metals Co. | 1,200 | 70,524 | ||||||||||||||
See Notes to Financial Statements.
| BrandywineGLOBAL — Diversified US Large Cap Value Fund 2024 Semi-Annual Report |
11 |
Schedule of investments (unaudited) (cont’d)
March 31, 2024
BrandywineGLOBAL — Diversified US Large Cap Value Fund
(Percentages shown based on Fund net assets)
| Security | Shares | Value | ||||||||||||||
Metals & Mining — continued | ||||||||||||||||
Nucor Corp. | 9,000 | $ | 1,781,100 | |||||||||||||
Reliance Inc. | 1,700 | 568,106 | ||||||||||||||
Steel Dynamics Inc. | 6,300 | 933,849 | ||||||||||||||
United States Steel Corp. | 5,600 | 228,368 | ||||||||||||||
Total Metals & Mining | 3,850,279 | |||||||||||||||
Total Materials | 8,697,878 | |||||||||||||||
| Real Estate — 0.0%†† | ||||||||||||||||
Real Estate Management & Development — 0.0%†† | ||||||||||||||||
Jones Lang LaSalle Inc. | 600 | 117,054 | * | |||||||||||||
| Utilities — 3.0% | ||||||||||||||||
Electric Utilities — 1.6% | ||||||||||||||||
Duke Energy Corp. | 18,400 | 1,779,464 | ||||||||||||||
Edison International | 8,300 | 587,059 | ||||||||||||||
OGE Energy Corp. | 4,800 | 164,640 | ||||||||||||||
Pinnacle West Capital Corp. | 2,800 | 209,244 | ||||||||||||||
PPL Corp. | 18,200 | 501,046 | ||||||||||||||
Southern Co. | 14,300 | 1,025,882 | ||||||||||||||
Total Electric Utilities | 4,267,335 | |||||||||||||||
Independent Power and Renewable Electricity Producers — 0.3% | ||||||||||||||||
Vistra Corp. | 10,400 | 724,360 | ||||||||||||||
Multi-Utilities — 1.1% | ||||||||||||||||
CenterPoint Energy Inc. | 10,200 | 290,598 | ||||||||||||||
Consolidated Edison Inc. | 8,000 | 726,480 | ||||||||||||||
Public Service Enterprise Group Inc. | 15,500 | 1,035,090 | ||||||||||||||
Sempra | 15,400 | 1,106,182 | ||||||||||||||
Total Multi-Utilities | 3,158,350 | |||||||||||||||
Total Utilities | 8,150,045 | |||||||||||||||
Total Common Stocks (Cost — $199,826,434) | 267,225,050 | |||||||||||||||
| Investments in Underlying Funds — 1.9% | ||||||||||||||||
iShares Trust — iShares Russell 1000 Value ETF (Cost — $5,256,130) | 30,000 | 5,373,300 | ||||||||||||||
Total Investments before Short-Term Investments (Cost — $205,082,564) |
| 272,598,350 | ||||||||||||||
| Rate | ||||||||||||||||
| Short-Term Investments — 0.4% | ||||||||||||||||
Western Asset Premier Institutional U.S. Treasury Reserves, Premium Shares (Cost — $994,220) | 5.242 | % | 994,220 | 994,220 | (a)(b) | |||||||||||
Total Investments — 99.8% (Cost — $206,076,784) | 273,592,570 | |||||||||||||||
Other Assets in Excess of Liabilities — 0.2% | 546,527 | |||||||||||||||
Total Net Assets — 100.0% | $ | 274,139,097 | ||||||||||||||
See Notes to Financial Statements.
12 | BrandywineGLOBAL — Diversified US Large Cap Value Fund 2024 Semi-Annual Report |
BrandywineGLOBAL — Diversified US Large Cap Value Fund
| †† | Represents less than 0.1%. |
| * | Non-income producing security. |
| (a) | Rate shown is one-day yield as of the end of the reporting period. |
| (b) | In this instance, as defined in the Investment Company Act of 1940, an “Affiliated Company” represents Fund ownership of at least 5% of the outstanding voting securities of an issuer, or a company which is under common ownership or control with the Fund. At March 31, 2024, the total market value of investments in Affiliated Companies was $994,220 and the cost was $994,220 (Note 8). |
Abbreviation(s) used in this schedule: | ||
| ETF | — Exchange-Traded Fund | |
See Notes to Financial Statements.
| BrandywineGLOBAL — Diversified US Large Cap Value Fund 2024 Semi-Annual Report |
13 |
Statement of assets and liabilities (unaudited)
March 31, 2024
| Assets: | ||||
Investments in unaffiliated securities, at value (Cost — $205,082,564) | $ | 272,598,350 | ||
Investments in affiliated securities, at value (Cost — $994,220) | 994,220 | |||
Cash | 240,399 | |||
Receivable for securities sold | 6,484,243 | |||
Dividends receivable from unaffiliated investments | 231,984 | |||
Receivable for Fund shares sold | 83,206 | |||
Dividends receivable from affiliated investments | 13,869 | |||
Security litigation proceeds receivable | 6,198 | |||
Prepaid expenses | 29,544 | |||
Total Assets | 280,682,013 | |||
| Liabilities: | ||||
Payable for securities purchased | 6,198,736 | |||
Payable for Fund shares repurchased | 123,211 | |||
Investment management fee payable | 117,162 | |||
Service and/or distribution fees payable | 14,623 | |||
Trustees’ fees payable | 4,868 | |||
Accrued expenses | 84,316 | |||
Total Liabilities | 6,542,916 | |||
| Total Net Assets | $ | 274,139,097 | ||
| Net Assets: | ||||
Par value (Note 7) | $ | 131 | ||
Paid-in capital in excess of par value | 199,320,647 | |||
Total distributable earnings (loss) | 74,818,319 | |||
| Total Net Assets | $ | 274,139,097 | ||
See Notes to Financial Statements.
14 | BrandywineGLOBAL — Diversified US Large Cap Value Fund 2024 Semi-Annual Report |
| Net Assets: | ||||
Class A | $65,543,848 | |||
Class C | $1,325,615 | |||
Class R | $253,460 | |||
Class I | $18,076,758 | |||
Class IS | $188,939,416 | |||
| Shares Outstanding: | ||||
Class A | 3,133,132 | |||
Class C | 64,069 | |||
Class R | 12,124 | |||
Class I | 863,290 | |||
Class IS | 9,023,180 | |||
| Net Asset Value: | ||||
Class A (and redemption price) | $20.92 | |||
Class C* | $20.69 | |||
Class R (and redemption price) | $20.91 | |||
Class I (and redemption price) | $20.94 | |||
Class IS (and redemption price) | $20.94 | |||
| Maximum Public Offering Price Per Share: | ||||
Class A (based on maximum initial sales charge of 5.50%) | $22.14 | |||
| * | Redemption price per share is NAV of Class C shares reduced by a 1.00% CDSC if shares are redeemed within one year from purchase payment (Note 2). |
See Notes to Financial Statements.
| BrandywineGLOBAL — Diversified US Large Cap Value Fund 2024 Semi-Annual Report |
15 |
Statement of operations (unaudited)
For the Six Months Ended March 31, 2024
| Investment Income: | ||||
Dividends from unaffiliated investments | $ | 2,953,132 | ||
Dividends from affiliated investments | 40,353 | |||
Total Investment Income | 2,993,485 | |||
| Expenses: | ||||
Investment management fee (Note 2) | 711,679 | |||
Service and/or distribution fees (Notes 2 and 5) | 82,377 | |||
Transfer agent fees (Notes 2 and 5) | 61,985 | |||
Registration fees | 45,286 | |||
Fund accounting fees | 33,751 | |||
Audit and tax fees | 17,211 | |||
Legal fees | 16,119 | |||
Trustees’ fees | 7,353 | |||
Shareholder reports | 4,785 | |||
Commitment fees (Note 9) | 923 | |||
Interest expense | 686 | |||
Insurance | 637 | |||
Custody fees | 510 | |||
Miscellaneous expenses | 3,645 | |||
Total Expenses | 986,947 | |||
Less: Fee waivers and/or expense reimbursements (Notes 2 and 5) | (80,496) | |||
Net Expenses | 906,451 | |||
| Net Investment Income | 2,087,034 | |||
| Realized and Unrealized Gain on Investments (Notes 1 and 3): | ||||
Net Realized Gain From Unaffiliated Investment Transactions | 7,706,444 | |||
Change in Net Unrealized Appreciation (Depreciation) From Unaffiliated Investments | 33,127,985 | |||
| Net Gain on Investments | 40,834,429 | |||
| Increase in Net Assets From Operations | $ | 42,921,463 | ||
See Notes to Financial Statements.
16 | BrandywineGLOBAL — Diversified US Large Cap Value Fund 2024 Semi-Annual Report |
Statements of changes in net assets
For the Six Months Ended March 31, 2024 (unaudited) and the Year Ended September 30, 2023 | 2024 | 2023 | ||||||
| Operations: | ||||||||
Net investment income | $ | 2,087,034 | $ | 3,690,451 | ||||
Net realized gain | 7,706,444 | 2,139,660 | ||||||
Change in net unrealized appreciation (depreciation) | 33,127,985 | 17,998,356 | ||||||
Increase in Net Assets From Operations | 42,921,463 | 23,828,467 | ||||||
| Distributions to Shareholders From (Notes 1 and 6): | ||||||||
Total distributable earnings | (4,182,026) | (21,749,807) | ||||||
Decrease in Net Assets From Distributions to Shareholders | (4,182,026) | (21,749,807) | ||||||
| Fund Share Transactions (Note 7): | ||||||||
Net proceeds from sale of shares | 55,382,821 | 70,934,117 | ||||||
Reinvestment of distributions | 4,172,012 | 21,672,891 | ||||||
Cost of shares repurchased | (28,558,721) | (48,975,128) | ||||||
Increase in Net Assets From Fund Share Transactions | 30,996,112 | 43,631,880 | ||||||
Increase in Net Assets | 69,735,549 | 45,710,540 | ||||||
| Net Assets: | ||||||||
Beginning of period | 204,403,548 | 158,693,008 | ||||||
End of period | $ | 274,139,097 | $ | 204,403,548 | ||||
See Notes to Financial Statements.
| BrandywineGLOBAL — Diversified US Large Cap Value Fund 2024 Semi-Annual Report |
17 |
| For a share of each class of beneficial interest outstanding throughout each year ended September 30, unless otherwise noted: | ||||||||||||||||||||||||
| Class A Shares1 | 20242 | 2023 | 2022 | 2021 | 2020 | 2019 | ||||||||||||||||||
| Net asset value, beginning of period | $17.65 | $17.35 | $21.65 | $16.66 | $19.77 | $21.85 | ||||||||||||||||||
| Income (loss) from operations: | ||||||||||||||||||||||||
Net investment income | 0.15 | 0.31 | 0.29 | 0.25 | 0.31 | 0.32 | ||||||||||||||||||
Net realized and unrealized gain (loss) | 3.43 | 2.41 | (2.08) | 6.00 | (1.31) | (0.52) | ||||||||||||||||||
Total income (loss) from operations | 3.58 | 2.72 | (1.79) | 6.25 | (1.00) | (0.20) | ||||||||||||||||||
| Less distributions from: | ||||||||||||||||||||||||
Net investment income | (0.29) | (0.31) | (0.16) | (0.37) | (0.49) | (0.29) | ||||||||||||||||||
Net realized gains | (0.02) | (2.11) | (2.35) | (0.89) | (1.62) | (1.59) | ||||||||||||||||||
Total distributions | (0.31) | (2.42) | (2.51) | (1.26) | (2.11) | (1.88) | ||||||||||||||||||
| Net asset value, end of period | $20.92 | $17.65 | $17.35 | $21.65 | $16.66 | $19.77 | ||||||||||||||||||
Total return3 | 20.49 | % | 15.31 | % | (9.62) | % | 38.09 | % | (6.24) | % | (0.36) | % | ||||||||||||
| Net assets, end of period (000s) | $65,544 | $57,178 | $43,784 | $44,626 | $1,361 | $2,440 | ||||||||||||||||||
| Ratios to average net assets: | ||||||||||||||||||||||||
Gross expenses | 1.17 | %4 | 1.21 | % | 1.18 | % | 1.18 | % | 1.18 | %5 | 1.13 | %5 | ||||||||||||
Net expenses6,7,8 | 1.10 | 4 | 1.10 | 1.10 | 1.09 | 1.10 | 5 | 1.10 | 5 | |||||||||||||||
Net investment income | 1.64 | 4 | 1.72 | 1.45 | 1.16 | 1.76 | 1.68 | |||||||||||||||||
| Portfolio turnover rate | 36 | % | 58 | % | 62 | %9 | 75 | %9 | 54 | % | 51 | %9 | ||||||||||||
| 1 | Per share amounts have been calculated using the average shares method. |
| 2 | For the six months ended March 31, 2024 (unaudited). |
| 3 | Performance figures, exclusive of sales charges, may reflect compensating balance arrangements, fee waivers and/or expense reimbursements. In the absence of compensating balance arrangements, fee waivers and/or expense reimbursements, the total return would have been lower. Past performance is no guarantee of future results. Total returns for periods of less than one year are not annualized. |
| 4 | Annualized. |
| 5 | Reflects recapture of fees waived and/or expenses reimbursed from prior fiscal years. |
| 6 | Reflects fee waivers and/or expense reimbursements. |
| 7 | As a result of an expense limitation arrangement, the ratio of total annual fund operating expenses, other than interest, brokerage commissions, dividend expense on short sales, taxes, extraordinary expenses and acquired fund fees and expenses, to average net assets of Class A shares did not exceed 1.15%. This expense limitation arrangement cannot be terminated prior to December 31, 2025 without the Board of Trustees’ consent. In addition, the manager has agreed to waive the Fund’s management fee to an extent sufficient to offset the net management fee payable in connection with any investment in an affiliated money market fund. |
| 8 | As a result of a voluntary expense limitation arrangement, the ratio of total annual fund operating expenses, other than interest, brokerage commissions, dividend expense on short sales, taxes, extraordinary expenses and acquired fund fees and expenses, to average net assets of Class A shares did not exceed 1.10%. This expense limitation arrangement is expected to continue until December 31, 2025, but may be terminated at any time by the manager. |
| 9 | Excludes securities delivered as a result of a redemption in-kind. |
See Notes to Financial Statements.
18 | BrandywineGLOBAL — Diversified US Large Cap Value Fund 2024 Semi-Annual Report |
| For a share of each class of beneficial interest outstanding throughout each year ended September 30, unless otherwise noted: | ||||||||||||||||||||||||
| Class C Shares1 | 20242 | 2023 | 2022 | 2021 | 2020 | 2019 | ||||||||||||||||||
| Net asset value, beginning of period | $17.33 | $17.18 | $21.48 | $16.61 | $19.21 | $21.50 | ||||||||||||||||||
| Income (loss) from operations: | ||||||||||||||||||||||||
Net investment income | 0.08 | 0.18 | 0.15 | 0.10 | 0.31 | 3 | 0.18 | |||||||||||||||||
Net realized and unrealized gain (loss) | 3.38 | 2.39 | (2.07) | 5.96 | (1.29) | (0.56) | ||||||||||||||||||
Total income (loss) from operations | 3.46 | 2.57 | (1.92) | 6.06 | (0.98) | (0.38) | ||||||||||||||||||
| Less distributions from: | ||||||||||||||||||||||||
Net investment income | (0.08) | (0.31) | (0.03) | (0.30) | — | (0.32) | ||||||||||||||||||
Net realized gains | (0.02) | (2.11) | (2.35) | (0.89) | (1.62) | (1.59) | ||||||||||||||||||
Total distributions | (0.10) | (2.42) | (2.38) | (1.19) | (1.62) | (1.91) | ||||||||||||||||||
| Net asset value, end of period | $20.69 | $17.33 | $17.18 | $21.48 | $16.61 | $19.21 | ||||||||||||||||||
Total return4 | 20.02 | % | 14.44 | % | (10.22) | % | 37.16 | % | (6.06) | %3 | (1.29) | % | ||||||||||||
| Net assets, end of period (000s) | $1,326 | $1,780 | $411 | $127 | $141 | $213 | ||||||||||||||||||
| Ratios to average net assets: | ||||||||||||||||||||||||
Gross expenses | 1.92 | %5 | 1.94 | %6 | 1.98 | % | 2.21 | % | 2.34 | %6 | 1.89 | %6 | ||||||||||||
Net expenses7,8,9 | 1.85 | 5 | 1.85 | 6 | 1.85 | 1.85 | 1.08 | 3,6 | 1.85 | 6 | ||||||||||||||
Net investment income | 0.92 | 5 | 1.01 | 0.76 | 0.50 | 1.81 | 3 | 0.96 | ||||||||||||||||
| Portfolio turnover rate | 36 | % | 58 | % | 62 | %10 | 75 | %10 | 54 | % | 51 | %10 | ||||||||||||
| 1 | Per share amounts have been calculated using the average shares method. |
| 2 | For the six months ended March 31, 2024 (unaudited). |
| 3 | Ratios and total return for Class C for the year ended September 30, 2020 reflect prior period 12b-1 fee reimbursements. If these reimbursements were not included, net investment income per share would have been $0.20, total return would have been (6.80)% and the net expense and net investment income ratios would have been 1.71% and 1.18%, respectively. |
| 4 | Performance figures, exclusive of CDSC, may reflect compensating balance arrangements, fee waivers and/or expense reimbursements. In the absence of compensating balance arrangements, fee waivers and/or expense reimbursements, the total return would have been lower. Past performance is no guarantee of future results. Total returns for periods of less than one year are not annualized. |
| 5 | Annualized. |
| 6 | Reflects recapture of fees waived and/or expenses reimbursed from prior fiscal years. |
| 7 | Reflects fee waivers and/or expense reimbursements. |
| 8 | As a result of an expense limitation arrangement, the ratio of total annual fund operating expenses, other than interest, brokerage commissions, dividend expense on short sales, taxes, extraordinary expenses and acquired fund fees and expenses, to average net assets of Class C shares did not exceed 1.90%. This expense limitation arrangement cannot be terminated prior to December 31, 2025 without the Board of Trustees’ consent. In addition, the manager has agreed to waive the Fund’s management fee to an extent sufficient to offset the net management fee payable in connection with any investment in an affiliated money market fund. |
| 9 | As a result of a voluntary expense limitation arrangement, the ratio of total annual fund operating expenses, other than interest, brokerage commissions, dividend expense on short sales, taxes, extraordinary expenses and acquired fund fees and expenses, to average net assets of Class C shares did not exceed 1.85%. This expense limitation arrangement is expected to continue until December 31, 2025, but may be terminated at any time by the manager. |
| 10 | Excludes securities delivered as a result of a redemption in-kind. |
See Notes to Financial Statements.
| BrandywineGLOBAL — Diversified US Large Cap Value Fund 2024 Semi-Annual Report |
19 |
Financial highlights (cont’d)
| For a share of each class of beneficial interest outstanding throughout each year ended September 30, unless otherwise noted: | ||||||||||||||||||||||||
| Class R Shares1 | 20242 | 2023 | 2022 | 2021 | 2020 | 2019 | ||||||||||||||||||
| Net asset value, beginning of period | $17.62 | $17.33 | $21.53 | $16.58 | $19.70 | $21.80 | ||||||||||||||||||
| Income (loss) from operations: | ||||||||||||||||||||||||
Net investment income | 0.13 | 0.26 | 0.24 | 0.20 | 0.27 | 0.28 | ||||||||||||||||||
Net realized and unrealized gain (loss) | 3.43 | 2.41 | (2.09) | 5.97 | (1.30) | (0.53) | ||||||||||||||||||
Total income (loss) from operations | 3.56 | 2.67 | (1.85) | 6.17 | (1.03) | (0.25) | ||||||||||||||||||
| Less distributions from: | ||||||||||||||||||||||||
Net investment income | (0.25) | (0.27) | (0.00) | 3 | (0.33) | (0.47) | (0.26) | |||||||||||||||||
Net realized gains | (0.02) | (2.11) | (2.35) | (0.89) | (1.62) | (1.59) | ||||||||||||||||||
Total distributions | (0.27) | (2.38) | (2.35) | (1.22) | (2.09) | (1.85) | ||||||||||||||||||
| Net asset value, end of period | $20.91 | $17.62 | $17.33 | $21.53 | $16.58 | $19.70 | ||||||||||||||||||
Total return4 | 20.39 | % | 14.98 | % | (9.83) | % | 37.74 | % | (6.44) | % | (0.62) | % | ||||||||||||
| Net assets, end of period (000s) | $253 | $209 | $146 | $198 | $118 | $107 | ||||||||||||||||||
| Ratios to average net assets: | ||||||||||||||||||||||||
Gross expenses | 1.55 | %5 | 1.57 | % | 1.59 | % | 1.62 | % | 1.68 | % | 1.58 | %6 | ||||||||||||
Net expenses7,8,9 | 1.35 | 5 | 1.35 | 1.35 | 1.35 | 1.35 | 1.35 | 6 | ||||||||||||||||
Net investment income | 1.38 | 5 | 1.46 | 1.19 | 0.97 | 1.55 | 1.44 | |||||||||||||||||
| Portfolio turnover rate | 36 | % | 58 | % | 62 | %10 | 75 | %10 | 54 | % | 51 | %10 | ||||||||||||
| 1 | Per share amounts have been calculated using the average shares method. |
| 2 | For the six months ended March 31, 2024 (unaudited). |
| 3 | Amount represents less than $0.005 or greater than $(0.005) per share. |
| 4 | Performance figures may reflect compensating balance arrangements, fee waivers and/or expense reimbursements. In the absence of compensating balance arrangements, fee waivers and/or expense reimbursements, the total return would have been lower. Past performance is no guarantee of future results. Total returns for periods of less than one year are not annualized. |
| 5 | Annualized. |
| 6 | Reflects recapture of fees waived and/or expenses reimbursed from prior fiscal years. |
| 7 | Reflects fee waivers and/or expense reimbursements. |
| 8 | As a result of an expense limitation arrangement, the ratio of total annual fund operating expenses, other than interest, brokerage commissions, dividend expense on short sales, taxes, extraordinary expenses and acquired fund fees and expenses, to average net assets of Class R shares did not exceed 1.40%. This expense limitation arrangement cannot be terminated prior to December 31, 2025 without the Board of Trustees’ consent. In addition, the manager has agreed to waive the Fund’s management fee to an extent sufficient to offset the net management fee payable in connection with any investment in an affiliated money market fund. |
| 9 | As a result of a voluntary expense limitation arrangement, the ratio of total annual fund operating expenses, other than interest, brokerage commissions, dividend expense on short sales, taxes, extraordinary expenses and acquired fund fees and expenses, to average net assets of Class R shares did not exceed 1.35%. This expense limitation arrangement is expected to continue until December 31, 2025, but may be terminated at any time by the manager. |
| 10 | Excludes securities delivered as a result of a redemption in-kind. |
See Notes to Financial Statements.
20 | BrandywineGLOBAL — Diversified US Large Cap Value Fund 2024 Semi-Annual Report |
| For a share of each class of beneficial interest outstanding throughout each year ended September 30, unless otherwise noted: | ||||||||||||||||||||||||
| Class I Shares1 | 20242 | 2023 | 2022 | 2021 | 2020 | 2019 | ||||||||||||||||||
| Net asset value, beginning of period | $17.69 | $17.37 | $21.66 | $16.70 | $19.79 | $21.88 | ||||||||||||||||||
| Income (loss) from operations: | ||||||||||||||||||||||||
Net investment income | 0.18 | 0.36 | 0.35 | 0.32 | 0.37 | 0.37 | ||||||||||||||||||
Net realized and unrealized gain (loss) | 3.43 | 2.43 | (2.09) | 6.00 | (1.31) | (0.52) | ||||||||||||||||||
Total income (loss) from operations | 3.61 | 2.79 | (1.74) | 6.32 | (0.94) | (0.15) | ||||||||||||||||||
| Less distributions from: | ||||||||||||||||||||||||
Net investment income | (0.34) | (0.36) | (0.20) | (0.47) | (0.53) | (0.35) | ||||||||||||||||||
Net realized gains | (0.02) | (2.11) | (2.35) | (0.89) | (1.62) | (1.59) | ||||||||||||||||||
Total distributions | (0.36) | (2.47) | (2.55) | (1.36) | (2.15) | (1.94) | ||||||||||||||||||
| Net asset value, end of period | $20.94 | $17.69 | $17.37 | $21.66 | $16.70 | $19.79 | ||||||||||||||||||
Total return3 | 20.67 | % | 15.65 | % | (9.34) | % | 38.51 | % | (5.93) | % | (0.10) | % | ||||||||||||
| Net assets, end of period (000s) | $18,077 | $28,570 | $20,648 | $9,048 | $3,630 | $4,743 | ||||||||||||||||||
| Ratios to average net assets: | ||||||||||||||||||||||||
Gross expenses | 0.89 | %4 | 0.89 | %5 | 0.88 | % | 0.84 | % | 0.85 | %5 | 0.83 | %5 | ||||||||||||
Net expenses6,7 | 0.80 | 4 | 0.80 | 5 | 0.80 | 0.80 | 0.80 | 5 | 0.80 | 5 | ||||||||||||||
Net investment income | 1.97 | 4 | 1.99 | 1.77 | 1.54 | 2.09 | 1.92 | |||||||||||||||||
| Portfolio turnover rate | 36 | % | 58 | % | 62 | %8 | 75 | %8 | 54 | % | 51 | %8 | ||||||||||||
| 1 | Per share amounts have been calculated using the average shares method. |
| 2 | For the six months ended March 31, 2024 (unaudited). |
| 3 | Performance figures may reflect compensating balance arrangements, fee waivers and/or expense reimbursements. In the absence of compensating balance arrangements, fee waivers and/or expense reimbursements, the total return would have been lower. Past performance is no guarantee of future results. Total returns for periods of less than one year are not annualized. |
| 4 | Annualized. |
| 5 | Reflects recapture of fees waived and/or expenses reimbursed from prior fiscal years. |
| 6 | Reflects fee waivers and/or expense reimbursements. |
| 7 | As a result of an expense limitation arrangement, the ratio of total annual fund operating expenses, other than interest, brokerage commissions, dividend expense on short sales, taxes, extraordinary expenses and acquired fund fees and expenses, to average net assets of Class I shares did not exceed 0.80%. This expense limitation arrangement cannot be terminated prior to December 31, 2025 without the Board of Trustees’ consent. In addition, the manager has agreed to waive the Fund’s management fee to an extent sufficient to offset the net management fee payable in connection with any investment in an affiliated money market fund. |
| 8 | Excludes securities delivered as a result of a redemption in-kind. |
See Notes to Financial Statements.
| BrandywineGLOBAL — Diversified US Large Cap Value Fund 2024 Semi-Annual Report |
21 |
Financial highlights (cont’d)
| For a share of each class of beneficial interest outstanding throughout each year ended September 30, unless otherwise noted: | ||||||||||||||||||||||||
| Class IS Shares1 | 20242 | 2023 | 2022 | 2021 | 2020 | 2019 | ||||||||||||||||||
| Net asset value, beginning of period | $17.70 | $17.39 | $21.66 | $16.71 | $19.82 | $21.91 | ||||||||||||||||||
| Income (loss) from operations: | ||||||||||||||||||||||||
Net investment income | 0.19 | 0.38 | 0.36 | 0.33 | 0.38 | 0.40 | ||||||||||||||||||
Net realized and unrealized gain (loss) | 3.43 | 2.42 | (2.07) | 6.01 | (1.30) | (0.53) | ||||||||||||||||||
Total income (loss) from operations | 3.62 | 2.80 | (1.71) | 6.34 | (0.92) | (0.13) | ||||||||||||||||||
| Less distributions from: | ||||||||||||||||||||||||
Net investment income | (0.36) | (0.38) | (0.21) | (0.50) | (0.57) | (0.37) | ||||||||||||||||||
Net realized gains | (0.02) | (2.11) | (2.35) | (0.89) | (1.62) | (1.59) | ||||||||||||||||||
Total distributions | (0.38) | (2.49) | (2.56) | (1.39) | (2.19) | (1.96) | ||||||||||||||||||
| Net asset value, end of period | $20.94 | $17.70 | $17.39 | $21.66 | $16.71 | $19.82 | ||||||||||||||||||
Total return3 | 20.72 | % | 15.77 | % | (9.25) | % | 38.64 | % | (5.82) | % | 0.01 | % | ||||||||||||
| Net assets, end of period (000s) | $188,939 | $116,667 | $93,704 | $257,706 | $424,811 | $592,807 | ||||||||||||||||||
| Ratios to average net assets: | ||||||||||||||||||||||||
Gross expenses | 0.77 | %4 | 0.79 | % | 0.75 | % | 0.72 | % | 0.73 | %5 | 0.72 | %5 | ||||||||||||
Net expenses6,7 | 0.70 | 4 | 0.70 | 0.70 | 0.70 | 0.70 | 5 | 0.70 | 5 | |||||||||||||||
Net investment income | 2.02 | 4 | 2.12 | 1.73 | 1.62 | 2.17 | 2.08 | |||||||||||||||||
| Portfolio turnover rate | 36 | % | 58 | % | 62 | %8 | 75 | %8 | 54 | % | 51 | %8 | ||||||||||||
| 1 | Per share amounts have been calculated using the average shares method. |
| 2 | For the six months ended March 31, 2024 (unaudited). |
| 3 | Performance figures may reflect compensating balance arrangements, fee waivers and/or expense reimbursements. In the absence of compensating balance arrangements, fee waivers and/or expense reimbursements, the total return would have been lower. Past performance is no guarantee of future results. Total returns for periods of less than one year are not annualized. |
| 4 | Annualized. |
| 5 | Reflects recapture of fees waived and/or expenses reimbursed from prior fiscal years. |
| 6 | Reflects fee waivers and/or expense reimbursements. |
| 7 | As a result of an expense limitation arrangement, the ratio of total annual fund operating expenses, other than interest, brokerage commissions, dividend expense on short sales, taxes, extraordinary expenses and acquired fund fees and expenses, to average net assets of Class IS shares did not exceed 0.70%. In addition, the ratio of total annual fund operating expenses for Class IS shares did not exceed the ratio of total annual fund operating expenses for Class I shares. These expense limitation arrangements cannot be terminated prior to December 31, 2025 without the Board of Trustees’ consent. In addition, the manager has agreed to waive the Fund’s management fee to an extent sufficient to offset the net management fee payable in connection with any investment in an affiliated money market fund. |
| 8 | Excludes securities delivered as a result of a redemption in-kind. |
See Notes to Financial Statements.
22 | BrandywineGLOBAL — Diversified US Large Cap Value Fund 2024 Semi-Annual Report |
Notes to financial statements (unaudited)
1. Organization and significant accounting policies
BrandywineGLOBAL — Diversified US Large Cap Value Fund (the “Fund”) is a separate diversified investment series of Legg Mason Global Asset Management Trust (the “Trust”). The Trust, a Maryland statutory trust, is registered under the Investment Company Act of 1940, as amended (the “1940 Act”), as an open-end management investment company.
The Fund follows the accounting and reporting guidance in Financial Accounting Standards Board (“FASB”) Accounting Standards Codification Topic 946, Financial Services – Investment Companies (“ASC 946”). The following are significant accounting policies consistently followed by the Fund and are in conformity with U.S. generally accepted accounting principles (“GAAP”), including, but not limited to, ASC 946. Estimates and assumptions are required to be made regarding assets, liabilities and changes in net assets resulting from operations when financial statements are prepared. Changes in the economic environment, financial markets and any other parameters used in determining these estimates could cause actual results to differ. Subsequent events have been evaluated through the date the financial statements were issued.
(a) Investment valuation. Equity securities, including exchange-traded funds (“ETF”), for which market quotations are available are valued at the last reported sales price or official closing price on the primary market or exchange on which they trade. The valuations for fixed income securities (which may include, but are not limited to, corporate, government, municipal, mortgage-backed, collateralized mortgage obligations and asset-backed securities) and certain derivative instruments are typically the prices supplied by independent third party pricing services, which may use market prices or broker/dealer quotations or a variety of valuation techniques and methodologies. The independent third party pricing services typically use inputs that are observable such as issuer details, interest rates, yield curves, prepayment speeds, credit risks/spreads, default rates and quoted prices for similar securities. Investments in open-end funds are valued at the closing net asset value per share of each fund on the day of valuation. When the Fund holds securities or other assets that are denominated in a foreign currency, the Fund will normally use the currency exchange rates as of 4:00 p.m. (Eastern Time). If independent third party pricing services are unable to supply prices for a portfolio investment, or if the prices supplied are deemed by the manager to be unreliable, the market price may be determined by the manager using quotations from one or more broker/dealers or at the transaction price if the security has recently been purchased and no value has yet been obtained from a pricing service or pricing broker. When reliable prices are not readily available, such as when the value of a security has been significantly affected by events after the close of the exchange or market on which the security is principally traded, but before the Fund calculates its net asset value, the Fund values these securities as determined in accordance with procedures approved by the Fund’s Board of Trustees.
| BrandywineGLOBAL — Diversified US Large Cap Value Fund 2024 Semi-Annual Report |
23 |
Notes to financial statements (unaudited) (cont’d)
Pursuant to policies adopted by the Board of Trustees, the Fund’s manager has been designated as the valuation designee and is responsible for the oversight of the daily valuation process. The Fund’s manager is assisted by the Global Fund Valuation Committee (the “Valuation Committee”). The Valuation Committee is responsible for making fair value determinations, evaluating the effectiveness of the Fund’s pricing policies, and reporting to the Fund’s manager and the Board of Trustees. When determining the reliability of third party pricing information for investments owned by the Fund, the Valuation Committee, among other things, conducts due diligence reviews of pricing vendors, monitors the daily change in prices and reviews transactions among market participants.
The Valuation Committee will consider pricing methodologies it deems relevant and appropriate when making fair value determinations. Examples of possible methodologies include, but are not limited to, multiple of earnings; discount from market of a similar freely traded security; discounted cash-flow analysis; book value or a multiple thereof; risk premium/yield analysis; yield to maturity; and/or fundamental investment analysis. The Valuation Committee will also consider factors it deems relevant and appropriate in light of the facts and circumstances. Examples of possible factors include, but are not limited to, the type of security; the issuer’s financial statements; the purchase price of the security; the discount from market value of unrestricted securities of the same class at the time of purchase; analysts’ research and observations from financial institutions; information regarding any transactions or offers with respect to the security; the existence of merger proposals or tender offers affecting the security; the price and extent of public trading in similar securities of the issuer or comparable companies; and the existence of a shelf registration for restricted securities.
For each portfolio security that has been fair valued pursuant to the policies adopted by the Board of Trustees, the fair value price is compared against the last available and next available market quotations. The Valuation Committee reviews the results of such back testing monthly and fair valuation occurrences are reported to the Board of Trustees quarterly.
The Fund uses valuation techniques to measure fair value that are consistent with the market approach and/or income approach, depending on the type of security and the particular circumstance. The market approach uses prices and other relevant information generated by market transactions involving identical or comparable securities. The income approach uses valuation techniques to discount estimated future cash flows to present value.
24 | BrandywineGLOBAL — Diversified US Large Cap Value Fund 2024 Semi-Annual Report |
GAAP establishes a disclosure hierarchy that categorizes the inputs to valuation techniques used to value assets and liabilities at measurement date. These inputs are summarized in the three broad levels listed below:
| • | Level 1 — unadjusted quoted prices in active markets for identical investments |
| • | Level 2 — other significant observable inputs (including quoted prices for similar investments, interest rates, prepayment speeds, credit risk, etc.) |
| • | Level 3 — significant unobservable inputs (including the Fund’s own assumptions in determining the fair value of investments) |
The inputs or methodologies used to value securities are not necessarily an indication of the risk associated with investing in those securities.
The following is a summary of the inputs used in valuing the Fund’s assets carried at fair value:
| ASSETS | ||||||||||||||||
| Description | Quoted Prices (Level 1) | Other Significant Observable Inputs (Level 2) | Significant Unobservable Inputs (Level 3) | Total | ||||||||||||
| Long-Term Investments†: | ||||||||||||||||
Common Stocks | $ | 267,225,050 | — | — | $ | 267,225,050 | ||||||||||
Investments in Underlying Funds | 5,373,300 | — | — | 5,373,300 | ||||||||||||
| Total Long-Term Investments | 272,598,350 | — | — | 272,598,350 | ||||||||||||
| Short-Term Investments† | 994,220 | — | — | 994,220 | ||||||||||||
| Total Investments | $ | 273,592,570 | — | — | $ | 273,592,570 | ||||||||||
| † | See Schedule of Investments for additional detailed categorizations. |
(b) Security transactions and investment income. Security transactions are accounted for on a trade date basis. Interest income (including interest income from payment-in-kind securities) is recorded on the accrual basis. Amortization of premiums and accretion of discounts on debt securities are recorded to interest income over the lives of the respective securities, except for premiums on certain callable debt securities, which are amortized to the earliest call date. Dividend income is recorded on the ex-dividend date for dividends received in cash and/or securities. Foreign dividend income is recorded on the ex-dividend date or as soon as practicable after the Fund determines the existence of a dividend declaration after exercising reasonable due diligence. The cost of investments sold is determined by use of the specific identification method. To the extent any issuer defaults or a credit event occurs that impacts the issuer, the Fund may halt any additional interest income accruals and consider the realizability of interest accrued up to the date of default or credit event.
| BrandywineGLOBAL — Diversified US Large Cap Value Fund 2024 Semi-Annual Report |
25 |
Notes to financial statements (unaudited) (cont’d)
(c) Distributions to shareholders. Distributions from net investment income and distributions of net realized gains, if any, are declared at least annually. Distributions to shareholders of the Fund are recorded on the ex-dividend date and are determined in accordance with income tax regulations, which may differ from GAAP.
(d) Share class accounting. Investment income, common expenses and realized/unrealized gains (losses) on investments are allocated to the various classes of the Fund on the basis of daily net assets of each class. Fees relating to a specific class are charged directly to that share class.
(e) Compensating balance arrangements. The Fund has an arrangement with its custodian bank whereby a portion of the custodian’s fees is paid indirectly by credits earned on the Fund’s cash on deposit with the bank.
(f) Federal and other taxes. It is the Fund’s policy to comply with the federal income and excise tax requirements of the Internal Revenue Code of 1986 (the “Code”), as amended, applicable to regulated investment companies. Accordingly, the Fund intends to distribute its taxable income and net realized gains, if any, to shareholders in accordance with timing requirements imposed by the Code. Therefore, no federal or state income tax provision is required in the Fund’s financial statements.
Management has analyzed the Fund’s tax positions taken on income tax returns for all open tax years and has concluded that as of September 30, 2023, no provision for income tax is required in the Fund’s financial statements. The Fund’s federal and state income and federal excise tax returns for tax years for which the applicable statutes of limitations have not expired are subject to examination by the Internal Revenue Service and state departments of revenue.
(g) Reclassification. GAAP requires that certain components of net assets be reclassified to reflect permanent differences between financial and tax reporting. These reclassifications have no effect on net assets or net asset value per share.
2. Investment management agreement and other transactions with affiliates
Franklin Templeton Fund Adviser, LLC (“FTFA”) (formerly known as Legg Mason Partners Fund Advisor, LLC prior to November 30, 2023) is the Fund’s investment manager and Brandywine Global Investment Management, LLC (“Brandywine Global”) is the Fund’s subadviser. FTFA and Brandywine Global are indirect, wholly-owned subsidiaries of Franklin Resources, Inc. (“Franklin Resources”).
26 | BrandywineGLOBAL — Diversified US Large Cap Value Fund 2024 Semi-Annual Report |
Under the investment management agreement, the Fund pays an investment management fee, calculated daily and paid monthly, in accordance with the following breakpoint schedule:
| Average Daily Net Assets | Annual Rate | |||
| First $1 billion | 0.650 | % | ||
| Next $1 billion | 0.625 | |||
| Next $3 billion | 0.600 | |||
| Next $5 billion | 0.575 | |||
| Over $10 billion | 0.550 | |||
FTFA provides administrative and certain oversight services to the Fund. FTFA delegates to the subadviser the day-to-day portfolio management of the Fund. For its services, FTFA pays Brandywine Global a fee monthly, at an annual rate equal to 90% of the net management fee it receives from the Fund.
As a result of expense limitation arrangements between the Fund and FTFA, the ratio of total annual fund operating expenses, other than interest, brokerage commissions, dividend expense on short sales, taxes, extraordinary expenses and acquired fund fees and expenses, to average net assets of Class A, Class C, Class R, Class I and Class IS shares did not exceed 1.15%, 1.90%, 1.40%, 0.80% and 0.70%, respectively. In addition, the ratio of total annual fund operating expenses for Class IS shares did not exceed the ratio of total annual fund operating expenses for Class I shares. These expense limitation arrangements cannot be terminated prior to December 31, 2025 without the Board of Trustees’ consent. In addition, the manager has agreed to waive the Fund’s management fee to an extent sufficient to offset the net management fee payable in connection with any investment in an affiliated money market fund (the “affiliated money market fund waiver”). The affiliated money market fund waiver is not subject to the recapture provision discussed below.
As a result of voluntary expense limitation arrangements, the ratio of total annual fund operating expenses, other than interest, brokerage commissions, dividend expense on short sales, taxes, extraordinary expenses and acquired fund fees and expenses, to average net assets of Class A, Class C and Class R shares did not exceed 1.10%, 1.85% and 1.35%, respectively. These arrangements are expected to continue until December 31, 2025, but may be terminated at any time by FTFA.
During the six months ended March 31, 2024, fees waived and/or expenses reimbursed amounted to $80,496, which included an affiliated money market fund waiver of $959.
FTFA is permitted to recapture amounts waived and/or reimbursed to a class within three years after the fiscal year in which FTFA earned the fee or incurred the expense if the class’ total annual fund operating expenses have fallen to a level below the expense limitation (“expense cap”) in effect at the time the fees were earned or the expenses incurred. In no case will FTFA recapture any amount that would result, on any particular business day of
| BrandywineGLOBAL — Diversified US Large Cap Value Fund 2024 Semi-Annual Report |
27 |
Notes to financial statements (unaudited) (cont’d)
the Fund, in the class’ total annual fund operating expenses exceeding the expense cap or any other lower limit then in effect.
Pursuant to these arrangements, at March 31, 2024, the Fund had remaining fee waivers and/or expense reimbursements subject to recapture by FTFA and respective dates of expiration as follows:
| Class A | Class C | Class R | Class I | Class IS | ||||||||||||||||
| Expires September 30, 2024 | $ | 9,988 | $ | 22 | $ | 464 | $ | 786 | $ | 71,869 | ||||||||||
| Expires September 30, 2025 | 37,871 | 155 | 387 | 14,964 | 102,352 | |||||||||||||||
| Expires September 30, 2026 | 60,410 | 1,699 | 417 | 22,337 | 95,939 | |||||||||||||||
| Expires September 30, 2027 | 21,110 | 551 | 222 | 10,972 | 46,682 | |||||||||||||||
| Total fee waivers/expense reimbursements subject to recapture | $ | 129,379 | $ | 2,427 | $ | 1,490 | $ | 49,059 | $ | 316,842 | ||||||||||
For the six months ended March 31, 2024, FTFA did not recapture any fees.
Franklin Distributors, LLC (“Franklin Distributors”) serves as the Fund’s sole and exclusive distributor. Franklin Distributors is an indirect, wholly-owned broker-dealer subsidiary of Franklin Resources. Franklin Templeton Investor Services, LLC (“Investor Services”) serves as the Fund’s shareholder servicing agent and acts as the Fund’s transfer agent and dividend-paying agent. Investor Services is an indirect, wholly-owned subsidiary of Franklin Resources. Each class of shares of the Fund pays transfer agent fees to Investor Services for its performance of shareholder servicing obligations. Investor Services charges account-based fees based on the number of individual shareholder accounts, as well as a fixed percentage fee based on the total account-based fees charged. In addition, each class reimburses Investor Services for out of pocket expenses incurred. For the six months ended March 31, 2024, the Fund incurred transfer agent fees as reported on the Statement of Operations, of which $3,556 was earned by Investor Services.
There is a maximum initial sales charge of 5.50% for Class A shares. There is a contingent deferred sales charge (“CDSC”) of 1.00% on Class C shares, which applies if redemption occurs within 12 months from purchase payment. In certain cases, Class A shares have a 1.00% CDSC, which applies if redemption occurs within 18 months from purchase payment. This CDSC only applies to those purchases of Class A shares, which, when combined with current holdings of other shares of funds sold by Franklin Distributors, equal or exceed $1,000,000 in the aggregate. These purchases do not incur an initial sales charge.
For the six months ended March 31, 2024, sales charges retained by and CDSCs paid to Franklin Distributors and its affiliates, if any, were as follows:
| Class A | Class C | |||||||
| Sales charges | $ | 10,835 | — | |||||
| CDSCs | 121 | $ | 32 | |||||
28 | BrandywineGLOBAL — Diversified US Large Cap Value Fund 2024 Semi-Annual Report |
Under a Deferred Compensation Plan (the “Plan”), Trustees may have elected to defer receipt of all or a specified portion of their compensation. A participating Trustee selected one or more funds managed by FTFA or an affiliate of FTFA in which his or her deferred trustee’s fees were deemed to be invested. Deferred amounts remain in the Fund until distributed in accordance with the Plan. In May 2015, the Board of Trustees approved an amendment to the Plan so that effective January 1, 2016, no compensation earned after that date may be deferred under the Plan.
All officers and one Trustee of the Trust are employees of Franklin Resources or its affiliates and do not receive compensation from the Trust.
As of March 31, 2024, Franklin Resources and its affiliates owned 64% of the Fund.
3. Investments
During the six months ended March 31, 2024, the aggregate cost of purchases and proceeds from sales of investments (excluding short-term investments) were as follows:
| Purchases | $ | 104,858,334 | ||
| Sales | 78,942,793 |
At March 31, 2024, the aggregate cost of investments and the aggregate gross unrealized appreciation and depreciation of investments for federal income tax purposes were substantially as follows:
| Cost | Gross Unrealized Appreciation | Gross Unrealized Depreciation | Net Unrealized Appreciation | |||||||||||||
| Securities | $ | 206,076,784 | $ | 68,134,554 | $ | (618,768) | $ | 67,515,786 | ||||||||
4. Derivative instruments and hedging activities
During the six months ended March 31, 2024, the Fund did not invest in derivative instruments.
5. Class specific expenses, waivers and/or expense reimbursements
The Fund has adopted a Rule 12b-1 shareholder services and distribution plan and under that plan the Fund pays service and/or distribution fees with respect to its Class A, Class C and Class R shares calculated at the annual rate of 0.25%, 1.00% and 0.50% of the average daily net assets of each class, respectively. Service and/or distribution fees are accrued daily and paid monthly.
| BrandywineGLOBAL — Diversified US Large Cap Value Fund 2024 Semi-Annual Report |
29 |
Notes to financial statements (unaudited) (cont’d)
For the six months ended March 31, 2024, class specific expenses were as follows:
Service and/or Distribution Fees | Transfer Agent Fees | |||||||
| Class A | $ | 74,484 | $ | 45,420 | ||||
| Class C | 7,338 | 1,140 | ||||||
| Class R | 555 | 312 | ||||||
| Class I | — | 15,012 | ||||||
| Class IS | — | 101 | ||||||
| Total | $ | 82,377 | $ | 61,985 | ||||
For the six months ended March 31, 2024, waivers and/or expense reimbursements by class were as follows:
| Waivers/Expense Reimbursements | ||||
| Class A | $ | 21,356 | ||
| Class C | 557 | |||
| Class R | 223 | |||
| Class I | 11,060 | |||
| Class IS | 47,300 | |||
| Total | $ | 80,496 | ||
6. Distributions to shareholders by class
| Six Months Ended March 31, 2024 | Year Ended September 30, 2023 | |||||||
| Net Investment Income: | ||||||||
| Class A | $ | 925,870 | $ | 842,826 | ||||
| Class C | 6,504 | 28,864 | ||||||
| Class R | 2,907 | 2,342 | ||||||
| Class I | 464,676 | 352,642 | ||||||
| Class IS | 2,600,048 | 1,904,795 | ||||||
| Total | $ | 4,000,005 | $ | 3,131,469 | ||||
| Net Realized Gains: | ||||||||
| Class A | $ | 49,172 | $ | 5,764,563 | ||||
| Class C | 1,225 | 197,187 | ||||||
| Class R | 178 | 18,032 | ||||||
| Class I | 20,862 | 2,078,543 | ||||||
| Class IS | 110,584 | 10,560,013 | ||||||
| Total | $ | 182,021 | $ | 18,618,338 | ||||
7. Shares of beneficial interest
At March 31, 2024, the Trust had an unlimited number of shares of beneficial interest authorized with a par value of $0.00001 per share. The Fund has the ability to issue multiple classes of shares. Each class of shares represents an identical interest and has the same
30 | BrandywineGLOBAL — Diversified US Large Cap Value Fund 2024 Semi-Annual Report |
rights, except that each class bears certain direct expenses, including those specifically related to the distribution of its shares.
Transactions in shares of each class were as follows:
| Six Months Ended March 31, 2024 | Year Ended September 30, 2023 | |||||||||||||||
| Shares | Amount | Shares | Amount | |||||||||||||
| Class A | ||||||||||||||||
| Shares sold | 248,637 | $ | 4,619,982 | 888,556 | $ | 16,414,616 | ||||||||||
| Shares issued on reinvestment | 53,264 | 974,735 | 363,639 | 6,607,321 | ||||||||||||
| Shares repurchased | (408,290) | (7,642,361) | (536,993) | (9,670,787) | ||||||||||||
| Net increase (decrease) | (106,389) | $ | (2,047,644) | 715,202 | $ | 13,351,150 | ||||||||||
| Class C | ||||||||||||||||
| Shares sold | 8,288 | $ | 149,314 | 113,717 | $ | 2,136,467 | ||||||||||
| Shares issued on reinvestment | 426 | 7,729 | 12,593 | 226,051 | ||||||||||||
| Shares repurchased | (47,363) | (851,901) | (47,548) | (841,483) | ||||||||||||
| Net increase (decrease) | (38,649) | $ | (694,858) | 78,762 | $ | 1,521,035 | ||||||||||
| Class R | ||||||||||||||||
| Shares sold | 1,719 | $ | 31,660 | 3,319 | $ | 58,425 | ||||||||||
| Shares issued on reinvestment | 169 | 3,085 | 1,121 | 20,373 | ||||||||||||
| Shares repurchased | (1,599) | (29,119) | (1,013) | (17,577) | ||||||||||||
| Net increase | 289 | $ | 5,626 | 3,427 | $ | 61,221 | ||||||||||
| Class I | ||||||||||||||||
| Shares sold | 23,022 | $ | 468,663 | 1,590,807 | $ | 28,404,528 | ||||||||||
| Shares issued on reinvestment | 26,002 | 475,831 | 129,963 | 2,361,433 | ||||||||||||
| Shares repurchased | (800,730) | (15,114,890) | (1,294,152) | (23,782,332) | ||||||||||||
| Net increase (decrease) | (751,706) | $ | (14,170,396) | 426,618 | $ | 6,983,629 | ||||||||||
| Class IS | ||||||||||||||||
| Shares sold | 2,542,641 | $ | 50,113,202 | 1,297,886 | $ | 23,920,081 | ||||||||||
| Shares issued on reinvestment | 148,122 | 2,710,632 | 685,620 | 12,457,713 | ||||||||||||
| Shares repurchased | (259,202) | (4,920,450) | (781,787) | (14,662,949) | ||||||||||||
| Net increase | 2,431,561 | $ | 47,903,384 | 1,201,719 | $ | 21,714,845 | ||||||||||
8. Transactions with affiliated company
As defined by the 1940 Act, an affiliated company is one in which the Fund owns 5% or more of the outstanding voting securities, or a company which is under common ownership or control with the Fund. The following company was considered an affiliated company for
| BrandywineGLOBAL — Diversified US Large Cap Value Fund 2024 Semi-Annual Report |
31 |
Notes to financial statements (unaudited) (cont’d)
all or some portion of the six months ended March 31, 2024. The following transactions were effected in such company for the six months ended March 31, 2024.
Affiliate Value at September 30, | Purchased | Sold | ||||||||||||||||||
| 2023 | Cost | Shares | Proceeds | Shares | ||||||||||||||||
| Western Asset Premier Institutional U.S. Treasury Reserves, Premium Shares | $ | 1,225,995 | $ | 60,830,290 | 60,830,290 | $ | 61,062,065 | 61,062,065 | ||||||||||||
| (cont’d) | Realized Gain (Loss) | Dividend Income | Net Increase (Decrease) in Unrealized Appreciation (Depreciation) | Affiliate Value at March 31, | ||||||||||||
| Western Asset Premier Institutional U.S. Treasury Reserves, Premium Shares | — | $ | 40,353 | — | $ | 994,220 | ||||||||||
9. Redemption facility
The Fund, together with other U.S. registered and foreign investment funds (collectively, the “Borrowers”) managed by Franklin Resources or its affiliates, is a borrower in a joint syndicated senior unsecured credit facility totaling $2.675 billion (the “Global Credit Facility”). The Global Credit Facility provides a source of funds to the Borrowers for temporary and emergency purposes, including the ability to meet future unanticipated or unusually large redemption requests. Unless renewed, the Global Credit Facility will terminate on January 31, 2025.
Under the terms of the Global Credit Facility, the Fund shall, in addition to interest charged on any borrowings made by the Fund and other costs incurred by the Fund, pay its share of fees and expenses incurred in connection with the implementation and maintenance of the Global Credit Facility, based upon its relative share of the aggregate net assets of all the Borrowers, including an annual commitment fee of 0.15% based upon the unused portion of the Global Credit Facility. These fees are reflected in the Statement of Operations. The Fund did not utilize the Global Credit Facility during the six months ended March 31, 2024.
10. Recent accounting pronouncement
In June 2022, the Financial Accounting Standards Board (FASB) issued Accounting Standards Update (ASU) No. 2022-03, Fair Value Measurement (Topic 820) – Fair Value Measurement of Equity Securities Subject to Contractual Sale Restrictions. The amendments in the ASU clarify that a contractual restriction on the sale of an equity security is not considered part of the unit of account of the equity security and, therefore, should not be considered in measuring fair value. The ASU is effective for interim and
32 | BrandywineGLOBAL — Diversified US Large Cap Value Fund 2024 Semi-Annual Report |
annual reporting periods beginning after December 15, 2023, with the option of early adoption. Management has reviewed the requirements and believes that the adoption of the ASU will not have a material impact on the financial statements.
| BrandywineGLOBAL — Diversified US Large Cap Value Fund 2024 Semi-Annual Report |
33 |
BrandywineGLOBAL —
Diversified US Large Cap Value Fund
Trustees
Andrew L. Breech
Stephen R. Gross
Susan M. Heilbron
Arnold L. Lehman
Robin J. W. Masters
Ken Miller
G. Peter O’Brien*
Chair
Thomas F. Schlafly
Jane Trust
Investment manager
Franklin Templeton Fund Adviser, LLC**
Subadviser
Brandywine Global Investment Management, LLC
Distributor
Franklin Distributors, LLC
Custodian
The Bank of New York Mellon
Transfer agent
Franklin Templeton Investor
Services, LLC
3344 Quality Drive
Rancho Cordova, CA 95670-7313
Independent registered public accounting firm
PricewaterhouseCoopers LLP
Baltimore, MD
| * | Effective February 7, 2024, Mr. O’Brien became Chair of the Board. |
| ** | Formerly known as Legg Mason Partners Fund Advisor, LLC. |
BrandywineGLOBAL — Diversified US Large Cap Value Fund
The Fund is a separate investment series of Legg Mason Global Asset Management Trust, a Maryland statutory trust.
BrandywineGLOBAL — Diversified US Large Cap Value Fund
Legg Mason Funds
100 International Drive
Baltimore, MD 21202
The Fund files its complete schedule of portfolio holdings with the Securities and Exchange Commission (“SEC”) for the first and third quarters of each fiscal year as an exhibit to its reports on Form N-PORT. The Fund’s Forms N-PORT are available on the SEC’s website at www.sec.gov. To obtain information on Form N-PORT, shareholders can call the Fund at 877-6LM-FUND/656-3863.
Information on how the Fund voted proxies relating to portfolio securities during the prior 12-month period ended June 30th of each year and a description of the policies and procedures that the Fund uses to determine how to vote proxies related to portfolio transactions are available (1) without charge, upon request, by calling the Fund at 877-6LM-FUND/656-3863, (2) at www.franklintempleton.com and (3) on the SEC’s website at www.sec.gov.
This report is submitted for the general information of the shareholders of BrandywineGLOBAL — Diversified US Large Cap Value Fund. This report is not authorized for distribution to prospective investors in the Fund unless preceded or accompanied by a current prospectus.
Investors should consider the Fund’s investment objectives, risks, charges and expenses carefully before investing. The prospectus contains this and other important information about the Fund. Please read the prospectus carefully before investing.
www.franklintempleton.com
© 2024 Franklin Distributors, LLC, Member FINRA/SIPC. All rights reserved.
Franklin Templeton Funds Privacy and Security Notice
Your Privacy Is Our Priority
Franklin Templeton* is committed to safeguarding your personal information. This notice is designed to provide you with a summary of the non-public personal information Franklin Templeton may collect and maintain about current or former individual investors; our policy regarding the use of that information; and the measures we take to safeguard the information. We do not sell individual investors’ non-public personal information to anyone and only share it as described in this notice.
Information We Collect
When you invest with us, you provide us with your non-public personal information. We collect and use this information to service your accounts and respond to your requests. The non-public personal information we may collect falls into the following categories:
| • | Information we receive from you or your financial intermediary on applications or other forms, whether we receive the form in writing or electronically. For example, this information may include your name, address, tax identification number, birth date, investment selection, beneficiary information, and your personal bank account information and/or email address if you have provided that information. |
| • | Information about your transactions and account history with us, or with other companies that are part of Franklin Templeton, including transactions you request on our website or in our app. This category also includes your communications to us concerning your investments. |
| • | Information we receive from third parties (for example, to update your address if you move, obtain or verify your email address or obtain additional information to verify your identity). |
| • | Information collected from you online, such as your IP address or device ID and data gathered from your browsing activity and location. (For example, we may use cookies to collect device and browser information so our website recognizes your online preferences and device information.) Our website contains more information about cookies and similar technologies and ways you may limit them. |
| • | Other general information that we may obtain about you such as demographic information. |
Disclosure Policy
To better service your accounts and process transactions or services you requested, we may share non-public personal information with other Franklin Templeton companies. From time to time we may also send you information about products/services offered by other Franklin Templeton companies although we will not share your non-public personal information with these companies without first offering you the opportunity to prevent that sharing.
We will only share non-public personal information with outside parties in the limited circumstances permitted by law. For example, this includes situations where we need to share information with companies who work on our behalf to service or maintain your account or process transactions you requested, when the disclosure is to companies assisting us with our own marketing efforts, when the disclosure is to a party representing you, or when required by law (for example, in response to legal process). Additionally, we will ensure that any outside companies working on our behalf, or with whom we have joint marketing agreements, are under contractual obligations to protect the confidentiality of your information, and to use it only to provide the services we asked them to perform.
| NOT PART OF THE SEMI-ANNUAL REPORT |
Franklin Templeton Funds Privacy and Security Notice (cont’d)
Confidentiality and Security
Our employees are required to follow procedures with respect to maintaining the confidentiality of our investors’ non-public personal information. Additionally, we maintain physical, electronic and procedural safeguards to protect the information. This includes performing ongoing evaluations of our systems containing investor information and making changes when appropriate.
At all times, you may view our current privacy notice on our website at https://www.franklintempleton.com/help/privacy-policy or contact us for a copy at (800) 632-2301.
*For purposes of this privacy notice Franklin Templeton shall refer to the following entities:
Fiduciary Trust International of the South (FTIOS), as custodian for individual retirement plans
Franklin Advisers, Inc.
Franklin Distributors, LLC, including as program manager of the Franklin Templeton 529 College Savings Plan and the NJBEST 529 College Savings Plan
Franklin Mutual Advisers, LLC
Franklin, Templeton and Mutual Series Funds
Franklin Templeton Institutional, LLC
Franklin Templeton Investments Corp., Canada
Franklin Templeton Investments Management, Limited UK
Legg Mason Funds
Templeton Asset Management, Limited
Templeton Global Advisors, Limited
Templeton Investment Counsel, LLC
If you are a customer of other Franklin Templeton affiliates and you receive notices from them, you will need to read those notices separately.
| NOT PART OF THE SEMI-ANNUAL REPORT |
www.franklintempleton.com
© 2024 Franklin Distributors, LLC, Member FINRA/SIPC. All rights reserved.
LMFX013521 5/24 SR24-4863
| ITEM 2. | CODE OF ETHICS. |
Not applicable.
| ITEM 3. | AUDIT COMMITTEE FINANCIAL EXPERT. |
Not applicable.
| ITEM 4. | PRINCIPAL ACCOUNTANT FEES AND SERVICES. |
Not applicable.
| ITEM 5. | AUDIT COMMITTEE OF LISTED REGISTRANTS. |
Not applicable.
| ITEM 6. | SCHEDULE OF INVESTMENTS. |
Included herein under Item 1.
| ITEM 7. | DISCLOSURE OF PROXY VOTING POLICIES AND PROCEDURES FOR CLOSED-END MANAGEMENT INVESTMENT COMPANIES. |
Not applicable.
| ITEM 8. | PORTFOLIO MANAGERS OF CLOSED-END MANAGEMENT INVESTMENT COMPANIES. |
Not applicable.
| ITEM 9. | PURCHASES OF SECURITIES BY CLOSED-END MANAGEMENT INVESTMENT COMPANY AND AFFILIATED PURCHASERS. |
Not applicable.
| ITEM 10. | SUBMISSION OF MATTERS TO A VOTE OF SECURITY HOLDERS. |
Not applicable.
| ITEM 11. | CONTROLS AND PROCEDURES. |
| (a) | The registrant’s principal executive officer and principal financial officer have concluded that the registrant’s disclosure controls and procedures (as defined in Rule 30a- 3(c) under the Investment Company Act of 1940, as amended (the “1940 Act”)) are effective as of a date within 90 days of the filing date of this report that includes the disclosure required by this paragraph, based on their evaluation of the disclosure controls and procedures required by Rule 30a-3(b) under the 1940 Act and 15d-15(b) under the Securities Exchange Act of 1934. |
| (b) | There were no changes in the registrant’s internal control over financial reporting (as defined in Rule 30a-3(d) under the 1940 Act) that occurred during the period covered by this report that have materially affected, or are likely to materially affect the registrant’s internal control over financial reporting. |
| ITEM 12. | DISCLOSURE OF SECURITIES LENDING ACTIVITIES FOR CLOSED-END MANAGEMENT INVESTMENT COMPANIES. |
Not applicable.
| ITEM 13. | RECOVERY OF ERRONEOUSLY AWARDED COMPENSATION. |
(a) Not applicable.
(b) Not applicable.
| ITEM 14. | EXHIBITS. |
(a) (1) Not applicable.
Exhibit 99.CODE ETH
(a) (2) Certifications pursuant to section 302 of the Sarbanes-Oxley Act of 2002 attached hereto.
(b) Certifications pursuant to Section 906 of the Sarbanes-Oxley Act of 2002 attached hereto.
SIGNATURES
Pursuant to the requirements of the Securities Exchange Act of 1934 and the Investment Company Act of 1940, the registrant has duly caused this Report to be signed on its behalf by the undersigned, there unto duly authorized.
Legg Mason Global Asset Management Trust
| By: | /s/ Jane Trust | |
| Jane Trust | ||
| Chief Executive Officer | ||
| Date: | May 23, 2024 | |
Pursuant to the requirements of the Securities Exchange Act of 1934 and the Investment Company Act of 1940, this report has been signed below by the following persons on behalf of the registrant and in the capacities and on the dates indicated.
| By: | /s/ Jane Trust | |
| Jane Trust | ||
| Chief Executive Officer | ||
| Date: | May 23, 2024 | |
| By: | /s/ Christopher Berarducci | |
| Christopher Berarducci | ||
| Principal Financial Officer | ||
| Date: | May 23, 2024 | |