UNITED STATES
SECURITIES AND EXCHANGE COMMISSION
Washington, D.C. 20549
FORM N-CSR
CERTIFIED SHAREHOLDER REPORT OF REGISTERED
MANAGEMENT INVESTMENT COMPANIES
Investment Company Act file number 811-22338
Legg Mason Global Asset Management Trust
(Exact name of registrant as specified in charter)
100 International Drive, Baltimore, MD, 21202
(Address of principal executive offices) (Zip code)
Marc A. De Oliveira
Franklin Templeton
100 First Stamford Place
Stamford, CT 06902
(Name and address of agent for service)
Registrant’s telephone number, including area code: 877-6LM-FUND/656-3863
Date of fiscal year end: September 30
Date of reporting period: March 31, 2024
| ITEM 1. | REPORT TO STOCKHOLDERS. |
The Semi-Annual Report to Stockholders is filed herewith. |

Semi-Annual Report
| March 31, 2024 |
FRANKLIN
STRATEGIC REAL
RETURN FUND
The Securities and Exchange Commission has adopted new regulations that will result in changes to the design and delivery of annual and semi-annual shareholder reports beginning in July 2024.
If you have previously elected to receive shareholder reports electronically, you will continue to do so and need not take any action.
Otherwise, paper copies of the Fund’s shareholder reports will be mailed to you beginning in July 2024. If you would like to receive shareholder reports and other communications from the Fund electronically instead of by mail, you may make that request at any time by contacting your financial intermediary (such as a broker-dealer or bank) or, if you are a direct investor, enrolling at franklintempleton.com.
You may access franklintempleton.com by scanning the code below.


| INVESTMENT PRODUCTS: NOT FDIC INSURED • NO BANK GUARANTEE • MAY LOSE VALUE |
Fund objective
The Fund seeks to provide an attractive long-term real return.
| II | Franklin Strategic Real Return Fund |

Dear Shareholder,
We are pleased to provide the semi-annual report of Franklin Strategic Real Return Fund for the six-month reporting period ended March 31, 2024. Please read on for Fund performance information during the Fund’s reporting period.
Special shareholder notice
The Fund’s Board of Trustees has determined that it is in the best interests of the Fund and its shareholders to terminate the Fund. The Fund is expected to cease operations on or about April 19, 2024. Before that date, the assets of the Fund will be liquidated at the discretion of Fund management and the Fund will cease to pursue its investment objective. This will cause the Fund to increase its cash holdings and deviate from the investment strategies stated in the Fund’s prospectus. For more information, please see the Fund’s prospectus supplement dated February 14, 2024.
As always, we remain committed to providing you with excellent service and a full spectrum of investment choices. We also remain committed to supplementing the support you receive from your financial advisor. One way we accomplish this is through our website, www.franklintempleton.com. Here you can gain immediate access to market and investment information, including:
| • | Fund prices and performance, |
| • | Market insights and commentaries from our portfolio managers, and |
| • | A host of educational resources. |
We look forward to helping you meet your financial goals.
Sincerely,

Jane Trust, CFA
President and Chief Executive Officer
April 30, 2024
| Franklin Strategic Real Return Fund |
III |
For the six months ended March 31, 2024, Class A shares of Franklin Strategic Real Return Fund, excluding sales charges, returned 9.26%. The Fund’s unmanaged benchmark, the Bloomberg U.S. Treasury: U.S. TIPSi, returned 4.62% for the same period. The Composite Indexii, representing the Fund’s underlying investments, returned 8.08% over the same time frame.
| Performance Snapshot as of March 31, 2024 (unaudited) | ||||
| (excluding sales charges) | 6 months | |||
| Franklin Strategic Real Return Fund: | ||||
Class A | 9.26 | % | ||
Class C | 8.82 | % | ||
Class I | 9.38 | % | ||
Class IS | 9.47 | % | ||
| Bloomberg U.S. Treasury: U.S. TIPS | 4.62 | % | ||
| Composite Index | 8.08 | % | ||
The performance shown represents past performance. Past performance is no guarantee of future results and current performance may be higher or lower than the performance shown above. Principal value and investment returns will fluctuate and investors’ shares, when redeemed, may be worth more or less than their original cost. To obtain performance data current to the most recent month-end, please visit our website at www.franklintempleton.com.
All share class returns assume the reinvestment of all distributions, including returns of capital, if any, at net asset value and the deduction of all Fund expenses. Returns have not been adjusted to include sales charges that may apply or the deduction of taxes that a shareholder would pay on Fund distributions. If sales charges were reflected, the performance quoted would be lower. Performance figures for periods shorter than one year represent cumulative figures and are not annualized.
Fund performance figures reflect fee waivers and/or expense reimbursements, without which the performance would have been lower.
| Total Annual Operating Expenses (unaudited) |
As of the Fund’s current prospectus dated January 31, 2024, the gross total annual fund operating expense ratios for Class A, Class C, Class I and Class IS shares were 1.48%, 2.21%, 1.20% and 1.10%, respectively.
Actual expenses may be higher. For example, expenses may be higher than those shown if average net assets decrease. Net assets are more likely to decrease and Fund expense ratios are more likely to increase when markets are volatile.
As a result of expense limitation arrangements, the ratio of total annual fund operating expenses, other than interest, brokerage commissions (except for brokerage commissions paid on purchases and sales of shares of exchange-traded funds (“ETFs”)), dividend expense on short sales, taxes and extraordinary expenses, to average net assets will not exceed 1.35% for Class A shares, 2.10% for Class C shares, 1.10% for Class I shares and 1.00% for Class IS shares. In addition, the ratio of total annual fund operating expenses for Class IS shares will not exceed the ratio of total annual fund operating expenses for Class I shares. Acquired fund fees and expenses are subject to these
IV | Franklin Strategic Real Return Fund |
arrangements. These expense limitation arrangements cannot be terminated prior to December 31, 2025 without the Board of Trustees’ consent.
The manager is permitted to recapture amounts waived and/or reimbursed to a class within three years after the fiscal year in which the manager earned the fee or incurred the expense if the class total annual fund operating expenses have fallen to a level below the expense limitation (“expense cap”) in effect at the time the fees were earned or the expenses incurred. In no case will the manager recapture any amount that would result, on any particular business day of the Fund, in the class’ total annual fund operating expenses exceeding the expense cap or any other lower limit then in effect.
As always, thank you for your confidence in our stewardship of your assets.
Sincerely,
Jane Trust, CFA
President and Chief Executive Officer
April 30, 2024
RISKS: The Fund is subject to interest rate, credit, income, prepayment and inflation risks. As interest rates rise, bond prices fall, reducing the value of a fixed income investment. Changes in inflation will cause the Fund’s income to fluctuate, sometimes substantially. Periods of deflation may adversely affect the Fund’s net asset value. Equity securities are subject to market and price fluctuations. The Fund is non-diversified, and therefore it is permitted to invest a larger percentage of its assets in a smaller number of issuers than a diversified fund, which may magnify the Fund’s losses from events affecting a particular issuer. The Fund is subject to the risks of the underlying funds in which it invests. In addition to the Fund’s operating expenses, you will indirectly bear the operating expenses of any underlying funds, including exchange-traded funds (“ETFs”). Each underlying fund may engage in active and frequent trading, resulting in higher portfolio turnover and transaction costs. Derivatives, such as options and futures, can be illiquid, may disproportionately increase losses and have a potentially large impact on Fund performance. International investments are subject to special risks including currency fluctuations and social, economic and political uncertainties, which could increase volatility. These risks are magnified in emerging markets. Emerging market countries tend to have economic, political, and legal systems that are less developed and are less stable than those of more developed countries. The Fund may use leverage, which may increase volatility and possibility of loss. The Fund may invest in real estate investment trusts (“REITs”), which are closely linked to the performance of the real estate markets. The Fund is subject to the illiquidity, credit and interest rate risks of REITs, as well as risks associated with small- and mid-cap investments. The model used to manage the Fund’s assets provides no assurance that the recommended allocation will either maximize returns or minimize risks. There is no assurance
| Franklin Strategic Real Return Fund |
V |
Performance review (cont’d)
that a recommended allocation will prove the ideal allocation in all circumstances. The Fund may engage in short selling, which is a speculative strategy that involves special risks. Unlike the possible loss on a security that is purchased, there is no limit on the amount of loss on an appreciating security that is sold short. Additional risks may include those risks associated with investing in commodities, ETFs, exchange-traded notes (“ETNs”) and master limited partnerships (“MLPs”). The market values of securities or other assets will fluctuate, sometimes sharply and unpredictably, due to changes in general market conditions, overall economic trends or events, governmental actions or intervention, actions taken by the U.S. Federal Reserve or foreign central banks, market disruptions caused by trade disputes or other factors, political developments, armed conflicts, economic sanctions and countermeasures in response to sanctions, major cybersecurity events, investor sentiment, the global and domestic effects of a pandemic, and other factors that may or may not be related to the issuer of the security or other asset. Please see the Fund’s prospectus for a more complete discussion of these and other risks and the Fund’s investment strategies.
All investments are subject to risk including the possible loss of principal. Past performance is no guarantee of future results. All index performance reflects no deduction for fees, expenses or taxes. Please note that an investor cannot invest directly in an index.
| i | The Bloomberg U.S. Treasury: U.S. TIPS represents an unmanaged market index made up of U.S. Treasury Inflation Protected securities (TIPS). |
| ii | The Composite Index reflects the blended rate of return of the following underlying indices: 40% Bloomberg U.S. Treasury: U.S. TIPS, 20% MSCI All Country World Index, 20% S&P GSCI®, 10% FTSE NAREIT All REITs Index, and 10% FTSE 1-Month U.S. Treasury Bill Index. The Composite Index is hedged to 50% exposure to the U.S. dollar, as defined by the U.S. Dollar Index (USDX). The Composite Index’s unhedged currency exposure is predominantly U.S. dollar-based. The Fund’s target hedged currency exposure is 50% U.S. dollar, 50% non-U.S. dollar. The Fund may deviate, either up or down, from its target currency allocation due to market conditions. |
VI | Franklin Strategic Real Return Fund |
Investment breakdown (%) as a percent of total investments
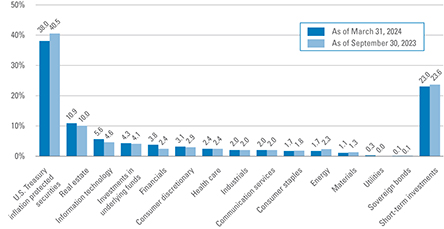
| † | The bar graph above represents the composition of the Fund’s investments as of March 31, 2024 and September 30, 2023 and does not include derivatives, such as futures contracts and forward foreign currency contracts. The Fund is actively managed. As a result, the composition of the Fund’s investments is subject to change at any time. |
| Franklin Strategic Real Return Fund 2024 Semi-Annual Report |
|
1 |
|
Example
As a shareholder of the Fund, you may incur two types of costs: (1) transaction costs, including front-end and back-end sales charges (loads) on purchase payments; and (2) ongoing costs, including management fees; service and/or distribution (12b-1) fees; and other Fund expenses. This example is intended to help you understand your ongoing costs (in dollars) of investing in the Fund and to compare these costs with the ongoing costs of investing in other mutual funds.
This example is based on an investment of $1,000 invested on October 1, 2023 and held for the six months ended March 31, 2024.
Actual expenses
The table below titled “Based on actual total return” provides information about actual account values and actual expenses. You may use the information provided in this table, together with the amount you invested, to estimate the expenses that you paid over the period. To estimate the expenses you paid on your account, divide your ending account value by $1,000 (for example, an $8,600 ending account value divided by $1,000 = 8.6), then multiply the result by the number under the heading entitled “Expenses Paid During the Period”.
Hypothetical example for comparison purposes
The table below titled “Based on hypothetical total return” provides information about hypothetical account values and hypothetical expenses based on the actual expense ratio and an assumed rate of return of 5.00% per year before expenses, which is not the Fund’s actual return. The hypothetical account values and expenses may not be used to estimate the actual ending account balance or expenses you paid for the period. You may use the information provided in this table to compare the ongoing costs of investing in the Fund and other funds. To do so, compare the 5.00% hypothetical example relating to the Fund with the 5.00% hypothetical examples that appear in the shareholder reports of the other funds.
Please note that the expenses shown in the table below are meant to highlight your ongoing costs only and do not reflect any transactional costs, such as front-end or back-end sales charges (loads). Therefore, the table is useful in comparing ongoing costs only, and will not help you determine the relative total costs of owning different funds. In addition, if these transaction costs were included, your costs would have been higher.
| Based on actual total return1 | Based on hypothetical total return1 | |||||||||||||||||||||||||||||||||||||||||||||
| Actual Total Return Without Sales Charge2 | Beginning Account Value | Ending Account Value | Annualized Expense Ratio3 | Expenses Paid During the Period4 | Hypothetical Annualized Total Return | Beginning Account Value | Ending Account Value | Annualized Expense Ratio3 | Expenses Paid During the Period4 | |||||||||||||||||||||||||||||||||||||
| Class A | 9.26 | % | $ | 1,000.00 | $ | 1,092.60 | 1.30 | % | $ | 6.80 | Class A | 5.00 | % | $ | 1,000.00 | $ | 1,018.50 | 1.30 | % | $ | 6.56 | |||||||||||||||||||||||||
| Class C | 8.82 | 1,000.00 | 1,088.20 | 2.05 | 10.70 | Class C | 5.00 | 1,000.00 | 1,014.75 | 2.05 | 10.33 | |||||||||||||||||||||||||||||||||||
| Class I | 9.38 | 1,000.00 | 1,093.80 | 1.05 | 5.50 | Class I | 5.00 | 1,000.00 | 1,019.75 | 1.05 | 5.30 | |||||||||||||||||||||||||||||||||||
| Class IS | 9.47 | 1,000.00 | 1,094.70 | 0.95 | 4.97 | Class IS | 5.00 | 1,000.00 | 1,020.25 | 0.95 | 4.80 | |||||||||||||||||||||||||||||||||||
| 2 | Franklin Strategic Real Return Fund 2024 Semi-Annual Report |
| 1 | For the six months ended March 31, 2024. |
| 2 | Assumes the reinvestment of all distributions, including returns of capital, if any, at net asset value and does not reflect the deduction of the applicable sales charge with respect to Class A shares or the applicable contingent deferred sales charge (“CDSC”) with respect to Class C shares. Total return is not annualized, as it may not be representative of the total return for the year. Performance figures may reflect compensating balance arrangements, fee waivers and/or expense reimbursements. In the absence of compensating balance arrangements, fee waivers and/or expense reimbursements, the total return would have been lower. Past performance is no guarantee of future results. |
| 3 | Does not include fees and expenses of the Underlying Funds in which the Fund invests. |
| 4 | Expenses (net of compensating balance arrangements, fee waivers and/or expense reimbursements) are equal to each class’ respective annualized expense ratio multiplied by the average account value over the period, multiplied by the number of days in the most recent fiscal half-year (183), then divided by 366. |
| Franklin Strategic Real Return Fund 2024 Semi-Annual Report |
|
3 |
|
Consolidated schedule of investments (unaudited)
March 31, 2024
Franklin Strategic Real Return Fund
(Percentages shown based on Fund net assets)
| Security | Rate | Maturity Date | Face Amount | Value | ||||||||||||
| U.S. Treasury Inflation Protected Securities — 37.4% |
| |||||||||||||||
U.S. Treasury Bonds, Inflation Indexed | 2.500 | % | 1/15/29 | $ | 2,154,750 | $ | 2,214,516 | |||||||||
U.S. Treasury Bonds, Inflation Indexed | 3.875 | % | 4/15/29 | 2,438,917 | 2,667,808 | |||||||||||
U.S. Treasury Bonds, Inflation Indexed | 0.750 | % | 2/15/45 | 4,191,136 | 3,220,759 | |||||||||||
U.S. Treasury Bonds, Inflation Indexed | 0.250 | % | 2/15/50 | 2,159,316 | 1,365,370 | |||||||||||
U.S. Treasury Bonds, Inflation Indexed | 1.500 | % | 2/15/53 | 2,853,262 | 2,493,765 | |||||||||||
U.S. Treasury Notes, Inflation Indexed | 0.625 | % | 1/15/26 | 3,634,372 | 3,530,404 | |||||||||||
U.S. Treasury Notes, Inflation Indexed | 0.125 | % | 4/15/26 | 4,351,348 | 4,168,065 | |||||||||||
U.S. Treasury Notes, Inflation Indexed | 0.125 | % | 10/15/26 | 2,742,668 | 2,616,992 | |||||||||||
U.S. Treasury Notes, Inflation Indexed | 0.875 | % | 1/15/29 | 4,885,760 | 4,659,254 | |||||||||||
U.S. Treasury Notes, Inflation Indexed | 0.250 | % | 7/15/29 | 844,011 | 778,525 | |||||||||||
U.S. Treasury Notes, Inflation Indexed | 0.125 | % | 1/15/30 | 2,157,732 | 1,954,008 | |||||||||||
U.S. Treasury Notes, Inflation Indexed | 1.125 | % | 1/15/33 | 2,588,475 | 2,428,963 | |||||||||||
U.S. Treasury Notes, Inflation Indexed | 1.750 | % | 1/15/34 | 7,023,380 | 6,937,953 | |||||||||||
Total U.S. Treasury Inflation Protected Securities (Cost — $41,939,216) |
| 39,036,382 | ||||||||||||||
| Shares | ||||||||||||||||
| Common Stocks — 32.3% | ||||||||||||||||
| Communication Services — 1.9% | ||||||||||||||||
Diversified Telecommunication Services — 0.3% |
| |||||||||||||||
| LG Uplus Corp. | 13,586 | 100,614 | (a) | |||||||||||||
| Telefonica SA | 27,200 | 120,122 | (a) | |||||||||||||
| Verizon Communications Inc. | 3,550 | 148,958 | ||||||||||||||
Total Diversified Telecommunication Services |
| 369,694 | ||||||||||||||
Entertainment — 0.3% |
| |||||||||||||||
Electronic Arts Inc. | 888 | 117,811 | ||||||||||||||
Nintendo Co. Ltd. | 3,000 | 162,426 | (a) | |||||||||||||
Total Entertainment |
| 280,237 | ||||||||||||||
Interactive Media & Services — 1.2% |
| |||||||||||||||
Alphabet Inc., Class A Shares | 2,396 | 361,628 | * | |||||||||||||
Alphabet Inc., Class C Shares | 2,373 | 361,313 | * | |||||||||||||
Auto Trader Group PLC | 16,300 | 143,944 | (a) | |||||||||||||
Meta Platforms Inc., Class A Shares | 900 | 437,022 | ||||||||||||||
Total Interactive Media & Services |
| 1,303,907 | ||||||||||||||
Wireless Telecommunication Services — 0.1% |
| |||||||||||||||
MTN Group Ltd. | 13,926 | 68,903 | (a) | |||||||||||||
Total Communication Services |
| 2,022,741 | ||||||||||||||
See Notes to Consolidated Financial Statements.
| 4 | Franklin Strategic Real Return Fund 2024 Semi-Annual Report |
Franklin Strategic Real Return Fund
(Percentages shown based on Fund net assets)
| Security | Shares | Value | ||||||||||||||
| Consumer Discretionary — 3.0% |
| |||||||||||||||
Automobiles — 0.3% |
| |||||||||||||||
Bayerische Motoren Werke AG | 1,374 | $ | 158,530 | (a) | ||||||||||||
Tesla Inc. | 640 | 112,506 | * | |||||||||||||
Total Automobiles |
| 271,036 | ||||||||||||||
Broadline Retail — 0.5% |
| |||||||||||||||
Alibaba Group Holding Ltd. | 14,000 | 126,600 | (a) | |||||||||||||
Amazon.com Inc. | 1,557 | 280,851 | * | |||||||||||||
eBay Inc. | 1,924 | 101,549 | ||||||||||||||
Total Broadline Retail |
| 509,000 | ||||||||||||||
Diversified Consumer Services — 0.1% |
| |||||||||||||||
New Oriental Education & Technology Group Inc. | 14,000 | 122,358 | *(a) | |||||||||||||
Hotels, Restaurants & Leisure — 0.5% |
| |||||||||||||||
Aristocrat Leisure Ltd. | 3,189 | 89,295 | (a) | |||||||||||||
Booking Holdings Inc. | 40 | 145,115 | ||||||||||||||
Domino’s Pizza Inc. | 300 | 149,064 | ||||||||||||||
Expedia Group Inc. | 913 | 125,766 | * | |||||||||||||
Total Hotels, Restaurants & Leisure |
| 509,240 | ||||||||||||||
Household Durables — 0.2% |
| |||||||||||||||
PulteGroup Inc. | 2,201 | 265,485 | ||||||||||||||
Specialty Retail — 0.9% |
| |||||||||||||||
AutoZone Inc. | 69 | 217,464 | * | |||||||||||||
Home Depot Inc. | 687 | 263,533 | ||||||||||||||
Lowe’s Cos. Inc. | 879 | 223,907 | ||||||||||||||
TJX Cos. Inc. | 2,290 | 232,252 | ||||||||||||||
Total Specialty Retail |
| 937,156 | ||||||||||||||
Textiles, Apparel & Luxury Goods — 0.5% |
| |||||||||||||||
Deckers Outdoor Corp. | 274 | 257,905 | * | |||||||||||||
Pandora A/S | 1,592 | 256,959 | (a) | |||||||||||||
Under Armour Inc., Class A Shares | 4,764 | 35,158 | * | |||||||||||||
Total Textiles, Apparel & Luxury Goods |
| 550,022 | ||||||||||||||
Total Consumer Discretionary |
| 3,164,297 | ||||||||||||||
| Consumer Staples — 1.7% |
| |||||||||||||||
Consumer Staples Distribution & Retail — 1.0% |
| |||||||||||||||
George Weston Ltd. | 1,200 | 162,129 | ||||||||||||||
Koninklijke Ahold Delhaize NV | 4,300 | 128,664 | (a) | |||||||||||||
Kroger Co. | 2,657 | 151,795 | ||||||||||||||
Target Corp. | 948 | 167,995 | ||||||||||||||
Tesco PLC | 34,700 | 129,968 | (a) | |||||||||||||
Walmart Inc. | 4,395 | 264,447 | ||||||||||||||
Total Consumer Staples Distribution & Retail |
| 1,004,998 | ||||||||||||||
See Notes to Consolidated Financial Statements.
| Franklin Strategic Real Return Fund 2024 Semi-Annual Report |
|
5 |
|
Consolidated schedule of investments (unaudited) (cont’d)
March 31, 2024
Franklin Strategic Real Return Fund
(Percentages shown based on Fund net assets)
| Security | Shares | Value | ||||||||||||||
Household Products — 0.5% |
| |||||||||||||||
Clorox Co. | 900 | $ | 137,799 | |||||||||||||
Colgate-Palmolive Co. | 1,655 | 149,033 | ||||||||||||||
Procter & Gamble Co. | 1,126 | 182,693 | ||||||||||||||
Total Household Products |
| 469,525 | ||||||||||||||
Tobacco — 0.2% |
| |||||||||||||||
Imperial Brands PLC | 4,700 | 105,067 | (a) | |||||||||||||
Japan Tobacco Inc. | 5,800 | 155,325 | (a) | |||||||||||||
Total Tobacco |
| 260,392 | ||||||||||||||
Total Consumer Staples |
| 1,734,915 | ||||||||||||||
| Energy — 0.9% | ||||||||||||||||
Oil, Gas & Consumable Fuels — 0.9% | ||||||||||||||||
BP PLC | 25,397 | 159,326 | (a) | |||||||||||||
Marathon Petroleum Corp. | 1,420 | 286,130 | ||||||||||||||
PetroChina Co. Ltd., Class H Shares | 258,000 | 221,267 | (a) | |||||||||||||
Valero Energy Corp. | 1,374 | 234,528 | ||||||||||||||
Total Energy | 901,251 | |||||||||||||||
| Financials — 3.6% | ||||||||||||||||
Banks — 0.9% |
| |||||||||||||||
Bank of China Ltd., Class H Shares | 229,000 | 93,892 | (a) | |||||||||||||
BNP Paribas SA | 1,924 | 136,979 | (a) | |||||||||||||
Citigroup Inc. | 2,229 | 140,962 | ||||||||||||||
Hana Financial Group Inc. | 2,881 | 123,479 | (a) | |||||||||||||
JPMorgan Chase & Co. | 1,249 | 250,175 | ||||||||||||||
Mizuho Financial Group Inc. | 5,000 | 100,608 | (a) | |||||||||||||
UniCredit SpA | 3,000 | 113,938 | (a) | |||||||||||||
Total Banks |
| 960,033 | ||||||||||||||
Capital Markets — 0.7% |
| |||||||||||||||
3i Group PLC | 5,000 | 177,287 | (a) | |||||||||||||
Ameriprise Financial Inc. | 401 | 175,814 | ||||||||||||||
Bank of New York Mellon Corp. | 2,950 | 169,979 | ||||||||||||||
Brookfield Asset Management Ltd., Class A Shares | 3,000 | 126,020 | ||||||||||||||
SEI Investments Co. | 1,722 | 123,812 | ||||||||||||||
Total Capital Markets |
| 772,912 | ||||||||||||||
Consumer Finance — 0.2% |
| |||||||||||||||
Synchrony Financial | 3,939 | 169,850 | ||||||||||||||
Financial Services — 0.7% |
| |||||||||||||||
Eurazeo SE | 1,399 | 122,587 | (a) | |||||||||||||
Mastercard Inc., Class A Shares | 570 | 274,495 | ||||||||||||||
See Notes to Consolidated Financial Statements.
| 6 | Franklin Strategic Real Return Fund 2024 Semi-Annual Report |
Franklin Strategic Real Return Fund
(Percentages shown based on Fund net assets)
| Security | Shares | Value | ||||||||||||||
Financial Services — continued |
| |||||||||||||||
MGIC Investment Corp. | 5,873 | $ | 131,320 | |||||||||||||
Visa Inc., Class A Shares | 818 | 228,287 | ||||||||||||||
Total Financial Services |
| 756,689 | ||||||||||||||
Insurance — 1.1% |
| |||||||||||||||
Allianz SE, Registered Shares | 759 | 227,485 | (a) | |||||||||||||
DB Insurance Co. Ltd. | 1,500 | 105,515 | (a) | |||||||||||||
Erie Indemnity Co., Class A Shares | 259 | 104,007 | ||||||||||||||
Fairfax Financial Holdings Ltd. | 160 | 172,468 | ||||||||||||||
Japan Post Holdings Co. Ltd. | 13,300 | 134,599 | (a) | |||||||||||||
Manulife Financial Corp. | 4,137 | 103,322 | ||||||||||||||
Muenchener Rueckversicherungs-Gesellschaft AG in Muenchen, Registered Shares | 350 | 170,849 | (a) | |||||||||||||
OUTsurance Group Ltd. | 33,980 | 75,352 | ||||||||||||||
Total Insurance |
| 1,093,597 | ||||||||||||||
Total Financials | 3,753,081 | |||||||||||||||
| Health Care — 2.4% | ||||||||||||||||
Biotechnology — 0.4% |
| |||||||||||||||
Regeneron Pharmaceuticals Inc. | 175 | 168,436 | * | |||||||||||||
Vertex Pharmaceuticals Inc. | 558 | 233,249 | * | |||||||||||||
Total Biotechnology |
| 401,685 | ||||||||||||||
Health Care Providers & Services — 1.1% |
| |||||||||||||||
Cardinal Health Inc. | 1,832 | 205,001 | ||||||||||||||
Elevance Health Inc. | 394 | 204,305 | ||||||||||||||
HCA Healthcare Inc. | 657 | 219,129 | ||||||||||||||
McKesson Corp. | 413 | 221,719 | ||||||||||||||
Molina Healthcare Inc. | 516 | 211,988 | * | |||||||||||||
UnitedHealth Group Inc. | 186 | 92,014 | ||||||||||||||
Total Health Care Providers & Services |
| 1,154,156 | ||||||||||||||
Pharmaceuticals — 0.9% |
| |||||||||||||||
Eli Lilly & Co. | 360 | 280,066 | ||||||||||||||
Novo Nordisk A/S, Class B Shares | 2,967 | 380,587 | (a) | |||||||||||||
Ono Pharmaceutical Co. Ltd. | 5,800 | 94,042 | (a) | |||||||||||||
Roche Holding AG | 348 | 88,851 | (a) | |||||||||||||
Shionogi & Co. Ltd. | 1,700 | 87,033 | (a) | |||||||||||||
Total Pharmaceuticals |
| 930,579 | ||||||||||||||
Total Health Care | 2,486,420 | |||||||||||||||
| Industrials — 2.0% | ||||||||||||||||
Building Products — 0.5% |
| |||||||||||||||
Builders FirstSource Inc. | 730 | 152,242 | * | |||||||||||||
See Notes to Consolidated Financial Statements.
| Franklin Strategic Real Return Fund 2024 Semi-Annual Report |
|
7 |
|
Consolidated schedule of investments (unaudited) (cont’d)
March 31, 2024
Franklin Strategic Real Return Fund
(Percentages shown based on Fund net assets)
| Security | Shares | Value | ||||||||||||||
Building Products — continued |
| |||||||||||||||
Lennox International Inc. | 442 | $ | 216,032 | |||||||||||||
Masco Corp. | 2,657 | 209,584 | ||||||||||||||
Total Building Products |
| 577,858 | ||||||||||||||
Machinery — 0.3% |
| |||||||||||||||
Caterpillar Inc. | 861 | 315,496 | ||||||||||||||
Professional Services — 0.3% |
| |||||||||||||||
ManpowerGroup Inc. | 1,100 | 85,404 | ||||||||||||||
Wolters Kluwer NV | 1,390 | 217,660 | (a) | |||||||||||||
Total Professional Services |
| 303,064 | ||||||||||||||
Trading Companies & Distributors — 0.9% |
| |||||||||||||||
Marubeni Corp. | 6,100 | 105,938 | (a) | |||||||||||||
Mitsubishi Corp. | 12,600 | 290,238 | (a) | |||||||||||||
Mitsui & Co. Ltd. | 5,100 | 239,402 | (a) | |||||||||||||
W.W. Grainger Inc. | 265 | 269,584 | ||||||||||||||
Total Trading Companies & Distributors |
| 905,162 | ||||||||||||||
Total Industrials |
| 2,101,580 | ||||||||||||||
| Information Technology — 5.5% |
| |||||||||||||||
Communications Equipment — 0.2% |
| |||||||||||||||
Cisco Systems Inc. | 3,672 | 183,270 | ||||||||||||||
IT Services — 0.4% |
| |||||||||||||||
CGI Inc. | 1,500 | 165,487 | * | |||||||||||||
Gartner Inc. | 520 | 247,868 | * | |||||||||||||
Total IT Services |
| 413,355 | ||||||||||||||
Semiconductors & Semiconductor Equipment — 2.3% |
| |||||||||||||||
Applied Materials Inc. | 1,465 | 302,127 | ||||||||||||||
ASM International NV | 241 | 147,589 | (a) | |||||||||||||
ASML Holding NV | 378 | 366,456 | (a) | |||||||||||||
KLA Corp. | 435 | 303,878 | ||||||||||||||
MediaTek Inc. | 4,000 | 149,359 | (a) | |||||||||||||
NVIDIA Corp. | 857 | 774,351 | ||||||||||||||
QUALCOMM Inc. | 1,300 | 220,090 | ||||||||||||||
United Microelectronics Corp. | 86,000 | 140,272 | (a) | |||||||||||||
Total Semiconductors & Semiconductor Equipment |
| 2,404,122 | ||||||||||||||
Software — 1.5% |
| |||||||||||||||
Adobe Inc. | 400 | 201,840 | * | |||||||||||||
Cadence Design Systems Inc. | 700 | 217,896 | * | |||||||||||||
Check Point Software Technologies Ltd. | 1,121 | 183,855 | * | |||||||||||||
Fortinet Inc. | 2,748 | 187,716 | * | |||||||||||||
Microsoft Corp. | 1,888 | 794,319 | ||||||||||||||
Total Software |
| 1,585,626 | ||||||||||||||
See Notes to Consolidated Financial Statements.
| 8 | Franklin Strategic Real Return Fund 2024 Semi-Annual Report |
Franklin Strategic Real Return Fund
(Percentages shown based on Fund net assets)
| Security | Shares | Value | ||||||||||||||
Technology Hardware, Storage & Peripherals — 1.1% |
| |||||||||||||||
Apple Inc. | 5,990 | $1,027,165 | ||||||||||||||
Logitech International SA, Registered Shares | 1,541 | 138,088 | (a) | |||||||||||||
Total Technology Hardware, Storage & Peripherals |
| 1,165,253 | ||||||||||||||
Total Information Technology |
| 5,751,626 | ||||||||||||||
| Materials — 0.2% | ||||||||||||||||
Chemicals — 0.1% |
| |||||||||||||||
CF Industries Holdings Inc. | 1,100 | 91,531 | ||||||||||||||
Metals & Mining — 0.1% |
| |||||||||||||||
BHP Group Ltd. | 4,260 | 122,042 | (a) | |||||||||||||
Total Materials |
| 213,573 | ||||||||||||||
| Real Estate — 10.8% | ||||||||||||||||
Diversified REITs — 0.4% |
| |||||||||||||||
Alexander & Baldwin Inc. | 4,104 | 67,593 | ||||||||||||||
Armada Hoffler Properties Inc. | 7,291 | 75,827 | ||||||||||||||
Essential Properties Realty Trust Inc. | 7,135 | 190,219 | ||||||||||||||
Stockland | 36,648 | 115,803 | (a) | |||||||||||||
Total Diversified REITs |
| 449,442 | ||||||||||||||
Health Care REITs — 1.0% |
| |||||||||||||||
CareTrust REIT Inc. | 7,472 | 182,093 | ||||||||||||||
Global Medical REIT Inc. | 5,867 | 51,336 | ||||||||||||||
LTC Properties Inc. | 3,277 | 106,535 | ||||||||||||||
Medical Properties Trust Inc. | 12,739 | 59,873 | ||||||||||||||
National Health Investors Inc. | 2,665 | 167,442 | ||||||||||||||
Omega Healthcare Investors Inc. | 6,921 | 219,188 | ||||||||||||||
Ventas Inc. | 1,155 | 50,289 | ||||||||||||||
Welltower Inc. | 2,573 | 240,421 | ||||||||||||||
Total Health Care REITs |
| 1,077,177 | ||||||||||||||
Hotel & Resort REITs — 0.5% |
| |||||||||||||||
Apple Hospitality REIT Inc. | 11,545 | 189,107 | ||||||||||||||
Host Hotels & Resorts Inc. | 14,637 | 302,693 | ||||||||||||||
Total Hotel & Resort REITs |
| 491,800 | ||||||||||||||
Industrial REITs — 1.7% |
| |||||||||||||||
Americold Realty Trust Inc. | 3,279 | 81,713 | ||||||||||||||
First Industrial Realty Trust Inc. | 2,724 | 143,119 | ||||||||||||||
LXP Industrial Trust | 15,557 | 140,324 | ||||||||||||||
Prologis Inc. | 8,653 | 1,126,794 | ||||||||||||||
Rexford Industrial Realty Inc. | 3,401 | 171,070 | ||||||||||||||
STAG Industrial Inc. | 1,392 | 53,508 | ||||||||||||||
Total Industrial REITs |
| 1,716,528 | ||||||||||||||
See Notes to Consolidated Financial Statements.
| Franklin Strategic Real Return Fund 2024 Semi-Annual Report |
|
9 |
|
Consolidated schedule of investments (unaudited) (cont’d)
March 31, 2024
Franklin Strategic Real Return Fund
(Percentages shown based on Fund net assets)
| Security | Shares | Value | ||||||||||||||
Office REITs — 0.6% |
| |||||||||||||||
Boston Properties Inc. | 2,359 | $ | 154,066 | |||||||||||||
COPT Defense Properties | 4,594 | 111,037 | ||||||||||||||
Douglas Emmett Inc. | 6,094 | 84,524 | ||||||||||||||
Easterly Government Properties Inc. | 5,727 | 65,918 | ||||||||||||||
Highwoods Properties Inc. | 3,338 | 87,389 | ||||||||||||||
Kilroy Realty Corp. | 2,512 | 91,512 | ||||||||||||||
Total Office REITs |
| 594,446 | ||||||||||||||
Real Estate Management & Development — 0.1% |
| |||||||||||||||
Daito Trust Construction Co. Ltd. | 1,200 | 138,328 | (a) | |||||||||||||
Residential REITs — 1.8% |
| |||||||||||||||
Apartment Investment and Management Co., Class A Shares | 15,438 | 126,437 | * | |||||||||||||
AvalonBay Communities Inc. | 1,683 | 312,298 | ||||||||||||||
Camden Property Trust | 1,805 | 177,612 | ||||||||||||||
Equity LifeStyle Properties Inc. | 3,553 | 228,813 | ||||||||||||||
Equity Residential | 3,504 | 221,138 | ||||||||||||||
Essex Property Trust Inc. | 979 | 239,669 | ||||||||||||||
Invitation Homes Inc. | 2,994 | 106,616 | ||||||||||||||
Mid-America Apartment Communities Inc. | 2,051 | 269,871 | ||||||||||||||
Sun Communities Inc. | 1,099 | 141,309 | ||||||||||||||
Total Residential REITs |
| 1,823,763 | ||||||||||||||
Retail REITs — 1.9% |
| |||||||||||||||
Brixmor Property Group Inc. | 10,044 | 235,532 | ||||||||||||||
Getty Realty Corp. | 3,124 | 85,441 | ||||||||||||||
Klepierre SA | 5,900 | 152,725 | (a) | |||||||||||||
NNN REIT Inc. | 5,297 | 226,394 | ||||||||||||||
Realty Income Corp. | 6,020 | 325,682 | ||||||||||||||
Regency Centers Corp. | 1,232 | 74,610 | ||||||||||||||
Simon Property Group Inc. | 5,762 | 901,695 | ||||||||||||||
Total Retail REITs |
| 2,002,079 | ||||||||||||||
Specialized REITs — 2.8% |
| |||||||||||||||
CubeSmart | 5,635 | 254,815 | ||||||||||||||
Digital Realty Trust Inc. | 2,424 | 349,153 | ||||||||||||||
EPR Properties | 3,461 | 146,919 | ||||||||||||||
Equinix Inc. | 902 | 744,448 | ||||||||||||||
Extra Space Storage Inc. | 1,928 | 283,416 | ||||||||||||||
Gaming and Leisure Properties Inc. | 3,859 | 177,784 | ||||||||||||||
Iron Mountain Inc. | 1,953 | 156,650 | ||||||||||||||
See Notes to Consolidated Financial Statements.
10 | Franklin Strategic Real Return Fund 2024 Semi-Annual Report |
Franklin Strategic Real Return Fund
(Percentages shown based on Fund net assets)
| Security | Shares | Value | ||||||||||||||
Specialized REITs — continued |
| |||||||||||||||
Public Storage | 1,828 | $ | 530,230 | |||||||||||||
VICI Properties Inc. | 10,350 | 308,326 | ||||||||||||||
Total Specialized REITs |
| 2,951,741 | ||||||||||||||
Total Real Estate |
| 11,245,304 | ||||||||||||||
| Utilities — 0.3% |
| |||||||||||||||
Independent Power and Renewable Electricity Producers — 0.2% |
| |||||||||||||||
Vistra Corp. | 2,838 | 197,667 | ||||||||||||||
Multi-Utilities — 0.1% |
| |||||||||||||||
Centrica PLC | 46,826 | 75,486 | (a) | |||||||||||||
Total Utilities |
| 273,153 | ||||||||||||||
Total Common Stocks (Cost — $25,638,635) |
| 33,647,941 | ||||||||||||||
| Investments in Underlying Funds — 4.3% |
| |||||||||||||||
iShares Trust — iShares Global Infrastructure ETF (Cost — $4,501,122) | 93,890 | 4,471,042 | ||||||||||||||
| Rate | Maturity Date | Face Amount | ||||||||||||||
| Corporate Bonds & Notes — 1.7% |
| |||||||||||||||
| Energy — 0.8% |
| |||||||||||||||
Energy Equipment & Services — 0.0%†† |
| |||||||||||||||
Halliburton Co., Senior Notes | 3.800 | % | 11/15/25 | $ | 2,000 | 1,956 | ||||||||||
Oil, Gas & Consumable Fuels — 0.8% |
| |||||||||||||||
Apache Corp., Senior Notes | 4.750 | % | 4/15/43 | 60,000 | 47,347 | |||||||||||
BP Capital Markets America Inc., Senior Notes | 3.588 | % | 4/14/27 | 240,000 | 231,285 | |||||||||||
Devon Energy Corp., Senior Notes | 5.850 | % | 12/15/25 | 230,000 | 231,349 | |||||||||||
Energy Transfer LP, Senior Notes | 2.900 | % | 5/15/25 | 20,000 | 19,418 | |||||||||||
Exxon Mobil Corp., Senior Notes | 3.043 | % | 3/1/26 | 50,000 | 48,451 | |||||||||||
Kinder Morgan Inc., Senior Notes | 4.300 | % | 6/1/25 | 80,000 | 78,886 | |||||||||||
Occidental Petroleum Corp., Senior Notes | 5.550 | % | 3/15/26 | 40,000 | 40,173 | |||||||||||
Occidental Petroleum Corp., Senior Notes | 3.000 | % | 2/15/27 | 60,000 | 56,317 | |||||||||||
Occidental Petroleum Corp., Senior Notes | 3.500 | % | 8/15/29 | 50,000 | 45,380 | |||||||||||
Western Midstream Operating LP, Senior Notes | 3.100 | % | 2/1/25 | 30,000 | 29,372 | |||||||||||
Total Oil, Gas & Consumable Fuels |
| 827,978 | ||||||||||||||
Total Energy |
| 829,934 | ||||||||||||||
| Materials — 0.9% |
| |||||||||||||||
Metals & Mining — 0.7% |
| |||||||||||||||
Anglo American Capital PLC, Senior Notes | 4.000 | % | 9/11/27 | 200,000 | 190,965 | (b) | ||||||||||
Antofagasta PLC, Senior Notes | 2.375 | % | 10/14/30 | 200,000 | 167,439 | (b) | ||||||||||
ArcelorMittal SA, Senior Notes | 7.000 | % | 10/15/39 | 50,000 | 54,481 | |||||||||||
Glencore Funding LLC, Senior Notes | 4.000 | % | 3/27/27 | 50,000 | 48,354 | (b) | ||||||||||
See Notes to Consolidated Financial Statements.
| Franklin Strategic Real Return Fund 2024 Semi-Annual Report |
|
11 |
|
Consolidated schedule of investments (unaudited) (cont’d)
March 31, 2024
Franklin Strategic Real Return Fund
(Percentages shown based on Fund net assets)
| Security | Rate | Maturity Date | Face Amount | Value | ||||||||||||
Metals & Mining — continued |
| |||||||||||||||
Southern Copper Corp., Senior Notes | 5.250 | % | 11/8/42 | $ | 220,000 | $ | 208,649 | |||||||||
Vale Overseas Ltd., Senior Notes | 6.250 | % | 8/10/26 | 50,000 | 50,808 | |||||||||||
Total Metals & Mining |
| 720,696 | ||||||||||||||
Paper & Forest Products — 0.2% |
| |||||||||||||||
Inversiones CMPC SA, Senior Notes | 4.375 | % | 4/4/27 | 200,000 | 192,520 | (c) | ||||||||||
Total Materials |
| 913,216 | ||||||||||||||
Total Corporate Bonds & Notes (Cost — $1,834,523) |
| 1,743,150 | ||||||||||||||
| Shares | ||||||||||||||||
| Preferred Stocks — 0.1% |
| |||||||||||||||
| Financials — 0.1% |
| |||||||||||||||
Banks — 0.1% |
| |||||||||||||||
Itausa SA (Cost — $143,246) | 8.866 | % | 70,100 | 146,618 | (d) | |||||||||||
| Maturity Date | Face Amount | |||||||||||||||
| Sovereign Bonds — 0.1% | ||||||||||||||||
Peru — 0.1% |
| |||||||||||||||
Peruvian Government International Bond, Senior Notes (Cost — $160,002) | 2.783 | % | 1/23/31 | $ | 160,000 | 137,289 | ||||||||||
Total Investments before Short-Term Investments (Cost — $74,216,744) |
| 79,182,422 | ||||||||||||||
| Shares | ||||||||||||||||
| Short-Term Investments — 22.7% |
| |||||||||||||||
Dreyfus Government Cash Management, Institutional Shares | 5.219% | 692,477 | 692,477 | (e) | ||||||||||||
Invesco Government & Agency Portfolio, Institutional Class | 5.245% | 22,569,278 | 22,569,278 | (e) | ||||||||||||
Invesco Treasury Portfolio, Institutional Class | 5.216% | 365,354 | 365,354 | (e) | ||||||||||||
Total Short-Term Investments (Cost — $23,627,109) |
| 23,627,109 | ||||||||||||||
Total Investments — 98.6% (Cost — $97,843,853) |
| 102,809,531 | ||||||||||||||
Other Assets in Excess of Liabilities — 1.4% |
| 1,506,032 | ||||||||||||||
Total Net Assets — 100.0% |
| $ | 104,315,563 | |||||||||||||
See Notes to Consolidated Financial Statements.
12 | Franklin Strategic Real Return Fund 2024 Semi-Annual Report |
Franklin Strategic Real Return Fund
| †† | Represents less than 0.1%. |
| * | Non-income producing security. |
| (a) | Security is fair valued in accordance with procedures approved by the Board of Trustees (Note 1). |
| (b) | Security is exempt from registration under Rule 144A of the Securities Act of 1933. This security may be resold in transactions that are exempt from registration, normally to qualified institutional buyers. This security has been deemed liquid pursuant to guidelines approved by the Board of Trustees. |
| (c) | Security is exempt from registration under Regulation S of the Securities Act of 1933. Regulation S applies to securities offerings that are made outside of the United States and do not involve direct selling efforts in the United States. This security has been deemed liquid pursuant to guidelines approved by the Board of Trustees. |
| (d) | The rate shown represents the yield as of March 31, 2024. |
| (e) | Rate shown is one-day yield as of the end of the reporting period. |
Abbreviation(s) used in this schedule: | ||
| ETF | — Exchange-Traded Fund | |
| REIT | — Real Estate Investment Trust | |
At March 31, 2024, the Fund had the following open futures contracts:
Number of Contracts | Expiration Date | Notional Amount | Market Value | Unrealized Appreciation | ||||||||||||||||
| Contracts to Buy: | ||||||||||||||||||||
| E-mini S&P 500 Index | 23 | 6/24 | $ | 5,964,636 | $ | 6,104,775 | $ | 140,139 | ||||||||||||
| S&P GSCI | 134 | 4/24 | 18,829,113 | 19,498,675 | 669,562 | |||||||||||||||
| U.S. Treasury 10-Year Notes | 5 | 6/24 | 551,102 | 553,984 | 2,882 | |||||||||||||||
| Net unrealized appreciation on open futures contracts |
| $ | 812,583 | |||||||||||||||||
At March 31, 2024, the Fund had the following open forward foreign currency contracts:
Currency Purchased | Currency Sold | Counterparty | Settlement Date | Unrealized Appreciation (Depreciation) | ||||||||||||||||
| EUR | 21,908 | USD | 24,142 | Citibank N.A. | 4/19/24 | $ | (486 | ) | ||||||||||||
| USD | 23,749 | EUR | 21,907 | Citibank N.A. | 4/19/24 | 94 | ||||||||||||||
| Net unrealized depreciation on open forward foreign currency contracts |
| $ | (392 | ) | ||||||||||||||||
Abbreviation(s) used in this table: | ||
| EUR | — Euro | |
| USD | — United States Dollar | |
See Notes to Consolidated Financial Statements.
| Franklin Strategic Real Return Fund 2024 Semi-Annual Report |
|
13 |
|
Consolidated statement of assets and liabilities (unaudited)
March 31, 2024
| Assets: | ||||
Investments, at value (Cost — $97,843,853) | $ | 102,809,531 | ||
Foreign currency, at value (Cost — $7,495) | 7,426 | |||
Cash | 27,718 | |||
Deposits with brokers for open futures contracts | 1,220,025 | |||
Interest and dividends receivable | 338,882 | |||
Receivable from brokers — net variation margin on open futures contracts | 272,922 | |||
Unrealized appreciation on forward foreign currency contracts | 94 | |||
Prepaid expenses | 3,301 | |||
Total Assets | 104,679,899 | |||
| Liabilities: | ||||
Investment management fee payable | 139,643 | |||
Payable for Fund shares repurchased | 118,786 | |||
Fund accounting fees payable | 69,520 | |||
Trustees’ fees payable | 2,068 | |||
Service and/or distribution fees payable | 1,357 | |||
Unrealized depreciation on forward foreign currency contracts | 486 | |||
Accrued expenses | 32,476 | |||
Total Liabilities | 364,336 | |||
| Total Net Assets | $ | 104,315,563 | ||
| Net Assets: | ||||
Par value (Note 7) | $ | 106 | ||
Paid-in capital in excess of par value | 101,783,878 | |||
Total distributable earnings (loss) | 2,531,579 | |||
| Total Net Assets | $ | 104,315,563 | ||
See Notes to Consolidated Financial Statements.
14 | Franklin Strategic Real Return Fund 2024 Semi-Annual Report |
| Net Assets: | ||||
Class A | $4,002,040 | |||
Class C | $369,525 | |||
Class I | $108,366 | |||
Class IS | $99,835,632 | |||
| Shares Outstanding: | ||||
Class A | 415,855 | |||
Class C | 39,771 | |||
Class I | 10,829 | |||
Class IS | 10,165,701 | |||
| Net Asset Value: | ||||
Class A (and redemption price) | $9.62 | |||
Class C* | $9.29 | |||
Class I (and redemption price) | $10.01 | |||
Class IS (and redemption price) | $9.82 | |||
| Maximum Public Offering Price Per Share: | ||||
Class A (based on maximum initial sales charge of 5.50%) | $10.18 | |||
| * | Redemption price per share is NAV of Class C shares reduced by a 1.00% CDSC if shares are redeemed within one year from purchase payment (Note 2). |
See Notes to Consolidated Financial Statements.
| Franklin Strategic Real Return Fund 2024 Semi-Annual Report |
|
15 |
|
Consolidated statement of operations (unaudited)
For the Six Months Ended March 31, 2024
| Investment Income: | ||||
Dividends | $ | 1,033,983 | ||
Interest | 499,373 | |||
Less: Foreign taxes withheld | (22,322) | |||
Total Investment Income | 1,511,034 | |||
| Expenses: | ||||
Investment management fee (Note 2) | 382,892 | |||
Fund accounting fees | 69,675 | |||
Registration fees | 60,839 | |||
Legal fees | 23,685 | |||
Service and/or distribution fees (Notes 2 and 5) | 10,501 | |||
Commodity pool reports | 7,393 | |||
Transfer agent fees (Notes 2 and 5) | 6,240 | |||
Shareholder reports | 5,124 | |||
Trustees’ fees | 3,769 | |||
Audit and tax fees | 2,962 | |||
Custody fees | 2,668 | |||
Insurance | 662 | |||
Commitment fees (Note 8) | 649 | |||
Interest expense | 311 | |||
Fees recaptured by investment manager (Note 2) | 190 | |||
Miscellaneous expenses | 11,291 | |||
Total Expenses | 588,851 | |||
Less: Fee waivers and/or expense reimbursements (Notes 2 and 5) | (89,218) | |||
Net Expenses | 499,633 | |||
| Net Investment Income | 1,011,401 | |||
| Realized and Unrealized Gain (Loss) on Investments, Futures Contracts, Forward Foreign Currency Contracts and Foreign Currency Transactions (Notes 1, 3 and 4): |
| |||
Net Realized Gain (Loss) From: | ||||
Investment transactions | (1,792,902) | |||
Futures contracts | (672,433) | |||
Forward foreign currency contracts | (229,527) | |||
Foreign currency transactions | 91 | |||
Net Realized Loss | (2,694,771) | |||
Change in Net Unrealized Appreciation (Depreciation) From: | ||||
Investments | 9,512,101 | |||
Futures contracts | 1,000,370 | |||
Forward foreign currency contracts | 444,796 | |||
Foreign currencies | 1,739 | |||
Change in Net Unrealized Appreciation (Depreciation) | 10,959,006 | |||
| Net Gain on Investments, Futures Contracts, Forward Foreign Currency Contracts and Foreign Currency Transactions | 8,264,235 | |||
| Increase in Net Assets From Operations | $ | 9,275,636 | ||
See Notes to Consolidated Financial Statements.
16 | Franklin Strategic Real Return Fund 2024 Semi-Annual Report |
Consolidated statements of changes in net assets
| For the Six Months Ended March 31, 2024 (unaudited) and the Year Ended September 30, 2023 | 2024 | 2023 | ||||||
| Operations: | ||||||||
Net investment income | $ | 1,011,401 | $ | 2,432,949 | ||||
Net realized gain (loss) | (2,694,771 | ) | 667,080 | |||||
Change in net unrealized appreciation (depreciation) | 10,959,006 | 4,422,065 | ||||||
Increase in Net Assets From Operations | 9,275,636 | 7,522,094 | ||||||
| Distributions to Shareholders From (Notes 1 and 6): | ||||||||
Total distributable earnings | (3,400,003 | ) | (10,124,763 | ) | ||||
Decrease in Net Assets From Distributions to Shareholders | (3,400,003 | ) | (10,124,763 | ) | ||||
| Fund Share Transactions (Note 7): | ||||||||
Net proceeds from sale of shares | 3,054,715 | 6,795,565 | ||||||
Reinvestment of distributions | 3,398,213 | 10,116,978 | ||||||
Cost of shares repurchased | (7,833,618 | ) | (4,668,068 | ) | ||||
Increase (Decrease) in Net Assets From Fund Share Transactions | (1,380,690 | ) | 12,244,475 | |||||
Increase in Net Assets | 4,494,943 | 9,641,806 | ||||||
| Net Assets: | ||||||||
Beginning of period | 99,820,620 | 90,178,814 | ||||||
End of period | $ | 104,315,563 | $ | 99,820,620 | ||||
See Notes to Consolidated Financial Statements.
| Franklin Strategic Real Return Fund 2024 Semi-Annual Report |
|
17 |
|
Consolidated financial highlights
| For a share of each class of beneficial interest outstanding throughout each year ended September 30, unless otherwise noted: | ||||||||||||||||||||||||
| Class A Shares1 | 20242 | 2023 | 2022 | 2021 | 2020 | 2019 | ||||||||||||||||||
| Net asset value, beginning of period | $9.08 | $9.35 | $12.72 | $10.54 | $11.15 | $12.24 | ||||||||||||||||||
| Income (loss) from operations: | ||||||||||||||||||||||||
Net investment income | 0.07 | 0.20 | 0.39 | 0.21 | 0.05 | 0.14 | ||||||||||||||||||
Net realized and unrealized gain (loss) | 0.76 | 0.56 | (1.75) | 2.23 | (0.24) | (0.30) | ||||||||||||||||||
Total income (loss) from operations | 0.83 | 0.76 | (1.36) | 2.44 | (0.19) | (0.16) | ||||||||||||||||||
| Less distributions from: | ||||||||||||||||||||||||
Net investment income | (0.29) | (0.30) | (1.30) | (0.16) | (0.05) | (0.49) | ||||||||||||||||||
Net realized gains | — | (0.73) | (0.71) | (0.10) | (0.37) | (0.44) | ||||||||||||||||||
Total distributions | (0.29) | (1.03) | (2.01) | (0.26) | (0.42) | (0.93) | ||||||||||||||||||
| Net asset value, end of period | $9.62 | $9.08 | $9.35 | $12.72 | $10.54 | $11.15 | ||||||||||||||||||
Total return3 | 9.26 | % | 8.13 | % | (13.03) | % | 23.37 | % | (1.74) | % | (0.73) | % | ||||||||||||
| Net assets, end of period (000s) | $4,002 | $6,914 | $7,295 | $1,704 | $259 | $272 | ||||||||||||||||||
| Ratios to average net assets: | ||||||||||||||||||||||||
Gross expenses4 | 1.53 | %5 | 1.46 | % | 1.50 | % | 1.63 | % | 1.81 | % | 1.68 | % | ||||||||||||
Net expenses4,6,7 | 1.30 | 5 | 1.30 | 1.31 | 1.30 | 1.31 | 1.32 | |||||||||||||||||
Net investment income | 1.49 | 5 | 2.10 | 3.59 | 1.75 | 0.43 | 1.27 | |||||||||||||||||
| Portfolio turnover rate | 18 | % | 15 | % | 64 | % | 41 | % | 43 | % | 44 | % | ||||||||||||
| 1 | Per share amounts have been calculated using the average shares method. |
| 2 | For the six months ended March 31, 2024 (unaudited). |
| 3 | Performance figures, exclusive of sales charges, may reflect compensating balance arrangements, fee waivers and/or expense reimbursements. In the absence of compensating balance arrangements, fee waivers and/or expense reimbursements, the total return would have been lower. Past performance is no guarantee of future results. Total returns for periods of less than one year are not annualized. |
| 4 | Does not include fees and expenses of the Underlying Funds in which the Fund invests. |
| 5 | Annualized. |
| 6 | Reflects fee waivers and/or expense reimbursements. |
| 7 | As a result of an expense limitation arrangement, the ratio of total annual fund operating expenses, other than interest, brokerage commissions (except for brokerage commissions paid on purchases and sales of shares of ETFs), dividend expense on short sales, taxes and extraordinary expenses, to average net assets of Class A shares did not exceed 1.35%. This expense limitation arrangement cannot be terminated prior to December 31, 2025 without the Board of Trustees’ consent. Acquired fund fees and expenses are subject to the expense limitation arrangement. |
See Notes to Consolidated Financial Statements.
18 | Franklin Strategic Real Return Fund 2024 Semi-Annual Report |
| For a share of each class of beneficial interest outstanding throughout each year ended September 30, unless otherwise noted: | ||||||||||||||||||||||||
| Class C Shares1 | 20242 | 2023 | 2022 | 2021 | 2020 | 2019 | ||||||||||||||||||
| Net asset value, beginning of period | $8.73 | $9.04 | $12.14 | $10.13 | $10.79 | $11.82 | ||||||||||||||||||
| Income (loss) from operations: | ||||||||||||||||||||||||
Net investment income (loss) | 0.04 | 0.12 | 0.37 | 0.02 | (0.04) | 0.04 | ||||||||||||||||||
Net realized and unrealized gain (loss) | 0.73 | 0.54 | (1.64) | 2.23 | (0.21) | (0.27) | ||||||||||||||||||
Total income (loss) from operations | 0.77 | 0.66 | (1.27) | 2.25 | (0.25) | (0.23) | ||||||||||||||||||
| Less distributions from: | ||||||||||||||||||||||||
Net investment income | (0.21) | (0.24) | (1.12) | (0.14) | (0.04) | (0.36) | ||||||||||||||||||
Net realized gains | — | (0.73) | (0.71) | (0.10) | (0.37) | (0.44) | ||||||||||||||||||
Total distributions | (0.21) | (0.97) | (1.83) | (0.24) | (0.41) | (0.80) | ||||||||||||||||||
| Net asset value, end of period | $9.29 | $8.73 | $9.04 | $12.14 | $10.13 | $10.79 | ||||||||||||||||||
Total return3 | 8.82 | % | 7.34 | % | (12.54) | % | 22.53 | % | (2.54) | % | (1.51) | % | ||||||||||||
| Net assets, end of period (000s) | $370 | $505 | $628 | $13 | $54 | $81 | ||||||||||||||||||
| Ratios to average net assets: | ||||||||||||||||||||||||
Gross expenses4 | 2.26 | %5 | 2.19 | % | 2.25 | % | 2.42 | % | 2.45 | % | 2.42 | %6 | ||||||||||||
Net expenses4,7,8 | 2.05 | 5 | 2.05 | 2.06 | 2.05 | 2.06 | 2.07 | 6 | ||||||||||||||||
Net investment income (loss) | 0.96 | 5 | 1.31 | 3.54 | 0.20 | (0.37) | 0.40 | |||||||||||||||||
| Portfolio turnover rate | 18 | % | 15 | % | 64 | % | 41 | % | 43 | % | 44 | % | ||||||||||||
| 1 | Per share amounts have been calculated using the average shares method. |
| 2 | For the six months ended March 31, 2024 (unaudited). |
| 3 | Performance figures, exclusive of CDSC, may reflect compensating balance arrangements, fee waivers and/or expense reimbursements. In the absence of compensating balance arrangements, fee waivers and/or expense reimbursements, the total return would have been lower. Past performance is no guarantee of future results. Total returns for periods of less than one year are not annualized. |
| 4 | Does not include fees and expenses of the Underlying Funds in which the Fund invests. |
| 5 | Annualized. |
| 6 | Reflects recapture of fees waived and/or expenses reimbursed from prior fiscal years. |
| 7 | Reflects fee waivers and/or expense reimbursements. |
| 8 | As a result of an expense limitation arrangement, the ratio of total annual fund operating expenses, other than interest, brokerage commissions (except for brokerage commissions paid on purchases and sales of shares of ETFs), dividend expense on short sales, taxes and extraordinary expenses, to average net assets of Class C shares did not exceed 2.10%. This expense limitation arrangement cannot be terminated prior to December 31, 2025 without the Board of Trustees’ consent. Acquired fund fees and expenses are subject to the expense limitation arrangement. |
See Notes to Consolidated Financial Statements.
| Franklin Strategic Real Return Fund 2024 Semi-Annual Report |
|
19 |
|
Consolidated financial highlights (cont’d)
| For a share of each class of beneficial interest outstanding throughout each year ended September 30, unless otherwise noted: | ||||||||||||||||||||||||
| Class I Shares1 | 20242 | 2023 | 2022 | 2021 | 2020 | 2019 | ||||||||||||||||||
| Net asset value, beginning of period | $9.44 | $9.69 | $13.07 | $10.81 | $11.40 | $12.52 | ||||||||||||||||||
| Income (loss) from operations: | ||||||||||||||||||||||||
Net investment income | 0.08 | 0.23 | 0.46 | 0.05 | 0.06 | 0.16 | ||||||||||||||||||
Net realized and unrealized gain (loss) | 0.80 | 0.58 | (1.85) | 2.48 | (0.22) | (0.31) | ||||||||||||||||||
Total income (loss) from operations | 0.88 | 0.81 | (1.39) | 2.53 | (0.16) | (0.15) | ||||||||||||||||||
| Less distributions from: | ||||||||||||||||||||||||
Net investment income | (0.31) | (0.33) | (1.28) | (0.17) | (0.06) | (0.53) | ||||||||||||||||||
Net realized gains | — | (0.73) | (0.71) | (0.10) | (0.37) | (0.44) | ||||||||||||||||||
Total distributions | (0.31) | (1.06) | (1.99) | (0.27) | (0.43) | (0.97) | ||||||||||||||||||
| Net asset value, end of period | $10.01 | $9.44 | $9.69 | $13.07 | $10.81 | $11.40 | ||||||||||||||||||
Total return3 | 9.38 | % | 8.41 | % | (12.83) | % | 23.72 | % | (1.55) | % | (0.52) | % | ||||||||||||
| Net assets, end of period (000s) | $108 | $241 | $237 | $51 | $515 | $1,684 | ||||||||||||||||||
| Ratios to average net assets: | ||||||||||||||||||||||||
Gross expenses4 | 1.22 | %5 | 1.18 | %6 | 2.24 | % | 1.50 | % | 1.31 | %6 | 1.30 | %6 | ||||||||||||
Net expenses4,7,8 | 1.05 | 5,6 | 1.05 | 6 | 1.06 | 1.05 | 1.06 | 6 | 1.07 | 6 | ||||||||||||||
Net investment income | 1.58 | 5 | 2.32 | 4.09 | 0.44 | 0.51 | 1.41 | |||||||||||||||||
| Portfolio turnover rate | 18 | % | 15 | % | 64 | % | 41 | % | 43 | % | 44 | % | ||||||||||||
| 1 | Per share amounts have been calculated using the average shares method. |
| 2 | For the six months ended March 31, 2024 (unaudited). |
| 3 | Performance figures may reflect compensating balance arrangements, fee waivers and/or expense reimbursements. In the absence of compensating balance arrangements, fee waivers and/or expense reimbursements, the total return would have been lower. Past performance is no guarantee of future results. Total returns for periods of less than one year are not annualized. |
| 4 | Does not include fees and expenses of the Underlying Funds in which the Fund invests. |
| 5 | Annualized. |
| 6 | Reflects recapture of fees waived and/or expenses reimbursed from prior fiscal years. |
| 7 | Reflects fee waivers and/or expense reimbursements. |
| 8 | As a result of an expense limitation arrangement, the ratio of total annual fund operating expenses, other than interest, brokerage commissions (except for brokerage commissions paid on purchases and sales of shares of ETFs), dividend expense on short sales, taxes and extraordinary expenses, to average net assets of Class I shares did not exceed 1.10%. This expense limitation arrangement cannot be terminated prior to December 31, 2025 without the Board of Trustees’ consent. Acquired fund fees and expenses are subject to the expense limitation arrangement. |
See Notes to Consolidated Financial Statements.
20 | Franklin Strategic Real Return Fund 2024 Semi-Annual Report |
| For a share of each class of beneficial interest outstanding throughout each year ended September 30, unless otherwise noted: | ||||||||||||||||||||||||
| Class IS Shares1 | 20242 | 2023 | 2022 | 2021 | 2020 | 2019 | ||||||||||||||||||
| Net asset value, beginning of period | $9.28 | $9.53 | $12.91 | $10.67 | $11.25 | $12.36 | ||||||||||||||||||
| Income (loss) from operations: | ||||||||||||||||||||||||
Net investment income | 0.10 | 0.24 | 0.33 | 0.18 | 0.08 | 0.18 | ||||||||||||||||||
Net realized and unrealized gain (loss) | 0.77 | 0.57 | (1.68) | 2.33 | (0.23) | (0.31) | ||||||||||||||||||
Total income (loss) from operations | 0.87 | 0.81 | (1.35) | 2.51 | (0.15) | (0.13) | ||||||||||||||||||
| Less distributions from: | ||||||||||||||||||||||||
Net investment income | (0.33) | (0.33) | (1.32) | (0.17) | (0.06) | (0.54) | ||||||||||||||||||
Net realized gains | — | (0.73) | (0.71) | (0.10) | (0.37) | (0.44) | ||||||||||||||||||
Total distributions | (0.33) | (1.06) | (2.03) | (0.27) | (0.43) | (0.98) | ||||||||||||||||||
| Net asset value, end of period | $9.82 | $9.28 | $9.53 | $12.91 | $10.67 | $11.25 | ||||||||||||||||||
Total return3 | 9.47 | % | 8.52 | % | (12.73) | % | 23.88 | % | (1.45) | % | (0.35) | % | ||||||||||||
| Net assets, end of period (000s) | $99,836 | $92,160 | $82,018 | $109,255 | $93,150 | $94,463 | ||||||||||||||||||
| Ratios to average net assets: | ||||||||||||||||||||||||
Gross expenses4 | 1.12 | %5 | 1.08 | % | 1.09 | % | 1.08 | % | 1.17 | %6 | 1.17 | %6 | ||||||||||||
Net expenses4,7,8 | 0.95 | 5,6 | 0.95 | 0.95 | 0.95 | 0.96 | 6 | 0.97 | 6 | |||||||||||||||
Net investment income | 2.02 | 5 | 2.48 | 2.87 | 1.48 | 0.78 | 1.65 | |||||||||||||||||
| Portfolio turnover rate | 18 | % | 15 | % | 64 | % | 41 | % | 43 | % | 44 | % | ||||||||||||
| 1 | Per share amounts have been calculated using the average shares method. |
| 2 | For the six months ended March 31, 2024 (unaudited). |
| 3 | Performance figures may reflect compensating balance arrangements, fee waivers and/or expense reimbursements. In the absence of compensating balance arrangements, fee waivers and/or expense reimbursements, the total return would have been lower. Past performance is no guarantee of future results. Total returns for periods of less than one year are not annualized. |
| 4 | Does not include fees and expenses of the Underlying Funds in which the Fund invests. |
| 5 | Annualized. |
| 6 | Reflects recapture of fees waived and/or expenses reimbursed from prior fiscal years. |
| 7 | Reflects fee waivers and/or expense reimbursements. |
| 8 | As a result of an expense limitation arrangement, the ratio of total annual fund operating expenses, other than interest, brokerage commissions (except for brokerage commissions paid on purchases and sales of ETFs), dividend expense on short sales, taxes and extraordinary expenses, to average net assets of Class IS shares did not exceed 1.00%. In addition, the ratio of total annual fund operating expenses for Class IS shares did not exceed the ratio of total annual fund operating expenses for Class I shares. These expense limitation arrangements cannot be terminated prior to December 31, 2025 without the Board of Trustees’ consent. Acquired fund fees and expenses are subject to the expense limitation arrangement. |
See Notes to Consolidated Financial Statements.
| Franklin Strategic Real Return Fund 2024 Semi-Annual Report |
|
21 |
|
Notes to consolidated financial statements (unaudited)
1. Organization and significant accounting policies
Franklin Strategic Real Return Fund (the “Fund”) is a separate non-diversified investment series of Legg Mason Global Asset Management Trust (the “Trust”). The Trust, a Maryland statutory trust, is registered under the Investment Company Act of 1940, as amended (the “1940 Act”), as an open-end management investment company.
The Fund gains exposure to the commodities markets by investing a portion of its assets in a wholly-owned subsidiary, Real Return Fund Ltd. (the “Subsidiary”), organized under the laws of the Cayman Islands. Among other investments, the Subsidiary may invest in commodity-linked instruments. The Fund may invest up to 25% of its total assets in the Subsidiary. These financial statements are the consolidated financial statements of the Fund and the Subsidiary. All interfund transactions have been eliminated in consolidation.
The Fund follows the accounting and reporting guidance in Financial Accounting Standards Board (“FASB”) Accounting Standards Codification Topic 946, Financial Services – Investment Companies (“ASC 946”). The following are significant accounting policies consistently followed by the Fund and are in conformity with U.S. generally accepted accounting principles (“GAAP”), including, but not limited to, ASC 946. Estimates and assumptions are required to be made regarding assets, liabilities and changes in net assets resulting from operations when financial statements are prepared. Changes in the economic environment, financial markets and any other parameters used in determining these estimates could cause actual results to differ. Subsequent events have been evaluated through the date the financial statements were issued.
(a) Investment valuation. Equity securities for which market quotations are available are valued at the last reported sales price or official closing price on the primary market or exchange on which they trade. The valuations for fixed income securities (which may include, but are not limited to, corporate, government, municipal, mortgage-backed, collateralized mortgage obligations and asset-backed securities) and certain derivative instruments are typically the prices supplied by independent third party pricing services, which may use market prices or broker/dealer quotations or a variety of valuation techniques and methodologies. The independent third party pricing services typically use inputs that are observable such as issuer details, interest rates, yield curves, prepayment speeds, credit risks/spreads, default rates and quoted prices for similar securities. Investments in open-end funds are valued at the closing net asset value per share of each fund on the day of valuation. Futures contracts are valued daily at the settlement price established by the board of trade or exchange on which they are traded. When the Fund holds securities or other assets that are denominated in a foreign currency, the Fund will normally use the currency exchange rates as of 4:00 p.m. (Eastern Time). If independent third party pricing services are unable to supply prices for a portfolio investment, or if the prices supplied are deemed by the manager to be unreliable, the market price may be determined by the manager using quotations from one or more broker/dealers or at the transaction price if the security has recently been purchased and no value has yet been obtained from a pricing service or pricing broker. When reliable prices are not readily available, such as when the value of a security has been significantly affected by events
22 | Franklin Strategic Real Return Fund 2024 Semi-Annual Report |
after the close of the exchange or market on which the security is principally traded, but before the Fund calculates its net asset value, the Fund values these securities as determined in accordance with procedures approved by the Fund’s Board of Trustees. This may include using an independent third party pricing service to adjust the value of such securities to the latest indications of fair value at 4:00 p.m. (Eastern Time).
Pursuant to policies adopted by the Board of Trustees, the Fund’s manager has been designated as the valuation designee and is responsible for the oversight of the daily valuation process. The Fund’s manager is assisted by the Global Fund Valuation Committee (the “Valuation Committee”). The Valuation Committee is responsible for making fair value determinations, evaluating the effectiveness of the Fund’s pricing policies, and reporting to the Fund’s manager and the Board of Trustees. When determining the reliability of third party pricing information for investments owned by the Fund, the Valuation Committee, among other things, conducts due diligence reviews of pricing vendors, monitors the daily change in prices and reviews transactions among market participants.
The Valuation Committee will consider pricing methodologies it deems relevant and appropriate when making fair value determinations. Examples of possible methodologies include, but are not limited to, multiple of earnings; discount from market of a similar freely traded security; discounted cash-flow analysis; book value or a multiple thereof; risk premium/yield analysis; yield to maturity; and/or fundamental investment analysis. The Valuation Committee will also consider factors it deems relevant and appropriate in light of the facts and circumstances. Examples of possible factors include, but are not limited to, the type of security; the issuer’s financial statements; the purchase price of the security; the discount from market value of unrestricted securities of the same class at the time of purchase; analysts’ research and observations from financial institutions; information regarding any transactions or offers with respect to the security; the existence of merger proposals or tender offers affecting the security; the price and extent of public trading in similar securities of the issuer or comparable companies; and the existence of a shelf registration for restricted securities.
For each portfolio security that has been fair valued pursuant to the policies adopted by the Board of Trustees, the fair value price is compared against the last available and next available market quotations. The Valuation Committee reviews the results of such back testing monthly and fair valuation occurrences are reported to the Board of Trustees quarterly.
The Fund uses valuation techniques to measure fair value that are consistent with the market approach and/or income approach, depending on the type of security and the particular circumstance. The market approach uses prices and other relevant information generated by market transactions involving identical or comparable securities. The income approach uses valuation techniques to discount estimated future cash flows to present value.
| Franklin Strategic Real Return Fund 2024 Semi-Annual Report |
|
23 |
|
Notes to consolidated financial statements (unaudited) (cont’d)
GAAP establishes a disclosure hierarchy that categorizes the inputs to valuation techniques used to value assets and liabilities at measurement date. These inputs are summarized in the three broad levels listed below:
| • | Level 1 — unadjusted quoted prices in active markets for identical investments |
| • | Level 2 — other significant observable inputs (including quoted prices for similar investments, interest rates, prepayment speeds, credit risk, etc.) |
| • | Level 3 — significant unobservable inputs (including the Fund’s own assumptions in determining the fair value of investments) |
The inputs or methodologies used to value securities are not necessarily an indication of the risk associated with investing in those securities.
The following is a summary of the inputs used in valuing the Fund’s assets and liabilities carried at fair value:
| ASSETS | ||||||||||||||||
| Description | Quoted Prices (Level 1) | Other Significant Observable Inputs (Level 2)* | Significant Unobservable Inputs (Level 3) | Total | ||||||||||||
| Long-Term Investments†: | ||||||||||||||||
U.S. Treasury Inflation Protected Securities | — | $ | 39,036,382 | — | $ | 39,036,382 | ||||||||||
Common Stocks: | ||||||||||||||||
Communication Services | $ | 1,426,732 | 596,009 | — | 2,022,741 | |||||||||||
Consumer Discretionary | 2,410,555 | 753,742 | — | 3,164,297 | ||||||||||||
Consumer Staples | 1,215,891 | 519,024 | — | 1,734,915 | ||||||||||||
Energy | 520,658 | 380,593 | — | 901,251 | ||||||||||||
Financials | 2,245,863 | 1,507,218 | — | 3,753,081 | ||||||||||||
Health Care | 1,835,907 | 650,513 | — | 2,486,420 | ||||||||||||
Industrials | 1,248,342 | 853,238 | — | 2,101,580 | ||||||||||||
Information Technology | 4,809,862 | 941,764 | — | 5,751,626 | ||||||||||||
Materials | 91,531 | 122,042 | — | 213,573 | ||||||||||||
Real Estate | 10,838,448 | 406,856 | — | 11,245,304 | ||||||||||||
Utilities | 197,667 | 75,486 | — | 273,153 | ||||||||||||
Investments in Underlying Funds | 4,471,042 | — | — | 4,471,042 | ||||||||||||
Corporate Bonds & Notes | — | 1,743,150 | — | 1,743,150 | ||||||||||||
Preferred Stocks | 146,618 | — | — | 146,618 | ||||||||||||
Sovereign Bonds | — | 137,289 | — | 137,289 | ||||||||||||
| Total Long-Term Investments | 31,459,116 | 47,723,306 | — | 79,182,422 | ||||||||||||
| Short-Term Investments† | 23,627,109 | — | — | 23,627,109 | ||||||||||||
| Total Investments | $ | 55,086,225 | $ | 47,723,306 | — | $ | 102,809,531 | |||||||||
24 | Franklin Strategic Real Return Fund 2024 Semi-Annual Report |
| ASSETS (cont’d) | ||||||||||||||||
| Description | Quoted Prices (Level 1) | Other Significant Observable Inputs (Level 2)* | Significant Unobservable Inputs (Level 3) | Total | ||||||||||||
| Other Financial Instruments: | ||||||||||||||||
Futures Contracts†† | $ | 812,583 | — | — | $ | 812,583 | ||||||||||
Forward Foreign Currency | ||||||||||||||||
Contracts†† | — | $ | 94 | — | 94 | |||||||||||
| Total Other Financial Instruments | $ | 812,583 | $ | 94 | — | $ | 812,677 | |||||||||
| Total | $ | 55,898,808 | $ | 47,723,400 | — | $ | 103,622,208 | |||||||||
| LIABILITIES | ||||||||||||||||
| Description | Quoted Prices (Level 1) | Other Significant Observable Inputs (Level 2) | Significant Unobservable Inputs (Level 3) | Total | ||||||||||||
| Other Financial Instruments: | ||||||||||||||||
Forward Foreign Currency Contracts†† | — | $ | 486 | — | $ | 486 | ||||||||||
| * | As a result of the fair value pricing procedures for international equities utilized by the Fund, which account for events occurring after the close of the principal market of the security but prior to the calculation of the Fund’s net asset value, certain securities were classified as Level 2 within the fair value hierarchy. |
| † | See Consolidated Schedule of Investments for additional detailed categorizations. |
| †† | Reflects the unrealized appreciation (depreciation) of the instruments. |
(b) Futures contracts. The Fund uses futures contracts generally to gain exposure to, or hedge against, changes in interest rates or gain exposure to, or hedge against, changes in certain asset classes. A futures contract represents a commitment for the future purchase or sale of an asset at a specified price on a specified date.
Upon entering into a futures contract, the Fund is required to deposit cash or securities with a broker in an amount equal to a certain percentage of the contract amount. This is known as the ‘‘initial margin’’ and subsequent payments (‘‘variation margin’’) are made or received by the Fund each day, depending on the daily fluctuation in the value of the contract. For certain futures, including foreign denominated futures, variation margin is not settled daily, but is recorded as a net variation margin payable or receivable. The daily changes in contract value are recorded as unrealized appreciation or depreciation in the Consolidated Statement of Operations and the Fund recognizes a realized gain or loss when the contract is closed.
Futures contracts involve, to varying degrees, risk of loss in excess of the amounts reflected in the financial statements. In addition, there is the risk that the Fund may not be able to enter into a closing transaction because of an illiquid secondary market.
(c) Forward foreign currency contracts. The Fund enters into a forward foreign currency contract to maintain its target exposure to foreign currencies, to hedge against foreign
| Franklin Strategic Real Return Fund 2024 Semi-Annual Report |
|
25 |
|
Notes to consolidated financial statements (unaudited) (cont’d)
currency exchange rate risk on its non-U.S. dollar denominated securities, to facilitate settlement of a foreign currency denominated portfolio transaction or to attempt to increase the Fund’s return. A forward foreign currency contract is an agreement between two parties to buy and sell a currency at a set price with delivery and settlement at a future date. The contract is marked-to-market daily and the change in value is recorded by the Fund as an unrealized gain or loss. When a forward foreign currency contract is closed, through either delivery or offset by entering into another forward foreign currency contract, the Fund recognizes a realized gain or loss equal to the difference between the value of the contract at the time it was opened and the value of the contract at the time it is closed.
Forward foreign currency contracts involve elements of market risk in excess of the amounts reflected on the Consolidated Statement of Assets and Liabilities. The Fund bears the risk of an unfavorable change in the foreign exchange rate underlying the forward foreign currency contract. Risks may also arise upon entering into these contracts from the potential inability of the counterparties to meet the terms of their contracts.
(d) Inflation-indexed bonds. Inflation-indexed bonds are fixed income securities whose principal value or interest rate is periodically adjusted according to the rate of inflation. As the index measuring inflation changes, the principal value or interest rate of inflation-indexed bonds will be adjusted accordingly. Inflation adjustments to the principal amount of inflation-indexed bonds are reflected as an increase or decrease to investment income on the Consolidated Statement of Operations. Repayment of the original bond principal upon maturity (as adjusted for inflation) is guaranteed in the case of U.S. Treasury inflation-indexed bonds. For bonds that do not provide a similar guarantee, the adjusted principal value of the bond repaid at maturity may be less than the original principal.
(e) Foreign currency translation. Investment securities and other assets and liabilities denominated in foreign currencies are translated into U.S. dollar amounts based upon prevailing exchange rates on the date of valuation. Purchases and sales of investment securities and income and expense items denominated in foreign currencies are translated into U.S. dollar amounts based upon prevailing exchange rates on the respective dates of such transactions.
The Fund does not isolate that portion of the results of operations resulting from fluctuations in foreign exchange rates on investments from the fluctuations arising from changes in market prices of securities held. Such fluctuations are included with the net realized and unrealized gain or loss on investments.
Net realized foreign exchange gains or losses arise from sales of foreign currencies, including gains and losses on forward foreign currency contracts, currency gains or losses realized between the trade and settlement dates on securities transactions, and the difference between the amounts of dividends, interest, and foreign withholding taxes recorded on the Fund’s books and the U.S. dollar equivalent of the amounts actually received or paid. Net unrealized foreign exchange gains and losses arise from changes in
26 | Franklin Strategic Real Return Fund 2024 Semi-Annual Report |
the values of assets and liabilities, other than investments in securities, on the date of valuation, resulting from changes in exchange rates.
Foreign security and currency transactions may involve certain considerations and risks not typically associated with those of U.S. dollar denominated transactions as a result of, among other factors, the possibility of lower levels of governmental supervision and regulation of foreign securities markets and the possibility of political or economic instability.
(f) Foreign investment risks. The Fund’s investments in foreign securities may involve risks not present in domestic investments. Since securities may be denominated in foreign currencies, may require settlement in foreign currencies or may pay interest or dividends in foreign currencies, changes in the relationship of these foreign currencies to the U.S. dollar can significantly affect the value of the investments and earnings of the Fund. Foreign investments may also subject the Fund to foreign government exchange restrictions, expropriation, taxation or other political, social or economic developments, all of which affect the market and/or credit risk of the investments.
(g) Counterparty risk and credit-risk-related contingent features of derivative instruments. The Fund may invest in certain securities or engage in other transactions where the Fund is exposed to counterparty credit risk in addition to broader market risks. The Fund may invest in securities of issuers, which may also be considered counterparties as trading partners in other transactions. This may increase the risk of loss in the event of default or bankruptcy by the counterparty or if the counterparty otherwise fails to meet its contractual obligations. The Fund’s subadviser attempts to mitigate counterparty risk by (i) periodically assessing the creditworthiness of its trading partners, (ii) monitoring and/or limiting the amount of its net exposure to each individual counterparty based on its assessment and (iii) requiring collateral from the counterparty for certain transactions. Market events and changes in overall economic conditions may impact the assessment of such counterparty risk by the subadviser. In addition, declines in the values of underlying collateral received may expose the Fund to increased risk of loss.
With exchange traded and centrally cleared derivatives, there is less counterparty risk to the Fund since the exchange or clearinghouse, as counterparty to such instruments, guarantees against a possible default. The clearinghouse stands between the buyer and the seller of the contract; therefore, the credit risk is limited to failure of the clearinghouse. While offset rights may exist under applicable law, the Fund does not have a contractual right of offset against a clearing broker or clearinghouse in the event of a default of the clearing broker or clearinghouse.
The Fund has entered into master agreements, such as an International Swaps and Derivatives Association, Inc. Master Agreement (“ISDA Master Agreement”) or similar agreement, with certain of its derivative counterparties that govern over-the-counter (“OTC”) derivatives and provide for general obligations, representations, agreements, collateral posting terms, netting provisions in the event of default or termination and credit
| Franklin Strategic Real Return Fund 2024 Semi-Annual Report |
|
27 |
|
Notes to consolidated financial statements (unaudited) (cont’d)
related contingent features. The credit related contingent features include, but are not limited to, a percentage decrease in the Fund’s net assets or net asset value per share over a specified period of time. If these credit related contingent features were triggered, the derivatives counterparty could terminate the positions and demand payment or require additional collateral.
Under an ISDA Master Agreement, the Fund may, under certain circumstances, offset with the counterparty certain derivative financial instruments’ payables and/or receivables with collateral held and/or posted and create one single net payment. However, absent an event of default by the counterparty or a termination of the agreement, the terms of the ISDA Master Agreements do not result in an offset of reported amounts of financial assets and financial liabilities in the Consolidated Statement of Assets and Liabilities across transactions between the Fund and the applicable counterparty. The enforceability of the right to offset may vary by jurisdiction.
Collateral requirements differ by type of derivative. Collateral or margin requirements are set by the broker or exchange clearinghouse for exchange traded derivatives while collateral terms are contract specific for OTC traded derivatives. Cash collateral that has been pledged to cover obligations of the Fund under derivative contracts, if any, will be reported separately in the Consolidated Statement of Assets and Liabilities. Securities pledged as collateral, if any, for the same purpose are noted in the Consolidated Schedule of Investments.
As of March 31, 2024, the Fund held forward foreign currency contracts with credit related contingent features which had a liability position of $486. If a contingent feature in the master agreements would have been triggered, the Fund would have been required to pay this amount to its derivatives counterparties.
(h) Security transactions and investment income. Security transactions are accounted for on a trade date basis. Interest income (including interest income from payment-in-kind securities) is recorded on the accrual basis. Amortization of premiums and accretion of discounts on debt securities are recorded to interest income over the lives of the respective securities, except for premiums on certain callable debt securities, which are amortized to the earliest call date. Dividend income is recorded on the ex-dividend date for dividends received in cash and/or securities. Foreign dividend income is recorded on the ex-dividend date or as soon as practicable after the Fund determines the existence of a dividend declaration after exercising reasonable due diligence. The cost of investments sold is determined by use of the specific identification method. To the extent any issuer defaults or a credit event occurs that impacts the issuer, the Fund may halt any additional interest income accruals and consider the realizability of interest accrued up to the date of default or credit event.
(i) REIT distributions. The character of distributions received from Real Estate Investment Trusts (‘‘REITs’’) held by the Fund is generally comprised of net investment income, capital gains, and return of capital. It is the policy of the Fund to estimate the character of
28 | Franklin Strategic Real Return Fund 2024 Semi-Annual Report |
distributions received from underlying REITs based on historical data provided by the REITs. After each calendar year end, REITs report the actual tax character of these distributions. Differences between the estimated and actual amounts reported by the REITs are reflected in the Fund’s records in the year in which they are reported by the REITs by adjusting related investment cost basis, capital gains and income, as necessary.
(j) Distributions to shareholders. Distributions from net investment income and distributions of net realized gains, if any, are declared at least annually. Distributions to shareholders of the Fund are recorded on the ex-dividend date and are determined in accordance with income tax regulations, which may differ from GAAP.
(k) Share class accounting. Investment income, common expenses and realized/ unrealized gains (losses) on investments are allocated to the various classes of the Fund on the basis of daily net assets of each class. Fees relating to a specific class are charged directly to that share class.
(l) Compensating balance arrangements. The Fund has an arrangement with its custodian bank whereby a portion of the custodian’s fees is paid indirectly by credits earned on the Fund’s cash on deposit with the bank.
(m) Federal and other taxes. It is the Fund’s policy to comply with the federal income and excise tax requirements of the Internal Revenue Code of 1986 (the “Code”), as amended, applicable to regulated investment companies. Accordingly, the Fund intends to distribute its taxable income and net realized gains, if any, to shareholders in accordance with timing requirements imposed by the Code. Therefore, no federal or state income tax provision is required in the Fund’s financial statements.
Management has analyzed the Fund’s tax positions taken on income tax returns for all open tax years and has concluded that as of September 30, 2023, no provision for income tax is required in the Fund’s financial statements. The Fund’s federal and state income and federal excise tax returns for tax years for which the applicable statutes of limitations have not expired are subject to examination by the Internal Revenue Service and state departments of revenue.
Under the applicable foreign tax laws, a withholding tax may be imposed on interest, dividends and capital gains at various rates.
(n) Reclassification. GAAP requires that certain components of net assets be reclassified to reflect permanent differences between financial and tax reporting. These reclassifications have no effect on net assets or net asset value per share.
2. Investment management agreement and other transactions with affiliates
Franklin Templeton Fund Adviser, LLC (“FTFA”) (formerly known as Legg Mason Partners Fund Advisor, LLC prior to November 30, 2023) is the Fund’s investment manager. Franklin Advisers, Inc. (“Franklin Advisers”) is the Fund’s adviser and a subadviser. ClearBridge Investments, LLC (“ClearBridge”), Western Asset Management Company, LLC (“Western
| Franklin Strategic Real Return Fund 2024 Semi-Annual Report |
|
29 |
|
Notes to consolidated financial statements (unaudited) (cont’d)
Asset”), Western Asset Management Company Limited (“Western Asset London”) and Western Asset Management Company Ltd in Japan (“Western Japan”) are also the Fund’s subadvisers. Western Asset also manages the portion of the Fund’s cash and short-term instruments allocated to it pursuant to a separate subadvisory agreement between FTFA and Western Asset (“Western Asset Agreement”). FTFA, Franklin Advisers, ClearBridge, Western Asset, Western Asset London and Western Japan are wholly-owned subsidiaries of Franklin Resources, Inc. (“Franklin Resources”).
Under the investment management agreement, the Fund pays FTFA an investment management fee, calculated daily and paid monthly, at an annual rate of 0.75% of the Fund’s average daily net assets.
FTFA provides administrative and certain oversight services to the Fund. FTFA delegates to Franklin Advisers the day-to-day portfolio management of the Fund, except for the management of the portion of the cash and short-term instruments allocated to Western Asset. Franklin Advisers is responsible for monitoring and coordinating the overall management of the Fund, including rebalancing the Fund’s target asset allocations among itself and the subadvisers. Franklin Advisers also provides management for a portion of the Fund’s assets.
FTFA pays Franklin Advisers for its services to the Fund an advisory fee, calculated daily and paid monthly, at an annual rate of 0.20% of the Fund’s average daily net assets. Franklin Advisers has agreed that it will not receive any additional compensation for the services provided to the Subsidiary. FTFA pays Franklin Advisers, ClearBridge and Western Asset each a subadvisory fee for their services to the Fund, calculated daily and paid monthly, at annual rates of 0.45%, 0.35% and 0.25% of the average daily net assets managed by each, respectively. For Western Asset’s cash management services to the Fund pursuant to the Western Asset Agreement, FTFA, not the Fund, pays Western Asset monthly 0.02% of the portion of the Fund’s average daily net assets that are allocated to them by FTFA. Western Asset pays each of Western Asset London and Western Japan a subadvisory fee for their services to the Fund, calculated daily and paid monthly, at an annual rate of 0.25% of the average daily net assets managed by each.
FTFA has agreed to waive fees and/or reimburse operating expenses (other than interest, brokerage commissions (except for brokerage commissions paid on purchases and sales of shares of ETFs), dividend expense on short sales, taxes and extraordinary expenses), subject to recapture as described below. As a result, total annual fund operating expenses did not exceed 1.35%, 2.10%, 1.10% and 1.00% for Class A, Class C, Class I and Class IS shares, respectively. In addition, the ratio of total annual fund operating expenses for Class IS shares did not exceed the ratio of total annual fund operating expenses for Class I shares. Acquired fund fees and expenses are subject to the expense limitation arrangements, and are calculated based on an average of the net expense ratio (as shown in the most recent prospectus or shareholder report for each acquired fund as of the date of the Fund’s most recent prospectus) of each acquired fund held by the Fund, weighted in proportion to the Fund’s investment allocation among the acquired funds. These arrangements are expected
30 | Franklin Strategic Real Return Fund 2024 Semi-Annual Report |
to continue until December 31, 2025, may be terminated prior to that date by agreement of FTFA and the Board of Trustees, and may be terminated at any time after that date by FTFA. The arrangements, however, may be modified by FTFA to decrease total annual fund operating expenses at any time.
During the six months ended March 31, 2024, fees waived and/or expenses reimbursed amounted to $89,218.
FTFA is permitted to recapture amounts waived and/or reimbursed to a class within three years after the fiscal year in which FTFA earned the fee or incurred the expense if the class’ total annual fund operating expenses have fallen to a level below the expense limitation (“expense cap”) in effect at the time the fees were earned or the expenses incurred. In no case will FTFA recapture any amount that would result, on any particular business day of the Fund, in the class’ total annual fund operating expenses exceeding the expense cap or any other lower limit then in effect.
Pursuant to these arrangements, at March 31, 2024, the Fund had remaining fee waivers and/or expense reimbursements subject to recapture by FTFA and respective dates of expiration as follows:
| Class A | Class C | Class I | Class IS | |||||||||||||
| Expires September 30, 2024 | $ | 2,164 | $ | 176 | $ | 539 | $ | 129,253 | ||||||||
| Expires September 30, 2025 | 10,019 | 774 | 2,219 | 134,639 | ||||||||||||
| Expires September 30, 2026 | 12,548 | 793 | 380 | 112,329 | ||||||||||||
| Expires September 30, 2027 | 7,636 | 488 | 187 | 80,907 | ||||||||||||
| Total fee waivers/expense reimbursements subject to recapture | $ | 32,367 | $ | 2,231 | $ | 3,325 | $ | 457,128 | ||||||||
For the six months ended March 31, 2024, fee waivers and/or expense reimbursements recaptured by FTFA were as follows:
| Class I | Class IS | |||||||
| FTFA recaptured | $ | 52 | $ | 138 | ||||
Franklin Distributors, LLC (“Franklin Distributors”) serves as the Fund’s sole and exclusive distributor. Franklin Distributors is an indirect, wholly-owned broker-dealer subsidiary of Franklin Resources. Franklin Templeton Investor Services, LLC (“Investor Services”) serves as the Fund’s shareholder servicing agent and acts as the Fund’s transfer agent and dividend-paying agent. Investor Services is an indirect, wholly-owned subsidiary of Franklin Resources. Each class of shares of the Fund pays transfer agent fees to Investor Services for its performance of shareholder servicing obligations. Investor Services charges account-based fees based on the number of individual shareholder accounts, as well as a fixed percentage fee based on the total account-based fees charged. In addition, each class reimburses Investor Services for out of pocket expenses incurred. For the six months ended March 31, 2024, the Fund incurred transfer agent fees as reported on the Statement of Operations, of which $807 was earned by Investor Services.
| Franklin Strategic Real Return Fund 2024 Semi-Annual Report |
|
31 |
|
Notes to consolidated financial statements (unaudited) (cont’d)
There is a maximum initial sales charge of 5.50% for Class A shares. There is a contingent deferred sales charge (“CDSC”) of 1.00% on Class C shares, which applies if redemption occurs within 12 months from purchase payment. In certain cases, Class A shares have a 1.00% CDSC, which applies if redemption occurs within 18 months from purchase payment. This CDSC only applies to those purchases of Class A shares, which, when combined with current holdings of other shares of funds sold by Franklin Distributors, equal or exceed $1,000,000 in the aggregate. These purchases do not incur an initial sales charge.
For the six months ended March 31, 2024, sales charges retained by and CDSCs paid to Franklin Distributors and its affiliates, if any, were as follows:
| Class A | ||||
| Sales charges | $ | 260 | ||
| CDSCs | — | |||
Under a Deferred Compensation Plan (the “Plan”), Trustees may have elected to defer receipt of all or a specified portion of their compensation. A participating Trustee selected one or more funds managed by FTFA or an affiliate of FTFA in which his or her deferred trustee’s fees were deemed to be invested. Deferred amounts remain in the Fund until distributed in accordance with the Plan. In May 2015, the Board of Trustees approved an amendment to the Plan so that effective January 1, 2016, no compensation earned after that date may be deferred under the Plan.
All officers and one Trustee of the Trust are employees of Franklin Resources or its affiliates and do not receive compensation from the Trust.
As of March 31, 2024, Franklin Resources and its affiliates owned 96% of the Fund.
3. Investments
During the six months ended March 31, 2024, the aggregate cost of purchases and proceeds from sales of investments (excluding short-term investments) and U.S. Government & Agency Obligations were as follows:
| Investments | U.S. Government & Agency Obligations | |||||||
| Purchases | $ | 3,303,546 | $ | 10,764,954 | ||||
| Sales | 4,902,498 | 13,467,861 | ||||||
32 | Franklin Strategic Real Return Fund 2024 Semi-Annual Report |
At March 31, 2024, the aggregate cost of investments and the aggregate gross unrealized appreciation and depreciation of investments for federal income tax purposes were substantially as follows:
| Cost | Gross Unrealized Appreciation | Gross Unrealized Depreciation | Net Unrealized Appreciation (Depreciation) | |||||||||||||
| Securities | $ | 97,843,853 | $ | 10,408,763 | $ | (5,443,085) | $ | 4,965,678 | ||||||||
| Futures contracts | — | 812,583 | — | 812,583 | ||||||||||||
| Forward foreign currency contracts | — | 94 | (486) | (392) | ||||||||||||
4. Derivative instruments and hedging activities
Below is a table, grouped by derivative type, that provides information about the fair value and the location of derivatives within the Consolidated Statement of Assets and Liabilities at March 31, 2024.
| ASSET DERIVATIVES1 | ||||||||||||||||||||
| Interest Rate Risk | Foreign Exchange Risk | Equity Risk | Commodity Risk | Total | ||||||||||||||||
| Futures contracts2 | $ | 2,882 | — | $ | 140,139 | $ | 669,562 | $ | 812,583 | |||||||||||
| Forward foreign currency contracts | — | $ | 94 | — | — | 94 | ||||||||||||||
| Total | $ | 2,882 | $ | 94 | $ | 140,139 | $ | 669,562 | $ | 812,677 | ||||||||||
| LIABILITY DERIVATIVES1 | ||||
| Foreign Exchange Risk | ||||
| Forward foreign currency contracts | $ | 486 | ||
| 1 | Generally, the balance sheet location for asset derivatives is receivables/net unrealized appreciation and for liability derivatives is payables/net unrealized depreciation. |
| 2 | Includes cumulative unrealized appreciation (depreciation) of futures contracts as reported in the Consolidated Schedule of Investments. Only net variation margin is reported within the receivables and/or payables on the Consolidated Statement of Assets and Liabilities. |
| Franklin Strategic Real Return Fund 2024 Semi-Annual Report |
|
33 |
|
Notes to consolidated financial statements (unaudited) (cont’d)
The following tables provide information about the effect of derivatives and hedging activities on the Fund’s Consolidated Statement of Operations for the six months ended March 31, 2024. The first table provides additional detail about the amounts and sources of gains (losses) realized on derivatives during the period. The second table provides additional information about the change in net unrealized appreciation (depreciation) resulting from the Fund’s derivatives and hedging activities during the period.
| AMOUNT OF NET REALIZED GAIN (LOSS) ON DERIVATIVES RECOGNIZED | ||||||||||||||||||||
Interest Rate Risk | Foreign Exchange Risk | Equity Risk | Commodity Risk | Total | ||||||||||||||||
| Futures contracts | $ | (153,704) | — | $ | 790,734 | $ | (1,309,463) | $ | (672,433) | |||||||||||
| Forward foreign currency contracts | — | $ | (229,527) | — | — | (229,527) | ||||||||||||||
| Total | $ | (153,704) | $ | (229,527) | $ | 790,734 | $ | (1,309,463) | $ | (901,960) | ||||||||||
| CHANGE IN NET UNREALIZED APPRECIATION (DEPRECIATION) ON DERIVATIVES RECOGNIZED | ||||||||||||||||||||
| Interest Rate Risk | Foreign Exchange Risk | Equity Risk | Commodity Risk | Total | ||||||||||||||||
| Futures contracts | $ | 117,748 | — | $ | 158,983 | $ | 723,639 | $ | 1,000,370 | |||||||||||
| Forward foreign currency contracts | — | $ | 444,796 | — | — | 444,796 | ||||||||||||||
| Total | $ | 117,748 | $ | 444,796 | $ | 158,983 | $ | 723,639 | $ | 1,445,166 | ||||||||||
During the six months ended March 31, 2024, the volume of derivative activity for the Fund was as follows:
| Average Market Value | ||||
| Futures contracts (to buy) | $ | 24,856,661 | ||
| Futures contracts (to sell)† | 53,545 | |||
| Forward foreign currency contracts (to buy) | 36,167,607 | |||
| Forward foreign currency contracts (to sell) | 3,379 | |||
| † | At March 31, 2024, there were no open positions held in this derivative. |
The following table presents the Fund’s OTC derivative assets and liabilities by counterparty net of amounts available for offset under an ISDA Master Agreement and net of the related collateral pledged (received) by the Fund as of March 31, 2024.
| Counterparty | Gross Assets Subject to Master Agreements1 | Gross Liabilities Subject to Master Agreements1 | Net Assets (Liabilities) Subject to Master Agreements | Collateral Pledged (Received) | Net Amount2 | |||||||||||||||
| Citibank N.A. | $ | 94 | $ | (486) | $ | (392) | — | $ | (392) | |||||||||||
| 1 | Absent an event of default or early termination, derivative assets and liabilities are presented gross and not offset in the Consolidated Statement of Assets and Liabilities. |
| 2 | Represents the net amount receivable (payable) from (to) the counterparty in the event of default. |
34 | Franklin Strategic Real Return Fund 2024 Semi-Annual Report |
5. Class specific expenses, waivers and/or expense reimbursements
The Fund has adopted a Rule 12b-1 shareholder services and distribution plan and under that plan the Fund pays service and/or distribution fees with respect to its Class A and Class C shares calculated at the annual rate of 0.25% and 1.00% of the average daily net assets of each class, respectively. Service and/or distribution fees are accrued daily and paid monthly.
For the six months ended March 31, 2024, class specific expenses were as follows:
Service and/or Distribution Fees | Transfer Agent Fees | |||||||
| Class A | $ | 8,179 | $ | 5,932 | ||||
| Class C | 2,322 | 355 | ||||||
| Class I | — | 91 | ||||||
| Class IS | — | (138) | ||||||
| Total | $ | 10,501 | $ | 6,240 | ||||
For the six months ended March 31, 2024, waivers and/or expense reimbursements by class were as follows:
Waivers/Expense Reimbursements | ||||
| Class A | $ | 7,636 | ||
| Class C | 488 | |||
| Class I | 187 | |||
| Class IS | 80,907 | |||
| Total | $ | 89,218 | ||
6. Distributions to shareholders by class
Six Months Ended March 31, 2024 | Year Ended September 30, 2023 | |||||||
| Net Investment Income: | ||||||||
| Class A | $ | 214,835 | $ | 251,263 | ||||
| Class C | 11,671 | 16,556 | ||||||
| Class I | 7,630 | 12,454 | ||||||
| Class IS | 3,165,867 | 2,860,986 | ||||||
| Total | $ | 3,400,003 | $ | 3,141,259 | ||||
| Net Realized Gains: | ||||||||
| Class A | — | $ | 604,129 | |||||
| Class C | — | 49,963 | ||||||
| Class I | — | 27,902 | ||||||
| Class IS | — | 6,301,510 | ||||||
| Total | — | $ | 6,983,504 | |||||
| Franklin Strategic Real Return Fund 2024 Semi-Annual Report |
|
35 |
|
Notes to consolidated financial statements (unaudited) (cont’d)
7. Shares of beneficial interest
At March 31, 2024, the Trust had an unlimited number of shares of beneficial interest authorized with a par value of $0.00001 per share. The Fund has the ability to issue multiple classes of shares. Each class of shares represents an identical interest and has the same rights, except that each class bears certain direct expenses, including those specifically related to the distribution of its shares.
Transactions in shares of each class were as follows:
| Six Months Ended March 31, 2024 | Year Ended September 30, 2023 | |||||||||||||||
| Shares | Amount | Shares | Amount | |||||||||||||
| Class A | ||||||||||||||||
| Shares sold | 33,235 | $ | 305,787 | 257,839 | $ | 2,442,134 | ||||||||||
| Shares issued on reinvestment | 23,007 | 213,045 | 92,898 | 849,088 | ||||||||||||
| Shares repurchased | (401,992) | (3,792,237) | (369,053) | (3,432,672) | ||||||||||||
| Net decrease | (345,750) | $ | (3,273,405) | (18,316) | $ | (141,450) | ||||||||||
| Class C | ||||||||||||||||
| Shares sold | 5,762 | $ | 50,202 | 5,780 | $ | 51,266 | ||||||||||
| Shares issued on reinvestment | 1,303 | 11,671 | 7,525 | 66,519 | ||||||||||||
| Shares repurchased | (25,146) | (225,229) | (24,976) | (222,653) | ||||||||||||
| Net decrease | (18,081) | $ | (163,356) | (11,671) | $ | (104,868) | ||||||||||
| Class I | ||||||||||||||||
| Shares sold | 3,898 | $ | 37,248 | 26,612 | $ | 262,165 | ||||||||||
| Shares issued on reinvestment | 792 | 7,630 | 4,096 | 38,875 | ||||||||||||
| Shares repurchased | (19,402) | (188,203) | (29,650) | (287,743) | ||||||||||||
| Net increase (decrease) | (14,712) | $ | (143,325) | 1,058 | $ | 13,297 | ||||||||||
| Class IS | ||||||||||||||||
| Shares sold | 281,933 | $ | 2,661,478 | 420,700 | $ | 4,040,000 | ||||||||||
| Shares issued on reinvestment | 335,367 | 3,165,867 | 984,156 | 9,162,496 | ||||||||||||
| Shares repurchased | (385,790) | (3,627,949) | (75,289) | (725,000) | ||||||||||||
| Net increase | 231,510 | $ | 2,199,396 | 1,329,567 | $ | 12,477,496 | ||||||||||
8. Redemption facility
The Fund, together with other U.S. registered and foreign investment funds (collectively, the “Borrowers”) managed by Franklin Resources or its affiliates, is a borrower in a joint syndicated senior unsecured credit facility totaling $2.675 billion (the “Global Credit Facility”). The Global Credit Facility provides a source of funds to the Borrowers for temporary and emergency purposes, including the ability to meet future unanticipated or unusually large redemption requests. Unless renewed, the Global Credit Facility will terminate on January 31, 2025.
Under the terms of the Global Credit Facility, the Fund shall, in addition to interest charged on any borrowings made by the Fund and other costs incurred by the Fund, pay its share of
36 | Franklin Strategic Real Return Fund 2024 Semi-Annual Report |
fees and expenses incurred in connection with the implementation and maintenance of the Global Credit Facility, based upon its relative share of the aggregate net assets of all the Borrowers, including an annual commitment fee of 0.15% based upon the unused portion of the Global Credit Facility. These fees are reflected in the Consolidated Statement of Operations. The Fund did not utilize the Global Credit Facility during the six months ended March 31, 2024.
9. Deferred capital losses
As of September 30, 2023, the Fund had deferred capital losses of $392,752, which have no expiration date, that will be available to offset future taxable capital gains.
10. Recent accounting pronouncement
In June 2022, the Financial Accounting Standards Board (FASB) issued Accounting Standards Update (ASU) No. 2022-03, Fair Value Measurement (Topic 820) – Fair Value Measurement of Equity Securities Subject to Contractual Sale Restrictions. The amendments in the ASU clarify that a contractual restriction on the sale of an equity security is not considered part of the unit of account of the equity security and, therefore, should not be considered in measuring fair value. The ASU is effective for interim and annual reporting periods beginning after December 15, 2023, with the option of early adoption. Management has reviewed the requirements and believes that the adoption of the ASU will not have a material impact on the financial statements.
11. Subsequent event
The Fund’s Board of Trustees determined that it is in the best interest of the Fund and its shareholders to terminate the Fund. The Fund ceased operations on April 19, 2024. Before that date, the assets of the Fund were liquidated at the discretion of Fund management and the Fund ceased to pursue its investment objective.
| Franklin Strategic Real Return Fund 2024 Semi-Annual Report |
|
37 |
|
Franklin
Strategic Real Return Fund
Trustees
Andrew L. Breech
Stephen R. Gross
Susan M. Heilbron
Arnold L. Lehman
Robin J. W. Masters
Ken Miller
G. Peter O’Brien*
Chair
Thomas F. Schlafly
Jane Trust
Investment manager
Franklin Templeton Fund Adviser, LLC**
Investment adviser
Franklin Advisers, Inc.
Subadvisers
Franklin Advisers, Inc.
ClearBridge Investments, LLC
Western Asset Management Company, LLC
Western Asset Management Company Limited
Western Asset Management Company Ltd
Distributor
Franklin Distributors, LLC
Custodian
The Bank of New York Mellon
Transfer agent
Franklin Templeton Investor Services, LLC
3344 Quality Drive
Rancho Cordova, CA 95670-7313
Independent registered public accounting firm
PricewaterhouseCoopers LLP
Baltimore, MD
| * | Effective February 7, 2024, Mr. O’Brien became Chair of the Board. |
| ** | Formerly known as Legg Mason Partners Fund Advisor, LLC. |
Franklin Strategic Real Return Fund
The Fund is a separate investment series of Legg Mason Global Asset Management Trust, a Maryland statutory trust.
Franklin Strategic Real Return Fund
Legg Mason Funds
100 International Drive
Baltimore, MD 21202
The Fund files its complete schedule of portfolio holdings with the Securities and Exchange Commission (“SEC”) for the first and third quarters of each fiscal year as an exhibit to its reports on Form N-PORT. The Fund’s Forms N-PORT are available on the SEC’s website at www.sec.gov. To obtain information on Form N-PORT, shareholders can call the Fund at 877-6LM-FUND/656-3863.
Information on how the Fund voted proxies relating to portfolio securities during the prior 12-month period ended June 30th of each year and a description of the policies and procedures that the Fund uses to determine how to vote proxies related to portfolio transactions are available (1) without charge, upon request, by calling the Fund at 877-6LM-FUND/656-3863, (2) at www.franklintempleton.com and (3) on the SEC’s website at www.sec.gov.
This report is submitted for the general information of the shareholders of Franklin Strategic Real Return Fund. This report is not authorized for distribution to prospective investors in the Fund unless preceded or accompanied by a current prospectus.
Investors should consider the Fund’s investment objectives, risks, charges and expenses carefully before investing. The prospectus contains this and other important information about the Fund. Please read the prospectus carefully before investing.
www.franklintempleton.com
© 2024 Franklin Distributors, LLC, Member FINRA/SIPC. All rights reserved.
Franklin Templeton Funds Privacy and Security Notice
Your Privacy Is Our Priority
Franklin Templeton* is committed to safeguarding your personal information. This notice is designed to provide you with a summary of the non-public personal information Franklin Templeton may collect and maintain about current or former individual investors; our policy regarding the use of that information; and the measures we take to safeguard the information. We do not sell individual investors’ non-public personal information to anyone and only share it as described in this notice.
Information We Collect
When you invest with us, you provide us with your non-public personal information. We collect and use this information to service your accounts and respond to your requests. The non-public personal information we may collect falls into the following categories:
| • | Information we receive from you or your financial intermediary on applications or other forms, whether we receive the form in writing or electronically. For example, this information may include your name, address, tax identification number, birth date, investment selection, beneficiary information, and your personal bank account information and/or email address if you have provided that information. |
| • | Information about your transactions and account history with us, or with other companies that are part of Franklin Templeton, including transactions you request on our website or in our app. This category also includes your communications to us concerning your investments. |
| • | Information we receive from third parties (for example, to update your address if you move, obtain or verify your email address or obtain additional information to verify your identity). |
| • | Information collected from you online, such as your IP address or device ID and data gathered from your browsing activity and location. (For example, we may use cookies to collect device and browser information so our website recognizes your online preferences and device information.) Our website contains more information about cookies and similar technologies and ways you may limit them. |
| • | Other general information that we may obtain about you such as demographic information. |
Disclosure Policy
To better service your accounts and process transactions or services you requested, we may share non-public personal information with other Franklin Templeton companies. From time to time we may also send you information about products/services offered by other Franklin Templeton companies although we will not share your non-public personal information with these companies without first offering you the opportunity to prevent that sharing.
We will only share non-public personal information with outside parties in the limited circumstances permitted by law. For example, this includes situations where we need to share information with companies who work on our behalf to service or maintain your account or process transactions you requested, when the disclosure is to companies assisting us with our own marketing efforts, when the disclosure is to a party representing you, or when required by law (for example, in response to legal process). Additionally, we will ensure that any outside
| NOT PART OF THE SEMI-ANNUAL REPORT |
Franklin Templeton Funds Privacy and Security Notice (cont’d)
companies working on our behalf, or with whom we have joint marketing agreements, are under contractual obligations to protect the confidentiality of your information, and to use it only to provide the services we asked them to perform.
Confidentiality and Security
Our employees are required to follow procedures with respect to maintaining the confidentiality of our investors’ non-public personal information. Additionally, we maintain physical, electronic and procedural safeguards to protect the information. This includes performing ongoing evaluations of our systems containing investor information and making changes when appropriate.
At all times, you may view our current privacy notice on our website at https://www.franklintempleton.com/help/privacy-policy or contact us for a copy at (800) 632-2301.
*For purposes of this privacy notice Franklin Templeton shall refer to the following entities:
Fiduciary Trust International of the South (FTIOS), as custodian for individual retirement plans Franklin Advisers, Inc.
Franklin Distributors, LLC, including as program manager of the Franklin Templeton 529 College Savings Plan and the NJBEST 529 College Savings Plan
Franklin Mutual Advisers, LLC
Franklin, Templeton and Mutual Series Funds
Franklin Templeton Institutional, LLC
Franklin Templeton Investments Corp., Canada
Franklin Templeton Investments Management, Limited UK
Legg Mason Funds
Templeton Asset Management, Limited
Templeton Global Advisors, Limited
Templeton Investment Counsel, LLC
If you are a customer of other Franklin Templeton affiliates and you receive notices from them, you will need to read those notices separately.
| NOT PART OF THE SEMI-ANNUAL REPORT |
www.franklintempleton.com
© 2024 Franklin Distributors, LLC, Member FINRA/SIPC. All rights reserved.
LMFX012787 5/24 SR24-4867
| ITEM 2. | CODE OF ETHICS. |
Not applicable.
| ITEM 3. | AUDIT COMMITTEE FINANCIAL EXPERT. |
Not applicable.
| ITEM 4. | PRINCIPAL ACCOUNTANT FEES AND SERVICES. |
Not applicable.
| ITEM 5. | AUDIT COMMITTEE OF LISTED REGISTRANTS. |
Not applicable.
| ITEM 6. | SCHEDULE OF INVESTMENTS. |
Included herein under Item 1.
| ITEM 7. | DISCLOSURE OF PROXY VOTING POLICIES AND PROCEDURES FOR CLOSED-END MANAGEMENT INVESTMENT COMPANIES. |
Not applicable.
| ITEM 8. | PORTFOLIO MANAGERS OF CLOSED-END MANAGEMENT INVESTMENT COMPANIES. |
Not applicable.
| ITEM 9. | PURCHASES OF SECURITIES BY CLOSED-END MANAGEMENT INVESTMENT COMPANY AND AFFILIATED PURCHASERS. |
Not applicable.
| ITEM 10. | SUBMISSION OF MATTERS TO A VOTE OF SECURITY HOLDERS. |
Not applicable.
| ITEM 11. | CONTROLS AND PROCEDURES. |
| (a) | The registrant’s principal executive officer and principal financial officer have concluded that the registrant’s disclosure controls and procedures (as defined in Rule 30a- 3(c) under the Investment Company Act of 1940, as amended (the “1940 Act”)) are effective as of a date within 90 days of the filing date of this report that includes the disclosure required by this paragraph, based on their evaluation of the disclosure controls and procedures required by Rule 30a-3(b) under the 1940 Act and 15d-15(b) under the Securities Exchange Act of 1934. |
| (b) | There were no changes in the registrant’s internal control over financial reporting (as defined in Rule 30a-3(d) under the 1940 Act) that occurred during the period covered by this report that have materially affected, or are likely to materially affect the registrant’s internal control over financial reporting. |
| ITEM 12. | DISCLOSURE OF SECURITIES LENDING ACTIVITIES FOR CLOSED-END MANAGEMENT INVESTMENT COMPANIES. |
Not applicable.
| ITEM 13. | RECOVERY OF ERRONEOUSLY AWARDED COMPENSATION. |
(a) Not applicable.
(b) Not applicable.
| ITEM 14. | EXHIBITS. |
(a) (1) Not applicable.
Exhibit 99.CODE ETH
(a) (2) Certifications pursuant to section 302 of the Sarbanes-Oxley Act of 2002 attached hereto.
Exhibit 99.CERT
(b) Certifications pursuant to Section 906 of the Sarbanes-Oxley Act of 2002 attached hereto.
Exhibit 99.906CERT
SIGNATURES
Pursuant to the requirements of the Securities Exchange Act of 1934 and the Investment Company Act of 1940, the registrant has duly caused this Report to be signed on its behalf by the undersigned, there unto duly authorized.
Legg Mason Global Asset Management Trust
| By: | /s/ Jane Trust | |
| Jane Trust | ||
| Chief Executive Officer | ||
| Date: | May 23, 2024 | |
Pursuant to the requirements of the Securities Exchange Act of 1934 and the Investment Company Act of 1940, this report has been signed below by the following persons on behalf of the registrant and in the capacities and on the dates indicated.
| By: | /s/ Jane Trust | |
| Jane Trust | ||
| Chief Executive Officer | ||
| Date: | May 23, 2024 | |
| By: | /s/ Christopher Berarducci | |
| Christopher Berarducci | ||
| Principal Financial Officer | ||
| Date: | May 23, 2024 | |