UNITED STATES
SECURITIES AND EXCHANGE COMMISSION
Washington, D.C. 20549
FORM N-CSR
Certified Shareholder Report of
Registered Management Investment Companies
Investment Company Act File Number: 811-22349
Capital Group Private Client Services Funds
(Exact Name of Registrant as Specified in Charter)
6455 Irvine Center Drive
Irvine, California 92618
(Address of Principal Executive Offices)
Registrant's telephone number, including area code: (949) 975-5000
Date of fiscal year end: October 31
Date of reporting period: October 31, 2021
Gregory F. Niland
Capital Group Private Client Services Funds
5300 Robin Hood Road
Norfolk, Virginia 23513
(Name and Address of Agent for Service)
ITEM 1 – Reports to Stockholders
 | Capital Group Core Municipal FundSM
Annual report for the year ended October 31, 2021 |

Research-driven
approaches to seeking
wealth preservation
and income
Capital Group Core Municipal Fund seeks to provide current income exempt from federal income tax while preserving your investment.
Capital Group Short-Term Municipal Fund seeks to preserve your investment and secondarily to provide current income exempt from federal income tax.
Capital Group California Core Municipal Fund seeks to provide current income exempt from federal and California income taxes while preserving your investment.
Capital Group California Short-Term Municipal Fund seeks to preserve your investment and secondarily to provide current income exempt from federal and California income taxes.
Capital Group Core Bond Fund seeks to provide you with current income while preserving your investment.
Each fund is one of more than 40 offered by Capital Group, home of American Funds, one of the nation’s largest mutual fund families. For 90 years, Capital Group has invested with a long-term focus based on thorough research and attention to risk.
Fund results shown in this report are at net asset value. Results are for past periods and are not predictive of results for future periods. Current and future results may be lower or higher than those shown. Prices and returns will vary, so investors may lose money. Investing for short periods makes losses more likely.
Here are the total returns on a $1,000 investment with all distributions reinvested for periods ended September 30, 2021 (the most recent calendar quarter-end), and the total annual fund operating expense ratios as of the prospectus dated January 1, 2022 (unaudited):
| Cumulative total returns | Average annual total returns | Gross | ||||||||||||||||||
| 1 year | 5 years | 10 years | Lifetime* | expense ratios | ||||||||||||||||
| Capital Group Core Municipal Fund | 1.13 | % | 2.35 | % | 2.37 | % | 2.65 | % | 0.28 | % | ||||||||||
| Capital Group Short-Term Municipal Fund | 0.36 | 1.78 | 1.48 | 1.63 | 0.31 | † | ||||||||||||||
| Capital Group California Core Municipal Fund | 0.56 | 1.92 | 2.42 | 2.62 | 0.27 | |||||||||||||||
| Capital Group California Short-Term Municipal Fund | 0.04 | 1.35 | 1.26 | 1.34 | 0.29 | |||||||||||||||
| Capital Group Core Bond Fund | –0.38 | 2.43 | 2.22 | 2.63 | 0.28 | |||||||||||||||
| * | Since April 13, 2010. |
| † | The net expense ratio for Capital Group Short-Term Municipal Fund is 0.30%. |
The investment adviser is currently reimbursing a portion of the expenses for Capital Group Short-Term Municipal Fund. This reimbursement will be in effect through at least January 1, 2023. The adviser may elect at its discretion to extend, modify or terminate the reimbursements at that time. Visit capitalgrouppcsfunds.com and capitalgroup.com for American Funds for more information.
Investments are not FDIC-insured, nor are they deposits of or guaranteed by a bank or any other entity, so they may lose value.
Contents
| 1 | Letter to investors |
| 2 | Funds’ 30-day yields and 12-month distribution rates |
| 4 | Fund reviews |
| Investment portfolios | |
| 9 | Capital Group Core Municipal Fund |
| 35 | Capital Group Short-Term Municipal Fund |
| 52 | Capital Group California Core Municipal Fund |
| 64 | Capital Group California Short-Term Municipal Fund |
| 70 | Capital Group Core Bond Fund |
| 82 | Financial statements |
| 105 | Board of trustees and other officers |
Fellow investors:
Bond indexes generally moved sideways in the 12 months ended October 31, 2021, as the fixed income market contended with shifting interest rates, heightened inflationary pressures and the shadow cast by the powerful equity market rally.
Despite the various challenges, the return of the Capital Group Core Bond Fund exceeded its benchmark by a notable margin, while results for Capital Group Private Client Services’ four municipal bond funds were comparable to their respective indices.
Beyond that, all five funds largely sidestepped a broad financial market pullback in September. Even though inflation fears caused yields to rise significantly during the month, the funds incurred only small declines. That stood in contrast to a far sharper drop in the stock market, underscoring the role that high-quality fixed income can play in preserving capital in portfolios.
Markets and economy
For the most part, bond indexes moved modestly during the year, generating either small gains or losses. Yields rose in the spring and again in the autumn — both times amid strengthening economic data and the specter of higher inflation. Beyond that, the attention-grabbing gains in the stock market overshadowed bonds throughout the year.
Fixed income was also weighed down by the expectation that the Federal Reserve would start scaling back its bond purchase program as a first step toward tighter monetary policies. Indeed, the central bank announced the launch of so-called tapering in November. However, the odds and timing of potential interest rate hikes remain highly uncertain, with any Fed action likely to depend on changing economic conditions and interest rates likely to remain low by historical standards.
On a positive note, the bond market’s reaction to the lead-up of the tapering announcement was subdued in comparison to the 2013 “taper tantrum,” when borrowing costs jumped sharply after the Fed unveiled similar plans to wind down bond purchases. In this case, policymakers telegraphed their thinking well in advance and soothed the market by indicating that they will move judiciously.
Capital Group Core Municipal Fund and Capital Group Short-Term Municipal Fund
Proposed tax increases in federal infrastructure and spending bills drove interest in tax-advantaged municipal bonds. The sector began the year fully priced after a rally in 2020, leading to tight spreads and limited yields. Nevertheless, each fund notched positive returns.
With a 0.99% return for the 12 months ended October 31, Capital Group Core Municipal Fund narrowly trailed its index, the Bloomberg Municipal Short-Intermediate 1–10 Years Index*, which gained 1.09%.
Capital Group Short-Term Municipal Fund rose 0.43%, compared to the 0.76% return for its index, the Bloomberg Municipal Short 1–5 Years Index*.
Capital Group California Core Municipal Fund and Capital Group California Short-Term Municipal Fund
Capital Group California Core Municipal Fund returned 0.53% for the past 12 months, slightly edging out the Bloomberg California Short-Intermediate Municipal Index*, which returned 0.52%.
Capital Group California Short-Term Municipal Fund gained 0.12%, short of the 0.42% return notched by the Bloomberg California Short Municipal Index*.
| Private Client Services Funds | 1 |
Capital Group Core Bond Fund
Capital Group Core Bond Fund declined 0.60% for the period, a much better result than the Bloomberg Intermediate A+ U.S. Government/Credit Index, which dropped 1.22%.*
The investment-grade bond market was in a holding pattern for much of the past 12 months as investors positioned themselves for a less dovish Fed. Returns were further pressured by unusually high inflation. The impact was especially apparent in securities with high sensitivity to interest rate changes. The yield on the 10-year U.S. Treasury note rose to 1.55% by October 31, up nearly 70 basis points, or 7/10ths of a percentage point, from the beginning of the period.
The Capital Group Core Bond Fund fared better than its index in part because managers reduced duration early on to make the fund less sensitive to rising rates.
Market outlook
Inflation continues to cloud the outlook for bonds, with some Fed governors suggesting they’re open to more hawkish measures if consumer prices keep climbing. Several factors are contributing to inflationary pressure: consumer demand, powered by high savings and low debt levels; snarled supply chains, which have yet to fully recover from the COVID-19 pandemic; and potentially slower growth in China, which could limit manufacturing output and complicate supply chain issues.
Nevertheless, the consensus view among Capital Group economists is that heightened inflation is likely to persist into 2022. Though inflation has been more pronounced and longer lasting than the market expected earlier this year, a return to more normal environments and previous spending patterns are expected to gradually relieve pressure on global factories and supply chains.
Furthermore, as they have in recent years, yields are expected to remain low by historical standards. As the September decline in markets indicates, high-quality fixed income can help preserve capital and provide income, helping to balance portfolios in a variety of market conditions.
Thank you for your trust and continued investment.
Sincerely,

John S. Armour
President

Mark Marinella
Senior Vice President

John R. Queen
Senior Vice President
December 15, 2021
| * | Index definitions can be found on page 3. |
The return of principal for bond funds and for funds with significant underlying bond holdings is not guaranteed. Fund shares are subject to the same interest rate, inflation and credit risks associated with the underlying bond holdings. Income from municipal bonds may be subject to state or local income taxes. Certain other income, as well as capital gain distributions, may be taxable. Refer to the funds’ prospectuses and the Risk Factors section of this report for more information on these and other risks associated with investing in the funds.
Shown in the table below are the 30-day SEC yields and 12-month distribution rates as of November 30, 2021, for Capital Group Core Municipal Fund, Capital Group Short-Term Municipal Fund, Capital Group California Core Municipal Fund, Capital Group California Short-Term Municipal Fund and Capital Group Core Bond Fund. The funds’ returns for the 12 months ended October 31, 2021, can be found on page 2.
For additional information about the funds, their investment results, holdings and portfolio managers, visit capitalgrouppcsfunds.com. You can also read our insights about the markets, industries and more at capitalgroup.com/pcs.
Funds’ 30-day yields and 12-month distribution rates
Below is a summary of each fund’s 30-day yield and 12-month distribution rate as of November 30, 2021. Each fund’s 30-day yield is calculated in accordance with the U.S. Securities and Exchange Commission (SEC) formula. The SEC yield reflects the rate at which each fund is earning income on its current portfolio of securities while the distribution rate reflects the funds’ past dividends paid to shareholders. Accordingly, the funds’ SEC yields and distribution rates may differ.
| SEC 30-day yield | Distribution rate | |||||||
| Capital Group Core Municipal Fund | 0.62 | % | 1.16 | % | ||||
| Capital Group Short-Term Municipal Fund | 0.40 | 0.84 | ||||||
| Capital Group California Core Municipal Fund | 0.43 | 1.02 | ||||||
| Capital Group California Short-Term Municipal Fund | 0.22 | 0.73 | ||||||
| Capital Group Core Bond Fund | 0.81 | 1.36 | ||||||
| 2 | Private Client Services Funds |
Results at a glance
For periods ended October 31, 2021, with all distributions reinvested
| Cumulative total returns | Average annual total returns | |||||||||||||||
| 1 year | 5 years | 10 years | Lifetime1 | |||||||||||||
| Capital Group Core Municipal Fund | 0.99 | % | 2.39 | % | 2.39 | % | 2.61 | % | ||||||||
| Bloomberg Municipal Short-Intermediate 1–10 years Index2 | 1.09 | 2.39 | 2.49 | 2.74 | ||||||||||||
| Lipper Short-Intermediate Municipal Debt Funds Average3 | 1.11 | 1.84 | 1.93 | 2.11 | ||||||||||||
| Capital Group Short-Term Municipal Fund | 0.43 | 1.81 | 1.51 | 1.61 | ||||||||||||
| Bloomberg Municipal Short 1–5 Years Index2 | 0.76 | 1.82 | 1.63 | 1.77 | ||||||||||||
| Lipper Short Municipal Debt Funds Average3 | 0.57 | 1.27 | 1.08 | 1.16 | ||||||||||||
| Capital Group California Core Municipal Fund | 0.53 | 2.02 | 2.46 | 2.58 | ||||||||||||
| Bloomberg California Short-Intermediate Municipal Index2 | 0.52 | 2.15 | 2.50 | 2.75 | ||||||||||||
| Lipper California Short-Intermediate Municipal Debt Funds Average3 | 1.15 | 1.49 | 1.78 | 1.82 | ||||||||||||
| Capital Group California Short-Term Municipal Fund | 0.12 | 1.36 | 1.29 | 1.32 | ||||||||||||
| Bloomberg California Short Municipal Index2 | 0.42 | 1.59 | 1.54 | 1.70 | ||||||||||||
| Lipper Short Municipal Debt Funds Average3 | 0.57 | 1.27 | 1.08 | 1.16 | ||||||||||||
| Capital Group Core Bond Fund | –0.60 | 2.39 | 2.14 | 2.57 | ||||||||||||
| Bloomberg Intermediate A+ U.S. Government/Credit Index2 | –1.22 | 2.26 | 2.13 | 2.61 | ||||||||||||
| Lipper Short-Intermediate Investment Grade Debt Funds Average3 | 0.51 | 2.25 | 2.15 | 2.43 | ||||||||||||
| 1 | Since April 13, 2010. |
| 2 | The market indexes are unmanaged and, therefore, have no expenses. Investors cannot invest directly in an index. Source: Bloomberg Index Services Ltd. |
| 3 | Lipper averages reflect the current composition of all eligible mutual funds (all share classes) within a given category. Lipper source: Refinitiv Lipper. |
Bloomberg Municipal Short-Intermediate 1–10 Years Index is a market value-weighted index that includes investment-grade tax-exempt bonds with maturities of one to 10 years. Bloomberg Municipal Short 1–5 Years Index is a market value-weighted index that includes investment-grade tax-exempt bonds with maturities of one to five years. Bloomberg California Short-Intermediate Municipal Index is a market value-weighted index that includes only investment-grade tax-exempt bonds that are issued from California with maturities of one to 10 years. Bloomberg California Short Municipal Index is a market value-weighted index that includes only investment-grade tax-exempt bonds that are issued from California with maturities of one to five years. Bloomberg Intermediate A+ U.S. Government/Credit Index is a market value-weighted index that tracks the total return of fixed-rate, publicly placed, dollar-denominated obligations issued by the U.S. Treasury, U.S. government agencies and quasi-federal corporations, corporate or foreign debt guaranteed by the U.S. government, and U.S. corporate and foreign debentures and secured notes that meet specified maturity, liquidity and quality requirements, with maturities of one to 10 years, excluding BBB-rated securities.
| Private Client Services Funds | 3 |
Capital Group Core Municipal Fund
(For the period April 13, 2010, through October 31, 2021, with dividends reinvested)
How a hypothetical $10,000 investment has grown
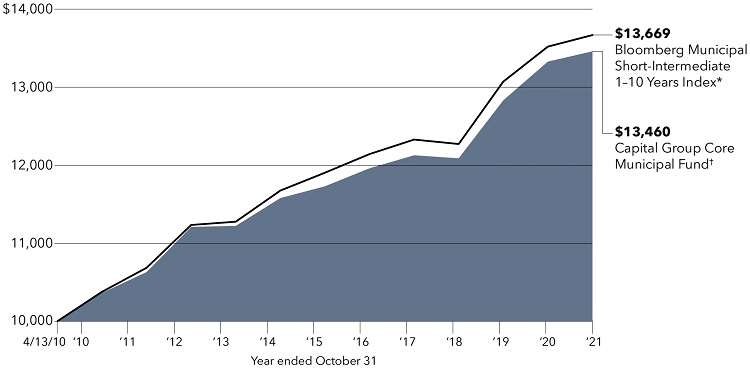
| * | Bloomberg Municipal Short-Intermediate 1–10 Years Index is a market value-weighted index that includes investment-grade tax-exempt bonds with maturities of one to 10 years. This index is unmanaged, and its results include reinvested distributions but do not reflect the effect of sales charges, commissions, account fees, expenses or U.S. federal income taxes. Investors cannot invest directly in an index. Source: Bloomberg Index Services Ltd. |
| † | Includes capital gain distributions. |
Results are for past periods and are not predictive of results for future periods. Current and future results may be lower or higher than those shown. The results shown are before taxes on fund distributions and sale of fund shares.
Average annual total returns based on a hypothetical $1,000 investment
For periods ended October 31, 2021
| 1 year | 5 years | 10 years | ||||
| Capital Group Core Municipal Fund | 0.99% | 2.39% | 2.39% |
| 4 | Private Client Services Funds |
Capital Group Short-Term Municipal Fund
(For the period April 13, 2010, through October 31, 2021, with dividends reinvested)
How a hypothetical $10,000 investment has grown
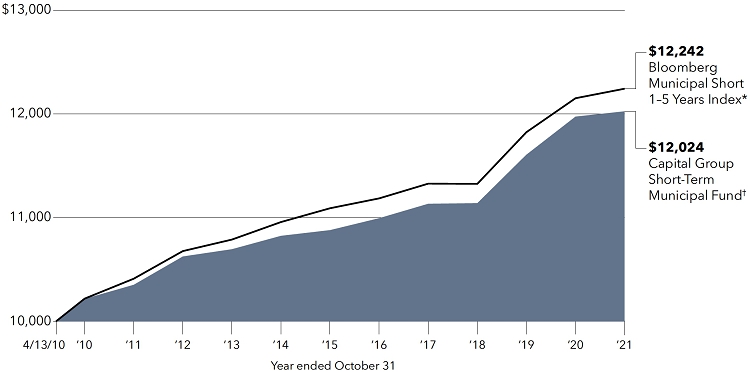
| * | Bloomberg Municipal Short 1–5 Years Index is a market value-weighted index that includes investment-grade tax-exempt bonds with maturities of one to five years. This index is unmanaged, and its results include reinvested distributions but do not reflect the effect of sales charges, commissions, account fees, expenses or U.S. federal income taxes. Investors cannot invest directly in an index. Source: Bloomberg Index Services Ltd. |
| † | Includes capital gain distributions. |
Results are for past periods and are not predictive of results for future periods. Current and future results may be lower or higher than those shown. The results shown are before taxes on fund distributions and sale of fund shares.
Investment results assume all distributions are reinvested and reflect applicable fees and expenses. When applicable, results reflect fee waivers and/or expense reimbursements, without which they would have been lower. Refer to the fund’s most recent prospectus for details.
Average annual total returns based on a hypothetical $1,000 investment
For periods ended October 31, 2021
| 1 year | 5 years | 10 years | ||||
| Capital Group Short-Term Municipal Fund | 0.43% | 1.81% | 1.51% |
| Private Client Services Funds | 5 |
Capital Group California Core Municipal Fund
(For the period April 13, 2010, through October 31, 2021, with dividends reinvested)
How a hypothetical $10,000 investment has grown
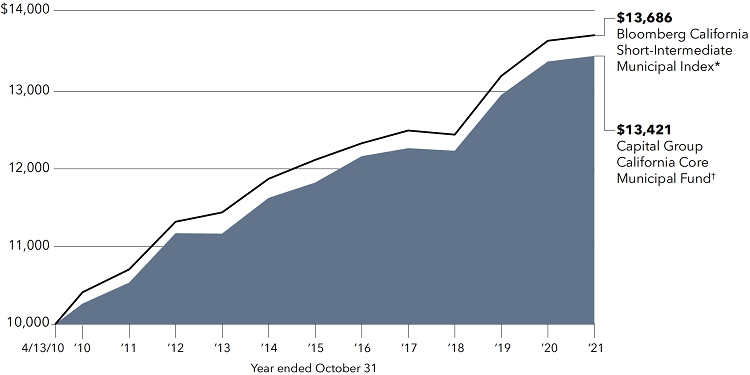
| * | Bloomberg California Short-Intermediate Municipal Index is a market value-weighted index that includes only investment-grade tax-exempt bonds that are issued from California with maturities of one to 10 years. This index is unmanaged, and its results include reinvested distributions but do not reflect the effect of commissions, account fees, expenses or U.S. federal income taxes. Investors cannot invest directly in an index. Source: Bloomberg Index Services Ltd. |
| † | Includes capital gain distributions. |
Results are for past periods and are not predictive of results for future periods. Current and future results may be lower or higher than those shown. The results shown are before taxes on fund distributions and sale of fund shares.
Average annual total returns based on a hypothetical $1,000 investment
For periods ended October 31, 2021
| 1 year | 5 years | 10 years | ||||
| Capital Group California Core Municipal Fund | 0.53% | 2.02% | 2.46% |
| 6 | Private Client Services Funds |
Capital Group California Short-Term Municipal Fund
(For the period April 13, 2010, through October 31, 2021, with dividends reinvested)
How a hypothetical $10,000 investment has grown
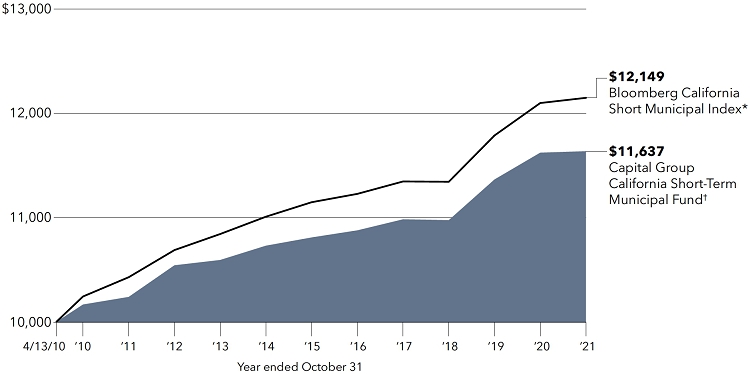
| * | Bloomberg California Short Municipal Index is a market value-weighted index that includes only investment-grade tax-exempt bonds that are issued from California with maturities of one to five years. This index is unmanaged, and its results include reinvested distributions but do not reflect the effect of commissions, account fees, expenses or U.S. federal income taxes. Investors cannot invest directly in an index. Source: Bloomberg Index Services Ltd. |
| † | Includes capital gain distributions. |
Results are for past periods and are not predictive of results for future periods. Current and future results may be lower or higher than those shown. The results shown are before taxes on fund distributions and sale of fund shares.
Average annual total returns based on a hypothetical $1,000 investment
For periods ended October 31, 2021
| 1 year | 5 years | 10 years | ||||
| Capital Group California Short-Term Municipal Fund | 0.12% | 1.36% | 1.29% |
| Private Client Services Funds | 7 |
Capital Group Core Bond Fund
(For the period April 13, 2010, through October 31, 2021, with dividends reinvested)
How a hypothetical $10,000 investment has grown
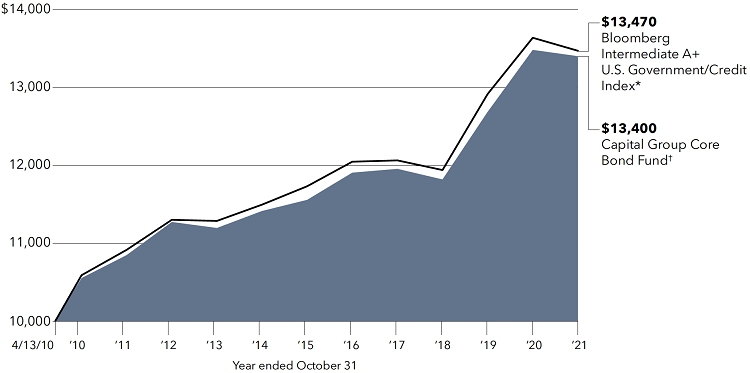
| * | The Bloomberg Intermediate A+ U.S. Government/Credit Index is a market value-weighted index that tracks the total return of fixed-rate, publicly placed, dollar-denominated obligations issued by the U.S. Treasury, U.S. government agencies and quasi-federal corporations, corporate or foreign debt guaranteed by the U.S. government, and U.S. corporate and foreign debentures and secured notes that meet specified maturity, liquidity and quality requirements, with maturities of one to 10 years, excluding BBB-rated securities. This index is unmanaged, and its results include reinvested distributions but do not reflect the effect of account fees, expenses or U.S. federal income taxes. Investors cannot invest directly in an index. Source: Bloomberg Index Services Ltd. |
| † | Includes capital gain distributions. |
Results are for past periods and are not predictive of results for future periods. Current and future results may be lower or higher than those shown. The results shown are before taxes on fund distributions and sale of fund shares.
Average annual total returns based on a hypothetical $1,000 investment
For periods ended October 31, 2021
| 1 year | 5 years | 10 years | ||||
| Capital Group Core Bond Fund | –0.60% | 2.39% | 2.14% |
| 8 | Private Client Services Funds |
Capital Group Core Municipal Fund
Investment portfolio October 31, 2021
| Portfolio quality summary* | Percent of net assets |
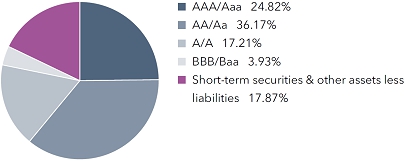
| * | Bond ratings, which typically range from AAA/Aaa (highest) to D (lowest), are assigned by credit rating agencies such as Standard & Poor’s, Moody’s and/or Fitch as an indication of an issuer’s creditworthiness. In assigning a credit rating to a security, the fund looks specifically to the ratings assigned to the issuer of the security by Standard & Poor’s, Moody’s and/or Fitch. If agency ratings differ, the security will be considered to have received the highest of those ratings, consistent with the fund’s investment policies. The ratings are not covered by the Report of Independent Registered Public Accounting Firm. |
| Bonds, notes & other debt instruments 82.13% | Principal amount (000) | Value (000) | ||||||
| Alabama 1.19% | ||||||||
| Black Belt Energy Gas Dist., Gas Supply Prepay Rev. Bonds (Project No. 5), Series 2020-A-1, 4.00% 2049 (put 2026) | $ | 825 | $ | 940 | ||||
| Black Belt Energy Gas Dist., Gas Supply Rev. Bonds, Series 2017-A, 4.00% 2047 (put 2022) | 2,050 | 2,092 | ||||||
| Black Belt Energy Gas Dist., Gas Supply Rev. Bonds, Series 2021-A, 4.00% 2051 (put 2023) | 1,000 | 1,217 | ||||||
| Federal Aid Highway Fin. Auth., Federal Highway Grant Anticipation Bonds, Series 2012, 5.00% 2023 (preref. 2022) | 100 | 104 | ||||||
| City of Huntsville, Electric Rev. Bonds, Series 2017-A, 5.00% 2022 | 450 | 473 | ||||||
| City of Huntsville, Electric Rev. Bonds, Series 2017-B, 5.00% 2022 | 400 | 421 | ||||||
| Southeast Energy Auth., Commodity Supply Rev. Bonds (Project No. 1), Series 2021-A, 4.00% 2051 (put 2028) | 1,440 | 1,682 | ||||||
| Southeast Energy Auth., Commodity Supply Rev. Bonds (Project No. 2), Series 2021-B-1, 4.00% 2051 (put 2031) | 1,985 | 2,377 | ||||||
| 9,306 | ||||||||
| Alaska 0.31% | ||||||||
| Housing Fin. Corp., Collateralized Bonds (Veterans Mortgage Program), Series 2019, 4.00% 2048 | 865 | 942 | ||||||
| Housing Fin. Corp., General Mortgage Rev. Bonds, Series 2020-A, 3.25% 2044 | 910 | 986 | ||||||
| Housing Fin. Corp., General Mortgage Rev. Bonds, Series 2016-A, 3.50% 2046 | 150 | 158 | ||||||
| Housing Fin. Corp., State Capital Project Bonds, Series 2014-A, 5.00% 2032 (preref. 2023) | 230 | 253 | ||||||
| Housing Fin. Corp., State Capital Project Bonds, Series 2014-A, 5.00% 2033 (preref. 2023) | 110 | 121 | ||||||
| 2,460 | ||||||||
| Arizona 1.11% | ||||||||
| Agricultural Improvement and Power Dist., Electric System Rev. Bonds (Salt River Project), Series 2021-A, 5.00% 2028 | 295 | 368 | ||||||
| Agricultural Improvement and Power Dist., Electric System Rev. Bonds (Salt River Project), Series 2021-A, 5.00% 2029 | 370 | 472 | ||||||
| Board of Regents of the Arizona State University System, Rev. Bonds, Series 2020-A, 5.00% 2027 | 400 | 492 | ||||||
| Board of Regents of the Arizona State University System, Rev. Bonds, Series 2020-A, 5.00% 2028 | 550 | 692 | ||||||
| Board of Regents of the Arizona State University System, Rev. Bonds, Series 2020-A, 5.00% 2033 | 80 | 104 | ||||||
| Bullhead City, Excise Taxes Rev. Obligations, Series 2021-2, 1.15% 2027 | 375 | 368 | ||||||
| County of Coconino, Pollution Control Corp., Pollution Control Rev. Ref. Bonds, Series 2017-B, 1.65% 2039 (put 2023) | 1,500 | 1,526 | ||||||
| City of Glendale, Industrial Dev. Auth., Rev. Ref. Bonds (Midwestern University), Series 2020, 5.00% 2029 | 1,000 | 1,266 | ||||||
| Industrial Dev. Auth., Education Rev. Bonds (Greathearts Arizona Projects), Series 2021-A, 5.00% 2029 | 115 | 144 | ||||||
| Industrial Dev. Auth., Hospital Rev. Bonds (Phoenix Children’s Hospital), Series 2021-A, 5.00% 2030 | 255 | 326 | ||||||
| Industrial Dev. Auth., Hospital Rev. Bonds (Phoenix Children’s Hospital), Series 2021-A, 5.00% 2031 | 75 | 98 | ||||||
| Industrial Dev. Auth., Rev. Bonds (Lincoln South Beltway Project), Series 2020, 5.00% 2023 | 1,000 | 1,090 | ||||||
| Kyrene Elementary School Dist. No. 28, School Improvement Bonds (2010 Project), Series 2013-B, 4.50% 2024 (preref. 2023)1 | 55 | 59 | ||||||
| Private Client Services Funds | 9 |
Capital Group Core Municipal Fund
| Bonds, notes & other debt instruments (continued) | Principal amount (000) | Value (000) | ||||||
| Arizona (continued) | ||||||||
| Kyrene Elementary School Dist. No. 28, School Improvement Bonds (2010 Project), Series 2013-B, 4.50% 2025 (preref. 2023)1 | $ | 45 | $ | 48 | ||||
| County of Maricopa, Industrial Dev. Auth., Education Rev. Bonds (GreatHearts Arizona Projects), Series 2017-A, 5.00% 2027 | 745 | 898 | ||||||
| City of Phoenix, Civic Improvement Corp., Water System Rev. Ref. Bonds, Series 2014-B, 5.00% 2024 | 115 | 129 | ||||||
| County of Pima, Industrial Dev. Auth., Rev. Bonds (Tucson Medical Center), Series 2021-A, 5.00% 2031 | 485 | 636 | ||||||
| 8,716 | ||||||||
| Arkansas 0.08% | ||||||||
| Dev. Fin. Auth., Health Care Rev. Bonds (Baptist Memorial Health Care), Series 2015-B-3, (SIFMA Municipal Swap Index + 1.55%) 1.60% 2044 (put 2022)2 | 600 | 600 | ||||||
| California 4.01% | ||||||||
| Bay Area Toll Auth., San Francisco Bay Area Toll Bridge Rev. Bonds, Series 2006-C-1, (SIFMA Municipal Swap Index + 0.90%) 0.95% 2045 (put 2023)2 | 2,205 | 2,221 | ||||||
| Bay Area Toll Auth., San Francisco Bay Area Toll Bridge Rev. Bonds, Series 2021-C, (SIFMA Municipal Swap Index + 0.45%) 0.50% 2056 (put 2026)2 | 425 | 430 | ||||||
| Trustees of the California State University, Systemwide Rev. Bonds, Series 2016-B-2, 0.55% 2049 (put 2026) | 195 | 192 | ||||||
| Carlsbad Unified School Dist., G.O. Bonds, 2018 Election, Series 2021-B, 2.00% 2023 | 75 | 77 | ||||||
| Carlsbad Unified School Dist., G.O. Bonds, 2018 Election, Series 2021-B, 2.00% 2024 | 85 | 89 | ||||||
| Community Choice Fncg. Auth., Clean Energy Project Rev. Green Bonds, Series 2021-B-1, 4.00% 2052 (put 2031) | 2,415 | 2,903 | ||||||
| Eastern Municipal Water Dist., Water and Wastewater Rev. Ref. Bonds, Series 2021-A, 3.00% 2024 | 165 | 177 | ||||||
| Educational Facs. Auth., Rev. Bonds (University of Southern California), Series 2009-C, 5.25% 2024 (escrowed to maturity) | 35 | 40 | ||||||
| Fresno Unified School Dist., G.O. Bonds, 2016 Election, Series 2021-D, 2.00% 2023 | 105 | 108 | ||||||
| Fresno Unified School Dist., G.O. Bonds, 2016 Election, Series 2021-D, 2.00% 2024 | 50 | 52 | ||||||
| G.O. Bonds, Series 2020, 5.00% 2029 | 180 | 233 | ||||||
| G.O. Bonds, Series 2021, 5.00% 2031 | 30 | 36 | ||||||
| G.O. Bonds, Series 2021, 5.00% 2032 | 25 | 30 | ||||||
| G.O. Bonds, Series 2021, 5.00% 2034 | 25 | 30 | ||||||
| G.O. Rev. Ref. Bonds, Series 2021, 5.00% 2023 | 1,265 | 1,374 | ||||||
| G.O. Rev. Ref. Bonds, Series 2021, 5.00% 2028 | 1,000 | 1,268 | ||||||
| G.O. Rev. Ref. Bonds, Series 2021, 5.00% 2030 | 55 | 73 | ||||||
| Health Facs. Fncg. Auth., Rev. Bonds (Kaiser Permanente), Series 2017-B, 5.00% 2029 (put 2022) | 1,000 | 1,048 | ||||||
| Health Facs. Fncg. Auth., Rev. Ref. Bonds (Marshall Medical Center), Series 2015, 5.00% 2028 | 315 | 353 | ||||||
| Housing Fin. Agcy., Municipal Certs., Series 2021-A-1, 3.50% 2035 | 739 | 852 | ||||||
| Infrastructure and Econ. Dev. Bank, Rev. Bonds (The Colburn School), Series 2015-B, (SIFMA Municipal Swap Index + 1.20%) 1.25% 2037 (put 2022)2 | 1,000 | 1,001 | ||||||
| Infrastructure and Econ. Dev. Bank, Rev. Ref. Bonds (Museum of Art Project), Series 2021-B, 0.75% 2050 (put 2026)2 | 340 | 345 | ||||||
| Irvine Unified School Dist., Community Facs. Dist. No. 09-1, Special Tax Bonds, Series 2017-A, BAM insured, 5.00% 2025 | 250 | 290 | ||||||
| City of Jurupa, Public Fncg. Auth., Special Tax Rev. Ref. Bonds, Series 2020-A, BAM insured, 5.00% 2024 | 85 | 96 | ||||||
| City of Jurupa, Public Fncg. Auth., Special Tax Rev. Ref. Bonds, Series 2020-A, BAM insured, 4.00% 2026 | 60 | 69 | ||||||
| City of Los Angeles, Dept. of Water and Power, Power System Rev. Bonds, Series 2018-B, 4.00% 2022 | 75 | 75 | ||||||
| County of Los Angeles, Dev. Auth., Multi Family Housing Rev. Bonds (Cantamar Villas), Series 2021-D-1, 0.30% 2025 (put 2024) | 55 | 55 | ||||||
| County of Los Angeles, Dev. Auth., Multi Family Housing Rev. Bonds (Sunny Garden Apartments), Series 2021-C-1, 0.20% 2024 (put 2023) | 75 | 75 | ||||||
| County of Los Angeles, Metropolitan Transportation Auth., Measure R Sales Tax Rev. Bonds, Series 2016-A, 5.00% 2023 | 50 | 54 | ||||||
| County of Los Angeles, Metropolitan Transportation Auth., Measure R Sales Tax Rev. Bonds, Series 2021-A, 5.00% 2032 | 955 | 1,287 | ||||||
| County of Los Angeles, Metropolitan Transportation Auth., Measure R Sales Tax Rev. Ref. Green Bonds, Series 2020-A, 5.00% 2024 | 860 | 965 | ||||||
| Los Angeles Unified School Dist., G.O. Dedicated Unlimited Ad Valorem Property Tax Bonds, Series 2020-C, 5.00% 2029 | 150 | 193 | ||||||
| Los Angeles Unified School Dist., G.O. Dedicated Unlimited Ad Valorem Property Tax Bonds, Series 2020-RYQ, 5.00% 2033 | 570 | 744 | ||||||
| Metropolitan Water Dist. of Southern California, Water Rev. Ref. Bonds, Series 2020-A, 5.00% 2023 | 1,500 | 1,620 | ||||||
| Murrieta Valley Unified School Dist., Public Fncg. Auth., Special Tax Rev. Bonds, Series 2016-A, 5.00% 2022 | 1,250 | 1,295 | ||||||
| 10 | Private Client Services Funds |
Capital Group Core Municipal Fund
| Bonds, notes & other debt instruments (continued) | Principal amount (000) | Value (000) | ||||||
| California (continued) | ||||||||
| Public Fin. Auth., Rev. Bonds (Henry Mayo Newhall Memorial Hospital), Series 2021-A, 4.00% 2024 | $ | 45 | $ | 49 | ||||
| Public Fin. Auth., Rev. Bonds (Henry Mayo Newhall Memorial Hospital), Series 2021-A, 4.00% 2025 | 45 | 50 | ||||||
| Public Fin. Auth., Rev. Bonds (Henry Mayo Newhall Memorial Hospital), Series 2021-A, 4.00% 2026 | 45 | 51 | ||||||
| Public Fin. Auth., Rev. Bonds (Henry Mayo Newhall Memorial Hospital), Series 2021-A, 4.00% 2027 | 45 | 52 | ||||||
| Public Fin. Auth., Rev. Bonds (Henry Mayo Newhall Memorial Hospital), Series 2021-A, 4.00% 2028 | 40 | 47 | ||||||
| Public Works Board, Lease Rev. Ref. Bonds (Various Capital Projects), Series 2022-A, 5.00% 2028 | 655 | 807 | ||||||
| Public Works Board, Lease Rev. Ref. Bonds (Various Capital Projects), Series 2021-A, 5.00% 2030 | 1,000 | 1,291 | ||||||
| RNR School Fncg. Auth., Community Facs. Dist. No. 92-1, Special Tax Bonds, Series 2017-A, BAM insured, 5.00% 2028 | 1,000 | 1,192 | ||||||
| City of San Diego, Community Facs. Dist. No. 2 (Santaluz), Improvement Area No. 1, Special Tax Rev. Ref. Bonds, Series 2021, 4.00% 2029 | 70 | 85 | ||||||
| County of San Diego, Regional Airport Auth., Airport Rev. Ref. Bonds, Series 2020-B, 5.00% 2022 | 1,000 | 1,032 | ||||||
| County of San Diego, Regional Transportation Commission, Limited Sales Tax Rev. Short-Term Notes, Series 2021-A, 5.00% 2022 | 1,235 | 1,289 | ||||||
| County of San Diego, Water Auth., Water Rev. Ref. Green Bonds, Series 2021-B, 5.00% 2030 | 230 | 304 | ||||||
| City and County of San Francisco, G.O. Rev. Ref. Bonds, Series 2020-R-2, 5.00% 2023 | 480 | 517 | ||||||
| City and County of San Francisco, G.O. Rev. Ref. Bonds, Series 2020-R-2, 5.00% 2028 | 1,000 | 1,271 | ||||||
| City of Santee, Community Facs. Dist. No. 2017-1, Special Tax Bonds (Weston Infrastructure), Series 2019, 5.00% 2022 | 135 | 140 | ||||||
| City of Santee, Community Facs. Dist. No. 2017-1, Special Tax Bonds (Weston Infrastructure), Series 2019, 5.00% 2023 | 160 | 173 | ||||||
| City of Santee, Community Facs. Dist. No. 2017-1, Special Tax Bonds (Weston Infrastructure), Series 2019, 5.00% 2024 | 170 | 190 | ||||||
| Southern California Public Power Auth., Rev. Ref. Green Bonds (Milford Wind Corridor Phase II Project), Series 2021-1, 5.00% 2023 | 65 | 70 | ||||||
| Southern California Public Power Auth., Rev. Ref. Green Bonds (Milford Wind Corridor Phase II Project), Series 2021-1, 5.00% 2024 | 20 | 22 | ||||||
| Southern California Public Power Auth., Transmission Project Rev. Bonds (Southern Transmission Project), Series 2017-A, 5.00% 2023 | 490 | 528 | ||||||
| Statewide Communities Dev. Auth., Multi Family Housing Rev. Bonds (Villa Del Sol Apartments), Series 2021-A-2, 0.39% 2023 (put 2023) | 280 | 280 | ||||||
| Statewide Communities Dev. Auth., Multi Family Housing Rev. Bonds (Washington Court Apartments), Series 2021-E, 0.22% 2023 (put 2022) | 125 | 125 | ||||||
| Statewide Communities Dev. Auth., Pollution Control Rev. Ref. Bonds (Southern California Edison Co.), Series 2006-D, 2.625% 2033 (put 2023) | 135 | 141 | ||||||
| Statewide Communities Dev. Auth., Rev. Bonds (American Baptist Homes of the West), Series 2013-A, 5.00% 2023 (preref. 2022) | 80 | 85 | ||||||
| Statewide Communities Dev. Auth., Rev. Bonds (Viamonte Senior Living 1 Project), Series 2018-B, 3.00% 2025 | 65 | 65 | ||||||
| Statewide Communities Dev. Auth., Rev. Bonds (Viamonte Senior Living 1 Project), Series 2018-B, 3.00% 2026 | 500 | 501 | ||||||
| Tobacco Securitization Auth. of Northern California, Tobacco Settlement Asset-Backed Rev. Ref. Senior Bonds (Sacramento County Tobacco Securitization Corp.), Series 2021-B-1, 0.45% 2030 | 20 | 20 | ||||||
| Tobacco Securitization Auth. of Southern California, Tobacco Settlement Asset-Backed Rev. Ref. Bonds (San Diego County Tobacco Asset Securitization Corp.), Series 2019-A, 5.00% 2030 | 180 | 229 | ||||||
| Regents of the University of California, Limited Project Rev. Bonds, Series 2022-S, 5.00% 2026 | 165 | 193 | ||||||
| Dept. of Veterans Affairs, Veterans G.O. Bonds, Series 2019-CS, 4.00% 2049 | 850 | 924 | ||||||
| 31,473 | ||||||||
| Colorado 1.87% | ||||||||
| City of Arvada, Mountain Shadows Metropolitan Dist., Limited Tax G.O. Rev. Ref. and Improvement Bonds, Series 2016, 4.00% 2026 | 735 | 771 | ||||||
| Certs. of Part., Series 2021-A, 5.00% 2028 | 495 | 628 | ||||||
| Certs. of Part., Series 2021-A, 5.00% 2029 | 1,000 | 1,292 | ||||||
| City of Colorado Springs, Utilities System Rev. Ref. Bonds, Series 2020-B, 5.00% 2021 | 75 | 75 | ||||||
| City and County of Denver, Board of Water Commissioners, Water Rev. Bonds, Series 2021-A, 5.00% 2031 | 1,910 | 2,596 | ||||||
| City and County of Denver, Dept. of Aviation, Airport System Rev. Bonds, Series 2019-D, 5.00% 2031 (put 2022) | 1,000 | 1,048 | ||||||
| E-470 Public Highway Auth., Rev. Bonds, Series 2021-B, (USD-SOFR x 0.67 + 0.35%) 0.383% 2039 (put 2024)2 | 285 | 286 | ||||||
| Educational and Cultural Facs. Auth., Rev. Ref. Bonds (Johnson & Wales University Project), Series 2013-B, 5.00% 2023 (escrowed to maturity) | 1,805 | 1,922 | ||||||
| Health Facs. Auth., Health Facs. Rev. and Rev. Ref. Bonds (Evangelical Lutheran Good Samaritan Society Project), Series 2015-A, 5.00% 2024 (escrowed to maturity) | 1,825 | 2,045 | ||||||
| Health Facs. Auth., Hospital Rev. Bonds (Adventist Health System/Sunbelt Obligated Group), Series 2018-A, 5.00% 2048 | 125 | 150 | ||||||
| Private Client Services Funds | 11 |
Capital Group Core Municipal Fund
| Bonds, notes & other debt instruments (continued) | Principal amount (000) | Value (000) | ||||||
| Colorado (continued) | ||||||||
| Housing and Fin. Auth., Single Family Mortgage Bonds, Series 2018-C, Class I, 4.25% 2048 | $ | 590 | $ | 647 | ||||
| Housing and Fin. Auth., Single Family Mortgage Bonds, Series 2020-B, Class I, 3.75% 2050 | 905 | 985 | ||||||
| Housing and Fin. Auth., Single Family Mortgage Bonds, Series 2021-L, Class I, 3.25% 2051 | 1,250 | 1,367 | ||||||
| Regional Transportation Dist., Private Activity Bonds (Denver Transit Partners Eagle P3 Project), Series 2020-A, 5.00% 2029 | 70 | 87 | ||||||
| Regional Transportation Dist., Private Activity Bonds (Denver Transit Partners Eagle P3 Project), Series 2020-A, 5.00% 2029 | 40 | 50 | ||||||
| Regional Transportation Dist., Private Activity Bonds (Denver Transit Partners Eagle P3 Project), Series 2020-A, 5.00% 2030 | 150 | 189 | ||||||
| Regional Transportation Dist., Private Activity Bonds (Denver Transit Partners Eagle P3 Project), Series 2020-A, 5.00% 2030 | 35 | 45 | ||||||
| Weld County School Dist. RE-5J, G.O. Bonds, Series 2021, 5.00% 2023 | 475 | 522 | ||||||
| 14,705 | ||||||||
| Connecticut 0.87% | ||||||||
| Town of East Hartford, Housing Auth., Multi Family Housing Rev. Bonds (Veterans Terrace Project), Series 2021, 0.25% 2023 (put 2022) | 140 | 140 | ||||||
| Health and Educational Facs. Auth., Rev. Bonds (Hartford Healthcare Issue), Series 2021-A, 5.00% 2029 | 330 | 422 | ||||||
| Health and Educational Facs. Auth., Rev. Bonds (Stamford Hospital Issue), Series 2022-M, 5.00% 2030 | 450 | 559 | ||||||
| Health and Educational Facs. Auth., Rev. Bonds (Stamford Hospital Issue), Series 2022-M, 5.00% 2031 | 310 | 391 | ||||||
| Health and Educational Facs. Auth., Rev. Bonds (Yale University Issue), Series 2003-X-2, 0.25% 2037 (put 2024) | 910 | 906 | ||||||
| Health and Educational Facs. Auth., Rev. Bonds (Yale University Issue), Series 2014-A, 1.10% 2048 (put 2023) | 1,105 | 1,117 | ||||||
| Housing Fin. Auth., Housing Mortgage Fin. Program Bonds, Series 2014-C-1, 4.00% 2044 | 70 | 72 | ||||||
| Housing Fin. Auth., Housing Mortgage Fin. Program Bonds, Series 2016-A-1, 4.00% 2045 | 255 | 266 | ||||||
| Housing Fin. Auth., Housing Mortgage Fin. Program Bonds, Series 2017-A-1, 4.00% 2047 | 1,835 | �� | 1,963 | |||||
| Housing Fin. Auth., Housing Mortgage Fin. Program Bonds, Series 2017-C-1, 4.00% 2047 | 700 | 748 | ||||||
| Housing Fin. Auth., Housing Mortgage Fin. Program Bonds, Series 2017-D-1, 4.00% 2047 | 150 | 160 | ||||||
| Housing Fin. Auth., Housing Mortgage Fin. Program Rev. Ref. Bonds, Series 2015-A, 3.50% 2044 | 75 | 77 | ||||||
| 6,821 | ||||||||
| Delaware 0.47% | ||||||||
| G.O. Bonds, Series 2021, 5.00% 2029 | 1,220 | 1,562 | ||||||
| G.O. Bonds, Series 2021, 5.00% 2031 | 945 | 1,260 | ||||||
| Health Facs. Auth., Rev. Bonds (Beebe Medical Center Project), Series 2018, 5.00% 2022 | 290 | 297 | ||||||
| Health Facs. Auth., Rev. Bonds (Beebe Medical Center Project), Series 2018, 5.00% 2023 | 200 | 213 | ||||||
| Health Facs. Auth., Rev. Bonds (Beebe Medical Center Project), Series 2018, 5.00% 2024 | 300 | 333 | ||||||
| 3,665 | ||||||||
| District of Columbia 0.55% | ||||||||
| G.O. Bonds, Series 2015-A, 5.00% 2032 | 1,800 | 2,075 | ||||||
| Income Tax Secured Rev. Bonds, Series 2011-A, 5.00% 2029 | 235 | 236 | ||||||
| Income Tax Secured Rev. Bonds, Series 2020-A, 5.00% 2032 | 750 | 970 | ||||||
| Income Tax Secured Rev. Bonds, Series 2020-C, 5.00% 2033 | 215 | 278 | ||||||
| Washington Convention and Sports Auth., Dedicated Tax Rev. Ref. Bonds, Series 2018-A, 5.00% 2027 | 600 | 736 | ||||||
| 4,295 | ||||||||
| Florida 5.52% | ||||||||
| County of Alachua, Health Facs. Auth., Continuing Care Retirement Community Rev. Bonds (Oak Hammock at the University of Florida, Inc. Project), Series 2021, 4.00% 2022 | 20 | 20 | ||||||
| County of Brevard, Health Facs. Auth., Rev. Ref. Bonds (Health First, Inc. Project), Series 2014, 5.00% 2022 | 500 | 510 | ||||||
| County of Brevard, Health Facs. Auth., Rev. Ref. Bonds (Health First, Inc. Project), Series 2014, 5.00% 2033 | 130 | 143 | ||||||
| County of Brevard, Housing Fncg. Auth., Multi Family Mortgage Rev. Bonds (Tropical Manor Apartments), Series 2021, 0.25% 2023 (put 2022) | 135 | 135 | ||||||
| Capital Trust Agcy., Multi Family Housing Rev. Bonds (GMF - Stonybrook Apartments), Series 2012-A, 5.50% 2047 (preref. 2022) | 540 | 552 | ||||||
| Central Florida Expressway Auth., Rev. Bonds, Series 2019-B, 5.00% 2030 | 1,000 | 1,278 | ||||||
| Citizens Property Insurance Corp., Personal Lines Account/Commercial Lines Account Secured Bonds, Series 2012-A-1, 5.00% 2022 | 170 | 175 | ||||||
| County of Collier, Water-Sewer Dist., Water and Sewer Rev. Bonds, Series 2021, 5.00% 2030 | 655 | 861 | ||||||
| 12 | Private Client Services Funds |
Capital Group Core Municipal Fund
| Bonds, notes & other debt instruments (continued) | Principal amount (000) | Value (000) | ||||||
| Florida (continued) | ||||||||
| County of Collier, Water-Sewer Dist., Water and Sewer Rev. Bonds, Series 2021, 5.00% 2031 | $ | 1,070 | $ | 1,433 | ||||
| Connerton West Community Dev. Dist., Improvement Rev. Ref. Bonds, Series 2018-A-1, Assured Guaranty Municipal insured, 3.00% 2026 | 345 | 373 | ||||||
| Connerton West Community Dev. Dist., Improvement Rev. Ref. Bonds, Series 2018-A-1, Assured Guaranty Municipal insured, 3.20% 2027 | 355 | 391 | ||||||
| Connerton West Community Dev. Dist., Improvement Rev. Ref. Bonds, Series 2018-A-1, Assured Guaranty Municipal insured, 3.25% 2028 | 370 | 412 | ||||||
| Board of Education, Public Education Capital Outlay Rev. Ref. Bonds, Series 2019-D, 5.00% 2023 | 120 | 129 | ||||||
| Board of Education, Public Education Capital Outlay Rev. Ref. Bonds, Series 2021-B, 5.00% 2022 | 1,000 | 1,028 | ||||||
| Greater Orlando Aviation Auth., Airport Facs. Rev. Bonds, Series 2016-B, 5.00% 2028 | 750 | 897 | ||||||
| Higher Educational Facs. Fncg. Auth., Educational Facs. Rev. Ref. Bonds (Nova Southeastern University Project), Series 2012-A, 5.00% 2022 (escrowed to maturity) | 1,000 | 1,020 | ||||||
| Higher Educational Facs. Fncg. Auth., Educational Facs. Rev. Ref. Bonds (Nova Southeastern University Project), Series 2016, 5.00% 2026 | 655 | 771 | ||||||
| Housing Fin. Corp., Homeowner Mortgage Rev. Bonds, Series 2017-1, 4.00% 2048 | 1,110 | 1,182 | ||||||
| Housing Fin. Corp., Homeowner Mortgage Rev. Bonds, Series 2018-1, 4.00% 2049 | 1,105 | 1,188 | ||||||
| Housing Fin. Corp., Homeowner Mortgage Rev. Bonds, Series 2018-2, 4.25% 2050 | 1,090 | 1,187 | ||||||
| Housing Fin. Corp., Homeowner Mortgage Rev. Bonds, Series 2020-1, 3.50% 2051 | 155 | 169 | ||||||
| Housing Fin. Corp., Homeowner Mortgage Rev. Bonds, Series 2021-2, 3.00% 2052 | 735 | 795 | ||||||
| Housing Fin. Corp., Homeowner Mortgage Rev. Bonds (Special Program), Series 2015-A, 3.50% 2046 | 45 | 46 | ||||||
| Housing Fin. Corp., Multi Family Mortgage Rev. Bonds (Valencia Park Apartments), Series 2021-A, FHA insured, 0.25% 2023 (put 2022) | 630 | 629 | ||||||
| JEA, Electric System Rev. Bonds, Series 2014-A-3, 5.00% 2022 | 600 | 626 | ||||||
| JEA, Electric System Rev. Bonds, Series 2017-B, 5.00% 2026 | 500 | 600 | ||||||
| JEA, Electric System Rev. Bonds, Series 2017-B-3, 5.00% 2026 | 340 | 408 | ||||||
| JEA, Electric System Rev. Bonds, Series 2020-A-3, 5.00% 2030 | 50 | 64 | ||||||
| JEA, Electric System Rev. Bonds, Series 2021-A, 5.00% 2031 | 2,095 | 2,769 | ||||||
| JEA, Electric System Rev. Bonds, Series 2021-A-3, 5.00% 2033 | 625 | 826 | ||||||
| JEA, Water and Sewer System Rev. Bonds, Series 2020-A, 5.00% 2033 | 50 | 64 | ||||||
| County of Manatee, University Park Recreation Dist., Non-Ad Valorem Assessment Bonds, Series 2019, BAM insured, 2.50% 2024 | 280 | 291 | ||||||
| County of Manatee, University Park Recreation Dist., Non-Ad Valorem Assessment Bonds, Series 2019, BAM insured, 2.50% 2025 | 285 | 299 | ||||||
| County of Manatee, University Park Recreation Dist., Non-Ad Valorem Assessment Bonds, Series 2019, BAM insured, 2.50% 2026 | 295 | 312 | ||||||
| County of Manatee, University Park Recreation Dist., Non-Ad Valorem Assessment Bonds, Series 2019, BAM insured, 2.50% 2027 | 300 | 319 | ||||||
| County of Manatee, University Park Recreation Dist., Non-Ad Valorem Assessment Bonds, Series 2019, BAM insured, 2.50% 2028 | 305 | 325 | ||||||
| County of Manatee, University Park Recreation Dist., Non-Ad Valorem Assessment Bonds, Series 2019, BAM insured, 2.625% 2029 | 315 | 338 | ||||||
| County of Miami-Dade, Aviation Rev. Ref. Bonds, Series 2020-A, 5.00% 2025 | 1,150 | 1,342 | ||||||
| County of Miami-Dade, Expressway Auth., Toll System Rev. Bonds, Series 2014-A, BAM insured, 5.00% 2026 | 780 | 873 | ||||||
| County of Miami-Dade, Expressway Auth., Toll System Rev. Ref. Bonds, Series 2014-B, BAM insured, 5.00% 2026 | 760 | 851 | ||||||
| County of Miami-Dade, Housing Fin. Auth., Multi Family Housing Rev. Bonds (Platform 3750), Series 2021, 0.25% 2024 (put 2021) | 510 | 510 | ||||||
| County of Miami-Dade, Housing Fin. Auth., Multi Family Housing Rev. Bonds (Sunset Bay Apartments), Series 2021, 0.25% 2023 (put 2022) | 420 | 420 | ||||||
| County of Miami-Dade, Industrial Dev. Auth., Solid Waste Disposal Rev. Bonds (Waste Management, Inc. of Florida Project), Series 2007, 0.45% 2027 (put 2021) | 4,090 | 4,090 | ||||||
| County of Miami-Dade, Transit System Sales Surtax Rev. Bonds, Series 2012, 5.00% 2025 (preref. 2022) | 25 | 26 | ||||||
| City of Miami Beach, Health Facs. Auth., Hospital Rev. and Rev. Ref. Bonds (Mount Sinai Medical Center of Florida), Series 2014, 5.00% 2027 | 145 | 163 | ||||||
| Municipal Power Agcy., All-Requirements Power Supply Project Rev. Ref. Bonds, Series 2016-A, 5.00% 2026 | 1,000 | 1,200 | ||||||
| County of Orange, Health Facs. Auth., Health Care Facs. Rev. Ref. Bonds (Presbyterian Retirement Communities Project), Series 2016, 5.00% 2031 | 300 | 328 | ||||||
| County of Orange, Housing Fin. Auth., Multi Family Housing Rev. Bonds (Dunwoodie Place Apartments), Series 2021-A, 0.20% 2024 (put 2023) | 200 | 200 | ||||||
| County of Orange, Housing Fin. Auth., Multi Family Housing Rev. Bonds (Jernigan Gardens), Series 2020-B, 0.35% 2023 (put 2022) | 2,000 | 2,000 | ||||||
| Orlando-Orange County Expressway Auth., Rev. Ref. Bonds, Series 2013-A, 5.00% 2032 (preref. 2023) | 1,020 | 1,099 | ||||||
| County of Palm Beach, Health Facs. Auth., Rev. Bonds (Lifespace Communities, Inc.), Series 2015-C, 5.00% 2027 | 300 | 340 | ||||||
| County of Polk, Utility System Rev. and Rev. Ref. Bonds, Series 2013, BAM insured, 5.00% 2043 (preref. 2023) | 185 | 201 | ||||||
| Private Client Services Funds | 13 |
Capital Group Core Municipal Fund
| Bonds, notes & other debt instruments (continued) | Principal amount (000) | Value (000) | ||||||
| Florida (continued) | ||||||||
| City of Pompano Beach, Rev. Bonds (John Knox Village Project), Series 2015, 5.00% 2023 | $ | 630 | $ | 674 | ||||
| Counties of St. Johns and Duval, Tolomato Community Dev. Dist., Rev. Ref. Bonds, Series 2018-A-1, Assured Guaranty Municipal insured, 2.625% 2024 | 1,065 | 1,114 | ||||||
| County of St. Johns, Sweetwater Creek Community Dev. Dist., Capital Improvement Rev. Ref. Bonds, Series 2019-A-1, Assured Guaranty Municipal insured, 2.00% 2022 | 340 | 342 | ||||||
| City of South Miami, Health Facs. Auth., Hospital Rev. Ref. Bonds (Baptist Health South Florida Obligated Group), Series 2017, 5.00% 2024 | 500 | 562 | ||||||
| City of Tallahassee, Energy System Rev. Ref. Bonds, Series 2020, 5.00% 2028 | 1,000 | 1,262 | ||||||
| City of Tampa, Hospital Rev. Bonds (H. Lee Moffitt Cancer Center Project), Series 2020-B, 5.00% 2028 | 215 | 268 | ||||||
| City of Tampa, Hospital Rev. Bonds (H. Lee Moffitt Cancer Center Project), Series 2020-B, 5.00% 2029 | 250 | 318 | ||||||
| City of Tampa, Hospital Rev. Bonds (H. Lee Moffitt Cancer Center Project), Series 2020-B, 5.00% 2030 | 260 | 336 | ||||||
| Dept. of Transportation, Right-of-Way Acquisition and Bridge Construction Bonds, Series 2019-B, 5.00% 2028 | 1,000 | 1,260 | ||||||
| Dept. of Transportation Fncg. Corp., Rev. Bonds, Series 2020, 5.00% 2024 | 430 | 483 | ||||||
| City of Winter Garden, Winter Garden Village at Fowler Groves Community Dev. Dist., Special Assessment Rev. Ref. Bonds, Series 2016, 3.00% 2024 | 530 | 543 | ||||||
| 43,370 | ||||||||
| Georgia 2.50% | ||||||||
| County of Appling, Dev. Auth., Pollution Control Rev. Bonds (Oglethorpe Power Corp. Scherer Project), Series 2013-A, 1.50% 2038 (put 2025) | 885 | 907 | ||||||
| City of Atlanta, Urban Residential Fin. Auth., Multi Family Housing Rev. Bonds (Sylvan Hills Senior Apartments Project), Series 2020, 0.41% 2025 (put 2023) | 285 | 285 | ||||||
| County of Burke, Dev. Auth., Pollution Control Rev. Bonds (Georgia Power Co. Plant Vogtle Project), Series 2013, 2.925% 2053 (put 2024) | 600 | 632 | ||||||
| County of Burke, Dev. Auth., Pollution Control Rev. Bonds (Oglethorpe Power Corp. Vogtle Project), Series 2013-A, 1.50% 2040 (put 2025) | 685 | 702 | ||||||
| City of Columbus, Dev. Auth., Multi Family Housing Rev. Bonds (Highland Terrace Phase II Project), Series 2021-B, 0.34% 2025 (put 2024) | 425 | 424 | ||||||
| County of Dawson, Dev. Auth., Multi Family Housing Rev. Bonds (Peaks of Dawsonville Project), Series 2021, 0.28% 2023 | 250 | 249 | ||||||
| County of Dekalb, Housing Auth., Multi Family Housing Rev. Bonds (Columbia Village Project), Series 2021-A, 0.34% 2024 (put 2023) | 140 | 140 | ||||||
| G.O. Bonds, Series 2020-A, 5.00% 2023 | 160 | 173 | ||||||
| G.O. Bonds, Series 2020-A, 5.00% 2029 | 1,875 | 2,434 | ||||||
| Housing and Fin. Auth., Single Family Mortgage Bonds, Series 2014-A-1, 4.00% 2044 | 225 | 232 | ||||||
| Housing and Fin. Auth., Single Family Mortgage Bonds, Series 2015-A-1, 3.50% 2045 | 160 | 167 | ||||||
| Housing and Fin. Auth., Single Family Mortgage Bonds, Series 2017-A, 4.00% 2047 | 405 | 431 | ||||||
| Main Street Natural Gas, Inc., Gas Supply Rev. Bonds, Series 2018-D, (3-month USD-LIBOR x 0.67 + 0.83%) 0.885% 2048 (put 2023)2 | 155 | 156 | ||||||
| Main Street Natural Gas, Inc., Gas Supply Rev. Bonds, Series 2019-B, 4.00% 2049 (put 2024) | 980 | 1,078 | ||||||
| Main Street Natural Gas, Inc., Gas Supply Rev. Bonds, Series 2019-C, 4.00% 2050 (put 2026) | 1,500 | 1,708 | ||||||
| Main Street Natural Gas, Inc., Gas Supply Rev. Bonds, Series 2021-C, 4.00% 2052 (put 2028) | 3,305 | 3,872 | ||||||
| Metropolitan Atlanta Rapid Transit Auth., Sales Tax Rev. Ref. Bonds (Third Indenture Series), Series 2012-A, 5.00% 2030 (preref. 2022) | 630 | 650 | ||||||
| Municipal Electric Auth., General Resolution Projects Bonds, Series 2021-A, 5.00% 2031 | 415 | 533 | ||||||
| Municipal Electric Auth., Plant Vogtle Units 3 and 4 Project J Bonds, Series 2021-A, Assured Guaranty Municipal insured, 5.00% 2029 | 495 | 624 | ||||||
| Municipal Electric Auth., Plant Vogtle Units 3 and 4 Project J Bonds, Series 2021-A, Assured Guaranty Municipal insured, 5.00% 2030 | 430 | 550 | ||||||
| Municipal Electric Auth., Plant Vogtle Units 3 and 4 Project M Bonds, Series 2019-A, 5.00% 2029 | 120 | 149 | ||||||
| Municipal Electric Auth., Plant Vogtle Units 3 and 4 Project M Bonds, Series 2019-A, 5.00% 2030 | 115 | 142 | ||||||
| Municipal Electric Auth., Project One Bonds, Series 2019-A, 5.00% 2024 | 1,000 | 1,098 | ||||||
| Municipal Electric Auth., Project One Bonds, Series 2019-A, 5.00% 2029 | 870 | 1,085 | ||||||
| Municipal Electric Auth., Project One Bonds, Series 2021-A, 5.00% 2031 | 785 | 1,008 | ||||||
| Northwest Georgia Housing Auth., Multi Family Housing Rev. Bonds (Dallas Manor Apartments Project), Series 2021, 0.25% 2024 (put 2023) | 120 | 120 | ||||||
| Private Colleges and Universities Auth., Rev. Bonds (The Savannah College of Art and Design Projects), Series 2021, 5.00% 2030 | 80 | 102 | ||||||
| 19,651 | ||||||||
| 14 | Private Client Services Funds |
Capital Group Core Municipal Fund
| Bonds, notes & other debt instruments (continued) | Principal amount (000) | Value (000) | ||||||
| Guam 0.06% | ||||||||
| Waterworks Auth., Water and Wastewater System Rev. Bonds, Series 2013, 5.25% 2024 | $ | 450 | $ | 482 | ||||
| Hawaii 0.17% | ||||||||
| Airports System Rev. Bonds, Series 2018-D, 5.00% 2030 | 1,000 | 1,294 | ||||||
| Idaho 0.13% | ||||||||
| Housing and Fin. Assn., Grant and Rev. Anticipation Bonds (Federal Highway Trust Fund), Series 2015-A, 5.00% 2022 | 1,000 | 1,033 | ||||||
| Illinois 6.34% | ||||||||
| Build Illinois Bonds, Sales Tax Rev. Ref. Bonds, Series 2016-D, 5.00% 2025 | 350 | 403 | ||||||
| City of Chicago, Board of Education, Unlimited Tax G.O. Bonds (Dedicated Rev.), Series 2018-A, Assured Guaranty Municipal insured, 5.00% 2023 | 1,100 | 1,202 | ||||||
| City of Chicago, Chicago Midway Airport, Rev. and Rev. Ref. Bonds, Series 2014-B, 5.00% 2028 | 500 | 548 | ||||||
| City of Chicago, G.O. Rev. Ref. Bonds, Series 2020-A, 5.00% 2022 | 400 | 403 | ||||||
| City of Chicago, G.O. Rev. Ref. Bonds, Series 2020-A, 5.00% 2023 | 560 | 589 | ||||||
| City of Chicago, Transit Auth., Capital Grant Receipts Rev. Ref. Bonds (Federal Transit Administration Section 5307 Urbanized Area Formula Funds), Series 2021, 5.00% 2024 | 65 | 72 | ||||||
| City of Chicago, Wastewater Transmission Rev. Bonds, Series 2012, Assured Guaranty Municipal insured, 5.00% 2023 | 500 | 504 | ||||||
| City of Chicago, Wastewater Transmission Rev. Project Bonds, Series 2014, 5.00% 2028 | 385 | 421 | ||||||
| City of Chicago, Water Rev. Bonds, Series 2004, 5.00% 2023 | 200 | 218 | ||||||
| City of Chicago, Water Rev. Ref. Bonds, Series 2004, 5.00% 2021 | 1,895 | 1,895 | ||||||
| City of Chicago, Water Rev. Ref. Bonds, Series 2014, 5.00% 2023 | 200 | 218 | ||||||
| City of Chicago, Water Rev. Ref. Bonds, Series 2017, 5.00% 2028 | 355 | 438 | ||||||
| County of Cook, Community College Dist. No. 508 (City Colleges of Chicago), Unlimited Tax G.O. Bonds, Series 2013, 5.00% 2023 | 200 | 216 | ||||||
| Fin. Auth., Academic Fac. Lease Rev. Bonds (Provident Group - UIUC Properties LLC - University of Illinois at Urbana-Champaign Project), Series 2019-A, 5.00% 2025 | 110 | 128 | ||||||
| Fin. Auth., Academic Fac. Lease Rev. Bonds (Provident Group - UIUC Properties LLC - University of Illinois at Urbana-Champaign Project), Series 2019-A, 5.00% 2027 | 500 | 611 | ||||||
| Fin. Auth., Academic Fac. Lease Rev. Bonds (Provident Group - UIUC Properties LLC - University of Illinois at Urbana-Champaign Project), Series 2019-A, 5.00% 2028 | 400 | 499 | ||||||
| Fin. Auth., Rev. Bonds (Advocate Health Care Network), Series 2008-A-1, 4.00% 2030 | 1,000 | 1,119 | ||||||
| Fin. Auth., Rev. Bonds (Art Institute of Chicago), Series 2016, 5.00% 2025 | 125 | 143 | ||||||
| Fin. Auth., Rev. Bonds (Art Institute of Chicago), Series 2016, 5.00% 2026 | 120 | 141 | ||||||
| Fin. Auth., Rev. Bonds (Clean Water Initiative Revolving Fund), Series 2017, 5.00% 2033 | 500 | 600 | ||||||
| Fin. Auth., Rev. Bonds (Lifespace Communities, Inc.), Series 2015-A, 5.00% 2027 | 590 | 668 | ||||||
| Fin. Auth., Rev. Bonds (Northshore University Heathsystem), Series 2020-A, 5.00% 2029 | 1,000 | 1,281 | ||||||
| Fin. Auth., Rev. Bonds (Northshore University Heathsystem), Series 2020-A, 5.00% 2033 | 280 | 361 | ||||||
| Fin. Auth., Rev. Bonds (OSF Healthcare System), Series 2015-A, 5.00% 2027 | 250 | 290 | ||||||
| Fin. Auth., Rev. Bonds (OSF Healthcare System), Series 2020-B-2, 5.00% 2050 (put 2026) | 105 | 124 | ||||||
| Fin. Auth., Rev. Bonds (Presbyterian Homes Obligated Group), Series 2016-A, 5.00% 2024 | 310 | 343 | ||||||
| Fin. Auth., Rev. Bonds (Presbyterian Homes Obligated Group), Series 2021-B, (SIFMA Municipal Swap Index + 0.70%) 0.75% 2042 (put 2026)2 | 140 | 140 | ||||||
| Fin. Auth., Rev. Bonds (Presence Health Network), Series 2016-C, 5.00% 2026 | 600 | 710 | ||||||
| Fin. Auth., Rev. Bonds (Presence Health Network), Series 2016-C, 5.00% 2028 | 400 | 484 | ||||||
| Fin. Auth., Rev. Bonds (Rush University Medical Center Obligated Group), Series 2015-A, 5.00% 2021 | 500 | 501 | ||||||
| Fin. Auth., Rev. Bonds (Rush University Medical Center Obligated Group), Series 2015-A, 5.00% 2028 | 1,000 | 1,148 | ||||||
| Fin. Auth., Rev. Bonds (Rush University Medical Center Obligated Group), Series 2015-A, 5.00% 2029 | 500 | 573 | ||||||
| Fin. Auth., Rev. Bonds (The Carle Foundation), Series 2021-A, 5.00% 2029 | 800 | 1,022 | ||||||
| Fin. Auth., Rev. Bonds (The Carle Foundation), Series 2021-A, 5.00% 2030 | 360 | 468 | ||||||
| Fin. Auth., Rev. Bonds (University of Chicago), Series 2021-A, 5.00% 2025 | 270 | 316 | ||||||
| Fin. Auth., Rev. Ref. Bonds (Northwestern Memorial Healthcare), Series 2021-A, 5.00% 2032 | 510 | 676 | ||||||
| Fin. Auth., Rev. Ref. Bonds (Northwestern Memorial Healthcare), Series 2021-A, 5.00% 2033 | 365 | 482 | ||||||
| Fin. Auth., Rev. Ref. Bonds (OSF Healthcare System), Series 2015-A, 5.00% 2026 | 770 | 895 | ||||||
| Fin. Auth., Water Facs. Rev. Ref. Bonds (American Water Capital Corp. Project), Series 2020, 0.70% 2040 (put 2023) | 215 | 215 | ||||||
| G.O. Bonds, Series 2017-D, BAM insured, 5.00% 2021 | 1,150 | 1,150 | ||||||
| G.O. Bonds, Series 2017-A, 5.00% 2021 | 500 | 502 | ||||||
| G.O. Bonds, Series 2016, 5.00% 2022 | 130 | 131 | ||||||
| Private Client Services Funds | 15 |
Capital Group Core Municipal Fund
| Bonds, notes & other debt instruments (continued) | Principal amount (000) | Value (000) | ||||||
| Illinois (continued) | ||||||||
| G.O. Bonds, Series 2014, 5.00% 2022 | $ | 110 | $ | 113 | ||||
| G.O. Bonds, Series 2017-D, 5.00% 2027 | 205 | 246 | ||||||
| G.O. Bonds, Series 2020-B, 5.00% 2029 | 2,090 | 2,577 | ||||||
| G.O. Rev. Ref. Bonds, Series 2016, 5.00% 2022 | 215 | 218 | ||||||
| Housing Dev. Auth., Multi Family Housing Rev. Bonds, Series 2021-C, 0.80% 2026 | 40 | 40 | ||||||
| Housing Dev. Auth., Multi Family Housing Rev. Bonds (Concord Commons), Series 2021, 0.25% 2024 (put 2023) | 810 | 810 | ||||||
| Housing Dev. Auth., Multi Family Housing Rev. Bonds (Marshall Field Garden Apartment Homes), Series 2015, (SIFMA Municipal Swap Index + 1.00%) 1.05% 2050 (put 2025)2 | 2,000 | 2,043 | ||||||
| Housing Dev. Auth., Rev. Bonds, Series 2019-A, 4.25% 2049 | 1,605 | 1,770 | ||||||
| Housing Dev. Auth., Rev. Bonds, Series 2021-D, 3.00% 2051 | 1,665 | 1,798 | ||||||
| Board of Trustees of Illinois State University, Auxiliary Facs. System Rev. Bonds, Series 2016, Assured Guaranty Municipal insured, 5.00% 2022 | 1,465 | 1,493 | ||||||
| Metropolitan Pier and Exposition Auth., McCormick Place Expansion Project Rev. Ref. Bonds, Series 2017-B, 5.00% 2025 | 225 | 262 | ||||||
| Municipal Electric Agcy., Power Supply System Rev. Ref. Bonds, Series 2015-A, 5.00% 2027 | 1,000 | 1,160 | ||||||
| Railsplitter Tobacco Settlement Auth., Tobacco Settlement Rev. Bonds, Series 2017, 5.00% 2023 | 620 | 665 | ||||||
| Sales Tax Securitization Corp., Sales Tax Rev. Ref. Bonds, Series 2017-A, 5.00% 2024 | 1,000 | 1,095 | ||||||
| Sales Tax Securitization Corp., Sales Tax Securitization Bonds, Series 2020-A, BAM insured, 5.00% 2027 | 1,000 | 1,201 | ||||||
| Sales Tax Securitization Corp., Sales Tax Securitization Rev. Ref. Bonds, Series 2017-A, 5.00% 2023 | 2,000 | 2,110 | ||||||
| Toll Highway Auth., Toll Highway Rev. Bonds, Series 2019-C, 5.00% 2025 | 1,180 | 1,346 | ||||||
| Toll Highway Auth., Toll Highway Rev. Bonds, Series 2015-A, 5.00% 2027 | 1,250 | 1,448 | ||||||
| Toll Highway Auth., Toll Highway Rev. Bonds, Series 2015-A, 5.00% 2028 | 1,110 | 1,283 | ||||||
| Toll Highway Auth., Toll Highway Rev. Bonds, Series 2019-C, 5.00% 2029 | 440 | 555 | ||||||
| Toll Highway Auth., Toll Highway Rev. Ref. Bonds, Series 2019-A, 5.00% 2024 | 500 | 549 | ||||||
| Toll Highway Auth., Toll Highway Rev. Ref. Bonds, Series 2019-A, 5.00% 2025 | 740 | 844 | ||||||
| Toll Highway Auth., Toll Highway Rev. Ref. Bonds, Series 2019-A, 5.00% 2028 | 635 | 784 | ||||||
| Board of Trustees of the University of Illinois, Auxiliary Facs. System Rev. Bonds, Series 2018-A, 5.00% 2025 | 135 | 155 | ||||||
| Board of Trustees of the University of Illinois, Auxiliary Facs. System Rev. Bonds, Series 2020-A, 5.00% 2028 | 1,000 | 1,239 | ||||||
| Board of Trustees of the University of Illinois, Auxiliary Facs. System Rev. Ref. Bonds, Series 2005-A, National insured, 5.50% 2023 | 500 | 537 | ||||||
| Board of Trustees of the University of Illinois, Auxiliary Facs. System Rev. Ref. Bonds, Series 2015-A, 5.00% 2026 | 500 | 572 | ||||||
| Board of Trustees of the University of Illinois, Rev. Ref. Certs. of Part., Series 2008-A, Assured Guaranty Municipal insured, 5.25% 2024 | 30 | 30 | ||||||
| 49,791 | ||||||||
| Indiana 1.41% | ||||||||
| Fin. Auth., Health System Rev. Bonds (Indiana University Health), Series 2019-C, 5.00% 2022 | 140 | 147 | ||||||
| Fin. Auth., Hospital Rev. Bonds (Community Health Network Project), Series 2012-A, 5.00% 2042 (preref. 2023) | 1,165 | 1,247 | ||||||
| Fin. Auth., Rev. Bonds (Community Foundation of Northwest Indiana Obligated Group), Series 2012, 5.00% 2030 (preref. 2022) | 515 | 523 | ||||||
| Fin. Auth., State Revolving Fund Program Green Bonds, Series 2019-E, 5.00% 2022 | 750 | 759 | ||||||
| Fin. Auth., State Revolving Fund Program Green Bonds, Series 2021-B, 5.00% 2028 | 575 | 715 | ||||||
| Fin. Auth., Wastewater Utility Rev. Ref. Bonds, Series 2021-2, 5.00% 2022 | 130 | 136 | ||||||
| Fin. Auth., Wastewater Utility Rev. Ref. Bonds, Series 2021-1, 5.00% 2023 | 275 | 300 | ||||||
| Fin. Auth., Wastewater Utility Rev. Ref. Bonds, Series 2021-2, 5.00% 2023 | 85 | 93 | ||||||
| Fin. Auth., Wastewater Utility Rev. Ref. Bonds, Series 2021-2, 5.00% 2027 | 335 | 413 | ||||||
| City of Franklin, Econ. Dev. and Rev. Ref. Bonds (Otterbein Homes Obligated Group), Series 2019-B, 5.00% 2023 | 30 | 32 | ||||||
| Health Fac. Fncg. Auth., Rev. Bonds (Ascension Health Subordinate Credit Group), Series 2005-A-1, 4.00% 2023 | 80 | 86 | ||||||
| Housing and Community Dev. Auth., Collateralized Rev. Bonds (RD Moving Forward Justus Project), Series 2021, 0.33% 2024 (put 2023) | 710 | 709 | ||||||
| Housing and Community Dev. Auth., Single Family Mortgage Rev. Bonds, Series 2019-A, 4.25% 2048 | 1,825 | 1,991 | ||||||
| Housing and Community Dev. Auth., Single Family Mortgage Rev. Bonds, Series 2020-A, 3.75% 2049 | 160 | 174 | ||||||
| Housing and Community Dev. Auth., Single Family Mortgage Rev. Bonds, Series 2021-B, 3.00% 2050 | 110 | 118 | ||||||
| Housing and Community Dev. Auth., Single Family Mortgage Rev. Bonds, Series 2021-C-1, 3.00% 2052 | 355 | 385 | ||||||
| City of Indianapolis, Local Public Improvement Bond Bank Bonds (Indianapolis Airport Auth. Project), Series 2019-I-2, 5.00% 2026 | 340 | 401 | ||||||
| City of Indianapolis, Local Public Improvement Bond Bank Bonds (Indianapolis Airport Auth. Project), Series 2019-I-2, 5.00% 2027 | 330 | 399 | ||||||
| City of Indianapolis, Local Public Improvement Bond Bank Bonds (Indianapolis Airport Auth. Project), Series 2019-I-2, 5.00% 2028 | 435 | 537 | ||||||
| 16 | Private Client Services Funds |
Capital Group Core Municipal Fund
| Bonds, notes & other debt instruments (continued) | Principal amount (000) | Value (000) | ||||||
| Indiana (continued) | ||||||||
| City of Indianapolis, Local Public Improvement Bond Bank Bonds (Indianapolis Airport Auth. Project), Series 2019-I-2, 5.00% 2029 | $ | 265 | $ | 333 | ||||
| City of Indianapolis, Local Public Improvement Bond Bank Bonds (Indianapolis Airport Auth. Project), Series 2019-I-2, 5.00% 2030 | 435 | 558 | ||||||
| City of Kokomo, Multi Family Housing Rev. Bonds (KHA RAD I Apartments), Series 2021-A, 0.56% 2025 (put 2024) | 1,030 | 1,030 | ||||||
| 11,086 | ||||||||
| Iowa 0.35% | ||||||||
| Fin. Auth., Rev. Bonds (Lifespace Communities, Inc.), Series 2019-A-2, 2.875% 2049 | 15 | 15 | ||||||
| Fin. Auth., Single Family Mortgage Bonds (Mortgage-Backed Securities Program), Series 2019-A, 4.00% 2047 | 835 | 929 | ||||||
| Fin. Auth., Single Family Mortgage Bonds (Mortgage-Backed Securities Program), Series 2019-D, 3.50% 2049 | 25 | 27 | ||||||
| PEFA, Inc., Gas Project Rev. Bonds, Series 2019, 5.00% 2049 (put 2026) | 1,000 | 1,183 | ||||||
| Tobacco Settlement Auth., Tobacco Settlement Asset-Backed Bonds, Series 2021-A-2, 5.00% 2031 | 320 | 420 | ||||||
| Tobacco Settlement Auth., Tobacco Settlement Asset-Backed Bonds, Series 2021-A-2, 5.00% 2033 | 135 | 175 | ||||||
| 2,749 | ||||||||
| Kansas 0.15% | ||||||||
| Turnpike Auth., Rev. Ref. Bonds, Series 2020-A, 3.00% 2025 | 950 | 1,040 | ||||||
| Unified Government of Wyandotte County, Board of Public Utilities, Utility System Improvement Rev. Bonds, Series 2012-B, 5.00% 2026 (preref. 2022) | 110 | 114 | ||||||
| 1,154 | ||||||||
| Kentucky 0.97% | ||||||||
| County of Carroll, Environmental Facs. Rev. Bonds, Series 2008-A, 2.00% 2032 | 725 | 738 | ||||||
| Econ. Dev. Fin. Auth., Health System Rev. Bonds (Norton Healthcare, Inc.), Capital Appreciation Bonds, Series 2000-B, National insured, 0% 2027 | 1,000 | 894 | ||||||
| Housing Corp., Multi Family Housing Rev. Bonds (Cambridge Square Project), Series 2021, 0.30% 2024 (put 2024) | 365 | 364 | ||||||
| Housing Corp., Multi Family Housing Rev. Bonds (New Hope Properties Portfolio Project), Series 2021, 0.41% 2024 (put 2023) | 1,575 | 1,576 | ||||||
| Housing Corp., Multi Family Housing Rev. Bonds (Winterwood II Rural Housing Portfolio), Series 2021, 0.37% 2024 (put 2023) | 635 | 635 | ||||||
| County of Owen, Water Facs. Rev. Ref. Bonds (Kentucky - American Water Co. Project), Series 2019, 2.45% 2039 (put 2029) | 750 | 795 | ||||||
| Property and Buildings Commission, Commonwealth Rev. Ref. Bonds (Project No. 125), Series 2021-A, 5.00% 2022 | 170 | 177 | ||||||
| Public Energy Auth., Gas Supply Rev. Bonds, Series 2018-A, 4.00% 2048 (put 2024) | 410 | 441 | ||||||
| Public Energy Auth., Gas Supply Rev. Bonds, Series 2019-A-1, 4.00% 2049 (put 2025) | 1,180 | 1,308 | ||||||
| Public Energy Auth., Gas Supply Rev. Bonds, Series 2018-B, 4.00% 2049 (put 2025) | 185 | 203 | ||||||
| Turnpike Auth., Econ. Dev. Road Rev. Ref. Bonds (Revitalization Projects), Series 2022-A, 5.00% 2031 | 270 | 346 | ||||||
| County of Warren, Hospital Rev. Ref. Bonds (Bowling Green - Warren County Community Hospital Corp.), Series 2021-A, 5.00% 2022 | 135 | 138 | ||||||
| 7,615 | ||||||||
| Louisiana 2.04% | ||||||||
| Parish of East Baton Rouge, Road and Street Improvement Sales Tax Rev. Ref. Bonds, Series 2020, Assured Guaranty Municipal insured, 5.00% 2022 | 85 | 88 | ||||||
| Parish of East Baton Rouge, Road and Street Improvement Sales Tax Rev. Ref. Bonds, Series 2020, Assured Guaranty Municipal insured, 5.00% 2026 | 1,250 | 1,496 | ||||||
| Parish of East Baton Rouge, Sewerage Commission, Multi Modal Rev. Ref. Bonds, Series 2021-A, 1.30% 2041 (put 2028) | 1,270 | 1,287 | ||||||
| Parish of East Baton Rouge, Sewerage Commission, Rev. Ref. Bonds, Series 2020-A, 5.00% 2026 | 1,135 | 1,337 | ||||||
| Gasoline and Fuels Tax Rev. Ref. Bonds, Series 2017-D-1, 0.60% 2043 (put 2023) | 2,000 | 2,001 | ||||||
| Grant Anticipation Rev. Bonds, Series 2021, 5.00% 2023 | 335 | 364 | ||||||
| Housing Corp., Multi Family Housing Rev. Bonds (Arbours at Lafayette Project), Series 2021, 0.35% 2024 (put 2023) | 375 | 375 | ||||||
| Housing Corp., Multi Family Housing Rev. Bonds (Mabry Place Townhomes Project), Series 2021, 0.31% 2024 (put 2023) | 215 | 214 | ||||||
| Housing Corp., Single Family Mortgage Rev. Bonds (Home Ownership Program), Series 2021-B, 3.00% 2051 | 755 | 813 | ||||||
| Private Client Services Funds | 17 |
Capital Group Core Municipal Fund
| Bonds, notes & other debt instruments (continued) | Principal amount (000) | Value (000) | ||||||
| Louisiana (continued) | ||||||||
| Parish of Jefferson, Sales Tax Rev. Ref. Bonds, Series 2019-B, Assured Guaranty Municipal insured, 5.00% 2027 | $ | 1,000 | $ | 1,235 | ||||
| Local Government Environmental Facs. and Community Dev. Auth., Rev. Ref. Bonds (Entergy Louisiana, LLC Projects), Series 2021-A, 2.00% 2030 | 105 | 106 | ||||||
| Louisiana Stadium and Exposition Dist., Rev. Ref. Bonds, Series 2013-A, 5.00% 2022 | 1,500 | 1,547 | ||||||
| Offshore Terminal Auth., Deepwater Port Rev. Bonds (Loop LLC Project), Series 2007-A, 1.65% 2027 (put 2023) | 905 | 923 | ||||||
| Public Facs. Auth., Hospital Rev. Ref. Bonds (Lafayette General Health System Project), Series 2016-A, 5.00% 2041 (preref. 2025) | 1,000 | 1,177 | ||||||
| Parish of St. Charles, Gulf Opportunity Zone Rev. Bonds (Valero Project), Series 2010, 4.00% 2040 (put 2022) | 2,000 | 2,042 | ||||||
| Parish of St. John the Baptist, Rev. Ref. Bonds (Marathon Oil Corp. Project), Series 2017-B-1, 2.125% 2037 (put 2024) | 285 | 294 | ||||||
| City of Shreveport, Water and Sewer Rev. Bonds, Series 2019-B, Assured Guaranty Municipal insured, 3.00% 2022 | 115 | 118 | ||||||
| City of Shreveport, Water and Sewer Rev. Bonds, Series 2019-B, Assured Guaranty Municipal insured, 4.00% 2023 | 105 | 112 | ||||||
| City of Shreveport, Water and Sewer Rev. Bonds, Series 2019-B, Assured Guaranty Municipal insured, 5.00% 2024 | 80 | 91 | ||||||
| City of Shreveport, Water and Sewer Rev. Bonds, Series 2019-B, Assured Guaranty Municipal insured, 4.00% 2025 | 145 | 163 | ||||||
| City of Shreveport, Water and Sewer Rev. Bonds, Series 2019-B, Assured Guaranty Municipal insured, 5.00% 2026 | 140 | 169 | ||||||
| Tobacco Settlement Fncg. Corp., Tobacco Settlement Asset-Backed Rev. Ref. Bonds, Series 2013-A, 5.00% 2023 | 90 | 96 | ||||||
| 16,048 | ||||||||
| Maine 0.05% | ||||||||
| Housing Auth., Mortgage Purchase Bonds, Series 2017-A, 4.00% 2047 | 355 | 376 | ||||||
| Maryland 1.16% | ||||||||
| Community Dev. Administration, Dept. of Housing and Community Dev., Multi Family Housing Dev. Rev. Bonds (Somerset Extension), Series 2019-H, 1.795% 2022 | 215 | 216 | ||||||
| Community Dev. Administration, Dept. of Housing and Community Dev., Residential Rev. Bonds, Series 2014-C, 4.00% 2044 | 235 | 247 | ||||||
| Community Dev. Administration, Dept. of Housing and Community Dev., Residential Rev. Bonds, Series 2018-A, 4.50% 2048 | 1,760 | 1,961 | ||||||
| G.O. Rev. Ref. Bonds, State and Local Facs. Loan of 2021, Series 2022-D-2, 4.00% 2029 | 585 | 694 | ||||||
| County of Montgomery, Housing Opportunities Commission, Single Family Housing Rev. Bonds, Series 2017-A, 4.00% 2048 | 565 | 606 | ||||||
| County of Montgomery, Housing Opportunities Commission, Single Family Housing Rev. Bonds, Series 2018-A, 4.00% 2049 | 1,510 | 1,628 | ||||||
| County of Prince George, Certs. of Part. (Behavioral Health Fac. and Capital Equipment), Series 2021, 5.00% 2024 | 165 | 187 | ||||||
| Transportation Auth., Transportation Facs. Projects Rev. Bonds, Series 2020. 5.00% 2033 | 745 | 968 | ||||||
| Washington Suburban Sanitary Dist., Consolidated Public Improvement Bonds, Series 2021, 5.00% 2030 | 2,000 | 2,625 | ||||||
| 9,132 | ||||||||
| Massachusetts 0.38% | ||||||||
| Dev. Fin. Agcy., Multi Family Housing Rev. Bonds (Salem Heights II Preservation Associates LP Issue), Series 2021-B, 0.25% 2024 (put 2023) | 180 | 179 | ||||||
| Dev. Fin. Agcy., Rev. Bonds (Williams College Issue), Series 2011-N, 0.45% 2041 (put 2025) | 150 | 149 | ||||||
| Dev. Fin. Agcy., Rev. Ref. Bonds (Berkshire Health Systems Issue), Series 2021-I, 5.00% 2024 | 615 | 696 | ||||||
| Housing Fin. Agcy., Housing Green Bonds, Series 2021-A-2, 0.30% 2023 | 50 | 50 | ||||||
| Housing Fin. Agcy., Housing Green Bonds, Series 2021-A-2, 0.40% 2024 | 65 | 65 | ||||||
| Housing Fin. Agcy., Housing Green Bonds, Series 2021-B-2, 0.75% 2025 | 55 | 55 | ||||||
| Housing Fin. Agcy., Single Family Housing Rev. Bonds, Series 169, 4.00% 2044 | 165 | 169 | ||||||
| Housing Fin. Agcy., Single Family Housing Rev. Bonds, Series 172, 4.00% 2045 | 310 | 322 | ||||||
| Transportation Fund Rev. Ref. Bonds, Series 2021-A, 5.00% 2029 | 1,000 | 1,289 | ||||||
| 2,974 | ||||||||
| Michigan 3.00% | ||||||||
| City of Detroit, Water and Sewerage Dept., Sewage Disposal System Rev. and Rev. Ref. Bonds, Series 2012-A, 5.00% 2032 (preref. 2022) | 185 | 191 | ||||||
| Fin. Auth., Hospital Rev. and Rev. Ref. Bonds (Trinity Health Credit Group), Series 2017-A, 5.00% 2047 (preref. 2022) | 2,555 | 2,688 | ||||||
| Fin. Auth., Hospital Rev. Ref. Bonds (McLaren Health Care), Series 2015-D-1, 0.25% 2022 | 40 | 40 | ||||||
| Fin. Auth., Local Government Loan Program Rev. Bonds (Detroit Water and Sewerage Dept., Sewage Disposal System Rev. Ref. Local Project Bonds), Series 2015-C, 5.00% 2027 | 250 | 289 | ||||||
| 18 | Private Client Services Funds |
Capital Group Core Municipal Fund
| Bonds, notes & other debt instruments (continued) | Principal amount (000) | Value (000) | ||||||
| Michigan (continued) | ||||||||
| Fin. Auth., Tobacco Settlement Asset-Backed Bonds, Series 2020-A-1, 5.00% 2026 | $ | 105 | $ | 124 | ||||
| Fin. Auth., Tobacco Settlement Asset-Backed Bonds, Series 2020-A, 5.00% 2028 | 1,000 | 1,242 | ||||||
| Fin. Auth., Tobacco Settlement Asset-Backed Bonds, Series 2020-A-1, 5.00% 2029 | 205 | 260 | ||||||
| Great Lakes Water Auth., Water Supply System Rev. Bonds, Series 2020-B, 5.00% 2032 | 500 | 645 | ||||||
| Hospital Fin. Auth., Hospital Rev. Bonds (Trinity Health Credit Group), Series 2009-B, 5.00% 2048 (preref. 2022) | 615 | 632 | ||||||
| Hospital Fin. Auth., Hospital Rev. Ref. Bonds (Trinity Health Credit Group), Series 2008-C, 5.00% 2021 | 650 | 653 | ||||||
| Hospital Fin. Auth., Hospital Rev. Ref. Bonds (Trinity Health Credit Group), Series 2008-C, 5.00% 2022 | 475 | 500 | ||||||
| Hospital Fin. Auth., Hospital Rev. Ref. Bonds (Trinity Health Credit Group), Series 2012-C, 5.00% 2026 (preref. 2022) | 400 | 411 | ||||||
| Housing Dev. Auth., Multi Family Housing Rev. Bonds, Series 2020, 0.32% 2023 (put 2022) | 1,000 | 1,001 | ||||||
| Housing Dev. Auth., Rental Housing Rev. Bonds, Series 2019-A-1, 1.50% 2022 | 1,210 | 1,211 | ||||||
| Housing Dev. Auth., Rental Housing Rev. Bonds, Series 2021-A, 0.55% 2025 | 185 | 185 | ||||||
| Housing Dev. Auth., Single Family Mortgage Rev. Bonds, Series 2016-B, 3.50% 2047 | 475 | 503 | ||||||
| Housing Dev. Auth., Single Family Mortgage Rev. Bonds, Series 2017-B, 3.50% 2048 | 270 | 286 | ||||||
| Housing Dev. Auth., Single Family Mortgage Rev. Bonds, Series 2018-A, 4.00% 2048 | 635 | 685 | ||||||
| Housing Dev. Auth., Single Family Mortgage Rev. Bonds, Series 2018-C, 4.25% 2049 | 1,750 | 1,910 | ||||||
| Housing Dev. Auth., Single Family Mortgage Rev. Bonds, Series 2019-A, 4.25% 2049 | 850 | 934 | ||||||
| Housing Dev. Auth., Single Family Mortgage Rev. Bonds, Series 2020-A, 3.50% 2050 | 970 | 1,055 | ||||||
| Housing Dev. Auth., Single Family Mortgage Rev. Bonds, Series 2021-A, 3.00% 2052 | 2,130 | 2,302 | ||||||
| Board of Trustees of Michigan State University, Rev. Bonds, Series 2019-B, 5.00% 2023 | 300 | 318 | ||||||
| Board of Trustees of Michigan State University, Rev. Bonds, Series 2019-B, 5.00% 2030 | 700 | 886 | ||||||
| County of Monroe, Econ. Dev. Corp., Limited Obligation Rev. Ref. Bonds (Detroit Edison Co. Project), Series 1992-AA, National insured, 6.95% 2022 | 1,000 | 1,055 | ||||||
| Strategic Fund, Limited Obligation Rev. Ref. Bonds (Detroit Edison Co. Pollution Control Bonds Project), Series 1995-CC, 1.45% 2030 | 1,630 | 1,598 | ||||||
| Trunk Line Fund Bonds, Series 2021-A, 5.00% 2031 | 575 | 770 | ||||||
| Trunk Line Fund Bonds, Series 2021-A, 5.00% 2032 | 860 | 1,147 | ||||||
| 23,521 | ||||||||
| Minnesota 1.43% | ||||||||
| City of Hopkins, Multi Family Housing Rev. Bonds (Raspberry Ridge Project), Series 2021, 0.26% 2024 (put 2023) | 535 | 534 | ||||||
| Housing Fin. Agcy., Residential Housing Fin. Bonds, Series 2014-B, 4.00% 2038 | 260 | 275 | ||||||
| Housing Fin. Agcy., Residential Housing Fin. Bonds, Series 2015-B, 3.50% 2046 | 670 | 708 | ||||||
| Housing Fin. Agcy., Residential Housing Fin. Bonds, Series 2017-B, 4.00% 2047 | 545 | 583 | ||||||
| Housing Fin. Agcy., Residential Housing Fin. Bonds, Series 2018-B, 4.00% 2048 | 385 | 414 | ||||||
| Housing Fin. Agcy., Residential Housing Fin. Bonds, Series 2017-E, 4.00% 2048 | 305 | 329 | ||||||
| Housing Fin. Agcy., Residential Housing Fin. Bonds, Series 2018-E, 4.25% 2049 | 1,665 | 1,829 | ||||||
| Housing Fin. Agcy., Residential Housing Fin. Bonds, Series 2019-B, 4.25% 2049 | 780 | 859 | ||||||
| Housing Fin. Agcy., Residential Housing Fin. Bonds, Series 2020-E, 3.50% 2050 | 285 | 309 | ||||||
| Housing Fin. Agcy., Residential Housing Fin. Bonds, Series 2021-B, 3.00% 2051 | 535 | 576 | ||||||
| Housing Fin. Agcy., Residential Housing Fin. Bonds, Series 2021-D, 3.00% 2052 | 1,205 | 1,300 | ||||||
| City of Mahtomedi, Multi Family Housing Rev. Bonds (Lincoln Place / Vadnais Highlands Projects), Series 2021, 0.25% 2023 (put 2022) | 300 | 300 | ||||||
| City of Rochester, Health Care Facs. Rev. Bonds (Mayo Clinic), Series 2011-C, 4.50% 2038 (put 2021) | 1,000 | 1,001 | ||||||
| Regents of the University of Minnesota, G.O. Bonds, Series 2011-D, 5.00% 2029 (preref. 2021) | 1,265 | 1,270 | ||||||
| Regents of the University of Minnesota, G.O. Rev. Ref. Bonds, Series 2017B, 5.00% 2021 | 960 | 964 | ||||||
| 11,251 | ||||||||
| Mississippi 0.49% | ||||||||
| Business Fin. Corp., Solid Waste Disposal Rev. Bonds (Waste Management, Inc. Project), Series 2004, 0.70% 2029 (put 2026) | 1,460 | 1,436 | ||||||
| Gaming Tax Rev. Bonds, Series 2019-A, 5.00% 2023 | 850 | 924 | ||||||
| Gaming Tax Rev. Ref. Bonds, Series 2015-E, 5.00% 2026 | 500 | 580 | ||||||
| Home Corp., Collateralized Multi Family Housing Bonds (J&A Dev. Portfolio Project I), Series 2021-1, 0.30% 2024 (put 2023) | 230 | 229 | ||||||
| Home Corp., Single Family Mortgage Rev. Bonds, Series 2019-A, 4.00% 2048 | 645 | 700 | ||||||
| 3,869 | ||||||||
| Private Client Services Funds | 19 |
Capital Group Core Municipal Fund
| Bonds, notes & other debt instruments (continued) | Principal amount (000) | Value (000) | ||||||
| Missouri 0.84% | ||||||||
| Health and Educational Facs. Auth., Health Facs. Rev. Bonds (BJC Health System), Series 2021-B, 5.00% 2052 (put 2028) | $ | 2,360 | $ | 2,922 | ||||
| Housing Dev. Commission, Single Family Mortgage Rev. Bonds (First Place Homeownership Loan Program), Series 2016-B, 3.50% 2041 | 1,335 | 1,403 | ||||||
| Housing Dev. Commission, Single Family Mortgage Rev. Bonds (First Place Homeownership Loan Program), Series 2017-B, 3.25% 2047 | 293 | 310 | ||||||
| Housing Dev. Commission, Single Family Mortgage Rev. Bonds (First Place Homeownership Loan Program), Series 2020-A, 3.50% 2050 | 560 | 608 | ||||||
| Housing Dev. Commission, Single Family Mortgage Rev. Bonds (First Place Homeownership Loan Program), Series 2021-A, 3.00% 2052 | 600 | 646 | ||||||
| Housing Dev. Commission, Single Family Mortgage Rev. Bonds (Special Homeownership Loan Program), Series 2015-A, 3.75% 2038 | 100 | 106 | ||||||
| City of St. Louis, Airport Rev. Ref. Bonds (Lambert-St. Louis International Airport), Series 2019-C, 5.00% 2031 | 500 | 628 | ||||||
| 6,623 | ||||||||
| Montana 0.06% | ||||||||
| Board of Housing, Single Family Mortgage Bonds, Series 2016-A-2, 3.50% 2044 | 120 | 126 | ||||||
| Board of Housing, Single Family Mortgage Bonds, Series 2020-C, 3.00% 2050 | 300 | 322 | ||||||
| 448 | ||||||||
| Nebraska 0.70% | ||||||||
| Central Plains Energy Project, Gas Project Rev. Bonds (Project No. 3), Series 2012, 5.00% 2032 (preref. 2022) | 1,190 | 1,236 | ||||||
| Investment Fin. Auth., Single Family Housing Rev. Bonds, Series 2013-A, 3.00% 2043 | 15 | 15 | ||||||
| Investment Fin. Auth., Single Family Housing Rev. Bonds, Series 2014-A, 4.00% 2044 | 110 | 116 | ||||||
| Investment Fin. Auth., Single Family Housing Rev. Bonds, Series 2015-C, 3.50% 2045 | 285 | 296 | ||||||
| Investment Fin. Auth., Single Family Housing Rev. Bonds, Series 2016-C, 3.50% 2046 | 75 | 76 | ||||||
| Investment Fin. Auth., Single Family Housing Rev. Bonds, Series 2018-C, 4.00% 2048 | 1,735 | 1,888 | ||||||
| Investment Fin. Auth., Single Family Housing Rev. Bonds, Series 2018-A, 4.00% 2048 | 640 | 695 | ||||||
| Investment Fin. Auth., Single Family Housing Rev. Bonds, Series 2021-C, 3.00% 2050 | 1,120 | 1,210 | ||||||
| 5,532 | ||||||||
| Nevada 0.67% | ||||||||
| Clark County School Dist., Limited Tax G.O. School Bonds, Series 2015-D, 5.00% 2022 | 500 | 514 | ||||||
| County of Clark, Airport System Rev. Ref. Bonds (McCarran International Airport), Series 2021-A, 5.00% 2033 | 760 | 996 | ||||||
| County of Clark, Las Vegas-McCarran International Airport, Passenger Fac. Charge Rev. Ref. Bonds, Series 2019-E, 5.00% 2029 | 770 | 987 | ||||||
| County of Clark, Pollution Control Rev. Ref. Bonds (Nevada Power Co. Projects), Series 2017, 1.65% 2036 (put 2023) | 1,355 | 1,378 | ||||||
| City of Henderson, Local Improvement Dist. No. T-17 (Madeira Canyon), Limited Obligation Rev. Ref. Bonds, Series 2017, 2.00% 2023 | 435 | 444 | ||||||
| Housing Division, Multi Unit Housing Rev. Bonds (Pinewood Terrace Apartments), Series 2021, 0.26% 2024 (put 2022) | 245 | 245 | ||||||
| Las Vegas Valley Water Dist., Limited Tax G.O. Water Rev. Ref. Bonds, Series 2020-A, 5.00% 2024 | 595 | 666 | ||||||
| County of Washoe, Gas and Water Facs. Rev. Ref. Bonds (Sierra Pacific Power Co. Projects), Series 2016-B, 3.00% 2036 (put 2022) | 10 | 10 | ||||||
| 5,240 | ||||||||
| New Hampshire 0.28% | ||||||||
| Health and Education Facs. Auth., Rev. Bonds (Southern New Hampshire University), Series 2012, 4.00% 2022 (escrowed to maturity) | 575 | 579 | ||||||
| Health and Education Facs. Auth., Rev. Bonds (Southern New Hampshire University), Series 2017, 5.00% 2022 (escrowed to maturity) | 320 | 322 | ||||||
| Health and Education Facs. Auth., Rev. Bonds (University System of New Hampshire Issue), Series 2017-A, 5.00% 2022 | 500 | 516 | ||||||
| Health and Education Facs. Auth., Rev. Bonds (University System of New Hampshire Issue), Series 2017-A, 5.00% 2023 | 600 | 646 | ||||||
| National Fin. Auth., Municipal Certs., Series 2020-1, Class A, 4.125% 2034 | 98 | 115 | ||||||
| 2,178 | ||||||||
| 20 | Private Client Services Funds |
Capital Group Core Municipal Fund
| Bonds, notes & other debt instruments (continued) | Principal amount (000) | Value (000) | ||||||
| New Jersey 0.98% | ||||||||
| Atlantic City, Tax Appeal Rev. Ref. Bonds, Series 2017-A, BAM insured, 5.00% 2022 | $ | 200 | $ | 203 | ||||
| Econ. Dev. Auth., School Facs. Construction Bonds, Series 2021-QQQ, 5.00% 2029 | 500 | 628 | ||||||
| Econ. Dev. Auth., Water Facs. Rev. Ref. Bonds (American Water Co., Inc. Project), Series 2020-A, 1.00% 2023 | 2,025 | 2,045 | ||||||
| Garden State Preservation Trust, Open Space and Farmland Preservation Rev. Ref. Bonds, Series 2012-A, 5.00% 2021 | 200 | 200 | ||||||
| Health Care Facs. Fncg. Auth., Rev. Bonds (RWJ Barnabas Health Obligated Group Issue), Series 2021-A, 5.00% 2033 | 375 | 494 | ||||||
| Housing and Mortgage Fin. Agcy., Single Family Housing Rev. Bonds, Series 2018-A, 4.50% 2048 | 340 | 379 | ||||||
| Housing and Mortgage Fin. Agcy., Single Family Housing Rev. Bonds, Series 2019-C, 4.75% 2050 | 205 | 229 | ||||||
| Tobacco Settlement Fncg. Corp., Tobacco Settlement Bonds, Series 2018-A, 5.00% 2022 | 1,185 | 1,215 | ||||||
| Tobacco Settlement Fncg. Corp., Tobacco Settlement Bonds, Series 2018-A, 5.00% 2023 | 500 | 534 | ||||||
| Tobacco Settlement Fncg. Corp., Tobacco Settlement Bonds, Series 2018-A, 5.00% 2029 | 225 | 276 | ||||||
| Transportation Trust Fund Auth., Transportation System Bonds, Series 2019-A, 5.00% 2028 | 750 | 938 | ||||||
| Turnpike Auth., Turnpike Rev. Bonds, Series 2020-D, 5.00% 2028 | 240 | 283 | ||||||
| Turnpike Auth., Turnpike Rev. Bonds, Series 2014-A, 5.00% 2028 | 230 | 257 | ||||||
| 7,681 | ||||||||
| New Mexico 1.36% | ||||||||
| Albuquerque Municipal School Dist. No. 12, G.O. School Bonds, Series 2021-A, 5.00% 2027 | 400 | 490 | ||||||
| City of Farmington, Pollution Control Rev. Ref. Bonds (Public Service Co. of San Juan and Four Corners Projects), Series 2016-B, 2.15% 2033 | 1,130 | 1,098 | ||||||
| City of Farmington, Pollution Control Rev. Ref. Bonds (Public Service Co. of San Juan Project), Series 2010-D, 1.10% 2040 (put 2023) | 500 | 503 | ||||||
| City of Farmington, Pollution Control Rev. Ref. Bonds (Public Service Co. of San Juan Project), Series 2010-E, 1.15% 2040 (put 2024) | 2,615 | 2,642 | ||||||
| Mortgage Fin. Auth., Single Family Mortgage Program Bonds, Series 2018-B-1, Class I, 4.00% 2049 | 800 | 870 | ||||||
| Mortgage Fin. Auth., Single Family Mortgage Program Bonds, Series 2019-C-1, Class I, 4.00% 2050 | 135 | 148 | ||||||
| Mortgage Fin. Auth., Single Family Mortgage Program Bonds, Series 2019-A-1, Class I, 4.25% 2050 | 2,350 | 2,587 | ||||||
| Mortgage Fin. Auth., Single Family Mortgage Program Bonds, Series 2021-A, Class I, 3.00% 2052 | 865 | 933 | ||||||
| Mortgage Fin. Auth., Single Family Mortgage Program Bonds, Series 2021-C, Class I, 3.00% 2052 | 260 | 281 | ||||||
| Municipal Energy Acquisition Auth., Gas Supply Rev. Ref. and Acquisition Bonds, Series 2019, 5.00% 2039 (put 2025) | 960 | 1,101 | ||||||
| 10,653 | ||||||||
| New York 7.69% | ||||||||
| Build NYC Resource Corp., Rev. Ref. Bonds (Ethical Culture Fieldston School Project), Series 2015, 5.00% 2024 | 395 | 439 | ||||||
| Dormitory Auth., State Personal Income Tax Rev. Bonds (General Purpose), Series 2017-A, 5.00% 2022 | 200 | 203 | ||||||
| Dormitory Auth., State Personal Income Tax Rev. Bonds (General Purpose), Series 2019-A, 5.00% 2028 | 1,000 | 1,247 | ||||||
| Dormitory Auth., State Personal Income Tax Rev. Bonds (General Purpose), Series 2020-A, 5.00% 2030 | 2,000 | 2,597 | ||||||
| Dormitory Auth., State Personal Income Tax Rev. Bonds (General Purpose), Series 2017-B, 5.00% 2030 | 1,500 | 1,839 | ||||||
| Dormitory Auth., State Personal Income Tax Rev. Bonds (General Purpose), Series 2019-D, 5.00% 2030 | 605 | 784 | ||||||
| Dormitory Auth., State Personal Income Tax Rev. Bonds (General Purpose), Series 2020-A-2, 5.00% 2031 | 165 | 214 | ||||||
| Dormitory Auth., State Sales Tax Rev. Bonds, Series 2014-A, 5.00% 2022 | 200 | 204 | ||||||
| Housing Fin. Agcy., Affordable Housing Rev. Green Bonds, Series 2018-H, 2.75% 2022 | 660 | 676 | ||||||
| Housing Fin. Agcy., Affordable Housing Rev. Green Bonds, Series 2019-P, 1.55% 2023 | 705 | 708 | ||||||
| Housing Fin. Agcy., Affordable Housing Rev. Green Bonds, Series 2020-E, 0.85% 2024 | 345 | 345 | ||||||
| Housing Fin. Agcy., Affordable Housing Rev. Green Bonds, Series 2020-L-2, 0.75% 2025 | 1,500 | 1,501 | ||||||
| Housing Fin. Agcy., Affordable Housing Rev. Green Bonds, Series 2020-M-2, 0.75% 2025 | 275 | 275 | ||||||
| Housing Fin. Agcy., Affordable Housing Rev. Green Bonds, Series 2021-D-2, 0.65% 2056 (put 2025) | 690 | 688 | ||||||
| Housing Fin. Agcy., Affordable Housing Rev. Green Bonds, Series 2021-I-2, 0.70% 2056 (put 2025) | 380 | 379 | ||||||
| Liberty Dev. Corp., Liberty Rev. Ref. Green Bonds (4 World Trade Center Project), Series 2021-A, 1.70% 2030 | 410 | 403 | ||||||
| Liberty Dev. Corp., Liberty Rev. Ref. Green Bonds (4 World Trade Center Project), Series 2021-A, 1.90% 2031 | 195 | 193 | ||||||
| Long Island Power Auth., Electric System General Rev. Bonds, Series 2014-C, (1-month USD-LIBOR x 0.70 + 0.75%) 0.807% 2033 (put 2023)2 | 1,000 | 1,003 | ||||||
| Long Island Power Auth., Electric System General Rev. Bonds, Series 2015-C, (1-month USD-LIBOR x 0.70 + 0.75%) 0.807% 2033 (put 2023)2 | 840 | 843 | ||||||
| Metropolitan Transportation Auth., Transportation Rev. Bonds, Series 2014-C, 5.00% 2023 | 375 | 409 | ||||||
| Metropolitan Transportation Auth., Transportation Rev. Bonds, Series 2012-C, 5.00% 2032 (preref. 2022) | 1,000 | 1,050 | ||||||
| Metropolitan Transportation Auth., Transportation Rev. Bonds, Series 2014-D-2, (SIFMA Municipal Swap Index + 0.45%) 0.50% 2044 (put 2022)2 | 750 | 751 | ||||||
| Metropolitan Transportation Auth., Transportation Rev. Bonds, Series 2015-A-2, 5.00% 2045 (put 2030) | 2,180 | 2,757 | ||||||
| Private Client Services Funds | 21 |
Capital Group Core Municipal Fund
| Bonds, notes & other debt instruments (continued) | Principal amount (000) | Value (000) | ||||||
| New York (continued) | ||||||||
| Metropolitan Transportation Auth., Transportation Rev. Bonds, Series 2012-C, 5.00% 2047 (preref. 2022) | $ | 1,100 | $ | 1,155 | ||||
| Metropolitan Transportation Auth., Transportation Rev. Ref. Bonds, Series 2002-D-2-B, Assured Guaranty Municipal insured, (USD-SOFR x 0.67 + 0.55%) 0.583% 2032 (put 2024)2 | 880 | 883 | ||||||
| Metropolitan Transportation Auth., Transportation Rev. Ref. Bonds, Series 2002-D-2-A-2, Assured Guaranty Municipal insured, (USD-SOFR x 0.67 + 0.80%) 0.833% 2032 (put 2026)2 | 315 | 319 | ||||||
| Metropolitan Transportation Auth., Transportation Rev. Ref. Green Bonds, Series 2017-B, 5.00% 2023 | 1,000 | 1,092 | ||||||
| Metropolitan Transportation Auth., Transportation Rev. Ref. Green Bonds, Series 2017-C-1, 5.00% 2023 | 305 | 333 | ||||||
| Metropolitan Transportation Auth., Transportation Rev. Ref. Green Bonds, Series 2017-C-1, 5.00% 2024 | 165 | 187 | ||||||
| Metropolitan Transportation Auth., Transportation Rev. Ref. Green Bonds, Series 2017-C-1, 5.00% 2027 | 535 | 651 | ||||||
| Mortgage Agcy., Homeowner Mortgage Rev. Bonds, Series 197, 3.50% 2044 | 1,015 | 1,075 | ||||||
| Mortgage Agcy., Homeowner Mortgage Rev. Bonds, Series 233, 3.00% 2045 | 1,465 | 1,579 | ||||||
| Mortgage Agcy., Homeowner Mortgage Rev. Bonds, Series 203, 3.50% 2047 | 965 | 1,024 | ||||||
| Mortgage Agcy., Homeowner Mortgage Rev. Bonds, Series 213, 4.25% 2047 | 750 | 820 | ||||||
| New York City G.O. Bonds, Series 2020-C-1, 5.00% 2028 | 2,000 | 2,519 | ||||||
| New York City G.O. Bonds, Series 2018-A, 5.00% 2028 | 565 | 693 | ||||||
| New York City G.O. Bonds, Series 2020-C-1, 5.00% 2030 | 2,350 | 3,066 | ||||||
| New York City G.O. Bonds, Series 2018-E-1, 5.00% 2031 | 1,635 | 2,018 | ||||||
| New York City G.O. Bonds, Series 2020-C-1, 5.00% 2032 | 1,750 | 2,252 | ||||||
| New York City G.O. Bonds, Series 2021-A-1, 5.00% 2032 | 1,435 | 1,885 | ||||||
| New York City G.O. Bonds, Series 2008-L-5, 5.00% 2032 | 100 | 131 | ||||||
| New York City G.O. Bonds, Series 2021-A-1, 5.00% 2033 | 370 | 485 | ||||||
| New York City G.O. Bonds, Series 2015-F-4, 5.00% 2044 (put 2025) | 290 | 334 | ||||||
| New York City Health and Hospitals Corp., Health System Bonds, Series 2020-A, 5.00% 2024 | 375 | 414 | ||||||
| New York City Housing Dev. Corp., Multi Family Housing Rev. Bonds (8 Spruce Street), Series 2014-E, 3.50% 2048 | 320 | 330 | ||||||
| New York City Housing Dev. Corp., Multi Family Housing Rev. Bonds (Sustainable Dev. Bonds), Series 2017-C-3-A, 0.20% 2022 | 160 | 160 | ||||||
| New York City Housing Dev. Corp., Multi Family Housing Rev. Bonds (Sustainable Dev. Bonds), Series 2016-C-2, 0.23% 2050 (put 2022) | 190 | 190 | ||||||
| New York City Housing Dev. Corp., Multi Family Housing Rev. Bonds (Sustainable Dev. Bonds), Series 2021-C-2, 0.70% 2060 (put 2025) | 325 | 326 | ||||||
| New York City Housing Dev. Corp., Multi Family Housing Rev. Bonds (Sustainable Neighborhood Bonds), Series 2017-G-2-A, 2.00% 2057 (put 2021) | 275 | 276 | ||||||
| New York City Housing Dev. Corp., Multi Family Housing Rev. Bonds (Sustainable Neighborhood Bonds), Series 2020-I-2, 0.70% 2060 (put 2025) | 700 | 701 | ||||||
| New York City Housing Dev. Corp., Multi Family Housing Rev. Green Bonds, Series 2021-F-2, 0.60% 2061 (put 2025) | 835 | 830 | ||||||
| New York City Municipal Water Fin. Auth., Water and Sewer System Second General Resolution Rev. Bonds, Series 2021-DD, 5.00% 2029 | 465 | 599 | ||||||
| New York City Transitional Fin. Auth., Future Tax Secured Bonds, Series 2020-A-1, 5.00% 2022 | 35 | 36 | ||||||
| New York City Transitional Fin. Auth., Future Tax Secured Bonds, Series 2021-E-1, 5.00% 2023 | 65 | 69 | ||||||
| New York City Transitional Fin. Auth., Future Tax Secured Bonds, Series 2021-F-1, 5.00% 2024 | 1,025 | 1,166 | ||||||
| New York City Transitional Fin. Auth., Future Tax Secured Bonds, Series 2021-A-1, 5.00% 2030 | 355 | 467 | ||||||
| New York City Transitional Fin. Auth., Future Tax Secured Bonds, Series 2020-C-1, 5.00% 2031 | 760 | 993 | ||||||
| New York City Transitional Fin. Auth., Future Tax Secured Bonds, Series 2021-A-1, 5.00% 2031 | 195 | 261 | ||||||
| New York City Transitional Fin. Auth., Future Tax Secured Bonds, Series 2021-A-1, 5.00% 2032 | 910 | 1,208 | ||||||
| New York City Transitional Fin. Auth., Future Tax Secured Bonds, Series 2020-C-1, 5.00% 2032 | 110 | 143 | ||||||
| New York City Transitional Fin. Auth., Future Tax Secured Bonds, Series 2021-B-1, 5.00% 2034 | 1,390 | 1,825 | ||||||
| Town of Oyster Bay, Public Improvement Rev. Ref. Bonds, Series 2021, 2.00% 2022 | 150 | 151 | ||||||
| Town of Oyster Bay, Public Improvement Rev. Ref. Bonds, Series 2021, 4.00% 2023 | 140 | 147 | ||||||
| Public Housing Capital Fund Rev. Trust I, Trust Certs., Series 2012, 4.50% 20223 | 63 | 63 | ||||||
| County of Suffolk, Econ. Dev. Corp., Rev. Ref. Bonds (Peconic Landing at Southold, Inc. Project), Series 2010, 3.125% 2025 | 225 | 238 | ||||||
| Thruway Auth., Personal Income Tax Rev. Bonds, Series 2021-A-1, 5.00% 2033 | 1,000 | 1,299 | ||||||
| City of Troy, Capital Resource Corp., Rev. Ref. Bonds (Rensselaer Polytechnic Institute Project), Series 2020-A, 5.00% 2030 | 155 | 199 | ||||||
| Urban Dev. Corp., State Personal Income Tax Rev. Bonds (General Purpose), Series 2020-C, 5.00% 2028 | 295 | 369 | ||||||
| Urban Dev. Corp., State Personal Income Tax Rev. Bonds (General Purpose), Series 2020-C, 5.00% 2032 | 2,000 | 2,584 | ||||||
| Urban Dev. Corp., State Personal Income Tax Rev. Bonds (General Purpose), Series 2020-C, 5.00% 2033 | 1,275 | 1,642 | ||||||
| Utility Debt Securitization Auth., Restructuring Bonds, Series 2017, 5.00% 2025 | 130 | 143 | ||||||
| County of Westchester, Industrial Dev. Agcy., Multi Family Housing Rev. Bonds (Marble Hall - Tuckahoe LP Project), Series 2021, 0.28% 2024 (put 2023) | 1,550 | 1,548 | ||||||
| 60,386 | ||||||||
| 22 | Private Client Services Funds |
Capital Group Core Municipal Fund
| Bonds, notes & other debt instruments (continued) | Principal amount (000) | Value (000) | ||||||
| North Carolina 1.82% | ||||||||
| City of Burlington, Housing Auth., Multi Family Housing Rev. Bonds (Thetford Portfolio), Series 2021, 0.30% 2024 (put 2022) | $ | 1,130 | $ | 1,129 | ||||
| City of Durham, Housing Auth., Multi Family Housing Rev. Bonds (JJ Henderson Apartments Project), Series 2020, 0.30% 2024 (put 2023) | 80 | 80 | ||||||
| City of Goldsboro, Multi Family Housing Rev. Bonds (Grand at Day Point), Series 2021, 0.28% 2024 (put 2023) | 1,725 | 1,722 | ||||||
| Hospital Auth., Health Care Rev. Bonds (Charlotte-Mecklenburg Hospital), Series 2021-D, 5.00% 2049 (put 2031) | 1,170 | 1,561 | ||||||
| Hospital Auth., Health Care Rev. Bonds (Charlotte-Mecklenburg Hospital), Series 2021-C, 5.00% 2050 (put 2028) | 585 | 744 | ||||||
| Housing Fin. Agcy., Home Ownership Rev. Bonds, Series 40, 4.25% 2047 | 890 | 971 | ||||||
| Housing Fin. Agcy., Home Ownership Rev. Ref. Bonds, Series 38-B, 4.00% 2047 | 995 | 1,066 | ||||||
| Housing Fin. Agcy., Home Ownership Rev. Ref. Bonds, Series 44, 4.00% 2050 | 315 | 348 | ||||||
| Housing Fin. Agcy., Multi Family Housing Rev. Bonds (Winds Crest Senior Living, LP), Series 2021, 0.36% 2024 (put 2023) | 405 | 405 | ||||||
| Raleigh-Durham Airport Auth., Airport Rev. Ref. Bonds, Series 2020-B, 5.00% 2022 | 1,705 | 1,746 | ||||||
| University of North Carolina at Chapel Hill, General Rev. Bonds, Series 2012-B, (1-month USD-LIBOR x 0.67 + 0.40%) 0.455% 2041 (put 2022)2 | 1,480 | 1,482 | ||||||
| University of North Carolina at Charlotte, General Rev. Ref. Bonds, Series 2017-A, 5.00% 2023 | 1,000 | 1,091 | ||||||
| County of Wake, G.O. Rev. Ref. Bonds, Series 2020-A, 5.00% 2022 | 1,190 | 1,214 | ||||||
| County of Wake, Limited Obligation Bonds, Series 2021, 5.00% 2023 | 675 | 718 | ||||||
| 14,277 | ||||||||
| North Dakota 0.46% | ||||||||
| County of Cass, Joint Water Resource Dist., Temporary Rev. Ref. Improvement Bonds, Series 2021-A, 0.48% 2024 | 800 | 801 | ||||||
| City of Grand Forks, Health Care System Rev. Bonds, Series 2021, 5.00% 2030 | 280 | 358 | ||||||
| Housing Fin. Agcy., Homeownership Rev. Bonds (Home Mortgage Fin. Program), Series 2016-D, 3.50% 2046 | 965 | 1,023 | ||||||
| Housing Fin. Agcy., Housing Fin. Program Bonds (Home Mortgage Fin. Program), Series 2015-B, 4.00% 2036 | 210 | 219 | ||||||
| Housing Fin. Agcy., Housing Fin. Program Bonds (Home Mortgage Fin. Program), Series 2017-D, 4.00% 2048 | 305 | 327 | ||||||
| Housing Fin. Agcy., Housing Fin. Program Bonds (Home Mortgage Fin. Program), Series 2017-F, 4.00% 2048 | 230 | 247 | ||||||
| Housing Fin. Agcy., Housing Fin. Program Bonds (Home Mortgage Fin. Program), Series 2019-A, 4.25% 2049 | 170 | 186 | ||||||
| Housing Fin. Agcy., Housing Fin. Program Bonds (Home Mortgage Fin. Program), Series 2021-A, 3.00% 2052 | 440 | 475 | ||||||
| 3,636 | ||||||||
| Ohio 2.68% | ||||||||
| Air Quality Dev. Auth., Air Quality Rev. Bonds (Ohio Valley Electric Corp. Project), Series 2009-B, 1.375% 2026 (put 2024) | 200 | 199 | ||||||
| Air Quality Dev. Auth., Air Quality Rev. Bonds (Ohio Valley Electric Corp. Project), Series 2009-C, 1.50% 2026 (put 2025) | 50 | 50 | ||||||
| Akron, Bath and Copley Joint Township Hospital Dist., Hospital Facs. Rev. Ref. Bonds (Summa Health Obligated Group), Series 2020, 5.00% 2028 | 680 | 845 | ||||||
| Akron, Bath and Copley Joint Township Hospital Dist., Hospital Facs. Rev. Ref. Bonds (Summa Health Obligated Group), Series 2020, 5.00% 2030 | 350 | 449 | ||||||
| County of Allen, Hospital Facs. Rev. Bonds (Bon Secours Mercy Health, Inc.), Series 2020-A, 5.00% 2027 | 1,500 | 1,855 | ||||||
| County of Allen, Hospital Facs. Rev. Bonds (Bon Secours Mercy Health, Inc.), Series 2020-A, 5.00% 2030 | 400 | 517 | ||||||
| County of Allen, Hospital Facs. Rev. Bonds (Mercy Health), Series 2017-A, 5.00% 2022 | 810 | 839 | ||||||
| County of Allen, Hospital Facs. Rev. Bonds (Mercy Health), Series 2017-A, 5.00% 2027 | 570 | 699 | ||||||
| County of Allen, Hospital Facs. Rev. Bonds (Mercy Health), Series 2017-B, 5.00% 2047 (put 2022) | 575 | 588 | ||||||
| Capital Facs. Lease Appropriation Bonds, Series 2021-A, 5.00% 2029 | 180 | 228 | ||||||
| Capital Facs. Lease Appropriation Bonds, Series 2021-A, 5.00% 2030 | 115 | 149 | ||||||
| City of Cleveland, Airport System Rev. Ref. Bonds, Series 2012-A, 5.00% 2025 | 1,000 | 1,008 | ||||||
| City of Dayton, Metropolitan Housing Auth., Multi Family Housing Rev. Bonds (Southern Montgomery Apartments Project), Series 2021-A, 0.32% 2024 (put 2023) | 200 | 200 | ||||||
| G.O. Common Schools Rev. Ref. Bonds, Series 2021-B, 5.00% 2028 | 685 | 867 | ||||||
| G.O. Conservation Projects Bonds, Series 2019-A, 2.00% 2022 | 65 | 65 | ||||||
| G.O. Infrastructure Improvement Bonds, Series 2021-A, 5.00% 2030 | 190 | 247 | ||||||
| County of Hamilton, Hospital Facs. Rev. Bonds (UC Health), Series 2014, 5.00% 2025 | 400 | 439 | ||||||
| Hospital Rev. Ref. Bonds (Cleveland Clinic Health System Obligated Group), Series 2021-B, 5.00% 2029 | 1,000 | 1,269 | ||||||
| Hospital Rev. Ref. Bonds (Cleveland Clinic Health System Obligated Group), Series 2021-B, 5.00% 2030 | 280 | 362 | ||||||
| Housing Fin. Agcy., Multi Family Housing Rev. Bonds (Chevybrook Estates Apartments Project), Series 2021, 0.35% 2024 (put 2023) | 200 | 200 | ||||||
| Housing Fin. Agcy., Multi Family Housing Rev. Bonds (Franklin Manor North Project), Series 2021, 0.25% 2024 (put 2023) | 440 | 439 | ||||||
| Private Client Services Funds | 23 |
Capital Group Core Municipal Fund
| Bonds, notes & other debt instruments (continued) | Principal amount (000) | Value (000) | ||||||
| Ohio (continued) | ||||||||
| Housing Fin. Agcy., Multi Family Housing Rev. Bonds (Glen Meadows Apartments Project), Series 2021-A, 0.40% 2024 (put 2023) | $ | 305 | $ | 305 | ||||
| Housing Fin. Agcy., Multi Family Housing Rev. Bonds (Pinzone Tower Apartments Project), Series 2021, 0.28% 2023 (put 2022) | 655 | 654 | ||||||
| Housing Fin. Agcy., Residential Mortgage Rev. Bonds (Mortgage-Backed Securities Program), Series 2017-D, 4.00% 2048 | 320 | 344 | ||||||
| Housing Fin. Agcy., Residential Mortgage Rev. Bonds (Mortgage-Backed Securities Program), Series 2019-A, 4.50% 2049 | 620 | 687 | ||||||
| Housing Fin. Agcy., Residential Mortgage Rev. Bonds (Mortgage-Backed Securities Program), Series 2020-A, 3.75% 2050 | 620 | 680 | ||||||
| Housing Fin. Agcy., Residential Mortgage Rev. Bonds (Mortgage-Backed Securities Program), Series 2021-C, 3.25% 2051 | 860 | 940 | ||||||
| Madison Local School Dist., School Improvement Rev. Ref. Bonds, Series 2014, 5.25% 2037 (preref. 2022) | 1,095 | 1,127 | ||||||
| Major New State Infrastructure Project Rev. Bonds, Series 2019-1, 5.00% 2028 | 700 | 891 | ||||||
| Major New State Infrastructure Project Rev. Bonds, Series 2019-1, 5.00% 2029 | 300 | 389 | ||||||
| County of Montgomery, Hospital Facs. Rev. Bonds (Dayton Children’s Hospital), Series 2021, 5.00% 2030 | 75 | 97 | ||||||
| North East Ohio Regional Sewer Dist., Wastewater Improvement Rev. and Rev. Ref. Bonds, Series 2014, 5.00% 2044 (preref. 2024) | 1,000 | 1,140 | ||||||
| Public Facs. Commission, Higher Education G.O. Bonds, Series 2015-C, 5.00% 2028 | 1,000 | 1,153 | ||||||
| Rev. Bonds (Premier Health Partners Obligated Group), Series 2020, 5.00% 2033 | 85 | 106 | ||||||
| Turnpike and Infrastructure Commission, Rev. Bonds, Series 2013-A-1, 5.00% 2025 | 115 | 122 | ||||||
| Water Dev. Auth., Water Dev. Rev. Bonds, Series 2013-A, 5.00% 2023 | 155 | 167 | ||||||
| Water Dev. Auth., Water Pollution Control Loan Fund Rev. Bonds, Series 2019-A, 5.00% 2029 | 130 | 166 | ||||||
| Water Dev. Auth., Water Pollution Control Loan Fund Rev. Bonds, Series 2020-A, 5.00% 2032 | 455 | 590 | ||||||
| 21,072 | ||||||||
| Oklahoma 0.20% | ||||||||
| Capital Improvement Auth., State Highways Capital Improvement Rev. Ref. Bonds (Oklahoma Dept. of Transportation Project), Series 2020-A, 5.00% 2023 | 595 | 642 | ||||||
| Housing Fin. Agcy., Collateralized Rev. Bonds (Deer Park & Apple Run Apartments), Series 2019, 1.60% 2022 | 750 | 752 | ||||||
| Board of Regents of Oklahoma State University, General Rev. Ref. Bonds, Series 2020-A, 5.00% 2032 | 120 | 156 | ||||||
| 1,550 | ||||||||
| Oregon 0.91% | ||||||||
| County of Deschutes, Deschutes Public Library Dist., G.O. Bonds, Series 2021, 4.00% 2029 | 225 | 272 | ||||||
| County of Deschutes, Deschutes Public Library Dist., G.O. Bonds, Series 2021, 4.00% 2030 | 265 | 324 | ||||||
| Facs. Auth., Rev. Bonds (University of Portland Projects), Series 2015-A, 5.00% 2031 | 600 | 679 | ||||||
| G.O. Bonds (Veteran’s Welfare Bonds Series 108), Series 2021-O, 3.00% 2051 | 2,095 | 2,274 | ||||||
| G.O. Bonds (Veteran’s Welfare Bonds Series 99B), Series 2020, 3.50% 2050 | 280 | 305 | ||||||
| Housing and Community Services Dept., Housing Dev. Rev. Bonds (The Susan Emmons Apartments Project), Series 2021-S-2, 0.38% 2024 (put 2023) | 460 | 459 | ||||||
| Housing and Community Services Dept., Housing Dev. Rev. Bonds (Westwind Apartments Project), Series 2021-H, 0.25% 2024 (put 2023) | 175 | 175 | ||||||
| Housing and Community Services Dept., Mortgage Rev. Bonds (Single Family Mortgage Program), Series 2017-A, 4.00% 2047 | 685 | 732 | ||||||
| Housing and Community Services Dept., Mortgage Rev. Bonds (Single Family Mortgage Program), Series 2016-A, 4.00% 2047 | 400 | 423 | ||||||
| Housing and Community Services Dept., Mortgage Rev. Bonds (Single Family Mortgage Program), Series 2018-A, 4.50% 2049 | 135 | 146 | ||||||
| Housing and Community Services Dept., Mortgage Rev. Bonds (Single Family Mortgage Program), Series 2020-C, 3.00% 2052 | 1,235 | 1,326 | ||||||
| 7,115 | ||||||||
| Pennsylvania 2.76% | ||||||||
| County of Allegheny, Airport Auth., Airport Rev. Bonds, Series 2013-A, 5.00% 2022 | 400 | 406 | ||||||
| County of Allegheny, Hospital Dev. Auth., UPMC Rev. Bonds, Series 2019-A, 5.00% 2022 | 1,000 | 1,033 | ||||||
| County of Allegheny, Sanitary Auth., Sewer Rev. Bonds, Series 2020-A, 5.00% 2026 | 500 | 595 | ||||||
| County of Berks, G.O. Bonds, Series 2015, 4.00% 2027 (preref. 2023) | 35 | 38 | ||||||
| Bethlehem Area School Dist. Auth., School Rev. Bonds (Bethlehem Area School Dist. Ref. Project), Series 2021-C, (USD-SOFR x 0.67 + 0.35%) 0.384% 2030 (put 2025)2 | 195 | 195 | ||||||
| 24 | Private Client Services Funds |
Capital Group Core Municipal Fund
| Bonds, notes & other debt instruments (continued) | Principal amount (000) | Value (000) | ||||||
| Pennsylvania (continued) | ||||||||
| Bethlehem Area School Dist. Auth., School Rev. Bonds (Bethlehem Area School Dist. Ref. Project), Series 2021-B, (USD-SOFR x 0.67 + 0.35%) 0.384% 2031 (put 2025)2 | $ | 265 | $ | 265 | ||||
| Bethlehem Area School Dist. Auth., School Rev. Bonds (Bethlehem Area School Dist. Ref. Project), Series 2021-C, (USD-SOFR x 0.67 + 0.35%) 0.384% 2032 (put 2025)2 | 205 | 205 | ||||||
| Cumberland Valley School Dist., G.O. Bonds, Series 2015, 5.00% 2032 (preref. 2023) | 150 | 164 | ||||||
| Cumberland Valley School Dist., G.O. Bonds, Series 2015, 5.00% 2034 (preref. 2023) | 130 | 143 | ||||||
| Econ. Dev. Fncg. Auth., Solid Waste Disposal Rev. Bonds (Waste Management, Inc. Project), Series 2004-A, 2.15% 2021 | 200 | 200 | ||||||
| Econ. Dev. Fncg. Auth., UPMC Rev. Bonds, Series 2021-A, 5.00% 2028 | 1,500 | 1,885 | ||||||
| Fncg. Auth., Rev. Bonds, Series 2013-A-2, 5.00% 2027 (preref. 2022) | 500 | 514 | ||||||
| Fncg. Auth., Rev. Bonds, Series 2013-A-2, 5.00% 2042 (preref. 2022) | 580 | 596 | ||||||
| G.O. Bonds, Series 2011-1, 5.00% 2025 (preref. 2021) | 700 | 701 | ||||||
| General Auth. of Southcentral Pennsylvania, Rev. Bonds (Wellspan Health Obligated Group), Series 2019-B, (SIFMA Municipal Swap Index + 0.60%) 0.65% 2049 (put 2024)2 | 455 | 458 | ||||||
| Housing Fin. Agcy., Single Family Mortgage Rev. Bonds, Series 2017-122, 4.00% 2046 | 1,005 | 1,073 | ||||||
| Housing Fin. Agcy., Single Family Mortgage Rev. Bonds, Series 2020-133, 3.00% 2050 | 1,000 | 1,072 | ||||||
| Housing Fin. Agcy., Single Family Mortgage Rev. Bonds, Series 2021-135-A, 3.00% 2051 | 220 | 235 | ||||||
| Housing Fin. Agcy., Special Limited Obligation, Multi Family Housing Dev. Bonds (Harrison Senior Tower), Series 2021, 0.25% 2024 (put 2023) | 1,030 | 1,026 | ||||||
| Housing Fin. Agcy., Special Limited Obligation, Multi Family Housing Dev. Bonds (School of Nursing), Series 2021, 0.27% 2024 (put 2023) | 330 | 329 | ||||||
| County of Lehigh, General Purpose Auth., Rev. Bonds (The Good Shepherd Group), Series 2021-A, 4.00% 2023 | 95 | 102 | ||||||
| County of Montgomery, Higher Education and Health Auth., Hospital Rev. Bonds (Abington Memorial Hospital Obligated Group), Series 2012-A, 5.00% 2031 (preref. 2022) | 350 | 360 | ||||||
| County of Montgomery, Higher Education and Health Auth., Rev. Bonds (Thomas Jefferson University), Series 2018-C, 0.77% 2051 (put 2023)2 | 400 | 400 | ||||||
| County of Montgomery, Industrial Dev. Auth., Rev. Bonds (Foulkeways at Gwynedd Project), Series 2016, 5.00% 2026 | 400 | 455 | ||||||
| County of Montgomery, Industrial Dev. Auth., Rev. Bonds (Waverly Heights Ltd.), Series 2019, 4.00% 2021 | 100 | 100 | ||||||
| County of Montgomery, Industrial Dev. Auth., Rev. Bonds (Waverly Heights Ltd.), Series 2019, 4.00% 2023 | 125 | 134 | ||||||
| County of Northampton, General Purpose Auth., Hospital Rev. Bonds (St. Luke’s University Health Network Project), Series 2018-B, (1-month USD-LIBOR x 0.70 + 1.04%) 1.097% 2048 (put 2022)2 | 175 | 176 | ||||||
| Philadelphia School Dist., G.O. Bonds, Series 2019-A, 5.00% 2022 | 1,050 | 1,092 | ||||||
| Philadelphia School Dist., G.O. Bonds, Series 2016-F, 5.00% 2025 | 415 | 483 | ||||||
| Philadelphia School Dist., G.O. Bonds, Series 2021-A, 5.00% 2030 | 260 | 334 | ||||||
| Philadelphia School Dist., G.O. Bonds, Series 2021-A, 5.00% 2031 | 125 | 163 | ||||||
| Philadelphia School Dist., G.O. Rev. Ref. Bonds, Series 2016-F, 5.00% 2023 | 1,500 | 1,628 | ||||||
| Scranton School Dist., G.O. Bonds, Series 2017-E, BAM insured, 5.00% 2026 | 1,000 | 1,198 | ||||||
| Turnpike Commission, Turnpike Rev. Bonds, Series 2011-E, 5.00% 2042 (preref. 2022) | 575 | 605 | ||||||
| Turnpike Commission, Turnpike Rev. Bonds, Series 2011-E, 5.00% 2029 (preref. 2021) | 1,315 | 1,320 | ||||||
| Turnpike Commission, Turnpike Rev. Bonds, Series 2011-E, 5.00% 2030 (preref. 2021) | 335 | 336 | ||||||
| Turnpike Commission, Turnpike Rev. Bonds, Series 2021-B, 5.00% 2030 | 165 | 216 | ||||||
| Turnpike Commission, Turnpike Rev. Bonds, Series 2021-B, 5.00% 2031 | 295 | 387 | ||||||
| Turnpike Commission, Turnpike Rev. Bonds (Motor License Fund), Series 2012-A, 5.00% 2026 (preref. 2021) | 1,000 | 1,004 | ||||||
| 21,626 | ||||||||
| Rhode Island 0.30% | ||||||||
| Commerce Corp., Grant Anticipation Rev. Ref. Bonds (Dept. of Transportation), Series 2016-A, 5.00% 2023 | 500 | 538 | ||||||
| Housing and Mortgage Fin. Corp., Homeownership Opportunity Bonds, Series 75-A, 3.00% 2051 | 1,530 | 1,655 | ||||||
| Housing and Mortgage Fin. Corp., Multi Family Dev. Bonds, Series 2021-A-1, 0.45% 2040 (put 2023) | 195 | 195 | ||||||
| 2,388 | ||||||||
| South Carolina 1.18% | ||||||||
| County of Charleston, G.O. Capital Improvement Transportation Sales Tax Bonds, Series 2011, 5.00% 2024 (preref. 2021) | 515 | 515 | ||||||
| City of Columbia, Housing Auth., Multi Family Housing Rev. Bonds (Palmetto Terrace Apartments Project), Series 2021, 0.31% 2024 (put 2023) | 460 | 459 | ||||||
| City of Columbia, Waterworks and Sewer System Rev. Bonds, Series 2019-A, 5.00% 2028 | 100 | 125 | ||||||
| City of Columbia, Waterworks and Sewer System Rev. Bonds, Series 2013, 5.00% 2043 (preref. 2023) | 1,000 | 1,060 | ||||||
| Housing Fin. and Dev. Auth., Mortgage Rev. Bonds, Series 2017-A, 4.00% 2047 | 365 | 387 | ||||||
| Private Client Services Funds | 25 |
Capital Group Core Municipal Fund
| Bonds, notes & other debt instruments (continued) | Principal amount (000) | Value (000) | ||||||
| South Carolina (continued) | ||||||||
| Housing Fin. and Dev. Auth., Mortgage Rev. Bonds, Series 2017-B, 4.00% 2047 | $ | 95 | $ | 102 | ||||
| Housing Fin. and Dev. Auth., Mortgage Rev. Bonds, Series 2020-A, 4.00% 2050 | 755 | 837 | ||||||
| Housing Fin. and Dev. Auth., Mortgage Rev. Bonds, Series 2021-A, 3.00% 2052 | 645 | 699 | ||||||
| Housing Fin. and Dev. Auth., Mortgage Rev. Ref. Bonds, Series 2016-A, 4.00% 2036 | 510 | 546 | ||||||
| Lexington County Health Services Dist., Inc., Hospital Rev. Ref. Bonds, Series 2017, 5.00% 2022 | 600 | 628 | ||||||
| Lexington County Health Services Dist., Inc., Hospital Rev. Ref. Bonds, Series 2017, 5.00% 2024 | 500 | 566 | ||||||
| Patriots Energy Group Fncg. Agcy., Gas Supply Rev. Bonds, Series 2018-A, 4.00% 2048 (put 2024) | 180 | 193 | ||||||
| Public Service Auth., Improvement Rev. Obligations, Series 2021-B, 5.00% 2029 | 520 | 666 | ||||||
| Public Service Auth., Rev. Obligations (Santee Cooper), Series 2014-C, 5.00% 2021 | 500 | 502 | ||||||
| Public Service Auth., Rev. Obligations (Santee Cooper), Series 2014-C, 5.00% 2022 | 350 | 368 | ||||||
| Public Service Auth., Rev. Obligations (Santee Cooper), Series 2014-C, 5.00% 2023 | 125 | 137 | ||||||
| Public Service Auth., Rev. Obligations (Santee Cooper), Series 2012-D, 5.00% 2028 | 510 | 524 | ||||||
| Public Service Auth., Rev. Obligations (Santee Cooper), Series 2012-D, 5.00% 2028 (preref. 2022) | 490 | 504 | ||||||
| Public Service Auth., Rev. Obligations (Santee Cooper), Series 2011-C, 5.00% 2036 | 340 | 341 | ||||||
| Public Service Auth., Rev. Ref. Obligations (Santee Cooper), Series 2015-A, 5.00% 2028 | 100 | 114 | ||||||
| 9,273 | ||||||||
| South Dakota 1.04% | ||||||||
| Housing Dev. Auth., Homeownership Mortgage Bonds, Series 2014-E, 4.00% 2044 | 550 | 575 | ||||||
| Housing Dev. Auth., Homeownership Mortgage Bonds, Series 2016-D, 3.50% 2046 | 830 | 878 | ||||||
| Housing Dev. Auth., Homeownership Mortgage Bonds, Series 2017-B, 4.00% 2047 | 1,175 | 1,263 | ||||||
| Housing Dev. Auth., Homeownership Mortgage Bonds, Series 2018-B, 4.50% 2048 | 1,440 | 1,593 | ||||||
| Housing Dev. Auth., Homeownership Mortgage Bonds, Series 2019-B, 4.00% 2049 | 315 | 344 | ||||||
| Housing Dev. Auth., Homeownership Mortgage Bonds, Series 2021-B, 3.00% 2051 | 2,255 | 2,433 | ||||||
| Housing Dev. Auth., Homeownership Mortgage Bonds, Series 2020-C, 3.50% 2051 | 975 | 1,064 | ||||||
| 8,150 | ||||||||
| Tennessee 0.66% | ||||||||
| Town of Greeneville, Health and Educational Facs. Board, Multi Family Housing Rev. Bonds (People RD Portfolio Project), Series 2019, 1.45% 2022 (put 2021) | 20 | 20 | ||||||
| Housing Dev. Agcy., Homeownership Program Bonds, Series 2012-1-C, 4.50% 2037 | 30 | 30 | ||||||
| Housing Dev. Agcy., Homeownership Program Bonds, Series 2012-2-C, 4.00% 2038 | 25 | 25 | ||||||
| Housing Dev. Agcy., Residential Fin. Program Bonds, Series 2017-1, 4.00% 2042 | 470 | 504 | ||||||
| Housing Dev. Agcy., Residential Fin. Program Bonds, Series 2017-2-B, 4.00% 2042 | 465 | 500 | ||||||
| Housing Dev. Agcy., Residential Fin. Program Bonds, Series 2015-2-A, 4.00% 2046 | 460 | 488 | ||||||
| Housing Dev. Agcy., Residential Fin. Program Bonds, Series 2020-3-A, 3.50% 2050 | 110 | 120 | ||||||
| Housing Dev. Agcy., Residential Fin. Program Bonds, Series 2015-2-A, 3.75% 2050 | 450 | 493 | ||||||
| Housing Dev. Agcy., Residential Fin. Program Bonds, Series 2019-1, 4.25% 2050 | 835 | 913 | ||||||
| City of Knoxville, Community Dev. Corp., Collateralized Multi Family Housing Bonds (Austin 1B Apartments Project), Series 2021, 0.22% 2024 (put 2023) | 155 | 154 | ||||||
| Metropolitan Government of Nashville and Davidson County, Health and Educational Facs. Board, Rev. Bonds (Vanderbilt University Medical Center), Series 2021-A, 5.00% 2031 | 355 | 455 | ||||||
| Metropolitan Government of Nashville and Davidson County, Water & Sewer Rev. Green Bonds, Series 2021-A, 5.00% 2030 | 145 | 189 | ||||||
| Tennessee Energy Acquisition Corp., Commodity Project Rev. Bonds, Series 2021-A, 5.00% 2052 (put 2031) | 1,000 | 1,291 | ||||||
| 5,182 | ||||||||
| Texas 13.85% | ||||||||
| Affordable Housing Corp., Multi Family Housing Rev. Bonds (Apartments of Las Palmas I LLC), Series 2021, 0.25% 2024 (put 2022) | 65 | 65 | ||||||
| Alvarado Independent School Dist., Unlimited Tax School Building Bonds, Series 2020, 5.00% 2023 | 795 | 842 | ||||||
| Alvin Independent School Dist., Unlimited Tax Schoolhouse and Rev. Ref. Bonds, Series 2020, 5.00% 2025 | 600 | 689 | ||||||
| Alvin Independent School Dist., Unlimited Tax Schoolhouse and Rev. Ref. Bonds, Series 2020, 5.00% 2027 | 225 | 274 | ||||||
| Angleton Independent School Dist., Unlimited Tax School Building Bonds, Series 2020, 5.00% 2025 | 620 | 711 | ||||||
| Arlington Higher Education Fin. Corp., Education Rev. and Rev. Ref. Bonds (Uplift Education), Series 2017-A, 5.00% 2023 | 885 | 968 | ||||||
| Arlington Higher Education Fin. Corp., Education Rev. and Rev. Ref. Bonds (Uplift Education), Series 2017-A, 5.00% 2024 | 400 | 454 | ||||||
| Arlington Higher Education Fin. Corp., Education Rev. Bonds (Great Hearts America - Texas), Series 2019-A, 5.00% 2026 | 400 | 476 | ||||||
| 26 | Private Client Services Funds |
Capital Group Core Municipal Fund
| Bonds, notes & other debt instruments (continued) | Principal amount (000) | Value (000) | ||||||
| Texas (continued) | ||||||||
| Arlington Higher Education Fin. Corp., Education Rev. Bonds (Great Hearts America - Texas), Series 2019-A, 5.00% 2028 | $ | 595 | $ | 741 | ||||
| Arlington Higher Education Fin. Corp., Education Rev. Bonds (Great Hearts America - Texas), Series 2019-A, 5.00% 2029 | 235 | 298 | ||||||
| Arlington Higher Education Fin. Corp., Education Rev. Bonds (KIPP Texas, Inc.), Series 2019, 5.00% 2026 | 1,900 | 2,273 | ||||||
| Arlington Higher Education Fin. Corp., Education Rev. Bonds (KIPP Texas, Inc.), Series 2019, 5.00% 2027 | 1,000 | 1,225 | ||||||
| Arlington Higher Education Fin. Corp., Education Rev. Bonds (Responsive Education Solutions), Series 2021-A, 5.00% 2029 | 510 | 650 | ||||||
| Arlington Higher Education Fin. Corp., Education Rev. Bonds (Responsive Education Solutions), Series 2021-A, 5.00% 2030 | 485 | 629 | ||||||
| Arlington Higher Education Fin. Corp., Education Rev. Bonds (Riverwalk Education Foundation, Inc.), Series 2019, 5.00% 2028 | 650 | 808 | ||||||
| Arlington Higher Education Fin. Corp., Education Rev. Bonds (Uplift Education), Series 2017-B, 5.00% 2026 | 450 | 540 | ||||||
| Arlington Higher Education Fin. Corp., Education Rev. Bonds (Uplift Education), Series 2019-A, 4.00% 2027 | 460 | 529 | ||||||
| Arlington Higher Education Fin. Corp., Education Rev. Bonds (Uplift Education), Series 2017-B, 5.00% 2027 | 250 | 301 | ||||||
| Arlington Higher Education Fin. Corp., Education Rev. Bonds (Uplift Education), Series 2019-A, 4.00% 2028 | 475 | 546 | ||||||
| Arlington Higher Education Fin. Corp., Education Rev. Bonds (Uplift Education), Series 2019-A, 4.00% 2029 | 395 | 451 | ||||||
| Arlington Independent School Dist., Unlimited Tax School Building and Rev. Ref. Bonds, Series 2020, 5.00% 2026 | 325 | 385 | ||||||
| City of Arlington, Permanent Improvement Bonds, Series 2021-A, 5.00% 2030 | 140 | 183 | ||||||
| Austin Affordable PFC, Inc., Multi Family Housing Rev. Bonds (Bridge at Turtle Creek Apartments), Series 2020, 0.42% 2040 (put 2023) | 1,000 | 1,001 | ||||||
| Austin Community College Dist., Maintenance Tax Notes, Series 2021, 5.00% 2030 | 160 | 210 | ||||||
| City of Austin, Water and Wastewater System Rev. Ref. Bonds, Series 2015-A, 5.00% 2030 | 740 | 867 | ||||||
| City of Austin, Water and Wastewater System Rev. Ref. Bonds, Series 2021, 5.00% 2030 | 110 | 145 | ||||||
| City of Austin, Water and Wastewater System Rev. Ref. Bonds, Series 2021, 5.00% 2031 | 135 | 181 | ||||||
| Barbers Hill Independent School Dist., Unlimited Tax School Building Bonds, Series 2020, 5.00% 2030 | 375 | 486 | ||||||
| Beaumont Independent School Dist., Unlimited Tax Rev. Ref. Bonds, Series 2017, 5.00% 2026 | 1,500 | 1,776 | ||||||
| County of Bexar, Hospital Dist., Limited Tax Rev. Ref. Bonds, Series 2019, 5.00% 2031 | 480 | 592 | ||||||
| Brazosport Independent School Dist., Unlimited Tax School Building Bonds, Series 2019, 5.00% 2022 | 115 | 117 | ||||||
| Burnet Consolidated Independent School Dist., Unlimited Tax School Building Bonds, Series 2021, 5.00% 2031 | 215 | 280 | ||||||
| County of Cameron, Housing Fin. Corp., Multi Family Housing Rev. Bonds (Sunland Country Apartments), Series 2021, 0.28% 2024 (put 2023) | 205 | 205 | ||||||
| Canyon Independent School Dist., Unlimited Tax School Building Bonds, Series 2020, 5.00% 2027 | 1,000 | 1,217 | ||||||
| Capital Area Housing Fin. Corp., Multi Family Housing Rev. Bonds (Mission Trail at El Camino Real Apartments), Series 2019, 2.10% 2037 (put 2022) | 1,080 | 1,081 | ||||||
| Capital Area Housing Fin. Corp., Multi Family Housing Rev. Bonds (Redwood Apartments), Series 2020, 0.41% 2041 (put 2024) | 3,920 | 3,922 | ||||||
| Carroll Independent School Dist., Unlimited Tax Rev. Ref. Bonds, Series 2019, 5.00% 2026 | 970 | 1,148 | ||||||
| Carrollton-Farmers Branch Independent School Dist., Unlimited Tax School Building Bonds, Series 2021, 5.00% 2023 | 230 | 244 | ||||||
| Central Texas Regional Mobility Auth., Rev. Ref. Bonds, Series 2021-D, 5.00% 2030 | 320 | 409 | ||||||
| Central Texas Regional Mobility Auth., Rev. Ref. Bonds, Series 2021-D, 5.00% 2032 | 520 | 679 | ||||||
| Clear Creek Independent School Dist., Unlimited Tax School Building Bonds, Series 2018, 5.00% 2028 | 1,100 | 1,335 | ||||||
| Clear Creek Independent School Dist., Unlimited Tax School Building Bonds, Series 2013-B, 0.28% 2038 (put 2024) | 205 | 204 | ||||||
| Clifton Higher Education Fin. Corp., Education Rev. and Ref. Bonds (Idea Public Schools), Series 2017, 5.00% 2027 | 1,360 | 1,672 | ||||||
| Clifton Higher Education Fin. Corp., Education Rev. Bonds (Idea Public Schools), Series 2018, 5.00% 2025 | 500 | 582 | ||||||
| Clifton Higher Education Fin. Corp., Education Rev. Bonds (Idea Public Schools), Series 2019, 5.00% 2026 | 1,000 | 1,199 | ||||||
| Collin County Community College Dist., G.O. Bonds, Series 2020-A, 5.00% 2032 | 680 | 876 | ||||||
| Conroe Independent School Dist., Unlimited Tax Rev. Ref. Bonds, Series 2019, 5.00% 2022 | 220 | 223 | ||||||
| Corpus Christi Independent School Dist., Unlimited Tax School Building and Rev. Ref. Bonds, Series 2020, 5.00% 2027 | 675 | 831 | ||||||
| Port of Corpus Christi Auth. of Nueces County, Rev. Bonds, Series 2018-A, 5.00% 2027 | 490 | 599 | ||||||
| Crowley Independent School Dist., Unlimited Tax Rev. Ref. Bonds, Series 2015-A, 5.00% 2025 | 1,000 | 1,163 | ||||||
| Crowley Independent School Dist., Unlimited Tax School Building Bonds, Series 2019, 5.00% 2028 | 310 | 389 | ||||||
| Crowley Independent School Dist., Unlimited Tax School Building Bonds, Series 2019, 5.00% 2029 | 400 | 508 | ||||||
| Crowley Independent School Dist., Unlimited Tax School Building Bonds, Series 2019, 5.00% 2031 | 260 | 327 | ||||||
| Cities of Dallas and Fort Worth, Dallas/Fort Worth International Airport, Joint Rev. Improvement Bonds, Series 2013-B, 4.00% 2039 | 1,000 | 1,034 | ||||||
| City of Dallas, Housing Fin. Corp., Multi Family Housing Rev. Bonds (Midpark Towers), Series 2021, 0.35% 2024 (put 2023) | 675 | 675 | ||||||
| City of Dallas, Housing Fin. Corp., Multi Family Housing Rev. Notes (Estates at Shiloh), Series 2019, 1.25% 2037 (put 2023) | 430 | 436 | ||||||
| Private Client Services Funds | 27 |
Capital Group Core Municipal Fund
| Bonds, notes & other debt instruments (continued) | Principal amount (000) | Value (000) | ||||||
| Texas (continued) | ||||||||
| Dallas Independent School Dist., Unlimited Tax Rev. Ref. Bonds, Series 2014-A, 5.00% 2023 | $ | 120 | $ | 130 | ||||
| Del Valle Independent School Dist., Unlimited Tax School Building Bonds, Series 2020, 5.00% 2022 | 155 | 160 | ||||||
| City of Denton, Utility System Rev. Bonds, Series 2017, 5.00% 2028 | 2,000 | 2,396 | ||||||
| Eagle Mountain-Saginaw Independent School Dist., Unlimited Tax School Building Bonds, Series 2019, 5.00% 2027 | 600 | 738 | ||||||
| El Paso Independent School Dist., Unlimited Tax Rev. Ref. Bonds, Series 2015, 5.00% 2026 | 500 | 565 | ||||||
| Fort Bend Independent School Dist., Unlimited Tax Rev. Ref. Bonds, Series 2021-B, 0.72% 2051 (put 2026) | 1,515 | 1,511 | ||||||
| Fort Bend Independent School Dist., Unlimited Tax School Building and Rev. Ref. Bonds, Series 2020-B, 0.875% 2050 (put 2023) | 340 | 343 | ||||||
| Fort Worth Independent School Dist., Unlimited Tax School Building Bonds, Series 2021-A, 5.00% 2030 | 275 | 357 | ||||||
| Fort Worth Independent School Dist., Unlimited Tax School Building Bonds, Series 2021-A, 5.00% 2031 | 255 | 337 | ||||||
| G.O. Water Financial Assistance Rev. Ref. Bonds, Series 2021-B, 4.00% 2028 | 175 | 197 | ||||||
| City of Galveston, Public Fac. Corp., Multi Family Housing Rev. Bonds (The Orleanders at Broadway), Series 2021, 0.47% 2025 (put 2024) | 510 | 509 | ||||||
| City of Garland, Electric Utility System Rev. Ref. Bonds, Series 2021, 5.00% 2022 | 675 | 686 | ||||||
| City of Garland, Electric Utility System Rev. Ref. Bonds, Series 2021-A, 5.00% 2028 | 80 | 99 | ||||||
| City of Garland, Electric Utility System Rev. Ref. Bonds, Series 2021-A, 5.00% 2031 | 150 | 196 | ||||||
| City of Garland, Tax and Rev. Certs. of Obligation, Series 2021, 5.00% 2024 | 135 | 149 | ||||||
| Goose Creek Consolidated Independent School Dist., Unlimited Tax School Building Bonds, Series 2014-B, 0.60% 2035 (put 2026) | 340 | 337 | ||||||
| Goose Creek Consolidated Independent School Dist., Unlimited Tax School Building Bonds, Series 2019-B, 0.15% 2049 (put 2022) | 555 | 555 | ||||||
| Harlandale Independent School Dist., Maintenance Tax Notes, Series 2021, BAM insured, 2.00% 2040 (put 2024) | 185 | 187 | ||||||
| Harlandale Independent School Dist., Unlimited Tax Rev. Ref. Bonds, Series 2020, 0.75% 2045 (put 2025) | 330 | 330 | ||||||
| County of Harris, Cultural Education Facs. Fin. Corp., Hospital Rev. Bonds (Memorial Hermann Health System), Series 2020, 5.00% 2022 | 1,000 | 1,028 | ||||||
| County of Harris, Cultural Education Facs. Fin. Corp., Hospital Rev. Bonds (Memorial Hermann Health System), Series 2019-C-2, (SIFMA Municipal Swap Index + 0.57%) 0.62% 2049 (put 2024)2 | 1,000 | 1,004 | ||||||
| County of Harris, Cultural Education Facs. Fin. Corp., Hospital Rev. Bonds (Texas Children’s Hospital), Series 2019-B, 5.00% 2041 (put 2024) | 1,000 | 1,132 | ||||||
| County of Harris, Cultural Education Facs. Fin. Corp., Hospital Rev. Ref. Bonds (Memorial Hermann Health System), Series 2013-B, (SIFMA Municipal Swap Index + 0.90%) 0.95% 20222 | 250 | 251 | ||||||
| County of Harris, Cultural Education Facs. Fin. Corp., Medical Facs. Mortgage Rev. Ref. Bonds (Baylor College of Medicine), Series 2019-A, (3-month USD-LIBOR x 0.70 + 0.65%) 0.707% 2046 (put 2024)2 | 535 | 537 | ||||||
| County of Harris, Cultural Education Facs. Fin. Corp., Rev. Bonds (Texas Medical Center), Series 2020-A, 0.90% 2050 (put 2025) | 455 | 455 | ||||||
| County of Harris, Health Facs. Dev. Corp., Rev. Ref. Bonds (CHRISTUS Health), Series 2005-A-4, Assured Guaranty Municipal insured, 0.20% 20312 | 125 | 125 | ||||||
| County of Harris, Sports Auth., Rev. Ref. Bonds, Series 2014-A, Assured Guaranty Municipal insured, 5.00% 2022 (escrowed to maturity) | 365 | 383 | ||||||
| Hays Consolidated Independent School Dist., Unlimited Tax School Building Bonds, Series 2021, 4.00% 2030 | 2,045 | 2,448 | ||||||
| Dept. of Housing and Community Affairs, Multi Family Housing Rev. Bonds (Corona Del Valle), Series 2021, 0.37% 2025 (put 2023) | 185 | 185 | ||||||
| Dept. of Housing and Community Affairs, Multi Family Housing Rev. Bonds (Oso Bay Apartments), Series 2021, 0.27% 2024 (put 2022) | 345 | 345 | ||||||
| Dept. of Housing and Community Affairs, Multi Family Housing Rev. Bonds (Palladium Simpson Stuart Apartments), Series 2021, 0.35% 2025 (put 2024) | 630 | 629 | ||||||
| Dept. of Housing and Community Affairs, Residential Mortgage Rev. Bonds, Series 2019-A, 4.75% 2049 | 1,195 | 1,322 | ||||||
| Dept. of Housing and Community Affairs, Residential Mortgage Rev. Bonds, Series 2021-A, 3.00% 2052 | 2,300 | 2,490 | ||||||
| Dept. of Housing and Community Affairs, Single Family Mortgage Rev. Bonds, Series 2019-A, 4.00% 2050 | 1,270 | 1,415 | ||||||
| Dept. of Housing and Community Affairs, Single Family Mortgage Rev. Bonds, Series 2020-A, 3.50% 2051 | 370 | 407 | ||||||
| Dept. of Housing and Community Affairs, Single Family Mortgage Rev. Bonds, Series 2021-A, 3.00% 2052 | 850 | 922 | ||||||
| Housing Options, Inc., Multi Family Housing Rev. Bonds (Brooks Manor - The Oaks Project), Series 2021, 0.50% 2041 (put 2025) | 255 | 254 | ||||||
| City of Houston, Combined Utility System Rev. and Rev. Ref. Bonds, Series 2016-B, 5.00% 2027 | 500 | 607 | ||||||
| City of Houston, Combined Utility System Rev. Bonds, Series 2011-D, 5.00% 2026 (preref. 2021) | 185 | 185 | ||||||
| City of Houston, Combined Utility System Rev. Ref. Bonds, Series 2019-B, 5.00% 2027 | 550 | 682 | ||||||
| City of Houston, Convention and Entertainment Facs. Dept., Hotel Occupancy Tax and Special Rev. Ref. Bonds, Series 2021, 4.00% 2028 | 225 | 264 | ||||||
| City of Houston, Convention and Entertainment Facs. Dept., Hotel Occupancy Tax and Special Rev. Ref. Bonds, Series 2021, 4.00% 2030 | 25 | 30 | ||||||
| City of Houston, Convention and Entertainment Facs. Dept., Hotel Occupancy Tax and Special Rev. Ref. Bonds, Series 2021, 4.00% 2031 | 10 | 12 | ||||||
| 28 | Private Client Services Funds |
Capital Group Core Municipal Fund
| Bonds, notes & other debt instruments (continued) | Principal amount (000) | Value (000) | ||||||
| Texas (continued) | ||||||||
| City of Houston, Housing Fin. Corp., Multi Family Housing Rev. Bonds (Temenos Place Apartments), Series 2021, 0.29% 2024 (put 2023) | $ | 325 | $ | 324 | ||||
| City of Houston, Memorial City Redev. Auth., Tax Increment Contract Rev. and Rev. Ref. Bonds, Series 2019, Assured Guaranty Municipal insured, 5.00% 2027 | 1,050 | 1,265 | ||||||
| City of Houston, Memorial City Redev. Auth., Tax Increment Contract Rev. and Rev. Ref. Bonds, Series 2019, Assured Guaranty Municipal insured, 5.00% 2028 | 250 | 306 | ||||||
| Katy Independent School Dist., Unlimited Tax Rev. Ref. Bonds, Series 2019-B, 5.00% 2022 | 465 | 471 | ||||||
| County of Kaufman, Unlimited Tax Road Bonds, Series 2020, 5.00% 2031 | 115 | 145 | ||||||
| Killeen Independent School Dist., Unlimited Tax Rev. Ref. Bonds, Series 2019, 5.00% 2022 | 445 | 451 | ||||||
| Longview Independent School Dist., Unlimited Tax Rev. Ref. Bonds, Series 2020, 5.00% 2023 | 575 | 610 | ||||||
| Lower Colorado River Auth., Rev. Ref. Bonds, Series 2022, Assured Guaranty Municipal insured, 5.00% 2032 | 380 | 484 | ||||||
| Lower Colorado River Auth., Transmission Contract Rev. Ref. Bonds (LCRA Transmission Services Corp. Project), Series 2016, 5.00% 2022 | 460 | 472 | ||||||
| Lower Colorado River Auth., Transmission Contract Rev. Ref. Bonds (LCRA Transmission Services Corp. Project), Series 2018, 5.00% 2024 | 255 | 285 | ||||||
| Lower Colorado River Auth., Transmission Contract Rev. Ref. Bonds (LCRA Transmission Services Corp. Project), Series 2020, 5.00% 2027 | 1,750 | 2,141 | ||||||
| Lower Colorado River Auth., Transmission Contract Rev. Ref. Bonds (LCRA Transmission Services Corp. Project), Series 2021-A, 5.00% 2031 | 570 | 747 | ||||||
| Lumberton Independent School Dist., Unlimited Tax School Building Bonds, Series 2020, 5.00% 2029 | 245 | 312 | ||||||
| Medina Valley Independent School Dist., Unlimited Tax School Building Bonds, Series 2021, 0.82% 2051 (put 2026) | 325 | 322 | ||||||
| County of Midland, Public Fac. Corp., Multi Family Housing Rev. Bonds (Palladium at West Francis), Series 2020, 0.35% 2024 (put 2023) | 1,000 | 998 | ||||||
| Municipal Gas Acquisition and Supply Corp. I, Gas Supply Rev. Bonds, Series 2008-D, 6.25% 2026 | 480 | 555 | ||||||
| Municipal Gas Acquisition and Supply Corp. III, Gas Supply Rev. Ref. Bonds, Series 2021, 5.00% 2022 | 660 | 693 | ||||||
| Nederland Independent School Dist., Unlimited Tax School Building Bonds, Series 2021, 5.00% 2031 | 195 | 248 | ||||||
| New Hope Cultural Education Facs. Fin. Corp., Retirement Fac. Rev. Bonds (Westminster Project), Series 2016, 5.00% 2028 | 235 | 265 | ||||||
| North Central Texas Housing Fin. Corp., Multi Family Housing Rev. Bonds (Bluebonnet Ridge Apartments), Series 2021, 0.375% 2040 (put 2024) | 220 | 219 | ||||||
| North East Independent School Dist., Unlimited Tax Rev. Ref. Bonds, Series 2017, 2.375% 2047 (put 2022) | 500 | 508 | ||||||
| North East Independent School Dist., Unlimited Tax School Building and Rev. Ref. Bonds, Series 2019-A, 4.00% 2032 | 215 | 251 | ||||||
| North Fort Bend Water Auth., Water System Rev. and Rev. Ref. Bonds, Series 2021, BAM insured, 5.00% 2031 | 435 | 579 | ||||||
| North Harris County Regional Water Auth., Rev. and Rev. Ref. Bonds, Series 2016, 5.00% 2034 | 950 | 1,139 | ||||||
| North Texas Municipal Water Dist., Water System Rev. Ref. and Improvement Bonds, Series 2021, 5.00% 2022 | 170 | 177 | ||||||
| North Texas Tollway Auth., System Rev. and Rev. Ref. Bonds, Series 2017-A, 5.00% 2022 | 220 | 222 | ||||||
| North Texas Tollway Auth., System Rev. Ref. Bonds, Series 2016-A, 5.00% 2026 | 500 | 549 | ||||||
| North Texas Tollway Auth., System Rev. Ref. Bonds, Series 2015-A, 5.00% 2030 | 300 | 340 | ||||||
| North Texas Tollway Auth., System Rev. Ref. Bonds, Capital Appreciation Bonds, Series 2008-D, Assured Guaranty insured, 0% 2030 | 500 | 435 | ||||||
| Northside Independent School Dist., Unlimited Tax Rev. Ref. Bonds, Series 2020, 5.00% 2027 | 850 | 1,048 | ||||||
| Northwest Independent School Dist., Unlimited Tax School Building Bonds, Series 2021, 5.00% 2030 | 175 | 227 | ||||||
| Northwest Independent School Dist., Unlimited Tax School Building Bonds, Series 2021, 5.00% 2031 | 105 | 137 | ||||||
| Northwest Independent School Dist., Unlimited Tax School Building Bonds, Series 2013, 5.00% 2038 (preref. 2023) | 700 | 743 | ||||||
| Odessa Housing Fin. Corp., Multi Family Housing Rev. Bonds (Cove in Odessa Apartments), Series 2021, 0.37% 2024 (put 2023) | 755 | 755 | ||||||
| Pasadena Independent School Dist., Unlimited Tax Rev. Ref. Bonds, Series 2019, 5.00% 2029 | 260 | 331 | ||||||
| Pasadena Independent School Dist., Unlimited Tax School Building and Rev. Ref. Bonds, Series 2013, 5.00% 2038 | 1,000 | 1,059 | ||||||
| Pflugerville Independent School Dist., Unlimited Tax School Building Bonds, Series 2019-A, 5.00% 2022 | 1,000 | 1,014 | ||||||
| Prosper Independent School Dist., Unlimited Tax School Building Bonds, Series 2021-A, 5.00% 2030 | 255 | 331 | ||||||
| Prosper Independent School Dist., Unlimited Tax School Building Bonds, Series 2021-A, 5.00% 2031 | 60 | 79 | ||||||
| Prosper Independent School Dist., Unlimited Tax School Building Bonds, Series 2019-B, 2.00% 2050 (put 2021) | 415 | 427 | ||||||
| Round Rock Independent School Dist., Unlimited Tax Rev. Ref. Bonds, Series 2017, 5.00% 2022 | 600 | 621 | ||||||
| City of San Antonio, Electric and Gas Systems Rev. Bonds, Series 2013, 5.00% 2048 (preref. 2023) | 475 | 503 | ||||||
| City of San Antonio, Electric and Gas Systems Rev. Ref. Bonds, Series 2016, 5.00% 2028 | 1,000 | 1,198 | ||||||
| City of San Antonio, Electric and Gas Systems Rev. Ref. Bonds, Series 2015-B, 2.00% 2033 (put 2021) | 1,150 | 1,152 | ||||||
| City of San Antonio, Electric and Gas Systems Rev. Ref. Bonds, Series 2018, 2.75% 2048 (put 2022) | 250 | 257 | ||||||
| City of San Antonio, General Improvement and Rev. Ref. Bonds, Series 2016, 5.00% 2022 | 270 | 273 | ||||||
| City of San Antonio, Water System Rev. Ref. Bonds, Series 2019-C, 5.00% 2022 | 185 | 190 | ||||||
| Sheldon Independent School Dist., Unlimited Tax School Building Bonds, Series 2017, 5.00% 2022 | 250 | 253 | ||||||
| Private Client Services Funds | 29 |
Capital Group Core Municipal Fund
| Bonds, notes & other debt instruments (continued) | Principal amount (000) | Value (000) | ||||||
| Texas (continued) | ||||||||
| Sherman Independent School Dist., Unlimited Tax School Building Bonds, Series 2018-A, 5.00% 2027 | $ | 1,010 | $ | 1,228 | ||||
| Spring Independent School Dist., Unlimited Tax School Building Bonds, Series 2019, 5.00% 2031 | 465 | 582 | ||||||
| County of Tarrant, Cultural Education Facs. Fin. Corp., Rev. Ref. Bonds (Christus Health), Series 2018-A, 5.00% 2023 | 850 | 916 | ||||||
| Board of Regents of the Texas A&M University System, Rev. Fncg. System Bonds, Series 2017-E, 5.00% 2022 | 1,425 | 1,462 | ||||||
| Tomball Independent School Dist., Unlimited Tax School Building Bonds, Series 2020, 5.00% 2023 | 270 | 286 | ||||||
| Tomball Independent School Dist., Unlimited Tax School Building Bonds, Series 2020, 5.00% 2024 | 90 | 100 | ||||||
| Transportation Commission, Highway Improvement G.O. Bonds, Series 2016-A, 5.00% 2028 | 200 | 237 | ||||||
| County of Travis, Strategic Housing Fin. Corp., Multi Family Housing Rev. Bonds (Yager Flats), Series 2021, 0.46% 2041 (put 2025) | 3,000 | 2,980 | ||||||
| Trinity River Auth., Regional Wastewater System Rev. Ref. Bonds, Series 2021, 5.00% 2030 | 235 | 306 | ||||||
| Trinity River Public Fac. Corp., Multi Family Housing Rev. Bonds (Cowan Place Apartments), Series 2021, 0.28% 2024 (put 2023) | 500 | 499 | ||||||
| Board of Regents of the University of North Texas System, Rev. Fncg. System Rev. Ref. and Improvement Bonds, Series 2018-A, 5.00% 2025 | 240 | 277 | ||||||
| Board of Regents of the University of North Texas System, Rev. Fncg. System Rev. Ref. and Improvement Bonds, Series 2018-A, 5.00% 2026 | 760 | 903 | ||||||
| Water Dev. Board, State Revolving Fund, Rev. Bonds, Series 2021, 5.00% 2031 | 260 | 348 | ||||||
| Water Dev. Board, State Water Implementation Rev. Fund, Rev. Bonds (Master Trust), Series 2018-A, 5.00% 2029 | 990 | 1,239 | ||||||
| Water Dev. Board, State Water Implementation Rev. Fund, Rev. Bonds (Master Trust), Series 2021, 5.00% 2032 | 1,040 | 1,392 | ||||||
| Wylie Independent School Dist., Unlimited Tax Rev. Ref. Bonds, Series 2020-A, 5.00% 2030 | 1,790 | 2,327 | ||||||
| 108,738 | ||||||||
| Utah 0.42% | ||||||||
| Canyons School Dist., Local Building Auth., Lease Rev. Bonds, Series 2021, 5.00% 2029 | 1,000 | 1,284 | ||||||
| Housing Corp., Single Family Mortgage Bonds, Class III, Series 2015-D-2, 4.00% 2045 | 155 | 165 | ||||||
| Salt Lake City, Airport Rev. Bonds (Salt Lake City International Airport), Series 2021-B, 5.00% 2025 | 450 | 522 | ||||||
| Salt Lake City, Airport Rev. Bonds (Salt Lake City International Airport), Series 2021-B, 5.00% 2026 | 620 | 740 | ||||||
| School Fin. Auth., Charter School Rev. Bonds (Utah Charter Academies Project), Series 2018, 4.00% 2022 | 335 | 346 | ||||||
| Transit Auth., Sales Tax Rev. Bonds, Series 2008-A, 5.25% 2023 | 80 | 86 | ||||||
| City of Vineyard, Redev. Agcy., Tax Increment Rev. and Rev. Ref. Bonds, Series 2021, Assured Guaranty Municipal insured, 5.00% 2026 | 95 | 112 | ||||||
| City of Vineyard, Redev. Agcy., Tax Increment Rev. and Rev. Ref. Bonds, Series 2021, Assured Guaranty Municipal insured, 5.00% 2030 | 25 | 32 | ||||||
| City of Vineyard, Redev. Agcy., Tax Increment Rev. and Rev. Ref. Bonds, Series 2021, Assured Guaranty Municipal insured, 5.00% 2031 | 20 | 26 | ||||||
| 3,313 | ||||||||
| Vermont 0.06% | ||||||||
| Housing Fin. Agcy., Multiple Purpose Bonds, Series 2018-A, 4.00% 2048 | 245 | 264 | ||||||
| Housing Fin. Agcy., Multiple Purpose Bonds, Series 2020-A, 3.75% 2050 | 165 | 181 | ||||||
| 445 | ||||||||
| Virginia 1.51% | ||||||||
| County of Arlington, Industrial Dev. Auth., Hospital Rev. Bonds (Virginia Hospital Center), Series 2020, 5.00% 2031 | 600 | 773 | ||||||
| County of Arlington, Industrial Dev. Auth., Hospital Rev. Bonds (Virginia Hospital Center), Series 2020, 5.00% 2032 | 215 | 276 | ||||||
| County of Charles City, Econ. Dev. Auth., Solid Waste Disposal Rev. Bonds (Waste Management, Inc. Project), Series 2004-A, 2.875% 2029 | 1,000 | 1,082 | ||||||
| College Building Auth., Educational Facs. Rev. Bonds (21st Century College and Equipment Programs), Series 2012-A, 5.00% 2024 (preref. 2022) | 295 | 298 | ||||||
| College Building Auth., Educational Facs. Rev. Bonds (21st Century College and Equipment Programs), Series 2013-A, 4.50% 2033 | 1,865 | 1,965 | ||||||
| College Building Auth., Educational Facs. Rev. Bonds (21st Century College and Equipment Programs), Series 2013-A, 4.50% 2034 | 975 | 1,027 | ||||||
| College Building Auth., Educational Facs. Rev. Bonds (Regent University Project), Series 2021, 5.00% 2029 | 375 | 462 | ||||||
| College Building Auth., Educational Facs. Rev. Bonds (Regent University Project), Series 2021, 5.00% 2030 | 375 | 468 | ||||||
| County of Fairfax, Redev. and Housing Auth., Multi Family Housing Rev. Bonds (Arrowbrook Apartments Project), Series 2020, 0.41% 2041 (put 2024) | 1,000 | 1,001 | ||||||
| County of Halifax, Industrial Dev. Auth., Recovery Zone Fac. Rev. Bonds (Virginia Electric and Power Co. Project), Series 2010-A, 0.45% 2041 (put 2022) | 740 | 740 | ||||||
| 30 | Private Client Services Funds |
Capital Group Core Municipal Fund
| Bonds, notes & other debt instruments (continued) | Principal amount (000) | Value (000) | ||||||
| Virginia (continued) | ||||||||
| County of Henrico, Econ. Dev. Auth., Residential Care Fac. Rev. Ref. Bonds (Westminster Canterbury Richmond), Series 2018, 5.00% 2023 | $ | 575 | $ | 623 | ||||
| Town of Louisa, Industrial Dev. Auth., Pollution Control Rev. Ref. Bonds (Virginia Electric and Power Co. Project), Series 2008-A, 1.90% 2035 (put 2023) | 1,000 | 1,024 | ||||||
| Small Business Fncg. Auth., Residential Care Facs. Rev. and Rev. Ref. Bonds (Lifespire of Virginia), Series 2021, 3.00% 2023 | 45 | 47 | ||||||
| Small Business Fncg. Auth., Residential Care Facs. Rev. and Rev. Ref. Bonds (Lifespire of Virginia), Series 2021, 3.00% 2024 | 15 | 16 | ||||||
| Small Business Fncg. Auth., Residential Care Facs. Rev. and Rev. Ref. Bonds (Lifespire of Virginia), Series 2021, 4.00% 2031 | 375 | 426 | ||||||
| Small Business Fncg. Auth., Rev. Bonds (National Senior Campuses, Inc. Obligated Group), Series 2020-A, 5.00% 2027 | 350 | 422 | ||||||
| Small Business Fncg. Auth., Rev. Bonds (National Senior Campuses, Inc. Obligated Group), Series 2020-A, 5.00% 2028 | 120 | 148 | ||||||
| Small Business Fncg. Auth., Rev. Bonds (National Senior Campuses, Inc. Obligated Group), Series 2020-A, 5.00% 2029 | 140 | 173 | ||||||
| Small Business Fncg. Auth., Rev. Bonds (National Senior Campuses, Inc. Obligated Group), Series 2020-A, 5.00% 2030 | 170 | 209 | ||||||
| County of Wise, Industrial Dev. Auth., Solid Waste and Sewage Disposal Rev. Bonds (Virginia Electric and Power Co. Project), Series 2010-A, 1.20% 2040 (put 2024) | 640 | 650 | ||||||
| 11,830 | ||||||||
| Washington 2.22% | ||||||||
| Central Puget Sound Regional Transit Auth., Sales Tax and Motor Vehicle Excise Tax Improvement and Rev. Ref. Green Bonds, Series 2021-S-1, 5.00% 2029 | 510 | 659 | ||||||
| Energy Northwest, Electric Rev. and Rev. Ref. Bonds (Columbia Generating Station), Series 2020-A, 5.00% 2032 | 195 | 254 | ||||||
| City of Everett, Housing Auth., Multi Family Housing Rev. Bonds (Baker Heights Legacy), Series 2021, 0.30% 2024 (put 2023) | 285 | 284 | ||||||
| G.O. Bonds, Series 2012-D, 5.00% 2026 (preref. 2022) | 1,000 | 1,012 | ||||||
| G.O. Bonds, Series 2017-D, 5.00% 2028 | 1,000 | 1,214 | ||||||
| G.O. Bonds, Series 2019-C, 5.00% 2031 | 1,000 | 1,264 | ||||||
| G.O. Bonds, Series 2012-D, 5.00% 2033 (preref. 2022) | 2,000 | 2,024 | ||||||
| G.O. Bonds, Series 2019-A, 5.00% 2033 | 500 | 623 | ||||||
| G.O. Rev. Ref. Bonds, Series 2017-R-A, 5.00% 2022 | 340 | 352 | ||||||
| County of Grant, Public Utility Dist. No. 2, Electric System Rev. Ref. Bonds, Series 2017-O, 5.00% 2024 | 275 | 302 | ||||||
| Health Care Facs. Auth., Rev. Ref. Bonds (Providence St. Joseph Health), Series 2021-B, 4.00% 2042 (put 2030) | 1,000 | 1,214 | ||||||
| Housing Fin. Commission, Multi Family Housing Rev. Bonds (Garten Haus Apartments Project), Series 2021, 0.37% 2024 (put 2023) | 170 | 170 | ||||||
| Housing Fin. Commission, Municipal Certs., Series 2021-1, 3.50% 2035 | 979 | 1,124 | ||||||
| Housing Fin. Commission, Nonprofit Housing Rev. Ref. Bonds (Horizon House Project), Series 2017, 5.00% 20233 | 1,095 | 1,148 | ||||||
| Housing Fin. Commission, Single Family Program Bonds, Series 2017-1-N, 4.00% 2047 | 460 | 488 | ||||||
| Housing Fin. Commission, Single Family Program Bonds, Series 2019-1-N, 4.00% 2049 | 295 | 321 | ||||||
| Motor Vehicle Fuel Tax G.O. Bonds, Series 2021-D, 5.00% 2022 | 2,375 | 2,442 | ||||||
| City of Seattle, Housing Auth., Rev. and Rev. Ref. Bonds (Northgate Plaza Project), Series 2021, 1.00% 2026 | 460 | 460 | ||||||
| City of Seattle, Housing Auth., Rev. Bonds (Lam Bow Apartments Project), Series 2021, 1.25% 2024 | 55 | 55 | ||||||
| City of Seattle, Municipal Light and Power Rev. Ref. Bonds, Series 2021-B, (SIFMA Municipal Swap Index + 0.25%) 0.30% 2045 (put 2026)2 | 765 | 772 | ||||||
| City of Seattle, Municipal Light and Power Rev. Ref. Bonds, Series 2018-C-2, (SIFMA Municipal Swap Index + 0.49%) 0.54% 2046 (put 2023)2 | 825 | 828 | ||||||
| City of Seattle, Solid Waste System Rev. Ref. Bonds, Series 2021, 5.00% 2029 | 170 | 219 | ||||||
| City of Seattle, Solid Waste System Rev. Ref. Bonds, Series 2021, 5.00% 2030 | 175 | 230 | ||||||
| 17,459 | ||||||||
| Private Client Services Funds | 31 |
Capital Group Core Municipal Fund
| Bonds, notes & other debt instruments (continued) | Principal amount (000) | Value (000) | ||||||
| West Virginia 0.32% | ||||||||
| Econ. Dev. Auth., Solid Waste Disposal Facs. Rev. Bonds (Appalachian Power Co. - Amos Project), Series 2009-B, 2.625% 2042 (put 2022) | $ | 750 | $ | 759 | ||||
| Econ. Dev. Auth., Solid Waste Disposal Facs. Rev. Ref. Bonds (Appalachian Power Co. - Amos Project), Series 2015-A, 2.55% 2040 (put 2024) | 500 | 521 | ||||||
| Housing Dev. Fund, Multi Family Housing Rev. Bonds (Charles Towers), Series 2021, 0.21% 2023 (put 2022) | 235 | 235 | ||||||
| Housing Dev. Fund, Multi Family Housing Rev. Bonds (Parkland Place / Chapmanville Towers), Series 2021, 0.28% 2024 (put 2023) | 1,000 | 999 | ||||||
| 2,514 | ||||||||
| Wisconsin 2.07% | ||||||||
| Environmental Improvement Fund Rev. Green Bonds, Series 2021-A, 4.00% 2031 | 1,000 | 1,220 | ||||||
| G.O. Bonds, Series 2015-A, 5.00% 2031 (preref. 2023) | 2,000 | 2,143 | ||||||
| Health and Educational Facs. Auth., Health Facs. Rev. Bonds (SSM Health Care), Series 2018-B, 5.00% 2038 (put 2023) | 1,300 | 1,365 | ||||||
| Health and Educational Facs. Auth., Rev. Bonds (Advocate Aurora Health Care Credit Group), Series 2018-C-3, (SIFMA Municipal Swap Index + 0.55%) 0.60% 2054 (put 2023)2 | 1,130 | 1,133 | ||||||
| Health and Educational Facs. Auth., Rev. Bonds (Ascension Senior Credit Group), Series 2019-A, 5.00% 2021 | 325 | 326 | ||||||
| Health and Educational Facs. Auth., Rev. Bonds (Ascension Senior Credit Group), Series 2016-A, 5.00% 2021 | 45 | 45 | ||||||
| Health and Educational Facs. Auth., Rev. Bonds (Gundersen Lutheran), Series 2020, 5.00% 20263 | 1,910 | 2,209 | ||||||
| Housing and Econ. Dev. Auth., Home Ownership Rev. Bonds, Series 2017-C, 4.00% 2048 | 940 | 1,007 | ||||||
| Housing and Econ. Dev. Auth., Home Ownership Rev. Bonds, Series 2018-B, 4.00% 2048 | 710 | 762 | ||||||
| Housing and Econ. Dev. Auth., Home Ownership Rev. Bonds, Series 2020-A, 3.50% 2050 | 1,160 | 1,265 | ||||||
| Housing and Econ. Dev. Auth., Home Ownership Rev. Bonds, Series 2021-A, 3.00% 2052 | 410 | 442 | ||||||
| Housing and Econ. Dev. Auth., Housing Rev. Bonds, Series 2021-B, 0.40% 2045 (put 2023) | 95 | 95 | ||||||
| Housing and Econ. Dev. Auth., Housing Rev. Bonds, Series 2021-B, 0.50% 2050 (put 2024) | 120 | 120 | ||||||
| Public Fin. Auth., Hospital Rev. Ref. Bonds (Renown Regional Medical Center Project), Series 2016-A, 5.00% 2022 | 300 | 308 | ||||||
| Public Fin. Auth., Rev. Ref. Bonds (Providence St. Joseph Health), Series 2021-C, 4.00% 2041 (put 2030) | 1,680 | 2,038 | ||||||
| Public Fin. Auth., Student Housing Rev. Bonds (Beyond Boone, LLC - Appalachian State University Project), Series 2019-A, Assured Guaranty Municipal insured, 5.00% 2030 | 315 | 386 | ||||||
| University of Wisconsin, Hospitals and Clinics Auth., Rev. Green Bonds, Series 2021-B, 5.00% 2030 | 630 | 811 | ||||||
| WPPI Energy, Power Supply System Rev. Bonds, Series 2016-A, 5.00% 2026 | 500 | 593 | ||||||
| 16,268 | ||||||||
| Wyoming 0.48% | ||||||||
| Community Dev. Auth., Housing Rev. Bonds, Series 2019-1, 4.00% 2048 | 745 | 808 | ||||||
| Community Dev. Auth., Housing Rev. Bonds, Series 2021-1, 3.00% 2050 | 1,570 | 1,692 | ||||||
| Community Dev. Auth., Housing Rev. Bonds, Series 2020-1, 4.00% 2050 | 1,125 | 1,242 | ||||||
| 3,742 | ||||||||
| Total bonds, notes & other debt instruments (cost: $635,051,000) | 644,756 | |||||||
| Short-term securities 18.85% | ||||||||
| Municipals 18.85% | ||||||||
| State of Arizona, Industrial Dev. Auth., Hospital Rev. Ref. Bonds (Phoenix Children’s Hospital), Series 2019-B, 0.02% 20482 | 4,500 | 4,500 | ||||||
| State of Arizona, County of Yavapai, Industrial Dev. Auth., Solid Waste Disposal Rev. Ref. Bonds (Republic Services, Inc. Project), Series 2010, 0.15% 2029 (put 2021)2,4 | 1,775 | 1,775 | ||||||
| State of California, Kern Community College Dist., Facs. Improvement Dist. No. 1, G.O. Bond Anticipation Notes, Capital Appreciation Notes, Series 2020, 0% 2023 | 135 | 134 | ||||||
| State of California, City of Los Angeles, Dept. of Water and Power, Power System Rev. Ref. Bonds, Series 2001-B-3, 0.01% 20342 | 1,500 | 1,500 | ||||||
| State of California, City of Los Angeles, Tax and Rev. Anticipation Notes, Series 2021, 4.00% 6/23/2022 | 2,000 | 2,050 | ||||||
| State of California, City of Los Angeles, Wastewater System Rev. Ref. Bonds, Series 2018-C-1, 0.04% 20322 | 2,500 | 2,500 | ||||||
| State of California, County of Los Angeles, Tax and Rev. Anticipation Notes, Series 2021, 4.00% 6/30/2022 | 2,815 | 2,887 | ||||||
| State of California, Pollution Control Fncg. Auth., Environmental Impact Rev. Bonds (Air Products and Chemicals, Inc. Project), Series 1997-B, 0.02% 20422 | 1,000 | 1,000 | ||||||
| State of Colorado, Regents of the University of Colorado, University Enterprise Rev. and Rev. Ref. Bonds, Series 2020-A-2, 0.03% 20502 | 6,630 | 6,630 | ||||||
| 32 | Private Client Services Funds |
Capital Group Core Municipal Fund
| Short-term securities (continued) | Principal amount (000) | Value (000) | ||||||
| Municipals (continued) | ||||||||
| State of Georgia, Northwest Georgia Housing Auth., Multi Family Housing Rev. Bonds (Charles Hight Apartments Project), Series 2019, 0.25% 8/1/2022 (put 2022)4 | $ | 160 | $ | 160 | ||||
| State of Georgia, Northwest Georgia Housing Auth., Multi Family Housing Rev. Bonds (Park Homes Apartments Project), Series 2019, 0.25% 8/1/2022 (put 2022)4 | 175 | 175 | ||||||
| State of Idaho, Tax Anticipation Notes, Series 2021, 3.00% 6/30/2022 | 5,000 | 5,094 | ||||||
| State of Illinois, Fin. Auth., Demand Rev. Bonds (University of Chicago Medical Center), Series 2011-A, 0.03% 20442 | 2,950 | 2,950 | ||||||
| State of Illinois, G.O. Rev. Ref. Bonds, Series 2021-C, 4.00% 3/1/2022 | 665 | 673 | ||||||
| State of Indiana, Bond Bank, Advance Funding Program Notes, Series 2021-A, 2.00% 1/10/2022 | 1,040 | 1,043 | ||||||
| State of Indiana, Fin. Auth., Environmental Rev. Ref. Bonds (Duke Energy Indiana, Inc. Project), Series 2009-A-3, 0.07% 20392 | 5,000 | 5,000 | ||||||
| State of Iowa, Fin. Auth., Rev. Bonds (UnityPoint Health), Series 2018-F, 0.02% 20412 | 6,925 | 6,925 | ||||||
| State of Louisiana, Parish of East Baton Rouge, Pollution Control Rev. Ref. Bonds (ExxonMobil Project), Series 1993, 0.03% 3/1/20222 | 3,345 | 3,345 | ||||||
| State of Louisiana, Public Facs. Auth., Rev. Bonds (Air Products and Chemicals Project), Series 2009-A, 0.04% 20492 | 5,000 | 5,000 | ||||||
| State of Louisiana, Public Facs. Auth., Rev. Bonds (Air Products and Chemicals Project), Series 2010, 0.04% 20502 | 500 | 500 | ||||||
| State of Michigan, Strategic Fund, Demand Limited Obligation Rev. Bonds (Air Products and Chemicals, Inc. Project), Series 2007, 0.02% 20422 | 4,700 | 4,700 | ||||||
| State of Michigan, Regents of the University of Michigan, General Rev. Bonds, Series 2012-B, 0.02% 20422 | 7,435 | 7,435 | ||||||
| State of Minnesota, City of Shakopee, Multi Family Housing Rev. Bonds (Shakopee Village Apartments Project), Series 2021, 0.25% 2024 (put 2022)4 | 140 | 140 | ||||||
| State of New Hampshire, Health and Education Facs. Auth., Rev. Ref. Bonds (Dartmouth College Issue), Series 2007-B, 0.02% 20412 | 2,000 | 2,000 | ||||||
| State of New York, Metropolitan Transportation Auth., Transportation Rev. Bond Anticipation Notes, Series 2020-A-2S, 4.00% 2/1/2022 | 1,160 | 1,171 | ||||||
| State of New York, New York City G.O. Bonds, Series 2013-F-3, 0.02% 20422 | 11,465 | 11,466 | ||||||
| State of New York, New York City G.O. Bonds, Series 2021-2, 0.11% 20422 | 695 | 695 | ||||||
| State of New York, New York City G.O. Bonds, Series 2021-3, 0.11% 20422 | 530 | 530 | ||||||
| State of New York, New York City G.O. Bonds, Series 2016-A-5, 0.03% 20442 | 9,000 | 9,000 | ||||||
| State of New York, New York City Municipal Water Fin. Auth., Water and Sewer System Second General Resolution Rev. Bonds, Series 2011-FF-1, 0.02% 20442 | 8,000 | 8,000 | ||||||
| State of New York, New York City Municipal Water Fin. Auth., Water and Sewer System Second General Resolution Rev. Bonds, Series 2021-EE-1, 0.03% 20452 | 5,000 | 5,000 | ||||||
| State of New York, New York City Municipal Water Fin. Auth., Water and Sewer System Second General Resolution Rev. Bonds, Series 2016-AA-1, 0.02% 20482 | 2,170 | 2,170 | ||||||
| State of New York, New York City Municipal Water Fin. Auth., Water and Sewer System Second General Resolution Rev. Bonds, Series 2015-BB-1, 0.02% 20492 | 16,500 | 16,500 | ||||||
| State of New York, New York City Transitional Fin. Auth., Future Tax Secured Bonds, Series 2016-A-4, 0.02% 20412 | 2,905 | 2,905 | ||||||
| State of New York, New York City Transitional Fin. Auth., Future Tax Secured Bonds, Series 2019-B-4, 0.03% 20422 | 1,000 | 1,000 | ||||||
| State of Ohio, Hospital Rev. Bonds (Cleveland Clinic Health System Obligated Group), Series 2019-F, 0.03% 20522 | 4,900 | 4,900 | ||||||
| State of Pennsylvania, Econ. Dev. Fin. Auth., Solid Waste Rev. Ref. Bonds (Republic Service, Inc. Project), Series 2010-B, 0.20% 2030 (put 2022)4 | 1,695 | 1,695 | ||||||
| State of South Carolina, Jobs-Econ. Dev. Auth., Hospital Rev. Bonds (Prisma Health Obligated Group), Series 2018-B, 0.03% 20482 | 5,000 | 5,000 | ||||||
| State of Tennessee, City of Clarksville, Public Building Auth., Pooled Fncg. Rev. Bonds, Series 2003, Bank of America LOC, 0.05% 20332 | 1,955 | 1,955 | ||||||
| State of Tennessee, County of Montgomery, Public Building Auth., Pooled Fncg. Rev. Bonds (Tennessee County Loan Pool), Series 2004, Bank of America LOC, 0.05% 20342 | 405 | 405 | ||||||
| State of Texas, Deer Park Independent School Dist., Unlimited Tax School Building Bonds, Series 2018, 0.16% 2042 (put 2022)4 | 135 | 135 | ||||||
| State of Texas, Lone Star College System, Limited Tax G.O. Bonds, Series 2021-A, 5.00% 2/15/2022 | 70 | 71 | ||||||
| State of Texas, Lone Star College System, Limited Tax G.O. Rev. Ref. Bonds, Series 2021-B, 5.00% 2/15/2022 | 135 | 137 | ||||||
| State of Texas, Municipal Gas Acquisition and Supply Corp. III, Gas Supply Rev. Ref. Bonds, Series 2021, 5.00% 12/15/2021 | 805 | 809 | ||||||
| State of Texas, North East Independent School Dist., Unlimited Tax School Building Bonds, Series 2013-B, 0.25% 2032 (put 2022)4 | 130 | 130 | ||||||
| Private Client Services Funds | 33 |
Capital Group Core Municipal Fund
| Short-term securities (continued) | Principal amount (000) | Value (000) | ||||||
| Municipals (continued) | ||||||||
| State of Texas, Richardson Independent School Dist., Unlimited Tax School Building Bonds, Series 2021, 5.00% 2/15/2022 | $ | 355 | $ | 360 | ||||
| State of Utah, Provo City School Dist., G.O. Rev. Ref. Bonds, Series 2021-B, 5.00% 6/15/2022 | 1,000 | 1,030 | ||||||
| State of Wyoming, County of Lincoln, Pollution Control Rev. Ref. Bonds (ExxonMobil Project), Series 2014, 0.03% 20442 | 4,800 | 4,800 | ||||||
| Total short-term securities (cost: $147,977,000) | 147,980 | |||||||
| Total investment securities 100.98% (cost: $783,028,000) | 792,736 | |||||||
| Other assets less liabilities (0.98%) | (7,683 | ) | ||||||
| Net assets 100.00% | $ | 785,053 | ||||||
Futures contracts
| Contracts | Type | Number of contracts | Expiration | Notional amount (000) | 5 | Value at 10/31/2021 (000) | 6 | Unrealized (depreciation) appreciation at 10/31/2021 (000) | ||||||||||
| 5 Year U.S. Treasury Note Futures | Long | 121 | December 2021 | $ | 12,100 | $ | 14,732 | $ | (58 | ) | ||||||||
| 10 Year U.S. Treasury Note Futures | Short | 33 | December 2021 | (3,300 | ) | (4,313 | ) | 51 | ||||||||||
| $ | (7 | ) | ||||||||||||||||
| 1 | Step bond; coupon rate may change at a later date. |
| 2 | Coupon rate may change periodically. Reference rate and spread are as of the most recent information available. Some coupon rates are determined by the issuer or agent based on current market conditions; therefore, the reference rate and spread are not available. For short-term securities, the date of the next scheduled coupon rate change is considered to be the maturity date. |
| 3 | Acquired in a transaction exempt from registration under Rule 144A of the Securities Act of 1933. May be resold in the U.S. in transactions exempt from registration, normally to qualified institutional buyers. The total value of all such securities was $3,420,000, which represented .44% of the net assets of the fund. |
| 4 | For short-term securities, the mandatory put date is considered to be the maturity date. |
| 5 | Notional amount is calculated based on the number of contracts and notional contract size. |
| 6 | Value is calculated based on the notional amount and current market price. |
Key to abbreviations and symbol
Agcy. = Agency
AMT = Alternative Minimum Tax
Auth. = Authority
Certs. = Certificates
Dept. = Department
Dev. = Development
Dist. = District
Econ. = Economic
Fac. = Facility
Facs. = Facilities
Fin. = Finance
Fncg. = Financing
G.O. = General Obligation
IAM = Interest at Maturity
LIBOR = London Interbank Offered Rate
LOC = Letter of Credit
Part. = Participation
Preref. = Prerefunded
Redev. = Redevelopment
Ref. = Refunding
Rev. = Revenue
SIFMA = Securities Industry and Financial Markets Association
USD/$ = U.S. dollars
| 34 | Private Client Services Funds |
Capital Group Short-Term Municipal Fund
Investment portfolio October 31, 2021
| Portfolio quality summary* | Percent of net assets |
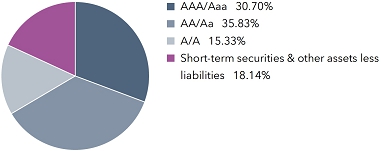
| * | Bond ratings, which typically range from AAA/Aaa (highest) to D (lowest), are assigned by credit rating agencies such as Standard & Poor’s, Moody’s and/or Fitch as an indication of an issuer’s creditworthiness. In assigning a credit rating to a security, the fund looks specifically to the ratings assigned to the issuer of the security by Standard & Poor’s, Moody’s and/or Fitch. If agency ratings differ, the security will be considered to have received the highest of those ratings, consistent with the fund’s investment policies. The ratings are not covered by the Report of Independent Registered Public Accounting Firm. |
| Bonds, notes & other debt instruments 81.86% | Principal amount (000) | Value (000) | ||||||
| Alabama 1.90% | ||||||||
| City of Alabaster, Board of Education, Special Tax School Warrants, Series 2014-A, | ||||||||
| Assured Guaranty Municipal insured, 5.00% 2028 (preref. 2024) | $ | 500 | $ | 565 | ||||
| City of Birmingham, Water Works Board, Water Rev. Bonds, Series 2013-B, 5.00% 2038 (preref. 2023) | 500 | 528 | ||||||
| Black Belt Energy Gas Dist., Gas Project Rev. Bonds (Project No. 6), Series 2021-B, 4.00% 2052 (put 2026) | 500 | 571 | ||||||
| Black Belt Energy Gas Dist., Gas Supply Prepay Rev. Bonds (Project No. 4), Series 2019-A, 4.00% 2049 (put 2025) | 750 | 838 | ||||||
| Black Belt Energy Gas Dist., Gas Supply Prepay Rev. Bonds (Project No. 5), Series 2020-A-1, 4.00% 2049 (put 2026) | 455 | 519 | ||||||
| Federal Aid Highway Fin. Auth., Federal Highway Grant Anticipation Bonds, Series 2012, 5.00% 2023 (preref. 2022) | 35 | 36 | ||||||
| Housing Fin. Auth., Multi Family Housing Rev. Bonds (Capstone at Kinsey Cove Project), Series 2020-A, 0.35% 2023 (put 2023) | 110 | 110 | ||||||
| South East Gas Supply Dist., Gas Supply Rev. Bonds (Project No. 2), Series 2018-A, 4.00% 2049 (put 2024) | 490 | 529 | ||||||
| Southeast Energy Auth., Commodity Supply Rev. Bonds (Project No. 2), Series 2021-B-1, 4.00% 2051 (put 2031) | 125 | 150 | ||||||
| 3,846 | ||||||||
| Alaska 0.15% | ||||||||
| Housing Fin. Corp., General Mortgage Rev. Bonds, Series 2020-A, 3.25% 2044 | 275 | 298 | ||||||
| Arizona 1.47% | ||||||||
| Agricultural Improvement and Power Dist., Electric System Rev. Bonds (Salt River Project), Series 2021-A, 5.00% 2026 | 730 | 862 | ||||||
| Board of Regents of the Arizona State University System, Rev. Bonds, Series 2020-A, 5.00% 2026 | 300 | 359 | ||||||
| County of Coconino, Pollution Control Corp., Pollution Control Rev. Ref. Bonds, Series 2017-B, 1.65% 2039 (put 2023) | 500 | 509 | ||||||
| City of Glendale, Industrial Dev. Auth., Rev. Ref. Bonds (Midwestern University), Series 2020, 5.00% 2022 | 185 | 190 | ||||||
| Industrial Dev. Auth., Hospital Rev. Bonds (Phoenix Children’s Hospital), Series 2021-A, 5.00% 2026 | 190 | 223 | ||||||
| Industrial Dev. Auth., Rev. Bonds (Lincoln South Beltway Project), Series 2020, 5.00% 2023 | 750 | 818 | ||||||
| City of Phoenix, Civic Improvement Corp., Water System Rev. Ref. Bonds, Series 2014-B, 5.00% 2024 | 15 | 17 | ||||||
| 2,978 | ||||||||
| California 4.64% | ||||||||
| Bay Area Toll Auth., San Francisco Bay Area Toll Bridge Rev. Bonds, Series 2006-C-1, (SIFMA Municipal Swap Index + 0.90%) 0.95% 2045 (put 2023)1 | 1,500 | 1,511 | ||||||
| Bay Area Toll Auth., San Francisco Bay Area Toll Bridge Rev. Bonds, Series 2021-C, (SIFMA Municipal Swap Index + 0.45%) 0.50% 2056 (put 2026)1 | 65 | 66 | ||||||
| Trustees of the California State University, Systemwide Rev. Bonds, Series 2012-A, 5.00% 2042 (preref. 2022) | 795 | 833 | ||||||
| Trustees of the California State University, Systemwide Rev. Bonds, Series 2016-B-2, 0.55% 2049 (put 2026) | 100 | 99 | ||||||
| East Side Union High School Dist., G.O. Bonds, 2008 Election, Series 2012-D, 5.00% 2037 (preref. 2022) | 1,000 | 1,036 | ||||||
| Eastern Municipal Water Dist., Water and Wastewater Rev. Ref. Bonds, Series 2021-A, 3.00% 2024 | 45 | 48 | ||||||
| Private Client Services Funds | 35 |
Capital Group Short-Term Municipal Fund
| Bonds, notes & other debt instruments (continued) | Principal amount (000) | Value (000) | ||||||
| California (continued) | ||||||||
| Fresno Unified School Dist., G.O. Bonds, 2016 Election, Series 2021-D, 2.00% 2023 | $ | 30 | $ | 31 | ||||
| Fresno Unified School Dist., G.O. Bonds, 2016 Election, Series 2021-D, 2.00% 2024 | 15 | 16 | ||||||
| G.O. Bonds, Series 2021, 5.00% 2027 | 395 | 490 | ||||||
| G.O. Bonds, Series 2021, 5.00% 2030 | 160 | 211 | ||||||
| G.O. Rev. Ref. Bonds, Series 2021, 5.00% 2023 | 420 | 456 | ||||||
| G.O. Rev. Ref. Bonds, Series 2019, 5.00% 2029 | 110 | 141 | ||||||
| Health Facs. Fncg. Auth., Rev. Bonds (Stanford Health Care), Series 2021-A, 3.00% 2054 (put 2025) | 475 | 519 | ||||||
| Health Facs. Fncg. Auth., Rev. Green Bonds (Kaiser Permanente), Series 2017-C, 5.00% 2031 (put 2022) | 500 | 524 | ||||||
| Infrastructure and Econ. Dev. Bank, Rev. Ref. Bonds (Museum of Art Project), Series 2021-B, 0.75% 2050 (put 2026)1 | 100 | 102 | ||||||
| City of Jurupa, Public Fncg. Auth., Special Tax Rev. Ref. Bonds, Series 2020-A, BAM insured, 5.00% 2022 | 115 | 119 | ||||||
| City of Los Angeles, Dept. of Water and Power, Power System Rev. Bonds, Series 2018-B, 4.00% 2022 | 15 | 15 | ||||||
| County of Los Angeles, Metropolitan Transportation Auth., Measure R Sales Tax Rev. Ref. Green Bonds, Series 2020-A, 5.00% 2024 | 125 | 140 | ||||||
| Public Works Board, Lease Rev. Ref. Bonds (Various Capital Projects), Series 2022-A, 5.00% 2025 | 180 | 205 | ||||||
| County of San Diego, Regional Transportation Commission, Limited Sales Tax Rev. Short-Term Notes, Series 2021-A, 5.00% 2022 | 500 | 522 | ||||||
| City and County of San Francisco, G.O. Rev. Ref. Bonds, Series 2020-R-2, 5.00% 2023 | 135 | 145 | ||||||
| City and County of San Francisco, G.O. Rev. Ref. Bonds, Series 2020-R-2, 5.00% 2024 | 310 | 348 | ||||||
| Southern California Public Power Auth., Rev. Ref. Bonds (Magnolia Power Project A), Series 2020-1, 5.00% 2023 | 400 | 431 | ||||||
| Southern California Public Power Auth., Rev. Ref. Green Bonds (Milford Wind Corridor Phase II Project), Series 2021-1, 5.00% 2023 | 20 | 22 | ||||||
| Southern California Public Power Auth., Rev. Ref. Green Bonds (Milford Wind Corridor Phase II Project), Series 2021-1, 5.00% 2024 | 5 | 6 | ||||||
| Southern California Public Power Auth., Transmission Project Rev. Bonds (Southern Transmission Project), Series 2017-A, 5.00% 2023 | 160 | 173 | ||||||
| Statewide Communities Dev. Auth., Multi Family Housing Rev. Bonds (Villa Del Sol Apartments), Series 2021-A-2, 0.39% 2023 (put 2023) | 80 | 80 | ||||||
| Statewide Communities Dev. Auth., Multi Family Housing Rev. Bonds (Washington Court Apartments), Series 2021-E, 0.22% 2023 (put 2022) | 35 | 35 | ||||||
| Statewide Communities Dev. Auth., Rev. Ref. Bonds (Enloe Medical Center), Series 2015, 5.00% 2028 | 250 | 293 | ||||||
| City of Tustin, Community Facs. Dist. No. 2014-1 (Tustin Legacy/Standard Pacific), Special Tax Bonds, Series 2015-A, 5.00% 2027 | 200 | 228 | ||||||
| Regents of the University of California, Limited Project Rev. Bonds, Series 2022-S, 5.00% 2026 | 25 | 29 | ||||||
| Val Verde Unified School Dist., G.O. Bonds, 2012 Election, Series 2013-A, BAM insured, 5.00% 2042 | 500 | 542 | ||||||
| 9,416 | ||||||||
| Colorado 0.88% | ||||||||
| Certs. of Part., Series 2021-A, 5.00% 2025 | 345 | 407 | ||||||
| City of Colorado Springs, Utilities System Rev. Ref. Bonds, Series 2020-B, 5.00% 2021 | 20 | 20 | ||||||
| City and County of Denver, Park Creek Metropolitan Dist., Limited Property Tax Supported Rev. Ref. Bonds, Series 2015-A, 5.00% 2021 | 260 | 261 | ||||||
| E-470 Public Highway Auth., Rev. Bonds, Series 2021-B, (USD-SOFR x 0.67 + 0.35%) 0.383% 2039 (put 2024)1 | 40 | 40 | ||||||
| Health Facs. Auth., Rev. Bonds (Sanford Health), Series 2019-A, 5.00% 2022 | 325 | 340 | ||||||
| Housing and Fin. Auth., Single Family Mortgage Bonds, Series 2021-E, 3.00% 2051 | 215 | 231 | ||||||
| Housing and Fin. Auth., Single Family Mortgage Bonds, Series 2021-L, Class I, 3.25% 2051 | 205 | 224 | ||||||
| Regents of the University of Colorado, University Enterprise Rev. and Rev. Ref. Bonds, Series 2019-C, 2.00% 2054 (put 2024) | 245 | 256 | ||||||
| 1,779 | ||||||||
| Connecticut 2.39% | ||||||||
| Town of East Hartford, Housing Auth., Multi Family Housing Rev. Bonds (Veterans Terrace Project), Series 2021, 0.25% 2023 (put 2022) | 45 | 45 | ||||||
| Health and Educational Facs. Auth., Rev. Bonds (Sacred Heart University Issue), Series 2017-I-1, 5.00% 2022 | 500 | 516 | ||||||
| Health and Educational Facs. Auth., Rev. Bonds (Yale University Issue), Series 1999-U-1, 2.00% 2033 (put 2022) | 500 | 502 | ||||||
| Health and Educational Facs. Auth., Rev. Bonds (Yale University Issue), Series 2015-A, 0.375% 2035 (put 2024) | 855 | 853 | ||||||
| Health and Educational Facs. Auth., Rev. Bonds (Yale University Issue), Series 2003-X-2, 0.25% 2037 (put 2024) | 265 | 264 | ||||||
| Health and Educational Facs. Auth., Rev. Bonds (Yale University Issue), Series 2014-A, 1.10% 2048 (put 2023) | 750 | 758 | ||||||
| Housing Fin. Auth., Housing Mortgage Fin. Program Bonds, Series 2019-F-1, 3.50% 2043 | 665 | 717 | ||||||
| Housing Fin. Auth., Housing Mortgage Fin. Program Bonds, Series 2014-C-1, 4.00% 2044 | 160 | 165 | ||||||
| Housing Fin. Auth., Housing Mortgage Fin. Program Bonds, Series 2016-A-1, 4.00% 2045 | 85 | 89 | ||||||
| 36 | Private Client Services Funds |
Capital Group Short-Term Municipal Fund
| Bonds, notes & other debt instruments (continued) | Principal amount (000) | Value (000) | ||||||
| Connecticut (continued) | ||||||||
| Housing Fin. Auth., Housing Mortgage Fin. Program Bonds, Series 2017-A-1, 4.00% 2047 | $ | 460 | $ | 492 | ||||
| Housing Fin. Auth., Housing Mortgage Fin. Program Bonds, Series 2021-B-1, 3.00% 2049 | 125 | 135 | ||||||
| Housing Fin. Auth., Housing Mortgage Fin. Program Rev. Ref. Bonds, Series 2013-B-2, 4.00% 2032 | 35 | 35 | ||||||
| Housing Fin. Auth., Housing Mortgage Fin. Program Rev. Ref. Bonds, Series 2014-D-1, 4.00% 2044 | 85 | 86 | ||||||
| Housing Fin. Auth., Housing Mortgage Fin. Program Rev. Ref. Bonds, Series 2015-C-1, 3.50% 2045 | 185 | 192 | ||||||
| 4,849 | ||||||||
| Delaware 0.08% | ||||||||
| G.O. Bonds, Series 2021, 5.00% 2031 | 125 | 167 | ||||||
| District of Columbia 0.56% | ||||||||
| G.O. Bonds, Series 2015-A, 5.00% 2032 | 700 | 807 | ||||||
| Income Tax Secured Rev. Bonds, Series 2011-A, 5.00% 2022 | 320 | 321 | ||||||
| 1,128 | ||||||||
| Florida 2.94% | ||||||||
| County of Brevard, Housing Fncg. Auth., Multi Family Mortgage Rev. Bonds (Tropical Manor Apartments), Series 2021, 0.25% 2023 (put 2022) | 40 | 40 | ||||||
| Citizens Property Insurance Corp., Personal Lines Account/Commercial Lines Account Secured Bonds, Series 2012-A-1, 5.00% 2022 | 50 | 51 | ||||||
| County of Collier, Heritage Bay Community Dev. Dist., Capital Improvement Rev. Bonds, Series 2018-A-2, 2.50% 2022 | 500 | 505 | ||||||
| Board of Education, Public Education Capital Outlay Rev. Ref. Bonds, Series 2019-D, 5.00% 2023 | 15 | 16 | ||||||
| Higher Educational Facs. Fncg. Auth., Educational Facs. Rev. Ref. Bonds (The University of Tampa Project), Series 2012-A, 5.25% 2042 (preref. 2022) | 1,000 | 1,021 | ||||||
| Housing Fin. Corp., Homeowner Mortgage Rev. Bonds, Series 2018-2, 4.25% 2050 | 320 | 348 | ||||||
| Housing Fin. Corp., Homeowner Mortgage Rev. Bonds, Series 2020-1, 3.50% 2051 | 50 | 55 | ||||||
| JEA, Water and Sewer System Rev. Bonds, Series 2020-A, 5.00% 2025 | 280 | 328 | ||||||
| County of Miami-Dade, Industrial Dev. Auth., Solid Waste Disposal Rev. Bonds (Waste Management, Inc. of Florida Project), Series 2007, 0.45% 2027 (put 2021) | 1,165 | 1,165 | ||||||
| County of Miami-Dade, Water and Sewer System Rev. Ref. Bonds, Series 2008-B, Assured Guaranty Municipal insured, 5.25% 2022 | 195 | 204 | ||||||
| County of Orange, Housing Fin. Auth., Multi Family Housing Rev. Bonds (Jernigan Gardens), Series 2020-B, 0.35% 2023 (put 2022) | 1,000 | 1,000 | ||||||
| County of Orange, Sales Tax Rev. Ref. Bonds, Series 2012-B, 5.00% 2030 (preref. 2022) | 500 | 504 | ||||||
| County of Polk, Utility System Rev. and Rev. Ref. Bonds, Series 2013, BAM insured, 5.00% 2043 (preref. 2023) | 110 | 120 | ||||||
| City of Tampa, Hospital Rev. Bonds (H. Lee Moffitt Cancer Center Project), Series 2020-B, 5.00% 2024 | 100 | 112 | ||||||
| City of Tampa, Hospital Rev. Bonds (H. Lee Moffitt Cancer Center Project), Series 2020-B, 5.00% 2025 | 75 | 87 | ||||||
| City of Tampa, Hospital Rev. Bonds (H. Lee Moffitt Cancer Center Project), Series 2020-B, 5.00% 2026 | 100 | 119 | ||||||
| Tampa-Hillsborough County Expressway Auth., Rev. Ref. Bonds, Series 2012-B, 5.00% 2042 (preref. 2022) | 200 | 206 | ||||||
| Dept. of Transportation Fncg. Corp., Rev. Bonds, Series 2020, 5.00% 2024 | 65 | 73 | ||||||
| 5,954 | ||||||||
| Georgia 2.70% | ||||||||
| City of Atlanta, Airport General Rev. Ref. Bonds, Series 2014-B, 5.00% 2026 | 800 | 878 | ||||||
| City of Atlanta, Airport General Rev. Ref. Bonds, Series 2021-B, 5.00% 2027 | 430 | 529 | ||||||
| City of Atlanta, Urban Residential Fin. Auth., Multi Family Housing Rev. Bonds (Sylvan Hills Senior Apartments Project), Series 2020, 0.41% 2025 (put 2023) | 85 | 85 | ||||||
| County of Dawson, Dev. Auth., Multi Family Housing Rev. Bonds (Peaks of Dawsonville Project), Series 2021, 0.28% 2023 | 500 | 499 | ||||||
| County of Dekalb, Housing Auth., Multi Family Housing Rev. Bonds (Columbia Village Project), Series 2021-A, 0.34% 2024 (put 2023) | 35 | 35 | ||||||
| Housing and Fin. Auth., Single Family Mortgage Bonds, Series 2015-A-1, 3.50% 2045 | 30 | 32 | ||||||
| Housing and Fin. Auth., Single Family Mortgage Bonds, Series 2017-A, 4.00% 2047 | 405 | 431 | ||||||
| Main Street Natural Gas, Inc., Gas Supply Rev. Bonds, Series 2019-C, 4.00% 2050 (put 2026) | 500 | 569 | ||||||
| Metropolitan Atlanta Rapid Transit Auth., Sales Tax Rev. Ref. Bonds (Third Indenture Series), Series 2012-A, 5.00% 2030 (preref. 2022) | 870 | 898 | ||||||
| Municipal Electric Auth., General Resolution Projects Bonds, Series 2021-A, 4.00% 2027 | 270 | 311 | ||||||
| Municipal Electric Auth., Project One Bonds, Series 2021-A, 5.00% 2030 | 40 | 51 | ||||||
| Private Client Services Funds | 37 |
Capital Group Short-Term Municipal Fund
| Bonds, notes & other debt instruments (continued) | Principal amount (000) | Value (000) | ||||||
| Georgia (continued) | ||||||||
| Private Colleges and Universities Auth., Rev. Bonds (The Savannah College of Art and Design Projects), Series 2021, 5.00% 2028 | $ | 35 | $ | 43 | ||||
| Private Colleges and Universities Auth., Rev. Bonds (The Savannah College of Art and Design Projects), Series 2021, 5.00% 2029 | 5 | 6 | ||||||
| City of Sandy Springs, Public Facs. Auth., Rev. Bonds (Sandy Springs City Center Project), Series 2015, 5.00% 2047 (preref. 2026) | 500 | 598 | ||||||
| City of Thomaston, Housing Auth., Multi Family Housing Rev. Bonds (Eastgate Apartments Project), Series 2020-A, 0.34% 2023 (put 2022) | 500 | 500 | ||||||
| 5,465 | ||||||||
| Idaho 0.57% | ||||||||
| Housing and Fin. Assn., Single Family Mortgage Bonds, Series 2019-A, 4.00% 2050 | 1,050 | 1,149 | ||||||
| Illinois 6.46% | ||||||||
| City of Chicago, Sales Tax Rev. Ref. Bonds, Series 2011-A, 5.00% 2041 (preref. 2022) | 205 | 207 | ||||||
| City of Chicago, Wastewater Transmission Rev. Bonds, Series 2014, 5.00% 2024 | 625 | 686 | ||||||
| City of Chicago, Water Rev. Ref. Bonds, Series 2017-2, 5.00% 2021 | 180 | 180 | ||||||
| City of Chicago, Water Rev. Ref. Bonds, Series 2017, 5.00% 2022 | 540 | 565 | ||||||
| Fin. Auth., Rev. Bonds (Art Institute of Chicago), Series 2016, 5.00% 2023 | 100 | 106 | ||||||
| Fin. Auth., Rev. Bonds (Art Institute of Chicago), Series 2016, 5.00% 2024 | 130 | 144 | ||||||
| Fin. Auth., Rev. Bonds (Centegra Health System), Series 2014-A, 5.00% 2027 (preref. 2024) | 200 | 226 | ||||||
| Fin. Auth., Rev. Bonds (Northshore University Heathsystem), Series 2020-A, 5.00% 2029 | 605 | 775 | ||||||
| Fin. Auth., Rev. Bonds (OSF Healthcare System), Series 2015-A, 5.00% 2021 | 1,100 | 1,102 | ||||||
| Fin. Auth., Rev. Bonds (OSF Healthcare System), Series 2020-B-2, 5.00% 2050 (put 2026) | 40 | 47 | ||||||
| Fin. Auth., Rev. Bonds (Presbyterian Homes Obligated Group), Series 2016-A, 5.00% 2023 | 225 | 240 | ||||||
| Fin. Auth., Rev. Bonds (Presbyterian Homes Obligated Group), Series 2021-B, (SIFMA Municipal Swap Index + 0.70%) 0.75% 2042 (put 2026)1 | 25 | 25 | ||||||
| Fin. Auth., Rev. Bonds (Presence Health Network), Series 2016-C, 5.00% 2026 | 515 | 610 | ||||||
| Fin. Auth., Rev. Bonds (University of Chicago), Series 2014-A, 5.00% 2023 | 200 | 218 | ||||||
| Fin. Auth., Rev. Bonds (University of Chicago), Series 2021-A, 5.00% 2025 | 40 | 47 | ||||||
| Fin. Auth., Rev. Ref. Bonds (Anne & Robert H. Lurie Children’s Hospital), Series 2017, 5.00% 2022 | 240 | 249 | ||||||
| Housing Dev. Auth., Multi Family Housing Rev. Bonds, Series 2021-C, 0.80% 2026 | 80 | 79 | ||||||
| Housing Dev. Auth., Multi Family Housing Rev. Bonds (Concord Commons), Series 2021, 0.25% 2024 (put 2023) | 595 | 595 | ||||||
| Housing Dev. Auth., Multi Family Housing Rev. Bonds (Marshall Field Garden Apartment Homes), Series 2015, (SIFMA Municipal Swap Index + 1.00%) 1.05% 2050 (put 2025)1 | 1,000 | 1,022 | ||||||
| Board of Trustees of Illinois State University, Auxiliary Facs. System Rev. Bonds, Series 2016, Assured Guaranty Municipal insured, 5.00% 2022 | 695 | 708 | ||||||
| Board of Trustees of Illinois State University, Auxiliary Facs. System Rev. Bonds, Series 2018-B, Assured Guaranty Municipal insured, 5.00% 2022 | 500 | 510 | ||||||
| Board of Trustees of Illinois State University, Auxiliary Facs. System Rev. Bonds, Series 2018-A, Assured Guaranty Municipal insured, 5.00% 2023 | 500 | 532 | ||||||
| Railsplitter Tobacco Settlement Auth., Tobacco Settlement Rev. Bonds, Series 2017, 5.00% 2022 | 250 | 257 | ||||||
| Railsplitter Tobacco Settlement Auth., Tobacco Settlement Rev. Bonds, Series 2017, 5.00% 2023 | 310 | 332 | ||||||
| City of Springfield, Water Rev. Bonds, Series 2012, 5.00% 2037 (preref. 2022) | 500 | 508 | ||||||
| Toll Highway Auth., Toll Highway Rev. Bonds, Series 2014-A, 5.00% 2021 | 120 | 120 | ||||||
| Toll Highway Auth., Toll Highway Rev. Bonds, Series 2019-C, 5.00% 2023 | 190 | 200 | ||||||
| Toll Highway Auth., Toll Highway Rev. Bonds, Series 2019-C, 5.00% 2025 | 545 | 622 | ||||||
| Toll Highway Auth., Toll Highway Rev. Ref. Bonds, Series 2014-D, 5.00% 2022 | 185 | 186 | ||||||
| Toll Highway Auth., Toll Highway Rev. Ref. Bonds, Series 2019-A, 5.00% 2023 | 175 | 185 | ||||||
| Toll Highway Auth., Toll Highway Rev. Ref. Bonds, Series 2019-A, 5.00% 2025 | 250 | 285 | ||||||
| Board of Trustees of the University of Illinois, Auxiliary Facs. System Rev. Bonds, Series 2018-A, 5.00% 2024 | 200 | 222 | ||||||
| Board of Trustees of the University of Illinois, Auxiliary Facs. System Rev. Ref. Bonds, Series 2015-A, 5.00% 2026 | 620 | 709 | ||||||
| County of Will, G.O. Bonds, Series 2016, 5.00% 2045 (preref. 2025) | 500 | 588 | ||||||
| 13,087 | ||||||||
| Indiana 2.05% | ||||||||
| Fin. Auth., Health System Rev. Bonds (Indiana University Health), Series 2019-C, 5.00% 2022 | 40 | 42 | ||||||
| Fin. Auth., Hospital Rev. Bonds (Community Health Network Project), Series 2012-A, 5.00% 2042 (preref. 2023) | 540 | 578 | ||||||
| Fin. Auth., Hospital Rev. Ref. Bonds (Parkview Health System), Series 2012-A, 5.00% 2022 | 440 | 450 | ||||||
| 38 | Private Client Services Funds |
Capital Group Short-Term Municipal Fund
| Bonds, notes & other debt instruments (continued) | Principal amount (000) | Value (000) | ||||||
| Indiana (continued) | ||||||||
| Fin. Auth., Rev. Bonds (Community Foundation of Northwest Indiana Obligated Group), Series 2012, 5.00% 2030 (preref. 2022) | $ | 245 | $ | 249 | ||||
| Fin. Auth., State Revolving Fund Program Green Bonds, Series 2021-B, 5.00% 2028 | 55 | 68 | ||||||
| Fin. Auth., Wastewater Utility Rev. Ref. Bonds, Series 2021-1, 5.00% 2025 | 155 | 182 | ||||||
| City of Franklin, Econ. Dev. and Rev. Ref. Bonds (Otterbein Homes Obligated Group), Series 2019-B, 5.00% 2023 | 510 | 548 | ||||||
| Health Fac. Fncg. Auth., Rev. Bonds (Ascension Health Subordinate Credit Group), Series 2005-A-1, 4.00% 2023 | 15 | 16 | ||||||
| Housing and Community Dev. Auth., Single Family Mortgage Rev. Bonds, Series 2019-A, 4.25% 2048 | 540 | 589 | ||||||
| Housing and Community Dev. Auth., Single Family Mortgage Rev. Bonds, Series 2020-A, 3.75% 2049 | 40 | 44 | ||||||
| Housing and Community Dev. Auth., Single Family Mortgage Rev. Bonds, Series 2021-C-1, 3.00% 2052 | 65 | 70 | ||||||
| City of Indianapolis, Local Public Improvement Bond Bank Bonds, Series 2021-A, 5.00% 2022 | 100 | 103 | ||||||
| City of Indianapolis, Local Public Improvement Bond Bank Bonds (Indianapolis Airport Auth. Project), Series 2019-I-2, 5.00% 2023 | 230 | 243 | ||||||
| City of Indianapolis, Local Public Improvement Bond Bank Bonds (Indianapolis Airport Auth. Project), Series 2019-I-2, 5.00% 2024 | 240 | 264 | ||||||
| City of Indianapolis, Local Public Improvement Bond Bank Bonds (Indianapolis Airport Auth. Project), Series 2019-I-2, 5.00% 2025 | 255 | 291 | ||||||
| City of Indianapolis, Local Public Improvement Bond Bank Rev. Ref. Bonds (Cityway 1 Project), Series 2021-B, 5.00% 2025 | 140 | 154 | ||||||
| City of Kokomo, Multi Family Housing Rev. Bonds (KHA RAD I Apartments), Series 2021-A, 0.56% 2025 (put 2024) | 265 | 265 | ||||||
| 4,156 | ||||||||
| Kansas 0.02% | ||||||||
| Unified Government of Wyandotte County, Board of Public Utilities, Utility System Improvement Rev. Bonds, Series 2012-B, 5.00% 2026 (preref. 2022) | 35 | 36 | ||||||
| Kentucky 0.63% | ||||||||
| Housing Corp., Multi Family Housing Rev. Bonds (New Hope Properties Portfolio Project), Series 2021, 0.41% 2024 (put 2023) | 485 | 485 | ||||||
| Housing Corp., Multi Family Housing Rev. Bonds (Winterwood II Rural Housing Portfolio), Series 2021, 0.37% 2024 (put 2023) | 195 | 195 | ||||||
| Property and Buildings Commission, Commonwealth Rev. Ref. Bonds (Project No. 125), Series 2021-A, 5.00% 2022 | 45 | 47 | ||||||
| Public Energy Auth., Gas Supply Rev. Bonds, Series 2019-A-1, 4.00% 2049 (put 2025) | 320 | 355 | ||||||
| Public Energy Auth., Gas Supply Rev. Bonds, Series 2018-B, 4.00% 2049 (put 2025) | 55 | 60 | ||||||
| County of Warren, Hospital Rev. Ref. Bonds (Bowling Green - Warren County Community Hospital Corp.), Series 2021-A, 5.00% 2022 | 135 | 138 | ||||||
| 1,280 | ||||||||
| Louisiana 0.88% | ||||||||
| Gasoline and Fuels Tax Rev. Ref. Bonds, Series 2017-D-2, 0.55% 2043 (put 2022) | 1,000 | 1,000 | ||||||
| Housing Corp., Multi Family Housing Rev. Bonds (Mabry Place Townhomes Project), Series 2021, 0.31% 2024 (put 2023) | 55 | 55 | ||||||
| Parish of Jefferson, Sales Tax Rev. Ref. Bonds, Series 2019-A, Assured Guaranty Municipal insured, 5.00% 2023 | 250 | 273 | ||||||
| Offshore Terminal Auth., Deepwater Port Rev. Bonds (Loop LLC Project), Series 2007-A, 1.65% 2027 (put 2023) | 105 | 107 | ||||||
| Parish of Tangipahoa, Hospital Service Dist. No. 1, Hospital Rev. Ref. Bonds (North Oaks Health System Project), Series 2021, 5.00% 2027 | 265 | 319 | ||||||
| Tobacco Settlement Fncg. Corp., Tobacco Settlement Asset-Backed Rev. Ref. Bonds, Series 2013-A, 5.00% 2023 | 30 | 32 | ||||||
| 1,786 | ||||||||
| Maine 0.13% | ||||||||
| Housing Auth., Mortgage Purchase Bonds, Series 2017-A, 4.00% 2047 | 250 | 265 | ||||||
| Maryland 2.04% | ||||||||
| County of Baltimore, Rev. Bonds (Oak Crest Village, Inc. Fac.), Series 2016, 5.00% 2022 | 400 | 403 | ||||||
| Community Dev. Administration, Dept. of Housing and Community Dev., Residential Rev. Bonds, Series 2018-A, 4.50% 2048 | 850 | 947 | ||||||
| Community Dev. Administration, Dept. of Housing and Community Dev., Residential Rev. Bonds, Series 2019-A, 4.25% 2049 | 90 | 99 | ||||||
| Private Client Services Funds | 39 |
Capital Group Short-Term Municipal Fund
| Bonds, notes & other debt instruments (continued) | Principal amount (000) | Value (000) | ||||||
| Maryland (continued) | ||||||||
| County of Montgomery, Housing Opportunities Commission, Single Family Housing Rev. Bonds, Series 2017-A, 4.00% 2048 | $ | 270 | $ | 290 | ||||
| County of Montgomery, Housing Opportunities Commission, Single Family Housing Rev. Bonds, Series 2018-A, 4.00% 2049 | 405 | 437 | ||||||
| Stadium Auth., Rev. Bonds (Baltimore City Public Schools Construction and Revitalization Program), Series 2016, 5.00% 2041 (preref. 2026) | 1,025 | 1,226 | ||||||
| Dept. of Transportation, Consolidated Transportation Rev. Ref. Bonds, Series 2015, 5.00% 2023 | 110 | 117 | ||||||
| Dept. of Transportation, Consolidated Transportation Rev. Ref. Bonds, Series 2022-A, 5.00% 2027 | 500 | 609 | ||||||
| 4,128 | ||||||||
| Massachusetts 0.39% | ||||||||
| Dev. Fin. Agcy., Multi Family Housing Rev. Bonds (Salem Heights II Preservation Associates LP Issue), Series 2021-B, 0.25% 2024 (put 2023) | 50 | 50 | ||||||
| Dev. Fin. Agcy., Rev. Ref. Bonds (Berkshire Health Systems Issue), Series 2021-I, 5.00% 2023 | 240 | 261 | ||||||
| Housing Fin. Agcy., Housing Green Bonds, Series 2021-B-2, 0.75% 2025 | 15 | 15 | ||||||
| Housing Fin. Agcy., Single Family Housing Rev. Bonds, Series 169, 4.00% 2044 | 35 | 36 | ||||||
| Housing Fin. Agcy., Single Family Housing Rev. Bonds, Series 183, 3.50% 2046 | 280 | 293 | ||||||
| Housing Fin. Agcy., Single Family Housing Rev. Ref. Bonds, Series 171, 4.00% 2044 | 140 | 143 | ||||||
| 798 | ||||||||
| Michigan 2.76% | ||||||||
| City of Detroit, Water and Sewerage Dept., Sewage Disposal System Rev. and Rev. Ref. Bonds, Series 2012-A, 5.00% 2023 | 700 | 722 | ||||||
| City of Detroit, Water and Sewerage Dept., Sewage Disposal System Rev. and Rev. Ref. Bonds, Series 2012-A, 5.00% 2032 (preref. 2022) | 45 | 47 | ||||||
| Fin. Auth., Hospital Rev. and Rev. Ref. Bonds (Trinity Health Credit Group), Series 2017-A, 5.00% 2047 (preref. 2022) | 1,290 | 1,357 | ||||||
| Fin. Auth., Hospital Rev. Ref. Bonds (McLaren Health Care), Series 2015-D-1, 0.25% 2022 | 5 | 5 | ||||||
| Grant Anticipation Rev. Ref. Bonds, Series 2016, 5.00% 2027 | 500 | 611 | ||||||
| Hospital Fin. Auth., Hospital Rev. Ref. Bonds (Trinity Health Credit Group), Series 2012-C, 5.00% 2026 (preref. 2022) | 120 | 123 | ||||||
| Housing Dev. Auth., Multi Family Housing Rev. Bonds, Series 2020, 0.32% 2023 (put 2022) | 415 | 415 | ||||||
| Housing Dev. Auth., Rental Housing Rev. Bonds, Series 2021-A, 0.55% 2025 | 50 | 50 | ||||||
| Housing Dev. Auth., Single Family Mortgage Rev. Bonds, Series 2017-B, 3.50% 2048 | 90 | 96 | ||||||
| Housing Dev. Auth., Single Family Mortgage Rev. Bonds, Series 2018-C, 4.25% 2049 | 550 | 600 | ||||||
| City of Lansing, Board of Water and Light, Utility System Rev. Bonds, Series 2019-A, 5.00% 2024 | 375 | 421 | ||||||
| County of Monroe, Econ. Dev. Corp., Limited Obligation Rev. Ref. Bonds (Detroit Edison Co. Project), Series 1992-AA, National insured, 6.95% 2022 | 500 | 527 | ||||||
| County of Wayne, Airport Auth., Airport Rev. Bonds (Detroit Metropolitan Wayne County Airport), Series 2015-G, 5.00% 2021 | 300 | 301 | ||||||
| County of Wayne, Airport Auth., Airport Rev. Bonds (Detroit Metropolitan Wayne County Airport), Series 2018-C, 5.00% 2023 | 290 | 318 | ||||||
| 5,593 | ||||||||
| Minnesota 1.19% | ||||||||
| City of Hopkins, Multi Family Housing Rev. Bonds (Raspberry Ridge Project), Series 2021, 0.26% 2024 (put 2023) | 145 | 145 | ||||||
| Housing Fin. Agcy., Residential Housing Fin. Bonds, Series 2018-B, 4.00% 2048 | 350 | 377 | ||||||
| Housing Fin. Agcy., Residential Housing Fin. Bonds, Series 2018-E, 4.25% 2049 | 590 | 648 | ||||||
| Housing Fin. Agcy., Residential Housing Fin. Bonds, Series 2020-E, 3.50% 2050 | 500 | 542 | ||||||
| Housing Fin. Agcy., Residential Housing Fin. Bonds, Series 2020-B, 3.50% 2050 | 460 | 499 | ||||||
| City of Mahtomedi, Multi Family Housing Rev. Bonds (Lincoln Place / Vadnais Highlands Projects), Series 2021, 0.25% 2023 (put 2022) | 80 | 80 | ||||||
| Regents of the University of Minnesota, G.O. Rev. Ref. Bonds, Series 2017B, 5.00% 2021 | 120 | 120 | ||||||
| 2,411 | ||||||||
| 40 | Private Client Services Funds |
Capital Group Short-Term Municipal Fund
| Bonds, notes & other debt instruments (continued) | Principal amount (000) | Value (000) | ||||||
| Mississippi 0.11% | ||||||||
| Business Fin. Corp., Solid Waste Disposal Rev. Bonds (Waste Management, Inc. Project), Series 2004, 0.70% 2029 (put 2026) | $ | 175 | $ | 172 | ||||
| Home Corp., Collateralized Multi Family Housing Bonds (J&A Dev. Portfolio Project I), Series 2021-1, 0.30% 2024 (put 2023) | 60 | 60 | ||||||
| 232 | ||||||||
| Missouri 0.49% | ||||||||
| Housing Dev. Commission, Single Family Mortgage Rev. Bonds (First Place Homeownership Loan Program), Series 2016-B, 3.50% 2041 | 610 | 641 | ||||||
| Housing Dev. Commission, Single Family Mortgage Rev. Bonds (First Place Homeownership Loan Program), Series 2020-A, 3.50% 2050 | 185 | 201 | ||||||
| Housing Dev. Commission, Single Family Mortgage Rev. Bonds (First Place Homeownership Loan Program), Series 2021-A, 3.00% 2052 | 60 | 64 | ||||||
| County of St. Charles, Industrial Dev. Auth., Multi Family Housing Rev. Bonds (Hidden Valley Estates), Series 2021, 0.27% 2025 (put 2023) | 85 | 85 | ||||||
| 991 | ||||||||
| Montana 0.21% | ||||||||
| Board of Housing, Single Family Mortgage Bonds, Series 2016-A-2, 3.50% 2044 | 115 | 121 | ||||||
| Board of Housing, Single Family Mortgage Bonds, Series 2019-A, 4.25% 2045 | 130 | 142 | ||||||
| Board of Housing, Single Family Mortgage Bonds, Series 2020-B, 4.00% 2050 | 140 | 155 | ||||||
| 418 | ||||||||
| Nebraska 0.59% | ||||||||
| Investment Fin. Auth., Single Family Housing Rev. Bonds, Series 2014-A, 4.00% 2044 | 220 | 232 | ||||||
| Investment Fin. Auth., Single Family Housing Rev. Bonds, Series 2016-C, 3.50% 2046 | 75 | 76 | ||||||
| Investment Fin. Auth., Single Family Housing Rev. Bonds, Series 2018-C, 4.00% 2048 | 445 | 484 | ||||||
| Investment Fin. Auth., Single Family Housing Rev. Bonds, Series 2021-C, 3.00% 2050 | 375 | 405 | ||||||
| 1,197 | ||||||||
| Nevada 0.68% | ||||||||
| County of Clark, Pollution Control Rev. Ref. Bonds (Nevada Power Co. Projects), Series 2017, 1.65% 2036 (put 2023) | 645 | 656 | ||||||
| Housing Division, Multi Unit Housing Rev. Bonds (Pinewood Terrace Apartments), Series 2021, 0.26% 2024 (put 2022) | 75 | 75 | ||||||
| Las Vegas Valley Water Dist., Limited Tax G.O. Water Improvement and Rev. Ref. Bonds, Series 2016-A, 5.00% 2023 | 600 | 645 | ||||||
| 1,376 | ||||||||
| New Jersey 0.80% | ||||||||
| Econ. Dev. Auth., Water Facs. Rev. Ref. Bonds (American Water Co., Inc. Project), Series 2020-A, 1.00% 2023 | 275 | 278 | ||||||
| Housing and Mortgage Fin. Agcy., Single Family Housing Rev. Bonds, Series 2018-A, 4.50% 2048 | 465 | 517 | ||||||
| Tobacco Settlement Fncg. Corp., Tobacco Settlement Bonds, Series 2018-A, 5.00% 2023 | 200 | 214 | ||||||
| Tobacco Settlement Fncg. Corp., Tobacco Settlement Bonds, Series 2018-A, 5.00% 2026 | 500 | 589 | ||||||
| Turnpike Auth., Turnpike Rev. Bonds, Series 2020-D, 5.00% 2028 | 30 | 35 | ||||||
| 1,633 | ||||||||
| New Mexico 0.29% | ||||||||
| Mortgage Fin. Auth., Single Family Mortgage Program Bonds, Series 2019-A-1, Class I, 4.25% 2050 | 400 | 440 | ||||||
| Municipal Energy Acquisition Auth., Gas Supply Rev. Ref. and Acquisition Bonds, Series 2019, 5.00% 2039 (put 2025) | 135 | 155 | ||||||
| 595 | ||||||||
| Private Client Services Funds | 41 |
Capital Group Short-Term Municipal Fund
| Bonds, notes & other debt instruments (continued) | Principal amount (000) | Value (000) | ||||||
| New York 5.15% | ||||||||
| Build NYC Resource Corp., Rev. Ref. Bonds (Ethical Culture Fieldston School Project), Series 2015, 5.00% 2024 | $ | 360 | $ | 400 | ||||
| Dormitory Auth., State Personal Income Tax Rev. Bonds (General Purpose), Series 2017-A, 5.00% 2022 | 175 | 177 | ||||||
| Dormitory Auth., State Personal Income Tax Rev. Bonds (General Purpose), Series 2020-A-2, 5.00% 2031 | 15 | 20 | ||||||
| City of Geneva, Dev. Corp., Rev. Ref. Bonds (Hobart and William Smith Colleges Project), Series 2012, 5.00% 2032 (preref. 2022) | 40 | 42 | ||||||
| Housing Fin. Agcy., Affordable Housing Rev. Green Bonds, Series 2020-K, 0.70% 2024 | 85 | 85 | ||||||
| Housing Fin. Agcy., Affordable Housing Rev. Green Bonds, Series 2020-L-2, 0.75% 2025 | 250 | 250 | ||||||
| Housing Fin. Agcy., Affordable Housing Rev. Green Bonds, Series 2021-D-2, 0.65% 2056 (put 2025) | 195 | 194 | ||||||
| Housing Fin. Agcy., Affordable Housing Rev. Green Bonds, Series 2021-I-2, 0.70% 2056 (put 2025) | 190 | 190 | ||||||
| Long Island Power Auth., Electric System General Rev. Bonds, Series 2014-C, | ||||||||
| (1-month USD-LIBOR x 0.70 + 0.75%) 0.807% 2033 (put 2023)1 | 300 | 301 | ||||||
| Long Island Power Auth., Electric System General Rev. Bonds, Series 2015-C, (1-month USD-LIBOR x 0.70 + 0.75%) 0.807% 2033 (put 2023)1 | 260 | 261 | ||||||
| Metropolitan Transportation Auth., Transportation Rev. Bonds, Series 2012-B, 5.00% 2022 | 195 | 204 | ||||||
| Metropolitan Transportation Auth., Transportation Rev. Bonds, Series 2012-C, 5.00% 2032 (preref. 2022) | 500 | 525 | ||||||
| Metropolitan Transportation Auth., Transportation Rev. Green Bonds, Series 2016-A-2, 5.00% 2024 | 300 | 339 | ||||||
| Metropolitan Transportation Auth., Transportation Rev. Ref. Bonds, Series 2012-F, 5.00% 2022 | 230 | 241 | ||||||
| Metropolitan Transportation Auth., Transportation Rev. Ref. Bonds, Series 2002-D-2-B, Assured Guaranty Municipal insured, (USD-SOFR x 0.67 + 0.55%) 0.583% 2032 (put 2024)1 | 255 | 256 | ||||||
| Metropolitan Transportation Auth., Transportation Rev. Ref. Bonds, Series 2002-D-2-A-2, Assured Guaranty Municipal insured, (USD-SOFR x 0.67 + 0.80%) 0.833% 2032 (put 2026)1 | 60 | 61 | ||||||
| Metropolitan Transportation Auth., Transportation Rev. Ref. Green Bonds, Series 2017-B, 5.00% 2023 | 455 | 497 | ||||||
| Metropolitan Transportation Auth., Transportation Rev. Ref. Green Bonds, Series 2017-C-1, 5.00% 2024 | 50 | 57 | ||||||
| Mortgage Agcy., Homeowner Mortgage Rev. Bonds, Series 197, 3.50% 2044 | 410 | 434 | ||||||
| Mortgage Agcy., Homeowner Mortgage Rev. Bonds, Series 233, 3.00% 2045 | 300 | 323 | ||||||
| Mortgage Agcy., Homeowner Mortgage Rev. Bonds, Series 213, 4.25% 2047 | 505 | 552 | ||||||
| New York City G.O. Bonds, Series 2018-C, 5.00% 2023 | 1,000 | 1,083 | ||||||
| New York City G.O. Bonds, Series 2014-I-1, 5.00% 2026 | 185 | 205 | ||||||
| New York City G.O. Bonds, Series 2021-A-1, 5.00% 2033 | 70 | 92 | ||||||
| New York City G.O. Bonds, Series 2015-F-4, 5.00% 2044 (put 2025) | 75 | 86 | ||||||
| New York City Housing Dev. Corp., Multi Family Housing Rev. Bonds (Sustainable Dev. Bonds), Series 2017-C-3-A, 0.20% 2022 | 45 | 45 | ||||||
| New York City Housing Dev. Corp., Multi Family Housing Rev. Bonds (Sustainable Dev. Bonds), Series 2016-C-2, 0.23% 2050 (put 2022) | 55 | 55 | ||||||
| New York City Housing Dev. Corp., Multi Family Housing Rev. Bonds (Sustainable Dev. Bonds), Series 2021-C-2, 0.70% 2060 (put 2025) | 330 | 331 | ||||||
| New York City Housing Dev. Corp., Multi Family Housing Rev. Bonds (Sustainable Neighborhood Bonds), Series 2017-G-2-A, 2.00% 2057 (put 2021) | 55 | 55 | ||||||
| New York City Housing Dev. Corp., Multi Family Housing Rev. Bonds (Sustainable Neighborhood Bonds), Series 2020-I-2, 0.70% 2060 (put 2025) | 230 | 230 | ||||||
| New York City Housing Dev. Corp., Multi Family Housing Rev. Green Bonds, Series 2021-F-2, 0.60% 2061 (put 2025) | 220 | 219 | ||||||
| New York City Municipal Water Fin. Auth., Water and Sewer System Second General Resolution Rev. Bonds, Series 2021-BB-2, 4.00% 2024 | 500 | 548 | ||||||
| New York City Transitional Fin. Auth., Future Tax Secured Bonds, Series 2019-C-1, 5.00% 2021 | 150 | 150 | ||||||
| New York City Transitional Fin. Auth., Future Tax Secured Bonds, Series 2020-A-1, 5.00% 2022 | 10 | 10 | ||||||
| New York City Transitional Fin. Auth., Future Tax Secured Bonds, Series 2021-E-1, 5.00% 2023 | 20 | 21 | ||||||
| New York City Transitional Fin. Auth., Future Tax Secured Bonds, Series 2021-F-1, 5.00% 2024 | 400 | 455 | ||||||
| New York City Transitional Fin. Auth., Future Tax Secured Bonds, Series 2013-I, 5.00% 2027 | 180 | 193 | ||||||
| Public Housing Capital Fund Rev. Trust I, Trust Certs., Series 2012, 4.50% 20222 | 47 | 47 | ||||||
| Triborough Bridge and Tunnel Auth., General Rev. Bonds (MTA Bridges and Tunnels), Series 2017-C-1, 5.00% 2025 | 500 | 588 | ||||||
| Utility Debt Securitization Auth., Restructuring Bonds, Series 2017, 5.00% 2025 | 10 | 11 | ||||||
| County of Westchester, Industrial Dev. Agcy., Multi Family Housing Rev. Bonds (EG Mt. Vernon Preservation, LP Project), Series 2020, 0.30% 2023 (put 2022) | 155 | 155 | ||||||
| County of Westchester, Industrial Dev. Agcy., Multi Family Housing Rev. Bonds (Marble Hall - Tuckahoe LP Project), Series 2021, 0.28% 2024 (put 2023) | 455 | 454 | ||||||
| 10,442 | ||||||||
| 42 | Private Client Services Funds |
Capital Group Short-Term Municipal Fund
| Bonds, notes & other debt instruments (continued) | Principal amount (000) | Value (000) | ||||||
| North Carolina 1.70% | ||||||||
| City of Burlington, Housing Auth., Multi Family Housing Rev. Bonds (Thetford Portfolio), Series 2021, 0.30% 2024 (put 2022) | $ | 325 | $ | 325 | ||||
| City of Durham, Housing Auth., Multi Family Housing Rev. Bonds (JJ Henderson Apartments Project), Series 2020, 0.30% 2024 (put 2023) | 20 | 20 | ||||||
| City of Goldsboro, Multi Family Housing Rev. Bonds (Grand at Day Point), Series 2021, 0.28% 2024 (put 2023) | 105 | 105 | ||||||
| Hospital Auth., Health Care Rev. Bonds (Charlotte-Mecklenburg Hospital), Series 2021-B, 5.00% 2050 (put 2024) | 980 | 1,115 | ||||||
| Housing Fin. Agcy., Home Ownership Rev. Ref. Bonds, Series 38-B, 4.00% 2047 | 205 | 219 | ||||||
| Housing Fin. Agcy., Home Ownership Rev. Ref. Bonds, Series 44, 4.00% 2050 | 75 | 83 | ||||||
| Housing Fin. Agcy., Home Ownership Rev. Ref. Bonds, Series 42, 4.00% 2050 | 70 | 76 | ||||||
| Housing Fin. Agcy., Multi Family Housing Rev. Bonds (Winds Crest Senior Living, LP), Series 2021, 0.36% 2024 (put 2023) | 105 | 105 | ||||||
| City of Sanford, Housing Auth., Multi Family Housing Rev. Bonds (Matthews Garden Gilmore), Series 2020, 0.30% 2023 (put 2022) | 750 | 750 | ||||||
| University of North Carolina at Chapel Hill, General Rev. Bonds, Series 2012-B, (1-month USD-LIBOR x 0.67 + 0.40%) 0.455% 2041 (put 2022)1 | 440 | 441 | ||||||
| City of Winston-Salem, Water and Sewer System Rev. Ref. Bonds, Series 2020-A, 5.00% 2022 | 200 | 206 | ||||||
| 3,445 | ||||||||
| North Dakota 0.40% | ||||||||
| Housing Fin. Agcy., Homeownership Rev. Bonds (Home Mortgage Fin. Program), Series 2016-D, 3.50% 2046 | 125 | 133 | ||||||
| Housing Fin. Agcy., Housing Fin. Program Bonds (Home Mortgage Fin. Program), Series 2015-A, 4.00% 2038 | 420 | 435 | ||||||
| Housing Fin. Agcy., Housing Fin. Program Bonds (Home Mortgage Fin. Program), Series 2015-D, 4.00% 2046 | 240 | 252 | ||||||
| 820 | ||||||||
| Ohio 2.61% | ||||||||
| Akron, Bath and Copley Joint Township Hospital Dist., Hospital Facs. Rev. Bonds (Akron General Health System), Series 2012, 5.00% 2031 (preref. 2022) | 375 | 378 | ||||||
| City of Dayton, Metropolitan Housing Auth., Multi Family Housing Rev. Bonds (Southern Montgomery Apartments Project), Series 2021-A, 0.32% 2024 (put 2023) | 200 | 200 | ||||||
| G.O. Conservation Projects Bonds, Series 2019-A, 2.00% 2022 | 20 | 20 | ||||||
| G.O. Infrastructure Improvement Bonds, Series 2021-A, 5.00% 2030 | 125 | 162 | ||||||
| County of Geauga, Rev. Bonds (South Franklin Circle Project), Series 2012-A, 8.00% 2047 (preref. 2022)3 | 890 | 986 | ||||||
| Hospital Rev. Ref. Bonds (Cleveland Clinic Health System Obligated Group), Series 2021-B, 5.00% 2024 | 310 | 341 | ||||||
| Hospital Rev. Ref. Bonds (Cleveland Clinic Health System Obligated Group), Series 2021-B, 5.00% 2026 | 500 | 590 | ||||||
| Housing Fin. Agcy., Multi Family Housing Rev. Bonds (Chevybrook Estates Apartments Project), Series 2021, 0.35% 2024 (put 2023) | 50 | 50 | ||||||
| Housing Fin. Agcy., Multi Family Housing Rev. Bonds (Glen Meadows Apartments Project), Series 2021-A, 0.40% 2024 (put 2023) | 80 | 80 | ||||||
| Housing Fin. Agcy., Multi Family Housing Rev. Bonds (Pinzone Tower Apartments Project), Series 2021, 0.28% 2023 (put 2022) | 190 | 190 | ||||||
| Housing Fin. Agcy., Residential Mortgage Rev. Bonds (Mortgage-Backed Securities Program), Series 2017-D, 4.00% 2048 | 80 | 86 | ||||||
| Housing Fin. Agcy., Residential Mortgage Rev. Bonds (Mortgage-Backed Securities Program), Series 2019-A, 4.50% 2049 | 185 | 205 | ||||||
| Housing Fin. Agcy., Residential Mortgage Rev. Bonds (Mortgage-Backed Securities Program), Series 2020-A, 3.75% 2050 | 135 | 148 | ||||||
| Housing Fin. Agcy., Residential Mortgage Rev. Bonds (Mortgage-Backed Securities Program), Series 2021-C, 3.25% 2051 | 225 | 246 | ||||||
| G.O. Infrastructure Improvement Rev. Ref. Bonds, Series 2016-A, 5.00% 2022 | 600 | 633 | ||||||
| Madison Local School Dist., School Improvement Rev. Ref. Bonds, Series 2014, 5.25% 2037 (preref. 2022) | 530 | 545 | ||||||
| County of Montgomery, Hospital Facs. Rev. Bonds (Dayton Children’s Hospital), Series 2021, 5.00% 2029 | 30 | 38 | ||||||
| County of Montgomery, Hospital Facs. Rev. Bonds (Dayton Children’s Hospital), Series 2021, 5.00% 2032 | 160 | 210 | ||||||
| Turnpike and Infrastructure Commission, Rev. Bonds, Series 2013-A-1, 5.00% 2025 | 125 | 133 | ||||||
| Water Dev. Auth., Water Dev. Rev. Bonds, Series 2013-A, 5.00% 2023 | 25 | 27 | ||||||
| Water Dev. Auth., Water Pollution Control Loan Fund Rev. Bonds, Series 2019-A, 5.00% 2029 | 15 | 19 | ||||||
| 5,287 | ||||||||
| Private Client Services Funds | 43 |
Capital Group Short-Term Municipal Fund
| Bonds, notes & other debt instruments (continued) | Principal amount (000) | Value (000) | ||||||
| Oklahoma 0.62% | ||||||||
| Capital Improvement Auth., State Highways Capital Improvement Rev. Ref. Bonds (Oklahoma Dept. of Transportation Project), Series 2020-A, 5.00% 2023 | $ | 145 | $ | 156 | ||||
| Housing Fin. Agcy., Collateralized Rev. Bonds (Deer Park & Apple Run Apartments), Series 2019, 1.60% 2022 | 250 | 250 | ||||||
| Housing Fin. Agcy., Single Family Mortgage Rev. Bonds (Homeownership Loan Program), Series 2012-A, 5.00% 2043 | 40 | 41 | ||||||
| Board of Regents of Oklahoma State University, General Rev. Ref. Bonds, Series 2020-A, 5.00% 2024 | 275 | 311 | ||||||
| Board of Regents of Oklahoma State University, General Rev. Ref. Bonds, Series 2020-A, 5.00% 2025 | 420 | 491 | ||||||
| 1,249 | ||||||||
| Oregon 0.21% | ||||||||
| G.O. Bonds (Veteran’s Welfare Bonds Series 108), Series 2021-O, 3.00% 2051 | 245 | 266 | ||||||
| Housing and Community Services Dept., Housing Dev. Rev. Bonds (The Susan Emmons Apartments Project), Series 2021-S-2, 0.38% 2024 (put 2023) | 115 | 115 | ||||||
| Housing and Community Services Dept., Housing Dev. Rev. Bonds (Westwind Apartments Project), Series 2021-H, 0.25% 2024 (put 2023) | 50 | 50 | ||||||
| 431 | ||||||||
| Pennsylvania 1.92% | ||||||||
| County of Allegheny, Hospital Dev. Auth., UPMC Rev. Bonds, Series 2019-A, 5.00% 2022 | 300 | 310 | ||||||
| Bethlehem Area School Dist. Auth., School Rev. Bonds (Bethlehem Area School Dist. Ref. Project), Series 2021-C, (USD-SOFR x 0.67 + 0.35%) 0.384% 2030 (put 2025)1 | 50 | 50 | ||||||
| Bethlehem Area School Dist. Auth., School Rev. Bonds (Bethlehem Area School Dist. Ref. Project), Series 2021-B, (USD-SOFR x 0.67 + 0.35%) 0.384% 2031 (put 2025)1 | 70 | 70 | ||||||
| Bethlehem Area School Dist. Auth., School Rev. Bonds (Bethlehem Area School Dist. Ref. Project), Series 2021-C, (USD-SOFR x 0.67 + 0.35%) 0.384% 2032 (put 2025)1 | 55 | 55 | ||||||
| Cumberland Valley School Dist., G.O. Bonds, Series 2015, 5.00% 2032 (preref. 2023) | 20 | 22 | ||||||
| Cumberland Valley School Dist., G.O. Bonds, Series 2015, 5.00% 2034 (preref. 2023) | 20 | 22 | ||||||
| Housing Fin. Agcy., Single Family Mortgage Rev. Bonds, Series 2017-122, 4.00% 2046 | 235 | 251 | ||||||
| Housing Fin. Agcy., Single Family Mortgage Rev. Bonds, Series 2020-133, 3.00% 2050 | 355 | 380 | ||||||
| Housing Fin. Agcy., Special Limited Obligation, Multi Family Housing Dev. Bonds (Harrison Senior Tower), Series 2021, 0.25% 2024 (put 2023) | 760 | 757 | ||||||
| Housing Fin. Agcy., Special Limited Obligation, Multi Family Housing Dev. Bonds (School of Nursing), Series 2021, 0.27% 2024 (put 2023) | 85 | 85 | ||||||
| County of Montgomery, Higher Education and Health Auth., Hospital Rev. Bonds (Abington Memorial Hospital Obligated Group), Series 2012-A, 5.00% 2031 (preref. 2022) | 775 | 796 | ||||||
| Philadelphia School Dist., G.O. Bonds, Series 2021-A, 5.00% 2027 | 190 | 232 | ||||||
| Turnpike Commission, Turnpike Rev. Bonds, Series 2021-B, 5.00% 2022 | 95 | 100 | ||||||
| Turnpike Commission, Turnpike Rev. Bonds, Series 2011-E, 5.00% 2042 (preref. 2022) | 275 | 289 | ||||||
| Turnpike Commission, Turnpike Rev. Bonds, Series 2011-E, 5.00% 2029 (preref. 2021) | 185 | 186 | ||||||
| Turnpike Commission, Turnpike Rev. Bonds, Series 2011-E, 5.00% 2030 (preref. 2021) | 55 | 55 | ||||||
| Wilkes-Barre Area School Dist., G.O. Bonds, Series 2019, BAM insured, 5.00% 2023 | 225 | 240 | ||||||
| 3,900 | ||||||||
| Rhode Island 0.08% | ||||||||
| Housing and Mortgage Fin. Corp., Homeownership Opportunity Bonds, Series 66-A-1, 4.00% 2033 | 165 | 170 | ||||||
| South Carolina 1.38% | ||||||||
| County of Charleston, G.O. Capital Improvement Transportation Sales Tax Bonds, Series 2011, 5.00% 2024 (preref. 2021) | 500 | 500 | ||||||
| City of Columbia, Housing Auth., Multi Family Housing Rev. Bonds (Palmetto Terrace Apartments Project), Series 2021, 0.31% 2024 (put 2023) | 130 | 130 | ||||||
| Housing Fin. and Dev. Auth., Mortgage Rev. Bonds, Series 2018-A, 4.50% 2048 | 225 | 246 | ||||||
| Housing Fin. and Dev. Auth., Mortgage Rev. Bonds, Series 2020-A, 4.00% 2050 | 160 | 177 | ||||||
| Housing Fin. and Dev. Auth., Mortgage Rev. Bonds, Series 2021-A, 3.00% 2052 | 80 | 87 | ||||||
| Housing Fin. and Dev. Auth., Mortgage Rev. Ref. Bonds, Series 2016-A, 4.00% 2036 | 225 | 241 | ||||||
| Lexington County Health Services Dist., Inc., Hospital Rev. Ref. Bonds, Series 2017, 5.00% 2021 | 250 | 250 | ||||||
| Patriots Energy Group Fncg. Agcy., Gas Supply Rev. Bonds, Series 2018-A, 4.00% 2048 (put 2024) | 55 | 59 | ||||||
| Public Service Auth., Rev. Obligations (Santee Cooper), Series 2011-B, 5.00% 2021 (escrowed to maturity) | 405 | 407 | ||||||
| Public Service Auth., Rev. Obligations (Santee Cooper), Series 2014-C, 5.00% 2025 | 120 | 136 | ||||||
| 44 | Private Client Services Funds |
Capital Group Short-Term Municipal Fund
| Bonds, notes & other debt instruments (continued) | Principal amount (000) | Value (000) | ||||||
| South Carolina (continued) | ||||||||
| Public Service Auth., Rev. Obligations (Santee Cooper), Series 2011-C, 5.00% 2036 | $ | 110 | $ | 110 | ||||
| Public Service Auth., Rev. Ref. Obligations (Santee Cooper), Series 2015-A, 5.00% 2028 | 35 | 40 | ||||||
| Town of Southold, Local Dev. Corp., Rev. Bonds (Peconic Landing at Southold, Inc. Project), Series 2015, 5.00% 2022 | 400 | 420 | ||||||
| 2,803 | ||||||||
| South Dakota 0.39% | ||||||||
| Housing Dev. Auth., Homeownership Mortgage Bonds, Series 2014-E, 4.00% 2044 | 95 | 99 | ||||||
| Housing Dev. Auth., Homeownership Mortgage Bonds, Series 2018-B, 4.50% 2048 | 375 | 415 | ||||||
| Housing Dev. Auth., Homeownership Mortgage Bonds, Series 2021-B, 3.00% 2051 | 260 | 281 | ||||||
| 795 | ||||||||
| Tennessee 1.58% | ||||||||
| Town of Greeneville, Health and Educational Facs. Board, Multi Family Housing Rev. Bonds | ||||||||
| (People RD Portfolio Project), Series 2019, 1.45% 2022 (put 2021) | 1,100 | 1,101 | ||||||
| Housing Dev. Agcy., Homeownership Program Bonds, Series 2012-1-C, 4.50% 2037 | 25 | 25 | ||||||
| Housing Dev. Agcy., Homeownership Program Bonds, Series 2012-2-C, 4.00% 2038 | 20 | 20 | ||||||
| Housing Dev. Agcy., Residential Fin. Program Bonds, Series 2017-1, 4.00% 2042 | 200 | 214 | ||||||
| Housing Dev. Agcy., Residential Fin. Program Bonds, Series 2014-2-A, 4.00% 2045 | 570 | 601 | ||||||
| Housing Dev. Agcy., Residential Fin. Program Bonds, Series 2014-2-C, 4.00% 2045 | 245 | 257 | ||||||
| Housing Dev. Agcy., Residential Fin. Program Bonds, Series 2015-2-A, 3.75% 2050 | 265 | 290 | ||||||
| City of Knoxville, Community Dev. Corp., Collateralized Multi Family Housing Bonds (Austin 1B Apartments Project), Series 2021, 0.22% 2024 (put 2023) | 40 | 40 | ||||||
| Metropolitan Government of Nashville and Davidson County, Health and Educational Facs. Board, Rev. Bonds (Vanderbilt University Medical Center), Series 2021-A, 5.00% 2031 | 30 | 38 | ||||||
| Metropolitan Government of Nashville and Davidson County, Water & Sewer Rev. Bonds, Series 2013, 5.00% 2025 (preref. 2023) | 85 | 92 | ||||||
| Tennessee Energy Acquisition Corp., Gas Project Rev. Bonds, Series 2017-A, 4.00% 2048 (put 2023) | 500 | 524 | ||||||
| 3,202 | ||||||||
| Texas 18.63% | ||||||||
| Affordable Housing Corp., Multi Family Housing Rev. Bonds (Apartments of Las Palmas I LLC), Series 2021, 0.25% 2024 (put 2022) | 15 | 15 | ||||||
| Alvin Independent School Dist., Unlimited Tax Schoolhouse and Rev. Ref. Bonds, Series 2020, 5.00% 2022 | 625 | 634 | ||||||
| Arlington Higher Education Fin. Corp., Education Rev. and Rev. Ref. Bonds (Uplift Education), Series 2017-A, 5.00% 2022 | 645 | 678 | ||||||
| Arlington Higher Education Fin. Corp., Education Rev. Bonds (Great Hearts America - Texas), Series 2021-A, 4.00% 2025 | 15 | 17 | ||||||
| Arlington Higher Education Fin. Corp., Education Rev. Bonds (Great Hearts America - Texas), Series 2021-A, 4.00% 2026 | 15 | 17 | ||||||
| Arlington Higher Education Fin. Corp., Education Rev. Bonds (Harmony Public Schools), Series 2016-A, 5.00% 2024 | 310 | 342 | ||||||
| Arlington Higher Education Fin. Corp., Education Rev. Bonds (KIPP Texas, Inc.), Series 2019, 5.00% 2026 | 560 | 670 | ||||||
| Arlington Higher Education Fin. Corp., Education Rev. Bonds (Riverwalk Education Foundation, Inc.), Series 2019, 5.00% 2022 | 350 | 363 | ||||||
| Arlington Higher Education Fin. Corp., Education Rev. Bonds (Riverwalk Education Foundation, Inc.), Series 2019, 5.00% 2025 | 800 | 928 | ||||||
| Arlington Independent School Dist., Unlimited Tax School Building Bonds, Series 2017, 5.00% 2022 | 405 | 411 | ||||||
| City of Arlington, Water and Wastewater System Rev. Bonds, Series 2021, 5.00% 2023 | 165 | 177 | ||||||
| Austin Affordable PFC, Inc., Multi Family Housing Rev. Bonds (Bridge at Turtle Creek Apartments), Series 2020, 0.42% 2040 (put 2023) | 215 | 215 | ||||||
| Austin Community College Dist., Maintenance Tax Notes, Series 2021, 5.00% 2022 | 100 | 104 | ||||||
| City of Austin, Water and Wastewater System Rev. Ref. Bonds, Series 2020-C, 5.00% 2025 | 510 | 601 | ||||||
| City of Austin, Water and Wastewater System Rev. Ref. Bonds, Series 2021, 5.00% 2029 | 95 | 123 | ||||||
| Barbers Hill Independent School Dist., Unlimited Tax School Building Bonds, Series 2020, 5.00% 2030 | 70 | 91 | ||||||
| County of Bexar, Combination Tax and Rev. Certs. of Obligation, Series 2013-B, 5.00% 2033 (preref. 2023) | 105 | 113 | ||||||
| Brazosport Independent School Dist., Unlimited Tax School Building and Rev. Ref. Bonds, Series 2020, 5.00% 2022 | 1,000 | 1,014 | ||||||
| Brazosport Independent School Dist., Unlimited Tax School Building Bonds, Series 2019, 5.00% 2022 | 70 | 71 | ||||||
| Brownsville Independent School Dist., Unlimited Tax Rev. Ref. Bonds, Series 2020-A, 3.00% 2026 | 500 | 555 | ||||||
| Private Client Services Funds | 45 |
Capital Group Short-Term Municipal Fund
| Bonds, notes & other debt instruments (continued) | Principal amount (000) | Value (000) | ||||||
| Texas (continued) | ||||||||
| County of Cameron, Housing Fin. Corp., Multi Family Housing Rev. Bonds (Sunland Country Apartments), Series 2021, 0.28% 2024 (put 2023) | $ | 50 | $ | 50 | ||||
| Canyon Independent School Dist., Unlimited Tax School Building Bonds, Series 2019, 5.00% 2022 | 165 | 167 | ||||||
| Capital Area Housing Fin. Corp., Multi Family Housing Rev. Bonds (Redwood Apartments), Series 2020, 0.41% 2041 (put 2024) | 460 | 460 | ||||||
| Carrollton-Farmers Branch Independent School Dist., Unlimited Tax School Building Bonds, Series 2021, 5.00% 2023 | 135 | 143 | ||||||
| Clear Creek Independent School Dist., Unlimited Tax School Building Bonds, Series 2013-B, 0.28% 2038 (put 2024) | 100 | 100 | ||||||
| Conroe Independent School Dist., Unlimited Tax Rev. Ref. Bonds, Series 2019, 5.00% 2022 | 50 | 51 | ||||||
| Conroe Independent School Dist., Unlimited Tax School Building and Rev. Ref. Bonds, Series 2020-A, 5.00% 2025 | 1,000 | 1,149 | ||||||
| Cypress-Fairbanks Independent School Dist., Unlimited Tax Rev. Ref. Bonds, Series 2013, 5.00% 2025 (preref. 2023) | 600 | 637 | ||||||
| Cypress-Fairbanks Independent School Dist., Unlimited Tax School Building and Rev. Ref. Bonds, Series 2014-C, 5.00% 2027 | 500 | 553 | ||||||
| Cypress-Fairbanks Independent School Dist., Unlimited Tax School Building Bonds, Series 2015-B-2, 0.28% 2040 (put 2024) | 210 | 208 | ||||||
| Cities of Dallas and Fort Worth, Dallas/Fort Worth International Airport, Joint Rev. Ref. Bonds, Series 2014-E, 5.00% 2023 | 370 | 387 | ||||||
| City of Dallas, Housing Fin. Corp., Multi Family Housing Rev. Bonds (Midpark Towers), Series 2021, 0.35% 2024 (put 2023) | 180 | 180 | ||||||
| Dallas Independent School Dist., Unlimited Tax Rev. Ref. Bonds, Series 2014-A, 5.00% 2023 | 15 | 16 | ||||||
| Dallas Independent School Dist., Unlimited Tax Rev. Ref. Bonds, Series 2015, 5.00% 2030 | 400 | 456 | ||||||
| Del Mar College Dist., Limited Tax Bonds, Series 2020-B, 5.00% 2024 | 400 | 450 | ||||||
| Del Mar College Dist., Limited Tax Bonds, Series 2020-A, 5.00% 2026 | 335 | 401 | ||||||
| Del Valle Independent School Dist., Unlimited Tax School Building Bonds, Series 2020, 5.00% 2022 | 155 | 160 | ||||||
| El Paso Independent School Dist., Unlimited Tax Rev. Ref. Bonds, Series 2015, 5.00% 2026 | 400 | 452 | ||||||
| Fort Bend Independent School Dist., Unlimited Tax Rev. Ref. Bonds, Series 2020, 5.00% 2024 | 130 | 147 | ||||||
| Fort Bend Independent School Dist., Unlimited Tax Rev. Ref. Bonds, Series 2021-B, 0.72% 2051 (put 2026) | 500 | 499 | ||||||
| Fort Bend Independent School Dist., Unlimited Tax School Building Bonds, Series 2019-A, 1.95% 2049 (put 2022)3 | 420 | 425 | ||||||
| G.O. Water Financial Assistance Rev. Ref. Bonds, Series 2021-B, 4.00% 2030 | 50 | 56 | ||||||
| City of Galveston, Public Fac. Corp., Multi Family Housing Rev. Bonds (The Orleanders at Broadway), Series 2021, 0.47% 2025 (put 2024) | 150 | 150 | ||||||
| Garland Independent School Dist., Unlimited Tax School Building Bonds, Series 2016, 5.00% 2030 | 400 | 457 | ||||||
| Goose Creek Consolidated Independent School Dist., Unlimited Tax School Building Bonds, Series 2019-B, 0.15% 2049 (put 2022) | 140 | 140 | ||||||
| Grand Prairie Independent School Dist., Unlimited Tax Rev. Ref. Bonds, Series 2015, 5.25% 2024 | 525 | 583 | ||||||
| Hallsville Independent School Dist., Unlimited Tax School Building and Rev. Ref. Bonds, Series 2020, 5.00% 2025 | 515 | 592 | ||||||
| Harlandale Independent School Dist., Maintenance Tax Notes, Series 2021, BAM insured, 2.00% 2040 (put 2024) | 50 | 51 | ||||||
| Harlandale Independent School Dist., Unlimited Tax Rev. Ref. Bonds, Series 2020, 0.75% 2045 (put 2025) | 100 | 100 | ||||||
| County of Harris, Cultural Education Facs. Fin. Corp., Hospital Rev. Bonds (Memorial Hermann Health System), Series 2019-C-1, (SIFMA Municipal Swap Index + 0.42%) 0.47% 2049 (put 2022)1 | 375 | 375 | ||||||
| County of Harris, Cultural Education Facs. Fin. Corp., Medical Facs. Mortgage Rev. Ref. Bonds (Baylor College of Medicine), Series 2019-A, (3-month USD-LIBOR x 0.70 + 0.65%) 0.707% 2046 (put 2024)1 | 130 | 131 | ||||||
| County of Harris, Cultural Education Facs. Fin. Corp., Rev. Bonds (Texas Medical Center), Series 2020-A, 0.90% 2050 (put 2025) | 130 | 130 | ||||||
| County of Harris, Health Facs. Dev. Corp., Rev. Ref. Bonds (CHRISTUS Health), Series 2005-A-4, Assured Guaranty Municipal insured, 0.20% 20311 | 125 | 125 | ||||||
| County of Harris, Metropolitan Transit Auth., Sales and Use Tax Bonds, Series 2011-A, 5.00% 2023 (preref. 2021) | 600 | 600 | ||||||
| County of Harris, Sports Auth., Rev. Ref. Bonds, Series 2014-A, Assured Guaranty Municipal insured, 5.00% 2022 (escrowed to maturity) | 110 | 115 | ||||||
| County of Harris, Toll Road Rev. and Rev. Ref. Bonds, Series 2018-A, 5.00% 2024 | 150 | 169 | ||||||
| Dept. of Housing and Community Affairs, Multi Family Housing Rev. Bonds (Corona Del Valle), Series 2021, 0.37% 2025 (put 2023) | 50 | 50 | ||||||
| Dept. of Housing and Community Affairs, Multi Family Housing Rev. Bonds (Oso Bay Apartments), Series 2021, 0.27% 2024 (put 2022) | 100 | 100 | ||||||
| Dept. of Housing and Community Affairs, Multi Family Housing Rev. Bonds (Palladium Simpson Stuart Apartments), Series 2021, 0.35% 2025 (put 2024) | 165 | 165 | ||||||
| Dept. of Housing and Community Affairs, Residential Mortgage Rev. Bonds, Series 2021-A, 3.00% 2052 | 310 | 336 | ||||||
| Dept. of Housing and Community Affairs, Single Family Mortgage Rev. Bonds, Series 2018-A, 4.75% 2049 | 370 | 409 | ||||||
| Dept. of Housing and Community Affairs, Single Family Mortgage Rev. Bonds, Series 2019-A, 4.00% 2050 | 405 | 451 | ||||||
| Dept. of Housing and Community Affairs, Single Family Mortgage Rev. Bonds, Series 2020-A, 3.50% 2051 | 125 | 138 | ||||||
| 46 | Private Client Services Funds |
Capital Group Short-Term Municipal Fund
| Bonds, notes & other debt instruments (continued) | Principal amount (000) | Value (000) | ||||||
| Texas (continued) | ||||||||
| Dept. of Housing and Community Affairs, Single Family Mortgage Rev. Bonds, Series 2021-A, 3.00% 2052 | $ | 135 | $ | 146 | ||||
| Housing Options, Inc., Multi Family Housing Rev. Bonds (Brooks Manor - The Oaks Project), Series 2021, 0.50% 2041 (put 2025) | 100 | 99 | ||||||
| City of Houston, Airport System Rev. Ref. Bonds, Series 2012-B, 5.00% 2028 (preref. 2022) | 870 | 898 | ||||||
| City of Houston, Combined Utility System Rev. Bonds, Series 2011-D, 5.00% 2026 (preref. 2021) | 55 | 55 | ||||||
| City of Houston, Combined Utility System Rev. Ref. Bonds, Series 2019-B, 2.00% 2024 | 615 | 646 | ||||||
| City of Houston, Convention and Entertainment Facs. Dept., Hotel Occupancy Tax and Special Rev. Ref. Bonds, Series 2021, 4.00% 2022 | 10 | 10 | ||||||
| City of Houston, Convention and Entertainment Facs. Dept., Hotel Occupancy Tax and Special Rev. Ref. Bonds, Series 2021, 4.00% 2023 | 15 | 16 | ||||||
| City of Houston, Housing Fin. Corp., Multi Family Housing Rev. Bonds (Temenos Place Apartments), Series 2021, 0.29% 2024 (put 2023) | 85 | 85 | ||||||
| Humble Independent School Dist., Unlimited Tax Rev. Ref. Bonds, Series 2020-B, 5.00% 2022 | 1,000 | 1,014 | ||||||
| Katy Independent School Dist., Unlimited Tax Rev. Ref. Bonds, Series 2019-B, 5.00% 2022 | 100 | 101 | ||||||
| Keller Independent School Dist., Unlimited Tax Rev. Ref. Bonds, Series 2015-A, 5.00% 2027 (preref. 2025) | 470 | 541 | ||||||
| Killeen Independent School Dist., Unlimited Tax Rev. Ref. Bonds, Series 2019, 5.00% 2022 | 95 | 96 | ||||||
| Longview Independent School Dist., Unlimited Tax Rev. Ref. Bonds, Series 2017, 5.00% 2022 | 180 | 183 | ||||||
| Longview Independent School Dist., Unlimited Tax Rev. Ref. Bonds, Series 2020, 5.00% 2024 | 500 | 553 | ||||||
| Lower Colorado River Auth., Rev. Ref. Bonds, Series 2022, Assured Guaranty Municipal insured, 5.00% 2032 | 55 | 70 | ||||||
| Lower Colorado River Auth., Transmission Contract Rev. Ref. Bonds (LCRA Transmission Services Corp. Project), Series 2020, 5.00% 2025 | 1,000 | 1,156 | ||||||
| Lower Colorado River Auth., Transmission Contract Rev. Ref. Bonds (LCRA Transmission Services Corp. Project), Series 2021-A, 5.00% 2031 | 60 | 79 | ||||||
| Medina Valley Independent School Dist., Unlimited Tax School Building Bonds, Series 2021, 0.82% 2051 (put 2026) | 90 | 89 | ||||||
| Municipal Gas Acquisition and Supply Corp. I, Gas Supply Rev. Bonds, Series 2008-D, 6.25% 2026 | 170 | 197 | ||||||
| Municipal Gas Acquisition and Supply Corp. III, Gas Supply Rev. Ref. Bonds, Series 2021, 5.00% 2022 | 10 | 10 | ||||||
| Municipal Gas Acquisition and Supply Corp. III, Gas Supply Rev. Ref. Bonds, Series 2021, 5.00% 2025 | 120 | 140 | ||||||
| North Central Texas Housing Fin. Corp., Multi Family Housing Rev. Bonds (Bluebonnet Ridge Apartments), Series 2021, 0.375% 2040 (put 2024) | 85 | 85 | ||||||
| North Texas Municipal Water Dist., Water System Rev. Ref. and Improvement Bonds, Series 2021, 5.00% 2022 | 45 | 47 | ||||||
| North Texas Tollway Auth., System Rev. Ref. Bonds, Series 2014-A, 5.00% 2024 | 395 | 434 | ||||||
| North Texas Tollway Auth., System Rev. Ref. Bonds, Series 2014-A, 5.00% 2024 (escrowed to maturity) | 190 | 209 | ||||||
| North Texas Tollway Auth., System Rev. Ref. Bonds, Series 2016-A, 5.00% 2026 | 1,500 | 1,647 | ||||||
| Northside Independent School Dist., Unlimited Tax School Building Bonds, Series 2020, 0.70% 2050 (put 2025) | 1,000 | 1,001 | ||||||
| Odessa Housing Fin. Corp., Multi Family Housing Rev. Bonds (Cove in Odessa Apartments), Series 2021, 0.37% 2024 (put 2023) | 230 | 230 | ||||||
| Pasadena Independent School Dist., Unlimited Tax Rev. Ref. Bonds, Series 2019, 5.00% 2022 | 125 | 127 | ||||||
| Pasadena Independent School Dist., Unlimited Tax School Building and Rev. Ref. Bonds, Series 2013, 5.00% 2038 | 500 | 529 | ||||||
| Plainview Independent School Dist., Unlimited Tax School Building Bonds, Series 2020-A, 5.00% 2022 | 500 | 507 | ||||||
| Plano Independent School Dist., Unlimited Tax Rev. Ref. Bonds, Series 2020, 5.00% 2023 | 135 | 143 | ||||||
| Prosper Independent School Dist., Unlimited Tax School Building Bonds, Series 2021-A, 5.00% 2030 | 50 | 65 | ||||||
| Prosper Independent School Dist., Unlimited Tax School Building Bonds, Series 2019-B, 2.00% 2050 (put 2021) | 960 | 989 | ||||||
| County of Rockwall, Permanent Improvement and Rev. Ref. Bonds, Series 2020, 5.00% 2024 | 200 | 221 | ||||||
| County of Rockwall, Permanent Improvement and Rev. Ref. Bonds, Series 2020, 5.00% 2025 | 250 | 286 | ||||||
| County of Rockwall, Permanent Improvement and Rev. Ref. Bonds, Series 2020, 5.00% 2026 | 260 | 307 | ||||||
| Round Rock Independent School Dist., Unlimited Tax Rev. Ref. Bonds, Series 2017, 5.00% 2022 | 300 | 311 | ||||||
| San Angelo Independent School Dist., Unlimited Tax Rev. Ref. Bonds, Series 2015-A, 5.00% 2030 (preref. 2024) | 1,110 | 1,227 | ||||||
| City of San Antonio, Electric and Gas Systems Rev. Bonds, Series 2015-D, 1.125% 2045 (put 2026) | 230 | 233 | ||||||
| City of San Antonio, Electric and Gas Systems Rev. Bonds, Series 2013, 5.00% 2048 (preref. 2023) | 140 | 148 | ||||||
| City of San Antonio, Electric and Gas Systems Rev. Ref. Bonds, Series 2020, 5.00% 2026 | 330 | 390 | ||||||
| City of San Antonio, General Improvement and Rev. Ref. Bonds, Series 2016, 5.00% 2022 | 70 | 71 | ||||||
| Tomball Independent School Dist., Unlimited Tax School Building Bonds, Series 2020, 5.00% 2023 | 80 | 85 | ||||||
| Tomball Independent School Dist., Unlimited Tax School Building Bonds, Series 2020, 5.00% 2024 | 30 | 33 | ||||||
| Transportation Commission, G.O. Mobility Fund Bonds, Series 2014-B, 0.65% 2041 (put 2026) | 310 | 307 | ||||||
| Transportation Commission, G.O. Mobility Fund Rev. Ref. Bonds, Series 2014-B, 5.00% 2026 | 550 | 611 | ||||||
| County of Travis, Strategic Housing Fin. Corp., Multi Family Housing Rev. Bonds (Yager Flats), Series 2021, 0.46% 2041 (put 2025) | 770 | 765 | ||||||
| Trinity River Auth., Regional Wastewater System Rev. Ref. Bonds, Series 2021, 5.00% 2029 | 160 | 205 | ||||||
| Private Client Services Funds | 47 |
Capital Group Short-Term Municipal Fund
| Bonds, notes & other debt instruments (continued) | Principal amount (000) | Value (000) | ||||||
| Texas (continued) | ||||||||
| Water Dev. Board, State Revolving Fund, Rev. Bonds, Series 2021, 5.00% 2031 | $ | 80 | $ | 107 | ||||
| Water Dev. Board, State Water Implementation Rev. Fund, Rev. Bonds (Master Trust), Series 2016, 5.00% 2022 | 550 | 562 | ||||||
| Water Dev. Board, State Water Implementation Rev. Fund, Rev. Bonds (Master Trust), Series 2018-B, 5.00% 2023 | 45 | 48 | ||||||
| 37,767 | ||||||||
| Utah 0.44% | ||||||||
| Housing Corp., Single Family Mortgage Bonds, Class III, Series 2015-D-2, 4.00% 2045 | 195 | 208 | ||||||
| Salt Lake City, Airport Rev. Bonds (Salt Lake City International Airport), Series 2021-B, 5.00% 2024 | 275 | 308 | ||||||
| County of Salt Lake, Board of Education, G.O. Rev. Ref. Bonds (Utah School Bond Guaranty Act), Series 2021, 5.00% 2024 | 250 | 280 | ||||||
| Transit Auth., Sales Tax Rev. Bonds, Series 2008-A, 5.25% 2023 | 15 | 16 | ||||||
| City of Vineyard, Redev. Agcy., Tax Increment Rev. and Rev. Ref. Bonds, Series 2021, Assured Guaranty Municipal insured, 5.00% 2024 | 65 | 72 | ||||||
| 884 | ||||||||
| Vermont 0.02% | ||||||||
| Housing Fin. Agcy., Multiple Purpose Bonds, Series 2020-A, 3.75% 2050 | 40 | 44 | ||||||
| Virginia 1.79% | ||||||||
| County of Arlington, Industrial Dev. Auth., Hospital Rev. Bonds (Virginia Hospital Center), Series 2020, 5.00% 2025 | 130 | 151 | ||||||
| College Building Auth., Educational Facs. Rev. Bonds (21st Century College and Equipment Programs), Series 2013-A, 4.50% 2033 | 450 | 474 | ||||||
| College Building Auth., Educational Facs. Rev. Bonds (21st Century College and Equipment Programs), Series 2013-A, 4.50% 2034 | 235 | 248 | ||||||
| Commonwealth Transportation Board, Federal Transportation Grant Anticipation Rev. Notes, Series 2012-A, 5.00% 2023 (preref. 2022) | 555 | 565 | ||||||
| County of Fairfax, Redev. and Housing Auth., Multi Family Housing Rev. Bonds (Arrowbrook Apartments Project), Series 2020, 0.41% 2041 (put 2024) | 500 | 500 | ||||||
| County of Fairfax, Redev. and Housing Auth., Multi Family Housing Rev. Bonds (Oakwood North Four Project), Series 2021, 0.41% 2025 (put 2024) | 570 | 569 | ||||||
| County of Halifax, Industrial Dev. Auth., Recovery Zone Fac. Rev. Bonds (Virginia Electric and Power Co. Project), Series 2010-A, 0.45% 2041 (put 2022) | 225 | 225 | ||||||
| Small Business Fncg. Auth., Rev. Bonds (National Senior Campuses, Inc. Obligated Group), Series 2020-A, 5.00% 2024 | 70 | 77 | ||||||
| Small Business Fncg. Auth., Rev. Bonds (National Senior Campuses, Inc. Obligated Group), Series 2020-A, 5.00% 2026 | 150 | 176 | ||||||
| County of Smyth, G.O. Public Improvement Bonds, Series 2011-A, 5.00% 2031 (preref. 2021) | 500 | 500 | ||||||
| County of Wise, Industrial Dev. Auth., Solid Waste and Sewage Disposal Rev. Bonds (Virginia Electric and Power Co. Project), Series 2010-A, 1.20% 2040 (put 2024) | 140 | 142 | ||||||
| 3,627 | ||||||||
| Washington 3.14% | ||||||||
| Central Puget Sound Regional Transit Auth., Sales Tax and Motor Vehicle Excise Tax Improvement and Rev. Ref. Green Bonds, Series 2021-S-1, 5.00% 2028 | 65 | 82 | ||||||
| Energy Northwest, Electric Rev. Ref. Bonds (Project No. 3), Series 2018-C, 5.00% 2023 | 1,000 | 1,079 | ||||||
| City of Everett, Housing Auth., Multi Family Housing Rev. Bonds (Baker Heights Legacy), Series 2021, 0.30% 2024 (put 2023) | 80 | 80 | ||||||
| G.O. Bonds, Series 2022-A, 5.00% 2030 | 765 | 1,004 | ||||||
| G.O. Rev. Ref. Bonds, Series 2017-R-A, 5.00% 2022 | 25 | 26 | ||||||
| Health Care Facs. Auth., Rev. Ref. Bonds (Providence St. Joseph Health), Series 2021-B, 4.00% 2042 (put 2030) | 250 | 304 | ||||||
| Housing Fin. Commission, Multi Family Housing Rev. Bonds (Garten Haus Apartments Project), Series 2021, 0.37% 2024 (put 2023) | 45 | 45 | ||||||
| Housing Fin. Commission, Single Family Program Bonds, Series 2017-1-N, 4.00% 2047 | 285 | 302 | ||||||
| Housing Fin. Commission, Single Family Program Bonds, Series 2019-1-N, 4.00% 2049 | 870 | 945 | ||||||
| Housing Fin. Commission, Single Family Program Bonds, Series 2020-2-N, 3.00% 2050 | 1,090 | 1,170 | ||||||
| Housing Fin. Commission, Single Family Program Bonds, Series 2020-1-N, 4.00% 2050 | 720 | 795 | ||||||
| City of Seattle, Housing Auth., Rev. and Rev. Ref. Bonds (Northgate Plaza Project), Series 2021, 1.00% 2026 | 70 | 70 | ||||||
| 48 | Private Client Services Funds |
Capital Group Short-Term Municipal Fund
| Bonds, notes & other debt instruments (continued) | Principal amount (000) | Value (000) | ||||||
| Washington (continued) | ||||||||
| City of Seattle, Housing Auth., Rev. Bonds (Lam Bow Apartments Project), Series 2021, 1.25% 2024 | $ | 15 | $ | 15 | ||||
| City of Seattle, Municipal Light and Power Rev. Ref. Bonds, Series 2021-B, (SIFMA Municipal Swap Index + 0.25%) 0.30% 2045 (put 2026)1 | 115 | 116 | ||||||
| City of Seattle, Municipal Light and Power Rev. Ref. Bonds, Series 2018-C-2, (SIFMA Municipal Swap Index + 0.49%) 0.54% 2046 (put 2023)1 | 325 | 326 | ||||||
| 6,359 | ||||||||
| West Virginia 0.47% | ||||||||
| Housing Dev. Fund, Multi Family Housing Rev. Bonds (Charles Towers), Series 2021, 0.21% 2023 (put 2022) | 75 | 75 | ||||||
| Housing Dev. Fund, Multi Family Housing Rev. Bonds (Parkland Place / Chapmanville Towers), Series 2021, 0.28% 2024 (put 2023) | 875 | 874 | ||||||
| 949 | ||||||||
| Wisconsin 2.86% | ||||||||
| G.O. Bonds, Series 2013-A, 5.00% 2025 (preref. 2022) | 1,000 | 1,024 | ||||||
| G.O. Bonds, Series 2014-B, 5.00% 2030 (preref. 2022) | 795 | 814 | ||||||
| G.O. Rev. Ref. Bonds, Series 2011-2, 5.00% 2022 (preref. 2021) | 230 | 230 | ||||||
| Health and Educational Facs. Auth., Rev. Bonds (Advocate Aurora Health Care Credit Group), Series 2018-C-3, (SIFMA Municipal Swap Index + 0.55%) 0.60% 2054 (put 2023)1 | 340 | 341 | ||||||
| Health and Educational Facs. Auth., Rev. Bonds (Ascension Senior Credit Group), Series 2019-A, 5.00% 2021 | 70 | 70 | ||||||
| Health and Educational Facs. Auth., Rev. Bonds (Gundersen Lutheran), Series 2020, 5.00% 20262 | 660 | 763 | ||||||
| Health and Educational Facs. Auth., Rev. Ref. Bonds (Aurora Health Care, Inc.), Series 2012, 5.00% 2022 (escrowed to maturity) | 655 | 680 | ||||||
| Health and Educational Facs. Auth., Rev. Ref. Bonds (Ministry Health Care, Inc.), Series 2012-C, | ||||||||
| 5.00% 2027 (preref. 2022) | 210 | 218 | ||||||
| Housing and Econ. Dev. Auth., Home Ownership Rev. Bonds, Series 2017-C, 4.00% 2048 | 210 | 225 | ||||||
| Housing and Econ. Dev. Auth., Home Ownership Rev. Bonds, Series 2020-A, 3.50% 2050 | 355 | 387 | ||||||
| Housing and Econ. Dev. Auth., Home Ownership Rev. Bonds, Series 2021-A, 3.00% 2052 | 30 | 33 | ||||||
| Housing and Econ. Dev. Auth., Housing Rev. Bonds, Series 2021-B, 0.40% 2045 (put 2023) | 25 | 25 | ||||||
| Housing and Econ. Dev. Auth., Housing Rev. Bonds, Series 2021-B, 0.50% 2050 (put 2024) | 35 | 35 | ||||||
| Public Fin. Auth., Hospital Rev. Ref. Bonds (Renown Regional Medical Center Project), Series 2016-A, 5.00% 2022 | 300 | 308 | ||||||
| Public Fin. Auth., Rev. Ref. Bonds (Providence St. Joseph Health), Series 2021-C, 4.00% 2041 (put 2030) | 115 | 140 | ||||||
| Transportation Rev. Bonds, Series 2012-1, 5.00% 2024 (preref. 2022) | 500 | 516 | ||||||
| 5,809 | ||||||||
| Wyoming 0.47% | ||||||||
| Community Dev. Auth., Housing Rev. Bonds, Series 2021-1, 3.00% 2050 | 705 | 759 | ||||||
| Community Dev. Auth., Housing Rev. Bonds, Series 2020-1, 4.00% 2050 | 170 | 188 | ||||||
| 947 | ||||||||
| Total bonds, notes & other debt instruments (cost: $164,432,000) | 165,941 | |||||||
| Short-term securities 18.79% | ||||||||
| Municipals 18.79% | ||||||||
| State of California, Kern Community College Dist., Facs. Improvement Dist. No. 1, G.O. Bond Anticipation Notes, Capital Appreciation Notes, Series 2020, 0% 2023 | 45 | 45 | ||||||
| State of California, City of Los Angeles, Wastewater System Rev. Ref. Bonds, Series 2018-C-1, 0.04% 20321 | 2,500 | 2,500 | ||||||
| State of California, Pollution Control Fncg. Auth., Environmental Impact Rev. Bonds (Air Products and Chemicals, Inc. Project), Series 1997-B, 0.02% 20421 | 500 | 500 | ||||||
| State of Georgia, Northwest Georgia Housing Auth., Multi Family Housing Rev. Bonds (Charles Hight Apartments Project), Series 2019, 0.25% 8/1/2022 (put 2022)4 | 40 | 40 | ||||||
| State of Georgia, Northwest Georgia Housing Auth., Multi Family Housing Rev. Bonds (Park Homes Apartments Project), Series 2019, 0.25% 8/1/2022 (put 2022)4 | 45 | 45 | ||||||
| State of Idaho, Tax Anticipation Notes, Series 2021, 3.00% 6/30/2022 | 3,000 | 3,056 | ||||||
| State of Louisiana, Parish of East Baton Rouge, Industrial Dev. Board, Gulf Opportunity Zone Rev. Bonds (ExxonMobil Project), Series 2010-B, 0.03% 20401 | 3,000 | 3,000 | ||||||
| Private Client Services Funds | 49 |
Capital Group Short-Term Municipal Fund
| Short-term securities (continued) | Principal amount (000) | Value (000) | ||||||
| Municipals (continued) | ||||||||
| State of Louisiana, Public Facs. Auth., Rev. Bonds (Air Products and Chemicals Project), Series 2008-A, 0.02% 20431 | $ | 1,000 | $ | 1,000 | ||||
| State of Louisiana, Public Facs. Auth., Rev. Bonds (Air Products and Chemicals Project), Series 2009-A, 0.04% 20491 | 5,000 | 5,000 | ||||||
| State of Michigan, Regents of the University of Michigan, General Rev. Bonds, Series 2012-B, 0.02% 20421 | 1,000 | 1,000 | ||||||
| State of Minnesota, City of Shakopee, Multi Family Housing Rev. Bonds (Shakopee Village Apartments Project), Series 2021, 0.25% 2024 (put 2022)4 | 35 | 35 | ||||||
| State of New Hampshire, Health and Education Facs. Auth., Rev. Ref. Bonds (Dartmouth College Issue), Series 2007-B, 0.02% 20411 | 5,295 | 5,295 | ||||||
| State of New York, Dormitory Auth., Rev. Bonds (Cornell University), Series 2019-B, 0.02% 20391 | 1,800 | 1,800 | ||||||
| State of New York, New York City G.O. Bonds, Series 2021-2, 0.11% 20421 | 205 | 205 | ||||||
| State of New York, New York City G.O. Bonds, Series 2021-3, 0.11% 20421 | 155 | 155 | ||||||
| State of New York, New York City G.O. Bonds, Series 2016-A-5, 0.03% 20441 | 2,000 | 2,000 | ||||||
| State of New York, New York City Municipal Water Fin. Auth., Water and Sewer System Second General Resolution Rev. Bonds, Series 2008-BB-2, 0.02% 20351 | 1,000 | 1,000 | ||||||
| State of New York, New York City Municipal Water Fin. Auth., Water and Sewer System Second General Resolution Rev. Bonds, Series 2015-BB-1, 0.02% 20491 | 3,500 | 3,500 | ||||||
| State of Ohio, Hospital Rev. Bonds (Cleveland Clinic Health System Obligated Group), Series 2013-B-3, 0.03% 20391 | 1,500 | 1,500 | ||||||
| State of South Carolina, Jobs-Econ. Dev. Auth., Hospital Rev. Bonds (Prisma Health Obligated Group), Series 2018-B, 0.03% 20481 | 700 | 700 | ||||||
| State of Texas, Deer Park Independent School Dist., Unlimited Tax School Building Bonds, Series 2018, 0.16% 2042 (put 2022)4 | 225 | 225 | ||||||
| State of Texas, Lone Star College System, Limited Tax G.O. Bonds, Series 2021-A, 5.00% 2/15/2022 | 20 | 20 | ||||||
| State of Texas, Lone Star College System, Limited Tax G.O. Rev. Ref. Bonds, Series 2021-B, 5.00% 2/15/2022 | 35 | 36 | ||||||
| State of Texas, Municipal Gas Acquisition and Supply Corp. III, Gas Supply Rev. Ref. Bonds, Series 2021, 5.00% 12/15/2021 | 10 | 10 | ||||||
| State of Texas, North East Independent School Dist., Unlimited Tax School Building Bonds, Series 2013-B, 0.25% 2032 (put 2022)4 | 35 | 35 | ||||||
| State of Texas, Richardson Independent School Dist., Unlimited Tax School Building Bonds, Series 2021, 5.00% 2/15/2022 | 95 | 96 | ||||||
| State of Virginia, College Building Auth., Educational Facs. Rev. Bonds (University of Richmond Project), Series 2006, 0.03% 20361 | 2,100 | 2,100 | ||||||
| State of Wyoming, County of Lincoln, Pollution Control Rev. Ref. Bonds (ExxonMobil Project), Series 2014, 0.03% 20441 | 3,200 | 3,200 | ||||||
| Total short-term securities (cost: $38,098,000) | 38,098 | |||||||
| Total investment securities 100.65% (cost: $202,530,000) | 204,039 | |||||||
| Other assets less liabilities (0.65%) | (1,316 | ) | ||||||
| Net assets 100.00% | $ | 202,723 | ||||||
Futures contracts
| Contracts | Type | Number of contracts | Expiration | Notional amount (000) | 5 | Value at 10/31/2021 (000) | 6 | Unrealized depreciation at 10/31/2021 (000) | ||||||||||
| 2 Year U.S. Treasury Note Futures | Long | 9 | December 2021 | $ | 1,800 | $ | 1,973 | $ | (9 | ) | ||||||||
| 5 Year U.S. Treasury Note Futures | Long | 26 | December 2021 | 2,600 | 3,166 | (14 | ) | |||||||||||
| $ | (23 | ) | ||||||||||||||||
| 50 | Private Client Services Funds |
Capital Group Short-Term Municipal Fund
| 1 | Coupon rate may change periodically. Reference rate and spread are as of the most recent information available. Some coupon rates are determined by the issuer or agent based on current market conditions; therefore, the reference rate and spread are not available. For short-term securities, the date of the next scheduled coupon rate change is considered to be the maturity date. |
| 2 | Acquired in a transaction exempt from registration under Rule 144A of the Securities Act of 1933. May be resold in the U.S. in transactions exempt from registration, normally to qualified institutional buyers. The total value of all such securities was $810,000, which represented .40% of the net assets of the fund. |
| 3 | Step bond; coupon rate may change at a later date. |
| 4 | For short-term securities, the mandatory put date is considered to be the maturity date. |
| 5 | Notional amount is calculated based on the number of contracts and notional contract size. |
| 6 | Value is calculated based on the notional amount and current market price. |
Key to abbreviations and symbol
Agcy. = Agency
AMT = Alternative Minimum Tax
Auth. = Authority
Certs. = Certificates
Dept. = Department
Dev. = Development
Dist. = District
Econ. = Economic
Fac. = Facility
Facs. = Facilities
Fin. = Finance
Fncg. = Financing
G.O. = General Obligation
IAM = Interest at Maturity
LIBOR = London Interbank Offered Rate
LOC = Letter of Credit
Part. = Participation
Preref. = Prerefunded
Redev. = Redevelopment
Ref. = Refunding
Rev. = Revenue
SIFMA = Securities Industry and Financial Markets Association
USD/$ = U.S. dollars
| Private Client Services Funds | 51 |
Capital Group California Core Municipal Fund
Investment portfolio October 31, 2021
| Portfolio quality summary* | Percent of net assets |
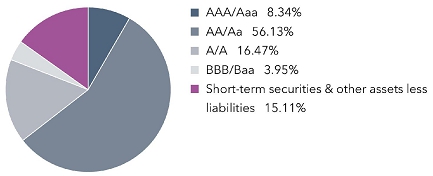 | |
| * | Bond ratings, which typically range from AAA/Aaa (highest) to D (lowest), are assigned by credit rating agencies such as Standard & Poor’s, Moody’s and/or Fitch as an indication of an issuer’s creditworthiness. In assigning a credit rating to a security, the fund looks specifically to the ratings assigned to the issuer of the security by Standard & Poor’s, Moody’s and/or Fitch. If agency ratings differ, the security will be considered to have received the highest of those ratings, consistent with the fund’s investment policies. The ratings are not covered by the Report of Independent Registered Public Accounting Firm. |
| Bonds, notes & other debt instruments 84.89% | Principal amount (000) | Value (000) | ||||||
| California 84.30% | ||||||||
| Alameda Corridor Transportation Auth., Rev. Ref. Bonds, Series 2013-A, 5.00% 2022 | $ | 975 | $ | 1,016 | ||||
| Alameda Corridor Transportation Auth., Rev. Ref. Bonds, Series 2016-A, 5.00% 2024 | 600 | 678 | ||||||
| Alameda Corridor Transportation Auth., Rev. Ref. Bonds, Series 2016-A, 5.00% 2025 | 500 | 583 | ||||||
| City of Alhambra, Insured Rev. Ref. Bonds (Atherton Baptist Homes Project), Series 2016, 5.00% 2027 | 630 | 739 | ||||||
| City of Anaheim, Public Fncg. Auth., Lease Rev. Bonds (Anaheim Public Improvement Project), Capital Appreciation Bonds, Series 1997-C, Assured Guaranty Municipal insured, 0% 2022 | 2,000 | 1,994 | ||||||
| Antelope Valley Community College Dist., G.O. Rev. Ref. Bonds, Capital Appreciation Bonds, Series 2015, 0% 2035 (preref. 2025) | 2,300 | 1,452 | ||||||
| Antelope Valley Community College Dist., G.O. Rev. Ref. Bonds, Capital Appreciation Bonds, Series 2015, 0% 2036 (preref. 2025) | 2,800 | 1,690 | ||||||
| Assn. of Bay Area Governments, Fin. Auth. for Nonprofit Corps., Rev. Ref. Bonds (Eskaton Properties, Inc. Obligated Group), Series 2013, 5.00% 2021 | 495 | 496 | ||||||
| Assn. of Bay Area Governments, Fin. Auth. for Nonprofit Corps., Rev. Ref. Bonds (Eskaton Properties, Inc. Obligated Group), Series 2013, 5.00% 2022 | 1,000 | 1,041 | ||||||
| Assn. of Bay Area Governments, Fin. Auth. for Nonprofit Corps., Rev. Ref. Bonds (Eskaton Properties, Inc. Obligated Group), Series 2013, 5.00% 2023 | 500 | 540 | ||||||
| Assn. of Bay Area Governments, Fin. Auth. for Nonprofit Corps., Rev. Ref. Bonds (Windemere Ranch Infrastructure Fncg. Program), Series 2014-A, 5.00% 2023 | 370 | 401 | ||||||
| Assn. of Bay Area Governments, Fin. Auth. for Nonprofit Corps., Rev. Ref. Bonds (Windemere Ranch Infrastructure Fncg. Program), Series 2014-A, 5.00% 2024 | 395 | 446 | ||||||
| Assn. of Bay Area Governments, Fin. Auth. for Nonprofit Corps., Rev. Ref. Bonds (Windemere Ranch Infrastructure Fncg. Program), Series 2014-A, 5.00% 2025 | 510 | 576 | ||||||
| Bay Area Toll Auth., San Francisco Bay Area Toll Bridge Rev. Bonds, Series 2001-A, (SIFMA Municipal Swap Index + 1.25%) 1.30% 2036 (put 2027)1 | 1,000 | 1,052 | ||||||
| Bay Area Toll Auth., San Francisco Bay Area Toll Bridge Rev. Bonds, Series 2013-S-4, 5.00% 2043 (preref. 2023) | 1,000 | 1,068 | ||||||
| Bay Area Toll Auth., San Francisco Bay Area Toll Bridge Rev. Bonds, Series 2008-B-1, (SIFMA Municipal Swap Index + 1.10%) 1.15% 2045 (put 2024)1 | 4,275 | 4,350 | ||||||
| Bay Area Toll Auth., San Francisco Bay Area Toll Bridge Rev. Bonds, Series 2017-G, 2.00% 2053 (put 2024) | 4,525 | 4,656 | ||||||
| Bay Area Toll Auth., San Francisco Bay Area Toll Bridge Rev. Bonds, Series 2021-A, 2.00% 2056 (put 2028) | 3,000 | 3,164 | ||||||
| Bay Area Toll Auth., San Francisco Bay Area Toll Bridge Rev. Ref. Bonds, Series 2017-S-7, 5.00% 2024 | 1,200 | 1,334 | ||||||
| Bay Area Toll Auth., San Francisco Bay Area Toll Bridge Rev. Ref. Bonds, Series 2012-F-1, 5.00% 2027 (preref. 2022) | 2,965 | 3,025 | ||||||
| Bay Area Water Supply and Conservation Agcy., Rev. Bonds, Series 2013-A, 5.00% 2023 | 500 | 534 | ||||||
| City of Beaumont, Wastewater Rev. Bonds, Series 2018-A, Assured Guaranty Municipal insured, 5.00% 2026 | 500 | 598 | ||||||
| City of Burbank, Successor Agcy. to the Redev. Agcy., Tax Allocation Rev. Ref. Redev. Bonds, Series 2015, BAM insured, 5.00% 2022 | 1,305 | 1,372 | ||||||
| California County Tobacco Securitization Agcy., Tobacco Settlement Rev. Bonds (Los Angeles County Securitization Corp.), Series 2020-A, 5.00% 2026 | 600 | 710 | ||||||
| Trustees of the California State University, Systemwide Rev. Bonds, Series 2015-A, 5.00% 2024 | 500 | 570 | ||||||
| Trustees of the California State University, Systemwide Rev. Bonds, Series 2016-B-2, 0.55% 2049 (put 2026) | 4,480 | 4,413 | ||||||
| Trustees of the California State University, Systemwide Rev. Bonds, Series 2016-B-3, 4.00% 2051 (put 2023) | 2,500 | 2,636 | ||||||
| 52 | Private Client Services Funds |
Capital Group California Core Municipal Fund
| Bonds, notes & other debt instruments (continued) | Principal amount (000) | Value (000) | ||||||
| California (continued) | ||||||||
| City of Carlsbad, Reassessment Dist. No. 2012-1, Limited Obligation Rev. Ref. Bonds, Series 2013, 3.55% 2023 | $ | 350 | $ | 358 | ||||
| Cathedral City, Successor Agcy. to the Redev. Agcy., Tax Allocation Housing Rev. Ref. Bonds (Merged Redev. Project Area), Series 2021-C, BAM insured, 4.00% 2022 | 200 | 205 | ||||||
| Cathedral City, Successor Agcy. to the Redev. Agcy., Tax Allocation Housing Rev. Ref. Bonds (Merged Redev. Project Area), Series 2021-C, BAM insured, 4.00% 2023 | 225 | 238 | ||||||
| Cathedral City, Successor Agcy. to the Redev. Agcy., Tax Allocation Housing Rev. Ref. Bonds (Merged Redev. Project Area), Series 2014-B, Assured Guaranty Municipal insured, 5.00% 2024 | 260 | 292 | ||||||
| Cathedral City, Successor Agcy. to the Redev. Agcy., Tax Allocation Housing Rev. Ref. Bonds (Merged Redev. Project Area), Series 2014-A, Assured Guaranty Municipal insured, 5.00% 2025 | 620 | 692 | ||||||
| Cerritos Community College Dist., G.O. Bonds, Capital Appreciation Bonds, 2004 Election, Series 2012-D, 0% 2027 | 830 | 772 | ||||||
| City of Chino, Successor Agcy. to the Redev. Agcy., Tax Allocation Rev. Ref. Bonds, Series 2014-A, BAM insured, 5.00% 2022 | 450 | 468 | ||||||
| City of Chino, Successor Agcy. to the Redev. Agcy., Tax Allocation Rev. Ref. Bonds, Series 2014-A, BAM insured, 5.00% 2025 | 665 | 746 | ||||||
| City of Chino Hills, Fin. Auth., Rev. Ref. Bonds (Community Facs. Dist. Bond Program), Series 2019-D, 5.00% 2024 | 465 | 524 | ||||||
| City of Chino Hills, Fin. Auth., Rev. Ref. Bonds (Community Facs. Dist. Bond Program), Series 2019-D, 5.00% 2026 | 780 | 936 | ||||||
| City of Chino Hills, Fin. Auth., Rev. Ref. Bonds (Community Facs. Dist. Bond Program), Series 2019-D, 5.00% 2027 | 430 | 528 | ||||||
| City of Chino Hills, Fin. Auth., Rev. Ref. Bonds (Community Facs. Dist. Bond Program), Series 2019-D, 5.00% 2028 | 355 | 443 | ||||||
| City of Chino Hills, Fin. Auth., Rev. Ref. Bonds (Community Facs. Dist. Bond Program), Series 2019-D, 5.00% 2029 | 225 | 288 | ||||||
| City of Chino Hills, Fin. Auth., Rev. Ref. Bonds (Community Facs. Dist. Bond Program), Series 2019-D, 5.00% 2030 | 60 | 77 | ||||||
| City of Chula Vista, Municipal Fncg. Auth., Special Tax Rev. Ref. Bonds, Series 2013, 5.00% 2022 | 1,355 | 1,406 | ||||||
| Clovis Unified School Dist., G.O. Bonds, Capital Appreciation Bonds, 2004 Election, Series 2006-B, National insured, 0% 2030 | 1,000 | 867 | ||||||
| Community Choice Fncg. Auth., Clean Energy Project Rev. Green Bonds, Series 2021-B-1, 4.00% 2052 (put 2031) | 2,750 | 3,306 | ||||||
| Compton Community College Dist., G.O. Rev. Ref. Bonds, Series 2014, BAM insured, 5.00% 2026 | 1,290 | 1,443 | ||||||
| Compton Community College Dist., G.O. Rev. Ref. Bonds, Series 2015, BAM insured, 5.00% 2029 | 1,000 | 1,157 | ||||||
| Compton Unified School Dist., G.O. Bonds, Capital Appreciation Bonds, 2015 Election, Series 2019-B, BAM insured, 0% 2033 | 1,000 | 756 | ||||||
| City of Concord, Successor Agcy. to the Redev. Agcy., Rev. Ref. Bonds, Series 2014, BAM insured, 5.00% 2023 | 825 | 875 | ||||||
| Del Mar Union School Dist., Community Facs. Dist. No. 99-1, Special Tax Bonds, Series 2019, 4.00% 2026 | 400 | 453 | ||||||
| Del Mar Union School Dist., Community Facs. Dist. No. 99-1, Special Tax Bonds, Series 2019, 5.00% 2027 | 885 | 1,065 | ||||||
| Del Mar Union School Dist., Community Facs. Dist. No. 99-1, Special Tax Bonds, Series 2019, 5.00% 2028 | 930 | 1,140 | ||||||
| Del Mar Union School Dist., Community Facs. Dist. No. 99-1, Special Tax Bonds, Series 2019, 5.00% 2029 | 675 | 844 | ||||||
| Desert Community College Dist., G.O. Rev. Ref. Bonds, Series 2016, 5.00% 2032 | 1,885 | 2,233 | ||||||
| City of Dublin, Community Facs. Dist. No. 2015-1 (Dublin Crossing), Improvement Area No. 3, Special Tax Bonds, Series 2021, 3.00% 2023 | 205 | 213 | ||||||
| City of Dublin, Community Facs. Dist. No. 2015-1 (Dublin Crossing), Improvement Area No. 3, Special Tax Bonds, Series 2021, 3.00% 2025 | 265 | 281 | ||||||
| East Bay Municipal Utility Dist., Water System Rev. Ref. Bonds, Series 2015-A, 5.00% 2027 | 3,550 | 4,124 | ||||||
| East Side Union High School Dist., G.O. Bonds, 2008 Election, Series 2012-D, 5.00% 2037 (preref. 2022) | 500 | 518 | ||||||
| Eastern Municipal Water Dist., Fin. Auth., Water and Wastewater Rev. Ref. Bonds, Series 2020-A, 2.75% 2028 | 535 | 596 | ||||||
| Eastern Municipal Water Dist., Water and Wastewater Rev. Ref. Bonds, Series 2021-A, 4.00% 2029 | 1,210 | 1,479 | ||||||
| Educational Facs. Auth., Rev. Bonds (Chapman University), Series 2021-A, 5.00% 2028 | 1,375 | 1,725 | ||||||
| Educational Facs. Auth., Rev. Bonds (University of the Pacific), Series 2012-A, 4.00% 2021 | 560 | 560 | ||||||
| Educational Facs. Auth., Rev. Bonds (University of the Pacific), Series 2012-A, 4.00% 2022 | 500 | 500 | ||||||
| Educational Facs. Auth., Rev. Ref. Bonds (Stanford University), Series 2009-T-5, 5.00% 2023 | 1,290 | 1,375 | ||||||
| City of El Centro, Fncg. Auth., Wastewater Rev. Ref. Bonds, Series 2014-A, Assured Guaranty Municipal insured, 5.00% 2026 | 530 | 598 | ||||||
| City of El Centro, Fncg. Auth., Wastewater Rev. Ref. Bonds, Series 2014-A, Assured Guaranty Municipal insured, 5.00% 2027 | 500 | 563 | ||||||
| City of El Centro, Fncg. Auth., Wastewater Rev. Ref. Bonds, Series 2014-A, Assured Guaranty Municipal insured, 5.00% 2030 | 1,000 | 1,125 | ||||||
| County of El Dorado, Community Facs. Dist. No. 1992-1 (El Dorado Hills Dev.), Special Tax Rev. Ref. Bonds, Series 2012, 5.00% 2024 | 855 | 888 | ||||||
| City of Elk Grove, Fin. Auth., Special Tax Rev. Bonds, Series 2015, BAM insured, 5.00% 2025 | 580 | 668 | ||||||
| Etiwanda School Dist., G.O. Bonds, 2016 Election, Series 2020-A, 4.00% 2029 | 570 | 691 | ||||||
| City of Eureka, Successor Agcy. to the Redev. Agcy., Tax Allocation Rev. Ref. Bonds, Series 2017-B, 5.00% 2022 | 835 | 872 | ||||||
| City of Fillmore, Successor Agcy. to the Redev. Agcy., Tax Allocation Rev. Ref. Bonds, Series 2015, BAM insured, 5.00% 2024 | 1,000 | 1,116 | ||||||
| Folsom Cordova Unified School Dist., School Facs. Improvement Dist. No. 1, G.O. Bonds, Capital Appreciation Bonds, 2002 Election, Series 2004-B, National insured, 0% 2026 | 1,000 | 949 | ||||||
| City of Fontana, Community Facs. Dist. No. 22 (Sierra Hills South), Special Tax Bonds, Series 2014, 5.00% 2023 | 535 | 576 | ||||||
| Private Client Services Funds | 53 |
Capital Group California Core Municipal Fund
| Bonds, notes & other debt instruments (continued) | Principal amount (000) | Value (000) | ||||||
| California (continued) | ||||||||
| City of Fontana, Community Facs. Dist. No. 86 (Etiwanda Ridge), Special Tax Bonds, Series 2020, 4.00% 2026 | $ | 100 | $ | 112 | ||||
| City of Fontana, Community Facs. Dist. No. 86 (Etiwanda Ridge), Special Tax Bonds, Series 2020, 4.00% 2027 | 120 | 136 | ||||||
| City of Fontana, Public Facs. Fin. Auth., Special Tax Rev. Ref. Bonds, Series 2021-A, 4.00% 2027 | 625 | 724 | ||||||
| City of Fontana, Public Facs. Fin. Auth., Special Tax Rev. Ref. Bonds, Series 2021-A, 4.00% 2029 | 390 | 463 | ||||||
| G.O. Bonds, Series 2020, 5.00% 2026 | 3,000 | 3,633 | ||||||
| G.O. Bonds, Series 2019, 5.00% 2029 | 2,000 | 2,592 | ||||||
| G.O. Bonds, Series 2021, 5.00% 2031 | 85 | 102 | ||||||
| G.O. Bonds, Series 2021, 5.00% 2032 | 70 | 84 | ||||||
| G.O. Bonds, Series 2021, 5.00% 2034 | 70 | 84 | ||||||
| G.O. Rev. Ref. Bonds, Series 2007, Assured Guaranty Municipal insured, 5.25% 2032 | 4,125 | 5,654 | ||||||
| G.O. Rev. Ref. Bonds, Series 2019, 5.00% 2027 | 745 | 912 | ||||||
| G.O. Rev. Ref. Bonds, Series 2021, 5.00% 2028 | 3,000 | 3,804 | ||||||
| G.O. Rev. Ref. Bonds, Series 2017, 5.00% 2029 | 4,000 | 4,995 | ||||||
| G.O. Rev. Ref. Bonds, Series 2021, 5.00% 2029 | 3,000 | 3,875 | ||||||
| G.O. Rev. Ref. Bonds, Series 2020, 5.00% 2029 | 1,500 | 1,944 | ||||||
| G.O. Rev. Ref. Bonds, Series 2019, 5.00% 2029 | 1,000 | 1,294 | ||||||
| G.O. Rev. Ref. Bonds, Series 2021, 5.00% 2031 | 2,500 | 3,350 | ||||||
| G.O. Rev. Ref. Bonds, Series 2020, 5.00% 2035 | 2,000 | 2,568 | ||||||
| City of Garden Grove, Successor Agcy. to the Dev. Agcy., Tax Allocation Bonds, Series 2016, BAM insured, 5.00% 2022 | 400 | 417 | ||||||
| City of Glendale, Successor Agcy. to the Redev. Agcy., Tax Allocation Rev. Ref. Bonds (Central Glendale Redev. Project), Series 2016, BAM insured, 5.00% 2024 | 425 | 483 | ||||||
| Golden State Tobacco Securitization Corp., Enhanced Tobacco Settlement Asset-Backed Bonds, Series 2018-A, 5.00% 2022 (escrowed to maturity) | 3,000 | 3,084 | ||||||
| Golden State Tobacco Securitization Corp., Enhanced Tobacco Settlement Asset-Backed Bonds, Series 2017A-1, 5.00% 2022 | 1,730 | 1,775 | ||||||
| Golden State Tobacco Securitization Corp., Enhanced Tobacco Settlement Asset-Backed Bonds, Capital Appreciation Bonds, Series 2005-A, AMBAC insured, 0% 2024 (escrowed to maturity) | 2,000 | 1,977 | ||||||
| Golden State Tobacco Securitization Corp., Enhanced Tobacco Settlement Asset-Backed Bonds, Capital Appreciation Bonds, Series 2005-A, Assured Guaranty Municipal insured, 0% 2026 (escrowed to maturity) | 2,785 | 2,689 | ||||||
| Greenfield Elementary School Dist., G.O. Bonds, Capital Appreciation Bonds, 2006 Election, Series 2007-A, Assured Guaranty Municipal insured, 0% 2029 | 1,270 | 1,110 | ||||||
| City of Hawthorne, Successor Agcy. to the Redev. Agcy., Tax Allocation Rev. Ref. Bonds, Series 2016, Assured Guaranty Municipal insured, 5.00% 2024 | 250 | 282 | ||||||
| Health Facs. Fncg. Auth., Rev. Bonds (Adventist Health System/West), Series 2013-A, 5.00% 2023 | 910 | 967 | ||||||
| Health Facs. Fncg. Auth., Rev. Bonds (Adventist Health System/West), Series 2013-A, 5.00% 2024 | 1,105 | 1,174 | ||||||
| Health Facs. Fncg. Auth., Rev. Bonds (Cedars-Sinai Medical Center), Series 2016-A, 5.00% 2023 | 650 | 705 | ||||||
| Health Facs. Fncg. Auth., Rev. Bonds (City of Hope), Series 2012-A, 5.00% 2021 | 350 | 351 | ||||||
| Health Facs. Fncg. Auth., Rev. Bonds (El Camino Hospital), Series 2017, 5.00% 2025 | 1,000 | 1,145 | ||||||
| Health Facs. Fncg. Auth., Rev. Bonds (Kaiser Permanente), Series 2017-B, 5.00% 2029 (put 2022) | 1,025 | 1,074 | ||||||
| Health Facs. Fncg. Auth., Rev. Bonds (Kaiser Permanente), Series 2017-D, 5.00% 2032 (put 2022) | 2,675 | 2,803 | ||||||
| Health Facs. Fncg. Auth., Rev. Bonds (Lucile Salter Packard Children’s Hospital at Stanford), Series 2014-A, 5.00% 2025 | 400 | 450 | ||||||
| Health Facs. Fncg. Auth., Rev. Bonds (PIH Health), Series 2020-A, 5.00% 2030 | 1,900 | 2,469 | ||||||
| Health Facs. Fncg. Auth., Rev. Bonds (Providence St. Joseph Health), Series 2019-B, 5.00% 2039 (put 2027) | 2,135 | 2,639 | ||||||
| Health Facs. Fncg. Auth., Rev. Bonds (Scripps Health), Series 2012-A, 5.00% 2024 | 150 | 151 | ||||||
| Health Facs. Fncg. Auth., Rev. Bonds (Scripps Health), Series 2012-A, 5.00% 2025 | 375 | 376 | ||||||
| Health Facs. Fncg. Auth., Rev. Bonds (Stanford Health Care), Series 2021-A, 3.00% 2054 (put 2025) | 4,430 | 4,836 | ||||||
| Health Facs. Fncg. Auth., Rev. Bonds (Sutter Health), Series 2018-A, 5.00% 2024 | 3,000 | 3,413 | ||||||
| Health Facs. Fncg. Auth., Rev. Bonds (Sutter Health), Series 2016-A, 5.00% 2026 (preref. 2025) | 300 | 355 | ||||||
| Health Facs. Fncg. Auth., Rev. Bonds (Sutter Health), Series 2016-A, 5.00% 2041 (preref. 2025) | 680 | 804 | ||||||
| Health Facs. Fncg. Auth., Rev. Bonds (Sutter Health), Series 2013-A, 5.00% 2052 (preref. 2023) | 1,665 | 1,806 | ||||||
| Health Facs. Fncg. Auth., Rev. Green Bonds (Kaiser Permanente), Series 2017-A-1, 5.00% 2027 | 3,000 | 3,737 | ||||||
| Health Facs. Fncg. Auth., Rev. Green Bonds (Kaiser Permanente), Series 2017-C, 5.00% 2031 (put 2022) | 6,985 | 7,319 | ||||||
| Health Facs. Fncg. Auth., Rev. Ref. Bonds (Adventist Health System/West), Series 2016-A, 4.00% 2025 | 1,270 | 1,418 | ||||||
| Health Facs. Fncg. Auth., Rev. Ref. Bonds (Lucile Salter Packard Children’s Hospital at Stanford), Series 2022-A, 5.00% 2026 | 830 | 956 | ||||||
| Health Facs. Fncg. Auth., Rev. Ref. Bonds (Marshall Medical Center), Series 2015, 5.00% 2022 | 175 | 183 | ||||||
| Health Facs. Fncg. Auth., Rev. Ref. Bonds (Marshall Medical Center), Series 2015, 5.00% 2023 | 135 | 147 | ||||||
| Health Facs. Fncg. Auth., Rev. Ref. Bonds (Stanford Health Care), Series 2017-A, 5.00% 2024 | 1,000 | 1,139 | ||||||
| Health Facs. Fncg. Auth., Rev. Ref. Bonds (Stanford Health Care), Series 2017-A, 5.00% 2026 | 1,750 | 2,121 | ||||||
| Hemet Unified School Dist., Fncg. Auth. Special Tax Rev. Bonds, Series 2015, 5.00% 2026 | 600 | 676 | ||||||
| 54 | Private Client Services Funds |
Capital Group California Core Municipal Fund
| Bonds, notes & other debt instruments (continued) | Principal amount (000) | Value (000) | ||||||
| California (continued) | ||||||||
| Hemet Unified School Dist., G.O. Rev. Ref. Bonds, Series 2014, Assured Guaranty Municipal insured, 5.00% 2023 | $ | 885 | $ | 958 | ||||
| Infrastructure and Econ. Dev. Bank, Charter School Rev. Bonds (Equitable School Revolving Fund), Series 2019-B, 5.00% 2025 | 100 | 117 | ||||||
| Infrastructure and Econ. Dev. Bank, Charter School Rev. Bonds (Equitable School Revolving Fund), Series 2019-B, 5.00% 2026 | 125 | 150 | ||||||
| Infrastructure and Econ. Dev. Bank, Charter School Rev. Bonds (Equitable School Revolving Fund), Series 2019-B, 5.00% 2027 | 110 | 135 | ||||||
| Infrastructure and Econ. Dev. Bank, Charter School Rev. Bonds (Equitable School Revolving Fund), Series 2019-B, 5.00% 2028 | 375 | 470 | ||||||
| Infrastructure and Econ. Dev. Bank, Charter School Rev. Bonds (Equitable School Revolving Fund), Series 2019-B, 5.00% 2029 | 140 | 175 | ||||||
| Infrastructure and Econ. Dev. Bank, Charter School Rev. Bonds (Equitable School Revolving Fund), Series 2019-B, 5.00% 2030 | 340 | 423 | ||||||
| Infrastructure and Econ. Dev. Bank, Rev. Bonds (The Colburn School), Series 2015-B, (SIFMA Municipal Swap Index + 1.20%) 1.25% 2037 (put 2022)1 | 1,000 | 1,001 | ||||||
| City of Inglewood, Successor Agcy. to the Redev. Agcy., Tax Allocation Rev. Ref. Bonds (Merged Redev. Project), Series 2017-A, BAM insured, 5.00% 2027 | 650 | 790 | ||||||
| City of Irvine, Reassessment Dist. No. 12-1, Limited Obligation Improvement Bonds, Series 2012, 3.25% 2022 | 700 | 718 | ||||||
| City of Irvine, Reassessment Dist. No. 12-1, Limited Obligation Improvement Bonds, Series 2012, 4.00% 2022 | 400 | 413 | ||||||
| City of Irvine, Reassessment Dist. No. 12-1, Limited Obligation Improvement Bonds, Series 2013, 5.00% 2024 | 725 | 788 | ||||||
| City of Irvine, Reassessment Dist. No. 13-1, Limited Obligation Improvement Bonds, Series 2013, 3.375% 2023 | 850 | 898 | ||||||
| City of Irvine, Reassessment Dist. No. 19-1, Limited Obligation Improvement Bonds, Series 2019, 4.00% 2022 | 225 | 232 | ||||||
| City of Irvine, Reassessment Dist. No. 19-1, Limited Obligation Improvement Bonds, Series 2019, 5.00% 2023 | 200 | 217 | ||||||
| City of Irvine, Reassessment Dist. No. 19-1, Limited Obligation Improvement Bonds, Series 2019, 5.00% 2024 | 210 | 237 | ||||||
| City of Irvine, Reassessment Dist. No. 19-1, Limited Obligation Improvement Bonds, Series 2019, 5.00% 2025 | 250 | 292 | ||||||
| City of Irvine, Reassessment Dist. No. 21-1, Limited Obligation Improvement Bonds, Series 2021, BAM insured, 4.00% 2025 | 500 | 565 | ||||||
| City of Irvine, Reassessment Dist. No. 21-1, Limited Obligation Improvement Bonds, Series 2021, 4.00% 2028 | 500 | 599 | ||||||
| City of Irvine, Reassessment Dist. No. 21-1, Limited Obligation Improvement Bonds, Series 2021, BAM insured, 4.00% 2030 | 1,265 | 1,556 | ||||||
| Irvine Unified School Dist., Community Facs. Dist. No. 09-1, Special Tax Bonds, Series 2019-A, BAM insured, 5.00% 2027 | 140 | 172 | ||||||
| Irvine Unified School Dist., Community Facs. Dist. No. 09-1, Special Tax Bonds, Series 2019-A, BAM insured, 5.00% 2028 | 350 | 439 | ||||||
| Irvine Unified School Dist., Community Facs. Dist. No. 09-1, Special Tax Bonds, Series 2019-A, BAM insured, 5.00% 2030 | 215 | 273 | ||||||
| City of Jurupa, Public Fncg. Auth., Special Tax Rev. Bonds, Series 2014-A, 5.00% 2023 | 500 | 541 | ||||||
| City of Jurupa, Public Fncg. Auth., Special Tax Rev. Bonds, Series 2014-A, 5.00% 2029 | 710 | 792 | ||||||
| City of Jurupa, Public Fncg. Auth., Special Tax Rev. Ref. Bonds, Series 2020-A, BAM insured, 5.00% 2023 | 750 | 812 | ||||||
| City of Jurupa, Public Fncg. Auth., Special Tax Rev. Ref. Bonds, Series 2020-A, BAM insured, 4.00% 2027 | 1,615 | 1,879 | ||||||
| Kern Community College Dist., Safety Repair and Improvement G.O. Bonds, Capital Appreciation Bonds, 2002 Election, Series 2006, FSA insured, 0% 2022 | 1,500 | 1,497 | ||||||
| Kings Canyon Joint Unified School Dist., G.O. Rev. Ref. Bonds, Series 2016, Assured Guaranty Municipal insured, 5.00% 2029 | 1,600 | 1,852 | ||||||
| La Habra School Dist., G.O. Bonds, Capital Appreciation Bonds, 2000 Election, Series 2002-A, FSA insured, 0% 2026 | 1,010 | 953 | ||||||
| Lakeside Union School Dist., G.O. Rev. Ref. Bonds, Series 2016, 5.00% 2029 | 1,785 | 2,138 | ||||||
| Lammersville Joint Unified School Dist., Community Facs. Dist. No. 2002, Special Tax Bonds, Series 2017, 4.00% 2022 | 680 | 699 | ||||||
| City of Lodi, Public Fin. Auth., Rev. Ref. Bonds, Series 2018, Assured Guaranty Municipal insured, 5.00% 2024 | 260 | 293 | ||||||
| City of Long Beach, Bond Fin. Auth., Rev. Ref. Bonds (Aquarium of the Pacific Project), Series 2012, 5.00% 2021 | 520 | 520 | ||||||
| Long Beach Community College Dist., G.O. Bonds, Capital Appreciation Bonds, 2008 Election, Series 2008-A, Assured Guaranty Municipal insured, 0% 2027 | 3,865 | 3,607 | ||||||
| City of Los Angeles, Community Facs. Dist. No. 4 (Playa Vista - Phase 1), Special Tax Rev. Ref. Bonds, Series 2014, 5.00% 2023 | 690 | 747 | ||||||
| City of Los Angeles, Dept. of Airports, Los Angeles International Airport, Rev. and Rev. Ref. Bonds, Series 2021-B, 5.00% 2031 | 420 | 556 | ||||||
| City of Los Angeles, Dept. of Airports, Los Angeles International Airport, Rev. Bonds, Series 2019-E, 5.00% 2039 | 1,130 | 1,408 | ||||||
| City of Los Angeles, Dept. of Airports, Los Angeles International Airport, Rev. Ref. Bonds, Series 2019-C, 5.00% 2025 | 2,000 | 2,317 | ||||||
| City of Los Angeles, Dept. of Water and Power, Power System Rev. Bonds, Series 2021-B, 3.00% 2022 | 3,000 | 3,057 | ||||||
| City of Los Angeles, Dept. of Water and Power, Power System Rev. Bonds, Series 2017-C, 5.00% 2022 | 575 | 593 | ||||||
| City of Los Angeles, Dept. of Water and Power, Power System Rev. Bonds, Series 2013-A, 5.00% 2022 | 515 | 532 | ||||||
| Private Client Services Funds | 55 |
Capital Group California Core Municipal Fund
| Bonds, notes & other debt instruments (continued) | Principal amount (000) | Value (000) | ||||||
| California (continued) | ||||||||
| City of Los Angeles, Dept. of Water and Power, Power System Rev. Bonds, Series 2018-D, 5.00% 2024 | $ | 535 | $ | 601 | ||||
| City of Los Angeles, Dept. of Water and Power, Power System Rev. Bonds, Series 2018-B, 5.00% 2025 | 1,875 | 2,181 | ||||||
| City of Los Angeles, Dept. of Water and Power, Power System Rev. Bonds, Series 2018-D, 5.00% 2025 | 500 | 582 | ||||||
| City of Los Angeles, Dept. of Water and Power, Power System Rev. Bonds, Series 2019-D, 5.00% 2027 | 1,100 | 1,359 | ||||||
| City of Los Angeles, Dept. of Water and Power, Water System Rev. Bonds, Series 2020-A, 5.00% 2028 | 650 | 823 | ||||||
| City of Los Angeles, Solid Waste Resources Rev. Bonds, Series 2013-A, 2.00% 2023 | 1,110 | 1,135 | ||||||
| County of Los Angeles, Dev. Auth., Multi Family Housing Rev. Bonds (Cantamar Villas), Series 2021-D-1, 0.30% 2025 (put 2024) | 1,295 | 1,290 | ||||||
| County of Los Angeles, Dev. Auth., Multi Family Housing Rev. Bonds (Sunny Garden Apartments), Series 2021-C-1, 0.20% 2024 (put 2023) | 3,175 | 3,171 | ||||||
| County of Los Angeles, Metropolitan Transportation Auth., Proposition C Sales Tax Rev. Bonds, Series 2021-A, 5.00% 2030 | 6,410 | 8,467 | ||||||
| County of Los Angeles, Redev. Ref. Auth., Tax Allocation Rev. Ref. Bonds (South Gate Project No. 1), Series 2014-A, Assured Guaranty Municipal insured, 5.00% 2022 | 1,190 | 1,235 | ||||||
| Los Angeles Community College Dist., G.O. Bonds, 2008 Election, Series 2008-G, 4.00% 2039 (preref. 2024) | 3,350 | 3,683 | ||||||
| Los Angeles Unified School Dist., G.O. Rev. Ref. Bonds, Series 2014-C, 5.00% 2023 | 520 | 561 | ||||||
| Los Angeles Unified School Dist., G.O. Rev. Ref. Bonds, Series 2019-A, 5.00% 2027 | 5,000 | 6,172 | ||||||
| Madera Unified School Dist., G.O. Bonds, Capital Appreciation Bonds, 2002 Election, Series 2006, Assured Guaranty Municipal insured, 0% 2029 | 585 | 521 | ||||||
| Manhattan Beach Unified School Dist., G.O. Bonds, Capital Appreciation Bonds, Series 1999-C, FGIC-National insured, 0% 2024 | 3,875 | 3,753 | ||||||
| Manteca Unified School Dist., G.O. Bonds, Capital Appreciation Bonds, 2004 Election, Series 2006, MBIA insured, 0% 2027 | 560 | 517 | ||||||
| City of Merced, Irrigation Dist., Electric System Rev. Ref. Bonds, Series 2015-A, Assured Guaranty Municipal insured, 5.00% 2022 | 500 | 522 | ||||||
| City of Merced, Irrigation Dist., Electric System Rev. Ref. Bonds, Series 2015-A, Assured Guaranty Municipal insured, 5.00% 2028 | 250 | 291 | ||||||
| Montebello Unified School Dist., G.O. Rev. Ref. Bonds, Series 2015, 5.00% 2028 | 1,545 | 1,752 | ||||||
| Mountain View School Dist., G.O. Bonds, 2020 Election, Series 2021-A, Assured Guaranty Municipal insured, 4.00% 2023 | 1,290 | 1,374 | ||||||
| Municipal Fin. Auth., Educational Rev. Bonds (American Heritage Education Foundation Project), Series 2016-A, 4.00% 2026 | 200 | 214 | ||||||
| Municipal Fin. Auth., Rev. Bonds (California Institute of the Arts), Series 2021, 4.00% 2033 | 250 | 298 | ||||||
| Municipal Fin. Auth., Rev. Bonds (California Lutheran University), Series 2018, 5.00% 2026 | 300 | 357 | ||||||
| Municipal Fin. Auth., Rev. Bonds (Retirement Housing Foundation), Series 2017-A, 5.00% 2024 | 300 | 339 | ||||||
| Municipal Fin. Auth., Rev. Bonds (University of La Verne), Series 2017-A, 5.00% 2023 | 750 | 805 | ||||||
| Municipal Fin. Auth., Rev. Bonds (Village Grove Apartments), Series 2013-A, 3.10% 2021 (escrowed to maturity) | 1,210 | 1,213 | ||||||
| Municipal Fin. Auth., Rev. Ref. Bonds (Biola University), Series 2013, 5.00% 2022 | 470 | 490 | ||||||
| Municipal Fin. Auth., Rev. Ref. Bonds (Biola University), Series 2017, 5.00% 2026 | 335 | 398 | ||||||
| Municipal Fin. Auth., Rev. Ref. Bonds (Harbor Regional Center Project), Series 2015, 5.00% 2022 | 885 | 927 | ||||||
| Municipal Fin. Auth., Rev. Ref. Bonds (Harbor Regional Center Project), Series 2015, 5.00% 2025 | 500 | 586 | ||||||
| Municipal Fin. Auth., Rev. Ref. Bonds (HumanGood Obligated Group), Series 2019-A, 4.00% 2028 | 750 | 859 | ||||||
| Municipal Fin. Auth., Rev. Ref. Bonds (HumanGood Obligated Group), Series 2019-A, 4.00% 2029 | 1,085 | 1,236 | ||||||
| Municipal Fin. Auth., Rev. Ref. Bonds (HumanGood Obligated Group), Series 2019-A, 4.00% 2035 | 1,000 | 1,127 | ||||||
| Municipal Fin. Auth., Student Housing Rev. Bonds (CHF-Riverside I, LLC - UCR Student Housing Project), Series 2019, BAM insured, 5.00% 2027 | 530 | 642 | ||||||
| Murrieta Valley Unified School Dist., G.O. Bonds, 2014 Election, Series 2020, 4.00% 2023 | 335 | 357 | ||||||
| Murrieta Valley Unified School Dist., Public Fncg. Auth., Special Tax Rev. Bonds, Series 2016-A, 5.00% 2023 | 2,530 | 2,727 | ||||||
| Northern California Energy Auth., Commodity Supply Rev. Bonds, Series 2018, 4.00% 2049 (put 2024) | 2,500 | 2,709 | ||||||
| Oak Park Unified School Dist., G.O. Bonds, Capital Appreciation Bonds, 2006 Election, Series 2009-B, Assured Guaranty Municipal insured, 0% 2029 | 605 | 531 | ||||||
| Oakland Unified School Dist., G.O. Bonds, 2006 Election, Series 2016-A, 5.00% 2026 | 1,325 | 1,584 | ||||||
| Oakland Unified School Dist., G.O. Bonds, 2012 Election, Series 2019-A, Assured Guaranty Municipal insured, 5.00% 2028 | 1,000 | 1,230 | ||||||
| Oakland Unified School Dist., G.O. Bonds, 2012 Election, Series 2019-A, Assured Guaranty Municipal insured, 4.00% 2034 | 1,000 | 1,158 | ||||||
| Oakland Unified School Dist., G.O. Rev. Ref. Bonds, Series 2017-A, 5.00% 2022 | 2,000 | 2,071 | ||||||
| Oakland Unified School Dist., G.O. Rev. Ref. Bonds, Series 2016, 5.00% 2022 | 915 | 947 | ||||||
| Oakland Unified School Dist., G.O. Rev. Ref. Bonds, Series 2016, 5.00% 2024 | 1,310 | 1,471 | ||||||
| Oakland Unified School Dist., G.O. Rev. Ref. Bonds, Series 2016, 5.00% 2025 | 3,000 | 3,486 | ||||||
| Oakland Unified School Dist., G.O. Rev. Ref. Bonds, Series 2015, Assured Guaranty insured, 5.00% 2026 | 1,125 | 1,309 | ||||||
| Ohlone Community College Dist., G.O. Rev. Ref. Bonds, Series 2012, 5.00% 2023 (preref. 2022) | 550 | 570 | ||||||
| County of Orange, Airport Private Activity Rev. Ref. Bonds, Series 2019-B, 5.00% 2025 | 1,065 | 1,237 | ||||||
| 56 | Private Client Services Funds |
Capital Group California Core Municipal Fund
| Bonds, notes & other debt instruments (continued) | Principal amount (000) | Value (000) | ||||||
| California (continued) | ||||||||
| County of Orange, Airport Private Activity Rev. Ref. Bonds, Series 2019-A, 5.00% 2025 | $ | 1,000 | $ | 1,161 | ||||
| County of Orange, Airport Rev. Ref. Bonds, Series 2019-A, 5.00% 2022 | 1,000 | 1,032 | ||||||
| County of Orange, Community Facs. Dist. No. 2016-1 (Village of Esencia), Special Tax Bonds, Series 2016-A, 5.00% 2026 | 570 | 673 | ||||||
| County of Orange, Sanitation Dist., Wastewater Rev. Ref. Obligations, Series 2021-A, 5.00% 2032 | 1,500 | 2,010 | ||||||
| County of Orange, Water Dist. Rev. Certs. of Part. (Interim Obligations), Series 2019-A, 2.00% 2023 | 2,725 | 2,787 | ||||||
| City of Oxnard, Fncg. Auth., Wastewater Rev. Ref. Bonds, Series 2014, Assured Guaranty Municipal insured, 5.00% 2024 | 250 | 279 | ||||||
| City of Oxnard, Water Rev. Ref. Bonds, Series 2018, BAM insured, 5.00% 2022 | 700 | 719 | ||||||
| City of Oxnard, Water Rev. Ref. Bonds, Series 2018, BAM insured, 5.00% 2024 | 450 | 502 | ||||||
| Oxnard Unified School Dist., G.O. Bonds, 2012 Election, Series 2012-A, Assured Guaranty Municipal insured, 5.00% 2037 (preref. 2022) | 500 | 518 | ||||||
| Palomar Health, G.O. Rev. Ref. Bonds, Series 2016-A, 5.00% 2026 | 630 | 739 | ||||||
| Paramount Unified School Dist., G.O. Bonds, Capital Appreciation Bonds, 1998 Election, Series 2001-B, Assured Guaranty Municipal insured, 0% 2025 | 3,000 | 2,907 | ||||||
| Peninsula Corridor Joint Powers Board, Farebox Rev. Bonds, Series 2019-A, 5.00% 2026 | 250 | 298 | ||||||
| Peninsula Corridor Joint Powers Board, Farebox Rev. Bonds, Series 2019-A, 5.00% 2027 | 200 | 244 | ||||||
| Peninsula Corridor Joint Powers Board, Farebox Rev. Bonds, Series 2019-A, 5.00% 2028 | 285 | 355 | ||||||
| Peninsula Corridor Joint Powers Board, Farebox Rev. Bonds, Series 2019-A, 5.00% 2029 | 400 | 507 | ||||||
| Peralta Community College Dist., G.O. Rev. Ref. Bonds, Series 2014-A, 5.00% 2025 | 2,680 | 3,006 | ||||||
| City of Perris, Joint Powers Auth., Local Agcy. Rev. Ref. Bonds (CFD No. 2001-1 IA No. 4 and No. 5; CFD No. 2005-1 IA No. 4), Series 2017-B, 4.00% 2022 | 915 | 940 | ||||||
| Perris Union High School Dist., Fncg. Auth., Rev. Bonds, Series 2015, 5.00% 2024 | 1,000 | 1,115 | ||||||
| Perris Union High School Dist., G.O. Bonds, 2012 Election, Series 2021-C, 4.00% 2028 | 185 | 222 | ||||||
| Perris Union High School Dist., G.O. Bonds, 2012 Election, Series 2021-C, 4.00% 2029 | 200 | 244 | ||||||
| Perris Union High School Dist., G.O. Bonds, 2012 Election, Series 2021-C, 4.00% 2030 | 215 | 260 | ||||||
| Perris Union High School Dist., G.O. Bonds, 2012 Election, Series 2021-C, 4.00% 2031 | 350 | 421 | ||||||
| Pleasant Valley School Dist., G.O. Bonds, 2018 Election, Series A, 5.00% 2029 | 645 | 770 | ||||||
| Pollution Control Fncg. Auth., Water Facs. Rev. Ref. Bonds (American Water Capital Corp. Project), Series 2020, 0.60% 2040 (put 2023) | 3,270 | 3,266 | ||||||
| Poway Unified School Dist., Public Fncg. Auth., Special Tax Rev. Bonds, Series 2013, 4.00% 2022 | 440 | 454 | ||||||
| Poway Unified School Dist., Public Fncg. Auth., Special Tax Rev. Ref. Bonds, Series 2015-A, 5.00% 2022 | 850 | 881 | ||||||
| Poway Unified School Dist., Public Fncg. Auth., Special Tax Rev. Ref. Bonds, Series 2015-B, BAM insured, 5.00% 2022 | 500 | 520 | ||||||
| Poway Unified School Dist., Public Fncg. Auth., Special Tax Rev. Ref. Bonds, Series 2016-A, 5.00% 2023 | 885 | 961 | ||||||
| Public Fin. Auth., Electric System Rev. Ref. Bonds, Series 2018, Assured Guaranty Municipal insured, 5.00% 2023 | 730 | 791 | ||||||
| Public Fin. Auth., Reassessment Rev. Ref. Bonds, Series 2019, 5.00% 2022 | 1,115 | 1,156 | ||||||
| Public Fin. Auth., Reassessment Rev. Ref. Bonds, Series 2019, 5.00% 2029 | 1,000 | 1,250 | ||||||
| Public Fin. Auth., Rev. Bonds (Henry Mayo Newhall Memorial Hospital), Series 2017, Assured Guaranty Municipal insured, 5.00% 2023 | 500 | 542 | ||||||
| Public Fin. Auth., Rev. Ref. Bonds (O’Conner Woods), Series 2022, 4.00% 2028 | 450 | 507 | ||||||
| Public Fin. Auth., Rev. Ref. Bonds (O’Conner Woods), Series 2022, 4.00% 2029 | 500 | 571 | ||||||
| Public Fin. Auth., Rev. Ref. Bonds (O’Conner Woods), Series 2022, 4.00% 2031 | 520 | 605 | ||||||
| Public Works Board, Lease Rev. Bonds (Dept. of Corrections, Various State Prisons), Series 2019-D, 5.00% 2028 | 1,000 | 1,266 | ||||||
| Public Works Board, Lease Rev. Ref. Bonds (Dept. of Corrections, Various State Prisons), Series 2015-A, 5.00% 2023 | 790 | 849 | ||||||
| Public Works Board, Lease Rev. Ref. Bonds (Various Capital Projects), Series 2016-C, 5.00% 2024 | 1,650 | 1,876 | ||||||
| Public Works Board, Lease Rev. Ref. Bonds (Various Capital Projects), Series 2017-C, 5.00% 2026 | 4,060 | 4,823 | ||||||
| Public Works Board, Lease Rev. Ref. Bonds (Various Capital Projects), Series 2022-A, 5.00% 2028 | 5,005 | 6,164 | ||||||
| Public Works Board, Lease Rev. Ref. Bonds (Various Capital Projects), Series 2016-D, 5.00% 2028 | 5,000 | 6,043 | ||||||
| Public Works Board, Lease Rev. Ref. Bonds (Various Capital Projects), Series 2017-B, 5.00% 2028 | 1,415 | 1,750 | ||||||
| City of Rancho Cucamonga, Successor Agcy. to the Redev. Agcy., Tax Allocation Rev. Ref. Bonds (Rancho Redev. Project Area), Series 2014, Assured Guaranty Municipal insured, 5.00% 2026 | 600 | 673 | ||||||
| City of Rancho Cucamonga, Successor Agcy. to the Redev. Agcy., Tax Allocation Rev. Ref. Bonds (Rancho Redev. Project Area), Series 2014, Assured Guaranty Municipal insured, 5.00% 2028 | 300 | 335 | ||||||
| City of Redding, Joint Powers Fin. Auth., Electric System Rev. Bonds, Series 2015-A, 5.00% 2024 | 15 | 17 | ||||||
| Rialto Unified School Dist., G.O. Bonds, 2010 Election, Series 2019, 3.00% 2026 | 600 | 669 | ||||||
| Rialto Unified School Dist., G.O. Bonds, 2010 Election, Series 2019, 3.00% 2027 | 750 | 847 | ||||||
| City of Richmond, Successor Agcy. to the Redev. Agcy., Rev. Ref. Bonds, Series 2014-A, BAM insured, 5.00% 2025 | 200 | 224 | ||||||
| Rio Elementary School Dist., Community Facs. Dist. No. 1, Special Tax Bonds, Series 2016, BAM insured, 5.00% 2032 | 240 | 282 | ||||||
| Rio Elementary School Dist., Community Facs. Dist. No. 1, Special Tax Rev. Ref. Bonds, Series 2014, 5.00% 2022 | 400 | 415 | ||||||
| Private Client Services Funds | 57 |
Capital Group California Core Municipal Fund
| Bonds, notes & other debt instruments (continued) | Principal amount (000) | Value (000) | ||||||
| California (continued) | ||||||||
| Rio Hondo Community College Dist., G.O. Bonds, Capital Appreciation Bonds, 2004 Election, Series 2010-C, 0% 2033 | $ | 660 | $ | 534 | ||||
| County of Riverside, Public Fncg. Auth., Tax Allocation Rev. Bonds (Project Area No. 1, Desert Communities and Interstate 215 Corridor Projects), Series 2015-A, Assured Guaranty Municipal insured, 5.00% 2023 | 1,075 | 1,169 | ||||||
| County of Riverside, Public Fncg. Auth., Tax Allocation Rev. Ref. Bonds (Hemet Project), Series 2014, BAM insured, 5.00% 2023 | 500 | 542 | ||||||
| Riverside Community Properties Dev., Inc., Lease Rev. Bonds (Riverside County Law Building Project), Series 2013, 6.00% 2038 (preref. 2023) | 2,585 | 2,876 | ||||||
| Riverside Unified School Dist., Fncg. Auth., Special Tax Rev. Ref. Bonds, Series 2015, BAM insured, 5.00% 2025 | 350 | 399 | ||||||
| Riverside Unified School Dist., Fncg. Auth., Special Tax Rev. Ref. Bonds, Series 2015, BAM insured, 5.00% 2026 | 400 | 457 | ||||||
| Riverside Unified School Dist., G.O. Bonds, 2016 Election, Series 2019, 4.00% 2029 | 850 | 992 | ||||||
| City of Roseville, Community Facs. Dist. No. 1 (Westpark), Special Tax Rev. Ref. Bonds, Series 2015, 5.00% 2024 | 1,000 | 1,117 | ||||||
| City of Sacramento, Municipal Utility Dist., Electric Rev. Bonds, Series 1997-K, AMBAC insured, 5.25% 2024 | 770 | 835 | ||||||
| County of Sacramento, Airport System Rev. Ref. Bonds, Series 2018-E, 5.00% 2027 | 1,015 | 1,247 | ||||||
| County of Sacramento, Airport System Rev. Ref. Bonds, Series 2018-E, 5.00% 2030 | 200 | 248 | ||||||
| County of Sacramento, Sanitation Dist. Fin. Auth., Rev. Ref. Bonds, Series 2021, 5.00% 2032 | 500 | 694 | ||||||
| Sacramento Unified School Dist., G.O. Bonds, Series 2015, Assured Guaranty Municipal insured, 5.00% 2030 | 1,000 | 1,107 | ||||||
| Sacramento Unified School Dist., G.O. Bonds, 2012 Election, Series 2019-D, BAM insured, 4.00% 2027 | 585 | 683 | ||||||
| Sacramento Unified School Dist., G.O. Bonds, 2012 Election, Series 2017-E, 5.00% 2027 | 555 | 677 | ||||||
| Sacramento Unified School Dist., G.O. Bonds, 2012 Election, Series 2019-D, BAM insured, 4.00% 2028 | 610 | 723 | ||||||
| Sacramento Unified School Dist., G.O. Bonds, 2012 Election, Series 2019-D, BAM insured, 4.00% 2029 | 635 | 762 | ||||||
| Sacramento Unified School Dist., G.O. Rev. Ref. Bonds, Series 2012, 5.25% 2024 | 1,300 | 1,340 | ||||||
| San Bernardino Unified School Dist., G.O. Rev. Ref. Bonds, Series 2013-A, Assured Guaranty Municipal insured, 5.00% 2022 (escrowed to maturity) | 1,500 | 1,553 | ||||||
| City of San Diego, Community Facs. Dist. No. 2 (Santaluz), Improvement Area No. 1, Special Tax Rev. Ref. Bonds, Series 2021, 4.00% 2027 | 635 | 743 | ||||||
| City of San Diego, Community Facs. Dist. No. 2 (Santaluz), Improvement Area No. 1, Special Tax Rev. Ref. Bonds, Series 2021, 4.00% 2028 | 880 | 1,047 | ||||||
| City of San Diego, Community Facs. Dist. No. 2 (Santaluz), Improvement Area No. 1, Special Tax Rev. Ref. Bonds, Series 2021, 4.00% 2029 | 430 | 520 | ||||||
| City of San Diego, Limited Obligation Rev. Bonds (Sanford Burnham Prebys Medical Discovery Institute Project), Series 2015-A, 5.00% 2022 | 200 | 209 | ||||||
| City of San Diego, Public Facs. Fncg. Auth., Lease Rev. Bonds (Capital Improvement Projects), Series 2021-A, 5.00% 2030 | 200 | 263 | ||||||
| City of San Diego, Public Facs. Fncg. Auth., Lease Rev. Bonds (Capital Improvement Projects), Series 2021-A, 5.00% 2031 | 150 | 197 | ||||||
| City of San Diego, Public Facs. Fncg. Auth., Water Rev. Bonds, Series 2020-A, 5.00% 2029 | 500 | 648 | ||||||
| County of San Diego, Community Facs. Dist. No. 2008-1 (Harmony Grove Village), Improvement Area No. 2, Special Tax Bonds, Series 2020-A, 4.00% 2026 | 255 | 288 | ||||||
| County of San Diego, Regional Airport Auth., Airport Rev. and Rev. Ref. Bonds, Series 2019-A, 5.00% 2027 | 400 | 490 | ||||||
| County of San Diego, Regional Airport Auth., Airport Rev. and Rev. Ref. Bonds, Series 2019-A, 5.00% 2028 | 320 | 401 | ||||||
| County of San Diego, Regional Airport Auth., Airport Rev. and Rev. Ref. Bonds, Series 2019-A, 5.00% 2029 | 585 | 745 | ||||||
| County of San Diego, Regional Airport Auth., Airport Rev. Bonds, Series 2013-A, 5.00% 2023 | 245 | 264 | ||||||
| County of San Diego, Regional Airport Auth., Airport Rev. Ref. Bonds, Series 2020-B, 5.00% 2022 | 3,990 | 4,117 | ||||||
| County of San Diego, Regional Airport Auth., Airport Rev. Ref. Bonds, Series 2020-A, 5.00% 2028 | 1,000 | 1,252 | ||||||
| County of San Diego, Regional Airport Auth., Airport Rev. Ref. Bonds, Series 2020-A, 5.00% 2029 | 1,000 | 1,274 | ||||||
| County of San Diego, Regional Airport Auth., Airport Rev. Ref. Bonds, Series 2020-B, 5.00% 2031 | 1,405 | 1,817 | ||||||
| County of San Diego, Regional Transportation Commission, Limited Sales Tax Rev. Bonds, Series 2021-B, 5.00% 2029 | 320 | 414 | ||||||
| County of San Diego, Regional Transportation Commission, Limited Sales Tax Rev. Green Bonds, Series 2020-A, 5.00% 2028 | 850 | 1,073 | ||||||
| County of San Diego, Water Auth. Rev. Ref. Bonds, Series 2013-A, 5.00% 2031 (preref. 2022) | 900 | 944 | ||||||
| County of San Diego, Water Auth. Rev. Ref. Green Bonds, Series 2021-A, 5.00% 2028 | 1,000 | 1,264 | ||||||
| County of San Diego, Water Auth., Water Rev. Ref. Green Bonds, Series 2021-S-1, 5.00% 2028 | 1,285 | 1,619 | ||||||
| San Diego Unified School Dist., G.O. Dedicated Unlimited Ad Valorem Property Tax Bonds, Series 2016-SR-1, 4.00% 2031 | 3,000 | 3,435 | ||||||
| San Diego Unified School Dist., G.O. Dedicated Unlimited Ad Valorem Property Tax Rev. Ref. Bonds, Series 2015-R-4, 5.00% 2026 | 1,000 | 1,166 | ||||||
| San Diego Unified School Dist., G.O. Dedicated Unlimited Ad Valorem Property Tax Rev. Ref. Bonds, Series 2015-R-4, 5.00% 2027 | 3,000 | 3,497 | ||||||
| City and County of San Francisco, Airport Commission, San Francisco International Airport, Rev. Bonds, Series 2019-D-2, 5.00% 2024 | 1,000 | 1,114 | ||||||
| 58 | Private Client Services Funds |
Capital Group California Core Municipal Fund
| Bonds, notes & other debt instruments (continued) | Principal amount (000) | Value (000) | ||||||
| California (continued) | ||||||||
| City and County of San Francisco, Airport Commission, San Francisco International Airport, Rev. Ref. Bonds, Series 2021-B-2, 5.00% 2031 | $ | 2,780 | $ | 3,666 | ||||
| City and County of San Francisco, Public Utilities Commission, San Francisco Water Rev. Bonds, Series 2011-A, 5.00% 2029 (preref. 2021) | 3,000 | 3,000 | ||||||
| City and County of San Francisco, Successor Agcy. to the Redev. Agcy., Special Tax Rev. Ref. Bonds (San Francisco Redev. Projects), Series 2014-C, 5.00% 2022 | 305 | 316 | ||||||
| City of San Francisco, Bay Area Rapid Transit Dist., G.O. Bonds, 2016 Election, Series 2020-C-1, 5.00% 2027 | 1,500 | 1,859 | ||||||
| San Francisco Community College Dist., G.O. Rev. Ref. Bonds, Series 2015, 5.00% 2023 | 2,510 | 2,701 | ||||||
| San Francisco Community College Dist., G.O. Rev. Ref. Bonds, Series 2020, 5.00% 2027 | 1,525 | 1,871 | ||||||
| San Francisco Unified School Dist., G.O. Bonds, 2016 Election, Series 2020-B, 4.00% 2022 | 1,000 | 1,024 | ||||||
| San Francisco Unified School Dist., G.O. Bonds, 2016 Election, Series 2020-B, 4.00% 2029 | 1,000 | 1,192 | ||||||
| San Jacinto Unified School Dist., Fncg. Auth., Special Tax Rev. Bonds, Series 2019, 5.00% 2022 | 25 | 26 | ||||||
| San Jacinto Unified School Dist., Fncg. Auth., Special Tax Rev. Bonds, Series 2019, 5.00% 2023 | 40 | 43 | ||||||
| San Jacinto Unified School Dist., Fncg. Auth., Special Tax Rev. Bonds, Series 2019, 5.00% 2024 | 65 | 72 | ||||||
| San Jacinto Unified School Dist., Fncg. Auth., Special Tax Rev. Bonds, Series 2019, 5.00% 2025 | 90 | 103 | ||||||
| San Jacinto Unified School Dist., Fncg. Auth., Special Tax Rev. Bonds, Series 2019, 5.00% 2026 | 155 | 183 | ||||||
| San Joaquin Hills Transportation Corridor Agcy., Toll Road Rev. Ref. Bonds, Capital Appreciation Bonds, Series 1993, National insured, 0% 2022 (escrowed to maturity) | 5,000 | 4,998 | ||||||
| San Joaquin Hills Transportation Corridor Agcy., Toll Road Rev. Ref. Bonds, Capital Appreciation Bonds, Series 1997-A, National insured, 0% 2025 | 285 | 278 | ||||||
| City of San Jose, Airport Rev. Ref. Bonds, Series 2021-A, BAM insured, 5.00% 2029 | 500 | 633 | ||||||
| City of San Jose, Airport Rev. Ref. Bonds, Series 2021-A, BAM insured, 5.00% 2030 | 250 | 322 | ||||||
| City of San Jose, Airport Rev. Ref. Bonds, Series 2021-B, 5.00% 2032 | 1,250 | 1,639 | ||||||
| City of San Jose, Fin. Auth., Lease Rev. Ref. Bonds (Civic Center Project), Series 2013-A, 5.00% 2030 (preref. 2023) | 1,625 | 1,747 | ||||||
| City of San Jose, G.O. Bonds (Disaster Preparedness, Public Safety and Infrastructure), Series 2021-A, 5.00% 2030 | 2,250 | 2,993 | ||||||
| San Jose Unified School Dist., G.O. Bonds, Capital Appreciation Bonds, 2002 Election, Series 2006-C, National insured, 0% 2025 | 795 | 776 | ||||||
| San Jose Unified School Dist., G.O. Rev. Ref. Bonds, Series 2017, 5.00% 2022 | 500 | 518 | ||||||
| San Jose Unified School Dist., G.O. Rev. Ref. Bonds, Series 2017, 5.00% 2023 | 375 | 406 | ||||||
| San Jose Unified School Dist., G.O. Rev. Ref. Bonds, Series 2017, 5.00% 2024 | 500 | 565 | ||||||
| San Ramon Valley Unified School Dist., G.O. Bonds, 2012 Election, Series 2018, 5.00% 2024 | 1,000 | 1,127 | ||||||
| Santa Margarita Water Dist., Community Facs. Dist. No. 99-1 (Talega), Special Tax Rev. Ref. Bonds, Series 2014-B, 5.00% 2022 | 310 | 322 | ||||||
| Santa Margarita Water Dist., Community Facs. Dist. No. 99-1 (Talega), Special Tax Rev. Ref. Bonds, Series 2014-B, 5.00% 2024 | 530 | 592 | ||||||
| Santa Margarita Water Dist., Community Facs. Dist. No. 99-1 (Talega), Special Tax Rev. Ref. Bonds, Series 2014-B, 5.00% 2025 | 375 | 418 | ||||||
| Santa Monica-Malibu Unified School Dist., School Facs. Improvement Dist. No. 2 (Malibu Schools), G.O. Bonds, 2018 Election, Series 2021-B, 4.00% 2024 | 1,235 | 1,361 | ||||||
| Santa Monica-Malibu Unified School Dist., School Facs. Improvement Dist. No. 2 (Malibu Schools), G.O. Bonds, 2018 Election, Series 2021-B, 4.00% 2025 | 345 | 391 | ||||||
| Santa Monica-Malibu Unified School Dist., School Facs. Improvement Dist. No. 2 (Santa Monica Schools), G.O. Bonds, 2018 Election, Series 2021-B, 4.00% 2025 | 405 | 459 | ||||||
| Santa Rosa High School Dist., G.O. Bonds, 2014 Election, Series 2021-E, BAM insured, 4.00% 2027 | 500 | 590 | ||||||
| Santa Rosa High School Dist., G.O. Bonds, 2014 Election, Series 2021-E, BAM insured, 4.00% 2029 | 500 | 609 | ||||||
| Saugus Union School Dist., G.O. Rev. Ref. Bonds, Capital Appreciation Bonds, Series 2006, FGIC-National insured, 0% 2024 | 1,210 | 1,187 | ||||||
| Saugus Union School Dist., Saugus/Hart School Facs. Fin. Auth., Community Facs. Dist. No. 2006-1, Special Tax Rev. Bonds, Series 2016, 5.00% 2024 | 500 | 558 | ||||||
| Saugus Union School Dist., Saugus/Hart School Facs. Fin. Auth., Community Facs. Dist. No. 2006-1, Special Tax Rev. Bonds, Series 2016, 5.00% 2025 | 1,110 | 1,275 | ||||||
| School Fin. Auth., School Fac. Rev. Bonds (Granada Hills Charter Obligated Group), Series 2019, 4.00% 20272 | 740 | 831 | ||||||
| School Fin. Auth., School Fac. Rev. Bonds (Granada Hills Charter Obligated Group), Series 2019, 4.00% 20292 | 805 | 894 | ||||||
| School Fin. Auth., School Fac. Rev. Bonds (Granada Hills Charter Obligated Group), Series 2019, 5.00% 20312 | 875 | 1,008 | ||||||
| School Fin. Auth., School Fac. Rev. Bonds (Kipp LA Projects), Series 2017-A, 5.00% 20272 | 600 | 719 | ||||||
| School Fin. Auth., School Fac. Rev. Bonds (KIPP LA Projects), Series 2014-A, 4.125% 2024 | 940 | 992 | ||||||
| School Fin. Auth., School Fac. Rev. Bonds (KIPP LA Projects), Series 2017-A, 5.00% 20242 | 585 | 648 | ||||||
| School Fin. Auth., School Fac. Rev. Bonds (KIPP LA Projects), Series 2015-A, 3.625% 20252 | 600 | 634 | ||||||
| School Fin. Auth., School Fac. Rev. Bonds (KIPP LA Projects), Series 2017-A, 5.00% 20262 | 505 | 591 | ||||||
| School Fin. Auth., School Fac. Rev. Bonds (KIPP SoCal Projects), Series 2019-A, 5.00% 20222 | 200 | 206 | ||||||
| School Fin. Auth., School Fac. Rev. Bonds (KIPP SoCal Projects), Series 2019-A, 5.00% 20232 | 225 | 241 | ||||||
| School Fin. Auth., School Fac. Rev. Bonds (KIPP SoCal Projects), Series 2019-A, 5.00% 20242 | 130 | 144 | ||||||
| School Fin. Auth., School Fac. Rev. Bonds (KIPP SoCal Projects), Series 2020-A, 5.00% 20242 | 100 | 111 | ||||||
| Private Client Services Funds | 59 |
Capital Group California Core Municipal Fund
| Bonds, notes & other debt instruments (continued) | Principal amount (000) | Value (000) | ||||||
| California (continued) | ||||||||
| School Fin. Auth., School Fac. Rev. Bonds (KIPP SoCal Projects), Series 2019-A, 5.00% 20252 | $ | 150 | $ | 171 | ||||
| School Fin. Auth., School Fac. Rev. Bonds (KIPP SoCal Projects), Series 2020-A, 5.00% 20252 | 105 | 120 | ||||||
| School Fin. Auth., School Fac. Rev. Bonds (KIPP SoCal Projects), Series 2020-A, 5.00% 20262 | 110 | 129 | ||||||
| School Fin. Auth., School Fac. Rev. Bonds (KIPP SoCal Projects), Series 2019-A, 5.00% 20262 | 105 | 123 | ||||||
| School Fin. Auth., School Fac. Rev. Bonds (KIPP SoCal Projects), Series 2019-A, 5.00% 20272 | 220 | 264 | ||||||
| School Fin. Auth., School Fac. Rev. Bonds (KIPP SoCal Projects), Series 2020-A, 5.00% 20272 | 100 | 120 | ||||||
| School Fin. Auth., School Fac. Rev. Bonds (KIPP SoCal Projects), Series 2020-A, 5.00% 20282 | 100 | 122 | ||||||
| School Fin. Auth., School Fac. Rev. Bonds (KIPP SoCal Projects), Series 2020-A, 5.00% 20292 | 100 | 124 | ||||||
| School Fin. Auth., School Fac. Rev. Bonds (KIPP SoCal Projects), Series 2020-A, 5.00% 20302 | 100 | 126 | ||||||
| City of Seal Beach, Community Facs. Dist. No. 2005-1 (Pacific Gateway Business Center), Special Tax Rev. Ref. Bonds, Series 2016, 3.00% 2023 | 150 | 155 | ||||||
| City of Seal Beach, Community Facs. Dist. No. 2005-1 (Pacific Gateway Business Center), Special Tax Rev. Ref. Bonds, Series 2016, 3.00% 2024 | 145 | 150 | ||||||
| City of Seal Beach, Community Facs. Dist. No. 2005-1 (Pacific Gateway Business Center), Special Tax Rev. Ref. Bonds, Series 2016, 3.00% 2025 | 365 | 378 | ||||||
| City of Seal Beach, Community Facs. Dist. No. 2005-1 (Pacific Gateway Business Center), Special Tax Rev. Ref. Bonds, Series 2016, 3.00% 2026 | 150 | 155 | ||||||
| City of Signal Hill, Successor Agcy. to the Redev. Agcy., Tax Allocation Rev. Ref. Bonds, Series 2015-A, BAM insured, 5.00% 2023 | 500 | 544 | ||||||
| Silicon Valley Clean Water, Wastewater Rev. Notes, Series 2019-A, 3.00% 2024 | 4,065 | 4,259 | ||||||
| Silicon Valley Clean Water, Wastewater Rev. Notes, Series 2021-B, 0.50% 2026 | 5,040 | 4,998 | ||||||
| Solano Community College Dist., G.O. Bonds, 2015 Election, Series 2013-A, 4.375% 2047 (preref. 2023) | 595 | 638 | ||||||
| South Placer Wastewater Auth., Wastewater Rev. Ref. Bonds, Series 2020, 5.00% 2031 | 2,885 | 3,825 | ||||||
| South Placer Wastewater Auth., Wastewater Rev. Ref. Bonds, Series 2020, 5.00% 2032 | 500 | 675 | ||||||
| Southern California Public Power Auth., Rev. Ref. Bonds (Magnolia Power Project A), Series 2020-1, 5.00% 2027 | 1,100 | 1,362 | ||||||
| Southern California Public Power Auth., Rev. Ref. Green Bonds (Milford Wind Corridor Phase II Project), Series 2021-1, 5.00% 2026 | 200 | 241 | ||||||
| Southern California Public Power Auth., Rev. Ref. Green Bonds (Milford Wind Corridor Phase II Project), Series 2021-1, 5.00% 2027 | 400 | 495 | ||||||
| Stanislaus Union School Dist., G.O. Rev. Ref. Bonds, Series 2019, BAM insured, 5.00% 2025 | 500 | 582 | ||||||
| Statewide Communities Dev. Auth., Multi Family Housing Rev. Bonds (Harriet Tubman Terrace Apartments), Series 2021-Q, 0.24% 2024 (put 2023) | 7,000 | 6,990 | ||||||
| Statewide Communities Dev. Auth., Multi Family Housing Rev. Bonds (Washington Court Apartments), Series 2021-E, 0.22% 2023 (put 2022) | 5,000 | 4,998 | ||||||
| Statewide Communities Dev. Auth., Rev. Bonds (Adventist Health System/West), Series 2015-A, 5.00% 2025 | 750 | 862 | ||||||
| Statewide Communities Dev. Auth., Rev. Bonds (Adventist Health System/West), Series 2015-A, 5.00% 2028 | 2,085 | 2,447 | ||||||
| Statewide Communities Dev. Auth., Rev. Bonds (Adventist Health System/West), Series 2018-A, 5.00% 2034 | 975 | 1,184 | ||||||
| Statewide Communities Dev. Auth., Rev. Bonds (American Baptist Homes of the West), Series 2015, 5.00% 2023 | 1,110 | 1,203 | ||||||
| Statewide Communities Dev. Auth., Rev. Bonds (Cottage Health System Obligated Group), Series 2015, 5.00% 2043 (preref. 2024) | 5,000 | 5,694 | ||||||
| Statewide Communities Dev. Auth., Rev. Bonds (Henry Mayo Newhall Memorial Hospital), Series 2014, Assured Guaranty Municipal insured, 5.00% 2022 | 750 | 782 | ||||||
| Statewide Communities Dev. Auth., Rev. Bonds (Jewish Home of San Francisco), Series 2016, 5.00% 2026 | 575 | 693 | ||||||
| Statewide Communities Dev. Auth., Rev. Bonds (Viamonte Senior Living 1 Project), Series 2018-B, 3.00% 2025 | 310 | 311 | ||||||
| Statewide Communities Dev. Auth., Rev. Ref. Bonds (Episcopal Communities and Services), Series 2012, 5.00% 2024 | 300 | 307 | ||||||
| Statewide Communities Dev. Auth., Rev. Ref. Bonds (Huntington Memorial Hospital), Series 2014-B, 5.00% 2026 | 200 | 224 | ||||||
| Statewide Communities Dev. Auth., Rev. Ref. Bonds (Methodist Hospital of Southern California), Series 2018, 5.00% 2023 | 500 | 526 | ||||||
| Statewide Communities Dev. Auth., Rev. Ref. Bonds (Methodist Hospital of Southern California), Series 2018, 5.00% 2024 | 390 | 427 | ||||||
| Statewide Communities Dev. Auth., Rev. Ref. Bonds (Rady Children’s Hospital), Series 2016-B, 5.00% 2028 | 860 | 1,081 | ||||||
| Statewide Communities Dev. Auth., Student Housing Rev. Bonds (University of California, Irvine East Campus Apartments, Phase I Ref. and Phase IV-B CHF-Irvine, LLC), Series 2021, BAM insured, 5.00% 2031 | 3,000 | 3,958 | ||||||
| Statewide Communities Dev. Auth., Student Housing Rev. Bonds (University of California, Irvine East Campus Apartments, Phase I Ref. and Phase IV-B CHF-Irvine, LLC), Series 2021, BAM insured, 5.00% 2032 | 3,500 | 4,588 | ||||||
| Statewide Communities Dev. Auth., Student Housing Rev. Ref. Bonds (CHF-Irvine, LLC - University of California, Irvine East Campus Apartments), Series 2016, 5.00% 2022 | 1,000 | 1,026 | ||||||
| Stockton Unified School Dist., G.O. Bonds, 2012 Election, Series 2018-C, BAM insured, 5.00% 2030 | 2,145 | 2,681 | ||||||
| City of Suisun, Successor Agcy. to the Redev. Agcy., Tax Allocation Rev. Ref. Bonds, Series 2014-B, BAM insured, 5.00% 2022 | 400 | 417 | ||||||
| 60 | Private Client Services Funds |
Capital Group California Core Municipal Fund
| Bonds, notes & other debt instruments (continued) | Principal amount (000) | Value (000) | ||||||
| California (continued) | ||||||||
| Sweetwater Union High School Dist., G.O. Bonds, 2006 Election, Series 2006, 4.00% 2026 | $ | 515 | $ | 573 | ||||
| Sweetwater Union High School Dist., G.O. Rev. Ref. Bonds, Series 2014, BAM insured, 5.00% 2025 | 1,715 | 1,918 | ||||||
| Sweetwater Union High School Dist., G.O. Rev. Ref. Bonds, Series 2014, BAM insured, 5.00% 2026 | 6,000 | 6,691 | ||||||
| Tobacco Securitization Auth. of Northern California, Tobacco Settlement Asset-Backed Rev. Ref. Senior Bonds (Sacramento County Tobacco Securitization Corp.), Series 2021-A-1, 5.00% 2024 | 1,250 | 1,391 | ||||||
| Tobacco Securitization Auth. of Southern California, Tobacco Settlement Asset-Backed Rev. Ref. Bonds (San Diego County Tobacco Asset Securitization Corp.), Series 2019-A, 5.00% 2025 | 1,000 | 1,151 | ||||||
| City of Tracy, Successor Agcy. to the Community Dev. Agcy., Tax Allocation Rev. Ref. Bonds, Series 2016, Assured Guaranty Municipal insured, 5.00% 2030 | 545 | 628 | ||||||
| Transbay Joint Powers Auth., Senior Tax Allocation Green Bonds, Series 2020-A, 5.00% 2027 | 600 | 737 | ||||||
| Transbay Joint Powers Auth., Senior Tax Allocation Green Bonds, Series 2020-A, 5.00% 2028 | 700 | 879 | ||||||
| Transbay Joint Powers Auth., Senior Tax Allocation Green Bonds, Series 2020-A, 5.00% 2029 | 660 | 845 | ||||||
| Transbay Joint Powers Auth., Senior Tax Allocation Green Bonds, Series 2020-A, 5.00% 2030 | 300 | 386 | ||||||
| City of Tustin, Community Facs. Dist. No. 06-1 (Tustin Legacy/Columbus Villages), Special Tax Rev. Ref. Bonds, Series 2015-A, 5.00% 2024 | 860 | 973 | ||||||
| Tustin Unified School Dist., Community Facs. Dist. No. 88-1, Special Tax Rev. Ref. Bonds, Series 2015, BAM insured, 5.00% 2022 | 830 | 862 | ||||||
| Twin Rivers Unified School Dist., G.O. Rev. Ref. Bonds, Series 2016-B, Assured Guaranty Municipal insured, 5.00% 2024 | 400 | 447 | ||||||
| Ukiah Unified School Dist., G.O. Bonds, Capital Appreciation Bonds, 2005 Election, Series 2006, National insured, 0% 2022 | 175 | 174 | ||||||
| Ukiah Unified School Dist., G.O. Bonds, Capital Appreciation Bonds, 2005 Election, Series 2006, MBIA insured, 0% 2023 | 1,500 | 1,486 | ||||||
| Union City, Successor Agcy. to the Redev. Agcy., Tax Allocation Rev. Ref. Redev. Bonds, Series 2015-A, 5.00% 2023 | 375 | 409 | ||||||
| Regents of the University of California, G.O. Rev. Bonds, Series 2013-AK, 5.00% 2048 (put 2023) | 2,000 | 2,146 | ||||||
| Regents of the University of California, Limited Project Rev. Bonds, Series 2022-S, 5.00% 2031 | 1,150 | 1,511 | ||||||
| Val Verde Unified School Dist., G.O. Rev. Ref. Bonds, Series 2016-A, Assured Guaranty Municipal insured, 4.00% 2023 | 600 | 637 | ||||||
| Dept. of Veterans Affairs, Home Purchase Rev. Bonds, Series 2016-B, 3.50% 2045 | 1,055 | 1,111 | ||||||
| Dept. of Veterans Affairs, Home Purchase Rev. Bonds, Series 2019-A, 4.00% 2049 | 2,810 | 3,060 | ||||||
| Dept. of Veterans Affairs, Home Purchase Rev. Bonds, Series 2020-A, 3.00% 2050 | 4,975 | 5,339 | ||||||
| Dept. of Veterans Affairs, Veterans G.O. Bonds, Series 2017-CQ, 4.00% 2047 | 1,380 | 1,481 | ||||||
| Dept. of Veterans Affairs, Veterans G.O. Bonds, Series 2018-CR, 4.00% 2048 | 4,770 | 5,164 | ||||||
| Dept. of Veterans Affairs, Veterans G.O. Bonds, Series 2019-CS, 4.00% 2049 | 2,675 | 2,908 | ||||||
| Dept. of Veterans Affairs, Veterans G.O. Bonds, Series 2020-CT, 3.00% 2050 | 4,980 | 5,345 | ||||||
| Dept. of Veterans Affairs, Veterans G.O. Rev. Ref. Bonds, Series 2016-CN, 3.50% 2045 | 680 | 710 | ||||||
| Victor Valley Union High School Dist., G.O. Rev. Ref. Bonds, Series 2016-B, Assured Guaranty Municipal insured, 4.00% 2024 | 730 | 801 | ||||||
| Victor Valley Union High School Dist., G.O. Rev. Ref. Bonds, Series 2016-B, Assured Guaranty Municipal insured, 4.00% 2026 | 270 | 311 | ||||||
| City of Vista, Successor Agcy. to the Redev. Agcy., Tax Allocation Rev. Ref. Redev. Bonds, Series 2015-B-1, Assured Guaranty Municipal insured, 5.00% 2022 | 340 | 353 | ||||||
| City of Vista, Successor Agcy. to the Redev. Agcy., Tax Allocation Rev. Ref. Redev. Bonds, Series 2015-B-1, Assured Guaranty Municipal insured, 4.00% 2025 | 400 | 451 | ||||||
| West Basin Municipal Water Dist., Rev. Ref. Bonds, Series 2021-A, 5.00% 2030 | 1,065 | 1,408 | ||||||
| West Basin Municipal Water Dist., Rev. Ref. Bonds, Series 2021-A, 5.00% 2031 | 745 | 1,006 | ||||||
| West Contra Costa Unified School Dist., G.O. Bonds, 2010 Election, Series 2020-F, Assured Guaranty Municipal insured, 4.00% 2028 | 600 | 715 | ||||||
| West Contra Costa Unified School Dist., G.O. Bonds, 2012 Election, Series 2020-E, Assured Guaranty Municipal insured, 4.00% 2030 | 900 | 1,098 | ||||||
| West Contra Costa Unified School Dist., G.O. Rev. Ref. Bonds, 2005 Election, Series 2008-B, 6.00% 2027 | 3,000 | 3,846 | ||||||
| West Kern Community College Dist., G.O. Rev. Ref. Bonds, Series 2019, BAM insured, 4.00% 2032 | 2,700 | 3,217 | ||||||
| Westminster School Dist., G.O. Bonds, Capital Appreciation Bonds, 2008 Election, Series 2009-A-1, Assured Guaranty insured, 0% 2023 | 1,000 | 994 | ||||||
| Whittier City School Dist., G.O. Rev. Ref. Bonds, Series 2016, 4.00% 2030 | 825 | 941 | ||||||
| City of Woodland, Community Facs. Dist. No. 2004-1 (Spring Lake), Special Tax Capital Projects Bonds, Series 2021, Assured Guaranty Municipal insured, 4.00% 2029 | 215 | 258 | ||||||
| Private Client Services Funds | 61 |
Capital Group California Core Municipal Fund
| Bonds, notes & other debt instruments (continued) | Principal amount (000) | Value (000) | ||||||
| California (continued) | ||||||||
| City of Woodland, Community Facs. Dist. No. 2004-1 (Spring Lake), Special Tax Capital Projects Bonds, Series 2021, Assured Guaranty Municipal insured, 4.00% 2030 | $ | 235 | $ | 280 | ||||
| City of Woodland, Community Facs. Dist. No. 2004-1 (Spring Lake), Special Tax Capital Projects Bonds, Series 2021, Assured Guaranty Municipal insured, 4.00% 2031 | 260 | 309 | ||||||
| Yosemite Community College Dist., G.O. Bonds, Capital Appreciation Bonds, 2004 Election, Series 2010-D, 0% 2031 | 500 | 428 | ||||||
| 559,873 | ||||||||
| Missouri 0.02% | ||||||||
| Housing Dev. Commission, Single Family Mortgage Rev. Bonds (Special Homeownership Loan Program), Series 2015-A, 3.75% 2038 | 95 | 101 | ||||||
| Texas 0.08% | ||||||||
| County of Tarrant, Cultural Education Facs. Fin. Corp., Rev. Ref. Bonds (Christus Health), Series 2018-A, 5.00% 2024 | 500 | 558 | ||||||
| United States 0.49% | ||||||||
| Freddie Mac, Multi Family Mortgage Bonds, Series 2019-ML-05, Class ACA, 3.35% 2033 | 2,911 | 3,242 | ||||||
| Total bonds, notes & other debt instruments (cost: $553,137,000) | 563,774 | |||||||
| Short-term securities 13.64% | ||||||||
| Municipals 13.64% | ||||||||
| State of California, Fin. Auth., Recovery Zone Fac. Bonds (Chevron U.S.A., Inc. Project), Series 2010-A, 0.02% 20351 | 15,765 | 15,765 | ||||||
| State of California, Fin. Auth., Recovery Zone Fac. Bonds (Chevron U.S.A., Inc. Project), Series 2010-B, 0.02% 20351 | 4,000 | 4,000 | ||||||
| State of California, Irvine Ranch Water Dist. Nos. 105, 140, 240 and 250, Consolidated G.O. Bonds, Series 1993, 0.01% 20331 | 5,700 | 5,700 | ||||||
| State of California, Kern Community College Dist., Facs. Improvement Dist. No. 1, G.O. Bond Anticipation Notes, Capital Appreciation Notes, Series 2020, 0% 2023 | 2,000 | 1,990 | ||||||
| State of California, City of Los Angeles, Dept. of Water and Power, Power System Demand Rev. Bonds, Series 2002-A-2, 0.01% 20351 | 7,500 | 7,500 | ||||||
| State of California, City of Los Angeles, Dept. of Water and Power, Power System Demand Rev. Bonds, Series 2002-A-1, 0.01% 20351 | 2,500 | 2,500 | ||||||
| State of California, City of Los Angeles, Dept. of Water and Power, Rev. Bonds, Series 2021-A-1, 0.02% 20501 | 8,500 | 8,500 | ||||||
| State of California, City of Los Angeles, Dept. of Water and Power, Water System Bonds, Series 2019-A, 0.01% 20491 | 5,200 | 5,200 | ||||||
| State of California, County of Los Angeles, Schools Pooled Fncg. Program, Certs. of Parts., Series 2021-B, 2.00% 12/30/2021 | 6,000 | 6,018 | ||||||
| State of California, Metropolitan Water Dist. of Southern California, Water Rev. Ref. Bonds, Series 2016-B-2, 0.02% 20371 | 3,605 | 3,605 | ||||||
| State of California, Metropolitan Water Dist. of Southern California, Water Rev. Ref. Bonds, Series 2016-B-1, 0.02% 20371 | 750 | 750 | ||||||
| State of California, Municipal Fin. Auth., Pollution Control Rev. Ref. Bonds (Chevron U.S.A., Inc. Project), Series 2005, 0.02% 20251 | 3,000 | 3,000 | ||||||
| State of California, County of Riverside, Tax and Rev. Anticipation Notes, Series 2021, 2.00% 6/30/2022 | 5,000 | 5,063 | ||||||
| State of California, Statewide Communities Dev. Auth., Pollution Control Rev. Ref. Bonds (Chevron U.S.A., Inc. Project), Series 2002, 0.02% 20241 | 2,435 | 2,435 | ||||||
| State of California, City of Stockton, Public Fncg. Auth., Wastewater Bond Anticipation Notes, Series 2019, 1.40% 6/1/2022 | 4,525 | 4,527 | ||||||
| State of California, Regents of the University of California, General Rev. Bonds, Series 2013-AL-4, 0.01% 20481 | 11,295 | 11,295 | ||||||
| State of California, Regents of the University of California, Medical Center Pooled Rev. Bonds, Series 2007-B-1, 0.02% 20321 | 2,755 | 2,755 | ||||||
| Total short-term securities (cost: $90,579,000) | 90,603 | |||||||
| Total investment securities 98.53% (cost: $643,716,000) | 654,377 | |||||||
| Other assets less liabilities 1.47% | 9,753 | |||||||
| Net assets 100.00% | $ | 664,130 | ||||||
| 62 | Private Client Services Funds |
Capital Group California Core Municipal Fund
| Futures contracts | ||||||||||||||||||
| Contracts | Type | Number of contracts | Expiration | Notional amount (000) | 3 | Value at 10/31/2021 (000) | 4 | Unrealized appreciation at 10/31/2021 (000) | ||||||||||
| 10 Year U.S. Treasury Note Futures | Short | 63 | December 2021 | $ | (6,300 | ) | $ | (8,234 | ) | $ | 94 | |||||||
| 1 | Coupon rate may change periodically. Reference rate and spread are as of the most recent information available. Some coupon rates are determined by the issuer or agent based on current market conditions; therefore, the reference rate and spread are not available. For short-term securities, the date of the next scheduled coupon rate change is considered to be the maturity date. |
| 2 | Acquired in a transaction exempt from registration under Rule 144A of the Securities Act of 1933. May be resold in the U.S. in transactions exempt from registration, normally to qualified institutional buyers. The total value of all such securities was $7,326,000, which represented 1.10% of the net assets of the fund. |
| 3 | Notional amount is calculated based on the number of contracts and notional contract size. |
| 4 | Value is calculated based on the notional amount and current market price. |
Key to abbreviations and symbol
Agcy. = Agency
AMT = Alternative Minimum Tax
Auth. = Authority
Certs. = Certificates
Dept. = Department
Dev. = Development
Dist. = District
Econ. = Economic
Fac. = Facility
Facs. = Facilities
Fin. = Finance
Fncg. = Financing
G.O. = General Obligation
IAM = Interest at Maturity
LIBOR = London Interbank Offered Rate
LOC = Letter of Credit
Part. = Participation
Preref. = Prerefunded
Redev. = Redevelopment
Ref. = Refunding
Rev. = Revenue
SIFMA = Securities Industry and Financial Markets Association
USD/$ = U.S. dollars
| Private Client Services Funds | 63 |
Capital Group California Short-Term Municipal Fund
Investment portfolio October 31, 2021
| Portfolio quality summary* | Percent of net assets |
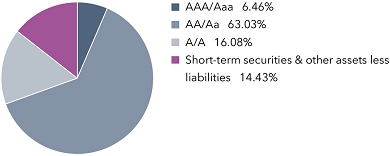
| * | Bond ratings, which typically range from AAA/Aaa (highest) to D (lowest), are assigned by credit rating agencies such as Standard & Poor’s, Moody’s and/or Fitch as an indication of an issuer’s creditworthiness. In assigning a credit rating to a security, the fund looks specifically to the ratings assigned to the issuer of the security by Standard & Poor’s, Moody’s and/or Fitch. If agency ratings differ, the security will be considered to have received the highest of those ratings, consistent with the fund’s investment policies. The ratings are not covered by the Report of Independent Registered Public Accounting Firm. |
| Bonds, notes & other debt instruments 85.57% | Principal amount (000) | Value (000) | ||||||
| California 85.57% | ||||||||
| City of Alhambra, Rev. Ref. Bonds (Atherton Baptist Homes Project), Series 2016, 5.00% 2023 | $ | 450 | $ | 474 | ||||
| Alvord Unified School Dist., G.O. Rev. Ref. Bonds, Series 2018, Assured Guaranty Municipal insured, 5.00% 2022 | 500 | 518 | ||||||
| City of Anaheim, Housing and Public Improvements Auth., Rev. Bonds (Electric Utility Distribution System Improvements), Series 2020-A, 5.00% 2022 | 230 | 240 | ||||||
| City of Anaheim, Housing and Public Improvements Auth., Rev. Bonds (Electric Utility Distribution System Improvements), Series 2020-A, 5.00% 2023 | 200 | 218 | ||||||
| Assn. of Bay Area Governments, Fin. Auth. for Nonprofit Corps., Rev. Ref. Bonds (Sharp HealthCare), Series 2012-A, 5.00% 2023 (preref. 2022) | 1,640 | 1,660 | ||||||
| Bay Area Toll Auth., San Francisco Bay Area Toll Bridge Rev. Bonds, Series 2013-S-4, 5.00% 2043 (preref. 2023) | 1,525 | 1,629 | ||||||
| Bay Area Toll Auth., San Francisco Bay Area Toll Bridge Rev. Bonds, Series 2021-A, 2.00% 2056 (put 2028) | 1,000 | 1,055 | ||||||
| Bay Area Toll Auth., San Francisco Bay Area Toll Bridge Rev. Ref. Bonds, Series 2017-S-7, 5.00% 2024 | 1,000 | 1,112 | ||||||
| Bay Area Toll Auth., San Francisco Bay Area Toll Bridge Rev. Ref. Bonds, Series 2012-F-1, 5.00% 2031 (preref. 2022) | 1,365 | 1,392 | ||||||
| City of Beaumont, Wastewater Rev. Bonds, Series 2018-A, Assured Guaranty Municipal insured, 5.00% 2022 | 225 | 234 | ||||||
| City of Burbank, Successor Agcy. to the Redev. Agcy., Tax Allocation Rev. Ref. Redev. Bonds, Series 2015, BAM insured, 5.00% 2022 | 500 | 526 | ||||||
| Burlingame Elementary School Dist., G.O. Bonds, 2020 Election, Series A, 3.00% 2022 | 600 | 613 | ||||||
| Trustees of the California State University, Systemwide Rev. Bonds, Series 2018-A, 5.00% 2023 | 1,045 | 1,144 | ||||||
| Trustees of the California State University, Systemwide Rev. Bonds, Series 2013-A, 5.00% 2023 | 400 | 438 | ||||||
| Trustees of the California State University, Systemwide Rev. Bonds, Series 2020-A, 5.00% 2024 | 800 | 911 | ||||||
| Trustees of the California State University, Systemwide Rev. Bonds, Series 2016-B-3, 4.00% 2051 (put 2023) | 1,650 | 1,740 | ||||||
| Chino Basin Regional Fin. Auth., Rev. Notes (Inland Empire Utilities Interim Fncg.), Series 2020-B, 4.00% 2025 | 1,500 | 1,695 | ||||||
| Coast Community College Dist., G.O. Bonds, Capital Appreciation Bonds, Series 2006-B, Assured Guaranty insured, 0% 2026 | 1,205 | 1,157 | ||||||
| Compton Unified School Dist., G.O. Bonds, 2015 Election, Series 2019-B, BAM insured, 4.00% 2022 | 1,350 | 1,379 | ||||||
| Compton Unified School Dist., G.O. Bonds, 2015 Election, Series 2019-B, BAM insured, 5.00% 2025 | 125 | 144 | ||||||
| Compton Unified School Dist., G.O. Bonds, 2015 Election, Series 2019-B, BAM insured, 5.00% 2027 | 500 | 609 | ||||||
| Del Mar Union School Dist., Community Facs. Dist. No. 99-1, Special Tax Bonds, Series 2019, 4.00% 2024 | 400 | 435 | ||||||
| Del Mar Union School Dist., Community Facs. Dist. No. 99-1, Special Tax Bonds, Series 2019, 4.00% 2025 | 410 | 456 | ||||||
| East Side Union High School Dist., G.O. Rev. Ref. Bonds, Series 2020, BAM insured, 5.00% 2025 | 845 | 990 | ||||||
| Eastern Municipal Water Dist., Community Facs. Dist. No. 2017-79 (Eagle Crest), Special Tax Bonds, Series 2021, 4.00% 2023 | 255 | 271 | ||||||
| Eastern Municipal Water Dist., Community Facs. Dist. No. 2017-79 (Eagle Crest), Special Tax Bonds, Series 2021, 4.00% 2025 | 275 | 304 | ||||||
| Eastern Municipal Water Dist., Community Facs. Dist. No. 2017-79 (Eagle Crest), Special Tax Bonds, Series 2021, 4.00% 2026 | 285 | 319 | ||||||
| Eastern Municipal Water Dist., Fin. Auth., Water and Wastewater Rev. Ref. Bonds, Series 2020-A, 5.00% 2024 | 225 | 253 | ||||||
| Eastern Municipal Water Dist., Fin. Auth., Water and Wastewater Rev. Ref. Bonds, Series 2020-A, 5.00% 2026 | 300 | 361 | ||||||
| Educational Facs. Auth., Rev. Bonds (Chapman University), Series 2021-A, 5.00% 2025 | 425 | 490 | ||||||
| County of El Dorado, Community Facs. Dist. No. 1992-1 (El Dorado Hills Dev.), Special Tax Rev. Ref. Bonds, Series 2012, 5.00% 2022 | 845 | 879 | ||||||
| 64 | Private Client Services Funds |
Capital Group California Short-Term Municipal Fund
| Bonds, notes & other debt instruments (continued) | Principal amount (000) | Value (000) | ||||||
| California (continued) | ||||||||
| Fowler Unified School Dist., G.O. Rev. Ref. Bonds, Series 2014, Assured Guaranty Municipal insured, 4.00% 2024 | $ | 745 | $ | 817 | ||||
| County of Fresno, Central Unified School Dist., G.O. Bonds, 2020 Election, Series 2021-A, 4.00% 2024 | 395 | 435 | ||||||
| Fresno Joint Powers Fin. Auth., Rev. Ref. Bonds (Master Lease Projects), Series 2017-A, Assured Guaranty Municipal insured, 5.00% 2022 | 1,350 | 1,375 | ||||||
| G.O. Bonds, Series 2021, 5.00% 2027 | 1,475 | 1,829 | ||||||
| G.O. Bonds, Series 2013-E, (SIFMA Municipal Swap Index + 0.43%) 0.48% 2029 (put 2023)1 | 500 | 501 | ||||||
| Glendale Community College Dist., G.O. Rev. Ref. Bonds, 2016 Election, Series 2020-B, 4.00% 2023 | 500 | 533 | ||||||
| Glendale Unified School Dist., G.O. Bonds, 2011 Election, Series 2020-E, 4.00% 2024 | 475 | 524 | ||||||
| Golden State Tobacco Securitization Corp., Enhanced Tobacco Settlement Asset-Backed Bonds, Series 2017A-1, 5.00% 2022 | 1,500 | 1,539 | ||||||
| Golden State Tobacco Securitization Corp., Enhanced Tobacco Settlement Asset-Backed Bonds, Series 2018-A, 5.00% 2022 (escrowed to maturity) | 1,000 | 1,028 | ||||||
| Health Facs. Fncg. Auth., Rev. Bonds (Adventist Health System/West), Series 2013-A, 5.00% 2024 | 410 | 436 | ||||||
| Health Facs. Fncg. Auth., Rev. Bonds (El Camino Hospital), Series 2017, 5.00% 2025 | 400 | 466 | ||||||
| Health Facs. Fncg. Auth., Rev. Bonds (Kaiser Permanente), Series 2017-B, 5.00% 2029 (put 2022) | 1,000 | 1,048 | ||||||
| Health Facs. Fncg. Auth., Rev. Bonds (Providence St. Joseph Health), Series 2016-A, 5.00% 2022 | 300 | 313 | ||||||
| Health Facs. Fncg. Auth., Rev. Bonds (Providence St. Joseph Health), Series 2016-B-3, 2.00% 2036 (put 2025) | 1,000 | 1,057 | ||||||
| Health Facs. Fncg. Auth., Rev. Bonds (Providence St. Joseph Health), Series 2016-B-2, 4.00% 2036 (put 2024) | 110 | 122 | ||||||
| Health Facs. Fncg. Auth., Rev. Bonds (Stanford Health Care), Series 2021-A, 3.00% 2054 (put 2025) | 1,475 | 1,610 | ||||||
| Health Facs. Fncg. Auth., Rev. Bonds (Sutter Health), Series 2016-A, 5.00% 2022 (escrowed to maturity) | 200 | 210 | ||||||
| Health Facs. Fncg. Auth., Rev. Bonds (Sutter Health), Series 2018-A, 5.00% 2023 | 1,275 | 1,396 | ||||||
| Health Facs. Fncg. Auth., Rev. Bonds (Sutter Health), Series 2018-A, 5.00% 2025 | 400 | 470 | ||||||
| Health Facs. Fncg. Auth., Rev. Bonds (Sutter Health), Series 2016-A, 5.00% 2026 (preref. 2025) | 275 | 325 | ||||||
| Health Facs. Fncg. Auth., Rev. Bonds (Sutter Health), Series 2016-A, 5.00% 2046 (preref. 2025) | 250 | 296 | ||||||
| Health Facs. Fncg. Auth., Rev. Green Bonds (Kaiser Permanente), Series 2017-C, 5.00% 2031 (put 2022) | 1,150 | 1,205 | ||||||
| Health Facs. Fncg. Auth., Rev. Ref. Bonds (Adventist Health System/West), Series 2016-A, 4.00% 2022 | 300 | 304 | ||||||
| Health Facs. Fncg. Auth., Rev. Ref. Bonds (Lucile Salter Packard Children’s Hospital at Stanford), Series 2022-A, 5.00% 2024 | 680 | 737 | ||||||
| Health Facs. Fncg. Auth., Rev. Ref. Bonds (St. Joseph Health System), Series 2009-D, 1.70% 2033 (put 2022) | 750 | 761 | ||||||
| Health Facs. Fncg. Auth., Rev. Ref. Bonds (St. Joseph Health System), Series 2009-C, 5.00% 2034 (put 2022) | 1,200 | 1,255 | ||||||
| Health Facs. Fncg. Auth., Rev. Ref. Bonds (Stanford Hospital and Clinics), Series 2008-A-3, 5.50% 2040 (preref. 2021) | 1,500 | 1,503 | ||||||
| Health Facs. Fncg. Auth., Rev. Ref. Bonds (Sutter Health), Series 2016-B, 5.00% 2026 | 700 | 847 | ||||||
| Hemet Unified School Dist., G.O. Rev. Ref. Bonds, Series 2014, Assured Guaranty Municipal insured, 4.00% 2024 | 500 | 549 | ||||||
| Infrastructure and Econ. Dev. Bank, Rev. Bonds (Stanford Consortium Project), Series 2016-A, 5.00% 2022 | 265 | 272 | ||||||
| Infrastructure and Econ. Dev. Bank, Rev. Ref. Bonds (Segerstrom Center for the Arts), Series 2016-B, 5.00% 2023 | 1,000 | 1,075 | ||||||
| Infrastructure and Econ. Dev. Bank, Rev. Ref. Bonds (The Broad), Series 2021-A, 5.00% 2026 | 585 | 702 | ||||||
| City of Irvine, Reassessment Dist. No. 12-1, Limited Obligation Improvement Bonds, Series 2015, 5.00% 2024 | 965 | 1,093 | ||||||
| County of Kern, Water Agcy., Improvement Dist. No. 4, Water Rev. Ref. Bonds, Series 2016-A, Assured Guaranty Municipal insured, 5.00% 2023 | 800 | 857 | ||||||
| Kern Community College Dist., Facs. Improvement Dist. No. 1, G.O. Bonds, 2016 Election, Series 2020-C, 4.00% 2026 | 645 | 745 | ||||||
| Kings Canyon Joint Unified School Dist., G.O. Rev. Ref. Bonds, Series 2016, Assured Guaranty Municipal insured, 5.00% 2022 | 470 | 487 | ||||||
| La Canada Unified School Dist., G.O. Bonds, 2017 Election, Series 2020-B, 4.00% 2022 | 270 | 278 | ||||||
| La Canada Unified School Dist., G.O. Bonds, 2017 Election, Series 2020-B, 4.00% 2023 | 260 | 277 | ||||||
| La Canada Unified School Dist., G.O. Bonds, 2017 Election, Series 2020-B, 4.00% 2024 | 425 | 468 | ||||||
| Lake Elsinore Facs. Fin. Auth., Local Agcy. Rev. Ref. Bonds, Series 2021-B, Assured Guaranty Municipal insured, 4.00% 2026 | 195 | 224 | ||||||
| Lake Elsinore Facs. Fin. Auth., Local Agcy. Rev. Ref. Bonds, Series 2021-B, Assured Guaranty Municipal insured, 4.00% 2027 | 210 | 245 | ||||||
| Los Altos Union High School Dist., G.O. Bonds, Capital Appreciation Bonds, Series 1997-C, National insured, 0% 2022 | 460 | 460 | ||||||
| City of Los Angeles, Dept. of Water and Power, Power System Rev. Bonds, Series 2021-B, 3.00% 2022 | 1,000 | 1,019 | ||||||
| City of Los Angeles, Dept. of Water and Power, Power System Rev. Bonds, Series 2013-A, 5.00% 2022 | 590 | 609 | ||||||
| City of Los Angeles, Dept. of Water and Power, Power System Rev. Bonds, Series 2014-D, 4.00% 2023 | 500 | 531 | ||||||
| City of Los Angeles, Dept. of Water and Power, Power System Rev. Bonds, Series 2019-B, 5.00% 2023 | 1,000 | 1,079 | ||||||
| City of Los Angeles, Dept. of Water and Power, Power System Rev. Bonds, Series 2014-B, 5.00% 2023 | 825 | 891 | ||||||
| City of Los Angeles, Dept. of Water and Power, Power System Rev. Bonds, Series 2016-B, 5.00% 2024 | 800 | 900 | ||||||
| City of Los Angeles, Dept. of Water and Power, Water System Rev. Bonds, Series 2020-A, 5.00% 2025 | 500 | 583 | ||||||
| City of Los Angeles, Dept. of Water and Power, Water System Rev. Bonds, Series 2020-A, 5.00% 2026 | 300 | 361 | ||||||
| City of Los Angeles, Solid Waste Resources Rev. Bonds, Series 2013-A, 2.00% 2023 | 500 | 511 | ||||||
| Private Client Services Funds | 65 |
Capital Group California Short-Term Municipal Fund
| Bonds, notes & other debt instruments (continued) | Principal amount (000) | Value (000) | ||||||
| California (continued) | ||||||||
| County of Los Angeles, Metropolitan Transportation Auth., Measure R Sales Tax Rev. Ref. Green Bonds, Series 2020-A, 5.00% 2024 | $ | 1,000 | $ | 1,122 | ||||
| County of Los Angeles, Metropolitan Transportation Auth., Measure R Sales Tax Rev. Ref. Green Bonds, Series 2020-A, 5.00% 2025 | 1,500 | 1,745 | ||||||
| County of Los Angeles, Metropolitan Transportation Auth., Measure R Sales Tax Rev. Ref. Green Bonds, Series 2020-A, 5.00% 2026 | 400 | 481 | ||||||
| Los Angeles Unified School Dist., G.O. Dedicated Unlimited Ad Valorem Property Tax Bonds, Series 2020-RYQ, 5.00% 2025 | 750 | 873 | ||||||
| Los Angeles Unified School Dist., G.O. Dedicated Unlimited Ad Valorem Property Tax Rev. Ref. Bonds, Series 2017-A, 5.00% 2025 | 1,000 | 1,164 | ||||||
| Los Angeles Unified School Dist., G.O. Rev. Ref. Bonds, Series 2014-A, 5.00% 2022 | 250 | 258 | ||||||
| Los Angeles Unified School Dist., G.O. Rev. Ref. Bonds, Series 2015-A, 5.00% 2023 | 685 | 739 | ||||||
| Mammoth Unified School Dist., G.O. Bonds, Capital Appreciation Bonds, 1998 Election, Series 2000, AMBAC insured, 0% 2023 | 1,000 | 991 | ||||||
| Menifee Union School Dist., Public Fncg. Auth., Special Tax Rev. Bonds, Series 2016-A, BAM insured, 4.00% 2022 | 250 | 256 | ||||||
| Menifee Union School Dist., Public Fncg. Auth., Special Tax Rev. Bonds, Series 2016-A, 5.00% 2026 | 755 | 852 | ||||||
| Merced City School Dist., G.O. Bonds, Capital Appreciation Bonds, 2003 Election, Series 2005, MBIA insured, 0% 2023 | 1,065 | 1,056 | ||||||
| Modesto Irrigation Dist., Electric System Rev. Ref. Bonds, Series 2016, 5.00% 2023 | 160 | 174 | ||||||
| Modesto Irrigation Dist., Electric System Rev. Ref. Bonds, Series 2021, 5.00% 2026 | 635 | 763 | ||||||
| Mountain View Whisman School Dist., G.O. Bonds, 2012 Election, Series 2016-B, 5.00% 2025 | 610 | 716 | ||||||
| Municipal Fin. Auth., Solid Waste Rev. Ref. Bonds (Republic Services, Inc. Project), Capital Appreciation Bonds, Series 2010, Assured Guaranty Municipal insured, 0% 2023 | 260 | 258 | ||||||
| Municipal Fin. Auth., Student Housing Rev. Bonds (CHF-Davis II, LLC - Orchard Park Student Housing Project), Series 2021, BAM insured, 5.00% 2025 | 400 | 459 | ||||||
| Napa Valley Unified School Dist., G.O. Rev. Ref. Bonds, Series 2013, 5.00% 2024 (preref. 2023) | 250 | 271 | ||||||
| New Haven Unified School Dist., G.O. Rev. Ref. Bonds, Capital Appreciation Bonds, Series 2012, Assured Guaranty Municipal insured, 0% 2023 | 965 | 956 | ||||||
| Newport Mesa Unified School Dist., G.O. Bonds, Capital Appreciation Bonds, 2005 Election, Series 2007, National insured, 0% 2022 | 1,000 | 999 | ||||||
| Northern California Energy Auth., Commodity Supply Rev. Bonds, Series 2018, 4.00% 2049 (put 2024) | 1,000 | 1,084 | ||||||
| Oakland Unified School Dist., G.O. Rev. Ref. Bonds, Series 2017-A, 5.00% 2022 | 1,000 | 1,035 | ||||||
| County of Orange, Sanitation Dist., Wastewater Rev. Ref. Obligations, Series 2021-A, 5.00% 2026 | 1,750 | 2,082 | ||||||
| County of Orange, Transportation Auth., Bond Anticipation Notes (I-405 Improvement Project), Series 2021, 5.00% 2024 | 1,185 | 1,345 | ||||||
| County of Orange, Water Dist. Rev. Ref. Bonds, Series 2019-C, 5.00% 2024 | 500 | 565 | ||||||
| Pasadena Unified School Dist., G.O. Rev. Ref. Bonds, Series 2016-B, 5.00% 2024 | 655 | 739 | ||||||
| Peralta Community College Dist., G.O. Bonds, 2006 Election, Series 2020-E-1, 5.00% 2025 | 1,000 | 1,166 | ||||||
| City of Perris, Joint Powers Auth., Local Agcy. Rev. Ref. Bonds (CFD No. 2001-1 IA No. 4 and No. 5; CFD No. 2005-1 IA No. 4), Series 2017-B, 5.00% 2024 | 990 | 1,105 | ||||||
| Perris Union High School Dist., G.O. Bonds, 2012 Election, Series 2021-C, 4.00% 2024 | 240 | 265 | ||||||
| Perris Union High School Dist., G.O. Bonds, 2012 Election, Series 2021-C, 4.00% 2025 | 400 | 453 | ||||||
| Pittsburg Unified School Dist., G.O. Bonds, Capital Appreciation Bonds, 2010 Election, Series 2012-C, 0% 2047 (preref. 2022) | 200 | 47 | ||||||
| Public Fin. Auth., Rev. Ref. Bonds (O’Conner Woods), Series 2022, 4.00% 2026 | 440 | 479 | ||||||
| Public Works Board, Lease Rev. Bonds (Various Capital Projects), Series 2014-E, 5.00% 2022 | 500 | 520 | ||||||
| Public Works Board, Lease Rev. Bonds (Various Capital Projects), Series 2011-A, 5.00% 2027 | 1,025 | 1,026 | ||||||
| Public Works Board, Lease Rev. Ref. Bonds (Dept. of State Hospitals), Series 2016-E, 5.00% 2025 | 1,000 | 1,072 | ||||||
| Public Works Board, Lease Rev. Ref. Bonds (Various Capital Projects), Series 2020-E, 5.00% 2024 | 1,000 | 1,137 | ||||||
| Public Works Board, Lease Rev. Ref. Bonds (Various Capital Projects), Series 2016-C, 5.00% 2024 | 505 | 574 | ||||||
| Public Works Board, Lease Rev. Ref. Bonds (Various Capital Projects), Series 2017-B, 5.00% 2024 | 330 | 374 | ||||||
| Public Works Board, Lease Rev. Ref. Bonds (Various Capital Projects), Series 2022-A, 5.00% 2025 | 1,330 | 1,517 | ||||||
| Public Works Board, Lease Rev. Ref. Bonds (Various Capital Projects), Series 2016-C, 5.00% 2027 | 250 | 302 | ||||||
| Public Works Board, Lease Rev. Ref. Bonds (Various State Office Buildings), Series 2015-F, 5.00% 2024 | 150 | 167 | ||||||
| Ravenswood City School Dist., G.O. Bonds, 2016 Election, Series 2016, 5.00% 2023 | 445 | 482 | ||||||
| City of Redding, Electric System Rev. Ref. Bonds, Series 2018, 5.00% 2022 | 725 | 745 | ||||||
| City of Richmond, Wastewater Rev. Ref. Bonds, Series 2019-B, 5.00% 2023 | 940 | 1,019 | ||||||
| County of Riverside, Infrastructure Fncg. Auth., Lease Rev. Ref. Bonds, Series 2015-A, 5.00% 2021 | 850 | 850 | ||||||
| County of Riverside, Infrastructure Fncg. Auth., Lease Rev. Ref. Bonds, Series 2015-A, 5.00% 2021 (escrowed to maturity) | 150 | 150 | ||||||
| Riverside Unified School Dist., G.O. Bonds, 2016 Election, Series 2019, 4.00% 2024 | 125 | 138 | ||||||
| Robla School Dist., G.O. Bonds, 2018 Election, Series 2019-A, Assured Guaranty Municipal insured, 4.00% 2022 | 740 | 761 | ||||||
| City of Roseville, Fin. Auth., Special Tax Rev. Ref. Bonds, Series 2016, 4.00% 2022 | 620 | 639 | ||||||
| 66 | Private Client Services Funds |
Capital Group California Short-Term Municipal Fund
| Bonds, notes & other debt instruments (continued) | Principal amount (000) | Value (000) | ||||||
| California (continued) | ||||||||
| City of Sacramento, Municipal Utility Dist., Electric Rev. Bonds, Series 1997-K, AMBAC insured, 5.25% 2024 | $ | 115 | $ | 125 | ||||
| Sacramento Unified School Dist., G.O. Bonds, 2012 Election, Series 2019-D, BAM insured, 4.00% 2023 | 450 | 478 | ||||||
| Sacramento Unified School Dist., G.O. Bonds, 2012 Election, Series 2019-D, BAM insured, 4.00% 2024 | 520 | 569 | ||||||
| City of San Diego, Community Facs. Dist. No. 2 (Santaluz), Improvement Area No. 1, Special Tax Rev. Ref. Bonds, Series 2021, 4.00% 2026 | 490 | 564 | ||||||
| City of San Diego, Public Facs. Fncg. Auth., Lease Rev. Bonds (Capital Improvement Projects), Series 2021-A, 5.00% 2027 | 255 | 316 | ||||||
| City of San Diego, Public Fin. Auth., Water Rev. Bonds, Series 2020-A, 5.00% 2022 | 335 | 347 | ||||||
| County of San Diego, Regional Airport Auth., Airport Rev. and Rev. Ref. Bonds, Series 2019-A, 5.00% 2023 | 500 | 539 | ||||||
| County of San Diego, Regional Airport Auth., Airport Rev. and Rev. Ref. Bonds, Series 2019-A, 5.00% 2024 | 500 | 561 | ||||||
| County of San Diego, Regional Airport Auth., Airport Rev. Ref. Bonds, Series 2020-B, 5.00% 2022 | 1,000 | 1,032 | ||||||
| County of San Diego, Regional Transportation Commission, Limited Sales Tax Rev. Bonds, Series 2021-B, 5.00% 2026 | 140 | 167 | ||||||
| County of San Diego, Water Auth., Water Rev. Ref. Green Bonds, Series 2021-A, 5.00% 2025 | 1,000 | 1,160 | ||||||
| City and County of San Francisco, Airport Commission, San Francisco International Airport, Rev. Bonds, Series 2019-D-2, 5.00% 2024 | 2,000 | 2,229 | ||||||
| City and County of San Francisco, Airport Commission, San Francisco International Airport, Rev. Ref. Bonds, Series 2009-D-2, 4.00% 2023 (escrowed to maturity) | 400 | 422 | ||||||
| City and County of San Francisco, Airport Commission, San Francisco International Airport, Rev. Ref. Bonds, Series 2016-A-2, 5.00% 2024 | 400 | 446 | ||||||
| City and County of San Francisco, Airport Commission, San Francisco International Airport, Rev. Ref. Bonds, Series 2019-D-2, 5.00% 2026 | 500 | 596 | ||||||
| City and County of San Francisco, G.O. Bonds (Earthquake Safety and Emergency Response), Series 2021-E-1, 5.00% 2025 | 815 | 949 | ||||||
| City and County of San Francisco, Public Utilities Commission, San Francisco Water Rev. Bonds, Series 2011-A, 5.00% 2029 (preref. 2021) | 1,000 | 1,000 | ||||||
| City and County of San Francisco, Public Utilities Commission, Wastewater Rev. Green Bonds, Series 2018-C, 2.125% 2048 (put 2023) | 1,000 | 1,026 | ||||||
| City and County of San Francisco, Successor Agcy. to the Redev. Agcy., Special Tax Rev. Ref. Bonds (San Francisco Redev. Projects), Series 2014-C, 5.00% 2022 | 250 | 259 | ||||||
| San Francisco Community College Dist., G.O. Rev. Ref. Bonds, Series 2015, 5.00% 2024 | 865 | 968 | ||||||
| San Gabriel Unified School Dist., G.O. Bonds, Capital Appreciation Bonds, 2008 Election, Series 2012-B, 0% 2023 | 200 | 198 | ||||||
| City of San Jose, Airport Rev. Ref. Bonds, Series 2021-A, BAM insured, 5.00% 2026 | 440 | 522 | ||||||
| City of San Jose, Fin. Auth., Lease Rev. Ref. Bonds (Civic Center Project), Series 2013-A, 5.00% 2030 (preref. 2023) | 2,000 | 2,150 | ||||||
| San Jose Unified School Dist., G.O. Rev. Ref. Bonds, Series 2017, 5.00% 2022 | 155 | 161 | ||||||
| Santa Monica-Malibu Unified School Dist., Certs. of Part., Capital Appreciation Notes, Series 2001-C, National insured, 0% 2022 | 100 | 100 | ||||||
| Santa Monica-Malibu Unified School Dist., School Facs. Improvement Dist. No. 2 (Santa Monica Schools), G.O. Bonds, 2018 Election, Series 2021-B, 4.00% 2024 | 485 | 535 | ||||||
| Santa Monica-Malibu Unified School Dist., School Facs. Improvement Dist. No. 2 (Santa Monica Schools), G.O. Bonds, 2018 Election, Series 2021-B, 4.00% 2025 | 335 | 380 | ||||||
| Santa Rosa High School Dist., G.O. Bonds, 2014 Election, Series 2021-E, BAM insured, 4.00% 2025 | 1,050 | 1,187 | ||||||
| Semitropic Water Storage Dist., Water Banking Rev. Ref. Bonds, Series 2012-A, 5.00% 2035 (preref. 2022) | 1,325 | 1,393 | ||||||
| Silicon Valley Clean Water, Wastewater Rev. Notes, Series 2019-A, 3.00% 2024 | 2,500 | 2,620 | ||||||
| Silicon Valley Clean Water, Wastewater Rev. Notes, Series 2021-B, 0.50% 2026 | 2,025 | 2,008 | ||||||
| Southern California Public Power Auth., Rev. Ref. Bonds (Magnolia Power Project A), Series 2020-1, 5.00% 2025 | 1,000 | 1,166 | ||||||
| Southern California Public Power Auth., Rev. Ref. Bonds (Milford Wind Corridor Phase I Project), Series 2019-1, 5.00% 2022 | 200 | 206 | ||||||
| Southern California Public Power Auth., Rev. Ref. Green Bonds (Linden Wind Energy Project), Series 2020-A, 5.00% 2024 | 550 | 606 | ||||||
| Southern California Public Power Auth., Rev. Ref. Green Bonds (Milford Wind Corridor Phase II Project), Series 2021-1, 5.00% 2024 | 520 | 585 | ||||||
| Southwestern Community College Dist., G.O. Rev. Ref. Bonds (2019 Crossover), Series 2016-B, 4.00% 2022 | 310 | 319 | ||||||
| Statewide Communities Dev. Auth., Health Fac. Rev. Ref. Bonds (Los Angeles Jewish Home for the Aging), Series 2019-A, 4.00% 2022 | 265 | 274 | ||||||
| Statewide Communities Dev. Auth., Health Fac. Rev. Ref. Bonds (Los Angeles Jewish Home for the Aging), Series 2019-A, 4.00% 2021 | 150 | 150 | ||||||
| Statewide Communities Dev. Auth., Health Fac. Rev. Ref. Bonds (Los Angeles Jewish Home for the Aging), Series 2019-A, 4.00% 2023 | 250 | 268 | ||||||
| Statewide Communities Dev. Auth., Health Fac. Rev. Ref. Bonds (Los Angeles Jewish Home for the Aging), Series 2019-B, 4.00% 2023 | 660 | 708 | ||||||
| Statewide Communities Dev. Auth., Multi Family Housing Rev. Bonds (Harriet Tubman Terrace Apartments), Series 2021-Q, 0.24% 2024 (put 2023) | 2,000 | 1,997 | ||||||
| Private Client Services Funds | 67 |
Capital Group California Short-Term Municipal Fund
| Bonds, notes & other debt instruments (continued) | Principal amount (000) | Value (000) | ||||||
| California (continued) | ||||||||
| Statewide Communities Dev. Auth., Multi Family Housing Rev. Bonds (Washington Court Apartments), Series 2021-E, 0.22% 2023 (put 2022) | $ | 1,000 | $ | 1,000 | ||||
| Statewide Communities Dev. Auth., Rev. Bonds (Adventist Health System/West), Series 2018, 5.00% 2022 | 150 | 152 | ||||||
| Statewide Communities Dev. Auth., Rev. Bonds (Adventist Health System/West), Series 2018-A, 5.00% 2023 | 135 | 144 | ||||||
| Statewide Communities Dev. Auth., Rev. Bonds (Adventist Health System/West), Series 2018-A, 5.00% 2024 | 200 | 222 | ||||||
| Statewide Communities Dev. Auth., Rev. Bonds (Adventist Health System/West), Series 2018-A, 5.00% 2025 | 415 | 477 | ||||||
| Statewide Communities Dev. Auth., Rev. Bonds (Cottage Health System Obligated Group), Series 2015, 5.00% 2043 (preref. 2024) | 1,500 | 1,708 | ||||||
| Statewide Communities Dev. Auth., Rev. Bonds (Huntington Memorial Hospital), Series 2018, 5.00% 2022 | 700 | 722 | ||||||
| Statewide Communities Dev. Auth., Rev. Bonds (Huntington Memorial Hospital), Series 2018, 5.00% 2026 | 325 | 387 | ||||||
| Statewide Communities Dev. Auth., Rev. Bonds (Viamonte Senior Living 1 Project), Series 2018-B, 3.00% 2025 | 155 | 155 | ||||||
| Statewide Communities Dev. Auth., Student Housing Rev. Bonds (University of California, Irvine East Campus Apartments, Phase I Ref. and Phase IV-B CHF-Irvine, LLC), Series 2021, BAM insured, 5.00% 2029 | 1,865 | 2,379 | ||||||
| City of Stockton, Public Fncg. Auth., Water Rev. Ref. Green Bonds, Series 2018-A, BAM insured, 5.00% 2022 | 1,210 | 1,260 | ||||||
| Torrance Unified School Dist., G.O. Bonds, Capital Appreciation Bonds, 2008 Election, Series 2009-B-1, 0% 2023 | 250 | 248 | ||||||
| City of Tracy, Successor Agcy. to the Community Dev. Agcy., Tax Allocation Rev. Ref. Bonds, Series 2016, Assured Guaranty Municipal insured, 5.00% 2022 | 450 | 465 | ||||||
| Transbay Joint Powers Auth., Senior Tax Allocation Green Bonds, Series 2020-A, 5.00% 2025 | 500 | 583 | ||||||
| Transbay Joint Powers Auth., Senior Tax Allocation Green Bonds, Series 2020-A, 5.00% 2026 | 550 | 659 | ||||||
| Twin Rivers Unified School Dist., G.O. Rev. Ref. Bonds, Series 2016-B, Assured Guaranty Municipal insured, 5.00% 2027 | 225 | 269 | ||||||
| Ukiah Unified School Dist., G.O. Bonds, Capital Appreciation Bonds, 2005 Election, Series 2006, MBIA insured, 0% 2023 | 440 | 436 | ||||||
| Regents of the University of California, G.O. Rev. Bonds, Series 2013-AK, 5.00% 2048 (put 2023) | 1,000 | 1,073 | ||||||
| Regents of the University of California, Limited Project Rev. Bonds, Series 2012-G, 5.00% 2022 | 150 | 154 | ||||||
| Regents of the University of California, Limited Project Rev. Bonds, Series 2022-S, 5.00% 2026 | 2,500 | 2,930 | ||||||
| Val Verde Unified School Dist., G.O. Bonds, 2020 Election, Series 2020-A, BAM insured, 4.00% 2023 | 450 | 478 | ||||||
| Dept. of Veterans Affairs, Home Purchase Rev. Bonds, Series 2016-B, 3.50% 2045 | 465 | 490 | ||||||
| Dept. of Veterans Affairs, Home Purchase Rev. Bonds, Series 2019-A, 4.00% 2049 | 1,310 | 1,427 | ||||||
| Dept. of Veterans Affairs, Home Purchase Rev. Bonds, Series 2020-A, 3.00% 2050 | 995 | 1,068 | ||||||
| Dept. of Veterans Affairs, Veterans G.O. Bonds, Series 2017-CQ, 4.00% 2047 | 655 | 703 | ||||||
| Dept. of Veterans Affairs, Veterans G.O. Bonds, Series 2018-CR, 4.00% 2048 | 1,195 | 1,294 | ||||||
| Dept. of Veterans Affairs, Veterans G.O. Bonds, Series 2020-CT, 3.00% 2050 | 1,990 | 2,136 | ||||||
| Dept. of Veterans Affairs, Veterans G.O. Rev. Ref. Bonds, Series 2016-CN, 3.50% 2045 | 680 | 710 | ||||||
| Dept. of Water Resources, Water System Rev. Bonds (Central Valley Project), Series 2021-BD, 5.00% 2025 | 1,000 | 1,183 | ||||||
| West Contra Costa Unified School Dist., G.O. Bonds, 2012 Election, Series 2020-E, Assured Guaranty Municipal insured, 4.00% 2024 | 300 | 329 | ||||||
| West Contra Costa Unified School Dist., G.O. Bonds, 2012 Election, Series 2020-E, Assured Guaranty Municipal insured, 4.00% 2026 | 640 | 737 | ||||||
| West Contra Costa Unified School Dist., G.O. Rev. Ref. Bonds, Series 2017-A-1, 5.00% 2024 | 250 | 281 | ||||||
| Western Riverside Water and Wastewater Fncg. Auth., Local Agcy. Rev. Ref. Bonds, Series 2016-A, 5.00% 2022 | 100 | 104 | ||||||
| City of Westminster, Successor Agcy. to the Redev. Agcy., Commercial Redev. Project No. 1, Tax Allocation Rev. Ref. Bonds, Series 2016-B, BAM insured, 4.00% 2022 | 120 | 124 | ||||||
| Whittier Union High School Dist., G.O. Rev. Ref. Bonds, Series 2015, 5.00% 2022 | 300 | 311 | ||||||
| City of Woodland, Community Facs. Dist. No. 2004-1 (Spring Lake), Special Tax Capital Projects Bonds, Series 2021, 4.00% 2026 | 160 | 184 | ||||||
| City of Woodland, Community Facs. Dist. No. 2004-1 (Spring Lake), Special Tax Capital Projects Bonds, Series 2021, Assured Guaranty Municipal insured, 4.00% 2027 | 180 | 210 | ||||||
| City of Woodland, Community Facs. Dist. No. 2004-1 (Spring Lake), Special Tax Capital Projects Bonds, Series 2021, Assured Guaranty Municipal insured, 4.00% 2028 | 200 | 237 | ||||||
| Total bonds, notes & other debt instruments (cost: $154,232,000) | 155,490 | |||||||
| Short-term securities 15.60% | ||||||||
| Municipals 15.60% | ||||||||
| State of California, Fin. Auth., Recovery Zone Fac. Bonds (Chevron U.S.A., Inc. Project), Series 2010-A, 0.02% 20351 | 8,700 | 8,700 | ||||||
| State of California, City of Los Angeles, Dept. of Water and Power, Power System Rev. Ref. Bonds, Series 2001-B-3, 0.01% 20341 | 1,300 | 1,300 | ||||||
| State of California, City of Los Angeles, Dept. of Water and Power, Rev. Bonds, Series 2021-A-1, 0.02% 20501 | 4,000 | 4,000 | ||||||
| 68 | Private Client Services Funds |
Capital Group California Short-Term Municipal Fund
| Short-term securities (continued) | Principal amount (000) | Value (000) | ||||||
| Municipals (continued) | ||||||||
| State of California, Metropolitan Water Dist. of Southern California, Water Rev. Ref. Bonds, Series 2016-B-2, 0.02% 20371 | $ | 3,500 | $ | 3,500 | ||||
| State of California, Pollution Control Fncg. Auth., Environmental Impact Rev. Bonds (Air Products and Chemicals, Inc. Project), Series 1997-B, 0.02% 20421 | 1,350 | 1,350 | ||||||
| State of California, Regents of the University of California, General Rev. Bonds, Series 2013-AL-4, 0.01% 20481 | 3,600 | 3,600 | ||||||
| State of California, Regents of the University of California, General Rev. Bonds, Series 2013-AL-1, 0.02% 20481 | 1,000 | 1,000 | ||||||
| State of California, Regents of the University of California, Medical Center Pooled Rev. Bonds, Series 2007-B-2, 0.01% 20321 | 3,000 | 3,000 | ||||||
| State of California, Regents of the University of California, Medical Center Pooled Rev. Bonds, Series 2007-B-1, 0.02% 20321 | 1,900 | 1,900 | ||||||
| Total short-term securities (cost: $28,351,000) | 28,350 | |||||||
| Total investment securities 101.17% (cost: $182,583,000) | 183,840 | |||||||
| Other assets less liabilities (1.17%) | (2,121 | ) | ||||||
| Net assets 100.00% | $ | 181,719 | ||||||
| 1 | Coupon rate may change periodically. Reference rate and spread are as of the most recent information available. Some coupon rates are determined by the issuer or agent based on current market conditions; therefore, the reference rate and spread are not available. For short-term securities, the date of the next scheduled coupon rate change is considered to be the maturity date. |
Key to abbreviations and symbol
Agcy. = Agency
AMT = Alternative Minimum Tax
Auth. = Authority
Certs. = Certificates
Dept. = Department
Dev. = Development
Dist. = District
Econ. = Economic
Fac. = Facility
Facs. = Facilities
Fin. = Finance
Fncg. = Financing
G.O. = General Obligation
IAM = Interest at Maturity
LIBOR = London Interbank Offered Rate
LOC = Letter of Credit
Part. = Participation
Preref. = Prerefunded
Redev. = Redevelopment
Ref. = Refunding
Rev. = Revenue
SIFMA = Securities Industry and Financial Markets Association
USD/$ = U.S. dollars
| Private Client Services Funds | 69 |
Capital Group Core Bond Fund
Investment portfolio October 31, 2021
| Portfolio by type of security | Percent of net assets |
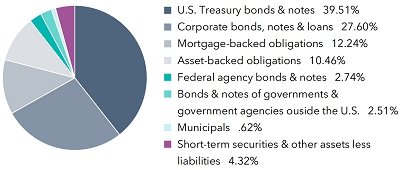
| Portfolio quality summary* | Percent of net assets | |||
| U.S. Treasury and agency† | 42.25 | % | ||
| AAA/Aaa | 20.93 | |||
| AA/Aa | 9.15 | |||
| A/A | 14.63 | |||
| BBB/Baa | 8.72 | |||
| Short-term securities & other assets less liabilities | 4.32 | |||
| * | Bond ratings, which typically range from AAA/Aaa (highest) to D (lowest), are assigned by credit rating agencies such as Standard & Poor’s, Moody’s and/or Fitch as an indication of an issuer’s creditworthiness. In assigning a credit rating to a security, the fund looks specifically to the ratings assigned to the issuer of the security by Standard & Poor’s, Moody’s and/or Fitch. If agency ratings differ, the security will be considered to have received the highest of those ratings, consistent with the fund’s investment policies. The ratings are not covered by the Report of Independent Registered Public Accounting Firm. |
| † | These securities are guaranteed by the full faith and credit of the U.S. government. |
| Bonds, notes & other debt instruments 95.68% | Principal amount (000) | Value (000) | ||||||
| U.S. Treasury bonds & notes 39.51% | ||||||||
| U.S. Treasury 30.40% | ||||||||
| U.S. Treasury 1.875% 2021 | $ | 500 | $ | 501 | ||||
| U.S. Treasury 2.125% 2021 | 1,000 | 1,003 | ||||||
| U.S. Treasury 0.125% 2022 | 27,000 | 27,008 | ||||||
| U.S. Treasury 1.50% 2022 | 1,920 | 1,943 | ||||||
| U.S. Treasury 1.75% 2022 | — | 1 | — | 1 | ||||
| U.S. Treasury 1.875% 2022 | 3,745 | 3,784 | ||||||
| U.S. Treasury 2.125% 2022 | 3,000 | 3,041 | ||||||
| U.S. Treasury 0.125% 2023 | 10,000 | 9,986 | ||||||
| U.S. Treasury 0.125% 2023 | 2,000 | 1,983 | ||||||
| U.S. Treasury 0.25% 2023 | 2,610 | 2,605 | ||||||
| U.S. Treasury 0.25% 2023 | 437 | 435 | ||||||
| U.S. Treasury 1.25% 2023 | 1,000 | 1,015 | ||||||
| U.S. Treasury 1.375% 20232 | 1,275 | 1,296 | ||||||
| U.S. Treasury 1.375% 2023 | 1,000 | 1,017 | ||||||
| U.S. Treasury 1.75% 2023 | 1,000 | 1,022 | ||||||
| U.S. Treasury 2.00% 2023 | 2,000 | 2,045 | ||||||
| U.S. Treasury 2.125% 2023 | 3,415 | 3,528 | ||||||
| U.S. Treasury 2.25% 2023 | 500 | 518 | ||||||
| U.S. Treasury 2.50% 2023 | 1,050 | 1,089 | ||||||
| U.S. Treasury 2.75% 2023 | 4,542 | 4,706 | ||||||
| U.S. Treasury 2.75% 2023 | 2,250 | 2,353 | ||||||
| U.S. Treasury 0.375% 2024 | 22,000 | 21,790 | ||||||
| U.S. Treasury 1.75% 2024 | 4,000 | 4,117 | ||||||
| U.S. Treasury 2.00% 2024 | 3,288 | 3,405 | ||||||
| U.S. Treasury 2.00% 2024 | 2,480 | 2,566 | ||||||
| U.S. Treasury 2.125% 2024 | 5,000 | 5,202 | ||||||
| U.S. Treasury 2.125% 20242 | 3,500 | 3,627 | ||||||
| U.S. Treasury 2.25% 20242 | 3,713 | 3,863 | ||||||
| U.S. Treasury 2.25% 2024 | 1,820 | 1,889 | ||||||
| 70 | Private Client Services Funds |
Capital Group Core Bond Fund
| Bonds, notes & other debt instruments (continued) | Principal amount (000) | Value (000) | ||||||
| U.S. Treasury bonds & notes (continued) | ||||||||
| U.S. Treasury (continued) | ||||||||
| U.S. Treasury 2.75% 2024 | $ | 2,500 | $ | 2,624 | ||||
| U.S. Treasury 0.50% 2025 | 4,452 | 4,398 | ||||||
| U.S. Treasury 1.375% 2025 | 8,128 | 8,276 | ||||||
| U.S. Treasury 2.00% 2025 | 2,000 | 2,077 | ||||||
| U.S. Treasury 2.625% 2025 | 6,600 | 7,028 | ||||||
| U.S. Treasury 7.625% 20252 | 750 | 917 | ||||||
| U.S. Treasury 0.50% 2026 | 3,500 | 3,414 | ||||||
| U.S. Treasury 0.75% 2026 | 1,150 | 1,132 | ||||||
| U.S. Treasury 0.75% 2026 | 32 | 31 | ||||||
| U.S. Treasury 0.875% 2026 | 7,428 | 7,327 | ||||||
| U.S. Treasury 1.625% 2026 | 3,000 | 3,070 | ||||||
| U.S. Treasury 1.75% 20262 | 12,140 | 12,485 | ||||||
| U.S. Treasury 1.125% 2027 | 477 | 475 | ||||||
| U.S. Treasury 2.25% 2027 | 8,420 | 8,860 | ||||||
| U.S. Treasury 2.25% 2027 | 2,200 | 2,316 | ||||||
| U.S. Treasury 2.625% 2029 | 5,660 | 6,121 | ||||||
| U.S. Treasury 1.25% 2031 | 6,971 | 6,777 | ||||||
| 194,665 | ||||||||
| U.S. Treasury inflation-protected securities 9.11% | ||||||||
| U.S. Treasury Inflation-Protected Security 0.125% 20223 | 12,151 | 12,387 | ||||||
| U.S. Treasury Inflation-Protected Security 0.125% 20253 | 10,746 | 11,590 | ||||||
| U.S. Treasury Inflation-Protected Security 0.125% 20263 | 14,301 | 15,582 | ||||||
| U.S. Treasury Inflation-Protected Security 0.875% 20293 | 4,958 | 5,763 | ||||||
| U.S. Treasury Inflation-Protected Security 0.125% 20302,3 | 11,775 | 13,053 | ||||||
| 58,375 | ||||||||
| Total U.S. Treasury bonds & notes | 253,040 | |||||||
| Corporate bonds, notes & loans 27.60% | ||||||||
| Financials 7.13% | ||||||||
| ACE INA Holdings, Inc. 2.875% 2022 | 150 | 153 | ||||||
| ACE INA Holdings, Inc. 3.35% 2026 | 45 | 49 | ||||||
| ACE INA Holdings, Inc. 4.35% 2045 | 50 | 64 | ||||||
| AerCap Ireland Capital, Ltd. / AerCap Global Aviation Trust 2.45% 2026 | 1,637 | 1,653 | ||||||
| AerCap Ireland Capital, Ltd. / AerCap Global Aviation Trust 3.00% 2028 | 1,190 | 1,207 | ||||||
| Allstate Corp. 0.75% 2025 | 637 | 624 | ||||||
| Allstate Corp. 3.28% 2026 | 175 | 189 | ||||||
| American International Group, Inc. 2.50% 2025 | 2,000 | 2,078 | ||||||
| American International Group, Inc. 3.40% 2030 | 1,021 | 1,107 | ||||||
| Bank of America Corp. 1.197% 2026 (USD-SOFR + 1.01% on 10/24/2025)4 | 1,108 | 1,090 | ||||||
| Bank of America Corp. 1.734% 2027 (USD-SOFR + 0.96% on 7/22/2026)4 | 1,740 | 1,729 | ||||||
| Bank of America Corp. 1.922% 2031 (USD-SOFR + 1.37% on 10/24/2030)4 | 1,385 | 1,322 | ||||||
| Bank of America Corp. 2.687% 2032 (USD-SOFR + 1.32% on 4/22/2031)4 | 748 | 758 | ||||||
| BNP Paribas 2.159% 2029 (USD-SOFR + 1.218% on 9/15/2028)4,5 | 475 | 467 | ||||||
| Citigroup, Inc. 4.45% 2027 | 400 | 450 | ||||||
| Citigroup, Inc. 2.572% 2031 (USD-SOFR + 2.107% on 6/3/2030)4 | 1,283 | 1,294 | ||||||
| Citigroup, Inc. 2.666% 2031 (USD-SOFR + 1.146% on 1/29/2030)4 | 502 | 511 | ||||||
| Credit Suisse Group AG 3.80% 2023 | 500 | 524 | ||||||
| GE Capital Funding, LLC 3.45% 2025 | 1,000 | 1,070 | ||||||
| Goldman Sachs Group, Inc. 0.925% 2024 (USD-SOFR + 0.50% on 10/21/2023)4 | 1,545 | 1,544 | ||||||
| Goldman Sachs Group, Inc. 3.272% 2025 (3-month USD-LIBOR + 1.201% on 9/29/2024)4 | 1,385 | 1,462 | ||||||
| Goldman Sachs Group, Inc. 0.855% 2026 (USD-SOFR + 0.609% on 2/12/2025)4 | 400 | 393 | ||||||
| Goldman Sachs Group, Inc. 1.093% 2026 (USD-SOFR + 0.789% on 12/9/2025)4 | 750 | 732 | ||||||
| Goldman Sachs Group, Inc. 1.948% 2027 (USD-SOFR + 0.913% on 10/21/2026)4 | 679 | 680 | ||||||
| Goldman Sachs Group, Inc. 3.814% 2029 (3-month USD-LIBOR + 1.158% on 4/23/2028)4 | 725 | 795 | ||||||
| Goldman Sachs Group, Inc. 1.992% 2032 (USD-SOFR + 1.09% on 1/27/2031)4 | 708 | 679 | ||||||
| Goldman Sachs Group, Inc. 4.017% 2038 (3-month USD-LIBOR + 1.373% on 10/31/2037)4 | 175 | 201 | ||||||
| Private Client Services Funds | 71 |
| Capital Group Core Bond Fund | ||||||||
| Bonds, notes & other debt instruments (continued) | Principal amount (000) | Value (000) | ||||||
| Corporate bonds, notes & loans (continued) | ||||||||
| Financials (continued) | ||||||||
| JPMorgan Chase & Co. 3.559% 2024 (3-month USD-LIBOR + 0.73% on 4/23/2023)4 | $ | 1,125 | $ | 1,171 | ||||
| JPMorgan Chase & Co. 2.301% 2025 (USD-SOFR + 1.16% on 10/15/2024)4 | 1,165 | 1,201 | ||||||
| JPMorgan Chase & Co. 1.045% 2026 (USD-SOFR + 0.80% on 11/19/2025)4 | 1,500 | 1,464 | ||||||
| JPMorgan Chase & Co. 2.58% 2032 (USD-SOFR + 1.25% on 4/22/2031)4 | 232 | 234 | ||||||
| Lloyds Banking Group PLC 4.375% 2028 | 200 | 226 | ||||||
| Marsh & McLennan Companies, Inc. 3.875% 2024 | 495 | 529 | ||||||
| Marsh & McLennan Companies, Inc. 2.25% 2030 | 715 | 715 | ||||||
| Metropolitan Life Global Funding I 0.95% 20255 | 757 | 748 | ||||||
| Morgan Stanley 1.164% 2025 (USD-SOFR + 0.56% on 10/21/2024)4 | 995 | 991 | ||||||
| Morgan Stanley 2.72% 2025 (USD-SOFR + 1.152% on 7/22/2024)4 | 1,640 | 1,703 | ||||||
| Morgan Stanley 0.985% 2026 (USD-SOFR + 0.72% on 12/10/2025)4 | 1,386 | 1,346 | ||||||
| Morgan Stanley 1.593% 2027 (USD-SOFR + 0.879% on 5/4/2026)4 | 954 | 945 | ||||||
| Morgan Stanley 2.699% 2031 (USD-SOFR + 1.143% on 1/22/2030)4 | 461 | 471 | ||||||
| National Securities Clearing Corp. 0.40% 20235 | 3,000 | 2,986 | ||||||
| New York Life Global Funding 2.25% 20225 | 305 | 310 | ||||||
| New York Life Global Funding 0.90% 20245 | 2,000 | 1,998 | ||||||
| Northwestern Mutual Global Funding 0.80% 20265 | 1,778 | 1,732 | ||||||
| Toronto-Dominion Bank 0.45% 2023 | 1,353 | 1,350 | ||||||
| Toronto-Dominion Bank 1.25% 2026 | 1,005 | 987 | ||||||
| Wells Fargo & Company 2.572% 2031 (3-month USD-LIBOR + 1.00% on 2/11/2030)4 | 1,715 | 1,736 | ||||||
| 45,668 | ||||||||
| Consumer discretionary 4.70% | ||||||||
| Amazon.com, Inc. 0.25% 2023 | 1,175 | 1,173 | ||||||
| Amazon.com, Inc. 0.45% 2024 | 1,175 | 1,166 | ||||||
| Amazon.com, Inc. 0.80% 2025 | 1,544 | 1,529 | ||||||
| Amazon.com, Inc. 1.20% 2027 | 1,287 | 1,267 | ||||||
| Amazon.com, Inc. 1.65% 2028 | 1,175 | 1,172 | ||||||
| Amazon.com, Inc. 2.10% 2031 | 1,175 | 1,186 | ||||||
| American Honda Finance Corp. 0.75% 2024 | 2,145 | 2,132 | ||||||
| American Honda Finance Corp. 1.30% 2026 | 1,535 | 1,524 | ||||||
| American Honda Finance Corp. 2.30% 2026 | 80 | 83 | ||||||
| American Honda Finance Corp. 3.50% 2028 | 325 | 359 | ||||||
| Bayerische Motoren Werke AG 0.75% 20245 | 1,250 | 1,244 | ||||||
| Bayerische Motoren Werke AG 0.80% 20245 | 1,225 | 1,221 | ||||||
| Bayerische Motoren Werke AG 1.25% 20265 | 1,000 | 990 | ||||||
| General Motors Company 4.20% 2027 | 1,020 | 1,116 | ||||||
| Home Depot, Inc. 3.25% 2022 | 350 | 353 | ||||||
| Home Depot, Inc. 1.50% 2028 | 1,840 | 1,808 | ||||||
| Hyundai Capital America 0.80% 20235 | 1,200 | 1,200 | ||||||
| Hyundai Capital America 1.80% 20255 | 481 | 482 | ||||||
| Hyundai Capital America 2.375% 20275 | 387 | 389 | ||||||
| Hyundai Capital America 2.10% 20285 | 350 | 342 | ||||||
| McDonald’s Corp. 3.70% 2026 | 135 | 147 | ||||||
| McDonald’s Corp. 3.50% 2027 | 185 | 202 | ||||||
| NIKE, Inc. 2.375% 2026 | 615 | 645 | ||||||
| Stellantis Finance US, Inc. 1.711% 20275 | 1,365 | 1,344 | ||||||
| Stellantis Finance US, Inc. 2.691% 20315 | 900 | 887 | ||||||
| Toyota Motor Credit Corp. 0.625% 2024 | 2,145 | 2,128 | ||||||
| Toyota Motor Credit Corp. 3.00% 2025 | 1,240 | 1,313 | ||||||
| Toyota Motor Credit Corp. 0.80% 2026 | 890 | 874 | ||||||
| Toyota Motor Credit Corp. 1.125% 2026 | 1,840 | 1,815 | ||||||
| 30,091 | ||||||||
| Industrials 2.34% | ||||||||
| Avolon Holdings Funding, Ltd. 3.625% 20225 | 587 | 594 | ||||||
| Avolon Holdings Funding, Ltd. 3.95% 20245 | 743 | 784 | ||||||
| Avolon Holdings Funding, Ltd. 4.375% 20265 | 925 | 999 | ||||||
| Boeing Company 5.04% 2027 | 1,021 | 1,160 | ||||||
| Boeing Company 3.25% 2028 | 1,095 | 1,147 | ||||||
| 72 | Private Client Services Funds |
| Capital Group Core Bond Fund | ||||||||
| Bonds, notes & other debt instruments (continued) | Principal amount (000) | Value (000) | ||||||
| Corporate bonds, notes & loans (continued) | ||||||||
| Industrials (continued) | ||||||||
| Emerson Electric Co. 1.80% 2027 | $ | 383 | $ | 386 | ||||
| General Dynamics Corp. 1.15% 2026 | 1,000 | 998 | ||||||
| General Electric Co. 3.45% 2027 | 1,000 | 1,091 | ||||||
| Honeywell International, Inc. 2.15% 2022 | 1,160 | 1,175 | ||||||
| Honeywell International, Inc. 2.30% 2024 | 878 | 912 | ||||||
| Masco Corp. 1.50% 2028 | 782 | 754 | ||||||
| Raytheon Technologies Corp. 3.20% 2024 | 275 | 289 | ||||||
| Siemens AG 0.40% 20235 | 1,140 | 1,140 | ||||||
| Siemens AG 0.65% 20245 | 1,425 | 1,420 | ||||||
| Siemens AG 1.20% 20265 | 808 | 800 | ||||||
| Union Pacific Corp. 3.75% 2025 | 230 | 250 | ||||||
| Union Pacific Corp. 2.15% 2027 | 793 | 816 | ||||||
| United Technologies Corp. 3.65% 2023 | 27 | 28 | ||||||
| Vinci SA 3.75% 20295 | 200 | 222 | ||||||
| 14,965 | ||||||||
| Utilities 2.02% | ||||||||
| Ameren Corp. 2.50% 2024 | 373 | 388 | ||||||
| Connecticut Light and Power Co. 3.20% 2027 | 1,025 | 1,107 | ||||||
| Duke Energy Progress, LLC 3.375% 2023 | 786 | 824 | ||||||
| Duke Energy Progress, LLC 3.70% 2028 | 200 | 222 | ||||||
| Entergy Louisiana, LLC 0.95% 2024 | 1,860 | 1,852 | ||||||
| Eversource Energy 2.75% 2022 | 750 | 755 | ||||||
| FirstEnergy Transmission LLC 2.866% 20285 | 425 | �� | 438 | |||||
| Florida Power & Light Company 2.85% 2025 | 225 | 237 | ||||||
| NextEra Energy Capital Holdings, Inc. 2.25% 2030 | 1,276 | 1,276 | ||||||
| Pacific Gas and Electric Co. 3.45% 2025 | 150 | 156 | ||||||
| Pacific Gas and Electric Co. 3.75% 2028 | 150 | 157 | ||||||
| Pacific Gas and Electric Co. 2.50% 2031 | 175 | 167 | ||||||
| Pacific Gas and Electric Co. 3.30% 2040 | 50 | 47 | ||||||
| Southern California Edison Co. 0.975% 2024 | 925 | 921 | ||||||
| Southern California Edison Co. 3.70% 2025 | 1,000 | 1,081 | ||||||
| Southern California Edison Co. 2.85% 2029 | 1,000 | 1,032 | ||||||
| Tampa Electric Co. 2.60% 2022 | 350 | 355 | ||||||
| Virginia Electric and Power Co. 3.10% 2025 | 1,040 | 1,099 | ||||||
| Xcel Energy, Inc. 3.35% 2026 | 749 | 803 | ||||||
| 12,917 | ||||||||
| Information technology 2.00% | ||||||||
| Adobe, Inc. 1.90% 2025 | 647 | 663 | ||||||
| Analog Devices, Inc. 1.70% 2028 | 418 | 416 | ||||||
| Apple, Inc. 0.70% 2026 | 1,135 | 1,113 | ||||||
| Apple, Inc. 1.20% 2028 | 1,418 | 1,375 | ||||||
| Apple, Inc. 1.25% 2030 | 1,470 | 1,389 | ||||||
| Broadcom Corp. / Broadcom Cayman Finance, Ltd. 3.875% 2027 | 185 | 201 | ||||||
| Broadcom, Inc. 1.95% 20285 | 123 | 121 | ||||||
| Broadcom, Ltd. 3.625% 2024 | 270 | 284 | ||||||
| Fidelity National Information Services, Inc. 1.15% 2026 | 1,283 | 1,258 | ||||||
| Fidelity National Information Services, Inc. 1.65% 2028 | 129 | 126 | ||||||
| Fiserv, Inc. 3.20% 2026 | 670 | 713 | ||||||
| Fiserv, Inc. 2.25% 2027 | 777 | 790 | ||||||
| Fortinet, Inc. 1.00% 2026 | 696 | 678 | ||||||
| Intuit, Inc. 0.95% 2025 | 255 | 252 | ||||||
| Intuit, Inc. 1.35% 2027 | 235 | 230 | ||||||
| Microsoft Corp. 2.40% 2026 | 1,951 | 2,048 | ||||||
| Oracle Corp. 2.30% 2028 | 668 | 678 | ||||||
| PayPal Holdings, Inc. 1.65% 2025 | 481 | 488 | ||||||
| 12,823 | ||||||||
| Private Client Services Funds | 73 |
| Capital Group Core Bond Fund | ||||||||
| Bonds, notes & other debt instruments (continued) | Principal amount (000) | Value (000) | ||||||
| Corporate bonds, notes & loans (continued) | ||||||||
| Communication services 1.95% | ||||||||
| Alphabet, Inc. 0.80% 2027 | $ | 490 | $ | 470 | ||||
| Alphabet, Inc. 1.10% 2030 | 1,605 | 1,507 | ||||||
| Alphabet, Inc. 2.05% 2050 | 440 | 396 | ||||||
| AT&T, Inc. 2.30% 2027 | 996 | 1,019 | ||||||
| AT&T, Inc. 1.65% 2028 | 1,065 | 1,039 | ||||||
| CCO Holdings LLC and CCO Holdings Capital Corp. 4.908% 2025 | 165 | 183 | ||||||
| CCO Holdings LLC and CCO Holdings Capital Corp. 2.80% 2031 | 502 | 500 | ||||||
| Comcast Corp. 3.95% 2025 | 539 | 592 | ||||||
| Comcast Corp. 1.95% 2031 | 704 | 687 | ||||||
| SBA Tower Trust 1.631% 20265 | 983 | 971 | ||||||
| T-Mobile US, Inc. 3.75% 2027 | 1,119 | 1,215 | ||||||
| Verizon Communications, Inc. 3.00% 2027 | 450 | 477 | ||||||
| Verizon Communications, Inc. 2.10% 2028 | 1,250 | 1,254 | ||||||
| Verizon Communications, Inc. 2.355% 20325 | 2,210 | 2,179 | ||||||
| 12,489 | ||||||||
| Consumer staples 1.94% | ||||||||
| 7-Eleven, Inc. 0.95% 20265 | 250 | 243 | ||||||
| 7-Eleven, Inc. 1.30% 20285 | 175 | 167 | ||||||
| Altria Group, Inc. 2.35% 2025 | 156 | 161 | ||||||
| Altria Group, Inc. 4.40% 2026 | 117 | 130 | ||||||
| Altria Group, Inc. 3.40% 2030 | 89 | 93 | ||||||
| British American Tobacco PLC 3.462% 2029 | 1,850 | 1,938 | ||||||
| Coca-Cola Company 1.00% 2028 | 1,625 | 1,556 | ||||||
| Constellation Brands, Inc. 3.20% 2023 | 386 | 398 | ||||||
| Constellation Brands, Inc. 2.875% 2030 | 239 | 248 | ||||||
| Costco Wholesale Corp. 2.30% 2022 | 285 | 288 | ||||||
| Keurig Dr Pepper, Inc. 4.057% 2023 | 251 | 264 | ||||||
| Keurig Dr Pepper, Inc. 3.20% 2030 | 500 | 531 | ||||||
| Kimberly-Clark Corp. 1.05% 2027 | 185 | 179 | ||||||
| Kimberly-Clark Corp. 3.10% 2030 | 116 | 126 | ||||||
| Molson Coors Brewing Co. 3.00% 2026 | 245 | 260 | ||||||
| Nestle Holdings, Inc. 1.50% 20285 | 1,750 | 1,714 | ||||||
| Nestlé Holdings, Inc. 1.00% 20275 | 1,640 | 1,582 | ||||||
| PepsiCo, Inc. 1.625% 2030 | 85 | 83 | ||||||
| Philip Morris International, Inc. 1.50% 2025 | 274 | 276 | ||||||
| Philip Morris International, Inc. 0.875% 2026 | 566 | 550 | ||||||
| Procter & Gamble Company 0.55% 2025 | 796 | 779 | ||||||
| Procter & Gamble Company 1.00% 2026 | 362 | 359 | ||||||
| Procter & Gamble Company 3.00% 2030 | 495 | 538 | ||||||
| 12,463 | ||||||||
| Health care 1.93% | ||||||||
| Abbott Laboratories 3.40% 2023 | 98 | 103 | ||||||
| Abbott Laboratories 3.75% 2026 | 292 | 323 | ||||||
| Aetna, Inc. 2.80% 2023 | 55 | 57 | ||||||
| AmerisourceBergen Corp. 0.737% 2023 | 853 | 854 | ||||||
| Amgen, Inc. 2.20% 2027 | 740 | 755 | ||||||
| AstraZeneca Finance LLC 0.70% 2024 | 1,486 | 1,485 | ||||||
| AstraZeneca Finance LLC 1.20% 2026 | 600 | 595 | ||||||
| AstraZeneca Finance LLC 1.75% 2028 | 444 | 443 | ||||||
| AstraZeneca PLC 3.375% 2025 | 445 | 482 | ||||||
| Becton, Dickinson and Company 3.734% 2024 | 17 | 18 | ||||||
| Boston Scientific Corp. 3.45% 2024 | 675 | 712 | ||||||
| Cigna Corp. 3.75% 2023 | 99 | 104 | ||||||
| CVS Health Corp. 1.30% 2027 | 1,384 | 1,342 | ||||||
| CVS Health Corp. 4.30% 2028 | 282 | 319 | ||||||
| GlaxoSmithKline PLC 3.375% 2023 | 750 | 783 | ||||||
| Novartis Capital Corp. 1.75% 2025 | 1,006 | 1,027 | ||||||
| Novartis Capital Corp. 2.00% 2027 | 275 | 282 | ||||||
| 74 | Private Client Services Funds |
| Capital Group Core Bond Fund | ||||||||
| Bonds, notes & other debt instruments (continued) | Principal amount (000) | Value (000) | ||||||
| Corporate bonds, notes & loans (continued) | ||||||||
| Health care (continued) | ||||||||
| Pfizer, Inc. 2.95% 2024 | $ | 485 | $ | 509 | ||||
| Shire PLC 2.875% 2023 | 120 | 124 | ||||||
| Shire PLC 3.20% 2026 | 300 | 319 | ||||||
| Thermo Fisher Scientific, Inc. 1.75% 2028 | 385 | 380 | ||||||
| UnitedHealth Group, Inc. 1.15% 2026 | 495 | 490 | ||||||
| UnitedHealth Group, Inc. 2.30% 2031 | 348 | 352 | ||||||
| Zimmer Holdings, Inc. 3.15% 2022 | 485 | 488 | ||||||
| 12,346 | ||||||||
| Energy 1.83% | ||||||||
| Boardwalk Pipeline Partners LP 4.95% 2024 | 460 | 504 | ||||||
| BP Capital Markets PLC 4.234% 2028 | 437 | 499 | ||||||
| Canadian Natural Resources, Ltd. 2.05% 2025 | 996 | 1,012 | ||||||
| Enbridge Energy Partners LP 5.875% 2025 | 230 | 265 | ||||||
| Energy Transfer Operating LP 3.75% 2030 | 1,645 | 1,754 | ||||||
| Energy Transfer Partners LP 4.20% 2023 | 155 | 163 | ||||||
| Energy Transfer Partners LP 4.50% 2024 | 90 | 97 | ||||||
| EOG Resources, Inc. 4.375% 2030 | 501 | 583 | ||||||
| Equinor ASA 3.625% 2028 | 165 | 183 | ||||||
| Exxon Mobil Corp. 2.019% 2024 | 127 | 131 | ||||||
| Exxon Mobil Corp. 2.44% 2029 | 183 | 189 | ||||||
| Kinder Morgan, Inc. 3.15% 2023 | 495 | 509 | ||||||
| MPLX LP 3.375% 2023 | 75 | 78 | ||||||
| MPLX LP 4.00% 2028 | 350 | 385 | ||||||
| ONEOK, Inc. 4.55% 2028 | 638 | 719 | ||||||
| ONEOK, Inc. 6.35% 2031 | 469 | 596 | ||||||
| Phillips 66 4.30% 2022 | 290 | 295 | ||||||
| Phillips 66 3.85% 2025 | 1,253 | 1,351 | ||||||
| Pioneer Natural Resources Company 1.125% 2026 | 238 | 233 | ||||||
| SA Global Sukuk, Ltd. 1.602% 20265 | 1,505 | 1,488 | ||||||
| Saudi Arabian Oil Co. 1.625% 20255 | 200 | 199 | ||||||
| Schlumberger BV 4.00% 20255 | 165 | 180 | ||||||
| Williams Companies, Inc. 3.50% 2030 | 293 | 315 | ||||||
| 11,728 | ||||||||
| Real estate 1.16% | ||||||||
| Alexandria Real Estate Equities, Inc. 3.95% 2028 | 60 | 67 | ||||||
| Alexandria Real Estate Equities, Inc. 1.875% 2033 | 596 | 560 | ||||||
| American Campus Communities, Inc. 3.75% 2023 | 300 | 311 | ||||||
| American Campus Communities, Inc. 4.125% 2024 | 415 | 447 | ||||||
| American Tower Corp. 1.45% 2026 | 982 | 968 | ||||||
| American Tower Corp. 1.60% 2026 | 717 | 713 | ||||||
| Corporate Office Properties LP 2.75% 2031 | 294 | 295 | ||||||
| Equinix, Inc. 2.90% 2026 | 929 | 975 | ||||||
| Equinix, Inc. 1.80% 2027 | 326 | 324 | ||||||
| Equinix, Inc. 2.00% 2028 | 433 | 429 | ||||||
| Essex Portfolio LP 3.50% 2025 | 490 | 521 | ||||||
| Gaming and Leisure Properties, Inc. 3.35% 2024 | 242 | 255 | ||||||
| Kimco Realty Corp. 3.40% 2022 | 35 | 36 | ||||||
| Public Storage 0.875% 2026 | 134 | 131 | ||||||
| Public Storage 1.85% 2028 | 553 | 553 | ||||||
| Scentre Group 3.50% 20255 | 250 | 265 | ||||||
| Sun Communities Operating LP 2.30% 2028 | 559 | 555 | ||||||
| 7,405 | ||||||||
| Materials 0.60% | ||||||||
| Air Products and Chemicals, Inc. 1.50% 2025 | 757 | 765 | ||||||
| Air Products and Chemicals, Inc. 1.85% 2027 | 155 | 158 | ||||||
| Dow Chemical Co. 3.625% 2026 | 250 | 271 | ||||||
| Private Client Services Funds | 75 |
| Capital Group Core Bond Fund | ||||||||
| Bonds, notes & other debt instruments (continued) | Principal amount (000) | Value (000) | ||||||
| Corporate bonds, notes & loans (continued) | ||||||||
| Materials (continued) | ||||||||
| Dow Chemical Co. 2.10% 2030 | $ | 1,000 | $ | 984 | ||||
| DowDuPont, Inc. 4.493% 2025 | 515 | 573 | ||||||
| LYB International Finance III, LLC 2.25% 2030 | 496 | 494 | ||||||
| Vale Overseas, Ltd. 3.75% 2030 | 587 | 598 | ||||||
| 3,843 | ||||||||
| Total corporate bonds, notes & loans | 176,738 | |||||||
| Mortgage-backed obligations 12.24% | ||||||||
| Federal agency mortgage-backed obligations 8.21% | ||||||||
| Fannie Mae Pool #889995 5.50% 20386 | 160 | 184 | ||||||
| Fannie Mae Pool #MA4387 2.00% 20416 | 853 | 870 | ||||||
| Fannie Mae Pool #AI5236 5.00% 20416 | 294 | 333 | ||||||
| Fannie Mae Pool #AI8806 5.00% 20416 | 52 | 59 | ||||||
| Fannie Mae, Series 2007-33, Class HE, 5.50% 20376 | 3 | 4 | ||||||
| Fannie Mae, Series 2012-M13, Class A2, Multi Family, 2.377% 20226 | 126 | 127 | ||||||
| Fannie Mae, Series 2015-M4, Class AV2, Multi Family, 2.509% 20226,7 | 172 | 173 | ||||||
| Fannie Mae, Series 2012-M2, Class A2, Multi Family, 2.717% 20226 | 23 | 23 | ||||||
| Fannie Mae, Series 2016-M2, Class AV2, Multi Family, 2.152% 20236 | 303 | 307 | ||||||
| Fannie Mae, Series 2016-M3, Class ASQ2, Multi Family, 2.263% 20236 | 40 | 40 | ||||||
| Fannie Mae, Series 2013-M12, Class APT, Multi Family, 2.405% 20236,7 | 300 | 305 | ||||||
| Fannie Mae, Series 2017-M3, Class AV2, Multi Family, 2.526% 20246,7 | 253 | 259 | ||||||
| Fannie Mae, Series 2017-M10, Class AV2, Multi Family, 2.554% 20246,7 | 403 | 417 | ||||||
| Fannie Mae, Series 2017-M15, Class AV2, Multi Family, 2.621% 20246,7 | 365 | 379 | ||||||
| Fannie Mae, Series 2015-M8, Class A1, Multi Family, 2.344% 20256 | 29 | 30 | ||||||
| Fannie Mae, Series 2016-M9, Class A1, Multi Family, 2.003% 20266 | 43 | 43 | ||||||
| Fannie Mae, Series 2016-M5, Class A1, Multi Family, 2.073% 20266 | 333 | 341 | ||||||
| Fannie Mae, Series 2016-M11, Class A1, Multi Family, 2.08% 20266 | 500 | 512 | ||||||
| Fannie Mae, Series 2016-M12, Class A1, Multi Family, 2.132% 20266 | 210 | 215 | ||||||
| Fannie Mae, Series 2016-M6, Class A1, Multi Family, 2.137% 20266 | 164 | 167 | ||||||
| Fannie Mae, Series 2016-M4, Class A1, Multi Family, 2.187% 20266 | 227 | 233 | ||||||
| Fannie Mae, Series 2017-M7, Class A1, Multi Family, 2.595% 20266 | 62 | 62 | ||||||
| Fannie Mae, Series 2017-M8, Class A1, Multi Family, 2.654% 20276 | 19 | 19 | ||||||
| Fannie Mae, Series 2017-M7, Class A2, Multi Family, 2.961% 20276,7 | 461 | 493 | ||||||
| Fannie Mae, Series 2017-M15, Class ATS1, Multi Family, 2.987% 20275,6 | 37 | 38 | ||||||
| Freddie Mac, Series 3272, Class PA, 6.00% 20376 | 10 | 12 | ||||||
| Freddie Mac, Series K020, Class A2, Multi Family, 2.373% 20226 | 241 | 243 | ||||||
| Freddie Mac, Series K718, Class A2, Multi Family, 2.791% 20226 | 606 | 608 | ||||||
| Freddie Mac Seasoned Credit Risk Transfer Trust, Series 2017-1, Class HA, 3.00% 20566,7 | 381 | 394 | ||||||
| Freddie Mac Seasoned Credit Risk Transfer Trust, Series 2017-2, Class MA, 3.00% 20566 | 280 | 290 | ||||||
| Freddie Mac Seasoned Credit Risk Transfer Trust, Series 2017-2, Class HA, 3.00% 20566,7 | 278 | 288 | ||||||
| Freddie Mac Seasoned Credit Risk Transfer Trust, Series 2017-4, Class HT, 3.25% 20576,7 | 158 | 168 | ||||||
| Freddie Mac Seasoned Credit Risk Transfer Trust, Series 2018-2, Class MT, 3.50% 20576 | 345 | 364 | ||||||
| Freddie Mac Seasoned Credit Risk Transfer Trust, Series 2017-4, Class MT, 3.50% 20576 | 173 | 183 | ||||||
| Freddie Mac Seasoned Credit Risk Transfer Trust, Series 2019-2, Class MA, 3.50% 20586 | 1,418 | 1,478 | ||||||
| Freddie Mac Seasoned Credit Risk Transfer Trust, Series 2019-4, Class MA, 3.00% 20596 | 1,398 | 1,445 | ||||||
| Freddie Mac Seasoned Loan Structured Transaction Trust, Series 2018-1, Class A1, 3.50% 20286 | 1,503 | 1,565 | ||||||
| Government National Mortgage Assn. 2.00% 20516,8 | 2,410 | 2,441 | ||||||
| Government National Mortgage Assn. 2.00% 20516,8 | 483 | 488 | ||||||
| Government National Mortgage Assn. Pool #694836 5.661% 20596 | 2 | 2 | ||||||
| Government National Mortgage Assn. Pool #776095 4.907% 20646 | 1 | 1 | ||||||
| Government National Mortgage Assn. Pool #AA7554 6.64% 20646 | 8 | 8 | ||||||
| Government National Mortgage Assn., Series 2012-H20, Class PT, 0.899% 20626,7 | 265 | 264 | ||||||
| Uniform Mortgage-Backed Security 2.00% 20516,8 | 7,666 | 7,651 | ||||||
| Uniform Mortgage-Backed Security 2.00% 20526,8 | 6,981 | 6,953 | ||||||
| Uniform Mortgage-Backed Security 2.50% 20526,8 | 21,615 | 22,103 | ||||||
| 52,582 | ||||||||
| 76 | Private Client Services Funds |
| Capital Group Core Bond Fund | ||||||||
| Bonds, notes & other debt instruments (continued) | Principal amount (000) | Value (000) | ||||||
| Mortgage-backed obligations (continued) | ||||||||
| Collateralized mortgage-backed obligations (privately originated) 2.44% | ||||||||
| Bellemeade Re, Ltd., Series 2019-3A, Class M1A, 1.189% 20295,6,7 | $ | 30 | $ | 30 | ||||
| Cascade Funding Mortgage Trust, Series 2020-HB4, Class A, 0.946% 20305,6,7 | 217 | 217 | ||||||
| Cascade Funding Mortgage Trust, Series 2021-HB6, Class A, 0.898% 20365,6,7 | 1,231 | 1,232 | ||||||
| Credit Suisse Mortgage Trust, Series 2017-RPL3, Class A1, 2.00% 20605,6,7 | 345 | 349 | ||||||
| Finance of America Structured Securities Trust, Series 2019-JR2, Class A1, 2.00% 20695,6 | 704 | 774 | ||||||
| Home Partners of America Trust, Series 2021-2, Class A, 1.901% 20265,6,9 | 565 | 565 | ||||||
| Legacy Mortgage Asset Trust, Series 2019-GS5, Class A1, 3.20% 20595,6,7 | 544 | 547 | ||||||
| Legacy Mortgage Asset Trust, Series 2019-GS7, Class A1, 3.25% 20595,6,7 | 839 | 844 | ||||||
| Legacy Mortgage Asset Trust, Series 2019-GS2, Class A1, 3.75% 20595,6,7 | 527 | 528 | ||||||
| Mello Warehouse Securitization Trust, Series 2020-2, Class A, (1-month USD-LIBOR + 0.80%) 0.889% 20535,6,7 | 777 | 776 | ||||||
| Mello Warehouse Securitization Trust, Series 2020-1, Class A, (1-month USD-LIBOR + 0.90%) 0.989% 20535,6,7 | 719 | 722 | ||||||
| Mello Warehouse Securitization Trust, Series 2021-3, Class A, (1-month USD-LIBOR + 0.85%) 0.934% 20555,6,7 | 808 | 814 | ||||||
| MRA Issuance Trust, Series 2020-10, Class A, (1-month USD-LIBOR + 1.70%) 1.782% 20225,6,7 | 1,305 | 1,307 | ||||||
| NewRez Warehouse Securitization Trust, Series 2021-1, Class A, (1-month USD-LIBOR + 0.75%) 0.839% 20555,6,7 | 5,557 | 5,557 | ||||||
| RMF Proprietary Issuance Trust, Series 2019-1, Class A, 2.75% 20635,6,7 | 332 | 328 | ||||||
| Station Place Securitization Trust, Series 2021-WL2, Class A, (1-month USD-LIBOR + 0.70%) 0.789% 20545,6,7 | 1,000 | 1,001 | ||||||
| 15,591 | ||||||||
| Commercial mortgage-backed securities 1.59% | ||||||||
| BX Trust, Series 2021-SDMF, Class A, (1-month USD-LIBOR + 0.589%) 0.679% 20345,6,7 | 1,240 | 1,223 | ||||||
| BX Trust, Series 2021-VOLT, Class A, (1-month USD-LIBOR + 0.70%) 0.79% 20365,6,7 | 693 | 694 | ||||||
| BX Trust, Series 2021-ARIA, Class A, (1-month USD-LIBOR + 0.899%) 0.979% 20365,6,7 | 664 | 664 | ||||||
| BX Trust, Series 2021-VOLT, Class B, (1-month USD-LIBOR + 0.95%) 1.04% 20365,6,7 | 509 | 510 | ||||||
| BX Trust, Series 2021-SOAR, Class A, (1-month USD-LIBOR + 0.67%) 0.76% 20385,6,7 | 870 | 869 | ||||||
| BX Trust, Series 2021-SOAR, Class B, (1-month USD-LIBOR + 0.87%) 0.96% 20385,6,7 | 327 | 327 | ||||||
| BX Trust, Series 2021-SOAR, Class C, (1-month USD-LIBOR + 1.10%) 1.19% 20385,6,7 | 221 | 221 | ||||||
| Extended Stay America Trust, Series 2021-ESH, Class A, (1-month USD-LIBOR + 1.08%) 1.171% 20385,6,7 | 261 | 262 | ||||||
| Extended Stay America Trust, Series 2021-ESH, Class B, (1-month USD-LIBOR + 1.38%) 1.471% 20385,6,7 | 191 | 191 | ||||||
| Hawaii Hotel Trust, Series 2019-MAUI, Class A, (1-month USD-LIBOR + 1.15%) 1.24% 20385,6,7 | 1,500 | 1,504 | ||||||
| JPMorgan Chase Commercial Mortgage Securities Trust, Series 2021-410T, Class A, 2.287% 20425,6 | 461 | 470 | ||||||
| LUXE Commercial Mortgage Trust, Series 21-TRIP, Class A, (1-month USD-LIBOR + 1.05%) 1.15% 20385,6,7 | 1,343 | 1,346 | ||||||
| Manhattan West Mortgage Trust, Series 2020-1MW, Class A, 2.13% 20395,6 | 1,262 | 1,279 | ||||||
| MHC Commercial Mortgage Trust, CMO, Series 2021-MHC, Class A, (1-month USD-LIBOR + 0.801%) 0.891% 20265,6,7 | 460 | 461 | ||||||
| Motel 6 Trust, Series 2021-MTL6, Class A, (1-month USD-LIBOR + 0.90%) 0.99% 20385,6,7 | 164 | 164 | ||||||
| 10,185 | ||||||||
| Total mortgage-backed obligations | 78,358 | |||||||
| Asset-backed obligations 10.46% | ||||||||
| Aesop Funding LLC, Series 2019-2A, Class A, 3.35% 20255,6 | 750 | 793 | ||||||
| Aesop Funding LLC, Series 2020-2, Class A, 2.02% 20275,6 | 539 | 549 | ||||||
| Aesop Funding LLC, Series 2020-2A, Class B, 2.96% 20275,6 | 138 | 144 | ||||||
| Affirm Asset Securitization Trust, Series 2021-A, Class A, 0.88% 20255,6 | 462 | 463 | ||||||
| Affirm Asset Securitization Trust, Series 2020-A, Class A, 2.10% 20255,6 | 473 | 475 | ||||||
| Affirm Asset Securitization Trust, Series 2021-B, Class A, 1.03% 20265,6 | 1,136 | 1,132 | ||||||
| Allegro CLO, Ltd., Series 2016-1A, Class AR2, (3-month USD-LIBOR + 0.95%) 1.074% 20305,6,7 | 750 | 750 | ||||||
| Allegro CLO, Ltd., Series 2017-1A, Class AR, (3-month USD-LIBOR + 0.95%) 1.072% 20305,6,7 | 492 | 492 | ||||||
| Ares CLO, Ltd., Series 2017-42A, Class AR, (3-month USD-LIBOR + 0.92%) 1.048% 20285,6,7 | 1,053 | 1,053 | ||||||
| Ballyrock CLO, Ltd., Series 2019-2A, Class A1AR, (3-month USD-LIBOR + 1.00%) 1.131% 20305,6,7 | 1,095 | 1,095 | ||||||
| Private Client Services Funds | 77 |
| Capital Group Core Bond Fund | ||||||||
| Bonds, notes & other debt instruments (continued) | Principal amount (000) | Value (000) | ||||||
| Asset-backed obligations (continued) | ||||||||
| Bankers Healthcare Group Securitization Trust, Series 2021-A, Class A, 1.42% 20335,6 | $ | 111 | $ | 111 | ||||
| Bankers Healthcare Group Securitization Trust, Series 2021-B, Class A, 0.90% 20345,6 | 228 | 228 | ||||||
| CarMaxAuto Owner Trust, Series 2020-1, Class A2, 1.87% 20236 | 21 | 21 | ||||||
| CarMaxAuto Owner Trust, Series 2019-2, Class A3, 2.68% 20246 | 408 | 413 | ||||||
| CarMaxAuto Owner Trust, Series 2019-2, Class A4, 2.77% 20246 | 805 | 828 | ||||||
| CarMaxAuto Owner Trust, Series 2019-2, Class B, 3.01% 20246 | 775 | 800 | ||||||
| CarMaxAuto Owner Trust, Series 2019-2, Class C, 3.16% 20256 | 1,150 | 1,186 | ||||||
| Castlelake Aircraft Securitization Trust, Series 2021-2A, Class A, 2.852% 20375,6 | 593 | 593 | ||||||
| Castlelake Aircraft Securitization Trust, Series 2017-1R, Class A, 2.741% 20415,6 | 203 | 203 | ||||||
| Cent CLO, Ltd., Series 2014-21A, Class AR, (3-month USD-LIBOR + 0.97%) 1.105% 20305,6,7 | 1,557 | 1,557 | ||||||
| CF Hippolyta LLC, Series 2020-1, Class A1, 1.69% 20605,6 | 1,016 | 1,017 | ||||||
| CF Hippolyta LLC, Series 2020-1, Class A2, 1.99% 20605,6 | 166 | 165 | ||||||
| CF Hippolyta LLC, Series 2020-1, Class B1, 2.28% 20605,6 | 266 | 267 | ||||||
| CF Hippolyta LLC, Series 2020-1, Class B2, 2.60% 20605,6 | 93 | 94 | ||||||
| CF Hippolyta LLC, Series 2021-1, Class A1, 1.53% 20615,6 | 458 | 454 | ||||||
| CLI Funding V LLC, Series 2020-1A, Class A, 2.08% 20455,6 | 428 | 427 | ||||||
| CLI Funding V LLC, Series 2021-1A, Class A, 1.64% 20465,6 | 554 | 544 | ||||||
| CPS Auto Receivables Trust, Series 2019-B, Class C, 3.35% 20245,6 | 150 | 150 | ||||||
| Drive Auto Receivables Trust, Series 2020-1, Class B, 2.08% 20246 | 1,233 | 1,236 | ||||||
| Drive Auto Receivables Trust, Series 2020-1, Class C, 2.36% 20266 | 2,166 | 2,193 | ||||||
| Drivetime Auto Owner Trust, Series 2020-1, Class A, 1.94% 20235,6 | 2 | 2 | ||||||
| Drivetime Auto Owner Trust, Series 2020-1, Class B, 2.16% 20245,6 | 1,000 | 1,005 | ||||||
| Dryden Senior Loan Fund, CLO, Series 2017-47A, Class A1R, (3-month USD-LIBOR + 0.98%) 1.104% 20285,6,7 | 1,643 | 1,643 | ||||||
| EDvestinU Private Education Loan LLC, Series 2021-A, Class A, 1.80% 20455,6 | 88 | 87 | ||||||
| Exeter Automobile Receivables Trust, Series 2019-2A, Class C, 3.30% 20245,6 | 517 | 521 | ||||||
| First Investors Auto Owner Trust, Series 2021-1A, Class A, 0.45% 20265,6 | 283 | 283 | ||||||
| FirstKey Homes Trust, Series 2020-SFR2, Class A, 1.266% 20375,6 | 237 | 234 | ||||||
| Ford Credit Auto Owner Trust, Series 2020-A, Class A3, 1.04% 20246 | 433 | 435 | ||||||
| Ford Credit Auto Owner Trust, Series 2020-1, Class A, 2.04% 20315,6 | 582 | 597 | ||||||
| Ford Credit Auto Owner Trust, Series 2021-1, Class A, 1.37% 20335,6 | 439 | 438 | ||||||
| GCI Funding I LLC, Series 2020-1, Class A, 2.82% 20455,6 | 167 | 169 | ||||||
| GCI Funding I LLC, Series 2021-1, Class A, 2.38% 20465,6 | 443 | 445 | ||||||
| Global SC Finance V SRL, Series 2020-1A, Class A, 2.17% 20405,6 | 1,336 | 1,343 | ||||||
| Global SC Finance VII SRL, Series 2020-2A, Class A, 2.26% 20405,6 | 893 | 900 | ||||||
| Global SC Finance VII SRL, Series 2021-1A, Class A, 1.86% 20415,6 | 1,074 | 1,064 | ||||||
| GM Financial Automobile Leasing Trust, Series 2020-2, Class A2A, 0.71% 20226 | 51 | 51 | ||||||
| GM Financial Automobile Leasing Trust, Series 2020-2, Class A3, 0.80% 20236 | 208 | 209 | ||||||
| Hertz Vehicle Financing LLC, Series 2021-1A, Class A, 1.21% 20255,6 | 1,138 | 1,133 | ||||||
| Hertz Vehicle Financing LLC, Series 2021-1A, Class B, 1.56% 20255,6 | 122 | 122 | ||||||
| Hertz Vehicle Financing LLC, Series 2021-2A, Class A, 1.68% 20275,6 | 1,234 | 1,229 | ||||||
| Hertz Vehicle Financing LLC, Series 2021-2A, Class B, 2.12% 20275,6 | 132 | 132 | ||||||
| Honda Auto Receivables Owner Trust, Series 2019-2, Class A3, 2.52% 20236 | 704 | 710 | ||||||
| Longfellow Place CLO, Ltd., Series 2013-1A, Class AR3, (3-month USD-LIBOR + 1.00%) 1.124% 20295,6,7 | 909 | 909 | ||||||
| Madison Park Funding, Ltd., CLO, Series 2015-17A, Class AR2, (3-month USD-LIBOR + 1.00%) 1.13% 20305,6,7 | 1,665 | 1,667 | ||||||
| Marathon CLO, Ltd., Series 2017-9A, Class A1AR, (3-month USD-LIBOR + 1.15%) 1.274% 20295,6,7 | 794 | 794 | ||||||
| Mercury Financial Credit Card Master Trust, Series 2021-1A, Class A, 1.54% 20265,6 | 1,100 | 1,103 | ||||||
| Mission Lane Credit Card Master Trust, Series 2021-A, Class A, 1.59% 20265,6 | 380 | 379 | ||||||
| Navient Student Loan Trust, Series 2021-A, Class A, 0.84% 20695,6 | 175 | 174 | ||||||
| Navient Student Loan Trust, Series 2021-C, Class A, 1.06% 20695,6 | 789 | 787 | ||||||
| Nelnet Student Loan Trust, Series 2021-C, Class AFX, 1.32% 20625,6 | 1,821 | 1,808 | ||||||
| Nelnet Student Loan Trust, Series 2021-A, Class APT1, 1.36% 20625,6 | 922 | 914 | ||||||
| Nelnet Student Loan Trust, Series 2021-B, Class AFX, 1.42% 20625,6 | 1,730 | 1,722 | ||||||
| New Economy Assets Phase 1 Issuer, LLC, Series 2021-1, Class A1, 1.91% 20615,6 | 2,723 | 2,717 | ||||||
| Newark BSL CLO 2, Ltd., Series 2017-1A, Class A1R, (3-month USD-LIBOR + 0.97%) 1.094% 20305,6,7 | 529 | 529 | ||||||
| Nissan Auto Receivables Owner Trust, Series 2019-A, Class A-3, 2.90% 20236 | 186 | 188 | ||||||
| Oportun Funding LLC, Series 2021-B, Class A, 1.47% 20315,6 | 288 | 288 | ||||||
| OSW Structured Asset Trust, Series 2020-RPL1, Class A1, 3.072% 20595,6,7 | 2,996 | 3,007 | ||||||
| Palmer Square Loan Funding, CLO, Series 2021-4A, Class A1, (3-month USD-LIBOR + 0.80%) 0.928% 20295,6,7 | 1,500 | 1,500 | ||||||
| Palmer Square Loan Funding, CLO, Series 2021-4A, Class A2, (3-month USD-LIBOR + 1.40%) 1.528% 20295,6,7 | 856 | 856 | ||||||
| Palmer Square Loan Funding, CLO, Series 2020-4, Class A1, (3-month USD-LIBOR + 1.00%) 1.129% 20285,6,7 | 443 | 443 | ||||||
| Palmer Square Loan Funding, CLO, Series 2021-1, Class A1, (3-month USD-LIBOR + 0.90%) 1.032% 20295,6,7 | 198 | 198 | ||||||
| Race Point CLO, Ltd., Series 2015-9A, Class A1A2, (3-month USD-LIBOR + 0.94%) 1.064% 20305,6,7 | 1,390 | 1,390 | ||||||
| Santander Drive Auto Receivables Trust, Series 2019-3, Class C, 2.49% 20256 | 693 | 697 | ||||||
| 78 | Private Client Services Funds |
| Capital Group Core Bond Fund | ||||||||
| Bonds, notes & other debt instruments (continued) | Principal amount (000) | Value (000) | ||||||
| Asset-backed obligations (continued) | ||||||||
| SMB Private Education Loan Trust, Series 2021-A, Class A1, (1-month USD-LIBOR + 0.50%) 0.59% 20535,6,7 | $ | 86 | $ | 86 | ||||
| SMB Private Education Loan Trust, Series 2021-A, Class APT2, 1.07% 20535,6 | 257 | 252 | ||||||
| Sound Point CLO, Ltd., Series 2017-3A, Class A1R, (3-month USD-LIBOR + 0.98%) 1.112% 20305,6,7 | 1,660 | 1,661 | ||||||
| Sound Point CLO, Ltd., Series 2017-2A, Class AR, (3-month USD-LIBOR + 0.98%) 1.112% 20305,6,7 | 970 | 970 | ||||||
| Sound Point CLO, Ltd., Series 2015-1RA, Class AR, (3-month USD-LIBOR + 1.08%) 1.204% 20305,6,7 | 895 | 895 | ||||||
| Stellar Jay Ireland DAC, Series 2021-1, Class A, 3.967% 20285,6,9 | 898 | 898 | ||||||
| Stonepeak, Series 2021-1A, Class AA, 2.301% 20335,6 | 377 | 379 | ||||||
| SuttonPark Structured Settlements, Series 2021-1, Class A, 1.95% 20755,6 | 538 | 534 | ||||||
| Textainer Marine Containers, Ltd., Series 2021-1A, Class A, 1.68% 20465,6 | 196 | 192 | ||||||
| Textainer Marine Containers, Ltd., Series 2021-2A, Class A, 2.23% 20465,6 | 1,152 | 1,156 | ||||||
| TIF Funding II LLC, Series 2021-1A, Class A, 1.65% 20465,6 | 658 | 641 | ||||||
| Toyota Auto Loan Extended Note Trust, Series 2019-1, Class A, 2.56% 20315,6 | 1,250 | 1,301 | ||||||
| Toyota Auto Loan Extended Note Trust, Series 2020-1, Class A, 1.35% 20335,6 | 445 | 447 | ||||||
| Toyota Auto Receivables Owner Trust, Series 2019-B, Class A3, 2.57% 20236 | 603 | 608 | ||||||
| Triton Container Finance VIII LLC, Series 2020-1, Class A, 2.11% 20455,6 | 1,163 | 1,165 | ||||||
| Triton Container Finance VIII LLC, Series 2021-1, Class A, 1.86% 20465,6 | 782 | 771 | ||||||
| Volkswagen Auto Lease Trust, Series 2019-A, Class A3, 1.99% 20226 | 750 | 754 | ||||||
| Westlake Automobile Receivables Trust, Series 2019-2A, Class B, 2.62% 20245,6 | 18 | 18 | ||||||
| 66,983 | ||||||||
| Federal agency bonds & notes 2.74% | ||||||||
| Fannie Mae 2.375% 2023 | 2,442 | 2,505 | ||||||
| Fannie Mae 0.875% 2030 | 2,563 | 2,411 | ||||||
| Freddie Mac 0.25% 2023 | 3,439 | 3,430 | ||||||
| Freddie Mac 0.375% 2025 | 9,449 | 9,223 | ||||||
| 17,569 | ||||||||
| Bonds & notes of governments & government agencies outside the U.S. 2.51% | ||||||||
| Asian Development Bank 0.625% 2024 | 1,526 | 1,516 | ||||||
| Canada 0.75% 2026 | 2,350 | 2,297 | ||||||
| Denmark (Kingdom of) 0.125% 20225 | 660 | 658 | ||||||
| Denmark (Kingdom of) 0.125% 2022 | 655 | 653 | ||||||
| European Investment Bank 2.25% 2022 | 751 | 757 | ||||||
| European Investment Bank 0.75% 2026 | 758 | 741 | ||||||
| Inter-American Development Bank 0.50% 2024 | 500 | 495 | ||||||
| KfW 0.375% 2025 | 1,010 | 987 | ||||||
| Kommunalbanken 0.50% 20245 | 442 | 437 | ||||||
| Kommunalbanken 0.375% 20255 | 2,000 | 1,949 | ||||||
| Kommuninvest i Sverige Aktiebolag 0.25% 20235 | 905 | 902 | ||||||
| Manitoba (Province of) 3.05% 2024 | 200 | 211 | ||||||
| Ontario (Province of) 3.20% 2024 | 500 | 531 | ||||||
| Ontario Teachers’ Finance Trust 0.875% 20265 | 902 | 882 | ||||||
| Quebec (Province of) 0.60% 2025 | 1,600 | 1,573 | ||||||
| Saudi Arabia (Kingdom of) 4.00% 20255 | 430 | 468 | ||||||
| Saudi Arabia (Kingdom of) 4.50% 20305 | 445 | 518 | ||||||
| United Mexican States 4.15% 2027 | 460 | 514 | ||||||
| 16,089 | ||||||||
| Municipals 0.62% | ||||||||
| California 0.04% | ||||||||
| High-Speed Passenger Train G.O. Rev. Ref. Bonds, Series 2017-A, 2.367% 2022 | 250 | 252 | ||||||
| Florida 0.43% | ||||||||
| Board of Administration Fin. Corp., Rev. Bonds, Series 2020-A, 1.258% 2025 | 1,140 | 1,141 | ||||||
| Board of Administration Fin. Corp., Rev. Bonds, Series 2020-A, 1.705% 2027 | 805 | 803 | ||||||
| Board of Administration Fin. Corp., Rev. Bonds, Series 2020-A, 2.154% 2030 | 810 | 809 | ||||||
| 2,753 | ||||||||
| Private Client Services Funds | 79 |
| Capital Group Core Bond Fund | ||||||||
| Bonds, notes & other debt instruments (continued) | Principal amount (000) | Value (000) | ||||||
| Municipals (continued) | ||||||||
| New York 0.15% | ||||||||
| Dormitory Auth., Taxable State Personal Income Tax Rev. Bonds (General Purpose), Series 2021-C, 1.748% 2028 | $ | 965 | $ | 963 | ||||
| Washington 0.00% | ||||||||
| Energy Northwest, Electric Rev. Bonds (Columbia Generating Station), Series 2015-B, 2.814% 2024 | 20 | 21 | ||||||
| Total municipals | 3,989 | |||||||
| Total bonds, notes & other debt instruments (cost: $604,809,000) | 612,766 | |||||||
| Short-term securities 9.99% | Shares | |||||||
| Money market investments 9.99% | ||||||||
| Capital Group Central Cash Fund 0.06%10,11 | 639,514 | 63,951 | ||||||
| Total short-term securities (cost: $63,954,000) | 63,951 | |||||||
| Total investment securities 105.67% (cost: $668,763,000) | 676,717 | |||||||
| Other assets less liabilities (5.67%) | (36,322 | ) | ||||||
| Net assets 100.00% | $ | 640,395 | ||||||
| Futures contracts | ||||||||||||||||||
| Contracts | Type | Number of contracts | Expiration | Notional amount (000) | 12 | Value at 10/31/2021 (000) | 13 | Unrealized (depreciation) appreciation at 10/31/2021 (000) | ||||||||||
| 90 Day Euro Dollar Futures | Long | 1,255 | December 2022 | $313,750 | $ | 311,020 | $ | (768 | ) | |||||||||
| 2 Year U.S. Treasury Note Futures | Long | 189 | December 2021 | 37,800 | 41,438 | (175 | ) | |||||||||||
| 5 Year U.S. Treasury Note Futures | Short | 406 | December 2021 | (40,600 | ) | (49,430 | ) | 462 | ||||||||||
| 10 Year U.S. Treasury Note Futures | Long | 168 | December 2021 | 16,800 | 21,958 | (196 | ) | |||||||||||
| 10 Year Ultra U.S. Treasury Note Futures | Short | 69 | December 2021 | (6,900 | ) | (10,007 | ) | 172 | ||||||||||
| 20 Year U.S. Treasury Bond Futures | Short | 13 | December 2021 | (1,300 | ) | (2,091 | ) | (17 | ) | |||||||||
| 30 Year Ultra U.S. Treasury Bond Futures | Short | 20 | December 2021 | (2,000 | ) | (3,928 | ) | 15 | ||||||||||
| $ | (507 | ) | ||||||||||||||||
| Investments in affiliates11 | ||||||||||||||||||||||||||||
| Value of affiliate at 11/1/2020 (000) | Additions (000) | Reductions (000) | Net realized loss (000) | Net unrealized depreciation (000) | Value of affiliate at 10/31/2021 (000) | Dividend income (000) | ||||||||||||||||||||||
| Short-term securities 9.99% | ||||||||||||||||||||||||||||
| Money market investments 9.99% | ||||||||||||||||||||||||||||
| Capital Group Central Cash Fund 0.06%10 | $ | 79,218 | $ | 179,027 | $ | 194,288 | $ | (2 | ) | $ | (4 | ) | $ | 63,951 | $ | 60 | ||||||||||||
| 80 | Private Client Services Funds |
Capital Group Core Bond Fund
| 1 | Amount less than one thousand. |
| 2 | All or a portion of this security was pledged as collateral. The total value of pledged collateral was $721,000, which represented .11% of the net assets of the fund. |
| 3 | Index-linked bond whose principal amount moves with a government price index. |
| 4 | Step bond; coupon rate may change at a later date. |
| 5 | Acquired in a transaction exempt from registration under Rule 144A of the Securities Act of 1933. May be resold in the U.S. in transactions exempt from registration, normally to qualified institutional buyers. The total value of all such securities was $120,128,000, which represented 18.76% of the net assets of the fund. |
| 6 | Principal payments may be made periodically. Therefore, the effective maturity date may be earlier than the stated maturity date. |
| 7 | Coupon rate may change periodically. Reference rate and spread are as of the most recent information available. Some coupon rates are determined by the issuer or agent based on current market conditions; therefore, the reference rate and spread are not available. |
| 8 | Purchased on a TBA basis. |
| 9 | Valued under fair value procedures adopted by authority of the board of trustees. The total value of all such securities was $1,463,000, which represented .23% of the net assets of the fund. |
| 10 | Rate represents the seven-day yield at 10/31/2021. |
| 11 | Part of the same “group of investment companies” as the fund as defined under the Investment Company Act of 1940, as amended. |
| 12 | Notional amount is calculated based on the number of contracts and notional contract size. |
| 13 | Value is calculated based on the notional amount and current market price. |
Key to abbreviations and symbol
Auth. = Authority
CLO = Collateralized Loan Obligations
DAC = Designated Activity Company
Fin. = Finance
G.O. = General Obligation
LIBOR = London Interbank Offered Rate
Ref. = Refunding
Rev. = Revenue
SOFR = Secured Overnight Financing Rate
TBA = To-be-announced
USD/$ = U.S. dollars
| Private Client Services Funds | 81 |
| Financial statements | |
| Statements of assets and liabilities at October 31, 2021 | (dollars and shares in thousands, except per-share amounts) |
| Capital Group Core Municipal Fund | Capital Group Short-Term Municipal Fund | Capital Group California Core Municipal Fund | ||||||||||
| Assets: | ||||||||||||
| Investment securities, at value: | ||||||||||||
| Unaffiliated issuers | $ | 792,736 | $ | 204,039 | $ | 654,377 | ||||||
| Affiliated issuers | — | — | — | |||||||||
| Cash | 6,190 | 350 | 6,318 | |||||||||
| Cash collateral pledged for futures contracts | 99 | 39 | 133 | |||||||||
| Receivables for: | ||||||||||||
| Sales of investments | — | * | — | 3,627 | ||||||||
| Sales of fund’s shares | 764 | 756 | 5,427 | |||||||||
| Dividends and interest | 6,583 | 1,804 | 5,782 | |||||||||
| Variation margin on futures contracts | 4 | 1 | 3 | |||||||||
| Total assets | 806,376 | 206,989 | 675,667 | |||||||||
| Liabilities: | ||||||||||||
| Payables for: | ||||||||||||
| Purchases of investments | 20,733 | 4,198 | 11,225 | |||||||||
| Repurchases of fund’s shares | 424 | 26 | 172 | |||||||||
| Investment advisory services | 166 | 43 | 140 | |||||||||
| Services provided by related parties | — | (1 | ) | — | ||||||||
| Variation margin on futures contracts | — | — | — | |||||||||
| Other | — | * | — | * | — | * | ||||||
| Total liabilities | 21,323 | 4,266 | 11,537 | |||||||||
| Net assets at October 31, 2021 | $ | 785,053 | $ | 202,723 | $ | 664,130 | ||||||
| Net assets consist of: | ||||||||||||
| Capital paid in on shares of beneficial interest | $ | 769,940 | $ | 200,638 | $ | 648,872 | ||||||
| Total distributable earnings | 15,113 | 2,085 | 15,258 | |||||||||
| Net assets at October 31, 2021 | $ | 785,053 | $ | 202,723 | $ | 664,130 | ||||||
| Investment securities, at cost: | ||||||||||||
| Unaffiliated issuers | $ | 783,028 | $ | 202,530 | $ | 643,716 | ||||||
| Affiliated issuers | — | — | — | |||||||||
| Shares outstanding | 73,891 | 19,767 | 61,752 | |||||||||
| Net asset value per share | $ | 10.62 | $ | 10.26 | $ | 10.75 | ||||||
See end of statements of assets and liabilities for footnote.
See notes to financial statements.
| 82 | Private Client Services Funds |
| Financial statements (continued) | |
| Statements of assets and liabilities at October 31, 2021 (continued) | (dollars and shares in thousands, except per-share amounts) |
| Capital Group California Short-Term Municipal Fund | Capital Group Core Bond Fund | |||||||
| Assets: | ||||||||
| Investment securities, at value: | ||||||||
| Unaffiliated issuers | $ | 183,840 | $ | 612,766 | ||||
| Affiliated issuers | — | 63,951 | ||||||
| Cash | 2,424 | 3 | ||||||
| Cash collateral pledged for futures contracts | 25 | — | ||||||
| Receivables for: | ||||||||
| Sales of investments | — | 53,694 | ||||||
| Sales of fund’s shares | — | * | 4,350 | |||||
| Dividends and interest | 1,778 | 1,814 | ||||||
| Variation margin on futures contracts | — | 2 | ||||||
| Total assets | 188,067 | 736,580 | ||||||
| Liabilities: | ||||||||
| Payables for: | ||||||||
| Purchases of investments | 6,283 | 95,897 | ||||||
| Repurchases of fund’s shares | 26 | 43 | ||||||
| Investment advisory services | 39 | 135 | ||||||
| Services provided by related parties | — | — | ||||||
| Variation margin on futures contracts | — | 110 | ||||||
| Other | — | * | — | * | ||||
| Total liabilities | 6,348 | 96,185 | ||||||
| Net assets at October 31, 2021 | $ | 181,719 | $ | 640,395 | ||||
| Net assets consist of: | ||||||||
| Capital paid in on shares of beneficial interest | $ | 179,935 | $ | 638,411 | ||||
| Total distributable earnings | 1,784 | 1,984 | ||||||
| Net assets at October 31, 2021 | $ | 181,719 | $ | 640,395 | ||||
| Investment securities, at cost: | ||||||||
| Unaffiliated issuers | $ | 182,583 | $ | 604,809 | ||||
| Affiliated issuers | — | 63,954 | ||||||
| Shares outstanding | 17,655 | 62,511 | ||||||
| Net asset value per share | $ | 10.29 | $ | 10.24 | ||||
| * | Amount less than one thousand. |
See notes to financial statements.
| Private Client Services Funds | 83 |
| Financial statements (continued) | |
| Statements of operations for the year ended October 31, 2021 | (dollars in thousands) |
| Capital Group Core Municipal Fund | Capital Group Short-Term Municipal Fund | Capital Group California Core Municipal Fund | ||||||||||
| Investment income: | ||||||||||||
| Income (net of non-U.S. taxes*): | ||||||||||||
| Dividends from affiliated issuers | $ | — | $ | — | $ | — | ||||||
| Interest from unaffiliated issuers | 10,717 | 2,352 | 9,237 | |||||||||
| 10,717 | 2,352 | 9,237 | ||||||||||
| Fees and expenses*: | ||||||||||||
| Investment advisory services | 1,808 | 501 | 1,597 | |||||||||
| Transfer agent services | 8 | 2 | 8 | |||||||||
| Reports to shareholders | 18 | 7 | 16 | |||||||||
| Registration statement and prospectus | 66 | 38 | 13 | |||||||||
| Trustees’ compensation | 59 | 17 | 53 | |||||||||
| Auditing and legal | 48 | 41 | 47 | |||||||||
| Custodian | 10 | 7 | 10 | |||||||||
| Other | 5 | 1 | 4 | |||||||||
| Total fees and expenses before reimbursements | 2,022 | 614 | 1,748 | |||||||||
| Less reimbursements of fees and expenses: | ||||||||||||
| Miscellaneous fee reimbursements | — | 11 | — | |||||||||
| Total reimbursements of fees and expenses | — | 11 | — | |||||||||
| Total fees and expenses after reimbursements | 2,022 | 603 | 1,748 | |||||||||
| Net investment income | 8,695 | 1,749 | 7,489 | |||||||||
| Net realized gain (loss) and unrealized (depreciation): | ||||||||||||
| Net realized gain (loss) on: | ||||||||||||
| Investments in: | ||||||||||||
| Unaffiliated issuers | 6,067 | 1,008 | 4,100 | |||||||||
| Affiliated issuers | — | — | — | |||||||||
| Futures contracts | (531 | ) | (141 | ) | (327 | ) | ||||||
| 5,536 | 867 | 3,773 | ||||||||||
| Net unrealized (depreciation) appreciation on: | ||||||||||||
| Investments in: | ||||||||||||
| Unaffiliated issuers | (7,884 | ) | (1,874 | ) | (7,709 | ) | ||||||
| Affiliated issuers | — | — | — | |||||||||
| Futures contracts | (8 | ) | (20 | ) | 115 | |||||||
| (7,892 | ) | (1,894 | ) | (7,594 | ) | |||||||
| Net realized gain (loss) and unrealized (depreciation) | (2,356 | ) | (1,027 | ) | (3,821 | ) | ||||||
| Net increase (decrease) in net assets resulting from operations | $ | 6,339 | $ | 722 | $ | 3,668 | ||||||
See end of statements of operations for footnote.
See notes to financial statements.
| 84 | Private Client Services Funds |
| Financial statements (continued) | |
| Statements of operations for the year ended October 31, 2021 (continued) | (dollars in thousands) |
| Capital Group California Short-Term Municipal Fund | Capital Group Core Bond Fund | |||||||
| Investment income: | ||||||||
| Income (net of non-U.S. taxes*): | ||||||||
| Dividends from affiliated issuers | $ | — | $ | 60 | ||||
| Interest from unaffiliated issuers | 1,998 | 9,798 | ||||||
| 1,998 | 9,858 | |||||||
| Fees and expenses*: | ||||||||
| Investment advisory services | 475 | 1,502 | ||||||
| Transfer agent services | 2 | 7 | ||||||
| Reports to shareholders | 7 | 16 | ||||||
| Registration statement and prospectus | 9 | 49 | ||||||
| Trustees’ compensation | 16 | 49 | ||||||
| Auditing and legal | 40 | 48 | ||||||
| Custodian | 7 | 18 | ||||||
| Other | 1 | 4 | ||||||
| Total fees and expenses before reimbursements | 557 | 1,693 | ||||||
| Less reimbursements of fees and expenses: | ||||||||
| Miscellaneous fee reimbursements | — | — | ||||||
| Total fees and expenses after reimbursements | 557 | 1,693 | ||||||
| Net investment income | 1,441 | 8,165 | ||||||
| Net realized gain (loss) and unrealized (depreciation): | ||||||||
| Net realized gain (loss) on: | ||||||||
| Investments in: | ||||||||
| Unaffiliated issuers | 774 | (751 | ) | |||||
| Affiliated issuers | — | (2 | ) | |||||
| Futures contracts | (185 | ) | (54 | ) | ||||
| Swap contracts | — | 193 | ||||||
| 589 | (614 | ) | ||||||
| Net unrealized (depreciation) appreciation on: | ||||||||
| Investments in: | ||||||||
| Unaffiliated issuers | (1,796 | ) | (9,946 | ) | ||||
| Affiliated issuers | — | (4 | ) | |||||
| Futures contracts | 11 | (784 | ) | |||||
| Swap contracts | — | (285 | ) | |||||
| (1,785 | ) | (11,019 | ) | |||||
| Net realized gain (loss) and unrealized (depreciation) | (1,196 | ) | (11,633 | ) | ||||
| Net increase (decrease) in net assets resulting from operations | $ | 245 | $ | (3,468 | ) | |||
| * | Additional information related to non-U.S. taxes and fees and expenses is included in the notes to financial statements. |
See notes to financial statements.
| Private Client Services Funds | 85 |
| Financial statements (continued) | |
| Statements of changes in net assets | (dollars in thousands) |
| Capital Group Core Municipal Fund | Capital Group Short-Term Municipal Fund | Capital Group California Core Municipal Fund | ||||||||||||||||||||||
| Year ended October 31, | Year ended October 31, | Year ended October 31, | ||||||||||||||||||||||
| 2021 | 2020 | 2021 | 2020 | 2021 | 2020 | |||||||||||||||||||
| Operations: | ||||||||||||||||||||||||
| Net investment income | $ | 8,695 | $ | 10,450 | $ | 1,749 | $ | 2,314 | $ | 7,489 | $ | 9,164 | ||||||||||||
| Net realized gain (loss) | 5,536 | 7,512 | 867 | 1,171 | 3,773 | 5,569 | ||||||||||||||||||
| Net unrealized (depreciation) appreciation | (7,892 | ) | 5,054 | (1,894 | ) | 2,079 | (7,594 | ) | 3,519 | |||||||||||||||
| Net increase (decrease) in net assets resulting from operations | 6,339 | 23,016 | 722 | 5,564 | 3,668 | 18,252 | ||||||||||||||||||
| Distributions paid to shareholders | (15,834 | ) | (11,198 | ) | (2,260 | ) | (2,262 | ) | (12,004 | ) | (9,836 | ) | ||||||||||||
| Net capital share transactions | 142,622 | 56,358 | (3,942 | ) | 78,354 | 45,429 | 62,052 | |||||||||||||||||
| Total increase (decrease) in net assets | 133,127 | 68,176 | (5,480 | ) | 81,656 | 37,093 | 70,468 | |||||||||||||||||
| Net assets: | ||||||||||||||||||||||||
| Beginning of year | 651,926 | 583,750 | 208,203 | 126,547 | 627,037 | 556,569 | ||||||||||||||||||
| End of year | $ | 785,053 | $ | 651,926 | $ | 202,723 | $ | 208,203 | $ | 664,130 | $ | 627,037 | ||||||||||||
| Capital Group California Short-Term Municipal Fund | Capital Group Core Bond Fund | |||||||||||||||||||||||
| Year ended October 31, | Year ended October 31, | |||||||||||||||||||||||
| 2021 | 2020 | 2021 | 2020 | |||||||||||||||||||||
| Operations: | ||||||||||||||||||||||||
| Net investment income | $ | 1,441 | $ | 1,969 | $ | 8,165 | $ | 8,989 | ||||||||||||||||
| Net realized gain (loss) | 589 | 898 | (614 | ) | 10,758 | |||||||||||||||||||
| Net unrealized (depreciation) appreciation | (1,785 | ) | 1,043 | (11,019 | ) | 11,281 | ||||||||||||||||||
| Net increase (decrease) in net assets resulting from operations | 245 | 3,910 | (3,468 | ) | 31,028 | |||||||||||||||||||
| Distributions paid to shareholders | (2,083 | ) | (1,955 | ) | (22,116 | ) | (12,105 | ) | ||||||||||||||||
| Net capital share transactions | (15,782 | ) | 33,553 | 102,154 | 68,147 | |||||||||||||||||||
| Total increase (decrease) in net assets | (17,620 | ) | 35,508 | 76,570 | 87,070 | |||||||||||||||||||
| Net assets: | ||||||||||||||||||||||||
| Beginning of year | 199,339 | 163,831 | 563,825 | 476,755 | ||||||||||||||||||||
| End of year | $ | 181,719 | $ | 199,339 | $ | 640,395 | $ | 563,825 | ||||||||||||||||
See notes to financial statements.
| 86 | Private Client Services Funds |
Notes to financial statements
1. Organization
Capital Group Private Client Services Funds (the “series”) is registered under the Investment Company Act of 1940, as amended (the “1940 Act”), as an open-end, diversified management investment company. The series consists of five funds: Capital Group Core Municipal Fund, Capital Group Short-Term Municipal Fund, Capital Group California Core Municipal Fund, Capital Group California Short-Term Municipal Fund and Capital Group Core Bond Fund (each a “fund,” collectively the “funds”). The assets of each fund are segregated, with each fund accounted for separately.
Each fund’s investment objectives are as follows:
Capital Group Core Municipal Fund — Seeks to provide current income exempt from federal income tax and to preserve capital.
Capital Group Short-Term Municipal Fund — Seeks to preserve capital and secondarily to provide current income exempt from federal income tax.
Capital Group California Core Municipal Fund — Seeks to provide current income exempt from federal and California income taxes and to preserve capital.
Capital Group California Short-Term Municipal Fund — Seeks to preserve capital and secondarily to provide current income exempt from federal and California income taxes.
Capital Group Core Bond Fund — Seeks to provide current income and to preserve capital.
2. Significant accounting policies
Each fund is an investment company that applies the accounting and reporting guidance issued in Topic 946 by the U.S. Financial Accounting Standards Board. Each fund’s financial statements have been prepared to comply with U.S. generally accepted accounting principles (“U.S. GAAP”). These principles require the funds’ investment adviser to make estimates and assumptions that affect reported amounts and disclosures. Actual results could differ from those estimates. Subsequent events, if any, have been evaluated through the date of issuance in the preparation of the financial statements. The funds follow the significant accounting policies described in this section, as well as the valuation policies described in the next section on valuation.
Security transactions and related investment income — Security transactions are recorded by the funds as of the date the trades are executed with brokers. Realized gains and losses from security transactions are determined based on the specific identified cost of the securities. In the event a security is purchased with a delayed payment date, the funds will segregate liquid assets sufficient to meet their payment obligations. Dividend income is recognized on the ex-dividend date and interest income is recognized on an accrual basis. Market discounts, premiums and original issue discounts on fixed-income securities are amortized daily over the expected life of the security.
Distributions paid to shareholders — Income dividends and capital gain distributions are recorded on the ex-dividend date.
Currency translation — Assets and liabilities, including investment securities, denominated in currencies other than U.S. dollars are translated into U.S. dollars at the exchange rates supplied by one or more pricing vendors on the valuation date. Purchases and sales of investment securities and income and expenses are translated into U.S. dollars at the exchange rates on the dates of such transactions. The effects of changes in exchange rates on investment securities are included with the net realized gain or loss and net unrealized appreciation or depreciation on investments in the funds’ statements of operations. The realized gain or loss and unrealized appreciation or depreciation resulting from all other transactions denominated in currencies other than U.S. dollars are disclosed separately.
3. Valuation
Capital Research and Management Company (“CRMC”), the funds’ investment adviser, values each fund’s investments at fair value as defined by accounting principles generally accepted in the United State of America. The net asset value per share of each fund is calculated once daily as of the close of regular trading on the New York Stock Exchange, normally 4 p.m. New York time, each day the New York Stock Exchange is open.
| Private Client Services Funds | 87 |
Methods and inputs — The funds’ investment adviser uses the following methods and inputs to establish the fair value of each fund’s assets and liabilities. Use of particular methods and inputs may vary over time based on availability and relevance as market and economic conditions evolve.
Equity securities are generally valued at the official closing price of, or the last reported sale price on, the exchange or market on which such securities are traded, as of the close of business on the day the securities are being valued or, lacking any sales, at the last available bid price. Prices for each security are taken from the principal exchange or market on which the security trades.
Fixed-income securities, including short-term securities, are generally valued at prices obtained from one or more pricing vendors. Vendors value such securities based on one or more of the inputs described in the following table. The table provides examples of inputs that are commonly relevant for valuing particular classes of fixed-income securities in which the funds are authorized to invest. However, these classifications are not exclusive, and any of the inputs may be used to value any other class of fixed-income security.
| Fixed-income class | Examples of standard inputs | |
| All | Benchmark yields, transactions, bids, offers, quotations from dealers and trading systems, new issues, spreads and other relationships observed in the markets among comparable securities; and proprietary pricing models such as yield measures calculated using factors such as cash flows, financial or collateral performance and other reference data (collectively referred to as “standard inputs”) | |
| Corporate bonds, notes & loans; convertible securities | Standard inputs and underlying equity of the issuer | |
| Bonds & notes of governments & government agencies | Standard inputs and interest rate volatilities | |
| Mortgage-backed; asset-backed obligations | Standard inputs and cash flows, prepayment information, default rates, delinquency and loss assumptions, collateral characteristics, credit enhancements and specific deal information | |
| Municipal securities | Standard inputs and, for certain distressed securities, cash flows or liquidation values using a net present value calculation based on inputs that include, but are not limited to, financial statements and debt contracts |
When the funds’ investment adviser deems it appropriate to do so (such as when vendor prices are unavailable or deemed to be not representative), fixed-income securities will be valued in good faith at the mean quoted bid and ask prices that are reasonably and timely available (or bid prices, if ask prices are not available) or at prices for securities of comparable maturity, quality and type. Some securities may be valued based on their effective maturity or average life, which may be shorter than the stated maturity.
Securities with both fixed-income and equity characteristics, or equity securities traded principally among fixed-income dealers, are generally valued in the manner described for either equity or fixed-income securities, depending on which method is deemed most appropriate by the funds’ investment adviser. The Capital Group Central Cash Fund (“CCF”), a fund within the Capital Group Central Fund Series (“Central Funds”), is valued based upon a floating net asset value, which fluctuates with changes in the value of CCF’s portfolio securities. The underlying securities are valued based on the policies and procedures in CCF’s statement of additional information. Exchange-traded futures are generally valued at the official settlement price of the exchange or market on which such instruments are traded, as of the close of business on the day the futures are being valued. Interest rate swaps and credit default swaps are generally valued by pricing vendors based on market inputs that include the index and term of index, reset frequency, payer/receiver, currency and pay frequency.
Securities and other assets for which representative market quotations are not readily available or are considered unreliable by the funds’ investment adviser are fair valued as determined in good faith under fair valuation guidelines adopted by authority of the funds’ board of trustees as further described. The investment adviser follows fair valuation guidelines, consistent with U.S. Securities and Exchange Commission rules and guidance, to consider relevant principles and factors when making fair value determinations. The investment adviser considers relevant indications of value that are reasonably and timely available to it in determining the fair value to be assigned to a particular security, such as the type and cost of the security; contractual or legal restrictions on resale of the security; relevant financial or business developments of the issuer; actively traded similar or related securities; conversion or exchange rights on the security; related corporate actions; significant events occurring after the close of trading in the security; and changes in overall market conditions. In addition, the closing prices of equity securities that trade in markets outside U.S. time zones may be adjusted to reflect significant events that occur after the close of local trading but before the net asset value of each of the funds is determined. Fair valuations and valuations of investments that are not actively trading involve judgment and may differ materially from valuations that would have been used had greater market activity occurred.
| 88 | Private Client Services Funds |
Processes and structure — The funds’ board of trustees has delegated authority to the funds’ investment adviser to make fair value determinations, subject to board oversight. The investment adviser has established a Joint Fair Valuation Committee (the “Fair Valuation Committee”) to administer, implement and oversee the fair valuation process, and to make fair value decisions. The Fair Valuation Committee regularly reviews its own fair value decisions, as well as decisions made under its standing instructions to the investment adviser’s valuation teams. The Fair Valuation Committee reviews changes in fair value measurements from period to period and may, as deemed appropriate, update the fair valuation guidelines to better reflect the results of back testing and address new or evolving issues. The Fair Valuation Committee reports any changes to the fair valuation guidelines to the board of trustees. The funds’ board and audit committee also regularly review reports that describe fair value determinations and methods.
The funds’ investment adviser has also established a Fixed-Income Pricing Review Group to administer and oversee the fixed-income valuation process, including the use of fixed-income pricing vendors. This group regularly reviews pricing vendor information and market data. Pricing decisions, processes and controls over security valuation are also subject to additional internal reviews facilitated by the investment adviser’s global risk management group.
Classifications — The funds’ investment adviser classifies each fund’s assets and liabilities into three levels based on the inputs used to value the assets or liabilities. Level 1 values are based on quoted prices in active markets for identical securities. Level 2 values are based on significant observable market inputs, such as quoted prices for similar securities and quoted prices in inactive markets. Certain securities trading outside the U.S. may transfer between Level 1 and Level 2 due to valuation adjustments resulting from significant market movements following the close of local trading. Level 3 values are based on significant unobservable inputs that reflect the investment adviser’s determination of assumptions that market participants might reasonably use in valuing the securities. The valuation levels are not necessarily an indication of the risk or liquidity associated with the underlying investment. For example, U.S. government securities are reflected as Level 2 because the inputs used to determine fair value may not always be quoted prices in an active market. The funds’ valuation levels as of October 31, 2021 are as follows (dollars in thousands):
Capital Group Core Municipal Fund
| Investment securities | ||||||||||||||||
| Level 1 | Level 2 | Level 3 | Total | |||||||||||||
| Assets: | ||||||||||||||||
| Bonds, notes & other debt instruments: | ||||||||||||||||
| Municipals | $ | — | $ | 644,756 | $ | — | $ | 644,756 | ||||||||
| Short-term securities | — | 147,980 | — | 147,980 | ||||||||||||
| Total | $ | — | $ | 792,736 | $ | — | $ | 792,736 | ||||||||
| Other investments* | ||||||||||||||||
| Level 1 | Level 2 | Level 3 | Total | |||||||||||||
| Assets: | ||||||||||||||||
| Unrealized appreciation on futures contracts | $ | 51 | $ | — | $ | — | $ | 51 | ||||||||
| Liabilities: | ||||||||||||||||
| Unrealized depreciation on futures contracts | (58 | ) | — | — | (58 | ) | ||||||||||
| Total | $ | (7 | ) | $ | — | $ | — | $ | (7 | ) | ||||||
| * | Futures contracts are not included in the fund’s investment portfolio. |
Capital Group Short-Term Municipal Fund
| Investment securities | ||||||||||||||||
| Level 1 | Level 2 | Level 3 | Total | |||||||||||||
| Assets: | ||||||||||||||||
| Bonds, notes & other debt instruments: | ||||||||||||||||
| Municipals | $ | — | $ | 165,941 | $ | — | $ | 165,941 | ||||||||
| Short-term securities | — | 38,098 | — | 38,098 | ||||||||||||
| Total | $ | — | $ | 204,039 | $ | — | $ | 204,039 | ||||||||
| Other investments* | ||||||||||||||||
| Level 1 | Level 2 | Level 3 | Total | |||||||||||||
| Liabilities: | ||||||||||||||||
| Unrealized depreciation on futures contracts | $ | (23 | ) | $ | — | $ | — | $ | (23 | ) | ||||||
| * | Futures contracts are not included in the fund’s investment portfolio. |
| Private Client Services Funds | 89 |
Capital Group California Core Municipal Fund
| Investment securities | ||||||||||||||||
| Level 1 | Level 2 | Level 3 | Total | |||||||||||||
| Assets: | ||||||||||||||||
| Bonds, notes & other debt instruments: | ||||||||||||||||
| Municipals | $ | — | $ | 563,774 | $ | — | $ | 563,774 | ||||||||
| Short-term securities | — | 90,603 | — | 90,603 | ||||||||||||
| Total | $ | — | $ | 654,377 | $ | — | $ | 654,377 | ||||||||
| Other investments* | ||||||||||||||||
| Level 1 | Level 2 | Level 3 | Total | |||||||||||||
| Assets: | ||||||||||||||||
| Unrealized appreciation on futures contracts | $ | 94 | $ | — | $ | — | $ | 94 | ||||||||
| * | Futures contracts are not included in the fund’s investment portfolio. |
Capital Group California Short-Term Municipal Fund
At October 31, 2021, all of the fund’s investment securities were classified as Level 2.
Capital Group Core Bond Fund
| Investment securities | ||||||||||||||||
| Level 1 | Level 2 | Level 3 | Total | |||||||||||||
| Assets: | ||||||||||||||||
| Bonds, notes & other debt instruments: | ||||||||||||||||
| U.S. Treasury bonds & notes | $ | — | $ | 253,040 | $ | — | $ | 253,040 | ||||||||
| Corporate bonds, notes & loans | — | 176,738 | — | 176,738 | ||||||||||||
| Mortgage-backed obligations | — | 78,358 | — | 78,358 | ||||||||||||
| Asset-backed obligations | — | 66,983 | — | 66,983 | ||||||||||||
| Federal agency bonds & notes | — | 17,569 | — | 17,569 | ||||||||||||
| Bonds & notes of governments & government agencies outside the U.S. | — | 16,089 | — | 16,089 | ||||||||||||
| Municipals | — | 3,989 | — | 3,989 | ||||||||||||
| Short-term securities | 63,951 | — | — | 63,951 | ||||||||||||
| Total | $ | 63,951 | $ | 612,766 | $ | — | $ | 676,717 | ||||||||
| Other investments* | ||||||||||||||||
| Level 1 | Level 2 | Level 3 | Total | |||||||||||||
| Assets: | ||||||||||||||||
| Unrealized appreciation on futures contracts | $ | 649 | $ | — | $ | — | $ | 649 | ||||||||
| Liabilities: | ||||||||||||||||
| Unrealized depreciation on futures contracts | (1,156 | ) | — | — | (1,156 | ) | ||||||||||
| Total | $ | (507 | ) | $ | — | $ | — | $ | (507 | ) | ||||||
| * | Futures contracts are not included in the fund’s investment portfolio. |
4. Risk factors
Investing in the funds may involve certain risks including, but not limited to, those described below.
Market conditions — The prices of, and the income generated by, the securities held by the fund may decline — sometimes rapidly or unpredictably – due to various factors, including events or conditions affecting the general economy or particular industries; overall market changes; local, regional or global political, social or economic instability; governmental, governmental agency or central bank responses to economic conditions; and currency exchange rate, interest rate and commodity price fluctuations.
| 90 | Private Client Services Funds |
Economies and financial markets throughout the world are highly interconnected. Economic, financial or political events, trading and tariff arrangements, wars, terrorism, cybersecurity events, natural disasters, public health emergencies (such as the spread of infectious disease) and other circumstances in one country or region, including actions taken by governmental or quasi-governmental authorities in response to any of the foregoing, could have impacts on global economies or markets. As a result, whether or not the fund invests in securities of issuers located in or with significant exposure to the countries affected, the value and liquidity of the fund’s investments may be negatively affected by developments in other countries and regions.
Issuer risks — The prices of, and the income generated by, securities held by the fund may decline in response to various factors directly related to the issuers of such securities, including reduced demand for an issuer’s goods or services, poor management performance, major litigation, investigations or other controversies related to the issuer, changes in government regulations affecting the issuer or its competitive environment and strategic initiatives such as mergers, acquisitions or dispositions and the market response to any such initiatives.
Investing in debt instruments — The prices of, and the income generated by, bonds and other debt securities held by the fund may be affected by factors such as the interest rates, maturities and credit ratings of these securities.
Rising interest rates will generally cause the prices of bonds and other debt securities to fall. A general rise in interest rates may cause investors to sell debt securities on a large scale, which could also adversely affect the price and liquidity of debt securities and could also result in increased redemptions from the fund. Falling interest rates may cause an issuer to redeem, call or refinance a debt security before its stated maturity, which may result in the fund failing to recoup the full amount of its initial investment and having to reinvest the proceeds in lower yielding securities. Longer maturity debt securities generally have greater sensitivity to changes in interest rates and may be subject to greater price fluctuations than shorter maturity debt securities.
Bonds and other debt securities are also subject to credit risk, which is the possibility that the credit strength of an issuer or guarantor will weaken or be perceived to be weaker, and/or an issuer of a debt security will fail to make timely payments of principal or interest and the security will go into default. A downgrade or default affecting any of the fund’s securities could cause the value of the fund’s shares to decrease. Credit risk is gauged, in part, by the credit ratings of the debt securities in which the fund invests. However, ratings are only the opinions of the rating agencies issuing them and are not guarantees as to credit quality or an evaluation of market risk. The fund’s investment adviser relies on its own credit analysts to research issuers and issues in seeking to assess credit and default risks.
Credit and liquidity support — Changes in the credit quality of banks and financial institutions providing credit and liquidity support features with respect to securities held by the fund could cause the values of these securities to decline.
Investing in lower rated debt instruments — Lower rated bonds and other lower rated debt securities generally have higher rates of interest and involve greater risk of default or price declines due to changes in the issuer’s creditworthiness than those of higher quality debt securities. The market prices of these securities may fluctuate more than the prices of higher quality debt securities and may decline significantly in periods of general economic difficulty.
Liquidity risk — Certain fund holdings may be or may become difficult or impossible to sell, particularly during times of market turmoil. Liquidity may be impacted by the lack of an active market for a holding, legal or contractual restrictions on resale, or the reduced number and capacity of market participants to make a market in such holding. Market prices for less liquid or illiquid holdings may be volatile, and reduced liquidity may have an adverse impact on the market price of such holdings. Additionally, the sale of less liquid or illiquid holdings may involve substantial delays (including delays in settlement) and additional costs and the fund may be unable to sell such holdings when necessary to meet its liquidity needs or may be forced to sell at a loss.
Investing in similar municipal bonds — Investing significantly in municipal obligations of multiple issuers in the same state or backed by revenues of similar types of projects or industries may make the fund more susceptible to certain economic, political or regulatory occurrences. As a result, the fund has greater risk of volatility, and greater risk of loss, from these investments.
Investing in municipal bonds of issuers within the state of California — Because Capital Group California Core Municipal Fund and Capital Group California Short-Term Municipal Fund invest primarily in securities of issuers within the state of California, these funds are more susceptible to factors adversely affecting issuers of California securities than a comparable municipal bond mutual fund that does not concentrate its investments in a single state. For example, in the past, California voters have passed amendments to the state’s constitution and other measures that limit the taxing and spending authority of California governmental entities, and future voter initiatives may adversely affect California municipal bonds.
| Private Client Services Funds | 91 |
Investing in mortgage-related and other asset-backed securities — Mortgage-related securities, such as mortgage-backed securities, and other asset-backed securities, include debt obligations that represent interests in pools of mortgages or other income-bearing assets, such as consumer loans or receivables. While such securities are subject to the risks associated with investments in debt instruments generally (for example, credit, extension and interest rate risks), they are also subject to other and different risks. Mortgage-backed and other asset-backed securities are subject to changes in the payment patterns of borrowers of the underlying debt, potentially increasing the volatility of the securities and the fund’s net asset value. When interest rates fall, borrowers are more likely to refinance or prepay their debt before its stated maturity. This may result in the fund having to reinvest the proceeds in lower yielding securities, effectively reducing the fund’s income. Conversely, if interest rates rise and borrowers repay their debt more slowly than expected, the time in which the mortgage-backed and other asset-backed securities are paid off could be extended, reducing the fund’s cash available for reinvestment in higher yielding securities. Mortgage-backed securities are also subject to the risk that underlying borrowers will be unable to meet their obligations and the value of property that secures the mortgages may decline in value and be insufficient, upon foreclosure, to repay the associated loans. Investments in asset-backed securities are subject to similar risks.
Investing in securities backed by the U.S. government — Securities backed by the U.S. Treasury or the full faith and credit of the U.S. government are guaranteed only as to the timely payment of interest and principal when held to maturity. Accordingly, the current market values for these securities will fluctuate with changes in interest rates and the credit rating of the U.S. government. Securities issued by U.S. government-sponsored entities and federal agencies and instrumentalities that are not backed by the full faith and credit of the U.S. government are neither issued nor guaranteed by the U.S. government.
Management — The investment adviser to the fund actively manages the fund’s investments. Consequently, the fund is subject to the risk that the methods and analyses, including models, tools and data, employed by the investment adviser in this process may be flawed or incorrect and may not produce the desired results. This could cause the fund to lose value or its investment results to lag relevant benchmarks or other funds with similar objectives.
5. Certain investment techniques
Index-linked bonds — Capital Group Core Bond Fund has invested in index-linked bonds, which are fixed-income securities whose principal value is periodically adjusted to a government price index. Over the life of an index-linked bond, interest is paid on the adjusted principal value. Increases or decreases in the principal value of index-linked bonds are recorded as interest income in the fund’s statement of operations.
Mortgage dollar rolls — Capital Group Core Bond Fund has entered into mortgage dollar roll transactions in which the fund sells a mortgage-backed security to a counterparty and simultaneously enters into an agreement with the same counterparty to buy back a similar security on a specific future date at a predetermined price. Mortgage dollar rolls are accounted for as purchase and sale transactions, which may increase the funds’ portfolio turnover rates.
Futures contracts — Each fund has entered into futures contracts, which provide for the future sale by one party and purchase by another party of a specified amount of a specific financial instrument for a specified price, date, time and place designated at the time the contract is made. Futures contracts are used to strategically manage portfolio volatility and downside equity risk.
Upon entering into futures contracts, and to maintain the fund’s open positions in futures contracts, the fund is required to deposit with a futures broker, known as a futures commission merchant (“FCM”), in a segregated account in the name of the FCM an amount of cash, U.S. government securities or other liquid securities, known as initial margin. The margin required for a particular futures contract is set by the exchange on which the contract is traded to serve as collateral, and may be significantly modified from time to time by the exchange during the term of the contract.
On a daily basis, each fund pays or receives variation margin based on the increase or decrease in the value of the futures contracts and records variation margin on futures contracts in each fund’s statement of assets and liabilities. In addition, each fund segregates liquid assets equivalent to the fund’s outstanding obligations under the contract in excess of the initial margin and variation margin, if any. Futures contracts may involve a risk of loss in excess of the variation margin shown on each fund’s statement of assets and liabilities. Each fund records realized gains or losses at the time the futures contract is closed or expires. Net realized gains or losses and net unrealized appreciation or depreciation from futures contracts are recorded in each fund’s statement of operations.
| 92 | Private Client Services Funds |
Interest rate swaps — Capital Group Core Bond Fund has entered into interest rate swaps, which are agreements to exchange one stream of future interest payments for another based on a specified notional amount. Typically, interest rate swaps exchange a fixed interest rate for a payment that floats relative to a benchmark or vice versa. The series’ investment adviser uses interest rate swaps to manage the interest rate sensitivity of the fund by increasing or decreasing the duration of the fund or a portion of the fund’s portfolio. Risks may arise as a result of the series’ investment adviser incorrectly anticipating changes in interest rates, increased volatility, reduced liquidity and the potential inability of counterparties to meet the terms of their agreements.
Upon entering into an interest rate swap contract, the fund is required to deposit cash, U.S. government securities or other liquid securities, which is known as initial margin. Generally, the initial margin required for a particular interest rate swap is set and held as collateral by the clearinghouse on which the contract is cleared. The amount of initial margin required may be significantly modified from time to time by the clearinghouse during the term of the contract.
On a daily basis, the fund records daily interest accruals related to the exchange of future payments as a receivable and payable in the fund’s statement of assets and liabilities. The fund also pays or receives a variation margin based on the increase or decrease in the value of the interest rate swaps, including accrued interest, and records variation margin on interest rate swaps in the fund’s statement of assets and liabilities. The fund records realized gains and losses on both the net accrued interest and any gain or loss recognized at the time the interest rate swap is closed or expires. Net realized gains or losses, as well as any net unrealized appreciation or depreciation, from interest rate swaps are recorded in the fund’s statement of operations.
Credit default swap indices — Capital Group Core Bond Fund has entered into centrally cleared credit default swap agreements on credit indices (“CDSI”) that involve one party (the protection buyer) making a stream of payments to another party (the protection seller) in exchange for the right to receive a specified return upon the occurrence of a credit event, such as a default or restructuring, with respect to any of the underlying issuers (reference obligations) in the referenced index. The series’ investment adviser uses credit default swaps to assume exposure to a diversified portfolio of credits or to hedge against existing credit risks.
CDSI are portfolios of credit instruments or exposures designed to be representative of some part of the credit market, such as the high-yield or investment-grade credit market. CDSI are generally traded using standardized terms, including a fixed spread and standard maturity dates, and reference all the names in the index. If there is a credit event, it is settled based on that name’s weight in the index. The composition of the underlying issuers or obligations within a particular index may change periodically, usually every six months. A specified credit event may affect all or individual underlying reference obligations included in the index, and will be settled based upon the relative weighting of the affected obligation(s) within the index. The value of each CDSI can be used as a measure of the current payment/performance risk of the CDSI and represents the likelihood of an expected liability or profit should the notional amount of the CDSI be closed or sold as of the period end. An increasing value, as compared to the notional amount of the CDSI, represents a deterioration of the referenced indices’ credit soundness and a greater likelihood of risk of default or other credit event occurring as defined under the terms of the agreement. When the fund provides sell protection, its maximum exposure is the notional amount of the credit default swap agreement.
Upon entering into a centrally cleared CDSI contract, the fund is required to deposit with a derivatives clearing member (“DCM”) in a segregated account in the name of the DCM an amount of cash, U.S. government securities or other liquid securities, which is known as initial margin. Generally, the initial margin required for a particular credit default swap is set and held as collateral by the clearinghouse on which the contract is cleared. The amount of initial margin required may be significantly modified from time to time by the clearinghouse during the term of the contract.
On a daily basis, interest accruals related to the exchange of future payments are recorded as a receivable and payable in the fund’s statement of assets and liabilities. The fund also pays or receives a variation margin based on the increase or decrease in the value of the CDSI, and records variation margin in the fund’s statement of assets and liabilities. The fund records realized gains and losses on both the net accrued interest and any gain or loss recognized at the time the swap is closed or expires. Net realized gains or losses, as well as any net unrealized appreciation or depreciation, from credit default swaps are recorded in the fund’s statement of operations.
| Private Client Services Funds | 93 |
The following table presents the average month-end notional amounts of futures contracts, interest rate swaps and credit default swaps while held for each fund (dollars in thousands):
| Futures contracts | Interest rate swaps | Credit default swaps | ||||||||||
| Capital Group Core Municipal Fund | $23,692 | Not applicable | Not applicable | |||||||||
| Capital Group Short-Term Municipal Fund | 5,167 | Not applicable | Not applicable | |||||||||
| Capital Group California Core Municipal Fund | 22,667 | Not applicable | Not applicable | |||||||||
| Capital Group California Short-Term Municipal | 5,420 | * | Not applicable | Not applicable | ||||||||
| Capital Group Core Bond Fund | 231,375 | $53,620 | * | $25,000 | * | |||||||
| * | No contracts were held at the end of the reporting period; amount represents the average month-end notional amount of contracts while they were held. |
The following tables identify the location and fair value amounts on the funds’ statements of assets and liabilities and/or the effect on the funds’ statements of operations resulting from the funds’ use of futures contracts, interest rate swaps and credit default swaps as of, or for the year ended, October 31, 2021 (dollars in thousands):
Capital Group Core Municipal Fund
| Assets | Liabilities | |||||||||||||
| Contracts | Risk type | Location on statement of assets and liabilities | Value | Location on statement of assets and liabilities | Value | |||||||||
| Futures | Interest | Unrealized appreciation* | $ | 51 | Unrealized depreciation* | $ | 58 | |||||||
| Net realized loss | Net unrealized depreciation | |||||||||||||
| Contracts | Risk type | Location on statement of operations | Value | Location on statement of operations | Value | |||||||||
| Futures | Interest | Net realized loss on futures contracts | $ | (531 | ) | Net unrealized depreciation on futures contracts | $ | (8 | ) | |||||
Capital Group Short-Term Municipal Fund
| Assets | Liabilities | |||||||||||||
| Contracts | Risk type | Location on statement of assets and liabilities | Value | Location on statement of assets and liabilities | Value | |||||||||
| Futures | Interest | Unrealized appreciation* | $ | — | Unrealized depreciation* | $ | 23 | |||||||
| Net realized loss | Net unrealized depreciation | |||||||||||||
| Contracts | Risk type | Location on statement of operations | Value | Location on statement of operations | Value | |||||||||
| Futures | Interest | Net realized loss on futures contracts | $ | (141 | ) | Net unrealized depreciation on futures contracts | $ | (20 | ) | |||||
See end of tables for footnote.
| 94 | Private Client Services Funds |
| Capital Group California Core Municipal Fund |
| Assets | Liabilities | |||||||||||||
| Contracts | Risk type | Location on statement of assets and liabilities | Value | Location on statement of assets and liabilities | Value | |||||||||
| Futures | Interest | Unrealized appreciation* | $ | 94 | Unrealized depreciation* | $ | — | |||||||
| Net realized loss | Net unrealized appreciation | |||||||||||||
| Contracts | Risk type | Location on statement of operations | Value | Location on statement of operations | Value | |||||||||
| Futures | Interest | Net realized loss on futures contracts | $ | (327 | ) | Net unrealized appreciation on futures contracts | $ | 115 | ||||||
Capital Group California Short-Term Municipal Fund
| Net realized loss | Net unrealized appreciation | |||||||||||||
| Contracts | Risk type | Location on statement of operations | Value | Location on statement of operations | Value | |||||||||
| Futures | Interest | Net realized loss on futures contracts | $ | (185 | ) | Net unrealized appreciation on futures contracts | $ | 11 | ||||||
Capital Group Core Bond Fund
| Assets | Liabilities | |||||||||||||
| Contracts | Risk type | Location on statement of assets and liabilities | Value | Location on statement of assets and liabilities | Value | |||||||||
| Futures | Interest | Unrealized appreciation* | $ | 649 | Unrealized depreciation* | $ | 1,156 | |||||||
| Net realized (loss) gain | Net unrealized (depreciation) appreciation | |||||||||||||
| Contracts | Risk type | Location on statement of operations | Value | Location on statement of operations | Value | |||||||||
| Futures | Interest | Net realized loss on futures contracts | $ | (54 | ) | Net unrealized depreciation on futures contracts | $ | (784 | ) | |||||
| Swap | Interest | Net realized gain on swap contracts | 575 | Net unrealized depreciation on swap contracts | (285 | ) | ||||||||
| Swap | Credit | Net realized loss on swap contracts | (382 | ) | Net unrealized appreciation on swap contracts | — | ||||||||
| $ | 139 | $ | (1,069 | ) | ||||||||||
| * | Includes cumulative appreciation/depreciation on futures contracts as reported in the applicable table following each fund’s investment portfolio. Only current day’s variation margin is reported within each fund’s statement of assets and liabilities. |
Collateral — Each fund participates in a collateral program that calls for the funds to either receive or pledge highly liquid assets, such as cash or U.S. government securities, as collateral due to their use of futures contracts, interest rate swaps, credit default swaps and/or future delivery contracts. For futures contracts, interest rate swaps and credit default swaps, the program calls for the fund to pledge collateral for initial and variation margin by contract. For future delivery contracts, the program calls for the fund to either receive or pledge collateral based on the net gain or loss on unsettled contracts by certain counterparties. The purpose of the collateral is to cover potential losses that could occur in the event that either party cannot meet its contractual obligations. Non-cash collateral pledged by the fund, if any, is disclosed in the fund’s investment portfolio, and cash collateral pledged by the fund, if any, is held in a segregated account with the fund’s custodian, which is reflected as pledged cash collateral in each fund’s statement of assets and liabilities.
| Private Client Services Funds | 95 |
6. Taxation and distributions
Federal income taxation — Each fund complies with the requirements under Subchapter M of the Internal Revenue Code applicable to mutual funds and each intends to distribute substantially all of its net income and net capital gains each year. The funds are not subject to income taxes to the extent taxable income and net capital gains are distributed. Therefore, no federal income tax provision is required.
As of and during the year ended October 31, 2021, none of the funds had a liability for any unrecognized tax benefits. Each fund recognizes interest and penalties, if any, related to unrecognized tax benefits as income tax expense in their respective statements of operations. During the period, none of the funds incurred any significant interest or penalties.
Each fund’s tax returns are generally not subject to examination by federal, state and, if applicable, non-U.S. tax authorities after the expiration of each jurisdiction’s statute of limitations, which is typically three years after the date of filing but can be extended in certain jurisdictions.
Distributions — Distributions determined on a tax basis may differ from net investment income and net realized gains for financial reporting purposes. These differences are due primarily to different treatment for items such as short-term capital gains and losses; capital losses related to sales of certain securities within 30 days of purchase; income on certain investments; amortization of premiums and discounts; paydowns on fixed-income securities; net capital losses and cost of investments sold. The fiscal year in which amounts are distributed may differ from the year in which the net investment income and net realized gains are recorded by the funds for financial reporting purposes. The funds may also designate a portion of the amount paid to redeeming shareholders as a distribution for tax purposes.
Additional tax basis disclosures for each fund as of October 31, 2021, were as follows (dollars in thousands):
| Capital Group Core Municipal Fund | Capital Group Short-Term Municipal Fund | Capital Group California Core Municipal Fund | Capital Group California Short-Term Municipal Fund | Capital Group Core Bond Fund | ||||||||||||||||
| Undistributed ordinary income | $ | 2,465 | $ | 535 | $ | 1,100 | $ | 112 | $ | 99 | ||||||||||
| Undistributed tax-exempt income | 90 | 26 | 889 | 9 | — | |||||||||||||||
| Undistributed long-term capital gains | 2,811 | — | 2,586 | 405 | — | |||||||||||||||
| Capital loss carryforward* | — | — | — | — | (3,316 | ) | ||||||||||||||
| Gross unrealized appreciation on investments | 12,158 | 1,795 | 12,294 | 1,546 | 11,906 | |||||||||||||||
| Gross unrealized depreciation on investments | (2,410 | ) | (272 | ) | (1,612 | ) | (287 | ) | (4,024 | ) | ||||||||||
| Net unrealized appreciation on investments | 9,748 | 1,523 | 10,682 | 1,259 | 7,882 | |||||||||||||||
| Cost of investments | 782,981 | 202,493 | 643,789 | 182,581 | 668,328 | |||||||||||||||
| Reclassification from total distributable earnings/accumulated loss to capital paid in on shares of beneficial interest | 254 | 337 | 177 | 126 | (1 | ) | ||||||||||||||
| * | Each fund’s capital loss carryforwards will be used to offset any capital gains realized by each fund in future years. Each fund will not make distributions from capital gains while a capital loss carryforward remains. |
| 96 | Private Client Services Funds |
Distributions paid by each fund were characterized for tax purposes as follows (dollars in thousands):
| Year ended October 31, 2021 | ||||||||||||||||
| Tax-exempt income | Ordinary income | Long-term capital gains | Total distributions paid | |||||||||||||
| Capital Group Core Municipal Fund | $ | 8,677 | $ | 2,349 | $ | 4,808 | $ | 15,834 | ||||||||
| Capital Group Short-Term Municipal Fund | 1,747 | 513 | — | 2,260 | ||||||||||||
| Capital Group California Core Municipal Fund | 6,692 | 841 | 4,471 | 12,004 | ||||||||||||
| Capital Group California Short-Term Municipal Fund | 1,439 | 117 | 527 | 2,083 | ||||||||||||
| Capital Group Core Bond Fund | — | 15,330 | 6,786 | 22,116 | ||||||||||||
| Year ended October 31, 2020 | ||||||||||||||||
| Tax-exempt income | Ordinary income | Long-term capital gains | Total distributions paid | |||||||||||||
| Capital Group Core Municipal Fund | $ | 10,394 | $ | 620 | $ | 184 | $ | 11,198 | ||||||||
| Capital Group Short-Term Municipal Fund | 2,262 | — | — | 2,262 | ||||||||||||
| Capital Group California Core Municipal Fund | 9,118 | 565 | 153 | 9,836 | ||||||||||||
| Capital Group California Short-Term Municipal Fund | 1,955 | — | — | 1,955 | ||||||||||||
| Capital Group Core Bond Fund | — | 10,989 | 1,116 | 12,105 | ||||||||||||
7. Fees and transactions with related parties
CRMC, the funds’ investment adviser, is the parent company of American Funds Service Company® (“AFS”), the funds’ transfer agent. CRMC and AFS are considered related parties to each fund.
Investment advisory services — Each fund has an investment advisory and service agreement with CRMC that provides for monthly fees accrued daily. The fee for Capital Group Core Municipal Fund, Capital Group Short-Term Municipal Fund, Capital Group California Core Municipal Fund, Capital Group California Short-Term Municipal Fund and Capital Group Core Bond Fund is 0.25% of the daily net assets of each fund.
Transfer agent services — Each fund has a shareholder services agreement with AFS under which each fund compensates AFS for providing transfer agent services. These services include recordkeeping, shareholder communications and transaction processing. In addition, each fund reimburses AFS for amounts paid to third parties for performing transfer agent services on behalf of fund shareholders.
Miscellaneous fee reimbursements — CRMC has agreed to reimburse a portion of miscellaneous fees and expenses for Capital Group Short-Term Municipal Fund to limit the fund’s total annual operating expenses to 0.30% (as a percentage of daily net assets). Miscellaneous expenses exclude investment advisory services fees. These reimbursements may be adjusted or discontinued by CRMC, subject to any restrictions in the series’ prospectus. For the year ended October 31, 2021, total fees and expenses reimbursed by CRMC were $11,000 for Capital Group Short-Term Municipal Fund. CRMC will not recoup all or a portion of these reimbursements. Fees and expenses in each fund’s statement of operations are presented gross of any reimbursements from CRMC.
Affiliated officers and trustees — Officers and certain trustees of the series are or may be considered to be affiliated with CRMC. No affiliated officers or trustees received any compensation directly from the series.
Investment in CCF — Capital Group Core Bond Fund holds shares of CCF, an institutional prime money market fund managed by CRMC. CCF invests in high-quality, short-term money market instruments and is used as the primary investment vehicle for the fund’s short-term investments. CCF shares are only available for purchase by CRMC, its affiliates, and other funds managed by CRMC. CCF shares are not available to the public. CRMC does not receive an investment advisory services fee from CCF.
Security transactions with related funds — The funds may purchase from, or sell securities to, other CRMC-managed funds (or accounts managed by certain affiliates of CRMC) under procedures adopted by the funds’ board of trustees. The funds involved in such transactions are considered related by virtue of having a common investment adviser (or affiliated investment advisers), common trustees and/or common officers. When such transactions occur, each transaction is executed at the current market price of the security and no brokerage commissions or fees are paid in accordance with Rule 17a-7 of the 1940 Act.
| Private Client Services Funds | 97 |
The following table presents purchase and sales transactions, if any, between each fund and related funds and the net realized gains from such sales as of October 31, 2021 (dollars in thousands):
| Fund | Purchases | Sales | Net realized gain | |||||||||
| Capital Group Core Municipal Fund | $ | 5 | $ | 1,320 | $ | 25 | ||||||
| Capital Group Short-Term Municipal Fund | 97 | 355 | 14 | |||||||||
| Capital Group California Core Municipal Fund | 2,215 | 13,115 | 635 | |||||||||
| Capital Group California Short-Term Municipal Fund | 2,437 | 4,567 | 148 | |||||||||
| Capital Group Core Bond Fund | — | 1,194 | 39 | |||||||||
Interfund lending — Pursuant to an exemptive order issued by the SEC, the funds, along with other CRMC-managed funds (or funds managed by certain affiliates of CRMC), may participate in an interfund lending program. The program provides an alternate credit facility that permits the funds to lend or borrow cash for temporary purposes directly to or from one another, subject to the conditions of the exemptive order. The funds did not lend or borrow cash through the interfund lending program at any time during the year ended ended October 31, 2021.
8. Indemnifications
The series’ organizational documents provide board members and officers with indemnification against certain liabilities or expenses in connection with the performance of their duties to the series. In the normal course of business, the series may also enter into contracts that provide general indemnifications. Each fund’s maximum exposure under these arrangements is unknown since it is dependent on future claims that may be made against the series. The risk of material loss from such claims is considered remote. Insurance policies are also available to the series’ board members and officers.
9. Capital share transactions
Capital share transactions in the funds were as follows (dollars and shares in thousands):
| Sales | Reinvestment of distributions | Repurchases | Net increase (decrease) | |||||||||||||||||||||||||||||
| Fund | Amount | Shares | Amount | Shares | Amount | Shares | Amount | Shares | ||||||||||||||||||||||||
| Year ended October 31, 2021 | ||||||||||||||||||||||||||||||||
| Capital Group Core Municipal Fund | $ | 191,931 | 17,895 | $ | 15,789 | 1,472 | $ | (65,098 | ) | (6,065 | ) | $ | 142,622 | 13,302 | ||||||||||||||||||
| Capital Group Short-Term Municipal Fund | 135,966 | 13,169 | 2,260 | 219 | (142,168 | ) | (13,767 | ) | (3,942 | ) | (379 | ) | ||||||||||||||||||||
| Capital Group California Core Municipal Fund | 103,909 | 9,577 | 12,004 | 1,106 | (70,484 | ) | (6,480 | ) | 45,429 | 4,203 | ||||||||||||||||||||||
| Capital Group California Short-Term Municipal Fund | 68,363 | 6,590 | 2,083 | 201 | (86,228 | ) | (8,316 | ) | (15,782 | ) | (1,525 | ) | ||||||||||||||||||||
| Capital Group Core Bond Fund | 109,167 | 10,477 | 21,938 | 2,097 | (28,951 | ) | (2,773 | ) | 102,154 | 9,801 | ||||||||||||||||||||||
| Year ended October 31, 2020 | ||||||||||||||||||||||||||||||||
| Capital Group Core Municipal Fund | $ | 106,929 | 10,012 | $ | 11,142 | 1,046 | $ | (61,713 | ) | (5,824 | ) | $ | 56,358 | 5,234 | ||||||||||||||||||
| Capital Group Short-Term Municipal Fund | 154,195 | 15,083 | 2,262 | 221 | (78,103 | ) | (7,630 | ) | 78,354 | 7,674 | ||||||||||||||||||||||
| Capital Group California Core Municipal Fund | 106,925 | 9,888 | 9,834 | 910 | (54,707 | ) | (5,130 | ) | 62,052 | 5,668 | ||||||||||||||||||||||
| Capital Group California Short-Term Municipal Fund | 111,175 | 10,735 | 1,955 | 189 | (79,577 | ) | (7,685 | ) | 33,553 | 3,239 | ||||||||||||||||||||||
| Capital Group Core Bond Fund | 97,338 | 9,219 | 11,994 | 1,147 | (41,185 | ) | (3,901 | ) | 68,147 | 6,465 | ||||||||||||||||||||||
| 98 | Private Client Services Funds |
10. Investment transactions
The funds made purchases and sales of investment securities during the year ended October 31, 2021, as follows (dollars in thousands):
| Capital Group Core Municipal Fund | Capital Group Short-Term Municipal Fund | Capital Group California Core Municipal Fund | Capital Group California Short-Term Municipal Fund | Capital Group Core Bond Fund | ||||||||||||||||
| Purchases of investment securities* | $ | 330,447 | $ | 91,436 | $ | 223,741 | $ | 75,899 | $ | 1,145,566 | ||||||||||
| Sales of investment securities* | 298,418 | 108,382 | 232,398 | 102,309 | 1,079,222 | |||||||||||||||
| * | Excludes short-term securities and U.S. government obligations, if any. |
| Private Client Services Funds | 99 |
Financial highlights
| Income (loss) from investment operations1 | Dividends and distributions | |||||||||||||||||||||||||||||||||||||||||||||||||||
| Year ended | Net asset value, beginning of year | Net investment income | Net (losses) gains on securities (both realized and unrealized) | Total from investment operations | Dividends (from net investment income) | Distributions (from capital gains) | Total dividends and distributions | Net asset value, end of year | Total return2 | Net assets, end of year (in millions) | Ratio of expenses to average net assets before reimbursements3 | Ratio of expenses to average net assets after reimbursements2,3 | Ratio of net income to average net assets2 | |||||||||||||||||||||||||||||||||||||||
| Capital Group Core Municipal Fund | ||||||||||||||||||||||||||||||||||||||||||||||||||||
| 10/31/2021 | $ | 10.76 | $ | .13 | $ | (.02 | ) | $ | .11 | $ | (.13 | ) | $ | (.12 | ) | $ | (.25 | ) | $ | 10.62 | .99 | % | $ | 785 | .28 | % | .28 | % | 1.20 | % | ||||||||||||||||||||||
| 10/31/2020 | 10.55 | .18 | .22 | .40 | (.18 | ) | (.01 | ) | (.19 | ) | 10.76 | 3.87 | 652 | .28 | .28 | 1.70 | ||||||||||||||||||||||||||||||||||||
| 10/31/2019 | 10.15 | .22 | .40 | .62 | (.22 | ) | — | (.22 | ) | 10.55 | 6.15 | 584 | .28 | .28 | 2.11 | |||||||||||||||||||||||||||||||||||||
| 10/31/2018 | 10.41 | .21 | (.26 | ) | (.05 | ) | (.19 | ) | (.02 | ) | (.21 | ) | 10.15 | (.32 | ) | 474 | .27 | .27 | 2.04 | |||||||||||||||||||||||||||||||||
| 10/31/2017 | 10.48 | .21 | (.07 | ) | .14 | (.21 | ) | — | 4 | (.21 | ) | 10.41 | 1.39 | 442 | .35 | .34 | 2.02 | |||||||||||||||||||||||||||||||||||
| Capital Group Short-Term Municipal Fund | ||||||||||||||||||||||||||||||||||||||||||||||||||||
| 10/31/2021 | $ | 10.33 | $ | .09 | $ | (.04 | ) | $ | .05 | $ | (.09 | ) | $ | (.03 | ) | $ | (.12 | ) | $ | 10.26 | .43 | % | $ | 203 | .31 | % | .30 | % | .87 | % | ||||||||||||||||||||||
| 10/31/2020 | 10.15 | .14 | .18 | .32 | (.14 | ) | — | (.14 | ) | 10.33 | 3.16 | 208 | .32 | .30 | 1.36 | |||||||||||||||||||||||||||||||||||||
| 10/31/2019 | 9.93 | .19 | .22 | .41 | (.19 | ) | — | (.19 | ) | 10.15 | 4.19 | 127 | .35 | .30 | 1.92 | |||||||||||||||||||||||||||||||||||||
| 10/31/2018 | 10.09 | .17 | (.18 | ) | (.01 | ) | (.15 | ) | — | (.15 | ) | 9.93 | .05 | 138 | .32 | .30 | 1.67 | |||||||||||||||||||||||||||||||||||
| 10/31/2017 | 10.11 | .14 | (.02 | ) | .12 | (.14 | ) | — | 4 | (.14 | ) | 10.09 | 1.26 | 150 | .41 | .35 | 1.42 | |||||||||||||||||||||||||||||||||||
| Capital Group California Core Municipal Fund | ||||||||||||||||||||||||||||||||||||||||||||||||||||
| 10/31/2021 | $ | 10.90 | $ | .13 | $ | (.08 | ) | $ | .05 | $ | (.11 | ) | $ | (.09 | ) | $ | (.20 | ) | $ | 10.75 | .53 | % | $ | 664 | .27 | % | .27 | % | 1.17 | % | ||||||||||||||||||||||
| 10/31/2020 | 10.73 | .17 | .18 | .35 | (.17 | ) | (.01 | ) | (.18 | ) | 10.90 | 3.29 | 627 | .28 | .28 | 1.55 | ||||||||||||||||||||||||||||||||||||
| 10/31/2019 | 10.34 | .20 | .40 | .60 | (.20 | ) | (.01 | ) | (.21 | ) | 10.73 | 5.84 | 557 | .28 | .28 | 1.89 | ||||||||||||||||||||||||||||||||||||
| 10/31/2018 | 10.57 | .19 | (.23 | ) | (.04 | ) | (.18 | ) | (.01 | ) | (.19 | ) | 10.34 | (.27 | ) | 452 | .27 | .27 | 1.85 | |||||||||||||||||||||||||||||||||
| 10/31/2017 | 10.69 | .20 | (.11 | ) | .09 | (.20 | ) | (.01 | ) | (.21 | ) | 10.57 | .84 | 388 | .35 | .34 | 1.88 | |||||||||||||||||||||||||||||||||||
| Capital Group California Short-Term Municipal Fund | ||||||||||||||||||||||||||||||||||||||||||||||||||||
| 10/31/2021 | $ | 10.39 | $ | .08 | $ | (.07 | ) | $ | .01 | $ | (.08 | ) | $ | (.03 | ) | $ | (.11 | ) | $ | 10.29 | .12 | % | $ | 182 | .29 | % | .29 | % | .76 | % | ||||||||||||||||||||||
| 10/31/2020 | 10.28 | .12 | .11 | .23 | (.12 | ) | — | (.12 | ) | 10.39 | 2.26 | 199 | .30 | .30 | 1.16 | |||||||||||||||||||||||||||||||||||||
| 10/31/2019 | 10.06 | .15 | .22 | .37 | (.15 | ) | — | (.15 | ) | 10.28 | 3.55 | 164 | .32 | .30 | 1.46 | |||||||||||||||||||||||||||||||||||||
| 10/31/2018 | 10.21 | .13 | (.15 | ) | (.02 | ) | (.12 | ) | (.01 | ) | (.13 | ) | 10.06 | (.07 | ) | 129 | .31 | .30 | 1.28 | |||||||||||||||||||||||||||||||||
| 10/31/2017 | 10.23 | .11 | (.02 | ) | .09 | (.11 | ) | — | 4 | (.11 | ) | 10.21 | .97 | 120 | .42 | .35 | 1.11 | |||||||||||||||||||||||||||||||||||
| Capital Group Core Bond Fund | ||||||||||||||||||||||||||||||||||||||||||||||||||||
| 10/31/2021 | $ | 10.70 | $ | .14 | $ | (.20 | ) | $ | (.06 | ) | $ | (.15 | ) | $ | (.25 | ) | $ | (.40 | ) | $ | 10.24 | (.60 | )% | $ | 640 | .28 | % | .28 | % | 1.36 | % | |||||||||||||||||||||
| 10/31/2020 | 10.31 | .18 | .46 | .64 | (.19 | ) | (.06 | ) | (.25 | ) | 10.70 | 6.28 | 564 | .28 | .28 | 1.73 | ||||||||||||||||||||||||||||||||||||
| 10/31/2019 | 9.82 | .23 | .48 | .71 | (.22 | ) | — | (.22 | ) | 10.31 | 7.33 | 477 | .28 | .28 | 2.24 | |||||||||||||||||||||||||||||||||||||
| 10/31/2018 | 10.14 | .21 | (.34 | ) | (.13 | ) | (.19 | ) | — | (.19 | ) | 9.82 | (1.14 | ) | 446 | .28 | .28 | 2.08 | ||||||||||||||||||||||||||||||||||
| 10/31/2017 | 10.31 | .16 | (.12 | ) | .04 | (.16 | ) | (.05 | ) | (.21 | ) | 10.14 | .41 | 416 | .35 | .34 | 1.58 | |||||||||||||||||||||||||||||||||||
| Portfolio turnover rate for all share classes | Year ended October 31, | |||||||||||||||||||
| excluding mortgage dollar roll transactions5,6 | 2021 | 2020 | 2019 | 2018 | 2017 | |||||||||||||||
| Capital Group Core Bond Fund | 48 | % | 80 | % | 114 | % | 41 | % | 52 | % | ||||||||||
| Portfolio turnover rate for all share classes, | Year ended October 31, | |||||||||||||||||||
| including mortgage dollar roll transactions6 | 2021 | 2020 | 2019 | 2018 | 2017 | |||||||||||||||
| Capital Group Core Municipal Fund | 48 | % | 62 | % | 38 | % | 55 | % | 47 | % | ||||||||||
| Capital Group Short-Term Municipal Fund | 51 | 58 | 50 | 70 | 42 | |||||||||||||||
| Capital Group California Core Municipal Fund | 38 | 37 | 22 | 69 | 27 | |||||||||||||||
| Capital Group California Short-Term Municipal Fund | 43 | 42 | 39 | 65 | 36 | |||||||||||||||
| Capital Group Core Bond Fund | 217 | 158 | 151 | 110 | 95 | |||||||||||||||
| 1 | Based on average shares outstanding. |
| 2 | This column reflects the impact, if any, of miscellaneous fee reimbursements from CRMC. |
| 3 | Ratios do not include expenses of any Central Funds. The fund indirectly bears its proportionate share of the expenses of any Central Funds, if applicable. |
| 4 | Amount less than $.01. |
| 5 | Refer to Note 5 for further information on mortgage dollar rolls. |
| 6 | Rates do not include the fund’s portfolio activity with respect to any Central Funds, if applicable. |
See notes to financial statements.
| 100 | Private Client Services Funds |
Report of Independent Registered Public Accounting Firm
To the Board of Trustees of Capital Group Private Client Services Funds and Shareholders of Capital Group Core Municipal Fund, Capital Group Short-Term Municipal Fund, Capital Group California Core Municipal Fund, Capital Group California Short- Term Municipal Fund, and Capital Group Core Bond Fund
Opinions on the Financial Statements
We have audited the accompanying statements of assets and liabilities, including the investment portfolios, of Capital Group Core Municipal Fund, Capital Group Short-Term Municipal Fund, Capital Group California Core Municipal Fund, Capital Group California Short-Term Municipal Fund, and Capital Group Core Bond Fund (constituting Capital Group Private Client Services Funds, hereafter collectively referred to as the “Funds”) as of October 31, 2021, the related statements of operations for the year ended October 31, 2021, the statements of changes in net assets for each of the two years in the period ended October 31, 2021, including the related notes, and the financial highlights for each of the four years in the period ended October 31, 2021 (collectively referred to as the “financial statements”). In our opinion, the financial statements present fairly, in all material respects, the financial position of each of the Funds as of October 31, 2021, the results of each of their operations for the year then ended, the changes in each of their net assets for each of the two years in the period ended October 31, 2021 and each of the financial highlights for each of the four years in the period ended October 31, 2021 in conformity with accounting principles generally accepted in the United States of America.
The financial statements of the Funds as of and for the year ended October 31, 2017 and the financial highlights for each of the periods ended on or prior to October 31, 2017 (not presented herein, other than the financial highlights for the period ended October 31, 2017) were audited by other auditors whose report dated December 19, 2017 expressed an unqualified opinion on those financial statements and financial highlights.
Basis for Opinions
These financial statements are the responsibility of the Funds’ management. Our responsibility is to express an opinion on the Funds’ financial statements based on our audits. We are a public accounting firm registered with the Public Company Accounting Oversight Board (United States) (PCAOB) and are required to be independent with respect to the Funds in accordance with the U.S. federal securities laws and the applicable rules and regulations of the Securities and Exchange Commission and the PCAOB.
We conducted our audits of these financial statements in accordance with the standards of the PCAOB. Those standards require that we plan and perform the audit to obtain reasonable assurance about whether the financial statements are free of material misstatement, whether due to error or fraud.
Our audits included performing procedures to assess the risks of material misstatement of the financial statements, whether due to error or fraud, and performing procedures that respond to those risks. Such procedures included examining, on a test basis, evidence regarding the amounts and disclosures in the financial statements. Our audits also included evaluating the accounting principles used and significant estimates made by management, as well as evaluating the overall presentation of the financial statements. Our procedures included confirmation of securities owned as of October 31, 2021 by correspondence with the custodian, transfer agent and brokers; when replies were not received from brokers, we performed other auditing procedures. We believe that our audits provide a reasonable basis for our opinion.
/s/ PricewaterhouseCoopers LLP
Los Angeles, California
December 15, 2021
We have served as the auditor of one or more investment companies in The Capital Group Companies Investment Company Complex since 1934.
| Private Client Services Funds | 101 |
| Expense example | unaudited |
As a shareholder of the funds, you incur ongoing costs, including management fees and other expenses. This example is intended to help you understand your ongoing costs (in dollars) of investing in the funds so you can compare these costs with the ongoing costs of investing in other mutual funds. The example is based on an investment of $1,000 invested at the beginning of the period and held for the entire six-month period (May 1, 2021, through October 31, 2021).
Actual expenses:
The first line of each fund in the table below provides information about actual account values and actual expenses. You may use the information in this line, together with the amount you invested, to estimate the expenses that you paid over the period. Simply divide your account value by $1,000 (for example, an $8,600 account value divided by $1,000 = 8.6), then multiply the result by the number in the first line under the heading titled “Expenses paid during period” to estimate the expenses you paid on your account during this period.
Hypothetical example for comparison purposes:
The second line of each fund in the table below provides information about hypothetical account values and hypothetical expenses based on the actual expense ratio for the share class and an assumed rate of return of 5.00% per year before expenses, which is not the actual return of the share class. The hypothetical account values and expenses may not be used to estimate the actual ending account balance or expenses you paid for the period. You may use this information to compare the ongoing costs of investing in the fund and other funds. To do so, compare this 5.00% hypothetical example with the 5.00% hypothetical examples that appear in the shareholder reports of the other funds.
Notes:
Shareholders of the funds may be subject to an additional fee charged by CRMC’s Capital Group Private Client Services division for the ongoing services provided to the shareholder. You can estimate the impact of these fees by adding the amount of the fees to the total estimated expenses you paid on your account during the period as calculated above. In addition, your ending account value would be lower by the amount of these fees. Note that the expenses shown in the table are meant to highlight your ongoing costs only. The second line of each fund in the table below is useful in comparing ongoing costs only and will not help you determine the relative total costs of owning different funds.
| 102 | Private Client Services Funds |
| Beginning account value 5/1/2021 | Ending account value 10/31/2021 | Expenses paid during period* | Annualized expense ratio | |||||||||||||
| Capital Group Core Municipal Fund | ||||||||||||||||
| Actual return | $ | 1,000.00 | $ | 996.86 | $ | 1.41 | .28 | % | ||||||||
| Assumed 5% return | 1,000.00 | 1,023.79 | 1.43 | .28 | ||||||||||||
| Capital Group Short-Term Municipal Fund | ||||||||||||||||
| Actual return | $ | 1,000.00 | $ | 997.84 | $ | 1.66 | .33 | % | ||||||||
| Assumed 5% return | 1,000.00 | 1,023.54 | 1.68 | .33 | ||||||||||||
| Capital Group California Core Municipal Fund | ||||||||||||||||
| Actual return | $ | 1,000.00 | $ | 997.46 | $ | 1.41 | .28 | % | ||||||||
| Assumed 5% return | 1,000.00 | 1,023.79 | 1.43 | .28 | ||||||||||||
| Capital Group California Short-Term Municipal Fund | ||||||||||||||||
| Actual return | $ | 1,000.00 | $ | 997.49 | $ | 1.56 | .31 | % | ||||||||
| Assumed 5% return | 1,000.00 | 1,023.64 | 1.58 | .31 | ||||||||||||
| Capital Group Core Bond Fund | ||||||||||||||||
| Actual return | $ | 1,000.00 | $ | 996.06 | $ | 1.41 | .28 | % | ||||||||
| Assumed 5% return | 1,000.00 | 1,023.79 | 1.43 | .28 | ||||||||||||
| * | The “expenses paid during period” are equal to the “annualized expense ratio,” multiplied by the average account value over the period, multiplied by the number of days in the period, and divided by 365 (to reflect the one-half year period). |
| Private Client Services Funds | 103 |
| Tax information | unaudited |
We are required to advise you of the federal tax status of certain distributions received by shareholders during the fiscal year. The funds hereby designate the following amounts for the funds’ fiscal year ended October 31, 2021:
| Capital Group Core Municipal Fund | Capital Group Short-Term Municipal Fund | Capital Group California Core Municipal Fund | Capital Group California Short-Term Municipal Fund | Capital Group Core Bond Fund | ||||||||||||||||
| Long-term capital gains | $ | 4,808,000 | — | $ | 4,471,000 | $ | 527,000 | $ | 6,782,000 | |||||||||||
| Section 163(j) interest dividends | — | — | — | — | $ | 9,195,000 | ||||||||||||||
| Exempt interest dividends | 100 | % | 100 | % | 100 | % | 100 | % | — | |||||||||||
Individual shareholders should refer to their Form 1099 or other tax information, which will be mailed in January 2022, to determine the calendar year amounts to be included on their 2021 tax returns. Shareholders should consult their tax advisors.
| 104 | Private Client Services Funds |
Board of trustees and other officers
Independent trustees1
| Name and year of birth | Year first elected a trustee of the fund2 | Principal occupation(s) during past five years | Number of portfolios in fund complex overseen by trustee | Other directorships3 held by trustee | ||||
| Joseph C. Berenato, 1946 | 2015 | Former Chairman and CEO, Ducommun Incorporated (aerospace components manufacturer) | 15 | None | ||||
| Vanessa C. L. Chang, 1952 Chair of the Board (Independent and Non-Executive) | 2015 | Former Director, EL & EL Investments (real estate) | 16 | Edison International/Southern California Edison; Transocean Ltd. | ||||
| James G. Ellis, 1947 | 2019 | Professor of Marketing and former Dean, Marshall School of Business, University of Southern California | 99 | Advanced Merger Partners; EVe Mobility Acquisition Corp (acquisitions of companies in the electric vehicle market); J. G. Boswell (agricultural production); Mercury General Corporation | ||||
| Jennifer C. Feikin, 1968 | 2019 | Business Advisor; previously held positions at Google, AOL, 20th Century Fox and McKinsey & Company; Trustee, The Nature Conservancy of California; former Director, First Descents | 9 | Hertz Global Holdings, Inc. | ||||
| Pablo R. González Guajardo, 1967 | 2019 | CEO, Kimberly-Clark de México, S.A.B. de C.V. | 16 | América Móvil, S.A.B. de C.V. (telecommunications company); Grupo Lala, S.A.B. de C.V. (dairy company); Grupo Sanborns, S.A.B. de C.V. (retail stores and restaurants); Kimberly-Clark de México, S.A.B. de C.V. (consumer staples) | ||||
| Leslie Stone Heisz, 1961 | 2019 | Former Managing Director, Lazard (retired, 2010); Director, Edwards Lifesciences; Trustee, Public Storage; Director, Kaiser Permanente (California public benefit corporation); Lecturer, UCLA Anderson School of Management | 9 | None | ||||
| William D. Jones, 1955 | 2019 | Real estate developer/owner, President and CEO, CityLink Investment Corporation (acquires, develops and manages real estate ventures in urban communities) and for the former City Scene Management Company (provided commercial asset management services) | 17 | Biogen Inc.; Sempra Energy |
Interested trustee5
| Name, year of birth and position with fund | Year first elected a trustee or officer of the fund2 | Principal occupation(s) during past five years and positions held with affiliated entities or the principal underwriter of the fund | Number of portfolios overseen by trustee | Other directorships3 held by trustee | ||||
| John S. Armour, 1957 President and Trustee | 2013 | President — Capital Group Private Client Services, Inc.6 | 9 | None |
The funds’ statement of additional information includes further details about fund trustees and is available without charge upon request by calling your relationship manager at (800) 266-9532. The address for all trustees and officers of the fund is 333 South Hope Street, Los Angeles, CA 90071, Attention: Secretary.
See page 106 for footnotes.
| Private Client Services Funds | 105 |
Other officers7
| Name, year of birth and position with fund | Year first elected an officer of the fund2 | Principal occupation(s) during past five years and positions held with affiliated entities or the principal underwriter of the fund | ||
| Michael W. Stockton, 1967 Executive Vice President | 2021 | Senior Vice President — Fund Business Management Group, Capital Research and Management | ||
| Aaron Applebaum, 1979 Senior Vice President | 2017 | Partner — Capital Fixed Income Investors, Capital Research and Management Company | ||
| Mark Marinella, 1958 Senior Vice President | 2016 | Partner — Capital Fixed Income Investors, Capital Research and Management Company | ||
| John R. Queen, 1965 Senior Vice President | 2009 | Partner — Capital Fixed Income Investors, Capital Research and Management Company; Senior Vice President — Capital Group Private Client Services, Inc.6 | ||
| Timothy W. McHale, 1978 Vice President | 2009 | Senior Vice President and Senior Counsel — Fund Business Management Group, Capital Research and Management Company; Secretary, American Funds Distributors, Inc.6 | ||
| Courtney R. Taylor, 1975 Secretary | 2009 | Assistant Vice President — Investment Operations, Capital Research and Management Company | ||
| Gregory F. Niland, 1971 Treasurer | 2014 | Vice President — Investment Operations, Capital Research and Management Company | ||
| Susan K. Countess, 1966 Assistant Secretary | 2012 | Associate — Fund Business Management Group, Capital Research and Management Company | ||
| Sandra Chuon, 1972 Assistant Treasurer | 2019 | Assistant Vice President — Investment Operations, Capital Research and Management Company | ||
| Kyle J. Ilsley, 1980 Assistant Treasurer | 2020 | Assistant Vice President — Investment Operations, Capital Research and Management Company |
| 1 | The term independent trustee refers to a trustee who is not an “interested person” of the fund within the meaning of the Investment Company Act of 1940. |
| 2 | Trustees and officers of the fund serve until their resignation, removal or retirement. |
| 3 | Funds managed by Capital Research and Management Company or its affiliates. |
| 4 | This includes all directorships (other than the fund or other funds managed by Capital Research and Management Company or its affiliates) that are held by each trustee as a trustee or director of a public company or its affiliates. Unless otherwise noted, all directorships are current. |
| 5 | The term interested trustee refers to a trustee who is an “interested person” of the fund within the meaning of the Investment Company Act of 1940, on the basis of his or her affiliation with the fund’s investment adviser, Capital Research and Management Company, or affiliated entities (including the fund’s principal underwriter). |
| 6 | Company affiliated with Capital Research and Management Company. |
| 7 | All of the officers listed are officers of one or more of the other funds for which Capital Research and Management Company serves as investment adviser. |
| 106 | Private Client Services Funds |

Office of the fund
6455 Irvine Center Drive Irvine,
CA 92618-4518
Investment adviser
Capital Research and Management Company
333 South Hope Street
Los Angeles, CA 90071-1406
Transfer agent for shareholder accounts
American Funds Service Company
(Write to the address nearest you.)
P.O. Box 6007
Indianapolis, IN 46206-6007
P.O. Box 2280
Norfolk, VA 23501-2280
Custodian of assets
State Street Bank and Trust Company
One Lincoln Street
Boston, MA 02111
Counsel
Morgan, Lewis & Bockius LLP
One Federal Street
Boston, MA 02110-1726
Independent registered public accounting firm
PricewaterhouseCoopers LLP
601 South Figueroa Street
Los Angeles, CA 90017-3874
Principal underwriter
American Funds Distributors, Inc.
333 South Hope Street
Los Angeles, CA 90071-1406
Investors should carefully consider investment objectives, risks, charges and expenses. This and other important information is contained in the fund prospectuses, which can be obtained from Capital Research and Management Company by calling (800) 266-9532 and should be read carefully before investing.
Capital Group Private Client Services Fund files a complete list of its portfolio holdings with the U.S. Securities and Exchange Commission (SEC) for the first and third quarters of each fiscal year on Form NPORT-P. This filing is available free of charge on the SEC website (www.sec.gov). Additionally, the list of portfolio holdings is available by calling your relationship manager at (800) 266-9532.
The proxy voting procedures and policies of Capital Group Private Client Services Fund — which describe how we vote proxies relating to portfolio securities — are available upon request by calling your relationship manager at (800) 266-9532. The funds file their proxy voting records with the SEC for the 12 months ended June 30 by August 31. The report also is available on the SEC website or by calling your relationship manager.
BLOOMBERG® is a trademark and service mark of Bloomberg Finance L.P. and its affiliates (collectively “Bloomberg”). Bloomberg or Bloomberg’s licensors own all proprietary rights in the Bloomberg Indices. Neither Bloomberg nor Bloomberg’s licensors approves or endorses this material, or guarantees the accuracy or completeness of any information herein, or makes any warranty, express or implied, as to the results to be obtained therefrom and, to the maximum extent allowed by law, neither shall have any liability or responsibility for injury or damages arising in connection therewith.
All Capital Group trademarks mentioned are owned by The Capital Group Companies, Inc., an affiliated company or fund. All other company and product names mentioned are the property of their respective companies.
American Funds Distributors, Inc., member FINRA.

ITEM 2 – Code of Ethics
The Registrant has adopted a Code of Ethics that applies to its Principal Executive Officer and Principal Financial Officer. The Registrant undertakes to provide to any person without charge, upon request, a copy of the Code of Ethics. Such request can be made by calling 800/421-4225 or to the Secretary of the Registrant, 6455 Irvine Center Drive, Irvine, California 92618.
ITEM 3 – Audit Committee Financial Expert
The Registrant’s board has determined that Pablo R. González Guajardo, a member of the Registrant’s audit committee, is an “audit committee financial expert” and "independent," as such terms are defined in this Item. This designation will not increase the designee’s duties, obligations or liability as compared to his or her duties, obligations and liability as a member of the audit committee and of the board, nor will it reduce the responsibility of the other audit committee members. There may be other individuals who, through education or experience, would qualify as "audit committee financial experts" if the board had designated them as such. Most importantly, the board believes each member of the audit committee contributes significantly to the effective oversight of the Registrant’s financial statements and condition.
ITEM 4 – Principal Accountant Fees and Services
| CGPCS | ||
| Registrant: | ||
| a) Audit Fees: | ||
| Audit | 2020 | 170,000 |
| 2021 | 160,000 | |
| b) Audit-Related Fees: | ||
| 2020 | None | |
| 2021 | None | |
| c) Tax Fees: | ||
| 2020 | 33,000 | |
| 2021 | 33,000 | |
| The tax fees consist of professional services relating to the preparation of the Registrant’s tax returns. | ||
| d) All Other Fees: | ||
| 2020 | None | |
| 2021 | None | |
| Adviser and affiliates (includes only fees for non-audit services billed to the adviser and affiliates for engagements that relate directly to the operations and financial reporting of the Registrant and were subject to the pre-approval policies described below): | ||
| a) Audit Fees: | ||
| Not Applicable | ||
| b) Audit-Related Fees: | ||
| 2020 | None | |
| 2021 | None | |
| The audit-related fees consist of assurance and related services relating to the examination of the Registrant’s transfer agent, principal underwriter and investment adviser conducted in accordance with Statement on Standards for Attestation Engagements Number 18 issued by the American Institute of Certified Public Accountants. | ||
| c) Tax Fees: | ||
| 2020 | 15,000 | |
| 2021 | None |
| The tax fees consist of consulting services relating to the Registrant’s investments. | ||
| d) All Other Fees: | ||
| 2020 | 8,000 | |
| 2021 | 2,000 | |
| The other fees consist of subscription services related to an accounting research tool. | ||
| All audit and permissible non-audit services that the Registrant’s audit committee considers compatible with maintaining the independent registered public accounting firm’s independence are required to be pre-approved by the committee. The pre-approval requirement will extend to all non-audit services provided to the Registrant, the investment adviser, and any entity controlling, controlled by, or under common control with the investment adviser that provides ongoing services to the Registrant, if the engagement relates directly to the operations and financial reporting of the Registrant. The committee will not delegate its responsibility to pre-approve these services to the investment adviser. The committee may delegate to one or more committee members the authority to review and pre-approve audit and permissible non-audit services. Actions taken under any such delegation will be reported to the full committee at its next meeting. The pre-approval requirement is waived with respect to non-audit services if certain conditions are met. The pre-approval requirement was not waived for any of the non-audit services listed above provided to the Registrant, adviser and affiliates. | ||
| Aggregate non-audit fees paid to the Registrant’s auditors, including fees for all services billed to the Registrant, adviser and affiliates that provide ongoing services to the Registrant, were, $57,000 for fiscal year 2020 and $35,000 for fiscal year 2021. The non-audit services represented by these amounts were brought to the attention of the committee and considered to be compatible with maintaining the auditors’ independence. |
ITEM 5 – Audit Committee of Listed Registrants
Not applicable to this Registrant, insofar as the Registrant is not a listed issuer as defined in Rule 10A-3 under the Securities Exchange Act of 1934.
ITEM 6 – Schedule of Investments
Not applicable, insofar as the schedule is included as part of the report to shareholders filed under Item 1 of this Form.
ITEM 7 – Disclosure of Proxy Voting Policies and Procedures for Closed-End Management Investment Companies
Not applicable to this Registrant, insofar as the Registrant is not a closed-end management investment company.
ITEM 8 – Portfolio Managers of Closed-End Management Investment Companies
Not applicable to this Registrant, insofar as the Registrant is not a closed-end management investment company.
ITEM 9 – Purchases of Equity Securities by Closed-End Management Investment Company and Affiliated Purchasers
Not applicable to this Registrant, insofar as the Registrant is not a closed-end management investment company.
ITEM 10 – Submission of Matters to a Vote of Security Holders
There have been no material changes to the procedures by which shareholders may recommend nominees to the Registrant’s board of trustees since the Registrant last submitted a proxy statement to its shareholders. The procedures are as follows. The Registrant has a nominating committee comprised solely of persons who are not considered ‘‘interested persons’’ of the Registrant within the meaning of the Investment Company Act of 1940, as amended. The committee periodically reviews such issues as the board’s composition, responsibilities, committees, compensation and other relevant issues, and recommends any appropriate changes to the full board of trustees. While the committee normally is able to identify from its own resources an ample number of qualified candidates, it will consider shareholder suggestions of persons to be considered as nominees to fill future vacancies on the board. Such suggestions must be sent in writing to the nominating committee of the Registrant, c/o the Registrant’s Secretary, and must be accompanied by complete biographical and occupational data on the prospective nominee, along with a written consent of the prospective nominee for consideration of his or her name by the nominating committee.
ITEM 11 – Controls and Procedures
| (a) | The Registrant’s Principal Executive Officer and Principal Financial Officer have concluded, based on their evaluation of the Registrant’s disclosure controls and procedures (as such term is defined in Rule 30a-3 under the Investment Company Act of 1940), that such controls and procedures are adequate and reasonably designed to achieve the purposes described in paragraph (c) of such rule. |
| (b) | There were no changes in the Registrant’s internal controls over financial reporting (as defined in Rule 30a-3(d) under the Investment Company Act of 1940) that occurred during the Registrant’s semi-annual period covered by this report that has materially affected, or is reasonably likely to materially affect, the Registrant’s internal control over financial reporting.
|
ITEM 12 – Exhibits
| (a)(1) | The Code of Ethics that is the subject of the disclosure required by Item 2 is attached as an exhibit hereto. |
| (a)(2) | The certifications required by Rule 30a-2 of the Investment Company Act of 1940 and Sections 302 and 906 of the Sarbanes-Oxley Act of 2002 are attached as exhibits hereto. |
SIGNATURES
Pursuant to the requirements of the Securities Exchange Act of 1934 and the Investment Company Act of 1940, the Registrant has duly caused this report to be signed on its behalf by the undersigned, thereunto duly authorized.
| CAPITAL GROUP PRIVATE CLIENT SERVICES FUNDS | |
| By __/s/ John S. Armour________________ | |
John S. Armour, President and Principal Executive Officer | |
| Date: December 31, 2021 |
Pursuant to the requirements of the Securities Exchange Act of 1934 and the Investment Company Act of 1940, this report has been signed below by the following persons on behalf of the Registrant and in the capacities and on the dates indicated.
| By _ /s/ John S. Armour_____________ |
John S. Armour, President and Principal Executive Officer |
| Date: December 31, 2021 |
| By ___/s/ Gregory F. Niland__________________ |
Gregory F. Niland, Treasurer and Principal Financial Officer |
| Date: December 31, 2021 |