Table of Contents
UNITED STATES
SECURITIES AND EXCHANGE COMMISSION
Washington, D.C. 20549
FORM N-CSR
CERTIFIED SHAREHOLDER REPORT OF REGISTERED MANAGEMENT
INVESTMENT COMPANIES
Investment Company Act file number: 811-22375
PIMCO Equity Series
(Exact name of registrant as specified in charter)
840 Newport Center Drive, Newport Beach, CA 92660
(Address of principal executive offices)
John P. Hardaway
Treasurer and Principal Financial Officer
PIMCO Equity Series
840 Newport Center Drive
Newport Beach, CA 92660
(Name and address of agent for service)
Copies to:
Brendan C. Fox
Dechert LLP
1775 I Street, N.W.
Washington, D.C. 20006
Registrant’s telephone number, including area code: (866) 746-2602
Date of fiscal year end: June 30
Date of reporting period: December 31, 2011
Form N-CSR is to be used by management investment companies to file reports with the Commission not later than 10 days after the transmission to stockholders of any report that is required to be transmitted to stockholders under Rule 30e-1 under the Investment Company Act of 1940 (17 CFR 270.30e-1). The Commission may use the information provided on Form N-CSR in its regulatory, disclosure review, inspection, and policymaking roles.
A registrant is required to disclose the information specified by Form N-CSR, and the Commission will make this information public. A registrant is not required to respond to the collection of information contained in Form N-CSR unless the Form displays a currently valid Office of Management and Budget (“OMB”) control number. Please direct comments concerning the accuracy of the information collection burden estimate and any suggestions for reducing the burden to Secretary, Securities and Exchange Commission, 450 Fifth Street, NW, Washington, DC 20549-0609. The OMB has reviewed this collection of information under the clearance requirements of 44 U.S.C. § 3507.
Table of Contents
Item 1. Reports to Stockholders.
The following is a copy of the report transmitted to stockholders pursuant to Rule 30e-1 under the Investment Company Act of 1940, as amended (the “1940 Act”) (17 CFR 270.30e-1).
| • | PIMCO Equity Series—Institutional Class, Class P, Administrative Class, Class D, Class A, Class C and Class R |
Table of Contents

Your Global Investment Authority
PIMCO Equity Series
Semiannual Report
December 31, 2011

PIMCO Dividend and Income Builder Fund
PIMCO EqS Dividend Fund
PIMCO EqS Emerging Markets Fund
PIMCO Emerging Multi-Asset Fund
PIMCO EqS Pathfinder Fund™
Share Classes
| n | Institutional |
| n | P |
| n | Administrative |
| n | D |
| n | A |
| n | C |
| n | R |

Table of Contents
| Page | ||||||||||||
| 2 | ||||||||||||
| 4 | ||||||||||||
| 23 | ||||||||||||
| 26 | ||||||||||||
| 30 | ||||||||||||
| 32 | ||||||||||||
| 34 | ||||||||||||
| 35 | ||||||||||||
| 36 | ||||||||||||
| 37 | ||||||||||||
| 66 | ||||||||||||
| 77 | ||||||||||||
| 78 | ||||||||||||
| 79 | ||||||||||||
| FUND | Insights from the Portfolio Managers | Fund Summary | Schedule of Investments | |||||||||
| 5 | 7 | 38 | ||||||||||
| 8 | 10 | 42 | ||||||||||
| 11 | 14 | 45 | ||||||||||
| 15 | 18 | 54 | ||||||||||
| 19 | 22 | 58 | ||||||||||
This material is authorized for use only when preceded or accompanied by the current PIMCO Equity Series prospectus.
Table of Contents
Dear Shareholder,
Please find enclosed the Semiannual Report for the PIMCO Equity Series covering the six-month reporting period ended December 31, 2011. On the following pages are specific details about the investment performance of each fund and a discussion of the factors that affected performance during the reporting period. In addition, the letters from the portfolio managers provide a further review of such factors as well as an overview of each fund’s investment strategy, philosophy, and process.
During the reporting period, we expanded the PIMCO Equity Series with the introduction of two global dividend funds: the PIMCO Dividend and Income Builder Fund and the PIMCO EqS Dividend Fund. These new actively managed equity offerings, launched on December 14, 2011, provide additional investment opportunities for investors looking for steady and attractive income as well as the potential for capital appreciation. The PIMCO EqS Dividend Fund is designed for investors who prefer an equity-focused fund, while the PIMCO Dividend and Income Builder Fund supplements global equity investments with select fixed income positions. Each fund has a flexible mandate that can invest in what we believe are attractive opportunities for both income and capital appreciation, unconstrained by geography, sector or issuer size. The portfolio managers’ experienced stock selection process is enhanced by PIMCO’s thought leadership, risk management, and investment expertise to create what we believe is a compelling core equity allocation for many investors.
We remain committed to a steady and focused build-out of PIMCO’s actively managed equities investment business, which began with the launch of the PIMCO EqS Pathfinder Fund™ in April 2010, followed by the PIMCO EqS Emerging Markets Fund and PIMCO Emerging Multi-Asset Fund in March and April 2011, respectively. We are driven to provide our clients with global solutions that combine rigorous bottom-up company analysis with PIMCO’s top-down macroeconomic expertise. Furthermore, our actively managed equity platform is integrated with PIMCO’s time-tested investment process and applies the same standards of excellence, innovation and intellectual capital that have benefited our clients for four decades.
General highlights of the financial markets during our six-month reporting period include:
| n | Equity markets worldwide remained volatile throughout the reporting period as investors responded to muted global economic growth prospects, rising concerns over the European sovereign debt crisis, and political gridlock in Washington. U.S. equities, as measured by the S&P 500 Index, declined 3.69%, while global equities, as represented by the MSCI World Index, declined 10.29%. Emerging market (EM) equities, as represented by the MSCI Emerging Markets Index, declined 19.13% and underperformed developed market equities. |
| n | Yields on U.S. Treasury securities ended the period significantly lower (with prices on these securities therefore higher) due to a flight-to-quality brought on by the European sovereign debt crisis. This combined with a weaker global growth outlook, resulting in increased demand for bonds of nations with perceived stronger balance sheets, top credit ratings, and independent currency and monetary policy. The Federal Reserve kept the Federal Funds Rate anchored within a range of zero to 0.25%; the Bank of England held its key lending rate at 0.50%; and the European Central Bank reduced its main policy rate to 1.00%. The benchmark ten-year U.S. Treasury note yielded 1.95% at the end of the reporting period, as compared to 3.16% on June 30, 2011. |
| 2 | PIMCO EQUITY SERIES |
Table of Contents
If you have any questions regarding the PIMCO Equity Series, please contact your account manager or financial adviser, or call one of our shareholder associates at 1 (866) 746-2602. We also invite you to visit www.pimco.com/investments, as well as our investment manager’s website at www.pimco.com.
Thank you again for the trust you have placed in us. We value your commitment and will continue to work diligently to meet your broad investment needs.
 | Sincerely,
Brent R. Harris Chairman of the Board, PIMCO Equity Series
January 25, 2012 |

| DECEMBER 31, 2011 | SEMIANNUAL REPORT | 3 |
Table of Contents
Important Information About the Funds
PIMCO Equity Series (the “Trust”) is an open-end management investment company currently consisting of five separate investment portfolios (the “Funds”). The PIMCO Emerging Multi-Asset Fund may invest in Institutional Class or, as applicable, Class M shares of any of the funds of PIMCO Funds and PIMCO Equity Series, affiliated open-end investment companies, except the PIMCO All Asset, PIMCO All Asset All Authority, PIMCO Global Multi-Asset, and PIMCO RealRetirement® Funds (“Underlying PIMCO Funds”) and other affiliated, including PIMCO ETF Trust, and unaffiliated funds (collectively, the “Acquired Funds”). The PIMCO Emerging Multi-Asset Fund may invest in a combination of affiliated and unaffiliated funds, which may or may not be registered under the Investment Company Act of 1940, as amended (the “1940 Act”), fixed income instruments, equity securities, forwards and derivatives, to the extent permitted under the 1940 Act or exemptive relief therefrom. The PIMCO EqS Emerging Markets Fund invests in a diversified portfolio of investments economically tied to emerging market countries. The PIMCO EqS Emerging Markets Fund will invest a substantial portion of its assets in equity and equity-related securities, including common and preferred stock (and securities convertible into, or that PIMCO expects to be exchanged for, common or preferred stock). The PIMCO EqS Pathfinder Fund™ seeks capital appreciation by investing under normal circumstances in equity securities, including common and preferred stock (and securities convertible into, or that PIMCO expects to be exchanged for, common or preferred stock), of issuers that PIMCO believes are undervalued. The PIMCO EqS Pathfinder Fund’s bottom-up value investment style attempts to identify securities that are undervalued by the market in comparison to PIMCO’s own determination of the company’s value, taking into account criteria such as asset value, book value and cash flow and earnings estimates. The PIMCO Dividend and Income Fund seeks to achieve its investment objective by investing under normal circumstances at least 80% of its assets in a diversified portfolio of income-producing investments, and will typically invest at least 50% of its assets in equity and equity-related securities. When making investments, PIMCO uses fundamental analysis to seek to identify attractively valued issuers that currently pay dividends and have the potential for earnings and dividend growth over time. The PIMCO EqS Dividend Fund seeks to achieve its investment objective by investing under normal circumstances at least 75% of its assets in equity and equity-related securities, including common and preferred stock (and securities convertible into, or that PIMCO expects to be exchanged for, common or preferred stock), as well as securities issued by real estate investment trusts, master limited partnerships and other equity trusts and depositary receipts. When making investments, PIMCO uses fundamental analysis to seek to identify attractively valued issuers that currently pay dividends and have the potential for earnings and dividend growth over time.
The Funds may be subject to various risks as described in the Funds’ prospectus. Some of these risks may include, but are not limited to, the following: allocation risk, acquired fund risk, equity risk, dividend-oriented stocks risk, value investing risk, foreign (non-U.S.) investment risk, emerging markets risk, market risk, issuer risk, interest rate risk, credit risk, high yield and distressed company risk, currency risk, real estate risk, liquidity risk, leveraging risk, management risk, small-cap and mid-cap company risk, arbitrage risk, derivatives risk, short sale risk, commodity risk, convertible securities risk, tax risk, subsidiary risk and issuer non-diversification risk. A complete description of these risks and other risks is contained in the Funds’ prospectus. The Funds may use derivative instruments for hedging purposes or as part of an investment strategy. Use of these instruments may involve certain costs and risks such as liquidity risk, interest rate risk, market risk, credit risk, management risk, leverage risk, mispricing or improper valuation risk and the risk that the Funds could not close out a position when it would be most
advantageous to do so. The Funds could lose more than the principal amount invested in these derivative instruments.
On each individual Fund Summary page in this Semiannual Report (“Shareholder Report”), the Average Annual Total Return table and/or Cumulative Returns chart measure performance assuming that any dividend and capital gain distributions were reinvested. Class A shares are subject to an initial sales charge. A CDSC may be imposed in certain circumstances on Class A shares that are purchased without an initial sales charge and then redeemed during the first 18 months after purchase. The Cumulative Returns chart reflects only Institutional Class performance. Performance for Class P, Administrative Class, Class D, Class A, Class C and Class R shares is typically lower than Institutional Class performance due to the lower expenses paid by Institutional Class shares. Performance shown is net of fees and expenses. A Fund’s total annual operating expense ratios on each individual Fund summary page are as of the currently effective prospectus, as supplemented to date. The Cumulative Returns chart assumes the initial investment of $1,000,000 was made at the end of the month that the Institutional Class of the relevant Fund commenced operations. The minimum initial investment amount for Institutional Class, Class P or Administrative Class shares is $1,000,000. The minimum initial investment amount for Class A, Class C and Class D shares is $1,000. There is no minimum initial investment for Class R shares. Each Fund measures its performance against a broad-based securities market index (benchmark index) and a Lipper Average, which is calculated by Lipper, Inc. (“Lipper”), a Reuters Company, and represents the total return performance average of funds that are tracked by Lipper that have the same Fund classification. The benchmark index and Lipper Average do not take into account fees, expenses or taxes. A Fund’s past performance, before and after taxes, is not necessarily an indication of how the Fund will perform in the future.
An investment in a Fund is not a bank deposit and is not guaranteed or insured by the Federal Deposit Insurance Corporation (“FDIC”) or any other government agency. It is possible to lose money on investments in a Fund.
PIMCO has adopted written proxy voting policies and procedures (“Proxy Policy”) as required by Rule 206(4)-6 under the Investment Advisers Act of 1940, as amended. The Proxy Policy has been adopted by PIMCO Equity Series as the policies and procedures that PIMCO will use when voting proxies on behalf of a Fund. A description of the policies and procedures that PIMCO uses to vote proxies relating to portfolio securities of a Fund, and information about how the Fund voted proxies relating to portfolio securities held during the most recent twelve-month period ended June 30th, are available without charge, upon request, by calling (800) 927-4648 for Institutional Class, Class P and Administrative Class shares or (800) 426-0107 for Class A, Class C, Class D and Class R shares, on the Fund’s website at http://www.pimco.com/investments, and on the Securities and Exchange Commission’s (“SEC”) website at http://www.sec.gov.
PIMCO Equity Series files a complete schedule of each Fund’s portfolio holdings with the SEC for the first and third quarters of each fiscal year on Form N-Q. A copy of a Fund’s Form N-Q is available on the SEC’s website at http://www.sec.gov and may be reviewed and copied at the SEC’s Public Reference Room in Washington, D.C. A Fund’s Form N-Q will also be available without charge, upon request, by calling (800) 927-4648 for Institutional Class, Class P and Administrative Class shares or (800) 426-0107 for Class A, Class C, Class D and Class R shares and on the Fund’s website at http://www.pimco.com/investments. Information on the operation of the Public Reference Room may be obtained by calling 1-800-SEC-0330.
| 4 | PIMCO EQUITY SERIES |
Table of Contents
Insights from the Portfolio Managers PIMCO Dividend and Income Builder Fund
Dear Shareholder,
We appreciate your investment in the PIMCO Dividend and Income Builder Fund (the “Fund”). In the following letter, please find additional detail on the Fund’s investment process and philosophy, and why we believe dividend-paying equities offer a compelling investment opportunity.
Investment Process and Philosophy
The Fund was launched in December 2011 and is an actively managed, global portfolio that focuses on providing above-average yield today, a growing stream of income per share over time, and long-term capital appreciation by investing in dividend-paying equities. The Fund also invests in select fixed income securities to generate additional income.
The Fund benefits from the attention of three experienced portfolio managers with skill in managing portfolios of income-producing securities, and fundamental research that leverages PIMCO’s global investment platform and macroeconomic expertise. The Fund is designed to offer investors the following three key benefits: 1) an actively managed portfolio of dividend-paying companies that have demonstrated an ability and willingness to increase dividend payments over time and attractive-yielding fixed income securities; 2) a global, flexible investment approach that provides access to what we believe are the most attractive income opportunities around the world; and 3) an investment strategy that has been enhanced by PIMCO’s macroeconomic expertise and global investment platform.
The objective of the Fund’s equity investment process is to build an active, diversified portfolio of well-positioned companies with strong prospects. The Fund seeks to invest in companies that pay an attractive dividend today and we believe have the ability and willingness to pay and grow dividends through a variety of economic scenarios. Additionally, the Fund seeks to invest in such companies at an attractive price.
The Fund’s equity investment process begins with a global investment universe. Ideas are generated through global travel to meet with companies, their competitors and suppliers, as well as industry conferences and interviews with industry experts. The Fund also uses a proprietary investment framework to narrow the vast investment universe to a high-potential focus list.
The Fund emphasizes fundamental, bottom-up analysis throughout its evaluation of the focus list and we evaluate capital allocation policies, scrubbed financial statements and footnotes, business models, and industry dynamics, as well as the current dividend yield. Once the team has a high-potential investment idea, we perform extensive due diligence.
Next, the Fund constructs proprietary financial models and uses a variety of valuation metrics which may vary by company, but tends to start with traditional parameters that helps us value anticipated cash flows and future growth. The Fund’s valuation analysis subjects companies to thorough upside and downside stress testing, evaluating a wide range of possible and probable future outcomes. We believe this approach to valuation differs from most fundamental analysis which generally attempts to predict a specific outcome, such as an earnings estimate at a given point in time.
As part of the Fund’s equity portfolio construction process, the investment team considers the company’s life cycle stage. The Fund aims to invest in a diversified portfolio of companies, ranging from solid blue-chip companies that grow over time (consistent earners), to more cyclical companies (basic value), to companies that the investment team believes will grow quickly into the future (emerging franchises). The Fund’s exposures to each of these business types will depend on the risk/reward profile of the individual company and is also influenced by PIMCO’s macroeconomic outlook.
The Fund also has the flexibility to invest in select fixed income securities to help generate additional income. The asset allocation decision is the responsibility of the equity portfolio managers. The minimum allocation to equities will be 50-55%, and the fixed income allocation is expected to be 25% over the long term. Under most circumstances, the fund will hold 2-5% of its assets in cash.
In summary, the Fund’s investment approach combines bottom-up, fundamental research within a macroeconomic framework in order to maximize the total return potential of dividend-paying equities and select fixed-income securities.
Dividend Paying-Equities Are a Compelling Asset Class
Dividend-paying equities may be an attractive long-term investment solution, especially in the current environment. With ten-year Treasury yields at historical lows, the dividend yield on global stocks can be particularly attractive. Additionally, PIMCO believes that select companies have considerable potential to increase dividend payments, as corporate cash on balance sheets is at record highs while dividend payout ratios have declined.
Historically, dividends have been important to total return, as more than half of historical equity returns have been explained by dividend income. Also, the lower standard deviation of dividend-oriented equities has the potential to reduce portfolio volatility, as dividend-per-share growth has been more consistent than earnings-per-share growth. Given the historically less volatile nature of dividend paying stocks, investing in dividend-paying stocks may help dampen volatility.
| DECEMBER 31, 2011 | SEMIANNUAL REPORT | 5 |
Table of Contents
Insights from the Portfolio Managers PIMCO Dividend and Income Builder Fund (Cont.)
PIMCO believes that quality fundamental research is the key to selecting dividend-paying equities, as simply chasing the highest yields is not an optimal strategy. While many studies have shown that high dividend stocks outperform over time, the best performers have been companies that pay high, but not the highest, dividends. Additionally, the rate of dividend growth has been the key driver of returns.
PIMCO also believes that global stocks offer a range of dividend growth and capital appreciation opportunities, in addition to their diversification benefits. Non-U.S. companies have consistently offered more attractive dividend yields, and companies outside the U.S. typically pay out more of their earnings in the form of dividends.
The Fund’s global, flexible investment approach and strategy, supplemented with PIMCO’s macroeconomic expertise and global investment platform, help to create a Fund that is designed to take advantage of what we believe are the most attractive opportunities in dividend-paying equities around the world.
We thank you for your investment in the Fund.
Sincerely,
 | �� |  |
 |  | |
| Brad Kinkelaar | Cliff Remily, CFA | |
| Co-Portfolio Manager | Co-Portfolio Manager | |
 | ||
 | ||
Eve Tournier Portfolio Manager, Fixed Income | ||
Top Holdings1
Gold Fields Orogen Holding BVI Ltd. | 3.6% | |||||
Altria Group, Inc. | 3.2% | |||||
Microsoft Corp. | 3.0% | |||||
Carillion PLC | 3.0% | |||||
Lockheed Martin Corp. | 2.6% | |||||
Novartis AG | 2.6% | |||||
Pfizer, Inc. | 2.5% | |||||
PepsiCo, Inc. | 2.3% | |||||
Petroleos Mexicanos | 2.3% | |||||
Medtronic, Inc. | 2.3% |
Geographic Breakdown1
United States | 40.5% | |||||
United Kingdom | 9.8% | |||||
Switzerland | 4.7% | |||||
Virgin Islands (British) | 3.6% | |||||
Netherlands | 2.9% | |||||
China | 2.4% | |||||
Mexico | 2.3% | |||||
France | 2.2% | |||||
Puerto Rico | 2.1% | |||||
Luxembourg | 2.1% | |||||
Ireland | 2.1% | |||||
Australia | 2.0% | |||||
Brazil | 1.8% | |||||
South Africa | 1.8% | |||||
Hong Kong | 1.6% | |||||
Other | 5.8% |
Sector Breakdown1
Industrials | 36.9% | |||||
Consumer Staples | 14.8% | |||||
Health Care | 12.9% | |||||
Financials | 4.2% | |||||
Banking & Finance | 4.1% | |||||
Information Technology | 3.7% | |||||
Materials | 3.5% | |||||
Consumer Discretionary | 2.8% | |||||
Telecommunication Services | 1.8% | |||||
Energy | 1.5% | |||||
Utilities | 1.5% |
| 1 | % of Total Investments as of 12/31/2011. Top Holdings, Geographic and Sector Breakdown solely reflect long positions. Financial derivative instruments and short-term instruments are not taken into consideration. |
| 6 | PIMCO EQUITY SERIES |
Table of Contents
PIMCO Dividend and Income Builder Fund
| Institutional Class - PQIIX | Class A - PQIZX | |
| Class P - PQIPX | Class C - PQICX | |
Class D - PQIDX | Class R - PQIBX |
| Cumulative Total Return for the period ended December 31, 2011 | ||||
| Fund Inception (12/14/11) | ||||
| PIMCO Dividend and Income Builder Fund Institutional Class | 2.09 | % | ||
| PIMCO Dividend and Income Builder Fund Class P | 2.08 | % | ||
| PIMCO Dividend and Income Builder Fund Class D | 2.07 | % | ||
| PIMCO Dividend and Income Builder Fund Class A | 2.17 | % | ||
| PIMCO Dividend and Income Builder Fund Class A (adjusted) | -3.45 | % | ||
| PIMCO Dividend and Income Builder Fund Class C | 2.03 | % | ||
| PIMCO Dividend and Income Builder Fund Class C (adjusted) | 1.03 | % | ||
| PIMCO Dividend and Income Builder Fund Class R | 2.06 | % | ||
| MSCI World Index± | 3.89 | % | ||
| 75% MSCI World Index/25% Barclays Capital Global Aggregate (USD Unhedged) Index±± | 3.16 | % | ||
All Fund returns are net of fees and expenses.
± The MSCI World Index is a free float-adjusted market capitalization weighted index that is designed to measure the equity market performance of developed markets. As of May 27, 2010 the MSCI World Index consisted of the following 24 developed market country indices: Australia, Austria, Belgium, Canada, Denmark, Finland, France, Germany, Greece, Hong Kong, Ireland, Israel, Italy, Japan, Netherlands, New Zealand, Norway, Portugal, Singapore, Spain, Sweden, Switzerland, the United Kingdom, and the United States. The index represents the unhedged performance of the constituent stocks, in US dollars. It is not possible to invest directly in an unmanaged index.
±± The benchmark is a blend of 75% MSCI World Index/25% Barclays Capital Global Aggregate (USD Unhedged) Index. The MSCI World Index is a free float-adjusted market capitalization weighted index that is designed to measure the equity market performance of developed markets. As of May 27, 2010 the MSCI World Index consisted of the following 24 developed market country indices: Australia, Austria, Belgium, Canada, Denmark, Finland, France, Germany, Greece, Hong Kong, Ireland, Israel, Italy, Japan, Netherlands, New Zealand, Norway, Portugal, Singapore, Spain, Sweden, Switzerland, the United Kingdom, and the United States. The index represents the unhedged performance of the constituent stocks, in US dollars. Barclays Capital Global Aggregate (USD Unhedged) Index provides a broad-based measure of the global investment-grade fixed income markets. The three major components of this index are the U.S. Aggregate, the Pan-European Aggregate, and the Asian-Pacific Aggregate Indices. The index also includes Eurodollar and Euro-Yen corporate bonds, Canadian Government securities, and USD investment grade 144A securities. It is not possible to invest directly in an unmanaged index.
Performance quoted represents past performance. Past performance is not a guarantee or a reliable indicator of future results. Investment return and the principal value of an investment will fluctuate. Shares may be worth more or less than original cost when redeemed. Current performance may be lower or higher than performance shown. Returns shown do not reflect the deduction of taxes that a shareholder would pay on fund distributions or the redemption of fund shares. The adjusted returns take into account the maximum sales charge of 5.50% on A shares and 1.00% CDSC on C shares. The Fund’s total annual operating expense ratio as stated in the Fund’s current prospectus, as supplemented to date, is 1.01% for the Institutional Class shares, 1.11% for the Class P shares, 1.36% for the Class D shares, 1.36% for the Class A shares, 2.11% for the Class C shares and 1.61% for the Class R shares. Details regarding any Fund’s operating expenses can be found in the Fund’s prospectus. For performance current to the most recent month-end, visit www.pimco.com/investments.
A line graph is not included since the Fund has less than six months of performance.
Portfolio Insights
| » | The PIMCO Dividend and Income Builder Fund seeks to provide current income that exceeds the average yield on global stocks, and to provide a growing stream of income per share over time, with a secondary objective to provide long-term capital appreciation, by investing under normal circumstances at least 80% of its assets in a diversified portfolio of income-producing investments, and will typically invest at least 50% of its assets in equity and equity-related securities. The Fund’s investments in equity and equity-related securities include common and preferred stock (and securities convertible into, or that PIMCO expects to be exchanged for, common or preferred stock), as well as securities issued by real estate investment trusts, master limited partnerships and other equity trusts and depositary receipts. |
| » | The Fund commenced operations on December 14, 2011. |
| DECEMBER 31, 2011 | SEMIANNUAL REPORT | 7 |
Table of Contents
Insights from the Portfolio Managers PIMCO EqS Dividend Fund
Dear Shareholder,
We appreciate your investment in the PIMCO EqS Dividend Fund (the “Fund”). In the following letter, please find additional detail on the Fund’s investment process and philosophy, and why we believe dividend-paying equities offer a compelling investment opportunity.
Investment Process and Philosophy
The Fund was launched in December 2011 and is an actively managed, global portfolio that focuses on providing above-average yield today and long-term capital appreciation by investing in dividend-paying equities. The Fund benefits from the attention of our combined experience in managing portfolios of dividend paying stocks and fundamental equity research that leverages PIMCO’s global investment platform and macroeconomic expertise. The Fund is designed to offer investors the following three key benefits: 1) an actively managed portfolio of dividend-paying companies that have demonstrated an ability and willingness to increase dividend payments over time; 2) a global, flexible investment approach that provides access to what we believe are the most attractive income opportunities around the world; and 3) an investment strategy that has been enhanced by PIMCO’s macroeconomic expertise and global investment platform.
The objective of the Fund’s investment process is to build an active, diversified portfolio of well-positioned companies with strong prospects. The Fund seeks to invest in companies that pay an attractive dividend today and we believe have the ability and willingness to pay and grow dividends through a variety of economic scenarios. Additionally, the Fund seeks to invest in such companies at an attractive price.
The Fund’s investment process begins with a global investment universe. Ideas are generated through global travel to meet with companies, their competitors and suppliers, as well as industry conferences and interviews with industry experts. The Fund also uses a proprietary investment framework to narrow the vast investment universe to a high-potential focus list.
The Fund emphasizes fundamental, bottom-up analysis throughout its evaluation of the focus list and we evaluate capital allocation policies, scrubbed financial statements and footnotes, business models, and industry dynamics, as well as the current dividend yield. Once our team has a high-potential investment idea, we perform extensive due diligence.
Next, the Fund constructs proprietary financial models and uses a variety of valuation metrics which may vary by company, but tends to start with traditional parameters that helps us value anticipated cash flows and future growth. The Fund’s valuation analysis subjects
companies to thorough upside and downside stress testing, evaluating a wide range of possible and probable future outcomes. We believe this approach to valuation differs from most fundamental analysis which generally attempts to predict a specific outcome, such as an earnings estimate at a given point in time.
As part of the Fund’s portfolio construction process, the investment team considers the company’s life cycle stage. The Fund aims to invest in a diversified portfolio of companies, ranging from solid blue-chip companies that grow over time (consistent earners), to more cyclical companies (basic value), to companies that the investment team believes will grow quickly into the future (emerging franchises). The Fund’s exposures to each of these business types will depend on the risk/reward profile of the individual company and will also be influenced by PIMCO’s macroeconomic outlook.
In summary, the Fund’s investment approach combines bottom-up, fundamental research within a macroeconomic framework in order to maximize the total return potential of dividend-paying equities.
Dividend Paying-Equities Are a Compelling Asset Class
Dividend-paying equities may be an attractive long-term investment solution, especially in the current environment. With ten-year Treasury yields at historical lows, the dividend yield on global stocks can be particularly attractive. Additionally, PIMCO believes that select companies have considerable potential to increase dividend payments, as corporate cash on balance sheets is at record highs while dividend payout ratios have declined.
Historically, dividends have been important to total return, as more than half of historical equity returns have been explained by dividend income. Also, the lower standard deviation of dividend-oriented equities has the potential to reduce portfolio volatility, as dividend-per-share growth has been more consistent than earnings-per-share growth. Given the historically less volatile nature of dividend-paying equities, investing in dividend-paying stocks may help dampen volatility.
We believe that quality fundamental research is the key to selecting dividend-paying equities, as simply chasing the highest yields is not an optimal strategy. While many studies have shown that high dividend stocks outperform over time, the best performers have been companies that pay high, but not the highest, dividends. Additionally, the rate of dividend growth has been the key driver of returns.
PIMCO also believes that global stocks offer a range of dividend growth and capital appreciation opportunities, in addition to their diversification benefits. Non-U.S. companies have consistently offered
| 8 | PIMCO EQUITY SERIES |
Table of Contents
more attractive dividend yields, and companies outside the U.S. typically pay out more of their earnings in the form of dividends.
The Fund’s global, flexible investment approach and strategy, supplemented with PIMCO’s macroeconomic expertise and global investment platform, mean that the Fund is designed to take advantage of what we believe are the most attractive opportunities in dividend-paying equities around the world.
We thank you for your investment in the Fund.
Sincerely,
| | |
| | |
Brad Kinkelaar Co-Portfolio Manager | Cliff Remily, CFA Co-Portfolio Manager | |
Top Holdings1
Microsoft Corp. | 4.7% | |||||
Carillion PLC | 4.2% | |||||
Lockheed Martin Corp. | 3.8% | |||||
Novartis AG | 3.7% | |||||
Pfizer, Inc. | 3.7% | |||||
PepsiCo, Inc. | 3.4% | |||||
Medtronic, Inc. | 3.4% | |||||
Tesco PLC | 3.3% | |||||
Wal-Mart Stores, Inc. | 3.2% | |||||
Roche Holding AG | 3.2% |
Geographic Breakdown1
United States | 36.9% | |||||
United Kingdom | 14.8% | |||||
Switzerland | 6.9% | |||||
China | 4.3% | |||||
France | 3.3% | |||||
Australia | 2.9% | |||||
South Africa | 2.7% | |||||
Brazil | 2.5% | |||||
Hong Kong | 2.3% | |||||
Japan | 2.1% | |||||
Canada | 1.6% | |||||
Thailand | 1.6% | |||||
Other | 4.1% |
Sector Breakdown1
Consumer Staples | 22.1% | |||||
Health Care | 19.1% | |||||
Industrials | 17.2% | |||||
Financials | 6.1% | |||||
Information Technology | 5.8% | |||||
Materials | 5.1% | |||||
Consumer Discretionary | 3.8% | |||||
Telecommunication Services | 2.7% | |||||
Energy | 2.2% | |||||
Utilities | 1.9% |
| 1 | % of Total Investments as of 12/31/2011. Top Holdings, Geographic and Sector Breakdown solely reflect long positions. Financial derivative instruments and short-term instruments are not taken into consideration. |
| DECEMBER 31, 2011 | SEMIANNUAL REPORT | 9 |
Table of Contents
| Institutional Class - PQDIX | Class A - PQDAX | |
| Class P - PQDPX | Class C - PQDCX | |
Class D - PQDDX | Class R - PQDRX |
| Cumulative Total Return for the period ended December 31, 2011 | ||||
| Fund Inception (12/14/11) | ||||
| PIMCO EqS Dividend Fund Institutional Class | 1.82 | % | ||
| PIMCO EqS Dividend Fund Class P | 1.82 | % | ||
| PIMCO EqS Dividend Fund Class D | 1.81 | % | ||
| PIMCO EqS Dividend Fund Class A | 1.81 | % | ||
| PIMCO EqS Dividend Fund Class A (adjusted) | -3.79 | % | ||
| PIMCO EqS Dividend Fund Class C | 1.80 | % | ||
| PIMCO EqS Dividend Fund Class C (adjusted) | 0.80 | % | ||
| PIMCO EqS Dividend Fund Class R | 1.80 | % | ||
| MSCI World Index± | 3.89 | % | ||
All Fund returns are net of fees and expenses.
± The MSCI World Index is a free float-adjusted market capitalization weighted index that is designed to measure the equity market performance of developed markets. As of May 27, 2010 the MSCI World Index consisted of the following 24 developed market country indices: Australia, Austria, Belgium, Canada, Denmark, Finland, France, Germany, Greece, Hong Kong, Ireland, Israel, Italy, Japan, Netherlands, New Zealand, Norway, Portugal, Singapore, Spain, Sweden, Switzerland, the United Kingdom, and the United States. The index represents the unhedged performance of the constituent stocks, in US dollars. It is not possible to invest directly in an unmanaged index.
Performance quoted represents past performance. Past performance is not a guarantee or a reliable indicator of future results. Investment return and the principal value of an investment will fluctuate. Shares may be worth more or less than original cost when redeemed. Current performance may be lower or higher than performance shown. Returns shown do not reflect the deduction of taxes that a shareholder would pay on fund distributions or the redemption of fund shares. The adjusted returns take into account the maximum sales charge of 5.50% on A shares and 1.00% CDSC on C shares. The Fund’s total annual operating expense ratio as stated in the Fund’s current prospectus, as supplemented to date, is 1.01% for the Institutional Class shares, 1.11% for the Class P shares, 1.36% for the Class D shares, 1.36% for the Class A shares, 2.11% for the Class C shares and 1.61% for the Class R shares. Details regarding any Fund’s operating expenses can be found in the Fund’s prospectus. For performance current to the most recent month-end, visit www.pimco.com/investments.
A line graph is not included since the Fund has less than six months of performance.
Portfolio Insights
| » | The PIMCO EqS Dividend Fund seeks to provide current income that exceeds the average yield on global stocks, and a secondary objective to provide long-term capital appreciation, by investing under normal circumstances at least 75% of its assets in equity and equity-related securities, including common and preferred stock (and securities convertible into, or that PIMCO expects to be exchanged for, common or preferred stock), as well as securities issued by real estate investment trusts, master limited partnerships and other equity trusts and depository receipts. |
| » | The Fund commenced operations on December 14, 2011. |
| 10 | PIMCO EQUITY SERIES |
Table of Contents
Insights from the Portfolio Managers PIMCO EqS Emerging Markets Fund
Dear Shareholder,
We appreciate your investment in the PIMCO EqS Emerging Markets Fund (the “Fund”). In the following letter, please find a discussion of the recent market environment, a brief description of our philosophy and process, as well as a review of recent portfolio performance.
Market Overview
Over the past six months, equity returns were dominated by macroeconomic developments, most notably the ongoing Eurozone debt and austerity issues. Questions remain as to the future of the European Union and the potential for contagion to the global economy. Correspondingly, the market has been in a “risk off” position for much of the second half of the year and as a result, assets perceived to be riskier, such as emerging market equities, underperformed other asset classes.
Despite recent underperformance, we maintain our long-term view that emerging market (EM) economic growth will exceed that of developed markets. We continue to believe that emerging economies look more robust than their developed market peers on many traditional macroeconomic metrics, including current account balances, degree of indebtedness, foreign currency reserves and fiscal balances. In addition, higher growth rates in emerging economies are contributing to a burgeoning wealth effect that supports an expansion of the emerging market middle class and which may lead to stronger and more durable domestic consumption trends. In our opinion, these fundamental factors are likely to support improved profitability among emerging market companies and thus, the compelling nature of the investment opportunity in emerging market equities.
At PIMCO, we are forecasting a global market environment that continues to be driven by policy uncertainty and political paralysis. We believe the European debt crisis will enter an acute phase, as deleveraging and austerity measures create headwinds for global growth. While emerging market economies benefit from the powerful secular trends referenced above, they are clearly not immune from the challenges faced by developed economies, particularly as much of their growth has been driven by exports. A silver lining in this global slowdown is that inflation has slowed faster than expected in emerging markets. We believe this will allow emerging market central banks to ease monetary policy, potentially stimulating domestic demand to offset the weakness in global demand. In our view, equity valuations reflect slowing global growth, and while policy uncertainty is likely to result in high volatility in the shorter term, we believe attractive valuations could represent opportunity for the long-term investor.
Investment Philosophy and Process
We launched PIMCO’s EM equity strategy in March 2011 with the objective of assembling a team and designing an investment approach that we believe will deliver a compelling opportunity for investors to capture attractive risk-adjusted returns. Given the complexities of the EM landscape, it was important to us that our process incorporate several key characteristics: 1) an experienced team of investors who perform fundamental, company-specific research; 2) the ability to leverage PIMCO’s time-tested EM expertise and incorporate the macroeconomic insights of the broader PIMCO investment platform; and 3) proactive risk management designed to hedge the portfolio in periods of extreme market stress.
Our approach begins with fundamental research, evaluating an unconstrained universe of potential investments and focusing on the anticipated beneficiaries of emerging market growth with a goal of not limiting the opportunity set or being bound by the parameters of a benchmark. To be successful in EM equities, we feel it is essential that the investment process fully incorporate top-down considerations. In our investment process, we look to leverage PIMCO’s carefully vetted global macroeconomic outlook, which is driven by the firm’s Investment Committee and secular and cyclical forums. This macro framework is key not only to assessing country and currency factors, but also in helping us identify themes that may have implications for industries and the path of earnings of individual companies.
By combining a bottom-up perspective with macroeconomic insights, and by placing a particular emphasis on patience with entry points, we believe that macro volatility and shorter EM business cycles will provide us with ample opportunities to enter a strong equity story with an appropriate cushion. However, we also recognize that emerging market equities can be a volatile asset class and may experience periodic, broad-based drawdowns, so rigorous risk management is essential. Therefore we also employ tail-risk hedging strategies that are designed to help guard against the risk of a large sell-off across EM equities. Tail-risk management involves hedging against those unforeseeable crises that appear as outlying ‘tails’ on bell-shaped ‘normal’ curves of possible outcomes and that can have devastating effects on a portfolio.
In summary, our approach is research intensive, and by combining bottom-up, fundamental research with macroeconomic insights and focused risk management, we believe we can deliver attractive risk-adjusted returns for our clients over the long term.
Fund Review
In this environment, the PIMCO Eqs Emerging Markets Fund underperformed its benchmark over the reporting period. The primary
| DECEMBER 31, 2011 | SEMIANNUAL REPORT | 11 |
Table of Contents
Insights from the Portfolio Managers PIMCO EqS Emerging Markets Fund (Cont.)
driver of the underperformance for the period was an overweight to small market capitalization companies, which were down more than larger companies. Over the long term, we believe these types of investments offer greater opportunity for an active manager since we believe the market tends to be more inefficient and historically there have been fewer professional analysts covering these names.
The largest detractor for the period was Boshiwa, a retailer of children’s products in China, which led consumer discretionary and China to be the top detracting groups for the reporting period. Shares of the company fell after management reported first-half profits that fell below analyst estimates. The earnings miss was due to slower new store openings, higher than expected marketing expenses, and a foreign exchange loss. While we still have a positive outlook on Boshiwa’s ability to gain share in a fragmented market, we are continuing to monitor execution to determine the long term prospects for the company.
Our positioning within telecommunications services also detracted from returns as well as an overall underweight to the sector. In particular, we did not own any Chinese telecommunications companies, which held up better than other companies in the slowing global environment.
On the positive side, strong stock selection in consumer staples companies contributed to performance. In particular, British American Tobacco was a top contributor to relative returns. This is an example of an investment in a developed market company that has emerging market growth drivers. The company is a global tobacco group with a presence in over 180 countries and leading market share in over 50. One such subsidiary is Souza Cruz in Brazil, which we continue to believe is not fully valued at the combined company level.
The top relative contributor for the period was Creditcorp, a Peruvian bank. The company has positive growth drivers, such as good economic growth in the country but also a solid capital ratio and low loan-deposit ratio to take advantage of its strong market position.
Conclusion
As we enter 2012, we are positioning the portfolio relatively defensively, focusing on yield and value and selectively adding to stocks that we believe are trading at attractive valuations relative to long-term fundamentals. We believe there are opportunities to invest in companies that are consistent earners and less sensitive to a global slowdown, as well as companies with attractive dividends that are sustainable or, ideally, growing. As a result, we are focused on initiating investments or adding to positions in companies with strong balance sheets that exhibit pricing power and generate cash flow that we believe are capable of generating superior returns over time.
Although macroeconomic concerns have increased uncertainty in the global equity markets, we believe that emerging markets present an attractive opportunity for long-term investors. Furthermore, we believe our philosophy and investment process are well prepared to navigate these types of environments.
Again, we thank you for your continued investment in the Fund and look forward to serving your investment needs.
Sincerely,
Maria (Masha) Gordon Portfolio Manager |
| 12 | PIMCO EQUITY SERIES |
Table of Contents
Top Holdings1
Samsung Electronics Co. Ltd. | 5.5% | |||||
AIA Group Ltd. | 2.7% | |||||
Hon Hai Precision Industry Co. Ltd. | 2.3% | |||||
Bezeq The Israeli Telecommunication Corp. Ltd. | 2.0% | |||||
AngloGold Ashanti Ltd. SP—ADR | 2.0% | |||||
Credicorp Ltd. | 1.7% | |||||
Itau Unibanco Holding S.A. SP—ADR | 1.6% | |||||
Honda Motor Co. Ltd. | 1.5% | |||||
BOCI-Prudential—W.I.S.E. Fund | 1.5% | |||||
First Gen Corp. | 1.4% |
Geographic Breakdown1
China | 9.9% | |||||
South Korea | 9.8% | |||||
Hong Kong | 7.3% | |||||
Taiwan | 5.8% | |||||
Israel | 4.0% | |||||
India | 4.0% | |||||
United Kingdom | 3.7% | |||||
United States | 3.2% | |||||
Brazil | 2.8% | |||||
Thailand | 2.7% | |||||
South Africa | 2.6% | |||||
Australia | 1.9% | |||||
Peru | 1.7% | |||||
Russia | 1.6% | |||||
Japan | 1.5% | |||||
Other | 15.1% |
Sector Breakdown1
Financials | 14.0% | |||||
Industrials | 12.3% | |||||
Materials | 11.0% | |||||
Information Technology | 9.3% | |||||
Energy | 7.7% | |||||
Consumer Staples | 5.6% | |||||
Exchange-Traded Funds | 4.9% | |||||
Consumer Discretionary | 4.9% | |||||
Telecommunication Services | 3.8% | |||||
Utilities | 2.8% | |||||
Health Care | 1.2% |
| 1 | % of Total Investments as of 12/31/2011. Top Holdings, Geographic and Sector Breakdown solely reflect long positions. Securities sold short, financial derivative instruments and short-term instruments are not taken into consideration. |
| DECEMBER 31, 2011 | SEMIANNUAL REPORT | 13 |
Table of Contents
PIMCO EqS Emerging Markets Fund
| Institutional Class - PEQWX | Class A - PEQAX | |
| Class P - PEQQX | Class C - PEQEX | |
| Administrative Class - PEQTX | Class R - PEQHX | |
| Class D - PEQDX |
Cumulative Returns Through December 31, 2011
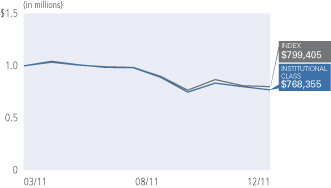
| Cumulative Total Return for the period ended December 31, 2011 | ||||||||||
| 6 Months | Fund Inception (03/22/11) | |||||||||
 | PIMCO EqS Emerging Markets Fund Institutional Class | -21.81% | -20.32% | |||||||
| PIMCO EqS Emerging Markets Fund Class P | -21.72% | -20.23% | ||||||||
| PIMCO EqS Emerging Markets Fund Administrative Class | -21.91% | -20.51% | ||||||||
| PIMCO EqS Emerging Markets Fund Class D | -21.93% | -20.52% | ||||||||
| PIMCO EqS Emerging Markets Fund Class A | -21.99% | -20.59% | ||||||||
| PIMCO EqS Emerging Markets Fund Class A (adjusted) | -26.26% | -24.94% | ||||||||
| PIMCO EqS Emerging Markets Fund Class C | -22.23% | -20.91% | ||||||||
| PIMCO EqS Emerging Markets Fund Class C (adjusted) | -23.01% | -21.70% | ||||||||
| PIMCO EqS Emerging Markets Fund Class R | -22.01% | -20.61% | ||||||||
 | MSCI Emerging Markets Index± | -19.13% | -16.39% | |||||||
All Fund returns are net of fees and expenses.
± MSCI (Morgan Stanley Capital International) Emerging Markets Index is a free float-adjusted market capitalization index that is designed to measure emerging market equity performance. It is not possible to invest directly in an unmanaged index.
Performance quoted represents past performance. Past performance is not a guarantee or a reliable indicator of future results. Investment return and the principal value of an investment will fluctuate. Shares may be worth more or less than original cost when redeemed. Current performance may be lower or higher than performance shown. Returns shown do not reflect the deduction of taxes that a shareholder would pay on fund distributions or the redemption of fund shares. The adjusted returns take into account the maximum sales charge of 5.50% on A shares and 1.00% CDSC on C shares. The Fund’s total annual operating expense ratio as stated in the Fund’s current prospectus, as supplemented to date, is 1.49% for the Institutional Class shares, 1.59% for the Class P shares, 1.74% for the Administrative Class shares, 1.84% for the Class D shares, 1.84% for the Class A shares, 2.59% for the Class C shares and 2.09% for the Class R shares. Details regarding any Fund’s operating expenses can be found in the Fund’s prospectus. For performance current to the most recent month-end, visit www.pimco.com/investments.
Portfolio Insights
| » | The PIMCO EqS Emerging Markets Fund seeks capital appreciation by investing under normal circumstances at least 80% of its assets in a diversified portfolio of investments economically tied to emerging market countries. The Fund will invest a substantial portion of its assets in equity and equity-related securities, including common and preferred stock (and securities convertible into, or that PIMCO expects to be exchanged for, common or preferred stock). The Fund may also invest in fixed income securities, including debt securities issued by both corporate and government issuers. The Fund may invest in commodity related instruments, including exchange-traded funds, futures and other investment companies. The Fund may also invest in derivative instruments, such as options, futures contracts or swap agreements. |
| » | During the reporting period, the Fund’s Institutional class shares declined 21.81% after fees, and the Fund’s benchmark index, the MSCI Emerging Markets Index, declined 19.13%. The Fund underperformed its benchmark by 2.68% after fees. |
| » | From a sector perspective, positive stock selection within consumer staples, including a U.K.-based tobacco group and a Brazilian food company, contributed to the Fund’s performance as these securities appreciated during the reporting period. Fund holdings in financials, including a well-capitalized Peruvian bank, also added to returns as these securities appreciated during the reporting period. |
| » | On the downside, weakness within the consumer discretionary sector, including exposure to a small market capitalization Chinese retailer, detracted from performance as these securities depreciated during the reporting period. Select holdings within the telecommunications sector and an underweight to the sector in general, detracted from performance as the sector outperformed during the reporting period. |
| » | From a country perspective, stock selection and an overweight to Peru contributed to performance relative to the Fund’s benchmark index. Positive stock selection within South Korea also added to returns. |
| » | On the downside, select holdings in China and Mexico detracted from results as these securities depreciated during the reporting period. |
| 14 | PIMCO EQUITY SERIES |
Table of Contents
Insights from the Portfolio Managers PIMCO Emerging Multi-Asset Fund
Dear Shareholder,
We appreciate your investment in the PIMCO Emerging Multi-Asset Fund (the “Fund”). It’s a pleasure to give you our first full semiannual update since the launch of the Fund in April 2011, including a discussion on our investment outlook with a focus on the emerging markets as well as an update on portfolio performance over the six-month reporting period ended December 31, 2011.
Emerging Markets Continue to be a Compelling Long-term Investment Opportunity
We continue to have high conviction regarding the long-term economic strength of emerging countries in general. As a group, emerging market (EM) countries are in the midst of a secular increase in global economic importance and we believe they are better positioned than their developed market peers when evaluated on many traditional macroeconomic metrics, including current account balances, degree of indebtedness, foreign currency reserves, and fiscal balances. These fundamental factors, combined with generally favorable demographics and rising productivity rates, should support higher Gross Domestic Product (GDP) growth rates. This in turn contributes to a wealth effect that would support an expansion of the EM middle class and stronger domestic consumption trends.
We believe EM asset classes stand to benefit from increased investor demand as they evolve from a satellite allocation to a core holding in portfolios. EM equities are likely to benefit from the earnings growth and capital appreciation potential of companies based in leading EM countries. The sovereign debt of EM countries, including what we consider to be low levels of indebtedness, strong growth prospects, and higher yields than debt from leading developed nations, may contribute to the potential for attractive returns with lower volatility than global equities. EM currencies in these favorably differentiated countries also stand to benefit as capital continues to flow into these economies, both for consumption and investment purposes.
Still, there are risks to be cognizant of. The EM universe is not homogeneous; some countries benefit from stronger initial economic conditions, while others are further behind on the evolution to developed market status. Also, these economies and their financial markets may continue to exhibit higher volatility and sensitivity to global economic shocks, particularly over short-term horizons. Despite the need to remain vigilant to these risks, we continue to believe that EM economies will support attractive long-term returns for investors who consider the spectrum of liquid EM investments—equities, fixed income, and currencies.
Managers’ Discussion & Market Overview
Since our June 2011 letter, global financial markets, and particularly those in EM countries, have experienced increased bouts of volatility. This can largely be attributed to the uncertainty and overall negative investor sentiment resulting from the ongoing Eurozone sovereign debt crisis. We have been diligently monitoring the crisis and
evaluating its potential knock-on effects to EM regions and asset classes. As always, portfolio themes and asset allocation decisions continue to be driven by PIMCO’s investment process, which is based off of our firm-wide macroeconomic, forward-looking investment views. These views emanate from our secular (3-5 year horizon) and quarterly cyclical (6-12 month horizon) economic forums and are then refined by our firm’s Investment Committee in order to determine key exposures that we want to either obtain or avoid in the Fund.
While the Fund’s performance over the reporting period lagged the returns of the Fund’s secondary benchmark (a blended index consisting of 50% EM Equities / 25% EM Local Sovereign Debt / 25% EM External Sovereign Debt), the Fund produced its returns with approximately three-quarters the volatility of the blended index. Additionally, it is worth noting, the Fund did outperform its primary benchmark, the MSCI Emerging Markets Index.
During the reporting period, EM asset returns were mainly lower, with EM external sovereign debt being the lone asset class with positive returns. August and September were particularly difficult months for EM asset classes, driven by Standard & Poor’s downgrade of U.S. long-term debt in August, followed by concerns that the Eurozone crisis would engulf peripheral economies and not be merely limited to Greece. EM equities, as represented by the MSCI Emerging Markets Index, returned -22.2% over these two months. However, October saw a quick reversal of investor pessimism as news of a newly agreed upon rescue plan was announced. As a result, EM equities rebounded 13.2% in October. However, this rally was short lived as the period ended with further selling over debt concerns in Europe, specifically, the realization that the entire Eurozone and even the global economy were at risk.
In light of all the market volatility and global uncertainty, the Fund had a generally defensive, selectively offensive allocation during the period. The Fund’s allocation to EM equities was trimmed, moving from a modest overweight to an underweight relative to the 50% weighting of Fund’s blended benchmark. This underweight positioning benefited the Fund’s relative performance during the period as EM equities, as measured by the MSCI Emerging Markets Index, returned -19.1% during the six-month period. EM equities were mainly driven lower by the general “risk-off” sentiment in the market. Given the ongoing crisis in the Eurozone during the period, EM Europe was the worst performing region in the index as investors feared the crisis could most immediately affect the EM nations in closest proximity to and most reliant on the economic health of the Eurozone. On the other hand, Asia and Latin America both outperformed the benchmark over the period as these regions seemed most resilient to the crisis, though not without their own concerns of slowing growth.
As mentioned previously, the lone asset class to post positive returns for the second half of 2011 was external denominated EM sovereign debt. The JPMorgan Emerging Markets Bond Index Global returned 3.2% over this period. The two main drivers of the positive returns were the rally in U.S. Treasuries amid a global flight to safety, and the strength of EM sovereign balance sheets as compared to their
| DECEMBER 31, 2011 | SEMIANNUAL REPORT | 15 |
Table of Contents
Insights from the Portfolio Managers PIMCO Emerging Multi-Asset Fund (Cont.)
developed market counterparts, which helped limit a rise in the yield premium of these bonds versus U.S. Treasuries. During the period, the 10-year U.S. Treasury bond saw its yield decline 1.28%, as investors’ risk aversion regarding a potential slowing global economy fueled by the European debt crisis trumped the concerns emanating from the U.S. which were highlighted by the Standard & Poor’s ratings downgrade. While the spreads of the external denominated EM sovereign debt did increase by 1.38% above the 10-year U.S. Treasury, investors still viewed sovereign balance sheets being more pristine and less debt-laden than many developed market sovereign balance sheets. This view was highlighted toward the end of the period as Brazil and Peru both had their debt ratings increased (both external and local denominated debt) by Standard & Poor’s and Fitch, respectively, based on their perceived ability to maintain strong fundamentals and balance sheets amid the global growth slowdown and debt crises. Recognizing that these characteristics of external EM debt make a more defensive asset, and further recognizing that their U.S. dollar denomination would likely benefit (versus local EM currency denominated bonds) in period of risk aversion or heightened volatility, the Fund’s allocation to external denominated EM debt was increased throughout the period. However, the Fund’s positioning remained underweight relative to the 25% weight in the blended index, which detracted from relative performance.
While external denominated EM sovereign debt benefited from its relationship to U.S. Treasury yields, EM local denominated debt suffered, primarily because investors shunned EM currencies during this period of heighted volatility, as these currencies are perceived to be riskier than the U.S. dollar. EM local denominated debt, as measured by the JPMorgan Government Bond Index-Emerging Markets Global Diversified, returned -8.1% during the period. Despite the negative impact of local currency exposure on total returns, the impact of local yields was positive across all regions during the period on the strength of local sovereign balance sheets. On a relative basis, the Fund’s performance benefited from an underweight allocation to EM local sovereign debt. Unfortunately, this benefit was partially offset by an additional allocation made to EM currencies as the JPMorgan Emerging Local Markets Index Plus returned -9.9% during the period.
The Fund’s alpha strategies (alpha being the excess return relative to the benchmark) are comprised of security selection or other relative value strategies held either in underlying PIMCO funds as a means of gaining EM asset class exposure or held directly in the Fund as individual positions. During the period, alpha strategies within underlying PIMCO funds detracted from relative performance on an aggregate basis. The largest negative contributor was alpha from EM equities. The EM equity strategy lagged the MSCI Emerging Markets Index due in part to security selection within China and Mexico. The remaining strategies, on an aggregate basis, did provide positive alpha to the Fund relative their respective benchmarks with the EM local sovereign debt strategy being the largest contributor. The strategy benefited from its overweight to Brazilian debt and an underweight to Hungarian debt relative to its benchmark.
Lastly, one of the key differentiators of PIMCO’s asset allocation approach is the inclusion of active tail-risk hedging. Tail-risk hedging involves acquiring targeted instruments such as equity put options that are designed to limit the Fund’s loss potential in the event of a large market downturn. Tail-risk hedging seeks to increase the Fund’s long-term return potential relative to unhedged asset allocation approaches. In market environments characterized by negative equity returns and heightened volatility, tail-risk hedges can help to mitigate downside risk and also potentially add to overall returns. As an example, during the second half of 2011, the S&P 500 Index returned -3.7%, while the CBOE Volatility Index (which is a measure of general market volatility known as the VIX in which the lower the value of the VIX then the lower the market volatility) began the period at 16.52 and ended at 23.40 (spiking as high at 48 in August 2011). In this environment, therefore, the Fund’s tail-risk hedging strategy provided a positive contribution to returns. Specifically, when market volatility was extremely high during August, the Fund was able to monetize selected tail-risk hedges, and capture the gains.
Outlook
PIMCO’s investment views are based on our firm’s secular (3-5 year) and cyclical (6-12 month) outlooks. Our secular outlook has identified structural headwinds to growth in the developed world, most notably debt deleveraging, whereas EM growth should continue to outpace that of developed economies. As such, we believe EM nations will see continued convergence of wealth and income levels toward those of developed nations. This helps speak to the relative attractiveness of EM equities, debt, and currencies over the secular horizon, given our projected higher regional growth rates, stronger sovereign balance sheets, and continued expected capital inflows.
Over the cyclical horizon we expect economic uncertainty and financial market volatility to persist around a baseline view of slowing global growth. As policymakers struggle to resolve the Eurozone debt crisis, we expect Europe to tip into a recession, which will weigh on global growth rates. There also exists the potential for a disorderly escalation of the European debt crisis, which could create a tail risk scenario of a severe recession in that region and more significant knock-on effects to other developed and developing economies.
In light of this continued uncertainty and the forecasted slowing global growth, we will look to position the Fund in a generally defensive manner while being selectively offensive, consistent with our supportive secular view of EM. In the near-term, we expect to maintain an underweight to EM equities as global growth slows and risks remain skewed to the downside, but we will look for opportunities to add to positions at attractive valuations should markets decline. Within our fixed income allocation, we also expect to remain underweight since EM debt sectors may exhibit co-movement with EM equities, particularly in periods of stress. Consistent with this defensive posture, we expect to maintain an elevated cash position in order to retain the optionality of making tactical purchases of EM asset classes as lower prices during periods of expected ongoing volatility. Within the fixed income allocation we expect to continue
| 16 | PIMCO EQUITY SERIES |
Table of Contents
allocating across local sovereign debt, external sovereign debt, and EM corporate debt, which contribute a mix of interest rate, sovereign, and credit exposures designed to enhance the portfolio’s yield. Lastly, we continue to maintain a mix of tail-risk hedges in order to help mitigate Fund losses should a period of stress emerge. We believe that emerging markets present an attractive opportunity for the investor who remains focused on the long-term opportunity, who has the ability to navigate evolving risks and opportunities in the short-term, and who has preemptively prepared by hedging against the impact of surprise negative events. These three elements are what we strive to deliver to our investors in the PIMCO Emerging Multi-Asset Fund.
Again, we thank you for your continued investment in the Fund and look forward to serving your investment needs.
Sincerely,
 |  | |
 |  | |
| Curtis Mewbourne | Maria (Masha) Gordon | |
| Portfolio Manager, Generalist | Portfolio Manager, Emerging Markets Equities | |
 |  | |
 |  | |
| Michael Gomez | Ramin Toloui | |
| Portfolio Manager, Emerging Markets Local Debt | Portfolio Manager, Emerging Markets External Debt | |
Top Holdings1
PIMCO EqS Emerging Markets Fund | 29.3% | |||||
PIMCO Emerging Local Bond Fund | 20.4% | |||||
PIMCO Emerging Markets Bond Fund | 17.6% | |||||
Vanguard MSCI Emerging Markets ETF | 8.9% | |||||
PIMCO Emerging Markets Corporate Bond Fund | 2.9% | |||||
PIMCO Emerging Markets Currency Fund | 1.9% |
| 1 | % of Total Investments as of 12/31/2011. Top Holdings, Geographic and Sector Breakdown solely reflect long positions. Financial derivative instruments and short-term instruments are not taken into consideration. |
| DECEMBER 31, 2011 | SEMIANNUAL REPORT | 17 |
Table of Contents
PIMCO Emerging Multi-Asset Fund
| Institutional Class - PEAWX | Class A - PEAAX | |
| Class P - PEAQX | Class C - PEACX | |
| Administrative Class - PEAMX | Class R - PEARX | |
| Class D - PEAEX |
Cumulative Returns Through December 31, 2011
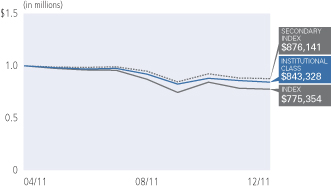
| Cumulative Total Return for the period ended December 31, 2011 | ||||||||||
| 6 Months | Fund Inception (04/12/11) | |||||||||
| PIMCO Emerging Multi-Asset Fund Institutional Class | -12.77% | -13.73% | |||||||
| PIMCO Emerging Multi-Asset Fund Class P | -12.91% | -13.78% | ||||||||
| PIMCO Emerging Multi-Asset Fund Administrative Class | -12.97% | -13.93% | ||||||||
| PIMCO Emerging Multi-Asset Fund Class D | -12.99% | -13.95% | ||||||||
| PIMCO Emerging Multi-Asset Fund Class A | -12.94% | -13.98% | ||||||||
| PIMCO Emerging Multi-Asset Fund Class A (adjusted) | -17.72% | -18.71% | ||||||||
| PIMCO Emerging Multi-Asset Fund Class C | -13.32% | -14.36% | ||||||||
| PIMCO Emerging Multi-Asset Fund Class C (adjusted) | -14.18% | -15.21% | ||||||||
| PIMCO Emerging Multi-Asset Fund Class R | -13.09% | -14.13% | ||||||||
| MSCI Emerging Markets Index± | -19.13% | -20.56% | |||||||
 | 50% MSCI Emerging Markets Index, 25% JPMorgan Emerging Markets Bond Index (EMBI) Global, 25% JPMorgan Government Bond Index-Emerging Markets Global Diversified Index (Unhedged)±± | -10.95% | -10.54% | |||||||
All Fund returns are net of fees and expenses.
± MSCI (Morgan Stanley Capital International) Emerging Markets Index is a free float-adjusted market capitalization index that is designed to measure emerging market equity performance. It is not possible to invest directly in an unmanaged index.
±± The benchmark is a blend of 50% MSCI Emerging Markets Index, 25% JPMorgan Emerging Markets Bond Index (EMBI) Global, 25% JPMorgan Government Bond Index-Emerging Markets Global Diversified Index (Unhedged) . MSCI Emerging Markets Index is a free float-adjusted market capitalization index that is designed to measure equity market performance of emerging markets. As of May 27, 2010 the MSCI Emerging Markets Index consisted of the following 21 emerging market country indices: Brazil, Chile, China, Colombia, Czech Republic, Egypt, Hungary, India, Indonesia, Korea, Malaysia, Mexico, Morocco, Peru, Philippines, Poland, Russia, South Africa, Taiwan, Thailand, and Turkey. JPMorgan Emerging Markets Bond Index (EMBI) Global tracks total returns for United States Dollar denominated debt instruments issued by emerging market sovereign and quasi-sovereign entities: Brady bonds, loans, Eurobonds and local market instruments. It is not possible to invest directly in an unmanaged index. JPMorgan Government Bond Index-Emerging Markets Global Diversified Index (Unhedged) is a comprehensive global local emerging markets index, and consists of regularly traded, liquid fixed-rate, domestic currency government bonds to which international investors can gain exposure.
Performance quoted represents past performance. Past performance is not a guarantee or a reliable indicator of future results. Investment return and the principal value of an investment will fluctuate. Shares may be worth more or less than original cost when redeemed. Current performance may be lower or higher than performance shown. Returns shown do not reflect the deduction of taxes that a shareholder would pay on fund distributions or the redemption of fund shares. The adjusted returns take into account the maximum sales charge of 5.50% on A shares and 1.00% CDSC on C shares. The Fund’s total annual operating expense ratio as stated in the Fund’s current prospectus, as supplemented to date, is 2.24% for the Institutional Class shares, 2.34% for the Class P shares, 2.49% for the Administrative Class shares, 2.59% for the Class D shares, 2.59% for the Class A shares, 3.34% for the Class C shares and 2.84% for the Class R shares. Details regarding any Fund’s operating expenses can be found in the Fund’s prospectus. For performance current to the most recent month-end, visit www.pimco.com/investments.
Portfolio Insights
| » | The PIMCO Emerging Multi-Asset Fund seeks maximum total return, consistent with prudent investment management, by investing under normal circumstances at least 80% of its assets in investments economically tied to emerging market countries. The Fund will typically invest 20% to 80% of its total assets in equity-related instruments (including investments in common stock, preferred stock, and equity-related Underlying PIMCO Funds or Acquired Funds). The Fund is designed to provide concurrent exposure to a broad spectrum of emerging market asset classes, such as equity, fixed income and currencies, and other investments, including commodities. |
| » | During the reporting period, the Fund’s Institutional class shares declined 12.77% after fees, and the Fund’s secondary benchmark index, a blended index consisting of 50% MSCI World Index / 25% JPMorgan Government Bond Index—Emerging Markets Global Diversified Index (Unhedged) / 25% JPMorgan Emerging Markets Bond Index Global, declined 10.95%. The Fund underperformed its secondary benchmark index by 1.82% after fees. |
| » | Asset allocation decisions to underweight emerging market equities contributed to relative performance as the MSCI Emerging Markets Index declined 19.13% over the reporting period. |
| » | A tactical underweight to emerging market local denominated sovereign debt contributed to relative performance as the JPMorgan Global Bond Index—Emerging Markets Global Diversified Index (Unhedged) declined 8.12% over the reporting period. |
| » | An underweight to emerging market external denominated sovereign debt detracted from relative performance as the JPMorgan Emerging Markets Bond Index Global returned 3.21% over the reporting period. |
| » | An allocation to emerging market corporate bonds detracted from performance as the JPMorgan Corporate Emerging Markets Bond Index Diversified declined 0.20% over the reporting period. |
| » | An allocation to emerging market currencies detracted from performance as the JPMorgan Emerging Local Markets Index PLUS Composite declined 9.85% over the reporting period. |
| » | Tail-risk hedges on emerging market equities contributed to relative performance as emerging markets equities, as measured by the MSCI Emerging Markets Index, declined over the reporting period. |
| 18 | PIMCO EQUITY SERIES |
Table of Contents
Insights from the Portfolio Managers PIMCO EqS Pathfinder Fund™
Dear Shareholder,
Thank you to all who have invested in the PIMCO EqS Pathfinder Fund™ (the “Fund”) since its launch in April of 2010. For all those who are reading and have an interest in the Fund, we have organized our thoughts to update you on the current state of the investment world, on the Fund itself and on our outlook.
Review of the Last Period
For the six-month reporting period ended December 31, 2011, your investment in the Fund outperformed its benchmark, the MSCI World Index, despite posting negative returns. The Fund’s outperformance relative to its benchmark occurred during a period marked by extremely high correlation across securities, distinct “risk on” and “risk off” modes within the market, and many professional money managers in both the long only and hedge fund world underperforming their benchmarks by wide margins due to this environment.
While the high correlation and resulting volatility in markets had an impact on the Fund, our historical track record of offering reduced downside exposure stayed intact and was a critical part of outperforming the benchmark over the reporting period. In the following remarks, we’ll relate what we saw in a market that is multifaceted to the extent that on the one hand, the earnings produced by companies are growing at an attractive rate but on the other hand, some of the macro risks we’re seeing are looming large in the background.
First, we’ll cover the positive developments we saw. Despite a global economy that can’t be described as strong, companies in the U.S., Asia and even Europe significantly grew their earnings over the reporting period. Growth has been so persistent that many are calling for operating margin declines because it just doesn’t seem possible that profitability can continue to expand so predictably. For example, to help highlight this point we look at the full year in which revenues and earnings for the MSCI World Index (which includes a healthy number of areas that are perceived to be challenged in Europe and the banking sector) grew by 6.6% and 2.6% over the year, respectively. In the U.S., as measured by the S&P 500 Index, growth was even stronger with revenues and earnings growth of 8.0% and 6.1%, respectively, over the full year. Return of capital to shareholders in 2011 was up over 40% year over year with authorized share repurchases set to be over $550 billion and dividends were up 13.5% in the same period (according to industry reports). In our opinion, this is leaving behind some very attractively valued stocks in all economies as earnings multiples are stagnant to contracting in many cases.
Second, let’s address what we see in the broader economy, which isn’t as positive and is somewhat in contrast with what we’re seeing with many individual companies. Over the review period, a number of negative developments came out of Europe and Asia despite a surprising pick up in the U.S. economy. In Europe, a litany of events revolving around a lack of consensus on how to deal with the overleveraged sovereign balance sheets of peripheral countries caused volatility in equity markets and has many evaluating the consequences of a Eurozone breakup—once an unimaginable outcome. In Asia, China’s enormous engine of global growth has been sputtering as property values have dropped by as much as 50% in some areas and the country’s Gross Domestic Product (GDP) is anticipated to have only expanded at a 9.2% rate in 2011, the lowest since 2009 (according to industry reports). As for the U.S., after a weak report by the Institute for Supply Management (ISM) at the end of July 2011 and the downgrade of U.S. long-term sovereign debt from AAA to AA+ by independent credit rating agency Standard & Poor’s in early August, the S&P 500 Index experienced a steep decline and the bears warned us of further downside. However, in a remarkable turnaround, the U.S. economy responded with report after report of better job creation and economic growth than many expected throughout the second half of the year and U.S. equity markets responded in kind, putting in a 15% advance from the bottom of the market on October 3, 2011 (as measured by the S&P 500 Index). Unfortunately, the risks in other parts of the world are likely to inevitably put pressure on the U.S. if things continue to sour in Europe and Asia.
With these concepts painting a picture of a tug-of-war between the good and the bad, let’s talk about some of the investment ideas in the Fund, including both positive and negative contributors to performance, that we find interesting and how they performed over the reporting period.
Among the securities that contributed to performance were the Fund’s investments in Phillip Morris and First Pacific.
Philip Morris
There are often negative headlines on the tobacco sector that deter many investors, but we find these intriguing for the Fund, including: declining volumes, litigation risk, increased taxation, plain packaging, and smoking bans. However, the tobacco industry has some characteristics that we consider unique; relatively inelastic pricing power, growth from emerging markets, highly cash generative business models and generally shareholder friendly managements.
Our security selection process has identified significant value amongst various tobacco companies, and one of them, Philip Morris International, was our top performer for the period under review.
| DECEMBER 31, 2011 | SEMIANNUAL REPORT | 19 |
Table of Contents
Insights from the Portfolio Managers PIMCO EqS Pathfinder Fund™ (Cont.)
Philip Morris International is the world’s largest tobacco manufacturer (excluding China), and owns the market leading brand, Marlboro. It was spun out of the Altria Group in March 2008 (Altria retained its US operations) and owns approximately a 15.6% cigarette market share outside the U.S. (according to industry reports). The international company benefits from its non-U.S. footprint, which to some extent limits its litigation risk compared to its U.S. peers, however, its acquisition of Rothmans in Canada does not make it completely immune. We believe Philip Morris International benefits from its brand portfolio and size, its international diversification, and its strong cash flow generation. The company is also managed in a very shareholder friendly manner. After the completion of its first $13 billion share repurchase program, management initiated another share buyback of $12 billion for 2010-2012 and then followed that with an announcement in February 2011 that it would add an additional $5 billion to the three year repurchase plan.
Although this name had performed well through the first few months of the reporting period, the stock began to pull back in early August 2011 as the equity markets began to weaken on heightened fears of contagion from the European debt crisis. We seized upon the opportunity to increase our exposure to this company and also added selectively to other positions in the Fund.
First Pacific
The advantage of being benchmark agnostic is that we often find attractive investment ideas before they become a constituent of a benchmark and First Pacific is a good example. First Pacific is a Hong Kong-based investment and management company with operations in Asia. Its principal business interests are in the telecommunications, consumer food products, infrastructure and natural resources sectors. We’ve held this position in the Fund since the launch of the Fund in April 2010, and have continued to add to the position, and did so particularly in March of this past year. We view the position as an example of a company with underappreciated assets which are available at an attractive conglomerate discount. Many of First Pacific’s underlying businesses are publicly listed on various emerging market exchanges; however, by investing in First Pacific in Hong Kong we believe one can gain exposure to the robust emerging economies in the Philippines and Indonesia at a discount to the total cost of those businesses on their local exchanges. In November 2011, after the company had already gained in price for the full year, MSCI announced that the company would replace Esprit in the MSCI Hong Kong Index.
Among the securities that detracted from performance were the Fund’s investments in Kloeckner & Co. and Marine Harvest.
Kloeckner & Co.
Kloeckner & Co is a steel and metals distributor. The company recently reported earnings results that missed consensus estimates and provided fourth quarter guidance for a sequentially lower result driven by continued margin pressure and 10-20 million euro of restructuring costs. The company, however, expects growing demand in North and South America in 2012, though its outlook for European demand for steel is “at best stable” (per company reports), citing the European sovereign debt crisis as a factor. We believe the company is improving its service offering and margins through recent acquisitions of service centers such as Becker and MacSteel and we are therefore attracted to the firm’s distribution business model which is very cash generative (estimated at 14% normalized free-cash-flow yield), in our opinion.
Marine Harvest
Salmon farming is the primary business of Oslo, Norway based Marine Harvest, and to its detriment salmon pricing has recently come under pressure due to optimistic salmon production forecasts. We see many investors believing there is going to be significant production growth coming out of Norway and Chile, two of the major commercial salmon growing areas of the world. However, we believe the forecasts for salmon production growth coming out of Chile, in particular, might be difficult to achieve due to challenging biological conditions and prevalent disease.
Salmon farming enjoys the lowest feed to protein conversion ratio of any of the major sources of protein. Over the long-term, we believe the emerging markets are going to consume greater quantities of protein as their per capita incomes and standards of living increase. Hence, we continue to believe there will be increased demand for salmon in the foreseeable future.
Looking Ahead
After a tumultuous 2011 as a whole in which global equity markets on a consolidated basis either eked out a small gain or were down, we believe 2012 promises to be just as interesting, but our sense is that a flattish outcome from equity markets for two years in a row is unlikely. This is the bi-modal world that we discuss at PIMCO where on one hand, a sizeable risk to the global economy and asset markets exists due to imbalances and stretched balance sheets, but on the other hand, many central banks are drowning their banking systems in fiat currency (paper money declared legal tender) which could lead to a bout of reflation.
To align our portfolio with that view, we expect that high quality stocks trading at steep discounts to their intrinsic value will continue to be added to the portfolio in addition to the ones we already own.
| 20 | PIMCO EQUITY SERIES |
Table of Contents
Not only do stocks like these tend to have high margins, little financial leverage and strong cash flow generation, but they also haven’t been offered at such attractive prices in decades, in our opinion. We’d like to think that “you can have your cake and eat it too” and stocks like these should be well positioned to benefit: if the equity market rallies strongly, we will seek to participate and deliver a positive return. But if the equity market drops precipitously due to the external environment, we expect companies like these may be less impacted than other stocks and could ultimately have the potential to return to a normal valuation, in our opinion. Also, we expect stocks with the ability to return capital to shareholders in the form of dividends and share buybacks will be a focus. In a world that has such a divergence in outcomes, companies that are returning cold hard cash should be favored and if they’re buying back their stock at cheap valuations, so much the better.
To close this letter, we repeat our thanks for staying the course with the PIMCO EqS Pathfinder Fund™, just as we’re staying the course and sticking with our discipline of seeking capital appreciation while also looking to help mitigate downside risk. We’re privileged to have the opportunity to steward your capital and our intent is to use all of the tools at our disposal to continue to serve in that role.
Sincerely,
 |  | |
|  | |
Charles Lahr, CFA Co-Portfolio Manager | Anne Gudefin, CFA Co-Portfolio Manager | |

Top Holdings1
SPDR Gold Trust | 3.6% | |||||
Imperial Tobacco Group PLC | 3.5% | |||||
British American Tobacco PLC | 3.0% | |||||
Danone | 2.6% | |||||
Microsoft Corp. | 2.4% | |||||
Intel Corp. | 2.2% | |||||
Lorillard, Inc. | 2.1% | |||||
Lancashire Holdings Ltd. | 2.1% | |||||
BP PLC | 1.9% | |||||
Koninklijke KPN NV | 1.9% |
Geographic Breakdown1
United States | 35.9% | |||||
United Kingdom | 12.2% | |||||
France | 11.0% | |||||
Bermuda | 6.1% | |||||
Netherlands | 5.8% | |||||
Switzerland | 4.1% | |||||
Hong Kong | 3.0% | |||||
Denmark | 2.0% | |||||
Canada | 1.5% | |||||
Japan | 1.5% | |||||
Norway | 1.5% | |||||
Germany | 1.3% | |||||
Other | 7.5% |
Sector Breakdown1
Consumer Staples | 27.3% | |||||
Financials | 21.1% | |||||
Information Technology | 8.6% | |||||
Energy | 7.8% | |||||
Industrials | 6.6% | |||||
Health Care | 6.5% | |||||
Consumer Discretionary | 5.2% | |||||
Exchange-Traded Funds | 3.6% | |||||
Materials | 2.9% | |||||
Telecommunication Services | 1.9% | |||||
Utilities | 0.6% |
| 1 | % of Total Investments as of 12/31/2011. Top Holdings, Geographic and Sector Breakdown solely reflect long positions. Securities sold short, financial derivative instruments and short-term instruments are not taken into consideration. |
| DECEMBER 31, 2011 | SEMIANNUAL REPORT | 21 |
Table of Contents
| Institutional Class - PTHWX | Class A - PATHX | |
| Class P - PTHPX | Class C - PTHCX | |
| Class D - PTHDX | Class R - PTHRX |
Cumulative Returns Through December 31, 2011
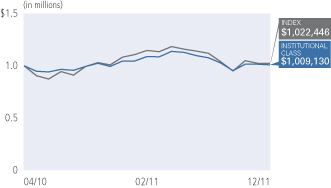
| Average Annual Total Return for the period ended December 31, 2011 | ||||||||||||||
| 6 Months* | 1 Year | Fund Inception (04/14/10) | ||||||||||||
| PIMCO EqS Pathfinder FundTM Institutional Class | -7.89% | -3.44% | -0.47% | ||||||||||
| PIMCO EqS Pathfinder FundTM Class P | -8.03% | -3.59% | -0.62% | |||||||||||
| PIMCO EqS Pathfinder FundTM Class D | -8.13% | -3.87% | -0.89% | |||||||||||
| PIMCO EqS Pathfinder FundTM Class A | -8.10% | -3.85% | -0.85% | |||||||||||
| PIMCO EqS Pathfinder FundTM Class A (adjusted) | -13.15% | -9.14% | -4.07% | |||||||||||
| PIMCO EqS Pathfinder FundTM Class C | -8.39% | -4.50% | -1.50% | |||||||||||
| PIMCO EqS Pathfinder FundTM Class C (adjusted) | -9.30% | -5.45% | -1.50% | |||||||||||
| PIMCO EqS Pathfinder FundTM Class R | -8.28% | -4.12% | -1.17% | |||||||||||
| MSCI World Index± | -10.29% | -5.54% | -0.58% | ||||||||||
All Fund returns are net of fees and expenses.
* Cumulative return.
± The MSCI World Index is a free float-adjusted market capitalization weighted index that is designed to measure the equity market performance of developed markets. As of May 27, 2010 the MSCI World Index consisted of the following 24 developed market country indices: Australia, Austria, Belgium, Canada, Denmark, Finland, France, Germany, Greece, Hong Kong, Ireland, Israel, Italy, Japan, Netherlands, New Zealand, Norway, Portugal, Singapore, Spain, Sweden, Switzerland, the United Kingdom, and the United States. The index represents the unhedged performance of the constituent stocks, in US dollars. It is not possible to invest directly in an unmanaged index.
Performance quoted represents past performance. Past performance is not a guarantee or a reliable indicator of future results. Investment return and the principal value of an investment will fluctuate. Shares may be worth more or less than original cost when redeemed. Current performance may be lower or higher than performance shown. Returns shown do not reflect the deduction of taxes that a shareholder would pay on fund distributions or the redemption of fund shares. The adjusted returns take into account the maximum sales charge of 5.50% on A shares and 1.00% CDSC on C shares. The Fund’s total annual operating expense ratio as stated in the Fund’s current prospectus, as supplemented to date, is 1.11% for the Institutional Class shares, 1.21% for the Class P shares, 1.46% for the Class D shares, 1.46% for the Class A shares, 2.21% for the Class C shares and 1.71% for the Class R shares. Details regarding any Fund’s operating expenses can be found in the Fund’s prospectus. For performance current to the most recent month-end, visit www.pimco.com/investments.
Portfolio Insights
| » | The PIMCO EqS Pathfinder Fund™ seeks capital appreciation by investing under normal circumstances in equity securities, including common and preferred stock (and securities convertible into, or that PIMCO expects to be exchanged for, common or preferred stock), of issuers that PIMCO believes are undervalued. The Fund’s bottom-up value investment style attempts to identify securities that are undervalued by the market in comparison to PIMCO’s own determination of the company’s value, taking into account criteria such as asset value, book value, cash flow and earnings estimates. |
| » | During the reporting period, the Fund’s Institutional class shares declined 7.89% after fees, and the Fund’s benchmark index, the MSCI World Index, declined 10.29%. The Fund’s performance, although negative, outperformed its benchmark by 2.40% after fees. |
| » | Holdings in Kloeckner & Co., Man Group, and Marine Harvest were notable detractors from returns as prices on these securities declined during the reporting period. |
| » | In a challenging period for equities, stock selection in the consumer staples and technology sectors contributed to returns. Also, our security selection in financials, with a focus on the insurance industry, was a significant contributor to the Fund’s excess returns over the benchmark. |
| » | Holdings in Philip Morris International, Imperial Tobacco, and First Pacific Company were notable performers as prices on these securities appreciated during the reporting period. |
| » | Given the decline in the equity markets over the reporting period, the Fund’s market risk and currency hedging strategies, including its position in a gold exchange-traded fund (ETF), contributed to performance as these hedging strategies appreciated in value. |
| » | At the end of the reporting period, the Fund held approximately 83% in equities we believe are undervalued, approximately 5% (on the long side only) in merger arbitrage investments, approximately 10% in cash equivalents, and held the balance of the portfolio in currency and market risk hedges, including approximately 4% in gold. |
| 22 | PIMCO EQUITY SERIES |
Table of Contents
Example
As a shareholder of a Fund, you incur two types of costs: (1) transaction costs, including sales charges (loads) on purchase payments and exchange fees; and (2) ongoing costs, including management fees, distribution and/or service (12b-1) fees, and other Fund expenses. The Example is intended to help you understand your ongoing costs (in dollars) of investing in a Fund and to compare these costs with the ongoing costs of investing in other mutual funds.
The Example is based on an investment of $1,000 invested at the beginning of the period and held for the entire period indicated, which for all Funds and share classes is from July 1, 2011 to December 31, 2011 unless noted otherwise in the table and footnotes below.
Actual Expenses
The information in the table under the heading “Actual Performance” provides information about actual account values and actual expenses. You may use the information in these columns, together with the amount you invested, to estimate the expenses that you paid over the period. Simply divide your account value by $1,000 (for example, an $8,600 account value divided by $1,000 = $8.60), then multiply the result by the number in the appropriate column for your share class, in the row entitled “Expenses Paid During Period” to estimate the expenses you paid on your account during this period.
Hypothetical Example for Comparison Purposes
The information in the table under the heading “Hypothetical Performance (5% return before expenses)” provides information about hypothetical account values and hypothetical expenses based on a Fund’s actual expense ratio and an assumed rate of return of 5% per year before expenses, which is not the Fund’s actual return. The hypothetical account values and expenses may not be used to estimate the actual ending account balance or expenses you paid for the period. You may use this information to compare the ongoing costs of investing in a Fund and other funds. To do so, compare this 5% hypothetical example with the 5% hypothetical examples that appear in the shareholder reports of the other funds.
Please note that the expenses shown in the table are meant to highlight your ongoing costs only and do not reflect any transactional costs, such as sales charges (loads) on purchase payments and exchange fees. Therefore, the information under the heading “Hypothetical Performance (5% return before expenses)” is useful in comparing ongoing costs only, and will not help you determine the relative total costs of owning different funds. In addition, if these transactional costs were included, your costs would have been higher.
Expense ratios may vary from period to period because of various factors such as an increase in expenses that are not covered by the management fees, such as fees and expenses of the independent trustees and their counsel, extraordinary expenses and interest expense.
Actual Performance | Hypothetical Performance (5% return before expenses) | |||||||||||||||||||||||||||||||
| Beginning Account Value (07/01/11) | Ending Account Value (12/31/11) | Expenses Paid During Period * | Beginning Account Value (07/01/11) | Ending Account Value (12/31/11) | Expenses Paid During Period * | Net Annualized Expense Ratio ** | ||||||||||||||||||||||||||
PIMCO Dividend and Income Builder Fund(a) | ||||||||||||||||||||||||||||||||
| Institutional Class | $ | 1,000.00 | $ | 1,020.90 | $ | 0.39 | $ | 1,000.00 | $ | 1,020.96 | $ | 4.22 | 0.83 | % | ||||||||||||||||||
| Class P | 1,000.00 | 1,020.80 | 0.44 | 1,000.00 | 1,020.46 | 4.72 | 0.93 | |||||||||||||||||||||||||
| Class D | 1,000.00 | 1,020.70 | 0.55 | 1,000.00 | 1,019.20 | 5.99 | 1.18 | |||||||||||||||||||||||||
| Class A | 1,000.00 | 1,021.70 | 0.55 | 1,000.00 | 1,019.20 | 5.99 | 1.18 | |||||||||||||||||||||||||
| Class C | 1,000.00 | 1,020.30 | 0.91 | 1,000.00 | 1,015.43 | 9.78 | 1.93 | |||||||||||||||||||||||||
| Class R | 1,000.00 | 1,020.60 | 0.67 | 1,000.00 | �� | 1,017.95 | 7.25 | 1.43 | ||||||||||||||||||||||||
PIMCO EqS Dividend Fund(a) | ||||||||||||||||||||||||||||||||
| Institutional Class | $ | 1,000.00 | $ | 1,018.20 | $ | 0.39 | $ | 1,000.00 | $ | 1,020.96 | $ | 4.22 | 0.83 | % | ||||||||||||||||||
| Class P | 1,000.00 | 1,018.20 | 0.44 | 1,000.00 | 1,020.46 | 4.72 | 0.93 | |||||||||||||||||||||||||
| Class D | 1,000.00 | 1,018.10 | 0.55 | 1,000.00 | 1,019.20 | 5.99 | 1.18 | |||||||||||||||||||||||||
| Class A | 1,000.00 | 1,018.10 | 0.55 | 1,000.00 | 1,019.20 | 5.99 | 1.18 | |||||||||||||||||||||||||
| Class C | 1,000.00 | 1,018.00 | 0.90 | 1,000.00 | 1,015.43 | 9.78 | 1.93 | |||||||||||||||||||||||||
| Class R | 1,000.00 | 1,018.00 | 0.67 | 1,000.00 | 1,017.95 | 7.25 | 1.43 | |||||||||||||||||||||||||
| DECEMBER 31, 2011 | SEMIANNUAL REPORT | 23 |
Table of Contents
Expense Examples (Cont.)
Actual Performance | Hypothetical Performance (5% return before expenses) | |||||||||||||||||||||||||||||||
| Beginning Account Value (07/01/11) | Ending Account Value (12/31/11) | Expenses Paid During Period * | Beginning Account Value (07/01/11) | Ending Account Value (12/31/11) | Expenses Paid During Period * | Net Annualized Expense Ratio ** | ||||||||||||||||||||||||||
PIMCO EqS Emerging Markets Fund | ||||||||||||||||||||||||||||||||
| Institutional Class | $ | 1,000.00 | $ | 781.90 | $ | 5.60 | $ | 1,000.00 | $ | 1,018.85 | $ | 6.34 | 1.25 | % | ||||||||||||||||||
| Class P | 1,000.00 | 782.80 | 6.05 | 1,000.00 | 1,018.35 | 6.85 | 1.35 | |||||||||||||||||||||||||
| Administrative Class | 1,000.00 | 780.90 | 6.71 | 1,000.00 | 1,017.60 | 7.61 | 1.50 | |||||||||||||||||||||||||
| Class D | 1,000.00 | 780.70 | 7.16 | 1,000.00 | 1,017.09 | 8.11 | 1.60 | |||||||||||||||||||||||||
| Class A | 1,000.00 | 780.10 | 7.16 | 1,000.00 | 1,017.09 | 8.11 | 1.60 | |||||||||||||||||||||||||
| Class C | 1,000.00 | 777.70 | 10.50 | 1,000.00 | 1,013.32 | 11.89 | 2.35 | |||||||||||||||||||||||||
| Class R | 1,000.00 | 779.90 | 8.28 | 1,000.00 | 1,015.84 | 9.37 | 1.85 | |||||||||||||||||||||||||
PIMCO Emerging Multi-Asset Fund | ||||||||||||||||||||||||||||||||
| Institutional Class | $ | 1,000.00 | $ | 872.30 | $ | 2.59 | $ | 1,000.00 | $ | 1,022.37 | $ | 2.80 | 0.55 | % | ||||||||||||||||||
| Class P | 1,000.00 | 870.90 | 3.06 | 1,000.00 | 1,021.87 | 3.30 | 0.65 | |||||||||||||||||||||||||
| Administrative Class | 1,000.00 | 870.30 | 3.76 | 1,000.00 | 1,021.11 | 4.06 | 0.80 | |||||||||||||||||||||||||
| Class D | 1,000.00 | 870.10 | 4.23 | 1,000.00 | 1,020.61 | 4.57 | 0.90 | |||||||||||||||||||||||||
| Class A | 1,000.00 | 870.60 | 4.23 | 1,000.00 | 1,020.61 | 4.57 | 0.90 | |||||||||||||||||||||||||
| Class C | 1,000.00 | 866.80 | 7.74 | 1,000.00 | 1,016.84 | 8.36 | 1.65 | |||||||||||||||||||||||||
| Class R | 1,000.00 | 869.10 | 5.40 | 1,000.00 | 1,019.36 | 5.84 | 1.15 | |||||||||||||||||||||||||
PIMCO EqS Pathfinder FundTM | ||||||||||||||||||||||||||||||||
| Institutional Class | $ | 1,000.00 | $ | 921.10 | $ | 4.30 | $ | 1,000.00 | $ | 1,020.66 | $ | 4.52 | 0.89 | % | ||||||||||||||||||
| Class P | 1,000.00 | 919.70 | 4.78 | 1,000.00 | 1,020.16 | 5.03 | 0.99 | |||||||||||||||||||||||||
| Class D | 1,000.00 | 918.70 | 5.98 | 1,000.00 | 1,018.90 | 6.29 | 1.24 | |||||||||||||||||||||||||
| Class A | 1,000.00 | 919.00 | 5.98 | 1,000.00 | 1,018.90 | 6.29 | 1.24 | |||||||||||||||||||||||||
| Class C | 1,000.00 | 916.10 | 9.58 | 1,000.00 | 1,015.13 | 10.08 | 1.99 | |||||||||||||||||||||||||
| Class R | 1,000.00 | 917.20 | 7.18 | 1,000.00 | 1,017.65 | 7.56 | 1.49 | |||||||||||||||||||||||||
* Expenses are equal to the net annualized expense ratio for the class, multiplied by the average account value over the period, multiplied by 184/366 (to reflect the one-half year period. Hypothetical expenses reflect an amount as if the Fund had been operational for the entire fiscal half year.
** The net annualized expense ratio is reflective of any applicable waivers related to contractual agreements for fund of funds, voluntary fee waivers, organizational or trustees’ fees and special purpose vehicles. Details regarding fee waivers can be found in note 8 in the Notes to Financial Statements.
(a) The Beginning Account Value is reflective as of 12/14/11 for Actual Performance. Expenses paid in the Actual Performance section are equal to the net annualized expense ratio for the Fund, multiplied by the average account value over the period, multiplied by 17/366 for the PIMCO Dividend and Income Builder Fund and PIMCO EqS Dividend Fund (to reflect the period since the inception date of 12/14/11).
| 24 | PIMCO EQUITY SERIES |
Table of Contents
(THIS PAGE INTENTIONALLY LEFT BLANK)
| DECEMBER 31, 2011 | SEMIANNUAL REPORT | 25 |
Table of Contents
| Selected Per Share Data for the Year or Period Ended: | Net Asset Value Beginning of Year or Period | Net Investment Income (Loss) (a) | Net Realized/ Unrealized Gain (Loss) | Total Income (Loss) from Investment Operations | Dividends from Net Investment Income | Distributions from Net Realized Capital Gains | Total Distributions | |||||||||||||||||||||
PIMCO Dividend and Income Builder Fund | ||||||||||||||||||||||||||||
| Institutional Class | ||||||||||||||||||||||||||||
12/14/2011 - 12/31/2011+ | $ | 10.00 | $ | 0.01 | $ | 0.20 | $ | 0.21 | $ | (0.01 | ) | $ | 0.00 | $ | (0.01 | ) | ||||||||||||
| Class P | ||||||||||||||||||||||||||||
12/14/2011 - 12/31/2011+ | 10.00 | 0.00 | ^ | 0.21 | 0.21 | (0.01 | ) | 0.00 | (0.01 | ) | ||||||||||||||||||
| Class D | ||||||||||||||||||||||||||||
12/14/2011 - 12/31/2011+ | 10.00 | 0.00 | ^ | 0.21 | 0.21 | (0.01 | ) | 0.00 | (0.01 | ) | ||||||||||||||||||
| Class A | ||||||||||||||||||||||||||||
12/14/2011 - 12/31/2011+ | 10.00 | 0.00 | ^ | 0.22 | 0.22 | (0.01 | ) | 0.00 | (0.01 | ) | ||||||||||||||||||
| Class C | ||||||||||||||||||||||||||||
12/14/2011 - 12/31/2011+ | 10.00 | 0.00 | ^ | 0.20 | 0.20 | 0.00 | ^ | 0.00 | 0.00 | |||||||||||||||||||
| Class R | ||||||||||||||||||||||||||||
12/14/2011 - 12/31/2011+ | 10.00 | 0.00 | ^ | 0.21 | 0.21 | (0.01 | ) | 0.00 | (0.01 | ) | ||||||||||||||||||
PIMCO EqS Dividend Fund | ||||||||||||||||||||||||||||
| Institutional Class | ||||||||||||||||||||||||||||
12/14/2011 - 12/31/2011+ | $ | 10.00 | $ | 0.00 | ^ | $ | 0.18 | $ | 0.18 | $ | 0.00 | ^ | $ | 0.00 | $ | 0.00 | ||||||||||||
| Class P | ||||||||||||||||||||||||||||
12/14/2011 - 12/31/2011+ | 10.00 | 0.00 | ^ | 0.18 | 0.18 | 0.00 | ^ | 0.00 | 0.00 | |||||||||||||||||||
| Class D | ||||||||||||||||||||||||||||
12/14/2011 - 12/31/2011+ | 10.00 | 0.00 | ^ | 0.18 | 0.18 | 0.00 | ^ | 0.00 | 0.00 | |||||||||||||||||||
| Class A | ||||||||||||||||||||||||||||
12/14/2011 - 12/31/2011+ | 10.00 | 0.00 | ^ | 0.18 | 0.18 | 0.00 | ^ | 0.00 | 0.00 | |||||||||||||||||||
| Class C | ||||||||||||||||||||||||||||
12/14/2011 - 12/31/2011+ | 10.00 | (0.01 | ) | 0.19 | 0.18 | 0.00 | ^ | 0.00 | 0.00 | |||||||||||||||||||
| Class R | ||||||||||||||||||||||||||||
12/14/2011 - 12/31/2011+ | 10.00 | 0.00 | ^ | 0.18 | 0.18 | 0.00 | ^ | 0.00 | 0.00 | |||||||||||||||||||
PIMCO EqS Emerging Markets Fund | ||||||||||||||||||||||||||||
| Institutional Class | ||||||||||||||||||||||||||||
07/01/2011 - 12/31/2011+ | $ | 10.19 | $ | 0.01 | $ | (2.23 | ) | $ | (2.22 | ) | $ | (0.02 | ) | $ | (0.01 | ) | $ | (0.03 | ) | |||||||||
03/22/2011 - 06/30/2011 | 10.00 | 0.05 | 0.14 | 0.19 | 0.00 | 0.00 | 0.00 | |||||||||||||||||||||
| Class P | ||||||||||||||||||||||||||||
07/01/2011 - 12/31/2011+ | 10.19 | 0.01 | (2.22 | ) | (2.21 | ) | (0.02 | ) | (0.01 | ) | (0.03 | ) | ||||||||||||||||
03/22/2011 - 06/30/2011 | 10.00 | 0.04 | 0.15 | 0.19 | 0.00 | 0.00 | 0.00 | |||||||||||||||||||||
| Administrative Class | ||||||||||||||||||||||||||||
07/01/2011 - 12/31/2011+ | 10.18 | (0.03 | ) | (2.20 | ) | (2.23 | ) | 0.00 | ^ | (0.01 | ) | (0.01 | ) | |||||||||||||||
04/19/2011 - 06/30/2011 | 10.51 | 0.04 | (0.37 | ) | (0.33 | ) | 0.00 | 0.00 | 0.00 | |||||||||||||||||||
| Class D | ||||||||||||||||||||||||||||
07/01/2011 - 12/31/2011+ | 10.18 | (0.02 | ) | (2.21 | ) | (2.23 | ) | (0.02 | ) | (0.01 | ) | (0.03 | ) | |||||||||||||||
03/22/2011 - 06/30/2011 | 10.00 | 0.06 | 0.12 | 0.18 | 0.00 | 0.00 | 0.00 | |||||||||||||||||||||
| Class A | ||||||||||||||||||||||||||||
07/01/2011 - 12/31/2011+ | 10.18 | (0.01 | ) | (2.23 | ) | (2.24 | ) | 0.00 | ^ | (0.01 | ) | (0.01 | ) | |||||||||||||||
03/22/2011 - 06/30/2011 | 10.00 | 0.05 | 0.13 | 0.18 | 0.00 | 0.00 | 0.00 | |||||||||||||||||||||
| Class C | ||||||||||||||||||||||||||||
07/01/2011 - 12/31/2011+ | 10.17 | (0.05 | ) | (2.21 | ) | (2.26 | ) | 0.00 | ^ | (0.01 | ) | (0.01 | ) | |||||||||||||||
03/22/2011 - 06/30/2011 | 10.00 | 0.03 | 0.14 | 0.17 | 0.00 | 0.00 | 0.00 | |||||||||||||||||||||
| Class R | ||||||||||||||||||||||||||||
07/01/2011 - 12/31/2011+ | 10.18 | (0.02 | ) | (2.22 | ) | (2.24 | ) | 0.00 | ^ | (0.01 | ) | (0.01 | ) | |||||||||||||||
03/22/2011 - 06/30/2011 | 10.00 | 0.06 | 0.12 | 0.18 | 0.00 | 0.00 | 0.00 | |||||||||||||||||||||
| + | Unaudited |
| * | Annualized |
| ** | Effective July 1, 2010, the calculation methodology of portfolio turnover rate has been updated to exclude PIMCO Short-Term Floating NAV Portfolio. |
| ^ | Reflects an amount rounding to less than one cent. |
| (a) | Per share amounts based on average number of shares outstanding during the year or period. |
| 26 | PIMCO EQUITY SERIES | See Accompanying Notes |
Table of Contents
| Net Asset Value End of Year or Period | Total Return | Net Assets End of Year or Period (000s) | Ratio of Expenses to Average Net Assets | Ratio of Expenses to Average Net Assets Excluding Waivers | Ratio of Expenses to Average Net Assets Excluding Interest Expense and Dividends on Securities Sold Short | Ratio of Expenses to Average Net Assets Excluding Interest Expense, Dividends on Securities Sold Short and Waivers | Ratio of Net Investment Income (Loss) to Average Net Assets | Portfolio Turnover Rate** | ||||||||||||||||||||||||||
| $ | 10.20 | 2.09 | % | $ | 5,173 | 0.83 | %* | 0.99 | %* | 0.83 | %* | 0.99 | %* | 1.13 | %* | 24 | % | |||||||||||||||||
| 10.20 | 2.08 | 11 | 0.93 | * | 1.09 | * | 0.93 | * | 1.09 | * | 1.02 | * | 24 | |||||||||||||||||||||
| 10.20 | 2.07 | 10 | 1.18 | * | 1.34 | * | 1.18 | * | 1.34 | * | 0.74 | * | 24 | |||||||||||||||||||||
| 10.21 | 2.17 | �� | 376 | 1.18 | * | 1.34 | * | 1.18 | * | 1.34 | * | 0.08 | * | 24 | ||||||||||||||||||||
| 10.20 | 2.03 | 10 | 1.93 | * | 2.09 | * | 1.93 | * | 2.09 | * | (0.10 | )* | 24 | |||||||||||||||||||||
| 10.20 | 2.06 | 10 | 1.43 | * | 1.59 | * | 1.43 | * | 1.59 | * | 0.48 | * | 24 | |||||||||||||||||||||
| $ | 10.18 | 1.82 | % | $ | 53,883 | 0.83 | %* | 0.99 | %* | 0.83 | %* | 0.99 | %* | (0.40 | )%* | 4 | % | |||||||||||||||||
| 10.18 | 1.82 | 10 | 0.93 | * | 1.09 | * | 0.93 | * | 1.09 | * | (0.43 | )* | 4 | |||||||||||||||||||||
| 10.18 | 1.81 | 10 | 1.18 | * | 1.34 | * | 1.18 | * | 1.34 | * | (0.71 | )* | 4 | |||||||||||||||||||||
| 10.18 | 1.81 | 10 | 1.18 | * | 1.34 | * | 1.18 | * | 1.34 | * | (0.71 | )* | 4 | |||||||||||||||||||||
| 10.18 | 1.80 | 10 | 1.93 | * | 2.09 | * | 1.93 | * | 2.09 | * | (1.55 | )* | 4 | |||||||||||||||||||||
| 10.18 | 1.80 | 10 | 1.43 | * | 1.59 | * | 1.43 | * | 1.59 | * | (0.95 | )* | 4 | |||||||||||||||||||||
| $ | 7.94 | (21.81 | )% | $ | 484,657 | 1.25 | %* | 1.45 | %* | 1.25 | %* | 1.45 | %* | 0.13 | %* | 49 | % | |||||||||||||||||
| 10.19 | 1.90 | 353,099 | 1.25 | * | 1.62 | * | 1.25 | * | 1.62 | * | 1.77 | * | 41 | |||||||||||||||||||||
| 7.95 | (21.72 | ) | 128 | 1.35 | * | 1.55 | * | 1.35 | * | 1.55 | * | 0.17 | * | 49 | ||||||||||||||||||||
| 10.19 | 1.90 | 37 | 1.35 | * | 1.94 | * | 1.35 | * | 1.94 | * | 1.42 | * | 41 | |||||||||||||||||||||
| 7.94 | (21.91 | ) | 1 | 1.50 | * | 1.70 | * | 1.50 | * | 1.70 | * | (0.75 | )* | 49 | ||||||||||||||||||||
| 10.18 | (3.14 | ) | 10 | 1.50 | * | 1.90 | * | 1.50 | * | 1.90 | * | 1.72 | * | 41 | ||||||||||||||||||||
| 7.92 | (21.93 | ) | 6,091 | 1.60 | * | 1.80 | * | 1.60 | * | 1.80 | * | (0.52 | )* | 49 | ||||||||||||||||||||
| 10.18 | 1.80 | 1,080 | 1.60 | * | 2.11 | * | 1.60 | * | 2.11 | * | 1.98 | * | 41 | |||||||||||||||||||||
| 7.93 | (21.99 | ) | 1,085 | 1.60 | * | 1.80 | * | 1.60 | * | 1.80 | * | (0.21 | )* | 49 | ||||||||||||||||||||
| 10.18 | 1.80 | 764 | 1.60 | * | 2.02 | * | 1.60 | * | 2.02 | * | 1.89 | * | 41 | |||||||||||||||||||||
| 7.90 | (22.23 | ) | 383 | 2.35 | * | 2.55 | * | 2.35 | * | 2.55 | * | (1.16 | )* | 49 | ||||||||||||||||||||
| 10.17 | 1.70 | 98 | 2.35 | * | 2.80 | * | 2.35 | * | 2.80 | * | 0.98 | * | 41 | |||||||||||||||||||||
| 7.93 | (22.01 | ) | 36 | 1.85 | * | 2.05 | * | 1.85 | * | 2.05 | * | (0.47 | )* | 49 | ||||||||||||||||||||
| 10.18 | 1.80 | 39 | 1.85 | * | 2.34 | * | 1.85 | * | 2.34 | * | 1.97 | * | 41 | |||||||||||||||||||||
| DECEMBER 31, 2011 | SEMIANNUAL REPORT | 27 |
Table of Contents
Financial Highlights (Cont.)
| Selected Per Share Data for the Year or Period Ended: | Net Asset Value Beginning of Year or Period | Net Investment Income (Loss) (a) | Net Realized/ Unrealized Gain (Loss) | Total Income (Loss) from Investment Operations | Dividends from Net Investment Income | Distributions from Net Realized Capital Gains | Total Distributions | |||||||||||||||||||||
PIMCO Emerging Multi-Asset Fund | ||||||||||||||||||||||||||||
| Institutional Class | ||||||||||||||||||||||||||||
07/01/2011 - 12/31/2011+ | $ | 9.89 | $ | 0.08 | $ | (1.34 | ) | $ | (1.26 | ) | $ | (0.05 | ) | $ | 0.00 | $ | (0.05 | ) | ||||||||||
04/12/2011 - 06/30/2011 | 10.00 | 0.02 | (0.13 | ) | (0.11 | ) | 0.00 | 0.00 | 0.00 | |||||||||||||||||||
| Class P | ||||||||||||||||||||||||||||
07/01/2011 - 12/31/2011+ | 9.90 | 0.10 | (1.38 | ) | (1.28 | ) | (0.05 | ) | 0.00 | (0.05 | ) | |||||||||||||||||
04/12/2011 - 06/30/2011 | 10.00 | 0.02 | (0.12 | ) | (0.10 | ) | 0.00 | 0.00 | 0.00 | |||||||||||||||||||
| Administrative Class | ||||||||||||||||||||||||||||
07/01/2011 - 12/31/2011+ | 9.89 | 0.07 | (1.35 | ) | (1.28 | ) | (0.04 | ) | 0.00 | (0.04 | ) | |||||||||||||||||
04/19/2011 - 06/30/2011 | 10.02 | 0.02 | (0.15 | ) | (0.13 | ) | 0.00 | 0.00 | 0.00 | |||||||||||||||||||
| Class D | ||||||||||||||||||||||||||||
07/01/2011 - 12/31/2011+ | 9.89 | 0.06 | (1.34 | ) | (1.28 | ) | (0.03 | ) | 0.00 | (0.03 | ) | |||||||||||||||||
04/12/2011 - 06/30/2011 | 10.00 | 0.02 | (0.13 | ) | (0.11 | ) | 0.00 | 0.00 | 0.00 | |||||||||||||||||||
| Class A | ||||||||||||||||||||||||||||
07/01/2011 - 12/31/2011+ | 9.88 | 0.08 | (1.36 | ) | (1.28 | ) | (0.04 | ) | 0.00 | (0.04 | ) | |||||||||||||||||
04/12/2011 - 06/30/2011 | 10.00 | 0.02 | (0.14 | ) | (0.12 | ) | 0.00 | 0.00 | 0.00 | |||||||||||||||||||
| Class C | ||||||||||||||||||||||||||||
07/01/2011 - 12/31/2011+ | 9.88 | 0.05 | (1.37 | ) | (1.32 | ) | (0.02 | ) | 0.00 | (0.02 | ) | |||||||||||||||||
04/12/2011 - 06/30/2011 | 10.00 | 0.00 | ^ | (0.12 | ) | (0.12 | ) | 0.00 | 0.00 | 0.00 | ||||||||||||||||||
| Class R | ||||||||||||||||||||||||||||
07/01/2011 - 12/31/2011+ | 9.88 | 0.05 | (1.34 | ) | (1.29 | ) | (0.02 | ) | 0.00 | (0.02 | ) | |||||||||||||||||
04/12/2011 - 06/30/2011 | 10.00 | 0.01 | (0.13 | ) | (0.12 | ) | 0.00 | 0.00 | 0.00 | |||||||||||||||||||
PIMCO EqS Pathfinder FundTM | ||||||||||||||||||||||||||||
| Institutional Class | ||||||||||||||||||||||||||||
07/01/2011 - 12/31/2011+ | $ | 10.65 | $ | 0.05 | $ | (0.89 | ) | $ | (0.84 | ) | $ | (0.07 | ) | $ | (0.03 | ) | $ | (0.10 | ) | |||||||||
06/30/2011 | 9.23 | 0.19 | 1.34 | 1.53 | (0.09 | ) | (0.02 | ) | (0.11 | ) | ||||||||||||||||||
04/14/2010 - 06/30/2010 | 10.00 | 0.07 | (0.84 | ) | (0.77 | ) | 0.00 | 0.00 | 0.00 | |||||||||||||||||||
| Class P | ||||||||||||||||||||||||||||
07/01/2011 - 12/31/2011+ | 10.64 | 0.05 | (0.91 | ) | (0.86 | ) | (0.06 | ) | (0.03 | ) | (0.09 | ) | ||||||||||||||||
06/30/2011 | 9.23 | 0.18 | 1.34 | 1.52 | (0.09 | ) | (0.02 | ) | (0.11 | ) | ||||||||||||||||||
04/14/2010 - 06/30/2010 | 10.00 | 0.07 | (0.84 | ) | (0.77 | ) | 0.00 | 0.00 | 0.00 | |||||||||||||||||||
| Class D | ||||||||||||||||||||||||||||
07/01/2011 - 12/31/2011+ | 10.61 | 0.04 | (0.90 | ) | (0.86 | ) | (0.05 | ) | (0.03 | ) | (0.08 | ) | ||||||||||||||||
06/30/2011 | 9.21 | 0.16 | 1.34 | 1.50 | (0.08 | ) | (0.02 | ) | (0.10 | ) | ||||||||||||||||||
04/14/2010 - 06/30/2010 | 10.00 | 0.06 | (0.85 | ) | (0.79 | ) | 0.00 | 0.00 | 0.00 | |||||||||||||||||||
| Class A | ||||||||||||||||||||||||||||
07/01/2011 - 12/31/2011+ | 10.64 | 0.04 | (0.90 | ) | (0.86 | ) | (0.05 | ) | (0.03 | ) | (0.08 | ) | ||||||||||||||||
06/30/2011 | �� | 9.22 | 0.17 | 1.33 | 1.50 | (0.06 | ) | (0.02 | ) | (0.08 | ) | |||||||||||||||||
04/14/2010 - 06/30/2010 | 10.00 | 0.07 | (0.85 | ) | (0.78 | ) | 0.00 | 0.00 | 0.00 | |||||||||||||||||||
| Class C | ||||||||||||||||||||||||||||
07/01/2011 - 12/31/2011+ | 10.55 | 0.00 | (0.89 | ) | (0.89 | ) | (0.01 | ) | (0.03 | ) | (0.04 | ) | ||||||||||||||||
06/30/2011 | 9.21 | 0.11 | 1.31 | 1.42 | (0.06 | ) | (0.02 | ) | (0.08 | ) | ||||||||||||||||||
04/14/2010 - 06/30/2010 | 10.00 | 0.05 | (0.84 | ) | (0.79 | ) | 0.00 | 0.00 | 0.00 | |||||||||||||||||||
| Class R | ||||||||||||||||||||||||||||
07/01/2011 - 12/31/2011+ | 10.59 | 0.02 | (0.90 | ) | (0.88 | ) | (0.04 | ) | (0.03 | ) | (0.07 | ) | ||||||||||||||||
06/30/2011 | 9.21 | 0.12 | 1.35 | 1.47 | (0.07 | ) | (0.02 | ) | (0.09 | ) | ||||||||||||||||||
04/14/2010 - 06/30/2010 | 10.00 | 0.06 | (0.85 | ) | (0.79 | ) | 0.00 | 0.00 | 0.00 | |||||||||||||||||||
| + | Unaudited |
| * | Annualized |
| ** | Effective July 1, 2010, the calculation methodology of portfolio turnover rate has been updated to exclude PIMCO Short-Term Floating NAV Portfolio. |
| ^ | Reflects an amount rounding to less than one cent. |
| (a) | Per share amounts based on average number of shares outstanding during the year or period. |
| 28 | PIMCO EQUITY SERIES | See Accompanying Notes |
Table of Contents
| Net Asset Value End of Year or Period | Total Return | Net Assets End of Year or Period (000s) | Ratio of Expenses to Average Net Assets | Ratio of Expenses to Average Net Assets Excluding Waivers | Ratio of Expenses to Average Net Assets Excluding Interest Expense and Dividends on Securities Sold Short | Ratio of Expenses to Average Net Assets Excluding Interest Expense, Dividends on Securities Sold Short and Waivers | Ratio of Net Investment Income (Loss) to Average Net Assets | Portfolio Turnover Rate** | ||||||||||||||||||||||||||
| $ | 8.58 | (12.77 | )% | $ | 19,414 | 0.55 | %* | 1.36 | %* | 0.55 | %* | 1.36 | %* | 1.86 | %* | 17 | % | |||||||||||||||||
| 9.89 | (1.10 | ) | 9,755 | 0.53 | * | 6.96 | * | 0.53 | * | 6.96 | * | 1.13 | * | 0 | ||||||||||||||||||||
| 8.57 | (12.91 | ) | 9,217 | 0.65 | * | 1.46 | * | 0.65 | * | 1.46 | * | 2.37 | * | 17 | ||||||||||||||||||||
| 9.90 | (1.00 | ) | 74 | 0.63 | * | 17.34 | * | 0.63 | * | 17.34 | * | 0.96 | * | 0 | ||||||||||||||||||||
| 8.57 | (12.97 | ) | 12 | 0.80 | * | 1.61 | * | 0.80 | * | 1.61 | * | 1.56 | * | 17 | ||||||||||||||||||||
| 9.89 | (1.30 | ) | 10 | 0.78 | * | 6.47 | * | 0.78 | * | 6.47 | * | 0.88 | * | 0 | ||||||||||||||||||||
| 8.58 | (12.99 | ) | 2,855 | 0.90 | * | 1.71 | * | 0.90 | * | 1.71 | * | 1.30 | * | 17 | ||||||||||||||||||||
| 9.89 | (1.10 | ) | 2,745 | 0.88 | * | 8.20 | * | 0.88 | * | 8.20 | * | 0.81 | * | 0 | ||||||||||||||||||||
| 8.56 | (12.94 | ) | 5,666 | 0.90 | * | 1.71 | * | 0.90 | * | 1.71 | * | 1.77 | * | 17 | ||||||||||||||||||||
| 9.88 | (1.20 | ) | 1,801 | 0.88 | * | 9.28 | * | 0.88 | * | 9.28 | * | 0.82 | * | 0 | ||||||||||||||||||||
| 8.54 | (13.32 | ) | 1,699 | 1.65 | * | 2.46 | * | 1.65 | * | 2.46 | * | 1.05 | * | 17 | ||||||||||||||||||||
| 9.88 | (1.20 | ) | 649 | 1.63 | * | 9.73 | * | 1.63 | * | 9.73 | * | 0.08 | * | 0 | ||||||||||||||||||||
| 8.57 | (13.09 | ) | 9 | 1.15 | * | 1.96 | * | 1.15 | * | 1.96 | * | 1.15 | * | 17 | ||||||||||||||||||||
| 9.88 | (1.20 | ) | 10 | 1.13 | * | 6.40 | * | 1.13 | * | 6.40 | * | 0.50 | * | 0 | ||||||||||||||||||||
| $ | 9.71 | (7.89 | )% | $ | 1,896,926 | 0.89 | %* | 1.08 | %* | 0.89 | %* | 1.08 | %* | 1.09 | %* | 16 | % | |||||||||||||||||
| 10.65 | 16.68 | 1,338,509 | 0.92 | 1.10 | 0.89 | 1.07 | 1.87 | 35 | ||||||||||||||||||||||||||
| 9.23 | (7.70 | ) | 542,879 | 0.98 | * | 1.21 | * | 0.89 | * | 1.12 | * | 3.53 | * | 4 | ||||||||||||||||||||
| 9.69 | (8.03 | ) | 104,332 | 0.99 | * | 1.18 | * | 0.99 | * | 1.18 | * | 1.00 | * | 16 | ||||||||||||||||||||
| 10.64 | 16.55 | 45,785 | 1.02 | 1.20 | 0.99 | 1.17 | 1.72 | 35 | ||||||||||||||||||||||||||
| 9.23 | (7.70 | ) | 970 | 1.08 | * | 1.31 | * | 0.99 | * | 1.22 | * | 3.36 | * | 4 | ||||||||||||||||||||
| 9.67 | (8.13 | ) | 20,020 | 1.24 | * | 1.43 | * | 1.24 | * | 1.43 | * | 0.71 | * | 16 | ||||||||||||||||||||
| 10.61 | 16.39 | 24,352 | 1.27 | 1.45 | 1.24 | 1.42 | 1.55 | 35 | ||||||||||||||||||||||||||
| 9.21 | (7.90 | ) | 7,084 | 1.33 | * | 1.56 | * | 1.24 | * | 1.47 | * | 3.13 | * | 4 | ||||||||||||||||||||
| 9.70 | (8.10 | ) | 72,936 | 1.24 | * | 1.43 | * | 1.24 | * | 1.43 | * | 0.71 | * | 16 | ||||||||||||||||||||
| 10.64 | 16.30 | 89,571 | 1.27 | 1.45 | 1.24 | 1.42 | 1.64 | 35 | ||||||||||||||||||||||||||
| 9.22 | (7.80 | ) | 15,436 | 1.33 | * | 1.56 | * | 1.24 | * | 1.47 | * | 3.28 | * | 4 | ||||||||||||||||||||
| 9.62 | (8.39 | ) | 46,238 | 1.99 | * | 2.18 | * | 1.99 | * | 2.18 | * | (0.04 | )* | 16 | ||||||||||||||||||||
| 10.55 | 15.50 | 50,672 | 2.02 | 2.20 | 1.99 | 2.17 | 1.04 | 35 | ||||||||||||||||||||||||||
| 9.21 | (7.90 | ) | 6,668 | 2.08 | * | 2.31 | * | 1.99 | * | 2.22 | * | 2.43 | * | 4 | ||||||||||||||||||||
| 9.64 | (8.28 | ) | 111 | 1.49 | * | 1.68 | * | 1.49 | * | 1.68 | * | 0.47 | * | 16 | ||||||||||||||||||||
| 10.59 | 16.02 | 102 | 1.52 | 1.70 | 1.49 | 1.67 | 1.21 | 35 | ||||||||||||||||||||||||||
| 9.21 | (7.90 | ) | 9 | 1.58 | * | 1.81 | * | 1.49 | * | 1.72 | * | 2.91 | * | 4 | ||||||||||||||||||||
| DECEMBER 31, 2011 | SEMIANNUAL REPORT | 29 |
Table of Contents
Statements of Assets and Liabilities
| (Amounts in thousands, except per share amounts) | PIMCO Dividend and Income Builder Fund | PIMCO EqS Dividend Fund | PIMCO EqS Emerging Markets Fund | |||||||||
Assets: | ||||||||||||
Investments, at value | $ | 4,794 | $ | 46,033 | $ | 391,370 | ||||||
Investments in Affiliates, at value | 0 | 7,503 | 104,449 | |||||||||
Repurchase agreements, at value | 100 | 0 | 701 | |||||||||
Cash | 150 | 592 | 64 | |||||||||
Deposits with counterparty | 0 | 0 | 2,350 | |||||||||
Foreign currency, at value | 97 | 23 | 1,036 | |||||||||
Receivable for investments sold | 0 | 0 | 97 | |||||||||
Receivable for Fund shares sold | 432 | 0 | 9 | |||||||||
Interest and dividends receivable | 29 | 6 | 189 | |||||||||
Dividends receivable from Affiliates | 0 | 1 | 22 | |||||||||
Unrealized appreciation on foreign currency contracts | 1 | 3 | 6,351 | |||||||||
Unrealized appreciation on OTC swap agreements | 0 | 0 | 2,295 | |||||||||
| 5,603 | 54,161 | 508,933 | ||||||||||
Liabilities: | ||||||||||||
Payable for investments purchased | $ | 7 | $ | 22 | $ | 851 | ||||||
Payable for investments in Affiliates purchased | 0 | 1 | 22 | |||||||||
Payable for short sales | 0 | 0 | 1,728 | |||||||||
Deposits from counterparty | 0 | 110 | 1,675 | |||||||||
Payable for Fund shares redeemed | 0 | 0 | 12 | |||||||||
Written options outstanding | 0 | 0 | 20 | |||||||||
Accrued investment advisory fees | 1 | 10 | 337 | |||||||||
Accrued supervisory and administrative fees | 1 | 6 | 192 | |||||||||
Reimbursement to PIMCO | 0 | 0 | 10 | |||||||||
OTC swap premiums received | 0 | 0 | 25 | |||||||||
Unrealized depreciation on OTC swap agreements | 0 | 0 | 2,695 | |||||||||
Unrealized depreciation on foreign currency contracts | 4 | 79 | 8,970 | |||||||||
Other liabilities | 0 | 0 | 15 | |||||||||
| 13 | 228 | 16,552 | ||||||||||
Net Assets | $ | 5,590 | $ | 53,933 | $ | 492,381 | ||||||
Net Assets Consist of: | ||||||||||||
Paid in capital | $ | 5,486 | $ | 53,057 | $ | 599,274 | ||||||
(Overdistributed) net investment income | (1 | ) | (14 | ) | (3,177 | ) | ||||||
Accumulated undistributed net realized gain (loss) | 4 | (78 | ) | (44,721 | ) | |||||||
Net unrealized appreciation (depreciation) | 101 | 968 | (58,995 | ) | ||||||||
| $ | 5,590 | $ | 53,933 | $ | 492,381 | |||||||
| 30 | PIMCO EQUITY SERIES | See Accompanying Notes |
Table of Contents
December 31, 2011 (Unaudited)
| PIMCO Dividend and Income Builder Fund | PIMCO EqS Dividend Fund | PIMCO EqS Emerging Markets Fund | ||||||||||
Net Assets: | ||||||||||||
Institutional Class | $ | 5,173 | $ | 53,883 | $ | 484,657 | ||||||
Class P | 11 | 10 | 128 | |||||||||
Administrative Class | NA | NA | 1 | |||||||||
Class D | 10 | 10 | 6,091 | |||||||||
Class A | 376 | 10 | 1,085 | |||||||||
Class C | 10 | 10 | 383 | |||||||||
Class R | 10 | 10 | 36 | |||||||||
Shares Issued and Outstanding: | ||||||||||||
Institutional Class | 507 | 5,291 | 61,007 | |||||||||
Class P | 1 | 1 | 16 | |||||||||
Administrative Class | NA | NA | 0 | |||||||||
Class D | 1 | 1 | 769 | |||||||||
Class A | 37 | 1 | 137 | |||||||||
Class C | 1 | 1 | 49 | |||||||||
Class R | 1 | 1 | 5 | |||||||||
Net Asset Value and Redemption Price* Per Share (Net Asset Per Share Outstanding): | ||||||||||||
Institutional Class | $ | 10.20 | $ | 10.18 | $ | 7.94 | ||||||
Class P | 10.20 | 10.18 | 7.95 | |||||||||
Administrative Class | NA | NA | 7.94 | |||||||||
Class D | 10.20 | 10.18 | 7.92 | |||||||||
Class A | 10.21 | 10.18 | 7.93 | |||||||||
Class C | 10.20 | 10.18 | 7.90 | |||||||||
Class R | 10.20 | 10.18 | 7.93 | |||||||||
Cost of Investments | $ | 4,690 | $ | 44,991 | $ | 447,636 | ||||||
Cost of Investments in Affiliates | $ | 0 | $ | 7,502 | $ | 104,443 | ||||||
Cost of Repurchase Agreements | $ | 100 | $ | 0 | $ | 701 | ||||||
Cost of Foreign Currency Held | $ | 97 | $ | 23 | $ | 1,035 | ||||||
Proceeds Received on Short Sales | $ | 0 | $ | 0 | $ | 1,968 | ||||||
Premiums Received on Written Options | $ | 0 | $ | 0 | $ | 66 | ||||||
| * | With respect to the A and C Classes, the redemption price varies by the length of time the shares are held. |
| DECEMBER 31, 2011 | SEMIANNUAL REPORT | 31 |
Table of Contents
Consolidated Statements of Assets and Liabilities
| (Amounts in thousands, except per share amounts) | PIMCO Emerging Multi-Asset Fund | PIMCO EqS Pathfinder FundTM | ||||||
Assets: | ||||||||
Investments, at value | $ | 4,361 | $ | 1,968,165 | ||||
Investments in Affiliates, at value | 34,295 | 156,073 | ||||||
Repurchase agreements, at value | 436 | 915 | ||||||
Cash | 11 | 78 | ||||||
Deposits with counterparty | 18 | 50,738 | ||||||
Foreign currency, at value | 34 | 478 | ||||||
Receivable for investments sold | 0 | 1,943 | ||||||
Receivable for investments in Affiliates sold | 1,120 | 0 | ||||||
Receivable for Fund shares sold | 144 | 1,337 | ||||||
Interest and dividends receivable | 0 | 2,364 | ||||||
Dividends receivable from Affiliates | 58 | 40 | ||||||
Variation margin receivable on financial derivative instruments | 3 | 0 | ||||||
OTC swap premiums paid | 1 | 0 | ||||||
Unrealized appreciation on foreign currency contracts | 42 | 20,807 | ||||||
Unrealized appreciation on OTC swap agreements | 4 | 121 | ||||||
| 40,527 | 2,203,059 | |||||||
Liabilities: | ||||||||
Payable for investments purchased | $ | 0 | $ | 667 | ||||
Payable for investments in Affiliates purchased | 1,179 | 40 | ||||||
Payable for short sales | 0 | 35,729 | ||||||
Deposits from counterparty | 0 | 12,790 | ||||||
Payable for Fund shares redeemed | 31 | 464 | ||||||
Dividends payable | 0 | 41 | ||||||
Written options outstanding | 288 | 1,121 | ||||||
Accrued investment advisory fees | 7 | 1,137 | ||||||
Accrued supervisory and administrative fees | 18 | 603 | ||||||
Accrued distribution fees | 1 | 31 | ||||||
Accrued servicing fees | 2 | 27 | ||||||
Reimbursement to PIMCO | 1 | 25 | ||||||
OTC swap premiums received | 8 | 0 | ||||||
Unrealized depreciation on OTC swap agreements | 0 | 70 | ||||||
Unrealized depreciation on foreign currency contracts | 120 | 9,731 | ||||||
Other liabilities | 0 | 20 | ||||||
| 1,655 | 62,496 | |||||||
Net Assets | $ | 38,872 | $ | 2,140,563 | ||||
Net Assets Consist of: | ||||||||
Paid in capital | $ | 42,735 | $ | 2,187,839 | ||||
Undistributed (overdistributed) net investment income | 93 | (5,786 | ) | |||||
Accumulated undistributed net realized (loss) | (377 | ) | (17,283 | ) | ||||
Net unrealized (depreciation) | (3,579 | ) | (24,207 | ) | ||||
| $ | 38,872 | $ | 2,140,563 | |||||
| 32 | PIMCO EQUITY SERIES | See Accompanying Notes |
Table of Contents
December 31, 2011 (Unaudited)
| (Amounts in thousands, except per share amounts) | PIMCO Emerging Multi-Asset Fund | PIMCO EqS Pathfinder FundTM | ||||||
Net Assets: | ||||||||
Institutional Class | $ | 19,414 | $ | 1,896,926 | ||||
Class P | 9,217 | 104,332 | ||||||
Administrative Class | 12 | NA | ||||||
Class D | 2,855 | 20,020 | ||||||
Class A | 5,666 | 72,936 | ||||||
Class C | 1,699 | 46,238 | ||||||
Class R | 9 | 111 | ||||||
Shares Issued and Outstanding: | ||||||||
Institutional Class | 2,264 | 195,426 | ||||||
Class P | 1,075 | 10,764 | ||||||
Administrative Class | 1 | NA | ||||||
Class D | 333 | 2,070 | ||||||
Class A | 662 | 7,520 | ||||||
Class C | 199 | 4,809 | ||||||
Class R | 1 | 12 | ||||||
Net Asset Value and Redemption Price* Per Share (Net Asset Per Share Outstanding): | ||||||||
Institutional Class | $ | 8.58 | $ | 9.71 | ||||
Class P | 8.57 | 9.69 | ||||||
Administrative Class | 8.57 | NA | ||||||
Class D | 8.58 | 9.67 | ||||||
Class A | 8.56 | 9.70 | ||||||
Class C | 8.54 | 9.62 | ||||||
Class R | 8.57 | 9.64 | ||||||
Cost of Investments | $ | 5,165 | $ | 2,005,429 | ||||
Cost of Investments in Affiliates | $ | 37,086 | $ | 156,068 | ||||
Cost of Repurchase Agreements | $ | 436 | $ | 915 | ||||
Cost of Foreign Currency Held | $ | 36 | $ | 480 | ||||
Proceeds Received on Short Sales | $ | 0 | $ | 37,395 | ||||
Premiums Received on Written Options | $ | 371 | $ | 1,817 | ||||
| * | With respect to the A and C Classes, the redemption price varies by the length of time the shares are held. |
| DECEMBER 31, 2011 | SEMIANNUAL REPORT | 33 |
Table of Contents
| Period Ended December 31, 2011 (Unaudited) | ||||||||||||
| (Amounts in thousands) | PIMCO Dividend and Income Builder Fund (1) | PIMCO EqS Dividend Fund (1) | PIMCO EqS Emerging Markets Fund | |||||||||
Investment Income: | ||||||||||||
Interest | $ | 4 | $ | 0 | $ | 1 | ||||||
Dividends, net of foreign taxes* | 1 | 8 | 2,594 | |||||||||
Dividends from Affiliate investments | 0 | 1 | 138 | |||||||||
Total Income | 5 | 9 | 2,733 | |||||||||
Expenses: | ||||||||||||
Investment advisory fees | 1 | 13 | 1,976 | |||||||||
Supervisory and administrative fees | 1 | 6 | 895 | |||||||||
Distribution fees - Class C | 0 | 0 | 1 | |||||||||
Servicing fees - Class A | 0 | 0 | 1 | |||||||||
Interest expense | 0 | 0 | 3 | |||||||||
Miscellaneous expense | 0 | 0 | 10 | |||||||||
Total Expenses | 2 | 19 | 2,886 | |||||||||
Waiver and/or Reimbursement by PIMCO | 0 | (3 | ) | (395 | ) | |||||||
Net Expenses | 0 | 16 | 2,491 | |||||||||
Net Investment Income (Loss) | 3 | (7 | ) | 242 | ||||||||
Net Realized and Unrealized Gain (Loss): | ||||||||||||
Net realized gain (loss) on investments | 7 | 8 | (28,264 | ) | ||||||||
Net realized gain (loss) on Affiliate investments | 0 | 1 | (50 | ) | ||||||||
Net realized gain (loss) on futures contracts, written options and swaps | 0 | 0 | (13,536 | ) | ||||||||
Net realized gain (loss) on short sales | 0 | 0 | (1,046 | ) | ||||||||
Net realized (loss) on foreign currency transactions | (3 | ) | (87 | ) | (1,211 | ) | ||||||
Net change in unrealized appreciation (depreciation) on investments | 104 | 1,043 | (42,157 | ) | ||||||||
Net change in unrealized appreciation on Affiliate investments | 0 | 1 | 12 | |||||||||
Net change in unrealized appreciation (depreciation) on futures contracts, written options and swaps | 0 | 0 | (3,259 | ) | ||||||||
Net change in unrealized appreciation on short sales | 0 | 0 | 240 | |||||||||
Net change in unrealized (depreciation) on translation of assets and liabilities denominated in foreign currencies | (3 | ) | (76 | ) | (3,417 | ) | ||||||
Net Gain (Loss) | 105 | 890 | (92,688 | ) | ||||||||
Net Increase (Decrease) in Net Assets Resulting from Operations | $ | 108 | $ | 883 | $ | (92,446 | ) | |||||
* Foreign tax withholdings - Dividends | $ | 0 | $ | 0 | $ | 136 | ||||||
| (1) | Period from December 14, 2011 to December 31, 2011. |
| 34 | PIMCO EQUITY SERIES | See Accompanying Notes |
Table of Contents
Consolidated Statements of Operations
| Period Ended December 31, 2011 (Unaudited) | ||||||||
| (Amounts in thousands) | PIMCO Emerging Multi-Asset Fund | PIMCO EqS Pathfinder FundTM | ||||||
Investment Income: | ||||||||
Interest | $ | 0 | $ | 15 | ||||
Dividends, net of foreign taxes* | 81 | 18,623 | ||||||
Dividends from Affiliate investments | 292 | 305 | ||||||
Total Income | 373 | 18,943 | ||||||
Expenses: | ||||||||
Investment advisory fees | 133 | 7,256 | ||||||
Supervisory and administrative fees | 77 | 3,052 | ||||||
Distribution fees - Class C | 4 | 179 | ||||||
Servicing fees - Class A | 4 | 101 | ||||||
Servicing fees - Class C | 1 | 59 | ||||||
Dividends on short sales | 0 | 41 | ||||||
Interest expense | 0 | 30 | ||||||
Miscellaneous expense | 1 | 47 | ||||||
Total Expenses | 220 | 10,765 | ||||||
Waiver and/or Reimbursement by PIMCO | (118 | ) | (1,638 | ) | ||||
Net Expenses | 102 | 9,127 | ||||||
Net Investment Income | 271 | 9,816 | ||||||
Net Realized and Unrealized Gain (Loss): | ||||||||
Net realized gain (loss) on investments | 199 | (32,236 | ) | |||||
Net realized (loss) on Affiliate investments | (289 | ) | (113 | ) | ||||
Net capital gain distributions received from Underlying Funds | 2 | 0 | ||||||
Net realized (loss) on futures contracts, written options and swaps | (98 | ) | (5,271 | ) | ||||
Net realized gain (loss) on short sales | 0 | (275 | ) | |||||
Net realized gain (loss) on foreign currency transactions | (191 | ) | 22,167 | |||||
Net change in unrealized (depreciation) on investments | (715 | ) | (135,549 | ) | ||||
Net change in unrealized appreciation (depreciation) on Affiliate investments | (2,676 | ) | 18 | |||||
Net change in unrealized appreciation on futures contracts, written options and swaps | 87 | 487 | ||||||
Net change in unrealized appreciation on short sales | 0 | 3,167 | ||||||
Net change in unrealized appreciation (depreciation) on translation of assets and liabilities denominated in foreign currencies | (79 | ) | 10,768 | |||||
Net (Loss) | (3,760 | ) | (136,837 | ) | ||||
Net (Decrease) in Net Assets Resulting from Operations | $ | (3,489 | ) | $ | (127,021 | ) | ||
* Foreign tax withholdings - Dividends | $ | 0 | $ | 598 | ||||
| DECEMBER 31, 2011 | SEMIANNUAL REPORT | 35 |
Table of Contents
Statements of Changes in Net Assets
| PIMCO Dividend and Income Builder Fund | PIMCO EqS Dividend Fund | PIMCO EqS Emerging Markets Fund | ||||||||||||||
| (Amounts in thousands) | Period from December 14, 2011 to December 31, 2011 (Unaudited) | Period from (Unaudited) | Six Months Ended December 31, 2011 (Unaudited) | Period from March 22, 2011 to June 30, 2011 | ||||||||||||
Increase in Net Assets from: | ||||||||||||||||
Operations: | ||||||||||||||||
Net investment income (loss) | $ | 3 | $ | (7 | ) | $ | 242 | $ | 1,456 | |||||||
Net realized gain (loss) | 4 | (79 | ) | (44,057 | ) | (3,868 | ) | |||||||||
Net realized gain (loss) on Affiliate investments | 0 | 1 | (50 | ) | 7 | |||||||||||
Net change in unrealized appreciation (depreciation) | 101 | 967 | (48,593 | ) | (10,408 | ) | ||||||||||
Net change in unrealized appreciation (depreciation) on Affiliate investments | 0 | 1 | 12 | (6 | ) | |||||||||||
Net increase (decrease) resulting from operations | 108 | 883 | (92,446 | ) | (12,819 | ) | ||||||||||
Distributions to Shareholders: | ||||||||||||||||
From net investment income | ||||||||||||||||
Institutional Class | (4 | ) | (7 | ) | (1,138 | ) | 0 | |||||||||
Class D | 0 | 0 | (14 | ) | 0 | |||||||||||
From net realized capital gains | ||||||||||||||||
Institutional Class | 0 | 0 | (468 | ) | 0 | |||||||||||
Class D | 0 | 0 | (7 | ) | 0 | |||||||||||
Class A | 0 | 0 | (1 | ) | 0 | |||||||||||
Total Distributions | (4 | ) | (7 | ) | (1,628 | ) | 0 | |||||||||
Fund Share Transactions: | ||||||||||||||||
Net increase resulting from Fund share transactions** | 5,486 | 53,057 | 231,328 | 367,946 | ||||||||||||
Total Increase in Net Assets | 5,590 | 53,933 | 137,254 | 355,127 | ||||||||||||
Net Assets: | �� | |||||||||||||||
Beginning of period | 0 | 0 | 355,127 | 0 | ||||||||||||
End of period* | $ | 5,590 | $ | 53,933 | $ | 492,381 | $ | 355,127 | ||||||||
*Including (overdistributed) net investment income of: | $ | (1 | ) | $ | (14 | ) | $ | (3,177 | ) | $ | (2,267 | ) | ||||
| ** | See note 12 in the Notes to Financial Statements. |
| 36 | PIMCO EQUITY SERIES | See Accompanying Notes |
Table of Contents
Consolidated Statements of Changes in Net Assets
| PIMCO Emerging Multi-Asset Fund | PIMCO EqS Pathfinder FundTM | |||||||||||||||
| (Amounts in thousands) | Six Months Ended December 31, 2011 (Unaudited) | Period from April 12, 2011 to June 30, 2011 | Six Months Ended December 31, 2011 (Unaudited) | Period from April 14, 2011 to June 30, 2011 | ||||||||||||
Increase in Net Assets from: | ||||||||||||||||
Operations: | ||||||||||||||||
Net investment income | $ | 271 | $ | 23 | $ | 9,816 | $ | 17,655 | ||||||||
Net realized gain (loss) | (90 | ) | 0 | (15,615 | ) | (27,421 | ) | |||||||||
Net realized gain (loss) on Affiliate investments | (289 | ) | 0 | (113 | ) | 54 | ||||||||||
Net capital gain distributions received from Underlying Funds | 2 | 0 | 0 | 0 | ||||||||||||
Net change in unrealized appreciation (depreciation) | (707 | ) | (81 | ) | (121,127 | ) | 131,694 | |||||||||
Net change in unrealized appreciation (depreciation) on Affiliate investments | (2,676 | ) | (115 | ) | 18 | (21 | ) | |||||||||
Net increase (decrease) resulting from operations | (3,489 | ) | (173 | ) | (127,021 | ) | 121,961 | |||||||||
Distributions to Shareholders: | ||||||||||||||||
From net investment income | ||||||||||||||||
Institutional Class | (105 | ) | 0 | (13,284 | ) | (6,818 | ) | |||||||||
Class P | (56 | ) | 0 | (693 | ) | (198 | ) | |||||||||
Class D | (8 | ) | 0 | (95 | ) | (156 | ) | |||||||||
Class A | (27 | ) | 0 | (350 | ) | (359 | ) | |||||||||
Class C | (5 | ) | 0 | (67 | ) | (126 | ) | |||||||||
Class R | 0 | 0 | 0 | (1 | ) | |||||||||||
From net realized capital gains | ||||||||||||||||
Institutional Class | 0 | 0 | (5,792 | ) | (1,484 | ) | ||||||||||
Class P | 0 | 0 | (338 | ) | (45 | ) | ||||||||||
Class D | 0 | 0 | (66 | ) | (37 | ) | ||||||||||
Class A | 0 | 0 | (241 | ) | (105 | ) | ||||||||||
Class C | 0 | 0 | (151 | ) | (36 | ) | ||||||||||
Total Distributions | (201 | ) | 0 | (21,077 | ) | (9,365 | ) | |||||||||
Fund Share Transactions: | ||||||||||||||||
Net increase resulting from Fund share transactions** | 27,518 | 15,217 | 739,670 | 863,349 | ||||||||||||
Total Increase in Net Assets | 23,828 | 15,044 | 591,572 | 975,945 | ||||||||||||
Net Assets: | ||||||||||||||||
Beginning of period | 15,044 | 0 | 1,548,991 | 573,046 | ||||||||||||
End of period* | $ | 38,872 | $ | 15,044 | $ | 2,140,563 | $ | 1,548,991 | ||||||||
*Including undistributed (overdistributed) net investment income of: | $ | 93 | $ | 23 | $ | (5,786 | ) | $ | (1,113 | ) | ||||||
| ** | See note 12 in the Notes to Financial Statements. |
| DECEMBER 31, 2011 | SEMIANNUAL REPORT | 37 |
Table of Contents
Schedule of Investments PIMCO Dividend and Income Builder Fund
| SHARES | MARKET VALUE (000S) | |||||||||||
| COMMON STOCKS 50.6% | ||||||||||||
| AUSTRALIA 1.7% | ||||||||||||
| MATERIALS 1.7% | ||||||||||||
Kingsgate Consolidated Ltd. | 16,580 | $ | 97 | |||||||||
|
| |||||||||||
Total Australia | 97 | |||||||||||
|
| |||||||||||
| BRAZIL 1.6% | ||||||||||||
| CONSUMER STAPLES 1.0% | ||||||||||||
Natura Cosmeticos S.A. | 2,700 | 52 | ||||||||||
|
| |||||||||||
| UTILITIES 0.6% | ||||||||||||
Cia de Saneamento Basico do Estado de Sao Paulo ADR | 639 | 36 | ||||||||||
|
| |||||||||||
Total Brazil | 88 | |||||||||||
|
| |||||||||||
| CANADA 1.0% | ||||||||||||
| CONSUMER DISCRETIONARY 1.0% | ||||||||||||
Groupe Aeroplan, Inc. | 4,886 | 57 | ||||||||||
|
| |||||||||||
Total Canada | 57 | |||||||||||
|
| |||||||||||
| CHINA 2.1% | ||||||||||||
| INDUSTRIALS 2.1% | ||||||||||||
Guangshen Railway Co. Ltd. | 108,000 | 38 | ||||||||||
Jiangsu Expressway Co. Ltd. | 42,000 | 39 | ||||||||||
Zhejiang Expressway Co. Ltd. | 62,000 | 40 | ||||||||||
|
| |||||||||||
| 117 | ||||||||||||
|
| |||||||||||
Total China | 117 | |||||||||||
|
| |||||||||||
| CZECH REPUBLIC 0.7% | ||||||||||||
| UTILITIES 0.7% | ||||||||||||
CEZ A/S | 913 | 36 | ||||||||||
|
| |||||||||||
Total Czech Republic | 36 | |||||||||||
|
| |||||||||||
| FRANCE 1.9% | ||||||||||||
| ENERGY 0.6% | ||||||||||||
Total S.A. | 716 | 37 | ||||||||||
|
| |||||||||||
| HEALTH CARE 1.3% | ||||||||||||
Sanofi | 977 | 71 | ||||||||||
|
| |||||||||||
Total France | 108 | |||||||||||
|
| |||||||||||
| HONG KONG 1.4% | ||||||||||||
| INDUSTRIALS 0.7% | ||||||||||||
Yuexiu Transport Infrastructure Ltd. | 90,000 | 40 | ||||||||||
|
| |||||||||||
| MATERIALS 0.7% | ||||||||||||
Huabao International Holdings Ltd. | 79,000 | 40 | ||||||||||
|
| |||||||||||
Total Hong Kong | 80 | |||||||||||
|
| |||||||||||
| JAPAN 1.3% | ||||||||||||
| INDUSTRIALS 1.3% | ||||||||||||
Asahi Holdings, Inc. | 3,500 | 69 | ||||||||||
|
| |||||||||||
Total Japan | 69 | |||||||||||
|
| |||||||||||
| SHARES | MARKET VALUE (000S) | |||||||||||
| MACAU 0.7% | ||||||||||||
| CONSUMER DISCRETIONARY 0.7% | ||||||||||||
Wynn Macau Ltd. | 15,600 | $ | 39 | |||||||||
|
| |||||||||||
Total Macau | 39 | |||||||||||
|
| |||||||||||
| NETHERLANDS 0.6% | ||||||||||||
| ENERGY 0.6% | ||||||||||||
Royal Dutch Shell PLC ‘A’ | 974 | 36 | ||||||||||
|
| |||||||||||
Total Netherlands | 36 | |||||||||||
|
| |||||||||||
| POLAND 0.8% | ||||||||||||
| CONSUMER STAPLES 0.8% | ||||||||||||
Eurocash S.A. | 5,348 | 44 | ||||||||||
|
| |||||||||||
Total Poland | 44 | |||||||||||
|
| |||||||||||
| SOUTH AFRICA 1.6% | ||||||||||||
| TELECOMMUNICATION SERVICES 1.6% | ||||||||||||
MTN Group Ltd. | 2,493 | 44 | ||||||||||
Vodacom Group Ltd. | 3,993 | 44 | ||||||||||
|
| |||||||||||
| 88 | ||||||||||||
|
| |||||||||||
Total South Africa | 88 | |||||||||||
|
| |||||||||||
| SWITZERLAND 4.1% | ||||||||||||
| HEALTH CARE 4.1% | ||||||||||||
Novartis AG | 2,170 | 124 | ||||||||||
Roche Holding AG | 618 | 104 | ||||||||||
|
| |||||||||||
| 228 | ||||||||||||
|
| |||||||||||
Total Switzerland | 228 | |||||||||||
|
| |||||||||||
| THAILAND 0.7% | ||||||||||||
| INDUSTRIALS 0.7% | ||||||||||||
Bangkok Expressway PCL | 68,800 | 40 | ||||||||||
|
| |||||||||||
Total Thailand | 40 | |||||||||||
|
| |||||||||||
| UNITED KINGDOM 8.6% | ||||||||||||
| CONSUMER STAPLES 4.3% | ||||||||||||
Reckitt Benckiser Group PLC | 1,868 | 92 | ||||||||||
SABMiller PLC | 1,529 | 54 | ||||||||||
Tesco PLC | 15,357 | 96 | ||||||||||
|
| |||||||||||
| 242 | ||||||||||||
|
| |||||||||||
| FINANCIALS 1.7% | ||||||||||||
HSBC Holdings PLC | 6,895 | 53 | ||||||||||
IG Group Holdings PLC | 5,474 | 40 | ||||||||||
|
| |||||||||||
| 93 | ||||||||||||
|
| |||||||||||
| INDUSTRIALS 2.6% | ||||||||||||
Carillion PLC | 30,966 | 145 | ||||||||||
|
| |||||||||||
Total United Kingdom | 480 | |||||||||||
|
| |||||||||||
| UNITED STATES 21.8% | ||||||||||||
| CONSUMER DISCRETIONARY 0.7% | ||||||||||||
McDonald’s Corp. | 401 | 40 | ||||||||||
|
| |||||||||||
| SHARES | MARKET VALUE (000S) | |||||||||||
| CONSUMER STAPLES 6.9% | ||||||||||||
Colgate-Palmolive Co. | 737 | $ | 68 | |||||||||
PepsiCo, Inc. | 1,722 | 114 | ||||||||||
Procter & Gamble Co. | 885 | 59 | ||||||||||
Sysco Corp. | 1,355 | 40 | ||||||||||
Wal-Mart Stores, Inc. | 1,772 | 106 | ||||||||||
|
| |||||||||||
| 387 | ||||||||||||
|
| |||||||||||
| FINANCIALS 2.0% | ||||||||||||
JPMorgan Chase & Co. | 1,312 | 44 | ||||||||||
State Street Corp. | 859 | 35 | ||||||||||
U.S. Bancorp | 1,311 | 35 | ||||||||||
|
| |||||||||||
| 114 | ||||||||||||
|
| |||||||||||
| HEALTH CARE 6.0% | ||||||||||||
Baxter International, Inc. | 2,011 | 99 | ||||||||||
Medtronic, Inc. | 2,900 | 111 | ||||||||||
Pfizer, Inc. | 5,723 | 124 | ||||||||||
|
| |||||||||||
| 334 | ||||||||||||
|
| |||||||||||
| INDUSTRIALS 2.3% | ||||||||||||
Lockheed Martin Corp. | 1,564 | 127 | ||||||||||
|
| |||||||||||
| INFORMATION TECHNOLOGY 3.3% | ||||||||||||
Intel Corp. | 1,457 | 35 | ||||||||||
Microsoft Corp. | 5,686 | 148 | ||||||||||
|
| |||||||||||
| 183 | ||||||||||||
|
| |||||||||||
| MATERIALS 0.6% | ||||||||||||
EI du Pont de Nemours & Co. | 772 | 35 | ||||||||||
|
| |||||||||||
Total United States | 1,220 | |||||||||||
|
| |||||||||||
Total Common Stocks |
| 2,827 | ||||||||||
|
| |||||||||||
| CORPORATE BONDS & NOTES 26.3% | ||||||||||||
| IRELAND 1.8% | ||||||||||||
| INDUSTRIALS 1.8% | ||||||||||||
RZD Capital Ltd. | 100,000 | 101 | ||||||||||
|
| |||||||||||
Total Ireland | 101 | |||||||||||
|
| |||||||||||
| LUXEMBOURG 1.8% | ||||||||||||
| INDUSTRIALS 1.8% | ||||||||||||
Gazprom OAO Via Gaz Capital S.A. | 100,000 | 102 | ||||||||||
|
| |||||||||||
Total Luxembourg | 102 | |||||||||||
|
| |||||||||||
| MEXICO 2.0% | ||||||||||||
| INDUSTRIALS 2.0% | ||||||||||||
Petroleos Mexicanos | 100,000 | 113 | ||||||||||
|
| |||||||||||
Total Mexico | 113 | |||||||||||
|
| |||||||||||
| NETHERLANDS 1.9% | ||||||||||||
| INDUSTRIALS 1.9% | ||||||||||||
UPC Holding BV | 100,000 | 107 | ||||||||||
|
| |||||||||||
Total Netherlands | 107 | |||||||||||
|
| |||||||||||
| 38 | PIMCO EQUITY SERIES | See Accompanying Notes |
Table of Contents
December 31, 2011 (Unaudited)
| SHARES | MARKET VALUE (000S) | |||||||||||
| PUERTO RICO 1.9% | ||||||||||||
| INDUSTRIALS 1.9% | ||||||||||||
Warner Chilcott Corp. | 100,000 | $ | 103 | |||||||||
|
| |||||||||||
Total Puerto Rico | 103 | |||||||||||
|
| |||||||||||
| UNITED STATES 13.7% | ||||||||||||
| BANKING & FINANCE 3.6% | ||||||||||||
Bank of America Corp. | 100,000 | 98 | ||||||||||
Morgan Stanley | 100,000 | 102 | ||||||||||
|
| |||||||||||
| 200 | ||||||||||||
|
| |||||||||||
| INDUSTRIALS 10.1% | ||||||||||||
Altria Group, Inc. | 100,000 | 156 | ||||||||||
Brocade Communications Systems, Inc. | 100,000 | 104 | ||||||||||
HCA, Inc. | 100,000 | 104 | ||||||||||
Reynolds Group Issuer, Inc. | 100,000 | 105 | ||||||||||
Rockies Express Pipeline LLC | 100,000 | 95 | ||||||||||
|
| |||||||||||
| 564 | ||||||||||||
|
| |||||||||||
Total United States | 764 | |||||||||||
|
| |||||||||||
| SHARES | MARKET VALUE (000S) | |||||||||||
| VIRGIN ISLANDS (BRITISH) 3.2% | ||||||||||||
| INDUSTRIALS 3.2% | ||||||||||||
Gold Fields Orogen Holding BVI Ltd. | 200,000 | $ | 177 | |||||||||
Total Virgin Islands (British) | 177 | |||||||||||
|
| |||||||||||
| Total Corporate Bonds & Notes (Cost $1,444) | 1,467 | |||||||||||
|
| |||||||||||
| PRINCIPAL AMOUNT (000S) | ||||||||||||
| SHORT-TERM INSTRUMENTS 10.7% | ||||||||||||
| REPURCHASE AGREEMENTS 1.8% | ||||||||||||
Credit Suisse Securities (USA) LLC |
| |||||||||||
0.050% due 01/03/2012 | $ | 100 | 100 | |||||||||
|
| |||||||||||
(Dated 12/30/2011. Collateralized by U.S. Treasury Notes 0.375% due 06/30/2013 valued at $102. Repurchase proceeds | ||||||||||||
| PRINCIPAL AMOUNT (000S) | MARKET VALUE (000S) | |||||||||||
| U.S. TREASURY BILLS 8.9% | ||||||||||||
0.053% due 06/28/2012 | $ | 500 | $ | 500 | ||||||||
| Total Short-Term Instruments (Cost $600) | 600 | |||||||||||
| Total Investments 87.6% (Cost $4,790) | $ | 4,894 | ||||||||||
| Other Assets and Liabilities (Net) 12.4% | 696 | |||||||||||
|
| |||||||||||
| Net Assets 100.0% | $ | 5,590 | ||||||||||
|
| |||||||||||
Notes to Schedule of Investments (amounts in thousands*):
| * | A zero balance may reflect actual amounts rounding to less than one thousand. |
| (a) | Foreign currency contracts outstanding on December 31, 2011: |
| Type | Currency | Principal Amount Covered by Contract | Settlement Month | Counterparty | Unrealized Appreciation | Unrealized (Depreciation) | Net Unrealized Appreciation/ (Depreciation) | |||||||||||||||||||
Sell | AUD | 74 | 01/2012 | BRC | $ | 0 | $ | (2 | ) | $ | (2 | ) | ||||||||||||||
Sell | 25 | 02/2012 | CBK | 0 | 0 | 0 | ||||||||||||||||||||
Sell | CZK | 720 | 02/2012 | BRC | 0 | 0 | 0 | |||||||||||||||||||
Sell | EUR | 78 | 01/2012 | CBK | 1 | 0 | 1 | |||||||||||||||||||
Sell | GBP | 131 | 01/2012 | CBK | 0 | 0 | 0 | |||||||||||||||||||
Sell | PLN | 40 | 02/2012 | CBK | 0 | 0 | 0 | |||||||||||||||||||
Sell | 117 | 02/2012 | DUB | 0 | 0 | 0 | ||||||||||||||||||||
Sell | ZAR | 866 | 01/2012 | MSC | 0 | (2 | ) | (2 | ) | |||||||||||||||||
|
|
|
|
|
| |||||||||||||||||||||
| $ | 1 | $ | (4 | ) | $ | (3 | ) | |||||||||||||||||||
|
|
|
|
|
| |||||||||||||||||||||
| (b) | Fair Value Measurements (1) |
The following is a summary of the fair valuations according to the inputs used as of December 31, 2011 in valuing the Fund’s assets and liabilities (2):
| Category and Subcategory (3) | Level 1 (4) | Level 2 (5) | Level 3 (6) | Fair Value at 12/31/2011 | ||||||||||||
Investments, at value | ||||||||||||||||
Common Stocks | ||||||||||||||||
Australia | ||||||||||||||||
Materials | $ | 97 | $ | 0 | $ | 0 | $ | 97 | ||||||||
Brazil | ||||||||||||||||
Consumer Staples | 52 | 0 | 0 | 52 | ||||||||||||
Utilities | 36 | 0 | 0 | 36 | ||||||||||||
Canada | ||||||||||||||||
Consumer Discretionary | 57 | 0 | 0 | 57 | ||||||||||||
China | ||||||||||||||||
Industrials | 117 | 0 | 0 | 117 | ||||||||||||
Czech Republic | ||||||||||||||||
Utilities | 36 | 0 | 0 | 36 | ||||||||||||
France | ||||||||||||||||
Energy | 0 | 37 | 0 | 37 | ||||||||||||
Health Care | 71 | 0 | 0 | 71 | ||||||||||||
| Category and Subcategory (3) | Level 1 (4) | Level 2 (5) | Level 3 (6) | Fair Value at 12/31/2011 | ||||||||||||
Hong Kong | ||||||||||||||||
Industrials | $ | 40 | $ | 0 | $ | 0 | $ | 40 | ||||||||
Materials | 0 | 40 | 0 | 40 | ||||||||||||
Japan | ||||||||||||||||
Industrials | 0 | 69 | 0 | 69 | ||||||||||||
Macau | ||||||||||||||||
Consumer Discretionary | 0 | 39 | 0 | 39 | ||||||||||||
Netherlands | ||||||||||||||||
Energy | 0 | 36 | 0 | 36 | ||||||||||||
Poland | ||||||||||||||||
Consumer Staples | 0 | 44 | 0 | 44 | ||||||||||||
South Africa | ||||||||||||||||
Telecommunication Services | 44 | 44 | 0 | 88 | ||||||||||||
Switzerland | ||||||||||||||||
Health Care | 0 | 228 | 0 | 228 | ||||||||||||
| See Accompanying Notes | DECEMBER 31, 2011 | SEMIANNUAL REPORT | 39 |
Table of Contents
Schedule of Investments PIMCO Dividend and Income Builder Fund (Cont.)
| Category and Subcategory (3) | Level 1 (4) | Level 2 (5) | Level 3 (6) | Fair Value at 12/31/2011 | ||||||||||||
Thailand | ||||||||||||||||
Industrials | $ | 40 | $ | 0 | $ | 0 | $ | 40 | ||||||||
United Kingdom | ||||||||||||||||
Consumer Staples | 0 | 242 | 0 | 242 | ||||||||||||
Financials | 0 | 93 | 0 | 93 | ||||||||||||
Industrials | 0 | 145 | 0 | 145 | ||||||||||||
United States | ||||||||||||||||
Consumer Discretionary | 40 | 0 | 0 | 40 | ||||||||||||
Consumer Staples | 387 | 0 | 0 | 387 | ||||||||||||
Financials | 114 | 0 | 0 | 114 | �� | |||||||||||
Health Care | 334 | 0 | 0 | 334 | ||||||||||||
Industrials | 127 | 0 | 0 | 127 | ||||||||||||
Information Technology | 183 | 0 | 0 | 183 | ||||||||||||
Materials | 35 | 0 | 0 | 35 | ||||||||||||
Corporate Bonds & Notes | ||||||||||||||||
Ireland | ||||||||||||||||
Industrials | 0 | 101 | 0 | 101 | ||||||||||||
Luxembourg | ||||||||||||||||
Industrials | 0 | 102 | 0 | 102 | ||||||||||||
Mexico | ||||||||||||||||
Industrials | 0 | 113 | 0 | 113 | ||||||||||||
Netherlands | ||||||||||||||||
Industrials | 0 | 107 | 0 | 107 | ||||||||||||
| Category and Subcategory (3) | Level 1 (4) | Level 2 (5) | Level 3 (6) | Fair Value at 12/31/2011 | ||||||||||||
Puerto Rico | ||||||||||||||||
Industrials | $ | 0 | $ | 103 | $ | 0 | $ | 103 | ||||||||
United States | ||||||||||||||||
Banking & Finance | 0 | 200 | 0 | 200 | ||||||||||||
Industrials | 0 | 564 | 0 | 564 | ||||||||||||
Virgin Islands (British) | ||||||||||||||||
Industrials | 0 | 177 | 0 | 177 | ||||||||||||
Short-Term Instruments | ||||||||||||||||
Repurchase Agreements | 0 | 100 | 0 | 100 | ||||||||||||
U.S. Treasury Bills | 0 | 500 | 0 | 500 | ||||||||||||
| $ | 1,810 | $ | 3,084 | $ | 0 | $ | 4,894 | |||||||||
Financial Derivative Instruments (7) - Assets |
| |||||||||||||||
Foreign Exchange Contracts | $ | 0 | $ | 1 | $ | 0 | $ | 1 | ||||||||
Financial Derivative Instruments (7) - Liabilities |
| |||||||||||||||
Foreign Exchange Contracts | $ | 0 | $ | (4 | ) | $ | 0 | $ | (4 | ) | ||||||
Totals | $ | 1,810 | $ | 3,081 | $ | 0 | $ | 4,891 | ||||||||
| (1) | See note 3 in the Notes to Financial Statements for more information regarding pricing inputs and valuation techniques. |
| (2) | There were no significant transfers into or out of level 1, 2, and 3 during the period ended December 31, 2011. |
| (3) | Refer to the Schedule of Investments for additional information. |
| (4) | Quoted prices in active markets for identical investments. |
| (5) | Significant other observable inputs. |
| (6) | Significant unobservable inputs. |
| (7) | Financial Derivative Instruments may include open futures contracts, swap agreements, written options, and foreign currency contracts. |
| (c) | Fair Value of Financial Derivative Instruments (1) |
The following is a summary of the fair valuation of the Fund’s derivative instruments categorized by risk exposure:
Fair Values of Financial Derivative Instruments on the Statements of Assets and Liabilities as of December 31, 2011:
| Derivatives not accounted for as hedging instruments | ||||||||||||||||||||||||
| Commodity Contracts | Credit Contracts | Equity Contracts | Foreign Exchange Contracts | Interest Rate Contracts | Total | |||||||||||||||||||
Assets: | ||||||||||||||||||||||||
Unrealized appreciation on foreign currency contracts | $ | 0 | $ | 0 | $ | 0 | $ | 1 | $ | 0 | $ | 1 | ||||||||||||
|
|
|
|
|
|
|
|
|
|
|
| |||||||||||||
Liabilities: | ||||||||||||||||||||||||
Unrealized depreciation on foreign currency contracts | $ | 0 | $ | 0 | $ | 0 | $ | 4 | $ | 0 | $ | 4 | ||||||||||||
|
|
|
|
|
|
|
|
|
|
|
| |||||||||||||
The Effect of Financial Derivative Instruments on the Statements of Operations for the Period Ended December 31, 2011:
| Derivatives not accounted for as hedging instruments | ||||||||||||||||||||||||
| Commodity Contracts | Credit Contracts | Equity Contracts | Foreign Exchange Contracts | Interest Rate Contracts | Total | |||||||||||||||||||
Realized Gain on Derivatives Recognized as a Result | ||||||||||||||||||||||||
Net realized gain on foreign currency transactions | $ | 0 | $ | 0 | $ | 0 | $ | 5 | $ | 0 | $ | 5 | ||||||||||||
|
|
|
|
|
|
|
|
|
|
|
| |||||||||||||
Net Change in Unrealized (Depreciation) on Derivatives Recognized as a Result of Operations: | ||||||||||||||||||||||||
Net change in unrealized (depreciation) on translation of assets and liabilities denominated in foreign currencies | $ | 0 | $ | 0 | $ | 0 | $ | (3 | ) | $ | 0 | $ | (3 | ) | ||||||||||
|
|
|
|
|
|
|
|
|
|
|
| |||||||||||||
| (1) | See note 5 in the Notes to Financial Statements for additional information. |
| 40 | PIMCO EQUITY SERIES | See Accompanying Notes |
Table of Contents
December 31, 2011 (Unaudited)
| (d) | Collateral (Received)/Pledged for OTC Financial Derivative Instruments |
The following is a summary by counterparty of the market value of OTC financial derivative instruments and collateral (received)/pledged as of December 31, 2011:
| Counterparty | Total Market Value of OTC Derivatives | Collateral (Received)/Pledged | Net Exposures (1) | |||||||||
BRC | $ | (2 | ) | $ | 0 | $ | (2 | ) | ||||
CBK | 1 | 0 | 1 | |||||||||
DUB | 0 | 0 | 0 | |||||||||
MSC | (2 | ) | 0 | (2 | ) | |||||||
| (1) | Net Exposure represents the net receivable/(payable) that would be due from/to the counterparty in the event of default. See note 6, Principal Risks, in the Notes to Financial Statements for more information regarding credit and counterparties at risk. |
| See Accompanying Notes | DECEMBER 31, 2011 | SEMIANNUAL REPORT | 41 |
Table of Contents
Schedule of Investments PIMCO EqS Dividend Fund
| SHARES | MARKET VALUE (000S) | |||||||||||
| COMMON STOCKS 85.4% | ||||||||||||
| AUSTRALIA 2.9% | ||||||||||||
| MATERIALS 2.9% | ||||||||||||
Kingsgate Consolidated Ltd. | 267,412 | $ | 1,566 | |||||||||
|
| |||||||||||
Total Australia |
| 1,566 | ||||||||||
|
| |||||||||||
| BRAZIL 2.5% | ||||||||||||
| CONSUMER STAPLES 1.6% | ||||||||||||
Natura Cosmeticos S.A. | 44,200 | 859 | ||||||||||
|
| |||||||||||
| UTILITIES 0.9% | ||||||||||||
Cia de Saneamento Basico do Estado de Sao Paulo ADR | 8,334 | 464 | ||||||||||
|
| |||||||||||
Total Brazil |
| 1,323 | ||||||||||
|
| |||||||||||
| CANADA 1.6% | ||||||||||||
| CONSUMER DISCRETIONARY 1.6% | ||||||||||||
Groupe Aeroplan, Inc. | 73,129 | 857 | ||||||||||
|
| |||||||||||
Total Canada |
| 857 | ||||||||||
|
| |||||||||||
| CHINA 4.3% | ||||||||||||
| INDUSTRIALS 4.3% | ||||||||||||
Guangshen Railway Co. Ltd. | 1,598,000 | 565 | ||||||||||
Jiangsu Expressway Co. Ltd. | 944,000 | 866 | ||||||||||
Zhejiang Expressway Co. Ltd. | 1,382,000 | 893 | ||||||||||
|
| |||||||||||
| 2,324 | ||||||||||||
|
| |||||||||||
Total China |
| 2,324 | ||||||||||
|
| |||||||||||
| CZECH REPUBLIC 1.0% | ||||||||||||
| UTILITIES 1.0% | ||||||||||||
CEZ A/S | 13,882 | 552 | ||||||||||
|
| |||||||||||
Total Czech Republic |
| 552 | ||||||||||
|
| |||||||||||
| FRANCE 3.2% | ||||||||||||
| ENERGY 1.1% | ||||||||||||
Total S.A. | 11,542 | 589 | ||||||||||
|
| |||||||||||
| HEALTH CARE 2.1% | ||||||||||||
Sanofi | 15,771 | 1,153 | ||||||||||
|
| |||||||||||
Total France |
| 1,742 | ||||||||||
|
| |||||||||||
| HONG KONG 2.3% | ||||||||||||
| INDUSTRIALS 1.2% | ||||||||||||
Yuexiu Transport Infrastructure Ltd. | 1,462,000 | 640 | ||||||||||
|
| |||||||||||
| MATERIALS 1.1% | ||||||||||||
Huabao International Holdings Ltd. | 1,189,000 | 607 | ||||||||||
|
| |||||||||||
Total Hong Kong |
| 1,247 | ||||||||||
|
| |||||||||||
| JAPAN 2.1% | ||||||||||||
| INDUSTRIALS 2.1% | ||||||||||||
Asahi Holdings, Inc. | 57,000 | 1,129 | ||||||||||
|
| |||||||||||
Total Japan | 1,129 | |||||||||||
|
| |||||||||||
| SHARES | MARKET VALUE (000S) | |||||||||||
| MACAU 1.1% | ||||||||||||
| CONSUMER DISCRETIONARY 1.1% | ||||||||||||
Wynn Macau Ltd. | 237,600 | $ | 592 | |||||||||
|
| |||||||||||
Total Macau |
| 592 | ||||||||||
|
| |||||||||||
| NETHERLANDS 1.1% | ||||||||||||
| ENERGY 1.1% | ||||||||||||
Royal Dutch Shell PLC ‘A’ | 15,710 | 576 | ||||||||||
|
| |||||||||||
Total Netherlands |
| 576 | ||||||||||
|
| |||||||||||
| POLAND 0.9% | ||||||||||||
| CONSUMER STAPLES 0.9% | ||||||||||||
Eurocash S.A. | 58,480 | 482 | ||||||||||
|
| |||||||||||
Total Poland |
| 482 | ||||||||||
|
| |||||||||||
| SOUTH AFRICA 2.7% | ||||||||||||
| TELECOMMUNICATION SERVICES 2.7% | ||||||||||||
MTN Group Ltd. | 40,332 | 716 | ||||||||||
Vodacom Group Ltd. | 64,604 | 712 | ||||||||||
|
| |||||||||||
| 1,428 | ||||||||||||
|
| |||||||||||
Total South Africa |
| 1,428 | ||||||||||
|
| |||||||||||
| SWITZERLAND 6.8% | ||||||||||||
| HEALTH CARE 6.8% | ||||||||||||
Novartis AG | 35,005 | 1,999 | ||||||||||
Roche Holding AG | 9,976 | 1,687 | ||||||||||
|
| |||||||||||
| 3,686 | ||||||||||||
|
| |||||||||||
Total Switzerland |
| 3,686 | ||||||||||
|
| |||||||||||
| THAILAND 1.6% | ||||||||||||
| INDUSTRIALS 1.6% | ||||||||||||
Bangkok Expressway PCL | 1,447,200 | 835 | ||||||||||
|
| |||||||||||
Total Thailand |
| 835 | ||||||||||
|
| |||||||||||
| UNITED KINGDOM 14.7% | ||||||||||||
| CONSUMER STAPLES 8.0% | ||||||||||||
Reckitt Benckiser Group PLC | 34,020 | 1,678 | ||||||||||
SABMiller PLC | 24,664 | 867 | ||||||||||
Tesco PLC | 278,512 | 1,743 | ||||||||||
|
| |||||||||||
| 4,288 | ||||||||||||
|
| |||||||||||
| FINANCIALS 2.6% | ||||||||||||
HSBC Holdings PLC | 111,291 | 849 | ||||||||||
IG Group Holdings PLC | 76,998 | 570 | ||||||||||
|
| |||||||||||
| 1,419 | ||||||||||||
|
| |||||||||||
| INDUSTRIALS 4.1% | ||||||||||||
Carillion PLC | 478,681 | 2,234 | ||||||||||
|
| |||||||||||
Total United Kingdom |
| 7,941 | ||||||||||
|
| |||||||||||
| UNITED STATES 36.6% | ||||||||||||
| CONSUMER DISCRETIONARY 1.1% | ||||||||||||
McDonald’s Corp. | 5,785 | 580 | ||||||||||
|
| |||||||||||
| SHARES | MARKET VALUE (000S) | |||||||||||
| CONSUMER STAPLES 11.5% | ||||||||||||
Colgate-Palmolive Co. | 11,955 | $ | 1,105 | |||||||||
PepsiCo, Inc. | 27,798 | 1,844 | ||||||||||
Procter & Gamble Co. | 16,550 | 1,104 | ||||||||||
Sysco Corp. | 15,626 | 458 | ||||||||||
Wal-Mart Stores, Inc. | 28,610 | 1,710 | ||||||||||
|
| |||||||||||
| 6,221 | ||||||||||||
|
| |||||||||||
| FINANCIALS 3.4% | ||||||||||||
JPMorgan Chase & Co. | 21,229 | 706 | ||||||||||
State Street Corp. | 13,856 | 558 | ||||||||||
U.S. Bancorp | 21,166 | 573 | ||||||||||
|
| |||||||||||
| 1,837 | ||||||||||||
|
| |||||||||||
| HEALTH CARE 10.0% | ||||||||||||
Baxter International, Inc. | 32,508 | 1,608 | ||||||||||
Medtronic, Inc. | 46,818 | 1,791 | ||||||||||
Pfizer, Inc. | 92,353 | 1,999 | ||||||||||
|
| |||||||||||
| 5,398 | ||||||||||||
|
| |||||||||||
| INDUSTRIALS 3.8% | ||||||||||||
Lockheed Martin Corp. | 25,237 | 2,042 | ||||||||||
|
| |||||||||||
| INFORMATION TECHNOLOGY 5.7% | ||||||||||||
Intel Corp. | 23,518 | 570 | ||||||||||
Microsoft Corp. | 97,613 | 2,534 | ||||||||||
|
| |||||||||||
| 3,104 | ||||||||||||
|
| |||||||||||
| MATERIALS 1.1% | ||||||||||||
EI du Pont de Nemours & Co. | 12,462 | 571 | ||||||||||
|
| |||||||||||
Total United States | 19,753 | |||||||||||
|
| |||||||||||
Total Common Stocks (Cost $44,991) |
| 46,033 | ||||||||||
|
| |||||||||||
| SHORT-TERM INSTRUMENTS 13.9% | ||||||||||||
| PIMCO SHORT-TERM FLOATING NAV PORTFOLIO (a) 13.9% | ||||||||||||
| 749,269 | 7,503 | |||||||||||
|
| |||||||||||
Total Short-Term Instruments (Cost $7,502) |
| 7,503 | ||||||||||
|
| |||||||||||
| Total Investments 99.3% (Cost $52,493) | $ | 53,536 | ||||||||||
| Other Assets and Liabilities (Net) 0.7% | 397 | |||||||||||
|
| |||||||||||
| Net Assets 100.0% | $ | 53,933 | ||||||||||
|
| |||||||||||
| 42 | PIMCO EQUITY SERIES | See Accompanying Notes |
Table of Contents
December 31, 2011 (Unaudited)
Notes to Schedule of Investments (amounts in thousands*):
| * | A zero balance may reflect actual amounts rounding to less than one thousand. |
| (a) | Affiliated to the Fund. |
| (b) | Foreign currency contracts outstanding on December 31, 2011: |
| Type | Currency | Principal Amount Covered by Contract | Settlement Month | Counterparty | Unrealized Appreciation | Unrealized (Depreciation) | Net Unrealized Appreciation/ (Depreciation) | |||||||||||||||||||
Sell | AUD | 72 | 01/2012 | BRC | $ | 0 | $ | (2 | ) | $ | (2 | ) | ||||||||||||||
Sell | 1,516 | 02/2012 | CBK | 0 | (22 | ) | (22 | ) | ||||||||||||||||||
Sell | CZK | 10,970 | 02/2012 | BRC | 1 | (7 | ) | (6 | ) | |||||||||||||||||
Sell | EUR | 526 | 02/2012 | CBK | 0 | (2 | ) | (2 | ) | |||||||||||||||||
Sell | GBP | 2,113 | 02/2012 | JPM | 0 | (24 | ) | (24 | ) | |||||||||||||||||
Sell | PLN | 1,640 | 02/2012 | CBK | 2 | 0 | 2 | |||||||||||||||||||
Sell | 114 | 02/2012 | DUB | 0 | 0 | 0 | ||||||||||||||||||||
Sell | ZAR | 11,602 | 01/2012 | MSC | 0 | (22 | ) | (22 | ) | |||||||||||||||||
|
|
|
|
|
| |||||||||||||||||||||
| $ | 3 | $ | (79 | ) | $ | (76 | ) | |||||||||||||||||||
|
|
|
|
|
| |||||||||||||||||||||
| (c) | Fair Value Measurements (1) |
The following is a summary of the fair valuations according to the inputs used as of December 31, 2011 in valuing the Fund’s assets and liabilities (2):
| Category and Subcategory (3) | Level 1 (4) | Level 2 (5) | Level 3 (6) | Fair Value at 12/31/2011 | ||||||||||||
Investments, at value | ||||||||||||||||
Common Stocks | ||||||||||||||||
Australia | ||||||||||||||||
Materials | $ | 1,566 | $ | 0 | $ | 0 | $ | 1,566 | ||||||||
Brazil | ||||||||||||||||
Consumer Staples | 859 | 0 | 0 | 859 | ||||||||||||
Utilities | 464 | 0 | 0 | 464 | ||||||||||||
Canada | ||||||||||||||||
Consumer Discretionary | 857 | 0 | 0 | 857 | ||||||||||||
China | ||||||||||||||||
Industrials | 2,324 | 0 | 0 | 2,324 | ||||||||||||
Czech Republic | ||||||||||||||||
Utilities | 552 | 0 | 0 | 552 | ||||||||||||
France | ||||||||||||||||
Energy | 0 | 589 | 0 | 589 | ||||||||||||
Health Care | 1,153 | 0 | 0 | 1,153 | ||||||||||||
Hong Kong | ||||||||||||||||
Industrials | 640 | 0 | 0 | 640 | ||||||||||||
Materials | 0 | 607 | 0 | 607 | ||||||||||||
Japan | ||||||||||||||||
Industrials | 0 | 1,129 | 0 | 1,129 | ||||||||||||
Macau | ||||||||||||||||
Consumer Discretionary | 0 | 592 | 0 | 592 | ||||||||||||
Netherlands | ||||||||||||||||
Energy | 0 | 576 | 0 | 576 | ||||||||||||
Poland | ||||||||||||||||
Consumer Staples | 0 | 482 | 0 | 482 | ||||||||||||
South Africa | ||||||||||||||||
Telecommunication Services | 716 | 712 | 0 | 1,428 | ||||||||||||
| Category and Subcategory (3) | Level 1 (4) | Level 2 (5) | Level 3 (6) | Fair Value at 12/31/2011 | ||||||||||||
Switzerland | ||||||||||||||||
Health Care | $ | 0 | $ | 3,686 | $ | 0 | $ | 3,686 | ||||||||
Thailand | ||||||||||||||||
Industrials | 835 | 0 | 0 | 835 | ||||||||||||
United Kingdom | ||||||||||||||||
Consumer Staples | 0 | 4,288 | 0 | 4,288 | ||||||||||||
Financials | 0 | 1,419 | 0 | 1,419 | ||||||||||||
Industrials | 0 | 2,234 | 0 | 2,234 | ||||||||||||
United States | ||||||||||||||||
Consumer Discretionary | 580 | 0 | 0 | 580 | ||||||||||||
Consumer Staples | 6,221 | 0 | 0 | 6,221 | ||||||||||||
Financials | 1,837 | 0 | 0 | 1,837 | ||||||||||||
Health Care | 5,398 | 0 | 0 | 5,398 | ||||||||||||
Industrials | 2,042 | 0 | 0 | 2,042 | ||||||||||||
Information Technology | 3,104 | 0 | 0 | 3,104 | ||||||||||||
Materials | 571 | 0 | 0 | 571 | ||||||||||||
Short-Term Instruments | ||||||||||||||||
PIMCO Short-Term Floating NAV Portfolio | 7,503 | 0 | 0 | 7,503 | ||||||||||||
| $ | 37,222 | $ | 16,314 | $ | 0 | $ | 53,536 | |||||||||
Financial Derivative Instruments (7) - Assets |
| |||||||||||||||
Foreign Exchange Contracts | $ | 0 | $ | 3 | $ | 0 | $ | 3 | ||||||||
Financial Derivative Instruments (7) - Liabilities |
| |||||||||||||||
Foreign Exchange Contracts | $ | 0 | $ | (79 | ) | $ | 0 | $ | (79 | ) | ||||||
Totals | $ | 37,222 | $ | 16,238 | $ | 0 | $ | 53,460 | ||||||||
| (1) | See note 3 in the Notes to Financial Statements for more information regarding pricing inputs and valuation techniques. |
| (2) | There were no significant transfers into or out of level 1, 2, and 3 during the period ended December 31, 2011. |
| (3) | Refer to the Schedule of Investments for additional information. |
| (4) | Quoted prices in active markets for identical investments. |
| (5) | Significant other observable inputs. |
| (6) | Significant unobservable inputs. |
| (7) | Financial Derivative Instruments may include open futures contracts, swap agreements, written options, and foreign currency contracts. |
| See Accompanying Notes | DECEMBER 31, 2011 | SEMIANNUAL REPORT | 43 |
Table of Contents
Schedule of Investments PIMCO EqS Dividend Fund (Cont.)
December 31, 2011 (Unaudited)
| (d) | Fair Value of Financial Derivative Instruments (1) |
The following is a summary of the fair valuation of the Fund’s derivative instruments categorized by risk exposure:
Fair Values of Financial Derivative Instruments on the Statements of Assets and Liabilities as of December 31, 2011:
| Derivatives not accounted for as hedging instruments | ||||||||||||||||||||||||
| Commodity Contracts | Credit Contracts | Equity Contracts | Foreign Exchange Contracts | Interest Rate Contracts | Total | |||||||||||||||||||
Assets: | ||||||||||||||||||||||||
Unrealized appreciation on foreign currency contracts | $ | 0 | $ | 0 | $ | 0 | $ | 3 | $ | 0 | $ | 3 | ||||||||||||
|
|
|
|
|
|
|
|
|
|
|
| |||||||||||||
Liabilities: | ||||||||||||||||||||||||
Unrealized depreciation on foreign currency contracts | $ | 0 | $ | 0 | $ | 0 | $ | 79 | $ | 0 | $ | 79 | ||||||||||||
|
|
|
|
|
|
|
|
|
|
|
| |||||||||||||
The Effect of Financial Derivative Instruments on the Statements of Operations for the Period Ended December 31, 2011:
| Derivatives not accounted for as hedging instruments | ||||||||||||||||||||||||
| Commodity Contracts | Credit Contracts | Equity Contracts | Foreign Exchange Contracts | Interest Rate Contracts | Total | |||||||||||||||||||
Realized Gain on Derivatives Recognized as a Result from Operations: | ||||||||||||||||||||||||
Net realized gain on foreign currency transactions | $ | 0 | $ | 0 | $ | 0 | $ | 7 | $ | 0 | $ | 7 | ||||||||||||
|
|
|
|
|
|
|
|
|
|
|
| |||||||||||||
Net Change in Unrealized (Depreciation) on Derivatives Recognized as a Result of Operations: | ||||||||||||||||||||||||
Net change in unrealized (depreciation) on translation of assets and liabilities denominated in foreign currencies | $ | 0 | $ | 0 | $ | 0 | $ | (76 | ) | $ | 0 | $ | (76 | ) | ||||||||||
|
|
|
|
|
|
|
|
|
|
|
| |||||||||||||
| (1) | See note 5 in the Notes to Financial Statements for additional information. |
| (e) | Collateral (Received) for OTC Financial Derivative Instruments |
The following is a summary by counterparty of the market value of OTC financial derivative instruments and collateral (received) as of December 31, 2011:
| Counterparty | Total Market Value of OTC Derivatives | Collateral (Received) | Net Exposures (1) | |||||||||
BRC | $ | (8 | ) | $ | 0 | $ | (8 | ) | ||||
CBK | (22 | ) | 0 | (22 | ) | |||||||
DUB | 0 | 0 | 0 | |||||||||
JPM | (24 | ) | 0 | (24 | ) | |||||||
MSC | (22 | ) | (110 | ) | (132 | ) | ||||||
| (1) | Net Exposure represents the net receivable/(payable) that would be due from/to the counterparty in the event of default. See note 6, Principal Risks, in the Notes to Financial Statements for more information regarding credit and counterparties at risk. |
| 44 | PIMCO EQUITY SERIES | See Accompanying Notes |
Table of Contents
Schedule of Investments PIMCO EqS Emerging Markets Fund
December 31, 2011 (Unaudited)
| SHARES | MARKET VALUE (000s) | |||||||||||
| COMMON STOCKS 65.3% | ||||||||||||
| AUSTRALIA 1.9% | ||||||||||||
| ENERGY 0.8% | ||||||||||||
Santos Ltd. | 305,671 | $ | 3,825 | |||||||||
|
| |||||||||||
| MATERIALS 1.1% | ||||||||||||
Fortescue Metals Group Ltd. | 1,267,317 | 5,544 | ||||||||||
|
| |||||||||||
Total Australia |
| 9,369 | ||||||||||
|
| |||||||||||
| BERMUDA 1.3% | ||||||||||||
| ENERGY 1.3% | ||||||||||||
Seadrill Ltd. | 193,122 | 6,441 | ||||||||||
|
| |||||||||||
Total Bermuda |
| 6,441 | ||||||||||
|
| |||||||||||
| BRAZIL 2.8% | ||||||||||||
| CONSUMER STAPLES 1.1% | ||||||||||||
Cia de Bebidas das Americas SP – ADR | 153,602 | 5,544 | ||||||||||
|
| |||||||||||
| FINANCIALS 1.7% | ||||||||||||
Itau Unibanco Holding S.A. SP – ADR | 440,109 | 8,168 | ||||||||||
|
| |||||||||||
Total Brazil |
| 13,712 | ||||||||||
|
| |||||||||||
| CANADA 0.9% | ||||||||||||
| MATERIALS 0.9% | ||||||||||||
Uranium One, Inc. (a) | 2,187,125 | 4,637 | ||||||||||
|
| |||||||||||
Total Canada |
| 4,637 | ||||||||||
|
| |||||||||||
| CHINA 10.0% | ||||||||||||
| CONSUMER DISCRETIONARY 1.0% | ||||||||||||
Boshiwa International Holding Ltd. | 20,689,000 | 4,639 | ||||||||||
|
| |||||||||||
| CONSUMER STAPLES 1.0% | ||||||||||||
Shenguan Holdings Group Ltd. | 8,868,000 | 5,115 | ||||||||||
|
| |||||||||||
| FINANCIALS 1.9% | ||||||||||||
China Construction Bank Corp. | 9,841,000 | 6,836 | ||||||||||
New China Life Insurance Co. Ltd. (a) | 806,300 | 2,668 | ||||||||||
|
| |||||||||||
| 9,504 | ||||||||||||
|
| |||||||||||
| INDUSTRIALS 3.3% | ||||||||||||
First Tractor Co. Ltd. | 3,364,000 | 3,132 | ||||||||||
International Mining Machinery Holdings Ltd. | 3,219,500 | 3,544 | ||||||||||
Jiangsu Expressway Co. Ltd. | 5,478,000 | 5,027 | ||||||||||
Sinotruk Hong Kong Ltd. | 1,675,000 | 934 | ||||||||||
Yuanda China Holdings Ltd. (a) | 25,684,000 | 3,395 | ||||||||||
|
| |||||||||||
| 16,032 | ||||||||||||
|
| |||||||||||
| SHARES | MARKET VALUE (000s) | |||||||||||
| INFORMATION TECHNOLOGY 1.6% | ||||||||||||
Hollysys Automation Technologies Ltd. (a) | 355,888 | $ | 2,961 | |||||||||
Lenovo Group Ltd. | 7,624,000 | 5,072 | ||||||||||
|
| |||||||||||
| 8,033 | ||||||||||||
|
| |||||||||||
| MATERIALS 1.2% | ||||||||||||
China Shanshui Cement Group Ltd. | 3,259,000 | 2,160 | ||||||||||
Xingda International Holdings Ltd. | 7,815,000 | 3,510 | ||||||||||
|
| |||||||||||
| 5,670 | ||||||||||||
|
| |||||||||||
Total China | 48,993 | |||||||||||
|
| |||||||||||
| COLOMBIA 1.3% | ||||||||||||
| ENERGY 1.3% | ||||||||||||
Ecopetrol S.A. SP – ADR | 146,435 | 6,519 | ||||||||||
|
| |||||||||||
Total Colombia |
| 6,519 | ||||||||||
|
| |||||||||||
| CYPRUS 0.8% | ||||||||||||
| INDUSTRIALS 0.8% | ||||||||||||
Globaltrans Investment PLC SP – GDR | 292,587 | 4,018 | ||||||||||
|
| |||||||||||
Total Cyprus |
| 4,018 | ||||||||||
|
| |||||||||||
| CZECH REPUBLIC 1.4% | ||||||||||||
| UTILITIES 1.4% | ||||||||||||
CEZ A/S | 173,283 | 6,894 | ||||||||||
|
| |||||||||||
Total Czech Republic |
| 6,894 | ||||||||||
|
| |||||||||||
| DENMARK 1.2% | ||||||||||||
| CONSUMER STAPLES 1.2% | ||||||||||||
Carlsberg A/S | 82,971 | 5,842 | ||||||||||
|
| |||||||||||
Total Denmark |
| 5,842 | ||||||||||
|
| |||||||||||
| HONG KONG 5.9% | ||||||||||||
| FINANCIALS 3.9% | ||||||||||||
AIA Group Ltd. | 4,262,800 | 13,270 | ||||||||||
China Overseas Grand Oceans Group Ltd. | 2,790,000 | 2,431 | ||||||||||
Glorious Property Holdings Ltd. | 19,920,000 | 3,501 | ||||||||||
|
| |||||||||||
| 19,202 | ||||||||||||
|
| |||||||||||
| INDUSTRIALS 0.8% | ||||||||||||
Shanghai Industrial Holdings Ltd. | 1,480,000 | 4,056 | ||||||||||
|
| |||||||||||
| INFORMATION TECHNOLOGY 0.6% | ||||||||||||
China High Precision Automation Group Ltd. | 8,446,000 | 2,839 | ||||||||||
|
| |||||||||||
| MATERIALS 0.6% | ||||||||||||
Huabao International Holdings Ltd. | 5,694,000 | 2,908 | ||||||||||
|
| |||||||||||
Total Hong Kong |
| 29,005 | ||||||||||
|
| |||||||||||
| SHARES | MARKET VALUE (000s) | |||||||||||
| INDIA 2.0% | ||||||||||||
| FINANCIALS 0.7% | ||||||||||||
Bank of Baroda | 146,734 | $ | 1,811 | |||||||||
Yes Bank Ltd. | 400,597 | 1,799 | ||||||||||
|
| |||||||||||
| 3,610 | ||||||||||||
|
| |||||||||||
| INDUSTRIALS 0.3% | ||||||||||||
Bharat Electronics Ltd. | 56,603 | 1,441 | ||||||||||
|
| |||||||||||
| INFORMATION TECHNOLOGY 0.5% | ||||||||||||
Infosys Ltd. | 48,671 | 2,524 | ||||||||||
|
| |||||||||||
| TELECOMMUNICATION SERVICES 0.5% | ||||||||||||
Idea Cellular Ltd. (a) | 1,507,286 | 2,353 | ||||||||||
|
| |||||||||||
Total India | 9,928 | |||||||||||
|
| |||||||||||
| INDONESIA 0.3% | ||||||||||||
| FINANCIALS 0.3% | ||||||||||||
Bank Mandiri Tbk PT | 2,215,000 | 1,646 | ||||||||||
|
| |||||||||||
Total Indonesia |
| 1,646 | ||||||||||
|
| |||||||||||
| ISRAEL 4.0% | ||||||||||||
| HEALTH CARE 1.2% | ||||||||||||
Teva Pharmaceutical Industries Ltd. SP – ADR | 144,570 | 5,835 | ||||||||||
|
| |||||||||||
| MATERIALS 0.8% | ||||||||||||
Israel Chemicals Ltd. | 390,625 | 4,097 | ||||||||||
|
| |||||||||||
| TELECOMMUNICATION SERVICES 2.0% | ||||||||||||
Bezeq The Israeli Telecommunication Corp. Ltd. | 5,336,627 | 9,832 | ||||||||||
|
| |||||||||||
Total Israel |
| 19,764 | ||||||||||
|
| |||||||||||
| ITALY 0.8% | ||||||||||||
| CONSUMER DISCRETIONARY 0.8% | ||||||||||||
Prada SpA (a) | 880,100 | 3,961 | ||||||||||
|
| |||||||||||
Total Italy |
| 3,961 | ||||||||||
|
| |||||||||||
| JAPAN 1.5% | ||||||||||||
| CONSUMER DISCRETIONARY 1.5% | ||||||||||||
Honda Motor Co. Ltd. | 249,500 | 7,600 | ||||||||||
|
| |||||||||||
Total Japan |
| 7,600 | ||||||||||
|
| |||||||||||
| KAZAKHSTAN 1.2% | ||||||||||||
| ENERGY 1.2% | ||||||||||||
KazMunaiGas Exploration Production SP – GDR | 405,041 | 6,041 | ||||||||||
|
| |||||||||||
Total Kazakhstan |
| 6,041 | ||||||||||
|
| |||||||||||
| MEXICO 1.4% | ||||||||||||
| CONSUMER DISCRETIONARY 0.7% | ||||||||||||
Urbi Desarrollos Urbanos S.A.B. de C.V. (a) | 2,919,600 | 3,322 | ||||||||||
|
| |||||||||||
| See Accompanying Notes | DECEMBER 31, 2011 | SEMIANNUAL REPORT | 45 |
Table of Contents
Schedule of Investments PIMCO EqS Emerging Markets Fund (Cont.)
| SHARES | MARKET VALUE (000S) | |||||||||||
| CONSUMER STAPLES 0.7% | ||||||||||||
Wal-Mart de Mexico S.A.B. de C.V. | 1,272,900 | $ | 3,494 | |||||||||
|
| |||||||||||
Total Mexico |
| 6,816 | ||||||||||
|
| |||||||||||
| PERU 1.7% | ||||||||||||
| FINANCIALS 1.7% | ||||||||||||
Credicorp Ltd. | 77,759 | 8,512 | ||||||||||
|
| |||||||||||
Total Peru |
| 8,512 | ||||||||||
|
| |||||||||||
| PHILIPPINES 1.4% | ||||||||||||
| UTILITIES 1.4% | ||||||||||||
First Gen Corp. (a) | 21,130,200 | 7,050 | ||||||||||
|
| |||||||||||
Total Philippines |
| 7,050 | ||||||||||
|
| |||||||||||
| QATAR 0.8% | ||||||||||||
| FINANCIALS 0.8% | ||||||||||||
Commercial Bank of Qatar QSC | 159,541 | 3,695 | ||||||||||
|
| |||||||||||
Total Qatar |
| 3,695 | ||||||||||
|
| |||||||||||
| RUSSIA 1.6% | ||||||||||||
| FINANCIALS 0.7% | ||||||||||||
Global Ports Investment PLC SP – GDR | 247,024 | 3,458 | ||||||||||
|
| |||||||||||
| MATERIALS 0.9% | ||||||||||||
Magnitogorsk Iron & Steel Works SP – GDR | 582,844 | 2,830 | ||||||||||
Mechel SP – ADR | 440,346 | 1,541 | ||||||||||
|
| |||||||||||
| 4,371 | ||||||||||||
|
| |||||||||||
Total Russia |
| 7,829 | ||||||||||
|
| |||||||||||
| SINGAPORE 0.8% | ||||||||||||
| ENERGY 0.8% | ||||||||||||
Sakari Resources Ltd. | 2,791,000 | 3,960 | ||||||||||
|
| |||||||||||
Total Singapore |
| 3,960 | ||||||||||
|
| |||||||||||
| SOUTH AFRICA 2.7% | ||||||||||||
| MATERIALS 2.7% | ||||||||||||
AngloGold Ashanti Ltd. | 230,717 | 9,794 | ||||||||||
Harmony Gold Mining Co. Ltd. SP – ADR | 278,551 | 3,242 | ||||||||||
|
| |||||||||||
Total South Africa |
| 13,036 | ||||||||||
|
| |||||||||||
| SOUTH KOREA 4.3% | ||||||||||||
| CONSUMER DISCRETIONARY 1.0% | ||||||||||||
GS Home Shopping, Inc. | 48,364 | 4,877 | ||||||||||
|
| |||||||||||
| INDUSTRIALS 1.1% | ||||||||||||
Samsung Techwin Co. Ltd. | 119,210 | 5,516 | ||||||||||
|
| |||||||||||
| INFORMATION TECHNOLOGY 1.2% | ||||||||||||
Jusung Engineering Co. Ltd. (a) | 200,392 | 1,884 | ||||||||||
LG Display Co. Ltd. | 184,870 | 3,924 | ||||||||||
|
| |||||||||||
| 5,808 | ||||||||||||
|
| |||||||||||
| SHARES | MARKET (000S) | |||||||||||
| MATERIALS 1.0% | ||||||||||||
LG Chem Ltd. | 18,336 | $ | 5,056 | |||||||||
|
| |||||||||||
Total South Korea |
| 21,257 | ||||||||||
|
| |||||||||||
| TAIWAN 5.8% | ||||||||||||
| FINANCIALS 0.5% | ||||||||||||
Huaku Development Co. Ltd. | 1,317,293 | 2,663 | ||||||||||
|
| |||||||||||
| INFORMATION TECHNOLOGY 5.3% | ||||||||||||
Chicony Electronics Co. Ltd. | 1,845,435 | 3,020 | ||||||||||
E Ink Holdings, Inc. | 2,749,000 | 3,572 | ||||||||||
Hon Hai Precision Industry Co. Ltd. | 4,167,900 | 11,398 | ||||||||||
Pegatron Corp. | 5,103,000 | 5,545 | ||||||||||
TPK Holding Co. Ltd. (a) | 189,000 | 2,458 | ||||||||||
|
| |||||||||||
| 25,993 | ||||||||||||
|
| |||||||||||
Total Taiwan |
| 28,656 | ||||||||||
|
| |||||||||||
| THAILAND 2.7% | ||||||||||||
| ENERGY 1.2% | ||||||||||||
PTT PCL | 587,300 | 5,909 | ||||||||||
|
| |||||||||||
| FINANCIALS 1.0% | ||||||||||||
Tisco Financial Group PCL | 3,985,500 | 4,791 | ||||||||||
|
| |||||||||||
| MATERIALS 0.5% | ||||||||||||
PTT Global Chemical PCL (a) | 1,307,159 | 2,527 | ||||||||||
|
| |||||||||||
Total Thailand | 13,227 | |||||||||||
|
| |||||||||||
| TURKEY 1.0% | ||||||||||||
| TELECOMMUNICATION SERVICES 1.0% | ||||||||||||
Turk Telekomunikasyon A/S | 1,290,475 | 4,776 | ||||||||||
|
| |||||||||||
Total Turkey | 4,776 | |||||||||||
|
| |||||||||||
| UNITED KINGDOM 3.8% | ||||||||||||
| CONSUMER STAPLES 1.3% | ||||||||||||
British American Tobacco PLC | 132,909 | 6,305 | ||||||||||
|
| |||||||||||
| ENERGY 1.1% | ||||||||||||
Afren PLC (a) | 4,031,582 | 5,365 | ||||||||||
|
| |||||||||||
| MATERIALS 1.4% | ||||||||||||
Petropavlovsk PLC | 716,665 | 6,858 | ||||||||||
Total United Kingdom | 18,528 | |||||||||||
|
| |||||||||||
Total Common Stocks (Cost $368,862) | 321,712 | |||||||||||
|
| |||||||||||
| UNITS | ||||||||||||
| EQUITY-LINKED SECURITIES 2.3% | ||||||||||||
| INDIA 2.0% | ||||||||||||
| FINANCIALS 0.9% | ||||||||||||
JPMorgan Chase & Co. | ||||||||||||
Bank of Baroda – Exp. 05/05/2016 | 78,276 | 981 | ||||||||||
Yes Bank Ltd. – Exp. 09/21/2015 | 32,304 | 145 | ||||||||||
| UNITS | MARKET VALUE (000S) | |||||||||||
Merrill Lynch International & Co. | ||||||||||||
Bank of Baroda – Exp. 01/16/2016 | 57,030 | $ | 715 | |||||||||
Yes Bank Ltd. – Exp. 09/14/2015 | 518,009 | 2,329 | ||||||||||
|
| |||||||||||
| 4,170 | ||||||||||||
|
| |||||||||||
| INDUSTRIALS 0.5% | ||||||||||||
JPMorgan Chase & Co. |
| |||||||||||
Bharat Electronics Ltd. – Exp. 08/02/2016 | 22,959 | 584 | ||||||||||
Merrill Lynch International & Co. |
| |||||||||||
Bharat Electronics Ltd. – Exp. 03/22/2016 | 78,400 | 1,994 | ||||||||||
|
| |||||||||||
| 2,578 | ||||||||||||
|
| |||||||||||
| INFORMATION TECHNOLOGY 0.6% | ||||||||||||
JPMorgan Chase & Co. |
| |||||||||||
Idea Cellular Ltd. – Exp. 07/25/2016 | 1,177,781 | 1,825 | ||||||||||
Merrill Lynch International & Co. |
| |||||||||||
Infosys Technologies Ltd. – Exp. 11/04/2015 | 22,932 | 1,195 | ||||||||||
| 3,020 | ||||||||||||
|
| |||||||||||
Total India | 9,768 | |||||||||||
|
| |||||||||||
| NIGERIA 0.3% | ||||||||||||
| CONSUMER STAPLES 0.3% | ||||||||||||
HSBC Bank PLC |
| |||||||||||
Guinness Nigeria PLC – Exp. 12/09/2014 | 348,540 | 537 | ||||||||||
Nigerian Breweries PLC – Exp. 12/09/2014 | 1,353,993 | 788 | ||||||||||
Merrill Lynch International & Co. |
| |||||||||||
Guinness Nigeria PLC – Exp. 11/10/2014 | 9,882 | 15 | ||||||||||
Nigerian Breweries PLC – Exp. 11/10/2014 | 128,233 | 74 | ||||||||||
|
| |||||||||||
Total Nigeria | 1,414 | |||||||||||
|
| |||||||||||
Total Equity-Linked Securities (Cost $15,663) | 11,182 | |||||||||||
|
| |||||||||||
| SHARES | ||||||||||||
| EXCHANGE-TRADED FUNDS 5.0% | ||||||||||||
| HONG KONG 1.5% | ||||||||||||
BOCI-Prudential – W.I.S.E. Fund | 2,019,200 | 7,188 | ||||||||||
|
| |||||||||||
Total Hong Kong | 7,188 | |||||||||||
|
| |||||||||||
| LUXEMBOURG 0.3% | ||||||||||||
db x-trackers – CSI300 Index ETF | 1,800,300 | 1,428 | ||||||||||
|
| |||||||||||
Total Luxembourg | 1,428 | |||||||||||
|
| |||||||||||
| UNITED STATES 3.2% | ||||||||||||
iShares MSCI Emerging Markets Index Fund | 109,024 | 4,136 | ||||||||||
Vanguard MSCI Emerging Markets ETF | 142,042 | 5,428 | ||||||||||
ETFS Palladium Trust | 98,603 | 6,367 | ||||||||||
|
| |||||||||||
Total United States | 15,931 | |||||||||||
|
| |||||||||||
Total Exchange-Traded Funds (Cost $28,345) | 24,547 | |||||||||||
|
| |||||||||||
| 46 | PIMCO EQUITY SERIES | See Accompanying Notes |
Table of Contents
December 31, 2011 (Unaudited)
| SHARES | MARKET VALUE (000S) | |||||||||||
| PREFERRED STOCKS 5.5% | ||||||||||||
| SOUTH KOREA 5.5% | ||||||||||||
| INDUSTRIALS 5.5% | ||||||||||||
Samsung Electronics Co. Ltd. | 47,066 | $ | 27,277 | |||||||||
|
| |||||||||||
Total Preferred Stocks (Cost $26,353) | 27,277 | |||||||||||
|
| |||||||||||
| PRINCIPAL AMOUNT (000S) | ||||||||||||
| SHORT-TERM INSTRUMENTS 22.3% | ||||||||||||
| REPURCHASE AGREEMENTS 0.1% | ||||||||||||
State Street Bank and Trust Co. |
| |||||||||||
0.010% due 01/03/2012 | $ | 701 | 701 | |||||||||
|
| |||||||||||
(Dated 12/30/2011. Collateralized by Freddie Mac 5.500% due 08/20/2012 valued at $717. Repurchase proceeds are $701.) | ||||||||||||
| U.S. TREASURY BILLS 1.0% | ||||||||||||
0.041% due 02/02/2012 - 06/28/2012 (b)(d)(e) | 4,849 | 4,848 | ||||||||||
|
| |||||||||||
| SHARES | MARKET VALUE (000S) | |||||||||||
| PIMCO SHORT-TERM FLOATING NAV PORTFOLIO (c) 21.2% | ||||||||||||
| 10,430,249 | $ | 104,449 | ||||||||||
|
| |||||||||||
Total Short-Term Instruments | 109,998 | |||||||||||
|
| |||||||||||
| PURCHASED OPTIONS (g) 0.4% | ||||||||||||
(Cost $3,565) | 1,804 | |||||||||||
| Total Investments 100.8% (Cost $552,780) | $ | 496,520 | ||||||||||
|
| |||||||||||
| Written Options (h) (0.0%) (Premiums $66) | (20 | ) | ||||||||||
| Other Assets and Liabilities (Net) (0.8%) | (4,119 | ) | ||||||||||
|
| |||||||||||
| Net Assets 100.0% | $ | 492,381 | ||||||||||
|
| |||||||||||
Notes to Schedule of Investments (amounts in thousands*, except shares):
| * | A zero balance may reflect actual amounts rounding to less than one thousand. |
| (a) | Non-income producing security. |
| (b) | Coupon represents a weighted average yield to maturity. |
| (c) | Affiliated to the Fund. |
| (d) | Securities with an aggregate market value of $120 and cash of $150 have been pledged as collateral for equity options as of December 31, 2011. |
| (e) | Securities with an aggregate market value of $4,728 have been pledged as collateral as of December 31, 2011 for OTC swap, swaption and foreign currency contracts as governed by International Swaps and Derivatives Association, Inc. Master Agreements. |
| (f) | OTC swap agreements outstanding on December 31, 2011: |
| Credit Default Swaps on Credit Indices - Buy Protection (1) | ||||||||||||||||||||||||||||||
| Index/Tranches | Counterparty | Fixed Deal (Pay) Rate | Maturity Date | Notional | Market Value (3) | Premiums Paid/(Received) | Unrealized Appreciation | |||||||||||||||||||||||
CDX.IG-9 10-Year Index 15-30% | BPS | (1.000% | ) | 12/20/2017 | $ | 3,100 | $ | 29 | $ | (25 | ) | $ | 54 | |||||||||||||||||
|
|
|
|
|
| |||||||||||||||||||||||||
| (1) | If the Fund is a buyer of protection and a credit event occurs, as defined under the terms of that particular swap agreement, the Fund will either (i) receive from the seller of protection an amount equal to the notional amount of the swap and deliver the referenced obligation or underlying securities comprising the referenced index or (ii) receive a net settlement amount in the form of cash or securities equal to the notional amount of the swap less the recovery value of the referenced obligation or underlying securities comprising the referenced index. |
| (2) | The maximum potential amount the Fund could be required to pay as a seller of credit protection or receive as a buyer of credit protection if a credit event occurs as defined under the terms of that particular swap agreement. |
| (3) | The prices and resulting values for credit default swap agreements on credit indices serve as an indicator of the current status of the payment/performance risk and represent the likelihood of an expected liability (or profit) for the credit derivative should the notional amount of the swap agreement be closed/sold as of the period end. Increasing market values, in absolute terms when compared to the notional amount of the swap, represent a deterioration of the referenced entity’s credit soundness and a greater likelihood or risk of default or other credit event occurring as defined under the terms of the agreement. |
| Total Return Swaps on Securities | ||||||||||||||||||||||||||
| Pay/Receive Total Return on Reference Entity | Reference Entity | # of Shares | Financing Rate (4) | Notional | Maturity Date | Counterparty | Unrealized Appreciation/ (Depreciation) | |||||||||||||||||||
| Receive | TNK-BP Holding | 629,771 | 1-Month USD-LIBOR plus a specified spread | $ | 1,889 | 07/12/2012 | BOA | $ | (263 | ) | ||||||||||||||||
| Receive | Banco do Brasil S.A. | 138,700 | 1-Month USD-LIBOR plus a specified spread | 1,717 | 08/15/2012 | CBK | 62 | |||||||||||||||||||
| Receive | Banco do Estado do Rio Grande do Sul | 92,500 | 1-Month USD-LIBOR plus a specified spread | 907 | 08/15/2012 | CBK | 98 | |||||||||||||||||||
| Receive | Brasil Foods S.A. | 79,000 | 1-Month USD-LIBOR plus a specified spread | 1,550 | 08/15/2012 | CBK | 6 | |||||||||||||||||||
| Receive | Brasil Insurance Participacoes e Administracao S.A. | 90,000 | 1-Month USD-LIBOR plus a specified spread | 817 | 08/15/2012 | CBK | 2 | |||||||||||||||||||
| Receive | Diagnosticos da America S.A. | 91,800 | 1-Month USD-LIBOR plus a specified spread | 762 | 08/15/2012 | CBK | 5 | |||||||||||||||||||
| See Accompanying Notes | DECEMBER 31, 2011 | SEMIANNUAL REPORT | 47 |
Table of Contents
Schedule of Investments PIMCO EqS Emerging Markets Fund (Cont.)
| Total Return Swaps on Securities (Cont.) | ||||||||||||||||||||||||||
| Pay/Receive Total Return on Reference Entity | Reference Entity | # of Shares | Financing Rate (4) | Notional | Maturity Date | Counterparty | Unrealized Appreciation/ (Depreciation) | |||||||||||||||||||
| Receive | PDG Realty S.A. Empreendimentos e Participacoes | 223,200 | 1-Month USD-LIBOR plus a specified spread | $ | 730 | 08/15/2012 | CBK | $ | (24 | ) | ||||||||||||||||
| Receive | Barloworld Ltd. | 85,089 | 1-Month USD-LIBOR plus a specified spread | 731 | 12/10/2012 | CBK | 60 | |||||||||||||||||||
| Receive | Harmony Gold Mining Co., Ltd. | 16,830 | 1-Month USD-LIBOR plus a specified spread | 204 | 12/10/2012 | CBK | (6 | ) | ||||||||||||||||||
| Receive | Impala Platinum Holdings Ltd. | 41,574 | 1-Month USD-LIBOR plus a specified spread | 829 | 12/10/2012 | CBK | 32 | |||||||||||||||||||
| Receive | MTN Group Ltd. | 91,687 | 1-Month USD-LIBOR plus a specified spread | 1,513 | 12/10/2012 | CBK | 118 | |||||||||||||||||||
| Receive | Sasol Ltd. | 18,432 | 1-Month USD-LIBOR plus a specified spread | 828 | 12/10/2012 | CBK | 52 | |||||||||||||||||||
| Receive | Usinas Siderurgicas de Minas Gerais S.A. | 39,500 | 1-Month USD-LIBOR plus a specified spread | 215 | 10/29/2012 | DUB | 0 | |||||||||||||||||||
| Receive | Bashneft OAO | 570 | 1-Month USD-LIBOR plus a specified spread | 26 | 03/22/2012 | FBF | (2 | ) | ||||||||||||||||||
| Receive | Banco do Estado do Rio Grande do Sul | 55,500 | 1-Month USD-LIBOR plus a specified spread | 544 | 08/15/2012 | FBF | 59 | |||||||||||||||||||
| Receive | Brasil Foods S.A. | 42,600 | 1-Month USD-LIBOR plus a specified spread | 836 | 08/15/2012 | FBF | 3 | |||||||||||||||||||
| Receive | Brasil Insurance Participacoes e Administracao S.A. | 20,000 | 1-Month USD-LIBOR plus a specified spread | 182 | 08/15/2012 | FBF | 0 | |||||||||||||||||||
| Receive | Diagnosticos da America S.A. | 50,500 | 1-Month USD-LIBOR plus a specified spread | 419 | 08/15/2012 | FBF | 3 | |||||||||||||||||||
| Receive | PDG Realty S.A. Empreendimentos e Participacoes | 251,800 | 1-Month USD-LIBOR plus a specified spread | 824 | 08/15/2012 | FBF | (28 | ) | ||||||||||||||||||
| Receive | Usinas Siderurgicas de Minas Gerais S.A. | 83,787 | 1-Month USD-LIBOR plus a specified spread | 456 | 08/22/2012 | FBF | (1 | ) | ||||||||||||||||||
| Receive | TNK-BP Holding | 910,646 | 1-Month USD-LIBOR plus a specified spread | 2,732 | 05/24/2012 | GST | (381 | ) | ||||||||||||||||||
| Receive | Banco do Brasil S.A. | 3,100 | 1-Month USD-LIBOR plus a specified spread | 37 | 06/15/2012 | GST | 1 | |||||||||||||||||||
| Receive | Banco do Estado do Rio Grande do Sul | 2,200 | 1-Month USD-LIBOR plus a specified spread | 22 | 06/15/2012 | GST | 2 | |||||||||||||||||||
| Receive | Brasil Insurance Participacoes e Administracao S.A. | 10,000 | 1-Month USD-LIBOR plus a specified spread | 91 | 06/15/2012 | GST | 0 | |||||||||||||||||||
| Receive | Diagnosticos da America S.A. | 2,100 | 1-Month USD-LIBOR plus a specified spread | 16 | 06/15/2012 | GST | 0 | |||||||||||||||||||
| Receive | PDG Realty S.A. Empreendimentos e Participacoes | 5,100 | 1-Month USD-LIBOR plus a specified spread | 17 | 06/15/2012 | GST | (1 | ) | ||||||||||||||||||
| Receive | NovaTek OAO | 182,015 | 1-Month USD-LIBOR plus a specified spread | 2,203 | 07/02/2012 | GST | 55 | |||||||||||||||||||
| Receive | Usinas Siderurgicas de Minas Gerais S.A. | 204,313 | 1-Month USD-LIBOR plus a specified spread | 1,113 | 08/13/2012 | GST | (1 | ) | ||||||||||||||||||
| Receive | Sberbank of Russia | 1,283,555 | 1-Month USD-LIBOR plus a specified spread | 2,450 | 10/11/2012 | GST | (86 | ) | ||||||||||||||||||
| Pay | Samsung Electronics Co. | 4,321 | 1-Month USD-LIBOR less a specified spread | 3,771 | 11/12/2012 | GST | (182 | ) | ||||||||||||||||||
| Receive | Barloworld Ltd. | 228,593 | 1-Month USD-LIBOR plus a specified spread | 1,964 | 04/19/2012 | JPM | 162 | |||||||||||||||||||
| Receive | MTN Group Ltd. | 201,321 | 1-Month USD-LIBOR plus a specified spread | 3,323 | 04/19/2012 | JPM | 260 | |||||||||||||||||||
| Receive | Sasol Ltd. | 45,315 | 1-Month USD-LIBOR plus a specified spread | 2,036 | 04/19/2012 | JPM | 127 | |||||||||||||||||||
| Receive | Brasil Insurance Participacoes e Administracao S.A. | 51,000 | 1-Month USD-LIBOR plus a specified spread | 500 | 06/08/2012 | JPM | 51 | |||||||||||||||||||
| Receive | Diagnosticos da America S.A. | 224,800 | 1-Month USD-LIBOR plus a specified spread | 1,866 | 06/08/2012 | JPM | 7 | |||||||||||||||||||
| Receive | PDG Realty S.A. Empreendimentos e Participacoes | 168,600 | 1-Month USD-LIBOR plus a specified spread | 552 | 06/08/2012 | JPM | (18 | ) | ||||||||||||||||||
| Receive | Usinas Siderurgicas de Minas Gerais S.A. | 128,500 | 1-Month USD-LIBOR plus a specified spread | 700 | 09/03/2012 | JPM | (1 | ) | ||||||||||||||||||
| Receive | Impala Platinum Holdings Ltd. | 213,035 | 1-Month USD-LIBOR plus a specified spread | 4,250 | 09/25/2012 | JPM | 164 | |||||||||||||||||||
| Receive | Harmony Gold Mining Co., Ltd. | 16,579 | 1-Month USD-LIBOR plus a specified spread | 201 | 10/12/2012 | JPM | (6 | ) | ||||||||||||||||||
| Receive | Brasil Insurance Participacoes e Administracao S.A. | 139,000 | 1-Month USD-LIBOR plus a specified spread | 1,782 | 12/10/2012 | JPM | 5 | |||||||||||||||||||
| Receive | Lojas Renner S.A. | 176,000 | 1-Month USD-LIBOR plus a specified spread | 4,821 | 12/14/2012 | JPM | (231 | ) | ||||||||||||||||||
| Receive | Diagnosticos da America S.A. | 0 | 1-Month USD-LIBOR plus a specified spread | 2 | 03/22/2012 | MEI | 0 | |||||||||||||||||||
| Receive | Sasol Ltd. | 53,331 | 1-Month USD-LIBOR plus a specified spread | 2,396 | 03/22/2012 | MYI | 149 | |||||||||||||||||||
| Receive | Brasil Insurance Participacoes e Administracao S.A. | 20,000 | 1-Month USD-LIBOR plus a specified spread | 182 | 07/19/2012 | MYI | 0 | |||||||||||||||||||
| Receive | Brasil Insurance Participacoes e Administracao S.A. | 120,000 | 1-Month USD-LIBOR plus a specified spread | 1,091 | 08/15/2012 | MYI | 2 | |||||||||||||||||||
| 48 | PIMCO EQUITY SERIES | See Accompanying Notes |
Table of Contents
December 31, 2011 (Unaudited)
| Total Return Swaps on Securities (Cont.) | ||||||||||||||||||||||||||
| Pay/Receive Total Return on Reference Entity | Reference Entity | # of Shares | Financing Rate (4) | Notional | Maturity Date | Counterparty | Unrealized Appreciation/ (Depreciation) | |||||||||||||||||||
| Receive | Harmony Gold Mining Co., Ltd. | 69,556 | 1-Month USD-LIBOR plus a specified spread | $ | 843 | 08/13/2012 | MYI | $ | (25 | ) | ||||||||||||||||
| Receive | Banco do Brasil S.A. | 123,500 | 1-Month USD-LIBOR plus a specified spread | 1,529 | 08/15/2012 | MYI | 55 | |||||||||||||||||||
| Receive | Banco do Estado do Rio Grande do Sul | 104,900 | 1-Month USD-LIBOR plus a specified spread | 1,029 | 08/15/2012 | MYI | 111 | |||||||||||||||||||
| Receive | Barloworld Ltd. | 207,723 | 1-Month USD-LIBOR plus a specified spread | 1,785 | 08/15/2012 | MYI | 147 | |||||||||||||||||||
| Receive | Brasil Foods S.A. | 84,500 | 1-Month USD-LIBOR plus a specified spread | 1,658 | 08/15/2012 | MYI | 7 | |||||||||||||||||||
| Receive | Brasil Insurance Participacoes e Administracao S.A. | 100,000 | 1-Month USD-LIBOR plus a specified spread | 909 | 08/15/2012 | MYI | 2 | |||||||||||||||||||
| Receive | Diagnosticos da America S.A. | 89,300 | 1-Month USD-LIBOR plus a specified spread | 741 | 08/15/2012 | MYI | 5 | |||||||||||||||||||
| Receive | MTN Group Ltd. | 268,678 | 1-Month USD-LIBOR plus a specified spread | 4,433 | 08/15/2012 | MYI | 347 | |||||||||||||||||||
| Receive | PDG Realty S.A. Empreendimentos e Participacoes | 221,500 | 1-Month USD-LIBOR plus a specified spread | 725 | 08/15/2012 | MYI | (24 | ) | ||||||||||||||||||
| Receive | Bashneft OAO | 85,976 | 1-Month USD-LIBOR plus a specified spread | 3,847 | 04/06/2012 | ULO | (280 | ) | ||||||||||||||||||
| Receive | TNK-BP Holding | 998,344 | 1-Month USD-LIBOR plus a specified spread | 2,995 | 04/16/2012 | ULO | (417 | ) | ||||||||||||||||||
| Receive | TNK-BP Holding | 694,468 | 1-Month USD-LIBOR plus a specified spread | 2,083 | 05/17/2012 | ULO | (287 | ) | ||||||||||||||||||
| Receive | Bashneft OAO | 64,057 | 1-Month USD-LIBOR plus a specified spread | 2,867 | 05/25/2012 | ULO | (209 | ) | ||||||||||||||||||
| Receive | Sberbank of Russia | 3,165,562 | 1-Month USD-LIBOR plus a specified spread | 6,043 | 07/09/2012 | ULO | (212 | ) | ||||||||||||||||||
| Receive | Banco do Brasil S.A. | 130,900 | 1-Month USD-LIBOR plus a specified spread | 1,621 | 08/01/2012 | ULO | 59 | |||||||||||||||||||
| Receive | Banco do Estado do Rio Grande do Sul | 13,000 | 1-Month USD-LIBOR plus a specified spread | 128 | 08/01/2012 | ULO | 14 | |||||||||||||||||||
| Receive | Brasil Foods S.A. | 44,600 | 1-Month USD-LIBOR plus a specified spread | 875 | 08/01/2012 | ULO | 4 | |||||||||||||||||||
| Receive | Diagnosticos da America S.A. | 157,200 | 1-Month USD-LIBOR plus a specified spread | 1,305 | 08/01/2012 | ULO | 4 | |||||||||||||||||||
| Receive | PDG Realty S.A. Empreendimentos e Participacoes | 80,900 | 1-Month USD-LIBOR plus a specified spread | 265 | 08/01/2012 | ULO | (9 | ) | ||||||||||||||||||
| Receive | Brasil Insurance Participacoes e Administracao S.A. | 185,400 | 1-Month USD-LIBOR plus a specified spread | 1,686 | 08/02/2012 | ULO | 3 | |||||||||||||||||||
| Receive | Usinas Siderurgicas de Minas Gerais S.A. | 148,100 | 1-Month USD-LIBOR plus a specified spread | 807 | 08/17/2012 | ULO | (1 | ) | ||||||||||||||||||
|
| |||||||||||||||||||||||||
| $ | (454 | ) | ||||||||||||||||||||||||
|
| |||||||||||||||||||||||||
| (4) | Financing rate is based upon predetermined notional amounts, which may be a multiple of the number of shares disclosed. |
| (g) | Purchased options outstanding on December 31, 2011: |
| Options on Exchange-Traded Futures Contracts | ||||||||||||||||||||
| Description | Index Value | Expiration Date | # of Contracts | Cost | Market Value | |||||||||||||||
Put - CBOE S&P 500 Index March Futures | 850.000 | 03/17/2012 | 30 | $ | 48 | $ | 6 | |||||||||||||
Put - CBOE S&P 500 Index March Futures | 1,050.000 | 03/17/2012 | 545 | 1,097 | 561 | |||||||||||||||
|
|
|
| |||||||||||||||||
| $ | 1,145 | $ | 567 | |||||||||||||||||
|
|
|
| |||||||||||||||||
| Foreign Currency Options | ||||||||||||||||||||||||||
| Description | Counterparty | Exercise Price | Expiration Date | Notional | Cost | Market Value | ||||||||||||||||||||
Put - OTC AUD versus USD | MSX | $ | 0.700 | 04/18/2012 | AUD | 102,790 | $ | 516 | $ | 136 | ||||||||||||||||
Put - OTC AUD versus USD | MSX | 0.750 | 07/23/2012 | 9,450 | 69 | 54 | ||||||||||||||||||||
|
|
|
| |||||||||||||||||||||||
| $ | 585 | $ | 190 | |||||||||||||||||||||||
|
|
|
| |||||||||||||||||||||||
| Options on Exchanged-Traded Funds | ||||||||||||||||||||
| Description | Strike | Expiration Date | # of Contracts | Cost | Market Value | |||||||||||||||
Put - CBOE iShares MSCI Emerging Markets Index Fund | $ 30.000 | 03/17/2012 | 2,619 | $ | 296 | $ | 120 | |||||||||||||
Put - CBOE iShares MSCI Emerging Markets Index Fund | 32.000 | 03/17/2012 | 5,300 | 816 | 371 | |||||||||||||||
Put - CBOE iShares MSCI Emerging Markets Index Fund | 33.000 | 03/17/2012 | 4,500 | 513 | 396 | |||||||||||||||
Put - CBOE iShares MSCI Emerging Markets Index Fund | 39.000 | 03/17/2012 | 565 | 210 | 160 | |||||||||||||||
|
|
|
| |||||||||||||||||
| $ 1,835 | $ | 1,047 | ||||||||||||||||||
|
|
|
| |||||||||||||||||
| See Accompanying Notes | DECEMBER 31, 2011 | SEMIANNUAL REPORT | 49 |
Table of Contents
Schedule of Investments PIMCO EqS Emerging Markets Fund (Cont.)
| (h) | Written options outstanding on December 31, 2011: |
| Options on Exchange-Traded Funds | ||||||||||||||||||||||||||
| Description | Strike | Expiration Date | # of Contracts | Premium | Market Value | |||||||||||||||||||||
Put - CBOE iShares MSCI Emerging Markets Index Fund | $ | 29.000 | 03/17/2012 | 565 | $ | 66 | $ | (20 | ) | |||||||||||||||||
|
|
|
| |||||||||||||||||||||||
Transactions in written call and put options for the period ended December 31, 2011:
| # of Contracts | Notional Amount in TRY | Premium | ||||||||||
Balance at 06/30/2011 | 0 | TRY | 53,544 | $ | 132 | |||||||
Sales | 1,632,706 | 0 | 338 | |||||||||
Closing Buys | (1,632,141 | ) | (53,544 | ) | (404 | ) | ||||||
Expirations | 0 | 0 | 0 | |||||||||
Exercised | 0 | 0 | 0 | |||||||||
|
|
|
|
|
| |||||||
Balance at 12/31/2011 | 565 | TRY | 0 | $ | 66 | |||||||
|
|
|
|
|
| |||||||
| (i) | Short sales outstanding on December 31, 2011: |
| Description | Shares | Proceeds | Market Value | |||||||||||||
NovaTek OAO SP – GDR | 13,800 | $ | 1,968 | $ | (1,728 | ) | ||||||||||
|
|
|
| |||||||||||||
| (j) | Foreign currency contracts outstanding on December 31, 2011: |
| Type | Currency | Principal Amount Covered by Contract | Settlement Month | Counterparty | Unrealized Appreciation | Unrealized (Depreciation) | Net Unrealized Appreciation/ (Depreciation) | |||||||||||||||||||
Sell | AUD | 12,612 | 02/2012 | JPM | $ | 0 | $ | (434 | ) | $ | (434 | ) | ||||||||||||||
Buy | BRL | 9,319 | 01/2012 | HUS | 119 | (49 | ) | 70 | ||||||||||||||||||
Sell | 9,319 | 01/2012 | HUS | 0 | (28 | ) | (28 | ) | ||||||||||||||||||
Buy | 10,407 | 01/2012 | JPM | 0 | (271 | ) | (271 | ) | ||||||||||||||||||
Sell | 10,407 | 01/2012 | JPM | 0 | (31 | ) | (31 | ) | ||||||||||||||||||
Buy | 25,093 | 01/2012 | UAG | 67 | (83 | ) | (16 | ) | ||||||||||||||||||
Sell | 25,093 | 01/2012 | UAG | 498 | (8 | ) | 490 | |||||||||||||||||||
Buy | 20,921 | 02/2012 | HUS | 82 | (56 | ) | 26 | |||||||||||||||||||
Sell | 19,478 | 02/2012 | HUS | 160 | (10 | ) | 150 | |||||||||||||||||||
Buy | 22,410 | 03/2012 | UAG | 0 | (507 | ) | (507 | ) | ||||||||||||||||||
Sell | CAD | 1,864 | 02/2012 | DUB | 0 | (2 | ) | (2 | ) | |||||||||||||||||
Sell | 888 | 02/2012 | JPM | 0 | (1 | ) | (1 | ) | ||||||||||||||||||
Buy | CHF | 2,143 | 03/2012 | BRC | 0 | (12 | ) | (12 | ) | |||||||||||||||||
Sell | 1,985 | 03/2012 | BRC | 28 | 0 | 28 | ||||||||||||||||||||
Sell | 1 | 03/2012 | CBK | 0 | 0 | 0 | ||||||||||||||||||||
Sell | 349 | 03/2012 | JPM | 6 | 0 | 6 | ||||||||||||||||||||
Buy | CZK | 1,378 | 02/2012 | CBK | 0 | (1 | ) | (1 | ) | |||||||||||||||||
Sell | 84,249 | 02/2012 | HUS | 194 | 0 | 194 | ||||||||||||||||||||
Sell | DKK | 2,563 | 03/2012 | BRC | 3 | 0 | 3 | |||||||||||||||||||
Sell | 24,027 | 03/2012 | HUS | 139 | 0 | 139 | ||||||||||||||||||||
Sell | 5,360 | 03/2012 | JPM | 31 | 0 | 31 | ||||||||||||||||||||
Sell | EUR | 3,204 | 01/2012 | DUB | 84 | 0 | 84 | |||||||||||||||||||
Sell | 11,534 | 01/2012 | JPM | 754 | 0 | 754 | ||||||||||||||||||||
Sell | 2,734 | 02/2012 | BRC | 183 | 0 | 183 | ||||||||||||||||||||
Sell | 1,406 | 02/2012 | UAG | 78 | 0 | 78 | ||||||||||||||||||||
Buy | GBP | 3,486 | 03/2012 | CBK | 0 | (17 | ) | (17 | ) | |||||||||||||||||
Sell | 11,497 | 03/2012 | JPM | 176 | 0 | 176 | ||||||||||||||||||||
Buy | IDR | 28,931,214 | 01/2012 | CBK | 0 | (65 | ) | (65 | ) | |||||||||||||||||
Sell | 9,114,810 | 01/2012 | CBK | 34 | 0 | 34 | ||||||||||||||||||||
Sell | ILS | 36,122 | 01/2012 | GST | 66 | 0 | 66 | |||||||||||||||||||
Sell | 20,931 | 01/2012 | HUS | 48 | 0 | 48 | ||||||||||||||||||||
Sell | 9,975 | 01/2012 | UAG | 0 | (2 | ) | (2 | ) | ||||||||||||||||||
Sell | 5,773 | 07/2012 | JPM | 2 | 0 | 2 | ||||||||||||||||||||
Sell | INR | 540,350 | 07/2012 | HUS | 556 | 0 | 556 | |||||||||||||||||||
Buy | 789,765 | 07/2012 | JPM | 0 | (2,729 | ) | (2,729 | ) | ||||||||||||||||||
Sell | 249,414 | 07/2012 | JPM | 5 | 0 | 5 | ||||||||||||||||||||
| 50 | PIMCO EQUITY SERIES | See Accompanying Notes |
Table of Contents
December 31, 2011 (Unaudited)
| Type | Currency | Principal Amount Covered by Contract | Settlement Month | Counterparty | Unrealized Appreciation | Unrealized (Depreciation) | Net Unrealized Appreciation/ (Depreciation) | |||||||||||||||||||
Buy | KRW | 22,401,467 | 02/2012 | CBK | $ | 0 | $ | (792 | ) | $ | (792 | ) | ||||||||||||||
Sell | 817,377 | 02/2012 | JPM | 4 | 0 | 4 | ||||||||||||||||||||
Buy | 1,623,867 | 02/2012 | UAG | 0 | (48 | ) | (48 | ) | ||||||||||||||||||
Sell | MXN | 28,670 | 03/2012 | BRC | 23 | 0 | 23 | |||||||||||||||||||
Buy | 73,688 | 03/2012 | CBK | 0 | (277 | ) | (277 | ) | ||||||||||||||||||
Sell | 17,860 | 03/2012 | CBK | 9 | 0 | 9 | ||||||||||||||||||||
Buy | 163,176 | 03/2012 | HUS | 0 | (401 | ) | (401 | ) | ||||||||||||||||||
Sell | 96,893 | 03/2012 | UAG | 45 | 0 | 45 | ||||||||||||||||||||
Buy | MYR | 3,783 | 04/2012 | CBK | 0 | (36 | ) | (36 | ) | |||||||||||||||||
Buy | 24,368 | 04/2012 | JPM | 0 | (389 | ) | (389 | ) | ||||||||||||||||||
Buy | 16,318 | 04/2012 | UAG | 0 | (62 | ) | (62 | ) | ||||||||||||||||||
Sell | NOK | 6,456 | 01/2012 | JPM | 42 | 0 | 42 | |||||||||||||||||||
Sell | 29,370 | 03/2012 | BRC | 170 | 0 | 170 | ||||||||||||||||||||
Sell | RUB | 14,408 | 03/2012 | BRC | 6 | 0 | 6 | |||||||||||||||||||
Sell | 358,882 | 03/2012 | CBK | 1,051 | 0 | 1,051 | ||||||||||||||||||||
Buy | 107,344 | 03/2012 | FBL | 0 | (185 | ) | (185 | ) | ||||||||||||||||||
Sell | 202,177 | 03/2012 | GST | 344 | 0 | 344 | ||||||||||||||||||||
Sell | 36,187 | 03/2012 | HUS | 0 | (43 | ) | (43 | ) | ||||||||||||||||||
Buy | TWD | 15,645 | 01/2012 | BOA | 0 | (31 | ) | (31 | ) | |||||||||||||||||
Buy | 480,698 | 01/2012 | BRC | 0 | (102 | ) | (102 | ) | ||||||||||||||||||
Buy | 754,271 | 01/2012 | CBK | 0 | (1,904 | ) | (1,904 | ) | ||||||||||||||||||
Sell | 841,792 | 01/2012 | CBK | 1,105 | 0 | 1,105 | ||||||||||||||||||||
Buy | 28,781 | 01/2012 | DUB | 0 | (52 | ) | (52 | ) | ||||||||||||||||||
Sell | 14,416 | 01/2012 | HUS | 30 | 0 | 30 | ||||||||||||||||||||
Buy | 150,325 | 01/2012 | JPM | 0 | (342 | ) | (342 | ) | ||||||||||||||||||
Sell | 92,815 | 01/2012 | UAG | 178 | 0 | 178 | ||||||||||||||||||||
Sell | ZAR | 17,238 | 01/2012 | CBK | 31 | 0 | 31 | |||||||||||||||||||
|
|
|
|
|
| |||||||||||||||||||||
| $ | 6,351 | $ | (8,970 | ) | $ | (2,619 | ) | |||||||||||||||||||
|
|
|
|
|
| |||||||||||||||||||||
| (k) | Fair Value Measurements (1) |
The following is a summary of the fair valuations according to the inputs used as of December 31, 2011 in valuing the Fund’s assets and liabilities (2):
| Category and Subcategory (3) | Level 1 (4) | Level 2 (5) | Level 3 (6) | Fair Value at 12/31/2011 | ||||||||||||
Investments, at value | ||||||||||||||||
Common Stocks | ||||||||||||||||
Australia | ||||||||||||||||
Energy | $ | 3,825 | $ | 0 | $ | 0 | $ | 3,825 | ||||||||
Materials | 5,544 | 0 | 0 | 5,544 | ||||||||||||
Bermuda | ||||||||||||||||
Energy | 0 | 6,441 | 0 | 6,441 | ||||||||||||
Brazil | ||||||||||||||||
Consumer Staples | 5,544 | 0 | 0 | 5,544 | ||||||||||||
Financials | 8,168 | 0 | 0 | 8,168 | ||||||||||||
Canada | ||||||||||||||||
Materials | 4,637 | 0 | 0 | 4,637 | ||||||||||||
China | ||||||||||||||||
Consumer Discretionary | 0 | 4,639 | 0 | 4,639 | ||||||||||||
Consumer Staples | 0 | 5,115 | 0 | 5,115 | ||||||||||||
Financials | 2,668 | 6,836 | 0 | 9,504 | ||||||||||||
Industrials | 8,159 | 7,873 | 0 | 16,032 | ||||||||||||
Information Technology | 8,033 | 0 | 0 | 8,033 | ||||||||||||
Materials | 0 | 5,670 | 0 | 5,670 | ||||||||||||
Colombia | ||||||||||||||||
Energy | 6,519 | 0 | 0 | 6,519 | ||||||||||||
Cyprus | ||||||||||||||||
Industrials | 4,018 | 0 | 0 | 4,018 | ||||||||||||
Czech Republic | ||||||||||||||||
Utilities | 6,894 | 0 | 0 | 6,894 | ||||||||||||
Denmark | ||||||||||||||||
Consumer Staples | 0 | 5,842 | 0 | 5,842 | ||||||||||||
Hong Kong | ||||||||||||||||
Financials | 2,431 | 16,771 | 0 | 19,202 | ||||||||||||
Industrials | 4,056 | 0 | 0 | 4,056 | ||||||||||||
Information Technology | 0 | 0 | 2,839 | 2,839 | ||||||||||||
Materials | 0 | 2,908 | 0 | 2,908 | ||||||||||||
| Category and Subcategory (3) | Level 1 (4) | Level 2 (5) | Level 3 (6) | Fair Value at 12/31/2011 | ||||||||||||
India | ||||||||||||||||
Financials | $ | 1,811 | $ | 1,799 | $ | 0 | $ | 3,610 | ||||||||
Industrials | 1,441 | 0 | 0 | 1,441 | ||||||||||||
Information Technology | 2,524 | 0 | 0 | 2,524 | ||||||||||||
Telecommunication Services | 0 | 2,353 | 0 | 2,353 | ||||||||||||
Indonesia | ||||||||||||||||
Financials | 1,646 | 0 | 0 | 1,646 | ||||||||||||
Israel | ||||||||||||||||
Health Care | 5,835 | 0 | 0 | 5,835 | ||||||||||||
Materials | 4,097 | 0 | 0 | 4,097 | ||||||||||||
Telecommunication Services | 9,832 | 0 | 0 | 9,832 | ||||||||||||
Italy | ||||||||||||||||
Consumer Discretionary | 0 | 3,961 | 0 | 3,961 | ||||||||||||
Japan | ||||||||||||||||
Consumer Discretionary | 7,600 | 0 | 0 | 7,600 | ||||||||||||
Kazakhstan | ||||||||||||||||
Energy | 0 | 6,041 | 0 | 6,041 | ||||||||||||
Mexico | ||||||||||||||||
Consumer Discretionary | 3,322 | 0 | 0 | 3,322 | ||||||||||||
Consumer Staples | 3,494 | 0 | 0 | 3,494 | ||||||||||||
Peru | ||||||||||||||||
Financials | 8,512 | 0 | 0 | 8,512 | ||||||||||||
Philippines | ||||||||||||||||
Utilities | 0 | 7,050 | 0 | 7,050 | ||||||||||||
Qatar | ||||||||||||||||
Financials | 3,695 | 0 | 0 | 3,695 | ||||||||||||
Russia | ||||||||||||||||
Financials | 3,458 | 0 | 0 | 3,458 | ||||||||||||
Materials | 1,541 | 2,830 | 0 | 4,371 | ||||||||||||
Singapore | ||||||||||||||||
Energy | 0 | 3,960 | 0 | 3,960 | ||||||||||||
South Africa | ||||||||||||||||
Materials | 13,036 | 0 | 0 | 13,036 | ||||||||||||
| See Accompanying Notes | DECEMBER 31, 2011 | SEMIANNUAL REPORT | 51 |
Table of Contents
Schedule of Investments PIMCO EqS Emerging Markets Fund (Cont.)
| Category and Subcategory (3) | Level 1 (4) | Level 2 (5) | Level 3 (6) | Fair Value at 12/31/2011 | ||||||||||||
South Korea | ||||||||||||||||
Consumer Discretionary | $ | 0 | $ | 4,877 | $ | 0 | $ | 4,877 | ||||||||
Industrials | 5,516 | 0 | 0 | 5,516 | ||||||||||||
Information Technology | 1,884 | 3,924 | 0 | 5,808 | ||||||||||||
Materials | 5,056 | 0 | 0 | 5,056 | ||||||||||||
Taiwan | ||||||||||||||||
Financials | 2,663 | 0 | 0 | 2,663 | ||||||||||||
Information Technology | 14,418 | 11,575 | 0 | 25,993 | ||||||||||||
Thailand | ||||||||||||||||
Energy | 5,909 | 0 | 0 | 5,909 | ||||||||||||
Financials | 0 | 4,791 | 0 | 4,791 | ||||||||||||
Materials | 0 | 2,527 | 0 | 2,527 | ||||||||||||
Turkey | ||||||||||||||||
Telecommunication Services | 0 | 4,776 | 0 | 4,776 | ||||||||||||
United Kingdom | ||||||||||||||||
Consumer Staples | 0 | 6,305 | 0 | 6,305 | ||||||||||||
Energy | 0 | 5,365 | 0 | 5,365 | ||||||||||||
Materials | 6,858 | 0 | 0 | 6,858 | ||||||||||||
Equity-Linked Securities | ||||||||||||||||
India | 0 | 9,768 | 0 | 9,768 | ||||||||||||
Nigeria | 0 | 1,414 | 0 | 1,414 | ||||||||||||
Exchange-Traded Funds | ||||||||||||||||
Hong Kong | 7,188 | 0 | 0 | 7,188 | ||||||||||||
Luxembourg | 1,428 | 0 | 0 | 1,428 | ||||||||||||
United States | 15,931 | 0 | 0 | 15,931 | ||||||||||||
Preferred Stocks | ||||||||||||||||
South Korea | ||||||||||||||||
Industrials | 27,277 | 0 | 0 | 27,277 | ||||||||||||
| Category and Subcategory (3) | Level 1 (4) | Level 2 (5) | Level 3 (6) | Fair Value at 12/31/2011 | ||||||||||||
Short-Term Instruments | ||||||||||||||||
Repurchase Agreements | $ | 0 | $ | 701 | $ | 0 | $ | 701 | ||||||||
U.S. Treasury Bills | 0 | 4,848 | 0 | 4,848 | ||||||||||||
PIMCO Short-Term Floating NAV Portfolio | 104,449 | 0 | 0 | 104,449 | ||||||||||||
Purchased Options | ||||||||||||||||
Equity Contracts | 1,614 | 0 | 0 | 1,614 | ||||||||||||
Foreign Exchange Contracts | 0 | 190 | 0 | 190 | ||||||||||||
| $ | 342,531 | $ | 151,150 | $ | 2,839 | $ | 496,520 | |||||||||
Short Sales, at value | $ | (1,728 | ) | $ | 0 | $ | 0 | $ | (1,728 | ) | ||||||
Financial Derivative Instruments (7) - Assets |
| |||||||||||||||
Credit Contracts | 0 | 54 | 0 | 54 | ||||||||||||
Equity Contracts | 0 | 2,241 | 0 | 2,241 | ||||||||||||
Foreign Exchange Contracts | 0 | 6,351 | 0 | 6,351 | ||||||||||||
| $ | 0 | $ | 8,646 | $ | 0 | $ | 8,646 | |||||||||
Financial Derivative Instruments (7) - Liabilities |
| |||||||||||||||
Equity Contracts | (20 | ) | (2,695 | ) | 0 | (2,715 | ) | |||||||||
Foreign Exchange Contracts | 0 | (8,970 | ) | 0 | (8,970 | ) | ||||||||||
| $ | (20 | ) | $ | (11,665 | ) | $ | 0 | $ | (11,685 | ) | ||||||
Totals | $ | 340,783 | $ | 148,131 | $ | 2,839 | $ | 491,753 | ||||||||
The following is a reconciliation of the fair valuations using significant unobservable inputs (Level 3) for the Fund during the period ending December 31, 2011:
Category and Subcategory (3) | Beginning Balance at 06/30/2011 | Net Purchases | Net Sales | Accrued Discounts/ (Premiums) | Realized Gain/(Loss) | Net Change in Unrealized Appreciation/ (Depreciation) (8) | Transfers into Level 3 | Transfers out of Level 3 | Ending Balance at 12/31/2011 | Net Change in Unrealized Appreciation/ (Depreciation) on Investments Held at 12/31/2011 (8) | ||||||||||||||||||||||||||||||
Investments, at value | ||||||||||||||||||||||||||||||||||||||||
Common Stocks | ||||||||||||||||||||||||||||||||||||||||
Hong Kong | ||||||||||||||||||||||||||||||||||||||||
Information Technology | $ | 0 | $ | 0 | $ | 0 | $ | 0 | $ | 0 | $ | 0 | $ | 2,839 | $ | 0 | $ | 2,839 | $ | 0 | ||||||||||||||||||||
|
|
|
|
|
|
|
|
|
|
|
|
|
|
|
|
|
|
|
| |||||||||||||||||||||
| (1) | See note 3 in the Notes to Financial Statements for more information regarding pricing inputs and valuation techniques. |
| (2) | There were no significant transfers into or out of level 1, 2, and 3 during the period ended December 31, 2011. |
| (3) | Refer to the Schedule of Investments for additional information. |
| (4) | Quoted prices in active markets for identical investments. |
| (5) | Significant other observable inputs. |
| (6) | Significant unobservable inputs. |
| (7) | Financial Derivative Instruments may include open futures contracts, swap agreements, written options, and foreign currency contracts. |
| (8) | Any difference between Net Change in Unrealized Appreciation/(Depreciation) and Net Change in Unrealized Appreciation/(Depreciation) on Investments Held at 12/31/2011 may be due to an investment no longer held or categorized as level 3 at period end. |
| 52 | PIMCO EQUITY SERIES | See Accompanying Notes |
Table of Contents
December 31, 2011 (Unaudited)
| (l) | Fair Value of Financial Derivative Instruments (1) |
The following is a summary of the fair valuation of the Fund’s derivative instruments categorized by risk exposure:
Fair Values of Financial Derivative Instruments on the Statements of Assets and Liabilities as of December 31, 2011:
| Derivatives not accounted for as hedging instruments | ||||||||||||||||||||||||
| Commodity Contracts | Credit Contracts | Equity Contracts | Foreign Exchange Contracts | Interest Rate Contracts | Total | |||||||||||||||||||
Assets: | ||||||||||||||||||||||||
Investments, at value (purchased options) | $ | 0 | $ | 0 | $ | 1,614 | $ | 190 | $ | 0 | $ | 1,804 | ||||||||||||
Unrealized appreciation on foreign currency contracts | 0 | 0 | 0 | 6,351 | 0 | 6,351 | ||||||||||||||||||
Unrealized appreciation on OTC swap agreements | 0 | 54 | 2,241 | 0 | 0 | 2,295 | ||||||||||||||||||
|
|
|
|
|
|
|
|
|
|
|
| |||||||||||||
| $ | 0 | $ | 54 | $ | 3,855 | $ | 6,541 | $ | 0 | $ | 10,450 | |||||||||||||
|
|
|
|
|
|
|
|
|
|
|
| |||||||||||||
Liabilities: | ||||||||||||||||||||||||
Written options outstanding | $ | 0 | $ | 0 | $ | 20 | $ | 0 | $ | 0 | $ | 20 | ||||||||||||
Unrealized depreciation on foreign currency contracts | 0 | 0 | 0 | 8,970 | 0 | 8,970 | ||||||||||||||||||
Unrealized depreciation on OTC swap agreements | 0 | 0 | 2,695 | 0 | 0 | 2,695 | ||||||||||||||||||
|
|
|
|
|
|
|
|
|
|
|
| |||||||||||||
| $ | 0 | $ | 0 | $ | 2,715 | $ | 8,970 | $ | 0 | $ | 11,685 | |||||||||||||
|
|
|
|
|
|
|
|
|
|
|
| |||||||||||||
The Effect of Financial Derivative Instruments on the Statements of Operations for the Period Ended December 31, 2011:
| Derivatives not accounted for as hedging instruments | ||||||||||||||||||||||||
| Commodity Contracts | Credit Contracts | Equity Contracts | Foreign Exchange Contracts | Interest Rate Contracts | Total | |||||||||||||||||||
Realized Gain (Loss) on Derivatives Recognized as a Result from Operations: | ||||||||||||||||||||||||
Net realized (loss) on investments (purchased options) | $ | 0 | $ | 0 | $ | (632 | ) | $ | 0 | $ | 0 | $ | (632 | ) | ||||||||||
Net realized (loss) on futures contracts, written options and swaps | 0 | (16 | ) | (13,520 | ) | 0 | 0 | (13,536 | ) | |||||||||||||||
Net realized (loss) on foreign currency transactions | 0 | 0 | 0 | (935 | ) | 0 | (935 | ) | ||||||||||||||||
|
|
|
|
|
|
|
|
|
|
|
| |||||||||||||
| $ | 0 | $ | (16 | ) | $ | (14,152 | ) | $ | (935 | ) | $ | 0 | $ | (15,103 | ) | |||||||||
|
|
|
|
|
|
|
|
|
|
|
| |||||||||||||
Net Change in Unrealized Appreciation (Depreciation) on Derivatives Recognized as a Result of Operations: | ||||||||||||||||||||||||
Net change in unrealized (depreciation) on investments (purchased options) | $ | 0 | $ | 0 | $ | (749 | ) | $ | (140 | ) | $ | 0 | $ | (889 | ) | |||||||||
Net change in unrealized appreciation (depreciation) on futures contracts, written options and swaps | 0 | 56 | (3,315 | ) | 0 | 0 | (3,259 | ) | ||||||||||||||||
Net change in unrealized (depreciation) on translation of assets and liabilities denominated in foreign currencies | 0 | 0 | 0 | (3,417 | ) | 0 | (3,417 | ) | ||||||||||||||||
|
|
|
|
|
|
|
|
|
|
|
| |||||||||||||
| $ | 0 | $ | 56 | $ | (4,064 | ) | $ | (3,557 | ) | $ | 0 | $ | (7,565 | ) | ||||||||||
|
|
|
|
|
|
|
|
|
|
|
| |||||||||||||
| (1) | See note 5 in the Notes to Financial Statements for additional information. |
| (m) | Collateral (Received)/Pledged for OTC Financial Derivative Instruments |
The following is a summary by counterparty of the market value of OTC financial derivative instruments and collateral (received)/pledged as of December 31, 2011:
| Counterparty | Total Market Value of OTC Derivatives | Collateral (Received)/Pledged | Net Exposures (1) | |||||||||
BOA | $ | (294 | ) | $ | 0 | $ | (294 | ) | ||||
BPS | 29 | 0 | 29 | |||||||||
BRC | 299 | (270 | ) | 29 | ||||||||
CBK | (457 | ) | 666 | 209 | ||||||||
DUB | 30 | 0 | 30 | |||||||||
FBF | 34 | 0 | 34 | |||||||||
FBL | (185 | ) | 0 | (185 | ) | |||||||
GST | (183 | ) | 280 | 97 | ||||||||
HUS | 741 | (620 | ) | 121 | ||||||||
JPM | (2,657 | ) | 2,702 | 45 | ||||||||
MEI | 0 | 0 | 0 | |||||||||
MSX | 190 | (335 | ) | (145 | ) | |||||||
MYI | 774 | (450 | ) | 324 | ||||||||
UAG | 156 | 1,080 | 1,236 | |||||||||
ULO | (1,331 | ) | 0 | (1,331 | ) | |||||||
| (1) | Net Exposure represents the net receivable/(payable) that would be due from/to the counterparty in the event of default. See note 6, Principal Risks, in the Notes to Financial Statements for more information regarding credit and counterparties at risk. |
| See Accompanying Notes | DECEMBER 31, 2011 | SEMIANNUAL REPORT | 53 |
Table of Contents
Consolidated Schedule of Investments PIMCO Emerging Multi-Asset Fund
| SHARES | MARKET VALUE (000S) | |||||||||||
| COMMON STOCKS 0.1% | ||||||||||||
| UNITED STATES 0.1% | ||||||||||||
| INFORMATION TECHNOLOGY 0.1% | ||||||||||||
Zynga, Inc. ‘A’ (a) | 713 | $ | 7 | |||||||||
|
| |||||||||||
Total Common Stocks (Cost $7) |
| 7 | ||||||||||
|
| |||||||||||
| EXCHANGE-TRADED FUNDS 9.0% | ||||||||||||
| UNITED STATES 9.0% | ||||||||||||
Vanguard MSCI Emerging Markets ETF | 91,329 | 3,490 | ||||||||||
|
| |||||||||||
Total Exchange-Traded Funds (Cost $4,209) |
| 3,490 | ||||||||||
|
| |||||||||||
| MUTUAL FUNDS (c)(d) 72.5% | ||||||||||||
| UNITED STATES 72.5% | ||||||||||||
PIMCO Emerging Markets Bond Fund | 612,258 | 6,888 | ||||||||||
PIMCO Emerging Markets Currency Fund | 75,246 | 746 | ||||||||||
PIMCO Emerging Local Bond Fund | 794,137 | 7,981 | ||||||||||
PIMCO Emerging Markets Corporate Bond Fund | 102,037 | 1,113 | ||||||||||
PIMCO EqS Emerging Markets Fund | 1,443,244 | 11,459 | ||||||||||
|
| |||||||||||
Total Mutual Funds (Cost $30,979) |
| 28,187 | ||||||||||
|
| |||||||||||
| PRINCIPAL AMOUNT (000s) | MARKET VALUE (000S) | |||||||||||
| SHORT-TERM INSTRUMENTS 16.9% | ||||||||||||
| REPURCHASE AGREEMENTS 1.1% | ||||||||||||
State Street Bank and Trust Co. |
| |||||||||||
0.010% due 01/03/2012 | $ | 436 | $ | 436 | ||||||||
(Dated 12/30/2011. Collateralized by Freddie Mac 5.500% due 08/20/2012 valued at $448. Repurchase proceeds are $436.) | ||||||||||||
| U.S. TREASURY BILLS 0.1% | ||||||||||||
0.029% due 05/10/2012 (b)(f) | 37 | 37 | ||||||||||
| SHARES | ||||||||||||
| PIMCO SHORT-TERM FLOATING NAV PORTFOLIO (c) 15.7% | ||||||||||||
| 609,907 | 6,108 | |||||||||||
|
| |||||||||||
Total Short-Term Instruments (Cost $6,581) |
| 6,581 | ||||||||||
|
| |||||||||||
| PURCHASED OPTIONS (h) 2.1% | ||||||||||||
(Cost $911) | 827 | |||||||||||
| Total Investments 100.6% (Cost $42,687) | $ | 39,092 | ||||||||||
| Written Options (i) (0.7%) (Premiums $371) | (288 | ) | ||||||||||
| Other Assets and Liabilities (Net) 0.1% | 68 | |||||||||||
|
| |||||||||||
| Net Assets 100.0% | $ | 38,872 | ||||||||||
|
| |||||||||||
Notes to Schedule of Investments (amounts in thousands*):
| * | A zero balance may reflect actual amounts rounding to less than one thousand. |
| (a) | Non-income producing security. |
| (b) | Coupon represents a weighted average yield to maturity. |
| (c) | Affiliated to the Fund. |
| (d) | Institutional Class Shares of each Fund. |
| (e) | Cash of $18 has been pledged as collateral for futures contracts on December 31, 2011. On December 31, 2011, there were no open futures contracts. |
| (f) | Centrally cleared swap agreements outstanding on December 31, 2011: |
Securities with an aggregate market value of $37 have been pledged as collateral for centrally cleared swaps as of December 31, 2011.
| Interest Rate Swaps | ||||||||||||||||||||||||
| Pay/Receive Floating Rate | Floating Rate Index | Fixed Rate | Maturity Date | Notional | Market Value | Unrealized Appreciation | ||||||||||||||||||
Pay | 6-Month EUR-EURIBOR | 2.250 | % | 09/21/2016 | EUR | 1,000 | $ | 37 | $ | 9 | ||||||||||||||
|
|
|
| |||||||||||||||||||||
| (g) | OTC swap agreements outstanding on December 31, 2011: |
| Credit Default Swaps on Corporate and Sovereign Issues - Sell Protection (1) | ||||||||||||||||||||||||||||||||||
| Reference Entity | Counterparty | Fixed Deal Receive Rate | Maturity Date | Implied Credit Spread at December 31, 2011 (2) | Notional | Market Value | Premiums Paid/(Received) | Unrealized Appreciation/ (Depreciation) | ||||||||||||||||||||||||||
Brazil Government International Bond | UAG | 1.000% | 12/20/2012 | 0.764% | $ | 100 | $ | 0 | $ | 0 | $ | 0 | ||||||||||||||||||||||
China Government International Bond | GST | 1.000% | 12/20/2012 | 0.720% | 100 | 1 | 1 | 0 | ||||||||||||||||||||||||||
China Government International Bond | HUS | 1.000% | 12/20/2012 | 0.720% | 100 | 0 | 0 | 0 | ||||||||||||||||||||||||||
China Government International Bond | RYL | 1.000% | 12/20/2016 | 1.450% | 100 | (2 | ) | (5 | ) | 3 | ||||||||||||||||||||||||
Gazprom Via Morgan Stanley, Inc. | GST | 1.000% | 12/20/2012 | 2.013% | 100 | (1 | ) | (1 | ) | 0 | ||||||||||||||||||||||||
Gazprom Via Morgan Stanley, Inc. | MYC | 1.000% | 12/20/2012 | 2.013% | 100 | (1 | ) | (1 | ) | 0 | ||||||||||||||||||||||||
Russia Government International Bond | BRC | 1.000% | 12/20/2012 | 1.564% | 100 | 0 | (1 | ) | 1 | |||||||||||||||||||||||||
South Africa Government International Bond | CBK | 1.000% | 12/20/2012 | 1.015% | 100 | 0 | 0 | 0 | ||||||||||||||||||||||||||
South Africa Government International Bond | GST | 1.000% | 12/20/2012 | 1.015% | 100 | 0 | 0 | 0 | ||||||||||||||||||||||||||
|
|
|
|
|
| |||||||||||||||||||||||||||||
| $ | (3 | ) | $ | (7 | ) | $ | 4 | |||||||||||||||||||||||||||
|
|
|
|
|
| |||||||||||||||||||||||||||||
| 54 | PIMCO EQUITY SERIES | See Accompanying Notes |
Table of Contents
December 31, 2011 (Unaudited)
| (1) | If the Fund is a seller of protection and a credit event occurs, as defined under the terms of that particular swap agreement, the Fund will either (i) pay to the buyer of protection an amount equal to the notional amount of the swap and take delivery of the referenced obligation or underlying securities comprising the referenced index or (ii) pay a net settlement amount in the form of cash or securities equal to the notional amount of the swap less the recovery value of the referenced obligation or underlying securities comprising the referenced index. |
| (2) | Implied credit spreads, represented in absolute terms, utilized in determining the market value of credit default swap agreements on corporate or sovereign issues as of period end serve as an indicator of the current status of the payment/performance risk and represent the likelihood or risk of default for the credit derivative. The implied credit spread of a particular referenced entity reflects the cost of buying/selling protection and may include upfront payments required to be made to enter into the agreement. Wider credit spreads represent a deterioration of the referenced entity’s credit soundness and a greater likelihood or risk of default or other credit event occurring as defined under the terms of the agreement. |
| (3) | The maximum potential amount the Fund could be required to pay as a seller of credit protection or receive as a buyer of credit protection if a credit event occurs as defined under the terms of that particular swap agreement. |
| (h) | Purchased options outstanding on December 31, 2011: |
| Options on Exchanged-Traded Funds | ||||||||||||||||||||||||
| Description | Strike Price | Expiration Date | # of Contracts | Cost | Market Value | |||||||||||||||||||
Put - CBOE iShares MSCI Emerging Markets Index Fund | $ | 37.000 | 06/16/2012 | 1,091 | $ | 293 | $ | 327 | ||||||||||||||||
Put - CBOE iShares MSCI Emerging Markets Index Fund | 36.000 | 09/22/2012 | 1,427 | 618 | 500 | |||||||||||||||||||
|
|
|
| |||||||||||||||||||||
| $ | 911 | $ | 827 | |||||||||||||||||||||
|
|
|
| |||||||||||||||||||||
| (i) | Written options outstanding on December 31, 2011: |
| Options on Exchange-Traded Futures Contracts | ||||||||||||||||||||||||
| Description | Exercise Price | Expiration Date | # of Contracts | Premium | Market Value | |||||||||||||||||||
Call - CME 90-Day Eurodollar June Futures | $ | 99.500 | 06/18/2012 | 1 | $ | 1 | $ | 0 | ||||||||||||||||
Put - CME 90-Day Eurodollar June Futures | 99.500 | 06/18/2012 | 1 | 0 | (1 | ) | ||||||||||||||||||
Call - CME 90-Day Eurodollar June Futures | 99.625 | 06/18/2012 | 4 | 1 | 0 | |||||||||||||||||||
Put - CME 90-Day Eurodollar June Futures | 99.625 | 06/18/2012 | 9 | 3 | (7 | ) | ||||||||||||||||||
|
|
|
| |||||||||||||||||||||
| $ | 5 | $ | (8 | ) | ||||||||||||||||||||
|
|
|
| |||||||||||||||||||||
| Options on Exchanged-Traded Funds | ||||||||||||||||||||||||
| Description | Strike Price | Expiration Date | # of Contracts | Premium | Market Value | |||||||||||||||||||
Put - CBOE iShares MSCI Emerging Markets Index Fund | $ | 30.000 | 06/16/2012 | 1,091 | $ | 113 | $ | (120 | ) | |||||||||||||||
Put - CBOE iShares MSCI Emerging Markets Index Fund | 27.000 | 09/22/2012 | 1,427 | 253 | (160 | ) | ||||||||||||||||||
|
|
|
| |||||||||||||||||||||
| $ | 366 | $ | (280 | ) | ||||||||||||||||||||
|
|
|
| |||||||||||||||||||||
Transactions in written call and put options for the period ended December 31, 2011:
| # of Contracts | Premium | |||||||
Balance at 06/30/2011 | 850 | $ | 46 | |||||
Sales | 2,533 | 371 | ||||||
Closing Buys | (850 | ) | (46 | ) | ||||
Expirations | 0 | 0 | ||||||
Exercised | 0 | 0 | ||||||
|
|
|
| |||||
Balance at 12/31/2011 | 2,533 | $ | 371 | |||||
|
|
|
| |||||
| (j) | Foreign currency contracts outstanding on December 31, 2011: |
| Type | Currency | Principal Amount Covered by Contract | Settlement Month | Counterparty | Unrealized Appreciation | Unrealized (Depreciation) | Net Unrealized Appreciation/ (Depreciation) | |||||||||||||||||||
Buy | BRL | 973 | 01/2012 | HUS | $ | 14 | $ | 0 | $ | 14 | ||||||||||||||||
Sell | 973 | 01/2012 | HUS | 0 | (3 | ) | (3 | ) | ||||||||||||||||||
Buy | 973 | 01/2012 | UAG | 3 | 0 | 3 | ||||||||||||||||||||
Sell | 973 | 01/2012 | UAG | 22 | 0 | 22 | ||||||||||||||||||||
Buy | 973 | 03/2012 | UAG | 0 | (22 | ) | (22 | ) | ||||||||||||||||||
Buy | CNY | 2,533 | 02/2012 | BRC | 0 | 0 | 0 | |||||||||||||||||||
| See Accompanying Notes | DECEMBER 31, 2011 | SEMIANNUAL REPORT | 55 |
Table of Contents
Consolidated Schedule of Investments PIMCO Emerging Multi-Asset Fund (Cont.)
| Type | Currency | Principal Amount Covered by Contract | Settlement Month | Counterparty | Unrealized Appreciation | Unrealized (Depreciation) | Net Unrealized Appreciation/ (Depreciation) | |||||||||||||||||||
Sell | EUR | 6 | 01/2012 | JPM | $ | 0 | $ | 0 | $ | 0 | ||||||||||||||||
Buy | HKD | 4,395 | 02/2012 | CBK | 2 | 0 | 2 | |||||||||||||||||||
Buy | 2,400 | 02/2012 | FBL | 1 | 0 | 1 | ||||||||||||||||||||
Buy | 1,000 | 02/2012 | UAG | 0 | 0 | 0 | ||||||||||||||||||||
Buy | HUF | 76,392 | 01/2012 | BRC | 0 | (25 | ) | (25 | ) | |||||||||||||||||
Buy | IDR | 1,712,200 | 01/2012 | UAG | 0 | (5 | ) | (5 | ) | |||||||||||||||||
Buy | MYR | 897 | 04/2012 | CBK | 0 | (8 | ) | (8 | ) | |||||||||||||||||
Buy | RUB | 11,692 | 03/2012 | CBK | 0 | (35 | ) | (35 | ) | |||||||||||||||||
Buy | TWD | 5,760 | 01/2012 | HUS | 0 | (10 | ) | (10 | ) | |||||||||||||||||
Buy | ZAR | 3,643 | 01/2012 | HUS | 0 | (12 | ) | (12 | ) | |||||||||||||||||
|
|
|
|
|
| |||||||||||||||||||||
| $ | 42 | $ | (120 | ) | $ | (78 | ) | |||||||||||||||||||
|
|
|
|
|
| |||||||||||||||||||||
| (k) | Fair Value Measurements (1) |
The following is a summary of the fair valuations according to the inputs used as of December 31, 2011 in valuing the Fund’s assets and liabilities (2):
| Category and Subcategory (3) | Level 1 (4) | Level 2 (5) | Level 3 (6) | Fair Value at 12/31/2011 | ||||||||||||
Investments, at value | ||||||||||||||||
Common Stocks | ||||||||||||||||
United States | ||||||||||||||||
Information Technology | $ | 7 | $ | 0 | $ | 0 | $ | 7 | ||||||||
Exchange-Traded Funds | ||||||||||||||||
United States | 3,490 | 0 | 0 | 3,490 | ||||||||||||
Mutual Funds | ||||||||||||||||
United States | 28,187 | 0 | 0 | 28,187 | ||||||||||||
Short-Term Instruments | ||||||||||||||||
Repurchase Agreements | 0 | 436 | 0 | 436 | ||||||||||||
U.S. Treasury Bills | 0 | 37 | 0 | 37 | ||||||||||||
PIMCO Short-Term Floating NAV Portfolio | 6,108 | 0 | 0 | 6,108 | ||||||||||||
Purchased Options | ||||||||||||||||
Equity Contracts | 827 | 0 | 0 | 827 | ||||||||||||
| $ | 38,619 | $ | 473 | $ | 0 | $ | 39,092 | |||||||||
| Category and Subcategory (3) | Level 1 (4) | Level 2 (5) | Level 3 (6) | Fair Value at 12/31/2011 | ||||||||||||
Financial Derivative Instruments (7) - Assets |
| |||||||||||||||
Credit Contracts | $ | 0 | $ | 4 | $ | 0 | $ | 4 | ||||||||
Foreign Exchange Contracts | 0 | 42 | 0 | 42 | ||||||||||||
Interest Rate Contracts | 0 | 9 | 0 | 9 | ||||||||||||
| $ | 0 | $ | 55 | $ | 0 | $ | 55 | |||||||||
Financial Derivative Instruments (7) - Liabilities |
| |||||||||||||||
Equity Contracts | (280 | ) | 0 | 0 | (280 | ) | ||||||||||
Foreign Exchange Contracts | 0 | (120 | ) | 0 | (120 | ) | ||||||||||
Interest Rate Contracts | 0 | (8 | ) | 0 | (8 | ) | ||||||||||
| $ | (280 | ) | $ | (128 | ) | $ | 0 | $ | (408 | ) | ||||||
Totals | $ | 38,339 | $ | 400 | $ | 0 | $ | 38,739 | ||||||||
| (1) | See note 3 in the Notes to Financial Statements for more information regarding pricing inputs and valuation techniques. |
| (2) | There were no significant transfers into or out of level 1, 2, and 3 during the period ended December 31, 2011. |
| (3) | Refer to the Schedule of Investments for additional information. |
| (4) | Quoted prices in active markets for identical investments. |
| (5) | Significant other observable inputs. |
| (6) | Significant unobservable inputs. |
| (7) | Financial Derivative Instruments may include open futures contracts, swap agreements, written options, and foreign currency contracts. |
| (l) | Fair Value of Financial Derivative Instruments (1) |
The following is a summary of the fair valuation of the Fund’s derivative instruments categorized by risk exposure:
Fair Values of Financial Derivative Instruments on the Statements of Assets and Liabilities as of December 31, 2011:
| Derivatives not accounted for as hedging instruments | ||||||||||||||||||||||||
| Commodity Contracts | Credit Contracts | Equity Contracts | Foreign Exchange Contracts | Interest Rate Contracts | Total | |||||||||||||||||||
Assets: | ||||||||||||||||||||||||
Investments, at value (purchased options) | $ | 0 | $ | 0 | $ | 827 | $ | 0 | $ | 0 | $ | 827 | ||||||||||||
Variation margin receivable on financial derivative instruments (2) | 0 | 0 | 0 | 0 | 3 | 3 | ||||||||||||||||||
Unrealized depreciation on foreign currency contracts | 0 | 0 | 0 | 42 | 0 | 42 | ||||||||||||||||||
Unrealized appreciation on OTC swap agreements | 0 | 4 | 0 | 0 | 0 | 4 | ||||||||||||||||||
|
|
|
|
|
|
|
|
|
|
|
| |||||||||||||
| $ | 0 | $ | 4 | $ | 827 | $ | 42 | $ | 3 | $ | 876 | |||||||||||||
|
|
|
|
|
|
|
|
|
|
|
| |||||||||||||
Liabilities: | ||||||||||||||||||||||||
Written options outstanding | $ | 0 | $ | 0 | $ | 280 | $ | 0 | $ | 8 | $ | 288 | ||||||||||||
Unrealized depreciation on foreign currency contracts | 0 | 0 | 0 | 120 | 0 | 120 | ||||||||||||||||||
|
|
|
|
|
|
|
|
|
|
|
| |||||||||||||
| $ | 0 | $ | 0 | $ | 280 | $ | 120 | $ | 8 | $ | 408 | |||||||||||||
|
|
|
|
|
|
|
|
|
|
|
| |||||||||||||
| 56 | PIMCO EQUITY SERIES | See Accompanying Notes |
Table of Contents
December 31, 2011 (Unaudited)
The Effect of Financial Derivative Instruments on the Statements of Operations for the Period Ended December 31, 2011:
| Derivatives not accounted for as hedging instruments | ||||||||||||||||||||||||
| Commodity Contracts | Credit Contracts | Equity Contracts | Foreign Exchange Contracts | Interest Rate Contracts | Total | |||||||||||||||||||
Realized Gain (Loss) on Derivatives Recognized as a Result | ||||||||||||||||||||||||
Net realized gain on investments (purchased options) | $ | 0 | $ | 0 | $ | 199 | $ | 0 | $ | 0 | $ | 199 | ||||||||||||
Net realized gain (loss) on futures contracts, written options and swaps | 0 | 0 | (118 | ) | 0 | 20 | (98 | ) | ||||||||||||||||
Net realized (loss) on foreign currency transactions | 0 | 0 | 0 | (191 | ) | 0 | (191 | ) | ||||||||||||||||
|
|
|
|
|
|
|
|
|
|
|
| |||||||||||||
| $ | 0 | $ | 0 | $ | 81 | $ | (191 | ) | $ | 20 | $ | (90 | ) | |||||||||||
|
|
|
|
|
|
|
|
|
|
|
| |||||||||||||
Net Change in Unrealized Appreciation (Depreciation) on Derivatives Recognized as a Result of Operations: | ||||||||||||||||||||||||
Net change in unrealized (depreciation) on investments (purchased options) | $ | 0 | $ | 0 | $ | (68 | ) | $ | 0 | $ | 0 | $ | (68 | ) | ||||||||||
Net change in unrealized appreciation on futures contracts, written options and swaps | 0 | 3 | 78 | 0 | 6 | 87 | ||||||||||||||||||
Net change in unrealized (depreciation) on translation of assets and liabilities denominated in foreign currencies | 0 | 0 | 0 | (78 | ) | 0 | (78 | ) | ||||||||||||||||
|
|
|
|
|
|
|
|
|
|
|
| |||||||||||||
| $ | 0 | $ | 3 | $ | 10 | $ | (78 | ) | $ | 6 | $ | (59 | ) | |||||||||||
|
|
|
|
|
|
|
|
|
|
|
| |||||||||||||
| (1) | See note 5 in the Notes to Financial Statements for additional information. |
| (2) | Only current day’s variation margin is reported within the Statement of Assets and Liabilities. The variation margin is included in the open centrally cleared swaps cumulative appreciation/(depreciation) of $9 as reported in the Notes to Schedule of Investments. |
| (m) | Collateral (Received)/Pledged for OTC Financial Derivative Instruments |
The following is a summary by counterparty of the market value of OTC financial derivative instruments and collateral (received)/pledged as of December 31, 2011:
Counterparty | Total Market Value of OTC Derivatives | Collateral (Received)/Pledged | Net Exposures (1) | Total Market Value of OTC Derivatives | Collateral (Received)/Pledged | Net Exposures (1) | ||||||||||||||||||||||
| PIMCO Emerging Multi-Asset Fund | PIMCO Cayman Commodity Fund V Ltd. (Subsidiary) | |||||||||||||||||||||||||||
BRC | $ | (25 | ) | $ | 0 | $ | (25 | ) | $ | 0 | $ | 0 | $ | 0 | ||||||||||||||
CBK | (41 | ) | 0 | (41 | ) | 0 | 0 | 0 | ||||||||||||||||||||
FBL | 1 | 0 | 1 | 0 | 0 | 0 | ||||||||||||||||||||||
HUS | (11 | ) | 0 | (11 | ) | 0 | 0 | 0 | ||||||||||||||||||||
MYC | (1 | ) | 0 | (1 | ) | 0 | 0 | 0 | ||||||||||||||||||||
RYL | (3 | ) | 0 | (3 | ) | 0 | 0 | 0 | ||||||||||||||||||||
UAG | (2 | ) | 0 | (2 | ) | 0 | 0 | 0 | ||||||||||||||||||||
| (1) | Net Exposure represents the net receivable/(payable) that would be due from/to the counterparty in the event of default. Exposure from OTC derivatives can only be netted across transactions governed under the same Master Agreement with the same legal entity. The Fund and subsidiary are recognized as two separate legal entities. As such, exposure cannot be netted. See note 6 Principal Risks in the Notes to Financial Statements for more information regarding Credit and Counterparties Risk. |
| See Accompanying Notes | DECEMBER 31, 2011 | SEMIANNUAL REPORT | 57 |
Table of Contents
Consolidated Schedule of Investments PIMCO EqS Pathfinder FundTM
| SHARES | MARKET VALUE (000S) | |||||||||||
| COMMON STOCKS 86.8% | ||||||||||||
| BERMUDA 6.1% | ||||||||||||
| ENERGY 2.7% | ||||||||||||
North Atlantic Drilling Ltd. | 14,715,434 | $ | 22,759 | |||||||||
Seadrill Ltd. | 1,070,277 | 35,692 | ||||||||||
|
| |||||||||||
| 58,451 | ||||||||||||
|
| |||||||||||
| FINANCIALS 3.4% | ||||||||||||
Hiscox Ltd. | 4,752,392 | 27,522 | ||||||||||
Lancashire Holdings Ltd. | 3,911,547 | 44,030 | ||||||||||
|
| |||||||||||
| 71,552 | ||||||||||||
|
| |||||||||||
Total Bermuda | 130,003 | |||||||||||
|
| |||||||||||
| BRAZIL 1.0% | ||||||||||||
| FINANCIALS 1.0% | ||||||||||||
Itau Unibanco Holding S.A. SP – ADR | 1,144,605 | 21,244 | ||||||||||
|
| |||||||||||
Total Brazil | 21,244 | |||||||||||
|
| |||||||||||
| CANADA 1.5% | ||||||||||||
| MATERIALS 1.5% | ||||||||||||
Cameco Corp. | 734,043 | 13,249 | ||||||||||
Kinross Gold Corp. | 761,908 | 8,686 | ||||||||||
Silver Wheaton Corp. | 350,366 | 10,147 | ||||||||||
|
| |||||||||||
| 32,082 | ||||||||||||
|
| |||||||||||
Total Canada | 32,082 | |||||||||||
|
| |||||||||||
| DENMARK 2.0% | ||||||||||||
| CONSUMER STAPLES 1.6% | ||||||||||||
Carlsberg A/S | 468,866 | 33,015 | ||||||||||
|
| |||||||||||
| FINANCIALS 0.4% | ||||||||||||
Jyske Bank A/S (a) | 351,042 | 8,606 | ||||||||||
|
| |||||||||||
Total Denmark | 41,621 | |||||||||||
|
| |||||||||||
| FAEROE ISLANDS 0.4% | ||||||||||||
| CONSUMER STAPLES 0.2% | ||||||||||||
Bakkafrost P/F | 810,885 | 4,962 | ||||||||||
|
| |||||||||||
| FINANCIALS 0.2% | ||||||||||||
BankNordik P/F | 236,546 | 3,295 | ||||||||||
|
| |||||||||||
Total Faeroe Islands | 8,257 | |||||||||||
|
| |||||||||||
| FRANCE 9.9% | ||||||||||||
| CONSUMER DISCRETIONARY 2.9% | ||||||||||||
Eutelsat Communications S.A. | 747,854 | 29,130 | ||||||||||
JCDecaux S.A. (a) | 518,652 | 11,908 | ||||||||||
Teleperformance S.A. | 951,735 | 21,143 | ||||||||||
|
| |||||||||||
| 62,181 | ||||||||||||
|
| |||||||||||
| CONSUMER STAPLES 6.5% | ||||||||||||
Carrefour S.A. | 1,565,779 | 35,624 | ||||||||||
Danone | 873,121 | 54,790 | ||||||||||
L’Oreal S.A. | 98,744 | 10,284 | ||||||||||
| SHARES | MARKET VALUE (000S) | |||||||||||
Pernod-Ricard S.A. | 414,078 | $ | 38,327 | |||||||||
|
| |||||||||||
| 139,025 | ||||||||||||
|
| |||||||||||
| ENERGY 0.5% | ||||||||||||
Bourbon S.A. | 377,191 | 10,330 | ||||||||||
|
| |||||||||||
Total France | 211,536 | |||||||||||
|
| |||||||||||
| GERMANY 1.3% | ||||||||||||
| HEALTH CARE 0.5% | ||||||||||||
Rhoen Klinikum AG | 514,590 | 9,794 | ||||||||||
|
| |||||||||||
| INDUSTRIALS 0.2% | ||||||||||||
Kloeckner & Co. SE | 383,249 | 4,905 | ||||||||||
|
| |||||||||||
| UTILITIES 0.6% | ||||||||||||
E.ON AG | 628,501 | 13,544 | ||||||||||
|
| |||||||||||
Total Germany | 28,243 | |||||||||||
|
| |||||||||||
| GUERNSEY, CHANNEL ISLANDS 0.9% | ||||||||||||
| FINANCIALS 0.9% | ||||||||||||
Resolution Ltd. | 5,137,075 | 20,026 | ||||||||||
|
| |||||||||||
Total Guernsey, Channel Islands | 20,026 | |||||||||||
|
| |||||||||||
| HONG KONG 3.0% | ||||||||||||
| CONSUMER DISCRETIONARY 0.4% | ||||||||||||
Television Broadcasts Ltd. | 1,338,000 | 8,102 | ||||||||||
|
| |||||||||||
| FINANCIALS 2.3% | ||||||||||||
AIA Group Ltd. | 12,013,200 | 37,396 | ||||||||||
First Pacific Co. Ltd. | 11,094,000 | 11,540 | ||||||||||
|
| |||||||||||
| 48,936 | ||||||||||||
|
| |||||||||||
| INDUSTRIALS 0.3% | ||||||||||||
Jardine Matheson Holdings Ltd. | 89,300 | 4,196 | ||||||||||
Jardine Strategic Holdings Ltd. | 96,500 | 2,669 | ||||||||||
|
| |||||||||||
| 6,865 | ||||||||||||
|
| |||||||||||
Total Hong Kong | 63,903 | |||||||||||
|
| |||||||||||
| ISRAEL 0.6% | ||||||||||||
| HEALTH CARE 0.6% | ||||||||||||
Teva Pharmaceutical Industries Ltd. | 314,971 | 12,712 | ||||||||||
|
| |||||||||||
Total Israel | 12,712 | |||||||||||
|
| |||||||||||
| JAPAN 1.5% | ||||||||||||
| INFORMATION TECHNOLOGY 1.5% | ||||||||||||
Nintendo Co. Ltd. | 232,442 | 31,912 | ||||||||||
|
| |||||||||||
Total Japan | 31,912 | |||||||||||
|
| |||||||||||
| NETHERLANDS 5.8% | ||||||||||||
| CONSUMER STAPLES 1.2% | ||||||||||||
CSM | 1,708,728 | 26,560 | ||||||||||
|
| |||||||||||
| SHARES | MARKET VALUE (000S) | |||||||||||
| ENERGY 0.9% | ||||||||||||
Royal Dutch Shell PLC ‘A’ | 506,320 | $ | 18,577 | |||||||||
|
| |||||||||||
| FINANCIALS 1.3% | ||||||||||||
ING Groep NV – Dutch Certificate (a) | 3,934,930 | 28,141 | ||||||||||
|
| |||||||||||
| INFORMATION TECHNOLOGY 0.5% | ||||||||||||
Gemalto NV | 228,348 | 11,067 | ||||||||||
|
| |||||||||||
| TELECOMMUNICATION SERVICES 1.9% | ||||||||||||
Koninklijke KPN NV | 3,343,425 | 39,911 | ||||||||||
|
| |||||||||||
Total Netherlands | 124,256 | |||||||||||
|
| |||||||||||
| NORWAY 1.4% | ||||||||||||
| CONSUMER STAPLES 0.9% | ||||||||||||
Marine Harvest ASA | 46,581,257 | 20,088 | ||||||||||
|
| |||||||||||
| INDUSTRIALS 0.5% | ||||||||||||
Orkla ASA | 1,453,514 | 10,824 | ||||||||||
|
| |||||||||||
Total Norway | 30,912 | |||||||||||
|
| |||||||||||
| SINGAPORE 0.7% | ||||||||||||
| FINANCIALS 0.0% | ||||||||||||
Great Eastern Holdings Ltd. | 85,220 | 828 | ||||||||||
|
| |||||||||||
| INDUSTRIALS 0.7% | ||||||||||||
Keppel Corp. Ltd. | 1,992,300 | 14,261 | ||||||||||
|
| |||||||||||
Total Singapore | 15,089 | |||||||||||
|
| |||||||||||
| SOUTH AFRICA 0.9% | ||||||||||||
| MATERIALS 0.9% | ||||||||||||
AngloGold Ashanti Ltd. SP – ADR | 474,566 | 20,145 | ||||||||||
|
| |||||||||||
Total South Africa | 20,145 | |||||||||||
|
| |||||||||||
| SOUTH KOREA 0.5% | ||||||||||||
| CONSUMER DISCRETIONARY 0.5% | ||||||||||||
GS Home Shopping, Inc. | 98,475 | 9,931 | ||||||||||
|
| |||||||||||
Total South Korea | 9,931 | |||||||||||
|
| |||||||||||
| SPAIN 0.2% | ||||||||||||
| CONSUMER STAPLES 0.2% | ||||||||||||
Distribuidora Internacional de Alimentacion S.A. (a) | 1,131,881 | 5,096 | ||||||||||
|
| |||||||||||
Total Spain | 5,096 | |||||||||||
|
| |||||||||||
| SWEDEN 0.9% | ||||||||||||
| CONSUMER DISCRETIONARY 0.9% | ||||||||||||
Loomis AB | 1,397,128 | 20,071 | ||||||||||
|
| |||||||||||
Total Sweden | 20,071 | |||||||||||
|
| |||||||||||
| SWITZERLAND 4.1% | ||||||||||||
| CONSUMER STAPLES 1.4% | ||||||||||||
Nestle S.A. | 506,158 | 29,066 | ||||||||||
|
| |||||||||||
| 58 | PIMCO EQUITY SERIES | See Accompanying Notes |
Table of Contents
December 31, 2011 (Unaudited)
| SHARES | MARKET VALUE (000S) | |||||||||||
| HEALTH CARE 1.7% | ||||||||||||
Novartis AG | 78,371 | $ | 4,474 | |||||||||
Roche Holding AG | 187,345 | 31,684 | ||||||||||
|
| |||||||||||
| 36,158 | ||||||||||||
|
| |||||||||||
| INDUSTRIALS 0.6% | ||||||||||||
Schindler Holding AG | 104,608 | 12,121 | ||||||||||
|
| |||||||||||
| MATERIALS 0.4% | ||||||||||||
Sika AG | 5,009 | 9,418 | ||||||||||
|
| |||||||||||
Total Switzerland | 86,763 | |||||||||||
|
| |||||||||||
| UNITED KINGDOM 12.1% | ||||||||||||
| CONSUMER DISCRETIONARY 0.4% | ||||||||||||
British Sky Broadcasting Group PLC | 866,307 | 9,856 | ||||||||||
|
| |||||||||||
| CONSUMER STAPLES 7.4% | ||||||||||||
British American Tobacco PLC | 1,344,236 | 63,771 | ||||||||||
Imperial Tobacco Group PLC | 1,955,203 | 73,986 | ||||||||||
Reckitt Benckiser Group PLC | 415,703 | 20,503 | ||||||||||
|
| |||||||||||
| 158,260 | ||||||||||||
|
| |||||||||||
| ENERGY 2.7% | ||||||||||||
BP PLC | 5,761,342 | 41,040 | ||||||||||
Ensco PLC SP – ADR | 351,649 | 16,499 | ||||||||||
|
| |||||||||||
| 57,539 | ||||||||||||
|
| |||||||||||
| FINANCIALS 1.6% | ||||||||||||
Barclays PLC | 4,761,197 | 13,039 | ||||||||||
Lloyds Banking Group PLC (a) | 52,494,230 | 21,086 | ||||||||||
|
| |||||||||||
| 34,125 | ||||||||||||
|
| |||||||||||
Total United Kingdom | 259,780 | |||||||||||
|
| |||||||||||
| UNITED STATES 32.0% | ||||||||||||
| CONSUMER STAPLES 7.7% | ||||||||||||
Altria Group, Inc. | 973,196 | 28,855 | ||||||||||
CVS Caremark Corp. | 934,530 | 38,110 | ||||||||||
Lorillard, Inc. | 390,690 | 44,539 | ||||||||||
Philip Morris International, Inc. | 276,367 | 21,689 | ||||||||||
Reynolds American, Inc. | 479,177 | 19,848 | ||||||||||
Wal-Mart Stores, Inc. | 185,812 | 11,104 | ||||||||||
|
| |||||||||||
| 164,145 | ||||||||||||
|
| |||||||||||
| FINANCIALS 9.9% | ||||||||||||
Alleghany Corp. (a) | 55,538 | 15,844 | ||||||||||
BankUnited, Inc. | 1,151,768 | 25,327 | ||||||||||
Berkshire Hathaway, Inc. ‘B’ (a) | 517,435 | 39,480 | ||||||||||
Capitol Federal Financial, Inc. | 753,253 | 8,692 | ||||||||||
CBOE Holdings, Inc. | 839,159 | 21,701 | ||||||||||
Northwest Bancshares, Inc. | 1,014,171 | 12,616 | ||||||||||
| SHARES | MARKET VALUE (000S) | |||||||||||
NYSE Euronext | 378,154 | $ | 9,870 | |||||||||
SLM Corp. | 1,232,877 | 16,521 | ||||||||||
TFS Financial Corp. (a) | 1,176,990 | 10,546 | ||||||||||
Transatlantic Holdings, Inc. | 22,888 | 1,253 | ||||||||||
ViewPoint Financial Group | 688,711 | 8,960 | ||||||||||
Washington Federal, Inc. | 774,137 | 10,830 | ||||||||||
White Mountains Insurance Group Ltd. | 65,110 | 29,525 | ||||||||||
|
| |||||||||||
| 211,165 | ||||||||||||
|
| |||||||||||
| HEALTH CARE 3.7% | ||||||||||||
Medco Health Solutions, Inc. (a) | 450,910 | 25,206 | ||||||||||
Pfizer, Inc. | 1,539,871 | 33,323 | ||||||||||
PharMerica Corp. (a) | 216,883 | 3,292 | ||||||||||
Synthes, Inc. | 101,010 | 16,907 | ||||||||||
|
| |||||||||||
| 78,728 | ||||||||||||
|
| |||||||||||
| INDUSTRIALS 4.2% | ||||||||||||
3M Co. | 393,043 | 32,124 | ||||||||||
Deere & Co. | 272,959 | 21,113 | ||||||||||
General Dynamics Corp. | 173,141 | 11,498 | ||||||||||
Goodrich Corp. | 207,289 | 25,642 | ||||||||||
|
| |||||||||||
| 90,377 | ||||||||||||
|
| |||||||||||
| INFORMATION TECHNOLOGY 6.5% | ||||||||||||
Dell, Inc. (a) | 1,657,827 | 24,254 | ||||||||||
Intel Corp. | 1,957,801 | 47,477 | ||||||||||
Microsoft Corp. | 1,981,674 | 51,444 | ||||||||||
Motorola Mobility Holdings, Inc. (a) | 444,490 | 17,246 | ||||||||||
|
| |||||||||||
| 140,421 | ||||||||||||
|
| |||||||||||
Total United States | 684,836 | |||||||||||
|
| |||||||||||
Total Common Stocks (Cost $1,891,605) | 1,858,418 | |||||||||||
|
| |||||||||||
| UNITS | ||||||||||||
| EQUITY-LINKED SECURITIES 1.0% | ||||||||||||
| FRANCE 1.0% | ||||||||||||
| FINANCIALS 1.0% | ||||||||||||
Morgan Stanley BV |
| |||||||||||
Total S.A.–Exp. | 393,174 | 20,666 | ||||||||||
|
| |||||||||||
Total Equity-Linked Securities (Cost $21,458) | 20,666 | |||||||||||
|
| |||||||||||
| SHARES | ||||||||||||
| EXCHANGE-TRADED FUNDS 3.6% | ||||||||||||
| UNITED STATES 3.6% | ||||||||||||
SPDR Gold Trust | 508,726 | 77,321 | ||||||||||
|
| |||||||||||
Total Exchange-Traded Funds |
| 77,321 | ||||||||||
|
| |||||||||||
| SHARES | MARKET VALUE (000S) | |||||||||||
| RIGHTS 0.1% | ||||||||||||
| FRANCE 0.1% | ||||||||||||
| HEALTH CARE 0.1% | ||||||||||||
Sanofi–Exp. 12/31/2020 | 1,305,421 | $ | 1,567 | |||||||||
|
| |||||||||||
Total Rights (Cost $3,149) |
| 1,567 | ||||||||||
|
| |||||||||||
| PRINCIPAL AMOUNT (000S) | ||||||||||||
| SHORT-TERM INSTRUMENTS 7.6% | ||||||||||||
| REPURCHASE AGREEMENTS 0.1% | ||||||||||||
State Street Bank and Trust Co. |
| |||||||||||
0.010% due 01/03/2012 | $ | 915 | 915 | |||||||||
|
| |||||||||||
(Dated 12/30/2011. Collateralized by Freddie Mac 5.500% due 08/20/2012 valued at $938. Repurchase proceeds are $915.) |
| |||||||||||
| U.S. TREASURY BILLS 0.2% | ||||||||||||
0.036% due 05/31/2012 - 06/21/2012 (b) (e) | 2,991 | 2,990 | ||||||||||
|
| |||||||||||
| SHARES | ||||||||||||
| PIMCO SHORT-TERM FLOATING NAV PORTFOLIO (c) 7.3% | ||||||||||||
| 15,585,529 | 156,073 | |||||||||||
|
| |||||||||||
Total Short-Term Instruments |
| 159,978 | ||||||||||
|
| |||||||||||
| PURCHASED OPTIONS (h) 0.3% | ||||||||||||
(Cost $13,372) |
| 7,203 | ||||||||||
| Total Investments 99.3% (Cost $2,162,412) | $ | 2,125,153 | ||||||||||
| Written Options (i) (0.1%) (Premiums $1,817) | (1,121 | ) | ||||||||||
| Other Assets and Liabilities (Net) 0.8% | 16,531 | |||||||||||
|
| |||||||||||
| Net Assets 100.0% | $ | 2,140,563 | ||||||||||
|
| |||||||||||
| See Accompanying Notes | DECEMBER 31, 2011 | SEMIANNUAL REPORT | 59 |
Table of Contents
Consolidated Schedule of Investments PIMCO EqS Pathfinder FundTM (Cont.)
Notes to Schedule of Investments (amounts in thousands*, except shares):
| * | A zero balance may reflect actual amounts rounding to less than one thousand. |
| (a) | Non-income producing security. |
| (b) | Coupon represents a weighted average yield to maturity. |
| (c) | Affiliated to the Fund. |
| (d) | Cash of $13,800 has been pledged as collateral for equity options as of December 31, 2011. |
| (e) | Securities with an aggregate market value of $2,252 have been pledged as collateral as of December 31, 2011 for OTC swap, swaption and foreign currency contracts as governed by International Swaps and Derivatives Association, Inc. Master Agreements. |
| (f) | Cash of $36,938 has been pledged as collateral for securities sold short as of December 31, 2011. |
| (g) | OTC swap agreements outstanding on December 31, 2011: |
| Total Return Swaps on Securities | ||||||||||||||||||||||||||
| Pay/Receive Total Return on Reference Entity (2) | Reference Entity | # of Shares | Financing Rate (1) | Notional | Maturity Date | Counterparty | Unrealized Appreciation/ (Depreciation) | |||||||||||||||||||
| Pay | Rio Tinto Ltd. | 112,288 | 3-Month USD-LIBOR less a specified spread | AUD | 6,866 | 12/20/2012 | CBK | $ | 96 | |||||||||||||||||
| Receive | Rio Tinto Ltd. | 144,162 | 3-Month USD-LIBOR plus a specified spread | 6,866 | 12/20/2012 | CBK | (70 | ) | ||||||||||||||||||
| Receive | Synthes, Inc | 11,899 | 1-Month USD-LIBOR plus a specified spread | CHF | 1,850 | 04/27/2012 | BOA | 25 | ||||||||||||||||||
|
| |||||||||||||||||||||||||
| $ | 51 | |||||||||||||||||||||||||
|
| |||||||||||||||||||||||||
| (1) | Financing rate is based upon predetermined notional amounts, which may be a multiple of the number of shares disclosed. |
| (2) | At the maturity date, a net cash flow is exchanged where the total return is equivalent to the return of the reference index less a financing rate, if any. As a receiver, the Fund would receive payments based on any positive total return and would owe payments in the event of a negative total return. As the payer, the Fund would owe payments on any net positive total return, and would receive payment in the event of a negative total return. |
| (h) | Purchased options outstanding on December 31, 2011: |
| Options on Exchange-Traded Futures Contracts | ||||||||||||||||||||
| Description | Index Value | Expiration Date | # of Contracts | Cost | Market Value | |||||||||||||||
Put - CBOT S&P 500 Index March Futures | 1,125.000 | 03/17/2012 | 464 | $ | 1,718 | $ | 849 | |||||||||||||
|
|
|
| |||||||||||||||||
| Foreign Currency Options | ||||||||||||||||||||||||||
| Description | Counterparty | Exercise Price | Expiration Date | Notional Amount | Cost | Market Value | ||||||||||||||||||||
Put - OTC EUR versus USD | BPS | $ | 1.200 | 03/13/2012 | EUR | 55,721 | $ | 679 | $ | 470 | ||||||||||||||||
Put - OTC EUR versus USD | BOA | 1.205 | 03/13/2012 | 74,900 | 1,545 | 681 | ||||||||||||||||||||
Put - OTC EUR versus USD | MYI | 1.205 | 03/13/2012 | 53,489 | 697 | 486 | ||||||||||||||||||||
|
|
|
| |||||||||||||||||||||||
| $ | 2,921 | $ | 1,637 | |||||||||||||||||||||||
|
|
|
| |||||||||||||||||||||||
| Options on Exchanged-Traded Funds | ||||||||||||||||||||||||
| Description | Strike Price | Expiration Date | # of Contracts | Cost | Market Value | |||||||||||||||||||
Put - CBOE iShares MSCI EAFE Index Fund | $ | 46.000 | 03/17/2012 | 15,259 | $ | 3,668 | $ | 2,213 | ||||||||||||||||
Put - CBOE iShares MSCI EAFE Index Fund | 48.000 | 03/17/2012 | 11,579 | 2,872 | 2,350 | |||||||||||||||||||
|
|
|
| |||||||||||||||||||||
| $ | 6,540 | $ | 4,563 | |||||||||||||||||||||
|
|
|
| |||||||||||||||||||||
| Options on Securities | ||||||||||||||||||||||||||||
| Description | Counterparty | Strike Price | Expiration Date | # of Contracts | Cost | Market Value | ||||||||||||||||||||||
Put - OTC Johnson & Johnson, Inc. | FBF | CHF | 68.878 | 03/16/2012 | 22,211 | $ | 2,193 | $ | 154 | |||||||||||||||||||
|
|
|
| |||||||||||||||||||||||||
| (i) | Written options outstanding on December 31, 2011: |
| Options on Exchanged-Traded Funds | ||||||||||||||||||||||||
| Description | Strike Price | Expiration Date | # of Contracts | Premium | Market Value | |||||||||||||||||||
Put - CBOE iShares MSCI EAFE Index Fund | $ | 36.000 | 03/17/2012 | 15,259 | $ | 1,150 | $ | (412 | ) | |||||||||||||||
|
|
|
| |||||||||||||||||||||
| Options on Securities | ||||||||||||||||||||||||||||
| Description | Counterparty | Strike Price | Expiration Date | # of Contracts | Premium | Market Value | ||||||||||||||||||||||
Call - OTC Johnson & Johnson, Inc. | FBF | CHF | 67.610 | 03/16/2012 | 19,305 | $ | 667 | $ | (709 | ) | ||||||||||||||||||
|
|
|
| |||||||||||||||||||||||||
| 60 | PIMCO EQUITY SERIES | See Accompanying Notes |
Table of Contents
December 31, 2011 (Unaudited)
Transactions in written call and put options for the period ended December 31, 2011:
| # of Contracts | Notional Amount in CHF | Notional Amount in EUR | Premium | |||||||||||||
Balance at 06/30/2011 | 0 | CHF | 28 | EUR | 186 | $ | 699 | |||||||||
Sales | 36,018 | 19,305 | 0 | 5,730 | ||||||||||||
Closing Buys | (19,247 | ) | (28 | ) | (186 | ) | (4,290 | ) | ||||||||
Expirations | 0 | 0 | 0 | 0 | ||||||||||||
Exercised | (1,512 | ) | 0 | 0 | (322 | ) | ||||||||||
|
|
|
|
|
|
|
| |||||||||
Balance at 12/31/2011 | 15,259 | CHF | 19,305 | EUR | 0 | $ | 1,817 | |||||||||
|
|
|
|
|
|
|
| |||||||||
| (j) | Short sales outstanding on December 31, 2011: |
| Description | Shares | Proceeds | Market Value) | |||||||||
Deutsche Boerse AG | 178 | $ | 10,112 | $ | (9,302 | ) | ||||||
Express Scripts, Inc. | 365,236 | 17,245 | (16,322 | ) | ||||||||
Temple-Inland, Inc. | 318,661 | 10,038 | (10,105 | ) | ||||||||
|
|
|
| |||||||||
| $ | 37,395 | $ | (35,729 | ) | ||||||||
|
|
|
| |||||||||
| (k) | Foreign currency contracts outstanding on December 31, 2011: |
| Type | Currency | Principal Amount Covered by Contract | Settlement Month | Counterparty | Unrealized Appreciation | Unrealized (Depreciation) | Net Unrealized Appreciation/ (Depreciation) | |||||||||||||||||||
Buy | AUD | 23,078 | 01/2012 | BRC | $ | 592 | $ | 0 | $ | 592 | ||||||||||||||||
Buy | 23,078 | 01/2012 | CBK | 615 | 0 | 615 | ||||||||||||||||||||
Buy | 23,078 | 01/2012 | DUB | 615 | 0 | 615 | ||||||||||||||||||||
Sell | 23,078 | 01/2012 | DUB | 0 | (362 | ) | (362 | ) | ||||||||||||||||||
Sell | 23,078 | 01/2012 | FBL | 0 | (375 | ) | (375 | ) | ||||||||||||||||||
Sell | 23,078 | 01/2012 | HUS | 0 | (375 | ) | (375 | ) | ||||||||||||||||||
Buy | 23,078 | 02/2012 | DUB | 363 | 0 | 363 | ||||||||||||||||||||
Buy | 23,078 | 02/2012 | FBL | 375 | 0 | 375 | ||||||||||||||||||||
Buy | 23,078 | 02/2012 | HUS | 375 | 0 | 375 | ||||||||||||||||||||
Buy | BRL | 28,563 | 01/2012 | HUS | 86 | 0 | 86 | |||||||||||||||||||
Sell | 28,563 | 01/2012 | HUS | 0 | (412 | ) | (412 | ) | ||||||||||||||||||
Buy | 28,563 | 01/2012 | MSC | 0 | (586 | ) | (586 | ) | ||||||||||||||||||
Sell | 28,563 | 01/2012 | MSC | 0 | (86 | ) | (86 | ) | ||||||||||||||||||
Sell | 28,563 | 03/2012 | MSC | 602 | 0 | 602 | ||||||||||||||||||||
Sell | CAD | 47,459 | 01/2012 | CBK | 0 | (17 | ) | (17 | ) | |||||||||||||||||
Sell | 47,459 | 01/2012 | GST | 3 | 0 | 3 | ||||||||||||||||||||
Buy | 142,378 | 01/2012 | RBC | 1,477 | 0 | 1,477 | ||||||||||||||||||||
Sell | 47,460 | 01/2012 | UAG | 0 | (10 | ) | (10 | ) | ||||||||||||||||||
Buy | 47,459 | 02/2012 | CBK | 16 | 0 | 16 | ||||||||||||||||||||
Buy | 47,459 | 02/2012 | GST | 0 | (5 | ) | (5 | ) | ||||||||||||||||||
Buy | 47,460 | 02/2012 | UAG | 10 | 0 | 10 | ||||||||||||||||||||
Buy | CHF | 35,048 | 01/2012 | BRC | 0 | (210 | ) | (210 | ) | |||||||||||||||||
Sell | 15,411 | 01/2012 | BRC | 353 | 0 | 353 | ||||||||||||||||||||
Sell | 16,114 | 01/2012 | DUB | 379 | 0 | 379 | ||||||||||||||||||||
Sell | 1,977 | 01/2012 | JPM | 32 | 0 | 32 | ||||||||||||||||||||
Sell | 1,546 | 01/2012 | UAG | 31 | 0 | 31 | ||||||||||||||||||||
Sell | 25,489 | 02/2012 | BRC | 96 | 0 | 96 | ||||||||||||||||||||
Buy | CNY | 284,350 | 02/2012 | DUB | 296 | 0 | 296 | |||||||||||||||||||
Buy | 97,617 | 02/2012 | JPM | 99 | 0 | 99 | ||||||||||||||||||||
Buy | DKK | 251,667 | 01/2012 | BRC | 0 | (417 | ) | (417 | ) | |||||||||||||||||
Sell | 238,266 | 01/2012 | BRC | 1,192 | 0 | 1,192 | ||||||||||||||||||||
Sell | 9,639 | 01/2012 | JPM | 55 | 0 | 55 | ||||||||||||||||||||
Sell | 3,762 | 01/2012 | UAG | 19 | 0 | 19 | ||||||||||||||||||||
Sell | 251,667 | 02/2012 | BRC | 426 | 0 | 426 | ||||||||||||||||||||
Buy | EUR | 42,342 | 01/2012 | BRC | 0 | (523 | ) | (523 | ) | |||||||||||||||||
Sell | 678 | 01/2012 | BRC | 21 | 0 | 21 | ||||||||||||||||||||
Buy | 59,978 | 01/2012 | CBK | 0 | (715 | ) | (715 | ) | ||||||||||||||||||
Sell | 98 | 01/2012 | CBK | 5 | 0 | 5 | ||||||||||||||||||||
Sell | 1,005 | 01/2012 | DUB | 39 | 0 | 39 | ||||||||||||||||||||
Sell | 82,976 | 01/2012 | FBL | 3,458 | 0 | 3,458 | ||||||||||||||||||||
Buy | 8,892 | 01/2012 | JPM | 0 | (90 | ) | (90 | ) | ||||||||||||||||||
Sell | 20,356 | 01/2012 | JPM | 497 | 0 | 497 | ||||||||||||||||||||
| See Accompanying Notes | DECEMBER 31, 2011 | SEMIANNUAL REPORT | 61 |
Table of Contents
Consolidated Schedule of Investments PIMCO EqS Pathfinder FundTM (Cont.)
| Type | Currency | Principal Amount Covered by Contract | Settlement Month | Counterparty | Unrealized Appreciation | Unrealized (Depreciation) | Net Unrealized Appreciation/ (Depreciation) | |||||||||||||||||||
Sell | EUR | 23,011 | 01/2012 | RBC | $ | 969 | $ | 0 | $ | 969 | ||||||||||||||||
Buy | 25,085 | 01/2012 | UAG | 0 | (245 | ) | (245 | ) | ||||||||||||||||||
Sell | 8,173 | 01/2012 | UAG | 307 | 0 | 307 | ||||||||||||||||||||
Sell | 42,342 | 02/2012 | BRC | 527 | 0 | 527 | ||||||||||||||||||||
Sell | 59,978 | 02/2012 | CBK | 722 | 0 | 722 | ||||||||||||||||||||
Sell | 8,892 | 02/2012 | JPM | 92 | 0 | 92 | ||||||||||||||||||||
Buy | 7,685 | 02/2012 | MSC | 0 | (111 | ) | (111 | ) | ||||||||||||||||||
Sell | 25,085 | 02/2012 | UAG | 248 | 0 | 248 | ||||||||||||||||||||
Buy | GBP | 6,239 | 01/2012 | BRC | 55 | 0 | 55 | |||||||||||||||||||
Sell | 928 | 01/2012 | BRC | 14 | 0 | 14 | ||||||||||||||||||||
Buy | 55,798 | 01/2012 | CBK | 0 | (837 | ) | (837 | ) | ||||||||||||||||||
Sell | 115 | 01/2012 | CBK | 2 | 0 | 2 | ||||||||||||||||||||
Sell | 101,328 | 01/2012 | DUB | 211 | 0 | 211 | ||||||||||||||||||||
Buy | 55,797 | 01/2012 | GST | 653 | 0 | 653 | ||||||||||||||||||||
Sell | 241 | 01/2012 | GST | 3 | 0 | 3 | ||||||||||||||||||||
Sell | 9,703 | 01/2012 | JPM | 95 | 0 | 95 | ||||||||||||||||||||
Sell | 446 | 01/2012 | RBC | 3 | 0 | 3 | ||||||||||||||||||||
Sell | 5,073 | 01/2012 | UAG | 0 | (11 | ) | (11 | ) | ||||||||||||||||||
Sell | 58,384 | 02/2012 | CBK | 876 | 0 | 876 | ||||||||||||||||||||
Sell | 55,797 | 02/2012 | GST | 0 | (652 | ) | (652 | ) | ||||||||||||||||||
Buy | 13,806 | 02/2012 | MSC | 0 | (178 | ) | (178 | ) | ||||||||||||||||||
Sell | HKD | 101,372 | 02/2012 | UAG | 0 | (35 | ) | (35 | ) | |||||||||||||||||
Sell | JPY | 55,026 | 01/2012 | DUB | 0 | (8 | ) | (8 | ) | |||||||||||||||||
Sell | 105,013 | 01/2012 | JPM | 0 | (10 | ) | (10 | ) | ||||||||||||||||||
Buy | 12,479,271 | 01/2012 | UAG | 0 | (395 | ) | (395 | ) | ||||||||||||||||||
Sell | 12,319,232 | 01/2012 | UAG | 0 | (1,463 | ) | (1,463 | ) | ||||||||||||||||||
Buy | 845,121 | 02/2012 | DUB | 138 | 0 | 138 | ||||||||||||||||||||
Buy | 12,319,232 | 02/2012 | UAG | 1,451 | 0 | 1,451 | ||||||||||||||||||||
Buy | KRW | 19,349,400 | 02/2012 | CBK | 0 | (1,246 | ) | (1,246 | ) | |||||||||||||||||
Sell | 6,511,598 | 02/2012 | CBK | 230 | 0 | 230 | ||||||||||||||||||||
Buy | NOK | 4,992 | 01/2012 | BRC | 0 | (7 | ) | (7 | ) | |||||||||||||||||
Sell | 798 | 01/2012 | BRC | 4 | 0 | 4 | ||||||||||||||||||||
Sell | 358 | 01/2012 | CBK | 2 | 0 | 2 | ||||||||||||||||||||
Sell | 4,016 | 01/2012 | DUB | 14 | 0 | 14 | ||||||||||||||||||||
Sell | 118,612 | 01/2012 | FBL | 262 | 0 | 262 | ||||||||||||||||||||
Buy | 130,641 | 01/2012 | GST | 0 | (118 | ) | (118 | ) | ||||||||||||||||||
Sell | 118,611 | 01/2012 | GST | 269 | 0 | 269 | ||||||||||||||||||||
Buy | 130,641 | 01/2012 | HUS | 0 | (108 | ) | (108 | ) | ||||||||||||||||||
Sell | 24,415 | 01/2012 | JPM | 145 | (1 | ) | 144 | |||||||||||||||||||
Buy | 130,640 | 01/2012 | MSC | 0 | (118 | ) | (118 | ) | ||||||||||||||||||
Sell | 130,104 | 01/2012 | UAG | 441 | 0 | 441 | ||||||||||||||||||||
Sell | 2,618 | 02/2012 | CBK | 0 | 0 | 0 | ||||||||||||||||||||
Sell | 130,641 | 02/2012 | GST | 116 | 0 | 116 | ||||||||||||||||||||
Sell | 130,641 | 02/2012 | HUS | 107 | 0 | 107 | ||||||||||||||||||||
Buy | 7,726 | 02/2012 | MSC | 11 | 0 | 11 | ||||||||||||||||||||
Sell | 130,640 | 02/2012 | MSC | 117 | 0 | 117 | ||||||||||||||||||||
Sell | PLN | 2,574 | 02/2012 | CBK | 93 | 0 | 93 | |||||||||||||||||||
Buy | SEK | 8,599 | 01/2012 | BRC | 9 | 0 | 9 | |||||||||||||||||||
Sell | 21,142 | 01/2012 | BRC | 3 | 0 | 3 | ||||||||||||||||||||
Buy | 1,131 | 01/2012 | DUB | 1 | 0 | 1 | ||||||||||||||||||||
Sell | 1,163 | 01/2012 | DUB | 0 | (1 | ) | (1 | ) | ||||||||||||||||||
Buy | 8,600 | 01/2012 | GST | 11 | 0 | 11 | ||||||||||||||||||||
Sell | 2,845 | 01/2012 | JPM | 8 | 0 | 8 | ||||||||||||||||||||
Sell | 1,779 | 01/2012 | RBC | 0 | 0 | 0 | ||||||||||||||||||||
Buy | 8,599 | 01/2012 | UAG | 9 | 0 | 9 | ||||||||||||||||||||
Buy | 21,142 | 02/2012 | BRC | 0 | (4 | ) | (4 | ) | ||||||||||||||||||
Buy | SGD | 2,183 | 02/2012 | JPM | 8 | 0 | 8 | |||||||||||||||||||
Sell | ZAR | 134,305 | 01/2012 | HUS | 428 | 0 | 428 | |||||||||||||||||||
Sell | 12,749 | 01/2012 | JPM | 26 | 0 | 26 | ||||||||||||||||||||
|
|
|
|
|
| |||||||||||||||||||||
| $ | 20,807 | $ | (9,731 | ) | $ | 11,076 | ||||||||||||||||||||
|
|
|
|
|
| |||||||||||||||||||||
| 62 | PIMCO EQUITY SERIES | See Accompanying Notes |
Table of Contents
December 31, 2011 (Unaudited)
| (l) | Fair Value Measurements (1) |
The following is a summary of the fair valuations according to the inputs used as of December 31, 2011 in valuing the Fund’s assets and liabilities (2):
| Category and Subcategory (3) | Level 1 (4) | Level 2 (5) | Level 3 (6) | Fair Value at 12/31/2011 | ||||||||||||
Investments, at value | ||||||||||||||||
Common Stocks | ||||||||||||||||
Bermuda | ||||||||||||||||
Energy | $ | 22,759 | $ | 35,692 | $ | 0 | $ | 58,451 | ||||||||
Financials | 0 | 71,552 | 0 | 71,552 | ||||||||||||
Brazil | ||||||||||||||||
Financials | 21,244 | 0 | 0 | 21,244 | ||||||||||||
Canada | ||||||||||||||||
Materials | 32,082 | 0 | 0 | 32,082 | ||||||||||||
Denmark | ||||||||||||||||
Consumer Staples | 0 | 33,015 | 0 | 33,015 | ||||||||||||
Financials | 0 | 8,606 | 0 | 8,606 | ||||||||||||
Faeroe Islands | ||||||||||||||||
Consumer Staples | 4,962 | 0 | 0 | 4,962 | ||||||||||||
Financials | 3,295 | 0 | 0 | 3,295 | ||||||||||||
France | ||||||||||||||||
Consumer Discretionary | 0 | 62,181 | 0 | 62,181 | ||||||||||||
Consumer Staples | 0 | 139,025 | 0 | 139,025 | ||||||||||||
Energy | 0 | 10,330 | 0 | 10,330 | ||||||||||||
Germany | ||||||||||||||||
Health Care | 0 | 9,794 | 0 | 9,794 | ||||||||||||
Industrials | 0 | 4,905 | 0 | 4,905 | ||||||||||||
Utilities | 0 | 13,544 | 0 | 13,544 | ||||||||||||
Guernsey, Channel Islands | ||||||||||||||||
Financials | 0 | 20,026 | 0 | 20,026 | ||||||||||||
Hong Kong | ||||||||||||||||
Consumer Discretionary | 0 | 8,102 | 0 | 8,102 | ||||||||||||
Financials | 0 | 48,936 | 0 | 48,936 | ||||||||||||
Industrials | 0 | 6,865 | 0 | 6,865 | ||||||||||||
Israel | ||||||||||||||||
Health Care | 12,712 | 0 | 0 | 12,712 | ||||||||||||
Japan | ||||||||||||||||
Information Technology | 0 | 31,912 | 0 | 31,912 | ||||||||||||
Netherlands | ||||||||||||||||
Consumer Staples | 0 | 26,560 | 0 | 26,560 | ||||||||||||
Energy | 0 | 18,577 | 0 | 18,577 | ||||||||||||
Financials | 0 | 28,141 | 0 | 28,141 | ||||||||||||
Information Technology | 0 | 11,067 | 0 | 11,067 | ||||||||||||
Telecommunication Services | 0 | 39,911 | 0 | 39,911 | ||||||||||||
Norway | ||||||||||||||||
Consumer Staples | 0 | 20,088 | 0 | 20,088 | ||||||||||||
Industrials | 0 | 10,824 | 0 | 10,824 | ||||||||||||
Singapore | ||||||||||||||||
Financials | 0 | 828 | 0 | 828 | ||||||||||||
Industrials | 0 | 14,261 | 0 | 14,261 | ||||||||||||
South Africa | ||||||||||||||||
Materials | 20,145 | 0 | 0 | 20,145 | ||||||||||||
South Korea | ||||||||||||||||
Consumer Discretionary | 0 | 9,931 | 0 | 9,931 | ||||||||||||
Spain | ||||||||||||||||
Consumer Staples | 0 | 5,096 | 0 | 5,096 | ||||||||||||
| Category and Subcategory (3) | Level 1 (4) | Level 2 (5) | Level 3 (6) | Fair Value at 12/31/2011 | ||||||||||||
Sweden | ||||||||||||||||
Consumer Discretionary | $ | 0 | $ | 20,071 | $ | 0 | $ | 20,071 | ||||||||
Switzerland | ||||||||||||||||
Consumer Staples | 0 | 29,066 | 0 | 29,066 | ||||||||||||
Health Care | 0 | 36,158 | 0 | 36,158 | ||||||||||||
Industrials | 0 | 12,121 | 0 | 12,121 | ||||||||||||
Materials | 0 | 9,418 | 0 | 9,418 | ||||||||||||
United Kingdom | ||||||||||||||||
Consumer Discretionary | 0 | 9,856 | 0 | 9,856 | ||||||||||||
Consumer Staples | 0 | 158,260 | 0 | 158,260 | ||||||||||||
Energy | 16,499 | 41,040 | 0 | 57,539 | ||||||||||||
Financials | 0 | 34,125 | 0 | 34,125 | ||||||||||||
United States | ||||||||||||||||
Consumer Staples | 164,145 | 0 | 0 | 164,145 | ||||||||||||
Financials | 211,165 | 0 | 0 | 211,165 | ||||||||||||
Health Care | 61,821 | 16,907 | 0 | 78,728 | ||||||||||||
Industrials | 90,377 | 0 | 0 | 90,377 | ||||||||||||
Information Technology | 140,421 | 0 | 0 | 140,421 | ||||||||||||
Equity-Linked Securities | ||||||||||||||||
France | 0 | 20,666 | 0 | 20,666 | ||||||||||||
Exchange-Traded Funds | ||||||||||||||||
United States | 77,321 | 0 | 0 | 77,321 | ||||||||||||
Rights | ||||||||||||||||
France | ||||||||||||||||
Health Care | 1,567 | 0 | 0 | 1,567 | ||||||||||||
Short-Term Instruments | ||||||||||||||||
Repurchase Agreements | 0 | 915 | 0 | 915 | ||||||||||||
U.S. Treasury Bills | 0 | 2,990 | 0 | 2,990 | ||||||||||||
PIMCO Short-Term Floating NAV Portfolio | 156,073 | 0 | 0 | 156,073 | ||||||||||||
Purchased Options | ||||||||||||||||
Equity Contracts | 5,412 | 0 | 154 | 5,566 | ||||||||||||
Foreign Exchange Contracts | 0 | 1,637 | 0 | 1,637 | ||||||||||||
| $ | 1,042,000 | $ | 1,082,999 | $ | 154 | $ | 2,125,153 | |||||||||
Short Sales, at value | $ | (26,427 | ) | $ | (9,302 | ) | $ | 0 | $ | (35,729 | ) | |||||
Financial Derivative Instruments (7) - Assets |
| |||||||||||||||
Equity Contracts | 0 | 121 | 0 | 121 | ||||||||||||
Foreign Exchange Contracts | 0 | 20,807 | 0 | 20,807 | ||||||||||||
| $ | 0 | $ | 20,928 | $ | 0 | $ | 20,928 | |||||||||
Financial Derivative Instruments (7) - Liabilities |
| |||||||||||||||
Equity Contracts | (412 | ) | (70 | ) | (709 | ) | (1,191 | ) | ||||||||
Foreign Exchange Contracts | 0 | (9,731 | ) | 0 | (9,731 | ) | ||||||||||
| $ | (412 | ) | $ | (9,801 | ) | $ | (709 | ) | $ | (10,922 | ) | |||||
Totals | $ | 1,015,161 | $ | 1,084,824 | $ | (555 | ) | $ | 2,099,430 | |||||||
The following is a reconciliation of the fair valuations using significant unobservable inputs (Level 3) for the Fund during the period ending December 31, 2011:
| Category and Subcategory (3) | Beginning Balance at 06/30/2011 | Net Purchases (8) | Net Sales (8) | Accrued Discounts/ (Premiums) | Realized Gain/(Loss) | Net Change in Unrealized Appreciation/ (Depreciation) (9) | Transfers into Level 3 | Transfers out of Level 3 | Ending Balance at 12/31/2011 | Net Change in Unrealized Appreciation/ (Depreciation) on Investments Held at 12/31/2011 (9) | ||||||||||||||||||||||||||||||
Investments, at value | ||||||||||||||||||||||||||||||||||||||||
Purchased Options | ||||||||||||||||||||||||||||||||||||||||
Equity Contracts | $ | 0 | $ | 2,193 | $ | 0 | $ | 0 | $ | 0 | $ | (2,039 | ) | $ | 0 | $ | 0 | $ | 154 | $ | (2,039 | ) | ||||||||||||||||||
|
|
|
|
|
|
|
|
|
|
|
|
|
|
|
|
|
|
|
| |||||||||||||||||||||
| See Accompanying Notes | DECEMBER 31, 2011 | SEMIANNUAL REPORT | 63 |
Table of Contents
Consolidated Schedule of Investments PIMCO EqS Pathfinder FundTM (Cont.)
| Category and Subcategory (3) | Beginning Balance at 06/30/2011 | Net Purchases (8) | Net Sales (8) | Accrued Discounts/ (Premiums) | Realized Gain/(Loss) | Net Change in Unrealized Appreciation/ (Depreciation) (9) | Transfers into Level 3 | Transfers out of Level 3 | Ending Balance at 12/31/2011 | Net Change in Unrealized Appreciation/ (Depreciation) on Investments Held at 12/31/2011 (9) | ||||||||||||||||||||||||||||||
Financial Derivative Instruments (7) - Liabilities |
| |||||||||||||||||||||||||||||||||||||||
Equity Contracts | $ | 0 | $ | 0 | $ | (667 | ) | $ | 0 | $ | 0 | $ | (42 | ) | $ | 0 | $ | 0 | $ | (709 | ) | $ | (42 | ) | ||||||||||||||||
Totals | $ | 0 | $ | 2,193 | $ | (667 | ) | $ | 0 | $ | 0 | $ | (2,081 | ) | $ | 0 | $ | 0 | $ | (555 | ) | $ | (2,081 | ) | ||||||||||||||||
| (1) | See note 3 in the Notes to Financial Statements for more information regarding pricing inputs and valuation techniques. |
| (2) | There were no significant transfers into or out of level 1, 2, and 3 during the period ended December 31, 2011. |
| (3) | Refer to the Schedule of Investments for additional information. |
| (4) | Quoted prices in active markets for identical investments. |
| (5) | Significant other observable inputs. |
| (6) | Significant unobservable inputs. |
| (7) | Financial Derivative Instruments may include open futures contracts, swap agreements, written options, and foreign currency contracts. |
| (8) | Net Purchases and Sales for Financial Derivative Instruments may include payments made or received upon entering into swap agreements to compensate for differences between the stated terms of the swap agreement and prevailing market conditions. |
| (9) | Any difference between Net Change in Unrealized Appreciation/(Depreciation) and Net Change in Unrealized Appreciation/(Depreciation) on Investments Held at 12/31/2011 may be due to an investment no longer held or categorized as level 3 at period end. |
| (m) | Fair Value of Financial Derivative Instruments (1) |
The following is a summary of the fair valuation of the Fund’s derivative instruments categorized by risk exposure:
Fair Values of Financial Derivative Instruments on the Statements of Assets and Liabilities as of December 31, 2011:
| Derivatives not accounted for as hedging instruments | ||||||||||||||||||||||||
| Commodity Contracts | Credit Contracts | Equity Contracts | Foreign Exchange Contracts | Interest Rate Contracts | Total | |||||||||||||||||||
Assets: | ||||||||||||||||||||||||
Investments, at value (purchased options) | $ | 0 | $ | 0 | $ | 5,566 | $ | 1,637 | $ | 0 | $ | 7,203 | ||||||||||||
Unrealized appreciation on foreign currency contracts | 0 | 0 | 0 | 20,807 | 0 | 20,807 | ||||||||||||||||||
Unrealized appreciation on OTC swap agreements | 0 | 0 | 121 | 0 | 0 | 121 | ||||||||||||||||||
|
|
|
|
|
|
|
|
|
|
|
| |||||||||||||
| $ | 0 | $ | 0 | $ | 5,687 | $ | 22,444 | $ | 0 | $ | 28,131 | |||||||||||||
|
|
|
|
|
|
|
|
|
|
|
| |||||||||||||
Liabilities: | ||||||||||||||||||||||||
Written options outstanding | $ | 0 | $ | 0 | $ | 1,121 | $ | 0 | $ | 0 | $ | 1,121 | ||||||||||||
Unrealized depreciation on foreign currency contracts | 0 | 0 | 0 | 9,731 | 0 | 9,731 | ||||||||||||||||||
Unrealized depreciation on OTC swap agreements | 0 | 0 | 70 | 0 | 0 | 70 | ||||||||||||||||||
|
|
|
|
|
|
|
|
|
|
|
| |||||||||||||
| $ | 0 | $ | 0 | $ | 1,191 | $ | 9,731 | $ | 0 | $ | 10,922 | |||||||||||||
|
|
|
|
|
|
|
|
|
|
|
| |||||||||||||
The Effect of Financial Derivative Instruments on the Statements of Operations for the Period Ended December 31, 2011:
| Derivatives not accounted for as hedging instruments | ||||||||||||||||||||||||
| Commodity Contracts | Credit Contracts | Equity Contracts | Foreign Exchange Contracts | Interest Rate Contracts | Total | |||||||||||||||||||
Realized Gain (Loss) on Derivatives Recognized as a Result from Operations: | ||||||||||||||||||||||||
Net realized gain (loss) on investments (purchased options) | $ | 0 | $ | 0 | $ | 5,085 | $ | 0 | $ | (1,691 | ) | $ | 3,394 | |||||||||||
Net realized (loss) on futures contracts, written options and swaps | 0 | 0 | (5,271 | ) | 0 | 0 | (5,271 | ) | ||||||||||||||||
Net realized gain on foreign currency transactions | 0 | 0 | 0 | 22,058 | 0 | 22,058 | ||||||||||||||||||
|
|
|
|
|
|
|
|
|
|
|
| |||||||||||||
| $ | 0 | $ | 0 | $ | (186 | ) | $ | 22,058 | $ | (1,691 | ) | $ | 20,181 | |||||||||||
|
|
|
|
|
|
|
|
|
|
|
| |||||||||||||
Net Change in Unrealized Appreciation (Depreciation) on Derivatives Recognized as a Result of Operations: | ||||||||||||||||||||||||
Net change in unrealized (depreciation) on investments (purchased options) | $ | 0 | $ | 0 | $ | (3,243 | ) | $ | (511 | ) | $ | 0 | $ | (3,754 | ) | |||||||||
Net change in unrealized appreciation on futures contracts, written options and swap | 0 | 0 | 487 | 0 | 0 | 487 | ||||||||||||||||||
Net change in unrealized appreciation on translation of assets and liabilities denominated in foreign currencies | 0 | 0 | 0 | 11,264 | 0 | 11,264 | ||||||||||||||||||
|
|
|
|
|
|
|
|
|
|
|
| |||||||||||||
| $ | 0 | $ | 0 | $ | (2,756 | ) | $ | 10,753 | $ | 0 | $ | 7,997 | ||||||||||||
|
|
|
|
|
|
|
|
|
|
|
| |||||||||||||
| (1) | See note 5 in the Notes to Financial Statements for additional information. |
| 64 | PIMCO EQUITY SERIES | See Accompanying Notes |
Table of Contents
December 31, 2011 (Unaudited)
| (n) | Collateral (Received)/Pledged for OTC Financial Derivative Instruments |
The following is a summary by counterparty of the market value of OTC financial derivative instruments and collateral (received)/pledged as of December 31, 2011:
Counterparty | Total Market Value of OTC Derivatives | Collateral (Received)/Pledged | Net Exposures (1) | Total Market Value of OTC Derivatives | Collateral (Received)/Pledged | Net Exposures (1) | ||||||||||||||||||||||
| PIMCO EqS Pathfinder FundTM | PIMCO Cayman Commodity Fund VI Ltd. (Subsidiary) | |||||||||||||||||||||||||||
BOA | $ | 706 | $ | (820 | ) | $ | (114 | ) | $ | 0 | $ | 0 | $ | 0 | ||||||||||||||
BPS | 470 | (610 | ) | (140 | ) | 0 | 0 | 0 | ||||||||||||||||||||
BRC | 2,131 | (1,610 | ) | 521 | 0 | 0 | 0 | |||||||||||||||||||||
CBK | (228 | ) | 641 | 413 | 0 | 0 | 0 | |||||||||||||||||||||
DUB | 1,685 | (2,690 | ) | (1,005 | ) | 0 | 0 | 0 | ||||||||||||||||||||
FBF | (555 | ) | 280 | (275 | ) | 0 | 0 | 0 | ||||||||||||||||||||
FBL | 3,720 | (3,810 | ) | (90 | ) | 0 | 0 | 0 | ||||||||||||||||||||
GST | 280 | (400 | ) | (120 | ) | 0 | 0 | 0 | ||||||||||||||||||||
HUS | 101 | (360 | ) | (259 | ) | 0 | 0 | 0 | ||||||||||||||||||||
JPM | 956 | (1,050 | ) | (94 | ) | 0 | 0 | 0 | ||||||||||||||||||||
MSC | (349 | ) | 381 | 32 | 0 | 0 | 0 | |||||||||||||||||||||
MYI | 486 | (400 | ) | 86 | 0 | 0 | 0 | |||||||||||||||||||||
RBC | 2,449 | (2,090 | ) | 359 | 0 | 0 | 0 | |||||||||||||||||||||
UAG | 357 | 950 | 1,307 | 0 | 0 | 0 | ||||||||||||||||||||||
| (1) | Net Exposure represents the net receivable/(payable) that would be due from/to the counterparty in the event of default. Exposure from OTC derivatives can only be netted across transactions governed under the same Master Agreement with the same legal entity. The Fund and subsidiary are recognized as two separate legal entities. As such, exposure cannot be netted. See note 6 Principal Risks in the Notes to Financial Statements for more information regarding Credit and Counterparties Risk. |
| See Accompanying Notes | DECEMBER 31, 2011 | SEMIANNUAL REPORT | 65 |
Table of Contents
1. ORGANIZATION
PIMCO Equity Series (the “Trust”) was established as a Delaware statutory trust on December 28, 2009. The Trust is registered under the Investment Company Act of 1940, as amended (the “Act”), as an open-end management investment company. Information presented in these financial statements pertains to the Institutional Class, Class P, Administrative Class, Class D, Class A, Class C and Class R shares of the five funds (the “Funds”) offered by the Trust.
2. SIGNIFICANT ACCOUNTING POLICIES
The following is a summary of significant accounting policies consistently followed by the Trust in the preparation of its financial statements in conformity with accounting principles generally accepted in the United States of America (“U.S. GAAP”). The preparation of financial statements in accordance with U.S. GAAP may require management to make estimates and assumptions that affect the reported amounts of assets and liabilities and disclosure of contingent assets and liabilities at the date of the financial statements and the reported amounts of increases and decreases in net assets from operations during the reporting period. Actual results could differ from those estimates.
(a) Determination of Net Asset Value The Net Asset Value (“NAV”) of a Fund’s shares is valued as of the close of regular trading (normally 4:00 p.m., Eastern time) (the “NYSE Close”) on each day that the New York Stock Exchange (“NYSE”) is open. Information that becomes known to a Fund or its agents after the NAV has been calculated on a particular day will not generally be used to retroactively adjust the price of a security or the NAV determined earlier that day.
(b) Securities Transactions and Investment Income Securities transactions are recorded as of the trade date for financial reporting purposes. Securities purchased or sold on a when-issued or delayed-delivery basis may be settled a month or more after the trade date. Realized gains and losses from securities sold are recorded on the identified cost basis. Dividend income is recorded on the ex-dividend date, except certain dividends from foreign securities where the ex-dividend date may have passed, which are recorded as soon as the Fund is informed of the ex-dividend date. Interest income, adjusted for the accretion of discounts and amortization of premiums, is recorded on the accrual basis from settlement date. Estimated tax liabilities on certain foreign securities are recorded on an accrual basis and are reflected as components of interest income or a net change in unrealized gain/loss on investments on the Statements of Operations, as appropriate. Tax liabilities realized as a result of such security sales are reflected as a component of net realized gain/loss on investments on the Statements of Operations. Income or short-term capital gain distributions received from underlying funds are recorded as dividend income. Long-term capital gain distributions received from underlying funds are recorded as realized gains.
Dividends received from real estate investment trust securities may include a return of capital invested. Such distributions reduce the cost basis of the respective securities. Return of capital distributions, if any, in excess of the cost basis of the security are recognized as capital gain.
(c) Foreign Currency Translation Portfolio securities and other assets and liabilities denominated in foreign currencies are translated into U.S. dollars based on the exchange rate of such currencies against U.S. dollars on the date of valuation. Purchases and sales of securities, income and expense items denominated in foreign currencies are translated into U.S. dollars at the exchange rate in effect on the transaction date.
A Fund does not separately report the effect of changes in foreign exchange rates from changes in market prices on securities held. Such changes are included in net realized and unrealized gain or loss from investments on the Statements of Operations.
Realized foreign exchange gains or losses arise from sales of foreign currencies, currency gains or losses realized between the trade and settlement dates on securities transactions and the difference between the recorded amounts of dividend, interest, and foreign withholding taxes and the U.S. dollar equivalent of the amounts actually received or paid. Net unrealized foreign exchange gains
and losses arise from changes in foreign exchange rates on foreign denominated assets and liabilities other than investments in securities held at the end of the reporting period.
(d) Multiclass Operations Each class offered by the Trust has equal rights as to assets and voting privileges (except that shareholders of a class have exclusive voting rights regarding any matter relating solely to that class of shares). For daily dividend funds, income and non-class specific expenses are allocated daily to each class on the basis of the relative value of settled shares. For non-daily dividend funds, income and non-class specific expenses are allocated daily to each class on the basis of the relative net assets. Realized and unrealized capital gains and losses of each class are allocated daily based on the relative net assets of each class of the respective Fund. Class specific expenses, where applicable, currently include supervisory and administrative and distribution and servicing fees.
(e) Dividends and Distributions to Shareholders Dividends from net investment income, if any, of each Fund, except the PIMCO Dividend and Income Builder Fund and PIMCO EqS Dividend Fund, are declared and distributed to shareholders annually. Dividends from net investment income, if any, of the PIMCO Dividend and Income Builder Fund and PIMCO EqS Dividend Fund are declared daily and distributed to shareholders quarterly. Net realized capital gains earned by each Fund, if any, will be distributed no less frequently than once each year.
Income dividends and capital gain distributions are determined in accordance with income tax regulations which may differ from U.S. GAAP. Differences between tax regulations and U.S. GAAP may change the fiscal year when income and capital items are recognized for tax and U.S. GAAP purposes. Examples of events that give rise to timing differences include wash sales, straddles and capital loss carryforwards. Further, the character of investment income and capital gains may be different for certain transactions under the two methods of accounting. Examples of characterization differences include the treatment of swaps, foreign currency transactions and investments in passive foreign investment companies. As a result, income dividends and capital gain distributions declared during a fiscal period may differ significantly from the net investment income and realized capital gain reported on each Fund’s annual financial statements presented under U.S. GAAP.
Distributions classified as a tax basis return of capital, if any, are reflected on the accompanying Statements of Changes in Net Assets and have been reclassified to paid in capital. In addition, other amounts have been reclassified between undistributed net investment income, accumulated undistributed net realized gains or losses and/or paid in capital to more appropriately conform financial accounting to tax characterizations of dividend distributions.
(f) New Accounting Pronouncements In April 2011, the Financial Accounting Standards Board (“FASB”) issued an Accounting Standards Update (“ASU”) related to the accounting for repurchase agreements and similar agreements that both entitle and obligate a transferor to repurchase or redeem financial assets before their maturity. The ASU modifies the criteria for determining effective control of transferred assets and as a result certain agreements may now be accounted for as secured borrowings. The ASU is effective prospectively for new transfers and existing transactions that are modified in the first interim or annual period beginning on or after December 15, 2011. Management anticipates certain Funds may incur additional borrowing expenses (interest expense) as a result of the change of accounting treatment. The magnitude of this change has not been determined at this time.
In May 2011, FASB issued an ASU to develop common requirements for measuring fair value and for disclosing information about fair value measurements in accordance with U.S. GAAP and International Financial Reporting Standards (“IFRS”). FASB concluded that the amendments in this ASU will improve the comparability of fair value measurements presented and disclosed in financial statements prepared in accordance with U.S. GAAP and IFRS. The ASU is effective prospectively during interim or annual periods beginning on or after December 15, 2011. At this time, management is evaluating the implications of these changes and their impact on the financial statements have not been determined.
| 66 | PIMCO EQUITY SERIES |
Table of Contents
December 31, 2011 (Unaudited)
3. INVESTMENT VALUATION AND FAIR VALUE MEASUREMENTS
For purposes of calculating the NAV, portfolio securities and other assets for which market quotes are readily available are valued at fair market value. Fair market value is generally determined on the basis of last reported sales prices, or if no sales are reported, based on quotes obtained from a quotation reporting system, established market makers, or pricing services.
Investments initially valued in currencies other than the U.S. dollar are converted to the U.S. dollar using exchange rates obtained from pricing service providers. As a result, the NAV of a Fund’s shares may be affected by changes in the value of currencies in relation to the U.S. dollar. The value of securities traded in markets outside the United States or denominated in currencies other than the U.S. dollar may be affected significantly on a day that the NYSE is closed and the NAV may change on days when an investor is not able to purchase, redeem or exchange shares.
U.S. GAAP defines fair market value as the price that a Fund would receive to sell an asset or pay to transfer a liability in an orderly transaction between market participants at the measurement date. It establishes a fair value hierarchy that prioritizes inputs to valuation methods and requires disclosure of the fair value hierarchy, separately for each major category of assets and liabilities, that segregates fair value measurements into levels (Level 1, 2, and 3). The inputs or methodology used for valuing securities are not necessarily an indication of the risk associated with investing in those securities. Levels 1, 2, and 3 of the fair value hierarchy are defined as follows:
| • | Level 1—Inputs using quoted prices in active markets or exchanges for identical assets and liabilities. |
| • | Level 2—Significant other observable inputs, which may include, but are not limited to, quoted prices for similar assets or liabilities in markets that are active, quoted prices for identical or similar assets or liabilities in markets that are not active, inputs other than quoted prices that are observable for the assets or liabilities (such as interest rates, yield curves, volatilities, prepayment speeds, loss severities, credit risks and default rates) or other market corroborated inputs. |
| • | Level 3—Significant unobservable inputs based on the best information available in the circumstances, to the extent observable inputs are not available, which may include assumptions made by the Board of Trustees (the ��Board”) or persons acting at their direction that are used in determining the fair market value of investments. |
Level 1 and Level 2 trading assets and trading liabilities, at fair market value The valuation techniques and significant inputs used in determining the fair market values of financial instruments classified as Level 1 and Level 2 of the fair value hierarchy are as follows:
Common stocks, exchange-traded funds and financial derivative instruments, such as futures contracts or options contracts that are traded on a national securities exchange, are stated at the last reported sale or settlement price on the day of valuation. To the extent these securities are actively traded and valuation adjustments are not applied, they are categorized as Level 1 of the fair value hierarchy. Valuation adjustments may be applied to certain securities that are solely traded on a foreign exchange to account for the market movement between the close of the foreign market and the close of the NYSE. These securities are valued using pricing service providers that consider the correlation of the trading patterns of the foreign security to the intraday trading in the U.S. markets for investments. Securities using these valuation adjustments are categorized as Level 2 of the fair value hierarchy. Preferred securities and other equities traded on inactive markets or valued by reference to similar instruments are also categorized as Level 2 of the fair value hierarchy.
Equity-linked securities are valued by referencing the last reported sale or settlement price of the linked referenced equity on the day of valuation. Foreign
exchange adjustments are applied to the last reported price to convert the linked equity’s trading currency to the contracts settling currency. These investments are categorized as Level 2 of the fair value hierarchy.
Investments in registered open-end investment management companies will be valued based upon the NAVs of such investments and are categorized as Level 1 of the fair value hierarchy. Investments in unregistered open-end management investment companies will be calculated based upon the NAVs of such investments and are considered Level 1 provided that the NAVs are observable, calculated daily and are the value at which both purchases and sales will be conducted. Investments in privately held investment funds will be valued based upon the NAVs of such investments and are categorized as Level 2 of the fair value hierarchy. Investments in privately held investment funds where the inputs of the NAVs are unobservable will be calculated based upon the NAVs of such investments and are categorized as Level 3 of the fair value hierarchy.
Short-term investments having a maturity of 60 days or less are generally valued at amortized cost which approximates fair market value. These investments are categorized as Level 2 of the fair value hierarchy.
Over-the-counter financial derivative instruments, such as foreign currency contracts, options contracts, or swap agreements, derive their value from underlying asset prices, indices, reference rates, and other inputs or a combination of these factors. These contracts are normally valued on the basis of broker dealer quotations or by pricing service providers. Depending on the product and the terms of the transaction, the value of financial derivatives can be estimated by a pricing service provider using a series of techniques, including simulation pricing models. The pricing models use inputs that are observed from actively quoted markets such as issuer details, indices, spreads, interest rates, curves, dividends and exchange rates. Financial derivatives that use similar valuation techniques and inputs as described above are categorized as Level 2 of the fair value hierarchy.
Centrally cleared swaps listed or traded on a multilateral or trade facility platform, such as a registered exchange are valued by the respective exchange. For centrally cleared credit default swaps the clearing facility requires its members to provide actionable levels across complete term structures. These levels along with external third party prices are used to produce daily settlement prices. These securities are categorized as Level 2 of the fair value hierarchy. Centrally cleared interest rate swaps are valued using a pricing model that references the underlying rates including the overnight index swap rate and LIBOR forward rate. These securities are categorized as Level 2 of the fair value hierarchy.
Level 3 trading assets and trading liabilities, at fair market value The valuation techniques and significant inputs used in determining the fair market values of financial instruments classified as Level 3 of the fair value hierarchy are as follows:
Securities and other assets for which market quotes are not readily available are valued at fair market value as determined in good faith by the Board or persons acting at their direction and are categorized as Level 3 of the fair value hierarchy.
Market quotes are considered not readily available in circumstances where there is an absence of current or reliable market-based data (e.g., trade information or broker quotes), including where events occur after the close of the relevant market, but prior to the NYSE Close, that materially affect the values of a Fund’s securities or assets. In addition, market quotes are considered not readily available when, due to extraordinary circumstances, the exchanges or markets on which the securities trade, do not open for trading for the entire day and no other market prices are available. The Board has delegated to the investment adviser, Pacific Investment Management Company LLC (“PIMCO”), the responsibility for monitoring significant events that may materially affect the values of a Fund’s securities or assets and for determining whether the value of the applicable securities or assets should be re-evaluated in light of such significant events.
| DECEMBER 31, 2011 | SEMIANNUAL REPORT | 67 |
Table of Contents
Notes to Financial Statements (Cont.)
The Board has adopted methods for valuing securities and other assets in circumstances where market quotes are not readily available, and has delegated the responsibility for applying the valuation methods to PIMCO. For instances in which daily market quotes are not readily available, investments may be valued, pursuant to guidelines established by the Board, with reference to other securities or indices. In the event that the security or asset cannot be valued pursuant to one of the valuation methods established by the Board, the value of the security or asset will be determined in good faith by the Valuation Committee of the Board, generally based upon recommendations provided by PIMCO. When a Fund uses fair valuation methods applied by PIMCO that use significant unobservable inputs to determine its NAV, securities will be priced by another method that the Board or persons acting at their direction believe accurately reflects fair market value and are categorized as Level 3 of the fair value hierarchy. These methods may require subjective determinations about the value of the security. While the Trust’s policy is intended to result in a calculation of a Fund’s NAV that fairly reflects security values as of the time of pricing, the Trust cannot guarantee that values determined by the Board or persons acting at their direction would accurately reflect the price that a Fund could obtain for a security if it were to dispose of that security as of the time of pricing (for instance, in a forced or distressed sale). The prices used by a Fund may differ from the value that would be realized if the securities were sold.
For fair valuations using significant unobservable inputs, U.S. GAAP requires a reconciliation of the beginning to ending balances for reported fair market values that presents changes attributable to total realized and unrealized gains or losses, purchases and sales, and transfers in or out of the Level 3 category during the period. The end of period timing recognition is used for the significant transfers between Levels of the Funds’ assets and liabilities. In accordance with the requirements of U.S. GAAP, a fair value hierarchy and Level 3 reconciliation, if any, have been included in the Notes to the Schedule of Investments for each respective Fund.
4. SECURITIES AND OTHER INVESTMENTS
(a) Equity-Linked Securities A Fund may purchase equity-linked securities, also known as participation notes, equity swaps, and zero strike calls and warrants. Equity-linked securities are primarily used by a Fund as an alternative means to more efficiently and effectively access what is generally an emerging securities market. A Fund deposits cash with its custodian (or broker, if legally permitted) in an amount near or equal to the selling price of the underlying security in exchange for an equity-linked security. Upon sale, a Fund receives cash from the broker or custodian equal to the value of the underlying security. Aside from market risk of the underlying securities, there is a risk of default by the counterparty to the transaction. In the event of insolvency of the counterparty, a Fund might be unable to obtain its expected benefit. In addition, while a Fund will seek to enter into such transactions only with parties that are capable of entering into closing transactions with the Fund, there can be no assurance that the Fund will be able to close out such a transaction with the counterparty or obtain an offsetting position with any counterparty, at any time prior to the end of the term of the underlying agreement. This may impair a Fund’s ability to enter into other transactions at a time when doing so might be advantageous.
(b) Exchange-Traded Funds The Funds may invest in exchange-traded funds (“ETFs”), which generally are index-based investment companies that hold substantially all of their assets in securities representing their specific index. ETFs are funds that issue shares that trade throughout the day on an exchange and represent an investment in a portfolio of securities and assets. As a shareholder of another investment company, the Funds would bear their pro rata portion of the other investment company’s expenses, including advisory fees, in addition to the expenses the Funds bear directly in connection with their own operations.
(c) Repurchase Agreements Each Fund may engage in repurchase agreements. Under the terms of a typical repurchase agreement, a Fund takes possession of an underlying debt obligation (collateral) subject to an obligation of the seller to repurchase, and a Fund to resell, the obligation at an agreed-upon price and time. The underlying securities for all repurchase agreements
are held in safekeeping at the Fund’s custodian or designated subcustodians under tri-party repurchase agreements. The market value of the collateral must be equal to or exceed the total amount of the repurchase obligations, including interest. Securities purchased under repurchase agreements are reflected as an asset on the Statements of Assets and Liabilities. Interest earned is recorded as a component of interest income on the Statements of Operations. In periods of increased demand for collateral, a Fund may pay a fee for receipt of collateral, which may result in interest expense to the Fund. Generally, in the event of counterparty default, a Fund has the right to use the collateral to offset losses incurred. If the counterparty should default, a Fund will seek to sell the securities which it holds as collateral. This could involve procedural costs or delays in addition to a loss on the securities if their value should fall below their repurchase price.
(d) Short Sales Certain Funds may enter into short sales transactions. Short sales are transactions in which a Fund sells a security or other instrument (such as an option, forward, future or other derivative contract) that it does not own. When a Fund engages in a short sale, it must borrow the security sold short and deliver it to the counterparty. A Fund will ordinarily have to pay a fee or premium to borrow a security and be obligated to repay the lender of the security any dividend or interest that accrues on the security during the period of the loan. A Fund may enter into a specific agreement with a prime broker giving the Fund the opportunity to borrow a predetermined amount of a thinly traded security for the duration of the term (the “Term Borrow Agreement”). In exchange for the opportunity to borrow the specified security, a Fund will pay the prime broker a fee as detailed in the Term Borrow Agreement. See Note 6 for risks associated with Prime Broker Account Agreements. Securities sold in short sale transactions and the dividend or interest payable on such securities, if any, are reflected as payable for short sales on the Statements of Assets and Liabilities. Short sales expose a Fund to the risk that it will be required to cover its short position at a time when the security or other asset has appreciated in value, thus resulting in losses to the Fund. A short sale is “against the box” if a Fund holds in its portfolio or has the right to acquire the security sold short at no additional cost. A Fund will be subject to additional risks to the extent that it engages in short sales that are not “against the box.” A Fund’s loss on a short sale could theoretically be unlimited in cases where the Fund is unable, for whatever reason, to close out its short position.
(e) U.S. Government Agencies or Government-Sponsored Enterprises Certain Funds may invest in securities of U.S. Government agencies or government-sponsored enterprises. U.S. Government securities are obligations of and, in certain cases, guaranteed by, the U.S. Government, its agencies or instrumentalities. Some U.S. Government securities, such as Treasury bills, are supported by the full faith and credit of the U.S. Government. U.S. Government securities may include zero coupon securities, which do not distribute interest on a current basis and tend to be subject to greater risk than interest-paying securities of similar maturities.
5. FINANCIAL DERIVATIVE INSTRUMENTS
The following disclosures contain information on how and why the Funds use financial derivative instruments, the credit-risk-related contingent features in certain financial derivative instruments, and how financial derivative instruments affect the Funds’ financial position, results of operations and cash flows. The location and fair value amounts of these instruments on the Statements of Assets and Liabilities and the realized and changes in unrealized gains and losses on the Statements of Operations, each categorized by type of financial derivative contract, are included in a table in the Notes to Schedules of Investments. The financial derivative instruments outstanding as of period end as disclosed in the Notes to Schedules of Investments and the amounts of realized and changes in unrealized gains and losses on financial derivative instruments during the period as disclosed on the Statements of Operations serve as indicators of the volume of financial derivative activity for the Funds.
(a) Foreign Currency Contracts Certain Funds may enter into foreign currency contracts in connection with settling planned purchases or sales of securities, to hedge the currency exposure associated with some or all of a Fund’s securities or as a part of an investment strategy. A foreign currency
| 68 | PIMCO EQUITY SERIES |
Table of Contents
December 31, 2011 (Unaudited)
contract is an agreement between two parties to buy and sell a currency at a set price on a future date. The market value of a foreign currency contract fluctuates with changes in foreign currency exchange rates. Foreign currency contracts are marked to market daily and the change in value is recorded by a Fund as an unrealized gain or loss. Realized gains or losses equal to the difference between the value of the contract at the time it was opened and the value at the time it was closed are recorded upon delivery or receipt of the currency. These contracts may involve market risk in excess of the unrealized gain or loss reflected on the Statements of Assets and Liabilities. In addition, a Fund could be exposed to risk if the counterparties are unable to meet the terms of the contracts or if the value of the currency changes unfavorably to the U.S. dollar. In connection with these contracts, securities may be identified as collateral in accordance with the terms of the respective contracts.
(b) Futures Contracts Certain Funds may enter into futures contracts. A Fund may use futures contracts to manage its exposure to the securities markets or to movements in interest rates and currency values. The primary risks associated with the use of futures contracts are the imperfect correlation between the change in market value of the securities held by a Fund and the prices of futures contracts and the possibility of an illiquid market. Futures contracts are valued based upon their quoted daily settlement prices. Upon entering into a futures contract, a Fund is required to deposit with its futures broker, an amount of cash or U.S. Government and Agency Obligations in accordance with the initial margin requirements of the broker or exchange. Futures contracts are marked to market daily and an appropriate payable or receivable for the change in value (“variation margin”) is recorded by the Fund. Gains or losses are recognized but not considered realized until the contracts expire or are closed. Futures contracts involve, to varying degrees, risk of loss in excess of the variation margin disclosed on the Statements of Assets and Liabilities.
(c) Options Contracts Certain Funds may write call and put options on securities and financial derivative instruments it owns or in which it may invest. Writing put options tends to increase a Fund’s exposure to the underlying instrument. Writing call options tends to decrease a Fund’s exposure to the underlying instrument. When a Fund writes a call or put, an amount equal to the premium received is recorded as a liability and subsequently marked to market to reflect the current value of the option written. These liabilities are reflected as written options outstanding on the Statements of Assets and Liabilities. Premiums received from writing options which expire are treated as realized gains. Premiums received from writing options which are exercised or closed are added to the proceeds or offset against amounts paid on the underlying futures, swap, security or currency transaction to determine the realized gain or loss. Certain options may be written with premiums to be determined on a future date. A Fund as a writer of an option has no control over whether the underlying instrument may be sold (call) or purchased (put) and as a result bears the market risk of an unfavorable change in the price of the instrument underlying the written option. There is the risk a Fund may not be able to enter into a closing transaction because of an illiquid market.
Certain Funds may also purchase put and call options. Purchasing call options tends to increase a Fund’s exposure to the underlying instrument. Purchasing put options tends to decrease a Fund’s exposure to the underlying instrument. A Fund pays a premium which is included on the Fund’s Statements of Assets and Liabilities as an investment and subsequently marked to market to reflect the current value of the option. Premiums paid for purchasing options which expire are treated as realized losses. Certain options may be purchased with premiums to be determined on a future date. The premiums for these options are based upon implied volatility parameters at specified terms. The risk associated with purchasing put and call options is limited to the premium paid. Premiums paid for purchasing options which are exercised or closed are added to the amounts paid or offset against the proceeds on the underlying investment transaction to determine the realized gain or loss when the underlying transaction is sold.
Options on Exchange-Traded Futures Contracts Certain Funds may write or purchase options on exchange-traded futures contracts (“Futures Option”). A Futures Option is an option contract in which the underlying is a single futures contract. A Fund may write a Futures Option for income purposes or to
hedge an existing position or future investment. A Fund may purchase Futures Options for speculative purposes or to manage exposure to market movements.
Foreign Currency Options Certain Funds may write or purchase foreign currency options. These options may be used as a short or long hedge against possible variations in foreign exchange rates or to gain exposure to foreign currencies. A foreign currency option will specify the amount of currency and a rate of exchange that may be exercised by a specified date.
Options on Securities Certain Funds may enter into options on securities (“Equity Option”). An Equity Option uses a specified equity security as the underlying for the option contract. A Fund may write or purchase options for income purposes or to hedge an existing position or future investment.
Options on Exchange-Traded Funds Certain Funds may enter into options on exchange-traded funds (“ETF Option”). An ETF Option uses a specified exchange-traded fund as the underlying for the option contract. A Fund may write or purchase options for income purposes or to hedge an existing position or future investment.
(d) Swap Agreements Certain Funds may invest in swap agreements. Swap agreements are bilaterally negotiated agreements between a Fund and a counterparty to exchange or swap investment cash flows, assets, foreign currencies or market-linked returns at specified, future intervals. Swap agreements are privately negotiated in the over-the-counter market (“OTC swaps”) or may be executed in a multilateral or other trade facility platform, such as a registered exchange (“centrally cleared swaps”). A Fund may enter into credit default, interest rate, total return and other forms of swap agreements to manage its exposure to credit, currency, interest rate, commodity, equity and inflation risk. In connection with these agreements, securities or cash may be identified as collateral or margin in accordance with the terms of the respective swap agreements to provide assets of value and recourse in the event of default or bankruptcy/insolvency.
Swaps are marked to market daily based upon values from third party vendors, which may include a registered exchange, or quotations from market makers to the extent available. In the event that market quotes are not readily available and the swap cannot be valued pursuant to one of the valuation methods, the value of the swap will be determined in good faith by the Valuation Committee of the Board of Trustees, generally based upon recommendations provided by PIMCO. Changes in market value, if any, are reflected as a component of net changes in unrealized appreciation/(depreciation) on the Statements of Operations. Daily changes in valuation of centrally cleared swaps, if any, are recorded as a receivable or payable for the change in value as appropriate (“variation margin”) on the Statements of Assets and Liabilities. OTC swap payments received or made at the beginning of the measurement period are reflected as such on the Statements of Assets and Liabilities and represent premiums paid or received upon entering into the swap agreement to compensate for differences between the stated terms of the swap agreement and prevailing market conditions (credit spreads, currency exchange rates, interest rates, and other relevant factors). These upfront premiums are recorded as realized gains or losses on the Statements of Operations upon termination or maturity of the swap. A liquidation payment received or made at the termination of the swap is recorded as realized gain or loss on the Statements of Operations. Net periodic payments received or paid by a Fund are included as part of realized gains or losses on the Statements of Operations.
Entering into these agreements involves, to varying degrees, elements of interest, credit, market and documentation risk in excess of the amounts recognized on the Statements of Assets and Liabilities. Such risks involve the possibility that there will be no liquid market for these agreements, that the counterparty to the agreements may default on its obligation to perform or disagree as to the meaning of contractual terms in the agreements and that there may be unfavorable changes in interest rates.
A Fund’s maximum risk of loss from counterparty credit risk is the discounted net value of the cash flows to be received from the counterparty over the contract’s remaining life, to the extent that amount is positive. The risk is
| DECEMBER 31, 2011 | SEMIANNUAL REPORT | 69 |
Table of Contents
Notes to Financial Statements (Cont.)
mitigated by having a master netting arrangement between a Fund and the counterparty and by the posting of collateral to a Fund to cover a Fund’s exposure to the counterparty.
Credit Default Swap Agreements Credit default swap agreements involve one party making a stream of payments (referred to as the buyer of protection) to another party (the seller of protection) in exchange for the right to receive a specified return in the event of a default or other credit event for the referenced entity, obligation or index. As a seller of protection on credit default swap agreements, a Fund will generally receive from the buyer of protection a fixed rate of income throughout the term of the swap provided that there is no credit event. As the seller, a Fund would effectively add leverage to its portfolio because, in addition to its total net assets, a Fund would be subject to investment exposure on the notional amount of the swap.
If a Fund is a seller of protection and a credit event occurs, as defined under the terms of that particular swap agreement, a Fund will either (i) pay to the buyer of protection an amount equal to the notional amount of the swap and take delivery of the referenced obligation, other deliverable obligations or underlying securities comprising the referenced index or (ii) pay a net settlement amount in the form of cash or securities equal to the notional amount of the swap less the recovery value of the referenced obligation or underlying securities comprising the referenced index. If a Fund is a buyer of protection and a credit event occurs, as defined under the terms of that particular swap agreement, a Fund will either (i) receive from the seller of protection an amount equal to the notional amount of the swap and deliver the referenced obligation, other deliverable obligations or underlying securities comprising the referenced index or (ii) receive a net settlement amount in the form of cash or securities equal to the notional amount of the swap less the recovery value of the referenced obligation or underlying securities comprising the referenced index. Recovery values are estimated by market makers considering either industry standard recovery rates or entity specific factors and considerations until a credit event occurs. If a credit event has occurred, the recovery value is determined by a facilitated auction whereby a minimum number of allowable broker bids, together with a specified valuation method, are used to calculate the settlement value.
Credit default swap agreements on corporate or sovereign issues involve one party making a stream of payments to another party in exchange for the right to receive a specified return in the event of a default or other credit event. If a credit event occurs and cash settlement is not elected, a variety of other deliverable obligations may be delivered in lieu of the specific referenced obligation. The ability to deliver other obligations may result in a cheapest-to-deliver option (the buyer of protection’s right to choose the deliverable obligation with the lowest value following a credit event). A Fund may use credit default swaps on corporate or sovereign issues to provide a measure of protection against defaults of the issuers (i.e., to reduce risk where a Fund owns or has exposure to the referenced obligation) or to take an active long or short position with respect to the likelihood of a particular issuer’s default.
Credit default swap agreements on credit indices involve one party making a stream of payments to another party in exchange for the right to receive a specified return in the event of a write-down, principal shortfall, interest shortfall or default of all or part of the referenced entities comprising the credit index. A credit index is a basket of credit instruments or exposures designed to be representative of some part of the credit market as a whole. These indices are made up of reference credits that are judged by a poll of dealers to be the most liquid entities in the credit default swap market based on the sector of the index. Components of the indices may include, but are not limited to, investment grade securities, high yield securities, asset-backed securities, emerging markets, and/or various credit ratings within each sector. Credit indices are traded using credit default swaps with standardized terms including a fixed spread and standard maturity dates. An index credit default swap references all the names in the index, and if there is a default, the credit event is settled based on that name’s weight in the index. The composition of the indices changes periodically, usually every six months, and for most indices, each name has an equal weight in the index. A Fund may use credit default
swaps on credit indices to hedge a portfolio of credit default swaps or bonds, which is less expensive than it would be to buy many credit default swaps to achieve a similar effect. Credit default swaps on indices are benchmarks for protecting investors owning bonds against default, and traders use them to speculate on changes in credit quality.
Implied credit spreads, represented in absolute terms, utilized in determining the market value of credit default swap agreements on corporate or sovereign issues as of period end are disclosed in the Notes to the Schedules of Investments and serve as an indicator of the current status of the payment/performance risk and represent the likelihood or risk of default for the credit derivative. The implied credit spread of a particular referenced entity reflects the cost of buying/selling protection and may include upfront payments required to be made to enter into the agreement. For credit default swap agreements on asset-backed securities and credit indices, the quoted market prices and resulting values serve as the indicator of the current status of the payment/performance risk. Wider credit spreads represent a deterioration of the referenced entity’s credit soundness and a greater likelihood or risk of default or other credit event occurring as defined under the terms of the agreement.
The maximum potential amount of future payments (undiscounted) that a Fund as a seller of protection could be required to make under a credit default swap agreement would be an amount equal to the notional amount of the agreement. Notional amounts of each individual credit default swap agreement outstanding as of December 31, 2011 for which a Fund is the seller of protection are disclosed in the Notes to the Schedules of Investments. These potential amounts would be partially offset by any recovery values of the respective referenced obligations, upfront payments received upon entering into the agreement, or net amounts received from the settlement of buy protection credit default swap agreements entered into by a Fund for the same referenced entity or entities.
Interest Rate Swap Agreements Certain Funds are subject to interest rate risk exposure in the normal course of pursuing their investment objectives. Because a Fund holds fixed rate bonds, the value of these bonds may decrease if interest rates rise. To help hedge against this risk and to maintain its ability to generate income at prevailing market rates, a Fund may enter into interest rate swap agreements. Interest rate swap agreements involve the exchange by a Fund with another party for their respective commitment to pay or receive interest on the notional amount of principal. Certain forms of interest rate swap agreements may include: (i) interest rate caps, under which, in return for a premium, one party agrees to make payments to the other to the extent that interest rates exceed a specified rate, or “cap”, (ii) interest rate floors, under which, in return for a premium, one party agrees to make payments to the other to the extent that interest rates fall below a specified rate, or “floor”, (iii) interest rate collars, under which a party sells a cap and purchases a floor or vice versa in an attempt to protect itself against interest rate movements exceeding given minimum or maximum levels, (iv) callable interest rate swaps, under which the counterparty may terminate the swap transaction in whole at zero cost by a predetermined date and time prior to the maturity date, (v) spreadlocks, which allow the interest rate swap users to lock in the forward differential (or spread) between the interest rate swap rate and a specified benchmark, or (vi) basis swap, under which two parties can exchange variable interest rates based on different money markets.
Total Return Swap Agreements Certain Funds may enter into total return swap agreements to gain or mitigate exposure of the underlying reference securities. Total return swap agreements on commodities involve commitments where cash flows are exchanged based on the price of a commodity and based on a fixed or variable rate. One party would receive payments based on the market value of the commodity involved and pay a fixed amount. Total return swap agreements on indices involve commitments to pay interest in exchange for a market-linked return. One counterparty pays out the total return of a specific reference asset, which may be an equity, index, or bond, and in return receives a regular stream of payments. To the extent the total return of the security or index underlying the transaction exceeds or falls short of the offsetting interest rate obligation, a Fund will receive a payment from or make a payment to the counterparty.
| 70 | PIMCO EQUITY SERIES |
Table of Contents
December 31, 2011 (Unaudited)
6. PRINCIPAL RISKS
In the normal course of business the Funds (or Underlying PIMCO Funds and/or Acquired Funds in the case of the mutual funds that pursue their investment objective by investing in other mutual funds (“PIMCO Fund of Funds”) trade financial instruments and enter into financial transactions where risk of potential loss exists due to changes in the market (market risk), or failure or inability of the other party to a transaction to perform (credit and counterparty risk). See below for a detailed description of select principal risks. For a list of potential risks the Funds may be subject to, please see the Important Information About the Funds.
PIMCO Fund of Funds Because the PIMCO Fund of Funds invest substantially all of their respective assets in Underlying PIMCO Funds (or Acquired Funds), the risks associated with investing in the PIMCO Fund of Funds are closely related to the risks associated with the securities and other investments held by the Underlying PIMCO Funds (or Acquired Funds). The ability of the PIMCO Fund of Funds to achieve their respective investment objectives will depend upon the ability of the Underlying PIMCO Funds (or Acquired Funds) to achieve their respective investment objectives. There can be no assurance that the investment objective of any Underlying PIMCO Fund (or Acquired Funds) will be achieved. The net asset value of a PIMCO Fund of Funds will fluctuate in response to changes in the respective net asset values of the Underlying PIMCO Funds (or Acquired Funds) in which it invests. The extent to which the investment performance and risks associated with the PIMCO Fund of Funds correlate to those of a particular Underlying PIMCO Fund (or Acquired Fund) will depend upon the extent to which the assets of the PIMCO Fund of Funds are allocated from time to time for investment in the Underlying PIMCO Fund (or Acquired Fund), which will vary.
Investing in Underlying PIMCO Funds (or Acquired Funds) involves certain additional expenses and tax results that would not be present in a direct investment in the Underlying PIMCO Funds (or Acquired Funds).
The investment performance depends upon how its assets are allocated and reallocated according to the PIMCO Fund of Fund’s asset allocation targets and ranges. A principal risk of investing in each PIMCO Fund of Funds is that the PIMCO Fund of Fund’s asset allocation sub-adviser will make less than optimal or poor asset allocation decisions. The asset allocation sub-adviser attempts to identify investment allocations for the Underlying PIMCO Funds (or Acquired Funds) that will provide consistent, quality performance for the PIMCO Fund of Funds, but there is no guarantee that such allocation techniques will produce the desired results. It is possible that the asset allocation sub-adviser will focus on an Underlying PIMCO Fund (or Acquired Fund) that performs poorly or underperforms other Underlying PIMCO Funds (or Acquired Funds) under various market conditions.
In the normal course of business the Underlying PIMCO Funds (or Acquired Funds) trade financial instruments and enter into financial transactions where risk of potential loss exists due to changes in the market (market risk), or failure or inability of the other party to a transaction to perform (credit and counterparty risk).
Market Risks A Fund’s (or Underlying PIMCO Funds’ and/or Acquired Funds’ in the case of the PIMCO Fund of Funds) investments in financial derivatives and other financial instruments expose the Fund to various risks such as, but not limited to, equity, interest rate, foreign currency and commodity risks.
The market values of equities, such as common stocks and preferred securities or equity related investments such as futures and options, may decline due to general market conditions which are not specifically related to a particular company, such as real or perceived adverse economic conditions, changes in the general outlook for corporate earnings, changes in interest or currency rates or adverse investor sentiment generally. They may also decline due to factors which affect a particular industry or industries, such as labor shortages or increased production costs and competitive conditions within an industry. Equity securities and equity related investments generally have greater market price volatility than fixed income securities.
Interest rate risk is the risk that fixed income securities will decline in value because of changes in interest rates. As nominal interest rates rise, the value of certain fixed income securities held by a Fund (or Underlying PIMCO Fund and/or Acquired Fund in the case of the PIMCO Fund of Funds) is likely to decrease. A nominal interest rate can be described as the sum of a real interest rate and an expected inflation rate. Fixed income securities with longer durations tend to be more sensitive to changes in interest rates, usually making them more volatile than securities with shorter durations. Duration is useful primarily as a measure of the sensitivity of a fixed income’s market price to interest rate (i.e. yield) movements.
If a Fund (or Underlying PIMCO Fund and/or Acquired Fund in the case of the PIMCO Fund of Funds) invests directly in foreign currencies or in securities that trade in, and receive revenues in, foreign currencies, or in financial derivatives that provide exposure to foreign currencies, it will be subject to the risk that those currencies will decline in value relative to the base currency of the Fund (or Underlying PIMCO Fund and/or Acquired Fund in the case of the PIMCO Fund of Funds), or, in the case of hedging positions, that the Fund’s (or Underlying PIMCO Funds’ and/or Acquired Funds’ in the case of the PIMCO Fund of Funds) base currency will decline in value relative to the currency being hedged. Currency rates in foreign countries may fluctuate significantly over short periods of time for a number of reasons, including changes in interest rates, intervention (or the failure to intervene) by U.S. or foreign governments, central banks or supranational entities such as the International Monetary Fund, or by the imposition of currency controls or other political developments in the United States or abroad. As a result, a Fund’s (or Underlying PIMCO Funds’ and/or Acquired Funds’ in the case of a PIMCO Fund of Funds) investments in foreign currency denominated securities may reduce the returns of the Fund (or Underlying PIMCO Fund and/or Acquired Fund in the case of the PIMCO Fund of Funds).
A Fund’s (or Underlying PIMCO Funds’ and/or Acquired Funds’ in the case of a PIMCO Fund of Funds) investments in commodity-linked financial derivative instruments may subject the Fund to greater market price volatility than investments in traditional securities. The value of commodity-linked financial derivative instruments may be affected by changes in overall market movements, commodity index volatility, changes in interest rates, or factors affecting a particular industry or commodity, such as drought, floods, weather, livestock disease, embargoes, tariffs and international economic, political and regulatory developments.
Credit and Counterparty Risks A Fund (or Underlying PIMCO Fund and/or Acquired Fund in the case of a PIMCO Fund of Funds) will be exposed to credit risk on parties with whom it trades and will also bear the risk of settlement default. A Fund (or Underlying PIMCO Fund and/or Acquired Fund in the case of a PIMCO Fund of Funds) minimizes concentrations of credit risk by undertaking transactions with a large number of customers and counterparties on recognized and reputable exchanges. A Fund (or Underlying PIMCO Fund and/or Acquired Fund in the case of a PIMCO Fund of Funds) could lose money if the issuer or guarantor of a fixed income security, or the counterparty to a financial derivatives contract, repurchase agreement or a loan of portfolio securities, is unable or unwilling to make timely principal and/or interest payments, or to otherwise honor its obligations. Securities are subject to varying degrees of credit risk, which are often reflected in credit ratings.
Similar to credit risk, a Fund (or Underlying PIMCO Fund and/or Acquired Fund in the case of a PIMCO Fund of Funds) may be exposed to counterparty risk, or the risk that an institution or other entity with which the Fund (or Underlying PIMCO Fund and/or Acquired Fund in the case of the PIMCO Fund of Funds) has unsettled or open transactions will default. Financial assets, which potentially expose a Fund to counterparty risk, consist principally of cash due from counterparties and investments. PIMCO, as the investment adviser, minimizes counterparty risks to the Funds by performing extensive reviews of each counterparty and obtaining approval from the PIMCO Counterparty Risk Committee prior to entering into transactions with a third party. Furthermore, to the extent that unpaid amounts owed to a Fund (or Underlying PIMCO Fund and/or Acquired Fund in the case of a PIMCO Fund of Funds) exceed a
| DECEMBER 31, 2011 | SEMIANNUAL REPORT | 71 |
Table of Contents
Notes to Financial Statements (Cont.)
predetermined threshold agreed to with the counterparty, such counterparty shall advance collateral to the Fund (or Underlying PIMCO Fund and/or Acquired Fund in the case of the PIMCO Fund of Funds) in the form of cash or cash equivalents equal in value to the unpaid amount owed to the Fund (or Underlying PIMCO Fund and/or Acquired Fund in the case of the PIMCO Fund of Funds). A Fund (or Underlying PIMCO Fund and/or Acquired Fund in the case of a PIMCO Fund of Funds) may invest such collateral in securities or other instruments and will typically pay interest to the counterparty on the collateral received. If the unpaid amount owed to a Fund (or Underlying PIMCO Fund and/or Acquired Fund in the case of a PIMCO Fund of Funds) subsequently decreases, the Fund (or Underlying PIMCO Fund and/or Acquired Fund in the case of the PIMCO Fund of Funds) would be required to return to the counterparty all or a portion of the collateral previously advanced to the Fund (or Underlying PIMCO Fund and/or Acquired Fund in the case of the PIMCO Fund of Funds).
All transactions in listed securities are settled/paid for upon delivery using approved counterparties. The risk of default is considered minimal, as delivery of securities sold is only made once a Fund has received payment. Payment is made on a purchase once the securities have been delivered by the counterparty. The trade will fail if either party fails to meet its obligation.
A Fund is subject to various Master Agreements, which govern the terms of certain transactions with select counterparties. These Master Agreements reduce the counterparty risk associated with relevant transactions by specifying credit protection mechanisms and providing standardization that improves legal certainty. Since different types of forward and OTC financial derivative transactions have different mechanics and are sometimes traded out of different legal entities of a particular counterparty organization, each type of transaction may be covered by a different Master Agreement and result in the need for multiple agreements with a single counterparty. Therefore, exposure cannot be netted and collateralized across all types of transactions. Exposures can only be netted across transactions governed under the same Master Agreement with the same legal entity.
Master Agreements can also help limit counterparty risk by specifying collateral posting arrangements at pre-arranged exposure levels. Under the Master Agreements, collateral is routinely transferred if the total net exposure to certain transactions (net of existing collateral already in place) governed under the relevant master agreement with a counterparty in a given account exceeds a specified threshold, which typically ranges from zero to $250,000 depending on the counterparty and the type of Master Agreement. United States Treasury Bills and U.S. dollar cash are generally the preferred forms of collateral, although other forms of AAA rated paper may be used. A Fund’s overall exposure to counterparty risk can change substantially within a short period, as it is affected by each transaction subject to the relevant Master Agreement.
Master Repurchase Agreements (“Master Repo Agreements”) govern transactions between a Fund and select counterparties. The Master Repo Agreements maintain provisions for, among other things, initiation, income payments, events of default, and maintenance of collateral for Repurchase Agreements.
International Swaps and Derivatives Association, Inc. Master Agreements (“ISDA Master Agreements”) govern OTC financial derivative transactions entered into by a Fund and select counterparties. The ISDA Master Agreements maintain provisions for general obligations, representations, agreements, collateral and events of default or termination. Events of termination include conditions that may entitle counterparties to elect to terminate early and cause settlement of all outstanding transactions under the applicable ISDA Master Agreement. Any election to early terminate could be material to the financial statements. The market value of OTC financial derivative transactions net of collateral received in or pledged by counterparty as of period end is disclosed in the Notes to the Schedules of Investments.
Prime Broker Account Agreements between a Fund and selected Prime Brokers govern the considerations and factors surrounding accounts opened for short selling transactions and activities, including, but not limited to, margin, execution, and settlement. The Prime Broker Account Agreements maintain provisions for, among other things, payments, maintenance of collateral, events of default, and termination. See Note 4(d) for additional information.
7. BASIS FOR CONSOLIDATION FOR THE PIMCO EMERGING MULTI-ASSET FUND AND PIMCO EqS PATHFINDER FUNDTM (“Commodity Funds”)
The PIMCO Cayman Commodity Fund V and VI (“Commodity Subsidiary”), the Cayman Islands exempted companies, were incorporated as wholly owned subsidiaries acting as investment vehicles for the Commodity Funds in order to effect certain investments for the Commodity Funds consistent with the Commodity Fund’s investment objectives and policies specified in their respective prospectus and statement of additional information. The Commodity Funds’ investment portfolio has been consolidated and includes the portfolio holdings of the Commodity Funds and their respective Commodity Subsidiary. The consolidated financial statements include the accounts of the Commodity Funds and their respective Subsidiary. All inter-company transactions and balances have been eliminated. A subscription agreement was entered into between the Commodity Funds and their respective Commodity Subsidiary, comprising the entire issued share capital of the Commodity Subsidiary with the intent that each Commodity Fund will remain the sole shareholder and retain all rights. Under the Articles of Association, each Commodity Subsidiary, shares issued by each Commodity Subsidiary confers upon a shareholder the right to receive notice of, to attend and to vote at general meetings of each of the Commodity Subsidiaries and shall confer upon the shareholder rights in a winding-up or repayment of capital and the right to participate in the profits or assets of each of the Commodity Subsidiaries. See the table below for details regarding the structure, incorporation and relationship as of December 31, 2011 of each Subsidiary to its Fund (amounts in thousands).
| Fund Name | Subsidiary | Date of Incorporation | Subscription Agreement | Fund Net Assets | Subsidiary Net Assets | % of Fund Net Assets | ||||||||||||||
| PIMCO Emerging Multi-Asset Fund | PIMCO Cayman Commodity Fund V Ltd. | 06/06/2011 | 07/01/2011 | $ | 38,872 | $ | 10 | 0.0 | % | |||||||||||
| PIMCO EqS Pathfinder Fund™ | PIMCO Cayman Commodity Fund VI Ltd. | 06/06/2011 | 06/20/2011 | 2,140,563 | 34,892 | 1.6 | ||||||||||||||
8. FEES AND EXPENSES
(a) Investment Advisory Fee PIMCO is a majority-owned subsidiary of Allianz Asset Management of America L.P. (“Allianz Asset Management”) formerly known as Allianz Global Investors of America L.P., and serves as investment adviser (the “Adviser”) to the Trust, pursuant to an investment advisory contract. The Adviser receives a monthly fee from each Fund, at an annual rate based on average daily net assets (the “Investment Advisory Fee”). The Investment Advisory Fee for all classes is charged at an annual rate as noted in the table below.
(b) Supervisory and Administrative Fee PIMCO serves as administrator (the “Administrator”), and provides supervisory and administrative services to the Trust for which it receives a monthly supervisory and administrative fee based on each share class’s average daily net assets (the “Supervisory and Administrative Fee”). As the Administrator, PIMCO bears the costs of various third-party services, including audit, custodial, portfolio accounting, legal, transfer agency and printing costs. The Supervision and Administration Agreement includes a plan specific to Class D shares that has been adopted in conformity with the requirements set forth under Rule 12b-1 of the Act (“Rule 12b-1”) to allow for payment of up to 0.25% per annum of the Class D supervisory and administrative fees as reimbursement for
| 72 | PIMCO EQUITY SERIES |
Table of Contents
December 31, 2011 (Unaudited)
expenses in respect of activities that may be deemed to be primarily intended to result in the sale of Class D shares. The principal types of activities for which such payments may be made are services in connection with the distribution and marketing of Class D shares and/or the provision of shareholder services.
The Investment Advisory and Supervisory and Administrative Fees for all classes are charged at an annual rate as noted in the following table:
| Investment Advisory Fee | Supervisory and Administrative Fee | |||||||||||||||||||||||||||
| Fund Name | All Classes | Institutional Class | Class P | Administrative Class | Class D (1) | A, C and R Classes | ||||||||||||||||||||||
PIMCO Dividend and Income Builder Fund | 0.69% | 0.30% | 0.40% | N/A | 0.65% | 0.40% | ||||||||||||||||||||||
PIMCO EqS Dividend Fund | 0.69% | 0.30% | 0.40% | N/A | 0.65% | 0.40% | ||||||||||||||||||||||
PIMCO EqS Emerging Markets Fund | 1.00% | 0.45% | 0.55% | 0.45% | 0.80% | 0.55% | ||||||||||||||||||||||
PIMCO Emerging Multi-Asset Fund | 0.90% | 0.45% | 0.55% | 0.45% | 0.80% | 0.55% | ||||||||||||||||||||||
PIMCO EqS Pathfinder FundTM | 0.75% | 0.30% | 0.40% | N/A | 0.65% | 0.40% | ||||||||||||||||||||||
| (1) | As described above, the Supervision and Administration Agreement includes a plan adopted under Rule 12b-1 which provides for the payment of up to 0.25% of the Class D Supervisory and Administrative Fee rate as reimbursement for expenses in respect of activities that may be deemed to be primarily intended to result in the sale of Class D shares. |
(c) Distribution and Servicing Fees PIMCO Investments LLC (“PI”), a wholly-owned subsidiary of PIMCO, serves as the distributor (“Distributor”) of the Trust’s shares. Pursuant to the Distribution and Servicing Plans adopted by the A, C and R Classes of the Trust, the Trust compensated the Distributor or an affiliate for services provided and expenses incurred in connection with assistance rendered in the sale of shares and services rendered to shareholders and for maintenance of shareholder accounts of the A, C and R Classes. The Trust compensates PIMCO for services provided and expenses incurred for the servicing of Class D shares. During the fiscal period ended December 31, 2011, PIMCO paid the Distributor under a separate agreement for services provided by the Distributor in connection with Class D shares. The Trust paid distribution and servicing fees at effective rates as set forth in the following table (calculated as a percentage of each Fund’s average daily net assets attributable to each class):
| Allowable Rate | ||||||||||
| Distribution Fee | Servicing Fee | |||||||||
Class A | — | 0.25% | ||||||||
Class C | 0.75% | 0.25% | ||||||||
Class R | 0.25% | 0.25% | ||||||||
The Distributor also received the proceeds of the initial sales charges paid by the shareholders upon the purchase of Class A shares and the contingent deferred sales charges paid by the shareholders upon certain redemptions of A and C Class shares. For the period ended December 31, 2011, the Distributor received $42,681 from the Trust representing commissions (sales charges) and contingent deferred sales charges.
(d) Fund Expenses The Trust is responsible for the following expenses: (i) salaries and other compensation of any of the Trust’s executive officers and employees who are not officers, directors, stockholders or employees of PIMCO or its subsidiaries or affiliates; (ii) taxes and governmental fees; (iii) brokerage fees and commissions and other portfolio transaction expenses; (iv) costs of borrowing money, including interest expenses; (v) fees and expenses of the Trustees who are not “interested persons” of PIMCO or the Trust, and any counsel retained exclusively for their benefit; (vi) extraordinary expenses, including costs of litigation and indemnification expenses; (vii) organization expenses and (viii) any expenses allocated or allocable to a specific class of shares (“class-specific expenses”). The ratio of expenses to average net assets per share class, as disclosed on the Financial Highlights, may differ from the annual fund operating expenses per share class as disclosed in the Prospectus for the reasons set forth above.
Each unaffiliated Trustee receives an annual retainer of $60,000, plus $4,750 for each Board of Trustees meeting attended in person, $375 ($750 in the case of the audit committee chair with respect to audit committee meetings) for each committee meeting attended and $750 for each Board of Trustees meeting attended telephonically, plus reimbursement of related expenses. In addition, the audit committee chair receives an additional annual retainer of $7,500 and each other committee chair receives an additional annual retainer of $750.
These expenses are allocated on a pro-rata basis to each Fund of the Trust according to its respective net assets. The Trust pays no compensation directly to any Trustee or any other officer who is affiliated with the Administrator, all
of whom receive remuneration for their services to the Trust from the Administrator or its affiliates.
(e) Expense Limitation PIMCO has agreed to waive a portion of the Funds’ Supervisory and Administrative Fees in each Fund’s first fiscal year, to the extent that the payment of each Fund’s pro rata share of organizational expenses and Trustee Fees cause the actual expense ratio to rise above the rates disclosed in the then-current prospectus plus 0.0049% (calculated as a percentage of each Fund’s average daily net assets attributable to each class).
PIMCO has contractually agreed to waive a portion of the Investment Advisory Fee as set forth in the following table (calculated as a percentage of each Fund’s average daily net assets.
| Fund Name | Investment Advisory Fee Waiver | Investment Advisory Waiver Expiration Date | ||||||||
PIMCO Dividend and Income Builder Fund | 0.16% | 10/31/2013 | ||||||||
PIMCO EqS Dividend Fund | 0.16% | 10/31/2013 | ||||||||
PIMCO Eqs Emerging Markets Fund | 0.20% | 10/31/2012 | ||||||||
PIMCO Eqs Pathfinder Fund | 0.16% | 10/31/2012 | ||||||||
Under the Fee Limitation Agreement, PIMCO is entitled to reimbursement by each Fund of any portion of the Supervisory and Administrative Fee and/or Investment Advisory Fee waived, reduced or reimbursed pursuant to the Fee Limitation Agreement (the “Reimbursement Amount”) during the previous three years, provided that such amount paid to PIMCO will not: 1) together with any recoupment of organizational expenses and pro rata Trustees’ fees pursuant to the Expense Limitation Agreement, exceed the Expense Limit; 2) exceed the total Reimbursement Amount; or 3) include any amounts previously reimbursed to PIMCO. The Fee Limitation Agreement will automatically renew for one-year terms unless PIMCO provides written notice to the Trust at least 30 days prior to the end of the then current term.
PIMCO may be reimbursed for these waived amounts in future periods, not to exceed thirty-six months after the waiver. Expenses that have been waived may still be reimbursed by the Administrator, to the extent the Fund’s annualized total portfolio operating expenses plus the amount reimbursed does not exceed the operating expense limitation. The recoverable amounts to PIMCO at December 31, 2011, were as follows (amounts in thousands):
| Fund Name | Recoverable Amounts | |||||
PIMCO Eqs Dividend Fund | $ | 3 | ||||
PIMCO EqS Emerging Markets Fund | 687 | |||||
PIMCO Emerging Multi-Asset Fund | 136 | |||||
PIMCO EqS Pathfinder FundTM | 3,365 | |||||
| DECEMBER 31, 2011 | SEMIANNUAL REPORT | 73 |
Table of Contents
Notes to Financial Statements (Cont.)
(f) Acquired Fund Fees and Expenses The Underlying PIMCO Fund expenses for the PIMCO Emerging Multi-Asset Fund are based upon an allocation of the PIMCO Emerging Multi-Asset Fund’s assets among the Underlying PIMCO Funds and upon the total annual operating expenses of the Institutional Class shares of these Underlying PIMCO Funds. Underlying PIMCO Fund expenses will vary with changes in the expenses of the Underlying PIMCO Funds, as well as allocation of the PIMCO Emerging Multi-Asset Fund’s assets.
PIMCO has contractually agreed, through October 31, 2012, to waive, first, the Investment Advisory Fee and, second, to the extent necessary, the Supervisory and Administrative Fee it receives from the PIMCO Emerging Multi-Asset Fund in an amount equal to the expenses attributable to Investment Advisory and Supervisory and Administrative Fees of Underlying PIMCO Funds indirectly incurred by the Fund in connection with the Fund’s investments in Underlying PIMCO Funds, to the extent the Investment Advisory Fee and Supervisory and Administrative Fees taken together are greater than or equal to the Investment Advisory Fees and Supervisory and Administrative Fees of the Underlying PIMCO Funds. This agreement renews annually for a full year unless terminated by PIMCO upon at least 30 days’ notice prior to the end of the contract term. The waivers are reflected in the Statement of Operations as a component of
Waiver and/or Reimbursement by PIMCO. For the period ended December 31, 2011, the amount was $118,418.
Each Commodity Subsidiary has entered into a separate contract with PIMCO for the management of each Commodity Subsidiary’s portfolio pursuant to which the Commodity Subsidiary pays PIMCO a management fee and administrative services fee at the annual rates of 0.49% and 0.20%, respectively, of its net assets. PIMCO has contractually agreed to waive the Investment Advisory Fee and Supervisory and Administrative Fees it receives from each Commodity Subsidiary in an amount equal to the management fee and administrative services fee, respectively, paid to PIMCO by each Commodity Subsidiary. This waiver may not be terminated by PIMCO and will remain in effect for as long as PIMCO’s contract with each Commodity Subsidiary is in place. The waiver is reflected in the Consolidated Statements of Operations as a component of Waiver and/or Reimbursement by PIMCO. During the period ended December 31, 2011, the Fund below waived the following fees (amounts in thousands):
| Fund Name | Waived Fees | |||||
PIMCO EqS Pathfinder FundTM | $ | 106 | ||||
9. RELATED PARTY TRANSACTIONS
The Adviser, Administrator, and Distributor are related parties. Fees payable to these parties are disclosed in Note 8 and the accrued related party fees amounts are disclosed on the Statements of Assets and Liabilities.
The PIMCO Emerging Multi-Asset Fund may invest assets in Institutional Class shares of the Underlying PIMCO Funds. The Underlying PIMCO Funds are considered to be affiliated with the PIMCO Emerging Multi-Asset Fund. The table below shows the transactions in and earnings from investments in these affiliated Funds for the period ended December 31, 2011 (amounts in thousands):
PIMCO Emerging Multi-Asset Fund
| Underlying PIMCO Funds | Market Value 06/30/2011 | Purchases at Cost | Proceeds from Sales | Net Capital and Realized (Loss) | Change in Unrealized Appreciation (Depreciation) | Market Value 12/31/2011 | Dividend Income | |||||||||||||||||||||||
PIMCO Emerging Local Bond Fund | $ | 1,953 | $ | 6,423 | $ | 0 | $ | 0 | $ | (395 | ) | $ | 7,981 | $ | 122 | |||||||||||||||
PIMCO Emerging Markets Bond Fund | 742 | 6,112 | 0 | 0 | 34 | 6,888 | 52 | |||||||||||||||||||||||
PIMCO Emerging Markets Corporate Bond Fund | 1,330 | 1,745 | (1,890 | ) | (101 | ) | 29 | 1,113 | 55 | |||||||||||||||||||||
PIMCO Emerging Markets Currency Fund | 1,003 | 2,154 | (2,180 | ) | (186 | ) | (45 | ) | 746 | 14 | ||||||||||||||||||||
PIMCO EqS Emerging Markets Fund | 5,229 | 8,530 | 0 | 0 | (2,300 | ) | 11,459 | 41 | ||||||||||||||||||||||
PIMCO Short-Term Floating NAV Portfolio | 1,401 | 29,408 | (24,700 | ) | (2 | ) | 1 | 6,108 | 8 | |||||||||||||||||||||
Totals | $ | 11,658 | $ | 54,372 | $ | (28,770 | ) | $ | (289 | ) | $ | (2,676 | ) | $ | 34,295 | $ | 292 | |||||||||||||
Each Fund may invest in the PIMCO Short-Term Floating NAV Portfolio to the extent permitted by the Act and rules thereunder. The PIMCO Short-Term Floating NAV Portfolio is a registered investment company created for use solely by the series of the Trust and series of the PIMCO Funds, PIMCO Variable Insurance Trust, PIMCO ETF Trust, PIMCO Equity Series VIT, and other series of registered investment companies advised by PIMCO, in connection with their cash management activities. The PIMCO Short-Term Floating NAV Portfolio may incur expenses related to its investment activities, but does not pay Investment Advisory or Supervisory and Administrative Fees to PIMCO. The PIMCO Short-Term Floating NAV Portfolio is considered to be affiliated with the Funds. The table below shows each Fund’s transactions in and earnings from investments in the PIMCO Short-Term Floating NAV Portfolio for the period ended December 31, 2011 (amounts in thousands):
| Fund Name | Market Value 06/30/2011 | Purchases at Cost | Proceeds from Sales | Net Capital and Realized Gain(Loss) | Change in Unrealized Appreciation | Market Value 12/31/2011 | Dividend Income | |||||||||||||||||||||||
PIMCO EqS Dividend Fund | $ | 0 | $ | 18,401 | $ | (10,900 | ) | $ | 1 | $ | 1 | $ | 7,503 | $ | 1 | |||||||||||||||
PIMCO EqS Emerging Markets Fund | 65,549 | 267,238 | (228,300 | ) | (50 | ) | 12 | 104,449 | 138 | |||||||||||||||||||||
PIMCO EqS Pathfinder FundTM | 139,763 | 601,905 | (585,500 | ) | (113 | ) | 18 | 156,073 | 305 | |||||||||||||||||||||
10. GUARANTEES AND INDEMNIFICATIONS
Under the Trust’s organizational documents, each Trustee or officer of the Trust is indemnified and each employee or other agent of the Trust (including the Trust’s investment manager) may be indemnified, to the extent permitted by the Act, against certain liabilities that may arise out of performance of their duties to the Funds. Additionally, in the normal course of business, the Funds enter into contracts that contain a variety of indemnification clauses. The Funds’ maximum exposure under these arrangements is unknown as this would involve future
claims that may be made against the Funds that have not yet occurred. However, the Funds have not had prior claims or losses pursuant to these contracts.
11. PURCHASES AND SALES OF SECURITIES
The length of time a Fund has held a particular security is not generally a consideration in investment decisions. A change in the securities held by a Fund is known as “portfolio turnover.” A Fund may engage in frequent and active trading of portfolio securities to achieve its investment objective, particularly
| 74 | PIMCO EQUITY SERIES |
Table of Contents
December 31, 2011 (Unaudited)
during periods of volatile market movements. High portfolio turnover (e.g., over 100%) involves correspondingly greater expenses to a Fund, including brokerage commissions or dealer mark-ups and other transaction costs on the sale of securities and reinvestments in other securities. Such sales may also result in realization of taxable capital gains, including short-term capital gains (which are generally taxed at ordinary income tax rates). The trading costs and tax effects associated with portfolio turnover may adversely affect a Fund’s performance. The portfolio turnover rates are reported in the Financial Highlights.
Purchases and sales of securities (excluding short-term instruments) for the period ended December 31, 2011, were as follows (amounts in thousands):
| Fund Name | Purchases | Sales | ||||||||
PIMCO Dividend and Income Builder Fund | $ | 5,200 | $ | 1,017 | ||||||
PIMCO EqS Dividend Fund | 46,447 | 1,466 | ||||||||
PIMCO EqS Emerging Markets Fund | 315,634 | 146,321 | ||||||||
PIMCO Emerging Multi-Asset Fund | 26,546 | 4,075 | ||||||||
PIMCO EqS Pathfinder FundTM | 1,011,283 | 267,660 | ||||||||
12. SHARES OF BENEFICIAL INTEREST
The Trust may issue an unlimited number of shares of beneficial interest with a $0.0001 par value. Changes in shares of beneficial interest were as follows (shares and amounts in thousands):
| PIMCO Dividend and Income Builder Fund | PIMCO EqS Dividend Fund | PIMCO EqS Emerging Market Fund | ||||||||||||||||||||||||||||||||
| Period from 12/14/2011 to 12/31/2011 | Period from 12/14/2011 to 12/31/2011 | Six Months Ended 12/31/2011 | Period from 03/22/2011 to 06/30/2011 | |||||||||||||||||||||||||||||||
| Shares | Amount | Shares | Amount | Shares | Amount | Shares | Amount | |||||||||||||||||||||||||||
Receipts for shares sold | ||||||||||||||||||||||||||||||||||
Institutional Class | 507 | $ | 5,067 | 5,291 | $ | 53,000 | 26,950 | $ | 229,892 | 34,968 | $ | 368,990 | ||||||||||||||||||||||
Class P | 1 | 10 | 1 | 10 | 12 | 107 | 4 | 36 | ||||||||||||||||||||||||||
Administrative Class | 0 | 0 | 0 | 0 | 53 | 454 | 1 | 11 | ||||||||||||||||||||||||||
Class D | 1 | 10 | 1 | 10 | 734 | 6,149 | 115 | 1,192 | ||||||||||||||||||||||||||
Class A | 37 | 375 | 1 | 10 | 121 | 1,059 | 90 | 943 | ||||||||||||||||||||||||||
Class C | 1 | 10 | 1 | 10 | 52 | 435 | 11 | 114 | ||||||||||||||||||||||||||
Class R | 1 | 10 | 1 | 10 | 1 | 6 | 4 | 39 | ||||||||||||||||||||||||||
Issued as reinvestment of distributions | ||||||||||||||||||||||||||||||||||
Institutional Class | 0 | 4 | 0 | 7 | 201 | 1,606 | 0 | 0 | ||||||||||||||||||||||||||
Class P | 0 | 0 | 0 | 0 | 0 | 0 | 0 | 0 | ||||||||||||||||||||||||||
Administrative Class | 0 | 0 | 0 | 0 | 0 | 0 | 0 | 0 | ||||||||||||||||||||||||||
Class D | 0 | 0 | 0 | 0 | 3 | 22 | 0 | 0 | ||||||||||||||||||||||||||
Class A | 0 | 0 | 0 | 0 | 0 | 2 | 0 | 0 | ||||||||||||||||||||||||||
Class C | 0 | 0 | 0 | 0 | 0 | 0 | 0 | 0 | ||||||||||||||||||||||||||
Class R | 0 | 0 | 0 | 0 | 0 | 0 | 0 | 0 | ||||||||||||||||||||||||||
Cost of shares redeemed | ||||||||||||||||||||||||||||||||||
Institutional Class | 0 | 0 | 0 | 0 | (800 | ) | (6,716 | ) | (312 | ) | (3,125 | ) | ||||||||||||||||||||||
Class P | 0 | 0 | 0 | 0 | 0 | 0 | 0 | 0 | ||||||||||||||||||||||||||
Administrative Class | 0 | 0 | 0 | 0 | (54 | ) | (449 | ) | 0 | 0 | ||||||||||||||||||||||||
Class D | 0 | 0 | 0 | 0 | (74 | ) | (622 | ) | (9 | ) | (93 | ) | ||||||||||||||||||||||
Class A | 0 | 0 | 0 | 0 | (59 | ) | (512 | ) | (15 | ) | (148 | ) | ||||||||||||||||||||||
Class C | 0 | 0 | 0 | 0 | (13 | ) | (105 | ) | (1 | ) | (13 | ) | ||||||||||||||||||||||
Class R | 0 | 0 | 0 | 0 | 0 | 0 | 0 | 0 | ||||||||||||||||||||||||||
Net increase resulting from Fund share transactions | 548 | $ | 5,486 | 5,296 | $ | 53,057 | 27,127 | $ | 231,328 | 34,856 | $ | 367,946 | ||||||||||||||||||||||
| DECEMBER 31, 2011 | SEMIANNUAL REPORT | 75 |
Table of Contents
Notes to Financial Statements (Cont.)
December 31, 2011 (Unaudited)
| PIMCO Emerging Multi-Asset Fund | PIMCO EqS Pathfinder FundTM | |||||||||||||||||||||||||||||||||
| Six Months Ended 12/31/2011 | Period from 04/12/2011 to 06/30/2011 | Six Months Ended 12/31/2011 | Year Ended 06/30/2011 | |||||||||||||||||||||||||||||||
| Shares | Amount | Shares | Amount | Shares | Amount | Shares | Amount | |||||||||||||||||||||||||||
Receipts for shares sold | ||||||||||||||||||||||||||||||||||
Institutional Class | 1,756 | $ | 16,328 | 1,003 | $ | 10,035 | 70,811 | $ | 697,192 | 68,574 | $ | 713,828 | ||||||||||||||||||||||
Class P | 1,202 | 10,474 | 7 | 73 | 7,584 | 72,854 | 4,553 | 46,300 | ||||||||||||||||||||||||||
Administrative Class | 1 | 9 | 1 | 10 | 0 | 0 | 0 | 0 | ||||||||||||||||||||||||||
Class D | 246 | 2,308 | 310 | 3,096 | 638 | 6,446 | 2,482 | 25,154 | ||||||||||||||||||||||||||
Class A | 572 | 5,215 | 184 | 1,835 | 2,666 | 26,807 | 9,594 | 97,473 | ||||||||||||||||||||||||||
Class C | 152 | 1,356 | 66 | 658 | 718 | 6,995 | 4,446 | 45,561 | ||||||||||||||||||||||||||
Class R | 0 | 0 | 1 | 10 | 2 | 17 | 10 | 96 | ||||||||||||||||||||||||||
Issued as reinvestment of distributions | ||||||||||||||||||||||||||||||||||
Institutional Class | 12 | 102 | 0 | 0 | 1,955 | 18,970 | 806 | 8,169 | ||||||||||||||||||||||||||
Class P | 7 | 56 | 0 | 0 | 69 | 672 | 5 | 48 | ||||||||||||||||||||||||||
Administrative Class | 0 | 0 | 0 | 0 | 0 | 0 | 0 | 0 | ||||||||||||||||||||||||||
Class D | 1 | 8 | 0 | 0 | 16 | 157 | 17 | 170 | ||||||||||||||||||||||||||
Class A | 3 | 26 | 0 | 0 | 57 | 556 | 41 | 413 | ||||||||||||||||||||||||||
Class C | 1 | 4 | 0 | 0 | 20 | 195 | 13 | 131 | ||||||||||||||||||||||||||
Class R | 0 | 0 | 0 | 0 | 0 | 1 | 0 | 1 | ||||||||||||||||||||||||||
Cost of shares redeemed | ||||||||||||||||||||||||||||||||||
Institutional Class | (490 | ) | (4,443 | ) | (17 | ) | (167 | ) | (2,982 | ) | (28,779 | ) | (2,571 | ) | (26,117 | ) | ||||||||||||||||||
Class P | (141 | ) | (1,214 | ) | 0 | 0 | (1,193 | ) | (11,524 | ) | (359 | ) | (3,696 | ) | ||||||||||||||||||||
Administrative Class | (1 | ) | (5 | ) | 0 | 0 | 0 | 0 | 0 | 0 | ||||||||||||||||||||||||
Class D | (192 | ) | (1,668 | ) | (32 | ) | (312 | ) | (879 | ) | (8,491 | ) | (972 | ) | (10,042 | ) | ||||||||||||||||||
Class A | (95 | ) | (854 | ) | (2 | ) | (17 | ) | (3,621 | ) | (35,407 | ) | (2,891 | ) | (30,193 | ) | ||||||||||||||||||
Class C | (19 | ) | (184 | ) | 0 | (4 | ) | (731 | ) | (6,991 | ) | (381 | ) | (3,935 | ) | |||||||||||||||||||
Class R | 0 | 0 | 0 | 0 | 0 | 0 | (1 | ) | (12 | ) | ||||||||||||||||||||||||
Net increase resulting from Fund share transactions | 3,015 | $ | 27,518 | 1,521 | $ | 15,217 | 75,130 | $ | 739,670 | 83,366 | $ | 863,349 | ||||||||||||||||||||||
13. REGULATORY AND LITIGATION MATTERS
The Trust is not engaged in any material litigation or arbitration proceedings and is not aware of any material litigation or claim pending or threatened by or against it.
14. FEDERAL INCOME TAX MATTERS
The Funds intend to qualify as a regulated investment company under Subchapter M of the Internal Revenue Code (the “Code”) and distribute all of its taxable income and net realized gains, if applicable, to shareholders. Accordingly, no provision for Federal income taxes has been made.
In accordance with provisions set forth under U.S. GAAP, the Investment Adviser has reviewed the Funds’ tax positions for all open tax years. As of December 31, 2011, the Funds have recorded no liability for net unrecognized tax benefits relating to uncertain income tax positions they have taken or expect to take in future tax returns.
As of December 31, 2011, the aggregate cost and the net unrealized appreciation/(depreciation) of investments for federal income tax purposes are as follows (amounts in thousands):
| Fund Name | Unrealized Appreciation | Unrealized (Depreciation) | Net Unrealized Appreciation/ (Depreciation) (1) | |||||||||||
PIMCO Dividend and Income Builder Fund | $ | 110 | $ | (6 | ) | $ | 104 | |||||||
PIMCO EqS Dividend Fund | 1,099 | (56 | ) | 1,043 | ||||||||||
PIMCO EqS Emerging Markets Fund | 5,460 | (61,720 | ) | (56,260 | ) | |||||||||
PIMCO Emerging Multi-Asset Fund | 92 | (3,687 | ) | (3,595 | ) | |||||||||
PIMCO EqS Pathfinder FundTM | 125,221 | (162,480 | ) | (37,259 | ) | |||||||||
| (1) | Primary differences, if any, between book and tax net unrealized appreciation/(depreciation) are attributable to wash sale loss deferrals and accelerated recognition of unrealized gain on certain futures, options and forward contracts for federal income tax purposes. |
15. SUBSEQUENT EVENTS
The investment adviser has evaluated the possibility of subsequent events and has determined that there are no material events that would require disclosure in the Funds’ financial statements.
| 76 | PIMCO EQUITY SERIES |
Table of Contents
Glossary: (abbreviations that may be used in the preceding statements)
(Unaudited)
Counterparty Abbreviations: | ||||||||||
| BOA | Bank of America N.A. | GST | Goldman Sachs International | MYC | Morgan Stanley Capital Services, Inc. | |||||
| BPS | BNP Paribas S.A. | HUS | HSBC Bank USA N.A. | MYI | Morgan Stanley & Co. International PLC | |||||
| BRC | Barclays Bank PLC | JPM | JPMorgan Chase Bank N.A. | RBC | Royal Bank of Canada | |||||
| CBK | Citibank N.A. | MEI | Merrill Lynch International | RYL | Royal Bank of Scotland Group PLC | |||||
| DUB | Deutsche Bank AG | MSC | Morgan Stanley & Co., Inc. | UAG | UBS AG Stamford | |||||
| FBF | Credit Suisse International | MSX | Morgan Stanley Capital Group, Inc. | ULO | UBS AG London | |||||
| FBL | Credit Suisse AG | |||||||||
Currency Abbreviations: | ||||||||||
| AUD | Australian Dollar | HUF | Hungarian Forint | PLN | Polish Zloty | |||||
| BRL | Brazilian Real | IDR | Indonesian Rupiah | RUB | Russian Ruble | |||||
| CAD | Canadian Dollar | ILS | Israeli Shekel | SEK | Swedish Krona | |||||
| CHF | Swiss Franc | INR | Indian Rupee | SGD | Singapore Dollar | |||||
| CNY | Chinese Renminbi | JPY | Japanese Yen | THB | Thai Baht | |||||
| CZK | Czech Koruna | KRW | South Korean Won | TRY | Turkish New Lira | |||||
| DKK | Danish Krone | MXN | Mexican Peso | TWD | Taiwanese Dollar | |||||
| EUR | Euro | MYR | Malaysian Ringgit | USD | United States Dollar | |||||
| GBP | British Pound | NOK | Norwegian Krone | ZAR | South African Rand | |||||
| HKD | Hong Kong Dollar | PHP | Philippine Peso | |||||||
Exchange Abbreviations: | ||||||||||
| OTC | Over-the-Counter | |||||||||
Index Abbreviations: | ||||||||||
| CDX.IG | Credit Derivatives Index - Investment Grade | |||||||||
Other Abbreviations: | ||||||||||
| EURIBOR | Euro Interbank Offered Rate | MSCI | Morgan Stanley Capital International | SP - GDR | Sponsored Global Depositary Receipt | |||||
| GDR | Global Depositary Receipt | SP - ADR | Sponsored American Depositary Receipt | SPDR | Standard & Poor’s Depository Receipts | |||||
| LIBOR | London Interbank Offered Rate | |||||||||
| DECEMBER 31, 2011 | SEMIANNUAL REPORT | 77 |
Table of Contents
(Unaudited)
A special meeting of shareholders of the PIMCO Emerging Multi-Asset Fund, PIMCO EqS Emerging Markets Fund and PIMCO EqS Pathfinder Fund (the “Funds”), each a series of the Trust, was held on October 24, 2011 at 10:00 a.m., Pacific time, at 800 Newport Center Drive, 6th Floor, Newport Beach, California 92660, pursuant to notice duly given to shareholders of the Funds contained in the definitive proxy statement filed with the Securities and Exchange Commission on September 20, 2011 (the “Meeting”).
At the Meeting, shareholders were asked to provide voting instructions to elect three Trustees to the Board of Trustees. The results of the shareholder vote were as follows:
| Affirmative | Withheld Authority | Total | ||||
Election of Allan B. Hubbard | 231,108,262.5936 | 3,897,163.1424 | 235,005,425.7360 | |||
Election of Neel T. Kashkari | 230,924,170.2715 | 4,081,255.4645 | 235,005,425.7360 | |||
Election of Peter B. McCarthy | 231,451,774.9713 | 3,553,650.7647 | 235,005,425.7360 |
The other members of the Board of Trustees at the time of the Meeting, E. Philip Cannon, Vern O. Curtis and Brent R. Harris, continue to serve as Trustees.
| 78 | PIMCO EQUITY SERIES |
Table of Contents
Approval of Renewal of the Investment Advisory Contract and Amended and Restated Supervision and Administration Agreement
(Unaudited)
On August 15, 2011, the Board of Trustees (the “Board”) of PIMCO Equity Series (the “Trust”), including all of the independent Trustees, approved the Investment Advisory Contract and Amended and Restated Supervision and Administration Agreement (the “Supervision and Administrative Agreement” and together with the Investment Advisory Contract, the “Agreements”) with Pacific Investment Management Company LLC (“PIMCO”), on behalf of the Trust’s series (the “Funds”), for an additional one-year term through August 31, 2012.
On November 7, 2011, the Board of the Trust, including all of the independent Trustees, approved the Investment Advisory Contract and the Supervision and Administrative Agreement (the “New Funds’ Agreements”) on behalf of the PIMCO Dividend and Income Builder Fund and PIMCO EqS Dividend Fund (the “New Funds”), for an initial two year term.
The information, material factors and conclusions that formed the basis for the Board’s approvals are described below.
| 1. | Information Received |
| A. | Materials Reviewed |
During the course of each year, the Trustees receive a wide variety of materials relating to the services provided by PIMCO. At each of its quarterly meetings, the Board reviews the Funds’ investment performance and a significant amount of information relating to Fund operations, including the Funds’ compliance program, shareholder services, valuation, custody, distribution, and other information relating to the nature, extent and quality of services provided by PIMCO to the Trust. In considering whether to approve the renewal of the Agreements, the Board also reviewed supplementary information, including, but not limited to, comparative industry data with regard to investment performance, advisory and supervisory and administrative fees and expenses, financial information regarding PIMCO, information about the personnel providing investment management services and supervisory and administrative services to the Funds and information about the fees charged and services provided by PIMCO to other clients with similar investment mandates as the Funds. The Board also reviewed material provided by counsel to the Trust and the independent Trustees, which included, among other things, a memorandum outlining legal duties of the Board in considering the continuation of the Agreements.
In considering whether to approve the New Funds’ Agreements, the Board reviewed materials provided by PIMCO, which included, among other things, comparative industry data with regard to expense ratios of funds with investment objectives and policies similar to those of the New Funds. The Board also reviewed material provided by counsel to the Trust and the independent Trustees, which included, among other things, a memorandum outlining legal duties of the Board. The Board also reviewed information about the personnel who would be providing investment management and administrative services to the New Funds.
| B. | Review Process |
In connection with the approval of the renewal of the Agreements, the Board reviewed written materials prepared by PIMCO in response to a request from counsel to the Trust. The Board also requested and received assistance and advice regarding applicable legal standards from Trust counsel, and reviewed comparative fee and performance data prepared at the Board’s request by Lipper, Inc. (“Lipper”), an independent provider of investment company performance and fee and expense data. The Board also heard oral presentations on matters related to the Agreements and met both as a full Board and as the independent Trustees, without management present, at the August 15, 2011 meeting. The independent Trustees also met with counsel to the Trust on August 4, 2011 to discuss the materials presented.
In connection with the approval of the New Funds’ Agreements, the Board reviewed written materials prepared by PIMCO, which included, among other things, comparative fee data for funds in the appropriate Lipper peer group. The Board also heard oral presentations on matters related to the applicable New Funds’ Agreements and the November 7, 2011 meeting.
The approval determinations were made on the basis of each Trustee’s business judgment after consideration of all the information presented. Individual Trustees may have given different weights to certain factors and assigned various degrees of materiality to information received in connection with the approval process. In deciding to approve the renewal of the Agreements and to approve the New Funds’ Agreements, the Board did not identify any single factor or particular information that, in isolation, was controlling. This summary describes the most important, but not all, of the factors considered by the Board.
| 2. | Nature, Extent and Quality of Services |
| A. | PIMCO, its Personnel, and Resources |
The Board considered the depth and quality of PIMCO’s investment management process, including: the experience, capability and integrity of its senior management and other personnel; the low turnover rates of its key personnel; the overall financial strength and stability of its organization; and the ability of its organizational structure to address the recent growth in assets under management. The Board also considered that PIMCO makes available to its investment professionals a variety of resources and systems relating to investment management, compliance, trading, performance and portfolio accounting. The Board noted that PIMCO has hired and will seek to hire additional personnel with equity experience, including traders, research analysts and compliance personnel to supplement existing PIMCO personnel. The Board considered PIMCO’s commitment to investing in information technology supporting investment management and compliance, as well as PIMCO’s continuing efforts to attract and retain qualified personnel and to maintain and enhance its resources and systems. The Board considered PIMCO’s policies, procedures and systems to assure compliance with applicable laws and regulations and its commitment to these programs; its efforts to keep the Trustees informed about matters relevant to the Funds and their shareholders; and its attention to matters that may involve conflicts of interest.
The Trustees considered the steps that PIMCO has taken in recent years with respect to active management of counterparty risk, such as implementing procedures requiring daily collateral adjustments and frequent communication between credit analysts and the counterparty risk committee. The Trustees considered that, over the last year, PIMCO has continued to strengthen the process it uses to assess the financial stability of broker-dealers with which the Funds do business, to manage collateral and to protect portfolios from an unforeseen deterioration in the creditworthiness of trading counterparties. The Trustees considered that PIMCO continued to invest in automated documentation management systems to better track trade documentation with broker-dealers.
The Trustees also considered new services and service enhancements that PIMCO has implemented since the Agreements were approved in 2010 in connection with the launch of the PIMCO EqS Pathfinder FundTM, including, but not limited to, undertaking significant technology initiatives; assuming responsibility for certain sub-administration services and decoupling from the Allianz Funds; broadening the PIMCO Retail Oversight (“PRO”) group to include oversight of institutional classes; implementing a quality management system for processes/activities; converting to a prospectus content management system; developing a “Pricing Portal” to streamline and automate certain pricing functions; continuing to implement fair valuation level assignments per FAS 157; planning to outsource net asset value delivery to another service
| DECEMBER 31, 2011 | SEMIANNUAL REPORT | 79 |
Table of Contents
Approval of Renewal of the Investment Advisory Contract and Amended and Restated Supervision and Administration Agreement (Cont.)
provider to accelerate delivery timing to intermediaries; improving the review of Boston Financial Data Services’ large trade processing; implementing new cost basis reporting obligations; establishing a new Funds’ website; and creating the PIMCO Risk Committee, which is the global risk oversight committee at PIMCO.
Ultimately, the Board concluded that the nature, extent and quality of services provided by PIMCO under the Agreements has benefited and will likely continue to benefit the Funds and their shareholders and the services to be provided by PIMCO under the New Funds’ Agreements are likely to benefit the New Funds and their shareholders.
| B. | Other Services |
The Board considered PIMCO’s policies, procedures and systems to assure compliance with applicable laws and regulations and its commitment to these programs; its efforts to keep the Trustees informed about matters relevant to each Fund and its shareholders; and its attention to matters that may involve conflicts of interest. The Board also considered the nature, extent, quality and cost of supervisory and administrative services provided by PIMCO to the Funds under the Agreements.
The Board considered the terms of Trust’s Supervision and Administration Agreement, under which each Fund pays for the supervisory and administrative services it requires under what is essentially an all-in fee structure (the “unified fee”). In return, PIMCO provides or procures supervisory and administrative services and bears the costs of various third party services required by the Funds, including audit, custodial, portfolio accounting, legal, transfer agency and printing costs. The Board considered PIMCO’s provision of these services and its supervision of the Trust’s third party service providers.
Ultimately, the Board concluded that the nature, extent and quality of the services provided by PIMCO has benefited and will likely continue to benefit the Funds and their shareholders.
With respect to the New Funds, the Board also considered the nature, extent, quality and cost of administrative and shareholder services provided by PIMCO to other series of the Trust under the Agreements. The Board considered the terms of the Trust’s Supervision and Administration Agreement, under which the Trust pays a unified fee. The Board concluded that the nature, extent and quality of the services to be provided by PIMCO would likely benefit the New Funds and their shareholders.
| 3. | Investment Performance |
As the New Funds had not yet commenced operations at the time the New Funds’ Agreements were considered, the Trustees did not receive or consider investment performance information.
The Board received and examined information from PIMCO concerning the Funds’ performance, as available, for the one-year and since inception periods ended May 31, 2011 and other performance data, as available, for the periods ended June 30, 2011 (the “PIMCO Report”) and from Lipper concerning the Funds’ performance, as available, for the periods ended May 31, 2011 (the “Lipper Report”). The Board noted that long-term performance information was not available due to each Fund’s relatively recent commencement of operations. The Board considered each Fund’s investment performance relative to its peer group and benchmark index as provided to the Board in advance of each of its quarterly meetings throughout the year, including the PIMCO Report and the Lipper Report, which were provided in advance of the August 15, 2011 meeting.
The Board discussed with PIMCO the reasons for the PIMCO EqS Pathfinder FundTM’s underperformance in comparison to its benchmark index and Lipper
peer group. Although the PIMCO EqS Pathfinder FundTM had underperformed in comparison to its benchmark index, the Board noted that the Fund had outperformed its benchmark index during periods of market downturn. The Board also considered the risk-adjusted performance of the PIMCO EqS Pathfinder FundTM and noted that the Fund compared favorably to competitor funds.
The Board ultimately determined within the context of all of its considerations in connection with the Agreements, that PIMCO’s performance record and process in managing the Funds indicates that its continued management is likely to benefit the Funds and their shareholders, and merits the approval of the continuation of the Agreements.
| 4. | Advisory Fees, Supervisory and Administrative Fees and Total Expenses |
PIMCO reported to the Board that, in proposing fees for the Funds, it considers a number of factors, including the type and complexity of the services to be provided, the cost of providing services, the risk assumed by PIMCO in the provision of services, the impact on potential returns from different levels of fees, the competitive marketplace for financial products, and the attractiveness of returns to the Funds’ investors.
The Board reviewed the advisory fee, supervisory and administrative fee and total expenses of the Funds (each as a percentage of average net assets) and compared such amounts with the average and median fees and expenses of other similar funds. With respect to advisory fees, the Board reviewed data from Lipper that compared the average and median advisory fees of other funds in a “Peer Group Expense Comparison” of comparable funds, as well as the universe of other similar funds. The Board compared each Fund’s total expenses to other funds in the Peer Group Expense Comparison provided by Lipper and found each Fund’s total expenses to be reasonable. The Board noted that PIMCO had contractually agreed, through October 31, 2012, to reduce its advisory fee by 0.16% and 0.20% of the average daily net assets of the PIMCO EqS Pathfinder FundTM and PIMCO EqS Emerging Markets Fund, respectively.
With respect to the New Funds, the Board reviewed the proposed advisory fee, supervisory and administrative fee and estimated total expenses of each New Fund (each as a percentage of average net assets) and compared such amounts with the average and median fees and expenses of other similar funds. With respect to advisory fees, the Board reviewed data from Lipper that compared the average and median advisory fees of other funds in a “Peer Group Expense Comparison” of comparable funds, as well as the universe of other similar funds. The Board compared the New Funds’ total expenses to other funds in the Peer Group Expense Comparison provided by Lipper and found the New Funds’ total expenses to be reasonable.
The Board also reviewed data comparing the PIMCO EqS Pathfinder FundTM’s advisory fees to the standard fee rate PIMCO charges to separate accounts and other investment companies with a similar investment strategy. In cases where the advisory fees for certain separate account clients were lower than those charged to the PIMCO EqS Pathfinder FundTM, the Trustees noted that the differences in fees were attributable to various factors, including differences in the services provided by PIMCO to the Fund, the manner in which similar portfolios may be managed, different requirements with respect to liquidity management and the implementation of other regulatory requirements, and the fact that separate accounts may have other contractual arrangements that justify different levels of fees. At the time that the Board considered the Agreements, PIMCO did not manage any separate accounts with investment strategies similar to those of the PIMCO Emerging Multi-Asset Fund and PIMCO EqS Emerging Markets Fund.
The Board considered each Fund’s supervisory and administrative fees, comparing them to similar funds in the report supplied by Lipper. The Board considered that PIMCO has provided a broad array of fund supervisory and administrative functions. The Board also considered the Trust’s unified fee structure, under which each Fund pays for the supervisory and administrative
| 80 | PIMCO EQUITY SERIES |
Table of Contents
(Unaudited)
services it requires for one set fee, and in return, PIMCO provides or procures supervisory and administrative services and bears the costs of various third party services required by the Fund, including audit, custodial, portfolio accounting, legal, transfer agency and printing costs. The Board noted that many other funds pay for these services separately, and thus it is difficult to directly compare each Fund’s unified supervisory and administrative fees with the fees paid by other funds for administrative services alone. The Board noted that the unified supervisory and administrative fee leads to fund fees that are fixed, rather than variable, and that fixed fees were viewed by many in the industry as a positive attribute of the Funds. The Board concluded that the Funds’ supervisory and administrative fees were reasonable in relation to the value of the services provided, including the services provided to different classes of shareholders, and that the expenses assumed contractually by PIMCO under the Supervision and Administration Agreement represent, in effect, a cap on overall fund expenses which is beneficial to the Funds and their shareholders. The Board further noted that, although the unified fee structure does not have break points, it implicitly reflects economies of scale by fixing the absolute level of Fund fees at competitive levels, in effect, setting the fees as if a Fund was already at scale.
With respect to the New Funds, the Board noted that PIMCO does not currently manage any separate accounts with investment strategies similar to those of the New Funds.
The Trustees also considered the advisory fees charged to the PIMCO Emerging Multi-Asset Fund, which operates as a fund of funds (the “Fund of Funds”), and the advisory services provided in exchange for such fees. The Trustees determined that such services were in addition to the advisory services provided to the underlying series in which the Fund of Funds may invest and, therefore, such services were not duplicative of the advisory services provided to the underlying series. The Board also considered the various fee waiver agreements in place for the Fund of Funds.
In connection with the approval of the New Funds’ Agreements, the Board also considered the Trust’s unified fee structure and the services to be provided under the New Funds’ Agreements. The Board concluded that the New Funds’ proposed supervisory and administrative fees were reasonable in relation to the value of the services to be provided, including the services provided to different classes of shareholders, and that the expenses assumed contractually by PIMCO under the Supervision and Administration Agreement represent, in effect, a cap on fund expense ratios that would be beneficial to the New Funds and their shareholders. The Board further noted that, although the unified fee structure does not have break points, it implicitly reflects economies of scale by fixing the absolute level of each New Fund’s expenses at competitive levels. The Board noted that PIMCO proposed to add the New Funds to the Expense Limitation Agreement currently in effect for certain other Funds. The Board noted that PIMCO had contractually agreed, through October 31, 2013, to reduce its advisory fee by 0.16% of the average daily net assets of the PIMCO Dividend and Income Builder Fund and PIMCO EqS Dividend Fund, respectively.
Based on the information presented by PIMCO and Lipper, members of the Board then determined, in the exercise of their business judgment, that the level of the advisory and supervisory and administrative fees charged by PIMCO, as well as the total expenses of the Funds, are reasonable and renewal of the Agreements would likely benefit the Funds and their shareholders.
With respect to the New Funds, based on the information presented by PIMCO, members of the Board then determined, in the exercise of their business judgment, that the level of the advisory and supervisory and administrative fees to be charged by PIMCO, as well as the estimated total expenses of the New Funds, are reasonable and approval of the New Funds’ Agreements would likely benefit each New Fund and its shareholders.
| 5. | Adviser Costs, Level of Profits and Economies of Scale |
As the New Funds are newly organized, information regarding PIMCO’s costs in providing services to the New Funds and the profitability of PIMCO’s relationship with the New Funds was not available.
The Board reviewed information regarding PIMCO’s costs of providing services to the Funds as a whole and considered that PIMCO continues to invest in the equity asset management platform and does not expect to derive any profit from the Funds during their current fiscal year. The Board noted that it had also received information regarding the structure and manner in which PIMCO’s investment professionals were compensated, and PIMCO’s view of the relationship of such compensation to the attraction and retention of quality personnel. The Board considered PIMCO’s need to invest in technology, infrastructure and staff to reinforce and offer new services and to accommodate changing regulatory requirements.
With respect to potential economies of scale, the Board found that because the unified fee protects shareholders against unanticipated increases in expense ratios due to redemptions, declines in asset values, or increases in the costs of services provided or procured by PIMCO, economies of scale are implicitly recognized in the level of the unified fee (which, together with the advisory fee, serves as a proxy for each Fund’s overall expense ratio). The Board noted that PIMCO may share the benefits of economies of scale with the Funds and their shareholders in a number of ways, including through fee reductions or waivers, the pricing of the Funds to scale from inception and the enhancement of services provided in return for fees paid. The Trustees also considered that the unified fee has provided inherent economies of scale by maintaining fixed fees even if the Funds’ operating costs rise.
The Board concluded that the Funds’ cost structures and the New Funds’ proposed cost structures were reasonable and that the unified fee structure inherently involves the sharing of economies of scale between PIMCO and the Funds and the New Funds, to the benefit of shareholders.
| 6. | Ancillary Benefits |
The Board considered other benefits received by PIMCO and its affiliates as a result of PIMCO’s relationship with the Trust, including possible ancillary benefits to PIMCO’s institutional investment management business due to the reputation and market penetration of the Funds. The Board also considered that affiliates of PIMCO will provide distribution and shareholder services to the Funds and their shareholders, for which the affiliates of PIMCO may be compensated under the unified supervisory and administrative fee, or through distribution fees paid pursuant to the Funds’ Rule 12b-1 plans. The Board also reviewed PIMCO’s soft dollar policies and procedures, noting that while PIMCO has the authority to receive the benefit of research provided by broker-dealers executing portfolio transactions on behalf of the Funds, it has adopted a policy not to enter into contractual soft dollar arrangements.
| 7. | Conclusions |
Based on its review, including its consideration of each of the factors referred to above, the Board concluded that the nature, extent and quality of the services rendered to the Funds by PIMCO continued to be excellent and favored the renewal of the Agreements. The Board concluded that the Agreements continued to be fair and reasonable to the Funds and their shareholders, that the Funds’ shareholders received reasonable value in return for the advisory fees and other amounts paid to PIMCO by the Funds, and that the approval of the Agreements was in the best interests of the Funds and their shareholders.
With respect to the New Funds, based on its review, including its consideration of each of the factors referred to above, the Board concluded that the New Funds’ Agreements were fair and reasonable to the New Funds and their shareholders, that the New Funds’ shareholders would likely receive reasonable value in return for the advisory fees and other amounts paid to PIMCO by each New Fund, and that the approval of the New Funds’ Agreements was in the best interests of the New Funds and their shareholders.
| DECEMBER 31, 2011 | SEMIANNUAL REPORT | 81 |
Table of Contents
General Information
Investment Adviser and Administrator
Pacific Investment Management Company LLC
840 Newport Center Drive
Newport Beach, CA 92660
Distributor
PIMCO Investments LLC
1633 Broadway
New York, NY 10019
Custodian
State Street Bank and Trust Company
801 Pennsylvania
Kansas City, MO 64105
Transfer Agent
Boston Financial Data Services, Inc.
P.O. Box 55060
Boston, MA 02205-8050
Legal Counsel
Dechert LLP
1775 I Street, N.W.
Washington, D.C. 20006
Independent Registered Public Accounting Firm
PricewaterhouseCoopers LLP
1100 Walnut Street
Kansas City, MO 64106
This report is submitted for the general information of the shareholders of the PIMCO Equity Series.
Table of Contents

Sign up for e-delivery
To get future prospectuses online
and to eliminate mailings, go to:
pimco.com/edelivery
pimco.com/investments

PES4001SAR_123111
Table of Contents
Item 2. | Code of Ethics. | |||||||
The information required by this Item 2 is only required in an annual report on this Form N-CSR. | ||||||||
Item 3. | Audit Committee Financial Expert. | |||||||
| The information required by this Item 3 is only required in an annual report on this Form N-CSR. | ||||||||
Item 4. | Principal Accountant Fees and Services. | |||||||
The information required by this Item 4 is only required in an annual report on this Form N-CSR. | ||||||||
Item 5. | Audit Committee of Listed Registrants. | |||||||
The information required by this Item 5 is only required in an annual report on this Form N-CSR. | ||||||||
Item 6. | Schedule of Investments. | |||||||
| The Schedule of Investments is included as part of the report to shareholders under Item 1. | ||||||||
Table of Contents
Item 7. | Disclosure of Proxy Voting Policies and Procedures for Closed-End Management Investment Companies. | |||||
| Not applicable. | ||||||
Item 8. | Portfolio Managers of Closed-End Management Investment Companies. | |||||
| Not applicable. | ||||||
Item 9. | Purchases of Equity Securities by Closed-End Management Investment Company and Affiliated Purchases. | |||||
| Not applicable. | ||||||
Item 10. | Submission of Matters to a Vote of Security Holders. | |||||
| Not applicable. | ||||||
Item 11. | Controls and Procedures. | |||||
| (a) | The principal executive officer and principal financial officer have concluded that the Registrant’s disclosure controls and procedures (as defined in Rule 30a-3(c) under the Investment Company Act of 1940, as amended (“1940 Act”)) provide reasonable assurances that material information relating to the Trust is made known to them by the appropriate persons, based on their evaluation of these controls and procedures as of a date within 90 days of the filing of this report. | |||||
| (b) | There were no changes in the Registrant’s internal control over financial reporting (as defined in Rule 30a-3(d) under the 1940 Act) that occurred during the second fiscal quarter of the period covered by this report that have materially affected, or are reasonably likely to materially affect, the Registrant’s internal control over financial reporting. | |||||
Item 12. | Exhibits. | |||||
(a)(1) | Exhibit 99.CODE—Code of Ethics is not applicable for semiannual reports. | |||||
(a)(2) | Exhibit 99.CERT—Certifications pursuant to Section 302 of the Sarbanes-Oxley Act of 2002. | |||||
(b) | Exhibit 99.906CERT—Certifications pursuant to Section 906 of the Sarbanes-Oxley Act of 2002. | |||||
Table of Contents
Signatures
Pursuant to the requirements of the Securities Exchange Act of 1934 and the Investment Company Act of 1940, the registrant has duly caused this report to be signed on its behalf by the undersigned, thereunto duly authorized.
| PIMCO Equity Series | ||
| By: | /s/ NEEL T. KASHKARI | |
| Neel T. Kashkari | ||
President and Trustee, Principal Executive Officer | ||
| Date: March 9, 2012 | ||
Pursuant to the requirements of the Securities Exchange Act of 1934 and the Investment Company Act of 1940, this report has been signed below by the following persons on behalf of the registrant and in the capacities and on the dates indicated.
| By: | /s/ NEEL T. KASHKARI | |
| Neel T. Kashkari | ||
President and Trustee, Principal Executive Officer | ||
| Date: March 9, 2012 | ||
| By: | /s/ JOHN P. HARDAWAY | |
| John P. Hardaway | ||
| Treasurer, Principal Financial Officer | ||
| Date: March 7, 2012 | ||