Table of Contents
UNITED STATES
SECURITIES AND EXCHANGE COMMISSION
Washington, D.C. 20549
FORM N-CSR
CERTIFIED SHAREHOLDER REPORT OF REGISTERED MANAGEMENT
INVESTMENT COMPANIES
Investment Company Act file number: 811-22375
PIMCO Equity Series
(Exact name of registrant as specified in charter)
840 Newport Center Drive, Newport Beach, CA 92660
(Address of principal executive offices)
John P. Hardaway
Treasurer and Principal Financial Officer
PIMCO Equity Series
840 Newport Center Drive
Newport Beach, CA 92660
(Name and address of agent for service)
Copies to:
Brendan C. Fox
Dechert LLP
1775 I Street, N.W.
Washington, D.C. 20006
Registrant’s telephone number, including area code: (888) 877-4626
Date of fiscal year end: June 30
Date of reporting period: June 30, 2012
Form N-CSR is to be used by management investment companies to file reports with the Commission not later than 10 days after the transmission to stockholders of any report that is required to be transmitted to stockholders under Rule 30e-1 under the Investment Company Act of 1940 (17 CFR 270.30e-1). The Commission may use the information provided on Form N-CSR in its regulatory, disclosure review, inspection, and policymaking roles.
A registrant is required to disclose the information specified by Form N-CSR, and the Commission will make this information public. A registrant is not required to respond to the collection of information contained in Form N-CSR unless the Form displays a currently valid Office of Management and Budget (“OMB”) control number. Please direct comments concerning the accuracy of the information collection burden estimate and any suggestions for reducing the burden to Secretary, Securities and Exchange Commission, 450 Fifth Street, NW, Washington, DC 20549-0609. The OMB has reviewed this collection of information under the clearance requirements of 44 U.S.C. § 3507.
Table of Contents
Item 1. | Reports to Stockholders. | |||||||
The following is a copy of the report transmitted to stockholders pursuant to Rule 30e-1 under the Investment Company Act of 1940, as amended (the “1940 Act”) (17 CFR 270.30e-1).
| • | PIMCO Equity Series—Institutional, P, Administrative, D, A, C and R Classes |
Table of Contents

Your Global Investment Authority
PIMCO Equity Series™
Annual Report
June 30, 2012

PIMCO Dividend and Income Builder Fund
PIMCO EqS™ Dividend Fund
PIMCO EqS™ Emerging Markets Fund
PIMCO EqS™ Long/Short Fund
PIMCO Emerging Multi-Asset Fund
PIMCO EqS Pathfinder Fund®
Share Classes
| n | Institutional |
| n | P |
| n | Administrative |
| n | D |
| n | A |
| n | C |
| n | R |

Table of Contents
| Page | ||||||
| 2 | ||||||
| 4 | ||||||
| 25 | ||||||
| 28 | ||||||
| 32 | ||||||
| 34 | ||||||
| 36 | ||||||
| 37 | ||||||
| 38 | ||||||
| 39 | ||||||
| 40 | ||||||
| 72 | ||||||
| 92 | ||||||
| 93 | ||||||
| 94 | ||||||
| 95 | ||||||
| 97 | ||||||
| 98 | ||||||
| Fund | Insights from the Portfolio Managers | Fund Summary | Schedule of Investments | |||||||||
| 5 | 7 | 41 | ||||||||||
| 8 | 10 | 47 | ||||||||||
| 11 | 13 | 51 | ||||||||||
| 14 | 16 | 59 | ||||||||||
| 17 | 20 | 61 | ||||||||||
| 21 | 24 | 65 | ||||||||||
This material is authorized for use only when preceded or accompanied by the current PIMCO Equity Series prospectus.
Table of Contents
Dear Shareholder,
Please find enclosed the Annual Report for the PIMCO Equity Series covering the twelve-month reporting period ended June 30, 2012. On the following pages are specific details about the investment performance of each fund and a discussion of the factors that influenced performance during the reporting period. In addition, the letters from the portfolio managers provide a further review of such factors as well as an overview of each fund’s investment strategy, philosophy, and process.
During our twelve-month reporting period, we expanded the PIMCO Equity Series with the introduction of three new active equity funds, including a long/short equity fund and two global dividend funds:
| n | PIMCO EqS Long/Short Fund, launched on April 20, 2012, is a concentrated, long-biased global equity strategy with a focus on both capital appreciation and capital preservation, which actively manages equity market exposure by adjusting the portfolio’s mix of long and short equity, and cash/cash equivalent positions. |
| n | PIMCO Dividend and Income Builder Fund, launched on December 14, 2011, is designed to be an integrated solution that provides current income, income growth, and long-term capital appreciation by investing in both dividend-paying equities and select fixed income securities from around the world. |
| n | PIMCO EqS Dividend Fund, launched on December 14, 2011, is designed for investors who prefer an equity-focused dividend strategy that seeks high current dividend income and capital appreciation. |
All of our active equity strategies are global, high-conviction portfolios that are unconstrained by geography, benchmark or market capitalization and incorporate downside risk management. Each strategy is managed by experienced equity investors who benefit from PIMCO’s global investment resources and macroeconomic insights.
We believe the long-term potential of equities to grow earnings and dividends is an important component of an investor’s overall portfolio. As such, we remain committed to a steady and focused build-out of PIMCO’s actively managed equity suite and look forward to keeping you informed of our progress.
Highlights of the financial markets during our twelve-month reporting period include:
| n | Global equity markets experienced volatility throughout the reporting period as investors oscillated between being “risk on” or “risk off” in response to a number of factors, including a slowing global economy, on-going concerns over the future of the eurozone, and continued social unrest in the Middle East and North Africa. U.S. equities, as measured by the S&P 500 Index, returned 5.45% as investors generally favored developed market equities based in the U.S. despite disappointing U.S. economic data late in the reporting period. Global equities, as represented by the MSCI World Index, declined 4.98% due to continued fiscal instability and uncertainty in the eurozone. Emerging market equities, as represented by the MSCI Emerging Markets Index, declined 15.96% in response to the slowing rate of economic growth in China and other emerging market countries. |
| n | Risk aversion drove down interest rates across developed markets, including in the U.S. and Germany where yields touched historic lows. By contrast, sovereign yields in Spain and Italy rose towards prohibitive levels. Yields on U.S. Treasury securities ended the period significantly lower (with prices on these securities therefore higher), as investors looked to U.S. Treasuries for their perceived safety and quality due to increasing concern of a global economic slowdown and continued uncertainty in Europe. The benchmark ten-year U.S. Treasury note yielded 1.64% at the end of the reporting period, as compared to 3.16% on June 30, 2011. The Barclays U.S. Aggregate Index, a widely used index of U.S. investment-grade bonds, returned 7.47% for the period. |
| 2 | PIMCO EQUITY SERIES |
Table of Contents
| n | The Federal Reserve (the “Fed”) kept the Federal Funds Rate anchored within a range of zero to 0.25% and signaled willingness to ease further if weakness in the U.S. economy persists. The Fed also responded to growing economic strains by extending through the end of 2012 its renewed “Operation Twist” program, which extends the average maturity of its holdings of securities. The Bank of England held its key lending rate at 0.50% and initiated increased monetary stimulus to shore up the U.K. economy; and outside of the reporting period in early July the European Central Bank reduced its main policy rate to 0.75% from 1.00%. |
If you have any questions regarding the PIMCO Equity Series, please contact your account manager or financial adviser, or call one of our shareholder associates at (888) 87-PIMCO. We also invite you to visit our website at www.pimco.com/investments to learn more about our views and global thought leadership.
Thank you again for the trust you have placed in us. We value your commitment and will continue to work diligently to meet your broad investment needs.
 | Sincerely,
Brent R. Harris Chairman of the Board, PIMCO Equity Series
July 25, 2012 |

| ANNUAL REPORT | JUNE 30, 2012 | 3 |
Table of Contents
Important Information About the Funds
PIMCO Equity Series (the “Trust”) is an open-end management investment company currently consisting of six separate investment portfolios (the “Funds”). Each Fund is an actively managed equity strategy. While we believe that equity funds have an important role to play in a well diversified investment portfolio, they are subject to notable risks. Among other things, equity and equity-related securities may decline in value due to both real and perceived general market, economic, and industry conditions.
The Funds may be subject to various risks as described in the Funds’ prospectus. Some of these risks may include, but are not limited to, the following: allocation risk, acquired fund risk, equity risk, dividend-oriented stocks risk, value investing risk, foreign (non-U.S.) investment risk, emerging markets risk, market risk, issuer risk, interest rate risk, credit risk, high yield and distressed company risk, cash holdings risk, currency risk, real estate risk, liquidity risk, leveraging risk, management risk, small-cap and mid-cap company risk, arbitrage risk, derivatives risk, short sale risk, commodity risk, convertible securities risk, tax risk, subsidiary risk and issuer non-diversification risk. A complete description of these risks and other risks is contained in the Funds’ prospectus. The Funds may use derivative instruments for hedging purposes or as part of an investment strategy. Use of these instruments may involve certain costs and risks such as liquidity risk, interest rate risk, market risk, credit risk, management risk, leverage risk, mispricing or improper valuation risk and the risk that the Funds could not close out a position when it would be most advantageous to do so. Certain derivative transactions may have a leveraging effect on a Fund. For example, a small investment in a derivative instrument may have a significant impact on a Fund’s exposure to interest rates, currency exchange rates or other investments. As a result, a relatively small price movement in a derivative instrument may cause an immediate and substantial loss or gain. A Fund may engage in such transactions regardless of whether the Fund owns the asset, instrument
or components of the index underlying the derivative instrument. A Fund may invest a significant portion of its assets in these types of instruments. If it does, the Fund’s investment exposure could far exceed the value of its portfolio securities and its investment performance could be primarily dependent upon securities it does not own.
On each individual Fund Summary page in this Annual Report (“Shareholder Report”), the Average Annual Total Return table and Cumulative Returns chart measure performance assuming that any dividend and capital gain distributions were reinvested. Class A shares are subject to an initial sales charge. A Contingent Deferred Sales Charge (“CDSC”) may be imposed in certain circumstances on Class A shares that are purchased without an initial sales charge and then redeemed during the first 18 months after purchase. The Cumulative Returns chart reflects only Institutional Class performance. Performance for Class P, Administrative Class, Class D, Class A, Class C and Class R shares is typically lower than Institutional Class performance due to the lower expenses paid by Institutional Class shares. Performance shown is net of fees and expenses. A Fund’s total annual operating expense ratios on each individual Fund summary page are as of the currently effective prospectus, as supplemented to date. The Cumulative Returns chart assumes the initial investment of $1,000,000 was made at the end of the month that the Institutional Class of the relevant Fund commenced operations. The minimum initial investment amount for Institutional Class, Class P or Administrative Class shares is $1,000,000. The minimum initial investment amount for Class A, Class C and Class D shares is $1,000. There is no minimum initial investment for Class R shares. Each Fund measures its performance against a broad-based securities market index (benchmark index). The benchmark index does not take into account fees, expenses, or taxes. A Fund’s past performance, before and after taxes, is not necessarily an indication of how the Fund will perform in the future.
The following table discloses the inception dates of each Fund and its respective share classes:
| Fund Name | Fund Inception | Institutional Class | Class P | Administrative Class | Class D | Class A | Class B | Class C | Class R | |||||||||||||||||||||||||||||
PIMCO Dividend and Income Builder Fund | 12/14/11 | 12/14/11 | 12/14/11 | — | 12/14/11 | 12/14/11 | — | 12/14/11 | 12/14/11 | |||||||||||||||||||||||||||||
PIMCO EqSTM Dividend Fund | 12/14/11 | 12/14/11 | 12/14/11 | — | 12/14/11 | 12/14/11 | — | 12/14/11 | 12/14/11 | |||||||||||||||||||||||||||||
PIMCO EqSTM Emerging Markets Fund | 03/22/11 | 03/22/11 | 03/22/11 | 04/19/11 | 03/22/11 | 03/22/11 | — | 03/22/11 | 03/22/11 | |||||||||||||||||||||||||||||
PIMCO EqSTM Long/Short Fund | 04/20/12 | 04/20/12 | 04/30/12 | — | 04/30/12 | 04/30/12 | — | 04/30/12 | — | |||||||||||||||||||||||||||||
PIMCO Emerging Multi-Asset Fund | 04/12/11 | 04/12/11 | 04/12/11 | 04/19/11 | 04/12/11 | 04/12/11 | — | 04/12/11 | — | |||||||||||||||||||||||||||||
PIMCO EqS Pathfinder Fund® | 04/14/10 | 04/14/10 | 04/14/10 | — | 04/14/10 | 04/14/10 | — | 04/14/10 | 04/14/10 | |||||||||||||||||||||||||||||
For periods prior to the inception date of the Class P, Administrative Class, Class D, Class A, Class C and Class R shares (if applicable), performance information shown is based on the performance of the Fund’s Institutional Class shares. The prior Institutional Class performance has been adjusted to reflect the distribution and/or service fees and other expenses paid by the Class P, Administrative Class, Class D, Class A, Class C and Class R shares, respectively.
An investment in a Fund is not a bank deposit and is not guaranteed or insured by the Federal Deposit Insurance Corporation (“FDIC”) or any other government agency. It is possible to lose money on investments in a Fund.
PIMCO has adopted written proxy voting policies and procedures (“Proxy Policy”) as required by Rule 206(4)-6 under the Investment Advisers Act of 1940, as amended. The Proxy Policy has been adopted by PIMCO Equity Series as the policies and procedures that PIMCO will use when voting proxies on behalf of a Fund. A description of the
policies and procedures that PIMCO uses to vote proxies relating to portfolio securities of a Fund, and information about how the Fund voted proxies relating to portfolio securities held during the most recent twelve-month period ended June 30th, are available without charge, upon request, by calling the Trust at (888) 87-PIMCO, on the Fund’s website at http://www.pimco.com/investments, and on the Securities and Exchange Commission’s (“SEC”) website at http://www.sec.gov.
PIMCO Equity Series files a complete schedule of each Fund’s portfolio holdings with the SEC for the first and third quarters of each fiscal year on Form N-Q. A copy of a Fund’s Form N-Q is available on the SEC’s website at http://www.sec.gov and may be reviewed and copied at the SEC’s Public Reference Room in Washington, D.C. A Fund’s Form N-Q will also be available without charge, upon request, by calling the Trust at (888) 87-PIMCO and on the Fund’s website at http://www.pimco.com/investments. Information on the operation of the Public Reference Room may be obtained by calling 1-800-SEC-0330.
| 4 | PIMCO EQUITY SERIES |
Table of Contents
Insights from the Portfolio Managers PIMCO Dividend and Income Builder Fund
Dear Shareholder,
We appreciate your investment in the PIMCO Dividend and Income Builder Fund (the “Fund”). In the following letter, please find a discussion of the recent market environment and a review of recent portfolio performance.
Market Overview
Global equity markets were up broadly during the period from the Fund’s inception on December 14, 2011 through the end of the reporting period. The MSCI All Country World Index (the “Index”), which tracks the performance of stocks in developed and emerging markets countries, returned 9.43%. Equity market performance was mixed, as equities rallied during the first quarter of 2012, led by more economically sensitive sectors. Equity markets declined during the second quarter, as sectors that are more defensive outperformed. The U.S. was the best performing region in both quarters.
Over the entire period, consumer discretionary was the best performing sector within the Index, led by Internet retailers, of which the Fund owned none. Financials also performed strongly. The sector was up broadly, with consumer finance companies leading the way.
Global fixed income performance was positive as well, with the Barclays Global Aggregate Index returning 2.55% over the reporting period.
The Fund’s blended benchmark, a blend of 75% MSCI All Country World Index/25% Barclays Global Aggregate Index, returned 7.80% during this time.
Fund Review
Over the reporting period, the Fund posted positive performance but underperformed its blended benchmark. The Fund underperformed the MSCI All Country World Index, the Fund’s primary benchmark, which returned 9.43%. The main driver of the underperformance was the Fund’s cash weight at the early part of the reporting period, a time when the Index performed strongly. The Fund’s cash weight has since been reduced.
The Fund’s equity positions had large portfolio allocations to the health care and industrials sectors, relative to the Index. The Fund was significantly underweighted to the financials and information technology sectors, relative to the Index.
Relative performance versus the Index was also weaker due to the Fund’s defensive sector positioning within equities, specifically an overweight to the consumer staples sector and an underweight to the financials and consumer discretionary sectors.
On the positive side, stock selection contributed slightly to performance of the Fund’s equity sleeve. In particular the Fund’s holding of Bangkok Expressway, a Thai toll road operator, contributed positively to the performance of the Fund’s equity sleeve, after the company reported strong increases in revenues and traffic volume, which benefited the stock price.
While the Fund’s underweight to the financials sector detracted from the Fund’s relative performance, security selection was positive. In particular, U.S. Bancorp, a U.S. regional bank, performed well in the Federal Reserve’s stress test program and was allowed to raise its dividend and authorize a share buyback program.
The Fund’s holding of Aimia, a Canadian loyalty management company, also benefited performance. The company announced both a dividend increase and a share repurchase program, and management reiterated its full-year financial guidance. These events positively impacted Aimia’s stock price.
Security selection within the utilities sector contributed to performance as well. Specifically, SABESP (‘Cia de Saneamento Basico do Estado de Sao Paulo SP—ADR’) performed positively. The Brazilian state-owned water utility’s stock rallied, reflecting continued growth of the country’s basic water infrastructure. Brazilian water utilities including SABESP, trade at a significant discount to Brazilian electric utilities and global water peers.
The largest detractor for the period was the Fund’s holding of Tesco, a U.K. food retailer. The stock underperformed after the company issued a sales and profit warning based on a disappointing 2011 holiday season in its home market. The team exited this position in February 2012.
The Fund’s holding of Carillion also detracted from relative performance. The U.K. construction company underperformed as it announced earnings growth guidance for its Support Services division that was less enthusiastic than previously announced. In response to this increased risk, the PIMCO Dividend team chose not to add to this position.
The Fund’s fixed income sleeve performed positively, driven mainly by overweight positions in investment grade, high yield, and emerging markets credit securities, as these sectors performed well over the period under review as credit spreads widened. Individual security selection also contributed to performance. Currency and duration (or sensitivity to changes in market interest rates) effects were positive as well.
The Fund paid ordinary quarterly dividends of 14 cents and 10 cents per Institutional Class share in the quarters ended June 30, 2012 and
| ANNUAL REPORT | JUNE 30, 2012 | 5 |
Table of Contents
Insights from the Portfolio Managers PIMCO Dividend and Income Builder Fund (Cont.)
March 31, 2012, respectively. The Fund also paid a small dividend on December 30, 2011. The dividend per share was lower for the other share classes, to account for varying class specific expenses. Over time, we seek to increase the total dividends paid by the Fund each year.
The Fund’s Institutional Class net asset value increased by $0.47 per share (from $10.00 to $10.47) over the reporting period.
Conclusion
Despite the Fund’s underperformance relative to its Index over this time period, we maintain our long-term view that dividend-paying equities have the potential to be an attractive long-term investment solution, especially in the current environment. With ten-year U.S. Treasury yields at historical lows, the dividend yield on global stocks can be particularly attractive.
We do not advocate selecting equity investments based on yield alone, however. Instead, we believe that an investment process that seeks out attractively valued income generating opportunities is critical in an environment where certain sectors commonly targeted by investors for yield are expensive relative to history.
The Fund remains defensively positioned, though we do intend to be selectively opportunistic through an increased allocation to Basic Value (i.e. more cyclical) and Emerging Franchise (i.e. growth) companies. We continue to emphasize valuation in a market that has recently been characterized by overreactions to both positive and negative news.
We thank you for your investment in the Fund.
Sincerely,
 |  | |
 |  | |
| Brad Kinkelaar | Cliff Remily, CFA | |
| Co-Portfolio Manager | Co-Portfolio Manager | |
Top 10 Holdings1
Roche Holding AG | 3.2% | |||||
Pfizer, Inc. | 3.0% | |||||
Medtronic, Inc. | 2.8% | |||||
Novartis AG | 2.6% | |||||
Microsoft Corp. | 2.6% | |||||
Baxter International, Inc. | 2.4% | |||||
Enagas S.A. | 2.4% | |||||
Aimia, Inc. | 2.3% | |||||
U.S. Bancorp | 2.2% | |||||
G4S PLC | 2.2% |
Geographic Breakdown1
United States | 29.1% | |||||
United Kingdom | 13.6% | |||||
Canada | 6.0% | |||||
Switzerland | 5.8% | |||||
France | 4.5% | |||||
South Africa | 4.5% | |||||
Hong Kong | 3.9% | |||||
China | 3.5% | |||||
Spain | 2.4% | |||||
Australia | 2.2% | |||||
Qatar | 1.9% | |||||
Norway | 1.8% | |||||
Netherlands | 1.7% | |||||
Brazil | 1.6% | |||||
Luxembourg | 1.6% | |||||
Other | 9.1% |
Sector Breakdown1
Industrials | 22.2% | |||||
Health Care | 17.2% | |||||
Financials | 14.3% | |||||
Utilities | 8.8% | |||||
Energy | 6.3% | |||||
Materials | 5.2% | |||||
Consumer Staples | 5.2% | |||||
Consumer Discretionary | 4.4% | |||||
Telecommunication Services | 4.0% | |||||
Information Technology | 3.8% | |||||
Other | 1.8% |
| 1 | % of Total Investments as of 06/30/2012. Top Holdings, Geographic and Sector Breakdown solely reflect long positions. Securities sold short, financial derivative instruments and short-term instruments are not taken into consideration. |
| 6 | PIMCO EQUITY SERIES |
Table of Contents
PIMCO Dividend and Income Builder Fund
| Institutional Class - PQIIX | Class A - PQIZX | |
| Class P - PQIPX | Class C - PQICX | |
| Class D - PQIDX | Class R - PQIBX |
Cumulative Returns Through June 30, 2012
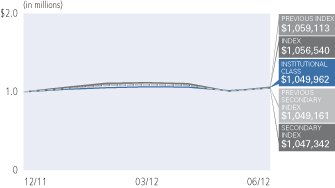
Cumulative Total Return for the period ended June 30, 2012 | ||||||
| Fund Inception (12/14/11) | ||||||
 | PIMCO Dividend and Income Builder Fund Institutional Class | 7.17% | ||||
| PIMCO Dividend and Income Builder Fund Class P | 7.21% | |||||
| PIMCO Dividend and Income Builder Fund Class D | 6.98% | |||||
| PIMCO Dividend and Income Builder Fund Class A | 6.98% | |||||
| PIMCO Dividend and Income Builder Fund Class A (adjusted) | 1.09% | |||||
| PIMCO Dividend and Income Builder Fund Class C | 6.46% | |||||
| PIMCO Dividend and Income Builder Fund Class C (adjusted) | 5.46% | |||||
| PIMCO Dividend and Income Builder Fund Class R | 6.84% | |||||
 | MSCI All Country World Index Net USD±* | 9.43% | ||||
 | MSCI World Index* | 10.03% | ||||
 | 75% MSCI All Country World Index Net USD/25% Barclays Global Aggregate USD Unhedged* | 7.80% | ||||
 | 75% MSCI World Index/25% Barclays Global Aggregate (USD Hedged) Index Fund Inception | 8.23% | ||||
All Fund returns are net of fees and expenses.
± The MSCI All Country World Index Net USD is a free float-adjusted market capitalization weighted index that is designed to measure the equity market performance of developed and emerging markets. The Index consists of 45 country indices comprising 24 developed and 21 emerging market country indices. It is not possible to invest directly in an unmanaged index.
±± The benchmark is a blend of 75% MSCI All Country World Index Net USD/25% Barclays Global Aggregate USD Unhedged. The MSCI All Country World Index Net USD is a free float-adjusted market capitalization weighted index that is designed to measure the equity market performance of developed and emerging markets. The Index consists of 45 country indices comprising 24 developed and 21 emerging market country indices. Barclays Global Aggregate (USD Unhedged) Index provides a broad-based measure of the global investment-grade fixed income markets. The three major components of this index are the U.S. Aggregate, the Pan-European Aggregate, and the Asian-Pacific Aggregate Indices. The index also includes Eurodollar and Euro-Yen corporate bonds, Canadian Government securities, and USD investment grade 144A securities. It is not possible to invest directly in an unmanaged index.
* Prior to July 17, 2012, the Fund’s primary benchmark was the MSCI World Index and the Fund’s secondary benchmark was the 75% MSCI World Index/25% Barclays Capital Global Capital Aggregate (USD Unhedged) Index. The primary benchmark was changed from the MSCI World Index Net USD to the MSCI All Country World Index Net USD because the MSCI All Country World Index contains both developed markets and emerging markets securities, and thus more accurately represents the Fund’s investable universe than the MSCI World Index Net USD, which contains only developed markets securities. The secondary blended benchmark was changed accordingly to reflect the updated primary benchmark.
Performance quoted represents past performance. Past performance is not a guarantee or a reliable indicator of future results. Current performance may be lower or higher than performance shown. Investment return and the principal value of an investment will fluctuate. Shares may be worth more or less than original cost when redeemed. Returns shown do not reflect the deduction of taxes that a shareholder would pay on fund distributions or the redemption of fund shares. The adjusted returns take into account the maximum sales charge of 5.50% on A shares and 1.00% CDSC on C shares. The Fund’s total annual operating expense ratio as stated in the Fund’s current prospectus, as supplemented to date, is 1.01% for the Institutional Class shares, 1.11% for the Class P shares, 1.36% for the Class D shares, 1.36% for the Class A shares, 2.11% for the Class C shares and 1.61% for the Class R shares. Details regarding any Fund’s operating expenses can be found in the Fund’s prospectus. For performance current to the most recent month-end, visit www.pimco.com/investments.
Portfolio Insights
| » | The PIMCO Dividend and Income Builder Fund seeks to provide current income that exceeds the average yield on global stocks, and to provide a growing stream of income per share over time, with a secondary objective to seek to provide long-term capital appreciation, by investing under normal circumstances at least 80% of its assets in a diversified portfolio of income-producing investments, and will typically invest at least 50% of its assets in equity and equity-related securities. The Fund’s investments in equity and equity-related securities include common and preferred stock (and securities convertible into, or that PIMCO expects to be exchanged for, common or preferred stock), as well as securities issued by real estate investment trusts, master limited partnerships and other equity trusts and depositary receipts. |
| » | The Fund commenced operations on December 14, 2011. |
| » | For the period since the Fund’s inception, the Fund’s Institutional class shares returned 7.17% after fees, and the Fund’s benchmark index, the MSCI All Country World Index, returned 9.43%. |
| » | Dividend equities generally underperformed non-dividend paying equities during the period since the Fund’s inception. |
| » | The Fund’s weight in cash at the beginning of the period was the largest single detractor from performance relative to its benchmark index since inception. |
| » | The Fund’s defensive equity positioning was a drag on relative performance. Specifically, the Fund’s underweight to the financials and consumer discretionary sectors as well as an overweight to the consumer staples sector detracted from relative performance. |
| » | On the whole, equity security selection contributed slightly to relative performance. The largest single contributor was the Fund’s holding of Bangkok Expressway, a Thai toll road operator. |
| » | The largest single detractor was the Fund’s holding of Tesco, a U.K. food retailer. The Fund exited the position in February 2012. |
| » | The Fund’s fixed income sleeve performed positively, driven mainly by an overweight to investment grade, high yield, and emerging markets credit securities, as these sectors outperformed. |
| ANNUAL REPORT | JUNE 30, 2012 | 7 |
Table of Contents
Insights from the Portfolio Managers PIMCO EqSTM Dividend Fund
Dear Shareholder,
We appreciate your investment in the PIMCO EqSTM Dividend Fund (the “Fund”). In the following letter, please find a discussion of the recent market environment and a review of recent portfolio performance.
Market Overview
Global equity markets were up broadly during the period from the Fund’s inception on December 14, 2011 through the end of the reporting period. The MSCI All Country World Index (the “Index”), which tracks the performance of stocks in developed and emerging markets countries, returned 9.43%. Equity market performance was mixed, as equities rallied during the first quarter of 2012, led by more economically sensitive sectors. Equity markets declined during the second quarter, as sectors that are more defensive outperformed. The U.S. was the best performing region in both quarters.
Over the entire period, consumer discretionary was the best performing sector within the Index, led by Internet retailers, of which the Fund owned none. Financials also performed strongly. The sector was up broadly, with consumer finance companies leading the way.
Fund Review
Over the reporting period, the Fund had large portfolio allocations to the health care and industrials sectors, relative to the Index. The Fund was significantly underweighted to the financials and information technology sectors, relative to the Index.
The Fund posted positive performance for the reporting period but underperformed its benchmark index, the MSCI All Country World Index. The primary driver of the underperformance was the Fund’s cash weight at the early part of the reporting period, a time when the Index performed strongly. The Fund’s cash weight has since been reduced.
Relative performance versus the Index was also weaker due to the Fund’s defensive sector positioning, specifically an overweight to the consumer staples sector and an underweight to the financials and consumer discretionary sectors.
On the positive side, stock selection contributed slightly to performance. In particular, the Fund’s holding of Aimia, a Canadian loyalty management company, contributed to performance. Aimia announced both a dividend increase and a share repurchase program, and management reiterated its full-year financial guidance. These events positively impacted Aimia’s stock price.
Security selection within the utilities sector also contributed to performance. Specifically, SABESP performed positively. The Brazilian state-owned water utility’s stock rallied, reflecting continued growth
of the country’s basic water infrastructure. Brazilian water utilities including SABESP, trade at a significant discount to Brazilian electric utilities and global water peers.
While the Fund’s overweight to the industrials sector detracted slightly from performance, security selection was positive as the Fund’s holding of Bangkok Expressway, a Thai toll road operator, contributed to relative performance as the company reported strong increases in revenues and traffic volume, which benefited the stock price.
The largest detractor for the period was the Fund’s holding of Tesco, a U.K. food retailer. The stock underperformed after the company issued a sales and profit warning based on a disappointing 2011 holiday season in its home market. The team exited this position in February 2012.
The Fund’s holding of Carillion also detracted from relative performance. The U.K. construction company underperformed as it announced earnings growth guidance for its Support Services division that was less enthusiastic than previously announced. In response to this increased risk, the PIMCO Dividend team chose not to add to this position.
The Fund paid ordinary quarterly dividends of 14 cents and 9 cents per Institutional Class share in the quarters ended June 30, 2012 and March 31, 2012, respectively. The Fund also paid a small dividend on December 30, 2011. The dividend per share was lower for the other share classes, to account for varying class specific expenses. Over time, we seek to increase the total dividends paid by the Fund each year.
The Fund’s Institutional Class net asset value increased by $0.47 per share (from $10.00 to $10.47) over the reporting period.
Conclusion
Despite the Fund’s underperformance relative to the Index over this time period, we maintain our long-term view that dividend-paying equities have the potential to be an attractive long-term investment solution, especially in the current environment. With ten-year U.S. Treasury yields at historical lows, the dividend yield on global stocks can be particularly attractive.
We do not advocate selecting equity investments based on yield alone, however. Instead, we believe that an investment process that seeks out attractively valued income generating opportunities is critical in an environment where certain sectors commonly targeted by investors for yield are expensive relative to history.
The Fund remains defensively positioned, though we do intend to be selectively opportunistic through an increased allocation to Basic Value (i.e. more cyclical) and Emerging Franchise (i.e. growth) companies.
| 8 | PIMCO EQUITY SERIES |
Table of Contents
We continue to emphasize valuation in a market that has recently been characterized by overreactions to both positive and negative news.
We thank you for your investment in the Fund.
Sincerely,
| | |
| | |
Brad Kinkelaar Co-Portfolio Manager | Cliff Remily, CFA Co-Portfolio Manager | |
Top 10 Holdings1
Roche Holding AG | 4.2% | |||||
Pfizer, Inc. | 3.9% | |||||
Medtronic, Inc. | 3.6% | |||||
Microsoft Corp. | 3.5% | |||||
Baxter International, Inc. | 3.5% | |||||
Novartis AG | 3.4% | |||||
Canadian Oil Sands Ltd. | 3.1% | |||||
Enagas S.A. | 3.1% | |||||
Aimia, Inc. | 3.0% | |||||
U.S. Bancorp | 2.9% |
Geographic Breakdown1
United States | 29.5% | |||||
United Kingdom | 15.5% | |||||
Switzerland | 7.7% | |||||
Canada | 7.4% | |||||
South Africa | 5.5% | |||||
France | 5.1% | |||||
Hong Kong | 3.9% | |||||
China | 3.5% | |||||
Spain | 3.1% | |||||
Australia | 2.8% | |||||
Norway | 2.0% | |||||
Macau | 1.7% | |||||
Netherlands | 1.6% | |||||
Czech Republic | 1.6% | |||||
Thailand | 1.5% | |||||
Brazil | 1.5% | |||||
Other | 1.4% |
Sector Breakdown1
Health Care | 22.7% | |||||
Industrials | 17.2% | |||||
Financials | 11.2% | |||||
Energy | 8.6% | |||||
Utilities | 7.1% | |||||
Consumer Staples | 6.7% | |||||
Materials | 6.1% | |||||
Consumer Discretionary | 5.6% | |||||
Information Technology | 5.1% | |||||
Telecommunication Services | 5.0% |
| 1 | % of Total Investments as of 06/30/2012. Top Holdings, Geographic and Sector Breakdown solely reflect long positions. Securities sold short, financial derivative instruments and short-term instruments are not taken into consideration. |
| ANNUAL REPORT | JUNE 30, 2012 | 9 |
Table of Contents
| Institutional Class - PQDIX | Class A - PQDAX | |
| Class P - PQDPX | Class C - PQDCX | |
| Class D - PQDDX | Class R - PQDRX |
Cumulative Returns Through June 30, 2012
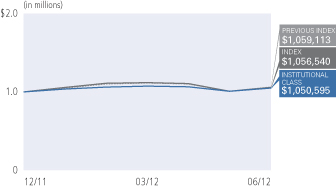
Cumulative Total Return for the period ended June 30, 2012 | ||||||
Fund Inception | ||||||
| PIMCO EqSTM Dividend Fund Institutional Class | 6.95% | ||||
PIMCO EqSTM Dividend Fund Class P | 7.00% | |||||
PIMCO EqSTM Dividend Fund Class D | 6.86% | |||||
PIMCO EqSTM Dividend Fund Class A | 6.86% | |||||
PIMCO EqSTM Dividend Fund Class A (Adjusted) | 0.99% | |||||
PIMCO EqSTM Dividend Fund Class C | 6.19% | |||||
PIMCO EqSTM Dividend Fund Class C (Adjusted) | 5.19% | |||||
PIMCO EqSTM Dividend Fund Class R | 6.63% | |||||
| MSCI All Country World Index Net USD±* | 9.43% | ||||
 | MSCI World Index | 15.03% | ||||
All Fund returns are net of fees and expenses.
± The MSCI All Country World Index Net USD is a free float-adjusted market capitalization weighted index that is designed to measure the equity market performance of developed and emerging markets. The Index consists of 45 country indices comprising 24 developed and 21 emerging market country indices. It is not possible to invest directly in an unmanaged index.
* Prior to July 17, 2012, the Fund’s primary benchmark was the MSCI World Index. The benchmark was changed from the MSCI World Index Net USD to the MSCI All Country World Index Net USD because the MSCI All Country World Index contains both developed markets and emerging markets securities, and thus more accurately represents the Fund’s investable universe than the MSCI World Index Net USD, which contains only developed markets securities.
Performance quoted represents past performance. Past performance is not a guarantee or a reliable indicator of future results. Current performance may be lower or higher than performance shown. Investment return and the principal value of an investment will fluctuate. Shares may be worth more or less than original cost when redeemed. Returns shown do not reflect the deduction of taxes that a shareholder would pay on fund distributions or the redemption of fund shares. The adjusted returns take into account the maximum sales charge of 5.50% on A shares and 1.00% CDSC on C shares. The Fund’s total annual operating expense ratio as stated in the Fund’s current prospectus, as supplemented to date, is 1.01% for the Institutional Class shares, 1.11% for the Class P shares, 1.36% for the Class D shares, 1.36% for the Class A shares, 2.11% for the Class C shares and 1.61% for the Class R shares. Details regarding any Fund’s operating expenses can be found in the Fund’s prospectus. For performance current to the most recent month-end, visit www.pimco.com/investments.
Portfolio Insights
| » | The PIMCO EqS™ Dividend Fund seeks to provide current income that exceeds the average yield on global stocks, and as a secondary objective, seeks to provide long-term capital appreciation, by investing under normal circumstances at least 75% of its assets in equity and equity-related securities, including common and preferred stock (and securities convertible into, or that PIMCO expects to be exchanged for, common or preferred stock), as well as securities issued by real estate investment trusts, master limited partnerships and other equity trusts and depository receipts. |
| » | The Fund commenced operations on December 14, 2011. |
| » | For the period since the Fund’s inception, the Fund’s Institutional class shares returned 6.95% after fees, and the Fund’s benchmark index, the MSCI All Country World Index, returned 9.43%. |
| » | Dividend equities generally underperformed non-dividend paying equities during the period since the Fund’s inception. |
| » | The Fund’s weight in cash at the beginning of the period was the largest single detractor from performance relative to its benchmark index since inception. |
| » | The Fund’s defensive equity positioning was a drag on relative performance. Specifically, underweights to the financials and consumer discretionary sectors as well as an overweight to the consumer staples sector detracted from relative performance. |
| » | Security selection contributed slightly to performance. The largest single contributor was the Fund’s holding of Aimia, a Canadian loyalty management company, as Aimia’s share price appreciated during the reporting period. |
| » | The largest single detractor was the Fund’s holding of Tesco, a U.K. food retailer. The Fund exited the position in February 2012. |
| 10 | PIMCO EQUITY SERIES |
Table of Contents
Insights from the Portfolio Managers PIMCO EqSTM Emerging Markets Fund
Dear Shareholder,
We appreciate your investment in the PIMCO EqSTM Emerging Markets Fund (the “Fund”). In the following letter, please find a discussion of the recent market environment and a review of recent portfolio performance.
Market Overview
Over the twelve-month reporting period, macroeconomic issues were the primary drivers of equity market returns. The overhang over a possible Greek exit from the eurozone as well as the potential for a debt crisis contagion to other eurozone countries weighed on market sentiment. In addition, the European Union (“EU”) and the U.S. have been stuck in a slow growth phase that has impacted export-driven economies such as China and Brazil. These concerns have led to an equity market drawdown over the reporting period, most notably in asset classes that are perceived to be riskier, such as emerging market equities.
While emerging market equities have underperformed in this environment, we maintain our long-term view that emerging market economic growth will exceed that of developed markets. In particular, the concerns in the eurozone have underscored the advantages of these emerging economies such as higher current account balances, foreign currency reserves as well as a lower degree of indebtedness and reasonable fiscal deficits. In our view, these macroeconomic factors are likely to provide long-term support for emerging market companies and thus, the compelling nature of the investment opportunity in emerging market equities. In addition, over the past twelve months, emerging market equity returns have substantially lagged earnings, resulting in an effective de-rating. As a result, emerging market equities continue to trade at low valuations relative to historical averages.
Fund Review
In this environment, the PIMCO EqSTM Emerging Markets Fund underperformed its benchmark over the reporting period. The primary driver of the underperformance for the period was an overweight to small market capitalization companies, particularly in China, that posted negative returns in the “risk off” market environment. Over the long-term horizon, we believe these types of investments offer greater opportunity for an active manager since we believe the market tends to be more inefficient and historically there have been fewer professional analysts covering these names.
The largest detractor for the reporting period was the Fund’s exposure to Boshiwa, a retailer of children’s products in China, which led the consumer discretionary sector and China to be the top detracting groups for the reporting period. Shares of the company fell after its auditor resigned citing material concerns on the validity of Boshiwa’s
financial statements, prompting us to exit the position. Following several high profile accounting scandals in China over the past year, regulators and auditors are increasingly focused on irregularities in companies’ financial reporting. While this may be an overhang on certain companies over the short term, we believe the improvement of corporate governance is a positive trend for investing in China.
Our positioning within the materials sector also detracted from returns as many names declined on concerns over global growth. While it is difficult to call a bottom in cyclically geared parts of the market, valuations in certain pockets have reached all-time lows, in our opinion. We believe positions initiated at these valuation levels will outperform over a full market cycle.
On the positive side, positive stock selection in the energy sector contributed to performance. Notably we have avoided many state-sponsored and state-owned enterprises as these companies may be operated to further government policies rather than operating for the benefit of private shareholders. Our avoidance of these companies, specifically in Brazil and Russia, contributed to relative performance during the past year.
The top relative contributor for the reporting period was the Fund’s exposure to Creditcorp, a Peruvian bank. We believe the company has positive growth drivers, such as good economic growth in the country but also a solid capital ratio and low loan-deposit ratio to take advantage of its strong market position.
Conclusion
Midway through 2012, we are mindful of the ongoing tug of war between elevated market risks and attractive equity valuations. Recently, we have observed that investors have sought the defensiveness of more stable businesses, namely consumer staples companies. As a result, these stocks have been bid up and now trade at two standard deviations above historical valuation levels.
We believe the likelihood that consumer staples stocks will retain such premium rating to the rest of the emerging market universe (inherently cyclically driven) is highly unlikely. Rather than reaching for earnings stability at historically high valuations, we have been seeking to identify companies that exhibit the compelling characteristics of emerging market staples without incurring the price tag. Instead we have been adding to consistent earning companies in other market segments, such as telecommunications, and also the producers of commodities in which end market demand is less cyclical, such as potash (an input in fertilizer production).
Although macroeconomic concerns have increased uncertainty in the global equity markets, we believe that emerging markets present an
| ANNUAL REPORT | JUNE 30, 2012 | 11 |
Table of Contents
Insights from the Portfolio Managers PIMCO EqSTM Emerging Markets Fund (Cont.)
attractive opportunity for long-term investors. Furthermore, we believe our philosophy and investment process are well prepared to navigate these types of market environments.
Again, we thank you for your continued investment in the Fund and look forward to serving your investment needs.
Sincerely,
Maria (Masha) Gordon Portfolio Manager |
Top 10 Holdings1
Samsung Electronics Co. Ltd. | 5.9% | |||||
China Mobile Ltd. | 3.1% | |||||
AIA Group Ltd. | 2.6% | |||||
Hon Hai Precision Industry Co. Ltd. | 2.6% | |||||
Israel Chemicals Ltd. | 2.1% | |||||
Itau Unibanco Holding S.A. SP—ADR | 2.1% | |||||
Honda Motor Co. Ltd. | 1.9% | |||||
Credicorp Ltd. | 1.8% | |||||
First Gen Corp. | 1.7% | |||||
Cia de Bebidas das Americas SP—ADR | 1.6% |
Geographic Breakdown1
Hong Kong | 11.6% | |||||
South Korea | 10.1% | |||||
China | 8.7% | |||||
Brazil | 6.3% | |||||
Russia | 5.2% | |||||
Israel | 4.6% | |||||
Taiwan | 4.5% | |||||
South Africa | 4.3% | |||||
India | 3.5% | |||||
United Kingdom | 3.1% | |||||
Thailand | 2.9% | |||||
United States | 2.6% | |||||
Japan | 1.9% | |||||
Peru | 1.8% | |||||
Philippines | 1.7% | |||||
Canada | 1.6% | |||||
Other | 13.5% |
Sector Breakdown1
Financials | 15.1% | |||||
Industrials | 13.7% | |||||
Consumer Staples | 13.2% | |||||
Materials | 10.1% | |||||
Consumer Discretionary | 9.0% | |||||
Energy | 6.5% | |||||
Telecommunication Services | 5.6% | |||||
Information Technology | 5.6% | |||||
Exchange-Traded Funds | 4.5% | |||||
Utilities | 2.9% | |||||
Health Care | 1.7% |
| 1 | % of Total Investments as of 06/30/2012. Top Holdings, Geographic and Sector Breakdown solely reflect long positions. Securities sold short, financial derivative instruments and short-term instruments are not taken into consideration. |
| 12 | PIMCO EQUITY SERIES |
Table of Contents
PIMCO EqSTM Emerging Markets Fund
| Institutional Class - PEQWX | Class A - PEQAX | |
| Class P - PEQQX | Class C - PEQEX | |
| Administrative Class - PEQTX | Class R - PEQHX | |
| Class D - PEQDX |
Cumulative Returns Through June 30, 2012
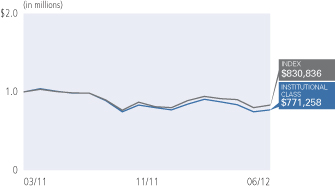
| Average Annual Total Return for the period ended June 30, 2012 | ||||||||||
| 1 Year | Fund Inception (03/22/11) | |||||||||
| PIMCO EqSTM Emerging Markets Fund Institutional Class | -21.51% | -16.08% | |||||||
| PIMCO EqSTM Emerging Markets Fund Class P | -21.52% | -16.09% | ||||||||
| PIMCO EqSTM Emerging Markets Fund Administrative Class | -21.72% | -16.33% | ||||||||
| PIMCO EqSTM Emerging Markets Fund Class D | -21.83% | -16.42% | ||||||||
| PIMCO EqSTM Emerging Markets Fund Class A | -21.89% | -16.47% | ||||||||
| PIMCO EqSTM Emerging Markets Fund Class A (adjusted) | -26.17% | -20.08% | ||||||||
| PIMCO EqSTM Emerging Markets Fund Class C | -22.43% | -16.98% | ||||||||
| PIMCO EqSTM Emerging Markets Fund Class C (adjusted) | -23.20% | -16.98% | ||||||||
| PIMCO EqSTM Emerging Markets Fund Class R | -22.01% | -16.57% | ||||||||
| MSCI Emerging Markets Index± | -15.95% | -10.42% | |||||||
All Fund returns are net of fees and expenses.
± The MSCI Emerging Markets Index is a free float-adjusted market capitalization index that is designed to measure equity market performance of emerging markets. The MSCI Emerging Markets Index consists of the following 21 emerging market country indices: Brazil, Chile, China, Colombia, Czech Republic, Egypt, Hungary, India, Indonesia, Korea, Malaysia, Mexico, Morocco, Peru, Philippines, Poland, Russia, South Africa, Taiwan, Thailand, and Turkey. It is not possible to invest directly in an unmanaged index.
Performance quoted represents past performance. Past performance is not a guarantee or a reliable indicator of future results. Current performance may be lower or higher than performance shown. Investment return and the principal value of an investment will fluctuate. Shares may be worth more or less than original cost when redeemed. Returns shown do not reflect the deduction of taxes that a shareholder would pay on fund distributions or the redemption of fund shares. The adjusted returns take into account the maximum sales charge of 5.50% on A shares and 1.00% CDSC on C shares. The Fund’s total annual operating expense ratio as stated in the Fund’s current prospectus, as supplemented to date, is 1.49% for the Institutional Class shares, 1.59% for the Class P shares, 1.74% for the Administrative Class shares, 1.84% for the Class D shares, 1.84% for the Class A shares, 2.59% for the Class C shares and 2.09% for the Class R shares. Details regarding any Fund’s operating expenses can be found in the Fund’s prospectus. For performance current to the most recent month-end, visit www.pimco.com/investments.
Portfolio Insights
| » | The PIMCO EqS™ Emerging Markets Fund seeks capital appreciation by investing under normal circumstances at least 80% of its assets in a diversified portfolio of investments economically tied to emerging market countries. The Fund will invest a substantial portion of its assets in equity and equity-related securities, including common and preferred stock (and securities convertible into, or that PIMCO expects to be exchanged for, common or preferred stock). The Fund may also invest in fixed income securities, including debt securities issued by both corporate and government issuers. The Fund may invest in commodity related instruments, including exchange-traded funds, futures and other investment companies. The Fund may also invest in derivative instruments, such as options, futures contracts or swap agreements. |
| » | During the reporting period, the Fund’s Institutional class shares declined 21.51% after fees, and the Fund’s benchmark index, the MSCI Emerging Markets Index, declined 15.95%. |
| » | From a sector perspective, positioning within the energy and industrials sectors contributed to performance. Most notably within the energy sector, the Fund avoided many state-sponsored and state-owned enterprises which contributed to relative performance during the reporting period. |
| » | On the downside, weakness within the consumer discretionary sector (including a Chinese retailer) detracted from performance. Also, several holdings in the materials sector detracted from relative returns. |
| » | From a country perspective, an underweight to Taiwan, a country that underperformed the broader MSCI Emerging Markets Index, added to the Fund’s performance relative to the benchmark as well as strong stock selection within the country. In addition, positioning within Peru contributed to absolute and relative performance. |
| » | On the downside, stock selection within Mexico and China, including the retailer mentioned above, detracted from relative performance. In addition, an underweight to Mexico, a country that outperformed the broad index, further weighed on relative results. |
| ANNUAL REPORT | JUNE 30, 2012 | 13 |
Table of Contents
Insights from the Portfolio Managers PIMCO EqSTM Long/Short Fund
Dear Shareholder,
We appreciate your investment in the PIMCO EqS™ Long/Short Fund (the “Fund”), which was recently reorganized into a mutual fund structure in April 2012. The Fund seeks to offer investors exposure to the long-term benefits of owning stocks while also preserving their capital during extended market declines. Over a full market cycle, we aim to deliver attractive capital appreciation with less volatility than the equity markets.
In the following letter, please find additional detail on the Fund’s investment process and philosophy, and why we believe long/short equity investing offers a compelling investment opportunity.
Overview
I began managing this strategy in 2003 at Catamount Capital Management, LLC (“Catamount”), a boutique investment firm, where I also served as a managing partner. In April 2012, PIMCO reorganized a private fund that I managed at Catamount (“Predecessor Fund”) into the Fund, whose investment objective and strategies are, in all material respects, the same as the Predecessor Fund.
The Fund is a concentrated, long-biased equity strategy with the ability to actively manage equity market exposure by adjusting the portfolio’s mix of long and short equity, and cash or cash equivalent positions. The Fund, which has nearly a 10-year track record, uses both top-down and bottom-up analysis to construct a high-conviction portfolio of long positions with selective shorts. Via this concentrated and deeply researched equity portfolio, we look to capture and magnify gains when markets rise. At the same time, we have greater ability to manage downside risk given the Fund’s flexibility to hold cash and selectively short stocks. Unlike many funds that have a limited ability to raise significant cash, let alone short, our flexible approach facilitates access to additional sources of alpha, or returns, and may result in reduced correlation with broader equity market indexes.
Investment Process and Philosophy
The investment process has been in place since I began managing the strategy in 2003. It begins with an assessment of the prospects for the equity market, which is now informed by PIMCO’s economic outlook as well as our judgment on equity market valuations. When we have a positive view of economic and market prospects we tend to be more invested, sometimes fully invested. However, when confronted with what we believe to be a weakening economy, significant financial system risks or unattractive valuations, we are able to move to cash, short or otherwise reduce the portfolio’s exposure to the market.
Our market exposure is guided by PIMCO’s macroeconomic outlook as well as our views on the equity markets. If we think market or financial system risks are too high, the portfolio is likely to carry more cash and selectively short. When our market outlook is positive and we have high conviction in the companies we own, we are likely to put capital to work and have few short positions.
Portfolio holdings are selected based on extensive fundamental analysis, which includes conducting field research, meeting with management teams, analyzing corporate filings, and constructing financial models. Our objective is to identify hidden value and mispriced securities.
The core of the portfolio consists of long positions, in our view, that are fundamentally strong companies that we believe are attractively priced. We seek to invest in companies with defensible brands, significant cash flow, sustainable earnings growth, and which are capitalizing on secular trends. Once we have identified the right company, we are disciplined about investing at what we believe is an attractive price. We conduct cash flow, or asset-based valuation analysis, to determine a company’s true economic value according to PIMCO, seeking to uncover stocks with hidden value. If we identify a catalyst that we believe will unlock that value in the next one to two quarters, we will initiate a position.
We short stocks when we identify opportunities to generate alpha as opposed to simply hedging market risk. Companies we short tend to fall into two categories: Fundamental shorts, or companies in secular decline, and cyclical shorts, or businesses that will likely be most impacted by a weakening economy.
When our outlook is bearish and our objective is to reduce equity market exposure, moving to cash is usually our first line of defense. In bear markets, the Fund can go 100% into cash and cash equivalents in an effort to avoid downside risk. To help preserve investors’ capital, in September 2008, for instance, we were invested mostly in cash and cash equivalents.
Essentially, we believe that a combination of fundamental bottom-up and top-down research, and an opportunistic approach to trading, provides the potential both for participation in the market upside as well as avoiding the downside during extended market declines. When we believe the opportunities for reward outweigh the risks, we can put capital to work and seek capital appreciation. But when the risks of loss appear to outweigh the rewards, we can move to cash or take other steps to preserve capital.
As such, the Fund aims to capture most of the market’s gains in up years while seeking to avoid the downside during extended market declines. Under normal market conditions, the portfolio is net long and
| 14 | PIMCO EQUITY SERIES |
Table of Contents
concentrated in about 20 of our best ideas, with a select number of short positions. In addition to stock selection, active management of the portfolio’s mix of long, short and cash positions is a crucial component of the strategy and helps its ability to navigate various market environments.
Long/Short Equity Investing Offers a Compelling Investment Opportunity
We believe that stock market exposure represents an important expected driver of long-term capital appreciation for many investors. However, equity markets do not always deliver positive returns and often are characterized by periods of high volatility. Consequently, we believe investors will benefit from a strategy that seeks to provide exposure to the long-term growth benefits of owning stocks, while allowing for better downside risk mitigation. To help meet these needs, the Fund aims to provide a positive return with lower volatility than the equity market over the long term. Although the Fund does not explicitly aim to manage short-term volatility, we believe it has greater ability than many traditional long-only strategies to manage downside risk, which provides the opportunity for strong risk-adjusted returns over a full market cycle.
In addition, our approach is consistent with the needs of many investors who are moving away from benchmark-oriented strategies in favor of highly active, unconstrained approaches that seek to limit downside risk. Although the Fund seeks to deliver attractive returns over a full market cycle, investors should not expect positive returns in every market environment, especially over short-term periods. At times, we would be willing to sacrifice some upside in order to avoid large losses. This is different from an approach that is simply focused on beating the market, such as a 130/30 strategy, or a market neutral strategy that remains hedged at all times. By design, the portfolio will have periods of high volatility in the short term, but its downside avoidance should result in lower volatility than the equity market over the long term.
Again, thank you for your investment in the Fund.
Sincerely,


Geoffrey Johnson, CFA
Portfolio Manager
Top 10 Holdings1
Apple, Inc. | 7.3% | |||||
Spirit Airlines, Inc. | 6.9% | |||||
McKesson Corp. | 5.8% | |||||
Portfolio Recovery Associates, Inc. | 3.4% | |||||
Charter Communications, Inc. | 3.3% | |||||
Harman International Industries, Inc. | 3.2% | |||||
Domino’s Pizza, Inc. | 2.9% | |||||
Corrections Corp. of America | 2.2% | |||||
SPDR Gold Trust | 2.2% | |||||
Biglari Holdings, Inc. | 2.0% |
Sector Breakdown1
Industrials | 14.8% | |||||
Consumer Discretionary | 11.9% | |||||
Information Technology | 7.3% | |||||
Health Care | 5.8% | |||||
Exchange-Traded Funds | 2.2% | |||||
Financials | 2.0% | |||||
Other | 0.5% |
| 1 | % of Total Investments as of 06/30/2012. Top Holdings, Geographic and Sector Breakdown solely reflect long positions. Securities sold short, financial derivative instruments and short-term instruments are not taken into consideration. |
| ANNUAL REPORT | JUNE 30, 2012 | 15 |
Table of Contents
| Institutional Class - PMHIX | Class A - PMHAX | |
| Class P - PMHBX | Class C - PMHCX | |
| Class D - PMHDX |
Cumulative Returns Through June 30, 2012
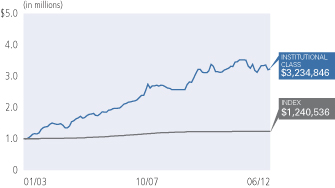
Average Annual Total Return for the period ended June 30, 2012* | ||||||||||||||
| 1 Year | 5 Year | Fund Inception (01/01/2003) | ||||||||||||
| PIMCO EqSTM Long/Short Fund Institutional Class | -8.21% | 6.93% | 13.31% | ||||||||||
| PIMCO EqSTM Long/Short Fund Class P | -8.38% | 6.81% | 13.18% | |||||||||||
| PIMCO EqSTM Long/Short Fund Class D | -8.57% | 6.55% | 12.91% | |||||||||||
| PIMCO EqSTM Long/Short Fund Class A | -8.57% | 6.55% | 12.91% | |||||||||||
| PIMCO EqSTM Long/Short Fund Class A (adjusted) | -13.60% | 5.35% | 12.24% | |||||||||||
| PIMCO EqSTM Long/Short Fund Class C | -9.21% | 5.76% | 12.07% | |||||||||||
| PIMCO EqSTM Long/Short Fund Class C (adjusted) | -10.13% | 5.76% | 12.07% | |||||||||||
| 3 Month USD LIBOR Index± | 0.42% | 1.60% | 2.31% | ||||||||||
All Fund returns are net of fees and expenses.
± 3 Month USD LIBOR Index. LIBOR (London Interbank Offered Rate) is an average interest rate, determined by the British Bankers Association, that banks charge one another for the use of short-term money (3 months) in England’s Eurodollar market. It is not possible to invest directly in an unmanaged index.
Performance quoted represents past performance. Past performance is not a guarantee or a reliable indicator of future results. Current performance may be lower or higher than performance shown. Investment return and the principal value of an investment will fluctuate. Shares may be worth more or less than original cost when redeemed. Returns shown do not reflect the deduction of taxes that a shareholder would pay on fund distributions or the redemption of fund shares. The adjusted returns take into account the maximum sales charge of 5.50% on A shares and 1.00% CDSC on C shares. The Fund’s total annual operating expense ratio as stated in the Fund’s current prospectus, as supplemented to date, is 1.98% for the Institutional Class shares, 2.08% for the Class P shares, 2.23% for the Administrative Class shares, 2.33% for the Class D shares, 2.33% for the Class A shares, 3.08% for the Class C shares and 2.58% for the Class R shares. Details regarding any Fund’s operating expenses can be found in the Fund’s prospectus. For performance current to the most recent month-end, visit www.pimco.com/investments.
* For periods prior to April 20, 2012, the Fund’s performance reflects the performance when the Fund was a partnership, net of actual fees and expenses charged to individual partnership accounts in the aggregate. If the performance had been restated to reflect the applicable fees and expenses of each share class, the performance may have been higher or lower. The Fund began operations as a partnership on January 1, 2003 and, on April 20, 2012, was reorganized into a newly-formed fund that was registered as an investment company under the Investment Company Act of 1940. Prior to the reorganization, the Fund had an investment objective, investment strategies, investment guidelines, and restrictions that were substantially similar to those currently applicable to the Fund; however, the Fund was not registered as an investment company under the Investment Company Act of 1940 and was not subject to its requirements or requirements imposed by the Internal Revenue Code of 1986 which, if applicable, may have adversely affected its performance. The performance of Class P, D, A and C shares for the period from April 20, 2012 to April 30, 2012 is based on the performance of the Institutional Class shares of the Fund. The performance of each class of shares will differ as a result of the different levels of fees and expenses applicable to each class of shares.
Portfolio Insights
| » | The PIMCO EqS™ Long/Short Fund seeks long-term capital appreciation by investing under normal circumstances in long and short positions of equity and equity-related securities, including common and preferred stock (and securities convertible into, or that PIMCO expects to be exchanged for, common or preferred stock), utilizing a fundamental, value-oriented investing style. The Fund will normally invest a substantial portion of its assets in equity and equity-related securities. The Fund may also invest in fixed income securities of varying maturities, cash and cash equivalents. |
| » | The mutual fund commenced operations on April 20, 2012. |
| » | Since the commencement of operations, the mutual fund has maintained a defensive posture with an average net equity exposure of approximately 42% of net assets with long and short holdings averaging approximately 47% and 6%, respectively, of net assets. |
| » | The Fund’s long equity holdings were the primary detractors from returns as equity markets fell during the period. While most of the Fund’s short positions benefited from the equity market selloff, these gains were offset by one position that rose meaningfully during the period. The Fund’s high cash position helped to preserve capital during the market drawdown. |
| 16 | PIMCO EQUITY SERIES |
Table of Contents
Insights from the Portfolio Managers PIMCO Emerging Multi-Asset Fund
Dear Shareholder,
We appreciate your investment in the PIMCO Emerging Multi-Asset Fund (the “Fund”). Below is our annual update that includes a discussion of our investment outlook with a focus on emerging markets (“EM”) as well as an update on the portfolio over the twelve-month reporting period ended June 30, 2012.
Emerging Market Asset Classes Fluctuate with Risk Appetite
In the second half of 2011 amidst a market in which risk sentiment oscillated due to eurozone events, EM assets suffered with EM equities losing 19% followed by EM FX (currencies) with a 9.86% loss. Yields in EM U.S. dollar-denominated instruments increased as the sharp rally in U.S. rates was not enough to compensate for the widening in spreads. In EM local debt on the other hand, yields tightened in response to slowing economic growth and since countries were generally implementing monetary easing measures. Nonetheless local debt lost 8.12%, a result mostly explained by the losses in EM FX. Given the increased volatility in the market during the latter part of 2011, we decreased our EM equities and EM FX exposure while increasing our cash positioning as well as our local rates exposure given the tailwind of slowing global growth to EM local rates.
Going into 2012, we viewed valuations, on a risk/return perspective, in these assets as attractive. Net cash, which stood at approximately 22% in late 2011, was brought steadily down to approximately 12% at the end of the first quarter of 2012 and reduced further to 9% at the end of the second quarter of 2012. Cash was tactically put to work in, primarily, EM equities and EM-related developed market equities where valuations were especially compelling, in our opinion. Thus, allocations to equities rose from 32% of the Fund (by market value) at December 31, 2011 to roughly 44% by the end of the reporting period. Allocations to EM local debt also continued rising steadily from approximately 20% of the Fund at the end of 2011 to approximately 24%, which was near its weight in the blended benchmark.
In 2012 the year began with a risk rally that sent EM asset returns up sharply from where they ended 2011. A string of positive U.S. economic data released through the earlier part of the first quarter of 2012 and continued European Central Bank life support policies for peripheral Europe improved risk sentiment. This translated into a strong performance for EM assets during the first quarter of 2012, especially for lesser-quality bonds, currencies, and equities. It seemed as if the asset classes and the individual countries that suffered the most in 2011 rose the most in January and February 2012. Some of those gains retracted in March, though, as the market seemed to acknowledge it had gotten off to an overly ambitious start to the year.
The significant risk rally in the beginning of the year benefited EM equities the most. After posting losses in 2011, EM equities returned over 10% in January 2012 (per MSCI’s Emerging Markets Index). Strong EM equity returns continued in February (up over 5%) before reversing in March when EM equities lost around 3%. EM equities fell sharply in the second quarter of 2012 but remained modestly up for the year-to-date period.
Local debt was the next biggest beneficiary of the vigorous start to the year. The risk-on rally drove down local yields and led to higher local currency values, propelling local debt to a 7.42% return in January 2012 as measured by the JPMorgan GBI-EM Global Diversified. Local debt returns ebbed in February along with risk appetite in the market but still returned 2.86% which was in-line with other EM asset classes. Risk appetite continued to fall in March, and as a result EM local debt underperformed all other EM fixed income asset classes, including FX. Local debt lagged in April and May as well, dragged down by weaker local currencies which, as expected, took the brunt of continued weak global risk appetite. EM local debt rebounded sharply when risk appetite reappeared in June and the asset class again became the top performing category in the EM fixed income and currency space.
U.S. dollar-denominated sovereign debt underperformed at the beginning of 2012. A sharp fall in U.S. Treasury yields, however, propelled this asset class as the year unfolded and U.S. dollar-denominated sovereign debt was the top-returning EM asset class through much of the remainder of the first half of 2012.
Balancing Near-Term Stress and a Longer-Term Bullish Outlook for Emerging Markets
While we still maintain secularly bullish on the investment prospects for EM, we acknowledge the near-term stress on the global economy is likely to exert pressure on all risk asset classes including EM. Events in the eurozone—and the need for an orderly solution to the challenges to growth and debt sustainability there—continue to dominate prospects for global growth and investor sentiment. Our view that developed market growth in general, and that of the eurozone in particular, needed to be revised down drove us to also lower our expectations for EM growth. Specifically, we see emerging economies expanding at a rate of 5% over the next few years, down from our previous forecast of 6%. That rate is still favorable vs. the 1% growth rate we anticipate for developed economies. Amid greater differentiation across EM countries though, the uncertain global landscape will affect some countries more than others. We see significant potential for spillover through the banking channel and financial markets in EM Europe but more attractive opportunities elsewhere.
As PIMCO has acknowledged for some time now, many emerging economies entered this period of global uncertainty with relatively
| ANNUAL REPORT | JUNE 30, 2012 | 17 |
Table of Contents
Insights from the Portfolio Managers PIMCO Emerging Multi-Asset Fund (Cont.)
clean balance sheets, reasonably high degrees of policy flexibility, and substantial dry powder in the form of international currency reserves. Countries with these attributes are poised to outperform those that may lack the tools and wherewithal to deal with shocks from slowing global growth or abrupt changes in investor risk tolerance. Emerging economies with relatively higher levels of leverage and those most connected to Europe are likely to suffer disproportionately. Contagion risks have increased as the eurozone crisis continues to develop and deepen into a banking crisis. Countries such as Hungary, Romania, and Bulgaria have large external debt overhangs and are heavily exposed to changes in investor sentiment. Trade links between the eurozone and emerging Europe could negatively impact the latter, further pressuring economic growth. EM Asia, on the other hand, should be relatively less impacted by the eurozone turmoil. Nonetheless, unlike in 2009 when the region led the global recovery, 2012 will be a year where Asia will likely find itself in more of a reactionary mode. Latin American countries should also be less impacted by the continuing eurozone crisis given lower trade and banking links. This does not mean, however that Latin America will go unscathed.
Another set of risks impacting EM relates to developed markets’ (“DM”) monetary policy, unprecedented use of monetary policy tools, and the risk of financial repression that still looms on the horizon for the world’s most advanced economies. Against this backdrop, EM central bankers are likely to be highly accommodative as inflation pressures have generally abated worldwide while the risks of a global economic slowdown have increased. Some countries, such as Brazil, Mexico, and South Africa have greater leeway to cut rates than others where embedded inflationary pressures remain and monetary policy has been expansionary for some time. EM central bankers will also likely rely disproportionately on non-interest rate tools such as reserve ratio requirements, liquidity provisions, and directed credit to ease policy. In addition, we have seen a shift to a dual-focus on inflation and exchange rate targeting which, if not managed correctly, entails risks for the long-term credibility of central banks and ultimately may start to imperil inflation expectations.
In the cyclical horizon the global landscape continues to provide challenges to EM that will likely lead to greater asset volatility. However, we still see as likely the continued allocation of capital towards EM over the secular horizon with emerging countries’ cleaner balance sheets, higher relative growth rates, and attractive real yields. This stands in contrast to DM where the likelihood of continued financial repression stands to erode real returns for bond holders. Focusing on the strongest countries as investment targets and avoiding those where potential returns on assets in those countries do not adequately compensate for inherent risks is paramount. We believe there remain attractive investment opportunities in EM given the large gap between EM and DM growth and the fiscal and monetary policy flexibility that certain EM countries enjoy.
In the EM local markets space we see opportunities in countries that have positive real rates, high nominal yields, relatively steep yield curves, and credibly managed inflation expectations that allow central banks to conduct counter-cyclical monetary policy and cut interest rates to combat a slowdown. In addition, given the fall in EM currency valuations, we believe select currencies look attractive relative to the U.S. dollar. In the external debt space, we favor countries that are well-equipped to weather market shocks from the eurozone and elsewhere. We also see EM corporates as good “higher carry, higher quality” alternatives to developed world corporate bonds.
Though we remain cautiously positioned in the Fund, we are also ready to add attractively valued assets at opportune turning points. Again, we thank you for your continued investment in the Fund and look forward to serving your investment needs.
Sincerely,
 |  | |
 |  | |
| Curtis Mewbourne | Maria (Masha) Gordon | |
| Portfolio Manager, Generalist | Portfolio Manager, Emerging Markets Equities | |
 |  | |
 |  | |
| Michael Gomez | Ramin Toloui | |
| Portfolio Manager, Emerging Markets Local Debt | Portfolio Manager, Emerging Markets External Debt | |
| 18 | PIMCO EQUITY SERIES |
Table of Contents
Top Holdings1
PIMCO EqSTM Emerging Markets Fund | 36.4% | |||||
PIMCO Emerging Local Bond Fund | 23.9% | |||||
PIMCO Emerging Markets Bond Fund | 16.3% | |||||
Vanguard MSCI Emerging Markets ETF | 5.6% | |||||
PIMCO Emerging Markets Corporate Bond Fund | 2.9% | |||||
PIMCO Emerging Markets Currency Fund | 1.5% | |||||
PIMCO CommoditiesPLUS® Strategy Fund | 0.8% | |||||
Teva Pharmaceutical Industries Ltd. SP—ADR | 0.7% |
| 1 | % of Total Investments as of 06/30/2012. Top Holdings solely reflect long positions. Securities sold short, financial derivative instruments and short-term instruments are not taken into consideration. |
| ANNUAL REPORT | JUNE 30, 2012 | 19 |
Table of Contents
PIMCO Emerging Multi-Asset Fund
| Institutional Class - PEAWX | Class A - PEAAX | |
| Class P - PEAQX | Class C - PEACX | |
| Administrative Class - PEAMX | Class R - PEARX | |
| Class D - PEAEX |
Cumulative Returns Through June 30, 2012
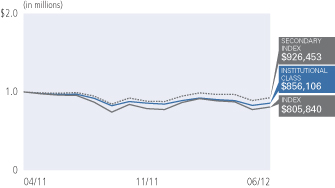
| Average Annual Total Return for the period ended June 30, 2012 | ||||||||||
| 1 Year | Fund Inception (04/12/11) | |||||||||
| PIMCO Emerging Multi-Asset Fund Institutional Class | -11.45% | -10.33% | |||||||
| PIMCO Emerging Multi-Asset Fund Class P | -11.69% | -10.46% | ||||||||
| PIMCO Emerging Multi-Asset Fund Administrative Class | -11.75% | -10.59% | ||||||||
| PIMCO Emerging Multi-Asset Fund Class D | -11.77% | -10.60% | ||||||||
| PIMCO Emerging Multi-Asset Fund Class A | -11.72% | -10.63% | ||||||||
| PIMCO Emerging Multi-Asset Fund Class A (adjusted) | -16.57% | -14.69% | ||||||||
| PIMCO Emerging Multi-Asset Fund Class C | -12.51% | -11.29% | ||||||||
| PIMCO Emerging Multi-Asset Fund Class C (adjusted) | -13.38% | -11.29% | ||||||||
| PIMCO Emerging Multi-Asset Fund Class R | -11.98% | -10.84% | ||||||||
| MSCI Emerging Markets Index± | -15.95% | -14.55% | |||||||
| 50% MSCI Emerging Markets Index, 25% JPMorgan Emerging Markets Bond Index (EMBI) Global, 25% JPMorgan Government Bond Index-Emerging Markets Global Diversified Index (Unhedged)±± | -5.83% | -4.46% | |||||||
All Fund returns are net of fees and expenses.
± The MSCI Emerging Markets Index is a free float-adjusted market capitalization index that is designed to measure equity market performance of emerging markets. The MSCI Emerging Markets Index consists of the following 21 emerging market country indices: Brazil, Chile, China, Colombia, Czech Republic, Egypt, Hungary, India, Indonesia, Korea, Malaysia, Mexico, Morocco, Peru, Philippines, Poland, Russia, South Africa, Taiwan, Thailand, and Turkey. It is not possible to invest directly in an unmanaged index.
±± The benchmark is a blend of 50% MSCI Emerging Markets Index, 25% JPMorgan Emerging Markets Bond Index (EMBI) Global, 25% JPMorgan Government Bond Index-Emerging Markets Global Diversified Index (Unhedged). The MSCI Emerging Markets Index is a free float-adjusted market capitalization index that is designed to measure the equity market performance in the global emerging markets. The MSCI Emerging Markets Index consists of the following 21 emerging market country indices: Brazil, Chile, China, Colombia, Czech Republic, Egypt, Hungary, India, Indonesia, Korea, Malaysia, Mexico, Morocco, Peru, Philippines, Poland, Russia, South Africa, Taiwan, Thailand and Turkey. JPMorgan Emerging Markets Bond Index (EMBI) Global tracks total returns for United States Dollar denominated debt instruments issued by emerging market sovereign and quasi-sovereign entities: Brady bonds, loans, Eurobonds and local market instruments. It is not possible to invest directly in an unmanaged index. JPMorgan Government Bond Index-Emerging Markets Global Diversified Index (Unhedged) is a comprehensive global local emerging markets index, and consists of regularly traded, liquid fixed-rate, domestic currency government bonds to which international investors can gain exposure.
Performance quoted represents past performance. Past performance is not a guarantee or a reliable indicator of future results. Current performance may be lower or higher than performance shown. Investment return and the principal value of an investment will fluctuate. Shares may be worth more or less than original cost when redeemed. Returns shown do not reflect the deduction of taxes that a shareholder would pay on fund distributions or the redemption of fund shares. The adjusted returns take into account the maximum sales charge of 5.50% on A shares and 1.00% CDSC on C shares. The Fund’s total annual operating expense ratio as stated in the Fund’s current prospectus, as supplemented to date, is 2.24% for the Institutional Class shares, 2.34% for the Class P shares, 2.49% for the Administrative Class shares, 2.59% for the Class D shares, 2.59% for the Class A shares, 3.34% for the Class C shares and 2.84% for the Class R shares. Details regarding any Fund’s operating expenses can be found in the Fund’s prospectus. For performance current to the most recent month-end, visit www.pimco.com/investments.
Portfolio Insights
| » | The PIMCO Emerging Multi-Asset Fund seeks maximum total return, consistent with prudent investment management, by investing under normal circumstances at least 80% of its assets in investments economically tied to emerging market countries. The Fund will typically invest 20% to 80% of its total assets in equity-related instruments (including investments in common stock, preferred stock, and equity-related Underlying PIMCO Funds or Acquired Funds). The Fund is designed to provide concurrent exposure to a broad spectrum of emerging market asset classes, such as equity, fixed income and currencies, and other investments, including commodities. |
| » | During the reporting period, the Fund’s Institutional class shares declined 11.45% after fees, and the Fund’s secondary benchmark (a blended index consisting of 50% MSCI Emerging Markets Index/25% JPMorgan Emerging Markets Bond Index (EMBI) Global)/25% JPMorgan Government Bond Index-Emerging Markets (GBI-EM) Global Diversified Index (Unhedged) declined 5.83%. |
| » | An asset allocation decision to underweight external emerging markets (“EM”) debt detracted from relative performance as the JPMorgan Emerging Markets Bond Index (EMBI) Global outperformed the Fund’s blended secondary benchmark over the reporting period. |
| » | An asset allocation decision to underweight local EM debt detracted from relative performance as the JPMorgan Government Bond Index-Emerging Markets (GBI-EM) Global Diversified Index outperformed the Fund’s blended secondary benchmark over the reporting period. |
| » | A tactical allocation to EM currencies, which underperformed the Fund’s blended secondary benchmark, detracted from relative performance. |
| » | An asset allocation decision to underweight equities positively contributed to relative performance as EM equities, as represented by the MSCI Emerging Markets Index, underperformed the Fund’s blended secondary benchmark over the reporting period. |
| » | A tactical allocation to EM corporates positively contributed to relative performance as the asset class outperformed the Fund’s blended secondary benchmark over the reporting period. |
| 20 | PIMCO EQUITY SERIES |
Table of Contents
Insights from the Portfolio Managers PIMCO EqS Pathfinder Fund®
Dear Shareholder,
It is our pleasure to be speaking with you as we finish our second complete year since the launch of the PIMCO EqS Pathfinder Fund® (the “Fund”). We thank you for your investment in the Fund. Our commitment continues to be to seek an absolute return that beats the market over a full market cycle and to do so with less volatility than the overall market. For all those who are reading and have an interest in the Fund, we have organized our thoughts to update you on the current state of the investment world, the Fund itself, and our outlook.
The Last Twelve Months in Review
For the year ending June 30, 2012 your investment in the Fund slightly outperformed its benchmark, the MSCI World Index, despite posting negative returns. Akin to last year, the Fund’s outperformance relative to its benchmark occurred during a period marked by extremely high correlation across securities, very high volatility, and distinct “risk on” and “risk off” phases within the market.
Although we are bottom-up, fundamental equity investors, the high correlations among stocks suggest that macroeconomic concerns have been overwhelming fundamentals in the market and particularly so around negative events. As concerns rise, the herd mentality drives many investors to pursue a “risk off” posture causing prices to decline. As concerns subside and investors gradually migrate to a “risk on” posture, prices tend to rise and the correlations among stocks tend to decrease. These “risk on” and “risk off” waves of reactions to economic and political concerns created increased levels of volatility and have had a rather pernicious effect on investors’ behavior.
As concerns rose last fall about sovereign debt and the financial health of some eurozone countries—e.g., Greece, Ireland, Portugal, Italy and Spain—markets sold off, correlations rose, and volatility tripled. Subsequently, modestly positive economic news coming out of the United States allowed investors to breathe a sigh of relief, and equity markets rose from late fall 2011 right through the end of the first quarter of 2012. Sovereign debt and Spanish bank concerns resurfaced in the spring of 2012, and markets retraced the attractive gains they had made since the end of the previous year. Although this volatility had an impact on the Fund, it continued to perform in historical fashion; being less volatile than the market, outperforming its benchmark during the negative time periods and for the entire twelve months overall.
Let’s review a few of our top and bottom performing stocks in the portfolio for the past year.
The shares of Intel Corp., the world’s largest chipmaker, returned 24.3% over the past year. In our view, Intel is a misunderstood and
underappreciated technology company, in spite of its position as an industry leader in microprocessor manufacturing. We believe this manufacturing capability provides the company with a significant competitive advantage for the PC/Server market and positions them well to compete in the mobile and tablet products areas where they have not been as heavily incorporated. The extraordinary growth in data and the proliferation of smartphones and tablets has been a significant benefit to the company’s server business, as its data-center group, which includes chips for servers, just recorded a 15% revenue increase, year over year. The company’s business model generates significant free cash flow yield of 6.5% and has been producing a return on assets of 18%, as of the end of the period. We continue to find the company attractive, trading at a price/earnings ratio (PE) of approximately 10.5X 2012 estimated earnings per share (EPS) with a dividend yield of 3.4%.
Founded in 1760, Lorillard is the third largest cigarette manufacturer and the oldest continuously operating tobacco company in the U.S. Lorillard’s flagship product is the Newport brand, which is the top selling menthol and second largest selling cigarette in the U.S. In a sector that’s besieged with litigation risk and declining volumes, Lorillard is perhaps one of the few companies that’s considered by some to be a “growth” story. The company’s stock returned 27.1% over the period as Lorillard’s sales rose 9% in 2011 with adjusted operating income up 8.2%. This has been a fairly consistent pattern as the company has evidenced compound annual growth rates (CAGR) of 7.8% in sales and operating income growth of 8.5 % over the 2006-2011 time period. The company maintains a narrow product line with only 43 SKUs (stock keeping units) for the entire company, versus 200 SKUs at Philip Morris, suggesting the opportunity to broaden the breadth of its Newport franchise. Towards that end, the company just recently introduced Newport Red, a non-menthol version. Trading with a dividend yield of 4.4% and a price/earnings ratio of 14.5X on 2013 estimated EPS, we continue to enjoy the stability of earnings from its existing product lines, as well as its growth potential.
Lancashire Holdings was another notable performer over the past year, with the stock returning 33.0% in local currency terms. Lancashire provides specialty insurance products in Bermuda, London, and Dubai. The company mainly focuses on short-tail, mostly in direct basis, specialty insurance risks under four general categories including property, energy, marine, and aviation. As a skilled underwriter of insurance and reinsurance with a low risk investment policy (assets invested largely in U.S. Treasuries) we view the company as a high quality holding within the financial sector. The main driver of the company’s returns come from its skill in underwriting these short-tailed risks rather than from taking unnecessary risks with the investment of its retained premiums. As a result, the company’s risks
| ANNUAL REPORT | JUNE 30, 2012 | 21 |
Table of Contents
Insights from the Portfolio Managers PIMCO EqS Pathfinder Fund® (Cont.)
revolve around its underwriting success and the property and casualty insurance pricing cycle rather the cycles of capital market appreciation. The company’s stock price rose steadily throughout the past year as the company delivered steady, solid performance and the company also announced a special dividend at the end of last year, which boosted the stock’s dividend yield to approximately 8.4% at the time.
As is always the case with deep value managers who tend to purchase stocks when they are under some pressure in the market, we also own a few companies whose share prices are in the penalty box.
Nintendo is one of the world’s largest manufacturers of video game hardware and software. It’s been under pressure for some time due to struggling sales, weaker than expected profits, and a continued shift of gamers away from portable gaming devices towards smartphones. Issues still linger for the Wii U, including its sales price, although in our view investors are already considering this product as a failure upon launch. So much so that at the end of the period, the company’s stock was priced at roughly a 28% premium to the cash and investments held on the company’s balance sheet. By comparison, BlackBerry manufacturer Research In Motion (RIMM), which is not held in the portfolio, and which is undergoing a great deal of negative investor sentiment, has a 72% premium in its market capitalization to the value of the cash and investments on its balance sheet. With competitors proposing methods of play that look similar to Nintendo’s with the use of a portable device that connects to a game console, the company hardware may no longer be a key competitive differentiator and Nintendo may need to highlight the unique appeal of Wii U through its software. In addition, we believe there is the potential for upside surprise if Nintendo is able to incorporate its own game universe (called “Miiverse”) and can then capitalize on its library of intellectual property.
ING is one of the leading financial services companies in the Netherlands, offering to its clients corporate, investment and private banking services, as well as investment management, treasury services and insurance. As a result of the financial crisis in 2008-2009, ING Groep is in the process of restructuring its business model by selling its various insurance businesses to separate ING Bank from ING Insurance to comply with the terms of the sovereign support it received in the midst of the crisis. With shares currently priced at a discounted price-to-book level of 0.4, which is a notable discount to the average 0.7 price to book ratio of European financials, we see a significantly undervalued company which has recently returned to profitability and has generated a much improved 10.6% return on equity.
Carrefour is the world’s second largest food retailer behind Wal-Mart, however its shares have struggled of late, declining 38.9% over the past year, due in part to its exposure to the declining economies of
Europe and its lack of good corporate leadership. The company derives about 43% of its revenue from France, which is teetering on the brink of a recession, and other parts of Europe and that has impacted sales. Leadership has also been an issue at the firm, as the retailer consistently missed the market in pricing; however the company replaced four senior executives this year including its CFO and CEO. At the end of June, Carrefour’s stock was trading at 1.5 times its book value, a noticeable discount to other retailers and a level which significantly discounts the other parts of its business outside Europe, in higher growth markets such as Latin America and Asia. The new management team is in the midst of affecting a turn-around at the company and we are watching the progress closely.
Quality Equity Investing in the Current Environment
As we look forward, PIMCO sees global growth moderating in the years ahead. Still, corporate balance sheets in developed markets are generally in good health and many companies are well positioned to generate growth even in difficult times. Navigating the elevated levels of volatility in the equity markets, however, is critical, as volatility can soar with the potential to do considerable damage to short- or long-term returns. We are focused on finding those idiosyncratic opportunities that may offer attractive returns irrespective of what the base case may be in the broad equity markets, and we are also focused on mitigating downside exposure.
Given the concerns facing investors in this environment—slower growth, the economic malaise and sovereign crisis in Europe, and geopolitical dysfunction—our investment process to manage the Fund is firmly developed and does not change. What is constantly changing, however, is the market, and our focus on quality companies provides the benefit of more consistent business performance and less risk during these volatile times.
We define quality businesses by their clean balance sheets with relatively low financial leverage, high operating margins and high dividend yields. We also seek high barriers to entry and access to high-growth markets in the business models we analyze. We believe these qualities in combination are excellent signals of a quality company—a company positioned to stand the test of time and ride out good times and bad. Given the sharp inflection points that we see looming ahead arising from debt and income imbalances, we view quality as the clearest way to position portfolios to help weather the vicissitudes of the market.
Short-term swings in equity markets can often drive investors out of quality companies and into more speculative names as they reach for higher beta stocks in their search for return. This type of behavior, however, can often provide a disciplined investor the opportunity to purchase a better business at a more attractive price. Better, quality
| 22 | PIMCO EQUITY SERIES |
Table of Contents
businesses tend to have less volatility in their earnings and stock prices over time, and this lower volatility can often lead to better compounding of returns over the long-term.
Opportunities to find good investments in quality companies are usually found in areas where the fewest investors are looking. Many large multinational companies today have access to growth in both developed and emerging markets and are trading at attractive valuations with good dividend yields. Many of these multinationals have diverse engines of growth where not only should an investor benefit from earnings growth potential in the future, but also from a growing stream of dividends; particularly so as we ponder living in a world in which ten-year U.S. Treasury yields are below 2%. Yes, volatility has increased, but we believe volatility presents opportunity for the prepared mind, and we anticipate finding a lot of outstanding values and opportunities right now in quality companies.
To close our letter, we repeat our thanks for staying the course with the PIMCO EqS Pathfinder Fund®, just as we are staying the course with our discipline, seeking the twin goals of capital appreciation and downside risk mitigation. We are privileged to have the opportunity to manage your capital and we look forward to both the challenges and the opportunities in the months and years ahead.
Sincerely,
 |  | |
|  | |
Charles Lahr, CFA Co-Portfolio Manager | Anne Gudefin, CFA Co-Portfolio Manager | |

Top 10 Holdings1
SPDR Gold Trust | 3.8% | |||||
Imperial Tobacco Group PLC | 3.4% | |||||
British American Tobacco PLC | 3.1% | |||||
Microsoft Corp. | 2.8% | |||||
Danone S.A. | 2.5% | |||||
Intel Corp. | 2.4% | |||||
Lorillard, Inc. | 2.4% | |||||
Lancashire Holdings Ltd. | 2.2% | |||||
AIA Group Ltd. | 2.2% | |||||
Pernod-Ricard S.A. | 2.0% |
Geographic Breakdown1
United States | 32.2% | |||||
France | 12.8% | |||||
United Kingdom | 11.7% | |||||
Bermuda | 6.4% | |||||
Netherlands | 6.4% | |||||
Switzerland | 4.4% | |||||
Hong Kong | 3.5% | |||||
Germany | 2.2% | |||||
Denmark | 2.1% | |||||
Canada | 2.1% | |||||
Norway | 2.0% | |||||
Japan | 1.8% | |||||
Other | 6.0% |
Sector Breakdown1
Consumer Staples | 27.2% | |||||
Financials | 21.1% | |||||
Energy | 8.8% | |||||
Information Technology | 8.3% | |||||
Industrials | 8.1% | |||||
Health Care | 5.7% | |||||
Exchange-Traded Funds | 3.8% | |||||
Consumer Discretionary | 3.5% | |||||
Utilities | 3.1% | |||||
Materials | 2.5% | |||||
Telecommunication Services | 1.5% |
| 1 | % of Total Investments as of 06/30/2012. Top Holdings, Geographic and Sector Breakdown solely reflect long positions. Securities sold short, financial derivative instruments and short-term instruments are not taken into consideration. |
| ANNUAL REPORT | JUNE 30, 2012 | 23 |
Table of Contents
| Institutional Class - PTHWX | Class A - PATHX | |
| Class P - PTHPX | Class C - PTHCX | |
| Class D - PTHDX | Class R - PTHRX |
Cumulative Returns Through June 30, 2012
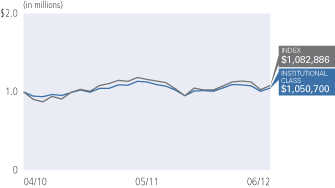
| Average Annual Total Return for the period ended June 30, 2012 | ||||||||||
| 1 Year | Fund Inception (04/14/10) | |||||||||
| PIMCO EqS Pathfinder Fund® Institutional Class | -4.09% | 1.47% | |||||||
| PIMCO EqS Pathfinder Fund® Class P | -4.23% | 1.36% | ||||||||
| PIMCO EqS Pathfinder Fund® Class D | -4.52% | 1.05% | ||||||||
| PIMCO EqS Pathfinder Fund® Class A | -4.50% | 1.08% | ||||||||
| PIMCO EqS Pathfinder Fund® Class A (adjusted) | -9.75% | -1.47% | ||||||||
| PIMCO EqS Pathfinder Fund® Class C | -5.15% | 0.40% | ||||||||
| PIMCO EqS Pathfinder Fund® Class C (adjusted) | -6.10% | 0.40% | ||||||||
| PIMCO EqS Pathfinder Fund® Class R | -4.86% | 0.75% | ||||||||
| MSCI World Index± | -4.98% | 2.16% | |||||||
All Fund returns are net of fees and expenses.
± The MSCI World Index is a free float-adjusted market capitalization weighted index that is designed to measure the equity market performance of developed markets. The MSCI World Index consists of the following 24 developed market country indices: Australia, Austria, Belgium, Canada, Denmark, Finland, France, Germany, Greece, Hong Kong, Ireland, Israel, Italy, Japan, Netherlands, New Zealand, Norway, Portugal, Singapore, Spain, Sweden, Switzerland, the United Kingdom, and the United States. It is not possible to invest directly in an unmanaged index.
Performance quoted represents past performance. Past performance is not a guarantee or a reliable indicator of future results. Current performance may be lower or higher than performance shown. Investment return and the principal value of an investment will fluctuate. Shares may be worth more or less than original cost when redeemed. Returns shown do not reflect the deduction of taxes that a shareholder would pay on fund distributions or the redemption of fund shares. The adjusted returns take into account the maximum sales charge of 5.50% on A shares and 1.00% CDSC on C shares. The Fund’s total annual operating expense ratio as stated in the Fund’s current prospectus, as supplemented to date, is 1.11% for the Institutional Class shares, 1.21% for the Class P shares, 1.46% for the Class D shares, 1.46% for the Class A shares, 2.21% for the Class C shares and 1.71% for the Class R shares. Details regarding any Fund’s operating expenses can be found in the Fund’s prospectus. For performance current to the most recent month-end, visit www.pimco.com/investments.
Portfolio Insights
| » | The PIMCO EqS Pathfinder Fund® seeks capital appreciation by investing under normal circumstances in equity securities, including common and preferred stock (and securities convertible into, or that PIMCO expects to be exchanged for, common or preferred stock), of issuers that PIMCO believes are undervalued. The Fund’s bottom-up value investment style attempts to identify securities that are undervalued by the market in comparison to PIMCO’s own determination of the company’s value, taking into account criteria such as asset value, book value, cash flow and earnings estimates. |
| » | During the reporting period, the Fund’s Institutional class shares declined 4.09% after fees, and the Fund’s benchmark index, the MSCI World Index, declined 4.98%. The Fund’s performance, although negative, outperformed its benchmark by 0.89% after fees. |
| » | Stock selection in the financials and energy sectors were notable contributors to the Fund’s excess returns as the holdings within these sectors proved to be more resilient during the market’s decline. |
| » | Holdings in Intel, Lorillard, and Lancashire Holdings were notable contributors to performance as the share prices of these companies appreciated during the reporting period. |
| » | Holdings in Nintendo, ING Groep, and Carrefour were moderate detractors from returns as prices on these securities declined during the reporting period. |
| » | At the end of the reporting period, the Fund held approximately 88% in equities we believe are undervalued, approximately 1% (on the long side only) in merger arbitrage investments, approximately 7% in cash equivalents, and held the balance of the portfolio in currency and market risk hedges, including approximately 4% in gold. |
| 24 | PIMCO EQUITY SERIES |
Table of Contents
Example
As a shareholder of a Fund, you incur two types of costs: (1) transaction costs, including sales charges (loads) on purchase payments and exchange fees and (2) ongoing costs, including management fees, distribution and/or service (12b-1) fees, and other Fund expenses. The Example is intended to help you understand your ongoing costs (in dollars) of investing in a Fund and to compare these costs with the ongoing costs of investing in other mutual funds.
The Example is based on an investment of $1,000 invested at the beginning of the period and held for the entire period indicated, which for all Funds and share classes is from January 1, 2012 to June 30, 2012 unless noted otherwise in the table and footnotes below.
Actual Expenses
The information in the table under the heading “Actual Performance” provides information about actual account values and actual expenses. You may use the information in these columns, together with the amount you invested, to estimate the expenses that you paid over the period. Simply divide your account value by $1,000 (for example, an $8,600 account value divided by $1,000 = $8.60), then multiply the result by the number in the appropriate column for your share class, in the row entitled “Expenses Paid During Period” to estimate the expenses you paid on your account during this period.
Hypothetical Example for Comparison Purposes
The information in the table under the heading “Hypothetical Performance (5% return before expenses)” provides information about hypothetical account values and hypothetical expenses based on a Fund’s actual expense ratio and an assumed rate of return of 5% per year before expenses, which is not the Fund’s actual return. The hypothetical account values and expenses may not be used to estimate the actual ending account balance or expenses you paid for the period. You may use this information to compare the ongoing costs of investing in a Fund and other funds. To do so, compare this 5% hypothetical example with the 5% hypothetical examples that appear in the shareholder reports of the other funds.
Please note that the expenses shown in the table are meant to highlight your ongoing costs only and do not reflect any transactional costs, such as sales charges (loads) on purchase payments and exchange fees. Therefore, the information under the heading “Hypothetical Performance (5% return before expenses)” is useful in comparing ongoing costs only, and will not help you determine the relative total costs of owning different funds. In addition, if these transactional costs were included, your costs would have been higher.
Expense ratios may vary from period to period because of various factors such as an increase in expenses that are not covered by the management fees, such as fees and expenses of the independent trustees and their counsel, extraordinary expenses and interest expense.
Actual Performance | Hypothetical Performance | |||||||||||||||||||||||||||||||||
| Beginning Account Value (01/01/12) | Ending Account Value (06/30/12) | Expenses Paid During Period * | Beginning Account Value (01/01/12) | Ending Account Value (06/30/12) | Expenses Paid During Period * | Net Annualized Expense Ratio ** | ||||||||||||||||||||||||||||
PIMCO Dividend and Income Builder Fund | ||||||||||||||||||||||||||||||||||
| Institutional Class | $ | 1,000.00 | $ | 1,049.80 | $ | 4.23 | $ | 1,000.00 | $ | 1,020.74 | $ | 4.17 | 0.83 | % | ||||||||||||||||||||
| Class P | 1,000.00 | 1,050.30 | 4.74 | 1,000.00 | 1,020.24 | 4.67 | 0.93 | |||||||||||||||||||||||||||
| Class D | 1,000.00 | 1,048.10 | 6.01 | 1,000.00 | 1,019.00 | 5.92 | 1.18 | |||||||||||||||||||||||||||
| Class A | 1,000.00 | 1,047.10 | 6.01 | 1,000.00 | 1,019.00 | 5.92 | 1.18 | |||||||||||||||||||||||||||
| Class C | 1,000.00 | 1,043.50 | 9.81 | 1,000.00 | 1,015.27 | 9.67 | 1.93 | |||||||||||||||||||||||||||
| Class R | 1,000.00 | 1,046.90 | 7.28 | 1,000.00 | 1,017.75 | 7.17 | 1.43 | |||||||||||||||||||||||||||
PIMCO EqSTM Dividend Fund | ||||||||||||||||||||||||||||||||||
| Institutional Class | $ | 1,000.00 | $ | 1,050.40 | $ | 4.23 | $ | 1,000.00 | $ | 1,020.74 | $ | 4.17 | 0.83 | % | ||||||||||||||||||||
| Class P | 1,000.00 | 1,050.80 | 4.74 | 1,000.00 | 1,020.24 | 4.67 | 0.93 | |||||||||||||||||||||||||||
| Class D | 1,000.00 | 1,049.60 | 6.01 | 1,000.00 | 1,019.00 | 5.92 | 1.18 | |||||||||||||||||||||||||||
| Class A | 1,000.00 | 1,049.60 | 6.01 | 1,000.00 | 1,019.00 | 5.92 | 1.18 | |||||||||||||||||||||||||||
| Class C | 1,000.00 | 1,043.10 | 9.80 | 1,000.00 | 1,015.27 | 9.67 | 1.93 | |||||||||||||||||||||||||||
| Class R | 1,000.00 | 1,047.40 | 7.28 | 1,000.00 | 1,017.75 | 7.17 | 1.43 | |||||||||||||||||||||||||||
| ANNUAL REPORT | JUNE 30, 2012 | 25 |
Table of Contents
Expense Examples (Cont.)
| Actual Performance | Hypothetical Performance (5% return before expenses) | |||||||||||||||||||||||||||||||||
| Beginning Account Value (01/01/12) | Ending Account Value (06/30/12) | Expenses Paid During Period * | Beginning Account Value (01/01/12) | Ending Account Value (06/30/12) | Expenses Paid During Period * | Net Annualized Expense Ratio ** | ||||||||||||||||||||||||||||
PIMCO EqSTM Emerging Markets Fund | ||||||||||||||||||||||||||||||||||
| Institutional Class | $ | 1,000.00 | $ | 1,003.80 | $ | 6.23 | $ | 1,000.00 | $ | 1,018.65 | $ | 6.27 | 1.25 | % | ||||||||||||||||||||
| Class P | 1,000.00 | 1,002.50 | 6.72 | 1,000.00 | 1,018.15 | 6.77 | 1.35 | |||||||||||||||||||||||||||
| Administrative Class | 1,000.00 | 1,002.50 | 7.47 | 1,000.00 | 1,017.40 | 7.52 | 1.50 | |||||||||||||||||||||||||||
| Class D | 1,000.00 | 1,001.30 | 7.96 | 1,000.00 | 1,016.91 | 8.02 | 1.60 | |||||||||||||||||||||||||||
| Class A | 1,000.00 | 1,001.30 | 7.96 | 1,000.00 | 1,016.91 | 8.02 | 1.60 | |||||||||||||||||||||||||||
| Class C | 1,000.00 | 997.50 | 11.67 | 1,000.00 | 1,013.18 | 11.76 | 2.35 | |||||||||||||||||||||||||||
| Class R | 1,000.00 | 1,000.00 | 9.20 | 1,000.00 | 1,015.66 | 9.27 | 1.85 | |||||||||||||||||||||||||||
PIMCO EqSTM Long/Short Fund(a) | ||||||||||||||||||||||||||||||||||
| Institutional Class | $ | 1,000.00 | $ | 1,033.80 | $ | 2.91 | $ | 1,000.00 | $ | 1,017.30 | $ | 7.62 | 1.52 | % | ||||||||||||||||||||
| Class P | 1,000.00 | 1,032.40 | 2.74 | 1,000.00 | 1,016.81 | 8.12 | 1.62 | |||||||||||||||||||||||||||
| Class D | 1,000.00 | 1,031.60 | 3.17 | 1,000.00 | 1,015.56 | 9.37 | 1.87 | |||||||||||||||||||||||||||
| Class A | 1,000.00 | 1,031.60 | 3.17 | 1,000.00 | 1,015.56 | 9.37 | 1.87 | |||||||||||||||||||||||||||
| Class C | 1,000.00 | 1,028.20 | 4.43 | 1,000.00 | 1,011.84 | 13.11 | 2.62 | |||||||||||||||||||||||||||
PIMCO Emerging Multi-Asset Fund | ||||||||||||||||||||||||||||||||||
| Institutional Class | $ | 1,000.00 | $ | 1,015.20 | $ | 2.66 | $ | 1,000.00 | $ | 1,022.23 | $ | 2.66 | 0.53 | % | ||||||||||||||||||||
| Class P | 1,000.00 | 1,014.00 | 3.15 | 1,000.00 | 1,021.73 | 3.17 | 0.63 | |||||||||||||||||||||||||||
| Administrative Class | 1,000.00 | 1,014.00 | 3.91 | 1,000.00 | 1,020.98 | 3.92 | 0.78 | |||||||||||||||||||||||||||
| Class D | 1,000.00 | 1,014.00 | 4.41 | 1,000.00 | 1,020.49 | 4.42 | 0.88 | |||||||||||||||||||||||||||
| Class A | 1,000.00 | 1,014.00 | 4.41 | 1,000.00 | 1,020.49 | 4.42 | 0.88 | |||||||||||||||||||||||||||
| Class C | 1,000.00 | 1,009.40 | 8.14 | 1,000.00 | 1,016.76 | 8.17 | 1.63 | |||||||||||||||||||||||||||
| Class R | 1,000.00 | 1,012.80 | 5.66 | 1,000.00 | 1,019.24 | 5.67 | 1.13 | |||||||||||||||||||||||||||
PIMCO EqS Pathfinder Fund® | ||||||||||||||||||||||||||||||||||
| Institutional Class | $ | 1,000.00 | $ | 1,041.20 | $ | 4.67 | $ | 1,000.00 | $ | 1,020.29 | $ | 4.62 | 0.92 | % | ||||||||||||||||||||
| Class P | 1,000.00 | 1,041.30 | 5.18 | 1,000.00 | 1,019.79 | 5.12 | 1.02 | |||||||||||||||||||||||||||
| Class D | 1,000.00 | 1,039.30 | 6.44 | 1,000.00 | 1,018.55 | 6.37 | 1.27 | |||||||||||||||||||||||||||
| Class A | 1,000.00 | 1,039.20 | 6.44 | 1,000.00 | 1,018.55 | 6.37 | 1.27 | |||||||||||||||||||||||||||
| Class C | 1,000.00 | 1,035.30 | 10.22 | 1,000.00 | 1,014.82 | 10.12 | 2.02 | |||||||||||||||||||||||||||
| Class R | 1,000.00 | 1,037.30 | 7.70 | 1,000.00 | 1,017.30 | 7.62 | 1.52 | |||||||||||||||||||||||||||
* Expenses paid during the period are equal to the net annualized expense ratio for the class, multiplied by the average account value over the period, multiplied by 182/366 (to reflect the one-half year period).
** The net annualized expense ratio is reflective of any applicable waivers related to contractual agreements for contractual fee waivers or voluntary fee waivers. Details regarding fee waivers can be found in note 9 in the Notes to Financial Statements.
(a) The Beginning Account Value is reflective as of 4/20/12 for Actual Performance. Expenses paid in the Actual Performance section are equal to the net annualized expense ratio for the Class, multiplied by the average account value over the period, multiplied by 69/366 for the Institutional Class shares and by 61/366 for all other class shares of the PIMCO EqSTM Long/Short Fund (to reflect the period since the inception date of 4/20/12 for the Institutional Class shares and of 4/30/12 for all other class shares). Hypothetical expenses reflect an amount as if the Classes had been operational for the entire fiscal half year.
| 26 | PIMCO EQUITY SERIES |
Table of Contents
(THIS PAGE INTENTIONALLY LEFT BLANK)
| ANNUAL REPORT | JUNE 30, 2012 | 27 |
Table of Contents
| Selected Per Share Data for the Year or Period Ended: | Net Asset Value | Net Investment Income (Loss) (a) | Net Realized/ Unrealized Gain (Loss) | Total Income (Loss) from Investment Operations | Dividends from Net Investment Income | Distributions from Net Realized Capital Gains | Total Distributions | |||||||||||||||||||||
PIMCO Dividend and Income Builder Fund | ||||||||||||||||||||||||||||
| Institutional Class | ||||||||||||||||||||||||||||
12/14/2011 - 06/30/2012 | $ | 10.00 | $ | 0.25 | $ | 0.47 | $ | 0.72 | $ | (0.25 | ) | $ | 0.00 | $ | (0.25 | ) | ||||||||||||
| Class P | ||||||||||||||||||||||||||||
12/14/2011 - 06/30/2012 | 10.00 | 0.30 | 0.42 | 0.72 | (0.24 | ) | 0.00 | (0.24 | ) | |||||||||||||||||||
| Class D | ||||||||||||||||||||||||||||
12/14/2011 - 06/30/2012 | 10.00 | 0.26 | 0.44 | 0.70 | (0.23 | ) | 0.00 | (0.23 | ) | |||||||||||||||||||
| Class A | ||||||||||||||||||||||||||||
12/14/2011 - 06/30/2012 | 10.00 | 0.26 | 0.44 | 0.70 | (0.23 | ) | 0.00 | (0.23 | ) | |||||||||||||||||||
| Class C | ||||||||||||||||||||||||||||
12/14/2011 - 06/30/2012 | 10.00 | 0.24 | 0.41 | 0.65 | (0.19 | ) | 0.00 | (0.19 | ) | |||||||||||||||||||
| Class R | ||||||||||||||||||||||||||||
12/14/2011 - 06/30/2012 | 10.00 | 0.25 | 0.43 | 0.68 | (0.21 | ) | 0.00 | (0.21 | ) | |||||||||||||||||||
PIMCO EqS™ Dividend Fund | ||||||||||||||||||||||||||||
| Institutional Class | ||||||||||||||||||||||||||||
12/14/2011 - 06/30/2012 | $ | 10.00 | $ | 0.28 | $ | 0.42 | $ | 0.70 | $ | (0.23 | ) | $ | 0.00 | $ | (0.23 | ) | ||||||||||||
| Class P | ||||||||||||||||||||||||||||
12/14/2011 - 06/30/2012 | 10.00 | 0.29 | 0.41 | 0.70 | (0.22 | ) | 0.00 | (0.22 | ) | |||||||||||||||||||
| Class D | ||||||||||||||||||||||||||||
12/14/2011 - 06/30/2012 | 10.00 | 0.30 | 0.39 | 0.69 | (0.21 | ) | 0.00 | (0.21 | ) | |||||||||||||||||||
| Class A | ||||||||||||||||||||||||||||
12/14/2011 - 06/30/2012 | 10.00 | 0.27 | 0.42 | 0.69 | (0.21 | ) | 0.00 | (0.21 | ) | |||||||||||||||||||
| Class C | ||||||||||||||||||||||||||||
12/14/2011 - 06/30/2012 | 10.00 | 0.23 | 0.39 | 0.62 | (0.17 | ) | 0.00 | (0.17 | ) | |||||||||||||||||||
| Class R | ||||||||||||||||||||||||||||
12/14/2011 - 06/30/2012 | 10.00 | 0.18 | 0.48 | 0.66 | (0.19 | ) | 0.00 | (0.19 | ) | |||||||||||||||||||
PIMCO EqS™ Emerging Markets Fund | ||||||||||||||||||||||||||||
| Institutional Class | ||||||||||||||||||||||||||||
06/30/2012 | $ | 10.19 | $ | 0.08 | $ | (2.27 | ) | $ | (2.19 | ) | $ | (0.02 | ) | $ | (0.01 | ) | $ | (0.03 | ) | |||||||||
03/22/2011 - 06/30/2011 | 10.00 | 0.05 | 0.14 | 0.19 | 0.00 | 0.00 | 0.00 | |||||||||||||||||||||
| Class P | ||||||||||||||||||||||||||||
06/30/2012 | 10.19 | 0.06 | (2.25 | ) | (2.19 | ) | (0.02 | ) | (0.01 | ) | (0.03 | ) | ||||||||||||||||
03/22/2011 - 06/30/2011 | 10.00 | 0.04 | 0.15 | 0.19 | 0.00 | 0.00 | 0.00 | |||||||||||||||||||||
| Administrative Class | ||||||||||||||||||||||||||||
06/30/2012 | 10.18 | 0.06 | (2.27 | ) | (2.21 | ) | 0.00 | ^ | (0.01 | ) | (0.01 | ) | ||||||||||||||||
04/19/2011 - 06/30/2011 | 10.51 | 0.04 | (0.37 | ) | (0.33 | ) | 0.00 | 0.00 | 0.00 | |||||||||||||||||||
| Class D | ||||||||||||||||||||||||||||
06/30/2012 | 10.18 | 0.00 | ^ | (2.22 | ) | (2.22 | ) | (0.02 | ) | (0.01 | ) | (0.03 | ) | |||||||||||||||
03/22/2011 - 06/30/2011 | 10.00 | 0.06 | 0.12 | 0.18 | 0.00 | 0.00 | 0.00 | |||||||||||||||||||||
| Class A | ||||||||||||||||||||||||||||
06/30/2012 | 10.18 | 0.08 | (2.31 | ) | (2.23 | ) | 0.00 | ^ | (0.01 | ) | (0.01 | ) | ||||||||||||||||
03/22/2011 - 06/30/2011 | 10.00 | 0.05 | 0.13 | 0.18 | 0.00 | 0.00 | 0.00 | |||||||||||||||||||||
| Class C | ||||||||||||||||||||||||||||
06/30/2012 | 10.17 | 0.01 | (2.29 | ) | (2.28 | ) | 0.00 | ^ | (0.01 | ) | (0.01 | ) | ||||||||||||||||
03/22/2011 - 06/30/2011 | 10.00 | 0.03 | 0.14 | 0.17 | 0.00 | 0.00 | 0.00 | |||||||||||||||||||||
| Class R | ||||||||||||||||||||||||||||
06/30/2012 | 10.18 | 0.01 | (2.25 | ) | (2.24 | ) | 0.00 | ^ | (0.01 | ) | (0.01 | ) | ||||||||||||||||
03/22/2011 - 06/30/2011 | 10.00 | 0.06 | 0.12 | 0.18 | 0.00 | 0.00 | 0.00 | |||||||||||||||||||||
PIMCO EqS™ Long/Short Fund | ||||||||||||||||||||||||||||
| Institutional Class | ||||||||||||||||||||||||||||
04/20/2012 - 06/30/2012 | $ | 10.00 | $ | (0.02 | ) | $ | (0.27 | ) | $ | (0.29 | ) | $ | 0.00 | $ | 0.00 | $ | 0.00 | |||||||||||
| Class P | ||||||||||||||||||||||||||||
04/30/2012 - 06/30/2012 | 10.00 | (0.02 | ) | (0.28 | ) | (0.30 | ) | 0.00 | 0.00 | 0.00 | ||||||||||||||||||
| Class D | ||||||||||||||||||||||||||||
04/30/2012 - 06/30/2012 | 10.00 | (0.03 | ) | (0.27 | ) | (0.30 | ) | 0.00 | 0.00 | 0.00 | ||||||||||||||||||
Please see footnotes on pages 30 and 31.
| 28 | PIMCO EQUITY SERIES | See Accompanying Notes |
Table of Contents
| Net Asset Value End of Year or Period | Total Return | Net Assets End of Year or Period (000s) | Ratio of Expenses to Average Net Assets | Ratio of Expenses to Average Net Assets Excluding Waivers | Ratio of Expenses to Average Net Assets Excluding Interest Expense and Dividends on Securities Sold Short | Ratio of Expenses to Average Net Assets Excluding Interest Expense and Dividends on Securities Sold Short and Waivers | Ratio of Net Investment Income (Loss) to Average Net Assets | Portfolio Turnover Rate** | ||||||||||||||||||||||||||
| $ | 10.47 | 7.17 | % | $ | 11,170 | 0.83 | %* | 1.57 | %* | 0.83 | %* | 1.57 | %* | 4.35 | %* | 28 | % | |||||||||||||||||
| 10.48 | 7.21 | 8,207 | 0.93 | * | 2.47 | * | 0.93 | * | 2.47 | * | 5.28 | * | 28 | |||||||||||||||||||||
| 10.47 | 6.98 | 2,306 | 1.18 | * | 2.26 | * | 1.18 | * | 2.26 | * | 4.52 | * | 28 | |||||||||||||||||||||
| 10.47 | 6.98 | 13,314 | 1.18 | * | 2.43 | * | 1.18 | * | 2.43 | * | 4.62 | * | 28 | |||||||||||||||||||||
| 10.46 | 6.46 | 8,000 | 1.93 | * | 3.46 | * | 1.93 | * | 3.46 | * | 4.27 | * | 28 | |||||||||||||||||||||
| 10.47 | 6.84 | 415 | 1.43 | * | 2.32 | * | 1.43 | * | 2.32 | * | 4.30 | * | 28 | |||||||||||||||||||||
| $ | 10.47 | 6.95 | % | $ | 315,513 | 0.83 | %* | 1.20 | %* | 0.83 | %* | 1.20 | %* | 4.98 | %* | 21 | % | |||||||||||||||||
| 10.48 | 7.00 | 71 | 0.93 | * | 1.33 | * | 0.93 | * | 1.33 | * | 5.11 | * | 21 | |||||||||||||||||||||
| 10.48 | 6.86 | 1,251 | 1.18 | * | 1.67 | * | 1.18 | * | 1.67 | * | 5.25 | * | 21 | |||||||||||||||||||||
| 10.48 | 6.86 | 2,529 | 1.18 | * | 1.51 | * | 1.18 | * | 1.51 | * | 4.74 | * | 21 | |||||||||||||||||||||
| 10.45 | 6.19 | 1,275 | 1.93 | * | 2.26 | * | 1.93 | * | 2.26 | * | 4.11 | * | 21 | |||||||||||||||||||||
| 10.47 | 6.63 | 11 | 1.43 | * | 1.67 | * | 1.43 | * | 1.67 | * | 3.24 | * | 21 | |||||||||||||||||||||
| $ | 7.97 | (21.51 | )% | $ | 514,884 | 1.25 | % | 1.46 | % | 1.25 | % | 1.45 | % | 0.94 | % | 92 | % | |||||||||||||||||
| 10.19 | 1.90 | 353,099 | 1.25 | * | 1.62 | * | 1.25 | * | 1.62 | * | 1.77 | * | 41 | |||||||||||||||||||||
| 7.97 | (21.52 | ) | 63 | 1.35 | 1.56 | 1.35 | 1.55 | 0.68 | 92 | |||||||||||||||||||||||||
| 10.19 | 1.90 | 37 | 1.35 | * | 1.94 | * | 1.35 | * | 1.94 | * | 1.42 | * | 41 | |||||||||||||||||||||
| 7.96 | (21.72 | ) | 34 | 1.50 | 1.72 | 1.50 | 1.72 | 0.74 | 92 | |||||||||||||||||||||||||
| 10.18 | (3.14 | ) | 10 | 1.50 | * | 1.90 | * | 1.50 | * | 1.90 | * | 1.72 | * | 41 | ||||||||||||||||||||
| 7.93 | (21.83 | ) | 989 | 1.60 | 1.82 | 1.60 | 1.81 | (0.02 | ) | 92 | ||||||||||||||||||||||||
| 10.18 | 1.80 | 1,080 | 1.60 | * | 2.11 | * | 1.60 | * | 2.11 | * | 1.98 | * | 41 | |||||||||||||||||||||
| 7.94 | (21.89 | ) | 2,469 | 1.60 | 1.81 | 1.60 | 1.80 | 0.90 | 92 | |||||||||||||||||||||||||
| 10.18 | 1.80 | 764 | 1.60 | * | 2.02 | * | 1.60 | * | 2.02 | * | 1.89 | * | 41 | |||||||||||||||||||||
| �� | ||||||||||||||||||||||||||||||||||
| 7.88 | (22.43 | ) | 675 | 2.35 | 2.57 | 2.35 | 2.56 | 0.12 | 92 | |||||||||||||||||||||||||
| 10.17 | 1.70 | 98 | 2.35 | * | 2.80 | * | 2.35 | * | 2.80 | * | 0.98 | * | 41 | |||||||||||||||||||||
| 7.93 | (22.01 | ) | 24 | 1.85 | 2.07 | 1.85 | 2.06 | 0.06 | 92 | |||||||||||||||||||||||||
| 10.18 | 1.80 | 39 | 1.85 | * | 2.34 | * | 1.85 | * | 2.34 | * | 1.97 | * | 41 | |||||||||||||||||||||
| $ | 9.71 | (2.90 | )% | $ | 212,229 | 1.52 | %* | 2.41 | %* | 1.40 | %* | 2.29 | %* | (1.30 | )%* | 113 | % | |||||||||||||||||
| 9.70 | (3.00 | ) | 10 | 1.62 | * | 2.40 | * | 1.50 | * | 2.28 | * | (1.34 | )* | 113 | ||||||||||||||||||||
| 9.70 | (3.00 | ) | 111 | 1.87 | * | 3.97 | * | 1.77 | * | 3.87 | * | (1.72 | )* | 113 | ||||||||||||||||||||
Please see footnotes on pages 30 and 31.
| ANNUAL REPORT | JUNE 30, 2012 | 29 |
Table of Contents
Financial Highlights (Cont.)
| Selected Per Share Data for the Year or Period Ended: | Net Asset Value | Net Investment Income (Loss) (a) | Net Realized/ Unrealized Gain (Loss) | Total Income (Loss) from Investment Operations | Dividends from Net Investment Income | Distributions from Net Realized Capital Gains | Total Distributions | |||||||||||||||||||||
PIMCO EqS™ Long/Short Fund (Cont.) | ||||||||||||||||||||||||||||
| Class A | ||||||||||||||||||||||||||||
04/30/2012 - 06/30/2012 | $ | 10.00 | $ | (0.03 | ) | $ | (0.27 | ) | $ | (0.30 | ) | $ | 0.00 | $ | 0.00 | $ | 0.00 | |||||||||||
| Class C | ||||||||||||||||||||||||||||
04/30/2012 - 06/30/2012 | 10.00 | (0.04 | ) | (0.27 | ) | (0.31 | ) | 0.00 | 0.00 | 0.00 | ||||||||||||||||||
PIMCO Emerging Multi-Asset Fund | ||||||||||||||||||||||||||||
| Institutional Class | ||||||||||||||||||||||||||||
06/30/2012 | $ | 9.89 | $ | 0.14 | $ | (1.27 | ) | $ | (1.13 | ) | $ | (0.05 | ) | $ | 0.00 | $ | (0.05 | ) | ||||||||||
04/12/2011 - 06/30/2011 | 10.00 | 0.02 | (0.13 | ) | (0.11 | ) | 0.00 | 0.00 | 0.00 | |||||||||||||||||||
| Class P | ||||||||||||||||||||||||||||
06/30/2012 | 9.90 | 0.15 | (1.31 | ) | (1.16 | ) | (0.05 | ) | 0.00 | (0.05 | ) | |||||||||||||||||
04/12/2011 - 06/30/2011 | 10.00 | 0.02 | (0.12 | ) | (0.10 | ) | 0.00 | 0.00 | 0.00 | |||||||||||||||||||
| Administrative Class | ||||||||||||||||||||||||||||
06/30/2012 | 9.89 | 0.12 | (1.28 | ) | (1.16 | ) | (0.04 | ) | 0.00 | (0.04 | ) | |||||||||||||||||
04/19/2011 - 06/30/2011 | 10.02 | 0.02 | (0.15 | ) | (0.13 | ) | 0.00 | 0.00 | 0.00 | |||||||||||||||||||
| Class D | ||||||||||||||||||||||||||||
06/30/2012 | 9.89 | 0.11 | (1.27 | ) | (1.16 | ) | (0.03 | ) | 0.00 | (0.03 | ) | |||||||||||||||||
04/12/2011 - 06/30/2011 | 10.00 | 0.02 | (0.13 | ) | (0.11 | ) | 0.00 | 0.00 | 0.00 | |||||||||||||||||||
| Class A | ||||||||||||||||||||||||||||
06/30/2012 | 9.88 | 0.12 | (1.28 | ) | (1.16 | ) | (0.04 | ) | 0.00 | (0.04 | ) | |||||||||||||||||
04/12/2011 - 06/30/2011 | 10.00 | 0.02 | (0.14 | ) | (0.12 | ) | 0.00 | 0.00 | 0.00 | |||||||||||||||||||
| Class C | ||||||||||||||||||||||||||||
06/30/2012 | 9.88 | 0.05 | (1.29 | ) | (1.24 | ) | (0.02 | ) | 0.00 | (0.02 | ) | |||||||||||||||||
04/12/2011 - 06/30/2011 | 10.00 | 0.00 | ^ | (0.12 | ) | (0.12 | ) | 0.00 | 0.00 | 0.00 | ||||||||||||||||||
| Class R | ||||||||||||||||||||||||||||
06/30/2012 | 9.88 | 0.09 | (1.27 | ) | (1.18 | ) | (0.02 | ) | 0.00 | (0.02 | ) | |||||||||||||||||
04/12/2011 - 06/30/2011 | 10.00 | 0.01 | (0.13 | ) | (0.12 | ) | 0.00 | 0.00 | 0.00 | |||||||||||||||||||
PIMCO EqS Pathfinder Fund® | ||||||||||||||||||||||||||||
| Institutional Class | ||||||||||||||||||||||||||||
06/30/2012 | $ | 10.65 | $ | 0.18 | $ | (0.62 | ) | $ | (0.44 | ) | $ | (0.07 | ) | $ | (0.03 | ) | $ | (0.10 | ) | |||||||||
06/30/2011 | 9.23 | 0.19 | 1.34 | 1.53 | (0.09 | ) | (0.02 | ) | (0.11 | ) | ||||||||||||||||||
04/14/2010 - 06/30/2010 | 10.00 | 0.07 | (0.84 | ) | (0.77 | ) | 0.00 | 0.00 | 0.00 | |||||||||||||||||||
| Class P | ||||||||||||||||||||||||||||
06/30/2012 | 10.64 | 0.17 | (0.63 | ) | (0.46 | ) | (0.06 | ) | (0.03 | ) | (0.09 | ) | ||||||||||||||||
06/30/2011 | 9.23 | 0.18 | 1.34 | 1.52 | (0.09 | ) | (0.02 | ) | (0.11 | ) | ||||||||||||||||||
04/14/2010 - 06/30/2010 | 10.00 | 0.07 | (0.84 | ) | (0.77 | ) | 0.00 | 0.00 | 0.00 | |||||||||||||||||||
| Class D | ||||||||||||||||||||||||||||
06/30/2012 | 10.61 | 0.13 | (0.61 | ) | (0.48 | ) | (0.05 | ) | (0.03 | ) | (0.08 | ) | ||||||||||||||||
06/30/2011 | 9.21 | 0.16 | 1.34 | 1.50 | (0.08 | ) | (0.02 | ) | (0.10 | ) | ||||||||||||||||||
04/14/2010 - 06/30/2010 | 10.00 | 0.06 | (0.85 | ) | (0.79 | ) | 0.00 | 0.00 | 0.00 | |||||||||||||||||||
| Class A | ||||||||||||||||||||||||||||
06/30/2012 | 10.64 | 0.14 | (0.62 | ) | (0.48 | ) | (0.05 | ) | (0.03 | ) | (0.08 | ) | ||||||||||||||||
06/30/2011 | 9.22 | 0.17 | 1.33 | 1.50 | (0.06 | ) | (0.02 | ) | (0.08 | ) | ||||||||||||||||||
04/14/2010 - 06/30/2010 | 10.00 | 0.07 | (0.85 | ) | (0.78 | ) | 0.00 | 0.00 | 0.00 | |||||||||||||||||||
| Class C | ||||||||||||||||||||||||||||
06/30/2012 | 10.55 | 0.06 | (0.61 | ) | (0.55 | ) | (0.01 | ) | (0.03 | ) | (0.04 | ) | ||||||||||||||||
06/30/2011 | 9.21 | 0.11 | 1.31 | 1.42 | (0.06 | ) | (0.02 | ) | (0.08 | ) | ||||||||||||||||||
04/14/2010 - 06/30/2010 | 10.00 | 0.05 | (0.84 | ) | (0.79 | ) | 0.00 | 0.00 | 0.00 | |||||||||||||||||||
| Class R | ||||||||||||||||||||||||||||
06/30/2012 | 10.59 | 0.07 | (0.59 | ) | (0.52 | ) | (0.04 | ) | (0.03 | ) | (0.07 | ) | ||||||||||||||||
06/30/2011 | 9.21 | 0.12 | 1.35 | 1.47 | (0.07 | ) | (0.02 | ) | (0.09 | ) | ||||||||||||||||||
04/14/2010 - 06/30/2010 | 10.00 | 0.06 | (0.85 | ) | (0.79 | ) | 0.00 | 0.00 | 0.00 | |||||||||||||||||||
| * | Annualized |
| ** | The ratio excludes PIMCO Short-Term Floating NAV Portfolio. |
| 30 | PIMCO EQUITY SERIES | See Accompanying Notes |
Table of Contents
| Net Asset Value End of Year or Period | Total Return | Net Assets End of Year or Period (000s) | Ratio of Expenses to Average Net Assets | Ratio of Expenses to Average Net Assets Excluding Waivers | Ratio of Expenses to Average Net Assets Excluding Interest Expense and Dividends on Securities Sold Short | Ratio of Expenses to Average Net Assets Excluding Interest Expense and Dividends on Securities Sold Short and Waivers | Ratio of Net Investment Income (Loss) to Average Net Assets | Portfolio Turnover Rate** | ||||||||||||||||||||||||||
| $ | 9.70 | (3.00 | )% | $ | 1,219 | 1.87 | %* | 3.17 | %* | 1.74 | %* | 3.04 | %* | (1.70 | )%* | 113 | % | |||||||||||||||||
| 9.69 | (3.10 | ) | 53 | 2.62 | * | 4.50 | * | 2.52 | * | 4.40 | * | (2.46 | )* | 113 | ||||||||||||||||||||
| $ | 8.71 | (11.45 | )% | $ | 29,987 | 0.53 | % | 1.38 | % | 0.53 | % | 1.38 | % | 1.62 | % | 41 | % | |||||||||||||||||
| 9.89 | (1.10 | ) | 9,755 | 0.53 | * | 6.96 | * | 0.53 | * | 6.96 | * | 1.13 | * | 0 | ||||||||||||||||||||
| 8.69 | (11.69 | ) | 2,019 | 0.63 | 1.48 | 0.63 | 1.48 | 1.71 | 41 | |||||||||||||||||||||||||
| 9.90 | (1.00 | ) | 74 | 0.63 | * | 17.34 | * | 0.63 | * | 17.34 | * | 0.96 | * | 0 | ||||||||||||||||||||
| 8.69 | (11.75 | ) | 28 | 0.78 | 1.63 | 0.78 | 1.63 | 1.36 | 41 | |||||||||||||||||||||||||
| 9.89 | (1.30 | ) | 10 | 0.78 | * | 6.47 | * | 0.78 | * | 6.47 | * | 0.88 | * | 0 | ||||||||||||||||||||
| 8.70 | (11.77 | ) | 4,912 | 0.88 | 1.73 | 0.88 | 1.73 | 1.20 | 41 | |||||||||||||||||||||||||
| 9.89 | (1.10 | ) | 2,745 | 0.88 | * | 8.20 | * | 0.88 | * | 8.20 | * | 0.81 | * | 0 | ||||||||||||||||||||
| 8.68 | (11.72 | ) | 10,147 | 0.88 | 1.73 | 0.88 | 1.73 | 1.32 | 41 | |||||||||||||||||||||||||
| 9.88 | (1.20 | ) | 1,801 | 0.88 | * | 9.28 | * | 0.88 | * | 9.28 | * | 0.82 | * | 0 | ||||||||||||||||||||
| 8.62 | (12.51 | ) | 3,868 | 1.63 | 2.48 | 1.63 | 2.48 | 0.57 | 41 | |||||||||||||||||||||||||
| 9.88 | (1.20 | ) | 649 | 1.63 | * | 9.73 | * | 1.63 | * | 9.73 | * | 0.08 | * | 0 | ||||||||||||||||||||
| 8.68 | (11.98 | ) | 9 | 1.13 | 1.98 | 1.13 | 1.98 | 0.99 | 41 | |||||||||||||||||||||||||
| 9.88 | (1.20 | ) | 10 | 1.13 | * | 6.40 | * | 1.13 | * | 6.40 | * | 0.50 | * | 0 | ||||||||||||||||||||
| $ | 10.11 | (4.09 | )% | $ | 1,930,637 | 0.92 | % | 1.09 | % | 0.90 | % | 1.07 | % | 1.80 | % | 32 | % | |||||||||||||||||
| 10.65 | 16.68 | 1,338,509 | 0.92 | 1.10 | 0.89 | 1.07 | 1.87 | 35 | ||||||||||||||||||||||||||
| 9.23 | (7.70 | ) | 542,879 | 0.98 | * | 1.21 | * | 0.89 | * | 1.12 | * | 3.53 | * | 4 | ||||||||||||||||||||
| 10.09 | (4.23 | ) | 67,977 | 1.02 | 1.19 | 1.00 | 1.17 | 1.70 | 32 | |||||||||||||||||||||||||
| 10.64 | 16.55 | 45,785 | 1.02 | 1.20 | 0.99 | 1.17 | 1.72 | 35 | ||||||||||||||||||||||||||
| 9.23 | (7.70 | ) | 970 | 1.08 | * | 1.31 | * | 0.99 | * | 1.22 | * | 3.36 | * | 4 | ||||||||||||||||||||
| 10.05 | (4.52 | ) | 18,469 | 1.27 | 1.45 | 1.26 | 1.42 | 1.33 | 32 | |||||||||||||||||||||||||
| 10.61 | 16.39 | 24,352 | 1.27 | 1.45 | 1.24 | 1.42 | 1.55 | 35 | ||||||||||||||||||||||||||
| 9.21 | (7.90 | ) | 7,084 | 1.33 | * | 1.56 | * | 1.24 | * | 1.47 | * | 3.13 | * | 4 | ||||||||||||||||||||
| 10.08 | (4.50 | ) | 69,910 | 1.27 | 1.43 | 1.26 | 1.42 | 1.37 | 32 | |||||||||||||||||||||||||
| 10.64 | 16.30 | 89,571 | 1.27 | 1.45 | 1.24 | 1.42 | 1.64 | 35 | ||||||||||||||||||||||||||
| 9.22 | (7.80 | ) | 15,436 | 1.33 | * | 1.56 | * | 1.24 | * | 1.47 | * | 3.28 | * | 4 | ||||||||||||||||||||
| 9.96 | (5.15 | ) | 47,006 | 2.02 | 2.21 | 2.00 | 2.17 | 0.65 | 32 | |||||||||||||||||||||||||
| 10.55 | 15.50 | 50,672 | 2.02 | 2.20 | 1.99 | 2.17 | 1.04 | 35 | ||||||||||||||||||||||||||
| 9.21 | (7.90 | ) | 6,668 | 2.08 | * | 2.31 | * | 1.99 | * | 2.22 | * | 2.43 | * | 4 | ||||||||||||||||||||
| 10.00 | (4.86 | ) | 11 | 1.52 | 1.67 | 1.51 | 1.66 | 0.71 | 32 | |||||||||||||||||||||||||
| 10.59 | 16.02 | 102 | 1.52 | 1.70 | 1.49 | 1.67 | 1.21 | 35 | ||||||||||||||||||||||||||
| 9.21 | (7.90 | ) | 9 | 1.58 | * | 1.81 | * | 1.49 | * | 1.72 | * | 2.91 | * | 4 | ||||||||||||||||||||
| ^ | Reflects an amount rounding to less than one cent. |
| (a) | Per share amounts based on average number of shares outstanding during the year or period. |
| ANNUAL REPORT | JUNE 30, 2012 | 31 |
Table of Contents
Statements of Assets and Liabilities
| (Amounts in thousands, except per share amounts) | PIMCO Dividend and Income Builder Fund | PIMCO EqSTM Dividend Fund | PIMCO EqSTM Emerging Markets Fund | PIMCO EqSTM Long/Short Fund | ||||||||||||
Assets: | ||||||||||||||||
Investments, at value | $ | 39,996 | $ | 305,605 | $ | 465,532 | $ | 149,453 | ||||||||
Investments in Affiliates, at value | 1,411 | 14,024 | 52,486 | 61,718 | ||||||||||||
Repurchase agreements, at value | 1,525 | 519 | 524 | 609 | ||||||||||||
Cash | 0 | 1 | 281 | 0 | ||||||||||||
Deposits with counterparty | 33 | 0 | 3,300 | 26,111 | ||||||||||||
Foreign currency, at value | 193 | 1,030 | 764 | 1 | ||||||||||||
Receivable for investments sold | 2 | 0 | 1,938 | 11,114 | ||||||||||||
Receivable for Fund shares sold | 274 | 43 | 13 | 95 | ||||||||||||
Interest and dividends receivable | 327 | 1,691 | 2,999 | 13 | ||||||||||||
Dividends receivable from Affiliates | 0 | 7 | 17 | 16 | ||||||||||||
Unrealized appreciation on foreign currency contracts | 207 | 1,693 | 4,095 | 24 | ||||||||||||
Unrealized appreciation on OTC swap agreements | 0 | 0 | 2,241 | 0 | ||||||||||||
Other assets | 0 | 0 | 0 | 63 | ||||||||||||
| 43,968 | 324,613 | 534,190 | 249,217 | |||||||||||||
Liabilities: | ||||||||||||||||
Payable for investments purchased | $ | 90 | $ | 0 | $ | 481 | $ | 11,096 | ||||||||
Payable for investments in Affiliates purchased | 1 | 7 | 17 | 16 | ||||||||||||
Payable for short sales | 0 | 0 | 0 | 24,215 | ||||||||||||
Deposits from counterparty | 0 | 820 | 3,835 | 0 | ||||||||||||
Payable for Fund shares redeemed | 61 | 17 | 1 | 0 | ||||||||||||
Dividends payable | 71 | 8 | 0 | 0 | ||||||||||||
Written options outstanding | 0 | 0 | 1,610 | 0 | ||||||||||||
Accrued investment advisory fees | 18 | 136 | 340 | 169 | ||||||||||||
Accrued supervisory and administrative fees | 13 | 78 | 191 | 80 | ||||||||||||
Accrued distribution fees | 5 | 1 | 1 | 0 | ||||||||||||
Accrued servicing fees | 4 | 1 | 1 | 0 | ||||||||||||
Variation margin payable on financial derivative instruments | 8 | 0 | 0 | 0 | ||||||||||||
Reimbursement to PIMCO | 0 | 2 | 23 | 2 | ||||||||||||
OTC swap premiums received | 0 | 0 | 25 | 0 | ||||||||||||
Unrealized depreciation on foreign currency contracts | 271 | 2,775 | 7,250 | 0 | ||||||||||||
Unrealized depreciation on OTC swap agreements | 0 | 0 | 918 | 0 | ||||||||||||
Other liabilities | 14 | 118 | 359 | 17 | ||||||||||||
| 556 | 3,963 | 15,052 | 35,595 | |||||||||||||
Net Assets | $ | 43,412 | $ | 320,650 | $ | 519,138 | $ | 213,622 | ||||||||
Net Assets Consist of: | ||||||||||||||||
Paid in capital | $ | 43,449 | $ | 319,032 | $ | 627,079 | $ | 217,276 | ||||||||
Undistributed (overdistributed) net investment income | 88 | (8 | ) | 214 | (326 | ) | ||||||||||
Accumulated undistributed net realized gain (loss) | 303 | 2,492 | (62,047 | ) | (5,651 | ) | ||||||||||
Net unrealized appreciation (depreciation) | (428 | ) | (866 | ) | (46,108 | ) | 2,323 | |||||||||
| $ | 43,412 | $ | 320,650 | $ | 519,138 | $ | 213,622 | |||||||||
| 32 | PIMCO EQUITY SERIES | See Accompanying Notes |
Table of Contents
June 30, 2012
| (Amounts in thousands, except per share amounts) | PIMCO Dividend and Income Builder Fund | PIMCO EqSTM Dividend Fund | PIMCO EqSTM Emerging Markets Fund | PIMCO EqSTM Long/Short Fund | ||||||||||||
Net Assets: | ||||||||||||||||
Institutional Class | $ | 11,170 | $ | 315,513 | $ | 514,884 | $ | 212,229 | ||||||||
Class P | 8,207 | 71 | 63 | 10 | ||||||||||||
Administrative Class | NA | NA | 34 | NA | ||||||||||||
Class D | 2,306 | 1,251 | 989 | 111 | ||||||||||||
Class A | 13,314 | 2,529 | 2,469 | 1,219 | ||||||||||||
Class C | 8,000 | 1,275 | 675 | 53 | ||||||||||||
Class R | 415 | 11 | 24 | NA | ||||||||||||
Shares Issued and Outstanding: | ||||||||||||||||
Institutional Class | 1,067 | 30,135 | 64,590 | 21,871 | ||||||||||||
Class P | 783 | 7 | 8 | 1 | ||||||||||||
Administrative Class | NA | NA | 4 | NA | ||||||||||||
Class D | 220 | 119 | 125 | 11 | ||||||||||||
Class A | 1,272 | 241 | 311 | 126 | ||||||||||||
Class C | 765 | 122 | 86 | 5 | ||||||||||||
Class R | 40 | 1 | 3 | NA | ||||||||||||
Net Asset Value and Redemption Price* Per Share Outstanding: | ||||||||||||||||
Institutional Class | $ | 10.47 | $ | 10.47 | $ | 7.97 | $ | 9.71 | ||||||||
Class P | 10.48 | 10.48 | 7.97 | 9.70 | ||||||||||||
Administrative Class | NA | NA | 7.96 | NA | ||||||||||||
Class D | 10.47 | 10.48 | 7.93 | 9.70 | ||||||||||||
Class A | 10.47 | 10.48 | 7.94 | 9.70 | ||||||||||||
Class C | 10.46 | 10.45 | 7.88 | 9.69 | ||||||||||||
Class R | 10.47 | 10.47 | 7.93 | NA | ||||||||||||
Cost of Investments | $ | 40,341 | $ | 305,402 | $ | 510,536 | $ | 146,654 | ||||||||
Cost of Investments in Affiliates | $ | 1,411 | $ | 14,025 | $ | 52,491 | $ | 61,725 | ||||||||
Cost of Repurchase Agreements | $ | 1,525 | $ | 519 | $ | 524 | $ | 609 | ||||||||
Cost of Foreign Currency Held | $ | 191 | $ | 1,026 | $ | 761 | $ | 1 | ||||||||
Proceeds Received on Short Sales | $ | 0 | $ | 0 | $ | 0 | $ | 23,644 | ||||||||
Premiums Received on Written Options | $ | 0 | $ | 0 | $ | 2,324 | $ | 0 | ||||||||
| * | With respect to the A and C Classes, the redemption price varies by the length of time the shares are held. |
| ANNUAL REPORT | JUNE 30, 2012 | 33 |
Table of Contents
Consolidated Statements of Assets and Liabilities
| (Amounts in thousands, except per share amounts) | PIMCO Emerging Multi-Asset Fund | PIMCO EqS Pathfinder Fund® | ||||||
Assets: | ||||||||
Investments, at value | $ | 4,056 | $ | 1,992,945 | ||||
Investments in Affiliates, at value | 46,805 | 129,357 | ||||||
Repurchase agreements, at value | 227 | 486 | ||||||
Cash | 10 | 58 | ||||||
Deposits with counterparty | 485 | 1,806 | ||||||
Foreign currency, at value | 11 | 1,361 | ||||||
Receivable for investments sold | 0 | 16,516 | ||||||
Receivable for Fund shares sold | 37 | 224 | ||||||
Interest and dividends receivable | 0 | 2,891 | ||||||
Dividends receivable from Affiliates | 84 | 19 | ||||||
Variation margin receivable on financial derivative instruments | 2 | 0 | ||||||
OTC swap premiums paid | 2 | 0 | ||||||
Unrealized appreciation on foreign currency contracts | 22 | 18,407 | ||||||
Unrealized appreciation on OTC swap agreements | 9 | 680 | ||||||
Other assets | 2 | 0 | ||||||
| 51,752 | 2,164,750 | |||||||
Liabilities: | ||||||||
Payable for investments purchased | $ | 0 | $ | 2,587 | ||||
Payable for investments in Affiliates purchased | 84 | 19 | ||||||
Deposits from counterparty | 0 | 8,640 | ||||||
Payable for Fund shares redeemed | 143 | 638 | ||||||
Written options outstanding | 473 | 374 | ||||||
Accrued investment advisory fees | 0 | 1,055 | ||||||
Accrued supervisory and administrative fees | 21 | 552 | ||||||
Accrued distribution fees | 3 | 33 | ||||||
Accrued servicing fees | 3 | 24 | ||||||
Reimbursement to PIMCO | 2 | 74 | ||||||
OTC swap premiums received | 8 | 0 | ||||||
Unrealized depreciation on foreign currency contracts | 45 | 16,355 | ||||||
Unrealized depreciation on OTC swap agreements | 0 | 376 | ||||||
Other liabilities | 0 | 13 | ||||||
| 782 | 30,740 | |||||||
Net Assets | $ | 50,970 | $ | 2,134,010 | ||||
Net Assets Consist of: | ||||||||
Paid in capital | $ | 54,682 | $ | 2,094,667 | ||||
Undistributed net investment income | 192 | 56,899 | ||||||
Accumulated undistributed net realized gain (loss) | (748 | ) | (30,254 | ) | ||||
Net unrealized appreciation (depreciation) | (3,156 | ) | 12,698 | |||||
| $ | 50,970 | $ | 2,134,010 | |||||
| 34 | PIMCO EQUITY SERIES | See Accompanying Notes |
Table of Contents
June 30, 2012
| (Amounts in thousands, except per share amounts) | PIMCO Emerging Multi-Asset Fund | PIMCO EqS Pathfinder Fund® | ||||||
Net Assets: | ||||||||
Institutional Class | $ | 29,987 | $ | 1,930,637 | ||||
Class P | 2,019 | 67,977 | ||||||
Administrative Class | 28 | NA | ||||||
Class D | 4,912 | 18,469 | ||||||
Class A | 10,147 | 69,910 | ||||||
Class C | 3,868 | 47,006 | ||||||
Class R | 9 | 11 | ||||||
Shares Issued and Outstanding: | ||||||||
Institutional Class | 3,443 | 190,995 | ||||||
Class P | 232 | 6,739 | ||||||
Administrative Class | 3 | NA | ||||||
Class D | 565 | 1,837 | ||||||
Class A | 1,169 | 6,934 | ||||||
Class C | 448 | 4,720 | ||||||
Class R | 1 | 1 | ||||||
Net Asset Value and Redemption Price* Per Share Outstanding: | ||||||||
Institutional Class | $ | 8.71 | $ | 10.11 | ||||
Class P | 8.69 | 10.09 | ||||||
Administrative Class | 8.69 | NA | ||||||
Class D | 8.70 | 10.05 | ||||||
Class A | 8.68 | 10.08 | ||||||
Class C | 8.62 | 9.96 | ||||||
Class R | 8.68 | 10.00 | ||||||
Cost of Investments | $ | 4,153 | $ | 1,986,102 | ||||
Cost of Investments in Affiliates | $ | 49,872 | $ | 129,367 | ||||
Cost of Repurchase Agreements | $ | 227 | $ | 486 | ||||
Cost of Foreign Currency Held | $ | 11 | $ | 1,364 | ||||
Premiums Received on Written Options | $ | 459 | $ | 3,968 | ||||
| * | With respect to the A and C Classes, the redemption price varies by the length of time the shares are held. |
| ANNUAL REPORT | JUNE 30, 2012 | 35 |
Table of Contents
| Year or Period Ended June 30, 2012 | ||||||||||||||||
| (Amounts in thousands) | PIMCO Dividend and Income Builder Fund (1) | PIMCO EqS™ Dividend Fund (1) | PIMCO EqS™ Emerging Markets Fund | PIMCO EqS™ Long/Short Fund (2) | ||||||||||||
Investment Income: | ||||||||||||||||
Interest | $ | 171 | $ | 2 | $ | 5 | $ | 19 | ||||||||
Dividends, net of foreign taxes* | 561 | 4,118 | 10,061 | 26 | ||||||||||||
Dividends from Affiliate investments | 1 | 17 | 304 | 25 | ||||||||||||
Total Income | 733 | 4,137 | 10,370 | 70 | ||||||||||||
Expenses: | ||||||||||||||||
Investment advisory fees | 90 | 490 | 4,709 | 318 | ||||||||||||
Supervisory and administrative fees | 46 | 214 | 2,133 | 138 | ||||||||||||
Distribution and/or servicing fees - Class D | 2 | 0 | 2 | 0 | ||||||||||||
Distribution fees - Class C | 12 | 3 | 3 | 0 | ||||||||||||
Servicing fees - Class A | 9 | 2 | 5 | 0 | ||||||||||||
Servicing fees - Class C | 4 | 1 | 1 | 0 | ||||||||||||
Dividends on short sales | 0 | 0 | 40 | 17 | ||||||||||||
Trustees’ fees | 4 | 30 | 52 | 22 | ||||||||||||
Organization expense | 118 | 118 | 0 | 222 | ||||||||||||
Interest expense | 0 | 2 | 28 | 19 | ||||||||||||
Total Expenses | 285 | 860 | 6,973 | 736 | ||||||||||||
Waiver and/or Reimbursement by PIMCO | (142 | ) | (260 | ) | (971 | ) | (270 | ) | ||||||||
Net Expenses | 143 | 600 | 6,002 | 466 | ||||||||||||
Net Investment Income (Loss) | 590 | 3,537 | 4,368 | (396 | ) | |||||||||||
Net Realized and Unrealized Gain (Loss): | ||||||||||||||||
Net realized gain (loss) on investments | 120 | 662 | (41,488 | ) | (5,363 | ) | ||||||||||
Net realized gain on Affiliate investments | 0 | 8 | 32 | 0 | ||||||||||||
Net capital gain distributions received from Underlying Funds | 0 | 0 | 1 | 0 | ||||||||||||
Net realized gain (loss) on futures contracts | 30 | 0 | (601 | ) | 0 | |||||||||||
Net realized gain on written options | 0 | 0 | 885 | 0 | ||||||||||||
Net realized (loss) on swaps | 0 | 0 | (20,193 | ) | 0 | |||||||||||
Net realized gain on short sales | 0 | 0 | 1,150 | 221 | ||||||||||||
Net realized gain (loss) on foreign currency transactions | 254 | 1,856 | (1,954 | ) | 35 | |||||||||||
Net change in unrealized appreciation (depreciation) on investments | (345 | ) | 203 | (30,895 | ) | 2,862 | ||||||||||
Net change in unrealized appreciation (depreciation) on Affiliate investments | 0 | (1 | ) | 1 | (7 | ) | ||||||||||
Net change in unrealized (depreciation) on futures contracts | (21 | ) | 0 | (185 | ) | 0 | ||||||||||
Net change in unrealized appreciation on written options | 0 | 0 | 708 | 0 | ||||||||||||
Net change in unrealized (depreciation) on swaps | 0 | 0 | (1,389 | ) | 0 | |||||||||||
Net change in unrealized (depreciation) on short sales | 0 | 0 | 0 | (556 | ) | |||||||||||
Net change in unrealized appreciation (depreciation) on translation of assets and liabilities denominated in foreign currencies | (62 | ) | (1,068 | ) | (3,934 | ) | 24 | |||||||||
Net Gain (Loss) | (24 | ) | 1,660 | (97,862 | ) | (2,784 | ) | |||||||||
Net Increase (Decrease) in Net Assets Resulting from Operations | $ | 566 | $ | 5,197 | $ | (93,494 | ) | $ | (3,180 | ) | ||||||
* Foreign tax withholdings - Dividends | $ | 49 | $ | 350 | $ | 796 | $ | 0 | ||||||||
| (1) | Period from December 14, 2011 to June 30, 2012. |
| (2) | Period from April 20, 2012 to June 30, 2012. |
| 36 | PIMCO EQUITY SERIES | See Accompanying Notes |
Table of Contents
Consolidated Statements of Operations
| Year or Period Ended June 30, 2012 | ||||||||
| (Amounts in thousands) | PIMCO Emerging Multi-Asset Fund | PIMCO EqS Pathfinder Fund® | ||||||
Investment Income: | ||||||||
Interest | $ | 0 | $ | 19 | ||||
Dividends, net of foreign taxes* | 81 | 54,686 | ||||||
Dividends from Affiliate investments | 737 | 492 | ||||||
Miscellaneous income | 0 | 1 | ||||||
Total Income | 818 | 55,198 | ||||||
Expenses: | ||||||||
Investment advisory fees | 336 | 15,466 | ||||||
Supervisory and administrative fees | 190 | 6,468 | ||||||
Distribution and/or servicing fees - Class D | 2 | 12 | ||||||
Distribution fees - Class C | 15 | 358 | ||||||
Servicing fees - Class A | 15 | 194 | ||||||
Servicing fees - Class C | 5 | 119 | ||||||
Dividends on short sales | 0 | 332 | ||||||
Trustees’ fees | 5 | 215 | ||||||
Organization expense | 3 | 0 | ||||||
Interest expense | 1 | 63 | ||||||
Total Expenses | 572 | 23,227 | ||||||
Waiver and/or Reimbursement by PIMCO | (311 | ) | (3,610 | ) | ||||
Net Expenses | 261 | 19,617 | ||||||
Net Investment Income | 557 | 35,581 | ||||||
Net Realized and Unrealized Gain (Loss): | ||||||||
Net realized (loss) on investments | (779 | ) | (23,536 | ) | ||||
Net realized (loss) on Affiliate investments | (208 | ) | (1 | ) | ||||
Net capital gain distributions received from Underlying Funds | 2 | 1 | ||||||
Net realized (loss) on futures contracts | 0 | (863 | ) | |||||
Net realized gain (loss) on written options | 237 | (2,039 | ) | |||||
Net realized gain on swaps | 26 | 439 | ||||||
Net realized (loss) on short sales | 0 | (2,471 | ) | |||||
Net realized gain (loss) on foreign currency transactions | (214 | ) | 36,614 | |||||
Net change in unrealized (depreciation) on investments | (9 | ) | (91,442 | ) | ||||
Net change in unrealized appreciation (depreciation) on Affiliate investments | (2,951 | ) | 3 | |||||
Net change in unrealized appreciation (depreciation) on written options | (23 | ) | 3,338 | |||||
Net change in unrealized appreciation on swaps | 46 | 300 | ||||||
Net change in unrealized appreciation on short sales | 0 | 1,501 | ||||||
Net change in unrealized appreciation (depreciation) on translation of assets and liabilities denominated in foreign currencies | (23 | ) | 2,096 | |||||
Net (Loss) | (3,896 | ) | (76,060 | ) | ||||
Net (Decrease) in Net Assets Resulting from Operations | $ | (3,339 | ) | $ | (40,479 | ) | ||
* Foreign tax withholdings - Dividends | $ | 0 | $ | 3,153 | ||||
| ANNUAL REPORT | JUNE 30, 2012 | 37 |
Table of Contents
Statements of Changes in Net Assets
PIMCO Dividend and | PIMCO EqS™ Dividend | PIMCO EqS™ Emerging Markets Fund | PIMCO EqS™ Long/Short | |||||||||||||||||
| (Amounts in thousands) | Period from December 14, 2011 to June 30, 2012 | Period from December 14, 2011 to June 30, 2012 | Year Ended June 30, 2012 | Period from March 22, 2011 to June 30, 2011 | Period from April 20, 2012 to June 30, 2012 | |||||||||||||||
Increase in Net Assets from: | ||||||||||||||||||||
Operations: | ||||||||||||||||||||
Net investment income (loss) | $ | 590 | $ | 3,537 | $ | 4,368 | $ | 1,456 | $ | (396 | ) | |||||||||
Net realized gain (loss) | 404 | 2,518 | (62,201 | ) | (3,868 | ) | (5,107 | ) | ||||||||||||
Net realized gain on Affiliate investments | 0 | 8 | 32 | 7 | 0 | |||||||||||||||
Net capital gain distributions received from Underlying Funds | 0 | 0 | 1 | 0 | 0 | |||||||||||||||
Net change in unrealized appreciation (depreciation) | (428 | ) | (865 | ) | (35,695 | ) | (10,408 | ) | 2,330 | |||||||||||
Net change in unrealized appreciation (depreciation) on Affiliate investments | 0 | (1 | ) | 1 | (6 | ) | (7 | ) | ||||||||||||
Net increase (decrease) resulting from operations | 566 | 5,197 | (93,494 | ) | (12,819 | ) | (3,180 | ) | ||||||||||||
Distributions to Shareholders: | ||||||||||||||||||||
From net investment income | ||||||||||||||||||||
Institutional Class | (250 | ) | (3,523 | ) | (1,138 | ) | 0 | 0 | ||||||||||||
Class P | (87 | ) | (1 | ) | 0 | 0 | 0 | |||||||||||||
Class D | (32 | ) | (9 | ) | (14 | ) | 0 | 0 | ||||||||||||
Class A | (160 | ) | (32 | ) | 0 | 0 | 0 | |||||||||||||
Class C | (68 | ) | (13 | ) | 0 | 0 | 0 | |||||||||||||
Class R | (7 | ) | 0 | 0 | 0 | 0 | ||||||||||||||
From net realized capital gains | ||||||||||||||||||||
Institutional Class | 0 | 0 | (468 | ) | 0 | 0 | ||||||||||||||
Class D | 0 | 0 | (7 | ) | 0 | 0 | ||||||||||||||
Class A | 0 | 0 | (1 | ) | 0 | 0 | ||||||||||||||
Total Distributions | (604 | ) | (3,578 | ) | (1,628 | ) | 0 | 0 | ||||||||||||
Fund Share Transactions: | ||||||||||||||||||||
Net increase resulting from Fund share transactions** | 43,450 | 319,031 | 259,133 | 367,946 | 216,802 | |||||||||||||||
Total Increase in Net Assets | 43,412 | 320,650 | 164,011 | 355,127 | 213,622 | |||||||||||||||
Net Assets: | ||||||||||||||||||||
Beginning of year or period | 0 | 0 | 355,127 | 0 | 0 | |||||||||||||||
End of year or period* | $ | 43,412 | $ | 320,650 | $ | 519,138 | $ | 355,127 | $ | 213,622 | ||||||||||
*Including undistributed (overdistributed) net investment income of: | $ | 88 | $ | (8 | ) | $ | 214 | $ | (2,267 | ) | $ | (326 | ) | |||||||
| ** | See Note 14 in the Notes to Financial Statements. |
| 38 | PIMCO EQUITY SERIES | See Accompanying Notes |
Table of Contents
Consolidated Statements of Changes in Net Assets
| PIMCO Emerging Multi-Asset Fund | PIMCO EqS Pathfinder Fund® | |||||||||||||||
| (Amounts in thousands) | Year Ended June 30, 2012 | Period from April 12, 2011 to June 30, 2011 | Year Ended June 30, 2012 | Period from | ||||||||||||
Increase in Net Assets from: | ||||||||||||||||
Operations: | ||||||||||||||||
Net investment income | $ | 557 | $ | 23 | $ | 35,581 | $ | 17,655 | ||||||||
Net realized gain (loss) | (730 | ) | 0 | 8,144 | (27,421 | ) | ||||||||||
Net realized gain (loss) on Affiliate investments | (208 | ) | 0 | (1 | ) | 54 | ||||||||||
Net capital gain distributions received from Underlying Funds | 2 | 0 | 1 | 0 | ||||||||||||
Net change in unrealized appreciation (depreciation) | (9 | ) | (81 | ) | (84,207 | ) | 131,694 | |||||||||
Net change in unrealized appreciation (depreciation) on Affiliate investments | (2,951 | ) | (115 | ) | 3 | (21 | ) | |||||||||
Net increase (decrease) resulting from operations | (3,339 | ) | (173 | ) | (40,479 | ) | 121,961 | |||||||||
Distributions to Shareholders: | ||||||||||||||||
From net investment income | ||||||||||||||||
Institutional Class | (105 | ) | 0 | (13,284 | ) | (6,818 | ) | |||||||||
Class P | (56 | ) | 0 | (693 | ) | (198 | ) | |||||||||
Class D | (8 | ) | 0 | (95 | ) | (156 | ) | |||||||||
Class A | (27 | ) | 0 | (350 | ) | (359 | ) | |||||||||
Class C | (5 | ) | 0 | (67 | ) | (126 | ) | |||||||||
Class R | 0 | 0 | 0 | (1 | ) | |||||||||||
From net realized capital gains | ||||||||||||||||
Institutional Class | 0 | 0 | (5,792 | ) | (1,484 | ) | ||||||||||
Class P | 0 | 0 | (338 | ) | (45 | ) | ||||||||||
Class D | 0 | 0 | (66 | ) | (37 | ) | ||||||||||
Class A | 0 | 0 | (241 | ) | (105 | ) | ||||||||||
Class C | 0 | 0 | (151 | ) | (36 | ) | ||||||||||
Total Distributions | (201 | ) | 0 | (21,077 | ) | (9,365 | ) | |||||||||
Fund Share Transactions: | ||||||||||||||||
Net increase resulting from Fund share transactions** | 39,466 | 15,217 | 646,575 | 863,349 | ||||||||||||
Total Increase in Net Assets | 35,926 | 15,044 | 585,019 | 975,945 | ||||||||||||
Net Assets: | ||||||||||||||||
Beginning of year or period | 15,044 | 0 | 1,548,991 | 573,046 | ||||||||||||
End of year or period* | $ | 50,970 | $ | 15,044 | $ | 2,134,010 | $ | 1,548,991 | ||||||||
*Including undistributed (overdistributed) net investment income of: | $ | 192 | $ | 23 | $ | 56,899 | $ | (1,113 | ) | |||||||
| ** | See Note 14 in the Notes to Financial Statements. |
| ANNUAL REPORT | JUNE 30, 2012 | 39 |
Table of Contents
| Period Ended June 30, 2012 | ||||
| (Amounts in thousands) | PIMCO EqSTM Long/Short Fund (1) | |||
Cash flows used for operating activities: | ||||
Net decrease in net assets resulting from operations | $ | (3,180 | ) | |
Adjustments to reconcile net decrease in net assets from operations to net cash used for operating activities: | ||||
Purchases of long-term securities | (150,794 | ) | ||
Proceeds from sales of long-term securities | 54,124 | |||
Purchases from short-term portfolio investments, net | (117,460 | ) | ||
Increase in deposits with counterparty | (26,111 | ) | ||
Increase in receivable for investments sold | (11,114 | ) | ||
Increase in interest and dividends receivable | (29 | ) | ||
Increase in payable for investments purchased | 11,112 | |||
Increase in accrued investment advisory fees | 169 | |||
Increase in accrued supervisory and administrative fees | 80 | |||
Increase in reimbursement to PIMCO | 2 | |||
Increase in other liabilities | 14 | |||
Proceeds from currency transactions | 35 | |||
Proceeds from short sale transactions | 23,644 | |||
Net change in unrealized appreciation on investments | (2,299 | ) | ||
Net change in unrealized appreciation on translation of assets and liabilities denominated in foreign currencies | (24 | ) | ||
Net realized loss on investments | 5,107 | |||
Net cash used for operating activities | (216,724 | ) | ||
Cash flows received from financing activities: | ||||
Proceeds from shares sold | 216,856 | |||
Payment on shares redeemed | (149 | ) | ||
Dividend payable | 18 | |||
Net cash received from financing activities | 216,725 | |||
Net Increase in Cash | 1 | |||
Cash and Foreign Currency: | ||||
Beginning of period | 0 | |||
End of period | $ | 1 | ||
Supplemental disclosure of cash flow information: | ||||
Interest expense paid during the period | $ | (19 | ) | |
| (1) | Period from April 20, 2012 to June 30, 2012. |
| 40 | PIMCO EQUITY SERIES | See Accompanying Notes |
Table of Contents
Schedule of Investments PIMCO Dividend and Income Builder Fund
June 30, 2012
| PRINCIPAL AMOUNT (000S) | MARKET VALUE (000S) | |||||||||||
| ASSET-BACKED SECURITIES 0.2% | ||||||||||||
| UNITED STATES 0.2% | ||||||||||||
Amortizing Residential Collateral Trust |
| |||||||||||
0.785% due 06/25/2032 | $ | 32 | $ | 27 | ||||||||
Countrywide Asset-Backed Certificates |
| |||||||||||
0.805% due 04/25/2034 | 16 | 13 | ||||||||||
EMC Mortgage Loan Trust |
| |||||||||||
0.795% due 11/25/2041 | 19 | 17 | ||||||||||
Structured Asset Securities Corp. |
| |||||||||||
0.295% due 02/25/2037 | 9 | 9 | ||||||||||
|
| |||||||||||
Total Asset-Backed Securities (Cost $56) | 66 | |||||||||||
|
| |||||||||||
| SHARES | ||||||||||||
| COMMON STOCKS 74.2% | ||||||||||||
| AUSTRALIA 2.2% | ||||||||||||
| INDUSTRIALS 0.8% | ||||||||||||
Ausdrill Ltd. | 94,285 | 334 | ||||||||||
|
| |||||||||||
| MATERIALS 1.4% | ||||||||||||
Kingsgate Consolidated Ltd. | 119,268 | 597 | ||||||||||
|
| |||||||||||
Total Australia | 931 | |||||||||||
|
| |||||||||||
| BRAZIL 1.1% | ||||||||||||
| UTILITIES 1.1% | ||||||||||||
Cia de Saneamento Basico do Estado de Sao Paulo SP - ADR | 6,324 | 480 | ||||||||||
|
| |||||||||||
Total Brazil | 480 | |||||||||||
|
| |||||||||||
| CANADA 5.4% | ||||||||||||
| CONSUMER DISCRETIONARY 2.3% | ||||||||||||
Aimia, Inc. | 73,716 | 981 | ||||||||||
|
| |||||||||||
| ENERGY 3.1% | ||||||||||||
Canadian Oil Sands Ltd. | 48,601 | 941 | ||||||||||
Poseidon Concepts Corp. | 35,109 | 430 | ||||||||||
|
| |||||||||||
| 1,371 | ||||||||||||
|
| |||||||||||
Total Canada | 2,352 | |||||||||||
|
| |||||||||||
| CHINA 3.5% | ||||||||||||
| INDUSTRIALS 3.5% | ||||||||||||
Guangshen Railway Co. Ltd. ‘H’ | 1,066,000 | 322 | ||||||||||
Jiangsu Expressway Co. Ltd. ‘H’ | 656,000 | 616 | ||||||||||
Zhejiang Expressway Co. Ltd. ‘H’ | 880,000 | 582 | ||||||||||
|
| |||||||||||
Total China | 1,520 | |||||||||||
|
| |||||||||||
| CZECH REPUBLIC 1.2% | ||||||||||||
| UTILITIES 1.2% | ||||||||||||
CEZ A/S | 15,131 | 523 | ||||||||||
|
| |||||||||||
Total Czech Republic | 523 | |||||||||||
|
| |||||||||||
| FRANCE 3.8% | ||||||||||||
| ENERGY 1.9% | ||||||||||||
Total S.A. | 18,585 | 836 | ||||||||||
|
| |||||||||||
| SHARES | MARKET VALUE (000S) | |||||||||||
| HEALTH CARE 1.9% | ||||||||||||
Sanofi | 10,948 | $ | 829 | |||||||||
|
| |||||||||||
Total France | 1,665 | |||||||||||
|
| |||||||||||
| HONG KONG 3.8% | ||||||||||||
| CONSUMER DISCRETIONARY 0.7% | ||||||||||||
Tianneng Power International Ltd. | 572,000 | 305 | ||||||||||
|
| |||||||||||
| INDUSTRIALS 1.4% | ||||||||||||
Yuexiu Transport Infrastructure Ltd. | 1,254,000 | 619 | ||||||||||
|
| |||||||||||
| MATERIALS 0.9% | ||||||||||||
Huabao International Holdings Ltd. | 795,000 | 396 | ||||||||||
|
| |||||||||||
| TELECOMMUNICATION SERVICES 0.8% | ||||||||||||
SmarTone Telecommunications Holdings Ltd. | 179,500 | 347 | ||||||||||
|
| |||||||||||
Total Hong Kong | 1,667 | |||||||||||
|
| |||||||||||
| ITALY 0.4% | ||||||||||||
| INDUSTRIALS 0.4% | ||||||||||||
Societa Iniziative Autostradali e Servizi SpA | 23,396 | 165 | ||||||||||
|
| |||||||||||
Total Italy | 165 | |||||||||||
|
| |||||||||||
| MACAU 1.3% | ||||||||||||
| CONSUMER DISCRETIONARY 1.3% | ||||||||||||
Wynn Macau Ltd. | 246,400 | 583 | ||||||||||
|
| |||||||||||
Total Macau | 583 | |||||||||||
|
| |||||||||||
| NETHERLANDS 1.2% | ||||||||||||
| ENERGY 1.2% | ||||||||||||
Royal Dutch Shell PLC ‘A’ | 15,321 | 516 | ||||||||||
|
| |||||||||||
Total Netherlands | 516 | |||||||||||
|
| |||||||||||
| NORWAY 1.5% | ||||||||||||
| INDUSTRIALS 1.5% | ||||||||||||
Orkla ASA | 89,539 | 650 | ||||||||||
|
| |||||||||||
Total Norway | 650 | |||||||||||
|
| |||||||||||
| QATAR 0.9% | ||||||||||||
| UTILITIES 0.9% | ||||||||||||
Qatar Electricity & Water Co. | 10,862 | 399 | ||||||||||
|
| |||||||||||
Total Qatar | 399 | |||||||||||
|
| |||||||||||
| SOUTH AFRICA 4.2% | ||||||||||||
| HEALTH CARE 1.2% | ||||||||||||
Life Healthcare Group Holdings Ltd. | 135,751 | 518 | ||||||||||
|
| |||||||||||
| MATERIALS 1.7% | ||||||||||||
Gold Fields Ltd. | 21,478 | 273 | ||||||||||
Gold Fields Ltd. SP - ADR | 37,857 | �� | 485 | |||||||||
|
| |||||||||||
| 758 | ||||||||||||
|
| |||||||||||
| SHARES | MARKET VALUE (000S) | |||||||||||
| TELECOMMUNICATION SERVICES 1.3% | ||||||||||||
Vodacom Group Ltd. | 49,049 | $ | 558 | |||||||||
|
| |||||||||||
Total South Africa | 1,834 | |||||||||||
|
| |||||||||||
| SPAIN 2.3% | ||||||||||||
| UTILITIES 2.3% | ||||||||||||
Enagas S.A. | 55,567 | 1,014 | ||||||||||
|
| |||||||||||
Total Spain | 1,014 | |||||||||||
|
| |||||||||||
| SWITZERLAND 5.8% | ||||||||||||
| HEALTH CARE 5.8% | ||||||||||||
Novartis AG | 20,093 | 1,124 | ||||||||||
Roche Holding AG | 7,962 | 1,375 | ||||||||||
|
| |||||||||||
Total Switzerland | 2,499 | |||||||||||
|
| |||||||||||
| THAILAND 1.4% | ||||||||||||
| INDUSTRIALS 1.4% | ||||||||||||
Bangkok Expressway PCL | 803,000 | 616 | ||||||||||
|
| |||||||||||
Total Thailand | 616 | |||||||||||
|
| |||||||||||
| UNITED KINGDOM 11.8% | ||||||||||||
| CONSUMER STAPLES 3.0% | ||||||||||||
Reckitt Benckiser Group PLC | 16,425 | 868 | ||||||||||
SABMiller PLC | 10,849 | 435 | ||||||||||
|
| |||||||||||
| 1,303 | ||||||||||||
|
| |||||||||||
| FINANCIALS 2.9% | ||||||||||||
HSBC Holdings PLC | 94,746 | 835 | ||||||||||
IG Group Holdings PLC | 55,520 | 417 | ||||||||||
|
| |||||||||||
| 1,252 | ||||||||||||
|
| |||||||||||
| INDUSTRIALS 4.0% | ||||||||||||
Carillion PLC | 184,540 | 800 | ||||||||||
G4S PLC | 217,193 | 949 | ||||||||||
|
| |||||||||||
| 1,749 | ||||||||||||
|
| |||||||||||
| TELECOMMUNICATION SERVICES 1.9% | ||||||||||||
Vodafone Group PLC | 285,807 | 803 | ||||||||||
|
| |||||||||||
Total United Kingdom | 5,107 | |||||||||||
|
| |||||||||||
| UNITED STATES 22.4% | ||||||||||||
| CONSUMER STAPLES 2.1% | ||||||||||||
Wal-Mart Stores, Inc. | 13,222 | 922 | ||||||||||
|
| |||||||||||
| FINANCIALS 5.7% | ||||||||||||
JPMorgan Chase & Co. | 18,127 | 648 | ||||||||||
Solar Capital Ltd. | 25,712 | 572 | ||||||||||
Solar Senior Capital Ltd. | 16,458 | 278 | ||||||||||
U.S. Bancorp | 30,157 | 970 | ||||||||||
|
| |||||||||||
| 2,468 | ||||||||||||
|
| |||||||||||
| HEALTH CARE 8.2% | ||||||||||||
Baxter International, Inc. | 19,782 | 1,051 | ||||||||||
Medtronic, Inc. | 31,104 | 1,205 | ||||||||||
| See Accompanying Notes | ANNUAL REPORT | JUNE 30, 2012 | 41 |
Table of Contents
Schedule of Investments PIMCO Dividend and Income Builder Fund (Cont.)
| SHARES | MARKET VALUE (000S) | |||||||||||
Pfizer, Inc. | 55,824 | $ | 1,284 | |||||||||
|
| |||||||||||
| 3,540 | ||||||||||||
|
| |||||||||||
| INDUSTRIALS 1.5% | ||||||||||||
Lockheed Martin Corp. | 7,512 | 654 | ||||||||||
|
| |||||||||||
| INFORMATION TECHNOLOGY 3.8% | ||||||||||||
Intel Corp. | 20,429 | 544 | ||||||||||
Microsoft Corp. | 35,980 | 1,101 | ||||||||||
|
| |||||||||||
| 1,645 | ||||||||||||
|
| |||||||||||
| MATERIALS 1.1% | ||||||||||||
E.I. du Pont de Nemours & Co. | 9,389 | 475 | ||||||||||
|
| |||||||||||
Total United States | 9,704 | |||||||||||
|
| |||||||||||
Total Common Stocks (Cost $32,748) | 32,225 | |||||||||||
|
| |||||||||||
| PRINCIPAL AMOUNT (000S) | ||||||||||||
| CORPORATE BONDS & NOTES 16.1% | ||||||||||||
| AUSTRIA 0.2% | ||||||||||||
| INDUSTRIALS 0.2% | ||||||||||||
OGX Austria GmbH | ||||||||||||
8.500% due 06/01/2018 | $ | 100 | 89 | |||||||||
|
| |||||||||||
Total Austria | 89 | |||||||||||
|
| |||||||||||
| BRAZIL 0.5% | ||||||||||||
| INDUSTRIALS 0.5% | ||||||||||||
Braskem Finance Ltd. | ||||||||||||
7.000% due 05/07/2020 | $ | 100 | 110 | |||||||||
Petrobras International Finance Co. |
| |||||||||||
5.375% due 01/27/2021 | 100 | 108 | ||||||||||
|
| |||||||||||
Total Brazil | 218 | |||||||||||
|
| |||||||||||
| CAYMAN ISLANDS 0.9% | ||||||||||||
| BANKING & FINANCE 0.6% | ||||||||||||
IPIC GMTN Ltd. | ||||||||||||
5.000% due 11/15/2020 | $ | 250 | 268 | |||||||||
|
| |||||||||||
| UTILITIES 0.3% | ||||||||||||
Odebrecht Drilling Norbe Ltd. |
| |||||||||||
6.350% due 06/30/2021 | 98 | 103 | ||||||||||
|
| |||||||||||
Total Cayman Islands | 371 | |||||||||||
|
| |||||||||||
| FINLAND 0.3% | ||||||||||||
| INDUSTRIALS 0.3% | ||||||||||||
Nokia OYJ | ||||||||||||
6.750% due 02/04/2019 | EUR | 100 | 110 | |||||||||
|
| |||||||||||
Total Finland | 110 | |||||||||||
|
| |||||||||||
| FRANCE 0.6% | ||||||||||||
| BANKING & FINANCE 0.6% | ||||||||||||
Banque PSA Finance S.A. | ||||||||||||
2.361% due 04/04/2014 | $ | 50 | 48 | |||||||||
Caisse Centrale du Credit Immobilier de France S.A. |
| |||||||||||
3.593% due 08/09/2013 | EUR | 100 | 123 | |||||||||
| PRINCIPAL AMOUNT (000S) | MARKET VALUE (000S) | |||||||||||
RCI Banque S.A. | ||||||||||||
4.600% due 04/12/2016 | $ | 100 | $ | 100 | ||||||||
|
| |||||||||||
Total France | 271 | |||||||||||
|
| |||||||||||
| GERMANY 0.3% | ||||||||||||
| INDUSTRIALS 0.3% | ||||||||||||
Kinove German Bondco GmbH | ||||||||||||
10.000% due 06/15/2018 | EUR | 100 | 129 | |||||||||
|
| |||||||||||
Total Germany | 129 | |||||||||||
|
| |||||||||||
| IRELAND 1.0% | ||||||||||||
| INDUSTRIALS 0.3% | ||||||||||||
RZD Capital Ltd. |
| |||||||||||
5.739% due 04/03/2017 | $ | 100 | 107 | |||||||||
|
| |||||||||||
| UTILITIES 0.7% | ||||||||||||
Novatek OAO via Novatek Finance Ltd. |
| |||||||||||
5.326% due 02/03/2016 | 300 | 314 | ||||||||||
|
| |||||||||||
Total Ireland | 421 | |||||||||||
|
| |||||||||||
| JAPAN 0.3% | ||||||||||||
| UTILITIES 0.3% | ||||||||||||
Tokyo Electric Power Co., Inc. |
| |||||||||||
4.500% due 03/24/2014 | EUR | 100 | 126 | |||||||||
|
| |||||||||||
Total Japan | 126 | |||||||||||
|
| |||||||||||
| LUXEMBOURG 1.6% | ||||||||||||
| BANKING & FINANCE 0.3% | ||||||||||||
Fiat Finance & Trade S.A. |
| |||||||||||
7.625% due 09/15/2014 | EUR | 100 | 131 | |||||||||
|
| |||||||||||
| INDUSTRIALS 1.0% | ||||||||||||
ArcelorMittal |
| |||||||||||
7.000% due 10/15/2039 | $ | 100 | 98 | |||||||||
INEOS Group Holdings S.A. |
| |||||||||||
8.500% due 02/15/2016 | 100 | 92 | ||||||||||
OXEA Finance & Cy S.C.A. |
| |||||||||||
9.625% due 07/15/2017 | EUR | 90 | 122 | |||||||||
Telenet Finance Luxembourg S.C.A. |
| |||||||||||
6.375% due 11/15/2020 | 100 | 126 | ||||||||||
|
| |||||||||||
| 438 | ||||||||||||
|
| |||||||||||
| UTILITIES 0.3% | ||||||||||||
Gazprom OAO Via Gaz Capital S.A. |
| |||||||||||
6.510% due 03/07/2022 | $ | 100 | 112 | |||||||||
|
| |||||||||||
Total Luxembourg | 681 | |||||||||||
|
| |||||||||||
| MEXICO 0.4% | ||||||||||||
| INDUSTRIALS 0.2% | ||||||||||||
America Movil S.A.B. de C.V. |
| |||||||||||
8.460% due 12/18/2036 | MXN | 1,000 | 79 | |||||||||
|
| |||||||||||
| UTILITIES 0.2% | ||||||||||||
Petroleos Mexicanos |
| |||||||||||
6.500% due 06/02/2041 | $ | 100 | 117 | |||||||||
|
| |||||||||||
Total Mexico | 196 | |||||||||||
|
| |||||||||||
| PRINCIPAL AMOUNT (000S) | MARKET VALUE (000S) | |||||||||||
| NETHERLANDS 0.5% | ||||||||||||
| INDUSTRIALS 0.5% | ||||||||||||
Schaeffler Finance BV |
| |||||||||||
7.750% due 02/15/2017 | $ | 100 | $ | 105 | ||||||||
UPC Holding BV |
| |||||||||||
9.875% due 04/15/2018 | 100 | 110 | ||||||||||
|
| |||||||||||
Total Netherlands | 215 | |||||||||||
|
| |||||||||||
| NORWAY 0.3% | ||||||||||||
| BANKING & FINANCE 0.3% | ||||||||||||
Eksportfinans ASA |
| |||||||||||
1.600% due 03/20/2014 | JPY | 10,000 | 119 | |||||||||
|
| |||||||||||
Total Norway | 119 | |||||||||||
|
| |||||||||||
| QATAR 0.9% | ||||||||||||
| INDUSTRIALS 0.2% | ||||||||||||
Nakilat, Inc. |
| |||||||||||
6.067% due 12/31/2033 | $ | 100 | 112 | |||||||||
|
| |||||||||||
| UTILITIES 0.7% | ||||||||||||
Ras Laffan Liquefied Natural Gas Co. Ltd. |
| |||||||||||
6.332% due 09/30/2027 | 250 | 287 | ||||||||||
|
| |||||||||||
Total Qatar | 399 | |||||||||||
|
| |||||||||||
| SOUTH KOREA 0.2% | ||||||||||||
| BANKING & FINANCE 0.2% | ||||||||||||
Export-Import Bank of Korea |
| |||||||||||
4.125% due 09/09/2015 | $ | 100 | 107 | |||||||||
|
| |||||||||||
Total South Korea | 107 | |||||||||||
|
| |||||||||||
| UNITED ARAB EMIRATES 0.2% | ||||||||||||
| INDUSTRIALS 0.2% | ||||||||||||
Dolphin Energy Ltd. |
| |||||||||||
5.888% due 06/15/2019 | $ | 80 | 88 | |||||||||
|
| |||||||||||
Total United Arab Emirates | 88 | |||||||||||
|
| |||||||||||
| UNITED KINGDOM 1.7% | ||||||||||||
| BANKING & FINANCE 1.7% | ||||||||||||
Abbey National Treasury Services PLC |
| |||||||||||
2.046% due 04/25/2014 | $ | 100 | 96 | |||||||||
FCE Bank PLC |
| |||||||||||
5.125% due 11/16/2015 | GBP | 100 | 165 | |||||||||
LBG Capital PLC |
| |||||||||||
15.000% due 12/21/2019 | 100 | 189 | ||||||||||
Royal Bank of Scotland Group PLC |
| |||||||||||
6.934% due 04/09/2018 | EUR | 100 | 117 | |||||||||
Virgin Media Secured Finance PLC |
| |||||||||||
7.000% due 01/15/2018 | GBP | 100 | 169 | |||||||||
|
| |||||||||||
Total United Kingdom | 736 | |||||||||||
|
| |||||||||||
| UNITED STATES 5.5% | ||||||||||||
| BANKING & FINANCE 1.7% | ||||||||||||
Ally Financial, Inc. |
| |||||||||||
6.750% due 12/01/2014 | $ | 100 | 106 | |||||||||
Bank of America Corp. |
| |||||||||||
6.000% due 09/01/2017 | 100 | 108 | ||||||||||
Cantor Fitzgerald LP |
| |||||||||||
7.875% due 10/15/2019 | 100 | 100 | ||||||||||
Goldman Sachs Group, Inc. |
| |||||||||||
5.250% due 07/27/2021 | 100 | 102 | ||||||||||
| 42 | PIMCO EQUITY SERIES | See Accompanying Notes |
Table of Contents
June 30, 2012
| PRINCIPAL AMOUNT (000S) | MARKET VALUE (000S) | |||||||||||
International Lease Finance Corp. |
| |||||||||||
6.500% due 09/01/2014 | $ | 100 | $ | 106 | ||||||||
Morgan Stanley |
| |||||||||||
7.300% due 05/13/2019 | 100 | 108 | ||||||||||
SLM Corp. |
| |||||||||||
0.992% due 06/17/2013 | EUR | 100 | 123 | |||||||||
|
| |||||||||||
| 753 | ||||||||||||
|
| |||||||||||
| INDUSTRIALS 3.3% | ||||||||||||
Altria Group, Inc. |
| |||||||||||
10.200% due 02/06/2039 | $ | 100 | 163 | |||||||||
Brocade Communications Systems, Inc. |
| |||||||||||
6.625% due 01/15/2018 | 100 | 105 | ||||||||||
CONSOL Energy, Inc. |
| |||||||||||
8.000% due 04/01/2017 | 100 | 104 | ||||||||||
Crown Castle Towers LLC |
| |||||||||||
6.113% due 01/15/2040 | 100 | 116 | ||||||||||
CVS Pass-Through Trust |
| |||||||||||
8.353% due 07/10/2031 | 95 | 124 | ||||||||||
HCA, Inc. |
| |||||||||||
6.500% due 02/15/2020 | 100 | 109 | ||||||||||
HD Supply, Inc. |
| |||||||||||
8.125% due 04/15/2019 | 100 | 108 | ||||||||||
Hexion U.S. Finance Corp. |
| |||||||||||
8.875% due 02/01/2018 | 100 | 103 | ||||||||||
Reynolds Group Issuer, Inc. |
| |||||||||||
9.875% due 08/15/2019 | 100 | 104 | ||||||||||
Rockies Express Pipeline LLC |
| |||||||||||
5.625% due 04/15/2020 | 100 | 92 | ||||||||||
Tyson Foods, Inc. |
| |||||||||||
4.500% due 06/15/2022 | 100 | 104 | ||||||||||
U.S. Airways Pass-Through Trust |
| |||||||||||
5.900% due 04/01/2026 | 100 | 102 | ||||||||||
Warner Chilcott Co. LLC |
| |||||||||||
7.750% due 09/15/2018 | 100 | 108 | ||||||||||
|
| |||||||||||
| 1,442 | ||||||||||||
|
| |||||||||||
| UTILITIES 0.5% | ||||||||||||
NGPL PipeCo LLC |
| |||||||||||
9.625% due 06/01/2019 | 100 | 107 | ||||||||||
NRG Energy, Inc. |
| |||||||||||
7.875% due 05/15/2021 | 100 | 102 | ||||||||||
|
| |||||||||||
| 209 | ||||||||||||
|
| |||||||||||
Total United States | 2,404 | |||||||||||
|
| |||||||||||
| VIRGIN ISLANDS (BRITISH) 0.7% | ||||||||||||
| INDUSTRIALS 0.4% | ||||||||||||
Gold Fields Orogen Holding BVI Ltd. |
| |||||||||||
4.875% due 10/07/2020 | $ | 200 | 191 | |||||||||
|
| |||||||||||
| PRINCIPAL AMOUNT (000S) | MARKET VALUE (000S) | |||||||||||
| UTILITIES 0.3% | ||||||||||||
TNK-BP Finance S.A. |
| |||||||||||
7.875% due 03/13/2018 | $ | 100 | $ | 115 | ||||||||
|
| |||||||||||
Total Virgin Islands (British) | 306 | |||||||||||
|
| |||||||||||
Total Corporate Bonds & Notes | 6,986 | |||||||||||
|
| |||||||||||
| MORTGAGE-BACKED SECURITIES 0.4% | ||||||||||||
| UNITED STATES 0.4% | ||||||||||||
Banc of America Funding Corp. |
| |||||||||||
5.532% due 05/20/2036 | $ | 87 | 80 | |||||||||
Banc of America Mortgage Securities, Inc. |
| |||||||||||
5.631% due 11/20/2046 | 50 | 40 | ||||||||||
Countrywide Home Loan Mortgage Pass-Through Trust |
| |||||||||||
0.745% due 07/25/2037 ^ | 108 | 59 | ||||||||||
Credit Suisse Mortgage Capital Certificates |
| |||||||||||
5.000% due 03/25/2037 | 10 | 9 | ||||||||||
Harborview Mortgage Loan Trust |
| |||||||||||
0.584% due 06/20/2035 | 7 | 5 | ||||||||||
|
| |||||||||||
Total Mortgage-Backed Securities | 193 | |||||||||||
|
| |||||||||||
| MUNICIPAL BONDS & NOTES 0.3% | ||||||||||||
| MICHIGAN 0.2% | ||||||||||||
Michigan Tobacco Settlement Finance Authority Revenue Bonds, Series 2006 |
| |||||||||||
7.309% due 06/01/2034 | $ | 100 | 74 | |||||||||
|
| |||||||||||
Total Michigan | 74 | |||||||||||
|
| |||||||||||
| VIRGINIA 0.1% | ||||||||||||
Tobacco Settlement Financing Corp., Virginia Revenue Bonds, Series 2007 |
| |||||||||||
6.706% due 06/01/2046 | 100 | 64 | ||||||||||
|
| |||||||||||
Total Virginia | 64 | |||||||||||
|
| |||||||||||
Total Municipal Bonds & Notes | 138 | |||||||||||
|
| |||||||||||
| SOVEREIGN ISSUES 0.9% | ||||||||||||
| CANADA 0.5% | ||||||||||||
Province of Ontario |
| |||||||||||
3.150% due 06/02/2022 | CAD | 100 | 102 | |||||||||
Province of Quebec |
| |||||||||||
4.500% due 12/01/2018 | 100 | 111 | ||||||||||
|
| |||||||||||
Total Canada | 213 | |||||||||||
|
| |||||||||||
| PRINCIPAL AMOUNT (000S) | MARKET VALUE (000S) | |||||||||||
| MEXICO 0.2% | ||||||||||||
Mexico Government International Bond |
| |||||||||||
6.000% due 06/18/2015 | MXN | 1,000 | $ | 78 | ||||||||
|
| |||||||||||
Total Mexico | 78 | |||||||||||
|
| |||||||||||
| SOUTH AFRICA 0.2% | ||||||||||||
South Africa Government International Bond |
| |||||||||||
8.000% due 12/21/2018 | ZAR | 750 | 97 | |||||||||
|
| |||||||||||
Total South Africa | 97 | |||||||||||
|
| |||||||||||
Total Sovereign Issues (Cost $391) | 388 | |||||||||||
|
| |||||||||||
| SHORT-TERM INSTRUMENTS 6.8% | ||||||||||||
| REPURCHASE AGREEMENTS 3.5% | ||||||||||||
Credit Suisse Securities (USA) LLC |
| |||||||||||
0.180% due 07/02/2012 | $ | 900 | 900 | |||||||||
(Dated 06/29/2012. Collateralized by U.S. Treasury Notes 2.375% due 10/31/2014 valued at $922. Repurchase proceeds are $900.) |
| |||||||||||
State Street Bank and Trust Co. |
| |||||||||||
0.010% due 07/02/2012 | 625 | 625 | ||||||||||
(Dated 06/29/2012. Collateralized by U.S. Treasury Notes 2.000% due 11/15/2021 valued at $639. Repurchase proceeds are $625.) |
| |||||||||||
|
| |||||||||||
| 1,525 | ||||||||||||
|
| |||||||||||
| SHARES | ||||||||||||
| PIMCO SHORT-TERM FLOATING NAV PORTFOLIO (a) 3.3% | ||||||||||||
PIMCO Short-Term Floating NAV Portfolio | 140,862 | 1,411 | ||||||||||
|
| |||||||||||
Total Short-Term Instruments |
| 2,936 | ||||||||||
|
| |||||||||||
| Total Investments 98.9% (Cost $43,277) | $ | 42,932 | ||||||||||
| Other Assets and Liabilities (Net) 1.1% | 480 | |||||||||||
|
| |||||||||||
| Net Assets 100.0% | $ | 43,412 | ||||||||||
|
| |||||||||||
Notes to Schedule of Investments (amounts in thousands*, except number of contracts):
| * | A zero balance may reflect actual amounts rounding to less than one thousand. |
| ^ | Security is in default. |
| (a) | Affiliated to the Fund. |
| (b) | Cash of $33 has been pledged as collateral for the following open futures contracts on June 30, 2012: |
| Description | Type | Expiration Month | # of Contracts | Unrealized (Depreciation) | ||||||||||
Japanese yen currency September Futures | Long | 09/2012 | 9 | $ | (21 | ) | ||||||||
|
| |||||||||||||
| See Accompanying Notes | ANNUAL REPORT | JUNE 30, 2012 | 43 |
Table of Contents
Schedule of Investments PIMCO Dividend and Income Builder Fund (Cont.)
| (c) | Foreign currency contracts outstanding on June 30, 2012: |
| Settlement Month | Currency to be Delivered | Currency to be Received | Counterparty | Unrealized Appreciation | Unrealized (Depreciation) | Net Unrealized Appreciation/ (Depreciation) | ||||||||||||||||||||
07/2012 | AUD | 398 | $ | 393 | CBK | $ | 0 | $ | (14 | ) | $ | (14 | ) | |||||||||||||
07/2012 | 481 | 467 | JPM | 0 | (25 | ) | (25 | ) | ||||||||||||||||||
07/2012 | CHF | 80 | 84 | DUB | 0 | (1 | ) | (1 | ) | |||||||||||||||||
07/2012 | EUR | 186 | 233 | CBK | 0 | (2 | ) | (2 | ) | |||||||||||||||||
07/2012 | 1,599 | 2,000 | UAG | 0 | (24 | ) | (24 | ) | ||||||||||||||||||
07/2012 | GBP | 211 | 326 | BRC | 0 | (4 | ) | (4 | ) | |||||||||||||||||
07/2012 | 1,873 | 2,896 | UAG | 0 | (38 | ) | (38 | ) | ||||||||||||||||||
07/2012 | NOK | 322 | 53 | BOA | 0 | (1 | ) | (1 | ) | |||||||||||||||||
07/2012 | 371 | 61 | BRC | 0 | (1 | ) | (1 | ) | ||||||||||||||||||
07/2012 | 1,579 | 263 | DUB | 0 | (3 | ) | (3 | ) | ||||||||||||||||||
07/2012 | 323 | 53 | FBF | 0 | (1 | ) | (1 | ) | ||||||||||||||||||
07/2012 | 323 | 53 | UAG | 0 | (1 | ) | (1 | ) | ||||||||||||||||||
07/2012 | $ | 880 | AUD | 879 | BRC | 20 | 0 | 20 | ||||||||||||||||||
07/2012 | 83 | CHF | 80 | BRC | 2 | 0 | 2 | |||||||||||||||||||
07/2012 | 2,218 | EUR | 1,785 | BRC | 41 | 0 | 41 | |||||||||||||||||||
07/2012 | 3,230 | GBP | 2,084 | BRC | 34 | 0 | 34 | |||||||||||||||||||
07/2012 | 481 | NOK | 2,918 | BRC | 9 | 0 | 9 | |||||||||||||||||||
07/2012 | 208 | ZAR | 1,668 | BRC | 0 | (4 | ) | (4 | ) | |||||||||||||||||
07/2012 | ZAR | 3,792 | $ | 459 | BRC | 4 | (8 | ) | (4 | ) | ||||||||||||||||
07/2012 | 1,544 | 197 | CBK | 9 | 0 | 9 | ||||||||||||||||||||
07/2012 | 4,934 | 619 | DUB | 21 | (3 | ) | 18 | |||||||||||||||||||
07/2012 | 792 | 101 | HUS | 5 | 0 | 5 | ||||||||||||||||||||
07/2012 | 5,741 | 666 | JPM | 0 | (34 | ) | (34 | ) | ||||||||||||||||||
08/2012 | AUD | 879 | 878 | BRC | 0 | (19 | ) | (19 | ) | |||||||||||||||||
08/2012 | BRL | 486 | 249 | BRC | 8 | 0 | 8 | |||||||||||||||||||
08/2012 | 61 | 30 | HUS | 0 | 0 | 0 | ||||||||||||||||||||
08/2012 | 372 | 188 | MSC | 4 | 0 | 4 | ||||||||||||||||||||
08/2012 | CHF | 80 | 83 | BRC | 0 | (2 | ) | (2 | ) | |||||||||||||||||
08/2012 | 189 | 198 | CBK | 0 | (2 | ) | (2 | ) | ||||||||||||||||||
08/2012 | 883 | 940 | HUS | 8 | 0 | 8 | ||||||||||||||||||||
08/2012 | CZK | 3,267 | 163 | JPM | 1 | 0 | 1 | |||||||||||||||||||
08/2012 | 7,506 | 399 | UAG | 26 | 0 | 26 | ||||||||||||||||||||
08/2012 | EUR | 1,785 | 2,219 | BRC | 0 | (41 | ) | (41 | ) | |||||||||||||||||
08/2012 | GBP | 2,084 | 3,230 | BRC | 0 | (34 | ) | (34 | ) | |||||||||||||||||
08/2012 | 81 | 127 | FBF | 0 | 0 | 0 | ||||||||||||||||||||
08/2012 | NOK | 2,918 | 481 | BRC | 0 | (9 | ) | (9 | ) | |||||||||||||||||
08/2012 | THB | 14,938 | 483 | HUS | 14 | 0 | 14 | |||||||||||||||||||
08/2012 | 3,009 | 96 | JPM | 1 | 0 | 1 | ||||||||||||||||||||
|
|
|
|
|
| |||||||||||||||||||||
| $ | 207 | $ | (271 | ) | $ | (64 | ) | |||||||||||||||||||
|
|
|
|
|
| |||||||||||||||||||||
| (d) | Fair Value Measurements (1) |
The following is a summary of the fair valuations according to the inputs used as of June 30, 2012 in valuing the Fund’s assets and liabilities (2):
| Category and Subcategory (3) | Level 1 (4) | Level 2 (5) | Level 3 (6) | Fair Value at 06/30/2012 | ||||||||||||
Investments, at value | ||||||||||||||||
Asset-Backed Securities | ||||||||||||||||
United States | $ | 0 | $ | 66 | $ | 0 | $ | 66 | ||||||||
Common Stocks | ||||||||||||||||
Australia | ||||||||||||||||
Industrials | 0 | 334 | 0 | 334 | ||||||||||||
Materials | 0 | 597 | 0 | 597 | ||||||||||||
Brazil | ||||||||||||||||
Utilities | 480 | 0 | 0 | 480 | ||||||||||||
Canada | ||||||||||||||||
Consumer Discretionary | 981 | 0 | 0 | 981 | ||||||||||||
Energy | 1,371 | 0 | 0 | 1,371 | ||||||||||||
China | ||||||||||||||||
Industrials | 0 | 1,520 | 0 | 1,520 | ||||||||||||
Czech Republic | ||||||||||||||||
Utilities | 523 | 0 | 0 | 523 | ||||||||||||
| Category and Subcategory (3) | Level 1 (4) | Level 2 (5) | Level 3 (6) | Fair Value at 06/30/2012 | ||||||||||||
France | ||||||||||||||||
Energy | $ | 0 | $ | 836 | $ | 0 | $ | 836 | ||||||||
Health Care | 0 | 829 | 0 | 829 | ||||||||||||
Hong Kong | ||||||||||||||||
Consumer Discretionary | 0 | 305 | 0 | 305 | ||||||||||||
Industrials | 0 | 619 | 0 | 619 | ||||||||||||
Materials | 0 | 396 | 0 | 396 | ||||||||||||
Telecommunication Services | 0 | 347 | 0 | 347 | ||||||||||||
Italy | ||||||||||||||||
Industrials | 0 | 165 | 0 | 165 | ||||||||||||
Macau | ||||||||||||||||
Consumer Discretionary | 0 | 583 | 0 | 583 | ||||||||||||
Netherlands | ||||||||||||||||
Energy | 0 | 516 | 0 | 516 | ||||||||||||
Norway | ||||||||||||||||
Industrials | 0 | 650 | 0 | 650 | ||||||||||||
| 44 | PIMCO EQUITY SERIES | See Accompanying Notes |
Table of Contents
June 30, 2012
| Category and Subcategory (3) | Level 1 (4) | Level 2 (5) | Level 3 (6) | Fair Value at 06/30/2012 | ||||||||||||
Qatar | ||||||||||||||||
Utilities | $ | 0 | $ | 399 | $ | 0 | $ | 399 | ||||||||
South Africa | ||||||||||||||||
Health Care | 0 | 518 | 0 | 518 | ||||||||||||
Materials | 485 | 273 | 0 | 758 | ||||||||||||
Telecommunication Services | 0 | 558 | 0 | 558 | ||||||||||||
Spain | ||||||||||||||||
Utilities | 0 | 1,014 | 0 | 1,014 | ||||||||||||
Switzerland | ||||||||||||||||
Health Care | 0 | 2,499 | 0 | 2,499 | ||||||||||||
Thailand | ||||||||||||||||
Industrials | 0 | 616 | 0 | 616 | ||||||||||||
United Kingdom | ||||||||||||||||
Consumer Staples | 0 | 1,303 | 0 | 1,303 | ||||||||||||
Financials | 0 | 1,252 | 0 | 1,252 | ||||||||||||
Industrials | 0 | 1,749 | 0 | 1,749 | ||||||||||||
Telecommunication Services | 0 | 803 | 0 | 803 | ||||||||||||
United States | ||||||||||||||||
Consumer Staples | 922 | 0 | 0 | 922 | ||||||||||||
Financials | 2,468 | 0 | 0 | 2,468 | ||||||||||||
Health Care | 3,540 | 0 | 0 | 3,540 | ||||||||||||
Industrials | 654 | 0 | 0 | 654 | ||||||||||||
Information Technology | 1,645 | 0 | 0 | 1,645 | ||||||||||||
Materials | 475 | 0 | 0 | 475 | ||||||||||||
Corporate Bonds & Notes | ||||||||||||||||
Austria | ||||||||||||||||
Industrials | 0 | 89 | 0 | 89 | ||||||||||||
Brazil | ||||||||||||||||
Industrials | 0 | 218 | 0 | 218 | ||||||||||||
Cayman Islands | ||||||||||||||||
Banking & Finance | 0 | 268 | 0 | 268 | ||||||||||||
Utilities | 0 | 103 | 0 | 103 | ||||||||||||
Finland | ||||||||||||||||
Industrials | 0 | 110 | 0 | 110 | ||||||||||||
France | ||||||||||||||||
Banking & Finance | 0 | 271 | 0 | 271 | ||||||||||||
Germany | ||||||||||||||||
Industrials | 0 | 129 | 0 | 129 | ||||||||||||
Ireland | ||||||||||||||||
Industrials | 0 | 107 | 0 | 107 | ||||||||||||
Utilities | 0 | 314 | 0 | 314 | ||||||||||||
Japan | ||||||||||||||||
Utilities | 0 | 126 | 0 | 126 | ||||||||||||
Luxembourg | ||||||||||||||||
Banking & Finance | 0 | 131 | 0 | 131 | ||||||||||||
Industrials | 0 | 438 | 0 | 438 | ||||||||||||
Utilities | 0 | 112 | 0 | 112 | ||||||||||||
| Category and Subcategory (3) | Level 1 (4) | Level 2 (5) | Level 3 (6) | Fair Value at 06/30/2012 | ||||||||||||
Mexico | ||||||||||||||||
Industrials | $ | 0 | $ | 79 | $ | 0 | $ | 79 | ||||||||
Utilities | 0 | 117 | 0 | 117 | ||||||||||||
Netherlands | ||||||||||||||||
Industrials | 0 | 215 | 0 | 215 | ||||||||||||
Norway | ||||||||||||||||
Banking & Finance | 0 | 119 | 0 | 119 | ||||||||||||
Qatar | ||||||||||||||||
Industrials | 0 | 112 | 0 | 112 | ||||||||||||
Utilities | 0 | 287 | 0 | 287 | ||||||||||||
South Korea | ||||||||||||||||
Banking & Finance | 0 | 107 | 0 | 107 | ||||||||||||
United Arab Emirates | ||||||||||||||||
Industrials | 0 | 88 | 0 | 88 | ||||||||||||
United Kingdom | ||||||||||||||||
Banking & Finance | 0 | 736 | 0 | 736 | ||||||||||||
United States | ||||||||||||||||
Banking & Finance | 0 | 753 | 0 | 753 | ||||||||||||
Industrials | 0 | 1,340 | 102 | 1,442 | ||||||||||||
Utilities | 0 | 209 | 0 | 209 | ||||||||||||
Virgin Islands (British) | ||||||||||||||||
Industrials | �� | 0 | 191 | 0 | 191 | |||||||||||
Utilities | 0 | 115 | 0 | 115 | ||||||||||||
Mortgage-Backed Securities | ||||||||||||||||
United States | 0 | 193 | 0 | 193 | ||||||||||||
Municipal Bonds & Notes | ||||||||||||||||
Michigan | 0 | 74 | 0 | 74 | ||||||||||||
Virginia | 0 | 64 | 0 | 64 | ||||||||||||
Sovereign Issues | ||||||||||||||||
Canada | 0 | 213 | 0 | 213 | ||||||||||||
Mexico | 0 | 78 | 0 | 78 | ||||||||||||
South Africa | 0 | 97 | 0 | 97 | ||||||||||||
Short-Term Instruments | ||||||||||||||||
Repurchase Agreements | 0 | 1,525 | 0 | 1,525 | ||||||||||||
PIMCO Short-Term Floating NAV Portfolio | 1,411 | 0 | 0 | 1,411 | ||||||||||||
| $ | 14,955 | $ | 27,875 | $ | 102 | $ | 42,932 | |||||||||
Financial Derivative Instruments (7) - Assets |
| |||||||||||||||
Foreign Exchange Contracts | $ | 0 | $ | 207 | $ | 0 | $ | 207 | ||||||||
Financial Derivative Instruments (7) - Liabilities |
| |||||||||||||||
Foreign Exchange Contracts | $ | (21 | ) $ | (271 | ) | $ | 0 | $ | (292 | ) | ||||||
Totals | $ | 14,934 | $ | 27,811 | $ | 102 | $ | 42,847 | ||||||||
The following is a reconciliation of the fair valuations using significant unobservable inputs (Level 3) for the Fund during the period ended June 30, 2012:
| Category and Subcategory (3) | Beginning Balance at 12/14/2011 | Net Purchases | Net Sales | Accrued Discounts/ (Premiums) | Realized Gain/(Loss) | Net Change in Unrealized Appreciation/ (Depreciation) (8) | Transfers into Level 3 | Transfers out of Level 3 | Ending Balance at 06/30/2012 | Net Change in Unrealized Appreciation/ (Depreciation) on Investments Held at 06/30/2012 (8) | ||||||||||||||||||||||||||||||
Investments, at value | ||||||||||||||||||||||||||||||||||||||||
Corporate Bonds & Notes | ||||||||||||||||||||||||||||||||||||||||
United States | ||||||||||||||||||||||||||||||||||||||||
Industrials | $ | 0 | $ | 102 | $ | 0 | $ | 0 | $ | 0 | $ | 0 | $ | 0 | $ | 0 | $ | 102 | $ | 0 | ||||||||||||||||||||
|
|
|
|
|
|
|
|
|
|
|
|
|
|
|
|
|
|
|
| |||||||||||||||||||||
| (1) | See note 3 in the Notes to Financial Statements for more information regarding pricing inputs and valuation techniques. |
| (2) | There were no significant transfers into or out of level 1, 2, and 3 during the period ended June 30, 2012. |
| (3) | Refer to the Schedule of Investments for additional information. |
| (4) | Quoted prices in active markets for identical investments. |
| (5) | Significant other observable inputs. |
| (6) | Significant unobservable inputs. |
| (7) | Financial Derivative Instruments may include open futures contracts, swap agreements, written options, and foreign currency contracts. |
| (8) | Any difference between Net Change in Unrealized Appreciation/(Depreciation) and Net Change in Unrealized Appreciation/(Depreciation) on Investments Held at June 30, 2012 may be due to an investment no longer held or categorized as level 3 at period end. |
| See Accompanying Notes | ANNUAL REPORT | JUNE 30, 2012 | 45 |
Table of Contents
Schedule of Investments PIMCO Dividend and Income Builder Fund (Cont.)
June 30, 2012
| (e) | Fair Value of Financial Derivative Instruments (1) |
The following is a summary of the fair valuation of the Fund’s derivative instruments categorized by risk exposure:
Fair Values of Financial Derivative Instruments on the Statements of Assets and Liabilities as of June 30, 2012:
| Derivatives not accounted for as hedging instruments | ||||||||||||||||||||||||
| Commodity Contracts | Credit Contracts | Equity Contracts | Foreign Exchange Contracts | Interest Rate Contracts | Total | |||||||||||||||||||
Assets: | ||||||||||||||||||||||||
Unrealized appreciation on foreign currency contracts | $ | 0 | $ | 0 | $ | 0 | $ | 207 | $ | 0 | $ | 207 | ||||||||||||
|
|
|
|
|
|
|
|
|
|
|
| |||||||||||||
Liabilities: | ||||||||||||||||||||||||
Variation margin payable on financial derivative instruments (2) | $ | 0 | $ | 0 | $ | 0 | $ | 8 | $ | 0 | $ | 8 | ||||||||||||
Unrealized depreciation on foreign currency contracts | 0 | 0 | 0 | 271 | 0 | 271 | ||||||||||||||||||
|
|
|
|
|
|
|
|
|
|
|
| |||||||||||||
| $ | 0 | $ | 0 | $ | 0 | $ | 279 | $ | 0 | $ | 279 | |||||||||||||
|
|
|
|
|
|
|
|
|
|
|
| |||||||||||||
The Effect of Financial Derivative Instruments on the Statements of Operations for the Period Ended June 30, 2012:
| Derivatives not accounted for as hedging instruments | ||||||||||||||||||||||||
| Commodity Contracts | Credit Contracts | Equity Contracts | Foreign Exchange Contracts | Interest Rate Contracts | Total | |||||||||||||||||||
Realized Gain on Derivatives Recognized as a Result from Operations: | ||||||||||||||||||||||||
Net realized gain on futures contracts | $ | 0 | $ | 0 | $ | 0 | $ | 30 | $ | 0 | $ | 30 | ||||||||||||
Net realized gain on foreign currency transactions | 0 | 0 | 0 | 242 | 0 | 242 | ||||||||||||||||||
|
|
|
|
|
|
|
|
|
|
|
| |||||||||||||
| $ | 0 | $ | 0 | $ | 0 | $ | 272 | $ | 0 | $ | 272 | |||||||||||||
|
|
|
|
|
|
|
|
|
|
|
| |||||||||||||
Net Change in Unrealized (Depreciation) on Derivatives Recognized as a Result of Operations: | ||||||||||||||||||||||||
Net change in unrealized (depreciation) on futures contracts | $ | 0 | $ | 0 | $ | 0 | $ | (21 | ) | $ | 0 | $ | (21 | ) | ||||||||||
Net change in unrealized (depreciation) on translation of assets and liabilities denominated in foreign currencies | 0 | 0 | 0 | (64 | ) | 0 | (64 | ) | ||||||||||||||||
|
|
|
|
|
|
|
|
|
|
|
| |||||||||||||
| $ | 0 | $ | 0 | $ | 0 | $ | (85 | ) | $ | 0 | $ | (85 | ) | |||||||||||
|
|
|
|
|
|
|
|
|
|
|
| |||||||||||||
| (1) | See note 6 in the Notes to Financial Statements for additional information. |
| (2) | Only current day’s variation margin is reported within the Statements of Assets and Liabilities. The variation margin is included in the open futures cumulative appreciation/(depreciation) of $(21) as reported in the Notes to Schedule of Investments. |
| (f) | Collateral (Received)/Pledged for OTC Financial Derivative Instruments |
The following is a summary by counterparty of the market value of OTC financial derivative instruments and collateral (received)/pledged as of June 30, 2012:
| Counterparty | Total Market Value of OTC Derivatives | Collateral (Received)/Pledged | Net Exposures (1) | |||||||||
BOA | $ | (1 | ) | $ | 0 | $ | (1 | ) | ||||
BRC | (4 | ) | 0 | (4 | ) | |||||||
CBK | (9 | ) | 0 | (9 | ) | |||||||
DUB | 14 | 0 | 14 | |||||||||
FBF | (1 | ) | 0 | (1 | ) | |||||||
HUS | 27 | 0 | 27 | |||||||||
JPM | (57 | ) | 0 | (57 | ) | |||||||
MSC | 4 | 0 | 4 | |||||||||
UAG | (37 | ) | 0 | (37 | ) | |||||||
| (1) | Net Exposure represents the net receivable/(payable) that would be due from/to the counterparty in the event of default. See note 7, Principal Risks, in the Notes to Financial Statements for more information regarding credit and counterparty risks. |
| 46 | PIMCO EQUITY SERIES | See Accompanying Notes |
Table of Contents
Schedule of Investments PIMCO EqSTM Dividend Fund
June 30, 2012
| SHARES | MARKET VALUE (000S) | |||||||||||
| COMMON STOCKS 95.1% | ||||||||||||
| AUSTRALIA 2.8% | ||||||||||||
| INDUSTRIALS 1.0% | ||||||||||||
Ausdrill Ltd. | 907,067 | $ | 3,215 | |||||||||
|
| |||||||||||
| MATERIALS 1.8% | ||||||||||||
Kingsgate Consolidated Ltd. | 1,170,295 | 5,855 | ||||||||||
|
| |||||||||||
Total Australia | 9,070 | |||||||||||
|
| |||||||||||
| BRAZIL 1.5% | ||||||||||||
| UTILITIES 1.5% | ||||||||||||
Cia de Saneamento Basico do Estado de Sao Paulo SP - ADR | 61,997 | 4,703 | ||||||||||
|
| |||||||||||
Total Brazil | 4,703 | |||||||||||
|
| |||||||||||
| CANADA 7.4% | ||||||||||||
| CONSUMER DISCRETIONARY 3.0% | ||||||||||||
Aimia, Inc. | 712,044 | 9,477 | ||||||||||
|
| |||||||||||
| ENERGY 4.4% | ||||||||||||
Canadian Oil Sands Ltd. | 519,725 | 10,067 | ||||||||||
Poseidon Concepts Corp. | 336,069 | 4,116 | ||||||||||
|
| |||||||||||
| 14,183 | ||||||||||||
|
| |||||||||||
Total Canada | 23,660 | |||||||||||
|
| |||||||||||
| CHINA 3.5% | ||||||||||||
| INDUSTRIALS 3.5% | ||||||||||||
Guangshen Railway Co. Ltd. ‘H’ | 8,054,000 | 2,436 | ||||||||||
Jiangsu Expressway Co. Ltd. ‘H’ | 4,754,000 | 4,463 | ||||||||||
Zhejiang Expressway Co. Ltd. ‘H’ | 6,664,000 | 4,405 | ||||||||||
|
| |||||||||||
Total China | 11,304 | |||||||||||
|
| |||||||||||
| CZECH REPUBLIC 1.6% | ||||||||||||
| UTILITIES 1.6% | ||||||||||||
CEZ A/S | 146,799 | 5,073 | ||||||||||
|
| |||||||||||
Total Czech Republic | 5,073 | |||||||||||
|
| |||||||||||
| FRANCE 5.0% | ||||||||||||
| ENERGY 2.5% | ||||||||||||
Total S.A. | 179,880 | 8,096 | ||||||||||
|
| |||||||||||
| HEALTH CARE 2.5% | ||||||||||||
Sanofi | 107,340 | 8,126 | ||||||||||
|
| |||||||||||
Total France | 16,222 | |||||||||||
|
| |||||||||||
| HONG KONG 3.9% | ||||||||||||
| CONSUMER DISCRETIONARY 0.9% | ||||||||||||
Tianneng Power International Ltd. | 5,514,000 | 2,940 | ||||||||||
|
| |||||||||||
| INDUSTRIALS 1.4% | ||||||||||||
Yuexiu Transport Infrastructure Ltd. | 9,118,000 | 4,503 | ||||||||||
|
| |||||||||||
| SHARES | MARKET VALUE (000S) | |||||||||||
| MATERIALS 0.6% | ||||||||||||
Huabao International Holdings Ltd. | 3,909,000 | $ | 1,944 | |||||||||
|
| |||||||||||
| TELECOMMUNICATION SERVICES 1.0% | ||||||||||||
SmarTone Telecommunications Holdings Ltd. | 1,577,000 | 3,049 | ||||||||||
|
| |||||||||||
Total Hong Kong | 12,436 | |||||||||||
|
| |||||||||||
| ITALY 0.5% | ||||||||||||
| INDUSTRIALS 0.5% | ||||||||||||
Societa Iniziative Autostradali e Servizi SpA | 223,388 | 1,574 | ||||||||||
|
| |||||||||||
Total Italy | 1,574 | |||||||||||
|
| |||||||||||
| MACAU 1.7% | ||||||||||||
| CONSUMER DISCRETIONARY 1.7% | ||||||||||||
Wynn Macau Ltd. | 2,365,200 | 5,594 | ||||||||||
|
| |||||||||||
Total Macau | 5,594 | |||||||||||
|
| |||||||||||
| NETHERLANDS 1.6% | ||||||||||||
| ENERGY 1.6% | ||||||||||||
Royal Dutch Shell PLC ‘A’ | 150,874 | 5,083 | ||||||||||
|
| |||||||||||
Total Netherlands | 5,083 | |||||||||||
|
| |||||||||||
| NORWAY 2.0% | ||||||||||||
| INDUSTRIALS 2.0% | ||||||||||||
Orkla ASA | 876,056 | 6,357 | ||||||||||
|
| |||||||||||
Total Norway | 6,357 | |||||||||||
|
| |||||||||||
| QATAR 0.9% | ||||||||||||
| UTILITIES 0.9% | ||||||||||||
Qatar Electricity & Water Co. | 83,567 | 3,068 | ||||||||||
|
| |||||||||||
Total Qatar | 3,068 | |||||||||||
|
| |||||||||||
| SOUTH AFRICA 5.5% | ||||||||||||
| HEALTH CARE 1.6% | ||||||||||||
Life Healthcare Group Holdings Ltd. | 1,304,251 | 4,974 | ||||||||||
|
| |||||||||||
| MATERIALS 2.2% | ||||||||||||
Gold Fields Ltd. | 149,173 | 1,898 | ||||||||||
Gold Fields Ltd. SP - ADR | 415,007 | 5,316 | ||||||||||
|
| |||||||||||
| 7,214 | ||||||||||||
|
| |||||||||||
| TELECOMMUNICATION SERVICES 1.7% | ||||||||||||
Vodacom Group Ltd. | 470,947 | 5,364 | ||||||||||
|
| |||||||||||
Total South Africa | 17,552 | |||||||||||
|
| |||||||||||
| SPAIN 3.1% | ||||||||||||
| UTILITIES 3.1% | ||||||||||||
Enagas S.A. | 542,930 | 9,906 | ||||||||||
|
| |||||||||||
Total Spain | 9,906 | |||||||||||
|
| |||||||||||
| SHARES | MARKET (000S) | |||||||||||
| SWITZERLAND 7.6% | ||||||||||||
| HEALTH CARE 7.6% | ||||||||||||
Novartis AG | 196,259 | $ | 10,973 | |||||||||
Roche Holding AG | 78,513 | 13,562 | ||||||||||
|
| |||||||||||
Total Switzerland | 24,535 | |||||||||||
|
| |||||||||||
| THAILAND 1.5% | ||||||||||||
| INDUSTRIALS 1.5% | ||||||||||||
Bangkok Expressway PCL | 6,142,600 | 4,713 | ||||||||||
|
| |||||||||||
Total Thailand | 4,713 | |||||||||||
|
| |||||||||||
| UNITED KINGDOM 15.5% | ||||||||||||
| CONSUMER STAPLES 4.0% | ||||||||||||
Reckitt Benckiser Group PLC | 158,550 | 8,380 | ||||||||||
SABMiller PLC | 106,972 | 4,292 | ||||||||||
|
| |||||||||||
| 12,672 | ||||||||||||
|
| |||||||||||
| FINANCIALS 3.8% | ||||||||||||
HSBC Holdings PLC | 927,769 | 8,175 | ||||||||||
IG Group Holdings PLC | 544,263 | 4,091 | ||||||||||
|
| |||||||||||
| 12,266 | ||||||||||||
|
| |||||||||||
| INDUSTRIALS 5.3% | ||||||||||||
Carillion PLC | 1,827,084 | 7,915 | ||||||||||
G4S PLC | 2,113,596 | 9,238 | ||||||||||
|
| |||||||||||
| 17,153 | ||||||||||||
|
| |||||||||||
| TELECOMMUNICATION SERVICES 2.4% | ||||||||||||
Vodafone Group PLC | 2,749,198 | 7,727 | ||||||||||
|
| |||||||||||
Total United Kingdom | 49,818 | |||||||||||
|
| |||||||||||
| UNITED STATES 29.5% | ||||||||||||
| CONSUMER STAPLES 2.7% | ||||||||||||
Wal-Mart Stores, Inc. | 124,063 | 8,650 | ||||||||||
|
| |||||||||||
| FINANCIALS 7.3% | ||||||||||||
JPMorgan Chase & Co. | 178,361 | 6,373 | ||||||||||
Solar Capital Ltd. | 246,686 | 5,491 | ||||||||||
Solar Senior Capital Ltd. | 126,651 | 2,140 | ||||||||||
U.S. Bancorp | 292,442 | 9,405 | ||||||||||
|
| |||||||||||
| 23,409 | ||||||||||||
|
| |||||||||||
| HEALTH CARE 10.9% | ||||||||||||
Baxter International, Inc. | 207,780 | 11,044 | ||||||||||
Medtronic, Inc. | 300,889 | 11,653 | ||||||||||
Pfizer, Inc. | 539,036 | 12,398 | ||||||||||
|
| |||||||||||
| 35,095 | ||||||||||||
|
| |||||||||||
| INDUSTRIALS 2.0% | ||||||||||||
Lockheed Martin Corp. | 72,938 | 6,352 | ||||||||||
|
| |||||||||||
| INFORMATION TECHNOLOGY 5.1% | ||||||||||||
Intel Corp. | 198,304 | 5,285 | ||||||||||
Microsoft Corp. | 362,868 | 11,100 | ||||||||||
|
| |||||||||||
| 16,385 | ||||||||||||
|
| |||||||||||
| See Accompanying Notes | ANNUAL REPORT | JUNE 30, 2012 | 47 |
Table of Contents
Schedule of Investments PIMCO EqSTM Dividend Fund (Cont.)
| SHARES | MARKET (000S) | |||||||||||
| MATERIALS 1.5% | ||||||||||||
E.I. du Pont de Nemours & Co. | 91,898 | $ | 4,647 | |||||||||
|
| |||||||||||
Total United States | 94,538 | |||||||||||
|
| |||||||||||
Total Common Stocks (Cost $305,002) | 305,206 | |||||||||||
|
| |||||||||||
| PRINCIPAL AMOUNT (000S) | MARKET (000S) | |||||||||||
| SHORT-TERM INSTRUMENTS 4.7% | ||||||||||||
| REPURCHASE AGREEMENTS 0.2% | ||||||||||||
State Street Bank and Trust Co. |
| |||||||||||
0.010% due 07/02/2012 | $ | 519 | $ | 519 | ||||||||
|
| |||||||||||
(Dated 06/29/2012. Collateralized by U.S. Treasury Notes 2.000% due 11/15/2021 valued at $530. Repurchase proceeds are $519.) | ||||||||||||
| U.S. TREASURY BILLS 0.1% | ||||||||||||
0.168% due 05/02/2013 (b) | 400 | 399 | ||||||||||
|
| |||||||||||
| SHARES | MARKET (000S) | |||||||||||
| PIMCO SHORT-TERM FLOATING NAV PORTFOLIO (a) 4.4% | ||||||||||||
PIMCO Short-Term Floating NAV Portfolio | 1,399,567 | $ | 14,024 | |||||||||
|
| |||||||||||
Total Short-Term Instruments (Cost $14,944) | 14,942 | |||||||||||
|
| |||||||||||
| Total Investments 99.8% (Cost $319,946) | $ | 320,148 | ||||||||||
| Other Assets and Liabilities (Net) 0.2% | 502 | |||||||||||
|
| |||||||||||
| Net Assets 100.0% | $ | 320,650 | ||||||||||
|
| |||||||||||
Notes to Schedule of Investments (amounts in thousands*):
| * | A zero balance may reflect actual amounts rounding to less than one thousand. |
| (a) | Affiliated to the Fund. |
| (b) | Securities with an aggregate market value of $399 have been pledged as collateral as of June 30, 2012 for foreign currency contracts as governed by International Swaps and Derivatives Association, Inc. Master Agreements. |
| (c) | Foreign currency contracts outstanding on June 30, 2012: |
| Settlement Month | Currency to | Currency to be Received | Counterparty | Unrealized Appreciation | Unrealized (Depreciation) | Net Unrealized Appreciation/ (Depreciation) | ||||||||||||||||||||
07/2012 | AUD | 5,901 | $ | 5,825 | CBK | $ | 0 | $ | (215 | ) | $ | (215 | ) | |||||||||||||
07/2012 | 2,591 | 2,518 | JPM | 0 | (134 | ) | (134 | ) | ||||||||||||||||||
07/2012 | CHF | 2,575 | 2,695 | DUB | 0 | (18 | ) | (18 | ) | |||||||||||||||||
07/2012 | EUR | 5,334 | 6,693 | CBK | 0 | (57 | ) | (57 | ) | |||||||||||||||||
07/2012 | 11,985 | 14,988 | UAG | 0 | (179 | ) | (179 | ) | ||||||||||||||||||
07/2012 | GBP | 6,334 | 9,800 | BRC | 0 | (120 | ) | (120 | ) | |||||||||||||||||
07/2012 | 14,445 | 22,333 | UAG | 0 | (290 | ) | (290 | ) | ||||||||||||||||||
07/2012 | NOK | 3,166 | 522 | BOA | 0 | (10 | ) | (10 | ) | |||||||||||||||||
07/2012 | 8,480 | 1,394 | BRC | 0 | (32 | ) | (32 | ) | ||||||||||||||||||
07/2012 | 10,035 | 1,669 | DUB | 0 | (17 | ) | (17 | ) | ||||||||||||||||||
07/2012 | 3,166 | 523 | FBF | 0 | (9 | ) | (9 | ) | ||||||||||||||||||
07/2012 | 3,166 | 520 | UAG | 0 | (12 | ) | (12 | ) | ||||||||||||||||||
07/2012 | $ | 8,503 | AUD | 8,492 | BRC | 189 | 0 | 189 | ||||||||||||||||||
07/2012 | 2,664 | CHF | 2,575 | BRC | 49 | 0 | 49 | |||||||||||||||||||
07/2012 | 21,523 | EUR | 17,319 | BRC | 395 | 0 | 395 | |||||||||||||||||||
07/2012 | 31,884 | GBP | 20,573 | BRC | 337 | 0 | 337 | |||||||||||||||||||
07/2012 | 319 | 206 | UAG | 3 | 0 | 3 | ||||||||||||||||||||
07/2012 | 4,618 | NOK | 28,013 | BRC | 91 | 0 | 91 | |||||||||||||||||||
07/2012 | 1,859 | ZAR | 14,939 | BRC | 0 | (38 | ) | (38 | ) | |||||||||||||||||
07/2012 | ZAR | 38,487 | $ | 4,587 | BRC | 0 | (105 | ) | (105 | ) | ||||||||||||||||
07/2012 | 3,216 | 410 | CBK | 18 | 0 | 18 | ||||||||||||||||||||
07/2012 | 36,439 | 4,537 | DUB | 130 | (35 | ) | 95 | |||||||||||||||||||
07/2012 | 10,015 | 1,283 | HUS | 62 | 0 | 62 | ||||||||||||||||||||
07/2012 | 71,609 | 8,340 | JPM | 0 | (389 | ) | (389 | ) | ||||||||||||||||||
08/2012 | AUD | 8,492 | 8,479 | BRC | 0 | (188 | ) | (188 | ) | |||||||||||||||||
08/2012 | BRL | 3,662 | 1,873 | BRC | 61 | 0 | 61 | |||||||||||||||||||
08/2012 | 2,583 | 1,266 | HUS | 0 | (12 | ) | (12 | ) | ||||||||||||||||||
08/2012 | 2,680 | 1,355 | MSC | 29 | 0 | 29 | ||||||||||||||||||||
08/2012 | CHF | 2,575 | 2,666 | BRC | 0 | (49 | ) | (49 | ) | |||||||||||||||||
08/2012 | 3,927 | 4,110 | CBK | 0 | (33 | ) | (33 | ) | ||||||||||||||||||
08/2012 | 5,117 | 5,445 | HUS | 47 | 0 | 47 | ||||||||||||||||||||
08/2012 | CZK | 61,114 | 3,048 | JPM | 26 | (8 | ) | 18 | ||||||||||||||||||
08/2012 | 43,821 | 2,327 | UAG | 154 | 0 | 154 | ||||||||||||||||||||
08/2012 | EUR | 17,319 | 21,528 | BRC | 0 | (394 | ) | (394 | ) | |||||||||||||||||
08/2012 | GBP | 20,573 | 31,881 | BRC | 0 | (337 | ) | (337 | ) | |||||||||||||||||
08/2012 | 1,276 | 1,995 | FBF | 0 | (3 | ) | (3 | ) | ||||||||||||||||||
08/2012 | NOK | 28,013 | 4,613 | BRC | 0 | (91 | ) | (91 | ) | |||||||||||||||||
08/2012 | THB | 89,130 | 2,884 | HUS | 83 | 0 | 83 | |||||||||||||||||||
08/2012 | 47,010 | 1,496 | JPM | 19 | 0 | 19 | ||||||||||||||||||||
|
|
|
|
|
| |||||||||||||||||||||
| $ | 1,693 | $ | (2,775 | ) | $ | (1,082 | ) | |||||||||||||||||||
|
|
|
|
|
| |||||||||||||||||||||
| 48 | PIMCO EQUITY SERIES | See Accompanying Notes |
Table of Contents
June 30, 2012
| (d) | Fair Value Measurements (1) |
The following is a summary of the fair valuations according to the inputs used as of June 30, 2012 in valuing the Fund’s assets and liabilities (2):
| Category and Subcategory (3) | Level 1 (4) | Level 2 (5) | Level 3 (6) | Fair Value at 06/30/2012 | ||||||||||||
Investments, at value | ||||||||||||||||
Common Stocks | ||||||||||||||||
Australia | ||||||||||||||||
Industrials | $ | 0 | $ | 3,215 | $ | 0 | $ | 3,215 | ||||||||
Materials | 0 | 5,855 | 0 | 5,855 | ||||||||||||
Brazil | ||||||||||||||||
Utilities | 4,703 | 0 | 0 | 4,703 | ||||||||||||
Canada | ||||||||||||||||
Consumer Discretionary | 9,477 | 0 | 0 | 9,477 | ||||||||||||
Energy | 14,183 | 0 | 0 | 14,183 | ||||||||||||
China | ||||||||||||||||
Industrials | 0 | 11,304 | 0 | 11,304 | ||||||||||||
Czech Republic | ||||||||||||||||
Utilities | 5,073 | 0 | 0 | 5,073 | ||||||||||||
France | ||||||||||||||||
Energy | 0 | 8,096 | 0 | 8,096 | ||||||||||||
Health Care | 0 | 8,126 | 0 | 8,126 | ||||||||||||
Hong Kong | ||||||||||||||||
Consumer Discretionary | 0 | 2,940 | 0 | 2,940 | ||||||||||||
Industrials | 0 | 4,503 | 0 | 4,503 | ||||||||||||
Materials | 0 | 1,944 | 0 | 1,944 | ||||||||||||
Telecommunication Services | 0 | 3,049 | 0 | 3,049 | ||||||||||||
Italy | ||||||||||||||||
Industrials | 0 | 1,574 | 0 | 1,574 | ||||||||||||
Macau | ||||||||||||||||
Consumer Discretionary | 0 | 5,594 | 0 | 5,594 | ||||||||||||
Netherlands | ||||||||||||||||
Energy | 0 | 5,083 | 0 | 5,083 | ||||||||||||
Norway | ||||||||||||||||
Industrials | 0 | 6,357 | 0 | 6,357 | ||||||||||||
Qatar | ||||||||||||||||
Utilities | 0 | 3,068 | 0 | 3,068 | ||||||||||||
South Africa | ||||||||||||||||
Health Care | 0 | 4,974 | 0 | 4,974 | ||||||||||||
| Category and Subcategory (3) | Level 1 (4) | Level 2 (5) | Level 3 (6) | Fair Value at 06/30/2012 | ||||||||||||
Materials | $ | 5,316 | $ | 1,898 | $ | 0 | $ | 7,214 | ||||||||
Telecommunication Services | 0 | 5,364 | 0 | 5,364 | ||||||||||||
Spain | ||||||||||||||||
Utilities | 0 | 9,906 | 0 | 9,906 | ||||||||||||
Switzerland | ||||||||||||||||
Health Care | 0 | 24,535 | 0 | 24,535 | ||||||||||||
Thailand | ||||||||||||||||
Industrials | 0 | 4,713 | 0 | 4,713 | ||||||||||||
United Kingdom | ||||||||||||||||
Consumer Staples | 0 | 12,672 | 0 | 12,672 | ||||||||||||
Financials | 0 | 12,266 | 0 | 12,266 | ||||||||||||
Industrials | 0 | 17,153 | 0 | 17,153 | ||||||||||||
Telecommunication Services | 0 | 7,727 | 0 | 7,727 | ||||||||||||
United States | ||||||||||||||||
Consumer Staples | 8,650 | 0 | 0 | 8,650 | ||||||||||||
Financials | 23,409 | 0 | 0 | 23,409 | ||||||||||||
Health Care | 35,095 | 0 | 0 | 35,095 | ||||||||||||
Industrials | 6,352 | 0 | 0 | 6,352 | ||||||||||||
Information Technology | 16,385 | 0 | 0 | 16,385 | ||||||||||||
Materials | 4,647 | 0 | 0 | 4,647 | ||||||||||||
Short-Term Instruments | ||||||||||||||||
Repurchase Agreements | 0 | 519 | 0 | 519 | ||||||||||||
U.S. Treasury Bills | 0 | 399 | 0 | 399 | ||||||||||||
PIMCO Short-Term Floating NAV Portfolio | 14,024 | 0 | 0 | 14,024 | ||||||||||||
| $ | 147,314 | $ | 172,834 | $ | 0 | $ | 320,148 | |||||||||
Financial Derivative Instruments (7) - Assets |
| |||||||||||||||
Foreign Exchange Contracts | $ | 0 | $ | 1,693 | $ | 0 | $ | 1,693 | ||||||||
Financial Derivative Instruments (7) - Liabilities |
| |||||||||||||||
Foreign Exchange Contracts | $ | 0 | $ | (2,775 | ) | $ | 0 | $ | (2,775 | ) | ||||||
Totals | $ | 147,314 | $ | 171,752 | $ | 0 | $ | 319,066 | ||||||||
| (1) | See note 3 in the Notes to Financial Statements for more information regarding pricing inputs and valuation techniques. |
| (2) | There were no significant transfers into or out of level 1, 2, and 3 during the period ended June 30, 2012. |
| (3) | Refer to the Schedule of Investments for additional information. |
| (4) | Quoted prices in active markets for identical investments. |
| (5) | Significant other observable inputs. |
| (6) | Significant unobservable inputs. |
| (7) | Financial Derivative Instruments may include open futures contracts, swap agreements, written options, and foreign currency contracts. |
| (e) | Fair Value of Financial Derivative Instruments (1) |
The following is a summary of the fair valuation of the Fund’s derivative instruments categorized by risk exposure:
Fair Values of Financial Derivative Instruments on the Statements of Assets and Liabilities as of June 30, 2012:
| Derivatives not accounted for as hedging instruments | ||||||||||||||||||||||||
| Commodity Contracts | Credit Contracts | Equity Contracts | Foreign Exchange Contracts | Interest Rate Contracts | Total | |||||||||||||||||||
Assets: | ||||||||||||||||||||||||
Unrealized appreciation on foreign currency contracts | $ | 0 | $ | 0 | $ | 0 | $ | 1,693 | $ | 0 | $ | 1,693 | ||||||||||||
|
|
|
|
|
|
|
|
|
|
|
| |||||||||||||
Liabilities: | ||||||||||||||||||||||||
Unrealized depreciation on foreign currency contracts | $ | 0 | $ | 0 | $ | 0 | $ | 2,775 | $ | 0 | $ | 2,775 | ||||||||||||
|
|
|
|
|
|
|
|
|
|
|
| |||||||||||||
| See Accompanying Notes | ANNUAL REPORT | JUNE 30, 2012 | 49 |
Table of Contents
Schedule of Investments PIMCO EqSTM Dividend Fund (Cont.)
June 30, 2012
The Effect of Financial Derivative Instruments on the Statements of Operations for the Period Ended June 30, 2012:
| Derivatives not accounted for as hedging instruments | ||||||||||||||||||||||||
| Commodity Contracts | Credit Contracts | Equity Contracts | Foreign Exchange Contracts | Interest Rate Contracts | Total | |||||||||||||||||||
Realized Gain on Derivatives Recognized as a Result from Operations: | ||||||||||||||||||||||||
Net realized gain on foreign currency transactions | $ | 0 | $ | 0 | $ | 0 | $ | 1,657 | $ | 0 | $ | 1,657 | ||||||||||||
|
|
|
|
|
|
|
|
|
|
|
| |||||||||||||
Net Change in Unrealized (Depreciation) on Derivatives Recognized as a Result of Operations: | ||||||||||||||||||||||||
Net change in unrealized (depreciation) on translation of assets and liabilities denominated in foreign currencies | $ | 0 | $ | 0 | $ | 0 | $ | (1,082 | ) | $ | 0 | $ | (1,082 | ) | ||||||||||
|
|
|
|
|
|
|
|
|
|
|
| |||||||||||||
| (1) | See note 6 in the Notes to Financial Statements for additional information. |
| (f) | Collateral (Received)/Pledged for OTC Financial Derivative Instruments |
The following is a summary by counterparty of the market value of OTC financial derivative instruments and collateral (received)/pledged as of June 30, 2012:
| Counterparty | Total Market Value of OTC Derivatives | Collateral (Received)/Pledged | Net Exposures (1) | |||||||||
BOA | $ | (10 | ) | $ | 0 | $ | (10 | ) | ||||
BRC | (232 | ) | 0 | (232 | ) | |||||||
CBK | (287 | ) | 0 | (287 | ) | |||||||
DUB | 60 | (210 | ) | (150 | ) | |||||||
FBF | (12 | ) | 0 | (12 | ) | |||||||
HUS | 180 | (330 | ) | (150 | ) | |||||||
JPM | (486 | ) | 140 | (346 | ) | |||||||
MSC | 29 | (280 | ) | (251 | ) | |||||||
UAG | (324 | ) | 259 | (65 | ) | |||||||
| (1) | Net Exposure represents the net receivable/(payable) that would be due from/to the counterparty in the event of default. See note 7, Principal Risks, in the Notes to Financial Statements for more information regarding credit and counterparty risks. |
| 50 | PIMCO EQUITY SERIES | See Accompanying Notes |
Table of Contents
Schedule of Investments PIMCO EqSTM Emerging Markets Fund
June 30, 2012
| SHARES | MARKET VALUE (000S) | |||||||||||
| COMMON STOCKS 75.6% | ||||||||||||
| BERMUDA 0.5% | ||||||||||||
| ENERGY 0.5% | ||||||||||||
Seadrill Ltd. | 75,353 | $ | 2,687 | |||||||||
|
| |||||||||||
Total Bermuda | 2,687 | |||||||||||
|
| |||||||||||
| BRAZIL 6.0% | ||||||||||||
| CONSUMER DISCRETIONARY 1.5% | ||||||||||||
Anhanguera Educacional Participacoes S.A. | 446,800 | 5,695 | ||||||||||
Lojas Renner S.A. | 79,400 | 2,228 | ||||||||||
|
| |||||||||||
| 7,923 | ||||||||||||
|
| |||||||||||
| CONSUMER STAPLES 2.1% | ||||||||||||
Cia de Bebidas das Americas SP - ADR | 218,696 | 8,383 | ||||||||||
Hypermarcas S.A. | 405,800 | 2,398 | ||||||||||
|
| |||||||||||
| 10,781 | ||||||||||||
|
| |||||||||||
| FINANCIALS 2.1% | ||||||||||||
Banco do Brasil S.A. | 3,100 | 30 | ||||||||||
Itau Unibanco Holding S.A. SP - ADR | 795,249 | 11,070 | ||||||||||
|
| |||||||||||
| 11,100 | ||||||||||||
|
| |||||||||||
| HEALTH CARE 0.3% | ||||||||||||
Diagnosticos da America S.A. | 226,900 | 1,492 | ||||||||||
|
| |||||||||||
Total Brazil | 31,296 | |||||||||||
|
| |||||||||||
| CANADA 1.6% | ||||||||||||
| ENERGY 0.7% | ||||||||||||
Uranium One, Inc. (a) | 1,433,165 | 3,646 | ||||||||||
|
| |||||||||||
| MATERIALS 0.9% | ||||||||||||
Ivanhoe Mines Ltd. (a) | 456,840 | 4,422 | ||||||||||
|
| |||||||||||
Total Canada | 8,068 | |||||||||||
|
| |||||||||||
| CHINA 8.7% | ||||||||||||
| CONSUMER STAPLES 1.5% | ||||||||||||
Shenguan Holdings Group Ltd. | 13,230,000 | 7,670 | ||||||||||
|
| |||||||||||
| FINANCIALS 2.1% | ||||||||||||
China Construction Bank Corp. ‘H’ | 10,625,000 | 7,340 | ||||||||||
New China Life Insurance Co. Ltd. ‘H’ | 939,400 | 3,627 | ||||||||||
|
| |||||||||||
| 10,967 | ||||||||||||
|
| |||||||||||
| INDUSTRIALS 2.7% | ||||||||||||
China Automation Group Ltd. | 7,231,000 | 1,735 | ||||||||||
First Tractor Co. Ltd. ‘H’ | 4,568,000 | 3,690 | ||||||||||
Jiangsu Expressway Co. Ltd. ‘H’ | 5,954,000 | 5,590 | ||||||||||
Yuanda China Holdings Ltd. | 25,684,000 | 2,886 | ||||||||||
|
| |||||||||||
| 13,901 | ||||||||||||
|
| |||||||||||
| SHARES | MARKET VALUE (000S) | |||||||||||
| INFORMATION TECHNOLOGY 0.6% | ||||||||||||
Hollysys Automation Technologies Ltd. (a) | 398,430 | $ | 3,395 | |||||||||
|
| |||||||||||
| MATERIALS 1.8% | ||||||||||||
China Shanshui Cement Group Ltd. | 8,671,000 | 5,937 | ||||||||||
Xingda International | 10,222,000 | 3,378 | ||||||||||
|
| |||||||||||
| 9,315 | ||||||||||||
|
| |||||||||||
Total China | 45,248 | |||||||||||
|
| |||||||||||
| CYPRUS 0.8% | ||||||||||||
| INDUSTRIALS 0.8% | ||||||||||||
Global Ports Investment PLC SP - GDR | 308,215 | 4,207 | ||||||||||
|
| |||||||||||
Total Cyprus | 4,207 | |||||||||||
|
| |||||||||||
| CZECH REPUBLIC 1.2% | ||||||||||||
| UTILITIES 1.2% | ||||||||||||
CEZ A/S | 173,283 | 5,988 | ||||||||||
|
| |||||||||||
Total Czech Republic | 5,988 | |||||||||||
|
| |||||||||||
| DENMARK 1.3% | ||||||||||||
| CONSUMER STAPLES 1.3% | ||||||||||||
Carlsberg A/S ‘B’ | 82,971 | 6,549 | ||||||||||
|
| |||||||||||
Total Denmark | 6,549 | |||||||||||
|
| |||||||||||
| HONG KONG 10.2% | ||||||||||||
| CONSUMER DISCRETIONARY 0.9% | ||||||||||||
Melco Crown Entertainment Ltd. ADR (a) | 395,407 | 4,555 | ||||||||||
|
| |||||||||||
| CONSUMER STAPLES 1.3% | ||||||||||||
China Mengniu Dairy Co. Ltd. | 1,553,000 | 4,143 | ||||||||||
Real Nutriceutical Group Ltd. | 13,283,000 | 2,959 | ||||||||||
|
| |||||||||||
| 7,102 | ||||||||||||
|
| |||||||||||
| FINANCIALS 3.7% | ||||||||||||
AIA Group Ltd. | 3,882,000 | 13,409 | ||||||||||
Glorious Property | 32,691,000 | 5,785 | ||||||||||
|
| |||||||||||
| 19,194 | ||||||||||||
|
| |||||||||||
| INDUSTRIALS 0.6% | ||||||||||||
Shanghai Industrial | 1,227,000 | 3,258 | ||||||||||
|
| |||||||||||
| INFORMATION TECHNOLOGY 0.6% | ||||||||||||
China High Precision Automation Group Ltd. | 8,446,000 | 2,983 | ||||||||||
|
| |||||||||||
| TELECOMMUNICATION SERVICES 3.1% | ||||||||||||
China Mobile Ltd. | 1,450,000 | 15,936 | ||||||||||
|
| |||||||||||
Total Hong Kong | 53,028 | |||||||||||
|
| |||||||||||
| INDIA 2.6% | ||||||||||||
| FINANCIALS 1.9% | ||||||||||||
Bank of Baroda | 146,734 | 1,936 | ||||||||||
| SHARES | MARKET VALUE (000S) | |||||||||||
Housing Development Finance Corp. | 401,009 | $ | 4,711 | |||||||||
Yes Bank Ltd. | 576,901 | 3,524 | ||||||||||
|
| |||||||||||
| 10,171 | ||||||||||||
|
| |||||||||||
| INDUSTRIALS 0.3% | ||||||||||||
Bharat Electronics Ltd. | 56,603 | 1,368 | ||||||||||
|
| |||||||||||
| INFORMATION TECHNOLOGY 0.3% | ||||||||||||
Rolta India Ltd. | 1,016,230 | 1,475 | ||||||||||
|
| |||||||||||
| TELECOMMUNICATION SERVICES 0.1% | ||||||||||||
Idea Cellular Ltd. (a) | 482,060 | 658 | ||||||||||
|
| |||||||||||
Total India | 13,672 | |||||||||||
|
| |||||||||||
| ISRAEL 4.6% | ||||||||||||
| HEALTH CARE 1.4% | ||||||||||||
Teva Pharmaceutical Industries Ltd. SP - ADR | 186,175 | 7,343 | ||||||||||
|
| |||||||||||
| MATERIALS 2.2% | ||||||||||||
Israel Chemicals Ltd. | 1,008,232 | 11,167 | ||||||||||
|
| |||||||||||
| TELECOMMUNICATION SERVICES 1.0% | ||||||||||||
Bezeq The Israeli Telecommunication Corp. Ltd. | 4,838,122 | 5,145 | ||||||||||
|
| |||||||||||
Total Israel | 23,655 | |||||||||||
|
| |||||||||||
| ITALY 1.0% | ||||||||||||
| CONSUMER DISCRETIONARY 1.0% | ||||||||||||
Fiat SpA | 1,049,435 | 5,291 | ||||||||||
|
| |||||||||||
Total Italy | 5,291 | |||||||||||
|
| |||||||||||
| JAPAN 1.9% | ||||||||||||
| CONSUMER DISCRETIONARY 1.9% | ||||||||||||
Honda Motor Co. Ltd. | 277,900 | 9,697 | ||||||||||
|
| |||||||||||
Total Japan | 9,697 | |||||||||||
|
| |||||||||||
| KAZAKHSTAN 1.3% | ||||||||||||
| ENERGY 1.3% | ||||||||||||
KazMunaiGas Exploration Production SP - GDR | 405,041 | 6,845 | ||||||||||
|
| |||||||||||
Total Kazakhstan | 6,845 | |||||||||||
|
| |||||||||||
| MACAU 1.2% | ||||||||||||
| CONSUMER DISCRETIONARY 1.2% | ||||||||||||
Wynn Macau Ltd. | 2,716,000 | 6,423 | ||||||||||
|
| |||||||||||
Total Macau | 6,423 | |||||||||||
|
| |||||||||||
| MEXICO 1.4% | ||||||||||||
| CONSUMER DISCRETIONARY 0.6% | ||||||||||||
Urbi Desarrollos Urbanos S.A.B. de C.V. (a) | 3,303,600 | 3,180 | ||||||||||
|
| |||||||||||
| CONSUMER STAPLES 0.8% | ||||||||||||
Wal-Mart de Mexico S.A.B. de C.V. ‘V’ | 1,414,800 | 3,785 | ||||||||||
|
| |||||||||||
Total Mexico | 6,965 | |||||||||||
|
| |||||||||||
| See Accompanying Notes | ANNUAL REPORT | JUNE 30, 2012 | 51 |
Table of Contents
Schedule of Investments PIMCO EqSTM Emerging Markets Fund (Cont.)
| SHARES | MARKET VALUE (000S) | |||||||||||
| NETHERLANDS 0.5% | ||||||||||||
| ENERGY 0.5% | ||||||||||||
SBM Offshore NV | 189,817 | $ | 2,631 | |||||||||
|
| |||||||||||
Total Netherlands | 2,631 | |||||||||||
|
| |||||||||||
| PERU 1.8% | ||||||||||||
| FINANCIALS 1.8% | ||||||||||||
Credicorp Ltd. | 73,431 | 9,244 | ||||||||||
|
| |||||||||||
Total Peru | 9,244 | |||||||||||
|
| |||||||||||
| PHILIPPINES 1.7% | ||||||||||||
| UTILITIES 1.7% | ||||||||||||
First Gen Corp. (a) | 21,130,200 | 8,873 | ||||||||||
|
| |||||||||||
Total Philippines | 8,873 | |||||||||||
|
| |||||||||||
| QATAR 0.8% | ||||||||||||
| FINANCIALS 0.8% | ||||||||||||
Commercial Bank of Qatar QSC | 218,788 | 4,144 | ||||||||||
|
| |||||||||||
Total Qatar | 4,144 | |||||||||||
|
| |||||||||||
| RUSSIA 5.2% | ||||||||||||
| CONSUMER STAPLES 1.4% | ||||||||||||
X5 Retail Group NV SP - GDR (a) | 325,703 | 7,450 | ||||||||||
|
| |||||||||||
| ENERGY 1.4% | ||||||||||||
NovaTek OAO SP - GDR | 67,627 | 7,173 | ||||||||||
|
| |||||||||||
| INDUSTRIALS 0.7% | ||||||||||||
Globaltrans Investment PLC SP - GDR | 207,805 | 3,752 | ||||||||||
|
| |||||||||||
| MATERIALS 1.7% | ||||||||||||
Magnitogorsk Iron & Steel Works SP - GDR | 1,376,167 | 5,091 | ||||||||||
Mechel SP - ADR | 970,857 | 3,673 | ||||||||||
|
| |||||||||||
| 8,764 | ||||||||||||
|
| |||||||||||
Total Russia | 27,139 | |||||||||||
|
| |||||||||||
| SINGAPORE 1.2% | ||||||||||||
| ENERGY 0.9% | ||||||||||||
Sakari Resources Ltd. | 4,227,000 | 4,628 | ||||||||||
|
| |||||||||||
| INDUSTRIALS 0.3% | ||||||||||||
Hutchison Port Holdings Trust | 1,866,000 | 1,334 | ||||||||||
|
| |||||||||||
Total Singapore | 5,962 | |||||||||||
|
| |||||||||||
| SOUTH AFRICA 4.3% | ||||||||||||
| CONSUMER STAPLES 2.3% | ||||||||||||
Shoprite Holdings Ltd. | 303,319 | 5,600 | ||||||||||
Tongaat Hulett Ltd. | 417,968 | 6,396 | ||||||||||
|
| |||||||||||
| 11,996 | ||||||||||||
|
| |||||||||||
| MATERIALS 1.8% | ||||||||||||
AngloGold Ashanti Ltd. SP - ADR | 181,544 | 6,234 | ||||||||||
| SHARES | MARKET VALUE (000S) | |||||||||||
Harmony Gold Mining Co. Ltd. | 59,562 | $ | 557 | |||||||||
Harmony Gold Mining Co. Ltd. SP - ADR | 278,551 | 2,618 | ||||||||||
|
| |||||||||||
| 9,409 | ||||||||||||
|
| |||||||||||
| TELECOMMUNICATION SERVICES 0.2% | ||||||||||||
MTN Group Ltd. | 56,811 | 984 | ||||||||||
|
| |||||||||||
Total South Africa | 22,389 | |||||||||||
|
| |||||||||||
| SOUTH KOREA 4.2% | ||||||||||||
| CONSUMER DISCRETIONARY 1.8% | ||||||||||||
GS Home Shopping, Inc. | 48,364 | 4,086 | ||||||||||
Hyundai Mobis | 22,522 | 5,459 | ||||||||||
|
| |||||||||||
| 9,545 | ||||||||||||
|
| |||||||||||
| FINANCIALS 0.5% | ||||||||||||
Korean Reinsurance Co. | 246,460 | 2,416 | ||||||||||
|
| |||||||||||
| INDUSTRIALS 0.8% | ||||||||||||
Samsung Techwin Co. Ltd. | 57,770 | 3,935 | ||||||||||
|
| |||||||||||
| INFORMATION TECHNOLOGY 0.2% | ||||||||||||
Jusung Engineering Co. Ltd. (a) | 200,392 | 1,320 | ||||||||||
|
| |||||||||||
| MATERIALS 0.9% | ||||||||||||
LG Chem Ltd. | 18,336 | 4,747 | ||||||||||
|
| |||||||||||
Total South Korea | 21,963 | |||||||||||
|
| |||||||||||
| TAIWAN 4.4% | ||||||||||||
| FINANCIALS 0.6% | ||||||||||||
Huaku Development Co. Ltd. | 1,317,293 | 3,218 | ||||||||||
|
| |||||||||||
| INFORMATION TECHNOLOGY 3.8% | ||||||||||||
Chicony Electronics Co. Ltd. | 1,845,435 | 3,426 | ||||||||||
E Ink Holdings, Inc. | 2,749,000 | 3,047 | ||||||||||
Hon Hai Precision Industry Co. Ltd. | 4,419,900 | 13,364 | ||||||||||
|
| |||||||||||
| 19,837 | ||||||||||||
|
| |||||||||||
Total Taiwan | 23,055 | |||||||||||
|
| |||||||||||
| THAILAND 2.9% | ||||||||||||
| CONSUMER STAPLES 0.8% | ||||||||||||
Thai Beverage PCL | 15,949,000 | 4,281 | ||||||||||
|
| |||||||||||
| FINANCIALS 1.1% | ||||||||||||
Tisco Financial Group PCL | 4,551,200 | 5,576 | ||||||||||
|
| |||||||||||
| INDUSTRIALS 1.0% | ||||||||||||
Thai Airways International PCL | 7,345,400 | 5,025 | ||||||||||
|
| |||||||||||
Total Thailand | 14,882 | |||||||||||
|
| |||||||||||
| TURKEY 1.2% | ||||||||||||
| TELECOMMUNICATION SERVICES 1.2% | ||||||||||||
Turk Telekomunikasyon A/S | 1,541,310 | 6,308 | ||||||||||
|
| |||||||||||
Total Turkey | 6,308 | |||||||||||
|
| |||||||||||
| SHARES | MARKET VALUE (000S) | |||||||||||
| UNITED KINGDOM 3.1% | ||||||||||||
| CONSUMER STAPLES 1.1% | ||||||||||||
British American Tobacco PLC | 111,736 | $ | 5,681 | |||||||||
|
| |||||||||||
| ENERGY 1.2% | ||||||||||||
Afren PLC (a) | 3,843,017 | 6,247 | ||||||||||
|
| |||||||||||
| MATERIALS 0.8% | ||||||||||||
Petropavlovsk PLC | 604,517 | 4,331 | ||||||||||
|
| |||||||||||
Total United Kingdom | 16,259 | |||||||||||
|
| |||||||||||
Total Common Stocks (Cost $433,718) | 392,468 | |||||||||||
|
| |||||||||||
| UNITS | ||||||||||||
| EQUITY-LINKED SECURITIES 1.4% | ||||||||||||
| INDIA 0.9% | ||||||||||||
| FINANCIALS 0.4% | ||||||||||||
JPMorgan Chase & Co. | ||||||||||||
Bank of Baroda - Exp. 05/05/2016 | 78,276 | 1,033 | ||||||||||
Merrill Lynch International & Co. |
| |||||||||||
Bank of Baroda - Exp. 01/07/2016 | 57,030 | 753 | ||||||||||
Yes Bank Ltd. - Exp. 09/14/2015 | 35,317 | 216 | ||||||||||
|
| |||||||||||
| 2,002 | ||||||||||||
|
| |||||||||||
| INDUSTRIALS 0.5% | ||||||||||||
JPMorgan Chase & Co. | ||||||||||||
Bharat Electronics Ltd. - Exp. 08/02/2016 | 22,959 | 554 | ||||||||||
Merrill Lynch International & Co. |
| |||||||||||
Bharat Electronics Ltd. - Exp. 03/22/2016 | 78,400 | 1,893 | ||||||||||
|
| |||||||||||
| 2,447 | ||||||||||||
|
| |||||||||||
| TELECOMMUNICATION SERVICES 0.0% | ||||||||||||
JPMorgan Chase & Co. | ||||||||||||
Idea Cellular Ltd. - Exp. 07/25/2016 | 90,792 | 124 | ||||||||||
|
| |||||||||||
Total India | 4,573 | |||||||||||
|
| |||||||||||
| NIGERIA 0.5% | ||||||||||||
| CONSUMER STAPLES 0.5% | ||||||||||||
HSBC Bank PLC | ||||||||||||
Guinness Nigeria PLC - Exp. 12/09/2014 | 545,745 | 764 | ||||||||||
Nigerian Breweries PLC - Exp. 12/09/2014 | 3,066,979 | 1,908 | ||||||||||
Merrill Lynch International & Co. |
| |||||||||||
Guinness Nigeria PLC - Exp. 11/10/2014 | 9,882 | 14 | ||||||||||
Nigerian Breweries PLC - Exp. 11/10/2014 | 251,197 | 156 | ||||||||||
|
| |||||||||||
Total Nigeria | 2,842 | |||||||||||
|
| |||||||||||
Total Equity-Linked Securities (Cost $9,630) | 7,415 | |||||||||||
|
| |||||||||||
| 52 | PIMCO EQUITY SERIES | See Accompanying Notes |
Table of Contents
June 30, 2012
| SHARES | MARKET VALUE (000S) | |||||||||||
| EXCHANGE-TRADED FUNDS 4.5% | ||||||||||||
| HONG KONG 1.4% | ||||||||||||
BOCI-Prudential - W.I.S.E. Fund | 2,019,200 | $ | 7,171 | |||||||||
|
| |||||||||||
Total Hong Kong | 7,171 | |||||||||||
|
| |||||||||||
| LUXEMBOURG 0.5% | ||||||||||||
db x-trackers - CSI300 Index ETF | 3,728,100 | 2,878 | ||||||||||
|
| |||||||||||
Total Luxembourg | 2,878 | |||||||||||
|
| |||||||||||
| UNITED STATES 2.6% | ||||||||||||
ETFS Palladium Trust | 98,603 | 5,653 | ||||||||||
Vanguard MSCI Emerging Markets ETF | 194,792 | 7,782 | ||||||||||
|
| |||||||||||
Total United States | 13,435 | |||||||||||
|
| |||||||||||
Total Exchange-Traded Funds (Cost $27,716) | 23,484 | |||||||||||
|
| |||||||||||
| PREFERRED STOCKS 6.2% | ||||||||||||
| BRAZIL 0.3% | ||||||||||||
| INDUSTRIALS 0.3% | ||||||||||||
Usinas Siderurgicas de Minas Gerais S.A. | 436,700 | 1,374 | ||||||||||
|
| |||||||||||
Total Brazil | 1,374 | |||||||||||
|
| |||||||||||
| SHARES | MARKET VALUE (000S) | |||||||||||
| SOUTH KOREA 5.9% | ||||||||||||
| INDUSTRIALS 5.9% | ||||||||||||
Samsung Electronics Co. Ltd. | 46,343 | $ | 30,594 | |||||||||
|
| |||||||||||
Total South Korea | 30,594 | |||||||||||
|
| |||||||||||
Total Preferred Stocks (Cost $28,959) | 31,968 | |||||||||||
|
| |||||||||||
| RIGHTS 0.1% | ||||||||||||
| CANADA 0.1% | ||||||||||||
| MATERIALS 0.1% | ||||||||||||
Ivanhoe Mines Ltd. - Exp. 07/19/2012 | 456,840 | 421 | ||||||||||
|
| |||||||||||
Total Rights (Cost $0) | 421 | |||||||||||
|
| |||||||||||
| PRINCIPAL AMOUNT (000s) | ||||||||||||
| SHORT-TERM INSTRUMENTS 11.6% | ||||||||||||
| REPURCHASE AGREEMENTS 0.1% | ||||||||||||
State Street Bank and Trust Co. | ||||||||||||
0.010% due 07/02/2012 | $ | 524 | 524 | |||||||||
|
| |||||||||||
(Dated 06/29/2012. Collateralized by U.S. Treasury Notes 2.000% due 11/15/2021 valued at $535. Repurchase proceeds are $524.) | ||||||||||||
| PRINCIPAL AMOUNT (000s) | MARKET VALUE (000S) | |||||||||||
| U.S. TREASURY BILLS 1.4% | ||||||||||||
0.159% due 08/23/2012 - 06/27/2013 (b)(e) | $ | 7,415 | $ | 7,408 | ||||||||
|
| |||||||||||
| SHARES | ||||||||||||
| PIMCO SHORT-TERM FLOATING NAV PORTFOLIO (c) 10.1% | ||||||||||||
PIMCO Short-Term Floating NAV Portfolio | 5,238,105 | 52,486 | ||||||||||
|
| |||||||||||
Total Short-Term Instruments (Cost $60,423) | 60,418 | |||||||||||
|
| |||||||||||
| PURCHASED OPTIONS (g) 0.5% | ||||||||||||
(Cost $3,105) | 2,368 | |||||||||||
| Total Investments 99.9% (Cost $563,551) | $ | 518,542 | ||||||||||
| Written Options (h) (0.3%) (Premiums $2,324) | (1,610 | ) | ||||||||||
| Other Assets and Liabilities (Net) 0.4% | 2,206 | |||||||||||
|
| |||||||||||
| Net Assets 100.0% | $ | 519,138 | ||||||||||
|
| |||||||||||
Notes to Schedule of Investments (amounts in thousands*, except number of contracts and shares):
| * | A zero balance may reflect actual amounts rounding to less than one thousand. |
| (a) | Non-income producing security. |
| (b) | Coupon represents a weighted average yield to maturity. |
| (c) | Affiliated to the Fund. |
| (d) | Cash of $3,300 has been pledged as collateral as of June 30, 2012 for equity options, equity short sales, and other transactions in accordance with prime brokerage arrangements. |
| (e) | Securities with an aggregate market value of $7,408 have been pledged as collateral as of June 30, 2012 for OTC swap agreements, foreign currency options and foreign currency contracts as governed by International Swaps and Derivatives Association, Inc. Master Agreements. |
| (f) | OTC swap agreements outstanding on June 30, 2012: |
Credit Default Swaps on Credit Indices - Buy Protection (1)
| Index/Tranches | Counterparty | Fixed Deal (Pay) Rate | Maturity Date | Notional Amount (2) | Market Value (3) | Premiums (Received) | Unrealized Appreciation | |||||||||||||||||||||||
CDX.IG-9 10-Year Index 15-30% | BPS | (1.000% | ) | 12/20/2017 | $ | 3,100 | $ | 13 | $ | (25 | ) | $ | 38 | |||||||||||||||||
|
|
|
|
|
| |||||||||||||||||||||||||
| (1) | If the Fund is a buyer of protection and a credit event occurs, as defined under the terms of that particular swap agreement, the Fund will either (i) receive from the seller of protection an amount equal to the notional amount of the swap and deliver the referenced obligation or underlying securities comprising the referenced index or (ii) receive a net settlement amount in the form of cash or securities equal to the notional amount of the swap less the recovery value of the referenced obligation or underlying securities comprising the referenced index. |
| (2) | The maximum potential amount the Fund could be required to pay as a seller of credit protection or receive as a buyer of credit protection if a credit event occurs as defined under the terms of that particular swap agreement. |
| (3) | The prices and resulting values for credit default swap agreements on credit indices serve as an indicator of the current status of the payment/performance risk and represent the likelihood of an expected liability (or profit) for the credit derivative should the notional amount of the swap agreement be closed/sold as of the period end. Increasing market values, in absolute terms when compared to the notional amount of the swap, represent a deterioration of the referenced entity’s credit soundness and a greater likelihood or risk of default or other credit event occurring as defined under the terms of the agreement. |
| Total Return Swaps on Securities | ||||||||||||||||||||||||||
| Pay/Receive | Underlying Reference | # of Shares | Financing Rate (4) | Notional Amount | Maturity Date | Counterparty | Unrealized Appreciation/ (Depreciation) | |||||||||||||||||||
| Receive | TNK-BP Holding | 629,771 | 1-Month USD-LIBOR plus a specified spread | $ | 1,410 | 07/12/2012 | BOA | $ | 217 | |||||||||||||||||
| Receive | Banco do Brasil S.A. | 138,700 | 1-Month USD-LIBOR plus a specified spread | 1,302 | 08/15/2012 | CBK | 62 | |||||||||||||||||||
| Receive | Brasil Insurance Participacoes e Administracao S.A. | 90,000 | 1-Month USD-LIBOR plus a specified spread | 881 | 08/15/2012 | CBK | (81 | ) | ||||||||||||||||||
| See Accompanying Notes | ANNUAL REPORT | JUNE 30, 2012 | 53 |
Table of Contents
Schedule of Investments PIMCO EqSTM Emerging Markets Fund (Cont.)
| Total Return Swaps on Securities (Cont.) | ||||||||||||||||||||||||||
| Pay/Receive | Underlying Reference | # of Shares | Financing Rate (4) | Notional Amount | Maturity Date | Counterparty | Unrealized Appreciation/ (Depreciation) | |||||||||||||||||||
| Receive | Diagnosticos da America S.A. | 91,800 | 1-Month USD-LIBOR plus a specified spread | $ | 630 | 08/15/2012 | CBK | $ | (22 | ) | ||||||||||||||||
| Receive | Harmony Gold Mining Co., Ltd. | 16,830 | 1-Month USD-LIBOR plus a specified spread | 172 | 12/10/2012 | CBK | (15 | ) | ||||||||||||||||||
| Receive | MTN Group Ltd. | 91,687 | 1-Month USD-LIBOR plus a specified spread | 1,490 | 12/10/2012 | CBK | 88 | |||||||||||||||||||
| Receive | Sasol Ltd. | 18,432 | 1-Month USD-LIBOR plus a specified spread | 801 | 12/10/2012 | CBK | (31 | ) | ||||||||||||||||||
| Receive | Brasil Insurance Participacoes e Administracao S.A. | 2,781 | 1-Month USD-LIBOR plus a specified spread | 27 | 08/15/2012 | FBF | (3 | ) | ||||||||||||||||||
| Receive | Diagnosticos da America S.A. | 50,500 | 1-Month USD-LIBOR plus a specified spread | 347 | 08/15/2012 | FBF | (12 | ) | ||||||||||||||||||
| Receive | Usinas Siderurgicas de Minas Gerais S.A. | 29,100 | 1-Month USD-LIBOR plus a specified spread | 106 | 08/13/2012 | GST | (14 | ) | ||||||||||||||||||
| Receive | AK Transneft OAO | 2,225 | 1-Month USD-LIBOR plus a specified spread | 3,173 | 01/14/2013 | GST | 115 | |||||||||||||||||||
| Receive | TNK-BP Holding | 910,646 | 1-Month USD-LIBOR plus a specified spread | 2,038 | 05/24/2013 | GST | 61 | |||||||||||||||||||
| Receive | Harmony Gold Mining Co., Ltd. | 16,579 | 1-Month USD-LIBOR plus a specified spread | 169 | 10/12/2012 | JPM | 6 | |||||||||||||||||||
| Receive | Brasil Insurance Participacoes e Administracao S.A. | 80,800 | 1-Month USD-LIBOR plus a specified spread | 790 | 12/10/2012 | JPM | (40 | ) | ||||||||||||||||||
| Receive | Lojas Renner S.A. | 106,700 | 1-Month USD-LIBOR plus a specified spread | 3,147 | 12/14/2012 | JPM | (149 | ) | ||||||||||||||||||
| Receive | MTN Group Ltd. | 201,321 | 1-Month USD-LIBOR plus a specified spread | 3,271 | 04/19/2013 | JPM | 193 | |||||||||||||||||||
| Receive | Sasol Ltd. | 45,315 | 1-Month USD-LIBOR plus a specified spread | 1,970 | 04/19/2013 | JPM | (76 | ) | ||||||||||||||||||
| Receive | Harmony Gold Mining Co., Ltd. | 69,556 | 1-Month USD-LIBOR plus a specified spread | 710 | 08/13/2012 | MYI | (60 | ) | ||||||||||||||||||
| Receive | Banco do Brasil S.A. | 123,500 | 1-Month USD-LIBOR plus a specified spread | 1,159 | 08/15/2012 | MYI | 55 | |||||||||||||||||||
| Receive | Diagnosticos da America S.A. | 89,300 | 1-Month USD-LIBOR plus a specified spread | 613 | 08/15/2012 | MYI | (21 | ) | ||||||||||||||||||
| Receive | MTN Group Ltd. | 158,328 | 1-Month USD-LIBOR plus a specified spread | 2,573 | 08/15/2012 | MYI | 152 | |||||||||||||||||||
| Receive | Hypermarcas S.A. | 337,100 | 1-Month USD-LIBOR less a specified spread | 1,984 | 02/06/2013 | MYI | 8 | |||||||||||||||||||
| Receive | Huabao International Holdings Ltd. | 3,531,000 | 1-Month USD-LIBOR less a specified spread | 1,393 | 02/13/2013 | MYI | 332 | |||||||||||||||||||
| Receive | TPK Holdings Co. Ltd. | 348,590 | 1-Month USD-LIBOR less a specified spread | 4,088 | 02/13/2013 | MYI | 432 | |||||||||||||||||||
| Receive | Hypermarcas S.A. | 133,800 | 1-Month USD-LIBOR less a specified spread | 787 | 02/25/2013 | MYI | 3 | |||||||||||||||||||
| Receive | Sasol Ltd. | 53,331 | 1-Month USD-LIBOR plus a specified spread | 2,319 | 03/22/2013 | MYI | (89 | ) | ||||||||||||||||||
| Receive | Banco do Brasil S.A. | 130,900 | 1-Month USD-LIBOR plus a specified spread | 1,229 | 08/01/2012 | ULO | 59 | |||||||||||||||||||
| Receive | Diagnosticos da America S.A. | 157,200 | 1-Month USD-LIBOR plus a specified spread | 1,080 | 08/01/2012 | ULO | (42 | ) | ||||||||||||||||||
| Receive | Brasil Insurance Participacoes e Administracao S.A. | 73,019 | 1-Month USD-LIBOR plus a specified spread | 714 | 08/02/2012 | ULO | (66 | ) | ||||||||||||||||||
| Receive | Usinas Siderurgicas de Minas Gerais S.A. | 148,100 | 1-Month USD-LIBOR plus a specified spread | 540 | 08/17/2012 | ULO | (74 | ) | ||||||||||||||||||
| Receive | Bashneft OAO | 633 | 1-Month USD-LIBOR plus a specified spread | 32 | 01/17/2013 | ULO | 0 | |||||||||||||||||||
| Receive | Bashneft OAO | 85,976 | 1-Month USD-LIBOR plus a specified spread | 4,331 | 04/05/2013 | ULO | 4 | |||||||||||||||||||
| Receive | TNK-BP Holding | 998,344 | 1-Month USD-LIBOR plus a specified spread | 2,234 | 04/12/2013 | ULO | 344 | |||||||||||||||||||
| Receive | TNK-BP Holding | 1,060,468 | 1-Month USD-LIBOR plus a specified spread | 2,373 | 05/17/2013 | ULO | 72 | |||||||||||||||||||
| Receive | Bashneft OAO | 45,890 | 1-Month USD-LIBOR plus a specified spread | 2,312 | 05/24/2013 | ULO | (123 | ) | ||||||||||||||||||
|
| |||||||||||||||||||||||||
| $ | 1,285 | |||||||||||||||||||||||||
|
| |||||||||||||||||||||||||
| (4) | Financing rate is based upon predetermined notional amounts, which may be a multiple of the number of shares disclosed. |
| (g) | Purchased options outstanding on June 30, 2012: |
Foreign Currency Options
| Description | Counterparty | Exercise Price | Expiration Date | Notional Amount | Cost | Market Value | ||||||||||||||||||||||||
Put - OTC AUD versus USD | MSX | $ | 0.750 | 07/23/2012 | AUD | 9,450 | $ | 69 | $ | 0 | ||||||||||||||||||||
Put - OTC EUR versus USD | UAG | 1.273 | 08/16/2012 | EUR | 17,315 | 574 | 381 | |||||||||||||||||||||||
|
|
|
| |||||||||||||||||||||||||||
| $ | 643 | $ | 381 | |||||||||||||||||||||||||||
|
|
|
| |||||||||||||||||||||||||||
Options on Exchange-Traded Funds
| Description | Strike Price | Expiration Date | # of Contracts | Cost | Market Value | |||||||||||||||
Put - CBOE iShares MSCI Emerging Markets Index Fund | $ 38.000 | 09/22/2012 | 2,465 | $ | 419 | $ | 362 | |||||||||||||
Put - CBOE iShares MSCI Emerging Markets Index Fund | 37.000 | 01/19/2013 | 6,525 | 2,043 | 1,625 | |||||||||||||||
|
|
|
| |||||||||||||||||
| $ | 2,462 | $ | 1,987 | |||||||||||||||||
|
|
|
| |||||||||||||||||
| (h) | Written options outstanding on June 30, 2012: |
Foreign Currency Options
| Description | Counterparty | Exercise Price | Expiration Date | Notional Amount | Premium | Market Value | ||||||||||||||||||||||||
Put - OTC EUR versus USD | UAG | $ | 1.214 | 08/16/2012 | EUR | 17,315 | $ | 245 | $ | (74 | ) | |||||||||||||||||||
|
|
|
| |||||||||||||||||||||||||||
| 54 | PIMCO EQUITY SERIES | See Accompanying Notes |
Table of Contents
June 30, 2012
Options on Exchange-Traded Funds
| Description | Strike Price | Expiration Date | # of Contracts | Premium | Market Value | |||||||||||||||||||||
Put - CBOE iShares MSCI Emerging Markets Index Fund | $ | 32.000 | 09/22/2012 | 9,859 | $ | 601 | $ | (355 | ) | |||||||||||||||||
Put - CBOE iShares MSCI Emerging Markets Index Fund | 33.000 | 01/19/2013 | 6,525 | 1,201 | (920 | ) | ||||||||||||||||||||
|
|
|
| |||||||||||||||||||||||
| $ | 1,802 | $ | (1,275 | ) | ||||||||||||||||||||||
|
|
|
| |||||||||||||||||||||||
Options on Securities
| Description | Counterparty | Strike | Expiration Date | Notional Amount | Premium | Market Value | ||||||||||||||||||||||||||
Put - OTC NovaTek OAO | CBK | $ | 84.510 | 08/28/2012 | $ | 2,704 | $ | 140 | $ | (45 | ) | |||||||||||||||||||||
Put - OTC Turk Telekomunikasyon A/S | GST | TRY | 6.750 | 08/23/2012 | TRY | 60,687 | 108 | (31 | ) | |||||||||||||||||||||||
Call - OTC Turk Telekomunikasyon A/S | GST | 7.680 | 08/23/2012 | 121,375 | 29 | (185 | ) | |||||||||||||||||||||||||
|
|
|
| |||||||||||||||||||||||||||||
| $ | 277 | $ | (261 | ) | ||||||||||||||||||||||||||||
|
|
|
| |||||||||||||||||||||||||||||
Transactions in written call and put options for the period ended June 30, 2012:
| # of Contracts | Notional Amount in $ | Notional Amount in EUR | Notional Amount in TRY | Premium | ||||||||||||||||||||||||
Balance at 06/30/2011 | 0 | $ | 0 | EUR | 0 | TRY | 53,544 | $ | 132 | |||||||||||||||||||
Sales | 1,655,989 | 2,704 | 17,315 | 182,062 | 3,428 | |||||||||||||||||||||||
Closing Buys | (1,636,305 | ) | 0 | 0 | (53,544 | ) | (906 | ) | ||||||||||||||||||||
Expirations | 0 | 0 | 0 | 0 | 0 | |||||||||||||||||||||||
Exercised | (3,300 | ) | 0 | 0 | 0 | (330 | ) | |||||||||||||||||||||
|
|
|
|
|
|
|
|
|
|
|
|
|
| |||||||||||||||
Balance at 06/30/2012 | 16,384 | $ | 2,704 | EUR | 17,315 | TRY | 182,062 | $ | 2,324 | |||||||||||||||||||
|
|
|
|
|
|
|
|
|
|
|
|
|
| |||||||||||||||
| (i) | Foreign currency contracts outstanding on June 30, 2012: |
| Settlement Month | Currency to be Delivered | Currency to be Received | Counterparty | Unrealized Appreciation | Unrealized (Depreciation) | Net Unrealized Appreciation/ (Depreciation) | ||||||||||||||||||||||||
07/2012 | AUD | 243 | $ | 236 | BRC | $ | 0 | $ | (13 | ) | $ | (13 | ) | |||||||||||||||||
07/2012 | EUR | 6,954 | 9,198 | BRC | 397 | 0 | 397 | |||||||||||||||||||||||
07/2012 | 7,832 | 9,801 | CBK | 0 | (112 | ) | (112 | ) | ||||||||||||||||||||||
07/2012 | 259 | 331 | DUB | 3 | 0 | 3 | ||||||||||||||||||||||||
07/2012 | 6,646 | 8,675 | UAG | 264 | 0 | 264 | ||||||||||||||||||||||||
07/2012 | IDR | 19,816,404 | 2,095 | MSC | 0 | (14 | ) | (14 | ) | |||||||||||||||||||||
07/2012 | 19,816,404 | 2,089 | UAG | 0 | (21 | ) | (21 | ) | ||||||||||||||||||||||
07/2012 | ILS | 16,015 | 4,224 | BRC | 130 | 0 | 130 | |||||||||||||||||||||||
07/2012 | 13,414 | 3,497 | CBK | 68 | 0 | 68 | ||||||||||||||||||||||||
07/2012 | 67,028 | 17,374 | DUB | 237 | 0 | 237 | ||||||||||||||||||||||||
07/2012 | 11,570 | 3,069 | HUS | 111 | 0 | 111 | ||||||||||||||||||||||||
07/2012 | 19,641 | 5,107 | JPM | 85 | 0 | 85 | ||||||||||||||||||||||||
07/2012 | INR | 1,289,285 | 23,442 | HUS | 630 | (295 | ) | 335 | ||||||||||||||||||||||
07/2012 | 249,414 | 4,509 | JPM | 39 | 0 | 39 | ||||||||||||||||||||||||
07/2012 | KRW | 2,644,055 | 2,309 | BRC | 1 | 0 | 1 | |||||||||||||||||||||||
07/2012 | 3,418,260 | 2,999 | JPM | 16 | 0 | 16 | ||||||||||||||||||||||||
07/2012 | 2,139,340 | 1,813 | UAG | 0 | (54 | ) | (54 | ) | ||||||||||||||||||||||
07/2012 | NOK | 3,139 | 523 | BPS | 0 | (5 | ) | (5 | ) | |||||||||||||||||||||
07/2012 | 3,139 | 522 | HUS | 0 | (6 | ) | (6 | ) | ||||||||||||||||||||||
07/2012 | �� | 3,139 | 521 | UAG | 0 | (7 | ) | (7 | ) | |||||||||||||||||||||
07/2012 | PEN | 16,971 | 6,245 | BRC | 0 | (114 | ) | (114 | ) | |||||||||||||||||||||
07/2012 | THB | 14,258 | 447 | JPM | 0 | (2 | ) | (2 | ) | |||||||||||||||||||||
07/2012 | $ | 124 | EUR | 99 | BPS | 2 | 0 | 2 | ||||||||||||||||||||||
07/2012 | 360 | 289 | BRC | 6 | 0 | 6 | ||||||||||||||||||||||||
07/2012 | 1,724 | 1,389 | JPM | 34 | 0 | 34 | ||||||||||||||||||||||||
07/2012 | 19,602 | 15,608 | RBC | 152 | 0 | 152 | ||||||||||||||||||||||||
07/2012 | 2,265 | 1,807 | UAG | 22 | 0 | 22 | ||||||||||||||||||||||||
07/2012 | 2,089 | IDR | 19,816,404 | MSC | 21 | 0 | 21 | |||||||||||||||||||||||
07/2012 | 2,104 | 19,816,404 | UAG | 6 | 0 | 6 | ||||||||||||||||||||||||
07/2012 | 7,398 | ILS | 28,022 | BRC | 0 | (234 | ) | (234 | ) | |||||||||||||||||||||
07/2012 | 25,433 | 99,645 | HUS | 43 | 0 | 43 | ||||||||||||||||||||||||
07/2012 | 13,350 | INR | 748,935 | CBK | 73 | 0 | 73 | |||||||||||||||||||||||
07/2012 | 16,991 | 789,764 | JPM | 0 | (2,837 | ) | (2,837 | ) | ||||||||||||||||||||||
07/2012 | 33,902 | KRW | 38,270,765 | CBK | 0 | (502 | ) | (502 | ) | |||||||||||||||||||||
07/2012 | 18,433 | MYR | 56,850 | JPM | 0 | (492 | ) | (492 | ) | |||||||||||||||||||||
| See Accompanying Notes | ANNUAL REPORT | JUNE 30, 2012 | 55 |
Table of Contents
Schedule of Investments PIMCO EqSTM Emerging Markets Fund (Cont.)
| Settlement Month | Currency to be Delivered | Currency to be Received | Counterparty | Unrealized Appreciation | Unrealized (Depreciation) | Net Unrealized Appreciation/ (Depreciation) | ||||||||||||||||||||||||
07/2012 | $ | 6,419 | PEN | 16,971 | BRC | $ | 0 | $ | (60 | ) | $ | (60 | ) | |||||||||||||||||
07/2012 | 8,857 | ZAR | 69,439 | BRC | 0 | (392 | ) | (392 | ) | |||||||||||||||||||||
07/2012 | 2,270 | 17,238 | DUB | 0 | (168 | ) | (168 | ) | ||||||||||||||||||||||
07/2012 | ZAR | 17,238 | $ | 2,049 | DUB | 0 | (52 | ) | (52 | ) | ||||||||||||||||||||
07/2012 | 1,918 | 225 | HUS | 0 | (8 | ) | (8 | ) | ||||||||||||||||||||||
07/2012 | 30,356 | 3,821 | UAG | 120 | 0 | 120 | ||||||||||||||||||||||||
08/2012 | CZK | 82,872 | 4,401 | UAG | 292 | 0 | 292 | |||||||||||||||||||||||
08/2012 | DKK | 31,950 | 5,492 | HUS | 46 | 0 | 46 | |||||||||||||||||||||||
08/2012 | HUF | 1,483,482 | 6,756 | BRC | 224 | 0 | 224 | |||||||||||||||||||||||
08/2012 | MXN | 97,603 | 7,100 | UAG | 0 | (186 | ) | (186 | ) | |||||||||||||||||||||
08/2012 | THB | 152,522 | 4,776 | JPM | 0 | (16 | ) | (16 | ) | |||||||||||||||||||||
08/2012 | $ | 22,960 | BRL | 44,891 | BRC | 0 | (753 | ) | (753 | ) | ||||||||||||||||||||
08/2012 | 30,186 | MXN | 408,917 | HUS | 341 | 0 | 341 | |||||||||||||||||||||||
08/2012 | 48 | 661 | UAG | 1 | 0 | 1 | ||||||||||||||||||||||||
08/2012 | 8,005 | PLN | 25,557 | BRC | 0 | (373 | ) | (373 | ) | |||||||||||||||||||||
09/2012 | CAD | 500 | $ | 486 | UAG | 0 | (4 | ) | (4 | ) | ||||||||||||||||||||
09/2012 | EUR | 5,730 | 7,149 | CBK | 0 | (107 | ) | (107 | ) | |||||||||||||||||||||
09/2012 | GBP | 450 | 701 | BPS | 0 | (3 | ) | (3 | ) | |||||||||||||||||||||
09/2012 | 7,545 | 11,746 | BRC | 0 | (69 | ) | (69 | ) | ||||||||||||||||||||||
09/2012 | 51 | 80 | FBF | 0 | 0 | 0 | ||||||||||||||||||||||||
09/2012 | 128 | 201 | JPM | 0 | 0 | 0 | ||||||||||||||||||||||||
09/2012 | 32 | 50 | MSC | 0 | 0 | 0 | ||||||||||||||||||||||||
09/2012 | 414 | 648 | RBC | 0 | 0 | 0 | ||||||||||||||||||||||||
09/2012 | JPY | 802,950 | 10,262 | BPS | 208 | 0 | 208 | |||||||||||||||||||||||
09/2012 | RUB | 513,146 | 15,451 | GSC | 0 | (150 | ) | (150 | ) | |||||||||||||||||||||
09/2012 | 276,302 | 8,350 | JPM | 0 | (51 | ) | (51 | ) | ||||||||||||||||||||||
09/2012 | $ | 5,315 | RUB | 175,873 | HUS | 32 | 0 | 32 | ||||||||||||||||||||||
10/2012 | ILS | 99,645 | $ | 25,352 | HUS | 0 | (46 | ) | (46 | ) | ||||||||||||||||||||
10/2012 | $ | 2,110 | ILS | 8,350 | CBK | 19 | 0 | 19 | ||||||||||||||||||||||
10/2012 | 12,895 | INR | 748,935 | HUS | 371 | 0 | 371 | |||||||||||||||||||||||
11/2012 | 24,874 | TWD | 734,585 | JPM | 0 | (104 | ) | (104 | ) | |||||||||||||||||||||
12/2012 | PEN | 16,971 | $ | 6,383 | BRC | 72 | 0 | 72 | ||||||||||||||||||||||
01/2013 | $ | 2,023 | IDR | 19,816,404 | MSC | 29 | 0 | 29 | ||||||||||||||||||||||
|
|
|
|
|
| |||||||||||||||||||||||||
| $ | 4,095 | $ | (7,250 | ) | $ | (3,155 | ) | |||||||||||||||||||||||
|
|
|
|
|
| |||||||||||||||||||||||||
| (j) | Fair Value Measurements (1) |
The following is a summary of the fair valuations according to the inputs used as of June 30, 2012 in valuing the Fund’s assets and liabilities (2):
| Category and Subcategory (3) | Level 1 (4) | Level 2 (5) | Level 3 (6) | Fair Value at 06/30/2012 | ||||||||||||
Investments, at value | ||||||||||||||||
Common Stocks | ||||||||||||||||
Bermuda | ||||||||||||||||
Energy | $ | 0 | $ | 2,687 | $ | 0 | $ | 2,687 | ||||||||
Brazil | ||||||||||||||||
Consumer Discretionary | 7,923 | 0 | 0 | 7,923 | ||||||||||||
Consumer Staples | 10,781 | 0 | 0 | 10,781 | ||||||||||||
Financials | 11,100 | 0 | 0 | 11,100 | ||||||||||||
Health Care | 1,492 | 0 | 0 | 1,492 | ||||||||||||
Canada | ||||||||||||||||
Energy | 3,646 | 0 | 0 | 3,646 | ||||||||||||
Materials | 4,422 | 0 | 0 | 4,422 | ||||||||||||
China | ||||||||||||||||
Consumer Staples | 0 | 7,670 | 0 | 7,670 | ||||||||||||
Financials | 0 | 10,967 | 0 | 10,967 | ||||||||||||
Industrials | 0 | 13,901 | 0 | 13,901 | ||||||||||||
Information Technology | 3,395 | 0 | 0 | 3,395 | ||||||||||||
Materials | 0 | 9,315 | 0 | 9,315 | ||||||||||||
Cyprus | ||||||||||||||||
Industrials | 4,207 | 0 | 0 | 4,207 | ||||||||||||
Czech Republic | ||||||||||||||||
Utilities | 5,988 | 0 | 0 | 5,988 | ||||||||||||
Denmark | ||||||||||||||||
Consumer Staples | 0 | 6,549 | 0 | 6,549 | ||||||||||||
| Category and Subcategory (3) | Level 1 (4) | Level 2 (5) | Level 3 (6) | Fair Value at 06/30/2012 | ||||||||||||
Hong Kong | ||||||||||||||||
Consumer Discretionary | $ | 4,555 | $ | 0 | $ | 0 | $ | 4,555 | ||||||||
Consumer Staples | 0 | 7,102 | 0 | 7,102 | ||||||||||||
Financials | 0 | 19,194 | 0 | 19,194 | ||||||||||||
Industrials | 0 | 3,258 | 0 | 3,258 | ||||||||||||
Information Technology | 0 | 0 | 2,983 | 2,983 | ||||||||||||
Telecommunication Services | 0 | 15,936 | 0 | 15,936 | ||||||||||||
India | ||||||||||||||||
Financials | 0 | 10,171 | 0 | 10,171 | ||||||||||||
Industrials | 0 | 1,368 | 0 | 1,368 | ||||||||||||
Information Technology | 0 | 1,475 | 0 | 1,475 | ||||||||||||
Telecommunication Services | 0 | 658 | 0 | 658 | ||||||||||||
Israel | ||||||||||||||||
Health Care | 7,343 | 0 | 0 | 7,343 | ||||||||||||
Materials | 0 | 11,167 | 0 | 11,167 | ||||||||||||
Telecommunication Services | 0 | 5,145 | 0 | 5,145 | ||||||||||||
Italy | ||||||||||||||||
Consumer Discretionary | 0 | 5,291 | 0 | 5,291 | ||||||||||||
Japan | ||||||||||||||||
Consumer Discretionary | 0 | 9,697 | 0 | 9,697 | ||||||||||||
Kazakhstan | ||||||||||||||||
Energy | 6,845 | 0 | 0 | 6,845 | ||||||||||||
Macau | ||||||||||||||||
Consumer Discretionary | 0 | 6,423 | 0 | 6,423 | ||||||||||||
| 56 | PIMCO EQUITY SERIES | See Accompanying Notes |
Table of Contents
June 30, 2012
| Category and Subcategory (3) | Level 1 (4) | Level 2 (5) | Level 3 (6) | Fair Value at 06/30/2012 | ||||||||||||
Mexico | ||||||||||||||||
Consumer Discretionary | $ | 3,180 | $ | 0 | $ | 0 | $ | 3,180 | ||||||||
Consumer Staples | 3,785 | 0 | 0 | 3,785 | ||||||||||||
Netherlands | ||||||||||||||||
Energy | 0 | 2,631 | 0 | 2,631 | ||||||||||||
Peru | ||||||||||||||||
Financials | 9,244 | 0 | 0 | 9,244 | ||||||||||||
Philippines | ||||||||||||||||
Utilities | 0 | 8,873 | 0 | 8,873 | ||||||||||||
Qatar | ||||||||||||||||
Financials | 0 | 4,144 | 0 | 4,144 | ||||||||||||
Russia | ||||||||||||||||
Consumer Staples | 0 | 7,450 | 0 | 7,450 | ||||||||||||
Energy | 0 | 7,173 | 0 | 7,173 | ||||||||||||
Industrials | 3,752 | 0 | 0 | 3,752 | ||||||||||||
Materials | 3,673 | 5,091 | 0 | 8,764 | ||||||||||||
Singapore | ||||||||||||||||
Energy | 0 | 4,628 | 0 | 4,628 | ||||||||||||
Industrials | 0 | 1,334 | 0 | 1,334 | ||||||||||||
South Africa | ||||||||||||||||
Consumer Staples | 6,396 | 5,600 | 0 | 11,996 | ||||||||||||
Materials | 8,852 | 557 | 0 | 9,409 | ||||||||||||
Telecommunication Services | 0 | 984 | 0 | 984 | ||||||||||||
South Korea | ||||||||||||||||
Consumer Discretionary | 0 | 9,545 | 0 | 9,545 | ||||||||||||
Financials | 0 | 2,416 | 0 | 2,416 | ||||||||||||
Industrials | 0 | 3,935 | 0 | 3,935 | ||||||||||||
Information Technology | 0 | 1,320 | 0 | 1,320 | ||||||||||||
Materials | 0 | 4,747 | 0 | 4,747 | ||||||||||||
Taiwan | ||||||||||||||||
Financials | 0 | 3,218 | 0 | 3,218 | ||||||||||||
Information Technology | 0 | 19,837 | 0 | 19,837 | ||||||||||||
Thailand | ||||||||||||||||
Consumer Staples | 4,281 | 0 | 0 | 4,281 | ||||||||||||
Financials | 0 | 5,576 | 0 | 5,576 | ||||||||||||
Industrials | 0 | 5,025 | 0 | 5,025 | ||||||||||||
Turkey | ||||||||||||||||
Telecommunication Services | 0 | 6,308 | 0 | 6,308 | ||||||||||||
United Kingdom | ||||||||||||||||
Consumer Staples | 0 | 5,681 | 0 | 5,681 | ||||||||||||
Energy | 0 | 6,247 | 0 | 6,247 | ||||||||||||
Materials | 0 | 4,331 | 0 | 4,331 | ||||||||||||
| Level 1 (4) | Level 2 (5) | Level 3 (6) | Fair Value at 06/30/2012 | |||||||||||||
Equity-Linked Securities | ||||||||||||||||
India | ||||||||||||||||
Financials | $ | 0 | $ | 2,002 | $ | 0 | $ | 2,002 | ||||||||
Industrials | 0 | 2,447 | 0 | 2,447 | ||||||||||||
Telecommunication Services | 0 | 124 | 0 | 124 | ||||||||||||
Nigeria | ||||||||||||||||
Consumer Staples | 0 | 2,842 | 0 | 2,842 | ||||||||||||
Exchange-Traded Funds | ||||||||||||||||
Hong Kong | 7,171 | 0 | 0 | 7,171 | ||||||||||||
Luxembourg | 2,878 | 0 | 0 | 2,878 | ||||||||||||
United States | 13,435 | 0 | 0 | 13,435 | ||||||||||||
Preferred Stocks | ||||||||||||||||
Brazil | ||||||||||||||||
Industrials | 1,374 | 0 | 0 | 1,374 | ||||||||||||
South Korea | ||||||||||||||||
Industrials | 0 | 30,594 | 0 | 30,594 | ||||||||||||
Rights | ||||||||||||||||
Canada | ||||||||||||||||
Materials | 421 | 0 | 0 | 421 | ||||||||||||
Short-Term Instruments | ||||||||||||||||
Repurchase Agreements | 0 | 524 | 0 | 524 | ||||||||||||
U.S. Treasury Bills | 0 | 7,408 | 0 | 7,408 | ||||||||||||
PIMCO Short-Term Floating NAV Portfolio | 52,486 | 0 | 0 | 52,486 | ||||||||||||
Purchased Options | ||||||||||||||||
Equity Contracts | 1,987 | 0 | 0 | 1,987 | ||||||||||||
Foreign Exchange Contracts | 0 | 381 | 0 | 381 | ||||||||||||
| $ | 194,612 | $ | 320,947 | $ | 2,983 | $ | 518,542 | |||||||||
Financial Derivative Instruments (7) - Assets |
| |||||||||||||||
Credit Contracts | 0 | 38 | 0 | 38 | ||||||||||||
Equity Contracts | 0 | 2,203 | 0 | 2,203 | ||||||||||||
Foreign Exchange Contracts | 0 | 4,095 | 0 | 4,095 | ||||||||||||
| $ | 0 | $ | 6,336 | $ | 0 | $ | 6,336 | |||||||||
Financial Derivative Instruments (7) - Liabilities |
| |||||||||||||||
Equity Contracts | (1,275 | ) | (1,179 | ) | 0 | (2,454 | ) | |||||||||
Foreign Exchange Contracts | 0 | (7,324 | ) | 0 | (7,324 | ) | ||||||||||
| $ | (1,275 | ) | $ | (8,503 | ) | $ | 0 | $ | (9,778 | ) | ||||||
Totals | $ | 193,337 | $ | 318,780 | $ | 2,983 | $ | 515,100 | ||||||||
The following is a reconciliation of the fair valuations using significant unobservable inputs (Level 3) for the Fund during the period ended June 30, 2012:
| Category and Subcategory (3) | Beginning Balance at 06/30/2011 | Net Purchases | Net Sales | Accrued Discounts/ (Premiums) | Realized Gain/(Loss) | Net Change in Unrealized Appreciation/ (Depreciation) (8) | Transfers into Level 3 | Transfers out of Level 3 | Ending Balance at 06/30/2012 | Net Change in Unrealized Appreciation/ (Depreciation) on Investments Held at 06/30/2012 (8) | ||||||||||||||||||||||||||||||
Investments, at value |
| |||||||||||||||||||||||||||||||||||||||
Common Stocks | ||||||||||||||||||||||||||||||||||||||||
Hong Kong | ||||||||||||||||||||||||||||||||||||||||
Information Technology | $ | 0 | $ | 0 | $ | 0 | $ | 0 | $ | 0 | $ | 0 | $ | 2,983 | $ | 0 | $ | 2,983 | $ | 0 | ||||||||||||||||||||
|
|
|
|
|
|
|
|
|
|
|
|
|
|
|
|
|
|
|
| |||||||||||||||||||||
| (1) | See note 3 in the Notes to Financial Statements for more information regarding pricing inputs and valuation techniques. |
| (2) | There were no significant transfers into or out of level 1, 2, and 3 during the period ended June 30, 2012. |
| (3) | Refer to the Schedule of Investments for additional information. |
| (4) | Quoted prices in active markets for identical investments. |
| (5) | Significant other observable inputs. |
| (6) | Significant unobservable inputs. |
| (7) | Financial Derivative Instruments may include open futures contracts, swap agreements, written options, and foreign currency contracts. |
| (8) | Any difference between Net Change in Unrealized Appreciation/(Depreciation) and Net Change in Unrealized Appreciation/(Depreciation) on Investments Held at June 30, 2012 may be due to an investment no longer held or categorized as level 3 at period end. |
| See Accompanying Notes | ANNUAL REPORT | JUNE 30, 2012 | 57 |
Table of Contents
Schedule of Investments PIMCO EqSTM Emerging Markets Fund (Cont.)
June 30, 2012
| (k) | Fair Value of Financial Derivative Instruments (1) |
The following is a summary of the fair valuation of the Fund’s derivative instruments categorized by risk exposure:
Fair Values of Financial Derivative Instruments on the Statements of Assets and Liabilities as of June 30, 2012:
| Derivatives not accounted for as hedging instruments | ||||||||||||||||||||||||
| Commodity Contracts | Credit Contracts | Equity Contracts | Foreign Exchange Contracts | Interest Rate Contracts | Total | |||||||||||||||||||
Assets: | ||||||||||||||||||||||||
Investments, at value (purchased options) | $ | 0 | $ | 0 | $ | 1,987 | $ | 381 | $ | 0 | $ | 2,368 | ||||||||||||
Unrealized appreciation on foreign currency contracts | 0 | 0 | 0 | 4,095 | 0 | 4,095 | ||||||||||||||||||
Unrealized appreciation on OTC swap agreements | 0 | 38 | 2,203 | 0 | 0 | 2,241 | ||||||||||||||||||
|
|
|
|
|
|
|
|
|
|
|
| |||||||||||||
| $ | 0 | $ | 38 | $ | 4,190 | $ | 4,476 | $ | 0 | $ | 8,704 | |||||||||||||
|
|
|
|
|
|
|
|
|
|
|
| |||||||||||||
Liabilities: | ||||||||||||||||||||||||
Written options outstanding | $ | 0 | $ | 0 | $ | 1,536 | $ | 74 | $ | 0 | $ | 1,610 | ||||||||||||
Unrealized depreciation on foreign currency contracts | 0 | 0 | 0 | 7,250 | 0 | 7,250 | ||||||||||||||||||
Unrealized depreciation on OTC swap agreements | 0 | 0 | 918 | 0 | 0 | 918 | ||||||||||||||||||
|
|
|
|
|
|
|
|
|
|
|
| |||||||||||||
| $ | 0 | $ | 0 | $ | 2,454 | $ | 7,324 | $ | 0 | $ | 9,778 | |||||||||||||
|
|
|
|
|
|
|
|
|
|
|
| |||||||||||||
The Effect of Financial Derivative Instruments on the Statements of Operations for the Period Ended June 30, 2012:
| Derivatives not accounted for as hedging instruments | ||||||||||||||||||||||||
| Commodity Contracts | Credit Contracts | Equity Contracts | Foreign Exchange Contracts | Interest Rate Contracts | Total | |||||||||||||||||||
Realized Gain (Loss) on Derivatives Recognized as a Result from Operations: | ||||||||||||||||||||||||
Net realized (loss) on investments (purchased options) | $ | 0 | $ | 0 | $ | (3,215 | ) | $ | (516 | ) | $ | 0 | $ | (3,731 | ) | |||||||||
Net realized (loss) on futures contracts | 0 | 0 | (601 | ) | 0 | 0 | (601 | ) | ||||||||||||||||
Net realized gain on written options | 0 | 0 | 885 | 0 | 0 | 885 | ||||||||||||||||||
Net realized (loss) on swaps | 0 | (31 | ) | (20,162 | ) | 0 | 0 | (20,193 | ) | |||||||||||||||
Net realized (loss) on foreign currency transactions | 0 | 0 | 0 | (1,464 | ) | 0 | (1,464 | ) | ||||||||||||||||
|
|
|
|
|
|
|
|
|
|
|
| |||||||||||||
| $ | 0 | $ | (31 | ) | $ | (23,093 | ) | $ | (1,980 | ) | $ | 0 | $ | (25,104 | ) | |||||||||
|
|
|
|
|
|
|
|
|
|
|
| |||||||||||||
Net Change in Unrealized Appreciation (Depreciation) on Derivatives Recognized as a Result of Operations: | ||||||||||||||||||||||||
Net change in unrealized appreciation (depreciation) on investments (purchased options) | $ | 0 | $ | 0 | $ | 142 | $ | (6 | ) | $ | 0 | $ | 136 | |||||||||||
Net change in unrealized (depreciation) on futures contracts | 0 | 0 | (185 | ) | 0 | 0 | (185 | ) | ||||||||||||||||
Net change in unrealized appreciation on written options | 0 | 0 | 537 | 171 | 0 | 708 | ||||||||||||||||||
Net change in unrealized appreciation (depreciation) on swaps | 0 | 41 | (1,430 | ) | 0 | 0 | (1,389 | ) | ||||||||||||||||
Net change in unrealized (depreciation) on translation of assets and liabilities denominated in foreign currencies | 0 | 0 | 0 | (3,953 | ) | 0 | (3,953 | ) | ||||||||||||||||
|
|
|
|
|
|
|
|
|
|
|
| |||||||||||||
| $ | 0 | $ | 41 | $ | (936 | ) | $ | (3,788 | ) | $ | 0 | $ | (4,683 | ) | ||||||||||
|
|
|
|
|
|
|
|
|
|
|
| |||||||||||||
| (1) | See note 6 in the Notes to Financial Statements for additional information. |
| (l) | Collateral (Received)/Pledged for OTC Financial Derivative Instruments |
The following is a summary by counterparty of the market value of OTC financial derivative instruments and collateral (received)/pledged as of June 30, 2012:
| Counterparty | Total Market Value of OTC Derivatives | Collateral (Received)/Pledged | Net Exposures (1) | |||||||||
BOA | $ | 217 | $ | 0 | $ | 217 | ||||||
BPS | 215 | (260 | ) | (45 | ) | |||||||
BRC | (1,178 | ) | 1,934 | 757 | ||||||||
CBK | (605 | ) | 1,279 | 674 | ||||||||
DUB | 20 | 0 | 20 | |||||||||
FBF | (15 | ) | 0 | (15 | ) | |||||||
GSC | (150 | ) | 0 | (150 | ) | |||||||
GST | (54 | ) | (390 | ) | (444 | ) | ||||||
HUS | 1,219 | (670 | ) | 549 | ||||||||
JPM | (3,394 | ) | 4,196 | 802 | ||||||||
MSC | 36 | (310 | ) | (274 | ) | |||||||
MSX | 0 | (85 | ) | (85 | ) | |||||||
MYI | 812 | (250 | ) | 562 | ||||||||
RBC | 152 | 0 | 152 | |||||||||
UAG | 740 | (1,590 | ) | (850 | ) | |||||||
ULO | 174 | 0 | 174 | |||||||||
| (1) | Net Exposure represents the net receivable/(payable) that would be due from/to the counterparty in the event of default. See note 7, Principal Risks, in the Notes to Financial Statements for more information regarding credit and counterparty risks. |
| 58 | PIMCO EQUITY SERIES | See Accompanying Notes |
Table of Contents
Schedule of Investments PIMCO EqSTM Long/Short Fund
June 30, 2012
| SHARES | MARKET VALUE (000S) | |||||||||||
| COMMON STOCKS 42.0% | ||||||||||||
BERMUDA 1.3% |
| |||||||||||
| FINANCIALS 1.3% | ||||||||||||
Enstar Group Ltd. (a) | 28,199 | $ | 2,790 | |||||||||
|
| |||||||||||
Total Bermuda | 2,790 | |||||||||||
|
| |||||||||||
| BRAZIL 0.5% | ||||||||||||
| CONSUMER STAPLES 0.5% | ||||||||||||
Brazil Pharma S.A. | 190,000 | 1,017 | ||||||||||
|
| |||||||||||
Total Brazil | 1,017 | |||||||||||
|
| |||||||||||
| UNITED STATES 40.2% | ||||||||||||
| CONSUMER DISCRETIONARY 11.8% | ||||||||||||
Biglari Holdings, Inc. (a) | 10,810 | 4,177 | ||||||||||
Charter Communications, Inc. (a) | 100,000 | 7,087 | ||||||||||
Domino’s Pizza, Inc. | 200,000 | 6,182 | ||||||||||
Family Dollar Stores, Inc. | 16,000 | 1,061 | ||||||||||
Harman International Industries, Inc. | 170,000 | 6,732 | ||||||||||
|
| |||||||||||
| 25,239 | ||||||||||||
|
| |||||||||||
| FINANCIALS 0.7% | ||||||||||||
Zillow, Inc. (a) | 40,000 | 1,545 | ||||||||||
|
| |||||||||||
| SHARES | MARKET VALUE (000S) | |||||||||||
| HEALTH CARE 5.8% | ||||||||||||
McKesson Corp. | 130,995 | $ | 12,281 | |||||||||
|
| |||||||||||
| INDUSTRIALS 14.7% | ||||||||||||
Corrections Corp. of America | 160,000 | 4,712 | ||||||||||
Portfolio Recovery Associates, Inc. (a) | 80,000 | 7,301 | ||||||||||
Spirit Airlines, Inc. (a) | 749,000 | 14,575 | ||||||||||
Titan Machinery, Inc. (a) | 135,000 | 4,100 | ||||||||||
United Rentals, Inc. (a) | 20,000 | 680 | ||||||||||
|
| |||||||||||
| 31,368 | ||||||||||||
|
| |||||||||||
| INFORMATION TECHNOLOGY 7.2% | ||||||||||||
Apple, Inc. (a) | 26,400 | 15,418 | ||||||||||
|
| |||||||||||
Total United States | 85,851 | |||||||||||
|
| |||||||||||
Total Common Stocks (Cost $86,818) | 89,658 | |||||||||||
|
| |||||||||||
| EXCHANGE-TRADED FUNDS 2.2% | ||||||||||||
| UNITED STATES 2.2% | ||||||||||||
SPDR Gold Trust | 30,000 | 4,656 | ||||||||||
|
| |||||||||||
Total Exchange-Traded Funds | 4,656 | |||||||||||
|
| |||||||||||
| PRINCIPAL AMOUNT (000S) | MARKET VALUE (000S) | |||||||||||
| SHORT-TERM INSTRUMENTS 55.0% | ||||||||||||
| REPURCHASE AGREEMENTS 0.3% | ||||||||||||
State Street Bank and Trust Co. |
| |||||||||||
0.010% due 07/02/2012 | $ | 609 | $ | 609 | ||||||||
|
| |||||||||||
(Dated 06/29/2012. Collateralized by U.S. Treasury Notes 2.000% due 11/15/2021 valued at $623. Repurchase proceeds are $609.) | ||||||||||||
| U.S. TREASURY BILLS 25.8% | ||||||||||||
0.182% due 04/04/2013 - 06/27/2013 (b)(d) | 55,230 | 55,139 | ||||||||||
|
| |||||||||||
| SHARES | ||||||||||||
| PIMCO SHORT-TERM FLOATING NAV PORTFOLIO (c) 28.9% | ||||||||||||
PIMCO Short-Term Floating NAV Portfolio | 6,159,445 | 61,718 | ||||||||||
|
| |||||||||||
Total Short-Term Instruments | 117,466 | |||||||||||
|
| |||||||||||
| Total Investments 99.2% (Cost $208,988) | $ | 211,780 | ||||||||||
| Securities Sold Short (e) (11.3%) (Proceeds $23,644) | (24,215 | ) | ||||||||||
| Other Assets and Liabilities (Net) 12.1% | 26,057 | |||||||||||
|
| |||||||||||
| Net Assets 100.0% | $ | 213,622 | ||||||||||
|
| |||||||||||
Notes to Schedule of Investments (amounts in thousands*, except number of shares):
| * | A zero balance may reflect actual amounts rounding to less than one thousand. |
| (a) | Non-income producing security. |
| (b) | Coupon represents a weighted average yield to maturity. |
| (c) | Affiliated to the Fund. |
| (d) | Securities with an aggregate market value of $12,628 and cash of $26,111 have been pledged as collateral as of June 30, 2012 for equity options, equity short sales, and other transactions in accordance with prime brokerage arrangements. |
| (e) | Short sales outstanding on June 30, 2012: |
| Description | Shares | Proceeds | Market Value (1) | |||||||||
Activision Blizzard, Inc. | 25,000 | $ | 291 | $ | (300 | ) | ||||||
Avon Products, Inc. | 130,000 | 2,025 | (2,107 | ) | ||||||||
Boston Beer Co., Inc. ‘A’ | 32,026 | 3,383 | (3,875 | ) | ||||||||
CH Robinson Worldwide, Inc. | 70,000 | 4,096 | (4,097 | ) | ||||||||
Expeditors International of Washington, Inc. | 30,000 | 1,148 | (1,163 | ) | ||||||||
FLIR Systems, Inc. | 54,000 | 1,060 | (1,053 | ) | ||||||||
Hanesbrands, Inc. | 40,000 | 1,096 | (1,109 | ) | ||||||||
Healthcare Services Group, Inc. | 17,000 | 315 | (329 | ) | ||||||||
JC Penney Co., Inc. | 60,000 | 1,380 | (1,399 | ) | ||||||||
OpenTable, Inc. | 17,000 | 755 | (765 | ) | ||||||||
Scotts Miracle-Gro Co. ‘A’ | 72,000 | 2,785 | (2,961 | ) | ||||||||
Sturm Ruger & Co., Inc. | 30,000 | 1,114 | (1,205 | ) | ||||||||
Thor Industries, Inc. | 140,000 | 4,196 | (3,852 | ) | ||||||||
|
|
|
| |||||||||
| $ | 23,644 | $ | (24,215 | ) | ||||||||
|
|
|
| |||||||||
| (1) | Market value includes $15 of dividends payable on short sales. Individual short sales may have been part of a hedging strategy rather than fundamental, stand-alone investment positions. |
| (f) | Foreign currency contracts outstanding on June 30, 2012: |
| Settlement Month | Currency to be Delivered | Currency to be Received | Counterparty | Unrealized Appreciation | Unrealized (Depreciation) | Net Unrealized Appreciation/ (Depreciation) | ||||||||||||||||||||
08/2012 | BRL | 1,404 | $ | 718 | BRC | $ | 24 | $ | 0 | $ | 24 | |||||||||||||||
|
|
|
|
|
| |||||||||||||||||||||
| See Accompanying Notes | ANNUAL REPORT | JUNE 30, 2012 | 59 |
Table of Contents
Schedule of Investments PIMCO EqSTM Long/Short Fund (Cont.)
June 30, 2012
| (g) | Fair Value Measurements (1) |
The following is a summary of the fair valuations according to the inputs used as of June 30, 2012 in valuing the Fund’s assets and liabilities (2):
| Category and Subcategory (3) | Level 1 (4) | Level 2 (5) | Level 3 (6) | Fair Value at 06/30/2012 | ||||||||||||
Investments, at value | ||||||||||||||||
Common Stocks | ||||||||||||||||
Bermuda | ||||||||||||||||
Financials | $ | 2,790 | $ | 0 | $ | 0 | $ | 2,790 | ||||||||
Brazil | ||||||||||||||||
Consumer Staples | 1,017 | 0 | 0 | 1,017 | ||||||||||||
United States | ||||||||||||||||
Consumer Discretionary | 25,239 | 0 | 0 | 25,239 | ||||||||||||
Financials | 1,545 | 0 | 0 | 1,545 | ||||||||||||
Health Care | 12,281 | 0 | 0 | 12,281 | ||||||||||||
Industrials | 31,368 | 0 | 0 | 31,368 | ||||||||||||
Information Technology | 15,418 | 0 | 0 | 15,418 | ||||||||||||
Exchange-Traded Funds | ||||||||||||||||
United States | 4,656 | 0 | 0 | 4,656 | ||||||||||||
| Category and Subcategory (3) | Level 1 (4) | Level 2 (5) | Level 3 (6) | Fair Value at 06/30/2012 | ||||||||||||
Short-Term Instruments | ||||||||||||||||
Repurchase Agreements | $ | 0 | $ | 609 | $ | 0 | $ | 609 | ||||||||
U.S. Treasury Bills | 0 | 55,139 | 0 | 55,139 | ||||||||||||
PIMCO Short-Term Floating NAV Portfolio | 61,718 | 0 | 0 | 61,718 | ||||||||||||
| $ | 156,032 | $ | 55,748 | $ | 0 | $ | 211,780 | |||||||||
Short Sales, at value | $ | (24,215 | ) | $ | 0 | $ | 0 | $ | (24,215 | ) | ||||||
Financial Derivative Instruments (7) - Assets |
| |||||||||||||||
Foreign Exchange Contracts | $ | 0 | $ | 24 | $ | 0 | $ | 24 | ||||||||
Totals | $ | 131,817 | $ | 55,772 | $ | 0 | $ | 187,589 | ||||||||
| (1) | See note 3 in the Notes to Financial Statements for more information regarding pricing inputs and valuation techniques. |
| (2) | There were no significant transfers into or out of level 1, 2, and 3 during the period ended June 30, 2012. |
| (3) | Refer to the Schedule of Investments for additional information. |
| (4) | Quoted prices in active markets for identical investments. |
| (5) | Significant other observable inputs. |
| (6) | Significant unobservable inputs. |
| (7) | Financial Derivative Instruments may include open futures contracts, swap agreements, written options, and foreign currency contracts. |
| (h) | Fair Value of Financial Derivative Instruments (1) |
The following is a summary of the fair valuation of the Fund’s derivative instruments categorized by risk exposure:
Fair Values of Financial Derivative Instruments on the Statements of Assets and Liabilities as of June 30, 2012:
| Derivatives not accounted for as hedging instruments | ||||||||||||||||||||||||
| Commodity Contracts | Credit Contracts | Equity Contracts | Foreign Exchange Contracts | Interest Rate Contracts | Total | |||||||||||||||||||
Assets: | ||||||||||||||||||||||||
Unrealized appreciation on foreign currency contracts | $ | 0 | $ | 0 | $ | 0 | $ | 24 | $ | 0 | $ | 24 | ||||||||||||
|
|
|
|
|
|
|
|
|
|
|
| |||||||||||||
The Effect of Financial Derivative Instruments on the Statements of Operations for the Period Ended June 30, 2012:
| Derivatives not accounted for as hedging instruments | ||||||||||||||||||||||||
| Commodity Contracts | Credit Contracts | Equity Contracts | Foreign Exchange Contracts | Interest Rate Contracts | Total | |||||||||||||||||||
Realized Gain on Derivatives Recognized as a Result from Operations: | ||||||||||||||||||||||||
Net realized gain on investments (purchased options) | $ | 0 | $ | 0 | $ | 11 | $ | 0 | $ | 0 | $ | 11 | ||||||||||||
Net realized gain on foreign currency transactions | 0 | 0 | 0 | 27 | 0 | 27 | ||||||||||||||||||
|
|
|
|
|
|
|
|
|
|
|
| |||||||||||||
| $ | 0 | $ | 0 | $ | 11 | $ | 27 | $ | 0 | $ | 38 | |||||||||||||
|
|
|
|
|
|
|
|
|
|
|
| |||||||||||||
Net Change in Unrealized Appreciation on Derivatives Recognized as a Result of Operations: | ||||||||||||||||||||||||
Net change in unrealized appreciation on translation of assets and liabilities denominated in foreign currencies | $ | 0 | $ | 0 | $ | 0 | $ | 24 | $ | 0 | $ | 24 | ||||||||||||
|
|
|
|
|
|
|
|
|
|
|
| |||||||||||||
| (1) | See note 6 in the Notes to Financial Statements for additional information. |
| (i) | Collateral (Received)/Pledged for OTC Financial Derivative Instruments |
The following is a summary by counterparty of the market value of OTC financial derivative instruments and collateral (received)/pledged as of June 30, 2012:
| Counterparty | Total Market Value of OTC Derivatives | Collateral (Received)/Pledged | Net Exposures (1) | |||||||||
BRC | $ | 24 | $ | 0 | $ | 24 | ||||||
| (1) | Net Exposure represents the net receivable/(payable) that would be due from/to the counterparty in the event of default. See note 7, Principal Risks, in the Notes to Financial Statements for more information regarding credit and counterparty risks. |
| 60 | PIMCO EQUITY SERIES | See Accompanying Notes |
Table of Contents
Consolidated Schedule of Investments PIMCO Emerging Multi-Asset Fund
June 30, 2012
| SHARES | MARKET VALUE (000S) | |||||||||||
| COMMON STOCKS 0.7% | ||||||||||||
| ISRAEL 0.7% | ||||||||||||
| HEALTH CARE 0.7% | ||||||||||||
Teva Pharmaceutical Industries Ltd. SP - ADR | 9,582 | $ | 378 | |||||||||
|
| |||||||||||
Total Common Stocks | 378 | |||||||||||
|
| |||||||||||
| EXCHANGE-TRADED FUNDS 5.7% | ||||||||||||
| UNITED STATES 5.7% | ||||||||||||
Vanguard MSCI Emerging Markets ETF | 72,070 | 2,879 | ||||||||||
|
| |||||||||||
Total Exchange-Traded Funds | 2,879 | |||||||||||
|
| |||||||||||
| MUTUAL FUNDS (a)(b) 82.0% | ||||||||||||
| UNITED STATES 82.0% | ||||||||||||
PIMCO CommoditiesPLUS® Strategy Fund | 43,941 | 436 | ||||||||||
PIMCO Emerging Local Bond Fund | 1,159,375 | 12,185 | ||||||||||
| SHARES | MARKET VALUE (000S) | |||||||||||
PIMCO Emerging Markets Bond Fund | 707,896 | $ | 8,304 | |||||||||
PIMCO Emerging Markets Corporate Bond Fund | 128,819 | 1,472 | ||||||||||
PIMCO Emerging Markets Currency Fund | 75,756 | 772 | ||||||||||
PIMCO EqSTM Emerging Markets Fund | 2,335,992 | 18,618 | ||||||||||
|
| |||||||||||
Total Mutual Funds (Cost $44,853) |
| 41,787 | ||||||||||
|
| |||||||||||
| PRINCIPAL AMOUNT (000S) | ||||||||||||
| SHORT-TERM INSTRUMENTS 10.2% | ||||||||||||
| REPURCHASE AGREEMENTS 0.4% | ||||||||||||
State Street Bank and Trust Co. |
| |||||||||||
0.010% due 07/02/2012 | $ | 227 | 227 | |||||||||
|
| |||||||||||
(Dated 06/29/2012. Collateralized by U.S. Treasury Notes 2.000% due 11/15/2021 valued at $234. Repurchase proceeds are $227.) | ||||||||||||
| SHARES | MARKET VALUE (000S) | |||||||||||
| PIMCO SHORT-TERM FLOATING NAV PORTFOLIO (a) 9.8% | ||||||||||||
PIMCO Short-Term Floating NAV Portfolio | 500,787 | $ | 5,018 | |||||||||
|
| |||||||||||
Total Short-Term Instruments |
| 5,245 | ||||||||||
|
| |||||||||||
| PURCHASED OPTIONS (f) 1.6% | ||||||||||||
(Cost $742) | 799 | |||||||||||
| Total Investments 100.2% (Cost $54,252) | $ | 51,088 | ||||||||||
| Written Options (g) (0.9%) (Premiums $459) | (473 | ) | ||||||||||
| Other Assets and Liabilities (Net) 0.7% | 355 | |||||||||||
|
| |||||||||||
| Net Assets 100.0% | $ | 50,970 | ||||||||||
|
| |||||||||||
Notes to Consolidated Schedule of Investments (amounts in thousands*, except number of contracts):
| * | A zero balance may reflect actual amounts rounding to less than one thousand. |
| (a) | Affiliated to the Fund. |
| (b) | Institutional Class Shares of each Fund. |
| (c) | Cash of $465 has been pledged as collateral as of June 30, 2012 for equity options, equity short sales, and other transactions in accordance with prime brokerage arrangements. |
| (d) | Centrally cleared swap agreements outstanding on June 30, 2012: Cash of $20 has been pledged as collateral for the following open centrally cleared swaps as of June 30, 2012. |
| Interest Rate Swaps | ||||||||||||||||||||||||
| Pay/Receive Floating Rate | Floating Rate Index | Fixed Rate | Maturity Date | Notional Amount | Market Value | Unrealized Appreciation | ||||||||||||||||||
Pay | 6-Month EUR-EURIBOR | 2.250 | % | 09/21/2016 | EUR | 1,000 | $ | 64 | $ | 37 | ||||||||||||||
|
|
|
| |||||||||||||||||||||
| (e) | OTC swap agreements outstanding on June 30, 2012: |
| Credit Default Swaps on Corporate and Sovereign Issues - Sell Protection (1) | ||||||||||||||||||||||||||||||||||
| Reference Entity | Counterparty | Fixed Deal Receive Rate | Maturity Date | Implied Credit Spread at | Notional | Market Value | Premiums Paid/(Received) | Unrealized Appreciation | ||||||||||||||||||||||||||
Brazil Government International Bond | CBK | 1.000% | 03/20/2013 | 0.534% | $ | 100 | $ | 0 | $ | 0 | $ | 0 | ||||||||||||||||||||||
Brazil Government International Bond | UAG | 1.000% | 12/20/2012 | 0.534% | 100 | 0 | �� | 0 | 0 | |||||||||||||||||||||||||
China Government International Bond | DUB | 1.000% | 03/20/2013 | 0.293% | 100 | 1 | 1 | 0 | ||||||||||||||||||||||||||
China Government International Bond | GST | 1.000% | 12/20/2012 | 0.293% | 100 | 1 | 1 | 0 | ||||||||||||||||||||||||||
China Government International Bond | HUS | 1.000% | 12/20/2012 | 0.293% | 100 | 0 | 0 | 0 | ||||||||||||||||||||||||||
China Government International Bond | RYL | 1.000% | 12/20/2016 | 1.028% | 100 | 0 | (5 | ) | 5 | |||||||||||||||||||||||||
Gazprom OAO Via RBS AG | GST | 1.000% | 12/20/2012 | 0.928% | 100 | 0 | (1 | ) | 1 | |||||||||||||||||||||||||
Gazprom OAO Via RBS AG | MYC | 1.000% | 12/20/2012 | 0.928% | 100 | 0 | (1 | ) | 1 | |||||||||||||||||||||||||
Russia Government International Bond | BRC | 1.000% | 12/20/2012 | 0.642% | 100 | 1 | (1 | ) | 2 | |||||||||||||||||||||||||
South Africa Government International Bond | CBK | 1.000% | 12/20/2012 | 0.476% | 100 | 0 | 0 | 0 | ||||||||||||||||||||||||||
South Africa Government International Bond | GST | 1.000% | 12/20/2012 | 0.476% | 100 | 0 | 0 | 0 | ||||||||||||||||||||||||||
|
|
|
|
|
| |||||||||||||||||||||||||||||
| $ | 3 | $ | (6 | ) | $ | 9 | ||||||||||||||||||||||||||||
|
|
|
|
|
| |||||||||||||||||||||||||||||
| (1) | If the Fund is a seller of protection and a credit event occurs, as defined under the terms of that particular swap agreement, the Fund will either (i) pay to the buyer of protection an amount equal to the notional amount of the swap and take delivery of the referenced obligation or underlying securities comprising the referenced index or (ii) pay a net settlement amount in the form of cash or securities equal to the notional amount of the swap less the recovery value of the referenced obligation or underlying securities comprising the referenced index. |
| (2) | Implied credit spreads, represented in absolute terms, utilized in determining the market value of credit default swap agreements on corporate or sovereign issues as of period end serve as an indicator of the current status of the payment/performance risk and represent the likelihood or risk of default for the credit derivative. The implied credit spread of a particular referenced entity reflects the cost of buying/selling protection and may include upfront payments required to be made to enter into the agreement. Wider credit spreads represent a deterioration of the referenced entity’s credit soundness and a greater likelihood or risk of default or other credit event occurring as defined under the terms of the agreement. |
| (3) | The maximum potential amount the Fund could be required to pay as a seller of credit protection or receive as a buyer of credit protection if a credit event occurs as defined under the terms of that particular swap agreement. |
| See Accompanying Notes | ANNUAL REPORT | JUNE 30, 2012 | 61 |
Table of Contents
Consolidated Schedule of Investments PIMCO Emerging Multi-Asset Fund (Cont.)
| (f) | Purchased options outstanding on June 30, 2012: |
| Options on Exchange-Traded Funds | ||||||||||||||||||||
| Description | Strike Price | Expiration Date | # of Contracts | Cost | Market Value | |||||||||||||||
Put - CBOE iShares MSCI Emerging Markets Index Fund | $ 40.000 | 01/19/2013 | 2,273 | $ 742 | $ | 799 | ||||||||||||||
|
|
|
| |||||||||||||||||
| (g) | Written options outstanding on June 30, 2012: |
| Options on Exchange-Traded Funds | ||||||||||||||||||||
| Description | Strike Price | Expiration Date | # of Contracts | Premium | Market Value | |||||||||||||||
Put - CBOE iShares MSCI Emerging Markets Index Fund | $ 35.000 | 01/19/2013 | 2,273 | $ | 412 | $ | (423 | ) | ||||||||||||
|
|
|
| |||||||||||||||||
| Options on Securities | ||||||||||||||||||||
| Description | Strike Price | Expiration Date | # of Contracts | Premium | Market Value | |||||||||||||||
Put - CBOE AngloGold Ashanti Ltd. SP - ADR | $ | 35.000 | 07/21/2012 | 130 | $ | 19 | $ | (18 | ) | |||||||||||
Put - CBOE BP PLC SP - ADR | 42.000 | 07/21/2012 | 105 | 13 | (19 | ) | ||||||||||||||
Put - CBOE Honda Motor Co. Ltd. SP - ADR | 35.000 | 07/21/2012 | 130 | 15 | (13 | ) | ||||||||||||||
|
|
|
| |||||||||||||||||
| $ | 47 | $ | (50 | ) | ||||||||||||||||
|
|
|
| |||||||||||||||||
Transactions in written call and put options for the period ended June 30, 2012:
| # of Contracts | Premium | |||||||
Balance at 06/30/2011 | 850 | $ | 46 | |||||
Sales | 6,958 | 880 | ||||||
Closing Buys | (5,057 | ) | (459 | ) | ||||
Expirations | 0 | 0 | ||||||
Exercised | (113 | ) | (8 | ) | ||||
|
|
|
| |||||
Balance at 06/30/2012 | 2,638 | $ | 459 | |||||
|
|
|
| |||||
| (h) | Foreign currency contracts outstanding on June 30, 2012: |
| Settlement Month | Currency to | Currency to | Counterparty | Unrealized Appreciation | Unrealized (Depreciation) | Net Unrealized Appreciation/ (Depreciation) | ||||||||||||||||||||||||
07/2012 | IDR | 1,712,200 | $ | 180 | BPS | $ | 0 | $ | (2 | ) | $ | (2 | ) | |||||||||||||||||
07/2012 | 1,712,200 | 180 | UAG | 0 | (2 | ) | (2 | ) | ||||||||||||||||||||||
07/2012 | $ | 21 | EUR | 16 | BOA | 0 | (1 | ) | (1 | ) | ||||||||||||||||||||
07/2012 | 25 | 20 | UAG | 0 | 0 | 0 | ||||||||||||||||||||||||
07/2012 | 180 | IDR | 1,712,200 | BPS | 2 | 0 | 2 | |||||||||||||||||||||||
07/2012 | 182 | 1,712,200 | UAG | 0 | 0 | 0 | ||||||||||||||||||||||||
07/2012 | 291 | MYR | 897 | JPM | 0 | (8 | ) | (8 | ) | |||||||||||||||||||||
07/2012 | 433 | ZAR | 3,643 | DUB | 11 | 0 | 11 | |||||||||||||||||||||||
08/2012 | 498 | BRL | 973 | BRC | 0 | (16 | ) | (16 | ) | |||||||||||||||||||||
08/2012 | 1,004 | HKD | 7,795 | UAG | 1 | 0 | 1 | |||||||||||||||||||||||
08/2012 | 346 | HUF | 76,392 | JPM | 0 | (10 | ) | (10 | ) | |||||||||||||||||||||
09/2012 | 352 | RUB | 11,692 | GSC | 3 | 0 | 3 | |||||||||||||||||||||||
11/2012 | 195 | TWD | 5,760 | BRC | 0 | (1 | ) | (1 | ) | |||||||||||||||||||||
01/2013 | 173 | IDR | 1,712,200 | BPS | 5 | 0 | 5 | |||||||||||||||||||||||
02/2013 | 402 | CNY | 2,533 | BRC | 0 | (5 | ) | (5 | ) | |||||||||||||||||||||
|
|
|
|
|
| |||||||||||||||||||||||||
| $ | 22 | $ | (45 | ) | $ | (23 | ) | |||||||||||||||||||||||
|
|
|
|
|
| |||||||||||||||||||||||||
| 62 | PIMCO EQUITY SERIES | See Accompanying Notes |
Table of Contents
June 30, 2012
| (i) | Fair Value Measurements (1) |
The following is a summary of the fair valuations according to the inputs used as of June 30, 2012 in valuing the Fund’s assets and liabilities (2):
| Category and Subcategory (3) | Level 1 (4) | Level 2 (5) | Level 3 (6) | Fair Value at 06/30/2012 | ||||||||||||
Investments, at value | ||||||||||||||||
Common Stocks | ||||||||||||||||
Israel | ||||||||||||||||
Health Care | $ | 378 | $ | 0 | $ | 0 | $ | 378 | ||||||||
Exchange-Traded Funds | ||||||||||||||||
United States | 2,879 | 0 | 0 | 2,879 | ||||||||||||
Mutual Funds | ||||||||||||||||
United States | 41,787 | 0 | 0 | 41,787 | ||||||||||||
Short-Term Instruments | ||||||||||||||||
Repurchase Agreements | 0 | 227 | 0 | 227 | ||||||||||||
PIMCO Short-Term Floating NAV Portfolio | 5,018 | 0 | 0 | 5,018 | ||||||||||||
Purchased Options | ||||||||||||||||
Equity Contracts | 799 | 0 | 0 | 799 | ||||||||||||
| $ | 50,861 | $ | 227 | $ | 0 | $ | 51,088 | |||||||||
| Category and Subcategory (3) | Level 1 (4) | Level 2 (5) | Level 3 (6) | Fair Value at 06/30/2012 | ||||||||||||
Financial Derivative Instruments (7) - Assets |
| |||||||||||||||
Credit Contracts | $ | 0 | $ | 9 | $ | 0 | $ | 9 | ||||||||
Foreign Exchange Contracts | 0 | 22 | 0 | 22 | ||||||||||||
Interest Rate Contracts | 0 | 37 | 0 | 37 | ||||||||||||
| $ | 0 | $ | 68 | $ | 0 | $ | 68 | |||||||||
Financial Derivative Instruments (7) - Liabilities |
| |||||||||||||||
Equity Contracts | (455 | ) | (18 | ) | 0 | (473 | ) | |||||||||
Foreign Exchange Contracts | 0 | (45 | ) | 0 | (45 | ) | ||||||||||
| $ | (455 | ) | $ | (63 | ) | $ | 0 | $ | (518 | ) | ||||||
Totals | $ | 50,406 | $ | 232 | $ | 0 | $ | 50,638 | ||||||||
| (1) | See note 3 in the Notes to Financial Statements for more information regarding pricing inputs and valuation techniques. |
| (2) | There were no significant transfers into or out of level 1, 2, and 3 during the period ended June 30, 2012. |
| (3) | Refer to the Consolidated Schedule of Investments for additional information. |
| (4) | Quoted prices in active markets for identical investments. |
| (5) | Significant other observable inputs. |
| (6) | Significant unobservable inputs. |
| (7) | Financial Derivative Instruments may include open futures contracts, swap agreements, written options, and foreign currency contracts. |
| (j) | Fair Value of Financial Derivative Instruments (1) |
The following is a summary of the fair valuation of the Fund’s derivative instruments categorized by risk exposure:
Fair Values of Financial Derivative Instruments on the Consolidated Statements of Assets and Liabilities as of June 30, 2012:
| Derivatives not accounted for as hedging instruments | ||||||||||||||||||||||||
| Commodity Contracts | Credit Contracts | Equity Contracts | Foreign Exchange Contracts | Interest Rate Contracts | Total | |||||||||||||||||||
Assets: | ||||||||||||||||||||||||
Investments, at value (purchased options) | $ | 0 | $ | 0 | $ | 799 | $ | 0 | $ | 0 | $ | 799 | ||||||||||||
Variation margin receivable on financial derivative instruments (2) | 0 | 0 | 0 | 0 | 2 | 2 | ||||||||||||||||||
Unrealized appreciation on foreign currency contracts | 0 | 0 | 0 | 22 | 0 | 22 | ||||||||||||||||||
Unrealized appreciation on OTC swap agreements | 0 | 9 | 0 | 0 | 0 | 9 | ||||||||||||||||||
|
|
|
|
|
|
|
|
|
|
|
| |||||||||||||
| $ | 0 | $ | 9 | $ | 799 | $ | 22 | $ | 2 | $ | 832 | |||||||||||||
|
|
|
|
|
|
|
|
|
|
|
| |||||||||||||
Liabilities: | ||||||||||||||||||||||||
Written options outstanding | $ | 0 | $ | 0 | $ | 473 | $ | 0 | $ | 0 | $ | 473 | ||||||||||||
Unrealized depreciation on foreign currency contracts | 0 | 0 | 0 | 45 | 0 | 45 | ||||||||||||||||||
|
|
|
|
|
|
|
|
|
|
|
| |||||||||||||
| $ | 0 | $ | 0 | $ | 473 | $ | 45 | $ | 0 | $ | 518 | |||||||||||||
|
|
|
|
|
|
|
|
|
|
|
| |||||||||||||
The Effect of Financial Derivative Instruments on the Consolidated Statements of Operations for the Period Ended June 30, 2012:
| Derivatives not accounted for as hedging instruments | ||||||||||||||||||||||||
| Commodity Contracts | Credit Contracts | Equity Contracts | Foreign Exchange Contracts | Interest Rate Contracts | Total | |||||||||||||||||||
Realized Gain (Loss) on Derivatives Recognized as a Result from Operations: | ||||||||||||||||||||||||
Net realized (loss) on investments (purchased options) | $ | 0 | $ | 0 | $ | (486 | ) | $ | 0 | $ | 0 | $ | (486 | ) | ||||||||||
Net realized gain on written options | 0 | 0 | 235 | 0 | 2 | 237 | ||||||||||||||||||
Net realized gain on swaps | 0 | 6 | 0 | 0 | 20 | 26 | ||||||||||||||||||
Net realized (loss) on foreign currency transactions | 0 | 0 | 0 | (212 | ) | 0 | (212 | ) | ||||||||||||||||
|
|
|
|
|
|
|
|
|
|
|
| |||||||||||||
| $ | 0 | $ | 6 | $ | (251 | ) | $ | (212 | ) | $ | 22 | $ | (435 | ) | ||||||||||
|
|
|
|
|
|
|
|
|
|
|
| |||||||||||||
| See Accompanying Notes | ANNUAL REPORT | JUNE 30, 2012 | 63 |
Table of Contents
Consolidated Schedule of Investments PIMCO Emerging Multi-Asset Fund (Cont.)
June 30, 2012
| Derivatives not accounted for as hedging instruments | ||||||||||||||||||||||||
| Commodity Contracts | Credit Contracts | Equity Contracts | Foreign Exchange Contracts | Interest Rate Contracts | Total | |||||||||||||||||||
Net Change in Unrealized Appreciation (Depreciation) on Derivatives Recognized as a Result of Operations: | ||||||||||||||||||||||||
Net change in unrealized appreciation on investments (purchased options) | $ | 0 | $ | 0 | $ | 73 | $ | 0 | $ | 0 | $ | 73 | ||||||||||||
Net change in unrealized (depreciation) on written options | 0 | 0 | (23 | ) | 0 | 0 | (23 | ) | ||||||||||||||||
Net change in unrealized appreciation on swaps | 0 | 9 | 0 | 0 | 37 | 46 | ||||||||||||||||||
Net change in unrealized (depreciation) on translation of assets and liabilities denominated in foreign currencies | �� | 0 | 0 | 0 | (23 | ) | 0 | (23 | ) | |||||||||||||||
|
|
|
|
|
|
|
|
|
|
|
| |||||||||||||
| $ | 0 | $ | 9 | $ | 50 | $ | (23 | ) | $ | 37 | $ | 73 | ||||||||||||
|
|
|
|
|
|
|
|
|
|
|
| |||||||||||||
| (1) | See note 6 in the Notes to Financial Statements for additional information. |
| (2) | Only current day’s variation margin is reported within the Consolidated Statements of Assets and Liabilities. The variation margin is included in the open centrally cleared swaps cumulative appreciation of $37 as reported in the Notes to Consolidated Schedule of Investments. |
| (k) | Collateral (Received)/Pledged for OTC Financial Derivative Instruments |
The following is a summary by counterparty of the market value of OTC financial derivative instruments and collateral (received)/pledged as of June 30, 2012:
Counterparty | Total Market Value of OTC Derivatives | Collateral (Received)/Pledged | Net Exposures (1) | Total Market Value of OTC Derivatives | Collateral (Received)/Pledged | Net Exposures (1) | ||||||||||||||||||||||
| PIMCO Emerging Multi-Asset Fund | PIMCO Cayman Commodity Fund V Ltd. (Subsidiary) | |||||||||||||||||||||||||||
BOA | $ | (1 | ) | $ | 0 | $ | (1 | ) | $ | 0 | $ | 0 | $ | 0 | ||||||||||||||
BPS | 5 | 0 | 5 | 0 | 0 | 0 | ||||||||||||||||||||||
BRC | (21 | ) | 0 | (21 | ) | 0 | 0 | 0 | ||||||||||||||||||||
CBK | 0 | 0 | 0 | 0 | 0 | 0 | ||||||||||||||||||||||
DUB | 12 | 0 | 12 | 0 | 0 | 0 | ||||||||||||||||||||||
GSC | 3 | 0 | 3 | 0 | 0 | 0 | ||||||||||||||||||||||
GST | 1 | 0 | 1 | 0 | 0 | 0 | ||||||||||||||||||||||
JPM | (18 | ) | 0 | (18 | ) | 0 | 0 | 0 | ||||||||||||||||||||
MYC | 0 | 0 | 0 | 0 | 0 | 0 | ||||||||||||||||||||||
RYL | 0 | 0 | 0 | 0 | 0 | 0 | ||||||||||||||||||||||
UAG | (1 | ) | 0 | (1 | ) | 0 | 0 | 0 | ||||||||||||||||||||
| (1) | Net Exposure represents the net receivable/(payable) that would be due from/to the counterparty in the event of default. Exposure from OTC derivatives can only be netted across transactions governed under the same Master Agreement with the same legal entity. The Fund and subsidiary are recognized as two separate legal entities. As such, exposure cannot be netted. See note 7, Principal Risks, in the Notes to Financial Statements for more information regarding credit and counterparty risks. |
| 64 | PIMCO EQUITY SERIES | See Accompanying Notes |
Table of Contents
Consolidated Schedule of Investments PIMCO EqS Pathfinder Fund®
June 30, 2012
| SHARES | MARKET VALUE (000S) | |||||||||||
| COMMON STOCKS 86.9% | ||||||||||||
| BERMUDA 6.4% | ||||||||||||
| ENERGY 2.7% | ||||||||||||
North Atlantic Drilling Ltd. | 14,178,340 | $ | 21,451 | |||||||||
Seadrill Ltd. | 1,036,617 | 36,971 | ||||||||||
|
| |||||||||||
| 58,422 | ||||||||||||
|
| |||||||||||
| FINANCIALS 3.7% | ||||||||||||
Hiscox Ltd. | 4,592,721 | 30,753 | ||||||||||
Lancashire Holdings Ltd. | 3,795,125 | 47,424 | ||||||||||
|
| |||||||||||
| 78,177 | ||||||||||||
|
| |||||||||||
Total Bermuda | 136,599 | |||||||||||
|
| |||||||||||
| BRAZIL 0.8% | ||||||||||||
| FINANCIALS 0.8% | ||||||||||||
Itau Unibanco Holding S.A. SP - ADR | 1,144,605 | 15,933 | ||||||||||
|
| |||||||||||
Total Brazil | 15,933 | |||||||||||
|
| |||||||||||
| CANADA 2.1% | ||||||||||||
| ENERGY 0.8% | ||||||||||||
Cameco Corp. | 734,043 | 16,112 | ||||||||||
|
| |||||||||||
| FINANCIALS 0.4% | ||||||||||||
TMX Group, Inc. | 168,428 | 7,676 | ||||||||||
|
| |||||||||||
| MATERIALS 0.9% | ||||||||||||
Kinross Gold Corp. | 1,299,297 | 10,589 | ||||||||||
Silver Wheaton Corp. | 350,366 | 9,404 | ||||||||||
|
| |||||||||||
| 19,993 | ||||||||||||
|
| |||||||||||
Total Canada | 43,781 | |||||||||||
|
| |||||||||||
| DENMARK 2.1% | ||||||||||||
| CONSUMER STAPLES 1.7% | ||||||||||||
Carlsberg A/S ‘B’ | 453,058 | 35,761 | ||||||||||
|
| |||||||||||
| FINANCIALS 0.4% | ||||||||||||
Jyske Bank A/S (a) | 351,042 | 9,472 | ||||||||||
|
| |||||||||||
Total Denmark | 45,233 | |||||||||||
|
| |||||||||||
| FAEROE ISLANDS 0.4% | ||||||||||||
| CONSUMER STAPLES 0.3% | ||||||||||||
Bakkafrost P/F | 810,885 | 6,066 | ||||||||||
|
| |||||||||||
| FINANCIALS 0.1% | ||||||||||||
BankNordik P/F | 236,546 | 2,788 | ||||||||||
|
| |||||||||||
Total Faeroe Islands | 8,854 | |||||||||||
|
| |||||||||||
| FRANCE 11.1% | ||||||||||||
| CONSUMER DISCRETIONARY 2.2% | ||||||||||||
Eutelsat Communications S.A. | 1,149,653 | 35,365 | ||||||||||
JCDecaux S.A. | 518,652 | 11,438 | ||||||||||
|
| |||||||||||
| 46,803 | ||||||||||||
|
| |||||||||||
| CONSUMER STAPLES 6.3% | ||||||||||||
Carrefour S.A. | 1,516,464 | 28,002 | ||||||||||
| SHARES | MARKET VALUE (000S) | |||||||||||
Danone S.A. | 846,850 | $ | 52,629 | |||||||||
L’Oreal S.A. | 98,744 | 11,553 | ||||||||||
Pernod-Ricard S.A. | 400,598 | 42,837 | ||||||||||
|
| |||||||||||
| 135,021 | ||||||||||||
|
| |||||||||||
| ENERGY 0.4% | ||||||||||||
Bourbon S.A. | 377,191 | 9,110 | ||||||||||
|
| |||||||||||
| INDUSTRIALS 1.0% | ||||||||||||
Teleperformance S.A. | 951,735 | 21,037 | ||||||||||
|
| |||||||||||
| UTILITIES 1.2% | ||||||||||||
Suez Environnement Co. | 1,105,351 | 11,885 | ||||||||||
Veolia Environnement S.A. | 1,098,374 | 13,909 | ||||||||||
|
| |||||||||||
| 25,794 | ||||||||||||
|
| |||||||||||
Total France | 237,765 | |||||||||||
|
| |||||||||||
| GERMANY 2.1% | ||||||||||||
| HEALTH CARE 1.3% | ||||||||||||
Rhoen Klinikum AG | 1,181,456 | 28,293 | ||||||||||
|
| |||||||||||
| INDUSTRIALS 0.2% | ||||||||||||
Kloeckner & Co. SE | 383,249 | 3,930 | ||||||||||
|
| |||||||||||
| UTILITIES 0.6% | ||||||||||||
E.ON AG | 628,501 | 13,581 | ||||||||||
|
| |||||||||||
Total Germany | 45,804 | |||||||||||
|
| |||||||||||
| GUERNSEY, CHANNEL ISLANDS 0.7% | ||||||||||||
| FINANCIALS 0.7% | ||||||||||||
Resolution Ltd. | 5,137,075 | 15,802 | ||||||||||
|
| |||||||||||
Total Guernsey, Channel Islands |
| 15,802 | ||||||||||
|
| |||||||||||
| HONG KONG 3.5% | ||||||||||||
| CONSUMER DISCRETIONARY 0.4% | ||||||||||||
Television Broadcasts Ltd. | 1,338,000 | 9,362 | ||||||||||
|
| |||||||||||
| FINANCIALS 2.7% | ||||||||||||
AIA Group Ltd. | 13,311,600 | 45,979 | ||||||||||
First Pacific Co. Ltd. | 11,094,000 | 11,536 | ||||||||||
|
| |||||||||||
| 57,515 | ||||||||||||
|
| |||||||||||
| INDUSTRIALS 0.4% | ||||||||||||
Jardine Matheson Holdings Ltd. | 89,300 | 4,350 | ||||||||||
Jardine Strategic Holdings Ltd. | 96,500 | 2,966 | ||||||||||
|
| |||||||||||
| 7,316 | ||||||||||||
|
| |||||||||||
Total Hong Kong | 74,193 | |||||||||||
|
| |||||||||||
| ISRAEL 0.6% | ||||||||||||
| HEALTH CARE 0.6% | ||||||||||||
Teva Pharmaceutical Industries Ltd. SP - ADR | 314,971 | 12,422 | ||||||||||
|
| |||||||||||
Total Israel | 12,422 | |||||||||||
|
| |||||||||||
| SHARES | MARKET VALUE (000S) | |||||||||||
| JAPAN 1.8% | ||||||||||||
| INDUSTRIALS 0.6% | ||||||||||||
FANUC Corp. | 78,600 | $ | 12,921 | |||||||||
|
| |||||||||||
| INFORMATION TECHNOLOGY 1.2% | ||||||||||||
Nintendo Co. Ltd. | 225,442 | 26,327 | ||||||||||
|
| |||||||||||
Total Japan | 39,248 | |||||||||||
|
| |||||||||||
| NETHERLANDS 5.7% | ||||||||||||
| CONSUMER STAPLES 1.4% | ||||||||||||
CSM | 1,670,633 | 30,808 | ||||||||||
|
| |||||||||||
| ENERGY 0.8% | ||||||||||||
Royal Dutch Shell PLC ‘A’ | 506,320 | 17,059 | ||||||||||
|
| |||||||||||
| FINANCIALS 1.2% | ||||||||||||
ING Groep NV - Dutch Certificate (a) | 3,805,425 | 25,512 | ||||||||||
|
| |||||||||||
| INFORMATION TECHNOLOGY 0.8% | ||||||||||||
Gemalto NV | 228,348 | 16,401 | ||||||||||
|
| |||||||||||
| TELECOMMUNICATION SERVICES 1.5% | ||||||||||||
Koninklijke KPN NV | 3,240,741 | 30,988 | ||||||||||
|
| |||||||||||
Total Netherlands | 120,768 | |||||||||||
|
| |||||||||||
| NORWAY 2.0% | ||||||||||||
| CONSUMER STAPLES 1.5% | ||||||||||||
Marine Harvest ASA (a) | 45,119,615 | 32,116 | ||||||||||
|
| |||||||||||
| INDUSTRIALS 0.5% | ||||||||||||
Orkla ASA | 1,453,514 | 10,548 | ||||||||||
|
| |||||||||||
Total Norway | 42,664 | |||||||||||
|
| |||||||||||
| SINGAPORE 0.8% | ||||||||||||
| FINANCIALS 0.0% | ||||||||||||
Great Eastern Holdings Ltd. | 85,220 | 860 | ||||||||||
|
| |||||||||||
| INDUSTRIALS 0.8% | ||||||||||||
Keppel Corp. Ltd. | 1,992,300 | 16,322 | ||||||||||
|
| |||||||||||
Total Singapore | 17,182 | |||||||||||
|
| |||||||||||
| SOUTH AFRICA 1.0% | ||||||||||||
| MATERIALS 1.0% | ||||||||||||
AngloGold Ashanti Ltd. SP - ADR | 614,314 | 21,096 | ||||||||||
|
| |||||||||||
Total South Africa | 21,096 | |||||||||||
|
| |||||||||||
| SOUTH KOREA 0.4% | ||||||||||||
| CONSUMER DISCRETIONARY 0.4% | ||||||||||||
GS Home Shopping, Inc. | 98,475 | 8,320 | ||||||||||
|
| |||||||||||
Total South Korea | 8,320 | |||||||||||
|
| |||||||||||
| See Accompanying Notes | ANNUAL REPORT | JUNE 30, 2012 | 65 |
Table of Contents
Consolidated Schedule of Investments PIMCO EqS Pathfinder Fund® (Cont.)
| SHARES | MARKET VALUE (000S) | |||||||||||
| SPAIN 0.3% | ||||||||||||
| CONSUMER STAPLES 0.3% | ||||||||||||
Distribuidora Internacional de Alimentacion S.A. | 1,131,881 | $ | 5,322 | |||||||||
|
| |||||||||||
Total Spain | 5,322 | |||||||||||
|
| |||||||||||
| SWEDEN 0.8% | ||||||||||||
| INDUSTRIALS 0.8% | ||||||||||||
Loomis AB ‘B’ | 1,348,428 | 16,637 | ||||||||||
|
| |||||||||||
Total Sweden | 16,637 | |||||||||||
|
| |||||||||||
| SWITZERLAND 4.4% | ||||||||||||
| CONSUMER STAPLES 1.4% | ||||||||||||
Nestle S.A. | 490,296 | 29,260 | ||||||||||
|
| |||||||||||
| FINANCIALS 0.6% | ||||||||||||
Swiss Re AG | 191,122 | 12,049 | ||||||||||
|
| |||||||||||
| HEALTH CARE 1.5% | ||||||||||||
Roche Holding AG | 181,282 | 31,313 | ||||||||||
|
| |||||||||||
| INDUSTRIALS 0.5% | ||||||||||||
Schindler Holding AG | 104,608 | 11,797 | ||||||||||
|
| |||||||||||
| MATERIALS 0.4% | ||||||||||||
Sika AG | 5,009 | 9,672 | ||||||||||
|
| |||||||||||
Total Switzerland | 94,091 | |||||||||||
|
| |||||||||||
| UNITED KINGDOM 11.7% | ||||||||||||
| CONSUMER DISCRETIONARY 0.4% | ||||||||||||
British Sky Broadcasting Group PLC | 866,307 | 9,444 | ||||||||||
|
| |||||||||||
| CONSUMER STAPLES 7.6% | ||||||||||||
British American Tobacco PLC | 1,302,707 | 66,229 | ||||||||||
Imperial Tobacco Group PLC | 1,894,396 | 72,988 | ||||||||||
Reckitt Benckiser Group PLC | 415,703 | 21,973 | ||||||||||
|
| |||||||||||
| 161,190 | ||||||||||||
|
| |||||||||||
| ENERGY 2.5% | ||||||||||||
BP PLC | 5,568,040 | 37,185 | ||||||||||
Ensco PLC ‘A’ | 351,649 | 16,517 | ||||||||||
|
| |||||||||||
| 53,702 | ||||||||||||
|
| |||||||||||
| FINANCIALS 1.2% | ||||||||||||
Lloyds Banking Group PLC (a) | 51,004,023 | 24,916 | ||||||||||
|
| |||||||||||
Total United Kingdom |
| 249,252 | ||||||||||
|
| |||||||||||
| UNITED STATES 28.2% | ||||||||||||
| CONSUMER STAPLES 6.6% | ||||||||||||
Altria Group, Inc. | 942,768 | 32,573 | ||||||||||
Lorillard, Inc. | 378,366 | 49,925 | ||||||||||
Philip Morris International, Inc. | 285,716 | 24,931 | ||||||||||
Reynolds American, Inc. | 479,177 | 21,501 | ||||||||||
Wal-Mart Stores, Inc. | 185,812 | 12,955 | ||||||||||
|
| |||||||||||
| 141,885 | ||||||||||||
|
| |||||||||||
| SHARES | MARKET VALUE (000S) | |||||||||||
| ENERGY 0.6% | ||||||||||||
Halliburton Co. | 344,367 | $ | 9,777 | |||||||||
Rentech, Inc. (a) | 2,039,843 | 4,202 | ||||||||||
|
| |||||||||||
| 13,979 | ||||||||||||
|
| |||||||||||
| FINANCIALS 9.1% | ||||||||||||
Alleghany Corp. (a) | 59,780 | 20,310 | ||||||||||
BankUnited, Inc. | 1,151,768 | 27,159 | ||||||||||
Berkshire Hathaway, Inc. ‘B’ (a) | 499,815 | 41,650 | ||||||||||
Capitol Federal Financial, Inc. | 753,253 | 8,949 | ||||||||||
Northwest Bancshares, Inc. | 824,859 | 9,659 | ||||||||||
NYSE Euronext | 378,154 | 9,673 | ||||||||||
SLM Corp. | 1,232,877 | 19,368 | ||||||||||
TFS Financial Corp. (a) | 1,176,990 | 11,240 | ||||||||||
ViewPoint Financial Group, Inc. | 688,711 | 10,771 | ||||||||||
White Mountains Insurance Group Ltd. | 66,529 | 34,712 | ||||||||||
|
| |||||||||||
| 193,491 | ||||||||||||
|
| |||||||||||
| HEALTH CARE 2.2% | ||||||||||||
Merck & Co., Inc. | 287,061 | 11,985 | ||||||||||
Pfizer, Inc. | 1,526,379 | 35,106 | ||||||||||
|
| |||||||||||
| 47,091 | ||||||||||||
|
| |||||||||||
| INDUSTRIALS 3.3% | ||||||||||||
3M Co. | 380,918 | 34,130 | ||||||||||
Deere & Co. | 308,137 | 24,919 | ||||||||||
General Dynamics Corp. | 174,760 | 11,527 | ||||||||||
|
| |||||||||||
| 70,576 | ||||||||||||
|
| |||||||||||
| INFORMATION TECHNOLOGY 6.3% | ||||||||||||
Dell, Inc. (a) | 1,958,376 | 24,519 | ||||||||||
Intel Corp. | 1,899,703 | 50,627 | ||||||||||
Microsoft Corp. | 1,921,633 | 58,783 | ||||||||||
|
| |||||||||||
| 133,929 | ||||||||||||
|
| |||||||||||
| MATERIALS 0.1% | ||||||||||||
Rentech Nitrogen Partners LP | 64,294 | 1,769 | ||||||||||
|
| |||||||||||
Total United States | 602,720 | |||||||||||
|
| |||||||||||
Total Common Stocks (Cost $1,831,510) | 1,853,686 | |||||||||||
|
| |||||||||||
| UNITS | ||||||||||||
| EQUITY-LINKED SECURITIES 2.1% | ||||||||||||
| FRANCE 1.4% | ||||||||||||
| ENERGY 0.9% | ||||||||||||
Morgan Stanley BV | ||||||||||||
Total S.A. - Exp. 08/02/2012 | 393,174 | 18,770 | ||||||||||
|
| |||||||||||
| UTILITIES 0.5% | ||||||||||||
Morgan Stanley BV | ||||||||||||
Suez Environnement Co. - Exp. 03/22/2013 | 1,096,432 | 12,599 | ||||||||||
|
| |||||||||||
Total France | 31,369 | |||||||||||
|
| |||||||||||
| UNITS | MARKET VALUE (000S) | |||||||||||
| NETHERLANDS 0.7% | ||||||||||||
| UTILITIES 0.7% | ||||||||||||
Morgan Stanley BV | ||||||||||||
Veolia Environnement S.A. -Exp. 03/22/2013 | 1,081,540 | $ | 14,576 | |||||||||
|
| |||||||||||
Total Netherlands | 14,576 | |||||||||||
|
| |||||||||||
Total Equity-Linked Securities | 45,945 | |||||||||||
|
| |||||||||||
| SHARES | ||||||||||||
| EXCHANGE-TRADED FUNDS 3.8% | ||||||||||||
| UNITED STATES 3.8% | ||||||||||||
SPDR Gold Trust | 523,594 | 81,256 | ||||||||||
|
| |||||||||||
Total Exchange-Traded Funds | 81,256 | |||||||||||
|
| |||||||||||
| PREFERRED STOCKS 0.2% | ||||||||||||
| BRAZIL 0.2% | ||||||||||||
| BANKING & FINANCE 0.2% | ||||||||||||
Itau Unibanco Holding S.A. | 362,000 | 5,099 | ||||||||||
|
| |||||||||||
Total Preferred Stocks (Cost $5,003) | 5,099 | |||||||||||
|
| |||||||||||
| RIGHTS 0.1% | ||||||||||||
| FRANCE 0.1% | ||||||||||||
| HEALTH CARE 0.1% | ||||||||||||
Sanofi - Exp. 12/31/2020 | 1,305,421 | 1,841 | ||||||||||
|
| |||||||||||
Total Rights (Cost $3,150) | 1,841 | |||||||||||
|
| |||||||||||
| PRINCIPAL AMOUNT (000S) | ||||||||||||
| SHORT-TERM INSTRUMENTS 6.2% | ||||||||||||
| REPURCHASE AGREEMENTS 0.0% | ||||||||||||
State Street Bank and Trust Co. | ||||||||||||
0.010% due 07/02/2012 | $ | 486 | 486 | |||||||||
|
| |||||||||||
(Dated 06/29/2012. Collateralized by U.S. Treasury Notes 2.000% due 11/15/2021 valued at $499. Repurchase proceeds are $486.) | ||||||||||||
| U.S. TREASURY BILLS 0.1% | ||||||||||||
0.190% due 03/07/2013 - 06/27/2013 (b)(e) | 1,347 | 1,345 | ||||||||||
|
| |||||||||||
| SHARES | ||||||||||||
| PIMCO SHORT-TERM FLOATING NAV PORTFOLIO (c) 6.1% | ||||||||||||
PIMCO Short-Term Floating NAV Portfolio | 12,909,897 | 129,357 | ||||||||||
|
| |||||||||||
Total Short-Term Instruments | 131,188 | |||||||||||
|
| |||||||||||
| PURCHASED OPTIONS (g) 0.2% | ||||||||||||
(Cost $8,184) | 3,773 | |||||||||||
| Total Investments 99.5% (Cost $2,115,955) | $ | 2,122,788 | ||||||||||
| Written Options (h) (0.0%) (Premiums $3,968) | (374 | ) | ||||||||||
| Other Assets and Liabilities (Net) 0.5% | 11,596 | |||||||||||
|
| |||||||||||
| Net Assets 100.0% | $ | 2,134,010 | ||||||||||
|
| |||||||||||
| 66 | PIMCO EQUITY SERIES | See Accompanying Notes |
Table of Contents
June 30, 2012
Notes to Consolidated Schedule of Investments (amounts in thousands*, except number of contracts and shares):
| * | A zero balance may reflect actual amounts rounding to less than one thousand. |
| (a) | Non-income producing security. |
| (b) | Coupon represents a weighted average yield to maturity. |
| (c) | Affiliated to the Fund. |
| (d) | Cash of $1,806 has been pledged as collateral as of June 30, 2012 for equity options, equity short sales, and other transactions in accordance with prime brokerage arrangements. |
| (e) | Securities with an aggregate market value of $1,345 have been pledged as collateral as of June 30, 2012 for OTC swap agreements, foreign currency options and foreign currency contracts as governed by International Swaps and Derivatives Association, Inc. Master Agreements. |
| (f) | OTC swap agreements outstanding on June 30, 2012: |
| Total Return Swaps on Securities | ||||||||||||||||||||||||||
| Pay/Receive | Underlying Reference | # of Shares | Financing Rate (1) | Notional Amount | Maturity Date | Counterparty | Unrealized Appreciation/ (Depreciation) | |||||||||||||||||||
| Pay | Rio Tinto Ltd. | 112,288 | 3-Month USD-LIBOR less a specified spread | AUD | 6,866 | 12/20/2012 | CBK | $ | 680 | |||||||||||||||||
| Receive | Rio Tinto Ltd. | 144,162 | 3-Month USD-LIBOR plus a specified spread | 6,866 | 12/20/2012 | CBK | (376 | ) | ||||||||||||||||||
|
| |||||||||||||||||||||||||
| $ | 304 | |||||||||||||||||||||||||
|
| |||||||||||||||||||||||||
| (1) | Financing rate is based upon predetermined notional amounts, which may be a multiple of the number of shares disclosed. |
| (g) | Purchased options outstanding on June 30, 2012: |
| Foreign Currency Options | ||||||||||||||||||||||||||
| Description | Counterparty | Exercise Price | Expiration Date | Notional Amount | Cost | Market Value | ||||||||||||||||||||
Put - OTC EUR versus USD | UAG | $ | 1.130 | 08/27/2012 | EUR | 16,778 | $ | 90 | $ | 12 | ||||||||||||||||
|
|
|
| |||||||||||||||||||||||
| Options on Exchange-Traded Funds | ||||||||||||||||||||||||
| Description | Strike Price | Expiration Date | # of Contracts | Cost | Market Value | |||||||||||||||||||
Put - CBOE Financial Select Sector SPDR Fund | $ | 13.000 | 12/22/2012 | 14,551 | $ | 975 | $ | 829 | ||||||||||||||||
Put - CBOE iShares MSCI EAFE Index Fund | 45.000 | 09/22/2012 | 26,066 | 6,360 | 2,294 | |||||||||||||||||||
Put - CBOE iShares MSCI EAFE Index Fund | 48.000 | 09/22/2012 | 4,170 | 759 | 638 | |||||||||||||||||||
|
|
|
| |||||||||||||||||||||
| $ | 8,094 | $ | 3,761 | |||||||||||||||||||||
|
|
|
| |||||||||||||||||||||
| (h) | Written options outstanding on June 30, 2012: |
| Options on Securities | ||||||||||||||||||||||||||||||||||
| Description | Counterparty | Strike | Expiration Date | # of Contracts | Notional Amount | Premium | Market Value | |||||||||||||||||||||||||||
Put - CBOE Halliburton Co. | — | $ | 30.000 | 07/21/2012 | 1,830 | — | $ | 227 | $ | (335 | ) | |||||||||||||||||||||||
Call - OTC Suez Environnement Co. | MYI | EUR | 12.000 | 07/20/2012 | — | EUR | 220,178 | 1,365 | (1 | ) | ||||||||||||||||||||||||
Call - OTC Veolia Environnement S.A. | MYI | 12.000 | 07/20/2012 | — | 217,991 | 2,376 | (38 | ) | ||||||||||||||||||||||||||
|
|
|
| |||||||||||||||||||||||||||||||
| $ | 3,968 | $ | (374 | ) | ||||||||||||||||||||||||||||||
|
|
|
| |||||||||||||||||||||||||||||||
Transactions in written call and put options for the period ended June 30, 2012:
| # of Contracts | Notional Amount in CHF | Notional Amount in EUR | Premium | |||||||||||||||||||
Balance at 06/30/2011 | 0 | CHF | 28 | EUR | 186 | $ | 699 | |||||||||||||||
Sales | 247,806 | 0 | 438,169 | 11,139 | ||||||||||||||||||
Closing Buys | (235,966 | ) | (28 | ) | (186 | ) | (6,980 | ) | ||||||||||||||
Expirations | 0 | 0 | 0 | 0 | ||||||||||||||||||
Exercised | (10,010 | ) | 0 | 0 | (890 | ) | ||||||||||||||||
|
|
|
|
|
|
|
|
|
|
| ||||||||||||
Balance at 06/30/2012 | 1,830 | CHF | 0 | EUR | 438,169 | $ | 3,968 | |||||||||||||||
|
|
|
|
|
|
|
|
|
|
| ||||||||||||
| (i) | Foreign currency contracts outstanding on June 30, 2012: |
| Settlement Month | Currency to | Currency to | Counterparty | Unrealized Appreciation | Unrealized (Depreciation) | Net Unrealized Appreciation/ (Depreciation) | ||||||||||||||||||||
07/2012 | AUD | 74,437 | $ | 74,943 | CBK | $ | 0 | $ | (1,243 | ) | $ | (1,243 | ) | |||||||||||||
07/2012 | CAD | 113,430 | 110,581 | BRC | 0 | (833 | ) | (833 | ) | |||||||||||||||||
07/2012 | 7,101 | 6,924 | RBC | 0 | (51 | ) | (51 | ) | ||||||||||||||||||
| See Accompanying Notes | ANNUAL REPORT | JUNE 30, 2012 | 67 |
Table of Contents
Consolidated Schedule of Investments PIMCO EqS Pathfinder Fund® (Cont.)
| Settlement Month | Currency to be Delivered | Currency to be Received | Counterparty | Unrealized Appreciation | Unrealized (Depreciation) | Net Unrealized Appreciation/ (Depreciation) | ||||||||||||||||||||||||
07/2012 | CHF | 28,166 | $ | 29,481 | DUB | $ | 0 | $ | (194 | ) | $ | (194 | ) | |||||||||||||||||
07/2012 | 4,990 | 5,260 | UAG | 2 | 0 | 2 | ||||||||||||||||||||||||
07/2012 | DKK | 229,557 | 38,389 | FBF | 0 | (685 | ) | (685 | ) | |||||||||||||||||||||
07/2012 | EUR | 39,214 | 48,927 | BPS | 0 | (699 | ) | (699 | ) | |||||||||||||||||||||
07/2012 | 39,913 | 50,035 | CBK | 0 | (475 | ) | (475 | ) | ||||||||||||||||||||||
07/2012 | 24,114 | 30,301 | FBF | 0 | (216 | ) | (216 | ) | ||||||||||||||||||||||
07/2012 | 49,214 | 62,270 | GSC | 0 | (10 | ) | (10 | ) | ||||||||||||||||||||||
07/2012 | 37,785 | 47,591 | HUS | 0 | (226 | ) | (226 | ) | ||||||||||||||||||||||
07/2012 | 32,369 | 40,515 | JPM | 0 | (448 | ) | (448 | ) | ||||||||||||||||||||||
07/2012 | 127 | 160 | MSC | 0 | (1 | ) | (1 | ) | ||||||||||||||||||||||
07/2012 | 140 | 176 | RBC | 0 | (1 | ) | (1 | ) | ||||||||||||||||||||||
07/2012 | 13,665 | 17,011 | UAG | 0 | (282 | ) | (282 | ) | ||||||||||||||||||||||
07/2012 | GBP | 37,801 | 59,272 | BOA | 70 | 0 | 70 | |||||||||||||||||||||||
07/2012 | 143 | 223 | BPS | 0 | (1 | ) | (1 | ) | ||||||||||||||||||||||
07/2012 | 37,801 | 59,356 | DUB | 154 | 0 | 154 | ||||||||||||||||||||||||
07/2012 | 2,799 | 4,390 | HUS | 6 | 0 | 6 | ||||||||||||||||||||||||
07/2012 | 29,659 | 46,621 | UAG | 171 | 0 | 171 | ||||||||||||||||||||||||
07/2012 | ILS | 29,038 | 7,670 | GST | 246 | 0 | 246 | |||||||||||||||||||||||
07/2012 | JPY | 6,238,664 | 78,642 | BPS | 595 | 0 | 595 | |||||||||||||||||||||||
07/2012 | 6,238,665 | 78,622 | DUB | 575 | 0 | 575 | ||||||||||||||||||||||||
07/2012 | 769,142 | 9,715 | RYL | 93 | 0 | 93 | ||||||||||||||||||||||||
07/2012 | KRW | 6,952,343 | 6,017 | BRC | 0 | (50 | ) | (50 | ) | |||||||||||||||||||||
07/2012 | 5,885,460 | 5,190 | HUS | 54 | 0 | 54 | ||||||||||||||||||||||||
07/2012 | NOK | 162,728 | 26,842 | BOA | 0 | (513 | ) | (513 | ) | |||||||||||||||||||||
07/2012 | 162,727 | 26,879 | CBK | 0 | (476 | ) | (476 | ) | ||||||||||||||||||||||
07/2012 | 162,727 | 26,870 | FBF | 0 | (485 | ) | (485 | ) | ||||||||||||||||||||||
07/2012 | 2,013 | 332 | HUS | 0 | (6 | ) | (6 | ) | ||||||||||||||||||||||
07/2012 | SEK | 79,139 | 11,204 | CBK | 0 | (236 | ) | (236 | ) | |||||||||||||||||||||
07/2012 | $ | 31,147 | AUD | 31,463 | CBK | 1,050 | (1 | ) | 1,049 | |||||||||||||||||||||
07/2012 | 21,480 | 22,030 | DUB | 1,068 | 0 | 1,068 | ||||||||||||||||||||||||
07/2012 | 21,480 | 22,029 | HUS | 1,066 | 0 | 1,066 | ||||||||||||||||||||||||
07/2012 | 8,130 | 8,348 | JPM | 414 | 0 | 414 | ||||||||||||||||||||||||
07/2012 | 38,985 | CAD | 40,177 | CBK | 477 | 0 | 477 | |||||||||||||||||||||||
07/2012 | 38,986 | 40,177 | RBC | 477 | 0 | 477 | ||||||||||||||||||||||||
07/2012 | 38,978 | 40,177 | RYL | 485 | 0 | 485 | ||||||||||||||||||||||||
07/2012 | 1,159 | CHF | 1,108 | RYL | 8 | 0 | 8 | |||||||||||||||||||||||
07/2012 | 28,025 | 27,058 | UAG | 483 | 0 | 483 | ||||||||||||||||||||||||
07/2012 | 38,498 | DKK | 229,557 | FBF | 576 | 0 | 576 | |||||||||||||||||||||||
07/2012 | 2,204 | EUR | 1,779 | DUB | 48 | 0 | 48 | |||||||||||||||||||||||
07/2012 | 1,497 | 1,185 | FBF | 3 | 0 | 3 | ||||||||||||||||||||||||
07/2012 | 121,674 | 97,690 | JPM | 1,953 | 0 | 1,953 | ||||||||||||||||||||||||
07/2012 | 48,060 | 38,278 | RYL | 381 | 0 | 381 | ||||||||||||||||||||||||
07/2012 | 121,962 | 97,609 | UAG | 1,562 | 0 | 1,562 | ||||||||||||||||||||||||
07/2012 | 1,151 | GBP | 732 | BRC | 0 | (5 | ) | (5 | ) | |||||||||||||||||||||
07/2012 | 118,907 | 76,142 | JPM | 343 | 0 | 343 | ||||||||||||||||||||||||
07/2012 | 44,153 | 28,530 | RYL | 529 | 0 | 529 | ||||||||||||||||||||||||
07/2012 | 7,500 | ILS | 29,038 | UAG | 0 | (76 | ) | (76 | ) | |||||||||||||||||||||
07/2012 | 165,649 | JPY | 13,246,471 | FBF | 66 | 0 | 66 | |||||||||||||||||||||||
07/2012 | 11,387 | KRW | 12,837,803 | UAG | 0 | (183 | ) | (183 | ) | |||||||||||||||||||||
07/2012 | 79,188 | NOK | 478,432 | GSC | 1,239 | 0 | 1,239 | |||||||||||||||||||||||
07/2012 | 412 | 2,434 | JPM | 0 | (3 | ) | (3 | ) | ||||||||||||||||||||||
07/2012 | 1,341 | 8,096 | MSC | 20 | 0 | 20 | ||||||||||||||||||||||||
07/2012 | 203 | 1,233 | RYL | 5 | 0 | 5 | ||||||||||||||||||||||||
07/2012 | 3,439 | SEK | 24,946 | FBF | 168 | 0 | 168 | |||||||||||||||||||||||
07/2012 | 3,444 | 24,947 | GSC | 162 | 0 | 162 | ||||||||||||||||||||||||
07/2012 | 591 | 4,299 | HUS | 31 | 0 | 31 | ||||||||||||||||||||||||
07/2012 | 3,450 | 24,947 | UAG | 156 | 0 | 156 | ||||||||||||||||||||||||
07/2012 | ZAR | 147,054 | $ | 17,481 | DUB | 0 | (445 | ) | (445 | ) | ||||||||||||||||||||
08/2012 | BRL | 42,124 | 21,557 | HUS | 718 | 0 | 718 | |||||||||||||||||||||||
08/2012 | CHF | 27,058 | 28,045 | UAG | 0 | (482 | ) | (482 | ) | |||||||||||||||||||||
08/2012 | DKK | 229,557 | 38,528 | FBF | 0 | (577 | ) | (577 | ) | |||||||||||||||||||||
08/2012 | EUR | 97,609 | 121,605 | JPM | 0 | (1,949 | ) | (1,949 | ) | |||||||||||||||||||||
08/2012 | 97,609 | 121,995 | UAG | 0 | (1,559 | ) | (1,559 | ) | ||||||||||||||||||||||
08/2012 | GBP | 76,142 | 118,896 | JPM | 0 | (345 | ) | (345 | ) | |||||||||||||||||||||
08/2012 | HKD | 310,247 | 39,972 | UAG | 0 | (24 | ) | (24 | ) | |||||||||||||||||||||
08/2012 | JPY | 162,077 | 2,043 | BRC | 15 | 0 | 15 | |||||||||||||||||||||||
08/2012 | NOK | 478,432 | 79,103 | GSC | 0 | (1,238 | ) | (1,238 | ) | |||||||||||||||||||||
08/2012 | PLN | 2,574 | 803 | UAG | 35 | 0 | 35 | |||||||||||||||||||||||
| 68 | PIMCO EQUITY SERIES | See Accompanying Notes |
Table of Contents
June 30, 2012
| Settlement Month | Currency to | Currency to be Received | Counterparty | Unrealized Appreciation | Unrealized (Depreciation) | Net Unrealized Appreciation/ (Depreciation) | ||||||||||||||||||||||||
08/2012 | SGD | 1,246 | $ | 1,009 | UAG | $ | 25 | $ | 0 | $ | 25 | |||||||||||||||||||
08/2012 | $ | 74,732 | AUD | 74,437 | CBK | 1,238 | 0 | 1,238 | ||||||||||||||||||||||
08/2012 | 109,881 | CAD | 112,789 | BRC | 830 | 0 | 830 | |||||||||||||||||||||||
08/2012 | 17,805 | CHF | 17,142 | JPM | 268 | 0 | 268 | |||||||||||||||||||||||
08/2012 | 186 | EUR | 149 | JPM | 3 | 0 | 3 | |||||||||||||||||||||||
08/2012 | 446 | GBP | 287 | JPM | 3 | 0 | 3 | |||||||||||||||||||||||
08/2012 | 78,674 | JPY | 6,238,664 | BPS | 0 | (593 | ) | (593 | ) | |||||||||||||||||||||
08/2012 | 78,654 | 6,238,665 | DUB | 0 | (574 | ) | (574 | ) | ||||||||||||||||||||||
08/2012 | 11,193 | SEK | 79,139 | CBK | 235 | 0 | 235 | |||||||||||||||||||||||
08/2012 | 416 | SGD | 529 | JPM | 2 | 0 | 2 | |||||||||||||||||||||||
09/2012 | 5,987 | KRW | 6,952,343 | BRC | 51 | 0 | 51 | |||||||||||||||||||||||
10/2012 | ILS | 29,038 | $ | 7,479 | UAG | 78 | 0 | 78 | ||||||||||||||||||||||
02/2013 | CNY | 64,440 | 10,055 | BPS | 0 | (39 | ) | (39 | ) | |||||||||||||||||||||
02/2013 | 95,571 | 15,140 | CBK | 170 | 0 | 170 | ||||||||||||||||||||||||
02/2013 | 94,540 | 14,750 | DUB | 0 | (58 | ) | (58 | ) | ||||||||||||||||||||||
02/2013 | 23,658 | 3,692 | HUS | 0 | (14 | ) | (14 | ) | ||||||||||||||||||||||
02/2013 | 19,826 | 3,094 | JPM | 0 | (12 | ) | (12 | ) | ||||||||||||||||||||||
02/2013 | 75,632 | 11,800 | RYL | 0 | (47 | ) | (47 | ) | ||||||||||||||||||||||
02/2013 | $ | 60,829 | CNY | 381,967 | JPM | 0 | (1,000 | ) | (1,000 | ) | ||||||||||||||||||||
|
|
|
|
|
| |||||||||||||||||||||||||
| $ | 18,407 | $ | (16,355 | ) | $ | 2,052 | ||||||||||||||||||||||||
|
|
|
|
|
| |||||||||||||||||||||||||
| (j) | Fair Value Measurements (1) |
The following is a summary of the fair valuations according to the inputs used as of June 30, 2012 in valuing the Fund’s assets and liabilities (2):
| Category and Subcategory (3) | Level 1 (4) | Level 2 (5) | Level 3 (6) | Fair Value at 06/30/2012 | ||||||||||||
Investments, at value | ||||||||||||||||
Common Stocks | ||||||||||||||||
Bermuda | ||||||||||||||||
Energy | $ | 21,451 | $ | 36,971 | $ | 0 | $ | 58,422 | ||||||||
Financials | 0 | 78,177 | 0 | 78,177 | ||||||||||||
Brazil | ||||||||||||||||
Financials | 15,933 | 0 | 0 | 15,933 | ||||||||||||
Canada | ||||||||||||||||
Energy | 16,112 | 0 | 0 | 16,112 | ||||||||||||
Financials | 7,676 | 0 | 0 | 7,676 | ||||||||||||
Materials | 19,993 | 0 | 0 | 19,993 | ||||||||||||
Denmark | ||||||||||||||||
Consumer Staples | 0 | 35,761 | 0 | 35,761 | ||||||||||||
Financials | 0 | 9,472 | 0 | 9,472 | ||||||||||||
Faeroe Islands | ||||||||||||||||
Consumer Staples | 6,066 | 0 | 0 | 6,066 | ||||||||||||
Financials | 0 | 2,788 | 0 | 2,788 | ||||||||||||
France | ||||||||||||||||
Consumer Discretionary | 0 | 46,803 | 0 | 46,803 | ||||||||||||
Consumer Staples | 0 | 135,021 | 0 | 135,021 | ||||||||||||
Energy | 0 | 9,110 | 0 | 9,110 | ||||||||||||
Industrials | 0 | 21,037 | 0 | 21,037 | ||||||||||||
Utilities | 0 | 25,794 | 0 | 25,794 | ||||||||||||
Germany | ||||||||||||||||
Health Care | 0 | 28,293 | 0 | 28,293 | ||||||||||||
Industrials | 0 | 3,930 | 0 | 3,930 | ||||||||||||
Utilities | 0 | 13,581 | 0 | 13,581 | ||||||||||||
Guernsey, Channel Islands | ||||||||||||||||
Financials | 0 | 15,802 | 0 | 15,802 | ||||||||||||
Hong Kong | ||||||||||||||||
Consumer Discretionary | 0 | 9,362 | 0 | 9,362 | ||||||||||||
Financials | 0 | 57,515 | 0 | 57,515 | ||||||||||||
Industrials | 0 | 7,316 | 0 | 7,316 | ||||||||||||
Israel | ||||||||||||||||
Health Care | 12,422 | 0 | 0 | 12,422 | ||||||||||||
Japan | ||||||||||||||||
Industrials | 0 | 12,921 | 0 | 12,921 | ||||||||||||
Information Technology | 0 | 26,327 | 0 | 26,327 | ||||||||||||
| Category and Subcategory (3) | Level 1 (4) | Level 2 (5) | Level 3 (6) | Fair Value at 06/30/2012 | ||||||||||||
Netherlands | ||||||||||||||||
Consumer Staples | $ | 0 | $ | 30,808 | $ | 0 | $ | 30,808 | ||||||||
Energy | 0 | 17,059 | 0 | 17,059 | ||||||||||||
Financials | 0 | 25,512 | 0 | 25,512 | ||||||||||||
Information Technology | 0 | 16,401 | 0 | 16,401 | ||||||||||||
Telecommunication Services | 0 | 30,988 | 0 | 30,988 | ||||||||||||
Norway | ||||||||||||||||
Consumer Staples | 0 | 32,116 | 0 | 32,116 | ||||||||||||
Industrials | 0 | 10,548 | 0 | 10,548 | ||||||||||||
Singapore | ||||||||||||||||
Financials | 0 | 860 | 0 | 860 | ||||||||||||
Industrials | 0 | 16,322 | 0 | 16,322 | ||||||||||||
South Africa | ||||||||||||||||
Materials | 21,096 | 0 | 0 | 21,096 | ||||||||||||
South Korea | ||||||||||||||||
Consumer Discretionary | 0 | 8,320 | 0 | 8,320 | ||||||||||||
Spain | ||||||||||||||||
Consumer Staples | 0 | 5,322 | 0 | 5,322 | ||||||||||||
Sweden | ||||||||||||||||
Industrials | 0 | 16,637 | 0 | 16,637 | ||||||||||||
Switzerland | ||||||||||||||||
Consumer Staples | 0 | 29,260 | 0 | 29,260 | ||||||||||||
Financials | 0 | 12,049 | 0 | 12,049 | ||||||||||||
Health Care | 0 | 31,313 | 0 | 31,313 | ||||||||||||
Industrials | 0 | 11,797 | 0 | 11,797 | ||||||||||||
Materials | 0 | 9,672 | 0 | 9,672 | ||||||||||||
United Kingdom | ||||||||||||||||
Consumer Discretionary | 0 | 9,444 | 0 | 9,444 | ||||||||||||
Consumer Staples | 0 | 161,190 | 0 | 161,190 | ||||||||||||
Energy | 16,517 | 37,185 | 0 | 53,702 | ||||||||||||
Financials | 0 | 24,916 | 0 | 24,916 | ||||||||||||
United States | ||||||||||||||||
Consumer Staples | 141,885 | 0 | 0 | 141,885 | ||||||||||||
Energy | 13,979 | 0 | 0 | 13,979 | ||||||||||||
Financials | 193,491 | 0 | 0 | 193,491 | ||||||||||||
Health Care | 47,091 | 0 | 0 | 47,091 | ||||||||||||
Industrials | 70,576 | 0 | 0 | 70,576 | ||||||||||||
Information Technology | 133,929 | 0 | 0 | 133,929 | ||||||||||||
Materials | 1,769 | 0 | 0 | 1,769 | ||||||||||||
| See Accompanying Notes | ANNUAL REPORT | JUNE 30, 2012 | 69 |
Table of Contents
Consolidated Schedule of Investments PIMCO EqS Pathfinder Fund® (Cont.)
| Category and Subcategory (3) | Level 1 (4) | Level 2 (5) | Level 3 (6) | Fair Value at 06/30/2012 | ||||||||||||
Equity-Linked Securities | ||||||||||||||||
France | ||||||||||||||||
Energy | $ | 0 | $ | 31,369 | $ | 0 | $ | 31,369 | ||||||||
Netherlands | ||||||||||||||||
Utilities | 0 | 14,576 | 0 | 14,576 | ||||||||||||
Exchange-Traded Funds | ||||||||||||||||
United States | 81,256 | 0 | 0 | 81,256 | ||||||||||||
Preferred Stocks | ||||||||||||||||
Brazil | ||||||||||||||||
Banking & Finance | 5,099 | 0 | 0 | 5,099 | ||||||||||||
Rights | ||||||||||||||||
France | ||||||||||||||||
Health Care | 1,841 | 0 | 0 | 1,841 | ||||||||||||
Short-Term Instruments | ||||||||||||||||
Repurchase Agreements | 0 | 486 | 0 | 486 | ||||||||||||
U.S. Treasury Bills | 0 | 1,345 | 0 | 1,345 | ||||||||||||
PIMCO Short-Term Floating NAV Portfolio | 129,357 | 0 | 0 | 129,357 | ||||||||||||
Purchased Options | ||||||||||||||||
Equity Contracts | 3,761 | 0 | 0 | 3,761 | ||||||||||||
| Category and Subcategory (3) | Level 1 (4) | Level 2 (5) | Level 3 (6) | Fair Value at 06/30/2012 | ||||||||||||
Foreign Exchange Contracts | $ | 0 | $ | 12 | $ | 0 | $ | 12 | ||||||||
| $ | 961,300 | $ | 1,161,488 | $ | 0 | $ | 2,122,788 | |||||||||
Financial Derivative Instruments (7) - Assets |
| |||||||||||||||
Equity Contracts | 0 | 680 | 0 | 680 | ||||||||||||
Foreign Exchange Contracts | 0 | 18,407 | 0 | 18,407 | ||||||||||||
| $ | 0 | $ | 19,087 | $ | 0 | $ | 19,087 | |||||||||
Financial Derivative Instruments (7) - Liabilities |
| |||||||||||||||
Equity Contracts | (335 | ) | (415 | ) | 0 | (750 | ) | |||||||||
Foreign Exchange Contracts | 0 | (16,355 | ) | 0 | (16,355 | ) | ||||||||||
| $ | (335 | ) | $ | (16,770 | ) | $ | 0 | $ | (17,105 | ) | ||||||
Totals | $ | 960,965 | $ | 1,163,805 | $ | 0 | $ | 2,124,770 | ||||||||
| (1) | See note 3 in the Notes to Financial Statements for more information regarding pricing inputs and valuation techniques. |
| (2) | There were no significant transfers into or out of level 1, 2, and 3 during the period ended June 30, 2012. |
| (3) | Refer to the Consolidated Schedule of Investments for additional information. |
| (4) | Quoted prices in active markets for identical investments. |
| (5) | Significant other observable inputs. |
| (6) | Significant unobservable inputs. |
| (7) | Financial Derivative Instruments may include open futures contracts, swap agreements, written options, and foreign currency contracts. |
| (k) | Fair Value of Financial Derivative Instruments (1) |
The following is a summary of the fair valuation of the Fund’s derivative instruments categorized by risk exposure:
Fair Values of Financial Derivative Instruments on the Consolidated Statements of Assets and Liabilities as of June 30, 2012:
| Derivatives not accounted for as hedging instruments | ||||||||||||||||||||||||
| Commodity Contracts | Credit Contracts | Equity Contracts | Foreign Exchange Contracts | Interest Rate Contracts | Total | |||||||||||||||||||
Assets: | ||||||||||||||||||||||||
Investments, at value (purchased options) | $ | 0 | $ | 0 | $ | 3,761 | $ | 12 | $ | 0 | $ | 3,773 | ||||||||||||
Unrealized appreciation on foreign currency contracts | 0 | 0 | 0 | 18,407 | 0 | 18,407 | ||||||||||||||||||
Unrealized appreciation on OTC swap agreements | 0 | 0 | 680 | 0 | 0 | 680 | ||||||||||||||||||
|
|
|
|
|
|
|
|
|
|
|
| |||||||||||||
| $ | 0 | $ | 0 | $ | 4,441 | $ | 18,419 | $ | 0 | $ | 22,860 | |||||||||||||
|
|
|
|
|
|
|
|
|
|
|
| |||||||||||||
Liabilities: | ||||||||||||||||||||||||
Written options outstanding | $ | 0 | $ | 0 | $ | 374 | $ | 0 | $ | 0 | $ | 374 | ||||||||||||
Unrealized depreciation on foreign currency contracts | 0 | 0 | 0 | 16,355 | 0 | 16,355 | ||||||||||||||||||
Unrealized depreciation on OTC swap agreements | 0 | 0 | 376 | 0 | 0 | 376 | ||||||||||||||||||
|
|
|
|
|
|
|
|
|
|
|
| |||||||||||||
| $ | 0 | $ | 0 | $ | 750 | $ | 16,355 | $ | 0 | $ | 17,105 | |||||||||||||
|
|
|
|
|
|
|
|
|
|
|
| |||||||||||||
The Effect of Financial Derivative Instruments on the Consolidated Statements of Operations for the Period Ended June 30, 2012:
| Derivatives not accounted for as hedging instruments | ||||||||||||||||||||||||
| Commodity Contracts | Credit Contracts | Equity Contracts | Foreign Exchange Contracts | Interest Rate Contracts | Total | |||||||||||||||||||
Realized Gain (Loss) on Derivatives Recognized as a Result from Operations: | ||||||||||||||||||||||||
Net realized (loss) on investments (purchased options) | $ | 0 | $ | 0 | $ | (11,045 | ) | $ | (3,340 | ) | $ | 0 | $ | (14,385 | ) | |||||||||
Net realized (loss) on futures contracts | 0 | 0 | (863 | ) | 0 | 0 | (863 | ) | ||||||||||||||||
Net realized (loss) on written options | 0 | 0 | (2,039 | ) | 0 | 0 | (2,039 | ) | ||||||||||||||||
Net realized gain on swaps | 0 | 0 | 439 | 0 | 0 | 439 | ||||||||||||||||||
Net realized gain on foreign currency transactions | 0 | 0 | 0 | 37,688 | 0 | 37,688 | ||||||||||||||||||
|
|
|
|
|
|
|
|
|
|
|
| |||||||||||||
| $ | 0 | $ | 0 | $ | (13,508 | ) | $ | 34,348 | $ | 0 | $ | 20,840 | ||||||||||||
|
|
|
|
|
|
|
|
|
|
|
| |||||||||||||
| 70 | PIMCO EQUITY SERIES | See Accompanying Notes |
Table of Contents
June 30, 2012
| Derivatives not accounted for as hedging instruments | ||||||||||||||||||||||||
| Commodity Contracts | Credit Contracts | Equity Contracts | Foreign Exchange Contracts | Interest Rate Contracts | Total | |||||||||||||||||||
Net Change in Unrealized Appreciation (Depreciation) on Derivatives Recognized as a Result of Operations: | ||||||||||||||||||||||||
Net change in unrealized appreciation (depreciation) on investments (purchased options) | $ | 0 | $ | 0 | $ | (2,691 | ) | $ | 694 | $ | 0 | $ | (1,997 | ) | ||||||||||
Net change in unrealized appreciation on written options | 0 | 0 | 3,338 | 0 | 0 | 3,338 | ||||||||||||||||||
Net change in unrealized appreciation on swaps | 0 | 0 | 300 | 0 | 0 | 300 | ||||||||||||||||||
Net change in unrealized appreciation on translation of assets and liabilities denominated in foreign currencies | 0 | 0 | 0 | 2,239 | 0 | 2,239 | ||||||||||||||||||
|
|
|
|
|
|
|
|
|
|
|
| |||||||||||||
| $ | 0 | $ | 0 | $ | 947 | $ | 2,933 | $ | 0 | $ | 3,880 | |||||||||||||
|
|
|
|
|
|
|
|
|
|
|
| |||||||||||||
| (1) | See note 6 in the Notes to Financial Statements for additional information. |
| (l) | Collateral (Received)/Pledged for OTC Financial Derivative Instruments |
The following is a summary by counterparty of the market value of OTC financial derivative instruments and collateral (received)/pledged as of June 30, 2012:
Counterparty | Total Market Value of OTC Derivatives | Collateral (Received)/Pledged | Net Exposures (1) | Total Market Value of OTC Derivatives | Collateral (Received)/Pledged | Net Exposures (1) | ||||||||||||||||||||||
| PIMCO EqS Pathfinder Fund® | PIMCO Cayman Commodity Fund IV Ltd. (Subsidiary) | |||||||||||||||||||||||||||
BOA | $ | (443 | ) | $ | (720 | ) | $ | (1,163 | ) | $ | 0 | $ | 0 | $ | 0 | |||||||||||||
BPS | (737 | ) | 0 | (737 | ) | 0 | 0 | 0 | ||||||||||||||||||||
BRC | 8 | 0 | 8 | 0 | 0 | 0 | ||||||||||||||||||||||
CBK | 1,043 | (1,560 | ) | (517 | ) | 0 | 0 | 0 | ||||||||||||||||||||
DUB | 574 | (1,760 | ) | (1,186 | ) | 0 | 0 | 0 | ||||||||||||||||||||
FBF | (1,150 | ) | (1,620 | ) | (2,770 | ) | 0 | 0 | 0 | |||||||||||||||||||
GLM | 0 | (1,060 | ) | 0 | 0 | 0 | 0 | |||||||||||||||||||||
GSC | 153 | 0 | 153 | 0 | 0 | 0 | ||||||||||||||||||||||
GST | 246 | (360 | ) | (114 | ) | 0 | 0 | 0 | ||||||||||||||||||||
HUS | 1,629 | (2,580 | ) | (951 | ) | 0 | 0 | 0 | ||||||||||||||||||||
JPM | (771 | ) | 619 | (152 | ) | 0 | 0 | 0 | ||||||||||||||||||||
MSC | 19 | 0 | 19 | 0 | 0 | 0 | ||||||||||||||||||||||
MYI | (39 | ) | 167 | 128 | 0 | 0 | 0 | |||||||||||||||||||||
RBC | 425 | 0 | 425 | 0 | 0 | 0 | ||||||||||||||||||||||
RYL | 1,454 | 559 | 2,013 | 0 | 0 | 0 | ||||||||||||||||||||||
UAG | (82 | ) | (300 | ) | (382 | ) | 0 | 0 | 0 | |||||||||||||||||||
| (1) | Net Exposure represents the net receivable/(payable) that would be due from/to the counterparty in the event of default. Exposure from OTC derivatives can only be netted across transactions governed under the same Master Agreement with the same legal entity. The Fund and subsidiary are recognized as two separate legal entities. As such, exposure cannot be netted. See note 7, Principal Risks, in the Notes to Financial Statements for more information regarding credit and counterparty risks. |
| See Accompanying Notes | ANNUAL REPORT | JUNE 30, 2012 | 71 |
Table of Contents
1. ORGANIZATION
PIMCO Equity Series (the “Trust”) was established as a Delaware statutory trust on December 28, 2009. The Trust is registered under the Investment Company Act of 1940, as amended (the “Act”), as an open-end management investment company (“Mutual Fund”). Information presented in these financial statements pertains to the Institutional Class, Class P, Administrative Class, Class D, Class A, Class C and Class R shares of the six funds (each a “Fund” and collectively the “Funds”) offered by the Trust.
2. SIGNIFICANT ACCOUNTING POLICIES
The following is a summary of significant accounting policies consistently followed by the Trust in the preparation of its financial statements in conformity with accounting principles generally accepted in the United States of America (“U.S. GAAP”). The preparation of financial statements in accordance with U.S. GAAP requires management to make estimates and assumptions that affect the reported amounts of assets and liabilities and disclosure of contingent assets and liabilities at the date of the financial statements and the reported amounts of increases and decreases in net assets from operations during the reporting period. Actual results could differ from those estimates.
(a) Determination of Net Asset Value The Net Asset Value (“NAV”) of a Fund’s shares is valued as of the close of regular trading (normally 4:00 p.m., Eastern time) (the “NYSE Close”) on each day that the New York Stock Exchange (“NYSE”) is open. Information that becomes known to a Fund or its agents after the NAV has been calculated on a particular day will not generally be used to retroactively adjust the price of a security or the NAV determined earlier that day.
(b) Securities Transactions and Investment Income Securities transactions are recorded as of the trade date for financial reporting purposes. Securities purchased or sold on a when-issued or delayed-delivery basis may be settled 15 days or more after the trade date. Realized gains and losses from securities sold are recorded on the identified cost basis. Dividend income is recorded on the ex-dividend date, except certain dividends from foreign securities where the ex-dividend date may have passed, which are recorded as soon as the Fund is informed of the ex-dividend date. Interest income, adjusted for the accretion of discounts and amortization of premiums, is recorded on the accrual basis from settlement date. Estimated tax liabilities on certain foreign securities are recorded on an accrual basis and are reflected as components of interest income or net change in unrealized gain/loss on investments on the Statements of Operations, as appropriate. Tax liabilities realized as a result of such security sales are reflected as a component of net realized gain/loss on investments on the Statements of Operations. Paydown gains and losses on mortgage-
related and other asset-backed securities are recorded as components of interest income on the Statements of Operations. Income or short-term capital gain distributions received from underlying funds are recorded as dividend income. Long-term capital gain distributions received from underlying funds are recorded as realized gains.
Debt obligations may be placed on non-accrual status and related interest income may be reduced by ceasing current accruals and writing off interest receivable when the collection of all or a portion of interest has become doubtful based on consistently applied procedures. A debt obligation is removed from non-accrual status when the issuer resumes interest payments or when collectability of interest is reasonably assured.
(c) Foreign Currency Translation The functional and reporting currency for the Funds is the U.S. dollar. Portfolio securities and other assets and liabilities denominated in foreign currencies are translated into U.S. dollars based on the exchange rate of such currencies against U.S. dollars on the date of valuation. Purchases and sales of securities, income and expense items denominated in foreign currencies are translated into U.S. dollars at the exchange rate in effect on the transaction date.
A Fund does not separately report the effect of changes in foreign exchange rates from changes in market prices on securities held. Such changes are included in net realized and unrealized gain or loss from investments on the Statements of Operations.
Realized foreign exchange gains or losses arise from sales of foreign currencies, currency gains or losses realized between the trade and settlement dates on securities transactions and the difference between the recorded amounts of dividend, interest, and foreign withholding taxes and the U.S. dollar equivalent of the amounts actually received or paid. Net unrealized foreign exchange gains and losses arise from changes in foreign exchange rates on foreign denominated assets and liabilities other than investments in securities held at the end of the reporting period.
(d) Multiclass Operations Each class offered by the Trust has equal rights as to assets and voting privileges (except that shareholders of a class have exclusive voting rights regarding any matter relating solely to that class of shares). For daily dividend funds, income and non-class specific expenses are allocated daily to each class on the basis of the relative value of settled shares. For non-daily dividend funds, income and non-class specific expenses are allocated daily to each class on the basis of the relative net assets. Realized and unrealized capital gains and losses are allocated daily based on the relative net assets of each class of the respective Fund. Class specific expenses, where applicable, currently include supervisory and administrative and distribution and servicing fees.
| 72 | PIMCO EQUITY SERIES |
Table of Contents
June 30, 2012
(e) Dividends and Distributions to Shareholders Dividends from net investment income, if any, of each Fund, except the PIMCO Dividend and Income Builder Fund and PIMCO EqSTM Dividend Fund, are declared and distributed to shareholders annually. Dividends from net investment income, if any, of the PIMCO Dividend and Income Builder Fund and PIMCO EqSTM Dividend Fund are declared daily and distributed to shareholders quarterly. Net realized capital gains earned by each Fund, if any, will be distributed no less frequently than once each year.
Income dividends and capital gain distributions are determined in accordance with income tax regulations which may differ from U.S. GAAP. Differences between tax regulations and U.S. GAAP may change the fiscal year when income and capital items are recognized for tax and U.S. GAAP purposes. Examples of events that give rise to timing differences include wash sales, straddles and capital loss carryforwards. Further, the character of investment income and capital gains may be different for certain transactions under the two methods of accounting. Examples of characterization differences include the treatment of swaps, foreign currency transactions and investments in passive foreign investment companies. As a result, income dividends and capital gain distributions declared during a fiscal period may differ significantly from the net investment income and realized gains reported on each Fund’s annual financial statements presented under U.S. GAAP.
Distributions classified as a tax basis return of capital, if any, are reflected on the accompanying Statements of Changes in Net Assets and have been recorded to paid in capital. In addition, other amounts have been reclassified between undistributed net investment income, accumulated undistributed net realized gains or losses and/or paid in capital to more appropriately conform financial accounting to tax characterizations of dividend distributions.
(f) Statement of Cash Flows U.S. GAAP requires entities providing financial statements that report both a financial position and results of operations to also provide a statement of cash flows for each period for which results of operations are provided, but exempts investment companies meeting certain conditions. One of the conditions is that the enterprise had little or no debt, based on the average debt outstanding during the period, in relation to average total assets. Funds with certain degrees of borrowing activity, typically through the use of short sale transactions have been determined to be at a level requiring a Statement of Cash Flows. Statements of Cash Flows have been prepared using the indirect method which requires net assets to be adjusted to reconcile to net cash flows from operating activities.
(g) New Accounting Pronouncements In April 2011, the Financial Accounting Standards Board (“FASB”) issued an Accounting Standards Update (“ASU”) related to the accounting for repurchase agreements
and similar agreements that both entitle and obligate a transferor to repurchase or redeem financial assets before their maturity. The ASU modifies the criteria for determining effective control of transferred assets and as a result certain agreements may now be accounted for as secured borrowings. The ASU is effective prospectively for new transfers and existing transactions that are modified in the first interim or annual period beginning on or after December 15, 2011. Management anticipates certain Funds may recognize additional borrowing expense (interest expense) as a result of the change of accounting treatment. The magnitude of this change has not been determined at this time.
In May 2011, FASB issued an ASU to develop common requirements for measuring fair value and for disclosing information about fair value measurements in accordance with U.S. GAAP and International Financial Reporting Standards (“IFRS”). FASB concluded that the amendments in this ASU will improve the comparability of fair value measurements presented and disclosed in financial statements prepared in accordance with U.S. GAAP and IFRS. The ASU is effective prospectively during interim or annual periods beginning on or after December 15, 2011. Management has evaluated the amendments to the ASU and anticipates modifications to the fair value disclosure to enhance the description of the valuation methods.
In December 2011, FASB issued an ASU to enhance disclosures about financial instruments and derivative instruments that are subject to offsetting (“netting”) on the Statements of Assets and Liabilities. This information will enable users of the entity’s financial statements to evaluate the effect or potential effect of netting arrangements on the entity’s financial position. The ASU is effective prospectively during interim or annual periods beginning on or after January 1, 2013. At this time, management is evaluating the implications of these changes on the financial statements.
3. INVESTMENT VALUATION AND FAIR VALUE MEASUREMENTS
For purposes of calculating the NAV, portfolio securities and other assets for which market quotes are readily available are valued at fair market value. Fair market value is generally determined on the basis of last reported sales prices, or if no sales are reported, based on quotes obtained from a quotation reporting system, established market makers, or pricing services.
Investments initially valued in currencies other than the U.S. dollar are converted to the U.S. dollar using exchange rates obtained from pricing service providers. As a result, the NAV of a Fund’s shares may be affected by changes in the value of currencies in relation to the U.S. dollar. The value of securities traded in markets outside the United States or denominated in currencies other than the U.S. dollar may be
| ANNUAL REPORT | JUNE 30, 2012 | 73 |
Table of Contents
Notes to Financial Statements (Cont.)
affected significantly on a day that the NYSE is closed and the NAV may change on days when an investor is not able to purchase, redeem or exchange shares.
U.S. GAAP defines fair market value as the price that a Fund would receive to sell an asset or pay to transfer a liability in an orderly transaction between market participants at the measurement date. It establishes a fair value hierarchy that prioritizes inputs to valuation methods and requires disclosure of the fair value hierarchy, separately for each major category of assets and liabilities, that segregates fair value measurements into levels (Level 1, 2, and 3). The inputs or methodology used for valuing securities are not necessarily an indication of the risk associated with investing in those securities. Levels 1, 2, and 3 of the fair value hierarchy are defined as follows:
| n | Level 1—Inputs using quoted prices in active markets or exchanges for identical assets and liabilities. |
| n | Level 2—Significant other observable inputs, which may include, but are not limited to, quoted prices for similar assets or liabilities in markets that are active, quoted prices for identical or similar assets or liabilities in markets that are not active, inputs other than quoted prices that are observable for the assets or liabilities (such as interest rates, yield curves, volatilities, prepayment speeds, loss severities, credit risks and default rates) or other market corroborated inputs. |
| n | Level 3—Significant unobservable inputs based on the best information available in the circumstances, to the extent observable inputs are not available, which may include assumptions made by the Board of Trustees (the “Board”) or persons acting at their direction that are used in determining the fair value of investments. |
Level 1 and Level 2 trading assets and trading liabilities, at fair market value The valuation techniques and significant inputs used in determining the fair market values of financial instruments classified as Level 1 and Level 2 of the fair value hierarchy are as follows:
Fixed income securities including corporate, convertible and municipal bonds and notes, U.S. government agencies, U.S. treasury obligations, sovereign issues, bank loans, convertible preferred securities and non-U.S. bonds are normally valued by pricing service providers that use broker dealer quotations, reported trades or valuation estimates from their internal pricing models. The service providers’ internal models use inputs that are observable such as issuer details, interest rates, yield curves, prepayment speeds, credit risks/spreads, default rates and quoted prices for similar assets. Securities that use similar valuation techniques and inputs as described above are categorized as Level 2 of the fair value hierarchy.
Mortgage-related and asset-backed securities are usually issued as separate tranches, or classes, of securities within each deal. These securities are also normally valued by pricing service providers that use broker dealer quotations or valuation estimates from their internal pricing models. The pricing models for these securities usually consider
tranche-level attributes, current market data, estimated cash flows and market-based yield spreads for each tranche, and incorporate deal collateral performance, as available. Mortgage-related and asset-backed securities that use similar valuation techniques and inputs as described above are categorized as Level 2 of the fair value hierarchy.
Common stocks, exchange-traded funds and financial derivative instruments, such as futures contracts or options contracts that are traded on a national securities exchange, are stated at the last reported sale or settlement price on the day of valuation. To the extent these securities are actively traded and valuation adjustments are not applied, they are categorized as Level 1 of the fair value hierarchy. Valuation adjustments may be applied to certain securities that are solely traded on a foreign exchange to account for the market movement between the close of the foreign market and the close of the NYSE. These securities are valued using pricing service providers that consider the correlation of the trading patterns of the foreign security to the intraday trading in the U.S. markets for investments. Securities using these valuation adjustments are categorized as Level 2 of the fair value hierarchy. Preferred securities and other equities traded on inactive markets or valued by reference to similar instruments are also categorized as Level 2 of the fair value hierarchy.
Equity-linked securities are valued by referencing the last reported sale or settlement price of the linked referenced equity on the day of valuation. Foreign exchange adjustments are applied to the last reported price to convert the linked equity’s trading currency to the contract’s settling currency. These investments are categorized as Level 2 of the fair value hierarchy.
Investments in registered open-end investment management companies will be valued based upon the NAVs of such investments and are categorized as Level 1 of the fair value hierarchy. Investments in unregistered open-end management investment companies will be calculated based upon the NAVs of such investments and are considered Level 1 provided that the NAVs are observable, calculated daily and are the value at which both purchases and sales will be conducted. Investments in privately held investment funds with significant restrictions on redemptions where the inputs of NAVs are observable will be valued based upon the NAVs of such investments and are categorized as Level 2 of the fair value hierarchy.
Short-term investments having a maturity of 60 days or less are generally valued at amortized cost which approximates fair market value. These investments are categorized as Level 2 of the fair value hierarchy.
Over-the-counter financial derivative instruments, such as foreign currency contracts, options contracts, or swap agreements, derive their value from underlying asset prices, indices, reference rates, and other
| 74 | PIMCO EQUITY SERIES |
Table of Contents
June 30, 2012
inputs or a combination of these factors. These contracts are normally valued on the basis of broker dealer quotations or by pricing service providers. Depending on the product and the terms of the transaction, the value of financial derivatives can be estimated by a pricing service provider using a series of techniques, including simulation pricing models. The pricing models use inputs that are observed from actively quoted markets such as issuer details, indices, spreads, interest rates, yield curves, dividends and exchange rates. Financial derivatives that use similar valuation techniques and inputs as described above are categorized as Level 2 of the fair value hierarchy.
Centrally cleared swaps listed or traded on a multilateral or trade facility platform, such as a registered exchange, are valued at the daily settlement price determined by the respective exchange. For centrally cleared credit default swaps the clearing facility requires its members to provide actionable levels across complete term structures. These levels along with external third party prices are used to produce daily settlement prices. These securities are categorized as Level 2 of the fair value hierarchy. Centrally cleared interest rate swaps are valued using a pricing model that references the underlying rates including the overnight index swap rate and London Interbank Offered Rate (“LIBOR”) forward rate to produce the daily settlement price. These securities are categorized as Level 2 of the fair value hierarchy.
Level 3 trading assets and trading liabilities, at fair value The valuation techniques and significant inputs used in determining the fair values of financial instruments classified as Level 3 of the fair value hierarchy are as follows:
Securities and other assets for which market quotes are not readily available are valued at fair value as determined in good faith by the Board or persons acting at their direction and are categorized as Level 3 of the fair value hierarchy.
Market quotes are considered not readily available in circumstances where there is an absence of current or reliable market-based data (e.g., trade information or broker quotes), including where events occur after the close of the relevant market, but prior to the NYSE Close, that materially affect the values of a Fund’s securities or assets. In addition, market quotes are considered not readily available when, due to extraordinary circumstances, the exchanges or markets on which the securities trade do not open for trading for the entire day and no other market prices are available. The Board has delegated to the investment adviser (the “Adviser”), Pacific Investment Management Company LLC (“PIMCO”), the responsibility for monitoring significant events that may materially affect the values of a Fund’s securities or assets and for determining whether the value of the applicable securities or assets should be re-evaluated in light of such significant events.
The Board has adopted methods for valuing securities and other assets in circumstances where market quotes are not readily available, and has delegated the responsibility for applying the valuation methods to PIMCO. For instances in which daily market quotes are not readily available, investments may be valued, pursuant to guidelines established by the Board, with reference to other securities or indices. In the event that the security or asset cannot be valued pursuant to one of the valuation methods established by the Board, the value of the security or asset will be determined in good faith by the Valuation Committee of the Board, generally based upon recommendations provided by PIMCO. When a fair valuation method is applied by PIMCO that uses significant unobservable inputs, securities will be priced by a method that the Board or persons acting at their direction believe accurately reflects fair value and are categorized as Level 3 of the fair value hierarchy. These methods may require subjective determinations about the value of a security. While the Trust’s policy is intended to result in a calculation of a Fund’s NAV that fairly reflects security values as of the time of pricing, the Trust cannot guarantee that values determined by the Board or persons acting at their direction would accurately reflect the price that a Fund could obtain for a security if it were to dispose of that security as of the time of pricing (for instance, in a forced or distressed sale). The prices used by a Fund may differ from the value that would be realized if the securities were sold.
For fair valuations using significant unobservable inputs, U.S. GAAP requires a reconciliation of the beginning to ending balances for reported fair values that presents changes attributable to total realized and unrealized gains or losses, purchases and sales, and transfers in or out of the Level 3 category during the period. The end of period timing recognition is used for the significant transfers between Levels of the Funds’ assets and liabilities. In accordance with the requirements of U.S. GAAP, a fair value hierarchy and Level 3 reconciliation, if any, have been included in the Notes to the Schedule of Investments for each respective Fund.
4. SECURITIES AND OTHER INVESTMENTS
(a) Equity-Linked Securities A Fund may purchase equity-linked securities, also known as participation notes, equity swaps, and zero strike calls and warrants. Equity-linked securities are primarily used by a Fund as an alternative means to more efficiently and effectively access what is generally an emerging securities market. A Fund deposits cash with its custodian (or broker, if legally permitted) in an amount near or equal to the selling price of the underlying security in exchange for an equity-linked security. Upon sale, a Fund receives cash from the broker or custodian equal to the value of the underlying security. Aside from market risk of the underlying securities, there is a risk of default by the counterparty to the transaction. In the event of insolvency of the counterparty, a Fund might be unable to obtain its expected benefit. In
| ANNUAL REPORT | JUNE 30, 2012 | 75 |
Table of Contents
Notes to Financial Statements (Cont.)
addition, while a Fund will seek to enter into such transactions only with parties that are capable of entering into closing transactions with the Fund, there can be no assurance that the Fund will be able to close out such a transaction with the counterparty or obtain an offsetting position with any counterparty, at any time prior to the end of the term of the underlying agreement. This may impair a Fund’s ability to enter into other transactions at a time when doing so might be advantageous.
(b) Exchange-Traded Funds The Funds may invest in exchange-traded funds (“ETFs”), which generally are index-based investment companies that hold substantially all of their assets in securities representing their specific index. Shares of ETFs trade throughout the day on an exchange and represent an investment in a portfolio of securities and assets. As a shareholder of another investment company, the Funds would bear their pro rata portion of the other investment company’s expenses, including advisory fees, in addition to the expenses the Funds bear directly in connection with their own operations.
(c) Mortgage-Related and Other Asset-Backed Securities Certain Funds may invest in mortgage-related and other asset-backed securities. These securities include mortgage pass-through securities, collateralized mortgage obligations, commercial mortgage-backed securities, asset-backed securities, collateralized debt obligations and other securities that directly or indirectly represent a participation in, or are secured by and payable from, mortgage loans on real property. Mortgage-related and other asset-backed securities are interests in pools of loans or other receivables. Mortgage-related securities are created from pools of residential or commercial mortgage loans, including mortgage loans made by savings and loan institutions, mortgage bankers, commercial banks and others. Asset-backed securities are created from many types of assets, including auto loans, credit card receivables, home equity loans, and student loans. These securities provide a monthly payment which consists of both interest and principal payments. Interest payments may be determined by fixed or adjustable rates. The rate of prepayments on underlying mortgages will affect the price and volatility of a mortgage-related security, and may have the effect of shortening or extending the effective duration of the security relative to what was anticipated at the time of purchase. The timely payment of principal and interest of certain mortgage-related securities is guaranteed with the full faith and credit of the U.S. Government. Pools created and guaranteed by non-governmental issuers, including government-sponsored corporations, may be supported by various forms of insurance or guarantees, but there can be no assurance that the private insurers or guarantors can meet their obligations under the insurance policies or guarantee arrangements.
Collateralized Mortgage Obligations (“CMOs”) are debt obligations of a legal entity that are collateralized by mortgages and divided into
classes. CMOs are structured into multiple classes, often referred to as “tranches,” with each class bearing a different stated maturity and entitled to a different schedule for payments of principal and interest, including prepayments. Commercial Mortgage-Backed Securities (“CMBS”) include securities that reflect an interest in, and are secured by, mortgage loans on commercial real property. Many of the risks of investing in CMBS reflect the risks of investing in the real estate securing the underlying mortgage loans. These risks reflect the effects of local and other economic conditions on real estate markets, the ability of tenants to make loan payments, and the ability of a property to attract and retain tenants. CMOs and CMBS may be less liquid and may exhibit greater price volatility than other types of mortgage-related or asset-backed securities.
Collateralized Debt Obligations (“CDOs”) include Collateralized Bond Obligations (“CBOs”), Collateralized Loan Obligations (“CLOs”) and other similarly structured securities. CBOs and CLOs are types of asset-backed securities. A CBO is a trust which is backed by a diversified pool of high risk, below investment grade fixed income securities. A CLO is a trust typically collateralized by a pool of loans, which may include, among others, domestic and foreign senior secured loans, senior unsecured loans, and subordinate corporate loans, including loans that may be rated below investment grade or equivalent unrated loans. The risks of an investment in a CDO depend largely on the type of the collateral securities and the class of the CDO in which a Fund invests. CDOs carry additional risks including, but not limited to, (i) the possibility that distributions from collateral securities will not be adequate to make interest or other payments, (ii) the collateral may decline in value or default, (iii) a Fund may invest in CDOs that are subordinate to other classes, and (iv) the complex structure of the security may not be fully understood at the time of investment and may produce disputes with the issuer or unexpected investment results.
(d) U.S. Government Agencies or Government-Sponsored Enterprises Certain Funds may invest in securities of U.S. Government agencies or government-sponsored enterprises. U.S. Government securities are obligations of and, in certain cases, guaranteed by, the U.S. Government, its agencies or instrumentalities. Some U.S. Government securities, such as Treasury bills, are supported by the full faith and credit of the U.S. Government. U.S. Government securities may include zero coupon securities, which do not distribute interest on a current basis and tend to be subject to greater risk than interest-paying securities of similar maturities.
5. BORROWINGS AND OTHER FINANCING TRANSACTIONS
The following disclosures contain information on a Fund’s ability to lend or borrow cash or securities to the extent permitted under the Act, which may be viewed as borrowing or financing transactions by the
| 76 | PIMCO EQUITY SERIES |
Table of Contents
June 30, 2012
Fund. The location and fair value amounts of these instruments are described below. For a detailed description of credit and counterparty risks that can be associated with borrowings and other financing transactions, please see Note 7, Principal Risks.
(a) Repurchase Agreements Each Fund may engage in repurchase agreements. Under the terms of a typical repurchase agreement, a Fund takes possession of an underlying debt obligation (collateral) subject to an obligation of the seller to repurchase, and a Fund to resell, the obligation at an agreed-upon price and time. The underlying securities for all repurchase agreements are held in safekeeping at the Fund’s custodian or designated subcustodians under tri-party repurchase agreements. The market value of the collateral must be equal to or exceed the total amount of the repurchase obligations, including interest. Securities purchased under repurchase agreements are reflected as an asset on the Statements of Assets and Liabilities. Interest earned is recorded as a component of interest income on the Statements of Operations. In periods of increased demand for collateral, a Fund may pay a fee for receipt of collateral, which may result in interest expense to the Fund.
(b) Short Sales Certain Funds may enter into short sales transactions. Short sales are transactions in which a Fund sells a security that it may not own. A Fund may make short sales of securities to (i) offset potential declines in long positions in similar securities, (ii) to increase the flexibility of the Fund, (iii) for investment return, (iv) as part of a risk arbitrage strategy, and (v) as part of its overall portfolio management strategies involving the use of derivative instruments. When a Fund engages in a short sale, it may borrow the security sold short and deliver it to the counterparty. A Fund will ordinarily have to pay a fee or premium to borrow a security and be obligated to repay the lender of the security any dividend or interest that accrues on the security during the period of the loan. Securities sold in short sale transactions and the dividend or interest payable on such securities, if any, are reflected as payable for short sales on the Statements of Assets and Liabilities. Short sales expose a Fund to the risk that it will be required to cover its short position at a time when the security or other asset has appreciated in value, thus resulting in losses to the Fund. A short sale is “against the box” if a Fund holds in its portfolio or has the right to acquire the security sold short at no additional cost. A Fund will be subject to additional risks to the extent that it engages in short sales that are not “against the box.” A Fund’s loss on a short sale could theoretically be unlimited in cases where the Fund is unable, for whatever reason, to close out its short position.
6. FINANCIAL DERIVATIVE INSTRUMENTS
The following disclosures contain information on how and why the Funds use financial derivative instruments, the credit-risk-related contingent features in certain financial derivative instruments, and how
financial derivative instruments affect the Funds’ financial position, results of operations and cash flows. The location and fair value amounts of these instruments on the Statements of Assets and Liabilities and the realized and changes in unrealized gains and losses on the Statements of Operations, each categorized by type of financial derivative contract and related risk exposure, are included in a table in the Notes to Schedules of Investments. The financial derivative instruments outstanding as of period end as disclosed in the Notes to Schedules of Investments and the amounts of realized and changes in unrealized gains and losses on financial derivative instruments during the period as disclosed on the Statements of Operations serve as indicators of the volume of financial derivative activity for the Funds.
(a) Foreign Currency Contracts Certain Funds may enter into foreign currency contracts in connection with settling planned purchases or sales of securities, to hedge the currency exposure associated with some or all of a Fund’s securities or as a part of an investment strategy. A foreign currency contract is an agreement between two parties to buy and sell a currency at a set price on a future date. The market value of a foreign currency contract fluctuates with changes in foreign currency exchange rates. Foreign currency contracts are marked to market daily and the change in value is recorded by a Fund as an unrealized gain or loss. Realized gains or losses equal to the difference between the value of the contract at the time it was opened and the value at the time it was closed are recorded upon delivery or receipt of the currency. These contracts may involve market risk in excess of the unrealized gain or loss reflected on the Statements of Assets and Liabilities. In addition, a Fund could be exposed to risk if the counterparties are unable to meet the terms of the contracts or if the value of the currency changes unfavorably to the U.S. dollar. In connection with these contracts, securities may be identified as collateral in accordance with the terms of the respective contracts.
(b) Futures Contracts Certain Funds may enter into futures contracts. A Fund may use futures contracts to manage its exposure to the securities markets or to movements in interest rates and currency values. The primary risks associated with the use of futures contracts are the imperfect correlation between the change in market value of the securities held by a Fund and the prices of futures contracts and the possibility of an illiquid market. Futures contracts are valued based upon their quoted daily settlement prices. Upon entering into a futures contract, a Fund is required to deposit with its futures broker, an amount of cash, or U.S. Government and Agency Obligations, or select sovereign debt, in accordance with the initial margin requirements of the broker or exchange. Futures contracts are marked to market daily and an appropriate payable or receivable for the change in value (“variation margin”) is recorded by the Fund. Gains or losses are recognized but not considered realized until the contracts expire or are closed. Futures contracts involve, to varying degrees, risk of loss in
| ANNUAL REPORT | JUNE 30, 2012 | 77 |
Table of Contents
Notes to Financial Statements (Cont.)
excess of the variation margin disclosed on the Statements of Assets and Liabilities.
(c) Options Contracts Certain Funds may write call and put options on securities and financial derivative instruments they own or in which they may invest. Writing put options tends to increase a Fund’s exposure to the underlying instrument. Writing call options tends to decrease a Fund’s exposure to the underlying instrument. When a Fund writes a call or put, an amount equal to the premium received is recorded as a liability and subsequently marked to market to reflect the current value of the option written. These liabilities are reflected as written options outstanding on the Statements of Assets and Liabilities. Premiums received from writing options which expire are treated as realized gains. Premiums received from writing options which are exercised or closed are added to the proceeds or offset against amounts paid on the underlying futures, swap, security or currency transaction to determine the realized gain or loss. Certain options may be written with premiums to be determined on a future date. The premiums for these options are based upon implied volatility parameters at specified terms. A Fund as a writer of an option has no control over whether the underlying instrument may be sold (call) or purchased (put) and as a result bears the market risk of an unfavorable change in the price of the instrument underlying the written option. There is the risk a Fund may not be able to enter into a closing transaction because of an illiquid market.
Certain Funds may also purchase put and call options. Purchasing call options tends to increase a Fund’s exposure to the underlying instrument. Purchasing put options tends to decrease a Fund’s exposure to the underlying instrument. A Fund pays a premium which is included on the Fund’s Statement of Assets and Liabilities as an investment and subsequently marked to market to reflect the current value of the option. Premiums paid for purchasing options which expire are treated as realized losses. Certain options may be purchased with premiums to be determined on a future date. The premiums for these options are based upon implied volatility parameters at specified terms. The risk associated with purchasing put and call options is limited to the premium paid. Premiums paid for purchasing options which are exercised or closed are added to the amounts paid or offset against the proceeds on the underlying investment transaction to determine the realized gain or loss when the underlying transaction is sold.
Foreign Currency Options Certain Funds may write or purchase foreign currency options. Purchasing foreign currency options gives a Fund the right, but not the obligation to buy or sell the currency and will specify the amount of currency and a rate of exchange that may be exercised by a specified date. These options may be used as a short or long hedge against possible variations in foreign exchange rates or to gain exposure to foreign currencies.
Options on Securities Certain Funds may write or purchase options on securities (“Equity Option”). An Equity Option uses a specified equity security as the underlying instrument for the option contract. A Fund may write or purchase options to enhance returns for a Fund or to hedge an existing position or future investment.
Options on Exchange-Traded Funds Certain Funds may write or purchase options on exchange-traded funds (“ETF Option”). An ETF Option uses a specified exchange-traded fund as the underlying instrument for the option contract. A Fund may write or purchase options to enhance returns or to hedge an existing position or future investment.
(d) Swap Agreements Certain Funds may invest in swap agreements. Swap agreements are bilaterally negotiated agreements between a Fund and a counterparty to exchange or swap investment cash flows, assets, foreign currencies or market-linked returns at specified, future intervals. Swap agreements are privately negotiated in the over-the-counter market (“OTC swaps”) or may be executed in a multilateral or other trade facility platform, such as a registered exchange (“centrally cleared swaps”). A Fund may enter into credit default, interest rate, total return and other forms of swap agreements to manage its exposure to credit, currency, interest rate, commodity, equity and inflation risk. In connection with these agreements, securities or cash may be identified as collateral or margin in accordance with the terms of the respective swap agreements to provide assets of value and recourse in the event of default or bankruptcy/insolvency.
Swaps are marked to market daily based upon values from third party vendors, which may include a registered exchange, or quotations from market makers to the extent available. In the event that market quotes are not readily available and the swap cannot be valued pursuant to one of the valuation methods, the value of the swap will be determined in good faith by the Valuation Committee of the Board of Trustees, generally based upon recommendations provided by PIMCO. Changes in market value, if any, are reflected as a component of net changes in unrealized appreciation/(depreciation) on the Statements of Operations. Daily changes in valuation of centrally cleared swaps, if any, are recorded as a receivable or payable for the change in value as appropriate (“variation margin”) on the Statements of Assets and Liabilities. OTC swap payments received or made at the beginning of the measurement period are reflected as such on the Statements of Assets and Liabilities and represent premiums paid or received upon entering into the swap agreement to compensate for differences between the stated terms of the swap agreement and prevailing market conditions (credit spreads, currency exchange rates, interest rates, and other relevant factors). These upfront premiums are recorded as realized gains or losses on the Statements of Operations upon termination or maturity of the swap. A liquidation payment received or
| 78 | PIMCO EQUITY SERIES |
Table of Contents
June 30, 2012
made at the termination of the swap is recorded as realized gain or loss on the Statements of Operations. Net periodic payments received or paid by a Fund are included as part of realized gains or losses on the Statements of Operations.
Entering into these agreements involves, to varying degrees, elements of interest, credit, market and documentation risk in excess of the amounts recognized on the Statements of Assets and Liabilities. Such risks involve the possibility that there will be no liquid market for these agreements, that the counterparty to the agreements may default on its obligation to perform or disagree as to the meaning of contractual terms in the agreements and that there may be unfavorable changes in interest rates.
A Fund’s maximum risk of loss from counterparty credit risk is the discounted net value of the cash flows to be received from the counterparty over the contract’s remaining life, to the extent that amount is positive. The risk is mitigated by having a master netting arrangement between a Fund and the counterparty and by the posting of collateral to a Fund to cover a Fund’s exposure to the counterparty.
Credit Default Swap Agreements Credit default swap agreements involve one party making a stream of payments (referred to as the buyer of protection) to another party (the seller of protection) in exchange for the right to receive a specified return in the event of a default or other credit event for the referenced entity, obligation or index. As a seller of protection on credit default swap agreements, a Fund will generally receive from the buyer of protection a fixed rate of income throughout the term of the swap provided that there is no credit event. As the seller, a Fund would effectively add leverage to its portfolio because, in addition to its total net assets, a Fund would be subject to investment exposure on the notional amount of the swap.
If a Fund is a seller of protection and a credit event occurs, as defined under the terms of that particular swap agreement, a Fund will either (i) pay to the buyer of protection an amount equal to the notional amount of the swap and take delivery of the referenced obligation, other deliverable obligations or underlying securities comprising the referenced index or (ii) pay a net settlement amount in the form of cash or securities equal to the notional amount of the swap less the recovery value of the referenced obligation or underlying securities comprising the referenced index. If a Fund is a buyer of protection and a credit event occurs, as defined under the terms of that particular swap agreement, a Fund will either (i) receive from the seller of protection an amount equal to the notional amount of the swap and deliver the referenced obligation, other deliverable obligations or underlying securities comprising the referenced index or (ii) receive a net settlement amount in the form of cash or securities equal to the notional amount of the swap less the recovery value of the referenced obligation or underlying securities comprising the referenced index.
Recovery values are estimated by market makers considering either industry standard recovery rates or entity specific factors and considerations until a credit event occurs. If a credit event has occurred, the recovery value is determined by a facilitated auction whereby a minimum number of allowable broker bids, together with a specified valuation method, are used to calculate the settlement value.
Credit default swap agreements on corporate or sovereign issues involve one party making a stream of payments to another party in exchange for the right to receive a specified return in the event of a default or other credit event. If a credit event occurs and cash settlement is not elected, a variety of other deliverable obligations may be delivered in lieu of the specific referenced obligation. The ability to deliver other obligations may result in a cheapest-to-deliver option (the buyer of protection’s right to choose the deliverable obligation with the lowest value following a credit event). A Fund may use credit default swaps on corporate or sovereign issues to provide a measure of protection against defaults of the issuers (i.e., to reduce risk where a Fund owns or has exposure to the referenced obligation) or to take an active long or short position with respect to the likelihood of a particular issuer’s default.
Credit default swap agreements on credit indices involve one party making a stream of payments to another party in exchange for the right to receive a specified return in the event of a write-down, principal shortfall, interest shortfall or default of all or part of the referenced entities comprising the credit index. A credit index is a basket of credit instruments or exposures designed to be representative of some part of the credit market as a whole. These indices are made up of reference credits that are judged by a poll of dealers to be the most liquid entities in the credit default swap market based on the sector of the index. Components of the indices may include, but are not limited to, investment grade securities, high yield securities, asset-backed securities, emerging markets, and/or various credit ratings within each sector. Credit indices are traded using credit default swaps with standardized terms including a fixed spread and standard maturity dates. An index credit default swap references all the names in the index, and if there is a default, the credit event is settled based on that name’s weight in the index. The composition of the indices changes periodically, usually every six months, and for most indices, each name has an equal weight in the index. A Fund may use credit default swaps on credit indices to hedge a portfolio of credit default swaps or bonds, which is less expensive than it would be to buy many credit default swaps to achieve a similar effect. Credit default swaps on indices are benchmarks for protecting investors owning bonds against default, and traders use them to speculate on changes in credit quality.
Implied credit spreads, represented in absolute terms, utilized in determining the market value of credit default swap agreements on
| ANNUAL REPORT | JUNE 30, 2012 | 79 |
Table of Contents
Notes to Financial Statements (Cont.)
corporate or sovereign issues as of period end are disclosed in the Notes to the Schedules of Investments and serve as an indicator of the current status of the payment/performance risk and represent the likelihood or risk of default for the credit derivative. The implied credit spread of a particular referenced entity reflects the cost of buying/selling protection and may include upfront payments required to be made to enter into the agreement. Wider credit spreads represent a deterioration of the referenced entity’s credit soundness and a greater likelihood or risk of default or other credit event occurring as defined under the terms of the agreement. For credit default swap agreements on asset-backed securities and credit indices, the quoted market prices and resulting values serve as the indicator of the current status of the payment/performance risk. Increasing market values, in absolute terms when compared to the notional amount of the swap, represent a deterioration of the referenced entity’s credit soundness and a greater likelihood or risk of default or other credit event occurring as defined under the terms of the agreement.
The maximum potential amount of future payments (undiscounted) that a Fund as a seller of protection could be required to make under a credit default swap agreement would be an amount equal to the notional amount of the agreement. Notional amounts of each individual credit default swap agreement outstanding as of June 30, 2012 for which a Fund is the seller of protection are disclosed in the Notes to the Schedules of Investments. These potential amounts would be partially offset by any recovery values of the respective referenced obligations, upfront payments received upon entering into the agreement, or net amounts received from the settlement of buy protection credit default swap agreements entered into by a Fund for the same referenced entity or entities.
Interest Rate Swap Agreements Certain Funds are subject to interest rate risk exposure in the normal course of pursuing their investment objectives. Because a Fund holds fixed rate bonds, the value of these bonds may decrease if interest rates rise. To help hedge against this risk and to maintain its ability to generate income at prevailing market rates, a Fund may enter into interest rate swap agreements. Interest rate swap agreements involve the exchange by a Fund with another party for their respective commitment to pay or receive interest on the notional amount of principal. Certain forms of interest rate swap agreements may include: (i) interest rate caps, under which, in return for a premium, one party agrees to make payments to the other to the extent that interest rates exceed a specified rate, or “cap”, (ii) interest rate floors, under which, in return for a premium, one party agrees to make payments to the other to the extent that interest rates fall below a specified rate, or “floor”, (iii) interest rate collars, under which a party sells a cap and purchases a floor or vice versa in an attempt to protect itself against interest rate movements exceeding given
minimum or maximum levels, (iv) callable interest rate swaps, under which the counterparty may terminate the swap transaction in whole at zero cost at a predetermined date and time prior to the maturity date, (v) spreadlocks, which allow the interest rate swap users to lock in the forward differential (or spread) between the interest rate swap rate and a specified benchmark, or (vi) basis swaps, under which two parties can exchange variable interest rates based on different money markets.
Total Return Swap Agreements Certain Funds may enter into total return swap agreements to gain or mitigate exposure of the underlying reference. Total return swap agreements involve commitments where cash flows are exchanged based on the price of an underlying reference and based on a fixed or variable rate. Total return swap agreements may involve commitments to pay interest in exchange for a market-linked return. One counterparty pays out the total return of a specific reference asset, which may include an underlying equity, index, or bond, and in return receives a fixed or variable rate. At the maturity date, a net cash flow is exchanged where the total return is equivalent to the return of the underlying reference less a financing rate, if any. As a receiver, a Fund would receive payments based on any positive total return and would owe payments in the event of a negative total return. As the payer, a Fund would owe payments on any net positive total return, and would receive payment in the event of a negative total return.
7. PRINCIPAL RISKS
In the normal course of business the Funds (or Underlying PIMCO Funds and/or Acquired Funds in the case of the mutual funds that pursue their investment objective by investing in other mutual funds (“PIMCO Fund of Funds”)) trade financial instruments and enter into financial transactions where risk of potential loss exists due to changes in the market (market risk), or failure or inability of the other party to a transaction to perform (credit and counterparty risk). See below for a detailed description of select principal risks. For a list of potential risks the Funds may be subject to, please see the Important Information About the Funds.
PIMCO Fund of Funds Because the PIMCO Fund of Funds invest substantially all of their respective assets in Underlying PIMCO Funds (or Acquired Funds), the risks associated with investing in the PIMCO Fund of Funds are closely related to the risks associated with the securities and other investments held by the Underlying PIMCO Funds (or Acquired Funds). The ability of the PIMCO Fund of Funds to achieve their respective investment objectives will depend upon the ability of the Underlying PIMCO Funds (or Acquired Funds) to achieve their respective investment objectives. There can be no assurance that the investment objective of any Underlying PIMCO Fund (or Acquired Fund) will be achieved. The net asset value of a PIMCO Fund of Funds will fluctuate in response to changes in the respective net asset values of
| 80 | PIMCO EQUITY SERIES |
Table of Contents
June 30, 2012
the Underlying PIMCO Funds (or Acquired Funds) in which it invests. The extent to which the investment performance and risks associated with the PIMCO Fund of Funds correlate to those of a particular Underlying PIMCO Fund (or Acquired Fund) will depend upon the extent to which the assets of the PIMCO Fund of Funds are allocated from time to time for investment in the Underlying PIMCO Funds (or Acquired Funds), which will vary.
Investing in Underlying PIMCO Funds (or Acquired Funds) involves certain additional expenses and tax results that would not be present in a direct investment in the Underlying PIMCO Funds (or Acquired Funds).
The investment performance depends upon how its assets are allocated and reallocated according to the PIMCO Fund of Fund’s asset allocation targets and ranges. A principal risk of investing in each PIMCO Fund of Funds is that the PIMCO Fund of Fund’s asset allocation sub-adviser will make less than optimal or poor asset allocation decisions. The asset allocation sub-adviser attempts to identify investment allocations for the Underlying PIMCO Funds (or Acquired Funds) that will provide consistent, quality performance for the PIMCO Fund of Funds, but there is no guarantee that such allocation techniques will produce the desired results. It is possible that the asset allocation sub-adviser will focus on an Underlying PIMCO Fund (or Acquired Fund) that performs poorly or underperforms other Underlying PIMCO Funds (or Acquired Funds) under various market conditions.
In the normal course of business the Underlying PIMCO Funds (or Acquired Funds) trade financial instruments and enter into financial transactions where risk of potential loss exists due to changes in the market (market risk), or failure or inability of the other party to a transaction to perform (credit and counterparty risk).
Market Risks A Fund’s (or Underlying PIMCO Fund’s and/or Acquired Fund’s in the case of the PIMCO Fund of Funds) investments in financial derivatives and other financial instruments expose the Fund to various risks such as, but not limited to, equity, interest rate, foreign currency and commodity risks.
The market values of equities, such as common stocks and preferred securities or equity related investments such as futures and options, may decline due to general market conditions which are not specifically related to a particular company, such as real or perceived adverse economic conditions, changes in the general outlook for corporate earnings, changes in interest or currency rates or adverse investor sentiment generally. They may also decline due to factors which affect a particular industry or industries, such as labor shortages or increased production costs and competitive conditions within an industry. Equity securities and equity related investments generally have greater market price volatility than fixed income securities.
Interest rate risk is the risk that fixed income securities will decline in value because of changes in interest rates. As nominal interest rates
rise, the value of certain fixed income securities held by a Fund (or Underlying PIMCO Fund and/or Acquired Fund in the case of the PIMCO Fund of Funds) is likely to decrease. A nominal interest rate can be described as the sum of a real interest rate and an expected inflation rate. Fixed income securities with longer durations tend to be more sensitive to changes in interest rates, usually making them more volatile than securities with shorter durations. Duration is useful primarily as a measure of the sensitivity of a fixed income’s market price to interest rate (i.e. yield) movements.
If a Fund (or Underlying PIMCO Fund and/or Acquired Fund in the case of the PIMCO Fund of Funds) invests directly in foreign currencies or in securities that trade in, and receive revenues in, foreign currencies, or in financial derivatives that provide exposure to foreign currencies, it will be subject to the risk that those currencies will decline in value relative to the base currency of the Fund (or Underlying PIMCO Fund and/or Acquired Fund in the case of the PIMCO Fund of Funds), or, in the case of hedging positions, that the Fund’s (or Underlying PIMCO Fund’s and/or Acquired Fund’s in the case of the PIMCO Fund of Funds) base currency will decline in value relative to the currency being hedged. Currency rates in foreign countries may fluctuate significantly over short periods of time for a number of reasons, including changes in interest rates, intervention (or the failure to intervene) by U.S. or foreign governments, central banks or supranational entities such as the International Monetary Fund, or by the imposition of currency controls or other political developments in the United States or abroad. As a result, a Fund’s (or Underlying PIMCO Fund’s and/or Acquired Fund’s in the case of a PIMCO Fund of Funds) investments in foreign currency denominated securities may reduce the returns of the Fund (or Underlying PIMCO Fund and/or Acquired Fund in the case of the PIMCO Fund of Funds).
A Fund’s (or Underlying PIMCO Fund’s and/or Acquired Fund’s in the case of a PIMCO Fund of Funds) investments in commodity-linked financial derivative instruments may subject the Fund to greater market price volatility than investments in traditional securities. The value of commodity-linked financial derivative instruments may be affected by changes in overall market movements, commodity index volatility, changes in interest rates, or factors affecting a particular industry or commodity, such as drought, floods, weather, livestock disease, embargoes, tariffs and international economic, political and regulatory developments.
Credit and Counterparty Risks A Fund (or Underlying PIMCO Fund and/or Acquired Fund in the case of a PIMCO Fund of Funds) will be exposed to credit risk on parties with whom it trades and will also bear the risk of settlement default. A Fund (or Underlying PIMCO Fund and/or Acquired Fund in the case of a PIMCO Fund of Funds) minimizes concentrations of credit risk by undertaking transactions with a large number of customers and counterparties on recognized and reputable
| ANNUAL REPORT | JUNE 30, 2012 | 81 |
Table of Contents
Notes to Financial Statements (Cont.)
exchanges. A Fund (or Underlying PIMCO Fund and/or Acquired Fund in the case of a PIMCO Fund of Funds) could lose money if the issuer or guarantor of a fixed income security, or the counterparty to a financial derivatives contract, repurchase agreement or a loan of portfolio securities, is unable or unwilling to make timely principal and/or interest payments, or to otherwise honor its obligations. Securities are subject to varying degrees of credit risk, which are often reflected in credit ratings.
Similar to credit risk, a Fund (or Underlying PIMCO Fund and/or Acquired Fund in the case of a PIMCO Fund of Funds) may be exposed to counterparty risk, or the risk that an institution or other entity with which the Fund (or Underlying PIMCO Fund and/or Acquired Fund in the case of the PIMCO Fund of Funds) has unsettled or open transactions will default. Financial assets, which potentially expose a Fund to counterparty risk, consist principally of cash due from counterparties and investments. PIMCO, as the investment adviser, minimizes counterparty risks to the Funds by performing extensive reviews of each counterparty and obtaining approval from the PIMCO Counterparty Risk Committee prior to entering into transactions with a third party. Furthermore, to the extent that unpaid amounts owed to a Fund (or Underlying PIMCO Fund and/or Acquired Fund in the case of a PIMCO Fund of Funds) exceed a predetermined threshold agreed to with the counterparty, such counterparty shall advance collateral to the Fund (or Underlying PIMCO Fund and/or Acquired Fund in the case of the PIMCO Fund of Funds) in the form of cash or cash equivalents equal in value to the unpaid amount owed to the Fund (or Underlying PIMCO Fund and/or Acquired Fund in the case of the PIMCO Fund of Funds). A Fund (or Underlying PIMCO Fund and/or Acquired Fund in the case of a PIMCO Fund of Funds) may invest such collateral in securities or other instruments and will typically pay interest to the counterparty on the collateral received. If the unpaid amount owed to a Fund (or Underlying PIMCO Fund and/or Acquired Fund in the case of a PIMCO Fund of Funds) subsequently decreases, the Fund (or Underlying PIMCO Fund and/or Acquired Fund in the case of the PIMCO Fund of Funds) would be required to return to the counterparty all or a portion of the collateral previously advanced to the Fund (or Underlying PIMCO Fund and/or Acquired Fund in the case of the PIMCO Fund of Funds).
All transactions in listed securities are settled/paid for upon delivery using approved counterparties. The risk of default is considered minimal, as delivery of securities sold is only made once a Fund has received payment. Payment is made on a purchase once the securities have been delivered by the counterparty. The trade will fail if either party fails to meet its obligation.
A Fund is subject to various Master Agreements, which govern the terms of certain transactions with select counterparties. These Master Agreements reduce the counterparty risk associated with relevant transactions by specifying credit protection mechanisms and providing
standardization that improves legal certainty. Since different types of forward and OTC financial derivative transactions have different mechanics and are sometimes traded out of different legal entities of a particular counterparty organization, each type of transaction may be covered by a different Master Agreement, resulting in the need for multiple agreements with a single counterparty. As the Master Agreements are specific to unique operations of different asset types, they allow a Fund to close out and net its total exposure to a counterparty in the event of a default with respect to all the transactions governed under a single agreement with a counterparty.
Master Agreements can also help limit counterparty risk by specifying collateral posting arrangements at pre-arranged exposure levels. Under the Master Agreements, collateral is routinely transferred if the total net exposure to certain transactions (net of existing collateral already in place) governed under the relevant master agreement with a counterparty in a given account exceeds a specified threshold, which typically ranges from zero to $250,000 depending on the counterparty and the type of Master Agreement. United States Treasury Bills and U.S. dollar cash are generally the preferred forms of collateral, although other forms of AAA rated paper may be used. A Fund’s overall exposure to counterparty risk can change substantially within a short period, as it is affected by each transaction subject to the relevant Master Agreement.
Master Repurchase Agreements (“Master Repo Agreements”) govern transactions between a Fund and select counterparties. The Master Repo Agreements maintain provisions for, among other things, initiation, income payments, events of default, and maintenance of collateral for Repurchase and Reverse Repurchase Agreements.
Master Securities Forward Transaction Agreements (“Master Forward Agreements”) govern the considerations and factors surrounding the settlement of certain purchases and sales made on a delayed-delivery basis by and between a Fund and select counterparties. The Master Forward Agreements maintain provisions for, among other things, initiation and confirmation, payment and transfer, events of default, termination, and maintenance of collateral.
International Swaps and Derivatives Association, Inc. Master Agreements (“ISDA Master Agreements”) govern OTC financial derivative transactions entered into by a Fund and select counterparties. The ISDA Master Agreements maintain provisions for general obligations, representations, agreements, collateral and events of default or termination. Events of termination include conditions that may entitle counterparties to elect to terminate early and cause settlement of all outstanding transactions under the applicable ISDA
Master Agreement. Any election to terminate early could be material to the financial statements. The market value of OTC financial derivative transactions, net of collateral received in or pledged by counterparty as of period end, is disclosed in the Notes to the Schedules of Investments.
| 82 | PIMCO EQUITY SERIES |
Table of Contents
June 30, 2012
Prime Broker Account Agreements between a Fund and selected Prime Brokers govern the considerations and factors surrounding accounts opened for short selling transactions and activities, including, but not limited to, margin, execution, and settlement. The Prime Broker
Account Agreements maintain provisions for, among other things, payments, maintenance of collateral, events of default, and termination. See Note 5(b) for additional information.
8. BASIS FOR CONSOLIDATION FOR THE PIMCO EMERGING MULTI-ASSET FUND AND PIMCO EqS PATHFINDER FUND® (“Consolidated Funds”)
PIMCO Cayman Commodity Fund V and VI (each a “Commodity Subsidiary”), Cayman Islands exempted companies, were incorporated as wholly owned subsidiaries acting as investment vehicles for the Consolidated Funds in order to effect certain investments for the Consolidated Funds consistent with each Consolidated Fund’s investment objectives and policies as specified in their respective prospectus and statement of additional information. Each Consolidated Fund’s investment portfolio has been consolidated and includes the portfolio holdings of the Consolidated Fund and its respective Commodity Subsidiary. The consolidated financial statements include the accounts of the Consolidated Funds and their respective Commodity Subsidiary. All inter-company transactions and balances have been eliminated. A subscription agreement was entered into between the Consolidated Funds and their respective Commodity Subsidiary, comprising the entire issued share capital of the Commodity Subsidiary with the intent that each Consolidated Fund will remain the sole shareholder and retain all rights. Under the Articles of Association of each Commodity Subsidiary, shares issued by each Commodity Subsidiary confer upon a shareholder the right to receive notice of, to attend and to vote at general meetings of each of the Commodity Subsidiaries and shall confer upon the shareholder rights in a winding-up or repayment of capital and the right to participate in the profits or assets of each of the Commodity Subsidiaries. See the table below for details regarding the structure, incorporation and relationship as of June 30, 2012 of each Commodity Subsidiary to its respective Consolidated Fund (amounts in thousands).
| Fund Name | Subsidiary | Date of Incorporation | Subscription Agreement | Fund Net Assets | Subsidiary Net Assets | % of Fund Net Assets | ||||||||||||||
| PIMCO Emerging Multi-Asset Fund | PIMCO Cayman Commodity Fund V Ltd. | 06/06/2011 | 07/01/2011 | $ | 50,970 | $ | 10 | 0.0 | % | |||||||||||
| PIMCO EqS Pathfinder Fund® | PIMCO Cayman Commodity Fund VI Ltd. | 06/06/2011 | 06/20/2011 | 2,134,010 | 81,288 | 3.8 | ||||||||||||||
9. FEES AND EXPENSES
(a) Investment Advisory Fee PIMCO is a majority-owned subsidiary of Allianz Asset Management of America L.P. (“Allianz Asset Management”), and serves as the Adviser to the Trust, pursuant to an investment advisory contract. The Adviser receives a monthly fee from each Fund, at an annual rate based on average daily net assets (the “Investment Advisory Fee”). The Investment Advisory Fee for all classes is charged at an annual rate as noted in the table below.
(b) Supervisory and Administrative Fee PIMCO serves as administrator (the “Administrator”), and provides supervisory and administrative services to the Trust for which it receives a monthly supervisory and administrative fee based on each share class’s average daily net assets (the “Supervisory and Administrative Fee”). As the Administrator, PIMCO bears the costs of various third-party services, including audit, custodial, portfolio accounting, legal, transfer agency and printing costs.
The Investment Advisory and Supervisory and Administrative Fees for all classes are charged at an annual rate as noted in the following table:
| Investment Advisory Fee | Supervisory and Administrative Fee | |||||||||||||||||||||||||||
| Fund Name | All Classes | Institutional Class | Class P | Administrative Class | Class D | A, C and R Classes | ||||||||||||||||||||||
PIMCO Dividend and Income Builder Fund | 0.69% | 0.30% | 0.40% | N/A | 0.40% | 0.40% | ||||||||||||||||||||||
PIMCO EqSTM Dividend Fund | 0.69% | 0.30% | 0.40% | N/A | 0.40% | 0.40% | ||||||||||||||||||||||
PIMCO EqSTM Emerging Markets Fund | 1.00% | 0.45% | 0.55% | 0.45% | 0.55% | 0.55% | ||||||||||||||||||||||
PIMCO EqSTM Long/Short Fund | 1.04% | 0.45% | 0.55% | N/A | 0.55% | 0.55% | ||||||||||||||||||||||
PIMCO Emerging Multi-Asset Fund | 0.90% | 0.45% | 0.55% | 0.45% | 0.55% | 0.55% | ||||||||||||||||||||||
PIMCO EqS Pathfinder Fund® | 0.75% | 0.30% | 0.40% | N/A | 0.40% | 0.40% | ||||||||||||||||||||||
(c) Distribution and Servicing Fees PIMCO Investments LLC (“PI”), a wholly-owned subsidiary of PIMCO, serves as the distributor (“Distributor”) of the Trust’s shares.
The Trust has adopted separate Distribution and Servicing Plans with respect to the Class A, Class C and Class R shares of the Trust pursuant to Rule 12b-1 under the Act. In connection with the distribution of Class C and Class R shares of the Trust, the Distributor receives
| ANNUAL REPORT | JUNE 30, 2012 | 83 |
Table of Contents
Notes to Financial Statements (Cont.)
distribution fees from the Trust of up to 0.75% for Class C shares and 0.25% for Class R shares, and in connection with personal services rendered to Class A, Class C and Class R shareholders and the maintenance of such shareholder accounts, the Distributor receives servicing fees from the Trust of up to 0.25% for each of Class A, Class C and Class R shares (percentages reflect annual rates of the average daily net assets attributable to the applicable class).
The Trust has adopted a Distribution and Servicing Plan with respect to the Class D shares of each Fund pursuant to Rule 12b-1 under the Act (the “Class D Plan”). Under the terms of the Class D Plan, a Fund is permitted to compensate the Distributor out of the assets attributable to the Class D shares of the Fund, in an amount up to 0.25% on an annual basis of the average daily net assets of the Fund’s Class D shares for providing, or procuring through financial intermediaries, distribution, shareholder services, and/or maintenance of shareholder accounts with respect to Class D shareholders of the Fund, some of which may be deemed to be primarily intended to result in the sale of Class D shares.
The Trust has adopted a Distribution and Servicing Plan with respect to the Administrative Class shares of each Fund pursuant to Rule 12b-1 under the Act (the “Administrative Class Plan”). Under the terms of the Administrative Class Plan, a Fund may compensate the Distributor for providing, or procuring through financial intermediaries, distribution, administrative, recordkeeping, shareholder and/or related services with respect to Administrative Class shares. The Administrative Class Plan permits a Fund to make total payments at an annual rate of up to 0.25% of the average daily net assets attributable to the Administrative Class shares.
The Trust paid distribution and servicing fees at effective rates as set forth in the following table (calculated as a percentage of each Fund’s average daily net assets attributable to each class):
| Allowable Rate | ||||||||||
| Distribution Fee | Servicing Fee | |||||||||
Administrative Class | — | 0.25% | ||||||||
Class D | — | 0.25% | ||||||||
Class A | — | 0.25% | ||||||||
Class C | 0.75% | 0.25% | ||||||||
Class R | 0.25% | 0.25% | ||||||||
The Distributor also received the proceeds of the initial sales charges paid by shareholders upon the purchase of Class A shares and the contingent deferred sales charges paid by shareholders upon certain redemptions of Class A and Class C shares. For the period ended June 30, 2012, the Distributor received $98,055 representing commissions (sales charges) and contingent deferred sales charges from the Trust.
(d) Fund Expenses The Trust is responsible for the following expenses: (i) salaries and other compensation of any of the Trust’s executive officers and employees who are not officers, directors, stockholders or employees of PIMCO or its subsidiaries or affiliates; (ii) taxes and governmental fees; (iii) brokerage fees and commissions and other portfolio transaction expenses; (iv) costs of borrowing money, including interest expense; (v) fees and expenses of the Trustees who are not “interested persons” of PIMCO or the Trust, and any counsel retained exclusively for their benefit; (vi) extraordinary expense, including costs of litigation and indemnification expenses; (vii) organization expenses and (viii) any expenses allocated or allocable to a specific class of shares (“class-specific expenses”). The ratio of expenses to average net assets per share class, as disclosed on the Financial Highlights, may differ from the annual fund operating expenses per share class as disclosed in the Prospectus for the reasons set forth above.
Each unaffiliated Trustee receives an annual retainer of $60,000, plus $4,750 for each Board of Trustees meeting attended in person, $375 ($750 in the case of the audit committee chair with respect to audit committee meetings) for each committee meeting attended and $750 for each Board of Trustees meeting attended telephonically, plus reimbursement of related expenses. In addition, the audit committee chair receives an additional annual retainer of $7,500 and each other committee chair receives an additional annual retainer of $750.
These expenses are allocated on a pro-rata basis to each Fund of the Trust according to its respective net assets. The Trust pays no compensation directly to any Trustee or any other officer who is affiliated with the Administrator, all of whom receive remuneration for their services to the Trust from the Administrator or its affiliates.
(e) Expense Limitation PIMCO has agreed to waive a portion of the Funds’ Supervisory and Administrative Fees in each Fund’s first fiscal year, to the extent that the payment of each Fund’s pro rata share of organizational expenses and Trustee Fees cause the actual expense ratio to rise above the rates disclosed in the then-current prospectus plus 0.0049% (calculated as a percentage of each Fund’s average daily net assets attributable to each class).
PIMCO has contractually agreed to waive a portion of the Investment Advisory Fee as set forth in the following table (calculated as a percentage of each Fund’s average daily net assets).
| Fund Name | Investment Advisory Fee Waiver | Investment Advisory Waiver Expiration Date | ||||||||
PIMCO Dividend and Income Builder Fund | 0.16% | 10/31/2013 | ||||||||
PIMCO EqSTM Dividend Fund | 0.16% | 10/31/2013 | ||||||||
PIMCO EqSTM Emerging Markets Fund | 0.20% | 10/31/2012 | ||||||||
PIMCO EqSTM Long/Short Fund | 0.09% | 10/31/2013 | ||||||||
PIMCO EqS Pathfinder Fund® | 0.16% | 10/31/2012 | ||||||||
| 84 | PIMCO EQUITY SERIES |
Table of Contents
June 30, 2012
Under the Fee Limitation Agreement, PIMCO is entitled to reimbursement by each Fund of any portion of the Supervisory and Administrative Fee and/or Investment Advisory Fee waived, reduced or reimbursed pursuant to the Fee Limitation Agreement (the “Reimbursement Amount”) during the previous three years, provided that such amount paid to PIMCO will not: 1) together with any recoupment of organizational expenses and pro rata Trustees’ fees pursuant to the Expense Limitation Agreement, exceed the Expense Limit; 2) exceed the total Reimbursement Amount; or 3) include any amounts previously reimbursed to PIMCO. The Fee Limitation Agreement will automatically renew for one-year terms unless PIMCO provides written notice to the Trust at least 30 days prior to the end of the then current term.
PIMCO may be reimbursed for these waived amounts in future periods, not to exceed thirty-six months after the waiver. Expenses that have been waived may still be reimbursed by the Administrator, to the extent the Fund’s annualized total portfolio operating expenses plus the amount reimbursed does not exceed the operating expense limitation. The recoverable amounts to PIMCO at June 30, 2012, were as follows (amounts in thousands):
| Fund Name | Recoverable Amounts | |||||
PIMCO Dividend and Income Builder Fund | $ | 142 | ||||
PIMCO EqSTM Dividend Fund | 260 | |||||
PIMCO EqSTM Emerging Markets Fund | 1,272 | |||||
PIMCO EqSTM Long/Short Fund | 270 | |||||
PIMCO Emerging Multi-Asset Fund | 143 | |||||
PIMCO EqS Pathfinder Fund® | 5,259 | |||||
(f) Acquired Fund Fees and Expenses The Underlying PIMCO Fund expenses for the PIMCO Emerging Multi-Asset Fund are based upon an allocation of the PIMCO Emerging Multi-Asset Fund’s assets among the Underlying PIMCO Funds and upon the total annual operating expenses of the Institutional Class shares of these Underlying PIMCO Funds. Underlying PIMCO Fund expenses will vary with changes in the expenses of the Underlying PIMCO Funds, as well as allocation of the PIMCO Emerging Multi-Asset Fund’s assets.
PIMCO has contractually agreed, through October 31, 2012, to waive, first, the Investment Advisory Fee and, second, to the extent necessary, the Supervisory and Administrative Fee it receives from the PIMCO Emerging Multi-Asset Fund in an amount equal to the expenses attributable to Investment Advisory and Supervisory and Administrative Fees of Underlying PIMCO Funds indirectly incurred by the Fund in connection with the Fund’s investments in Underlying PIMCO Funds, to the extent the Investment Advisory Fee and Supervisory and Administrative Fees taken together are greater than or equal to the Investment Advisory Fees and Supervisory and Administrative Fees of the Underlying PIMCO Funds. This agreement renews annually for a full year unless terminated by PIMCO upon at least 30 days’ notice prior to the end of the contract term. The waivers are reflected in the Statements of Operations as a component of Waiver and/or Reimbursement by PIMCO. For the period ended June 30, 2012, the amount was $305,520.
Each Commodity Subsidiary has entered into a separate contract with PIMCO for the management of each Commodity Subsidiary’s portfolio pursuant to which the Commodity Subsidiary pays PIMCO a management fee and administrative services fee at the annual rates of 0.49% and 0.20%, respectively, of its net assets. PIMCO has contractually agreed to waive the Investment Advisory Fee and Supervisory and Administrative Fees it receives from each Commodity Subsidiary in an amount equal to the management fee and administrative services fee, respectively, paid to PIMCO by each Commodity Subsidiary. This waiver may not be terminated by PIMCO and will remain in effect for as long as PIMCO’s contract with each Commodity Subsidiary is in place. The waiver is reflected in the Consolidated Statements of Operations as a component of Waiver and/or Reimbursement by PIMCO. During the period ended June 30, 2012, the Fund below waived the following fees (amounts in thousands):
| Fund Name | Waived Fees | |||||
PIMCO EqS Pathfinder Fund® | $ | 231 | ||||
| ANNUAL REPORT | JUNE 30, 2012 | 85 |
Table of Contents
Notes to Financial Statements (Cont.)
10. RELATED PARTY TRANSACTIONS
The Adviser, Administrator, and Distributor are related parties. Fees payable to these parties are disclosed in Note 9 and the accrued related party fee amounts are disclosed on the Statements of Assets and Liabilities.
The PIMCO Emerging Multi-Asset Fund may invest assets in Institutional Class shares of the Underlying PIMCO Funds. The Underlying PIMCO Funds are considered to be affiliated with the PIMCO Emerging Multi-Asset Fund. The table below shows the transactions in and earnings from investments in these affiliated Funds for the period ended June 30, 2012 (amounts in thousands):
PIMCO Emerging Multi-Asset Fund
| Underlying PIMCO Funds | Market Value 06/30/2011 | Purchases at Cost | Proceeds from Sales | Net Capital and Realized Gain/(Loss) | Change in Unrealized Appreciation/ (Depreciation) | Market Value 06/30/2012 | Dividend Income | |||||||||||||||||||||||
PIMCO CommoditiesPLUS® Strategy Fund | $ | 0 | $ | 501 | $ | 0 | $ | 0 | $ | (65 | ) | $ | 436 | $ | 1 | |||||||||||||||
PIMCO Emerging Local Bond Fund | 1,953 | 12,673 | (2,270 | ) | 7 | (178 | ) | 12,185 | 364 | |||||||||||||||||||||
PIMCO Emerging Markets Bond Fund | 742 | 9,166 | (1,930 | ) | 70 | 256 | 8,304 | 216 | ||||||||||||||||||||||
PIMCO Emerging Markets Corporate Bond Fund | 1,330 | 2,052 | (1,890 | ) | (101 | ) | 81 | 1,472 | 80 | |||||||||||||||||||||
PIMCO Emerging Markets Currency Fund | 1,003 | 2,159 | (2,180 | ) | (186 | ) | (24 | ) | 772 | 20 | ||||||||||||||||||||
PIMCO EqSTM Emerging Markets Fund | 5,229 | 16,410 | 0 | 0 | (3,021 | ) | 18,618 | 41 | ||||||||||||||||||||||
PIMCO Short-Term Floating NAV Portfolio | 1,401 | 60,615 | (57,000 | ) | 2 | 0 | 5,018 | 15 | ||||||||||||||||||||||
Totals | $ | 11,658 | $ | 103,576 | $ | (65,270 | ) | $ | (208 | ) | $ | (2,951 | ) | $ | 46,805 | $ | 737 | |||||||||||||
Each Fund may invest in the PIMCO Short-Term Floating NAV Portfolio and PIMCO Short-Term Floating NAV Portfolio III (“PIMCO Short-Term Floating NAV Portfolios”) to the extent permitted by the Act and rules thereunder. The PIMCO Short-Term Floating NAV Portfolios are registered investment companies created for use solely by the series of the Trust and series of the PIMCO Funds, PIMCO Variable Insurance Trust, PIMCO ETF Trust, PIMCO Equity Series VIT, and other series of registered investment companies advised by PIMCO, in connection with their cash management activities. The PIMCO Short-Term Floating NAV Portfolios may incur expenses related to their investment activities, but do not pay Investment Advisory or Supervisory and Administrative Fees to PIMCO. The PIMCO Short-Term Floating NAV Portfolios are considered to be affiliated with the Funds. The table below shows each Fund’s transactions in and earnings from investments in the PIMCO Short-Term Floating NAV Portfolios for the period ended June 30, 2012 (amounts in thousands):
Investments in PIMCO Short-Term Floating NAV Portfolio
| Fund Name | Market Value 06/30/2011 | Purchases at Cost | Proceeds from Sales | Net Capital and Realized Gain/(Loss) | Unrealized Appreciation/ (Depreciation) | Market Value 06/30/2012 | Dividend Income | |||||||||||||||||||||||
PIMCO Dividend and Income Builder Fund | $ | 0 | $ | 16,501 | $ | (15,090 | ) | $ | 0 | $ | 0 | $ | 1,411 | $ | 1 | |||||||||||||||
PIMCO EqSTM Dividend Fund | 0 | 167,617 | (153,600 | ) | 8 | (1 | ) | 14,024 | 17 | |||||||||||||||||||||
PIMCO EqSTM Emerging Markets Fund | 65,549 | 411,804 | (424,900 | ) | 32 | 1 | 52,486 | 304 | ||||||||||||||||||||||
PIMCO EqSTM Long/Short Fund | 0 | 64,825 | (3,100 | ) | 0 | (7 | ) | 61,718 | 25 | |||||||||||||||||||||
PIMCO EqS Pathfinder Fund® | 139,763 | 1,020,592 | (1,031,000 | ) | (1 | ) | 3 | 129,357 | 492 | |||||||||||||||||||||
11. GUARANTEES AND INDEMNIFICATIONS
Under the Trust’s organizational documents, each Trustee or officer of the Trust is indemnified and each employee or other agent of the Trust (including the Trust’s investment manager) may be indemnified, to the extent permitted by the Act, against certain liabilities that may arise out of performance of their duties to the Funds. Additionally, in the normal course of business, the Funds enter into contracts that contain a variety of indemnification clauses. The Funds’ maximum exposure under these arrangements is unknown as this would involve future claims that may be made against the Funds that have not yet occurred. However, the Funds have not had prior claims or losses pursuant to these contracts.
12. REORGANIZATION
On April 20, 2012, the PIMCO EqSTM Long/Short Fund acquired all of the assets and liabilities of a privately offered fund managed by the Adviser in exchange for Institutional Class shares of the PIMCO EqSTM Long/Short Fund. This transaction was structured to qualify as a tax-free reorganization under the Internal Revenue Code. The investment portfolio of the privately offered fund, with a fair value of $11,432,698 and identified cost of $10,775,817 as of the date of the reorganization, was the principal asset acquired by the PIMCO EqSTM Long/Short Fund. For financial statement purposes, assets received and shares issued by the PIMCO EqSTM Long/Short Fund were recorded at
| 86 | PIMCO EQUITY SERIES |
Table of Contents
June 30, 2012
fair value, and the PIMCO EqSTM Long/Short Fund recorded the cost of such investments at their historical cost as recorded by the privately offered fund. The cost basis of the investments received from the privately offered fund was carried forward to align ongoing reporting of the PIMCO EqSTM Long/Short Fund’s realized and unrealized gains and losses with amounts distributable for tax purposes. The net assets of the private fund at the date of the acquisition were $15,695,929, including unrealized appreciation of $670,754. The net assets of the PIMCO EqSTM Long/Short Fund immediately after the reorganization were $15,695,929. The PIMCO EqSTM Long/Short Fund had no net assets or liabilities prior to the reorganization.
13. PURCHASES AND SALES OF SECURITIES
The length of time a Fund has held a particular security is not generally a consideration in investment decisions. A change in the securities held by a Fund is known as “portfolio turnover.” A Fund may engage in frequent and active trading of portfolio securities to achieve its investment objective, particularly during periods of volatile market movements. High portfolio turnover (e.g., over 100%) involves correspondingly greater expenses to a Fund, including brokerage commissions or dealer mark-ups and other transaction costs on the sale of securities and reinvestments in other securities. Such sales may also result in realization of taxable capital gains, including short-term capital gains (which are generally taxed at ordinary income tax rates). The trading costs and tax effects associated with portfolio turnover may adversely affect a Fund’s performance. The portfolio turnover rates are reported in the Financial Highlights.
Purchases and sales of securities (excluding short-term instruments) for the period ended June 30, 2012, were as follows (amounts in thousands):
| U.S. Government/Agency | All Other | |||||||||||||||||
| Fund Name | Purchases | Sales | Purchases | Sales | ||||||||||||||
PIMCO Dividend and Income Builder Fund | $ | 126 | $ | 0 | $ | 46,045 | $ | 5,905 | ||||||||||
PIMCO EqSTM Dividend Fund | 0 | 0 | 331,285 | 26,945 | ||||||||||||||
PIMCO EqSTM Emerging Markets Fund | 0 | 0 | 579,233 | 341,371 | ||||||||||||||
PIMCO EqSTM Long/Short Fund | 0 | 0 | 166,522 | 50,498 | ||||||||||||||
PIMCO Emerging Multi-Asset Fund | 0 | 0 | 47,188 | 11,424 | ||||||||||||||
PIMCO EqS Pathfinder Fund® | 0 | 0 | 1,302,815 | 597,636 | ||||||||||||||
| ANNUAL REPORT | JUNE 30, 2012 | 87 |
Table of Contents
Notes to Financial Statements (Cont.)
14. SHARES OF BENEFICIAL INTEREST
The Trust may issue an unlimited number of shares of beneficial interest with a $0.0001 par value. Changes in shares of beneficial interest were as follows (shares and amounts in thousands):
| PIMCO Dividend and Income Builder Fund (1) | PIMCO EqSTM Dividend Fund (2)(6) | PIMCO EqSTM Emerging Markets Fund (3)(6) | ||||||||||||||||||||||||||||||||
| Period from 12/14/2011 to 06/30/2012 | Period from 12/14/2011 to 06/30/2012 | Year Ended 06/30/2012 | Period from 03/22/2011 to 06/30/2011 | |||||||||||||||||||||||||||||||
| Shares | Amount | Shares | Amount | Shares | Amount | Shares | Amount | |||||||||||||||||||||||||||
Receipts for shares sold | ||||||||||||||||||||||||||||||||||
Institutional Class | 1,288 | $ | 13,265 | 30,124 | $ | 313,756 | 31,969 | $ | 273,119 | 34,968 | $ | 368,990 | ||||||||||||||||||||||
Class P | 797 | 8,349 | 7 | 69 | 37 | 339 | 4 | 36 | ||||||||||||||||||||||||||
Administrative Class | 0 | 0 | 0 | 0 | 57 | 490 | 1 | 11 | ||||||||||||||||||||||||||
Class D | 282 | 2,951 | 134 | 1,379 | 910 | 7,718 | 115 | 1,192 | ||||||||||||||||||||||||||
Class A | 1,364 | 14,394 | 274 | 2,901 | 441 | 3,828 | 90 | 943 | ||||||||||||||||||||||||||
Class C | 789 | 8,296 | 137 | 1,461 | 97 | 825 | 11 | 114 | ||||||||||||||||||||||||||
Class R | 40 | 422 | 1 | 10 | 2 | 17 | 4 | 39 | ||||||||||||||||||||||||||
Issued as reinvestment of distributions | ||||||||||||||||||||||||||||||||||
Institutional Class | 24 | 250 | 334 | 3,511 | 201 | 1,606 | 0 | 0 | ||||||||||||||||||||||||||
Class P | 6 | 67 | 0 | 1 | 0 | 0 | 0 | 0 | ||||||||||||||||||||||||||
Administrative Class | 0 | 0 | 0 | 0 | 0 | 0 | 0 | 0 | ||||||||||||||||||||||||||
Class D | 3 | 32 | 1 | 9 | 3 | 22 | 0 | 0 | ||||||||||||||||||||||||||
Class A | 12 | 122 | 3 | 29 | 0 | 2 | 0 | 0 | ||||||||||||||||||||||||||
Class C | 4 | 39 | 1 | 13 | 0 | 0 | 0 | 0 | ||||||||||||||||||||||||||
Class R | 1 | 7 | 0 | 0 | 0 | 0 | 0 | 0 | ||||||||||||||||||||||||||
Cost of shares redeemed | ||||||||||||||||||||||||||||||||||
Institutional Class | (245 | ) | (2,519 | ) | (323 | ) | (3,420 | ) | (2,236 | ) | (18,635 | ) | (312 | ) | (3,125 | ) | ||||||||||||||||||
Class P | (20 | ) | (206 | ) | 0 | 0 | (33 | ) | (299 | ) | 0 | 0 | ||||||||||||||||||||||
Administrative Class | 0 | 0 | 0 | 0 | (54 | ) | (449 | ) | 0 | 0 | ||||||||||||||||||||||||
Class D | (65 | ) | (660 | ) | (16 | ) | (161 | ) | (894 | ) | (7,553 | ) | (9 | ) | (93 | ) | ||||||||||||||||||
Class A | (104 | ) | (1,062 | ) | (36 | ) | (361 | ) | (205 | ) | (1,695 | ) | (15 | ) | (148 | ) | ||||||||||||||||||
Class C | (28 | ) | (289 | ) | (16 | ) | (166 | ) | (21 | ) | (178 | ) | (1 | ) | (13 | ) | ||||||||||||||||||
Class R | (1 | ) | (8 | ) | 0 | 0 | (3 | ) | (24 | ) | 0 | 0 | ||||||||||||||||||||||
Net increase resulting from Fund share transactions | 4,147 | $ | 43,450 | 30,625 | $ | 319,031 | 30,271 | $ | 259,133 | 34,856 | $ | 367,946 | ||||||||||||||||||||||
| 88 | PIMCO EQUITY SERIES |
Table of Contents
June 30, 2012
| PIMCO EqSTM Long/Short Fund (4)(7) | PIMCO Emerging Multi-Asset Fund | PIMCO EqS Pathfinder Fund® (5)(8) | ||||||||||||||||||||||||||||||||||||||||
| Period from 04/20/2012 to 06/30/2012 | Year Ended 06/30/2012 | Period from 04/12/2011 to 06/30/2011 | Year Ended 06/30/2012 | Year Ended 06/30/2011 | ||||||||||||||||||||||||||||||||||||||
| Shares | Amount | Shares | Amount | Shares | Amount | Shares | Amount | Shares | Amount | |||||||||||||||||||||||||||||||||
Receipts for shares sold | ||||||||||||||||||||||||||||||||||||||||||
Institutional Class | 20,316 | $ | 199,848 | 3,596 | $ | 33,084 | 1,003 | $ | 10,035 | 73,170 | $ | 721,005 | 68,574 | $ | 713,828 | |||||||||||||||||||||||||||
Class P | 1 | 10 | 1,417 | 12,404 | 7 | 73 | 10,980 | 106,032 | 4,553 | 46,300 | ||||||||||||||||||||||||||||||||
Administrative Class | 0 | 0 | 3 | 25 | 1 | 10 | 0 | 0 | 0 | 0 | ||||||||||||||||||||||||||||||||
Class D | 12 | 117 | 618 | 5,586 | 310 | 3,096 | 932 | 9,477 | 2,482 | 25,154 | ||||||||||||||||||||||||||||||||
Class A | 126 | 1,227 | 1,205 | 10,932 | 184 | 1,835 | 3,516 | 35,477 | 9,594 | 97,473 | ||||||||||||||||||||||||||||||||
Class C | 5 | 53 | 412 | 3,692 | 66 | 658 | 1,284 | 12,707 | 4,446 | 45,561 | ||||||||||||||||||||||||||||||||
Class R | 0 | 0 | 0 | 0 | 1 | 10 | 2 | 23 | 10 | 96 | ||||||||||||||||||||||||||||||||
Issued as reinvestment of distributions | ||||||||||||||||||||||||||||||||||||||||||
Institutional Class | 0 | 0 | 12 | 102 | 0 | 0 | 1,955 | 18,970 | 806 | 8,169 | ||||||||||||||||||||||||||||||||
Class P | 0 | 0 | 6 | 56 | 0 | 0 | 69 | 672 | 5 | 48 | ||||||||||||||||||||||||||||||||
Administrative Class | 0 | 0 | 0 | 0 | 0 | 0 | 0 | 0 | 0 | 0 | ||||||||||||||||||||||||||||||||
Class D | 0 | 0 | 1 | 8 | 0 | 0 | 16 | 157 | 17 | 170 | ||||||||||||||||||||||||||||||||
Class A | 0 | 0 | 3 | 26 | 0 | 0 | 57 | 556 | 41 | 413 | ||||||||||||||||||||||||||||||||
Class C | 0 | 0 | 0 | 4 | 0 | 0 | 20 | 195 | 13 | 131 | ||||||||||||||||||||||||||||||||
Class R | 0 | 0 | 0 | 0 | 0 | 0 | 0 | 1 | 0 | 1 | ||||||||||||||||||||||||||||||||
Issued in reorganization | ||||||||||||||||||||||||||||||||||||||||||
Institutional Class | 1,570 | 15,696 | 0 | 0 | 0 | 0 | 0 | 0 | 0 | 0 | ||||||||||||||||||||||||||||||||
Cost of shares redeemed | ||||||||||||||||||||||||||||||||||||||||||
Institutional Class | (15 | ) | (143 | ) | (1,151 | ) | (10,433 | ) | (17 | ) | (167 | ) | (9,772 | ) | (97,233 | ) | (2,571 | ) | (26,117 | ) | ||||||||||||||||||||||
Class P | 0 | 0 | (1,198 | ) | (10,854 | ) | 0 | 0 | (8,614 | ) | (84,122 | ) | (359 | ) | (3,696 | ) | ||||||||||||||||||||||||||
Administrative Class | 0 | 0 | (1 | ) | (5 | ) | 0 | 0 | 0 | 0 | 0 | 0 | ||||||||||||||||||||||||||||||
Class D | (1 | ) | (6 | ) | (332 | ) | (2,910 | ) | (32 | ) | (312 | ) | (1,406 | ) | (13,801 | ) | (972 | ) | (10,042 | ) | ||||||||||||||||||||||
Class A | 0 | 0 | (221 | ) | (1,971 | ) | (2 | ) | (17 | ) | (5,057 | ) | (49,897 | ) | (2,891 | ) | (30,193 | ) | ||||||||||||||||||||||||
Class C | 0 | 0 | (30 | ) | (280 | ) | 0 | (4 | ) | (1,385 | ) | (13,532 | ) | (381 | ) | (3,935 | ) | |||||||||||||||||||||||||
Class R | 0 | 0 | 0 | 0 | 0 | 0 | (11 | ) | (112 | ) | (1 | ) | (12 | ) | ||||||||||||||||||||||||||||
Net increase resulting from Fund share transactions | 22,014 | $ | 216,802 | 4,340 | $ | 39,466 | 1,521 | $ | 15,217 | 65,756 | $ | 646,575 | 83,366 | $ | 863,349 | |||||||||||||||||||||||||||
| (1) | As of June 30, 2012, 1 shareholder owned 10% or more of the total Fund’s outstanding shares comprising 12% of the Fund. |
| (2) | As of June 30, 2012, 2 shareholders each owned 10% or more of the total Fund’s outstanding shares comprising 70% of the Fund. |
| (3) | As of June 30, 2012, 3 shareholders each owned 10% or more of the total Fund’s outstanding shares comprising 76% of the Fund. |
| (4) | As of June 30, 2012, 2 shareholders each owned 10% or more of the total Fund’s outstanding shares comprising 90% of the Fund. |
| (5) | As of June 30, 2012, 3 shareholders each owned 10% or more of the total Fund’s outstanding shares comprising 73% of the Fund. |
| (6) | The PIMCO Global Multi-Asset Fund, a related party to the Fund, owned 25% or more of the outstanding shares of beneficial interest of the Fund and therefore may be presumed to “control” the Fund, as that term is defined in the 1940 Act. |
| (7) | The PIMCO All Asset and PIMCO All Asset All Authority Funds, related parties to the Fund, owned 25% or more of the outstanding shares of beneficial interest of the Fund and therefore may be presumed to “control” the Fund, as that term is defined in the 1940 Act. |
| (8) | The PIMCO All Asset Fund, a related party to the Fund, owned 25% or more of the outstanding shares of beneficial interest of the Fund and therefore may be presumed to “control” the Fund, as that term is defined in the 1940 Act. |
15. REGULATORY AND LITIGATION MATTERS
The Trust is not engaged in any material litigation or arbitration proceedings and is not aware of any material litigation or claim pending or threatened by or against it.
16. FEDERAL INCOME TAX MATTERS
Each Fund intends to qualify as a regulated investment company under Subchapter M of the Internal Revenue Code (the “Code”) and distribute all of its taxable income and net realized gains, if applicable, to shareholders. Accordingly, no provision for Federal income taxes has been made.
In accordance with provisions set forth under U.S. GAAP, the Adviser has reviewed the Funds’ tax positions for all open tax years. As of June 30, 2012, the Funds have recorded no liability for net unrecognized tax benefits relating to uncertain income tax positions they have taken or expect to take in future tax returns.
The Funds file U.S. tax returns. While the statute of limitations remains open to examine the Funds’ U.S. tax returns filed for the fiscal years ending in 2010-2011, no examinations are in progress or anticipated at this time. The Funds are not aware of any tax positions for which it is reasonably possible that the total amounts of unrecognized tax benefits will significantly change in the next twelve months.
| ANNUAL REPORT | JUNE 30, 2012 | 89 |
Table of Contents
Notes to Financial Statements (Cont.)
The Consolidated Funds may gain exposure to the commodities markets primarily through index-linked notes, and may invest in other commodity-linked derivative investments, including commodity swap agreements, options, futures contracts, options on futures contracts and foreign funds investing in similar commodity-lined derivatives.
One of the requirements for favorable tax treatment as a regulated investment company under the Code is that a Fund must derive at least 90% of its gross income from certain qualifying sources of income. The IRS has issued a revenue ruling which holds that income derived from commodity index-linked swaps is not qualifying income under Subchapter M of the Code. The IRS has also issued private letter rulings in which the IRS specifically concluded that income from certain commodity index-linked notes is qualifying income. The IRS has also issued private rulings in which the IRS specifically concluded that income derived from investment in a subsidiary will also be qualifying income. Based on the reasoning in such rulings, each Fund will continue to seek to gain exposure to the commodity markets primarily through investments in commodity-linked notes and through any investments in its Subsidiary.
It should be noted, however, that the IRS currently has suspended the issuance of such rulings pending further review. There can be no assurance that the IRS will not change its position that income derived
from commodity-linked notes and wholly-owned subsidiaries is
qualifying income. Furthermore, the tax treatment of commodity-linked notes, other commodity-linked derivatives, and a Fund’s investments in its Subsidiary may otherwise be adversely affected by future legislation, Treasury Regulations and/or guidance issued by the IRS. Such developments could affect the character, timing and/or amount of the Fund’s taxable income or any distributions made by the Fund or result in the inability of the Fund to operate as described in its Prospectus.
If, during a taxable year, the Subsidiary’s taxable losses (and other deductible items) exceed its income and gains, the net loss will not pass through to the Fund as a deductible amount for income tax purposes. Note that the loss from the Subsidiary’s taxable gains exceed its losses and other deductible items during a taxable year, the net gain will pass through to the Fund as income for Federal income tax purposes.
On December 22, 2010, the Regulated Investment Company Modernization Act of 2010 (the “Act”) was enacted. Under the Act, net capital losses may be carried forward indefinitely, and their character is retained as short-term and/or long term losses. Previously, net capital losses were carried forward for eight years and treated as short-term losses. The Act requires that post-enactment net capital losses be used before pre-enactment net capital losses. As a result of this ordering rule, pre-enactment capital loss carryforwards may be more likely to expire unused.
As of June 30, 2012, the components of distributable taxable earnings are as follows (amounts in thousands):
| Undistributed Ordinary Income | Undistributed Long-Term Capital Gains | Net Tax Basis Unrealized Appreciation/ (Depreciation) (1) | Other Book-to-Tax Accounting Differences (2) | Accumulated Capital Losses | Qualified Post-October Loss Deferral Capital (4) | Qualified Late-Year Loss Deferral Ordinary (5) | ||||||||||||||||||||||||
PIMCO Dividend and Income Builder Fund | $ | 305 | $ | 62 | $ | (332 | ) | $ | (72 | ) | $ | — | $ | — | $ | — | ||||||||||||||
PIMCO Emerging Multi-Asset Fund | 182 | — | (3,208 | ) | — | (687 | ) | — | — | |||||||||||||||||||||
PIMCO EqS™ Dividend Fund | 938 | 410 | 279 | (8 | ) | — | — | — | ||||||||||||||||||||||
PIMCO EqS™ Emerging Markets Fund | 1,119 | — | (49,536 | ) | (114 | ) | (59,412 | ) | — | — | ||||||||||||||||||||
PIMCO EqS™ Long/Short Fund | — | — | (168 | ) | — | (3,247 | ) | — | (302 | ) | ||||||||||||||||||||
PIMCO EqS Pathfinder Fund® | 59,890 | $ | — | 6,323 | $ | — | (26,870 | ) | $ | — | $ | — | ||||||||||||||||||
| (1) | Adjusted for open wash sale loss deferrals and accelerated recognition of unrealized gain on certain futures, options and forward contracts for federal income tax purposes. Also adjusted for differences between book and tax realized and unrealized gain/loss on swap contracts. |
| (2) | Represents differences in income tax regulations and financial accounting principles generally accepted in the United States of America, mainly for straddle loss deferrals. |
| (3) | Capital losses available to offset future net capital gains expire in varying amounts in the years shown below. |
| (4) | Capital losses realized during the period November 1, 2011 through June 30, 2012, which the Fund elected to defer to the following taxable year pursuant to income tax regulations. |
| (5) | Specified losses realized during the period November 1, 2011 through June 30, 2012 and Ordinary losses realized during the period January 1, 2012 through June 30, 2012, which the Fund elected to defer to the following taxable year pursuant to income tax regulations. |
As of June 30, 2012, the Fund had accumulated capital losses expiring in the following years (amounts in thousands). The Fund will resume capital gain distributions in the future to the extent gains are realized in excess of accumulated capital losses.
| Expiration of Accumulated Capital Losses | ||||||||||||||||||||||||||||||
| 6/30/2013 | 6/30/2014 | 6/30/2015 | 6/30/2016 | 6/30/2017 | 6/30/2018 | 6/30/2019 | ||||||||||||||||||||||||
PIMCO Dividend and Income Builder Fund | $ | — | $ | — | $ | — | $ | — | $ | — | $ | — | $ | — | ||||||||||||||||
PIMCO Emerging Multi-Asset Fund | — | — | — | — | — | — | — | |||||||||||||||||||||||
PIMCO EqS™ Dividend Fund | — | — | — | — | — | — | — | |||||||||||||||||||||||
PIMCO EqS™ Emerging Markets Fund | — | — | — | — | — | — | — | |||||||||||||||||||||||
PIMCO EqS™ Long/Short Fund | — | — | — | — | — | — | — | |||||||||||||||||||||||
PIMCO EqS Pathfinder Fund® | $ | — | $ | — | $ | — | $ | — | $ | — | $ | — | $ | — | ||||||||||||||||
| 90 | PIMCO EQUITY SERIES |
Table of Contents
June 30, 2012
Under the recently enacted Regulated Investment Company Modernization Act of 2010, a fund is permitted to carry forward any new capital losses for an unlimited period. Additionally, such capital losses that are carried forward will retain their character as either short-term or long-term capital losses rather than being considered all short-term under previous law. As of June 30, 2012, the Fund had the following post-effective capital losses with no expiration:
| Short-Term | Long-Term | |||||||||
PIMCO Dividend and Income Builder Fund | $ | — | $ | — | ||||||
PIMCO Emerging Multi-Asset Fund | $ | 687 | $ | 0 | ||||||
PIMCO EqS™ Dividend Fund | $ | 0 | $ | 0 | ||||||
PIMCO EqS™ Emerging Markets Fund | $ | 56,079 | $ | 3,333 | ||||||
PIMCO EqS™ Long/Short Fund | $ | 3,247 | $ | 0 | ||||||
PIMCO EqS Pathfinder Fund® | $ | 26,039 | $ | 830 | ||||||
As of June 30, 2012, the aggregate cost and the net unrealized appreciation/(depreciation) of investments for federal income
| Federal Tax Cost | Unrealized Appreciation | Unrealized (Depreciation) | Net Unrealized Appreciation/ (Depreciation) (6) | |||||||||||||||
PIMCO Dividend and Income Builder Fund | $ | 43,281 | $ | 997 | $ | (1,346 | ) | $ | (350 | ) | ||||||||
PIMCO Emerging Multi-Asset Fund | 54,313 | 390 | (3,616 | ) | (3,226 | ) | ||||||||||||
PIMCO EqS™ Dividend Fund | 319,985 | 7,866 | (7,704 | ) | 162 | |||||||||||||
PIMCO EqS™ Emerging Markets Fund | 566,179 | 19,242 | (66,879 | ) | (47,637 | ) | ||||||||||||
PIMCO EqS™ Long/Short Fund | 211,382 | 1,837 | (1,440 | ) | 397 | |||||||||||||
PIMCO EqS Pathfinder Fund® | 2,119,289 | 191,915 | (188,416 | ) | 3,499 | |||||||||||||
| (6) | Primary differences, if any, between book and tax net unrealized appreciation/(depreciation) on investments are attributable to open wash sale loss deferrals. |
For the fiscal years ended June 30, 2012 and June 30, 2011, respectively, the Funds made the following tax basis distributions (amounts in thousands):
| June 30, 2012 | June 30, 2011 | |||||||||||||||||||||||||||
| Ordinary Income Distributions (7) | Long-Term Capital Gain Distributions | Return of Capital (8) | Ordinary Income Distributions (7) | Long-Term Capital Gain Distributions | Return of Capital (8) | |||||||||||||||||||||||
PIMCO Dividend and Income Builder Fund | $ | 603 | $ | — | $ | — | $ | — | $ | — | $ | — | ||||||||||||||||
PIMCO Emerging Multi-Asset Fund | 200 | — | — | — | — | — | ||||||||||||||||||||||
PIMCO EqS™ Dividend Fund | 3,578 | — | — | — | — | — | ||||||||||||||||||||||
PIMCO EqS™ Emerging Markets Fund | 1,628 | 2 | — | — | — | — | ||||||||||||||||||||||
PIMCO EqS™ Long/Short Fund | — | — | — | — | — | — | ||||||||||||||||||||||
PIMCO EqS Pathfinder Fund® | 14,462 | 6,616 | $ | — | 8,756 | 610 | $ | — | ||||||||||||||||||||
| (7) | Includes short-term capital gains, if any, distributed. |
| (8) | A portion of the distributions made represents a tax return of capital. Return of capital distributions have been reclassified from undistributed net investment income to paid-in capital to more appropriately conform financial accounting to tax accounting. |
17. SUBSEQUENT EVENTS
The Adviser has evaluated the possibility of subsequent events through the date the financial statements were issued and has determined that there are no material events that would require disclosure in the Funds’ financial statements.
| ANNUAL REPORT | JUNE 30, 2012 | 91 |
Table of Contents
Report of Independent Registered Public Accounting Firm
To the Board of Trustees and Shareholders of PIMCO Equity Series:
In our opinion, the accompanying statements of assets and liabilities, including the schedules of investments, and the related statements of operations, of changes in net assets and of cash flows and the financial highlights present fairly, in all material respects, the financial position of PIMCO Dividend and Income Builder Fund, PIMCO EqS™ Dividend Fund, PIMCO EqS™ Emerging Markets Fund, PIMCO EqS™ Long/Short Fund, PIMCO Emerging Multi-Asset Fund, and PIMCO EqS Pathfinder Fund® (constituting PIMCO Equity Series, hereinafter referred to as the “Funds”) at June 30, 2012, the results of each of their operations and the changes in each of their net assets, the cash flows for the PIMCO EqS™ Long/Short Fund and the financial highlights of the Funds for each of the periods indicated, in conformity with accounting principles generally accepted in the United States of America. These financial statements and financial highlights (hereafter referred to as “financial statements”) are the responsibility of the Funds’ management; our responsibility is to express an opinion on these financial statements based on our audits. We conducted our audits of these financial statements in accordance with the standards of the Public Company Accounting Oversight Board (United States). Those standards require that we plan and perform the audits to obtain reasonable assurance about whether the financial statements are free of material misstatement. An audit includes examining, on a test basis, evidence supporting the amounts and disclosures in the financial statements, assessing the accounting principles used and significant estimates made by management, and evaluating the overall financial statement presentation. We believe that our audits, which included confirmation of securities at June 30, 2012 by correspondence with the custodian, counterparties and underlying funds’ transfer agent, provide a reasonable basis for our opinion.
PricewaterhouseCoopers LLP
Kansas City, Missouri
August 17, 2012
| 92 | PIMCO EQUITY SERIES |
Table of Contents
Federal Income Tax Information
(Unaudited)
As required by the Internal Revenue Code (“Code”) and Treasury Regulations, if applicable, shareholders must be notified within 60 days of the Fund's fiscal year end regarding the status of qualified dividend income, the dividend received deduction, foreign source income earned by the fund, and any. foreign tax credits being passed through to shareholders.
Qualified Dividend Income. Under the Jobs and Growth Tax Relief Reconciliation Act of 2003 (the “Act”), the following percentages of ordinary dividends paid during the fiscal year ended June 30, 2012 are designated as “qualified dividend income”, as defined in the Act, subject to reduced tax rates.
PIMCO Dividend and Income Builder Fund | 78.63% | |||||
PIMCO Emerging Multi-Asset Fund | 45.78% | |||||
PIMCO EqS™ Dividend Fund | 69.48% | |||||
PIMCO EqS™ Emerging Markets Fund | 100.00% | |||||
PIMCO EqS™ Long/Short Fund | 0.00% | |||||
PIMCO EqS Pathfinder Fund® | 100.00% |
Dividend Received Deduction. Corporate shareholders are generally entitled to take the dividend received deduction on the portion of a Fund’s dividend distribution that qualifies under tax law. The percentage of each Fund’s fiscal 2012 ordinary income dividends that qualifies for the corporate dividend received deduction is set forth below.
PIMCO Dividend and Income Builder Fund | 16.84% | |||||
PIMCO Emerging Multi-Asset Fund | 34.63% | |||||
PIMCO EqS™ Dividend Fund | 19.83% | |||||
PIMCO EqS™ Emerging Markets Fund | 4.26% | |||||
PIMCO EqS™ Long/Short Fund | 0.00% | |||||
PIMCO EqS Pathfinder Fund® | 100.00% |
Foreign Taxes. PIMCO Dividend and Income Builder Fund, PIMCO EqS™ Dividend Fund, PIMCO EqS™ Emerging Markets Fund and PIMCO EqS Pathfinder Fund® earned foreign source income of $505,713, $3,681,377, $10,621,092 and $43,100,970 respectively, during the year ended June 30, 2012. The funds have made an election under Internal Revenue Code Section 853 to pass through foreign taxes paid in the amount of $47,983, $343,489, $593,813 and $2,773,349 respectively, to shareholders. Shareholders will receive more detailed information along with their Form 1099-DIV.
Shareholders are advised to consult their own tax advisor with respect to the tax consequences of their investment in the Trust. In January 2013, you will be advised on IRS Form 1099-DIV as to the federal tax status of the dividends and distributions received by you in calendar year 2012.
| ANNUAL REPORT | JUNE 30, 2012 | 93 |
Table of Contents
Glossary: (abbreviations that may be used in the preceding statements)
(Unaudited)
Counterparty Abbreviations: | ||||||||||
| BOA | Bank of America N.A. | GST | Goldman Sachs International | MYI | Morgan Stanley & Co. International PLC | |||||
| BPS | BNP Paribas S.A. | HUS | HSBC Bank USA N.A. | RBC | Royal Bank of Canada | |||||
| BRC | Barclays Bank PLC | JPM | JPMorgan Chase Bank N.A. | RYL | Royal Bank of Scotland Group PLC | |||||
| CBK | Citibank N.A. | MSC | Morgan Stanley & Co., Inc. | SAL | Citigroup Global Markets, Inc. | |||||
| DUB | Deutsche Bank AG | MSX | Morgan Stanley Capital Group, Inc. | UAG | UBS AG Stamford | |||||
| FBF | Credit Suisse International | MYC | Morgan Stanley Capital Services, Inc. | ULO | UBS AG London | |||||
| GSC | Goldman Sachs & Co. | |||||||||
Currency Abbreviations: | ||||||||||
| AUD | Australian Dollar | HUF | Hungarian Forint | PHP | Philippine Peso | |||||
| BRL | Brazilian Real | IDR | Indonesian Rupiah | PLN | Polish Zloty | |||||
| CAD | Canadian Dollar | ILS | Israeli Shekel | RUB | Russian Ruble | |||||
| CHF | Swiss Franc | INR | Indian Rupee | SEK | Swedish Krona | |||||
| CNY | Chinese Renminbi | JPY | Japanese Yen | SGD | Singapore Dollar | |||||
| CZK | Czech Koruna | KRW | South Korean Won | THB | Thai Baht | |||||
| DKK | Danish Krone | MXN | Mexican Peso | TRY | Turkish New Lira | |||||
| EUR | Euro | MYR | Malaysian Ringgit | TWD | Taiwanese Dollar | |||||
| GBP | British Pound | NOK | Norwegian Krone | USD | United States Dollar | |||||
| HKD | Hong Kong Dollar | PEN | Peruvian New Sol | ZAR | South African Rand | |||||
Exchange Abbreviations: | ||||||||||
| CBOE | Chicago Board Options Exchange | OTC | Over-the-Counter | |||||||
Index Abbreviations: | ||||||||||
| CDX.IG | Credit Derivatives Index - Investment Grade | EAFE | Europe, Australasia, and Far East Stock Index | |||||||
Other Abbreviations: | ||||||||||
| EURIBOR | Euro Interbank Offered Rate | MSCI | Morgan Stanley Capital International | SP - GDR | Sponsored Global Depositary Receipt | |||||
| LIBOR | London Interbank Offered Rate | SP - ADR | Sponsored American Depositary Receipt | SPDR | Standard & Poor’s Depository Receipts | |||||
| 94 | PIMCO EQUITY SERIES |
Table of Contents
(Unaudited)
The chart below identifies the Trustees and Officers of the Trust. Each “interested” Trustee as defined by the 1940 Act, is indicated by an asterisk (*). Unless otherwise indicated, the address of all persons below is 840 Newport Center Drive, Newport Beach, CA 92660.
The Fund’s Statement of Additional Information includes more information about the Trustees and Officers. To request a free copy, call PIMCO at (888) 87-PIMCO or visit the Fund’s website at www.pimco.com/investments.
Trustees of the Trust
Name, Year of Birth and Position Held with Trust | Term of Office** and Length of Time Served | Principal Occupation(s) During Past 5 Years | Number of Funds in Fund Complex Overseen by Trustee | Other Directorships Held by Trustee | ||||
Interested Trustees | ||||||||
Brent R. Harris* (1959) Chairman of the Board and Trustee | 03/2010 to present | Managing Director and member of Executive Committee, PIMCO. Formerly, Chairman and Director, PCM Fund, Inc. Formerly, Chairman and Director PIMCO Strategic Global Government Fund, Inc. | 161 | Chairman and Trustee, PIMCO Funds, PIMCO Variable Insurance Trust, PIMCO ETF Trust, PIMCO Equity Series VIT; Director, StocksPLUS® Management, Inc.; and member of Board of Governors, Investment Company Institute. Board Member and Owner, Harris Holdings, LLC (1992-present). | ||||
Neel T. Kashkari* (1973) Trustee | 09/2011 to present | Managing Director, PIMCO. Formerly, Interim Assistant Secretary for Financial Stability, Assistant Secretary for International Economics and Senior Advisor to Secretary Paulson, United States Department of Treasury; Vice President, Goldman Sachs Group, Inc. | 7 | Trustee, PIMCO Equity Series VIT. | ||||
Independent Trustees | ||||||||
E. Philip Cannon (1940) Trustee | 03/2010 to present | Private Investor. Formerly, President, Houston Zoo. Formerly, Director, PCM Fund, Inc. | 161 | Trustee, PIMCO Equity Series VIT; Trustee, PIMCO ETF Trust; Trustee, PIMCO Funds; and Trustee, PIMCO Variable Insurance Trust. | ||||
Vern O. Curtis (1934) Trustee | 03/2010 to present | Private Investor. Formerly, Director, PCM Fund, Inc. | 161 | Trustee, PIMCO Equity Series VIT; Trustee, PIMCO ETF Trust; Trustee, PIMCO Funds; and Trustee, PIMCO Variable Insurance Trust. | ||||
| Allan B. Hubbard (1947) Trustee | 02/2011 to present | Chairman, E&A Holdings, Inc. (Private Holding Company). Formerly, Assistant to the President for Economic Policy and Director, National Economic Council—President George W. Bush administration. | 7 | Trustee, PIMCO Equity Series VIT. Independent Director, Simon Property Group. | ||||
| Peter B. McCarthy (1950) Trustee | 09/2011 to present | Formerly, Assistant Secretary and Chief Financial Officer, United States Department of Treasury; Deputy Managing Director, Institute of International Finance. | 7 | Trustee, PIMCO Equity Series VIT. | ||||
* Mr. Harris and Mr. Kashkari are “interested persons” of the Trust (as that term is defined in the 1940 Act) because of their affiliation with PIMCO.
** Trustees serve until their successors are duly elected and qualified.
| ANNUAL REPORT | JUNE 30, 2012 | 95 |
Table of Contents
(Unaudited)
Executive Officers
| Name, Year of Birth and Position Held with Trust | Term of Office and Length of Time Served | Principal Occupation(s) During Past 5 Years | ||
Neel T. Kashkari (1973) President | 03/2010 to present | Managing Director, PIMCO. Formerly, Interim Assistant Secretary for Financial Stability, Assistant Secretary for International Economics and Senior Advisor to Secretary Paulson, United States Department of Treasury. | ||
David C. Flattum (1964) Chief Legal Officer | 03/2010 to present | Managing Director and General Counsel, PIMCO. Formerly, Managing Director, Chief Operating Officer and General Counsel, Allianz Asset Management of America L.P. and Partner at Latham & Watkins LLP. | ||
Jennifer E. Durham (1970) Chief Compliance Officer | 03/2010 to present | Managing Director and Chief Compliance Officer, PIMCO. | ||
William H. Gross (1944) Senior Vice President | 03/2010 to present | Managing Director and Co-Chief Investment Officer, PIMCO. | ||
Mohamed El-Erian (1958) Senior Vice President | 03/2010 to present | Managing Director, Co-Chief Investment Officer and Chief Executive Officer, PIMCO. Formerly, President and CEO of Harvard Management Company. | ||
Brent R. Harris (1959) Senior Vice President | 03/2010 to present | Managing Director and member of Executive Committee, PIMCO. | ||
Douglas M. Hodge (1957) Senior Vice President | 03/2010 to present | Managing Director; Chief Operating Officer (since 7/09); Member of Executive Committee and Head of PIMCO’s Asia Pacific region. Member Global Executive Committee, Allianz Global Asset Management. | ||
J. Stephen King, Jr. (1962) Vice President - Senior Counsel, Secretary | 03/2010 to present | Senior Vice President and Attorney, PIMCO. Formerly Associate, Dechert LLP. | ||
Kevin M. Broadwater (1964) Vice President - Senior Counsel | 05/2012 to present | Executive Vice President and Attorney, PIMCO. | ||
Peter G. Strelow (1970) Vice President | 03/2010 to present | Managing Director, PIMCO. | ||
Henrik P. Larsen (1970) Vice President | 03/2010 to present | Senior Vice President, PIMCO. | ||
Eric D. Johnson (1970) Vice President | 05/2011 to present | Senior Vice President, PIMCO. | ||
Greggory S. Wolf (1970) Vice President | 05/2011 to present | Senior Vice President, PIMCO. | ||
John P. Hardaway (1957) Treasurer | 03/2010 to present | Executive Vice President, PIMCO. | ||
Ryan G. Leshaw (1980) Assistant Secretary | 05/2012 to present | Vice President and Attorney, PIMCO. Formerly, Associate, Willkie Farr & Gallagher LLP. | ||
Stacie D. Anctil (1969) Assistant Treasurer | 03/2010 to present | Senior Vice President, PIMCO. | ||
Erik C. Brown (1967) Assistant Treasurer | 03/2010 to present | Senior Vice President, PIMCO. | ||
Trent W. Walker (1974) Assistant Treasurer | 03/2010 to present | Senior Vice President, PIMCO. | ||
| 96 | PIMCO EQUITY SERIES |
Table of Contents
(Unaudited)
The Funds consider customer privacy to be a fundamental aspect of their relationships with shareholders and are committed to maintaining the confidentiality, integrity and security of their current, prospective and former shareholders’ personal information. The Funds have developed policies that are designed to protect this confidentiality, while allowing shareholder needs to be served.
Obtaining Personal Information
In the course of providing shareholders with products and services, the Funds and certain service providers to the Funds, such as the Funds’ investment adviser (“Adviser”), may obtain non-public personal information about shareholders, which may come from sources such as account applications and other forms, from other written, electronic or verbal correspondence, from shareholder transactions, from a shareholder’s brokerage or financial advisory firm, financial adviser or consultant, and/or from information captured on the Funds’ internet websites.
Respecting Your Privacy
As a matter of policy, the Funds do not disclose any personal or account information provided by shareholders or gathered by the Funds to non-affiliated third parties, except as required or permitted by law or as necessary for such third parties to perform their agreements with respect to the Funds. As is common in the industry, non-affiliated companies may from time to time be used to provide certain services, such as preparing and mailing prospectuses, reports, account statements and other information, conducting research on shareholder satisfaction and gathering shareholder proxies. The Funds’ Distributor may also retain non-affiliated companies to market the Funds’ shares or products which use the Funds’ shares and enter into joint marketing arrangements with them and other companies. These companies may have access to a shareholder’s personal and account information, but are permitted to use this information solely to provide the specific service or as otherwise permitted by law. In most cases, the shareholders will be clients of a third party, but the Funds may also provide a shareholder’s personal and account information to the shareholder’s respective brokerage or financial advisory firm.
Sharing Information with Third Parties
The Funds reserve the right to disclose or report personal information to non-affiliated third parties, in limited circumstances, where the Funds believe in good faith that disclosure is required under law to cooperate with regulators or law enforcement authorities, to protect their rights or property or upon reasonable request by any Fund in which a shareholder has invested. In addition, the Funds may disclose information about a shareholder’s accounts to a non-affiliated third party at the shareholder’s request or with the consent of the shareholder.
Sharing Information with Affiliates
The Funds may share shareholder information with their affiliates in connection with servicing their shareholders’ accounts, and subject to applicable law may provide shareholders with information about products and services that the Funds or their Adviser, principal underwriters or their affiliates (“Service Affiliates”) believe may be of interest to such shareholders. The information that the Funds share may include, for example, a shareholder’s participation in one of the Funds or in other investment programs sponsored by a Service Affiliate, a shareholder’s ownership of certain types of accounts (such as IRAs), information about the Funds’ experiences or transactions with a shareholder, information captured on the Funds’ internet websites, or other data about a shareholder’s accounts, subject to applicable law. The Funds’ Service Affiliates, in turn, are not permitted to share shareholder information with non-affiliated entities, except as required or permitted by law.
Procedures to Safeguard Private Information
The Funds take seriously the obligation to safeguard shareholder non-public personal information. In addition to this policy, the Funds have implemented procedures that are designed to restrict access to a shareholder’s non-public personal information to internal personnel who need to know that information to perform their jobs, such as servicing shareholder accounts or notifying shareholders of new products or services. Physical, electronic and procedural safeguards are in place to guard a shareholder’s non-public personal information.
| ANNUAL REPORT | JUNE 30, 2012 | 97 |
Table of Contents
Approval of the Investment Advisory Contract and Second Amended and Restated Supervision and Administration Agreement for PIMCO EqS™ Long/Short Fund
On February 29, 2012, the Board of Trustees (the “Board”) of PIMCO Equity Series (the “Trust”), including all of the independent Trustees (the “Independent Trustees”), approved the Investment Advisory Contract and the Second Amended and Restated Supervision and Administration Agreement (the “Supervision and Administration Agreement” and together with the Investment Advisory Contract, the “Agreements”) with Pacific Investment Management Company LLC (“PIMCO”) on behalf of the PIMCO EqS™ Long/Short Fund, a new series of the Trust (the “New Fund”), for an initial two-year term.
The information, material factors and conclusions that formed the basis for the Board’s approvals are described below.
1. INFORMATION RECEIVED
(a) Materials Reviewed: The Trustees received a wide variety of materials relating to the services to be provided by PIMCO. The Board reviewed information relating to proposed fund operations, including the New Fund’s compliance program, shareholder services, valuation, custody, distribution, and other information relating to the nature, extent and quality of services proposed to be provided by PIMCO to the Trust. In considering whether to approve the Agreements, the Board also reviewed materials provided by PIMCO, which included, among other things, comparative industry data with regard to expense ratios of funds with investment objectives and policies similar to those of the New Fund. The Board also reviewed material provided by counsel to the Trust and the independent Trustees, which included, among other things, memoranda outlining legal duties of the Board. The Board also reviewed information about the personnel who would be providing investment management and administrative services to the New Fund.
(b) Review Process: In connection with the approval of the Agreements, the Board reviewed written materials prepared by PIMCO, which included, among other things, comparative fee data for funds in the appropriate Lipper, Inc. (“Lipper”) peer group. Lipper is an independent provider of investment company performance and fee and expense data. The Board also requested and received assistance and advice regarding applicable legal standards from Trust counsel. The Board also heard oral presentations on matters related to the Agreements. The approval determinations were made on the basis of each Trustee’s business judgment after consideration of all the information presented. Individual Trustees may have given different weights to certain factors and assigned various degrees of materiality to information received in connection with the approval process. In deciding to approve the Agreements, the Board did not identify any single factor or particular information that, in isolation, was controlling. This summary describes the most important, but not all, of the factors considered by the Board.
2. NATURE, EXTENT AND QUALITY OF SERVICES
(a) PIMCO, its Personnel, and Resources: The Board considered the depth and quality of PIMCO’s investment management process, including: its global research capabilities; the experience, capability and integrity of its senior management and other personnel; the low turnover rates of its key personnel; the overall financial strength and stability of its organization; and the ability of its organizational structure to address the recent growth in assets under management. The Board also considered that PIMCO makes available to its investment professionals a variety of resources and systems relating to investment management, compliance, trading, performance and portfolio accounting. The Board noted PIMCO’s commitment to investing in information technology supporting investment management and compliance, as well as PIMCO’s continuing efforts to attract and retain qualified personnel and to maintain and enhance its resources and systems.
Ultimately, the Board concluded that the nature, extent and quality of services proposed to be provided by PIMCO under the Agreements are likely to benefit the New Fund and its shareholders.
(b) Other Services: The Board considered PIMCO’s policies, procedures and systems to assure compliance with applicable laws and regulations and its commitment to these programs; its efforts to keep the Trustees informed about matters relevant to the Trust and its shareholders; and its attention to matters that may involve conflicts of interest with the Trust. The Board also considered the nature, extent, quality and cost of supervisory and administrative services to be provided by PIMCO to the New Fund under the Agreements.
The Board considered the terms of the Trust’s Supervision and Administration Agreement, under which the Trust pays for the supervisory and administrative services it requires under what is essentially an all-in fee structure (the “unified fee”). In return, PIMCO will provide or procure supervisory and administrative services and bears the costs of various third party services required by the New Fund, including audit, custodial, portfolio accounting, legal, transfer agency and printing costs. The Board considered PIMCO’s provision of these services to other series of the Trust and its supervision of the Trust’s third party service providers to assure that these service providers provide a high level of service relative to alternatives in the market. Ultimately, the Board concluded that the nature, extent and quality of the services to be provided by PIMCO would likely benefit the New Fund and its shareholders.
3. INVESTMENT PERFORMANCE
As the New Fund had not yet commenced operations at the time the Agreements were considered, the Trustees did not receive or consider investment performance information for the New Fund. However, the
| 98 | PIMCO EQUITY SERIES |
Table of Contents
(Unaudited)
Trustees did consider the investment performance information for the New Fund’s predecessor fund that would be included in the New Fund’s registration statement.
4. ADVISORY FEES, SUPERVISORY AND ADMINISTRATIVE FEES AND TOTAL EXPENSES
The Board considered that PIMCO strives to price funds with total expense ratios at or below the respective Lipper median, while providing premium investment offerings. PIMCO reported to the Board that, in proposing fees for the New Fund, it considered a number of factors, including the type and complexity of the services to be provided, the cost of providing services, the risk assumed by PIMCO in the provision of services, the impact on potential returns from different levels of fees, the competitive marketplace for financial products, and the attractiveness of potential returns to potential investors.
The Board reviewed the proposed advisory fee, supervisory and administrative fee and estimated total expenses of the New Fund (each as a percentage of average net assets) and compared such amounts with the average and median fees and expenses of other similar funds. With respect to advisory fees, the Board reviewed data from Lipper that compared the average and median advisory fees of other funds in a “Peer Group Expense Comparison” of comparable funds, as well as the universe of other similar funds. The Board compared the New Fund’s total expenses to other funds in the Peer Group Expense Comparison provided by Lipper and found the New Fund’s total expenses were comparable to the median and average.
At the time the Board considered the Agreements, PIMCO did not manage any separate accounts with similar investment strategies to the New Fund; therefore, the Board did not consider the fees charged by PIMCO to comparable separate accounts.
The Board also considered the Trust’s unified fee structure, under which the Trust pays for the supervisory and administrative services it requires for one set fee, and in return, PIMCO will provide or procure supervisory and administrative services and bear the costs of various third party services required by the New Fund, including audit, custodial, portfolio accounting, legal, transfer agency and printing costs. The Board noted that the unified supervisory and administrative fee creates fund fees that are fixed, rather than variable. The Board concluded that the New Fund’s proposed supervisory and administrative fee is reasonable in relation to the value of the services to be provided, including the services to be provided to different classes of shareholders, and that the expenses assumed contractually by PIMCO under the Supervision and Administration Agreement represent, in effect, a cap on fund fees that would be beneficial to the New Fund and its shareholders. The Board further noted that, although the unified fee structure does not have break points, it implicitly reflects
economies of scale by fixing the absolute level of Fund fees at competitive levels, in effect, setting the fees as if the New Fund was already at scale.
The Board also noted that PIMCO had contractually agreed to reduce total annual fund operating expenses for each class of the New Fund by waiving a portion of its supervisory and administrative fee, or reimbursing the New Fund, to the extent that any organizational expenses and the pro rata share of the Trust’s Trustees’ fees attributable to a class of the New Fund exceeds 0.49 basis points in any year. Furthermore, the Board noted that PIMCO had contractually agreed to reduce its advisory fee by 9 basis points through October 31, 2013.
Based on the information presented by PIMCO and Lipper, members of the Board then determined, in the exercise of their business judgment, that the level of the advisory and supervisory and administrative fees to be charged by PIMCO, as well as the estimated total expenses of the New Fund, are reasonable and approval of the Agreements would likely benefit the New Fund and its shareholders.
5. ADVISER COSTS, LEVEL OF PROFITS AND ECONOMIES OF SCALE
As the New Fund is newly organized, information regarding PIMCO’s costs in providing services to the New Fund and the profitability of PIMCO’s relationship with the New Fund was not available.
With respect to potential economies of scale, the Board found that because the unified fee protects shareholders against unanticipated increases in expense ratios due to redemptions, declines in asset values, or increases in the costs of services provided or procured by PIMCO, economies of scale are implicitly recognized in the level of the unified fee (which, together with the advisory fee, serves as a proxy for the New Fund’s overall expense ratio).
The Board concluded that the New Fund’s proposed cost structure was reasonable and that the unified fee structure inherently involves the sharing of economies of scale between PIMCO and the New Fund, to the benefit of the New Fund’s shareholders.
6. ANCILLARY BENEFITS
The Board considered other benefits received by PIMCO and its affiliates as a result of PIMCO’s relationship with the Trust, including possible ancillary benefits to PIMCO’s institutional investment management business due to the reputation and market penetration of the Trust. The Board also considered that affiliates of PIMCO will provide distribution and shareholder services to the New Fund and its shareholders, for which they may be compensated under the unified fee, or through distribution fees paid pursuant to the New Fund’s
| ANNUAL REPORT | JUNE 30, 2012 | 99 |
Table of Contents
Approval of the Investment Advisory Contract and Second Amended and Restated Supervision and Administration Agreement for PIMCO EqS™ Long/Short Fund (Cont.)
(Unaudited)
Rule 12b-1 plans. The Board reviewed PIMCO’s soft dollar policies and procedures, noting that while PIMCO has the authority to receive the benefit of research provided by broker-dealers executing portfolio transactions on behalf of the New Fund, it has adopted a policy not to enter into contractual soft dollar arrangements.
7. CONCLUSIONS
Based on its review, including its consideration of each of the factors referred to above, the Board concluded that the Agreements were fair and reasonable to the New Fund and its shareholders, that the New Fund’s shareholders would likely receive reasonable value in return for the advisory fees and other amounts paid to PIMCO by the New Fund, and that the approval of the Agreements was in the best interests of the New Fund and its shareholders.
| 100 | PIMCO EQUITY SERIES |
Table of Contents
General Information
Investment Adviser and Administrator
Pacific Investment Management Company LLC
840 Newport Center Drive
Newport Beach, CA 92660
Distributor
PIMCO Investments LLC
1633 Broadway
New York, NY 10019
Custodian
State Street Bank and Trust Company
801 Pennsylvania
Kansas City, MO 64105
Transfer Agent
Boston Financial Data Services, Inc.
P.O. Box 55060
Boston, MA 02205-5060
Legal Counsel
Dechert LLP
1775 I Street, N.W.
Washington, D.C. 20006
Independent Registered Public Accounting Firm
PricewaterhouseCoopers LLP
1100 Walnut Street
Kansas City, MO 64106
This report is submitted for the general information of the shareholders of the PIMCO Equity Series.
Table of Contents

Sign up for e-delivery
To get future shareholder reports online and to eliminate mailings, go to: pimco.com/edelivery
pimco.com/investments

PES3001AR_063012
Table of Contents
Item 2. | Code of Ethics. | |||||||||
As of the end of the period covered by this report, the Registrant has adopted a code of ethics (the “Code”) that applies to the Registrant’s principal executive officer and principal financial officer. The Registrant did not grant any waivers, including implicit waivers, from any provisions of the Code to the principal executive officer or principal financial officer during the period covered by this report. | ||||||||||
A copy of the Code is included as an exhibit to this report. | ||||||||||
Item 3. | Audit Committee Financial Expert. | |||||||||
(a) The Board of Trustees has determined that Vern O. Curtis, who serves on the Board’s audit committee, qualifies as an “audit committee financial expert” as such term is defined in the instructions to this Item 3. The Board has also determined that Mr. Curtis is “independent” as such term is interpreted under this Item 3. | ||||||||||
Item 4. | Principal Accountant Fees and Services. | |||||||||
(a) | Fiscal Year Ended | Audit Fees | ||||||||
June 30, 2012 | $ | 189,057 | ||||||||
June 30, 2011 | 81,072 | |||||||||
(b) | Fiscal Year Ended | Audit-Related Fees(1) | ||||||||
June 30, 2012 | ||||||||||
June 30, 2011 | — | |||||||||
(c) | Fiscal Year Ended | Tax Fees(2) | ||||||||
June 30, 2012 | ||||||||||
June 30, 2011 | — | |||||||||
(d) | Fiscal Year Ended | All Other Fees(3) | ||||||||
June 30, 2012 | ||||||||||
June 30, 2011 | — | |||||||||
| “Audit Fees” represents fees billed for each of the last two fiscal years for professional services rendered for the audit of the PIMCO Equity Series (the “Trust” or “Registrant”) annual financial statements for those fiscal years or services that are normally provided by the accountant in connection with statutory or regulatory filings or engagements for those fiscal years. | ||||||||||
| “Audit-Related Fees” represents fees billed for each of the last two fiscal years for assurance and related services reasonably related to the performance of the audit of the Trust’s annual financial statements for those years. | ||||||||||
| “Tax Fees” represents fees billed for each of the last two fiscal years for professional services related to tax compliance, tax advice and tax planning, including review of federal and state income tax returns, review of excise tax distribution requirements and preparation of excise tax returns. | ||||||||||
| “All Other Fees” represents fees, if any, billed for other products and services rendered by the principal accountant to the Trust for the last two fiscal years. | ||||||||||
(1) There were no “Audit-Related Fees” for the last two fiscal years. (2) There were no “Tax Fees” for the last two fiscal years. (3) There were no “All Other Fees” for the last two fiscal years. | ||||||||||
(e) Pre-approval policies and procedures |
| |||||||||
(1) The Registrant’s Audit Committee has adopted pre-approval policies and procedures (the “Procedures”) to govern the Audit Committee’s pre-approval of (i) all audit services and permissible non-audit services to be provided to the Registrant by its independent accountant, and (ii) all permissible non-audit services to be provided by such independent accountant to the Registrant’s investment adviser and to any entity controlling, controlled by, or under common control with the investment adviser that provides ongoing services to the Registrant (collectively, the “Service Affiliates”) if the services provided directly relate to the Registrant’s operations and financial reporting. In accordance with the Procedures, the Audit Committee is responsible for the engagement of the independent accountant to certify the Registrant’s financial statements for each fiscal year. With respect to the pre-approval of non-audit services provided to the Registrant and its Service Affiliates, the Procedures provide that the Audit Committee may annually pre-approve a list of types or categories of non-audit services that may be provided to the Registrant or its Service Affiliates, or the Audit Committee may pre-approve such services on a project-by-project basis as they arise. Unless a type of service has received general pre-approval, it will require specific pre-approval by the Audit Committee if it is to be provided by the independent accountant. The Procedures also permit the Audit Committee to delegate authority to one or more of its members to pre-approve any proposed non-audit services that have not been previously pre-approved by the Committee, subject to the ratification by the full Audit Committee no later than its next scheduled meeting. | ||||||||||
(2) With respect to the services described in paragraphs (b) through (d) of this Item 4, no amount was approved by the Audit Committee pursuant to paragraph (c)(7)(i)(C) of Rule 2-01 of Regulation S-X. | ||||||||||
(f) Not applicable. | ||||||||||
(g) | ||||||||||
| Aggregate Non-Audit Fees Billed to Entity | ||||||||
Entity | June 30, 2012 | June 30, 2011 | ||||||
PIMCO Equity Series | $ | — | $ | — | ||||
Pacific Investment Management Company LLC (“PIMCO”) | 4,957,898 | 2,712,636 | ||||||
Allianz Global Investors Fund Management LLC | 787,530 | 797,685 | ||||||
Allianz Asset Management of America L.P. (formerly known as Allianz Global Investors of America L.P.) | 4,118,031 | 3,373,920 | ||||||
|
|
|
| |||||
Totals | $ | 9,863,459 | $ | 6,884,241 | ||||
|
|
|
| |||||
(h) The Registrant’s Audit Committee has considered whether the provision of non-audit services that were rendered to the Registrant’s investment adviser, and any entity controlling, controlled by, or under common control with the investment adviser that provides ongoing services to the Registrant which were not pre-approved (not requiring pre-approval) is compatible with maintaining the principal accountant’s independence. | ||||||||
Item 5. | Audit Committee of Listed Registrants. | |||||||
The Registrant has a separately-designated standing audit committee established in accordance with Section 3(a)(58)(A) of the Securities Exchange Act of 1934, as amended. The audit committee is comprised of:
E. Philip Cannon; Vern O. Curtis; Allan B. Hubbard; Peter B. McCarthy | ||||||||
Item 6. | Schedule of Investments. | |||||||
| The Schedule of Investments is included as part of the report to shareholders under Item 1. | ||||||||
Table of Contents
Item 7. | Disclosure of Proxy Voting Policies and Procedures for Closed-End Management Investment Companies. | |||||
| Not applicable. | ||||||
Item 8. | Portfolio Managers of Closed-End Management Investment Companies. | |||||
| Not applicable. | ||||||
Item 9. | Purchases of Equity Securities by Closed-End Management Investment Company and Affiliated Purchases. | |||||
| Not applicable. | ||||||
Item 10. | Submission of Matters to a Vote of Security Holders. | |||||
| Not applicable. | ||||||
Item 11. | Controls and Procedures. | |||||
| (a) | The principal executive officer and principal financial officer have concluded that the Registrant’s disclosure controls and procedures (as defined in Rule 30a-3(c) under the Investment Company Act of 1940, as amended (“1940 Act”)) provide reasonable assurances that material information relating to the Trust is made known to them by the appropriate persons, based on their evaluation of these controls and procedures as of a date within 90 days of the filing of this report. | |||||
| (b) | There were no changes in the Registrant’s internal control over financial reporting (as defined in Rule 30a-3(d) under the 1940 Act) that occurred during the second fiscal quarter of the period covered by this report that have materially affected, or are reasonably likely to materially affect, the Registrant’s internal control over financial reporting. | |||||
Item 12. | Exhibits. | |||||
(a)(1) | Exhibit 99.CODE—Code of Ethics pursuant to Section 406 of the Sarbanes-Oxley Act of 2002. | |||||
(a)(2) | Exhibit 99.CERT—Certifications pursuant to Section 302 of the Sarbanes-Oxley Act of 2002. | |||||
(b) | Exhibit 99.906CERT—Certifications pursuant to Section 906 of the Sarbanes-Oxley Act of 2002. | |||||
Table of Contents
Signatures
Pursuant to the requirements of the Securities Exchange Act of 1934 and the Investment Company Act of 1940, the registrant has duly caused this report to be signed on its behalf by the undersigned, thereunto duly authorized.
| PIMCO Equity Series | ||
| By: | /s/ NEEL T. KASHKARI | |
| Neel T. Kashkari | ||
| President and Trustee, Principal Executive Officer | ||
| Date: August 29, 2012 | ||
Pursuant to the requirements of the Securities Exchange Act of 1934 and the Investment Company Act of 1940, this report has been signed below by the following persons on behalf of the registrant and in the capacities and on the dates indicated.
| By: | /s/ NEEL T. KASHKARI | |
| Neel T. Kashkari | ||
| President and Trustee, Principal Executive Officer | ||
| Date: August 29, 2012 | ||
| By: | /s/ JOHN P. HARDAWAY | |
| John P. Hardaway | ||
| Treasurer, Principal Financial Officer | ||
| Date: August 28, 2012 | ||