Table of Contents
UNITED STATES
SECURITIES AND EXCHANGE COMMISSION
Washington, D.C. 20549
FORM N-CSR
CERTIFIED SHAREHOLDER REPORT OF REGISTERED MANAGEMENT
INVESTMENT COMPANIES
Investment Company Act file number: 811-22375
PIMCO Equity Series
(Exact name of registrant as specified in charter)
840 Newport Center Drive, Newport Beach, CA 92660
(Address of principal executive offices)
John P. Hardaway
Treasurer and Principal Financial Officer
PIMCO Equity Series
840 Newport Center Drive
Newport Beach, CA 92660
(Name and address of agent for service)
Copies to:
Brendan C. Fox
Dechert LLP
1900 K Street, N.W.
Washington, D.C. 20006
Registrant’s telephone number, including area code: (888) 877-4626
Date of fiscal year end: June 30
Date of reporting period: June 30, 2013
Form N-CSR is to be used by management investment companies to file reports with the Commission not later than 10 days after the transmission to stockholders of any report that is required to be transmitted to stockholders under Rule 30e-1 under the Investment Company Act of 1940 (17 CFR 270.30e-1). The Commission may use the information provided on Form N-CSR in its regulatory, disclosure review, inspection, and policymaking roles.
A registrant is required to disclose the information specified by Form N-CSR, and the Commission will make this information public. A registrant is not required to respond to the collection of information contained in Form N-CSR unless the Form displays a currently valid Office of Management and Budget (“OMB”) control number. Please direct comments concerning the accuracy of the information collection burden estimate and any suggestions for reducing the burden to Secretary, Securities and Exchange Commission, 450 Fifth Street, NW, Washington, DC 20549-0609. The OMB has reviewed this collection of information under the clearance requirements of 44 U.S.C. § 3507.
Table of Contents
Item 1. | Reports to Stockholders. | |||||||
The following is a copy of the report transmitted to stockholders pursuant to Rule 30e-1 under the Investment Company Act of 1940, as amended (the “1940 Act”) (17 CFR 270.30e-1).
| • | PIMCO Equity Series—Institutional, P, Administrative, D, A, C and R Classes |
Table of Contents

Your Global Investment Authority
PIMCO Equity Series®
Annual Report
June 30, 2013

PIMCO Dividend and Income Builder Fund
PIMCO EqS® Dividend Fund
PIMCO EqS® Emerging Markets Fund
PIMCO EqS® Long/Short Fund
PIMCO Emerging Multi-Asset Fund
PIMCO EqS Pathfinder Fund®
Share Classes
| n | Institutional |
| n | P |
| n | Administrative |
| n | D |
| n | A |
| n | C |
| n | R |

Table of Contents
| Page | ||||||
| 2 | ||||||
| 3 | ||||||
| 26 | ||||||
| 28 | ||||||
| 34 | ||||||
| 36 | ||||||
| 38 | ||||||
| 39 | ||||||
| 40 | ||||||
| 41 | ||||||
| 42 | ||||||
| 80 | ||||||
| 100 | ||||||
| 101 | ||||||
| 102 | ||||||
| 103 | ||||||
| 105 | ||||||
| Fund | Insights from the Portfolio Managers | Fund Summary | Schedule of Investments | |||||||||
| 4 | 7 | 43 | ||||||||||
| 8 | 11 | 52 | ||||||||||
| 12 | 14 | 57 | ||||||||||
| 15 | 17 | 65 | ||||||||||
| 18 | 21 | 69 | ||||||||||
| 22 | 25 | 73 | ||||||||||
This material is authorized for use only when preceded or accompanied by the current PIMCO Equity Series prospectus.
Table of Contents
Dear Shareholder,
Please find enclosed the Annual Report for the PIMCO Equity Series covering the twelve-month reporting period ended June 30, 2013. On the following pages are specific details about the investment performance of each fund and a discussion of the factors that influenced performance during the reporting period. In addition, the letters from the portfolio managers provide a further review of such factors as well as an overview of each fund’s investment strategy.
Over most of the reporting period, intervention by the Federal Reserve (“Fed”) and other developed market central banks including the European Central Bank, Bank of England and Bank of Japan, largely succeeded in suppressing market volatility and encouraged investors to move into riskier assets such as equities and high yield bonds. As a result, prices on these asset classes rose considerably through April 2013, propped up by aggressive central bank policies rather than strong economic fundamentals.
However, conditions in financial markets deteriorated rapidly beginning in mid-May as investors reacted to signals by the Fed that it might begin to slow the pace of its asset purchases later this year. Fed Chairman Ben Bernanke outlined a plan for eventually tapering quantitative easing (“QE”) purchases of U.S. Treasuries and mortgage-backed securities (“MBS”) as the U.S. economy begins to meet certain growth targets. In particular, this shift in tone fueled a broad-based sell-off within fixed income assets, undermining market liquidity and sending yields higher across the risk spectrum.
Highlights of the financial markets during our twelve-month reporting period include:
| n | Developed market equities posted strong performance and touched record highs in the early part of 2013. U.S. equities, as measured by the S&P 500 Index, returned 20.60%. Global equities, as represented by the MSCI All Country World Index Net USD and MSCI World Index, returned 16.57% and 18.58%, respectively. Emerging market (“EM”) equities, as represented by the MSCI Emerging Markets Index (Net Dividends in USD), returned 2.87%. EM equities were impacted by declining earnings growth and rising U.S. interest rates towards the latter part of the period which placed pressure on local EM currencies. Concerns over growth and financial risk in China, worsening economic conditions in Brazil, and political turmoil in Turkey also weighed on EM equity returns. |
| n | After reaching historic lows in July 2012, yields on U.S. Treasuries beyond two years in maturity rose considerably beginning in mid-May through the end of the period primarily due to the possibility that the Fed would begin considering tapering its asset purchase program. As a result, bond markets sold off with yields increasing and bond prices declining. The benchmark ten-year U.S. Treasury note yielded 2.49% at the end of the reporting period, as compared to 1.64% on June 30, 2012. The Barclays U.S. Aggregate Index, a widely used index of U.S. investment-grade bonds, declined 0.69% for the period. |
All of our active equity strategies are global, high-conviction portfolios that are unconstrained by geography, benchmark or market capitalization and incorporate downside risk management. Each strategy is managed by experienced equity investors who benefit from PIMCO’s global investment resources and macroeconomic insights. We believe the long-term potential of equities to grow earnings and dividends is an important component of an investor’s overall portfolio.
If you have any questions regarding the PIMCO Equity Series, please contact your account manager or financial adviser, or call one of our shareholder associates at 888.87.PIMCO (888.877.4626). We also invite you to visit our website at www.pimco.com/investments to learn more about our views and global thought leadership.
Thank you again for the trust you have placed in us. We value your commitment and will continue to work diligently to meet your broad investment needs.
 | Sincerely,
Brent R. Harris Chairman of the Board, PIMCO Equity Series
July 25, 2013 |

| 2 | PIMCO EQUITY SERIES |
Table of Contents
Important Information About the Funds
PIMCO Equity Series (the “Trust”) is an open-end management investment company currently consisting of six separate investment portfolios (the “Funds”). Each Fund is an actively managed equity strategy. While we believe that equity funds have an important role to play in a well diversified investment portfolio, they are subject to notable risks. Among other things, equity and equity-related securities may decline in value due to both real and perceived general market, economic, and industry conditions.
The Funds may be subject to various risks as described in the Funds’ prospectus. Some of these risks may include, but are not limited to, the following: allocation risk, Acquired Fund risk, equity risk, dividend-oriented stocks risk, value investing risk, foreign (non-U.S.) investment risk, emerging markets risk, market risk, issuer risk, interest rate risk, credit risk, high yield and distressed company risk, cash holdings risk, currency risk, real estate risk, liquidity risk, leveraging risk, management risk, small-cap and mid-cap company risk, arbitrage risk, derivatives risk, mortgage-related and other asset-backed risk, short sale risk, commodity risk, convertible securities risk, tax risk, subsidiary risk and issuer non-diversification risk. A complete description of these risks and other risks is contained in the Funds’ prospectus. The Funds may use derivative instruments for hedging purposes or as part of an investment strategy. Use of these instruments may involve certain costs and risks such as liquidity risk, interest rate risk, market risk, credit risk, management risk, leverage risk, mispricing or improper valuation risk and the risk that the Funds could not close out a position when it would be most advantageous to do so. Certain derivative transactions may have a leveraging effect on a Fund. For example, a small investment in a derivative instrument may have a significant impact on a Fund’s exposure to interest rates, currency exchange rates or other investments. As a result, a relatively small price movement in a derivative instrument may cause an immediate and substantial loss or gain. A Fund may engage in such transactions regardless of whether
the Fund owns the asset, instrument or components of the index underlying the derivative instrument. A Fund may invest a significant portion of its assets in these types of instruments. If it does, the Fund’s investment exposure could far exceed the value of its portfolio securities and its investment performance could be primarily dependent upon securities it does not own.
On each individual Fund Summary page in this Annual Report (“Shareholder Report”), the Average Annual Total Return table and Cumulative Returns chart measure performance assuming that any dividend and capital gain distributions were reinvested. Class A shares are subject to an initial sales charge. A Contingent Deferred Sales Charge (“CDSC”) may be imposed in certain circumstances on Class A shares that are purchased without an initial sales charge and then redeemed during the first 18 months after purchase. The Cumulative Returns chart reflects only Institutional Class performance. Performance for Class P, Administrative Class, Class D, Class A, Class C and Class R shares is typically lower than Institutional Class performance due to the lower expenses paid by Institutional Class shares. Performance shown is net of fees and expenses. A Fund’s total annual operating expense ratios on each individual Fund summary page are as of the currently effective prospectus, as supplemented to date. The Cumulative Returns chart assumes the initial investment of $1,000,000 was made at the end of the month that the Institutional Class of the relevant Fund commenced operations. The minimum initial investment amount for Institutional Class, Class P or Administrative Class shares is $1,000,000. The minimum initial investment amount for Class A, Class C and Class D shares is $1,000. There is no minimum initial investment for Class R shares. Each Fund measures its performance against a broad-based securities market index (benchmark index). The benchmark index does not take into account fees, expenses, or taxes. A Fund’s past performance, before and after taxes, is not necessarily an indication of how the Fund will perform in the future.
The following table discloses the inception dates of each Fund and its respective share classes:
| Fund Name | Fund Inception | Institutional Class | Class P | Administrative Class | Class D | Class A | Class C | Class R | ||||||||||||||||||||||||||
PIMCO Dividend and Income Builder Fund | 12/14/11 | 12/14/11 | 12/14/11 | — | 12/14/11 | 12/14/11 | 12/14/11 | 12/14/11 | ||||||||||||||||||||||||||
PIMCO EqS® Dividend Fund | 12/14/11 | 12/14/11 | 12/14/11 | — | 12/14/11 | 12/14/11 | 12/14/11 | 12/14/11 | ||||||||||||||||||||||||||
PIMCO EqS® Emerging Markets Fund | 03/22/11 | 03/22/11 | 03/22/11 | 04/19/11 | 03/22/11 | 03/22/11 | 03/22/11 | 03/22/11 | ||||||||||||||||||||||||||
PIMCO EqS® Long/Short Fund | 04/20/12 | 04/20/12 | 04/30/12 | — | 04/30/12 | 04/30/12 | 04/30/12 | — | ||||||||||||||||||||||||||
PIMCO Emerging Multi-Asset Fund | 04/12/11 | 04/12/11 | 04/12/11 | 04/19/11 | 04/12/11 | 04/12/11 | 04/12/11 | 04/12/11 | ||||||||||||||||||||||||||
PIMCO EqS Pathfinder Fund® | 04/14/10 | 04/14/10 | 04/14/10 | — | 04/14/10 | 04/14/10 | 04/14/10 | 04/14/10 | ||||||||||||||||||||||||||
For periods prior to the inception date of the Class P, Administrative Class, Class D, Class A, Class C and Class R shares (if applicable), performance information shown is based on the performance of the Fund’s Institutional Class shares. The prior Institutional Class performance has been adjusted to reflect the distribution and/or service fees and other expenses paid by the Class P, Administrative Class, Class D, Class A, Class C and Class R shares, respectively.
An investment in a Fund is not a bank deposit and is not guaranteed or insured by the Federal Deposit Insurance Corporation (“FDIC”) or any other government agency. It is possible to lose money on investments in a Fund.
PIMCO has adopted written proxy voting policies and procedures (“Proxy Policy”) as required by Rule 206(4)-6 under the Investment Advisers Act of 1940, as amended. The Proxy Policy has been adopted by PIMCO Equity Series as the policies and procedures that PIMCO will use when voting proxies on behalf of a Fund. A description of the policies and procedures that PIMCO uses to vote proxies relating to portfolio securities of a Fund, and information about how the Fund
voted proxies relating to portfolio securities held during the most recent twelve-month period ended June 30th, are available without charge, upon request, by calling the Trust at (888) 87-PIMCO, on the Fund’s website at http://www.pimco.com/investments, and on the Securities and Exchange Commission’s (“SEC”) website at http://www.sec.gov.
PIMCO Equity Series files a complete schedule of each Fund’s portfolio holdings with the SEC for the first and third quarters of each fiscal year on Form N-Q. A copy of a Fund’s Form N-Q is available on the SEC’s website at http://www.sec.gov and may be reviewed and copied at the SEC’s Public Reference Room in Washington, D.C. A Fund’s Form N-Q will also be available without charge, upon request, by calling the Trust at (888) 87-PIMCO and on the Fund’s website at http://www.pimco.com/investments. Information on the operation of the Public Reference Room may be obtained by calling 1-800-SEC-0330.
| ANNUAL REPORT | JUNE 30, 2013 | 3 |
Table of Contents
Insights from the Portfolio Managers PIMCO Dividend and Income Builder Fund
Dear Shareholder,
We appreciate your investment in the PIMCO Dividend and Income Builder Fund (the “Fund”). In the following letter, please find a discussion of the recent market environment and a review of portfolio performance.
Market overview
During the twelve months ended June 30, 2013, the MSCI All Country World Index Net USD (the “Index”), which tracks the performance of stocks in developed and emerging markets countries, returned 16.57%. While overall market performance was positive, the intra-period performance was volatile due to political uncertainty in the U.S. and Europe.
Global equity market performance was strong during most of the third quarter of 2012 after Mario Draghi, President of the European Central Bank, vowed on July 26 to do “whatever it takes” to stabilize Europe. Following the U.S. Federal Reserve’s (“Fed”) announcement of plans for more stimulus action in mid-September, however, global equity markets declined and remained volatile through October, possibly implying a decreasing effectiveness of Fed actions. Global equity markets resumed the decline during the first half of November following the U.S. presidential election as the focus turned to the “fiscal cliff” in the U.S. Markets began to rally in mid-November as hope grew that U.S. lawmakers could reach an agreement that would avoid the $600 billion of automatic tax hikes and spending cuts that were scheduled to take effect in the new year. Market performance faded at the end of December as hope for an agreement waned.
Markets steadily rose in January 2013 after U.S. politicians finally passed and signed legislation that avoided much of the so-called “fiscal cliff,” although the legislation fell far short of the “grand bargain” that some had hoped for, leaving looming fiscal policy fights ahead. After reaching five-year highs, equity markets fell in February 2013 in response to weak U.S. and European economic data. They bounced back at the end of February and rallied through mid-March 2013, led by Japanese equities as investors anticipated that the Bank of Japan’s new governor would push forward very aggressive monetary easing policies. Markets fell slightly in mid-March after the small European country of Cyprus requested a bailout of its financial system, raising concerns about economic stability in Europe.
Following some bumpy first weeks in April 2013, markets rose until May 21, when Federal Reserve chairman Ben Bernanke indicated that the Fed might begin tapering quantitative easing in 2013 if employment improved. Markets then fell, particularly in June 2013 after Bernanke, at a press conference, clarified his earlier remarks regarding tapering. Markets rose slightly during the last week of the quarter after the U.S., European, and Chinese central banks all
delivered remarks aimed at assuaging investor concerns about liquidity, noting that “tapering” referred to less accommodative, not most restrictive, monetary policies. Performance was also helped by positive U.S. macro data, which suggested, among other things, that the housing market was improving.
Global equity market performance was positive in each of the ten Global Industry Classification Standard (“GICS”) sectors except the materials sector. Performance was strongest in consumer discretionary, health care, and financials. Materials, utilities, and energy were the poorest performing sectors. Japan and the U.S. were the strongest performing regions globally, while emerging markets, particularly Brazil, lagged.
Fund review
Over time, we seek to grow the total dividends paid by the Fund each year, while pursuing our other goals of providing an attractive current yield and total returns. During the twelve months ended June 30, 2013, the Fund paid ordinary quarterly dividends of 42.1 cents per share on its Institutional Class shares. The dividend per share was slightly lower for the other share classes, to account for varying class specific expenses. The Fund’s net asset value increased by $1.13 per share (from $10.47 to $11.60) over the reporting period, bringing the twelve-month total return to 15.17% (net of fees).
On a relative basis, the Fund outperformed its benchmark (a blend of 75% MSCI All Country World Index Net USD/25% Barclays Global Aggregate (USD Unhedged) Index), which returned 11.63%. Overall security selection within equities was positive, and was particularly strong in the health care, energy, and telecommunication services sectors. Security selection was negative in the materials and industrials sectors.
At the security level, the Fund’s position in Marathon Petroleum, a U.S. oil refining and marketing company, was the largest contributor to relative performance. Marathon’s stock outperformed as the company continued to profit from above-average crack spreads and growing oil production in America’s heartland, and Marathon announced favorable quarterly earnings results in both November 2012 and January 2013. The company also announced that it had entered into a $500 million share repurchase program. These positive developments prompted Moody’s to upgrade Marathon’s credit rating in March 2013.
Enagás was another contributor to performance. The Spanish natural gas utility outperformed as the outlook for the regulatory environment in Spain became more favorable, and after reporting positive quarterly earnings results which were driven by the contribution of new assets as well as by cost controls. Enagás also grew its semiannual dividend in April 2013.
The largest detractor for the period was the Fund’s holding of Gold Fields. The South African precious metals miner underperformed in sympathy with gold, the price of which declined during the period as
| 4 | PIMCO EQUITY SERIES |
Table of Contents
the economic environment appeared to stabilize and investor demand for gold declined. At the same time, Gold Fields’ production difficulties led to earnings disappointments. Given these increased risks, the Fund exited the position.
Poseidon Concepts was another detractor from performance. The Canada-based fluid management company underperformed after announcing disappointing quarterly earnings results in November 2012. The disappointment was due mainly to a decline in water tank utilization, lower North American rig counts, and a revision on the company’s ability to collect accounts receivable fully. Our concerns, including that the company might eliminate its dividend, prompted the Fund to exit the position.
The Fund’s fixed income allocation performed positively, driven mainly by overweight positions to investment grade, high yield, and emerging markets credit securities, as these sectors outperformed during the reporting period.
Investment process and portfolio construction
Our bottom-up investment strategy is focused on providing attractive income today and long-term capital appreciation. As we seek to achieve these goals, we employ fundamental research that aims to identify attractively priced companies exhibiting the ability and willingness to increase dividend payments. We then construct a portfolio that is diversified across three types of businesses:
| n | Consistent Earners are blue-chip industry leaders that consistently create value year after year. |
| n | Basic Value companies are traditional value companies such as cyclicals, turnarounds, and companies with low valuations. |
| n | Emerging Franchises are companies with the potential to be significantly larger over time. |
Our total return focused approach to dividend investing means that we do not advocate selecting equity investments based on yield alone. Instead, we believe that an investment process that seeks out attractively valued income generating opportunities is critical in an environment where certain sectors commonly targeted by investors for yield are expensive relative to history. Additionally, we believe that dividend growth is a vital ingredient to investment success with benefits including excess returns over the broad market and an increasing yield on cost over time.
Conclusion
Over the reporting period, we “derisked” the portfolio by decreasing our allocation to “Consistent Earners” (i.e. stable, blue-chip companies) that had appreciated in value during the market rally. We also increased our allocations to “Basic Value” (i.e. more cyclical) companies and
“Emerging Franchises” (i.e. growth companies) as the market volatility provided opportunities to initiate positions in some very compelling investments. At the sector level, we reduced our allocation to health care and materials and increased our allocation to financials.
Going forward, we maintain our long-term view that dividend-paying equities have the potential to be an attractive long-term investment solution, especially given a secular outlook for lower returns across asset classes. With ten-year U.S. Treasury yields currently near historical lows, the dividend yield on global stocks can be particularly attractive albeit with additional volatility and potential for loss. As always, however, we continue to emphasize valuation in a market that has recently been characterized by overreactions to both positive and negative news.
We thank you for your investment in the Fund.
Sincerely,
 |  | |
 |  | |
| Brad Kinkelaar | Cliff Remily, CFA | |
| Co-Portfolio Manager | Co-Portfolio Manager | |
 | ||
 | ||
| Eve Tournier | ||
| Fixed Income Portfolio Manager | ||
| ANNUAL REPORT | JUNE 30, 2013 | 5 |
Table of Contents
Insights from the Portfolio Managers PIMCO Dividend and Income Builder Fund (Cont.)
Top 10 Holdings1
KeyCorp | 3.4% | |||||
JPMorgan Chase & Co. | 3.4% | |||||
Kohl’s Corp. | 3.3% | |||||
Cisco Systems, Inc. | 3.2% | |||||
Walgreen Co. | 3.2% | |||||
Microsoft Corp. | 3.0% | |||||
ProSafe SE | 2.5% | |||||
Enagas S.A. | 2.5% | |||||
Nippon Telegraph & Telephone Corp. | 2.4% | |||||
Total S.A. | 2.3% |
Geographic Breakdown1
United States | 42.5% | |||||
United Kingdom | 8.8% | |||||
France | 4.3% | |||||
Brazil | 3.8% | |||||
Japan | 3.6% | |||||
South Africa | 3.6% | |||||
Switzerland | 3.3% | |||||
Spain | 3.0% | |||||
Netherlands | 2.6% | |||||
Cyprus | 2.5% | |||||
Australia | 2.4% | |||||
Canada | 2.0% | |||||
Other | 9.3% |
Sector Breakdown1
Financials | 23.1% | |||||
Health Care | 10.4% | |||||
Energy | 9.6% | |||||
Consumer Discretionary | 9.1% | |||||
Industrials | 9.1% | |||||
Information Technology | 8.2% | |||||
Telecommunication Services | 7.4% | |||||
Consumer Staples | 5.5% | |||||
Utilities | 6.0% | |||||
Mortgage-Backed Securities | 1.5% | |||||
Other | 1.7% |
| 1 | % of Total Investments as of 06/30/2013. Top Holdings, Geographic and Sector Breakdown solely reflect long positions. Securities sold short, financial derivative instruments and short-term instruments are not taken into consideration. |
| 6 | PIMCO EQUITY SERIES |
Table of Contents
PIMCO Dividend and Income Builder Fund
| Institutional Class - PQIIX | Class A - PQIZX | |
| Class P - PQIPX | Class C - PQICX | |
| Class D - PQIDX | Class R - PQIBX |
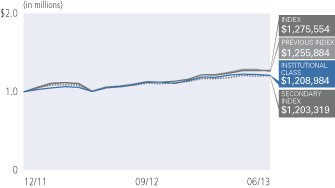
Cumulative Returns Through June 30, 2013
| Average Annual Total Return for the period ended June 30, 2013 | ||||||||||
| 1 Year | Fund Inception (12/14/11) | |||||||||
 | PIMCO Dividend and Income Builder Fund Institutional Class | 15.17% | 14.59% | |||||||
| PIMCO Dividend and Income Builder Fund Class P | 15.15% | 14.61% | ||||||||
| PIMCO Dividend and Income Builder Fund Class D | 14.91% | 14.29% | ||||||||
| PIMCO Dividend and Income Builder Fund Class A | 14.91% | 14.29% | ||||||||
| PIMCO Dividend and Income Builder Fund Class A (adjusted) | 8.59% | 10.18% | ||||||||
| PIMCO Dividend and Income Builder Fund Class C | 14.08% | 13.40% | ||||||||
| PIMCO Dividend and Income Builder Fund Class C (adjusted) | 13.08% | 13.40% | ||||||||
| PIMCO Dividend and Income Builder Fund Class R | 14.66% | 14.04% | ||||||||
 | MSCI All Country World Index Net USD± | 16.57% | 17.06% | |||||||
 | MSCI World Index** | 18.58% | 18.79% | |||||||
 | 75% MSCI All Country World Index Net USD/25% Barclays Global Aggregate USD Unhedged±± | 11.63% | 12.72% | |||||||
All Fund returns are net of fees and expenses.
± The MSCI All Country World Index Net USD is a free float-adjusted market capitalization weighted index that is designed to measure the equity market performance of developed and emerging markets. The Index consists of 45 country indices comprising 24 developed and 21 emerging market country indices. It is not possible to invest directly in an unmanaged index.
±± The benchmark is a blend of 75% MSCI All Country World Index Net USD/25% Barclays Global Aggregate USD Unhedged. The MSCI All Country World Index Net USD is a free float-adjusted market capitalization weighted index that is designed to measure the equity market performance of developed and emerging markets. The Index consists of 45 country indices comprising 24 developed and 21 emerging market country indices. Barclays Global Aggregate (USD Unhedged) Index provides a broad-based measure of the global investment-grade fixed income markets. The three major components of this index are the U.S. Aggregate, the Pan-European Aggregate, and the Asian-Pacific Aggregate Indices. The index also includes Eurodollar and Euro-Yen corporate bonds, Canadian Government securities, and USD investment grade 144A securities. It is not possible to invest directly in an unmanaged index.
** The MSCI World Index is a free float-adjusted market capitalization weighted index that is designed to measure the equity market performance of developed markets. The MSCI World Index consists of 24 developed market country indices. It is not possible to invest directly in an unmanaged index.
Performance quoted represents past performance. Past performance is not a guarantee or a reliable indicator of future results. Current performance may be lower or higher than performance shown. Investment return and the principal value of an investment will fluctuate. Shares may be worth more or less than original cost when redeemed. Returns shown do not reflect the deduction of taxes that a shareholder would pay on fund distributions or the redemption of fund shares. The adjusted returns take into account the maximum sales charge of 5.50% on Class A shares and 1.00% CDSC on Class C shares. The Fund’s total annual operating expense ratio as stated in the Fund’s current prospectus, as supplemented to date, is 0.99% for the Institutional Class shares, 1.09% for the Class P shares, 1.34% for the Class D shares, 1.34% for the Class A shares, 2.09% for the Class C shares and 1.59% for the Class R shares. Details regarding any Fund’s operating expenses can be found in the Fund’s prospectus. For performance current to the most recent month-end, visit www.pimco.com/investments.
Portfolio Insights
| » | The PIMCO Dividend and Income Builder Fund seeks to provide current income that exceeds the average yield on global stocks, and to provide a growing stream of income per share over time, with a secondary objective to seek to provide long-term capital appreciation, by investing under normal circumstances at least 80% of its assets in a diversified portfolio of income-producing investments, and will typically invest at least 50% of its assets in equity and equity-related securities. The Fund’s investments in equity and equity-related securities include common and preferred stock (and securities convertible into, or that PIMCO expects to be exchanged for, common or preferred stock), as well as securities issued by real estate investment trusts, master limited partnerships and other equity trusts and depositary receipts. |
| » | The Fund’s Institutional Class shares returned 15.17% after fees, and the Fund’s benchmark index, a blend of 75% MSCI All Country World Index Net USD/25% Barclays Global Aggregate (USD Unhedged) Index, returned 11.63%. |
| » | During the reporting period, the Fund paid ordinary quarterly dividends of 42.1 cents per share on its Institutional Class shares. The dividend per share was slightly lower for the other share classes, to account for varying class specific expenses. The net asset value of the Fund’s Institutional Class shares increased by $1.13 per share (from $10.47 to $11.60) over the reporting period, bringing the twelve-month total return to 15.17%. |
| » | Security selection contributed to performance. The largest single contributor to relative performance was the Fund’s holding of Marathon Petroleum, the U.S.-based oil refining and marketing company. |
| » | The largest single detractor from relative performance was the Fund’s holding of Gold Fields. The South African precious metals miner underperformed as the price of gold declined during the reporting period. |
| » | The Fund’s defensive sector positioning, specifically the Fund’s underweights to consumer discretionary and financials, detracted from relative performance. |
| » | The Fund’s fixed income allocation performed positively, driven mainly by overweights to investment grade, high yield, and emerging markets credit securities, as these sectors outperformed during the reporting period. |
| ANNUAL REPORT | JUNE 30, 2013 | 7 |
Table of Contents
Insights from the Portfolio Managers PIMCO EqS® Dividend Fund
Dear Shareholder,
We appreciate your investment in the PIMCO EqS® Dividend Fund (the “Fund”). In the following letter, please find a discussion of the recent market environment and a review of portfolio performance.
Market overview
During the twelve months ended June 30, 2013, the MSCI All Country World Index Net USD (the “Index”), which tracks the performance of stocks in developed and emerging markets countries, returned 16.57%. While overall market performance was positive, the intra-period performance was volatile due to political uncertainty in the U.S. and Europe.
Global equity market performance was strong during most of the third quarter of 2012 after Mario Draghi, President of the European Central Bank, vowed on July 26 to do “whatever it takes” to stabilize Europe. Following the U.S. Federal Reserve’s (“Fed”) announcement of plans for more stimulus action in mid-September, however, global equity markets declined and remained volatile through October, possibly implying a decreasing effectiveness of Fed actions. Global equity markets resumed the decline during the first half of November following the U.S. presidential election as the focus turned to the “fiscal cliff” in the U.S. Markets began to rally in mid-November as hope grew that U.S. lawmakers could reach an agreement that would avoid the $600 billion of automatic tax hikes and spending cuts that were scheduled to take effect in the new year. Market performance faded at the end of December as hope for an agreement waned.
Markets steadily rose in January 2013 after U.S. politicians finally passed and signed legislation that avoided much of the so-called “fiscal cliff,” although the legislation fell far short of the “grand bargain” that some had hoped for, leaving looming fiscal policy fights ahead. After reaching five-year highs, equity markets fell in February 2013 in response to weak U.S. and European economic data. They bounced back at the end of February and rallied through mid-March 2013, led by Japanese equities as investors anticipated that the Bank of Japan’s new governor would push forward very aggressive monetary easing policies. Markets fell slightly in mid-March after the small European country of Cyprus requested a bailout of its financial system, raising concerns about economic stability in Europe.
Following some bumpy first weeks in April 2013, markets rose until May 21, when Federal Reserve chairman Ben Bernanke indicated that the Fed might begin tapering quantitative easing in 2013 if employment improved. Markets then fell, particularly in June 2013 after Bernanke, at a press conference, clarified his earlier remarks regarding tapering. Markets rose slightly during the last week of the quarter after the U.S., European, and Chinese central banks all delivered remarks aimed at assuaging investor concerns about
liquidity, noting that “tapering” referred to less accommodative, not most restrictive, monetary policies. Performance was also helped by positive U.S. macro data, which suggested, among other things, that the housing market was improving.
Global equity market performance was positive in each of the ten Global Industry Classification Standard (“GICS”) sectors except the materials sector. Performance was strongest in consumer discretionary, health care, and financials. Materials, utilities, and energy were the poorest performing sectors. Japan and the U.S. were the strongest performing regions globally, while emerging markets, particularly Brazil, lagged.
Fund review
Over time, we seek to provide attractive current yield and total returns. During the twelve months ended June 30, 2013, the Fund paid ordinary quarterly dividends of 37.1 cents per share on its Institutional Class shares. The dividend per share was slightly lower for the other share classes, to account for varying class specific expenses. The Fund’s net asset value increased by $1.40 per share (from $10.47 to $11.87) over the reporting period, bringing the twelve-month total return to 17.32% (net of fees).
On a relative basis, the Fund outperformed the MSCI All Country World Index Net USD, which returned 16.57%. Overall security selection was positive, and was particularly strong in the health care, energy, and telecommunication services sectors. Security selection was negative in the materials and industrials sectors.
At the security level, the Fund’s position in Marathon Petroleum, a U.S. oil refining and marketing company, was the largest contributor to relative performance. Marathon’s stock outperformed as the company continued to profit from above-average crack spreads and growing oil production in America’s heartland, and Marathon announced favorable quarterly earnings results in both November 2012 and January 2013. The company also announced that it had entered into a $500 million share repurchase program. These positive developments prompted Moody’s to upgrade Marathon’s credit rating in March 2013.
Enagás was another contributor to performance. The Spanish natural gas utility outperformed as the outlook for the regulatory environment in Spain became more favorable, and after reporting positive quarterly earnings results which were driven by the contribution of new assets as well as by cost controls. Enagás also grew its semiannual dividend in April 2013.
The largest detractor for the period was the Fund’s holding of Gold Fields. The South African precious metals miner underperformed in sympathy with gold, the price of which declined during the period as
| 8 | PIMCO EQUITY SERIES |
Table of Contents
the economic environment appeared to stabilize and investor demand for gold declined. At the same time, Gold Fields’ production difficulties led to earnings disappointments. Given these increased risks, the Fund exited the position.
Poseidon Concepts was another detractor from performance. The Canada-based fluid management company underperformed after announcing disappointing quarterly earnings results in November 2012. The disappointment was due mainly to a decline in water tank utilization, lower North American rig counts, and a revision on the company’s ability to collect accounts receivable fully. Our concerns, including that the company might eliminate its dividend, prompted the Fund to exit the position.
Investment process and portfolio construction
Our bottom-up investment strategy is focused on providing attractive income today and long-term capital appreciation. As we seek to achieve these goals, we employ fundamental research that aims to identify attractively priced companies exhibiting the ability and willingness to increase dividend payments. We then construct a portfolio that is diversified across three types of businesses:
| n | Consistent Earners are blue-chip industry leaders that consistently create value year after year. |
| n | Basic Value companies are traditional value companies such as cyclicals, turnarounds, and companies with low valuations. |
| n | Emerging Franchises are companies with the potential to be significantly larger over time. |
Our total return focused approach to dividend investing means that we do not advocate selecting equity investments based on yield alone. Instead, we believe that an investment process that seeks out attractively valued income generating opportunities is critical in an environment where certain sectors commonly targeted by investors for yield are expensive relative to history. Additionally, we believe that dividend growth is a vital ingredient to investment success with benefits including excess returns over the broad market and an increasing yield on cost over time.
Conclusion
Over the reporting period, we “derisked” the portfolio by decreasing our allocation to “Consistent Earners” (i.e. stable, blue-chip companies) that had appreciated in value during the market rally. We also increased our allocations to “Basic Value” (i.e. more cyclical) companies and “Emerging Franchises” (i.e. growth companies) as the market volatility provided opportunities to initiate positions in some very compelling investments. At the sector level, we reduced our allocation to health care and materials and increased our allocation to financials.
Going forward, we maintain our long-term view that dividend-paying equities have the potential to be an attractive long-term investment solution, especially given a secular outlook for lower returns across asset classes. With ten-year U.S. Treasury yields currently near historical lows, the dividend yield on global stocks can be particularly attractive albeit with additional volatility and potential for loss. As always, however, we continue to emphasize valuation in a market that has recently been characterized by overreactions to both positive and negative news.
We thank you for your investment in the Fund.
Sincerely,
| | |
 |  | |
Brad Kinkelaar Co-Portfolio Manager | Cliff Remily, CFA Co-Portfolio Manager | |
Top 10 Holdings1
Walgreen Co. | 4.2% | |||||
JPMorgan Chase & Co. | 4.0% | |||||
Cisco Systems, Inc. | 4.0% | |||||
KeyCorp | 3.9% | |||||
Kohl’s Corp. | 3.7% | |||||
Microsoft Corp. | 3.5% | |||||
Nippon Telegraph & Telephone Corp. | 2.9% | |||||
Enagas S.A. | 2.8% | |||||
Intel Corp. | 2.5% | |||||
Total S.A. | 2.5% |
Geographic Breakdown1
United States | 46.3% | |||||
United Kingdom | 9.1% | |||||
France | 4.3% | |||||
Japan | 4.3% |
| ANNUAL REPORT | JUNE 30, 2013 | 9 |
Table of Contents
Insights from the Portfolio Managers PIMCO EqS® Dividend Fund (Cont.)
Geographic Breakdown1 (Cont.)
Brazil | 4.1% | |||||
South Africa | 4.0% | |||||
Switzerland | 3.7% | |||||
Canada | 2.8% | |||||
Spain | 2.8% | |||||
Cyprus | 2.5% | |||||
Netherlands | 2.5% | |||||
Australia | 2.3% | |||||
Other | 7.3% |
Sector Breakdown1
Financials | 24.1% | |||||
Health Care | 12.1% | |||||
Energy | 11.7% | |||||
Consumer Discretionary | 10.3% | |||||
Information Technology | 10.0% | |||||
Telecommunication Services | 8.9% | |||||
Consumer Staples | 7.0% | |||||
Industrials | 6.7% | |||||
Utilities | 5.3% |
| 1 | % of Total Investments as of 06/30/2013. Top Holdings, Geographic and Sector Breakdown solely reflect long positions. Securities sold short, financial derivative instruments and short-term instruments are not taken into consideration. |
| 10 | PIMCO EQUITY SERIES |
Table of Contents
| Institutional Class - PQDIX | Class A - PQDAX | |
| Class P - PQDPX | Class C - PQDCX | |
| Class D - PQDDX | Class R - PQDRX |
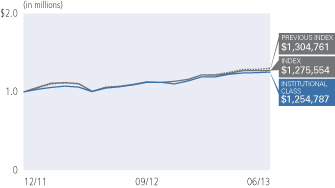
Cumulative Returns Through June 30, 2013
Average Annual Total Return for the period ended June 30, 2013 | ||||||||||
| 1 Year | Fund Inception (12/14/11) | |||||||||
| PIMCO EqS® Dividend Fund Institutional Class | 17.32% | 15.82% | |||||||
| PIMCO EqS® Dividend Fund Class P | 17.21% | 15.78% | ||||||||
| PIMCO EqS® Dividend Fund Class D | 16.85% | 15.46% | ||||||||
| PIMCO EqS® Dividend Fund Class A | 16.95% | 15.52% | ||||||||
| PIMCO EqS® Dividend Fund Class A (adjusted) | 10.52% | 11.37% | ||||||||
| PIMCO EqS® Dividend Fund Class C | 16.14% | 14.53% | ||||||||
| PIMCO EqS® Dividend Fund Class C (adjusted) | 15.14% | 14.53% | ||||||||
| PIMCO EqS® Dividend Fund Class R | 16.71% | 15.21% | ||||||||
| MSCI All Country World Index Net USD± | 16.57% | 17.06% | |||||||
| MSCI World Index** | 18.58% | 18.79% | |||||||
All Fund returns are net of fees and expenses.
± The MSCI All Country World Index Net USD is a free float-adjusted market capitalization weighted index that is designed to measure the equity market performance of developed and emerging markets. The Index consists of 45 country indices comprising 24 developed and 21 emerging market country indices. It is not possible to invest directly in an unmanaged index.
** The MSCI World Index is a free float-adjusted market capitalization weighted index that is designed to measure the equity market performance of developed markets. The MSCI World Index consists of 24 developed market country indices. It is not possible to invest directly in an unmanaged index.
Performance quoted represents past performance. Past performance is not a guarantee or a reliable indicator of future results. Current performance may be lower or higher than performance shown. Investment return and the principal value of an investment will fluctuate. Shares may be worth more or less than original cost when redeemed. Returns shown do not reflect the deduction of taxes that a shareholder would pay on fund distributions or the redemption of fund shares. The adjusted returns take into account the maximum sales charge of 5.50% on Class A shares and 1.00% CDSC on Class C shares. The Fund’s total annual operating expense ratio as stated in the Fund’s current prospectus, as supplemented to date, is 0.99% for the Institutional Class shares, 1.09% for the Class P shares, 1.34% for the Class D shares, 1.34% for the Class A shares, 2.09% for the Class C shares and 1.59% for the Class R shares. Details regarding any Fund’s operating expenses can be found in the Fund’s prospectus. For performance current to the most recent month-end, visit www.pimco.com/investments.
Portfolio Insights
| » | The PIMCO EqS® Dividend Fund seeks to provide current income that exceeds the average yield on global stocks, and as a secondary objective, seeks to provide long-term capital appreciation, by investing under normal circumstances at least 75% of its assets in equity and equity-related securities, including common and preferred stock (and securities convertible into, or that PIMCO expects to be exchanged for, common or preferred stock), as well as securities issued by real estate investment trusts, master limited partnerships and other equity trusts and depositary receipts. |
| » | The Fund’s Institutional Class shares returned 17.32% after fees, and the Fund’s benchmark index, the MSCI All Country World Index Net USD, returned 16.57%. |
| » | During the reporting period, the Fund paid ordinary quarterly dividends of 37.1 cents per share on its Institutional Class shares. The dividend per share was slightly lower for the other share classes to account for varying class specific expenses. The net asset value of the Fund’s Institutional Class shares increased by $1.40 per share (from $10.47 to $11.87) over the reporting period, bringing the twelve-month total return to 17.32%. |
| » | Security selection contributed to performance. The largest single contributor to relative performance was the Fund’s holding of Marathon Petroleum, the U.S.-based oil refining and marketing company. |
| » | The largest single detractor from relative performance was the Fund’s holding of Gold Fields. The South African precious metals miner underperformed as the price of gold declined during the reporting period. |
| » | The Fund’s defensive sector positioning, specifically the Fund’s underweights to consumer discretionary and financials, detracted from relative performance. |
| ANNUAL REPORT | JUNE 30, 2013 | 11 |
Table of Contents
Insights from the Portfolio Managers PIMCO EqS® Emerging Markets Fund
Dear Shareholder,
We appreciate your investment in the PIMCO EqS® Emerging Markets Fund (the “Fund”). In the following letter, please find a discussion of the recent market environment and a review of portfolio performance.
Market Overview
While developed market equities rallied strongly over the twelve-month reporting period, emerging market (“EM”) equities delivered modest returns, with the MSCI Emerging Markets Index increasing 2.87%, underperforming its developed market counterpart, the MSCI World Index, by over 15%.
With emerging market equities performing roughly in-line with developed markets during the latter half of 2012, the difference in performance has been driven by events in 2013. While earnings growth continues to be slow, a more optimistic outlook for the U.S. economy and unprecedented monetary stimulus in Japan has helped trigger a re-rating of multiples in equity markets. At the same time as sentiment has become more positive for developed economies, it has become more negative for emerging markets. Companies have been struggling to grow earnings in an environment of moderate global growth, and concerns over slowing growth in China have weighed on equity market returns. Furthermore, both emerging market equities and fixed income have been vulnerable to the influence of developed market monetary policy, with the asset classes suffering from a sell-off in May and June following comments from the Federal Reserve (“Fed”) that it may unwind its program of bond purchases earlier than expected. This talk of so-called “Fed tapering” sparked an increase in U.S. interest rates and a subsequent fall in EM local currencies.
Looking forward, our view is that a more negative outlook on emerging markets, given lower growth in China, earnings weakness and higher U.S. interest rates, is offset by long-term economic advantages, and historically low valuations. We continue to believe that emerging market growth rates will exceed that of developed markets, as structural advantages such as higher current account balances, higher foreign currency reserves, lower degrees of indebtedness, and better demographic profiles, remain. In our view, these growth dynamics should continue to provide long-term support for emerging market companies. At the same time, we think many short-term concerns may already be reflected in market prices, particularly in sectors such as energy and materials, which on a price-to-book basis, are trading close to or below valuation troughs reached in 2008. These valuations may in turn provide attractive entry points for investors taking a long-term approach to the asset class.
Fund Review
Over the twelve-month reporting period, the Fund’s Institutional Class shares returned 4.68% net of fees, outperforming its benchmark index, the MSCI Emerging Markets Index, by 1.81% on an after fees basis.
Against a backdrop of low global economic growth, a focus on businesses with long-term secular growth drivers, as opposed to short-term cyclical return drivers, was a major factor in the Fund’s performance. High quality consumer discretionary firms performed particularly well, benefiting from growing demand in end markets. Top performers included Melco Crown Entertainment, a Macau gaming company, which benefits from a combination of expanding demand, driven by wage growth, and constrained supply, which is limited by regulation. Other top contributors to performance included Thai Beverage, which performed strongly after the company successfully acquired food and beverage assets from Singaporean conglomerate, Fraser and Neave.
With low growth sustaining low interest rates in developed markets (at least until recent months), businesses with more consistent earnings profiles offering attractive dividend yields also outperformed. Two examples of this were MegaFon, a Russian telecom company, and KCell, a Kazakhstani telecoms company, which the Fund purchased for their “ultra” high dividend yields of between 10% and 15%, and which re-rated over the reporting period.
While businesses with sustainable growth drivers and consistent earnings profiles outperformed, those more exposed to short-term cyclical swings, and in particular to resources and commodities, suffered. The Fund’s avoidance of many of the largest companies in this sector was positive for relative returns; however, the areas of the portfolio where we had more cyclical exposure detracted on an absolute basis. Underperformers in this area included China Shenhua Energy, a Chinese coal producer, and Turquoise Resources, a Mongolia-based subsidiary of mining company, Rio Tinto. The share prices of both of these companies suffered in line with falling commodity prices.
Conclusion
Mid-way through 2013, we are mindful of the short-term headwinds facing emerging markets, while remaining optimistic on the long-term growth potential of these economies. We believe that emerging market equities remain attractively valued on a historical basis and that real wage growth and an emerging consuming class should drive equity returns. To take advantage of these trends we continue to adopt an unconstrained approach, investing in both emerging market stocks, and developed market stocks with emerging market growth drivers. We also continue to employ an active approach to currency management, an area that may be particularly important in light of the recent volatility seen in emerging market currencies. From a stock perspective, we are focused on consumer sectors, where we are gaining exposure through what we believe are high quality consumer discretionary firms, while avoiding more expensively valued staples firms. We are also finding attractive opportunities in more cyclical sectors trading at low valuations.
| 12 | PIMCO EQUITY SERIES |
Table of Contents
Again, we thank you for your continued investment in the Fund and look forward to serving your investment needs.
Sincerely,
Maria (Masha) Gordon Portfolio Manager |

Top 10 Holdings1
Kia Motors Corp. | 3.3% | |||||
Itau Unibanco Holding S.A. SP—ADR | 3.1% | |||||
Samsung Electronics Co. Ltd. | 2.9% | |||||
Israel Chemicals Ltd. | 2.5% | |||||
JPMorgan Chase & Co., Chinese Exchange | 2.4% | |||||
China Mobile Ltd. | 2.4% | |||||
MegaFon OAO GDR | 2.4% | |||||
Samsung Electronics Co. Ltd.—Preferred Stock | 2.3% | |||||
AIA Group Ltd. | 2.2% | |||||
Bolsa Mexicana de Valores S.A.B. de C.V. | 2.1% |
Geographic Breakdown1
China | 10.6% | |||||
Brazil | 10.3% | |||||
South Korea | 8.5% | |||||
Russia | 8.1% | |||||
Hong Kong | 6.4% | |||||
India | 6.1% | |||||
United Kingdom | 3.7% | |||||
Israel | 3.5% | |||||
Japan | 3.2% |
Geographic Breakdown1 (Cont.)
Peru | 2.8% | |||||
South Africa | 2.6% | |||||
Indonesia | 2.3% | |||||
Cyprus | 2.3% | |||||
Thailand | 2.2% | |||||
Mexico | 2.1% | |||||
Italy | 2.0% | |||||
Kazakhstan | 2.0% | |||||
Macau | 1.9% | |||||
Denmark | 1.9% | |||||
Turkey | 1.7% | |||||
Luxembourg | 1.6% | |||||
Australia | 1.6% | |||||
Cambodia | 1.6% | |||||
Other | 6.9% |
Sector Breakdown1
Financials | 20.9% | |||||
Consumer Discretionary | 16.9% | |||||
Consumer Staples | 16.0% | |||||
Telecommunication Services | 9.8% | |||||
Materials | 8.8% | |||||
Information Technology | 7.7% | |||||
Industrials | 5.8% | |||||
Energy | 5.6% | |||||
Exchange-Traded Funds | 1.6% | |||||
Utilities | 1.6% | |||||
Health Care | 1.0% |
| 1 | % of Total Investments as of 06/30/2013. Top Holdings, Geographic and Sector Breakdown solely reflect long positions. Securities sold short, financial derivative instruments and short-term instruments are not taken into consideration. |
| ANNUAL REPORT | JUNE 30, 2013 | 13 |
Table of Contents
PIMCO EqS® Emerging Markets Fund
| Institutional Class - PEQWX | Class A - PEQAX | |
| Class P - PEQQX | Class C - PEQEX | |
| Administrative Class - PEQTX | Class R - PEQHX | |
| Class D - PEQDX |
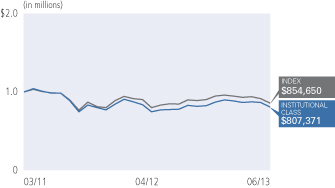
Cumulative Returns Through June 30, 2013
| Average Annual Total Return for the period ended June 30, 2013 | ||||||||||
1 Year | Fund Inception | |||||||||
| PIMCO EqS® Emerging Markets Fund Institutional Class | 4.68% | -7.51% | |||||||
PIMCO EqS® Emerging Markets Fund Class P | 4.46% | -7.60% | ||||||||
PIMCO EqS® Emerging Markets Fund Administrative Class | 4.36% | -7.79% | ||||||||
PIMCO EqS® Emerging Markets Fund Class D | 4.31% | -7.87% | ||||||||
PIMCO EqS® Emerging Markets Fund Class A | 4.23% | -7.93% | ||||||||
PIMCO EqS® Emerging Markets Fund Class A (adjusted) | -1.48% | -10.18% | ||||||||
PIMCO EqS® Emerging Markets Fund Class C | 3.54% | -8.51% | ||||||||
PIMCO EqS® Emerging Markets Fund Class C (adjusted) | 2.54% | -8.51% | ||||||||
PIMCO EqS® Emerging Markets Fund Class R | 4.04% | -8.07% | ||||||||
| MSCI Emerging Markets Index (Net Dividends in USD)± | 2.87% | -4.81% | |||||||
All Fund returns are net of fees and expenses.
± The MSCI Emerging Markets Index (Net Dividends in USD) is a free float-adjusted market capitalization index that is designed to measure equity market performance of emerging markets. The MSCI Emerging Markets Index consists of the following 21 emerging market country indices: Brazil, Chile, China, Colombia, Czech Republic, Egypt, Hungary, India, Indonesia, Korea, Malaysia, Mexico, Morocco, Peru, Philippines, Poland, Russia, South Africa, Taiwan, Thailand, and Turkey. It is not possible to invest directly in an unmanaged index.
Performance quoted represents past performance. Past performance is not a guarantee or a reliable indicator of future results. Current performance may be lower or higher than performance shown. Investment return and the principal value of an investment will fluctuate. Shares may be worth more or less than original cost when redeemed. Returns shown do not reflect the deduction of taxes that a shareholder would pay on fund distributions or the redemption of fund shares. The adjusted returns take into account the maximum sales charge of 5.50% on Class A shares and 1.00% CDSC on Class C shares. The Fund’s total annual operating expense ratio as stated in the Fund’s current prospectus, as supplemented to date, is 1.49% for the Institutional Class shares, 1.59% for the Class P shares, 1.74% for the Administrative Class shares, 1.84% for the Class D shares, 1.84% for the Class A shares, 2.59% for the Class C shares and 2.09% for the Class R shares. Details regarding any Fund’s operating expenses can be found in the Fund’s prospectus. For performance current to the most recent month-end, visit www.pimco.com/investments.
Portfolio Insights
| » | The PIMCO EqS® Emerging Markets Fund seeks capital appreciation by investing under normal circumstances at least 80% of its assets in a diversified portfolio of investments economically tied to emerging market countries. The Fund will invest a substantial portion of its assets in equity and equity-related securities, including common and preferred stock (and securities convertible into, or that PIMCO expects to be exchanged for, common or preferred stock). The Fund may also invest in fixed income securities, including debt securities issued by both corporate and government issuers. The Fund may invest in commodity related instruments, including exchange-traded funds, futures and other investment companies. The Fund may also invest in derivative instruments, such as options, futures contracts or swap agreements. |
| » | The Fund’s Institutional Class shares returned 4.68% after fees, and the Fund’s benchmark index, the MSCI Emerging Markets Index, returned 2.87%. |
| » | From a sector perspective, stock selection in the consumer discretionary and telecommunications sectors contributed to relative performance. In consumer discretionary, positions in companies benefiting from strong secular growth in gaming and retail were the top contributors. In telecommunications, mobile phone operators with high dividend yields and stable earnings streams in Russia and Kazakhstan performed well. |
| » | On the downside, an underweight to information technology detracted from returns as the sector outperformed the Fund’s benchmark index. Stock selection in information technology and industrials also detracted from returns, with the former driven by both underperformance of portfolio holdings and avoidance of large benchmark weights which outperformed. |
| » | From a country perspective, stock selection in Brazil and Korea, together with exposure to Japanese companies with emerging market growth drivers, was positive for performance. |
| » | On the downside, stock selection in Russia and China detracted from returns as these securities underperformed. |
| » | Currency positioning and cash holdings were positive contributors to performance over the reporting period. |
| 14 | PIMCO EQUITY SERIES |
Table of Contents
Insights from the Portfolio Managers PIMCO EqS® Long/Short Fund
Dear Shareholder,
We appreciate your investment in the PIMCO EqS® Long/Short Fund (the “Fund”). In the following letter, please find a discussion of the recent market environment and a review of recent portfolio performance.
Market Overview
U.S. equities rallied over the twelve-month reporting period, reaching an all-time high in May 2013 before retreating in June. The rally was largely driven by coordinated monetary easing on behalf of the Federal Reserve, the European Central Bank (“ECB”) and the Bank of Japan. In late 2012 in particular, positive sentiment increased due to a perceived reduction in the risk of a severe left tail event in Europe, following the ECB’s announcement of plans to purchase government bonds in early September.
Markets experienced a slight pull back in June 2013 as investors began to speculate as to the speed and magnitude of the Federal Reserve’s tapering and eventual exit of its supportive monetary policies. Investor sentiment continued to not be affected by continuing concerns out of Europe, viewing these concerns largely as localized events without impairing the region’s access to capital markets. Economic data in the U.S. has been mixed as employment and payroll numbers continue to be modest. Although risks remain, slow growth, as opposed to severe crisis, now appears to be the consensus view.
Fund Review
Over the twelve-month reporting period, the Fund returned 14.66% net of fees, outperforming its benchmark, 3-Month USD LIBOR by 14.31% on an after fees basis.
The Fund’s position in Spirit Airlines was the top contributor to performance. Shares were down in 2012 after a beneficial tax expired causing an increase in fares and hurricane Sandy impacted flights. Spirit Airlines rebounded in 2013 and has added to the Fund’s performance overall since we initiated a position. The company reported solid earnings for its fourth fiscal quarter and has resumed its attractive growth rate. The other area of contribution was the Fund’s positions with high yields and upside potential including several companies that are undergoing real estate investment trust (“REIT”) conversions. This included prison operators Geo Group and Corrections Corp. of America and records management company Iron Mountain. We believe this process can enhance cash generative businesses as the markets reassess intrinsic value after conversion based on different metrics than non-REIT businesses.
The Fund’s investment in Domino’s Pizza, consistent with the theme of consumers trading down in a moderate growth environment, also contributed to performance for the reporting period. The company
reported higher earnings driven by rapid international expansion of its asset-light franchise model, which keeps capital expenditure intensity and commodity risk (i.e. wheat and cheese) low and enhances cash generation. A combination of product innovation and low ticket prices has kept developed-world consumers coming back and rising discretionary incomes have driven emerging market sales. We sold out of the position after shares appreciated and we felt there was less upside potential.
These positive results were partially offset by the Fund’s position in Herbalife, which detracted from returns. Our original thesis on Herbalife was that the company had attractive growth prospects, but a depressed valuation multiple versus its peer group after an earnings disappointment earlier in the year has changed our view. Since that time, multiples for Herbalife’s peers have also contracted and we believe the controversial headlines for the company make it less likely that the multiple expands in the near future. As a result, we believe the opportunity is less compelling and have decided to exit the position.
In addition, our short positions detracted in aggregate due to the strong equity market rally. Our approach to shorting is to generate alpha as opposed to simply hedging market risk. We believe that stock market exposure represents an important expected driver of long-term capital appreciation for many investors. However, equity markets do not always deliver positive returns and often are characterized by periods of high volatility. Consequently, we believe investors can benefit from a strategy that seeks to provide exposure to the long-term growth benefits of owning stocks, while allowing for better downside risk mitigation. To help meet these needs, the Fund aims to provide a positive return with lower volatility than the equity market over the long term. Although the Fund does not explicitly aim to manage short-term volatility, we believe it has greater ability than many traditional long-only strategies to manage downside risk, which provides the opportunity for strong risk-adjusted returns over a full market cycle. While detracting over the one year period, these positions did serve to reduce the volatility of the portfolio in periods when the market pulled back, and we believe can still generate alpha over the full market cycle.
Conclusion
Mid-way through 2013, much of the strong equity market performance this year has been driven by multiple expansions rather than earnings growth, suggesting central bank activity, rather than underlying fundamentals, has been driving returns. As macroeconomic events continue to create inflection points and heightened equity market volatility, we believe an emphasis on downside risk mitigation will be critical. As a result, we have been very selective on both the long and short side of the portfolio while also carefully managing our net equity
| ANNUAL REPORT | JUNE 30, 2013 | 15 |
Table of Contents
Insights from the Portfolio Managers PIMCO EqS® Long/Short Fund (Cont.)
market exposure. While we believe earnings growth will continue to be moderate, certain areas of the U.S. economy appear to be in recovery. In particular, we are seeking to benefit from strengthening in the U.S. housing market, construction and recovering financials.
Again, we thank you for your continued investment in the Fund and look forward to serving your investment needs.
Sincerely,


Geoffrey Johnson, CFA
Portfolio Manager
Top 10 Holdings1
Kirby Corp. | 6.0% | |||||
DST Systems, Inc. | 5.6% | |||||
Spirit Airlines, Inc. | 5.4% | |||||
American International Group, Inc. | 4.8% | |||||
Enstar Group Ltd. | 4.1% | |||||
Methanex Corp. | 3.9% | |||||
SNC-Lavalin Group, Inc. | 3.6% | |||||
Genworth Financial, Inc. ‘A’ | 3.3% | |||||
Gilead Sciences, Inc. | 3.2% | |||||
Express Scripts Holding Co. | 3.0% |
Sector Breakdown2
Industrials | 22.2% | |||||
Financials | 12.3% | |||||
Health Care | 7.9% | |||||
Consumer Discretionary | 7.3% | |||||
Consumer Staples | 5.9% | |||||
Information Technology | 3.8% | |||||
Exchange-Traded Funds | (1.2% | ) | ||||
Materials | (3.4% | ) | ||||
Energy | (7.8% | ) |
| 1 | % of Total Investments as of 06/30/2013. Top Holdings solely reflect long positions. Securities sold short, financial derivative instruments and short-term instruments are not taken into consideration. |
| 2 | % of net exposure (Total Investments less Securities Sold Short) as of 06/30/2013. Financial derivative instruments and short-term instruments are not taken into consideration. |
| 16 | PIMCO EQUITY SERIES |
Table of Contents
| Institutional Class - PMHIX | Class A - PMHAX | |
| Class P - PMHBX | Class C - PMHCX | |
| Class D - PMHDX |
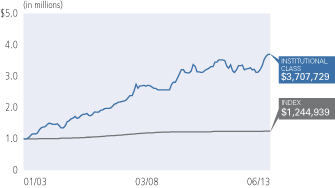
Cumulative Returns Through June 30, 2013
Average Annual Total Return for the period ended June 30, 2013* | ||||||||||||||||||
| 1 Year | 5 Year | 10 Year | Fund Inception (01/01/03) | |||||||||||||||
| PIMCO EqS® Long/Short Fund Institutional Class | 14.66% | 6.84% | 12.27% | 13.43% | |||||||||||||
| PIMCO EqS® Long/Short Fund Class P | 14.77% | 6.75% | 12.17% | 13.33% | ||||||||||||||
| PIMCO EqS® Long/Short Fund Class D | 14.31% | 6.47% | 11.88% | 13.04% | ||||||||||||||
| PIMCO EqS® Long/Short Fund Class A | 14.27% | 6.46% | 11.88% | 13.04% | ||||||||||||||
| PIMCO EqS® Long/Short Fund Class A (adjusted) | 8.03% | 5.26% | 11.24% | 12.43% | ||||||||||||||
| PIMCO EqS® Long/Short Fund Class C | 13.41% | 5.67% | 11.04% | 12.19% | ||||||||||||||
| PIMCO EqS® Long/Short Fund Class C (adjusted) | 12.41% | 5.67% | 11.04% | 12.19% | ||||||||||||||
| 3 Month USD LIBOR Index±± | 0.35% | 0.76% | 2.16% | 2.12% | |||||||||||||
All Fund returns are net of fees and expenses.
±± 3 Month USD LIBOR (London Interbank Offered Rate) Index is an average interest rate, determined by the British Bankers Association, that banks charge one another for the use of short-term money (3 months) in England’s Eurodollar market. It is not possible to invest directly in an unmanaged index.
Performance quoted represents past performance. Past performance is not a guarantee or a reliable indicator of future results. Current performance may be lower or higher than performance shown. Investment return and the principal value of an investment will fluctuate. Shares may be worth more or less than original cost when redeemed. Returns shown do not reflect the deduction of taxes that a shareholder would pay on fund distributions or the redemption of fund shares. The adjusted returns take into account the maximum sales charge of 5.50% on Class A shares and 1.00% CDSC on Class C shares. The Fund’s total annual operating expense ratio as stated in the Fund’s current prospectus, as supplemented to date, is 1.61% for the Institutional Class shares, 1.71% for the Class P shares, 1.96% for the Class D shares, 1.96% for the Class A shares, and 2.71% for the Class C shares. Details regarding any Fund’s operating expenses can be found in the Fund’s prospectus. For performance current to the most recent month-end, visit www.pimco.com/investments.
* For periods prior to April 20, 2012, the Fund’s performance reflects the performance when the Fund was a partnership, net of actual fees and expenses charged to individual partnership accounts in the aggregate. If the performance had been restated to reflect the applicable fees and expenses of each share class, the performance may have been higher or lower. The Fund began operations as a partnership on January 1, 2003 and, on April 20, 2012, was reorganized into a newly-formed fund that was registered as an investment company under the Investment Company Act of 1940. Prior to the reorganization, the Fund had an investment objective, investment strategies, investment guidelines, and restrictions that were substantially similar to those currently applicable to the Fund; however, the Fund was not registered as an investment company under the Investment Company Act of 1940 and was not subject to its requirements or requirements imposed by the Internal Revenue Code of 1986 which, if applicable, may have adversely affected its performance. The performance of Class P, D, A and C shares for the period from April 20, 2012 to April 30, 2012 is based on the performance of the Institutional Class shares of the Fund. The performance of each class of shares will differ as a result of the different levels of fees and expenses applicable to each class of shares.
Portfolio Insights
| » | The PIMCO EqS® Long/Short Fund seeks long-term capital appreciation by investing under normal circumstances in long and short positions of equity and equity-related securities, including common and preferred stock (and securities convertible into, or that PIMCO expects to be exchanged for, common or preferred stock), utilizing a fundamental investing style that integrates bottom-up and top-down research. The Fund will normally invest a substantial portion of its assets in equity and equity-related securities. The Fund may also invest in fixed income securities of varying maturities, cash and cash equivalents. |
| » | The Fund’s Institutional Class shares returned 14.66% after fees, and the Fund’s benchmark index, the 3-Month USD LIBOR Index, returned 0.35%. |
| » | The Fund’s long equity positions contributed to absolute returns as equity markets rallied and the stocks held in the Fund outperformed the broad equity markets. |
| » | The Fund’s short equity positions detracted from performance in aggregate as the overall equity markets rose during the reporting period. |
| » | Within the Fund, the two investment themes that contributed most on the long side were investing in high yielding equities, specifically companies undergoing real estate investment trust (“REIT”) conversions, and companies that benefit from U.S. consumers seeking bargain products and services. |
| » | The Fund’s cash position, which includes currency hedging, detracted from performance. |
| ANNUAL REPORT | JUNE 30, 2013 | 17 |
Table of Contents
Insights from the Portfolio Managers PIMCO Emerging Multi-Asset Fund
Dear Shareholder,
We appreciate your investment in the PIMCO Emerging Multi-Asset Fund (the “Fund”). Below is our annual update that includes a discussion of our investment outlook with a focus on emerging markets (“EM”) as well as an update on the portfolio over the twelve-month reporting period ended June 30, 2013.
Emerging Market Asset Classes Benefit from Central Bank Provisions
Central bank actions have driven returns across EM asset classes over the reporting period. Generous central bank-provided liquidity and worldwide easing measures helped spur strong positive returns across EM during the second half of 2012. Gains have largely been erased in 2013, as EM, both equities and fixed income, had losses in May and June following comments from the Federal Reserve (“Fed”) that it may unwind its program of bond purchases earlier than expected. This talk of so-called “Fed tapering” sparked an increase in U.S. interest rates and a subsequent fall in EM local currencies.
EM equities (as represented by the MSCI Emerging Markets Index) returned 2.87% over the reporting period, trailing its developed market (“DM”) counterpart (as represented by the MSCI World Index) by over 15%. The divergence in returns has largely occurred in 2013. While earnings growth continues to be slow, a more optimistic outlook for the U.S. economy and unprecedented monetary stimulus in Japan has helped trigger a re-rating of multiples in developed equity markets. Sentiment has become more positive for developed economies and more negative for emerging markets. EM companies have been struggling to grow earnings in an environment of moderate global growth, and concerns over slowing growth in China have weighed on EM equity market returns. We have tactically moved to a neutral position to EM equities, as we believe EM equities will continue to suffer from a weaker corporate and macroeconomic outlook and may be prone to the influence of DM monetary policy in the near term. Nevertheless, we believe EM valuations look favorable versus DM and we will be monitoring conditions to deploy risk into the EM equity space.
EM external debt (as represented by the JPMorgan Emerging Markets Bond Index (EMBI) Global) returned 1.24% over the reporting period. Early in the period, the approval of a Greek aid package, a compromise over the U.S. fiscal cliff, and strong inflows into EM debt from investors seeking yield led to significant spread compression and record-low yields. The asset class turned sharply negative in May and June as U.S. Treasury yields spiked following talk of Fed tapering. Spread widening due to lower investor risk appetite, a drop in liquidity and idiosyncratic country-specific factors further impacted returns. We will look to maintain an underweight position in EM spread duration, with overweights focused on those EM countries with the most durable growth drivers and seek opportunities within the more strongly positioned countries to earn additional compensation by
substituting what we believe are high quality quasi-sovereign and corporate credits for sovereign issuers.
EM local debt markets (as represented by the JPMorgan Government Bond Index-Emerging Markets Global Diversified Index Unhedged) returned 1.32% during the period, as the high nominal and real yields, relative to those found in developed markets, drove inflows and performance during the second half of 2012. Similar to other EM asset classes, EM local markets and currencies sold-off during the second half of the reporting period with losses concentrated in May and June. Rising yields following Fed tapering talk, a stronger U.S. dollar, and heavy foreign ownership of local markets vulnerable to swings in market sentiment weighed on returns. We continue to hold a slight overweight to local duration at the overall portfolio level, which should allow our investors to benefit from any continued declines in nominal yields and also benefit from the high relative carry of this asset class.
Ripple Effects from Central Banks
The uncertainty surrounding the U.S. Federal Reserve’s and other central banks’ continued influence on markets remains a primary focus for emerging markets investors. As markets will likely continue struggling to digest the policy innovations of central banks, we expect further volatility. For some investors with levered positions predicated on continued monetary policy support, heightened volatility can create the need for risk reduction, which may have implications for assets which respond more acutely to gyrations in risk appetite, particularly EM currencies. The transition from investment- to consumption-led growth is a continuing story in EM. While we remain constructive on EM on a secular basis, we are mindful of current market conditions and the need for caution in the near term.
Moderating quantitative easing from the U.S., Europe, and Japan could mean additional pressure on countries with negative trade balances and current account deficits. Those countries may find it increasingly challenging to attract more permanent sources of financing if central bank-induced flows prove fickle or dry up altogether. Many countries have benefited from the low cost of money – sponsored by central banks – that has helped to fuel investor risk appetite, but there are now concerns that the end of that assistance is coming into focus. This makes country selection an even more important part of the investment process.
Technicals need to be monitored carefully too, as the EM investable universe continues to expand. As investors search for yield in a world where rates have been held artificially low by central banks, outsized flows into EM can skew valuations. In addition, new and sometimes lower quality issuers in both external and local debt are now able to tap markets. Heightened liquidity has compressed some of these new issues to yield levels that are out of line with their fundamentals. The various initial conditions of these new entrants highlight the need to fully comprehend sovereign creditworthiness. Ensuring that investors
| 18 | PIMCO EQUITY SERIES |
Table of Contents
are adequately compensated for the risks entailed in each investment decision is paramount.
We remain concerned that EM growth will be pressured given that EM economies are primarily engaged in investment and production activities and their pivot toward consumption-led growth, particularly in Asia, is one that takes time. The near stall-speed growth in the major developed countries has thus influenced EM growth expectations although the gap remains significant. As in prior periods, we nevertheless continue to expect stronger growth in EM countries versus developed markets.
For EM equities, there are negatives and positives. From a negative perspective, EM equities are likely to continue to suffer from a weaker corporate and macroeconomic outlook and remain prone to the influence of DM monetary policy. From a positive perspective, the market’s reaction to U.S. Fed tapering may be overdone, and we believe valuations look attractive at current levels. Short-term volatility may remain, pending stabilization of U.S. interest rates and resolution of macro concerns in countries such as China and Brazil. With a longer-term perspective, we believe this could be an attractive entry point as the market appears oversold and valuations are attractive.
Within equities, we continue to favor consumer stocks, which we believe can benefit from secular growth in middle class consumption and can deliver strong profit growth and resilient earnings. However, we recognize that this space (particularly consumer staples) has re-rated significantly in recent years and is now trading at a large premium to the index. Instead of investing in these richly valued companies, we are seeking to identify more attractive opportunities in off-index consumer names, scenarios where companies are undergoing restructuring, and developed market consumer companies with high exposure to EM. At the country level, we continue to see value in Russia, where the market is trading at a wide discount to the EM index. Although commodity businesses may face challenges, we are finding opportunity in highly cash generative businesses that have shown good capital discipline.
In the external debt space, due to both the uncertainty and volatility plaguing the markets and increased country differentiation, we continue to favor countries that are capable of better withstanding negative market shocks. Accordingly, we also intend to underweight or avoid countries with weaker fundamentals that may be subject to country-specific pressures. Amid global dislocations, we aim to ensure that we achieve ample compensation for the risks being taken. Where we believe sovereign debt is rich, EM corporates and quasi-sovereign names may provide additional yield without sacrificing quality. These bonds with their shorter duration, relative to sovereign bonds, may be more insulated from rises in U.S. Treasury yields. Nonetheless, given forecasted volatility, we are in broad risk reduction mode and may lower off-benchmark allocations.
In the local markets space, we continue to see investment opportunities in countries with high nominal yields, positive real rates, and steeper yield curves with attractive carry and roll-down characteristics, where central banks are focused on the risks to
growth. Once we look through volatility, growth challenges caused by a lack of global aggregate demand and generally tame inflation provide tailwinds for local currency debt. Given that some countries have ended their easing cycles and have turned their attention to combating inflation, it is important to continually assess what monetary policy actions are priced into the market. We will be defensive in our positioning and look to cut rate positions in any country where either fundamentals or pricing are not supportive or compelling. In the currency space, we aim to take a more cautious view towards EM currencies, which face headwinds from Japanese yen debasement, talk of Fed tapering, potential Chinese yuan weakness, and lack of non-portfolio capital flows. The intermediate term may be volatile in nature and emphasizes the need to concentrate on those countries with strong fundamentals.
In summary, we believe that the secular underpinnings in EM remain valid. Near-term volatility will likely offer attractive entry points but also require discipline to preserve capital. We expect our tail-hedging strategy to be particularly important in this regard.
Sincerely,
 |  | |
 |  | |
| Curtis Mewbourne | Maria (Masha) Gordon | |
| Portfolio Manager, Generalist | Portfolio Manager, Emerging Markets Equities | |
 |  | |
 |  | |
| Michael Gomez | Ramin Toloui | |
| Portfolio Manager, Emerging Markets Debt | Portfolio Manager, Emerging Markets Debt | |
| ANNUAL REPORT | JUNE 30, 2013 | 19 |
Table of Contents
Insights from the Portfolio Managers PIMCO Emerging Multi-Asset Fund (Cont.)
Top Holdings1
PIMCO EqS® Emerging Markets Fund | 49.8% | |||||
PIMCO Emerging Local Bond Fund | 26.4% | |||||
PIMCO Emerging Markets Bond Fund | 15.5% | |||||
PIMCO Emerging Markets Corporate Bond Fund | 3.5% |
| 1 | % of Total Investments as of 06/30/2013. Top Holdings solely reflect long positions. Securities sold short, financial derivative instruments and short-term instruments are not taken into consideration. |
| ANNUAL REPORT | JUNE 30, 2013 | 20 |
Table of Contents
PIMCO Emerging Multi-Asset Fund
| Institutional Class - PEAWX | Class A - PEAAX | |
| Class P - PEAQX | Class C - PEACX | |
| Administrative Class - PEAMX | Class R - PEARX | |
| Class D - PEAEX |
Cumulative Returns Through June 30, 2013
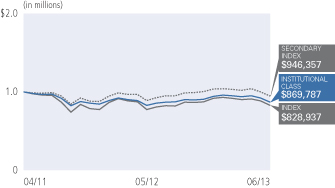
| Average Annual Total Return for the period ended June 30, 2013 | ||||||||||
1 Year | Fund Inception | |||||||||
| PIMCO Emerging Multi-Asset Fund Institutional Class | 1.60% | -5.13% | |||||||
PIMCO Emerging Multi-Asset Fund Class P | 1.53% | -5.23% | ||||||||
PIMCO Emerging Multi-Asset Fund Administrative Class | 1.35% | -5.39% | ||||||||
PIMCO Emerging Multi-Asset Fund Class D | 1.17% | -5.47% | ||||||||
PIMCO Emerging Multi-Asset Fund Class A | 1.12% | -5.51% | ||||||||
PIMCO Emerging Multi-Asset Fund Class A (adjusted) | -4.45% | -7.89% | ||||||||
PIMCO Emerging Multi-Asset Fund Class C | 0.56% | -6.13% | ||||||||
PIMCO Emerging Multi-Asset Fund Class C (adjusted) | -0.43% | -6.13% | ||||||||
PIMCO Emerging Multi-Asset Fund Class R | 0.96% | -5.70% | ||||||||
| MSCI Emerging Markets Index (Net Dividends in USD)± | 2.87% | -7.10% | |||||||
| 50% MSCI Emerging Markets Index, 25% JPMorgan Government Bond Index-Emerging Markets Global Diversified Index (Unhedged), 25% JPMorgan Emerging Markets Bond Index (EMBI) Global±± | 2.15% | -1.54% | |||||||
All Fund returns are net of fees and expenses.
± The MSCI Emerging Markets Index (Net Dividends in USD) is a free float-adjusted market capitalization index that is designed to measure equity market performance of emerging markets. The MSCI Emerging Markets Index consists of the following 21 emerging market country indices: Brazil, Chile, China, Colombia, Czech Republic, Egypt, Hungary, India, Indonesia, Korea, Malaysia, Mexico, Morocco, Peru, Philippines, Poland, Russia, South Africa, Taiwan, Thailand, and Turkey. It is not possible to invest directly in an unmanaged index.
±± The benchmark is a blend of 50% MSCI Emerging Markets Index, 25% JPMorgan Government Bond Index-Emerging Markets Global Diversified Index (Unhedged), 25% JPMorgan Emerging Markets Bond Index (EMBI) Global. The MSCI Emerging Markets Index is a free float-adjusted market capitalization index that is designed to measure equity market performance in the global emerging markets. The MSCI Emerging Markets Index consists of the following 21 emerging market country indices: Brazil, Chile, China, Colombia, Czech Republic, Egypt, Hungary, India, Indonesia, Korea, Malaysia, Mexico, Morocco, Peru, Philippines, Poland, Russia, South Africa, Taiwan, Thailand, and Turkey. JPMorgan Emerging Markets Bond Index (EMBI) Global tracks total returns for United States Dollar denominated debt instruments issued by emerging market sovereign and quasi-sovereign entities: Brady bonds, loans, Eurobonds and local market instruments. It is not possible to invest directly in an unmanaged index. JPMorgan Government Bond Index-Emerging Markets Global Diversified Index (Unhedged) is a comprehensive global local emerging markets index, and consists of regularly traded, liquid fixed-rate, domestic currency government bonds to which international investors can gain exposure.
Performance quoted represents past performance. Past performance is not a guarantee or a reliable indicator of future results. Current performance may be lower or higher than performance shown. Investment return and the principal value of an investment will fluctuate. Shares may be worth more or less than original cost when redeemed. Returns shown do not reflect the deduction of taxes that a shareholder would pay on fund distributions or the redemption of fund shares. The adjusted returns take into account the maximum sales charge of 5.50% on Class A shares and 1.00% CDSC on Class C shares. The Fund’s total annual operating expense ratio as stated in the Fund’s current prospectus, as supplemented to date, is 2.18% for the Institutional Class shares, 2.28% for the Class P shares, 2.43% for the Administrative Class shares, 2.53% for the Class D shares, 2.53% for the Class A shares, 3.28% for the Class C shares and 2.78% for the Class R shares. Details regarding any Fund’s operating expenses can be found in the Fund’s prospectus. For performance current to the most recent month-end, visit www.pimco.com/investments.
Portfolio Insights
| » | The PIMCO Emerging Multi-Asset Fund seeks maximum total return, consistent with prudent investment management, by investing under normal circumstances at least 80% of its assets in investments economically tied to emerging market countries. The Fund will typically invest 20% to 80% of its total assets in equity-related instruments (including investments in common stock, preferred stock, and equity-related Underlying PIMCO Funds or Acquired Funds). The Fund is designed to provide concurrent exposure to a broad spectrum of emerging market asset classes, such as equity, fixed income and currencies, and other investments, including commodities. |
| » | The Fund’s Institutional Class shares returned 1.60% after fees, while the Fund’s primary benchmark index (MSCI Emerging Markets Index) returned 2.87%, and the Fund’s secondary benchmark index (a blended index consisting of 50% MSCI Emerging Markets Index, 25% JPMorgan Government Bond Index-Emerging Markets Global Diversified Index (Unhedged), 25% JPMorgan Emerging Markets Bond Index (EMBI) Global) returned 2.15%. |
| » | The relative performance of the PIMCO Emerging Local Bond Fund (representative of the emerging local debt market) detracted from relative performance as this Underlying PIMCO Fund underperformed its respective primary benchmark, the JPMorgan Government Bond Index-Emerging Markets (GBI-EM) Global Diversified Index (Unhedged), over the reporting period. |
| » | An asset allocation decision to generally overweight emerging local debt throughout the reporting period detracted from relative performance as the JPMorgan Government Bond Index-Emerging Markets (GBI-EM) Global Diversified Index (Unhedged) underperformed the Fund’s secondary benchmark over the reporting period. |
| » | The relative performance of the PIMCO EqS® Emerging Markets Fund (representative of the emerging equities market) contributed to relative performance as this Underlying PIMCO Fund outperformed its respective primary benchmark, the MSCI Emerging Markets Index, over the reporting period. |
| » | An asset allocation decision to underweight external debt positively contributed to relative performance as the asset class, per the JPMorgan Emerging Markets Bond Index (EMBI) Global, underperformed the Fund’s blended secondary benchmark over the reporting period. |
| ANNUAL REPORT | JUNE 30, 2013 | 21 |
Table of Contents
Insights from the Portfolio Managers PIMCO EqS Pathfinder Fund®
Dear Shareholder,
It is our pleasure to be speaking with you as we finish the year ending June 30, 2013 and we thank you for your investment in the PIMCO EqS® Pathfinder Fund (the “Fund”). We are committed to seeking an absolute return that beats the market over a full market cycle and to do so with less volatility than the overall market. We have organized our thoughts below to provide you with a review of the equity market, the Fund itself, and our outlook for the remainder of 2013.
The Last Twelve Months in Review
The stock market rally that began in early 2012 continued unabated through the first half of 2013 with the MSCI World Index posting gains for eleven of the last twelve months through the end of May 2013, pausing only for a pullback in the month of June. Due to very valid concerns about growth in Europe, despite the monetary support and pledge by European Central Bank (“ECB”) President Mario Draghi to keep interest rates low for an “extended period of time”, European stocks did not perform nearly as well as those in either the United States or Japan; two areas of the world which are also trying to stimulate economic growth with very accommodative central bank policies. In the U.S., the S&P 500 Index posted its best first half since 1998, including the aforementioned modest decline in June due to Federal Reserve (“Fed”) Chairman Ben Bernanke’s comments about the potential for the “tapering” of quantitative easing (“QE”). In Japan, the equity rally that began last fall with the election of Prime Minister Shinzo Abe, continued with the subsequent appointment of Bank of Japan (“BOJ”) Governor Kuroda this past spring and his announcement of a very aggressive bond buying program designed to reach a target of 2% inflation for the country.
As a result of the unprecedented accommodative central bank monetary policies and the excess liquidity provided, equities and other risk assets appreciated in the first half of 2013. The increase, however, was driven by Price/Earnings (“PE”) multiple expansion, rather than an improvement in underlying fundamentals and in an equity market environment driven by yet-to-materialize growth expectations the Fund lagged the overall broad equity market index.
Pathfinder Fund
One of our best performing stocks for the past year was the Fund’s holding of GS Home Shopping. We originally purchased the stock at an extremely deep discounted value, with approximately 80% of its market capitalization in cash on the balance sheet and the stock trading at a PE of 2. GS Home Shopping, one of the leading internet and TV shopping providers in South Korea, has benefited from the development of on-line and mobile shopping in South Korea and the subsequent migration of consumers from shopping at department
stores to shopping on-line. The company also expanded its high margin apparel and fashion offerings and continued to develop its international operations. The double digit growth acted as a catalyst for a re-rating of the stock and it rose significantly over the past year.
Lloyd’s Banking Group is a large, London-based, financial services and banking company which went through a U.K. government sponsored recapitalization as a result of the financial crisis of 2008-2009. We purchased the stock at a very large discount to its book value as the company was embarking upon the long-term restructuring of its business. The U.K. banking sector has gradually repaired over the past five years, as has Lloyd’s balance sheet. The stock appreciated considerably over the past year, and we took our profits earlier this year as the stock traded up to our estimate of intrinsic value.
Carrefour is the largest food retailer in Europe and the second largest retailer in the world behind Wal-Mart. The company has been restructuring since the addition in 2012 of its new and very well respected CEO. He delivered on the first phase of his turnaround program with the sale of operations in five countries at attractive prices. This translated into significant balance sheet improvement giving Carrefour the needed financial flexibility to increase capital expenditures to revamp stores and turn around the core hypermarket division. With the lowest gross margin among its peer group, we believe there is upside for improvement. Although phase two of the turnaround is still in progress, investors have taken notice and the stock was up significantly over the past year.
We also had a few stocks in the portfolio which did not perform as we expected. The price of gold, for example, declined dramatically in the spring of this year due to concerns that Cyprus might need to liquidate its gold holdings in response to its financial crisis, and comments from Fed Chairman Bernanke on the potential for the “tapering” of the Fed’s quantitative easing program. The price of the Fund’s holding of gold miner Anglogold Ashanti dropped significantly due to the inherent operating leverage of its mining operations to the underlying commodity price. In addition, the departure of the CEO and uncertainty regarding the outcome of South African wage negotiations, continued to weigh on the company’s shares and detracted from the Fund’s returns.
KPN is the incumbent Dutch telecommunications provider which historically had an almost monopolistic position in the telecom sector in the Netherlands. In 2012, however, new competitors emerged, which put pricing and margin pressure on KPN. At the same time, KPN paid a very high price for additional spectrum at auction, and the combination of the two events placed enormous stress on the company’s balance sheet. We sold our shares at a loss in late 2012 and early 2013; however, the shares have continued to deteriorate in price.
| 22 | PIMCO EQUITY SERIES |
Table of Contents
Another detractor from returns was the Fund’s holding of Logitech International, which designs, manufactures and distributes peripheral products for personal computers, tablets and digital devices. The company’s stock price has suffered due to its exposure to the personal computer market and a generally poor execution of its business, in our view. After four years of mismanagement, Logitech hired a new CEO in early 2013, who had successfully restructured global consumer brands at Procter & Gamble and General Electric. He has since implemented a cost savings program, refocused the company around a few core products, and fostered innovation. We have confidence in the turnaround plan and we continue to hold what we believe to be a very cheap stock, with cash and Treasury shares now representing almost 50% of its market capitalization.
Looking Forward
As PIMCO’s CEO and Co-CIO Mohamed A. El-Erian described in the recent Secular Outlook, “New Normal . . . Morphing,” we do not expect to see near-term catalysts that would lead to sustainable, private sector, above-trend economic growth nor price pressures that would lead to rising inflation. We envision the global economy muddling through on a low-growth, low-inflation path for the next several years. With corporate balance sheets in developed markets generally in good health and with cash balances at all-time highs, we believe many companies are well positioned to generate growth even in what we expect to be a “muddle through” economic environment.
We continue to focus on buying quality companies, when we can find them at attractive valuations, and with what we believe is a margin of safety built into the price. Buying quality businesses provides the benefit of more consistent business performance which tends to provide less volatility in earnings and stock prices over time, in our opinion. This lower volatility often leads to better compounding of returns over the long-term.
In closing our letter, we repeat our thanks for investing with us in the Fund. We maintain our value driven discipline, seeking the twin goals of capital appreciation and downside risk mitigation. We are privileged to have the opportunity to manage your capital and we look forward to the challenges and the opportunities in the months and years ahead.
Sincerely,
 |  | |
|  | |

Charles Lahr, CFA Co-Portfolio Manager | Anne Gudefin, CFA Co-Portfolio Manager | |
Top 10 Holdings1
British American Tobacco PLC | 2.9% | |||||
Imperial Tobacco Group PLC | 2.9% | |||||
Microsoft Corp. | 2.8% | |||||
SPDR Gold Trust | 2.8% | |||||
Danone S.A. | 2.8% | |||||
Intel Corp. | 2.7% | |||||
Berkshire Hathaway, Inc. ‘B’ | 2.4% | |||||
AIA Group Ltd. | 2.4% | |||||
Lorillard, Inc. | 2.1% | |||||
Lancashire Holdings Ltd. | 2.1% |
Geographic Breakdown1
United States | 38.4% | |||||
United Kingdom | 13.2% | |||||
France | 9.4% | |||||
Netherlands | 5.0% | |||||
Bermuda | 4.7% | |||||
Switzerland | 4.4% | |||||
Hong Kong | 3.8% | |||||
Norway | 3.4% | |||||
Japan | 2.6% |
| ANNUAL REPORT | JUNE 30, 2013 | 23 |
Table of Contents
Insights from the Portfolio Managers PIMCO EqS Pathfinder Fund® (Cont.)
Geographic Breakdown1 (Cont.)
Germany | 2.3% | |||||
Denmark | 1.7% | |||||
Other | 7.4% |
Sector Breakdown1
Consumer Staples | 28.6% | |||||
Financials | 22.9% | |||||
Energy | 11.0% | |||||
Industrials | 9.0% | |||||
Information Technology | 8.5% | |||||
Health Care | 7.4% | |||||
Consumer Discretionary | 3.6% | |||||
Other | 5.7% |
| 1 | % of Total Investments as of 06/30/2013. Top Holdings, Geographic and Sector Breakdown solely reflect long positions. Securities sold short, financial derivative instruments and short-term instruments are not taken into consideration. |
| 24 | PIMCO EQUITY SERIES |
Table of Contents
| Institutional Class - PTHWX | Class A - PATHX | |
| Class P - PTHPX | Class C - PTHCX | |
| Class D - PTHDX | Class R - PTHRX |
Cumulative Returns Through June 30, 2013
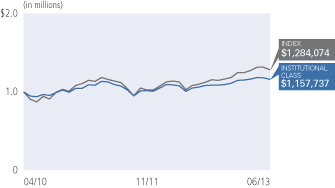
Average Annual Total Return for the period ended June 30, 2013 | ||||||||||
| 1 Year | Fund Inception (04/14/10) | |||||||||
| PIMCO EqS Pathfinder Fund® Institutional Class | 10.19% | 4.11% | |||||||
| PIMCO EqS Pathfinder Fund® Class P | 10.12% | 4.01% | ||||||||
| PIMCO EqS Pathfinder Fund® Class D | 9.89% | 3.73% | ||||||||
| PIMCO EqS Pathfinder Fund® Class A | 9.88% | 3.74% | ||||||||
| PIMCO EqS Pathfinder Fund® Class A (adjusted) | 3.84% | 1.93% | ||||||||
| PIMCO EqS Pathfinder Fund® Class C | 8.95% | 2.99% | ||||||||
| PIMCO EqS Pathfinder Fund® Class C (adjusted) | 7.95% | 2.99% | ||||||||
| PIMCO EqS Pathfinder Fund® Class R | 9.48% | 3.39% | ||||||||
| MSCI World Index± | 18.58% | 7.01% | |||||||
All Fund returns are net of fees and expenses.
± The MSCI World Index is a free float-adjusted market capitalization weighted index that is designed to measure the equity market performance of developed markets. The MSCI World Index consists of 24 developed market country indices. It is not possible to invest directly in an unmanaged index.
Performance quoted represents past performance. Past performance is not a guarantee or a reliable indicator of future results. Current performance may be lower or higher than performance shown. Investment return and the principal value of an investment will fluctuate. Shares may be worth more or less than original cost when redeemed. Returns shown do not reflect the deduction of taxes that a shareholder would pay on fund distributions or the redemption of fund shares. The adjusted returns take into account the maximum sales charge of 5.50% on Class A shares and 1.00% CDSC on Class C shares. The Fund’s total annual operating expense ratio as stated in the Fund’s current prospectus, as supplemented to date, is 1.08% for the Institutional Class shares, 1.18% for the Class P shares, 1.43% for the Class D shares, 1.43% for the Class A shares, 2.18% for the Class C shares and 1.68% for the Class R shares. Details regarding any Fund’s operating expenses can be found in the Fund’s prospectus. For performance current to the most recent month-end, visit www.pimco.com/investments.
Portfolio Insights
| » | The PIMCO EqS Pathfinder Fund® seeks capital appreciation by investing under normal circumstances in equity securities, including common and preferred stock (and securities convertible into, or that PIMCO expects to be exchanged for, common or preferred stock), of issuers that PIMCO believes are undervalued. The Fund’s bottom-up value investment style attempts to identify securities that are undervalued by the market in comparison to PIMCO’s own determination of the company’s value, taking into account criteria such as asset value, book value, cash flow and earnings estimates. |
| » | During the reporting period, the Fund’s Institutional Class shares returned 10.19% after fees, and the Fund’s benchmark index, the MSCI World Index, returned 18.58%. |
| » | An underweight to and security selection in the consumer discretionary sector was a significant detractor from returns during the reporting period, as well as the Fund’s weighting and security selection in the consumer staples and health care sectors. However, security selection in the energy sector and a lighter weighting to the materials sector benefited returns relative to the Fund’s benchmark index. |
| » | Holdings in Marine Harvest, Lloyds Banking Group, and Carrefour contributed to returns as prices on these securities appreciated during the reporting period. |
| » | Holdings in Veolia Environnement, Anglogold Ashanti, and KPN detracted from returns as prices on these securities declined during the reporting period. |
| » | Given the appreciation in the equity markets over the reporting period, the Fund’s market and tail risk hedging strategies, including its position in a gold exchange-traded fund, detracted from returns as these hedging strategies declined in value. |
| » | At the end of the reporting period, the Fund held approximately 92% in equities we believe are undervalued, 3% (on the long side only) in merger arbitrage investments, 3% in cash equivalents, and held the balance of the portfolio in currency and market risk hedges, including an approximate 3% position in gold. |
| ANNUAL REPORT | JUNE 30, 2013 | 25 |
Table of Contents
(Unaudited)
Example
As a shareholder of a Fund, you incur two types of costs: (1) transaction costs, including sales charges (loads) on purchase payments and exchange fees and (2) ongoing costs, including management fees, distribution and/or service (12b-1) fees, and other Fund expenses. The Example is intended to help you understand your ongoing costs (in dollars) of investing in a Fund and to compare these costs with the ongoing costs of investing in other mutual funds.
The Example is based on an investment of $1,000 invested at the beginning of the period and held for the entire period indicated, which for all Funds and share classes is from January 1, 2013 to June 30, 2013 unless noted otherwise in the table and footnotes below.
Actual Expenses
The information in the table under the heading “Actual Performance” provides information about actual account values and actual expenses. You may use the information in these columns, together with the amount you invested, to estimate the expenses that you paid over the period. Simply divide your account value by $1,000 (for example, an $8,600 account value divided by $1,000 = $8.60), then multiply the result by the number in the appropriate column for your share class, in the column entitled “Expenses Paid During Period” to estimate the expenses you paid on your account during this period.
Hypothetical Example for Comparison Purposes
The information in the table under the heading “Hypothetical Performance (5% return before expenses)” provides information about hypothetical account values and hypothetical expenses based on a Fund’s actual expense ratio and an assumed rate of return of 5% per year before expenses, which is not the Fund’s actual return. The hypothetical account values and expenses may not be used to estimate the actual ending account balance or expenses you paid for the period. You may use this information to compare the ongoing costs of investing in a Fund and other funds. To do so, compare this 5% hypothetical example with the 5% hypothetical examples that appear in the shareholder reports of the other funds.
Please note that the expenses shown in the table are meant to highlight your ongoing costs only and do not reflect any transactional costs, such as sales charges (loads) on purchase payments and exchange fees. Therefore, the information under the heading “Hypothetical Performance (5% return before expenses)” is useful in comparing ongoing costs only, and will not help you determine the relative total costs of owning different funds. In addition, if these transactional costs were included, your costs would have been higher.
Expense ratios may vary from period to period because of various factors such as an increase in expenses that are not covered by the management fees, such as fees and expenses of the independent trustees and their counsel, extraordinary expenses and interest expense.
| Actual Performance | Hypothetical Performance (5% return before expenses) | |||||||||||||||||||||||||||||||||
| Beginning Account Value (01/01/13) | Ending Account Value (06/30/13) | Expenses Paid During Period* | Beginning Account Value (01/01/13) | Ending Account Value (06/30/13) | Expenses Paid During Period* | Net Annualized Expense Ratio** | ||||||||||||||||||||||||||||
PIMCO Dividend and Income Builder Fund | ||||||||||||||||||||||||||||||||||
| Institutional Class | $ | 1,000.00 | $ | 1,057.80 | $ | 4.23 | $ | 1,000.00 | $ | 1,020.68 | $ | 4.16 | 0.83 | % | ||||||||||||||||||||
| Class P | 1,000.00 | 1,058.20 | 4.75 | 1,000.00 | 1,020.18 | 4.66 | 0.93 | |||||||||||||||||||||||||||
| Class D | 1,000.00 | 1,057.00 | 6.02 | 1,000.00 | 1,018.94 | 5.91 | 1.18 | |||||||||||||||||||||||||||
| Class A | 1,000.00 | 1,057.00 | 6.02 | 1,000.00 | 1,018.94 | 5.91 | 1.18 | |||||||||||||||||||||||||||
| Class C | 1,000.00 | 1,052.70 | 9.82 | 1,000.00 | 1,015.22 | 9.64 | 1.93 | |||||||||||||||||||||||||||
| Class R | 1,000.00 | 1,055.90 | 7.29 | 1,000.00 | 1,017.70 | 7.15 | 1.43 | |||||||||||||||||||||||||||
PIMCO EqS® Dividend Fund | ||||||||||||||||||||||||||||||||||
| Institutional Class | $ | 1,000.00 | $ | 1,082.10 | $ | 4.28 | $ | 1,000.00 | $ | 1,020.68 | $ | 4.16 | 0.83 | % | ||||||||||||||||||||
| Class P | 1,000.00 | 1,081.50 | 4.80 | 1,000.00 | 1,020.18 | 4.66 | 0.93 | |||||||||||||||||||||||||||
| Class D | 1,000.00 | 1,079.40 | 6.08 | 1,000.00 | 1,018.94 | 5.91 | 1.18 | |||||||||||||||||||||||||||
| Class A | 1,000.00 | 1,080.30 | 6.09 | 1,000.00 | 1,018.94 | 5.91 | 1.18 | |||||||||||||||||||||||||||
| Class C | 1,000.00 | 1,076.00 | 9.93 | 1,000.00 | 1,015.22 | 9.64 | 1.93 | |||||||||||||||||||||||||||
| Class R | 1,000.00 | 1,079.20 | 7.37 | 1,000.00 | 1,017.70 | 7.15 | 1.43 | |||||||||||||||||||||||||||
| 26 | PIMCO EQUITY SERIES |
Table of Contents
| Actual Performance | Hypothetical Performance (5% return before expenses) | |||||||||||||||||||||||||||||||||
| Beginning Account Value (01/01/13) | Ending Account Value (06/30/13) | Expenses Paid During Period* | Beginning Account Value (01/01/13) | Ending Account Value (06/30/13) | Expenses Paid During Period* | Net Annualized Expense Ratio** | ||||||||||||||||||||||||||||
PIMCO EqS® Emerging Markets Fund | ||||||||||||||||||||||||||||||||||
| Institutional Class | $ | 1,000.00 | $ | 931.20 | $ | 6.03 | $ | 1,000.00 | $ | 1,018.55 | $ | 6.31 | 1.26 | % | ||||||||||||||||||||
| Class P | 1,000.00 | 930.00 | 6.51 | 1,000.00 | 1,018.05 | 6.81 | 1.36 | |||||||||||||||||||||||||||
| Administrative Class | 1,000.00 | 929.90 | 7.23 | 1,000.00 | 1,017.31 | 7.55 | 1.51 | |||||||||||||||||||||||||||
| Class D | 1,000.00 | 929.70 | 7.70 | 1,000.00 | 1,016.81 | 8.05 | 1.61 | |||||||||||||||||||||||||||
| Class A | 1,000.00 | 928.70 | 7.70 | 1,000.00 | 1,016.81 | 8.05 | 1.61 | |||||||||||||||||||||||||||
| Class C | 1,000.00 | 925.80 | 11.27 | 1,000.00 | 1,013.09 | 11.78 | 2.36 | |||||||||||||||||||||||||||
| Class R | 1,000.00 | 928.60 | 8.89 | 1,000.00 | 1,015.57 | 9.30 | 1.86 | |||||||||||||||||||||||||||
PIMCO EqS® Long/Short Fund | ||||||||||||||||||||||||||||||||||
| Institutional Class | $ | 1,000.00 | $ | 1,182.30 | $ | 17.31 | $ | 1,000.00 | $ | 1,008.93 | $ | 15.94 | 3.20 | % | ||||||||||||||||||||
| Class P | 1,000.00 | 1,182.50 | 23.38 | 1,000.00 | 1,003.37 | 21.46 | 4.32 | |||||||||||||||||||||||||||
| Class D | 1,000.00 | 1,180.40 | 23.68 | 1,000.00 | 1,003.07 | 21.75 | 4.38 | |||||||||||||||||||||||||||
| Class A | 1,000.00 | 1,180.60 | 22.76 | 1,000.00 | 1,003.92 | 20.92 | 4.21 | |||||||||||||||||||||||||||
| Class C | 1,000.00 | 1,176.80 | 24.13 | 1,000.00 | 1,002.63 | 22.20 | 4.47 | |||||||||||||||||||||||||||
PIMCO Emerging Multi-Asset Fund | ||||||||||||||||||||||||||||||||||
| Institutional Class | $ | 1,000.00 | $ | 923.70 | $ | 1.48 | $ | 1,000.00 | $ | 1,023.26 | $ | 1.56 | 0.31 | % | ||||||||||||||||||||
| Class P | 1,000.00 | 923.60 | 1.96 | 1,000.00 | 1,022.76 | 2.06 | 0.41 | |||||||||||||||||||||||||||
| Administrative Class | 1,000.00 | 922.30 | 2.67 | 1,000.00 | 1,022.02 | 2.81 | 0.56 | |||||||||||||||||||||||||||
| Class D | 1,000.00 | 921.50 | 3.14 | 1,000.00 | 1,021.52 | 3.31 | 0.66 | |||||||||||||||||||||||||||
| Class A | 1,000.00 | 921.30 | 3.14 | 1,000.00 | 1,021.52 | 3.31 | 0.66 | |||||||||||||||||||||||||||
| Class C | 1,000.00 | 918.60 | 6.71 | 1,000.00 | 1,017.80 | 7.05 | 1.41 | |||||||||||||||||||||||||||
| Class R | 1,000.00 | 921.00 | 4.33 | 1,000.00 | 1,020.28 | 4.56 | 0.91 | |||||||||||||||||||||||||||
PIMCO EqS Pathfinder Fund® | ||||||||||||||||||||||||||||||||||
| Institutional Class | $ | 1,000.00 | $ | 1,043.40 | $ | 4.56 | $ | 1,000.00 | $ | 1,020.33 | $ | 4.51 | 0.90 | % | ||||||||||||||||||||
| Class P | 1,000.00 | 1,043.50 | 5.07 | 1,000.00 | 1,019.84 | 5.01 | 1.00 | |||||||||||||||||||||||||||
| Class D | 1,000.00 | 1,042.70 | 6.33 | 1,000.00 | 1,018.60 | 6.26 | 1.25 | |||||||||||||||||||||||||||
| Class A | 1,000.00 | 1,042.60 | 6.33 | 1,000.00 | 1,018.60 | 6.26 | 1.25 | |||||||||||||||||||||||||||
| Class C | 1,000.00 | 1,038.20 | 10.11 | 1,000.00 | 1,014.88 | 9.99 | 2.00 | |||||||||||||||||||||||||||
| Class R | 1,000.00 | 1,040.00 | 7.59 | 1,000.00 | 1,017.36 | 7.50 | 1.50 | |||||||||||||||||||||||||||
* Expenses Paid During Period are equal to the net annualized expense ratio for the class, multiplied by the average account value over the period, multiplied by 181/365 (to reflect the one-half year period).
** The Net Annualized Expense Ratio is reflective of any applicable waivers related to contractual agreements for contractual fee waivers or voluntary fee waivers. Details regarding fee waivers can be found in note 9 in the Notes to Financial Statements.
| ANNUAL REPORT | JUNE 30, 2013 | 27 |
Table of Contents
| Selected Per Share Data for the Year or Period Ended: | Net Asset Value | Net Investment Income (Loss) (a) | Net Realized/ Unrealized Gain (Loss) | Total Income (Loss) from Investment Operations | Dividends from Net Investment Income | Distributions from Net Realized Capital Gains | Total Distributions | |||||||||||||||||||||
PIMCO Dividend and Income Builder Fund | ||||||||||||||||||||||||||||
| Institutional Class | ||||||||||||||||||||||||||||
06/30/2013 | $ | 10.47 | $ | 0.54 | $ | 1.03 | $ | 1.57 | $ | (0.42 | ) | $ | (0.02 | ) | $ | (0.44 | ) | |||||||||||
12/14/2011 - 06/30/2012 | 10.00 | 0.25 | 0.47 | 0.72 | (0.25 | ) | 0.00 | (0.25 | ) | |||||||||||||||||||
| Class P | ||||||||||||||||||||||||||||
06/30/2013 | 10.48 | 0.54 | 1.03 | 1.57 | (0.41 | ) | (0.02 | ) | (0.43 | ) | ||||||||||||||||||
12/14/2011 - 06/30/2012 | 10.00 | 0.30 | 0.42 | 0.72 | (0.24 | ) | 0.00 | (0.24 | ) | |||||||||||||||||||
| Class D | ||||||||||||||||||||||||||||
06/30/2013 | 10.47 | 0.46 | 1.09 | 1.55 | (0.39 | ) | (0.02 | ) | (0.41 | ) | ||||||||||||||||||
12/14/2011 - 06/30/2012 | 10.00 | 0.26 | 0.44 | 0.70 | (0.23 | ) | 0.00 | (0.23 | ) | |||||||||||||||||||
| Class A | ||||||||||||||||||||||||||||
06/30/2013 | 10.47 | 0.48 | 1.07 | 1.55 | (0.39 | ) | (0.02 | ) | (0.41 | ) | ||||||||||||||||||
12/14/2011 - 06/30/2012 | 10.00 | 0.26 | 0.44 | 0.70 | (0.23 | ) | 0.00 | (0.23 | ) | |||||||||||||||||||
| Class C | ||||||||||||||||||||||||||||
06/30/2013 | 10.46 | 0.40 | 1.06 | 1.46 | (0.31 | ) | (0.02 | ) | (0.33 | ) | ||||||||||||||||||
12/14/2011 - 06/30/2012 | 10.00 | 0.24 | 0.41 | 0.65 | (0.19 | ) | 0.00 | (0.19 | ) | |||||||||||||||||||
| Class R | ||||||||||||||||||||||||||||
06/30/2013 | 10.47 | 0.36 | 1.16 | 1.52 | (0.36 | ) | (0.02 | ) | (0.38 | ) | ||||||||||||||||||
12/14/2011 - 06/30/2012 | 10.00 | 0.25 | 0.43 | 0.68 | (0.21 | ) | 0.00 | (0.21 | ) | |||||||||||||||||||
PIMCO EqS® Dividend Fund | ||||||||||||||||||||||||||||
| Institutional Class | ||||||||||||||||||||||||||||
06/30/2013 | $ | 10.47 | $ | 0.43 | $ | 1.37 | $ | 1.80 | $ | (0.37 | ) | $ | (0.03 | ) | $ | (0.40 | ) | |||||||||||
12/14/2011 - 06/30/2012 | 10.00 | 0.28 | 0.42 | 0.70 | (0.23 | ) | 0.00 | (0.23 | ) | |||||||||||||||||||
| Class P | ||||||||||||||||||||||||||||
06/30/2013 | 10.48 | 0.47 | 1.32 | 1.79 | (0.36 | ) | (0.03 | ) | (0.39 | ) | ||||||||||||||||||
12/14/2011 - 06/30/2012 | 10.00 | 0.29 | 0.41 | 0.70 | (0.22 | ) | 0.00 | (0.22 | ) | |||||||||||||||||||
| Class D | ||||||||||||||||||||||||||||
06/30/2013 | 10.48 | 0.40 | 1.36 | 1.76 | (0.34 | ) | (0.03 | ) | (0.37 | ) | ||||||||||||||||||
12/14/2011 - 06/30/2012 | 10.00 | 0.30 | 0.39 | 0.69 | (0.21 | ) | 0.00 | (0.21 | ) | |||||||||||||||||||
| Class A | ||||||||||||||||||||||||||||
06/30/2013 | 10.48 | 0.42 | 1.35 | 1.77 | (0.34 | ) | (0.03 | ) | (0.37 | ) | ||||||||||||||||||
12/14/2011 - 06/30/2012 | 10.00 | 0.27 | 0.42 | 0.69 | (0.21 | ) | 0.00 | (0.21 | ) | |||||||||||||||||||
| Class C | ||||||||||||||||||||||||||||
06/30/2013 | 10.45 | 0.36 | 1.32 | 1.68 | (0.26 | ) | (0.03 | ) | (0.29 | ) | ||||||||||||||||||
12/14/2011 - 06/30/2012 | 10.00 | 0.23 | 0.39 | 0.62 | (0.17 | ) | 0.00 | (0.17 | ) | |||||||||||||||||||
| Class R | ||||||||||||||||||||||||||||
06/30/2013 | 10.47 | 0.36 | 1.38 | 1.74 | (0.31 | ) | (0.03 | ) | (0.34 | ) | ||||||||||||||||||
12/14/2011 - 06/30/2012 | 10.00 | 0.18 | 0.48 | 0.66 | (0.19 | ) | 0.00 | (0.19 | ) | |||||||||||||||||||
PIMCO EqS® Emerging Markets Fund | ||||||||||||||||||||||||||||
| Institutional Class | ||||||||||||||||||||||||||||
06/30/2013 | $ | 7.97 | $ | 0.13 | $ | 0.25 | $ | 0.38 | $ | (0.09 | ) | $ | 0.00 | $ | (0.09 | ) | ||||||||||||
06/30/2012 | 10.19 | 0.08 | (2.27 | ) | (2.19 | ) | (0.02 | ) | (0.01 | ) | (0.03 | ) | ||||||||||||||||
03/22/2011 - 06/30/2011 | 10.00 | 0.05 | 0.14 | 0.19 | 0.00 | 0.00 | 0.00 | |||||||||||||||||||||
| Class P | ||||||||||||||||||||||||||||
06/30/2013 | 7.97 | 0.33 | 0.03 | 0.36 | (0.09 | ) | 0.00 | (0.09 | ) | |||||||||||||||||||
06/30/2012 | 10.19 | 0.06 | (2.25 | ) | (2.19 | ) | (0.02 | ) | (0.01 | ) | (0.03 | ) | ||||||||||||||||
03/22/2011 - 06/30/2011 | 10.00 | 0.04 | 0.15 | 0.19 | 0.00 | 0.00 | 0.00 | |||||||||||||||||||||
| Administrative Class | ||||||||||||||||||||||||||||
06/30/2013 | 7.96 | 0.11 | 0.24 | 0.35 | (0.08 | ) | 0.00 | (0.08 | ) | |||||||||||||||||||
06/30/2012 | 10.18 | 0.06 | (2.27 | ) | (2.21 | ) | 0.00 | ^ | (0.01 | ) | (0.01 | ) | ||||||||||||||||
04/19/2011 - 06/30/2011 | 10.51 | 0.04 | (0.37 | ) | (0.33 | ) | 0.00 | 0.00 | 0.00 | |||||||||||||||||||
| Class D | ||||||||||||||||||||||||||||
06/30/2013 | 7.93 | 0.09 | 0.26 | 0.35 | (0.08 | ) | 0.00 | (0.08 | ) | |||||||||||||||||||
06/30/2012 | 10.18 | 0.00 | ^ | (2.22 | ) | (2.22 | ) | (0.02 | ) | (0.01 | ) | (0.03 | ) | |||||||||||||||
03/22/2011 - 06/30/2011 | 10.00 | 0.06 | 0.12 | 0.18 | 0.00 | 0.00 | 0.00 | |||||||||||||||||||||
Please see footnotes on page 32.
| 28 | PIMCO EQUITY SERIES | See Accompanying Notes |
Table of Contents
| Net Asset Value End of Year or Period | Total Return | Net Assets End of Year or Period (000s) | Ratio of Expenses to Average Net Assets | Ratio of Expenses to Average Net Assets Excluding Waivers | Ratio of Expenses to Average Net Assets Excluding Interest Expense and Dividends on Securities Sold Short | Ratio of Expenses to Average Net Assets Excluding Interest Expense and Dividends on Securities Sold Short and Waivers | Ratio of Net Investment Income (Loss) to Average Net Assets | Portfolio Turnover Rate** | ||||||||||||||||||||||||||
| $ | 11.60 | 15.17 | % | $ | 69,203 | 0.83 | % | 1.00 | % | 0.83 | % | 1.00 | % | 4.66 | % | 75 | % | |||||||||||||||||
| 10.47 | 7.17 | 11,170 | 0.83 | * | 1.57 | * | 0.83 | * | 1.57 | * | 4.35 | * | 28 | |||||||||||||||||||||
| 11.62 | 15.15 | 85,724 | 0.93 | 1.10 | 0.93 | 1.10 | 4.62 | 75 | ||||||||||||||||||||||||||
| 10.48 | 7.21 | 8,207 | 0.93 | * | 2.47 | * | 0.93 | * | 2.47 | * | 5.28 | * | 28 | |||||||||||||||||||||
| 11.61 | 14.91 | 23,204 | 1.18 | 1.35 | 1.18 | 1.35 | 4.00 | 75 | ||||||||||||||||||||||||||
| 10.47 | 6.98 | 2,306 | 1.18 | * | 2.26 | * | 1.18 | * | 2.26 | * | 4.52 | * | 28 | |||||||||||||||||||||
| 11.61 | 14.91 | 117,579 | 1.18 | 1.35 | 1.18 | 1.35 | 4.18 | 75 | ||||||||||||||||||||||||||
| 10.47 | 6.98 | 13,314 | 1.18 | * | 2.43 | * | 1.18 | * | 2.43 | * | 4.62 | * | 28 | |||||||||||||||||||||
| 11.59 | 14.08 | 86,879 | 1.93 | 2.10 | 1.93 | 2.10 | 3.42 | 75 | ||||||||||||||||||||||||||
| 10.46 | 6.46 | 8,000 | 1.93 | * | 3.46 | * | 1.93 | * | 3.46 | * | 4.27 | * | 28 | |||||||||||||||||||||
| 11.61 | 14.66 | 217 | 1.43 | 1.60 | 1.43 | 1.60 | 3.24 | 75 | ||||||||||||||||||||||||||
| 10.47 | 6.84 | 415 | 1.43 | * | 2.32 | * | 1.43 | * | 2.32 | * | 4.30 | * | 28 | |||||||||||||||||||||
| $ | 11.87 | 17.32 | % | $ | 579,198 | 0.83 | % | 1.00 | % | 0.83 | % | 1.00 | % | 3.74 | % | 108 | % | |||||||||||||||||
| 10.47 | 6.95 | 315,513 | 0.83 | * | 1.20 | * | 0.83 | * | 1.20 | * | 4.98 | * | 21 | |||||||||||||||||||||
| 11.88 | 17.21 | 1,435 | 0.93 | 1.10 | 0.93 | 1.10 | 3.98 | 108 | ||||||||||||||||||||||||||
| 10.48 | 7.00 | 71 | 0.93 | * | 1.33 | * | 0.93 | * | 1.33 | * | 5.11 | * | 21 | |||||||||||||||||||||
| 11.87 | 16.85 | 7,801 | 1.18 | 1.35 | 1.18 | 1.35 | 3.41 | 108 | ||||||||||||||||||||||||||
| 10.48 | 6.86 | 1,251 | 1.18 | * | 1.67 | * | 1.18 | * | 1.67 | * | 5.25 | * | 21 | |||||||||||||||||||||
| 11.88 | 16.95 | 27,729 | 1.18 | 1.35 | 1.18 | 1.35 | 3.63 | 108 | ||||||||||||||||||||||||||
| 10.48 | 6.86 | 2,529 | 1.18 | * | 1.51 | * | 1.18 | * | 1.51 | * | 4.74 | * | 21 | |||||||||||||||||||||
| 11.84 | 16.14 | 14,150 | 1.93 | 2.10 | 1.93 | 2.10 | 3.05 | 108 | ||||||||||||||||||||||||||
| 10.45 | 6.19 | 1,275 | 1.93 | * | 2.26 | * | 1.93 | * | 2.26 | * | 4.11 | * | 21 | |||||||||||||||||||||
| 11.87 | 16.71 | 100 | 1.43 | 1.60 | 1.43 | 1.60 | 3.05 | 108 | ||||||||||||||||||||||||||
| 10.47 | 6.63 | 11 | 1.43 | * | 1.67 | * | 1.43 | * | 1.67 | * | 3.24 | * | 21 | |||||||||||||||||||||
| $ | 8.26 | 4.68 | % | $ | 496,172 | 1.26 | % | 1.46 | % | 1.26 | % | 1.46 | % | 1.46 | % | 85 | % | |||||||||||||||||
| 7.97 | (21.51 | ) | 514,884 | 1.25 | 1.46 | 1.25 | 1.45 | 0.94 | 92 | |||||||||||||||||||||||||
| 10.19 | 1.90 | 353,099 | 1.25 | * | 1.62 | * | 1.25 | * | 1.62 | * | 1.77 | * | 41 | |||||||||||||||||||||
| 8.24 | 4.46 | 7,615 | 1.36 | 1.56 | 1.36 | 1.56 | 3.81 | 85 | ||||||||||||||||||||||||||
| 7.97 | (21.52 | ) | 63 | 1.35 | 1.56 | 1.35 | 1.55 | 0.68 | 92 | |||||||||||||||||||||||||
| 10.19 | 1.90 | 37 | 1.35 | * | 1.94 | * | 1.35 | * | 1.94 | * | 1.42 | * | 41 | |||||||||||||||||||||
| 8.23 | 4.36 | 42 | 1.51 | 1.71 | 1.51 | 1.71 | 1.32 | 85 | ||||||||||||||||||||||||||
| 7.96 | (21.72 | ) | 34 | 1.50 | 1.72 | 1.50 | 1.72 | 0.74 | 92 | |||||||||||||||||||||||||
| 10.18 | (3.14 | ) | 10 | 1.50 | * | 1.90 | * | 1.50 | * | 1.90 | * | 1.72 | * | 41 | ||||||||||||||||||||
| 8.20 | 4.31 | 1,097 | 1.61 | 1.81 | 1.61 | 1.81 | 0.99 | 85 | ||||||||||||||||||||||||||
| 7.93 | (21.83 | ) | 989 | 1.60 | 1.82 | 1.60 | 1.81 | (0.02 | ) | 92 | ||||||||||||||||||||||||
| 10.18 | 1.80 | 1,080 | 1.60 | * | 2.11 | * | 1.60 | * | 2.11 | * | 1.98 | * | 41 | |||||||||||||||||||||
Please see footnotes on page 32.
| ANNUAL REPORT | JUNE 30, 2013 | 29 |
Table of Contents
Financial Highlights (Cont.)
| Selected Per Share Data for the Year or Period Ended: | Net Asset Value | Net Investment Income (Loss) (a) | Net Realized/ Unrealized Gain (Loss) | Total Income (Loss) from Investment Operations | Dividends from Net Investment Income | Distributions from Net Realized Capital Gains | Total Distributions | |||||||||||||||||||||
PIMCO EqS® Emerging Markets Fund (Cont.) | ||||||||||||||||||||||||||||
| Class A | ||||||||||||||||||||||||||||
06/30/2013 | $ | 7.94 | $ | 0.13 | $ | 0.21 | $ | 0.34 | $ | (0.08 | ) | $ | 0.00 | $ | (0.08 | ) | ||||||||||||
06/30/2012 | 10.18 | 0.08 | (2.31 | ) | (2.23 | ) | 0.00 | ^ | (0.01 | ) | (0.01 | ) | ||||||||||||||||
03/22/2011 - 06/30/2011 | 10.00 | 0.05 | 0.13 | 0.18 | 0.00 | 0.00 | 0.00 | |||||||||||||||||||||
| Class C | ||||||||||||||||||||||||||||
06/30/2013 | 7.88 | 0.07 | 0.21 | 0.28 | (0.05 | ) | 0.00 | (0.05 | ) | |||||||||||||||||||
06/30/2012 | 10.17 | 0.01 | (2.29 | ) | (2.28 | ) | 0.00 | ^ | (0.01 | ) | (0.01 | ) | ||||||||||||||||
03/22/2011 - 06/30/2011 | 10.00 | 0.03 | 0.14 | 0.17 | 0.00 | 0.00 | 0.00 | |||||||||||||||||||||
| Class R | ||||||||||||||||||||||||||||
06/30/2013 | 7.93 | 0.08 | 0.24 | 0.32 | (0.06 | ) | 0.00 | (0.06 | ) | |||||||||||||||||||
06/30/2012 | 10.18 | 0.01 | (2.25 | ) | (2.24 | ) | 0.00 | ^ | (0.01 | ) | (0.01 | ) | ||||||||||||||||
03/22/2011 - 06/30/2011 | 10.00 | 0.06 | 0.12 | 0.18 | 0.00 | 0.00 | 0.00 | |||||||||||||||||||||
PIMCO EqS® Long/Short Fund | ||||||||||||||||||||||||||||
| Institutional Class | ||||||||||||||||||||||||||||
06/30/2013 | $ | 9.71 | $ | 0.15 | $ | 1.27 | $ | 1.42 | $ | (0.04 | ) | $ | 0.00 | $ | (0.04 | ) | ||||||||||||
04/20/2012 - 06/30/2012 | 10.00 | (0.02 | ) | (0.27 | ) | (0.29 | ) | 0.00 | 0.00 | 0.00 | ||||||||||||||||||
| Class P | ||||||||||||||||||||||||||||
06/30/2013 | 9.70 | (0.05 | ) | 1.47 | 1.42 | (0.04 | ) | 0.00 | (0.04 | ) | ||||||||||||||||||
04/30/2012 - 06/30/2012 | 10.00 | (0.02 | ) | (0.28 | ) | (0.30 | ) | 0.00 | 0.00 | 0.00 | ||||||||||||||||||
| Class D | ||||||||||||||||||||||||||||
06/30/2013 | 9.70 | (0.10 | ) | 1.48 | 1.38 | (0.02 | ) | 0.00 | (0.02 | ) | ||||||||||||||||||
04/30/2012 - 06/30/2012 | 10.00 | (0.03 | ) | (0.27 | ) | (0.30 | ) | 0.00 | 0.00 | 0.00 | ||||||||||||||||||
| Class A | ||||||||||||||||||||||||||||
06/30/2013 | 9.70 | 0.00 | 1.38 | 1.38 | (0.03 | ) | 0.00 | (0.03 | ) | |||||||||||||||||||
04/30/2012 - 06/30/2012 | 10.00 | (0.03 | ) | (0.27 | ) | (0.30 | ) | 0.00 | 0.00 | 0.00 | ||||||||||||||||||
| Class C | ||||||||||||||||||||||||||||
06/30/2013 | 9.69 | 0.01 | 1.29 | 1.30 | (0.01 | ) | 0.00 | (0.01 | ) | |||||||||||||||||||
04/30/2012 - 06/30/2012 | 10.00 | (0.04 | ) | (0.27 | ) | (0.31 | ) | 0.00 | 0.00 | 0.00 | ||||||||||||||||||
PIMCO Emerging Multi-Asset Fund | ||||||||||||||||||||||||||||
| Institutional Class | ||||||||||||||||||||||||||||
06/30/2013 | $ | 8.71 | $ | 0.24 | $ | (0.08 | ) | $ | 0.16 | $ | (0.27 | ) | $ | 0.00 | $ | (0.27 | ) | |||||||||||
06/30/2012 | 9.89 | 0.14 | (1.27 | ) | (1.13 | ) | (0.05 | ) | 0.00 | (0.05 | ) | |||||||||||||||||
04/12/2011 - 06/30/2011 | 10.00 | 0.02 | (0.13 | ) | (0.11 | ) | 0.00 | 0.00 | 0.00 | |||||||||||||||||||
| Class P | ||||||||||||||||||||||||||||
06/30/2013 | 8.69 | 0.24 | (0.09 | ) | 0.15 | (0.26 | ) | 0.00 | (0.26 | ) | ||||||||||||||||||
06/30/2012 | 9.90 | 0.15 | (1.31 | ) | (1.16 | ) | (0.05 | ) | 0.00 | (0.05 | ) | |||||||||||||||||
04/12/2011 - 06/30/2011 | 10.00 | 0.02 | (0.12 | ) | (0.10 | ) | 0.00 | 0.00 | 0.00 | |||||||||||||||||||
| Administrative Class | ||||||||||||||||||||||||||||
06/30/2013 | 8.69 | 0.15 | (0.01 | ) | 0.14 | (0.28 | ) | 0.00 | (0.28 | ) | ||||||||||||||||||
06/30/2012 | 9.89 | 0.12 | (1.28 | ) | (1.16 | ) | (0.04 | ) | 0.00 | (0.04 | ) | |||||||||||||||||
04/19/2011 - 06/30/2011 | 10.02 | 0.02 | (0.15 | ) | (0.13 | ) | 0.00 | 0.00 | 0.00 | |||||||||||||||||||
| Class D | ||||||||||||||||||||||||||||
06/30/2013 | 8.70 | 0.20 | (0.08 | ) | 0.12 | (0.25 | ) | 0.00 | (0.25 | ) | ||||||||||||||||||
06/30/2012 | 9.89 | 0.11 | (1.27 | ) | (1.16 | ) | (0.03 | ) | 0.00 | (0.03 | ) | |||||||||||||||||
04/12/2011 - 06/30/2011 | 10.00 | 0.02 | (0.13 | ) | (0.11 | ) | 0.00 | 0.00 | 0.00 | |||||||||||||||||||
| Class A | ||||||||||||||||||||||||||||
06/30/2013 | 8.68 | 0.23 | (0.12 | ) | 0.11 | (0.25 | ) | 0.00 | (0.25 | ) | ||||||||||||||||||
06/30/2012 | 9.88 | 0.12 | (1.28 | ) | (1.16 | ) | (0.04 | ) | 0.00 | (0.04 | ) | |||||||||||||||||
04/12/2011 - 06/30/2011 | 10.00 | 0.02 | (0.14 | ) | (0.12 | ) | 0.00 | 0.00 | 0.00 | |||||||||||||||||||
| Class C | ||||||||||||||||||||||||||||
06/30/2013 | 8.62 | 0.15 | (0.09 | ) | 0.06 | (0.22 | ) | 0.00 | (0.22 | ) | ||||||||||||||||||
06/30/2012 | 9.88 | 0.05 | (1.29 | ) | (1.24 | ) | (0.02 | ) | 0.00 | (0.02 | ) | |||||||||||||||||
04/12/2011 - 06/30/2011 | 10.00 | 0.00 | ^ | (0.12 | ) | (0.12 | ) | 0.00 | 0.00 | 0.00 | ||||||||||||||||||
Please see footnotes on page 32.
| 30 | PIMCO EQUITY SERIES | See Accompanying Notes |
Table of Contents
| Net Asset Value End of Year or Period | Total Return | Net Assets End of Year or Period (000s) | Ratio of Expenses to Average Net Assets | Ratio of Expenses to Average Net Assets Excluding Waivers | Ratio of Expenses to Average Net Assets Excluding Interest Expense and Dividends on Securities Sold Short | Ratio of Expenses to Average Net Assets Excluding Interest Expense and Dividends on Securities Sold Short and Waivers | Ratio of Net Investment Income (Loss) to Average Net Assets | Portfolio Turnover Rate** | ||||||||||||||||||||||||||
| $ | 8.20 | 4.23 | % | $ | 4,324 | 1.61 | % | 1.81 | % | 1.61 | % | 1.81 | % | 1.51 | % | 85 | % | |||||||||||||||||
| 7.94 | (21.89 | ) | 2,469 | 1.60 | 1.81 | 1.60 | 1.80 | 0.90 | 92 | |||||||||||||||||||||||||
| 10.18 | 1.80 | 764 | 1.60 | * | 2.02 | * | 1.60 | * | 2.02 | * | 1.89 | * | 41 | |||||||||||||||||||||
| 8.11 | 3.54 | 1,371 | 2.36 | 2.56 | 2.36 | 2.56 | 0.83 | 85 | ||||||||||||||||||||||||||
| 7.88 | (22.43 | ) | 675 | 2.35 | 2.57 | 2.35 | 2.56 | 0.12 | 92 | |||||||||||||||||||||||||
| 10.17 | 1.70 | 98 | 2.35 | * | 2.80 | * | 2.35 | * | 2.80 | * | 0.98 | * | 41 | |||||||||||||||||||||
| 8.19 | 4.04 | 25 | 1.86 | 2.06 | 1.86 | 2.06 | 0.92 | 85 | ||||||||||||||||||||||||||
| 7.93 | (22.01 | ) | 24 | 1.85 | 2.07 | 1.85 | 2.06 | 0.06 | 92 | |||||||||||||||||||||||||
| 10.18 | 1.80 | 39 | 1.85 | * | 2.34 | * | 1.85 | * | 2.34 | * | 1.97 | * | 41 | |||||||||||||||||||||
| $ | 11.09 | 14.66 | % | $ | 329,610 | 2.65 | % | 2.75 | % | 1.40 | % | 1.50 | % | 1.45 | % | 528 | % | |||||||||||||||||
| 9.71 | (2.90 | ) | 212,229 | 1.52 | * | 2.41 | * | 1.40 | * | 2.29 | * | (1.30 | )* | 113 | ||||||||||||||||||||
| 11.08 | 14.77 | 15,664 | 3.94 | 4.04 | 1.50 | 1.60 | (0.48 | ) | 528 | |||||||||||||||||||||||||
| 9.70 | (3.00 | ) | 10 | 1.62 | * | 2.40 | * | 1.50 | * | 2.28 | * | (1.34 | )* | 113 | ||||||||||||||||||||
| 11.06 | 14.31 | 12,421 | 3.95 | 4.05 | 1.75 | 1.85 | (0.97 | ) | 528 | |||||||||||||||||||||||||
| 9.70 | (3.00 | ) | 111 | 1.87 | * | 3.97 | * | 1.77 | * | 3.87 | * | (1.72 | )* | 113 | ||||||||||||||||||||
| 11.05 | 14.27 | 24,759 | 3.62 | 3.72 | 1.75 | 1.85 | (0.03 | ) | 528 | |||||||||||||||||||||||||
| 9.70 | (3.00 | ) | 1,219 | 1.87 | * | 3.17 | * | 1.74 | * | 3.04 | * | (1.70 | )* | 113 | ||||||||||||||||||||
| 10.98 | 13.41 | 9,530 | 4.04 | 4.14 | 2.50 | 2.60 | 0.13 | 528 | ||||||||||||||||||||||||||
| 9.69 | (3.10 | ) | 53 | 2.62 | * | 4.50 | * | 2.52 | * | 4.40 | * | (2.46 | )* | 113 | ||||||||||||||||||||
| $ | 8.60 | 1.60 | % | $ | 36,051 | 0.35 | % | 1.36 | % | 0.35 | % | 1.36 | % | 2.62 | % | 53 | % | |||||||||||||||||
| 8.71 | (11.45 | ) | 29,987 | 0.53 | 1.38 | 0.53 | 1.38 | 1.62 | 41 | |||||||||||||||||||||||||
| 9.89 | (1.10 | ) | 9,755 | 0.53 | * | 6.96 | * | 0.53 | * | 6.96 | * | 1.13 | * | 0 | ||||||||||||||||||||
| 8.58 | 1.53 | 1,998 | 0.45 | 1.46 | 0.45 | 1.46 | 2.62 | 53 | ||||||||||||||||||||||||||
| 8.69 | (11.69 | ) | 2,019 | 0.63 | 1.48 | 0.63 | 1.48 | 1.71 | 41 | |||||||||||||||||||||||||
| 9.90 | (1.00 | ) | 74 | 0.63 | * | 17.34 | * | 0.63 | * | 17.34 | * | 0.96 | * | 0 | ||||||||||||||||||||
| 8.55 | 1.35 | 2,051 | 0.60 | 1.61 | 0.60 | 1.61 | 1.60 | 53 | ||||||||||||||||||||||||||
| 8.69 | (11.75 | ) | 28 | 0.78 | 1.63 | 0.78 | 1.63 | 1.36 | 41 | |||||||||||||||||||||||||
| 9.89 | (1.30 | ) | 10 | 0.78 | * | 6.47 | * | 0.78 | * | 6.47 | * | 0.88 | * | 0 | ||||||||||||||||||||
| 8.57 | 1.17 | 5,669 | 0.70 | 1.71 | 0.70 | 1.71 | 2.23 | 53 | ||||||||||||||||||||||||||
| 8.70 | (11.77 | ) | 4,912 | 0.88 | 1.73 | 0.88 | 1.73 | 1.20 | 41 | |||||||||||||||||||||||||
| 9.89 | (1.10 | ) | 2,745 | 0.88 | * | 8.20 | * | 0.88 | * | 8.20 | * | 0.81 | * | 0 | ||||||||||||||||||||
| 8.54 | 1.12 | 12,333 | 0.70 | 1.71 | 0.70 | 1.71 | 2.46 | 53 | ||||||||||||||||||||||||||
| 8.68 | (11.72 | ) | 10,147 | 0.88 | 1.73 | 0.88 | 1.73 | 1.32 | 41 | |||||||||||||||||||||||||
| 9.88 | (1.20 | ) | 1,801 | 0.88 | * | 9.28 | * | 0.88 | * | 9.28 | * | 0.82 | * | 0 | ||||||||||||||||||||
| 8.46 | 0.56 | 5,101 | 1.45 | 2.46 | 1.45 | 2.46 | 1.68 | 53 | ||||||||||||||||||||||||||
| 8.62 | (12.51 | ) | 3,868 | 1.63 | 2.48 | 1.63 | 2.48 | 0.57 | 41 | |||||||||||||||||||||||||
| 9.88 | (1.20 | ) | 649 | 1.63 | * | 9.73 | * | 1.63 | * | 9.73 | * | 0.08 | * | 0 | ||||||||||||||||||||
Please see footnotes on page 32.
| ANNUAL REPORT | JUNE 30, 2013 | 31 |
Table of Contents
Financial Highlights (Cont.)
| Selected Per Share Data for the Year or Period Ended: | Net Asset Value | Net Investment Income (Loss) (a) | Net Realized/ Unrealized Gain (Loss) | Total Income (Loss) from Investment Operations | Dividends from Net Investment Income | Distributions from Net Realized Capital Gains | Total Distributions | |||||||||||||||||||||
PIMCO Emerging Multi-Asset Fund (Cont.) | ||||||||||||||||||||||||||||
| Class R | ||||||||||||||||||||||||||||
06/30/2013 | $ | 8.68 | $ | 0.23 | $ | (0.13 | ) | $ | 0.10 | $ | (0.27 | ) | $ | 0.00 | $ | (0.27 | ) | |||||||||||
06/30/2012 | 9.88 | 0.09 | (1.27 | ) | (1.18 | ) | (0.02 | ) | 0.00 | (0.02 | ) | |||||||||||||||||
04/12/2011 - 06/30/2011 | 10.00 | 0.01 | (0.13 | ) | (0.12 | ) | 0.00 | 0.00 | 0.00 | |||||||||||||||||||
PIMCO EqS Pathfinder Fund® | ||||||||||||||||||||||||||||
| Institutional Class | ||||||||||||||||||||||||||||
06/30/2013 | $ | 10.11 | $ | 0.25 | $ | 0.77 | $ | 1.02 | $ | (0.31 | ) | $ | 0.00 | $ | (0.31 | ) | ||||||||||||
06/30/2012 | 10.65 | 0.18 | (0.62 | ) | (0.44 | ) | (0.07 | ) | (0.03 | ) | (0.10 | ) | ||||||||||||||||
06/30/2011 | 9.23 | 0.19 | 1.34 | 1.53 | (0.09 | ) | (0.02 | ) | (0.11 | ) | ||||||||||||||||||
04/14/2010 - 06/30/2010 | 10.00 | 0.07 | (0.84 | ) | (0.77 | ) | 0.00 | 0.00 | 0.00 | |||||||||||||||||||
| Class P | ||||||||||||||||||||||||||||
06/30/2013 | 10.09 | 0.25 | 0.76 | 1.01 | (0.30 | ) | 0.00 | (0.30 | ) | |||||||||||||||||||
06/30/2012 | 10.64 | 0.17 | (0.63 | ) | (0.46 | ) | (0.06 | ) | (0.03 | ) | (0.09 | ) | ||||||||||||||||
06/30/2011 | 9.23 | 0.18 | 1.34 | 1.52 | (0.09 | ) | (0.02 | ) | (0.11 | ) | ||||||||||||||||||
04/14/2010 - 06/30/2010 | 10.00 | 0.07 | (0.84 | ) | (0.77 | ) | 0.00 | 0.00 | 0.00 | |||||||||||||||||||
| Class D | ||||||||||||||||||||||||||||
06/30/2013 | 10.05 | 0.21 | 0.77 | 0.98 | (0.29 | ) | 0.00 | (0.29 | ) | |||||||||||||||||||
06/30/2012 | 10.61 | 0.13 | (0.61 | ) | (0.48 | ) | (0.05 | ) | (0.03 | ) | (0.08 | ) | ||||||||||||||||
06/30/2011 | 9.21 | 0.16 | 1.34 | 1.50 | (0.08 | ) | (0.02 | ) | (0.10 | ) | ||||||||||||||||||
04/14/2010 - 06/30/2010 | 10.00 | 0.06 | (0.85 | ) | (0.79 | ) | 0.00 | 0.00 | 0.00 | |||||||||||||||||||
| Class A | ||||||||||||||||||||||||||||
06/30/2013 | 10.08 | 0.22 | 0.76 | 0.98 | (0.28 | ) | 0.00 | (0.28 | ) | |||||||||||||||||||
06/30/2012 | 10.64 | 0.14 | (0.62 | ) | (0.48 | ) | (0.05 | ) | (0.03 | ) | (0.08 | ) | ||||||||||||||||
06/30/2011 | 9.22 | 0.17 | 1.33 | 1.50 | (0.06 | ) | (0.02 | ) | (0.08 | ) | ||||||||||||||||||
04/14/2010 - 06/30/2010 | 10.00 | 0.07 | (0.85 | ) | (0.78 | ) | 0.00 | 0.00 | 0.00 | |||||||||||||||||||
| Class C | ||||||||||||||||||||||||||||
06/30/2013 | 9.96 | 0.13 | 0.75 | 0.88 | (0.24 | ) | 0.00 | (0.24 | ) | |||||||||||||||||||
06/30/2012 | 10.55 | 0.06 | (0.61 | ) | (0.55 | ) | (0.01 | ) | (0.03 | ) | (0.04 | ) | ||||||||||||||||
06/30/2011 | 9.21 | 0.11 | 1.31 | 1.42 | (0.06 | ) | (0.02 | ) | (0.08 | ) | ||||||||||||||||||
04/14/2010 - 06/30/2010 | 10.00 | 0.05 | (0.84 | ) | (0.79 | ) | 0.00 | 0.00 | 0.00 | |||||||||||||||||||
| Class R | ||||||||||||||||||||||||||||
06/30/2013 | 10.00 | 0.20 | 0.74 | 0.94 | (0.28 | ) | 0.00 | (0.28 | ) | |||||||||||||||||||
06/30/2012 | 10.59 | 0.07 | (0.59 | ) | (0.52 | ) | (0.04 | ) | (0.03 | ) | (0.07 | ) | ||||||||||||||||
06/30/2011 | 9.21 | 0.12 | 1.35 | 1.47 | (0.07 | ) | (0.02 | ) | (0.09 | ) | ||||||||||||||||||
04/14/2010 - 06/30/2010 | 10.00 | 0.06 | (0.85 | ) | (0.79 | ) | 0.00 | 0.00 | 0.00 | |||||||||||||||||||
| * | Annualized |
| ** | The ratio excludes PIMCO Short-Term Floating NAV Portfolio. |
| ^ | Reflects an amount rounding to less than one cent. |
| (a) | Per share amounts based on average number of shares outstanding during the year or period. |
| 32 | PIMCO EQUITY SERIES | See Accompanying Notes |
Table of Contents
| Net Asset Value End of Year or Period | Total Return | Net Assets End of Year or Period (000s) | Ratio of Expenses to Average Net Assets | Ratio of Expenses to Average Net Assets Excluding Waivers | Ratio of Expenses to Average Net Assets Excluding Interest Expense and Dividends on Securities Sold Short | Ratio of Expenses to Average Net Assets Excluding Interest Expense and Dividends on Securities Sold Short and Waivers | Ratio of Net Investment Income (Loss) to Average Net Assets | Portfolio Turnover Rate** | ||||||||||||||||||||||||||
| $ | 8.51 | 0.96 | % | $ | 30 | 0.95 | % | 1.96 | % | 0.95 | % | 1.96 | % | 2.47 | % | 53 | % | |||||||||||||||||
| 8.68 | (11.98 | ) | 9 | 1.13 | 1.98 | 1.13 | 1.98 | 0.99 | 41 | |||||||||||||||||||||||||
| 9.88 | (1.20 | ) | 10 | 1.13 | * | 6.40 | * | 1.13 | * | 6.40 | * | 0.50 | * | 0 | ||||||||||||||||||||
| $ | 10.82 | 10.19 | % | $ | 1,691,850 | 0.90 | % | 1.10 | % | 0.89 | % | 1.09 | % | 2.38 | % | 29 | % | |||||||||||||||||
| 10.11 | (4.09 | ) | 1,930,637 | 0.92 | 1.09 | 0.90 | 1.07 | 1.80 | 32 | |||||||||||||||||||||||||
| 10.65 | 16.68 | 1,338,509 | 0.92 | 1.10 | 0.89 | 1.07 | 1.87 | 35 | ||||||||||||||||||||||||||
| 9.23 | (7.70 | ) | 542,879 | 0.98 | * | 1.21 | * | 0.89 | * | 1.12 | * | 3.53 | * | 4 | ||||||||||||||||||||
| 10.80 | 10.12 | 62,479 | 1.00 | 1.20 | 0.99 | 1.19 | 2.34 | 29 | ||||||||||||||||||||||||||
| 10.09 | (4.23 | ) | 67,977 | 1.02 | 1.19 | 1.00 | 1.17 | 1.70 | 32 | |||||||||||||||||||||||||
| 10.64 | 16.55 | 45,785 | 1.02 | 1.20 | 0.99 | 1.17 | 1.72 | 35 | ||||||||||||||||||||||||||
| 9.23 | (7.70 | ) | 970 | 1.08 | * | 1.31 | * | 0.99 | * | 1.22 | * | 3.36 | * | 4 | ||||||||||||||||||||
| 10.74 | 9.89 | 17,730 | 1.25 | 1.45 | 1.24 | 1.44 | 2.01 | 29 | ||||||||||||||||||||||||||
| 10.05 | (4.52 | ) | 18,469 | 1.27 | 1.45 | 1.26 | 1.42 | 1.33 | 32 | |||||||||||||||||||||||||
| 10.61 | 16.39 | 24,352 | 1.27 | 1.45 | 1.24 | 1.42 | 1.55 | 35 | ||||||||||||||||||||||||||
| 9.21 | (7.90 | ) | 7,084 | 1.33 | * | 1.56 | * | 1.24 | * | 1.47 | * | 3.13 | * | 4 | ||||||||||||||||||||
| 10.78 | 9.88 | 59,746 | 1.25 | 1.45 | 1.24 | 1.44 | 2.04 | 29 | ||||||||||||||||||||||||||
| 10.08 | (4.50 | ) | 69,910 | 1.27 | 1.43 | 1.26 | 1.42 | 1.37 | 32 | |||||||||||||||||||||||||
| 10.64 | 16.30 | 89,571 | 1.27 | 1.45 | 1.24 | 1.42 | 1.64 | 35 | ||||||||||||||||||||||||||
| 9.22 | (7.80 | ) | 15,436 | 1.33 | * | 1.56 | * | 1.24 | * | 1.47 | * | 3.28 | * | 4 | ||||||||||||||||||||
| 10.60 | 8.95 | 35,754 | 2.00 | 2.20 | 1.99 | 2.19 | 1.24 | 29 | ||||||||||||||||||||||||||
| 9.96 | (5.15 | ) | 47,006 | 2.02 | 2.21 | 2.00 | 2.17 | 0.65 | 32 | |||||||||||||||||||||||||
| 10.55 | 15.50 | 50,672 | 2.02 | 2.20 | 1.99 | 2.17 | 1.04 | 35 | ||||||||||||||||||||||||||
| 9.21 | (7.90 | ) | 6,668 | 2.08 | * | 2.31 | * | 1.99 | * | 2.22 | * | 2.43 | * | 4 | ||||||||||||||||||||
| 10.66 | 9.48 | 15 | 1.50 | 1.70 | 1.49 | 1.69 | 1.92 | 29 | ||||||||||||||||||||||||||
| 10.00 | (4.86 | ) | 11 | 1.52 | 1.67 | 1.51 | 1.66 | 0.71 | 32 | |||||||||||||||||||||||||
| 10.59 | 16.02 | 102 | 1.52 | 1.70 | 1.49 | 1.67 | 1.21 | 35 | ||||||||||||||||||||||||||
| 9.21 | (7.90 | ) | 9 | 1.58 | * | 1.81 | * | 1.49 | * | 1.72 | * | 2.91 | * | 4 | ||||||||||||||||||||
| ANNUAL REPORT | JUNE 30, 2013 | 33 |
Table of Contents
Statements of Assets and Liabilities
| (Amounts in thousands, except per share amounts) | PIMCO Dividend and Income Builder Fund | PIMCO EqS® Dividend Fund | PIMCO EqS® | PIMCO EqS® Long/Short Fund | ||||||||||||
Assets: | ||||||||||||||||
Investments, at value | $ | 357,054 | $ | 591,075 | $ | 499,751 | $ | 278,307 | ||||||||
Investments in Affiliates, at value | 28,734 | 19,574 | 9,903 | 136,702 | ||||||||||||
Repurchase agreements, at value | 4,126 | 952 | 575 | 1,385 | ||||||||||||
Cash | 0 | 0 | 8,528 | 1 | ||||||||||||
Deposits with counterparty | 345 | 360 | 0 | 88,220 | ||||||||||||
Foreign currency, at value | 1,420 | 2,365 | 4,679 | 2 | ||||||||||||
Receivable for investments sold | 3,076 | 5,856 | 2,546 | 52,956 | ||||||||||||
Variation margin receivable on financial derivative instruments | 44 | 92 | 0 | 0 | ||||||||||||
Unrealized appreciation on foreign currency contracts | 1,795 | 4,195 | 6,211 | 556 | ||||||||||||
Unrealized appreciation on OTC swap agreements | 0 | 0 | 350 | 0 | ||||||||||||
Receivable for Fund shares sold | 5,010 | 50,865 | 737 | 3,581 | ||||||||||||
Interest and dividends receivable | 1,794 | 2,930 | 3,826 | 191 | ||||||||||||
Dividends receivable from Affiliates | 6 | 6 | 5 | 19 | ||||||||||||
| 403,404 | 678,270 | 537,111 | 561,920 | |||||||||||||
Liabilities: | ||||||||||||||||
Payable for investments purchased | $ | 11,413 | $ | 38,730 | $ | 9,685 | $ | 63,122 | ||||||||
Payable for investments in Affiliates purchased | 6 | 6 | 5 | 19 | ||||||||||||
Payable for short sales | 0 | 0 | 0 | 105,036 | ||||||||||||
Written options outstanding | 0 | 0 | 531 | 0 | ||||||||||||
OTC swap premiums received | 0 | 0 | 25 | 0 | ||||||||||||
Variation margin payable on financial derivative instruments | 40 | 0 | 37 | 0 | ||||||||||||
Unrealized depreciation on foreign currency contracts | 1,461 | 4,027 | 10,381 | 355 | ||||||||||||
Unrealized depreciation on OTC swap agreements | 0 | 0 | 2,717 | 0 | ||||||||||||
Deposits from counterparty | 5,075 | 3,704 | 2,179 | 0 | ||||||||||||
Payable for Fund shares redeemed | 1,425 | 806 | 19 | 888 | ||||||||||||
Dividends payable | 812 | 85 | 0 | 0 | ||||||||||||
Accrued investment advisory fees | 143 | 245 | 330 | 272 | ||||||||||||
Accrued supervisory and administrative fees | 103 | 142 | 187 | 133 | ||||||||||||
Accrued distribution fees | 45 | 9 | 1 | 5 | ||||||||||||
Accrued servicing fees | 34 | 7 | 1 | 5 | ||||||||||||
Reimbursement to PIMCO | 8 | 24 | 28 | 14 | ||||||||||||
Other liabilities | 33 | 72 | 339 | 87 | ||||||||||||
| 20,598 | 47,857 | 26,465 | 169,936 | |||||||||||||
Net Assets | $ | 382,806 | $ | 630,413 | $ | 510,646 | $ | 391,984 | ||||||||
Net Assets Consist of: | ||||||||||||||||
Paid in capital | $ | 376,537 | $ | 576,510 | $ | 577,277 | $ | 355,880 | ||||||||
Undistributed net investment income | 1,179 | 2,827 | 1,664 | 4,891 | ||||||||||||
Accumulated undistributed net realized gain (loss) | (1,990 | ) | 18,617 | (39,774 | ) | 7,190 | ||||||||||
Net unrealized appreciation (depreciation) | 7,080 | 32,459 | (28,521 | ) | 24,023 | |||||||||||
| $ | 382,806 | $ | 630,413 | $ | 510,646 | $ | 391,984 | |||||||||
Cost of Investments | $ | 350,149 | $ | 558,891 | $ | 521,337 | $ | 260,870 | ||||||||
Cost of Investments in Affiliates | $ | 28,732 | $ | 19,574 | $ | 9,903 | $ | 136,701 | ||||||||
Cost of Repurchase Agreements | $ | 4,126 | $ | 952 | $ | 575 | $ | 1,385 | ||||||||
Cost of Foreign Currency Held | $ | 1,421 | $ | 2,413 | $ | 4,678 | $ | 2 | ||||||||
Proceeds Received on Short Sales | $ | 0 | $ | 0 | $ | 0 | $ | 111,644 | ||||||||
Premiums Received on Written Options | $ | 0 | $ | 0 | $ | 108 | $ | 0 | ||||||||
| 34 | PIMCO EQUITY SERIES | See Accompanying Notes |
Table of Contents
June 30, 2013
| (Amounts in thousands, except per share amounts) | PIMCO Dividend and Income Builder Fund | PIMCO EqS® Dividend Fund | PIMCO EqS® Emerging Markets Fund | PIMCO EqS® Long/Short Fund | ||||||||||||
Net Assets: | ||||||||||||||||
Institutional Class | $ | 69,203 | $ | 579,198 | $ | 496,172 | $ | 329,610 | ||||||||
Class P | 85,724 | 1,435 | 7,615 | 15,664 | ||||||||||||
Administrative Class | NA | NA | 42 | NA | ||||||||||||
Class D | 23,204 | 7,801 | 1,097 | 12,421 | ||||||||||||
Class A | 117,579 | 27,729 | 4,324 | 24,759 | ||||||||||||
Class C | 86,879 | 14,150 | 1,371 | 9,530 | ||||||||||||
Class R | 217 | 100 | 25 | NA | ||||||||||||
Shares Issued and Outstanding: | ||||||||||||||||
Institutional Class | 5,964 | 48,813 | 60,095 | 29,712 | ||||||||||||
Class P | 7,380 | 121 | 924 | 1,414 | ||||||||||||
Administrative Class | NA | NA | 5 | NA | ||||||||||||
Class D | 1,999 | 657 | 134 | 1,123 | ||||||||||||
Class A | 10,130 | 2,335 | 527 | 2,241 | ||||||||||||
Class C | 7,498 | 1,195 | 169 | 868 | ||||||||||||
Class R | 19 | 9 | 3 | NA | ||||||||||||
Net Asset Value and Redemption Price* Per Share Outstanding: | ||||||||||||||||
Institutional Class | $ | 11.60 | $ | 11.87 | $ | 8.26 | $ | 11.09 | ||||||||
Class P | 11.62 | 11.88 | 8.24 | 11.08 | ||||||||||||
Administrative Class | NA | NA | 8.23 | NA | ||||||||||||
Class D | 11.61 | 11.87 | 8.20 | 11.06 | ||||||||||||
Class A | 11.61 | 11.88 | 8.20 | 11.05 | ||||||||||||
Class C | 11.59 | 11.84 | 8.11 | 10.98 | ||||||||||||
Class R | 11.61 | 11.87 | 8.19 | NA | ||||||||||||
| * | With respect to the A and C Classes, the redemption price varies by the length of time the shares are held. |
| ANNUAL REPORT | JUNE 30, 2013 | 35 |
Table of Contents
Consolidated Statements of Assets and Liabilities
| (Amounts in thousands, except per share amounts) | PIMCO Emerging Multi-Asset Fund | PIMCO EqS Pathfinder Fund® | ||||||
Assets: | ||||||||
Investments, at value | $ | 937 | $ | 1,817,931 | ||||
Investments in Affiliates, at value | 63,363 | 52,498 | ||||||
Repurchase agreements, at value | 563 | 2,793 | ||||||
Cash | 10 | 1 | ||||||
Deposits with counterparty | 2 | 22,402 | ||||||
Foreign currency, at value | 34 | 3,797 | ||||||
Receivable for investments sold | 0 | 13,193 | ||||||
Unrealized appreciation on foreign currency contracts | 161 | 18,419 | ||||||
Unrealized appreciation on OTC swap agreements | 5 | 0 | ||||||
Receivable for Fund shares sold | 113 | 1,054 | ||||||
Interest and dividends receivable | 0 | 3,408 | ||||||
Dividends receivable from Affiliates | 117 | 15 | ||||||
| 65,305 | 1,935,511 | |||||||
Liabilities: | ||||||||
Payable for investments purchased | $ | 0 | $ | 13,981 | ||||
Payable for investments in Affiliates purchased | 117 | 15 | ||||||
Payable for short sales | 0 | 21,022 | ||||||
Written options outstanding | 137 | 53 | ||||||
OTC swap premiums received | 5 | 0 | ||||||
Unrealized depreciation on foreign currency contracts | 260 | 16,287 | ||||||
Unrealized depreciation on OTC swap agreements | 0 | 1,618 | ||||||
Deposits from counterparty | 0 | 13,015 | ||||||
Payable for Fund shares redeemed | 1,529 | 440 | ||||||
Accrued investment advisory fees | 0 | 903 | ||||||
Accrued supervisory and administrative fees | 13 | 470 | ||||||
Accrued distribution fees | 4 | 24 | ||||||
Accrued servicing fees | 4 | 19 | ||||||
Reimbursement to PIMCO | 3 | 72 | ||||||
Other liabilities | 0 | 18 | ||||||
| 2,072 | 67,937 | |||||||
Net Assets | $ | 63,233 | $ | 1,867,574 | ||||
Net Assets Consist of: | ||||||||
Paid in capital | $ | 69,668 | $ | 1,682,790 | ||||
Undistributed net investment income | 393 | 15,266 | ||||||
Accumulated undistributed net realized (loss) | (1,696 | ) | (3,817 | ) | ||||
Net unrealized appreciation (depreciation) | (5,132 | ) | 173,335 | |||||
| $ | 63,233 | $ | 1,867,574 | |||||
Cost of Investments | $ | 1,125 | $ | 1,645,061 | ||||
Cost of Investments in Affiliates | $ | 68,351 | $ | 52,499 | ||||
Cost of Repurchase Agreements | $ | 563 | $ | 2,793 | ||||
Cost of Foreign Currency Held | $ | 35 | $ | 3,807 | ||||
Proceeds Received on Short Sales | $ | 0 | $ | 20,825 | ||||
Premiums Received on Written Options | $ | 277 | $ | 258 | ||||
| 36 | PIMCO EQUITY SERIES | See Accompanying Notes |
Table of Contents
June 30, 2013
| (Amounts in thousands, except per share amounts) | PIMCO Emerging Multi-Asset Fund | PIMCO EqS Pathfinder Fund® | ||||||
Net Assets: | ||||||||
Institutional Class | $ | 36,051 | $ | 1,691,850 | ||||
Class P | 1,998 | 62,479 | ||||||
Administrative Class | 2,051 | NA | ||||||
Class D | 5,669 | 17,730 | ||||||
Class A | 12,333 | 59,746 | ||||||
Class C | 5,101 | 35,754 | ||||||
Class R | 30 | 15 | ||||||
Shares Issued and Outstanding: | ||||||||
Institutional Class | 4,195 | 156,349 | ||||||
Class P | 233 | 5,787 | ||||||
Administrative Class | 240 | NA | ||||||
Class D | 661 | 1,651 | ||||||
Class A | 1,443 | 5,544 | ||||||
Class C | 603 | 3,371 | ||||||
Class R | 4 | 1 | ||||||
Net Asset Value and Redemption Price* Per Share Outstanding: | ||||||||
Institutional Class | $ | 8.60 | $ | 10.82 | ||||
Class P | 8.58 | 10.80 | ||||||
Administrative Class | 8.55 | NA | ||||||
Class D | 8.57 | 10.74 | ||||||
Class A | 8.54 | 10.78 | ||||||
Class C | 8.46 | 10.60 | ||||||
Class R | 8.51 | 10.66 | ||||||
| * | With respect to the A and C Classes, the redemption price varies by the length of time the shares are held. |
| ANNUAL REPORT | JUNE 30, 2013 | 37 |
Table of Contents
| Year Ended June 30, 2013 | ||||||||||||||||
| (Amounts in thousands) | PIMCO Dividend and Income Builder Fund | PIMCO EqS® Dividend Fund | PIMCO EqS® Emerging Markets Fund | PIMCO EqS® Long/Short Fund | ||||||||||||
Investment Income: | ||||||||||||||||
Interest, net of foreign taxes* | $ | 1,221 | $ | 2 | $ | 2 | $ | 56 | ||||||||
Dividends, net of foreign taxes** | 7,572 | 22,518 | 15,250 | 11,142 | ||||||||||||
Dividends from Affiliate investments | 29 | 54 | 210 | 288 | ||||||||||||
Miscellaneous income | 0 | 0 | 2 | 58 | ||||||||||||
Total Income | 8,822 | 22,574 | 15,464 | 11,544 | ||||||||||||
Expenses: | ||||||||||||||||
Investment advisory fees | 1,116 | 3,382 | 5,654 | 2,936 | ||||||||||||
Supervisory and administrative fees | 611 | 1,492 | 2,553 | 1,283 | ||||||||||||
Distribution and/or servicing fees - Class D | 42 | 12 | 5 | 4 | ||||||||||||
Distribution fees - Class C | 204 | 44 | 8 | 15 | ||||||||||||
Distribution fees - Class R | 1 | 0 | 0 | 0 | ||||||||||||
Servicing fees - Class A | 109 | 26 | 9 | 16 | ||||||||||||
Servicing fees - Class C | 68 | 15 | 2 | 5 | ||||||||||||
Servicing fees - Class R | 1 | 0 | 0 | 0 | ||||||||||||
Dividends on short sales | 0 | 0 | 0 | 2,972 | ||||||||||||
Trustees’ fees | 32 | 72 | 60 | 36 | ||||||||||||
Interest expense | 1 | 2 | 14 | 674 | ||||||||||||
Miscellaneous expense | 0 | 0 | 0 | 16 | ||||||||||||
Total Expenses | 2,185 | 5,045 | 8,305 | 7,957 | ||||||||||||
Waiver and/or Reimbursement by PIMCO | (283 | ) | (832 | ) | (1,163 | ) | (292 | ) | ||||||||
Net Expenses | 1,902 | 4,213 | 7,142 | 7,665 | ||||||||||||
Net Investment Income | 6,920 | 18,361 | 8,322 | 3,879 | ||||||||||||
Net Realized and Unrealized Gain (Loss): | ||||||||||||||||
Net realized gain (loss) on investments | (1,389 | ) | 20,137 | (2,752 | ) | 18,551 | ||||||||||
Net realized (loss) on Affiliate investments | (8 | ) | (5 | ) | (51 | ) | (119 | ) | ||||||||
Net capital gain distributions received from Affiliate investments | 0 | 1 | 3 | 7 | ||||||||||||
Net realized gain (loss) on futures contracts | (409 | ) | 0 | 1,405 | 643 | |||||||||||
Net realized gain on written options | 0 | 0 | 2,184 | 784 | ||||||||||||
Net realized gain (loss) on swaps | 0 | 0 | (4,525 | ) | 1,212 | |||||||||||
Net realized (loss) on short sales | 0 | 0 | 0 | (5,744 | ) | |||||||||||
Net realized gain (loss) on foreign currency transactions | 76 | (1,899 | ) | 4,363 | (98 | ) | ||||||||||
Net change in unrealized appreciation on investments | 7,250 | 31,981 | 23,418 | 14,576 | ||||||||||||
Net change in unrealized appreciation on Affiliate investments | 2 | 1 | 5 | 8 | ||||||||||||
Net change in unrealized appreciation (depreciation) on futures contracts | (106 | ) | 217 | 0 | 0 | |||||||||||
Net change in unrealized (depreciation) on written options | 0 | 0 | (1,137 | ) | 0 | |||||||||||
Net change in unrealized (depreciation) on swaps | 0 | 0 | (3,690 | ) | 0 | |||||||||||
Net change in unrealized appreciation on short sales | 0 | 0 | 0 | 7,182 | ||||||||||||
Net change in unrealized appreciation (depreciation) on translation of assets and liabilities denominated in foreign currencies | 362 | 1,126 | (1,009 | ) | (66 | ) | ||||||||||
Net Gain | 5,778 | 51,559 | 18,214 | 36,936 | ||||||||||||
Net Increase in Net Assets Resulting from Operations | $ | 12,698 | $ | 69,920 | $ | 26,536 | $ | 40,815 | ||||||||
* Foreign tax withholdings - Interest | $ | 1 | $ | 0 | $ | 0 | $ | 0 | ||||||||
** Foreign tax withholdings - Dividends | $ | 643 | $ | 1,817 | $ | 1,371 | $ | 80 | ||||||||
| 38 | PIMCO EQUITY SERIES | See Accompanying Notes |
Table of Contents
Consolidated Statements of Operations
| Year Ended June 30, 2013 | ||||||||
| (Amounts in thousands) | PIMCO Emerging Multi-Asset Fund | PIMCO EqS Pathfinder Fund® | ||||||
Investment Income: | ||||||||
Interest | $ | 1 | $ | 9 | ||||
Dividends, net of foreign taxes* | 46 | 68,333 | ||||||
Dividends from Affiliate investments | 1,755 | 614 | ||||||
Miscellaneous income | 0 | 1 | ||||||
Total Income | 1,802 | 68,957 | ||||||
Expenses: | ||||||||
Investment advisory fees | 537 | 16,081 | ||||||
Supervisory and administrative fees | 292 | 6,618 | ||||||
Distribution and/or servicing fees - Class D | 11 | 49 | ||||||
Distribution fees - Class C | 34 | 305 | ||||||
Servicing fees - Class A | 31 | 160 | ||||||
Servicing fees - Class C | 12 | 102 | ||||||
Dividends on short sales | 0 | 60 | ||||||
Trustees’ fees | 8 | 204 | ||||||
Interest expense | 0 | 149 | ||||||
Miscellaneous expense | 0 | 1 | ||||||
Total Expenses | 925 | 23,729 | ||||||
Waiver and/or Reimbursement by PIMCO | (601 | ) | (3,982 | ) | ||||
Net Expenses | 324 | 19,747 | ||||||
Net Investment Income | 1,478 | 49,210 | ||||||
Net Realized and Unrealized Gain (Loss): | ||||||||
Net realized gain (loss) on investments | (633 | ) | 24,703 | |||||
Net realized (loss) on Affiliate investments | (846 | ) | (196 | ) | ||||
Net capital gain distributions received from Affiliate investments | 9 | 13 | ||||||
Net realized gain on futures contracts | 13 | 0 | ||||||
Net realized gain on written options | 510 | 4,522 | ||||||
Net realized gain (loss) on swaps | (52 | ) | 1,060 | |||||
Net realized (loss) on short sales | 0 | (1,843 | ) | |||||
Net realized gain (loss) on foreign currency transactions | 113 | (29,839 | ) | |||||
Net change in unrealized appreciation (depreciation) on investments | (91 | ) | 166,026 | |||||
Net change in unrealized appreciation (depreciation) on Affiliate investments | (1,921 | ) | 9 | |||||
Net change in unrealized appreciation (depreciation) on written options | 154 | (3,389 | ) | |||||
Net change in unrealized (depreciation) on swaps | (41 | ) | (1,922 | ) | ||||
Net change in unrealized appreciation on short sales | 0 | (197 | ) | |||||
Net change in unrealized appreciation (depreciation) on translation of assets and liabilities denominated in foreign currencies | (77 | ) | 110 | |||||
Net Gain (Loss) | (2,862 | ) | 159,057 | |||||
Net Increase (Decrease) in Net Assets Resulting from Operations | $ | (1,384 | ) | $ | 208,267 | |||
* Foreign tax withholdings - Dividends | $ | 0 | $ | 3,037 | ||||
| ANNUAL REPORT | JUNE 30, 2013 | 39 |
Table of Contents
Statements of Changes in Net Assets
| PIMCO Dividend and Income Builder Fund | PIMCO EqS® Dividend Fund | PIMCO EqS® Emerging Markets Fund | PIMCO EqS® Long/Short Fund | |||||||||||||||||||||||||||||
| (Amounts in thousands) | Year Ended June 30, 2013 | Period from December 14, 2011 to June 30, 2012 | Year Ended June 30, 2013 | Period from December 14, 2011 to June 30, 2012 | Year Ended June 30, 2013 | Year Ended June 30, 2012 | Year Ended June 30, 2013 | Period from | ||||||||||||||||||||||||
Increase (Decrease) in Net Assets from: | ||||||||||||||||||||||||||||||||
Operations: | ||||||||||||||||||||||||||||||||
Net investment income (loss) | $ | 6,920 | $ | 590 | $ | 18,361 | $ | 3,537 | $ | 8,322 | $ | 4,368 | $ | 3,879 | $ | (396 | ) | |||||||||||||||
Net realized gain (loss) | (1,722 | ) | 404 | 18,238 | 2,518 | 675 | (62,201 | ) | 15,348 | (5,107 | ) | |||||||||||||||||||||
Net realized gain (loss) | (8 | ) | 0 | (5 | ) | 8 | (51 | ) | 32 | (119 | ) | 0 | ||||||||||||||||||||
Net capital gain distributions received from Affiliate investments | 0 | 0 | 1 | 0 | 3 | 1 | 7 | 0 | ||||||||||||||||||||||||
Net change in unrealized appreciation (depreciation) | 7,506 | (428 | ) | 33,324 | (865 | ) | 17,582 | (35,695 | ) | 21,692 | 2,330 | |||||||||||||||||||||
Net change in unrealized appreciation (depreciation) on Affiliate investments | 2 | 0 | 1 | (1 | ) | 5 | 1 | 8 | (7 | ) | ||||||||||||||||||||||
Net increase (decrease) resulting from operations | 12,698 | 566 | 69,920 | 5,197 | 26,536 | (93,494 | ) | 40,815 | (3,180 | ) | ||||||||||||||||||||||
Distributions to Shareholders: | ||||||||||||||||||||||||||||||||
From net investment income | ||||||||||||||||||||||||||||||||
Institutional Class | (1,472 | ) | (250 | ) | (16,060 | ) | (3,523 | ) | (5,839 | ) | (1,138 | ) | (1,029 | ) | 0 | |||||||||||||||||
Class P | (1,556 | ) | (87 | ) | (30 | ) | (1 | ) | (2 | ) | (0 | )^ | (9 | ) | 0 | |||||||||||||||||
Administrative Class | 0 | 0 | 0 | 0 | (0 | )^ | (0 | )^ | 0 | 0 | ||||||||||||||||||||||
Class D | (604 | ) | (32 | ) | (149 | ) | (9 | ) | (10 | ) | (14 | ) | (2 | ) | 0 | |||||||||||||||||
Class A | (1,667 | ) | (160 | ) | (359 | ) | (32 | ) | (33 | ) | (0 | )^ | (15 | ) | 0 | |||||||||||||||||
Class C | (860 | ) | (68 | ) | (161 | ) | (13 | ) | (6 | ) | (0 | )^ | (2 | ) | 0 | |||||||||||||||||
Class R | (8 | ) | (7 | ) | (1 | ) | (0 | )^ | (0 | )^ | (0 | )^ | 0 | 0 | ||||||||||||||||||
From net realized capital gains | ||||||||||||||||||||||||||||||||
Institutional Class | (52 | ) | 0 | (839 | ) | 0 | 0 | (468 | ) | 0 | 0 | |||||||||||||||||||||
Class P | (48 | ) | 0 | (2 | ) | 0 | 0 | (0 | )^ | 0 | 0 | |||||||||||||||||||||
Administrative Class | 0 | 0 | 0 | 0 | 0 | (0 | )^ | 0 | 0 | |||||||||||||||||||||||
Class D | (28 | ) | 0 | (9 | ) | 0 | 0 | (7 | ) | 0 | 0 | |||||||||||||||||||||
Class A | (60 | ) | 0 | (18 | ) | 0 | 0 | (1 | ) | 0 | 0 | |||||||||||||||||||||
Class C | (36 | ) | 0 | (7 | ) | 0 | 0 | (0 | )^ | 0 | 0 | |||||||||||||||||||||
Class R | (0 | )^ | 0 | (0 | )^ | 0 | 0 | (0 | )^ | 0 | 0 | |||||||||||||||||||||
Total Distributions | (6,391 | ) | (604 | ) | (17,635 | ) | (3,578 | ) | (5,890 | ) | (1,628 | ) | (1,057 | ) | 0 | |||||||||||||||||
Portfolio Share Transactions: | ||||||||||||||||||||||||||||||||
Net increase (decrease) resulting from Fund share transactions** | 333,087 | 43,450 | 257,478 | 319,031 | (29,138 | ) | 259,133 | 138,604 | 216,802 | |||||||||||||||||||||||
Total Increase (Decrease) in | 339,394 | 43,412 | 309,763 | 320,650 | (8,492 | ) | 164,011 | 178,362 | 213,622 | |||||||||||||||||||||||
Net Assets: | ||||||||||||||||||||||||||||||||
Beginning of year or period | 43,412 | 0 | 320,650 | 0 | 519,138 | 355,127 | 213,622 | 0 | ||||||||||||||||||||||||
End of year or period* | $ | 382,806 | $ | 43,412 | $ | 630,413 | $ | 320,650 | $ | 510,646 | $ | 519,138 | $ | 391,984 | $ | 213,622 | ||||||||||||||||
*Including undistributed (overdistributed) net investment | $ | 1,179 | $ | 88 | $ | 2,827 | $ | (8 | ) | $ | 1,664 | $ | 214 | $ | 4,891 | $ | (326 | ) | ||||||||||||||
| ** | See Note 13 in the Notes to Financial Statements. |
| ^ | Amount is less than $500. |
| 40 | PIMCO EQUITY SERIES | See Accompanying Notes |
Table of Contents
Consolidated Statements of Changes in Net Assets
| PIMCO Emerging Multi-Asset Fund | PIMCO EqS Pathfinder Fund® | |||||||||||||||
| (Amounts in thousands) | Year Ended June 30, 2013 | Year Ended June 30, 2012 | Year Ended June 30, 2013 | Year Ended | ||||||||||||
Increase (Decrease) in Net Assets from: | ||||||||||||||||
Operations: | ||||||||||||||||
Net investment income | $ | 1,478 | $ | 557 | $ | 49,210 | $ | 35,581 | ||||||||
Net realized gain (loss) | (49 | ) | (730 | ) | (1,397 | ) | 8,144 | |||||||||
Net realized (loss) on Affiliate investments | (846 | ) | (208 | ) | (196 | ) | (1 | ) | ||||||||
Net capital gain distributions received from Affiliate investments | 9 | 2 | 13 | 1 | ||||||||||||
Net change in unrealized appreciation (depreciation) | (55 | ) | (9 | ) | 160,628 | (84,207 | ) | |||||||||
Net change in unrealized appreciation (depreciation) on Affiliate investments | (1,921 | ) | (2,951 | ) | 9 | 3 | ||||||||||
Net increase (decrease) resulting from operations | (1,384 | ) | (3,339 | ) | 208,267 | (40,479 | ) | |||||||||
Distributions to Shareholders: | ||||||||||||||||
From net investment income | ||||||||||||||||
Institutional Class | (773 | ) | (105 | ) | (58,239 | ) | (13,284 | ) | ||||||||
Class P | (47 | ) | (56 | ) | (1,444 | ) | (693 | ) | ||||||||
Administrative Class | (2 | ) | 0 | 0 | 0 | |||||||||||
Class D | (84 | ) | (8 | ) | (632 | ) | (95 | ) | ||||||||
Class A | (327 | ) | (27 | ) | (1,599 | ) | (350 | ) | ||||||||
Class C | (104 | ) | (5 | ) | (920 | ) | (67 | ) | ||||||||
Class R | (1 | ) | 0 | (0 | )^ | (0 | )^ | |||||||||
From net realized capital gains | ||||||||||||||||
Institutional Class | 0 | 0 | 0 | (5,792 | ) | |||||||||||
Class P | 0 | 0 | 0 | (338 | ) | |||||||||||
Class D | 0 | 0 | 0 | (66 | ) | |||||||||||
Class A | 0 | 0 | 0 | (241 | ) | |||||||||||
Class C | 0 | 0 | 0 | (151 | ) | |||||||||||
Class R | 0 | 0 | 0 | (0 | )^ | |||||||||||
Total Distributions | (1,338 | ) | (201 | ) | (62,834 | ) | (21,077 | ) | ||||||||
Portfolio Share Transactions: | ||||||||||||||||
Net increase (decrease) resulting from Fund share transactions** | 14,985 | 39,466 | (411,869 | ) | 646,575 | |||||||||||
Total Increase (Decrease) in Net Assets | 12,263 | 35,926 | (266,436 | ) | 585,019 | |||||||||||
Net Assets: | ||||||||||||||||
Beginning of year | 50,970 | 15,044 | 2,134,010 | 1,548,991 | ||||||||||||
End of year* | $ | 63,233 | $ | 50,970 | $ | 1,867,574 | $ | 2,134,010 | ||||||||
*Including undistributed net investment income of: | $ | 393 | $ | 192 | $ | 15,266 | $ | 56,899 | ||||||||
| ** | See Note 13 in the Notes to Financial Statements. |
| ^ | Amount is less than $500. |
| ANNUAL REPORT | JUNE 30, 2013 | 41 |
Table of Contents
| Year Ended June 30, 2013 | ||||
| (Amounts in thousands) | PIMCO EqS® Long/Short Fund | |||
Cash flows used for operating activities: | ||||
Net increase in net assets resulting from operations | $ | 40,815 | ||
Adjustments to reconcile net increase in net assets from operations to net cash used for operating activities: | ||||
Purchases of long-term securities | (1,262,585 | ) | ||
Proceeds from sales of long-term securities | 1,135,947 | |||
Purchases of short-term portfolio investments, net | (50,096 | ) | ||
(Increase) in deposits with counterparty | (62,109 | ) | ||
(Increase) in receivable for investments sold | (41,842 | ) | ||
(Increase) in interest and dividends receivable | (181 | ) | ||
Increase in payable for investments purchased | 52,029 | |||
Increase in accrued investment advisory fees | 103 | |||
Increase in accrued supervisory and administrative fees | 53 | |||
Increase in accrued distribution fee | 5 | |||
Increase in accrued servicing fee | 5 | |||
Increase in reimbursement to PIMCO | 12 | |||
Payments on currency transactions | (93 | ) | ||
Proceeds from short sales transactions, net | 88,001 | |||
Increase in other liabilities | 70 | |||
Net change in unrealized (appreciation) on investments | (14,576 | ) | ||
Net change in unrealized (appreciation) on Affiliate investments | (8 | ) | ||
Net change in unrealized (appreciation) on short sales | (7,182 | ) | ||
Net change in unrealized depreciation on translation of assets and liabilities in foreign currencies | 66 | |||
Net realized (gain) on investments, short sales and foreign currency transactions | (13,381 | ) | ||
Net cash used for operating activities | (134,947 | ) | ||
Cash flows received from financing activities: | ||||
Proceeds from shares sold | 163,752 | |||
Payment on shares redeemed | (28,803 | ) | ||
Cash dividend paid* | 0 | |||
Net cash received from financing activities | 134,949 | |||
Net Increase in Cash and Foreign Currency | 2 | |||
Cash and Foreign Currency: | ||||
Beginning of year | 1 | |||
End of year | $ | 3 | ||
* Reinvestment of dividends | $ | 1,057 | ||
Supplemental disclosure of cash flow information: | ||||
Interest expense paid during the year | $ | 612 | ||
| 42 | PIMCO EQUITY SERIES | See Accompanying Notes |
Table of Contents
Schedule of Investments PIMCO Dividend and Income Builder Fund
June 30, 2013
| PRINCIPAL AMOUNT (000S) | MARKET VALUE (000S) | |||||||||||
| ASSET-BACKED SECURITIES 0.1% | ||||||||||||
| UNITED STATES 0.1% | ||||||||||||
Credit Suisse First Boston Mortgage Securities Corp. |
| |||||||||||
0.813% due 01/25/2032 | $ | 16 | $ | 15 | ||||||||
EMC Mortgage Loan Trust |
| |||||||||||
0.843% due 02/25/2041 | 76 | 69 | ||||||||||
JPMorgan Mortgage Acquisition Trust |
| |||||||||||
5.464% due 11/25/2036 | 200 | 181 | ||||||||||
Morgan Stanley Home Equity Loan Trust |
| |||||||||||
0.293% due 12/25/2036 | 223 | 119 | ||||||||||
|
| |||||||||||
Total Asset-Backed Securities (Cost $382) | 384 | |||||||||||
|
| |||||||||||
| SHARES | ||||||||||||
| COMMON STOCKS 81.3% | ||||||||||||
| AUSTRALIA 2.2% | ||||||||||||
| FINANCIALS 2.2% | ||||||||||||
Australia & New Zealand Banking Group Ltd. | 318,666 | 8,272 | ||||||||||
|
| |||||||||||
Total Australia | 8,272 | |||||||||||
|
| |||||||||||
| BERMUDA 0.4% | ||||||||||||
| ENERGY 0.4% | ||||||||||||
Golar LNG Partners LP | 43,161 | 1,472 | ||||||||||
|
| |||||||||||
Total Bermuda | 1,472 | |||||||||||
|
| |||||||||||
| BRAZIL 3.8% | ||||||||||||
| FINANCIALS 1.2% | ||||||||||||
BB Seguridade Participacoes S.A. (a) | 597,208 | 4,711 | ||||||||||
|
| |||||||||||
| INDUSTRIALS 0.8% | ||||||||||||
Arteris S.A. | 336,000 | 3,040 | ||||||||||
|
| |||||||||||
| UTILITIES 1.8% | ||||||||||||
Cia de Saneamento Basico do Estado de Sao Paulo SP - ADR | 663,377 | 6,906 | ||||||||||
|
| |||||||||||
Total Brazil | 14,657 | |||||||||||
|
| |||||||||||
| CANADA 1.8% | ||||||||||||
| CONSUMER DISCRETIONARY 1.8% | ||||||||||||
Aimia, Inc. | 448,890 | 6,718 | ||||||||||
|
| |||||||||||
Total Canada | 6,718 | |||||||||||
|
| |||||||||||
| CHINA 1.1% | ||||||||||||
| INDUSTRIALS 1.1% | ||||||||||||
Guangshen Railway Co. Ltd. ‘H’ | 3,526,000 | 1,428 | ||||||||||
Zhejiang Expressway Co. Ltd. ‘H’ | 3,624,000 | 2,951 | ||||||||||
|
| |||||||||||
Total China | 4,379 | |||||||||||
|
| |||||||||||
| CYPRUS 2.5% | ||||||||||||
| ENERGY 2.5% | ||||||||||||
ProSafe SE | 1,100,520 | 9,678 | ||||||||||
|
| |||||||||||
Total Cyprus | 9,678 | |||||||||||
|
| |||||||||||
| FRANCE 4.0% | ||||||||||||
| ENERGY 2.3% | ||||||||||||
Total S.A. | 182,889 | 8,933 | ||||||||||
|
| |||||||||||
| SHARES | MARKET VALUE (000S) | |||||||||||
| HEALTH CARE 1.7% | ||||||||||||
Sanofi | 62,412 | $ | 6,452 | |||||||||
|
| |||||||||||
Total France | 15,385 | |||||||||||
|
| |||||||||||
| HONG KONG 1.5% | ||||||||||||
| CONSUMER DISCRETIONARY 0.3% | ||||||||||||
Tianneng Power International Ltd. | 2,826,000 | 1,132 | ||||||||||
|
| |||||||||||
| INDUSTRIALS 0.8% | ||||||||||||
Yuexiu Transport Infrastructure Ltd. | 5,956,000 | 3,001 | ||||||||||
|
| |||||||||||
| TELECOMMUNICATION SERVICES 0.4% | ||||||||||||
SmarTone Telecommunications Holdings Ltd. | 892,500 | 1,464 | ||||||||||
|
| |||||||||||
Total Hong Kong | 5,597 | |||||||||||
|
| |||||||||||
| ITALY 1.2% | ||||||||||||
| INDUSTRIALS 1.2% | ||||||||||||
Societa Iniziative Autostradali e Servizi SpA | 574,068 | 4,685 | ||||||||||
|
| |||||||||||
Total Italy | 4,685 | |||||||||||
|
| |||||||||||
| JAPAN 3.6% | ||||||||||||
| CONSUMER STAPLES 1.2% | ||||||||||||
Japan Tobacco, Inc. | 127,900 | 4,514 | ||||||||||
|
| |||||||||||
| TELECOMMUNICATION SERVICES 2.4% | ||||||||||||
Nippon Telegraph & Telephone Corp. | 180,000 | 9,382 | ||||||||||
|
| |||||||||||
Total Japan | 13,896 | |||||||||||
|
| |||||||||||
| NETHERLANDS 2.3% | ||||||||||||
| ENERGY 2.3% | ||||||||||||
Royal Dutch Shell PLC ‘A’ | 276,873 | 8,845 | ||||||||||
|
| |||||||||||
Total Netherlands | 8,845 | |||||||||||
|
| |||||||||||
| QATAR 0.8% | ||||||||||||
| UTILITIES 0.8% | ||||||||||||
Qatar Electricity & Water Co. | 68,761 | 2,967 | ||||||||||
|
| |||||||||||
Total Qatar | 2,967 | |||||||||||
|
| |||||||||||
| SOUTH AFRICA 3.5% | ||||||||||||
| CONSUMER DISCRETIONARY 0.9% | ||||||||||||
Imperial Holdings Ltd. | 153,410 | 3,257 | ||||||||||
|
| |||||||||||
| HEALTH CARE 0.9% | ||||||||||||
Life Healthcare Group Holdings Ltd. | 898,418 | 3,408 | ||||||||||
|
| |||||||||||
| TELECOMMUNICATION SERVICES 1.7% | ||||||||||||
MTN Group Ltd. | 353,583 | 6,576 | ||||||||||
|
| |||||||||||
Total South Africa | 13,241 | |||||||||||
|
| |||||||||||
| SPAIN 2.5% | ||||||||||||
| UTILITIES 2.5% | ||||||||||||
Enagas S.A. | 387,050 | 9,566 | ||||||||||
|
| |||||||||||
Total Spain | 9,566 | |||||||||||
|
| |||||||||||
| SHARES | MARKET VALUE (000S) | |||||||||||
| SWITZERLAND 3.3% | ||||||||||||
| HEALTH CARE 3.3% | ||||||||||||
Novartis AG | 84,930 | $ | 6,016 | |||||||||
Roche Holding AG | 26,996 | 6,700 | ||||||||||
|
| |||||||||||
Total Switzerland | 12,716 | |||||||||||
|
| |||||||||||
| THAILAND 0.4% | ||||||||||||
| INDUSTRIALS 0.4% | ||||||||||||
Bangkok Expressway PCL | 1,242,900 | 1,427 | ||||||||||
|
| |||||||||||
Total Thailand | 1,427 | |||||||||||
|
| |||||||||||
| TURKEY 0.8% | ||||||||||||
| INDUSTRIALS 0.8% | ||||||||||||
TAV Havalimanlari Holding A/S | 512,384 | 2,997 | ||||||||||
|
| |||||||||||
Total Turkey | 2,997 | |||||||||||
|
| |||||||||||
| UNITED KINGDOM 8.0% | ||||||||||||
| CONSUMER DISCRETIONARY 1.0% | ||||||||||||
Marks & Spencer Group PLC | 585,432 | 3,831 | ||||||||||
|
| |||||||||||
| CONSUMER STAPLES 1.2% | ||||||||||||
Imperial Tobacco Group PLC | 136,356 | 4,728 | ||||||||||
|
| |||||||||||
| FINANCIALS 3.7% | ||||||||||||
HSBC Holdings PLC | 705,032 | 7,299 | ||||||||||
IG Group Holdings PLC | 334,145 | 2,951 | ||||||||||
Intermediate Capital Group PLC | 573,863 | 3,795 | ||||||||||
|
| |||||||||||
| 14,045 | ||||||||||||
|
| |||||||||||
| TELECOMMUNICATION SERVICES 2.1% | ||||||||||||
BT Group PLC | 940,744 | 4,416 | ||||||||||
Inmarsat PLC | 370,374 | 3,793 | ||||||||||
|
| |||||||||||
| 8,209 | ||||||||||||
|
| |||||||||||
Total United Kingdom | 30,813 | |||||||||||
|
| |||||||||||
| UNITED STATES 37.6% | ||||||||||||
| CONSUMER DISCRETIONARY 5.2% | ||||||||||||
Foot Locker, Inc. | 45,995 | 1,615 | ||||||||||
General Motors Co. (a) | 101,752 | 3,389 | ||||||||||
Kohl’s Corp. | 253,182 | 12,788 | ||||||||||
Staples, Inc. | 140,121 | 2,234 | ||||||||||
|
| |||||||||||
| 20,026 | ||||||||||||
|
| |||||||||||
| CONSUMER STAPLES 3.2% | ||||||||||||
Walgreen Co. | 277,964 | 12,286 | ||||||||||
|
| |||||||||||
| ENERGY 2.2% | ||||||||||||
Marathon Petroleum Corp. | 87,835 | 6,242 | ||||||||||
MPLX LP | 56,814 | 2,091 | ||||||||||
|
| |||||||||||
| 8,333 | ||||||||||||
|
| |||||||||||
| FINANCIALS 12.8% | ||||||||||||
Apollo Investment Corp. | 159,249 | 1,233 | ||||||||||
Blackstone Group LP | 66,077 | 1,392 | ||||||||||
Capitol Federal Financial, Inc. | 138,308 | 1,698 | ||||||||||
| See Accompanying Notes | ANNUAL REPORT | JUNE 30, 2013 | 43 |
Table of Contents
Schedule of Investments PIMCO Dividend and Income Builder Fund (Cont.)
| SHARES | MARKET VALUE (000S) | |||||||||||
JPMorgan Chase & Co. | 247,200 | $ | 13,050 | |||||||||
KeyCorp | 1,199,680 | 13,244 | ||||||||||
Northwest Bancshares, Inc. | 22,167 | 298 | ||||||||||
Prudential Financial, Inc. | 93,509 | 6,829 | ||||||||||
Solar Capital Ltd. | 282,738 | 6,528 | ||||||||||
Solar Senior Capital Ltd. | 233,332 | 4,296 | ||||||||||
Washington Federal, Inc. | 16,403 | 308 | ||||||||||
|
| |||||||||||
| 48,876 | ||||||||||||
|
| |||||||||||
| HEALTH CARE 4.7% | ||||||||||||
Medtronic, Inc. | 122,507 | 6,306 | ||||||||||
Merck & Co., Inc. | 127,756 | 5,934 | ||||||||||
Pfizer, Inc. | 209,493 | 5,868 | ||||||||||
|
| |||||||||||
| 18,108 | ||||||||||||
|
| |||||||||||
| INDUSTRIALS 1.1% | ||||||||||||
Lockheed Martin Corp. | 40,885 | 4,434 | ||||||||||
|
| |||||||||||
| INFORMATION TECHNOLOGY 8.4% | ||||||||||||
Cisco Systems, Inc. | 506,161 | 12,305 | ||||||||||
Intel Corp. | 331,036 | 8,017 | ||||||||||
Microsoft Corp. | 338,134 | 11,676 | ||||||||||
|
| |||||||||||
| 31,998 | ||||||||||||
|
| |||||||||||
Total United States | 144,061 | |||||||||||
|
| |||||||||||
Total Common Stocks (Cost $302,737) | 311,372 | |||||||||||
|
| |||||||||||
| PRINCIPAL AMOUNT (000S) | ||||||||||||
| CORPORATE BONDS & NOTES 6.0% | ||||||||||||
| AUSTRALIA 0.1% | ||||||||||||
| INDUSTRIALS 0.1% | ||||||||||||
Asciano Finance Ltd. |
| |||||||||||
5.000% due 04/07/2018 | $ | 100 | 106 | |||||||||
FMG Resources Pty. Ltd. |
| |||||||||||
7.000% due 11/01/2015 | 100 | 102 | ||||||||||
6.375% due 02/01/2016 | 100 | 100 | ||||||||||
|
| |||||||||||
Total Australia | 308 | |||||||||||
|
| |||||||||||
| AUSTRIA 0.0% | ||||||||||||
| INDUSTRIALS 0.0% | ||||||||||||
OGX Austria GmbH |
| |||||||||||
8.500% due 06/01/2018 | 200 | 65 | ||||||||||
8.375% due 04/01/2022 | 200 | 60 | ||||||||||
|
| |||||||||||
Total Austria | 125 | |||||||||||
|
| |||||||||||
| BRAZIL 0.1% | ||||||||||||
| INDUSTRIALS 0.1% | ||||||||||||
Braskem America Finance Co. |
| |||||||||||
7.125% due 07/22/2041 | 200 | 190 | ||||||||||
Braskem Finance Ltd. |
| |||||||||||
7.000% due 05/07/2020 | 100 | 107 | ||||||||||
|
| |||||||||||
Total Brazil | 297 | |||||||||||
|
| |||||||||||
| CAYMAN ISLANDS 0.1% | ||||||||||||
| BANKING & FINANCE 0.1% | ||||||||||||
IPIC GMTN Ltd. |
| |||||||||||
5.000% due 11/15/2020 | 250 | 268 | ||||||||||
|
| |||||||||||
| PRINCIPAL AMOUNT (000S) | MARKET VALUE (000S) | |||||||||||
| UTILITIES 0.0% | ||||||||||||
Odebrecht Drilling Norbe Ltd. |
| |||||||||||
6.350% due 06/30/2021 | $ | 95 | $ | 96 | ||||||||
|
| |||||||||||
Total Cayman Islands | 364 | |||||||||||
|
| |||||||||||
| FRANCE 0.3% | ||||||||||||
| BANKING & FINANCE 0.2% | ||||||||||||
AXA S.A. |
| |||||||||||
5.125% due 07/04/2043 | EUR | 100 | 129 | |||||||||
Banque PSA Finance S.A. |
| |||||||||||
2.182% due 04/04/2014 | $ | 250 | 248 | |||||||||
BPCE S.A. |
| |||||||||||
12.500% due 12/31/2049 | 100 | 122 | ||||||||||
CNP Assurances |
| |||||||||||
6.875% due 09/30/2041 | EUR | 100 | 138 | |||||||||
RCI Banque S.A. |
| |||||||||||
4.600% due 04/12/2016 | $ | 100 | 104 | |||||||||
3.500% due 04/03/2018 | 200 | 199 | ||||||||||
|
| |||||||||||
| 940 | ||||||||||||
|
| |||||||||||
| INDUSTRIALS 0.1% | ||||||||||||
Europcar Groupe S.A. | ||||||||||||
11.500% due 05/15/2017 | EUR | 200 | 290 | |||||||||
|
| |||||||||||
Total France | 1,230 | |||||||||||
|
| |||||||||||
| GERMANY 0.1% | ||||||||||||
| INDUSTRIALS 0.1% | ||||||||||||
KP Germany Erste GmbH |
| |||||||||||
11.625% due 07/15/2017 | 100 | 144 | ||||||||||
Orion Engineered Carbons Bondco GmbH |
| |||||||||||
10.000% due 06/15/2018 | 90 | 129 | ||||||||||
|
| |||||||||||
Total Germany | 273 | |||||||||||
|
| |||||||||||
| IRELAND 0.2% | ||||||||||||
| INDUSTRIALS 0.1% | ||||||||||||
Nara Cable Funding Ltd. |
| |||||||||||
8.875% due 12/01/2018 | 200 | 273 | ||||||||||
Russian Railways via RZD Capital PLC |
| |||||||||||
5.739% due 04/03/2017 | $ | 100 | 106 | |||||||||
|
| |||||||||||
| 379 | ||||||||||||
|
| |||||||||||
| UTILITIES 0.1% | ||||||||||||
AK Transneft OJSC Via TransCapitalInvest Ltd. |
| |||||||||||
8.700% due 08/07/2018 | 100 | 118 | ||||||||||
Novatek OAO via Novatek Finance Ltd. |
| |||||||||||
5.326% due 02/03/2016 | 300 | 316 | ||||||||||
|
| |||||||||||
| 434 | ||||||||||||
|
| |||||||||||
Total Ireland | 813 | |||||||||||
|
| |||||||||||
| ITALY 0.1% | ||||||||||||
| BANKING & FINANCE 0.1% | ||||||||||||
Intesa Sanpaolo SpA |
| |||||||||||
6.500% due 02/24/2021 | 200 | 202 | ||||||||||
3.125% due 01/15/2016 | 100 | 98 | ||||||||||
|
| |||||||||||
Total Italy | 300 | |||||||||||
|
| |||||||||||
| JAPAN 0.1% | ||||||||||||
| UTILITIES 0.1% | ||||||||||||
Tokyo Electric Power Co., Inc. |
| |||||||||||
4.500% due 03/24/2014 | EUR | 200 | 263 | |||||||||
|
| |||||||||||
Total Japan | 263 | |||||||||||
|
| |||||||||||
| PRINCIPAL AMOUNT (000S) | MARKET VALUE (000S) | |||||||||||
| LUXEMBOURG 0.7% | ||||||||||||
| BANKING & FINANCE 0.2% | ||||||||||||
Fiat Finance & Trade S.A. |
| |||||||||||
7.625% due 09/15/2014 | EUR | 100 | $ | 137 | ||||||||
Sberbank of Russia Via SB Capital S.A. |
| |||||||||||
6.125% due 02/07/2022 | $ | 200 | 209 | |||||||||
VTB Bank OJSC Via VTB Capital S.A. |
| |||||||||||
6.875% due 05/29/2018 | 200 | 213 | ||||||||||
|
| |||||||||||
| 559 | ||||||||||||
|
| |||||||||||
| INDUSTRIALS 0.4% | ||||||||||||
ArcelorMittal |
| |||||||||||
6.000% due 03/01/2021 | 100 | 100 | ||||||||||
7.500% due 10/15/2039 | 200 | 192 | ||||||||||
Finmeccanica Finance S.A. |
| |||||||||||
8.000% due 12/16/2019 | GBP | 100 | 167 | |||||||||
Geo Debt Finance S.C.A. |
| |||||||||||
7.500% due 08/01/2018 | EUR | 100 | 130 | |||||||||
INEOS Group Holdings S.A. |
| |||||||||||
7.875% due 02/15/2016 | 135 | 176 | ||||||||||
OXEA Finance & Cy S.C.A. |
| |||||||||||
9.625% due 07/15/2017 | 86 | 120 | ||||||||||
Wind Acquisition Finance S.A. |
| |||||||||||
7.250% due 02/15/2018 | $ | 400 | 405 | |||||||||
7.375% due 02/15/2018 | EUR | 100 | 131 | |||||||||
11.750% due 07/15/2017 | 100 | 136 | ||||||||||
|
| |||||||||||
| 1,557 | ||||||||||||
|
| |||||||||||
| UTILITIES 0.1% | ||||||||||||
Gazprom OAO Via Gaz Capital S.A. |
| |||||||||||
6.510% due 03/07/2022 | $ | 200 | 213 | |||||||||
Telecom Italia Capital S.A. |
| |||||||||||
7.721% due 06/04/2038 | 300 | 306 | ||||||||||
|
| |||||||||||
| 519 | ||||||||||||
|
| |||||||||||
Total Luxembourg | 2,635 | |||||||||||
|
| |||||||||||
| MEXICO 0.2% | ||||||||||||
| INDUSTRIALS 0.2% | ||||||||||||
America Movil S.A.B. de C.V. |
| |||||||||||
9.000% due 01/15/2016 | MXN | 3,400 | 284 | |||||||||
6.125% due 03/30/2040 | $ | 200 | 219 | |||||||||
8.460% due 12/18/2036 | MXN | 1,000 | 77 | |||||||||
Corp. GEO S.A.B. de C.V. |
| |||||||||||
8.875% due 03/27/2022 ^ | $ | 300 | 135 | |||||||||
9.250% due 06/30/2020 ^ | 100 | 45 | ||||||||||
Desarrolladora Homex S.A.B. de C.V. |
| |||||||||||
7.500% due 09/28/2015 | 300 | 105 | ||||||||||
9.500% due 12/11/2019 | 100 | 35 | ||||||||||
|
| |||||||||||
Total Mexico | 900 | |||||||||||
|
| |||||||||||
| NETHERLANDS 0.3% | ||||||||||||
| BANKING & FINANCE 0.1% | ||||||||||||
GMAC International Finance BV |
| |||||||||||
7.500% due 04/21/2015 | EUR | 100 | 139 | |||||||||
Rabobank Group |
| |||||||||||
6.875% due 03/19/2020 | 100 | 141 | ||||||||||
|
| |||||||||||
| 280 | ||||||||||||
|
| |||||||||||
| INDUSTRIALS 0.1% | ||||||||||||
Schaeffler Finance BV |
| |||||||||||
7.750% due 02/15/2017 | $ | 100 | 111 | |||||||||
| 44 | PIMCO EQUITY SERIES | See Accompanying Notes |
Table of Contents
June 30, 2013
| PRINCIPAL AMOUNT (000S) | MARKET VALUE (000S) | |||||||||||
UPC Holding BV |
| |||||||||||
9.875% due 04/15/2018 | $ | 100 | $ | 109 | ||||||||
|
| |||||||||||
| 220 | ||||||||||||
|
| |||||||||||
| UTILITIES 0.1% | ||||||||||||
Enel Finance International NV |
| |||||||||||
6.800% due 09/15/2037 | 200 | 201 | ||||||||||
Koninklijke KPN NV |
| |||||||||||
6.125% due 09/14/2018 (c) | EUR | 300 | 385 | |||||||||
|
| |||||||||||
| 586 | ||||||||||||
|
| |||||||||||
Total Netherlands | 1,086 | |||||||||||
|
| |||||||||||
| NORWAY 0.1% | ||||||||||||
| BANKING & FINANCE 0.1% | ||||||||||||
Eksportfinans ASA |
| |||||||||||
1.600% due 03/20/2014 | JPY | 10,000 | 100 | |||||||||
3.000% due 11/17/2014 | $ | 135 | 135 | |||||||||
|
| |||||||||||
Total Norway | 235 | |||||||||||
|
| |||||||||||
| QATAR 0.1% | ||||||||||||
| INDUSTRIALS 0.0% | ||||||||||||
Nakilat, Inc. |
| |||||||||||
6.067% due 12/31/2033 | 200 | 226 | ||||||||||
|
| |||||||||||
| UTILITIES 0.1% | ||||||||||||
Ras Laffan Liquefied Natural Gas Co. Ltd. |
| |||||||||||
6.332% due 09/30/2027 | 250 | 294 | ||||||||||
|
| |||||||||||
Total Qatar | 520 | |||||||||||
|
| |||||||||||
| SOUTH AFRICA 0.0% | ||||||||||||
| INDUSTRIALS 0.0% | ||||||||||||
AngloGold Ashanti Holdings PLC |
| |||||||||||
6.500% due 04/15/2040 | 200 | 166 | ||||||||||
|
| |||||||||||
Total South Africa | 166 | |||||||||||
|
| |||||||||||
| SPAIN 0.2% | ||||||||||||
| BANKING & FINANCE 0.1% | ||||||||||||
Bankia S.A. |
| |||||||||||
0.407% due 01/25/2016 | EUR | 300 | 352 | |||||||||
BBVA U.S. Senior S.A.U. |
| |||||||||||
4.664% due 10/09/2015 | $ | 300 | 309 | |||||||||
|
| |||||||||||
| 661 | ||||||||||||
|
| |||||||||||
| INDUSTRIALS 0.1% | ||||||||||||
Obrascon Huarte Lain S.A. |
| |||||||||||
8.750% due 03/15/2018 | EUR | 200 | 280 | |||||||||
|
| |||||||||||
Total Spain | 941 | |||||||||||
|
| |||||||||||
| UNITED ARAB EMIRATES 0.1% | ||||||||||||
| INDUSTRIALS 0.1% | ||||||||||||
Dolphin Energy Ltd. |
| |||||||||||
5.888% due 06/15/2019 | $ | 71 | 78 | |||||||||
5.500% due 12/15/2021 | 200 | 216 | ||||||||||
|
| |||||||||||
Total United Arab Emirates | 294 | |||||||||||
|
| |||||||||||
| UNITED KINGDOM 1.0% | ||||||||||||
| BANKING & FINANCE 0.5% | ||||||||||||
Barclays Bank PLC |
| |||||||||||
14.000% due 06/15/2019 (c) | GBP | 300 | 598 | |||||||||
| PRINCIPAL AMOUNT (000S) | MARKET VALUE (000S) | |||||||||||
LBG Capital PLC |
| |||||||||||
15.000% due 12/21/2019 | GBP | 300 | $ | 636 | ||||||||
7.869% due 08/25/2020 | 100 | 155 | ||||||||||
Royal Bank of Scotland PLC |
| |||||||||||
6.934% due 04/09/2018 | EUR | 200 | 273 | |||||||||
Virgin Media Secured Finance PLC |
| |||||||||||
5.500% due 01/15/2021 | GBP | 200 | 298 | |||||||||
|
| |||||||||||
| 1,960 | ||||||||||||
|
| |||||||||||
| INDUSTRIALS 0.5% | ||||||||||||
Algeco Scotsman Global Finance PLC |
| |||||||||||
8.500% due 10/15/2018 | $ | 400 | 400 | |||||||||
DFS Furniture Holdings PLC |
| |||||||||||
7.625% due 08/15/2018 | GBP | 200 | 316 | |||||||||
Enterprise Inns PLC |
| |||||||||||
6.875% due 02/15/2021 | 200 | 290 | ||||||||||
Greene King Finance PLC |
| |||||||||||
5.106% due 03/15/2034 | 100 | 152 | ||||||||||
Priory Group PLC |
| |||||||||||
8.875% due 02/15/2019 | 200 | 301 | ||||||||||
Spirit Issuer PLC |
| |||||||||||
6.582% due 12/28/2027 | 200 | 302 | ||||||||||
|
| |||||||||||
| 1,761 | ||||||||||||
|
| |||||||||||
Total United Kingdom | 3,721 | |||||||||||
|
| |||||||||||
| UNITED STATES 1.9% | ||||||||||||
| BANKING & FINANCE 0.6% | ||||||||||||
American International Group, Inc. |
| |||||||||||
6.765% due 11/15/2017 | 100 | 178 | ||||||||||
Bank of America Corp. |
| |||||||||||
6.000% due 09/01/2017 | $ | 100 | 112 | |||||||||
Cantor Fitzgerald LP |
| |||||||||||
7.875% due 10/15/2019 | 300 | 311 | ||||||||||
Goldman Sachs Group, Inc. |
| |||||||||||
5.250% due 07/27/2021 | 300 | 321 | ||||||||||
Merrill Lynch & Co., Inc. |
| |||||||||||
7.750% due 04/30/2018 | GBP | 100 | 184 | |||||||||
Morgan Stanley |
| |||||||||||
6.250% due 08/28/2017 | $ | 100 | 112 | |||||||||
7.300% due 05/13/2019 | 100 | 116 | ||||||||||
SLM Corp. |
| |||||||||||
6.250% due 01/25/2016 | 200 | 213 | ||||||||||
Springleaf Finance Corp. |
| |||||||||||
5.400% due 12/01/2015 | 500 | 501 | ||||||||||
6.900% due 12/15/2017 | 200 | 197 | ||||||||||
|
| |||||||||||
| 2,245 | ||||||||||||
|
| |||||||||||
| INDUSTRIALS 0.9% | ||||||||||||
Aleris International, Inc. |
| |||||||||||
7.625% due 02/15/2018 | 300 | 314 | ||||||||||
Altria Group, Inc. |
| |||||||||||
10.200% due 02/06/2039 | 200 | 302 | ||||||||||
Brocade Communications Systems, Inc. |
| |||||||||||
6.875% due 01/15/2020 | 300 | 322 | ||||||||||
CONSOL Energy, Inc. |
| |||||||||||
8.000% due 04/01/2017 | 100 | 106 | ||||||||||
Crown Castle Towers LLC |
| |||||||||||
6.113% due 01/15/2020 | 100 | 115 | ||||||||||
CVS Pass-Through Trust |
| |||||||||||
8.353% due 07/10/2031 | 93 | 119 | ||||||||||
Dell, Inc. |
| |||||||||||
5.650% due 04/15/2018 | 100 | 101 | ||||||||||
Delta Air Lines Pass-Through Trust |
| |||||||||||
4.750% due 11/07/2021 | 96 | 101 | ||||||||||
| PRINCIPAL AMOUNT (000S) | MARKET VALUE (000S) | |||||||||||
HCA, Inc. |
| |||||||||||
6.500% due 02/15/2020 | $ | 100 | $ | 108 | ||||||||
HD Supply, Inc. |
| |||||||||||
8.125% due 04/15/2019 | 100 | 110 | ||||||||||
Hexion U.S. Finance Corp. |
| |||||||||||
8.875% due 02/01/2018 | 300 | 307 | ||||||||||
Midcontinent Express Pipeline LLC |
| |||||||||||
6.700% due 09/15/2019 | 500 | 516 | ||||||||||
Reynolds Group Issuer, Inc. |
| |||||||||||
8.500% due 05/15/2018 | 100 | 104 | ||||||||||
Rockies Express Pipeline LLC |
| |||||||||||
6.850% due 07/15/2018 | 100 | 96 | ||||||||||
5.625% due 04/15/2020 | 200 | 174 | ||||||||||
U.S. Airways Pass-Through Trust |
| |||||||||||
5.900% due 04/01/2026 | 100 | 105 | ||||||||||
Vector Group Ltd. |
| |||||||||||
7.750% due 02/15/2021 | 300 | 311 | ||||||||||
Warner Chilcott Co. LLC |
| |||||||||||
7.750% due 09/15/2018 | 100 | 108 | ||||||||||
|
| |||||||||||
| 3,419 | ||||||||||||
|
| |||||||||||
| UTILITIES 0.4% | ||||||||||||
FirstEnergy Solutions Corp. |
| |||||||||||
6.800% due 08/15/2039 | 300 | 336 | ||||||||||
MetroPCS Wireless, Inc. |
| |||||||||||
6.250% due 04/01/2021 | 150 | 153 | ||||||||||
NGPL PipeCo LLC |
| |||||||||||
7.119% due 12/15/2017 | 100 | 98 | ||||||||||
9.625% due 06/01/2019 | 500 | 520 | ||||||||||
NRG Energy, Inc. |
| |||||||||||
7.875% due 05/15/2021 | 100 | 107 | ||||||||||
7.625% due 01/15/2018 | 100 | 107 | ||||||||||
Penn Virginia Corp. |
| |||||||||||
8.500% due 05/01/2020 | 300 | 292 | ||||||||||
|
| |||||||||||
| 1,613 | ||||||||||||
|
| |||||||||||
Total United States | 7,277 | |||||||||||
|
| |||||||||||
| VENEZUELA 0.1% | ||||||||||||
| INDUSTRIALS 0.1% | ||||||||||||
Petroleos de Venezuela S.A. |
| |||||||||||
8.500% due 11/02/2017 | 600 | 551 | ||||||||||
|
| |||||||||||
Total Venezuela | 551 | |||||||||||
|
| |||||||||||
| VIRGIN ISLANDS (BRITISH) 0.2% | ||||||||||||
| INDUSTRIALS 0.1% | ||||||||||||
Gold Fields Orogen Holding BVI Ltd. |
| |||||||||||
4.875% due 10/07/2020 | 400 | 338 | ||||||||||
|
| |||||||||||
| UTILITIES 0.1% | ||||||||||||
TNK-BP Finance S.A. |
| |||||||||||
7.875% due 03/13/2018 | 200 | 229 | ||||||||||
|
| |||||||||||
Total Virgin Islands (British) | 567 | |||||||||||
|
| |||||||||||
Total Corporate Bonds & Notes | 22,866 | |||||||||||
|
| |||||||||||
| UNITS | ||||||||||||
| EQUITY-LINKED SECURITIES 1.0% | ||||||||||||
| SAUDI ARABIA 1.0% | ||||||||||||
| CONSUMER DISCRETIONARY 0.2% | ||||||||||||
Merrill Lynch International & Co. Saudi Airlines Catering Co. - | 20,228 | 647 | ||||||||||
|
| |||||||||||
| See Accompanying Notes | ANNUAL REPORT | JUNE 30, 2013 | 45 |
Table of Contents
Schedule of Investments PIMCO Dividend and Income Builder Fund (Cont.)
| UNITS | MARKET VALUE (000S) | |||||||||||
| CONSUMER STAPLES 0.8% | ||||||||||||
HSBC Bank PLC | 142,699 | $ | 3,025 | |||||||||
|
| |||||||||||
Total Equity-Linked Securities | 3,672 | |||||||||||
|
| |||||||||||
| PRINCIPAL AMOUNT (000S) | ||||||||||||
| MORTGAGE-BACKED SECURITIES 1.5% | ||||||||||||
| UNITED STATES 1.5% | ||||||||||||
American Home Mortgage Assets Trust |
| |||||||||||
6.250% due 06/25/2037 | $ | 220 | 145 | |||||||||
Banc of America Alternative Loan Trust |
| |||||||||||
6.000% due 04/25/2036 | 123 | 110 | ||||||||||
6.000% due 06/25/2046 | 71 | 58 | ||||||||||
6.000% due 07/25/2046 | 259 | 211 | ||||||||||
Banc of America Funding Corp. |
| |||||||||||
5.419% due 05/20/2036 | 69 | 66 | ||||||||||
Banc of America Mortgage Trust |
| |||||||||||
5.662% due 11/20/2046 | 41 | 37 | ||||||||||
6.000% due 10/25/2036 ^ | 82 | 72 | ||||||||||
Bear Stearns Alt-A Trust |
| |||||||||||
2.943% due 05/25/2036 | 256 | 142 | ||||||||||
5.246% due 09/25/2035 | 194 | 153 | ||||||||||
Chase Mortgage Finance Trust |
| |||||||||||
3.037% due 09/25/2036 | 139 | 117 | ||||||||||
Citigroup Mortgage Loan Trust, Inc. |
| |||||||||||
2.833% due 07/25/2046 ^ | 33 | 25 | ||||||||||
CitiMortgage Alternative Loan Trust |
| |||||||||||
6.000% due 01/25/2037 | 184 | 157 | ||||||||||
Countrywide Alternative Loan Trust |
| |||||||||||
6.000% due 03/25/2036 | 70 | 56 | ||||||||||
6.000% due 05/25/2036 | 62 | 48 | ||||||||||
6.000% due 02/25/2037 ^ | 291 | 219 | ||||||||||
6.000% due 03/25/2037 ^ | 95 | 75 | ||||||||||
6.000% due 05/25/2037 ^ | 28 | 22 | ||||||||||
6.000% due 06/25/2037 ^ | 970 | 798 | ||||||||||
6.250% due 12/25/2036 ^ | 59 | 47 | ||||||||||
6.500% due 11/25/2037 | 55 | 46 | ||||||||||
Countrywide Home Loan Mortgage Pass-Through Trust |
| |||||||||||
0.693% due 07/25/2037 ^ | 76 | 50 | ||||||||||
5.180% due 09/25/2037 | 178 | 152 | ||||||||||
Credit Suisse First Boston Mortgage Securities Corp. |
| |||||||||||
6.000% due 11/25/2035 ^ | 32 | 22 | ||||||||||
6.000% due 01/25/2036 | 95 | 73 | ||||||||||
CSMC Mortgage-Backed Trust |
| |||||||||||
5.000% due 03/25/2037 | 9 | 8 | ||||||||||
6.500% due 10/25/2021 | 202 | 172 | ||||||||||
6.750% due 08/25/2036 ^ | 38 | 28 | ||||||||||
Deutsche ALT-A Securities, Inc. |
| |||||||||||
0.393% due 02/25/2047 | 36 | 28 | ||||||||||
First Horizon Alternative Mortgage Securities |
| |||||||||||
2.319% due 06/25/2036 | 940 | 721 | ||||||||||
Harborview Mortgage Loan Trust |
| |||||||||||
0.532% due 06/20/2035 | 6 | 5 | ||||||||||
5.366% due 06/19/2036 ^ | 39 | 28 | ||||||||||
IndyMac Mortgage Loan Trust |
| |||||||||||
2.501% due 06/25/2037 | 312 | 159 | ||||||||||
4.722% due 05/25/2037 | 226 | 155 | ||||||||||
4.784% due 08/25/2035 | 155 | 125 | ||||||||||
JPMorgan Alternative Loan Trust |
| |||||||||||
5.613% due 05/26/2037 | 161 | 131 | ||||||||||
JPMorgan Mortgage Trust |
| |||||||||||
6.500% due 07/25/2036 | 165 | 146 | ||||||||||
Merrill Lynch Mortgage Investors Trust |
| |||||||||||
2.590% due 02/25/2036 | 19 | 18 | ||||||||||
| PRINCIPAL AMOUNT (000S) | MARKET VALUE (000S) | |||||||||||
3.006% due 03/25/2036 ^ | $ | 29 | $ | 20 | ||||||||
Morgan Stanley Mortgage Loan Trust |
| |||||||||||
2.579% due 06/25/2037 | 934 | 520 | ||||||||||
6.000% due 10/25/2037 ^ | 116 | 90 | ||||||||||
RBSSP Resecuritization Trust |
| |||||||||||
9.445% due 06/26/2037 | 300 | 183 | ||||||||||
Residential Accredit Loans, Inc. Trust |
| |||||||||||
0.593% due 10/25/2045 | 217 | 158 | ||||||||||
6.000% due 08/25/2036 | 81 | 64 | ||||||||||
6.000% due 08/25/2036 ^ | 188 | 147 | ||||||||||
6.250% due 03/25/2037 ^ | 95 | 66 | ||||||||||
Residential Funding Mortgage Securities, Inc. Trust |
| |||||||||||
6.000% due 10/25/2036 | 30 | 27 | ||||||||||
|
| |||||||||||
Total Mortgage-Backed Securities | 5,900 | |||||||||||
|
| |||||||||||
| MUNICIPAL BONDS & NOTES 0.2% | ||||||||||||
| MICHIGAN 0.0% | ||||||||||||
Michigan Tobacco Settlement Finance Authority Revenue Bonds, Series 2006 |
| |||||||||||
7.309% due 06/01/2034 | 95 | 82 | ||||||||||
|
| |||||||||||
Total Michigan | 82 | |||||||||||
|
| |||||||||||
| VIRGINIA 0.1% | ||||||||||||
Tobacco Settlement Financing Corp., Virginia Revenue Bonds, Series 2007 |
| |||||||||||
6.706% due 06/01/2046 | 390 | 294 | ||||||||||
|
| |||||||||||
Total Virginia | 294 | |||||||||||
|
| |||||||||||
| WEST VIRGINIA 0.1% | ||||||||||||
Tobacco Settlement Finance Authority, West Virginia Revenue Bonds, Series 2007 |
| |||||||||||
7.467% due 06/01/2047 | 380 | 328 | ||||||||||
|
| |||||||||||
Total West Virginia | 328 | |||||||||||
|
| |||||||||||
Total Municipal Bonds & Notes | 704 | |||||||||||
|
| |||||||||||
| SHARES | ||||||||||||
| REAL ESTATE INVESTMENT TRUSTS 1.7% | ||||||||||||
| UNITED STATES 1.7% | ||||||||||||
Colony Financial, Inc. | 326,292 | 6,490 | ||||||||||
|
| |||||||||||
Total Real Estate Investment Trusts | 6,490 | |||||||||||
|
| |||||||||||
| PRINCIPAL AMOUNT (000S) | ||||||||||||
| SOVEREIGN ISSUES 1.1% | ||||||||||||
| AUSTRALIA 0.2% | ||||||||||||
New South Wales Treasury Corp. |
| |||||||||||
6.000% due 03/01/2022 | AUD | 600 | 614 | |||||||||
|
| |||||||||||
Total Australia | 614 | |||||||||||
|
| |||||||||||
| CANADA 0.3% | ||||||||||||
Province of Ontario |
| |||||||||||
3.150% due 06/02/2022 | CAD | 600 | 568 | |||||||||
Province of Quebec |
| |||||||||||
4.500% due 12/01/2018 | 250 | 262 | ||||||||||
4.500% due 12/01/2019 | 350 | 368 | ||||||||||
|
| |||||||||||
Total Canada | 1,198 | |||||||||||
|
| |||||||||||
| PRINCIPAL AMOUNT (000S) | MARKET VALUE (000S) | |||||||||||
| INDONESIA 0.0% | ||||||||||||
Indonesia Government International Bond |
| |||||||||||
8.250% due 06/15/2032 | IDR | 87,000 | $ | 9 | ||||||||
|
| |||||||||||
Total Indonesia | 9 | |||||||||||
|
| |||||||||||
| MEXICO 0.1% | ||||||||||||
Mexico Government International Bond |
| |||||||||||
6.000% due 06/18/2015 | MXN | 2,500 | 199 | |||||||||
7.250% due 12/15/2016 | 1,400 | 117 | ||||||||||
|
| |||||||||||
Total Mexico | 316 | |||||||||||
|
| |||||||||||
| SOUTH AFRICA 0.1% | ||||||||||||
South Africa Government International Bond |
| |||||||||||
8.000% due 12/21/2018 | ZAR | 5,000 | 527 | |||||||||
|
| |||||||||||
Total South Africa | 527 | |||||||||||
|
| |||||||||||
| SPAIN 0.3% | ||||||||||||
Autonomous Community of Catalonia |
| |||||||||||
3.875% due 04/07/2015 | EUR | 100 | 129 | |||||||||
4.750% due 06/04/2018 | 300 | 372 | ||||||||||
Autonomous Community of Madrid |
| |||||||||||
5.750% due 02/01/2018 | 100 | 137 | ||||||||||
Autonomous Community of Valencia |
| |||||||||||
3.250% due 07/06/2015 | 50 | 63 | ||||||||||
4.375% due 07/16/2015 | 200 | 260 | ||||||||||
Xunta de Galicia |
| |||||||||||
6.131% due 04/03/2018 | 200 | 278 | ||||||||||
|
| |||||||||||
Total Spain | 1,239 | |||||||||||
|
| |||||||||||
| VENEZUELA 0.1% | ||||||||||||
Venezuela Government International Bond |
| |||||||||||
7.650% due 04/21/2025 | $ | 100 | 75 | |||||||||
7.750% due 10/13/2019 | 200 | 167 | ||||||||||
|
| |||||||||||
Total Venezuela | 242 | |||||||||||
|
| |||||||||||
Total Sovereign Issues (Cost $4,446) | 4,145 | |||||||||||
|
| |||||||||||
| U.S. TREASURY OBLIGATIONS 0.2% | ||||||||||||
| UNITED STATES 0.2% | ||||||||||||
U.S. Treasury Notes |
| |||||||||||
0.250% due 03/31/2014 | 100 | 100 | ||||||||||
0.250% due 04/30/2014 (f) | 500 | 500 | ||||||||||
0.250% due 06/30/2014 | 100 | 100 | ||||||||||
0.750% due 06/15/2014 | 100 | 101 | ||||||||||
1.000% due 05/15/2014 | 100 | 101 | ||||||||||
|
| |||||||||||
Total U.S. Treasury Obligations | 902 | |||||||||||
|
| |||||||||||
| SHORT-TERM INSTRUMENTS 8.8% | ||||||||||||
| REPURCHASE AGREEMENTS (e) 1.1% | ||||||||||||
| 4,126 | ||||||||||||
|
| |||||||||||
| U.S. TREASURY BILLS 0.2% | ||||||||||||
0.123% due 05/01/2014 - 05/29/2014 (b)(g) | 620 | 619 | ||||||||||
|
| |||||||||||
| 46 | PIMCO EQUITY SERIES | See Accompanying Notes |
Table of Contents
June 30, 2013
| SHARES | MARKET VALUE (000S) | |||||||||||
| CENTRAL FUNDS USED FOR CASH MANAGEMENT PURPOSES (d) 7.5% | ||||||||||||
PIMCO Short-Term Floating NAV Portfolio | 2,871,639 | $ | 28,734 | |||||||||
|
| |||||||||||
Total Short-Term Instruments | 33,479 | |||||||||||
|
| |||||||||||
| Total Investments 101.9% (Cost $383,007) | $ | 389,914 | ||||||||||
| Other Assets and Liabilities (Net) (1.9%) | (7,108 | ) | ||||||||||
|
| |||||||||||
| Net Assets 100.0% | $ | 382,806 | ||||||||||
|
| |||||||||||
Notes to Schedule of Investments (amounts in thousands*, except number of contracts):
| ^ | Security is in default. |
| (a) | Security did not produce income within the last twelve months. |
| (b) | Coupon represents a weighted average yield to maturity. |
| (c) | Perpetual maturity, date shown represents next contractual call date. |
| (d) | Affiliated to the Fund. |
BORROWINGS AND OTHER FINANCING TRANSACTIONS
| (e) | Repurchase Agreements: |
| Counterparty | Lending Rate | Settlement Date | Maturity Date | Principal Amount | Collateralized By | Collateral (Received), At Value | Repurchase Agreements, At Value | Repurchase Proceeds (1) | ||||||||||||||||||||
BOA | 0.140% | 06/28/2013 | 07/01/2013 | $ | 900 | U.S. Treasury Bonds 2.750% due 08/15/2042 | $ | (939 | ) | $ | 900 | $ | 900 | |||||||||||||||
BRC | 0.180% | 06/28/2013 | 07/01/2013 | 800 | U.S. Treasury Inflation Protected Securities 0.625% due 07/15/2021 | (820 | ) | 800 | 800 | |||||||||||||||||||
SSB | 0.010% | 06/28/2013 | 07/01/2013 | 2,426 | Fannie Mae 2.200% due 10/17/2022 | (2,479 | ) | 2,426 | 2,426 | |||||||||||||||||||
|
|
|
|
|
| |||||||||||||||||||||||
| $ | (4,238 | ) | $ | 4,126 | $ | 4,126 | ||||||||||||||||||||||
|
|
|
|
|
| |||||||||||||||||||||||
| (1) | Includes accrued interest. |
EXCHANGE-TRADED OR CENTRALLY CLEARED FINANCIAL DERIVATIVE INSTRUMENTS
Futures Contracts:
| Description | Type | Expiration Month | # of Contracts | Unrealized Appreciation/ (Depreciation) | ||||||||||
British pound currency September Futures | Short | 09/2013 | 167 | $ | 171 | |||||||||
Euro currency September Futures | Long | 09/2013 | 15 | (62 | ) | |||||||||
Japanese yen currency September Futures | Long | 09/2013 | 41 | (236 | ) | |||||||||
|
| |||||||||||||
| $ | (127 | ) | ||||||||||||
|
| |||||||||||||
| (f) | Securities with an aggregate market value of $19 and cash of $345 have been pledged as collateral for exchange-traded and centrally cleared financial derivative instruments as of June 30, 2013. |
OTC FINANCIAL DERIVATIVE INSTRUMENTS
Foreign Currency Contracts:
| Settlement Month | Currency to be Delivered | Currency to be Received | Counterparty | Unrealized Appreciation | Unrealized (Depreciation) | Net Unrealized Appreciation/ (Depreciation) | ||||||||||||||||||||||||
07/2013 | BRL | 1,047 | $ | 466 | JPM | $ | 0 | $ | (3 | ) | $ | (3 | ) | |||||||||||||||||
07/2013 | 1,046 | 472 | MSC | 3 | 0 | 3 | ||||||||||||||||||||||||
07/2013 | CHF | 8,025 | 8,285 | MSC | 0 | (211 | ) | (211 | ) | |||||||||||||||||||||
07/2013 | EUR | 8,218 | 10,615 | MSC | 0 | (82 | ) | (82 | ) | |||||||||||||||||||||
07/2013 | GBP | 2,023 | 3,167 | BRC | 91 | 0 | 91 | |||||||||||||||||||||||
07/2013 | 7,011 | 10,629 | HUS | 0 | (35 | ) | (35 | ) | ||||||||||||||||||||||
07/2013 | JPY | 445,473 | 4,409 | BOA | 0 | (82 | ) | (82 | ) | |||||||||||||||||||||
07/2013 | NOK | 22,899 | 4,001 | BOA | 231 | 0 | 231 | |||||||||||||||||||||||
07/2013 | 29,336 | 5,025 | FBF | 195 | 0 | 195 | ||||||||||||||||||||||||
07/2013 | SGD | 203 | 160 | CBK | 0 | 0 | 0 | |||||||||||||||||||||||
| See Accompanying Notes | ANNUAL REPORT | JUNE 30, 2013 | 47 |
Table of Contents
Schedule of Investments PIMCO Dividend and Income Builder Fund (Cont.)
Foreign Currency Contracts: (Cont.)
| Settlement Month | Currency to be Delivered | Currency to be Received | Counterparty | Unrealized Appreciation | Unrealized (Depreciation) | Net Unrealized Appreciation/ (Depreciation) | ||||||||||||||||||||||||
07/2013 | THB | 2,791 | $ | 95 | HUS | $ | 5 | $ | 0 | $ | 5 | |||||||||||||||||||
07/2013 | TWD | 10,799 | 359 | DUB | 0 | (1 | ) | (1 | ) | |||||||||||||||||||||
07/2013 | $ | 473 | BRL | 1,047 | JPM | 0 | (3 | ) | (3 | ) | ||||||||||||||||||||
07/2013 | 466 | 1,046 | MSC | 3 | 0 | 3 | ||||||||||||||||||||||||
07/2013 | 7,411 | CHF | 6,805 | DUB | 0 | (206 | ) | (206 | ) | |||||||||||||||||||||
07/2013 | 1,298 | 1,220 | FBF | 0 | (7 | ) | (7 | ) | ||||||||||||||||||||||
07/2013 | 11,002 | EUR | 8,218 | DUB | 0 | (306 | ) | (306 | ) | |||||||||||||||||||||
07/2013 | 13,950 | GBP | 9,034 | GLM | 0 | (210 | ) | (210 | ) | |||||||||||||||||||||
07/2013 | 49 | HKD | 378 | DUB | 0 | 0 | 0 | |||||||||||||||||||||||
07/2013 | 4,411 | JPY | 445,473 | BOA | 81 | 0 | 81 | |||||||||||||||||||||||
07/2013 | 8,559 | NOK | 52,235 | UAG | 40 | 0 | 40 | |||||||||||||||||||||||
07/2013 | 160 | SGD | 203 | BOA | 0 | 0 | 0 | |||||||||||||||||||||||
07/2013 | 90 | THB | 2,791 | BRC | 0 | 0 | 0 | |||||||||||||||||||||||
07/2013 | 360 | TWD | 10,799 | FBF | 0 | 0 | 0 | |||||||||||||||||||||||
07/2013 | ZAR | 54,956 | $ | 6,026 | BOA | 490 | 0 | 490 | ||||||||||||||||||||||
07/2013 | 3,566 | 352 | BRC | 0 | (7 | ) | (7 | ) | ||||||||||||||||||||||
07/2013 | 6,298 | 618 | HUS | 0 | (17 | ) | (17 | ) | ||||||||||||||||||||||
07/2013 | 46,783 | 4,657 | MSC | 0 | (57 | ) | (57 | ) | ||||||||||||||||||||||
08/2013 | BRL | 198 | 91 | BOA | 3 | 0 | 3 | |||||||||||||||||||||||
08/2013 | 1,068 | 490 | BRC | 15 | 0 | 15 | ||||||||||||||||||||||||
08/2013 | 735 | 342 | FBF | 15 | 0 | 15 | ||||||||||||||||||||||||
08/2013 | 9,648 | 4,420 | HUS | 135 | (9 | ) | 126 | |||||||||||||||||||||||
08/2013 | 2,556 | 1,169 | JPM | 31 | 0 | 31 | ||||||||||||||||||||||||
08/2013 | 1,052 | 466 | MSC | 0 | (2 | ) | (2 | ) | ||||||||||||||||||||||
08/2013 | 2,573 | 1,263 | UAG | 118 | 0 | 118 | ||||||||||||||||||||||||
08/2013 | CHF | 1,220 | 1,299 | FBF | 7 | 0 | 7 | |||||||||||||||||||||||
08/2013 | EUR | 578 | 758 | DUB | 5 | 0 | 5 | |||||||||||||||||||||||
08/2013 | GBP | 9,034 | 13,947 | GLM | 210 | 0 | 210 | |||||||||||||||||||||||
08/2013 | NOK | 52,235 | 8,550 | UAG | 0 | (41 | ) | (41 | ) | |||||||||||||||||||||
08/2013 | $ | 13,844 | GBP | 9,034 | FBF | 0 | (107 | ) | (107 | ) | ||||||||||||||||||||
10/2013 | HKD | 7,863 | $ | 1,014 | DUB | 0 | 0 | 0 | ||||||||||||||||||||||
10/2013 | 15,509 | 2,000 | JPM | 0 | 0 | 0 | ||||||||||||||||||||||||
10/2013 | KRW | 81,284 | 70 | BRC | 0 | (1 | ) | (1 | ) | |||||||||||||||||||||
10/2013 | 717,916 | 619 | JPM | 0 | (7 | ) | (7 | ) | ||||||||||||||||||||||
10/2013 | PHP | 2,086 | 48 | JPM | 0 | 0 | 0 | |||||||||||||||||||||||
10/2013 | THB | 2,047 | 65 | BRC | 0 | 0 | 0 | |||||||||||||||||||||||
10/2013 | 10,032 | 320 | JPM | 0 | (2 | ) | (2 | ) | ||||||||||||||||||||||
10/2013 | TRY | 276 | 140 | CBK | 0 | (1 | ) | (1 | ) | |||||||||||||||||||||
10/2013 | 7,155 | 3,769 | HUS | 116 | 0 | 116 | ||||||||||||||||||||||||
10/2013 | $ | 3,014 | HKD | 23,371 | GLM | 1 | 0 | 1 | ||||||||||||||||||||||
10/2013 | 696 | KRW | 799,200 | DUB | 0 | 0 | 0 | |||||||||||||||||||||||
10/2013 | 48 | PHP | 2,086 | HUS | 0 | 0 | 0 | |||||||||||||||||||||||
10/2013 | 1,733 | TRY | 3,268 | HUS | 0 | (64 | ) | (64 | ) | |||||||||||||||||||||
|
|
|
|
|
| |||||||||||||||||||||||||
| $ | 1,795 | $ | (1,461 | ) | $ | 334 | ||||||||||||||||||||||||
|
|
|
|
|
| |||||||||||||||||||||||||
Collateral (Received)/Pledged for OTC Financial Derivative Instruments
The following is a summary by counterparty of the market value of OTC financial derivative instruments and collateral (received)/pledged as of June 30, 2013:
| (g) | Securities with an aggregate market value of $420 have been pledged as collateral for foreign currency contracts as governed by International Swaps and Derivatives Association, Inc. master agreements as of June 30, 2013. |
| Counterparty | Total Market Value of OTC Derivatives | Collateral (Received)/Pledged | Net Exposures (1) | |||||||||
BOA | $ | 723 | $ | (870 | ) | $ | (147 | ) | ||||
BRC | 98 | 0 | 98 | |||||||||
CBK | (1 | ) | 0 | (1 | ) | |||||||
DUB | (508 | ) | 0 | (508 | ) | |||||||
FBF | 103 | (270 | ) | (167 | ) | |||||||
GLM | 1 | 0 | 1 | |||||||||
HUS | 131 | (290 | ) | (159 | ) | |||||||
JPM | 16 | 0 | 16 | |||||||||
MSC | (346 | ) | (3,225 | ) | (3,571 | ) | ||||||
UAG | 117 | 0 | 117 | |||||||||
| (1) | Net Exposures represents the net receivable/(payable) that would be due from/to the counterparty(ies) in the event of default and are not disclosed as assets or liabilities in the Statements of Assets and Liabilities. See note 7, Principal Risks, in the Notes to Financial Statements for more information regarding master netting arrangements. |
| 48 | PIMCO EQUITY SERIES | See Accompanying Notes |
Table of Contents
June 30, 2013
FAIR VALUE OF FINANCIAL DERIVATIVE INSTRUMENTS (1)
The following is a summary of the fair valuation of the Fund’s derivative instruments categorized by risk exposure:
Fair Values of Financial Derivative Instruments on the Statements of Assets and Liabilities as of June 30, 2013:
| Derivatives not accounted for as hedging instruments | ||||||||||||||||||||||||
| Commodity Contracts | Credit Contracts | Equity Contracts | Foreign Exchange Contracts | Interest Rate Contracts | Total | |||||||||||||||||||
Assets: | ||||||||||||||||||||||||
Variation margin receivable on financial derivative instruments (2) | $ | 0 | $ | 0 | $ | 0 | $ | 44 | $ | 0 | $ | 44 | ||||||||||||
Unrealized appreciation on foreign currency contracts | 0 | 0 | 0 | 1,795 | 0 | 1,795 | ||||||||||||||||||
|
|
|
|
|
|
|
|
|
|
|
| |||||||||||||
| $ | 0 | $ | 0 | $ | 0 | $ | 1,839 | $ | 0 | $ | 1,839 | |||||||||||||
|
|
|
|
|
|
|
|
|
|
|
| |||||||||||||
Liabilities: | ||||||||||||||||||||||||
Variation margin payable on financial derivative instruments (2) | $ | 0 | $ | 0 | $ | 0 | $ | 40 | $ | 0 | $ | 40 | ||||||||||||
Unrealized depreciation on foreign currency contracts | 0 | 0 | 0 | 1,461 | 0 | 1,461 | ||||||||||||||||||
|
|
|
|
|
|
|
|
|
|
|
| |||||||||||||
| $ | 0 | $ | 0 | $ | 0 | $ | 1,501 | $ | 0 | $ | 1,501 | |||||||||||||
|
|
|
|
|
|
|
|
|
|
|
| |||||||||||||
The Effect of Financial Derivative Instruments on the Statements of Operations for the Period Ended June 30, 2013:
| Derivatives not accounted for as hedging instruments | ||||||||||||||||||||||||
| Commodity Contracts | Credit Contracts | Equity Contracts | Foreign Exchange Contracts | Interest Rate Contracts | Total | |||||||||||||||||||
Realized (Loss) on Derivatives: | ||||||||||||||||||||||||
Net realized (loss) on futures contracts | $ | 0 | $ | 0 | $ | 0 | $ | (409 | ) | $ | 0 | $ | (409 | ) | ||||||||||
Net realized (loss) on foreign currency transactions | 0 | 0 | 0 | (155 | ) | 0 | (155 | ) | ||||||||||||||||
|
|
|
|
|
|
|
|
|
|
|
| |||||||||||||
| $ | 0 | $ | 0 | $ | 0 | $ | (564 | ) | $ | 0 | $ | (564 | ) | |||||||||||
|
|
|
|
|
|
|
|
|
|
|
| |||||||||||||
Net Change in Unrealized Appreciation (Depreciation) on Derivatives: | ||||||||||||||||||||||||
Net change in unrealized (depreciation) on futures contracts | $ | 0 | $ | 0 | $ | 0 | $ | (106 | ) | $ | 0 | $ | (106 | ) | ||||||||||
Net change in unrealized appreciation on translation of assets and liabilities denominated in foreign currencies | 0 | 0 | 0 | 398 | 0 | 398 | ||||||||||||||||||
|
|
|
|
|
|
|
|
|
|
|
| |||||||||||||
| $ | 0 | $ | 0 | $ | 0 | $ | 292 | $ | 0 | $ | 292 | |||||||||||||
|
|
|
|
|
|
|
|
|
|
|
| |||||||||||||
| (1) | See note 7 in the Notes to Financial Statements for additional information. |
| (2) | Only current day’s variation margin is reported within the Statements of Assets and Liabilities. The variation margin is included in the open futures cumulative appreciation/(depreciation) of $(127) as reported in the Notes to Schedule of Investments. |
FAIR VALUE MEASUREMENTS (1)
The following is a summary of the fair valuations according to the inputs used as of June 30, 2013 in valuing the Fund’s assets and liabilities:
| Category and Subcategory | Level 1 | Level 2 | Level 3 | Fair Value at | ||||||||||||
Investments, at value |
| |||||||||||||||
Asset-Backed Securities | ||||||||||||||||
United States | $ | 0 | $ | 384 | $ | 0 | $ | 384 | ||||||||
Common Stocks | ||||||||||||||||
Australia | ||||||||||||||||
Financials | 0 | 8,272 | 0 | 8,272 | ||||||||||||
Bermuda | ||||||||||||||||
Energy | 1,472 | 0 | 0 | 1,472 | ||||||||||||
Brazil | ||||||||||||||||
Financials | 4,711 | 0 | 0 | 4,711 | ||||||||||||
Industrials | 3,040 | 0 | 0 | 3,040 | ||||||||||||
Utilities | 6,906 | 0 | 0 | 6,906 | ||||||||||||
Canada | ||||||||||||||||
Consumer Discretionary | 6,718 | 0 | 0 | 6,718 | ||||||||||||
China | ||||||||||||||||
Industrials | 0 | 4,379 | 0 | 4,379 | ||||||||||||
Cyprus | ||||||||||||||||
Energy | 0 | 9,678 | 0 | 9,678 | ||||||||||||
France | ||||||||||||||||
Energy | 0 | 8,933 | 0 | 8,933 | ||||||||||||
Health Care | 0 | 6,452 | 0 | 6,452 | ||||||||||||
| Category and Subcategory | Level 1 | Level 2 | Level 3 | Fair Value at | ||||||||||||
Hong Kong | ||||||||||||||||
Consumer Discretionary | $ | 0 | $ | 1,132 | $ | 0 | $ | 1,132 | ||||||||
Industrials | 0 | 3,001 | 0 | 3,001 | ||||||||||||
Telecommunication Services | 0 | 1,464 | 0 | 1,464 | ||||||||||||
Italy | ||||||||||||||||
Industrials | 0 | 4,685 | 0 | 4,685 | ||||||||||||
Japan | ||||||||||||||||
Consumer Staples | 0 | 4,514 | 0 | 4,514 | ||||||||||||
Telecommunication Services | 0 | 9,382 | 0 | 9,382 | ||||||||||||
Netherlands | ||||||||||||||||
Energy | 0 | 8,845 | 0 | 8,845 | ||||||||||||
Qatar | ||||||||||||||||
Utilities | 2,967 | 0 | 0 | 2,967 | ||||||||||||
South Africa | ||||||||||||||||
Consumer Discretionary | 0 | 3,257 | 0 | 3,257 | ||||||||||||
Health Care | 0 | 3,408 | 0 | 3,408 | ||||||||||||
Telecommunication Services | 0 | 6,576 | 0 | 6,576 | ||||||||||||
Spain | ||||||||||||||||
Utilities | 0 | 9,566 | 0 | 9,566 | ||||||||||||
Switzerland | ||||||||||||||||
Health Care | 0 | 12,716 | 0 | 12,716 | ||||||||||||
| See Accompanying Notes | ANNUAL REPORT | JUNE 30, 2013 | 49 |
Table of Contents
Schedule of Investments PIMCO Dividend and Income Builder Fund (Cont.)
| Category and Subcategory | Level 1 | Level 2 | Level 3 | Fair Value at | ||||||||||||
Thailand | ||||||||||||||||
Industrials | $ | 0 | $ | 1,427 | $ | 0 | $ | 1,427 | ||||||||
Turkey | ||||||||||||||||
Industrials | 0 | 2,997 | 0 | 2,997 | ||||||||||||
United Kingdom | ||||||||||||||||
Consumer Discretionary | 0 | 3,831 | 0 | 3,831 | ||||||||||||
Consumer Staples | 0 | 4,728 | 0 | 4,728 | ||||||||||||
Financials | 0 | 14,045 | 0 | 14,045 | ||||||||||||
Telecommunication Services | 0 | 8,209 | 0 | 8,209 | ||||||||||||
United States | ||||||||||||||||
Consumer Discretionary | 20,026 | 0 | 0 | 20,026 | ||||||||||||
Consumer Staples | 12,286 | 0 | 0 | 12,286 | ||||||||||||
Energy | 8,333 | 0 | 0 | 8,333 | ||||||||||||
Financials | 48,876 | 0 | 0 | 48,876 | ||||||||||||
Health Care | 18,108 | 0 | 0 | 18,108 | ||||||||||||
Industrials | 4,434 | 0 | 0 | 4,434 | ||||||||||||
Information Technology | 31,998 | 0 | 0 | 31,998 | ||||||||||||
Corporate Bonds & Notes | ||||||||||||||||
Australia | ||||||||||||||||
Industrials | 0 | 308 | 0 | 308 | ||||||||||||
Austria | ||||||||||||||||
Industrials | 0 | 125 | 0 | 125 | ||||||||||||
Brazil | ||||||||||||||||
Industrials | 0 | 297 | 0 | 297 | ||||||||||||
Cayman Islands | ||||||||||||||||
Banking & Finance | 0 | 268 | 0 | 268 | ||||||||||||
Utilities | 0 | 96 | 0 | 96 | ||||||||||||
France | ||||||||||||||||
Banking & Finance | 0 | 940 | 0 | 940 | ||||||||||||
Industrials | 0 | 290 | 0 | 290 | ||||||||||||
Germany | ||||||||||||||||
Industrials | 0 | 273 | 0 | 273 | ||||||||||||
Ireland | ||||||||||||||||
Industrials | 0 | 379 | 0 | 379 | ||||||||||||
Utilities | 0 | 434 | 0 | 434 | ||||||||||||
Italy | ||||||||||||||||
Banking & Finance | 0 | 300 | 0 | 300 | ||||||||||||
Japan | ||||||||||||||||
Utilities | 0 | 263 | 0 | 263 | ||||||||||||
Luxembourg | ||||||||||||||||
Banking & Finance | 0 | 559 | 0 | 559 | ||||||||||||
Industrials | 0 | 1,557 | 0 | 1,557 | ||||||||||||
Utilities | 0 | 519 | 0 | 519 | ||||||||||||
Mexico | ||||||||||||||||
Industrials | 0 | 900 | 0 | 900 | ||||||||||||
Netherlands | ||||||||||||||||
Banking & Finance | 0 | 280 | 0 | 280 | ||||||||||||
Industrials | 0 | 220 | 0 | 220 | ||||||||||||
Utilities | 0 | 586 | 0 | 586 | ||||||||||||
Norway | ||||||||||||||||
Banking & Finance | 0 | 235 | 0 | 235 | ||||||||||||
Qatar | ||||||||||||||||
Industrials | 0 | 226 | 0 | 226 | ||||||||||||
Utilities | 0 | 294 | 0 | 294 | ||||||||||||
South Africa | ||||||||||||||||
Industrials | 0 | 166 | 0 | 166 | ||||||||||||
| Category and Subcategory | Level 1 | Level 2 | Level 3 | Fair Value at | ||||||||||||
Spain | ||||||||||||||||
Banking & Finance | $ | 0 | $ | 661 | $ | 0 | $ | 661 | ||||||||
Industrials | 0 | 280 | 0 | 280 | ||||||||||||
United Arab Emirates | ||||||||||||||||
Industrials | 0 | 294 | 0 | 294 | ||||||||||||
United Kingdom | ||||||||||||||||
Banking & Finance | 0 | 1,960 | 0 | 1,960 | ||||||||||||
Industrials | 0 | 1,761 | 0 | 1,761 | ||||||||||||
United States | ||||||||||||||||
Banking & Finance | 0 | 2,245 | 0 | 2,245 | ||||||||||||
Industrials | 0 | 3,213 | 206 | 3,419 | ||||||||||||
Utilities | 0 | 1,613 | 0 | 1,613 | ||||||||||||
Venezuela | ||||||||||||||||
Industrials | 0 | 551 | 0 | 551 | ||||||||||||
Virgin Islands (British) | ||||||||||||||||
Industrials | 0 | 338 | 0 | 338 | ||||||||||||
Utilities | 0 | 229 | 0 | 229 | ||||||||||||
Equity-Linked Securities | ||||||||||||||||
Saudi Arabia | ||||||||||||||||
Consumer Discretionary | 0 | 647 | 0 | 647 | ||||||||||||
Consumer Staples | 0 | 3,025 | 0 | 3,025 | ||||||||||||
Mortgage-Backed Securities | ||||||||||||||||
United States | 0 | 5,900 | 0 | 5,900 | ||||||||||||
Municipal Bonds & Notes | ||||||||||||||||
Michigan | 0 | 82 | 0 | 82 | ||||||||||||
Virginia | 0 | 294 | 0 | 294 | ||||||||||||
West Virginia | 0 | 328 | 0 | 328 | ||||||||||||
Real Estate Investment Trusts | ||||||||||||||||
United States | 6,490 | 0 | 0 | 6,490 | ||||||||||||
Sovereign Issues | ||||||||||||||||
Australia | 0 | 614 | 0 | 614 | ||||||||||||
Canada | 0 | 1,198 | 0 | 1,198 | ||||||||||||
Indonesia | 0 | 9 | 0 | 9 | ||||||||||||
Mexico | 0 | 316 | 0 | 316 | ||||||||||||
South Africa | 0 | 527 | 0 | 527 | ||||||||||||
Spain | 0 | 1,239 | 0 | 1,239 | ||||||||||||
Venezuela | 0 | 242 | 0 | 242 | ||||||||||||
U.S. Treasury Obligations | ||||||||||||||||
United States | 0 | 902 | 0 | 902 | ||||||||||||
Short-Term Instruments | ||||||||||||||||
Repurchase Agreements | 0 | 4,126 | 0 | 4,126 | ||||||||||||
U.S. Treasury Bills | 0 | 619 | 0 | 619 | ||||||||||||
Central Funds Used for Cash Management Purposes | 28,734 | 0 | 0 | 28,734 | ||||||||||||
| $ | 205,099 | $ | 184,609 | $ | 206 | $ | 389,914 | |||||||||
Financial Derivative Instruments - Assets |
| |||||||||||||||
Foreign Exchange Contracts | $ | 171 | $ | 1,795 | $ | 0 | $ | 1,966 | ||||||||
Financial Derivative Instruments - Liabilities |
| |||||||||||||||
Foreign Exchange Contracts | $ | (298 | ) | $ | (1,461 | ) | $ | 0 | $ | (1,759 | ) | |||||
Totals | $ | 204,972 | $ | 184,943 | $ | 206 | $ | 390,121 | ||||||||
There were assets and liabilities valued at $2,967 transferred from Level 2 to Level 1 during the period ended June 30, 2013.
The following is a reconciliation of the fair valuations using significant unobservable inputs (Level 3) for the Fund during the period ended June 30, 2013:
| Category and Subcategory | Beginning Balance at 06/30/2012 | Net Purchases | Net Sales | Accrued Discounts/ (Premiums) | Realized Gain/(Loss) | Net Change in Unrealized Appreciation/ (Depreciation) (2) | Transfers into Level 3 | Transfers out of Level 3 | Ending Balance at 06/30/2013 | Net Change in Unrealized Appreciation/ (Depreciation) on Investments Held at 06/30/2013 (2) | ||||||||||||||||||||||||||||||
Investments, at value | ||||||||||||||||||||||||||||||||||||||||
Corporate Bonds & Notes | ||||||||||||||||||||||||||||||||||||||||
United States | ||||||||||||||||||||||||||||||||||||||||
Industrials | $ | 102 | $ | 102 | $ | (4 | ) | $ | 0 | $ | 0 | $ | 6 | $ | 0 | $ | 0 | $ | 206 | $ | 6 | |||||||||||||||||||
|
|
|
|
|
|
|
|
|
|
|
|
|
|
|
|
|
|
|
| |||||||||||||||||||||
| 50 | PIMCO EQUITY SERIES | See Accompanying Notes |
Table of Contents
June 30, 2013
The following is a summary of significant unobservable inputs used in the fair valuations of assets and liabilities categorized within Level 3 of the fair value hierarchy:
| Category and Subcategory | Ending Balance at 06/30/2013 | Valuation Technique | Unobservable Inputs | Input Value(s) (% Unless Noted Otherwise) | ||||||||
Investments, at value | ||||||||||||
Corporate Bonds & Notes | ||||||||||||
United States | ||||||||||||
Industrials | $ | 206 | Third Party Vendor | Broker Quote | 104.50-105.00 | |||||||
|
| |||||||||||
| (1) | See note 3 in the Notes to Financial Statements for more information regarding pricing inputs, valuation techniques and transfers. |
| (2) | Any difference between Net Change in Unrealized Appreciation/(Depreciation) and Net Change in Unrealized Appreciation/(Depreciation) on Investments Held at June 30, 2013 may be due to an investment no longer held or categorized as level 3 at period end. |
| See Accompanying Notes | ANNUAL REPORT | JUNE 30, 2013 | 51 |
Table of Contents
Schedule of Investments PIMCO EqS® Dividend Fund
| SHARES | MARKET VALUE (000S) | |||||||||||
| COMMON STOCKS 90.2% | ||||||||||||
| AUSTRALIA 2.2% | ||||||||||||
| FINANCIALS 2.2% | ||||||||||||
Australia & New Zealand Banking Group Ltd. | 546,860 | $ | 14,196 | |||||||||
|
| |||||||||||
Total Australia | 14,196 | |||||||||||
|
| |||||||||||
| BERMUDA 0.5% | ||||||||||||
| ENERGY 0.5% | ||||||||||||
Golar LNG Partners LP | 91,669 | 3,126 | ||||||||||
|
| |||||||||||
Total Bermuda | 3,126 | |||||||||||
|
| |||||||||||
| BRAZIL 4.0% | ||||||||||||
| FINANCIALS 1.2% | ||||||||||||
BB Seguridade Participacoes S.A. (a) | 955,465 | 7,536 | ||||||||||
|
| |||||||||||
| INDUSTRIALS 0.8% | ||||||||||||
Arteris S.A. | 583,200 | 5,277 | ||||||||||
|
| |||||||||||
| UTILITIES 2.0% | ||||||||||||
Cia de Saneamento Basico do Estado de Sao Paulo SP - ADR | 1,196,113 | 12,452 | ||||||||||
|
| |||||||||||
Total Brazil | 25,265 | |||||||||||
|
| |||||||||||
| CANADA 2.7% | ||||||||||||
| CONSUMER DISCRETIONARY 1.8% | ||||||||||||
Aimia, Inc. | 789,523 | 11,816 | ||||||||||
|
| |||||||||||
| ENERGY 0.9% | ||||||||||||
Cameco Corp. | 267,224 | 5,517 | ||||||||||
|
| |||||||||||
Total Canada | 17,333 | |||||||||||
|
| |||||||||||
| CHINA 0.9% | ||||||||||||
| INDUSTRIALS 0.9% | ||||||||||||
Guangshen Railway Co. Ltd. ‘H’ | 6,542,000 | 2,650 | ||||||||||
Zhejiang Expressway Co. Ltd. ‘H’ | 3,466,000 | 2,822 | ||||||||||
|
| |||||||||||
Total China | 5,472 | |||||||||||
|
| |||||||||||
| CYPRUS 2.4% | ||||||||||||
| ENERGY 2.4% | ||||||||||||
ProSafe SE | 1,736,628 | 15,271 | ||||||||||
|
| |||||||||||
Total Cyprus | 15,271 | |||||||||||
|
| |||||||||||
| FRANCE 4.2% | ||||||||||||
| ENERGY 2.4% | ||||||||||||
Total S.A. | 313,142 | 15,295 | ||||||||||
|
| |||||||||||
| HEALTH CARE 1.8% | ||||||||||||
Sanofi | 107,944 | 11,159 | ||||||||||
|
| |||||||||||
Total France | 26,454 | |||||||||||
|
| |||||||||||
| HONG KONG 1.2% | ||||||||||||
| CONSUMER DISCRETIONARY 0.3% | ||||||||||||
Tianneng Power International Ltd. | 4,852,000 | 1,944 | ||||||||||
| SHARES | MARKET VALUE (000S) | |||||||||||
| INDUSTRIALS 0.5% | ||||||||||||
Yuexiu Transport Infrastructure Ltd. | 5,486,000 | $ | 2,764 | |||||||||
|
| |||||||||||
| TELECOMMUNICATION SERVICES 0.4% | ||||||||||||
SmarTone Telecommunications Holdings Ltd. | 1,675,000 | 2,746 | ||||||||||
|
| |||||||||||
Total Hong Kong | 7,454 | |||||||||||
|
| |||||||||||
| ITALY 0.8% | ||||||||||||
| INDUSTRIALS 0.8% | ||||||||||||
Societa Iniziative Autostradali e Servizi SpA | 612,855 | 5,002 | ||||||||||
|
| |||||||||||
Total Italy | 5,002 | |||||||||||
|
| |||||||||||
| JAPAN 4.2% | ||||||||||||
| CONSUMER STAPLES 1.4% | ||||||||||||
Japan Tobacco, Inc. | 248,900 | 8,786 | ||||||||||
|
| |||||||||||
| TELECOMMUNICATION SERVICES 2.8% | ||||||||||||
Nippon Telegraph & Telephone Corp. | 335,000 | 17,460 | ||||||||||
|
| |||||||||||
Total Japan | 26,246 | |||||||||||
|
| |||||||||||
| NETHERLANDS 2.4% | ||||||||||||
| ENERGY 2.4% | ||||||||||||
Royal Dutch Shell PLC ‘A’ | 474,546 | 15,159 | ||||||||||
|
| |||||||||||
Total Netherlands | 15,159 | |||||||||||
|
| |||||||||||
| PANAMA 0.9% | ||||||||||||
| INDUSTRIALS 0.9% | ||||||||||||
Copa Holdings S.A. | 44,671 | 5,857 | ||||||||||
|
| |||||||||||
Total Panama | 5,857 | |||||||||||
|
| |||||||||||
| QATAR 0.5% | ||||||||||||
| UTILITIES 0.5% | ||||||||||||
Qatar Electricity & Water Co. | 70,087 | 3,025 | ||||||||||
|
| |||||||||||
Total Qatar | 3,025 | |||||||||||
|
| |||||||||||
| SOUTH AFRICA 3.9% | ||||||||||||
| CONSUMER DISCRETIONARY 1.0% | ||||||||||||
Imperial Holdings Ltd. | 290,261 | 6,162 | ||||||||||
|
| |||||||||||
| HEALTH CARE 1.0% | ||||||||||||
Life Healthcare Group Holdings Ltd. | 1,599,899 | 6,068 | ||||||||||
|
| |||||||||||
| TELECOMMUNICATION SERVICES 1.9% | ||||||||||||
MTN Group Ltd. | 665,092 | 12,370 | ||||||||||
|
| |||||||||||
Total South Africa | 24,600 | |||||||||||
|
| |||||||||||
| SPAIN 2.7% | ||||||||||||
| UTILITIES 2.7% | ||||||||||||
Enagas S.A. | 688,329 | 17,013 | ||||||||||
|
| |||||||||||
Total Spain | 17,013 | |||||||||||
|
| |||||||||||
| SHARES | MARKET VALUE (000S) | |||||||||||
| SWITZERLAND 3.6% | ||||||||||||
| HEALTH CARE 3.6% | ||||||||||||
Novartis AG | 159,385 | $ | 11,289 | |||||||||
Roche Holding AG | 46,430 | 11,524 | ||||||||||
|
| |||||||||||
Total Switzerland | 22,813 | |||||||||||
|
| |||||||||||
| THAILAND 0.4% | ||||||||||||
| INDUSTRIALS 0.4% | ||||||||||||
Bangkok Expressway PCL | 2,148,100 | 2,467 | ||||||||||
|
| |||||||||||
Total Thailand | 2,467 | |||||||||||
|
| |||||||||||
| TURKEY 0.9% | ||||||||||||
| INDUSTRIALS 0.9% | ||||||||||||
TAV Havalimanlari Holding A/S | 933,642 | 5,461 | ||||||||||
|
| |||||||||||
Total Turkey | 5,461 | |||||||||||
|
| |||||||||||
| UNITED KINGDOM 8.8% | ||||||||||||
| CONSUMER DISCRETIONARY 1.1% | ||||||||||||
Marks & Spencer Group PLC | 1,035,195 | 6,773 | ||||||||||
|
| |||||||||||
| CONSUMER STAPLES 1.3% | ||||||||||||
Imperial Tobacco Group PLC | 233,337 | 8,091 | ||||||||||
|
| |||||||||||
| FINANCIALS 3.9% | ||||||||||||
HSBC Holdings PLC | 1,158,993 | 11,998 | ||||||||||
IG Group Holdings PLC | 630,499 | 5,568 | ||||||||||
Intermediate Capital Group PLC | 1,037,989 | 6,865 | ||||||||||
|
| |||||||||||
| 24,431 | ||||||||||||
|
| |||||||||||
| TELECOMMUNICATION SERVICES 2.5% | ||||||||||||
BT Group PLC | 1,873,200 | 8,794 | ||||||||||
Inmarsat PLC | 717,856 | 7,352 | ||||||||||
|
| |||||||||||
| 16,146 | ||||||||||||
|
| |||||||||||
Total United Kingdom | 55,441 | |||||||||||
|
| |||||||||||
| UNITED STATES 43.0% | ||||||||||||
| CONSUMER DISCRETIONARY 5.6% | ||||||||||||
Foot Locker, Inc. | 80,184 | 2,815 | ||||||||||
General Motors Co. (a) | 178,723 | 5,953 | ||||||||||
Kohl’s Corp. | 444,823 | 22,468 | ||||||||||
Staples, Inc. | 246,593 | 3,932 | ||||||||||
|
| |||||||||||
| 35,168 | ||||||||||||
|
| |||||||||||
| CONSUMER STAPLES 4.1% | ||||||||||||
Walgreen Co. | 581,885 | 25,719 | ||||||||||
|
| |||||||||||
| ENERGY 2.7% | ||||||||||||
Marathon Petroleum Corp. | 172,725 | 12,274 | ||||||||||
MPLX LP | 128,379 | 4,725 | ||||||||||
|
| |||||||||||
| 16,999 | ||||||||||||
|
| |||||||||||
| FINANCIALS 14.1% | ||||||||||||
Apollo Investment Corp. | 357,866 | 2,770 | ||||||||||
Blackstone Group LP | 272,595 | 5,741 | ||||||||||
Capitol Federal Financial, Inc. | 245,069 | 3,009 | ||||||||||
| 52 | PIMCO EQUITY SERIES | See Accompanying Notes |
Table of Contents
June 30, 2013
| SHARES | MARKET VALUE (000S) | |||||||||||
JPMorgan Chase & Co. | 462,644 | $ | 24,423 | |||||||||
KeyCorp | 2,152,325 | 23,761 | ||||||||||
Northwest Bancshares, Inc. | 39,277 | 528 | ||||||||||
Prudential Financial, Inc. | 188,756 | 13,785 | ||||||||||
Solar Capital Ltd. | 502,719 | 11,608 | ||||||||||
Solar Senior Capital Ltd. | 166,396 | 3,063 | ||||||||||
Washington Federal, Inc. | 29,065 | 546 | ||||||||||
|
| |||||||||||
| 89,234 | ||||||||||||
|
| |||||||||||
| HEALTH CARE 5.4% | ||||||||||||
Medtronic, Inc. | 222,456 | 11,450 | ||||||||||
Merck & Co., Inc. | 232,636 | 10,806 | ||||||||||
Pfizer, Inc. | 412,530 | 11,555 | ||||||||||
|
| |||||||||||
| 33,811 | ||||||||||||
|
| |||||||||||
| INDUSTRIALS 1.4% | ||||||||||||
Lockheed Martin Corp. | 81,936 | 8,887 | ||||||||||
|
| |||||||||||
| INFORMATION TECHNOLOGY 9.7% | ||||||||||||
Cisco Systems, Inc. | 995,652 | 24,204 | ||||||||||
Intel Corp. | 638,684 | 15,469 | ||||||||||
Microsoft Corp. | 618,574 | 21,360 | ||||||||||
|
| |||||||||||
| 61,033 | ||||||||||||
|
| |||||||||||
Total United States | 270,851 | |||||||||||
|
| |||||||||||
Total Common Stocks (Cost $534,983) |
| 568,506 | ||||||||||
|
| |||||||||||
| UNITS | MARKET VALUE (000S) | |||||||||||
| EQUITY-LINKED SECURITIES 1.1% | ||||||||||||
| SAUDI ARABIA 1.1% | ||||||||||||
| CONSUMER DISCRETIONARY 0.2% | ||||||||||||
Merrill Lynch International & Co. Saudi Airlines Catering Co. - Exp. 04/29/2015 | 36,792 | $ | 1,177 | |||||||||
|
| |||||||||||
| CONSUMER STAPLES 0.9% | ||||||||||||
HSBC Bank PLC | 263,785 | 5,592 | ||||||||||
|
| |||||||||||
Total Equity-Linked Securities | 6,769 | |||||||||||
|
| |||||||||||
| SHARES | ||||||||||||
| REAL ESTATE INVESTMENT TRUSTS 1.9% | ||||||||||||
| UNITED STATES 1.9% | ||||||||||||
Colony Financial, Inc. | 621,530 | 12,362 | ||||||||||
|
| |||||||||||
Total Real Estate Investment Trusts |
| 12,362 | ||||||||||
|
| |||||||||||
| PRINCIPAL AMOUNT (000S) | MARKET VALUE (000S) | |||||||||||
| SHORT-TERM INSTRUMENTS 3.8% | ||||||||||||
REPURCHASE AGREEMENTS (d) 0.2% |
| |||||||||||
| $ | 952 | |||||||||||
|
| |||||||||||
| SHORT-TERM NOTES 0.1% | ||||||||||||
Federal Home Loan Bank |
| |||||||||||
0.183% due 05/01/2014 | $ | 500 | 500 | |||||||||
|
| |||||||||||
| U.S. TREASURY BILLS 0.4% | ||||||||||||
0.106% due 08/15/2013 - 05/29/2014 (b)(f) | 2,941 | 2,938 | ||||||||||
|
| |||||||||||
| SHARES | ||||||||||||
| CENTRAL FUNDS USED FOR CASH MANAGEMENT PURPOSES (c)��3.1% | ||||||||||||
PIMCO Short-Term | 1,956,226 | 19,574 | ||||||||||
|
| |||||||||||
Total Short-Term Instruments | 23,964 | |||||||||||
|
| |||||||||||
| Total Investments 97.0% (Cost $579,417) | $ | 611,601 | ||||||||||
| Other Assets and Liabilities (Net) 3.0% | 18,812 | |||||||||||
|
| |||||||||||
| Net Assets 100.0% | $ | 630,413 | ||||||||||
|
| |||||||||||
Notes to Schedule of Investments (amounts in thousands*, except number of contracts):
| * | A zero balance may reflect actual amounts rounding to less than one thousand. |
| (a) | Security did not produce income within the last twelve months. |
| (b) | Coupon represents a weighted average yield to maturity. |
| (c) | Affiliated to the Fund. |
BORROWINGS AND OTHER FINANCING TRANSACTIONS
| (d) | Repurchase Agreements: |
| Counterparty | Lending Rate | Settlement Date | Maturity Date | Principal Amount | Collateralized By | Collateral (Received), At Value | Repurchase Agreements, At Value | Repurchase Proceeds (1) | ||||||||||||||||||||||
BOA | 0.140 | % | 06/28/2013 | 07/01/2013 | $ | 400 | U.S. Treasury Bonds 2.750% due 08/15/2042 | $ | (417 | ) | $ | 400 | $ | 400 | ||||||||||||||||
SSB | 0.010 | % | 06/28/2013 | 07/01/2013 | 552 | Fannie Mae 2.200% due 10/17/2022 | (566 | ) | 552 | 552 | ||||||||||||||||||||
|
|
|
|
|
| |||||||||||||||||||||||||
| $ | (983 | ) | $ | 952 | $ | 952 | ||||||||||||||||||||||||
|
|
|
|
|
| |||||||||||||||||||||||||
| (1) | Includes accrued interest. |
EXCHANGE-TRADED OR CENTRALLY CLEARED FINANCIAL DERIVATIVE INSTRUMENTS
Futures Contracts:
| Description | Type | Expiration Month | # of Contracts | Unrealized Appreciation | ||||||||||
British pound currency September Futures | Short | 09/2013 | 300 | $ | 217 | |||||||||
|
| |||||||||||||
| See Accompanying Notes | ANNUAL REPORT | JUNE 30, 2013 | 53 |
Table of Contents
Schedule of Investments PIMCO EqS® Dividend Fund (Cont.)
| (e) | Cash of $360 has been pledged as collateral for exchange-traded and centrally cleared financial derivative instruments as of June 30, 2013. |
OTC FINANCIAL DERIVATIVE INSTRUMENTS
Foreign Currency Contracts:
| Settlement Month | Currency to | Currency to | Counterparty | Unrealized Appreciation | Unrealized (Depreciation) | Net Unrealized Appreciation/ (Depreciation) | ||||||||||||||||||||||||
07/2013 | CHF | 19,625 | $ | 20,260 | MSC | $ | 0 | $ | (517 | ) | $ | (517 | ) | |||||||||||||||||
07/2013 | EUR | 21,684 | 28,009 | MSC | 0 | (216 | ) | (216 | ) | |||||||||||||||||||||
07/2013 | GBP | 28,765 | 43,471 | UAG | 0 | (279 | ) | (279 | ) | |||||||||||||||||||||
07/2013 | JPY | 1,499,399 | 14,841 | BOA | 0 | (277 | ) | (277 | ) | |||||||||||||||||||||
07/2013 | NOK | 101,366 | 17,362 | FBF | 674 | 0 | 674 | |||||||||||||||||||||||
07/2013 | SGD | 342 | 270 | CBK | 0 | 0 | 0 | |||||||||||||||||||||||
07/2013 | THB | 23,112 | 775 | UAG | 30 | 0 | 30 | |||||||||||||||||||||||
07/2013 | TWD | 18,529 | 616 | DUB | 0 | (2 | ) | (2 | ) | |||||||||||||||||||||
07/2013 | $ | 17,590 | CHF | 16,152 | DUB | 0 | (490 | ) | (490 | ) | ||||||||||||||||||||
07/2013 | 3,696 | 3,473 | FBF | 0 | (19 | ) | (19 | ) | ||||||||||||||||||||||
07/2013 | 29,009 | EUR | 21,684 | DUB | 0 | (784 | ) | (784 | ) | |||||||||||||||||||||
07/2013 | 15,685 | GBP | 10,013 | BRC | 0 | (456 | ) | (456 | ) | |||||||||||||||||||||
07/2013 | 28,957 | 18,752 | GLM | 0 | (436 | ) | (436 | ) | ||||||||||||||||||||||
07/2013 | 190 | HKD | 1,475 | DUB | 0 | 0 | 0 | |||||||||||||||||||||||
07/2013 | 14,846 | JPY | 1,499,399 | BOA | 273 | 0 | 273 | |||||||||||||||||||||||
07/2013 | 1,289 | NOK | 7,446 | DUB | 0 | (63 | ) | (63 | ) | |||||||||||||||||||||
07/2013 | 15,389 | 93,920 | UAG | 72 | 0 | 72 | ||||||||||||||||||||||||
07/2013 | 270 | SGD | 342 | BOA | 0 | 0 | 0 | |||||||||||||||||||||||
07/2013 | 55 | THB | 1,680 | BRC | 0 | (1 | ) | (1 | ) | |||||||||||||||||||||
07/2013 | 695 | 21,432 | UAG | 0 | (5 | ) | (5 | ) | ||||||||||||||||||||||
07/2013 | 618 | TWD | 18,529 | FBF | 1 | 0 | 1 | |||||||||||||||||||||||
07/2013 | ZAR | 183,736 | $ | 20,148 | BOA | 1,636 | 0 | 1,636 | ||||||||||||||||||||||
07/2013 | 9,222 | 905 | HUS | 0 | (24 | ) | (24 | ) | ||||||||||||||||||||||
07/2013 | 14,822 | 1,479 | MSC | 0 | (14 | ) | (14 | ) | ||||||||||||||||||||||
08/2013 | BRL | 9,269 | 4,285 | BOA | 160 | 0 | 160 | |||||||||||||||||||||||
08/2013 | 2,057 | 943 | BRC | 28 | 0 | 28 | ||||||||||||||||||||||||
08/2013 | 1,391 | 647 | FBF | 28 | 0 | 28 | ||||||||||||||||||||||||
08/2013 | 824 | 375 | HUS | 8 | 0 | 8 | ||||||||||||||||||||||||
08/2013 | 12,139 | 5,963 | UAG | 560 | 0 | 560 | ||||||||||||||||||||||||
08/2013 | CHF | 3,473 | 3,697 | FBF | 20 | 0 | 20 | |||||||||||||||||||||||
08/2013 | EUR | 2,214 | 2,902 | DUB | 20 | 0 | 20 | |||||||||||||||||||||||
08/2013 | GBP | 18,752 | 28,951 | GLM | 436 | 0 | 436 | |||||||||||||||||||||||
08/2013 | NOK | 93,920 | 15,373 | UAG | 0 | (73 | ) | (73 | ) | |||||||||||||||||||||
08/2013 | $ | 28,737 | GBP | 18,752 | FBF | 0 | (222 | ) | (222 | ) | ||||||||||||||||||||
10/2013 | HKD | 3,792 | $ | 489 | DUB | 0 | 0 | 0 | ||||||||||||||||||||||
10/2013 | 7,754 | 1,000 | JPM | 0 | 0 | 0 | ||||||||||||||||||||||||
10/2013 | KRW | 543,442 | 468 | BRC | 0 | (6 | ) | (6 | ) | |||||||||||||||||||||
10/2013 | 825,279 | 712 | UAG | 0 | (7 | ) | (7 | ) | ||||||||||||||||||||||
10/2013 | PHP | 3,607 | 83 | JPM | 0 | (1 | ) | (1 | ) | |||||||||||||||||||||
10/2013 | THB | 21,432 | 692 | UAG | 4 | 0 | 4 | |||||||||||||||||||||||
10/2013 | TRY | 15,006 | 7,904 | HUS | 244 | 0 | 244 | |||||||||||||||||||||||
10/2013 | $ | 1,489 | HKD | 11,546 | GLM | 0 | 0 | 0 | ||||||||||||||||||||||
10/2013 | 1,192 | KRW | 1,368,721 | DUB | 1 | 0 | 1 | |||||||||||||||||||||||
10/2013 | 84 | PHP | 3,607 | HUS | 0 | 0 | 0 | |||||||||||||||||||||||
10/2013 | 3,634 | TRY | 6,854 | HUS | 0 | (135 | ) | (135 | ) | |||||||||||||||||||||
|
|
|
|
|
| |||||||||||||||||||||||||
| $ | 4,195 | $ | (4,027 | ) | $ | 168 | ||||||||||||||||||||||||
|
|
|
|
|
| |||||||||||||||||||||||||
| 54 | PIMCO EQUITY SERIES | See Accompanying Notes |
Table of Contents
June 30, 2013
Collateral (Received)/Pledged for OTC Financial Derivative Instruments
The following is a summary by counterparty of the market value of OTC financial derivative instruments and collateral (received)/pledged as of June 30, 2013:
| (f) | Securities with an aggregate market value of $2,590 have been pledged as collateral for foreign currency contracts as governed by International Swaps and Derivatives Association, Inc. master agreements as of June 30, 2013. |
| Counterparty | Total Market Value of OTC Derivatives | Collateral (Received)/Pledged | Net Exposures (1) | |||||||||
BOA | $ | 1,792 | $ | (1,890 | ) | $ | (98 | ) | ||||
BRC | (435 | ) | 321 | (114 | ) | |||||||
DUB | (1,318 | ) | 1,420 | 102 | ||||||||
FBF | 482 | (480 | ) | 2 | ||||||||
HUS | 93 | 0 | 93 | |||||||||
JPM | (1 | ) | 0 | (1 | ) | |||||||
MSC | (747 | ) | 275 | (472 | ) | |||||||
UAG | 302 | 0 | 302 | |||||||||
| (1) | Net Exposures represents the net receivable/(payable) that would be due from/to the counterparty(ies) in the event of default and are not disclosed as assets or liabilities in the Statements of Assets and Liabilities. See note 7, Principal Risks, in the Notes to Financial Statements for more information regarding master netting arrangements. |
FAIR VALUE OF FINANCIAL DERIVATIVE INSTRUMENTS (1)
The following is a summary of the fair valuation of the Fund’s derivative instruments categorized by risk exposure:
Fair Values of Financial Derivative Instruments on the Statements of Assets and Liabilities as of June 30, 2013:
| Derivatives not accounted for as hedging instruments | ||||||||||||||||||||||||
| Commodity Contracts | Credit Contracts | Equity Contracts | Foreign Exchange Contracts | Interest Rate Contracts | Total | |||||||||||||||||||
Assets: | ||||||||||||||||||||||||
Variation margin receivable on financial derivative instruments (2) | $ | 0 | $ | 0 | $ | 0 | $ | 92 | $ | 0 | $ | 92 | ||||||||||||
Unrealized appreciation on foreign currency contracts | 0 | 0 | 0 | 4,195 | 0 | 4,195 | ||||||||||||||||||
|
|
|
|
|
|
|
|
|
|
|
| |||||||||||||
| $ | 0 | $ | 0 | $ | 0 | $ | 4,287 | $ | 0 | $ | 4,287 | |||||||||||||
|
|
|
|
|
|
|
|
|
|
|
| |||||||||||||
Liabilities: | ||||||||||||||||||||||||
Unrealized depreciation on foreign currency contracts | $ | 0 | $ | 0 | $ | 0 | $ | 4,027 | $ | 0 | $ | 4,027 | ||||||||||||
|
|
|
|
|
|
|
|
|
|
|
| |||||||||||||
The Effect of Financial Derivative Instruments on the Statements of Operations for the Period Ended June 30, 2013:
| Derivatives not accounted for as hedging instruments | ||||||||||||||||||||||||
| Commodity Contracts | Credit Contracts | Equity Contracts | Foreign Exchange Contracts | Interest Rate Contracts | Total | |||||||||||||||||||
Realized (Loss) on Derivatives: | ||||||||||||||||||||||||
Net realized (loss) on foreign currency transactions | $ | 0 | $ | 0 | $ | 0 | $ | (2,630 | ) | $ | 0 | $ | (2,630 | ) | ||||||||||
|
|
|
|
|
|
|
|
|
|
|
| |||||||||||||
Net Change in Unrealized Appreciation on Derivatives: | ||||||||||||||||||||||||
Net change in unrealized appreciation on futures contracts | $ | 0 | $ | 0 | $ | 0 | $ | 217 | $ | 0 | $ | 217 | ||||||||||||
Net change in unrealized appreciation on translation of assets and liabilities denominated in foreign currencies | 0 | 0 | 0 | 1,250 | 0 | 1,250 | ||||||||||||||||||
|
|
|
|
|
|
|
|
|
|
|
| |||||||||||||
| $ | 0 | $ | 0 | $ | 0 | $ | 1,467 | $ | 0 | $ | 1,467 | |||||||||||||
|
|
|
|
|
|
|
|
|
|
|
| |||||||||||||
| (1) | See note 6 in the Notes to Financial Statements for additional information. |
| (2) | Only current day’s variation margin is reported within the Statements of Assets and Liabilities. The variation margin is included in the open futures cumulative appreciation of $217 as reported in the Notes to Schedule of Investments. |
| See Accompanying Notes | ANNUAL REPORT | JUNE 30, 2013 | 55 |
Table of Contents
Schedule of Investments PIMCO EqS® Dividend Fund (Cont.)
June 30, 2013
FAIR VALUE MEASUREMENTS (1)
The following is a summary of the fair valuations according to the inputs used as of June 30, 2013 in valuing the Fund’s assets and liabilities:
| Category and Subcategory | Level 1 | Level 2 | Level 3 | Fair Value at 06/30/2013 | ||||||||||||
Investments, at value | ||||||||||||||||
Common Stocks | ||||||||||||||||
Australia | ||||||||||||||||
Financials | $ | 0 | $ | 14,196 | $ | 0 | $ | 14,196 | ||||||||
Bermuda | ||||||||||||||||
Energy | 3,126 | 0 | 0 | 3,126 | ||||||||||||
Brazil | ||||||||||||||||
Financials | 7,536 | 0 | 0 | 7,536 | ||||||||||||
Industrials | 5,277 | 0 | 0 | 5,277 | ||||||||||||
Utilities | 12,452 | 0 | 0 | 12,452 | ||||||||||||
Canada | ||||||||||||||||
Consumer Discretionary | 11,816 | 0 | 0 | 11,816 | ||||||||||||
Energy | 5,517 | 0 | 0 | 5,517 | ||||||||||||
China | ||||||||||||||||
Industrials | 0 | 5,472 | 0 | 5,472 | ||||||||||||
Cyprus | ||||||||||||||||
Energy | 0 | 15,271 | 0 | 15,271 | ||||||||||||
France | ||||||||||||||||
Energy | 0 | 15,295 | 0 | 15,295 | ||||||||||||
Health Care | 0 | 11,159 | 0 | 11,159 | ||||||||||||
Hong Kong | ||||||||||||||||
Consumer Discretionary | 0 | 1,944 | 0 | 1,944 | ||||||||||||
Industrials | 0 | 2,764 | 0 | 2,764 | ||||||||||||
Telecommunication Services | 0 | 2,746 | 0 | 2,746 | ||||||||||||
Italy | ||||||||||||||||
Industrials | 0 | 5,002 | 0 | 5,002 | ||||||||||||
Japan | ||||||||||||||||
Consumer Staples | 0 | 8,786 | 0 | 8,786 | ||||||||||||
Telecommunication Services | 0 | 17,460 | 0 | 17,460 | ||||||||||||
Netherlands | ||||||||||||||||
Energy | 0 | 15,159 | 0 | 15,159 | ||||||||||||
Panama | ||||||||||||||||
Industrials | 5,857 | 0 | 0 | 5,857 | ||||||||||||
Qatar | ||||||||||||||||
Utilities | 3,025 | 0 | 0 | 3,025 | ||||||||||||
South Africa | ||||||||||||||||
Consumer Discretionary | 0 | 6,162 | 0 | 6,162 | ||||||||||||
Health Care | 0 | 6,068 | 0 | 6,068 | ||||||||||||
Telecommunication Services | 0 | 12,370 | 0 | 12,370 | ||||||||||||
Spain | ||||||||||||||||
Utilities | 0 | 17,013 | 0 | 17,013 | ||||||||||||
Switzerland | ||||||||||||||||
Health Care | 0 | 22,813 | 0 | 22,813 | ||||||||||||
| Category and Subcategory | Level 1 | Level 2 | Level 3 | Fair Value at 06/30/2013 | ||||||||||||
Thailand | ||||||||||||||||
Industrials | $ | 0 | $ | 2,467 | $ | 0 | $ | 2,467 | ||||||||
Turkey | ||||||||||||||||
Industrials | 0 | 5,461 | 0 | 5,461 | ||||||||||||
United Kingdom | ||||||||||||||||
Consumer Discretionary | 0 | 6,773 | 0 | 6,773 | ||||||||||||
Consumer Staples | 0 | 8,091 | 0 | 8,091 | ||||||||||||
Financials | 0 | 24,431 | 0 | 24,431 | ||||||||||||
Telecommunication Services | 0 | 16,146 | 0 | 16,146 | ||||||||||||
United States | ||||||||||||||||
Consumer Discretionary | 35,168 | 0 | 0 | 35,168 | ||||||||||||
Consumer Staples | 25,719 | 0 | 0 | 25,719 | ||||||||||||
Energy | 16,999 | 0 | 0 | 16,999 | ||||||||||||
Financials | 89,234 | 0 | 0 | 89,234 | ||||||||||||
Health Care | 33,811 | 0 | 0 | 33,811 | ||||||||||||
Industrials | 8,887 | 0 | 0 | 8,887 | ||||||||||||
Information Technology | 61,033 | 0 | 0 | 61,033 | ||||||||||||
Equity-Linked Securities | ||||||||||||||||
Saudi Arabia | ||||||||||||||||
Consumer Discretionary | 0 | 1,177 | 0 | 1,177 | ||||||||||||
Consumer Staples | 0 | 5,592 | 0 | 5,592 | ||||||||||||
Real Estate Investment Trusts | ||||||||||||||||
United States | 12,362 | 0 | 0 | 12,362 | ||||||||||||
Short-Term Instruments | ||||||||||||||||
Repurchase Agreements | 0 | 952 | 0 | 952 | ||||||||||||
Short-Term Notes | 0 | 500 | 0 | 500 | ||||||||||||
U.S. Treasury Bills | 0 | 2,938 | 0 | 2,938 | ||||||||||||
Central Funds Used for Cash Management Purposes | 19,574 | 0 | 0 | 19,574 | ||||||||||||
| $ | 357,393 | $ | 254,208 | $ | 0 | $ | 611,601 | |||||||||
Financial Derivative Instruments - Assets |
| |||||||||||||||
Foreign Exchange Contracts | $ | 217 | $ | 4,195 | $ | 0 | $ | 4,412 | ||||||||
Financial Derivative Instruments - Liabilities |
| |||||||||||||||
Foreign Exchange Contracts | $ | 0 | $ | (4,027 | ) | $ | 0 | $ | (4,027 | ) | ||||||
Totals | $ | 357,610 | $ | 254,376 | $ | 0 | $ | 611,986 | ||||||||
There were assets and liabilities valued at $3,025 transferred from Level 2 to Level 1 during the period ended June 30, 2013.
| (1) | See note 3 in the Notes to Financial Statements for more information regarding pricing inputs, valuation techniques and transfers. |
| 56 | PIMCO EQUITY SERIES | See Accompanying Notes |
Table of Contents
Schedule of Investments PIMCO EqS® Emerging Markets Fund
June 30, 2013
| SHARES | MARKET VALUE (000S) | |||||||||||
| COMMON STOCKS 86.8% | ||||||||||||
| AUSTRALIA 1.6% | ||||||||||||
| MATERIALS 1.6% | ||||||||||||
Iluka Resources Ltd. | 892,634 | $ | 8,044 | |||||||||
|
| |||||||||||
Total Australia | 8,044 | |||||||||||
|
| |||||||||||
| BERMUDA 1.1% | ||||||||||||
| ENERGY 1.1% | ||||||||||||
Seadrill Ltd. | 135,440 | 5,455 | ||||||||||
|
| |||||||||||
Total Bermuda | 5,455 | |||||||||||
|
| |||||||||||
| BRAZIL 8.5% | ||||||||||||
| CONSUMER DISCRETIONARY 1.2% | ||||||||||||
Anhanguera Educacional Participacoes S.A. | 1,045,700 | 6,045 | ||||||||||
|
| |||||||||||
| CONSUMER STAPLES 1.9% | ||||||||||||
Cia de Bebidas das Americas SP - ADR | 264,514 | 9,880 | ||||||||||
|
| |||||||||||
| FINANCIALS 4.9% | ||||||||||||
BB Seguridade Participacoes S.A. (a) | 1,166,827 | 9,204 | ||||||||||
Itau Unibanco Holding S.A. SP - ADR | 1,226,421 | 15,845 | ||||||||||
|
| |||||||||||
| 25,049 | ||||||||||||
|
| |||||||||||
| UTILITIES 0.5% | ||||||||||||
Cia de Saneamento Basico do Estado de Sao Paulo SP - ADR | 251,404 | 2,617 | ||||||||||
|
| |||||||||||
Total Brazil | 43,591 | |||||||||||
|
| |||||||||||
| CAMBODIA 1.6% | ||||||||||||
| CONSUMER DISCRETIONARY 1.6% | ||||||||||||
NagaCorp Ltd. | 10,300,000 | 8,019 | ||||||||||
|
| |||||||||||
Total Cambodia | 8,019 | |||||||||||
|
| |||||||||||
| CANADA 0.9% | ||||||||||||
| MATERIALS 0.9% | ||||||||||||
Turquoise Hill Resources Ltd. (a) | 802,076 | 4,756 | ||||||||||
|
| |||||||||||
Total Canada | 4,756 | |||||||||||
|
| |||||||||||
| CHINA 8.2% | ||||||||||||
| CONSUMER DISCRETIONARY 1.7% | ||||||||||||
Dongfeng Motor Group Co. Ltd. ‘H’ | 3,608,000 | 4,786 | ||||||||||
Xingda International Holdings Ltd. | 9,244,000 | 3,912 | ||||||||||
|
| |||||||||||
| 8,698 | ||||||||||||
|
| |||||||||||
| CONSUMER STAPLES 1.2% | ||||||||||||
Shenguan Holdings Group Ltd. | 13,146,000 | 6,159 | ||||||||||
|
| |||||||||||
| ENERGY 1.4% | ||||||||||||
China Shenhua Energy Co. Ltd. | 2,767,000 | 6,998 | ||||||||||
|
| |||||||||||
| SHARES | MARKET VALUE (000S) | |||||||||||
| INDUSTRIALS 1.8% | ||||||||||||
China Automation Group Ltd. | 653,000 | $ | 126 | |||||||||
First Tractor Co. Ltd. ‘H’ | 3,688,000 | 2,016 | ||||||||||
Shanghai Electric Group Co. Ltd. | 20,446,000 | 6,836 | ||||||||||
|
| |||||||||||
| 8,978 | ||||||||||||
|
| |||||||||||
| INFORMATION TECHNOLOGY 1.1% | ||||||||||||
Baidu, Inc. SP - ADR (a) | 60,587 | 5,727 | ||||||||||
|
| |||||||||||
| MATERIALS 1.0% | ||||||||||||
China Shanshui Cement Group Ltd. | 11,848,000 | 5,275 | ||||||||||
|
| |||||||||||
Total China | 41,835 | |||||||||||
|
| |||||||||||
| CYPRUS 2.3% | ||||||||||||
| INDUSTRIALS 2.3% | ||||||||||||
Global Ports Investment PLC SP - GDR | 308,215 | 4,102 | ||||||||||
Globaltrans Investment PLC SP - GDR | 548,172 | 7,532 | ||||||||||
|
| |||||||||||
| 11,634 | ||||||||||||
|
| |||||||||||
Total Cyprus | 11,634 | |||||||||||
|
| |||||||||||
| DENMARK 1.9% | ||||||||||||
| CONSUMER STAPLES 1.9% | ||||||||||||
Carlsberg A/S ‘B’ | 106,722 | 9,543 | ||||||||||
|
| |||||||||||
Total Denmark | 9,543 | |||||||||||
|
| |||||||||||
| FINLAND 0.7% | ||||||||||||
| MATERIALS 0.7% | ||||||||||||
Kemira OYJ | 226,601 | 3,426 | ||||||||||
|
| |||||||||||
Total Finland | 3,426 | |||||||||||
|
| |||||||||||
| HONG KONG 6.4% | ||||||||||||
| CONSUMER DISCRETIONARY 0.7% | ||||||||||||
Melco Crown Entertainment Ltd. ADR (a) | 167,207 | 3,739 | ||||||||||
|
| |||||||||||
| FINANCIALS 3.1% | ||||||||||||
AIA Group Ltd. | 2,678,584 | 11,285 | ||||||||||
Glorious Property Holdings Ltd. | 29,562,000 | 4,461 | ||||||||||
|
| |||||||||||
| 15,746 | ||||||||||||
|
| |||||||||||
| INFORMATION TECHNOLOGY 0.2% | ||||||||||||
China High Precision Automation Group Ltd. | 8,446,000 | 930 | ||||||||||
|
| |||||||||||
| TELECOMMUNICATION SERVICES 2.4% | ||||||||||||
China Mobile Ltd. | 1,165,500 | 12,101 | ||||||||||
|
| |||||||||||
Total Hong Kong | 32,516 | |||||||||||
|
| |||||||||||
| INDIA 6.1% | ||||||||||||
| CONSUMER DISCRETIONARY 1.5% | ||||||||||||
Tata Motors Ltd. | 1,615,941 | 7,547 | ||||||||||
Tata Motors Ltd. ADR | 11,011 | 258 | ||||||||||
|
| |||||||||||
| 7,805 | ||||||||||||
|
| |||||||||||
| SHARES | MARKET VALUE (000S) | |||||||||||
| FINANCIALS 4.6% | ||||||||||||
Axis Bank Ltd. | 346,243 | $ | 7,699 | |||||||||
Housing Development Finance Corp. | 642,675 | 9,332 | ||||||||||
Yes Bank Ltd. | 793,252 | 6,148 | ||||||||||
|
| |||||||||||
| 23,179 | ||||||||||||
|
| |||||||||||
Total India | 30,984 | |||||||||||
|
| |||||||||||
| INDONESIA 2.3% | ||||||||||||
| CONSUMER DISCRETIONARY 1.6% | ||||||||||||
Matahari Department Store Tbk PT (a) | 6,890,000 | 8,056 | ||||||||||
|
| |||||||||||
| FINANCIALS 0.7% | ||||||||||||
Bank Mandiri Persero Tbk PT | 4,247,500 | 3,831 | ||||||||||
|
| |||||||||||
Total Indonesia | 11,887 | |||||||||||
|
| |||||||||||
| ISRAEL 3.4% | ||||||||||||
| HEALTH CARE 0.9% | ||||||||||||
Teva Pharmaceutical Industries Ltd. SP - ADR | 124,271 | 4,871 | ||||||||||
|
| |||||||||||
| MATERIALS 2.5% | ||||||||||||
Israel Chemicals Ltd. | 1,302,444 | 12,791 | ||||||||||
|
| |||||||||||
Total Israel | 17,662 | |||||||||||
|
| |||||||||||
| ITALY 2.0% | ||||||||||||
| CONSUMER DISCRETIONARY 2.0% | ||||||||||||
Prada SpA | 1,123,400 | 10,145 | ||||||||||
|
| |||||||||||
Total Italy | 10,145 | |||||||||||
|
| |||||||||||
| JAPAN 3.2% | ||||||||||||
| CONSUMER DISCRETIONARY 1.4% | ||||||||||||
Toyota Motor Corp. | 119,700 | 7,220 | ||||||||||
|
| |||||||||||
| INDUSTRIALS 1.8% | ||||||||||||
Mitsubishi Electric Corp. | 980,000 | 9,157 | ||||||||||
|
| |||||||||||
Total Japan | 16,377 | |||||||||||
|
| |||||||||||
| KAZAKHSTAN 2.0% | ||||||||||||
| ENERGY 0.1% | ||||||||||||
KazMunaiGas Exploration Production SP - GDR | 43,962 | 664 | ||||||||||
|
| |||||||||||
| TELECOMMUNICATION SERVICES 1.9% | ||||||||||||
KCell JSC GDR | 625,325 | 9,411 | ||||||||||
|
| |||||||||||
Total Kazakhstan | 10,075 | |||||||||||
|
| |||||||||||
| MACAU 1.9% | ||||||||||||
| CONSUMER DISCRETIONARY 1.9% | ||||||||||||
Wynn Macau Ltd. | 3,606,800 | 9,725 | ||||||||||
|
| |||||||||||
Total Macau | 9,725 | |||||||||||
|
| |||||||||||
| MEXICO 2.1% | ||||||||||||
| FINANCIALS 2.1% | ||||||||||||
Bolsa Mexicana de Valores S.A.B. de C.V. | 4,349,100 | 10,814 | ||||||||||
|
| |||||||||||
Total Mexico | 10,814 | |||||||||||
|
| |||||||||||
| See Accompanying Notes | ANNUAL REPORT | JUNE 30, 2013 | 57 |
Table of Contents
Schedule of Investments PIMCO EqS® Emerging Markets Fund (Cont.)
| SHARES | MARKET VALUE (000S) | |||||||||||
| NORWAY 1.2% | ||||||||||||
| CONSUMER STAPLES 1.2% | ||||||||||||
Marine Harvest ASA | 6,086,783 | $ | 6,187 | |||||||||
|
| |||||||||||
Total Norway | 6,187 | |||||||||||
|
| |||||||||||
| PERU 2.8% | ||||||||||||
| FINANCIALS 1.9% | ||||||||||||
Credicorp Ltd. | 77,111 | 9,867 | ||||||||||
|
| |||||||||||
| MATERIALS 0.9% | ||||||||||||
Cementos Pacasmayo S.A.A. - ADR | 349,412 | 4,448 | ||||||||||
|
| |||||||||||
Total Peru | 14,315 | |||||||||||
|
| |||||||||||
| PHILIPPINES 1.0% | ||||||||||||
| UTILITIES 1.0% | ||||||||||||
First Gen Corp. (a) | 13,555,000 | 5,319 | ||||||||||
|
| |||||||||||
Total Philippines | 5,319 | |||||||||||
|
| |||||||||||
| RUSSIA 8.1% | ||||||||||||
| CONSUMER STAPLES 1.1% | ||||||||||||
X5 Retail Group NV SP - GDR (a) | 294,532 | 5,326 | ||||||||||
|
| |||||||||||
| ENERGY 1.9% | ||||||||||||
NovaTek OAO SP - GDR | 82,601 | 9,870 | ||||||||||
|
| |||||||||||
| FINANCIALS 1.5% | ||||||||||||
Sberbank of Russia ADR | 674,072 | 7,739 | ||||||||||
|
| |||||||||||
| MATERIALS 1.2% | ||||||||||||
Magnitogorsk Iron & Steel Works SP - GDR | 1,942,536 | 5,760 | ||||||||||
Mechel SP - ADR | 665,418 | 572 | ||||||||||
|
| |||||||||||
| 6,332 | ||||||||||||
|
| |||||||||||
| TELECOMMUNICATION SERVICES 2.4% | ||||||||||||
MegaFon OAO GDR | 385,574 | 12,049 | ||||||||||
|
| |||||||||||
Total Russia | 41,316 | |||||||||||
|
| |||||||||||
| SOUTH AFRICA 2.6% | ||||||||||||
| CONSUMER STAPLES 1.1% | ||||||||||||
Tongaat Hulett Ltd. | 437,517 | 5,555 | ||||||||||
|
| |||||||||||
| TELECOMMUNICATION SERVICES 1.5% | ||||||||||||
Vodacom Group Ltd. | 720,773 | 7,649 | ||||||||||
|
| |||||||||||
Total South Africa | 13,204 | |||||||||||
|
| |||||||||||
| SOUTH KOREA 6.2% | ||||||||||||
| CONSUMER DISCRETIONARY 3.3% | ||||||||||||
Kia Motors Corp. | 308,802 | 16,676 | ||||||||||
|
| |||||||||||
| INFORMATION TECHNOLOGY 2.9% | ||||||||||||
Samsung Electronics Co. Ltd. | 12,795 | 14,955 | ||||||||||
|
| |||||||||||
Total South Korea | 31,631 | |||||||||||
|
| |||||||||||
| SHARES | MARKET VALUE (000S) | |||||||||||
| TAIWAN 1.1% | ||||||||||||
| INFORMATION TECHNOLOGY 1.1% | ||||||||||||
Chicony Electronics Co. Ltd. | 2,270,025 | $ | 5,899 | |||||||||
|
| |||||||||||
Total Taiwan | 5,899 | |||||||||||
|
| |||||||||||
| THAILAND 2.2% | ||||||||||||
| CONSUMER STAPLES 0.9% | ||||||||||||
Thai Beverage PCL | 9,363,000 | 4,353 | ||||||||||
|
| |||||||||||
| FINANCIALS 1.3% | ||||||||||||
Kasikornbank PCL | 1,110,400 | 6,780 | ||||||||||
|
| |||||||||||
Total Thailand | 11,133 | |||||||||||
|
| |||||||||||
| TURKEY 1.7% | ||||||||||||
| TELECOMMUNICATION SERVICES 1.7% | ||||||||||||
Turk Telekomunikasyon A/S | 2,263,577 | 8,761 | ||||||||||
|
| |||||||||||
Total Turkey | 8,761 | |||||||||||
|
| |||||||||||
| UNITED KINGDOM 3.7% | ||||||||||||
| CONSUMER STAPLES 1.8% | ||||||||||||
British American Tobacco PLC | 183,920 | 9,433 | ||||||||||
|
| |||||||||||
| ENERGY 1.1% | ||||||||||||
Afren PLC (a) | 2,755,405 | 5,432 | ||||||||||
|
| |||||||||||
| FINANCIALS 0.8% | ||||||||||||
Standard Chartered PLC | 176,453 | 3,831 | ||||||||||
|
| |||||||||||
Total United Kingdom | 18,696 | |||||||||||
|
| |||||||||||
Total Common Stocks |
| 442,949 | ||||||||||
|
| |||||||||||
| UNITS | ||||||||||||
| EQUITY-LINKED SECURITIES 3.2% | ||||||||||||
| CHINA 2.4% | ||||||||||||
| CONSUMER STAPLES 2.4% | ||||||||||||
JPMorgan Chase & Co. Chinese Exchange Basket - Exp. 01/08/2014 | 110,922 | 12,267 | ||||||||||
|
| |||||||||||
Total China | 12,267 | |||||||||||
|
| |||||||||||
| NIGERIA 0.8% | ||||||||||||
| CONSUMER STAPLES 0.8% | ||||||||||||
HSBC Bank PLC | ||||||||||||
Guinness Nigeria PLC - Exp. 12/09/2014 | 562,117 | 869 | ||||||||||
Nigerian Breweries PLC - Exp. 12/09/2014 | 3,066,979 | 2,946 | ||||||||||
Merrill Lynch International & Co. | ||||||||||||
Guinness Nigeria PLC - Exp. 11/10/2014 | 10,178 | 16 | ||||||||||
Nigerian Breweries PLC - Exp. 11/10/2014 | 251,197 | 241 | ||||||||||
|
| |||||||||||
Total Nigeria | 4,072 | |||||||||||
|
| |||||||||||
Total Equity-Linked Securities |
| 16,339 | ||||||||||
|
| |||||||||||
| SHARES | MARKET VALUE (000S) | |||||||||||
| EXCHANGE-TRADED FUNDS 1.6% | ||||||||||||
| LUXEMBOURG 1.6% | ||||||||||||
db x-trackers - CSI300 Index ETF | 11,817,300 | $ | 8,151 | |||||||||
|
| |||||||||||
Total Exchange-Traded Funds |
| 8,151 | ||||||||||
|
| |||||||||||
| PREFERRED STOCKS 4.1% | ||||||||||||
| BRAZIL 1.8% | ||||||||||||
| CONSUMER STAPLES 1.8% | ||||||||||||
Cia Brasileira de Distribuicao Grupo Pao de Acucar | 200,442 | 8,947 | ||||||||||
|
| |||||||||||
Total Brazil | 8,947 | |||||||||||
|
| |||||||||||
| SOUTH KOREA 2.3% | ||||||||||||
| INFORMATION TECHNOLOGY 2.3% | ||||||||||||
Samsung Electronics Co. Ltd. | 15,449 | 11,914 | ||||||||||
|
| |||||||||||
Total South Korea | 11,914 | |||||||||||
|
| |||||||||||
Total Preferred Stocks | 20,861 | |||||||||||
|
| |||||||||||
| PRINCIPAL AMOUNT (000S) | ||||||||||||
| U.S. TREASURY OBLIGATIONS 0.0% | ||||||||||||
| UNITED STATES 0.0% | ||||||||||||
U.S. Treasury Notes | ||||||||||||
1.250% due 04/15/2014 (g) | $ | 4 | 4 | |||||||||
|
| |||||||||||
Total U.S. Treasury Obligations | 4 | |||||||||||
|
| |||||||||||
| SHORT-TERM INSTRUMENTS 4.2% | ||||||||||||
| REPURCHASE AGREEMENTS (d) 0.1% | ||||||||||||
| 575 | ||||||||||||
|
| |||||||||||
| U.S. TREASURY BILLS 2.2% | ||||||||||||
0.096% due 08/15/2013 - 05/29/2014 (b)(e)(g) | 11,455 | 11,447 | ||||||||||
|
| |||||||||||
| SHARES | ||||||||||||
| CENTRAL FUNDS USED FOR CASH MANAGEMENT PURPOSES (c) 1.9% | ||||||||||||
PIMCO Short-Term Floating NAV Portfolio | 989,740 | 9,903 | ||||||||||
|
| |||||||||||
Total Short-Term Instruments | 21,925 | |||||||||||
|
| |||||||||||
| Total Investments 99.9% (Cost $531,815) | $ | 510,229 | ||||||||||
| Written Options (f) (0.1%) (Premiums $108) | (531 | ) | ||||||||||
| Other Assets and Liabilities (Net) 0.2% | 948 | |||||||||||
|
| |||||||||||
| Net Assets 100.0% | $ | 510,646 | ||||||||||
|
| |||||||||||
| 58 | PIMCO EQUITY SERIES | See Accompanying Notes |
Table of Contents
June 30, 2013
Notes to Schedule of Investments (amounts in thousands*, except number of contracts or shares):
| * | A zero balance may reflect actual amounts rounding to less than one thousand. |
| (a) | Security did not produce income within the last twelve months. |
| (b) | Coupon represents a weighted average yield to maturity. |
| (c) | Affiliated to the Fund. |
BORROWINGS AND OTHER FINANCING TRANSACTIONS
| (d) | Repurchase Agreements: |
| Counterparty | Lending Rate | Settlement Date | Maturity Date | Principal Amount | Collateralized By | Collateral (Received), At Value | Repurchase Agreements, At Value | Repurchase Proceeds (1) | ||||||||||||||||||||||
SSB | 0.010 | % | 06/28/2013 | 07/01/2013 | $ | 575 | Fannie Mae 2.200% due 10/17/2022 | $ | (590 | ) | $ | 575 | $ | 575 | ||||||||||||||||
|
|
|
|
|
| |||||||||||||||||||||||||
| (1) | Includes accrued interest. |
EXCHANGE-TRADED OR CENTRALLY CLEARED FINANCIAL DERIVATIVE INSTRUMENTS
| (e) | Securities with an aggregate market value of $59 have been pledged as collateral for exchange-traded and centrally cleared financial derivative instruments as of June 30, 2013. As of June 30, 2013, there were no open exchange-traded or centrally cleared financial derivative instruments. |
OTC FINANCIAL DERIVATIVE INSTRUMENTS
Foreign Currency Contracts:
| Settlement Month | Currency to | Currency to | Counterparty | Unrealized Appreciation | Unrealized (Depreciation) | Net Unrealized Appreciation/ (Depreciation) | ||||||||||||||||||||||||
07/2013 | HKD | 2,741 | $ | 353 | CBK | $ | 0 | $ | 0 | $ | 0 | |||||||||||||||||||
07/2013 | 122,354 | 15,770 | HUS | 0 | (6 | ) | (6 | ) | ||||||||||||||||||||||
07/2013 | 240 | 31 | MSC | 0 | 0 | 0 | ||||||||||||||||||||||||
07/2013 | 14,584 | 1,880 | UAG | 0 | 0 | 0 | ||||||||||||||||||||||||
07/2013 | IDR | 20,089,920 | 2,036 | BPS | 31 | 0 | 31 | |||||||||||||||||||||||
07/2013 | 25,988,483 | 2,548 | BRC | 0 | (45 | ) | (45 | ) | ||||||||||||||||||||||
07/2013 | 57,639,413 | 5,815 | CBK | 64 | 0 | 64 | ||||||||||||||||||||||||
07/2013 | 11,729,250 | 1,170 | JPM | 0 | 0 | 0 | ||||||||||||||||||||||||
07/2013 | ILS | 84,826 | 23,203 | MSC | 0 | (113 | ) | (113 | ) | |||||||||||||||||||||
07/2013 | INR | 526,489 | 9,340 | HUS | 518 | 0 | 518 | |||||||||||||||||||||||
07/2013 | 32,556 | 590 | JPM | 45 | 0 | 45 | ||||||||||||||||||||||||
07/2013 | KRW | 30,614,207 | 26,385 | BRC | 0 | (400 | ) | (400 | ) | |||||||||||||||||||||
07/2013 | MYR | 903 | 300 | JPM | 15 | 0 | 15 | |||||||||||||||||||||||
07/2013 | 62,479 | 19,376 | SCX | 0 | (338 | ) | (338 | ) | ||||||||||||||||||||||
07/2013 | PHP | 7,813 | 180 | BOA | 0 | (1 | ) | (1 | ) | |||||||||||||||||||||
07/2013 | THB | 38,946 | 1,263 | HUS | 8 | 0 | 8 | |||||||||||||||||||||||
07/2013 | TWD | 19,429 | 650 | JPM | 2 | 0 | 2 | |||||||||||||||||||||||
07/2013 | 1,090,640 | 36,355 | UAG | 0 | (43 | ) | (43 | ) | ||||||||||||||||||||||
07/2013 | $ | 20,927 | HKD | 162,342 | HUS | 5 | 0 | 5 | ||||||||||||||||||||||
07/2013 | 16,161 | 125,335 | JPM | 0 | (1 | ) | (1 | ) | ||||||||||||||||||||||
07/2013 | 1,880 | 14,584 | MSC | 0 | 0 | 0 | ||||||||||||||||||||||||
07/2013 | 943 | IDR | 9,483,334 | HUS | 4 | 0 | 4 | |||||||||||||||||||||||
07/2013 | 10,699 | 105,963,732 | SCX | 0 | (125 | ) | (125 | ) | ||||||||||||||||||||||
07/2013 | 20,617 | ILS | 74,759 | JPM | 0 | (68 | ) | (68 | ) | |||||||||||||||||||||
07/2013 | 2,767 | 10,067 | MSC | 0 | 0 | 0 | ||||||||||||||||||||||||
07/2013 | 197 | 714 | UAG | 0 | 0 | 0 | ||||||||||||||||||||||||
07/2013 | 10,055 | INR | 559,045 | UAG | 0 | (687 | ) | (687 | ) | |||||||||||||||||||||
07/2013 | 27,422 | KRW | 30,614,207 | SCX | 0 | (637 | ) | (637 | ) | |||||||||||||||||||||
07/2013 | 20,153 | MYR | 63,382 | BRC | 0 | (154 | ) | (154 | ) | |||||||||||||||||||||
07/2013 | 1,720 | 5,496 | JPM | 14 | 0 | 14 | ||||||||||||||||||||||||
07/2013 | 1,310 | THB | 38,946 | FBF | 0 | (55 | ) | (55 | ) | |||||||||||||||||||||
07/2013 | 37,219 | TWD | 1,110,069 | CBK | 0 | (173 | ) | (173 | ) | |||||||||||||||||||||
07/2013 | 30,033 | ZAR | 275,756 | BOA | 0 | (2,250 | ) | (2,250 | ) | |||||||||||||||||||||
07/2013 | 771 | 7,140 | BRC | 0 | (51 | ) | (51 | ) | ||||||||||||||||||||||
07/2013 | 403 | 4,083 | DUB | 8 | 0 | 8 | ||||||||||||||||||||||||
07/2013 | ZAR | 22,931 | $ | 2,230 | BRC | 0 | (80 | ) | (80 | ) | ||||||||||||||||||||
07/2013 | 5,477 | 589 | GLM | 37 | 0 | 37 | ||||||||||||||||||||||||
07/2013 | 3,712 | 370 | HUS | 0 | (4 | ) | (4 | ) | ||||||||||||||||||||||
07/2013 | 37,150 | 4,077 | JPM | 334 | 0 | 334 | ||||||||||||||||||||||||
07/2013 | 1,006 | 100 | MSC | 0 | (1 | ) | (1 | ) | ||||||||||||||||||||||
08/2013 | AUD | 9,670 | 9,374 | BOA | 564 | 0 | 564 | |||||||||||||||||||||||
08/2013 | BRL | 9,627 | 4,733 | BOA | 448 | 0 | 448 | |||||||||||||||||||||||
08/2013 | 2,708 | 1,190 | BRC | 0 | (15 | ) | (15 | ) | ||||||||||||||||||||||
08/2013 | CNY | 129,319 | 20,903 | UAG | 22 | 0 | 22 | |||||||||||||||||||||||
08/2013 | CZK | 4,931 | 250 | CBK | 3 | 0 | 3 | |||||||||||||||||||||||
| See Accompanying Notes | ANNUAL REPORT | JUNE 30, 2013 | 59 |
Table of Contents
Schedule of Investments PIMCO EqS® Emerging Markets Fund (Cont.)
| Settlement Month | Currency to be Delivered | Currency to be Received | Counterparty | Unrealized Appreciation | Unrealized (Depreciation) | Net Unrealized Appreciation/ (Depreciation) | ||||||||||||||||||||||||
08/2013 | DKK | 68,340 | $ | 11,873 | RYL | $ | 0 | $ | (61 | ) | $ | (61 | ) | |||||||||||||||||
08/2013 | EUR | 7,240 | 9,323 | FBF | 0 | (103 | ) | (103 | ) | |||||||||||||||||||||
08/2013 | 7,508 | 9,814 | GLM | 40 | 0 | 40 | ||||||||||||||||||||||||
08/2013 | GBP | 13,869 | 20,986 | RYL | 0 | (100 | ) | (100 | ) | |||||||||||||||||||||
08/2013 | JPY | 2,894,500 | 28,265 | CBK | 2 | (927 | ) | (925 | ) | |||||||||||||||||||||
08/2013 | 584,138 | 5,640 | GLM | 0 | (251 | ) | (251 | ) | ||||||||||||||||||||||
08/2013 | NOK | 67,875 | 11,703 | BPS | 550 | 0 | 550 | |||||||||||||||||||||||
08/2013 | PLN | 1,003 | 300 | HUS | 0 | (1 | ) | (1 | ) | |||||||||||||||||||||
08/2013 | $ | 827 | AUD | 903 | DUB | 0 | (4 | ) | (4 | ) | ||||||||||||||||||||
08/2013 | 2,512 | BRL | 5,103 | UAG | 0 | (241 | ) | (241 | ) | |||||||||||||||||||||
08/2013 | 1,060 | CNY | 6,577 | JPM | 2 | 0 | 2 | |||||||||||||||||||||||
08/2013 | 1,511 | CZK | 29,696 | MSC | 0 | (25 | ) | (25 | ) | |||||||||||||||||||||
08/2013 | 2,448 | DKK | 13,931 | DUB | 0 | (16 | ) | (16 | ) | |||||||||||||||||||||
08/2013 | 5,792 | EUR | 4,465 | RBC | 22 | 0 | 22 | |||||||||||||||||||||||
08/2013 | 2,912 | GBP | 1,896 | CBK | 0 | (30 | ) | (30 | ) | |||||||||||||||||||||
08/2013 | 1,189 | JPY | 121,800 | BPS | 40 | 0 | 40 | |||||||||||||||||||||||
08/2013 | 1,194 | 116,850 | CBK | 0 | (16 | ) | (16 | ) | ||||||||||||||||||||||
08/2013 | 10,109 | 964,432 | RYL | 0 | (383 | ) | (383 | ) | ||||||||||||||||||||||
08/2013 | 5,634 | 577,900 | SOG | 194 | 0 | 194 | ||||||||||||||||||||||||
08/2013 | 1,519 | 149,300 | UAG | 0 | (14 | ) | (14 | ) | ||||||||||||||||||||||
08/2013 | 582 | NOK | 3,405 | BPS | 0 | (23 | ) | (23 | ) | |||||||||||||||||||||
08/2013 | 9,294 | PLN | 29,511 | GLM | 0 | (436 | ) | (436 | ) | |||||||||||||||||||||
09/2013 | MXN | 102,366 | $ | 7,894 | CBK | 48 | 0 | 48 | ||||||||||||||||||||||
09/2013 | $ | 9,650 | CLP | 4,961,065 | MSC | 4 | 0 | 4 | ||||||||||||||||||||||
09/2013 | 13,606 | MXN | 167,988 | JPM | 0 | (730 | ) | (730 | ) | |||||||||||||||||||||
09/2013 | 13,978 | 173,648 | UAG | 0 | (669 | ) | (669 | ) | ||||||||||||||||||||||
10/2013 | HKD | 146,171 | $ | 18,852 | JPM | 0 | (2 | ) | (2 | ) | ||||||||||||||||||||
10/2013 | ILS | 69,939 | 19,245 | JPM | 57 | 0 | 57 | |||||||||||||||||||||||
10/2013 | PEN | 13,091 | 5,010 | BOA | 342 | 0 | 342 | |||||||||||||||||||||||
10/2013 | 5,390 | 1,910 | BPS | 0 | (12 | ) | (12 | ) | ||||||||||||||||||||||
10/2013 | 33,943 | 13,137 | FBF | 1,036 | 0 | 1,036 | ||||||||||||||||||||||||
10/2013 | PHP | 7,475 | 172 | JPM | 0 | (1 | ) | (1 | ) | |||||||||||||||||||||
10/2013 | RUB | 911,263 | 27,987 | BOA | 675 | 0 | 675 | |||||||||||||||||||||||
10/2013 | 7,537 | 226 | BRC | 0 | 0 | 0 | ||||||||||||||||||||||||
10/2013 | 85,463 | 2,558 | CBK | 0 | (4 | ) | (4 | ) | ||||||||||||||||||||||
10/2013 | 4,272 | 133 | DUB | 5 | 0 | 5 | ||||||||||||||||||||||||
10/2013 | 50,450 | 1,540 | GLM | 28 | 0 | 28 | ||||||||||||||||||||||||
10/2013 | 414,899 | 12,583 | JPM | 167 | (20 | ) | 147 | |||||||||||||||||||||||
10/2013 | TRY | 1,651 | 870 | BRC | 27 | 0 | 27 | |||||||||||||||||||||||
10/2013 | 335 | 170 | CBK | 0 | (1 | ) | (1 | ) | ||||||||||||||||||||||
10/2013 | 3,424 | 1,752 | JPM | 16 | (12 | ) | 4 | |||||||||||||||||||||||
10/2013 | $ | 6,030 | COP | 11,755,485 | MSC | 19 | 0 | 19 | ||||||||||||||||||||||
10/2013 | 1,881 | HKD | 14,584 | UAG | 0 | 0 | 0 | |||||||||||||||||||||||
10/2013 | 2,491 | IDR | 25,988,483 | BRC | 12 | 0 | 12 | |||||||||||||||||||||||
10/2013 | 2,140 | 22,660,460 | MSC | 42 | 0 | 42 | ||||||||||||||||||||||||
10/2013 | 1,020 | INR | 62,200 | CBK | 4 | 0 | 4 | |||||||||||||||||||||||
10/2013 | 3,330 | 196,424 | HUS | 0 | (95 | ) | (95 | ) | ||||||||||||||||||||||
10/2013 | 26,294 | KRW | 30,614,207 | BRC | 381 | 0 | 381 | |||||||||||||||||||||||
10/2013 | 5,720 | 6,630,052 | UAG | 57 | 0 | 57 | ||||||||||||||||||||||||
10/2013 | 19,274 | MYR | 62,479 | SCX | 277 | 0 | 277 | |||||||||||||||||||||||
10/2013 | 6,569 | PEN | 16,971 | FBF | 0 | (519 | ) | (519 | ) | |||||||||||||||||||||
10/2013 | 799 | RUB | 26,729 | HUS | 2 | 0 | 2 | |||||||||||||||||||||||
10/2013 | 4,440 | 142,728 | JPM | 0 | (162 | ) | (162 | ) | ||||||||||||||||||||||
10/2013 | 1,257 | THB | 38,946 | HUS | 0 | (8 | ) | (8 | ) | |||||||||||||||||||||
10/2013 | 2,280 | 71,478 | JPM | 13 | 0 | 13 | ||||||||||||||||||||||||
10/2013 | 566 | TRY | 1,059 | HUS | 0 | (25 | ) | (25 | ) | |||||||||||||||||||||
10/2013 | 235 | 428 | JPM | 0 | (16 | ) | (16 | ) | ||||||||||||||||||||||
10/2013 | 3,617 | 6,640 | MSC | 0 | (227 | ) | (227 | ) | ||||||||||||||||||||||
10/2013 | 36,418 | TWD | 1,090,640 | UAG | 27 | 0 | 27 | |||||||||||||||||||||||
|
|
|
|
|
| |||||||||||||||||||||||||
| $ | 6,211 | $ | (10,381 | ) | $ | (4,170 | ) | |||||||||||||||||||||||
|
|
|
|
|
| |||||||||||||||||||||||||
(f) Written Options:
Options on Securities
| Description | Counterparty | Strike | Expiration Date | Notional Amount | Premium | Market Value | ||||||||||||||||||||||||
Put - OTC China Shenhua Energy Co. Ltd. | ULO | HKD | 23.300 | 08/29/2013 | HKD | 110,062 | $ | 108 | $ | (531 | ) | |||||||||||||||||||
|
|
|
| |||||||||||||||||||||||||||
| 60 | PIMCO EQUITY SERIES | See Accompanying Notes |
Table of Contents
June 30, 2013
Transactions in written call and put options for the period ended June 30, 2013
| # of Contracts | Notional Amount in $ | Notional Amount in EUR | Notional Amount in HKD | Notional Amount in TRY | Premium | |||||||||||||||||||
Balance at 06/30/2012 | 16,384 | $ | 2,704 | EUR | 17,315 | HKD | 0 | TRY | 182,062 | $ | 2,324 | |||||||||||||
Sales | 10,828,216 | 37,645 | 0 | 110,062 | 0 | 2,512 | ||||||||||||||||||
Closing Buys | (1,140,112 | ) | 0 | (17,315 | ) | 0 | 0 | (3,379 | ) | |||||||||||||||
Expirations | (7,540,600 | ) | (34,376 | ) | 0 | 0 | (182,062 | ) | (1,104 | ) | ||||||||||||||
Exercised | (2,163,888 | ) | (5,973 | ) | 0 | 0 | 0 | (245 | ) | |||||||||||||||
|
|
|
|
|
|
|
|
|
|
|
| |||||||||||||
Balance at 06/30/2013 | 0 | $ | 0 | EUR | 0 | HKD | 110,062 | TRY | 0 | $ | 108 | |||||||||||||
|
|
|
|
|
|
|
|
|
|
|
| |||||||||||||
OTC Swap Agreements:
Credit Default Swaps on Credit Indices - Buy Protection (1)
| Index/Tranches | Counterparty | Fixed Deal (Pay) Rate | Maturity Date | Notional Amount (2) | Market Value (3) | Premiums (Received) | Unrealized (Depreciation) | |||||||||||||||||||||||
CDX.IG-9 10-Year Index 15-30% | BPS | (1.000% | ) | 12/20/2017 | $ | 3,100 | $ | (67 | ) | $ | (25 | ) | $ | (42 | ) | |||||||||||||||
|
|
|
|
|
| |||||||||||||||||||||||||
| (1) | If the Fund is a buyer of protection and a credit event occurs, as defined under the terms of that particular swap agreement, the Fund will either (i) receive from the seller of protection an amount equal to the notional amount of the swap and deliver the referenced obligation or underlying securities comprising the referenced index or (ii) receive a net settlement amount in the form of cash or securities equal to the notional amount of the swap less the recovery value of the referenced obligation or underlying securities comprising the referenced index. |
| (2) | The maximum potential amount the Fund could be required to pay as a seller of credit protection or receive as a buyer of credit protection if a credit event occurs as defined under the terms of that particular swap agreement. |
| (3) | The prices and resulting values for credit default swap agreements on credit indices serve as an indicator of the current status of the payment/performance risk and represent the likelihood of an expected liability (or profit) for the credit derivative should the notional amount of the swap agreement be closed/sold as of the period end. Increasing market values, in absolute terms when compared to the notional amount of the swap, represent a deterioration of the referenced entity’s credit soundness and a greater likelihood or risk of default or other credit event occurring as defined under the terms of the agreement. |
Total Return Swaps on Securities
| Pay/Receive | Underlying Reference | # of Shares | Financing Rate | Notional | Maturity Date | Counterparty | Unrealized Appreciation/ (Depreciation) | |||||||||||||||||||
| Receive | TNK-BP Holding | 1,493,502 | 1-Month USD-LIBOR plus a specified spread | $ | 1,994 | 07/11/2013 | BOA | $ | 116 | |||||||||||||||||
| Receive | Petroleo Brasileiro S.A. | 1,712,300 | 1-Month USD-LIBOR plus a specified spread | 13,291 | 04/29/2014 | DUB | (1,705 | ) | ||||||||||||||||||
| Receive | TNK-BP Holding | 967,915 | 1-Month USD-LIBOR plus a specified spread | 1,292 | 05/26/2014 | GST | 75 | |||||||||||||||||||
| Receive | Bashneft OAO | 205,910 | 1-Month USD-LIBOR plus a specified spread | 6,699 | 09/23/2013 | ULO | (970 | ) | ||||||||||||||||||
| Receive | TNK-BP Holding | 998,344 | 1-Month USD-LIBOR plus a specified spread | 1,333 | 04/14/2014 | ULO | 77 | |||||||||||||||||||
| Receive | TNK-BP Holding | 1,060,468 | 1-Month USD-LIBOR plus a specified spread | 1,416 | 05/19/2014 | ULO | 82 | |||||||||||||||||||
|
| |||||||||||||||||||||||||
| $ | (2,325 | ) | ||||||||||||||||||||||||
|
| |||||||||||||||||||||||||
Collateral (Received)/Pledged for OTC Financial Derivative Instruments
The following is a summary by counterparty of the market value of OTC financial derivative instruments and collateral (received)/pledged as of June 30, 2013:
| (g) | Securities with an aggregate market value of $9,622 have been pledged as collateral for OTC swap agreements and foreign currency contracts as governed by International Swaps and Derivatives Association, Inc. master agreements as of June 30, 2013. |
| Counterparty | Total Market Value of OTC Derivatives | Collateral (Received)/Pledged | Net Exposures (4) | |||||||||
BOA | $ | (106 | ) | $ | 704 | $ | 598 | |||||
BPS | 519 | (510 | ) | 9 | ||||||||
BRC | (325 | ) | 529 | 204 | ||||||||
CBK | (1,030 | ) | 1,270 | 240 | ||||||||
DUB | (1,712 | ) | 1,503 | (209 | ) | |||||||
FBF | 359 | (260 | ) | 99 | ||||||||
GLM | (582 | ) | 560 | (22 | ) | |||||||
GST | 75 | 0 | 75 | |||||||||
HUS | 398 | (470 | ) | (72 | ) | |||||||
JPM | (347 | ) | 342 | (5 | ) | |||||||
MSC | (301 | ) | (249 | ) | (550 | ) | ||||||
RBC | 22 | 0 | 22 | |||||||||
RYL | (544 | ) | 485 | (59 | ) | |||||||
SCX | (823 | ) | 1,020 | 197 | ||||||||
SOG | 194 | (300 | ) | (106 | ) | |||||||
UAG | (1,548 | ) | 2,820 | 1,272 | ||||||||
ULO | (1,342 | ) | 0 | (1,342 | ) | |||||||
| (4) | Net Exposures represents the net receivable/(payable) that would be due from/to the counterparty(ies) in the event of default and are not disclosed as assets or liabilities in the Statements of Assets and Liabilities. See note 7, Principal Risks, in the Notes to Financial Statements for more information regarding master netting arrangements. |
| See Accompanying Notes | ANNUAL REPORT | JUNE 30, 2013 | 61 |
Table of Contents
Schedule of Investments PIMCO EqS® Emerging Markets Fund (Cont.)
FAIR VALUE OF FINANCIAL DERIVATIVE INSTRUMENTS (1)
The following is a summary of the fair valuation of the Fund’s derivative instruments categorized by risk exposure:
Fair Values of Financial Derivative Instruments on the Statements of Assets and Liabilities as of June 30, 2013:
| Derivatives not accounted for as hedging instruments | ||||||||||||||||||||||||
| Commodity Contracts | Credit Contracts | Equity Contracts | Foreign Exchange Contracts | Interest Rate Contracts | Total | |||||||||||||||||||
Assets: | ||||||||||||||||||||||||
Unrealized appreciation on foreign currency contracts | $ | 0 | $ | 0 | $ | 0 | $ | 6,211 | $ | 0 | $ | 6,211 | ||||||||||||
Unrealized appreciation on OTC swap agreements | 0 | 0 | 350 | 0 | 0 | 350 | ||||||||||||||||||
|
|
|
|
|
|
|
|
|
|
|
| |||||||||||||
| $ | 0 | $ | 0 | $ | 350 | $ | 6,211 | $ | 0 | $ | 6,561 | |||||||||||||
|
|
|
|
|
|
|
|
|
|
|
| |||||||||||||
Liabilities: | ||||||||||||||||||||||||
Written options outstanding | $ | 0 | $ | 0 | $ | 531 | $ | 0 | $ | 0 | $ | 531 | ||||||||||||
Variation margin payable on financial derivative instruments(2) | 0 | 0 | 37 | 0 | 0 | 37 | ||||||||||||||||||
Unrealized depreciation on foreign currency contracts | 0 | 0 | 0 | 10,381 | 0 | 10,381 | ||||||||||||||||||
Unrealized depreciation on OTC swap agreements | 0 | 42 | 2,675 | 0 | 0 | 2,717 | ||||||||||||||||||
|
|
|
|
|
|
|
|
|
|
|
| |||||||||||||
| $ | 0 | $ | 42 | $ | 3,243 | $ | 10,381 | $ | 0 | $ | 13,666 | |||||||||||||
|
|
|
|
|
|
|
|
|
|
|
| |||||||||||||
The Effect of Financial Derivative Instruments on the Statements of Operations for the Period Ended June 30, 2013:
| Derivatives not accounted for as hedging instruments | ||||||||||||||||||||||||
| Commodity Contracts | Credit Contracts | Equity Contracts | Foreign Exchange Contracts | Interest Rate Contracts | Total | |||||||||||||||||||
Realized Gain (Loss) on Derivatives: | ||||||||||||||||||||||||
Net realized gain (loss) on investments (purchased options) | $ | 0 | $ | 0 | $ | (2,725 | ) | $ | 77 | $ | 0 | $ | (2,648 | ) | ||||||||||
Net realized gain on futures contracts | 0 | 0 | 1,405 | 0 | 0 | 1,405 | ||||||||||||||||||
Net realized gain on written options | 0 | 0 | 1,542 | 642 | 0 | 2,184 | ||||||||||||||||||
Net realized (loss) on swaps | 0 | (31 | ) | (4,494 | ) | 0 | 0 | (4,525 | ) | |||||||||||||||
Net realized gain on foreign currency transactions | 0 | 0 | 0 | 4,845 | 0 | 4,845 | ||||||||||||||||||
|
|
|
|
|
|
|
|
|
|
|
| |||||||||||||
| $ | 0 | $ | (31 | ) | $ | (4,272 | ) | $ | 5,564 | $ | 0 | $ | 1,261 | |||||||||||
|
|
|
|
|
|
|
|
|
|
|
| |||||||||||||
Net Change in Unrealized Appreciation (Depreciation) | ||||||||||||||||||||||||
Net change in unrealized appreciation on investments (purchased options) | $ | 0 | $ | 0 | $ | 474 | $ | 262 | $ | 0 | $ | 736 | ||||||||||||
Net change in unrealized (depreciation) on written options | 0 | 0 | (966 | ) | (171 | ) | 0 | (1,137 | ) | |||||||||||||||
Net change in unrealized (depreciation) on swaps | 0 | (80 | ) | (3,610 | ) | 0 | 0 | (3,690 | ) | |||||||||||||||
Net change in unrealized (depreciation) on translation of assets and liabilities denominated in foreign currencies | 0 | 0 | 0 | (1,015 | ) | 0 | (1,015 | ) | ||||||||||||||||
|
|
|
|
|
|
|
|
|
|
|
| |||||||||||||
| $ | 0 | $ | (80 | ) | $ | (4,102 | ) | $ | (924 | ) | $ | 0 | $ | (5,106 | ) | |||||||||
|
|
|
|
|
|
|
|
|
|
|
| |||||||||||||
| (1) | See note 6 in the Notes to Financial Statements for additional information. |
| (2) | Only current day’s variation margin is reported within the Statements of Assets and Liabilities. As of June 30, 2013, there were no open futures contracts. |
FAIR VALUE MEASUREMENTS (1)
The following is a summary of the fair valuations according to the inputs used as of June 30, 2013 in valuing the Fund’s assets and liabilities:
| Category and Subcategory | Level 1 | Level 2 | Level 3 | Fair Value at 06/30/2013 | ||||||||||||
Investments, at value | ||||||||||||||||
Common Stocks | ||||||||||||||||
Australia | ||||||||||||||||
Materials | $ | 0 | $ | 8,044 | $ | 0 | $ | 8,044 | ||||||||
Bermuda | ||||||||||||||||
Energy | 0 | 5,455 | 0 | 5,455 | ||||||||||||
Brazil | ||||||||||||||||
Consumer Discretionary | 6,045 | 0 | 0 | 6,045 | ||||||||||||
Consumer Staples | 9,880 | 0 | 0 | 9,880 | ||||||||||||
Financials | 25,049 | 0 | 0 | 25,049 | ||||||||||||
Utilities | 2,617 | 0 | 0 | 2,617 | ||||||||||||
Cambodia | ||||||||||||||||
Consumer Discretionary | 0 | 8,019 | 0 | 8,019 | ||||||||||||
Canada | ||||||||||||||||
Materials | 4,756 | 0 | 0 | 4,756 | ||||||||||||
China | ||||||||||||||||
Consumer Discretionary | 0 | 8,698 | 0 | 8,698 | ||||||||||||
| Category and Subcategory | Level 1 | Level 2 | Level 3 | Fair Value at 06/30/2013 | ||||||||||||
Consumer Staples | $ | 0 | $ | 6,159 | $ | 0 | $ | 6,159 | ||||||||
Energy | 0 | 6,998 | 0 | 6,998 | ||||||||||||
Industrials | 0 | 8,978 | 0 | 8,978 | ||||||||||||
Information Technology | 5,727 | 0 | 0 | 5,727 | ||||||||||||
Materials | 0 | 5,275 | 0 | 5,275 | ||||||||||||
Cyprus | ||||||||||||||||
Industrials | 9,268 | 2,366 | 0 | 11,634 | ||||||||||||
Denmark | ||||||||||||||||
Consumer Staples | 0 | 9,543 | 0 | 9,543 | ||||||||||||
Finland | ||||||||||||||||
Materials | 0 | 3,426 | 0 | 3,426 | ||||||||||||
Hong Kong | ||||||||||||||||
Consumer Discretionary | 3,739 | 0 | 0 | 3,739 | ||||||||||||
Financials | 0 | 15,746 | 0 | 15,746 | ||||||||||||
Information Technology | 0 | 0 | 930 | 930 | ||||||||||||
Telecommunication Services | 0 | 12,101 | 0 | 12,101 | ||||||||||||
| 62 | PIMCO EQUITY SERIES | See Accompanying Notes |
Table of Contents
June 30, 2013
| Category and Subcategory | Level 1 | Level 2 | Level 3 | Fair Value at 06/30/2013 | ||||||||||||
India | ||||||||||||||||
Consumer Discretionary | $ | 258 | $ | 7,547 | $ | 0 | $ | 7,805 | ||||||||
Financials | 0 | 23,179 | 0 | 23,179 | ||||||||||||
Indonesia | ||||||||||||||||
Consumer Discretionary | 0 | 8,056 | 0 | 8,056 | ||||||||||||
Financials | 0 | 3,831 | 0 | 3,831 | ||||||||||||
Israel | ||||||||||||||||
Health Care | 4,871 | 0 | 0 | 4,871 | ||||||||||||
Materials | 0 | 12,791 | 0 | 12,791 | ||||||||||||
Italy | ||||||||||||||||
Consumer Discretionary | 0 | 10,145 | 0 | 10,145 | ||||||||||||
Japan | ||||||||||||||||
Consumer Discretionary | 0 | 7,220 | 0 | 7,220 | ||||||||||||
Industrials | 0 | 9,157 | 0 | 9,157 | ||||||||||||
Kazakhstan | ||||||||||||||||
Energy | 664 | 0 | 0 | 664 | ||||||||||||
Telecommunication Services | 9,411 | 0 | 0 | 9,411 | ||||||||||||
Macau | ||||||||||||||||
Consumer Discretionary | 0 | 9,725 | 0 | 9,725 | ||||||||||||
Mexico | ||||||||||||||||
Financials | 10,814 | 0 | 0 | 10,814 | ||||||||||||
Norway | ||||||||||||||||
Consumer Staples | 0 | 6,187 | 0 | 6,187 | ||||||||||||
Peru | ||||||||||||||||
Financials | 9,867 | 0 | 0 | 9,867 | ||||||||||||
Materials | 4,448 | 0 | 0 | 4,448 | ||||||||||||
Philippines | ||||||||||||||||
Utilities | 0 | 5,319 | 0 | 5,319 | ||||||||||||
Russia | ||||||||||||||||
Consumer Staples | 0 | 5,326 | 0 | 5,326 | ||||||||||||
Energy | 9,262 | 608 | 0 | 9,870 | ||||||||||||
Financials | 7,739 | 0 | 0 | 7,739 | ||||||||||||
Materials | 2,257 | 4,075 | 0 | 6,332 | ||||||||||||
Telecommunication Services | 2,716 | 9,333 | 0 | 12,049 | ||||||||||||
South Africa | ||||||||||||||||
Consumer Staples | 5,555 | 0 | 0 | 5,555 | ||||||||||||
Telecommunication Services | 0 | 7,649 | 0 | 7,649 | ||||||||||||
South Korea | ||||||||||||||||
Consumer Discretionary | 0 | 16,676 | 0 | 16,676 | ||||||||||||
Information Technology | 0 | 14,955 | 0 | 14,955 | ||||||||||||
Taiwan | ||||||||||||||||
Information Technology | 0 | 5,899 | 0 | 5,899 | ||||||||||||
Thailand | ||||||||||||||||
Consumer Staples | 0 | 4,353 | 0 | 4,353 | ||||||||||||
| Category and Subcategory | Level 1 | Level 2 | Level 3 | Fair Value at 06/30/2013 | ||||||||||||
Financials | $ | 0 | $ | 6,780 | $ | 0 | $ | 6,780 | ||||||||
Turkey | ||||||||||||||||
Telecommunication Services | 0 | 8,761 | 0 | 8,761 | ||||||||||||
United Kingdom | ||||||||||||||||
Consumer Staples | 0 | 9,433 | 0 | 9,433 | ||||||||||||
Energy | 0 | 5,432 | 0 | 5,432 | ||||||||||||
Financials | 0 | 3,831 | 0 | 3,831 | ||||||||||||
Equity-Linked Securities | ||||||||||||||||
China | ||||||||||||||||
Consumer Staples | 0 | 12,267 | 0 | 12,267 | ||||||||||||
Nigeria | ||||||||||||||||
Consumer Staples | 0 | 4,072 | 0 | 4,072 | ||||||||||||
Exchange-Traded Funds | ||||||||||||||||
Luxembourg | 8,151 | 0 | 0 | 8,151 | ||||||||||||
Preferred Stocks | ||||||||||||||||
Brazil | ||||||||||||||||
Consumer Staples | 8,947 | 0 | 0 | 8,947 | ||||||||||||
South Korea | ||||||||||||||||
Information Technology | 0 | 11,914 | 0 | 11,914 | ||||||||||||
U.S. Treasury Obligations | ||||||||||||||||
United States | 0 | 4 | 0 | 4 | ||||||||||||
Short-Term Instruments | ||||||||||||||||
Repurchase Agreements | 0 | 575 | 0 | 575 | ||||||||||||
U.S. Treasury Bills | 0 | 11,447 | 0 | 11,447 | ||||||||||||
Central Funds Used for Cash Management Purposes | 9,903 | 0 | 0 | 9,903 | ||||||||||||
| $ | 161,944 | $ | 347,355 | $ | 930 | $ | 510,229 | |||||||||
Financial Derivative Instruments - Assets |
| |||||||||||||||
Equity Contracts | 0 | 350 | 0 | 350 | ||||||||||||
Foreign Exchange Contracts | 0 | 6,211 | 0 | 6,211 | ||||||||||||
| $ | 0 | $ | 6,561 | $ | 0 | $ | 6,561 | |||||||||
Financial Derivative Instruments - Liabilities |
| |||||||||||||||
Credit Contracts | 0 | (42 | ) | 0 | (42 | ) | ||||||||||
Equity Contracts | 0 | (3,206 | ) | 0 | (3,206 | ) | ||||||||||
Foreign Exchange Contracts | 0 | (10,381 | ) | 0 | (10,381 | ) | ||||||||||
| $ | 0 | $ | (13,629 | ) | $ | 0 | $ | (13,629 | ) | |||||||
Totals | $ | 161,944 | $ | 340,287 | $ | 930 | $ | 503,161 | ||||||||
There were assets and liabilities valued at $2,440 transferred from Level 2 to Level 1 and assets and liabilities valued at $6,719 transferred from Level 1 to Level 2 during the period ended June 30, 2013.
The following is a reconciliation of the fair valuations using significant unobservable inputs (Level 3) for the Fund during the period ended June 30, 2013:
| Category and Subcategory | Beginning Balance at 06/30/2012 | Net Purchases | Net Sales | Accrued Discounts/ (Premiums) | Realized Gain/(Loss) | Net Change in Unrealized Appreciation/ (Depreciation) (2) | Transfers into Level 3 | Transfers out of Level 3 | Ending Balance at 06/30/2013 | Net Change in Unrealized Appreciation/ (Depreciation) on Investments Held at 06/30/2013 (2) | ||||||||||||||||||||||||||||||
Investments, at value | ||||||||||||||||||||||||||||||||||||||||
Common Stocks | ||||||||||||||||||||||||||||||||||||||||
Hong Kong | ||||||||||||||||||||||||||||||||||||||||
Information Technology | $ | 2,983 | $ | 0 | $ | 0 | $ | 0 | $ | 0 | $ | (2,053 | ) | $ | 0 | $ | 0 | $ | 930 | $ | (2,053 | ) | ||||||||||||||||||
|
|
|
|
|
|
|
|
|
|
|
|
|
|
|
|
|
|
|
| |||||||||||||||||||||
| See Accompanying Notes | ANNUAL REPORT | JUNE 30, 2013 | 63 |
Table of Contents
Schedule of Investments PIMCO EqS® Emerging Markets Fund (Cont.)
June 30, 2013
The following is a summary of significant unobservable inputs used in the fair valuations of assets and liabilities categorized within Level 3 of the fair value hierarchy:
| Category and Subcategory | Ending Balance at 06/30/2013 | Valuation Technique | Unobservable Inputs | Input Value(s) (% Unless Noted Otherwise) | ||||||||
Investments, at value | ||||||||||||
Common Stocks | ||||||||||||
Hong Kong | ||||||||||||
Information Technology | $ | 930 | Other Valuation Techniques (3) | — | — | |||||||
|
| |||||||||||
| (1) | See note 3 in the Notes to Financial Statements for more information regarding pricing inputs, valuation techniques and transfers. |
| (2) | Any difference between Net Change in Unrealized Appreciation/(Depreciation) and Net Change in Unrealized Appreciation/(Depreciation) on Investments Held at June 30, 2013 may be due to an investment no longer held or categorized as level 3 at period end. |
| (3) | Includes valuation techniques not defined in the Notes to Financial Statements as securities valued using such techniques are not considered significant to the Fund. |
| 64 | PIMCO EQUITY SERIES | See Accompanying Notes |
Table of Contents
Schedule of Investments PIMCO EqS® Long/Short Fund
June 30, 2013
| SHARES | MARKET VALUE (000S) | |||||||||||
| COMMON STOCKS 64.5% | ||||||||||||
| BERMUDA 4.4% | ||||||||||||
| FINANCIALS 4.4% | ||||||||||||
Enstar Group Ltd. (a) | 130,000 | $ | 17,287 | |||||||||
|
| |||||||||||
Total Bermuda | 17,287 | |||||||||||
|
| |||||||||||
| CANADA 8.0% | ||||||||||||
| INDUSTRIALS 3.9% | ||||||||||||
SNC-Lavalin Group, Inc. | 361,000 | 15,251 | ||||||||||
|
| |||||||||||
| MATERIALS 4.1% | ||||||||||||
Methanex Corp. (f) | 380,000 | 16,260 | ||||||||||
|
| |||||||||||
Total Canada | 31,511 | |||||||||||
|
| |||||||||||
| UNITED STATES 52.1% | ||||||||||||
| CONSUMER DISCRETIONARY 7.5% | ||||||||||||
Biglari Holdings, Inc. (a) | 15,500 | 6,361 | ||||||||||
General Motors Co. (a) | 168,000 | 5,596 | ||||||||||
Lowe’s Cos., Inc. (f) | 100,000 | 4,090 | ||||||||||
Visteon Corp. (a) | 130,000 | 8,205 | ||||||||||
Wyndham Worldwide Corp. | 20,000 | 1,144 | ||||||||||
|
| |||||||||||
| 25,396 | ||||||||||||
|
| |||||||||||
| CONSUMER STAPLES 4.7% | ||||||||||||
Constellation Brands, Inc. (a)(f) | 240,000 | 12,509 | ||||||||||
Hillshire Brands Co. (f) | 180,000 | 5,954 | ||||||||||
|
| |||||||||||
| 18,463 | ||||||||||||
|
| |||||||||||
| SHARES | MARKET VALUE (000S) | |||||||||||
| FINANCIALS 10.2% | ||||||||||||
American International Group, Inc. (a) | 450,000 | $ | 20,115 | |||||||||
Genworth Financial, Inc. ‘A’ (a) | 1,200,000 | 13,692 | ||||||||||
McGraw-Hill Cos., Inc. | 100,000 | 5,319 | ||||||||||
Moody’s Corp. | 14,000 | 853 | ||||||||||
|
| |||||||||||
| 39,979 | ||||||||||||
|
| |||||||||||
| HEALTH CARE 6.6% | ||||||||||||
Express Scripts Holding Co. (a)(f) | 203,000 | 12,523 | ||||||||||
Gilead Sciences, Inc. (a)(f) | 260,000 | 13,315 | ||||||||||
|
| |||||||||||
| 25,838 | ||||||||||||
|
| |||||||||||
| INDUSTRIALS 15.2% | ||||||||||||
Kirby Corp. (a)(f) | 315,000 | 25,055 | ||||||||||
Spirit Airlines, Inc. (a)(f) | 710,000 | 22,557 | ||||||||||
United Rentals, Inc. (a)(f) | 235,000 | 11,729 | ||||||||||
|
| |||||||||||
| 59,341 | ||||||||||||
|
| |||||||||||
| INFORMATION TECHNOLOGY 7.9% | ||||||||||||
DST Systems, Inc. (f) | 360,000 | 23,519 | ||||||||||
OSI Systems, Inc. (a) | 115,000 | 7,408 | ||||||||||
|
| |||||||||||
| 30,927 | ||||||||||||
|
| |||||||||||
Total United States | 199,944 | |||||||||||
|
| |||||||||||
Total Common Stocks |
| 248,742 | ||||||||||
|
| |||||||||||
| PRINCIPAL AMOUNT (000S) | MARKET VALUE (000S) | |||||||||||
| SHORT-TERM INSTRUMENTS 42.1% | ||||||||||||
| REPURCHASE AGREEMENTS (d) 0.4% | ||||||||||||
| $ | 1,385 | |||||||||||
|
| |||||||||||
| U.S. TREASURY BILLS 6.9% | ||||||||||||
0.142% due 08/08/2013 - 06/26/2014 (b)(h) | $ | 26,990 | 26,955 | |||||||||
|
| |||||||||||
| SHARES | ||||||||||||
| CENTRAL FUNDS USED FOR CASH MANAGEMENT PURPOSES (c) 34.8% | ||||||||||||
PIMCO Short-Term | 13,661,954 | 136,702 | ||||||||||
|
| |||||||||||
Total Short-Term Instruments | 165,042 | |||||||||||
|
| |||||||||||
| PURCHASED OPTIONS (g) 0.7% | ||||||||||||
(Cost $413) | 2,610 | |||||||||||
| Total Investments 107.3% (Cost $398,956) | $ | 416,394 | ||||||||||
| Securities Sold Short (e) (27.8%) (Proceeds $111,644) | (105,036 | ) | ||||||||||
| Other Assets and Liabilities (Net) 20.5% | 80,626 | |||||||||||
|
| |||||||||||
| Net Assets 100.0% | $ | 391,984 | ||||||||||
|
| |||||||||||
Notes to Schedule of Investments (amounts in thousands*, except number of shares):
| * | A zero balance may reflect actual amounts rounding to less than one thousand. |
| (a) | Security did not produce income within the last twelve months. |
| (b) | Coupon represents a weighted average yield to maturity. |
| (c) | Affiliated to the Fund. |
BORROWINGS AND OTHER FINANCING TRANSACTIONS
| (d) | Repurchase Agreements: |
| Counterparty | Lending Rate | Settlement Date | Maturity Date | Principal Amount | Collateralized By | Collateral (Received), At Value | Repurchase Agreements, At Value | Repurchase Proceeds (1) | ||||||||||||||||||||||
SSB | 0.010 | % | 06/28/2013 | 07/01/2013 | $ | 1,385 | Fannie Mae 2.200% due 10/17/2022 | $ | (1,415 | ) | $ | 1,385 | $ | 1,385 | ||||||||||||||||
|
|
|
|
|
| |||||||||||||||||||||||||
| (1) | Includes accrued interest. |
| (e) | Short Sales: |
| (f) | Securities with an aggregate market value of $106,967 and cash of $88,220 have been pledged as collateral as of June 30, 2013 for equity short sales and equity options as governed by prime brokerage agreements and agreements governing listed equity option transactions. |
| Description | Shares | Proceeds | Market Value (2) | |||||||||
Acuity Brands, Inc. | 25,000 | $ | 1,809 | $ | (1,888 | ) | ||||||
Agnico Eagle Mines Ltd. | 170,000 | 4,770 | (4,682 | ) | ||||||||
Alon USA Energy, Inc. | 486,100 | 8,675 | (7,029 | ) | ||||||||
Amtrust Financial Services, Inc. | 100,000 | 3,227 | (3,584 | ) | ||||||||
Canadian Western Bank | 93,000 | 2,823 | (2,456 | ) | ||||||||
Carnival Corp. | 80,000 | 2,723 | (2,723 | ) | ||||||||
Cliffs Natural Resources, Inc. | 335,000 | 6,130 | (5,444 | ) | ||||||||
Compartamos S.A.B. de C.V. | 950,000 | 1,561 | (1,640 | ) | ||||||||
| See Accompanying Notes | ANNUAL REPORT | JUNE 30, 2013 | 65 |
Table of Contents
Schedule of Investments PIMCO EqS® Long/Short Fund (Cont.)
| (e) | Short Sales: (Cont.) |
| Description | Shares | Proceeds | Market Value (2) | |||||||||
CVR Energy, Inc. | 235,000 | $ | 12,975 | $ | (11,139 | ) | ||||||
Harmony Gold Mining Co. Ltd. ADR | 900,000 | 4,255 | (3,429 | ) | ||||||||
HollyFrontier Corp. | 50,000 | 2,142 | (2,143 | ) | ||||||||
Home Capital Group, Inc. | 215,000 | 11,814 | (11,352 | ) | ||||||||
Itron, Inc. | 167,000 | 7,308 | (7,086 | ) | ||||||||
Masimo Corp. | 60,000 | 1,188 | (1,272 | ) | ||||||||
MICROS Systems, Inc. | 280,000 | 11,977 | (12,082 | ) | ||||||||
Newmont Mining Corp. | 600,000 | 18,373 | (17,970 | ) | ||||||||
Northern Tier Energy LP | 75,000 | 1,897 | (1,801 | ) | ||||||||
Ritchie Bros. Auctioneers, Inc. | 190,000 | 3,870 | (3,652 | ) | ||||||||
Market Vectors Junior Gold Miners ETF | 400,000 | 4,127 | (3,664 | ) | ||||||||
|
|
|
| |||||||||
| $ | 111,644 | $ | (105,036 | ) | ||||||||
|
|
|
| |||||||||
| (2) | Market value includes $19 of dividends payable on short sales. |
EXCHANGE-TRADED OR CENTRALLY CLEARED FINANCIAL DERIVATIVE INSTRUMENTS
| (g) | Purchased Options: |
Options on Securities
| Description | Strike Price | Expiration Date | # of Contracts | Cost | Market Value | |||||||||||||||
Put - CBOE CVR Energy, Inc. | $ | 53.500 | 07/20/2013 | 2,200 | $ | 200 | $ | 1,387 | ||||||||||||
Put - CBOE CVR Energy, Inc. | 58.500 | 07/20/2013 | 1,100 | 213 | 1,223 | |||||||||||||||
|
|
|
| |||||||||||||||||
| $ | 413 | $ | 2,610 | |||||||||||||||||
|
|
|
| |||||||||||||||||
OTC FINANCIAL DERIVATIVE INSTRUMENTS
Foreign Currency Contracts:
| Settlement Month | Currency to | Currency to | Counterparty | Unrealized Appreciation | Unrealized (Depreciation) | Net Unrealized Appreciation/ (Depreciation) | ||||||||||||||||||||||||
07/2013 | CAD | 2,530 | $ | 2,443 | BOA | $ | 38 | $ | 0 | $ | 38 | |||||||||||||||||||
07/2013 | 12,709 | 12,312 | CBK | 228 | 0 | 228 | ||||||||||||||||||||||||
07/2013 | EUR | 2,014 | 2,688 | BPS | 66 | 0 | 66 | |||||||||||||||||||||||
07/2013 | 10,376 | 13,403 | MSC | 0 | (103 | ) | (103 | ) | ||||||||||||||||||||||
07/2013 | KRW | 4,224,971 | 3,730 | UAG | 34 | 0 | 34 | |||||||||||||||||||||||
07/2013 | $ | 14,560 | CAD | 15,239 | BRC | 0 | (70 | ) | (70 | ) | ||||||||||||||||||||
07/2013 | 1,109 | 1,170 | CBK | 3 | 0 | 3 | ||||||||||||||||||||||||
07/2013 | 7,131 | EUR | 5,460 | BOA | 0 | (24 | ) | (24 | ) | |||||||||||||||||||||
07/2013 | 9,069 | 6,930 | RYL | 0 | (48 | ) | (48 | ) | ||||||||||||||||||||||
07/2013 | 3,628 | KRW | 4,224,971 | BRC | 68 | 0 | 68 | |||||||||||||||||||||||
08/2013 | CAD | 15,239 | $ | 14,549 | BRC | 70 | 0 | 70 | ||||||||||||||||||||||
08/2013 | EUR | 6,930 | 9,070 | RYL | 49 | 0 | 49 | |||||||||||||||||||||||
08/2013 | $ | 9,065 | EUR | 6,930 | CBK | 0 | (44 | ) | (44 | ) | ||||||||||||||||||||
10/2013 | KRW | 4,224,971 | $ | 3,616 | BRC | 0 | (66 | ) | (66 | ) | ||||||||||||||||||||
|
|
|
|
|
| |||||||||||||||||||||||||
| $ | 556 | $ | (355 | ) | $ | 201 | ||||||||||||||||||||||||
|
|
|
|
|
| |||||||||||||||||||||||||
As of June 30, 2013, there were no open written options. Transactions in written call and put options for the period ended June 30, 2013:
| # of Contracts | Premium | |||||||
Balance at 06/30/2012 | 0 | $ | 0 | |||||
Sales | 14,200 | 3,047 | ||||||
Closing Buys | (12,200 | ) | (2,688 | ) | ||||
Expirations | (2,000 | ) | (359 | ) | ||||
Exercised | 0 | 0 | ||||||
|
|
|
| |||||
Balance at 06/30/2013 | 0 | $ | 0 | |||||
|
|
|
| |||||
| 66 | PIMCO EQUITY SERIES | See Accompanying Notes |
Table of Contents
June 30, 2013
Collateral Pledged for OTC Financial Derivative Instruments
The following is a summary by counterparty of the market value of OTC financial derivative instruments and collateral pledged as of June 30, 2013:
| (h) | Securities with an aggregate market value of $290 have been pledged as collateral for foreign currency contracts as governed by International Swaps and Derivatives Association, Inc. master agreements as of June 30, 2013. |
| Counterparty | Total Market Value of OTC Derivatives | Collateral Pledged | Net Exposures (1) | |||||||||
BOA | $ | 14 | $ | 0 | $ | 14 | ||||||
BPS | 66 | 0 | 66 | |||||||||
BRC | 2 | 0 | 2 | |||||||||
CBK | 187 | 0 | 187 | |||||||||
MSC | (103 | ) | 290 | 187 | ||||||||
UAG | 34 | 0 | 34 | |||||||||
| (1) | Net Exposures represents the net receivable/(payable) that would be due from/to the counterparty(ies) in the event of default and are not disclosed as assets or liabilities in the Statements of Assets and Liabilities. See note 7, Principal Risks, in the Notes to Financial Statements for more information regarding master netting arrangements. |
FAIR VALUE OF FINANCIAL DERIVATIVE INSTRUMENTS (1)
The following is a summary of the fair valuation of the Fund’s derivative instruments categorized by risk exposure:
Fair Values of Financial Derivative Instruments on the Statements of Assets and Liabilities as of June 30, 2013:
| Derivatives not accounted for as hedging instruments | ||||||||||||||||||||||||
| Commodity Contracts | Credit Contracts | Equity Contracts | Foreign Exchange Contracts | Interest Rate Contracts | Total | |||||||||||||||||||
Assets: | ||||||||||||||||||||||||
Investments, at value (purchased options) | $ | 0 | $ | 0 | $ | 2,610 | $ | 0 | $ | 0 | $ | 2,610 | ||||||||||||
Unrealized appreciation on foreign currency contracts | 0 | 0 | 0 | 556 | 0 | 556 | ||||||||||||||||||
|
|
|
|
|
|
|
|
|
|
|
| |||||||||||||
| $ | 0 | $ | 0 | $ | 2,610 | $ | 556 | $ | 0 | $ | 3,166 | |||||||||||||
|
|
|
|
|
|
|
|
|
|
|
| |||||||||||||
Liabilities: | ||||||||||||||||||||||||
Unrealized depreciation on foreign currency contracts | $ | 0 | $ | 0 | $ | 0 | $ | 355 | $ | 0 | $ | 355 | ||||||||||||
|
|
|
|
|
|
|
|
|
|
|
| |||||||||||||
The Effect of Financial Derivative Instruments on the Statements of Operations for the Period Ended June 30, 2013:
| Derivatives not accounted for as hedging instruments | ||||||||||||||||||||||||
| Commodity Contracts | Credit Contracts | Equity Contracts | Foreign Exchange Contracts | Interest Rate Contracts | Total | |||||||||||||||||||
Realized Gain (Loss) on Derivatives: | ||||||||||||||||||||||||
Net realized (loss) on investments (purchased options) | $ | 0 | $ | 0 | $ | (2,555 | ) | $ | 0 | $ | 0 | $ | (2,555 | ) | ||||||||||
Net realized gain on futures contracts | 0 | 0 | 643 | 0 | 0 | 643 | ||||||||||||||||||
Net realized gain on written options | 0 | 0 | 784 | 0 | 0 | 784 | ||||||||||||||||||
Net realized gain on swaps | 0 | 0 | 1,212 | 0 | 0 | 1,212 | ||||||||||||||||||
Net realized gain on foreign currency transactions | 0 | 0 | 0 | 59 | 0 | 59 | ||||||||||||||||||
|
|
|
|
|
|
|
|
|
|
|
| |||||||||||||
| $ | 0 | $ | 0 | $ | 84 | $ | 59 | $ | 0 | $ | 143 | |||||||||||||
|
|
|
|
|
|
|
|
|
|
|
| |||||||||||||
Net Change in Unrealized Appreciation on Derivatives: | ||||||||||||||||||||||||
Net change in unrealized appreciation on investments (purchased options) | $ | 0 | $ | 0 | $ | 2,197 | $ | 0 | $ | 0 | $ | 2,197 | ||||||||||||
Net change in unrealized appreciation on translation of assets and liabilities denominated in foreign currencies | 0 | 0 | 0 | 177 | 0 | 177 | ||||||||||||||||||
|
|
|
|
|
|
|
|
|
|
|
| |||||||||||||
| $ | 0 | $ | 0 | $ | 2,197 | $ | 177 | $ | 0 | $ | 2,374 | |||||||||||||
|
|
|
|
|
|
|
|
|
|
|
| |||||||||||||
| (1) | See note 6 in the Notes to Financial Statements for additional information. |
| See Accompanying Notes | ANNUAL REPORT | JUNE 30, 2013 | 67 |
Table of Contents
Schedule of Investments PIMCO EqS® Long/Short Fund (Cont.)
June 30, 2013
FAIR VALUE MEASUREMENTS (1)
The following is a summary of the fair valuations according to the inputs used as of June 30, 2013 in valuing the Fund’s assets and liabilities:
| Category and Subcategory | Level 1 | Level 2 | Level 3 | Fair Value at 06/30/2013 | ||||||||||||
Investments, at value | ||||||||||||||||
Common Stocks | ||||||||||||||||
Bermuda | ||||||||||||||||
Financials | $ | 17,287 | $ | 0 | $ | 0 | $ | 17,287 | ||||||||
Canada | ||||||||||||||||
Industrials | 15,251 | 0 | 0 | 15,251 | ||||||||||||
Materials | 16,260 | 0 | 0 | 16,260 | ||||||||||||
United States | ||||||||||||||||
Consumer Discretionary | 25,396 | 0 | 0 | 25,396 | ||||||||||||
Consumer Staples | 18,463 | 0 | 0 | 18,463 | ||||||||||||
Financials | 39,979 | 0 | 0 | 39,979 | ||||||||||||
Health Care | 25,838 | 0 | 0 | 25,838 | ||||||||||||
Industrials | 59,341 | 0 | 0 | 59,341 | ||||||||||||
Information Technology | 30,927 | 0 | 0 | 30,927 | ||||||||||||
Short-Term Instruments | ||||||||||||||||
Repurchase Agreements | 0 | 1,385 | 0 | 1,385 | ||||||||||||
U.S. Treasury Bills | 0 | 26,955 | 0 | 26,955 | ||||||||||||
Central Funds Used for Cash Management Purposes | 136,702 | 0 | 0 | 136,702 | ||||||||||||
| Category and Subcategory | Level 1 | Level 2 | Level 3 | Fair Value at 06/30/2013 | ||||||||||||
Purchased Options | ||||||||||||||||
Equity Contracts | $ | 0 | $ | 2,610 | $ | 0 | $ | 2,610 | ||||||||
| $ | 385,444 | $ | 30,950 | $ | 0 | $ | 416,394 | |||||||||
Short Sales, at value | ||||||||||||||||
Common Stocks | (101,372 | ) | 0 | 0 | (101,372 | ) | ||||||||||
Exchange-Traded Funds | (3,664 | ) | 0 | 0 | (3,664 | ) | ||||||||||
| $ | (105,036 | ) | $ | 0 | $ | 0 | $ | (105,036 | ) | |||||||
Financial Derivative Instruments - Assets |
| |||||||||||||||
Foreign Exchange Contracts | $ | 0 | $ | 556 | $ | 0 | $ | 556 | ||||||||
Financial Derivative Instruments - Liabilities |
| |||||||||||||||
Foreign Exchange Contracts | $ | 0 | $ | (355 | ) | $ | 0 | $ | (355 | ) | ||||||
Totals | $ | 280,408 | $ | 31,151 | $ | 0 | $ | 311,559 | ||||||||
There were no transfers between Level 1 and 2 during the period ended June 30, 2013.
| (1) | See note 3 in the Notes to Financial Statements for more information regarding pricing inputs, valuation techniques and transfers. |
| 68 | PIMCO EQUITY SERIES | See Accompanying Notes |
Table of Contents
Consolidated Schedule of Investments PIMCO Emerging Multi-Asset Fund
June 30, 2013
| SHARES | MARKET VALUE (000S) | |||||||||||
| MUTUAL FUNDS (b)(c) 97.5% | ||||||||||||
| UNITED STATES 97.5% | ||||||||||||
PIMCO Emerging Local Bond Fund | 1,748,849 | $ | 17,104 | |||||||||
PIMCO Emerging Markets Bond Fund | 890,996 | 10,024 | ||||||||||
PIMCO Emerging Markets Corporate Bond Fund | 197,644 | 2,241 | ||||||||||
PIMCO EqS® Emerging Markets Fund | 3,906,909 | 32,271 | ||||||||||
|
| |||||||||||
Total Mutual Funds (Cost $66,628) | 61,640 | |||||||||||
|
| |||||||||||
| PRINCIPAL AMOUNT (000S) | MARKET VALUE (000S) | |||||||||||
| SHORT-TERM INSTRUMENTS 4.5% | ||||||||||||
| REPURCHASE AGREEMENTS (d) 0.9% | ||||||||||||
| $ | 563 | |||||||||||
|
| |||||||||||
| U.S. TREASURY BILLS 0.9% | ||||||||||||
0.120% due 08/15/2013 - 05/01/2014 (a)(g) | $ | 587 | 587 | |||||||||
|
| |||||||||||
| SHARES | ||||||||||||
| CENTRAL FUNDS USED FOR CASH MANAGEMENT PURPOSES (b) 2.7% | ||||||||||||
PIMCO Short-Term | 172,180 | 1,723 | ||||||||||
|
| |||||||||||
Total Short-Term Instruments | 2,873 | |||||||||||
|
| |||||||||||
| MARKET VALUE (000S) | ||||||||||
| PURCHASED OPTIONS (e) 0.6% | ||||||||||
(Cost $539) | $ | 350 | ||||||||
| Total Investments 102.6% (Cost $70,039) | $ | 64,863 | ||||||||
| Written Options (f) (0.2%) (Premiums $277) | (137 | ) | ||||||||
| Other Assets and Liabilities (Net) (2.4%) | (1,493 | ) | ||||||||
|
| |||||||||
| Net Assets 100.0% | $ | 63,233 | ||||||||
|
| |||||||||
Notes to Consolidated Schedule of Investments (amounts in thousands*, except number of contracts):
| * | A zero balance may reflect actual amounts rounding to less than one thousand. |
| (a) | Coupon represents a weighted average yield to maturity. |
| (b) | Affiliated to the Fund. |
| (c) | Institutional Class Shares of each Fund. |
BORROWINGS AND OTHER FINANCING TRANSACTIONS
| (d) | Repurchase Agreements: |
| Counterparty | Lending Rate | Settlement Date | Maturity Date | Principal Amount | Collateralized By | Collateral (Received), At Value | Repurchase Agreements, At Value | Repurchase Proceeds (1) | ||||||||||||||||||||||
SSB | 0.010 | % | 06/28/2013 | 07/01/2013 | $ | 563 | Fannie Mae 2.200% due 10/17/2022 | $ | (575 | ) | $ | 563 | $ | 563 | ||||||||||||||||
|
|
|
|
|
| |||||||||||||||||||||||||
| (1) | Includes accrued interest. |
EXCHANGE-TRADED OR CENTRALLY CLEARED FINANCIAL DERIVATIVE INSTRUMENTS
| (e) | Purchased Options: |
Options on Exchange-Traded Funds
| Description | Strike Price | Expiration Date | # of Contracts | Cost | Market Value | |||||||||||||
Put - CBOE iShares MSCI Emerging Markets Index Fund | $ 35.000 | 01/18/2014 | 2,273 | $ | 539 | $ | 350 | |||||||||||
|
|
|
| |||||||||||||||
| (f) | Written Options: |
Options on Exchange-Traded Funds
| Description | Strike Price | Expiration Date | # of Contracts | Premium | Market Value | |||||||||||||
Put - CBOE iShares MSCI Emerging Markets Index Fund | $ 30.000 | 01/18/2014 | 2,273 | $ | 277 | $ | (137 | ) | ||||||||||
|
|
|
| |||||||||||||||
| (g) | Securities with an aggregate market value of $300 and cash of $2 have been pledged as collateral as of June 30, 2013 for equity short sales and equity options as governed by prime brokerage agreements and agreements governing listed equity option transactions. |
OTC FINANCIAL DERIVATIVE INSTRUMENTS
Foreign Currency Contracts:
| Settlement Month | Currency to | Currency to | Counterparty | Unrealized Appreciation | Unrealized (Depreciation) | Net Unrealized Appreciation/ (Depreciation) | ||||||||||||||||||||||||
07/2013 | HKD | 1,994 | $ | 257 | BPS | $ | 0 | $ | 0 | $ | 0 | |||||||||||||||||||
07/2013 | 4,058 | 523 | HUS | 0 | 0 | 0 | ||||||||||||||||||||||||
07/2013 | 2,251 | 290 | JPM | 0 | 0 | 0 | ||||||||||||||||||||||||
07/2013 | ILS | 240 | 66 | BRC | 0 | 0 | 0 | |||||||||||||||||||||||
| See Accompanying Notes | ANNUAL REPORT | JUNE 30, 2013 | 69 |
Table of Contents
Consolidated Schedule of Investments PIMCO Emerging Multi-Asset Fund (Cont.)
Foreign Currency Contracts: (Cont.)
| Settlement Month | Currency to | Currency to | Counterparty | Unrealized Appreciation | Unrealized (Depreciation) | Net Unrealized Appreciation/ (Depreciation) | ||||||||||||||||||||||||
07/2013 | INR | 20,189 | $ | 347 | HUS | $ | 9 | $ | 0 | $ | 9 | |||||||||||||||||||
07/2013 | JPY | 4,744 | 50 | BPS | 2 | 0 | 2 | |||||||||||||||||||||||
07/2013 | 12,248 | 130 | BRC | 7 | 0 | 7 | ||||||||||||||||||||||||
07/2013 | 8,000 | 82 | DUB | 1 | 0 | 1 | ||||||||||||||||||||||||
07/2013 | KRW | 713,017 | 612 | UAG | 0 | (12 | ) | (12 | ) | |||||||||||||||||||||
07/2013 | MYR | 564 | 176 | JPM | 0 | (2 | ) | (2 | ) | |||||||||||||||||||||
07/2013 | PHP | 13,797 | 319 | UAG | 0 | 0 | 0 | |||||||||||||||||||||||
07/2013 | THB | 15,137 | 508 | UAG | 20 | 0 | 20 | |||||||||||||||||||||||
07/2013 | $ | 1,070 | HKD | 8,303 | DUB | 1 | 0 | 1 | ||||||||||||||||||||||
07/2013 | 66 | ILS | 240 | JPM | 0 | 0 | 0 | |||||||||||||||||||||||
07/2013 | 366 | INR | 20,189 | JPM | 0 | (28 | ) | (28 | ) | |||||||||||||||||||||
07/2013 | 338 | JPY | 33,482 | RYL | 0 | (1 | ) | (1 | ) | |||||||||||||||||||||
07/2013 | 639 | KRW | 713,017 | CBK | 0 | (15 | ) | (15 | ) | |||||||||||||||||||||
07/2013 | 179 | MYR | 564 | UAG | 0 | (1 | ) | (1 | ) | |||||||||||||||||||||
07/2013 | 340 | PHP | 13,797 | JPM | 0 | (20 | ) | (20 | ) | |||||||||||||||||||||
07/2013 | 390 | THB | 11,380 | JPM | 0 | (23 | ) | (23 | ) | |||||||||||||||||||||
07/2013 | 122 | 3,757 | UAG | 0 | (1 | ) | (1 | ) | ||||||||||||||||||||||
07/2013 | 6 | TWD | 185 | UAG | 0 | 0 | 0 | |||||||||||||||||||||||
07/2013 | ZAR | 3,376 | $ | 370 | BOA | 30 | 0 | 30 | ||||||||||||||||||||||
08/2013 | CNY | 7,724 | 1,229 | BRC | 0 | (18 | ) | (18 | ) | |||||||||||||||||||||
08/2013 | CZK | 14,451 | 735 | HUS | 11 | 0 | 11 | |||||||||||||||||||||||
08/2013 | HUF | 149,344 | 650 | JPM | 0 | (6 | ) | (6 | ) | |||||||||||||||||||||
08/2013 | IDR | 4,106,135 | 417 | JPM | 13 | 0 | 13 | |||||||||||||||||||||||
08/2013 | $ | 578 | BRL | 1,174 | UAG | 0 | (55 | ) | (55 | ) | ||||||||||||||||||||
08/2013 | 352 | CNY | 2,217 | JPM | 6 | 0 | 6 | |||||||||||||||||||||||
08/2013 | 52 | PLN | 166 | GLM | 0 | (3 | ) | (3 | ) | |||||||||||||||||||||
09/2013 | EUR | 75 | $ | 100 | CBK | 2 | 0 | 2 | ||||||||||||||||||||||
09/2013 | GBP | 32 | 50 | BPS | 1 | 0 | 1 | |||||||||||||||||||||||
09/2013 | $ | 506 | CLP | 252,082 | UAG | 0 | (16 | ) | (16 | ) | ||||||||||||||||||||
09/2013 | 98 | EUR | 74 | BOA | 0 | (1 | ) | (1 | ) | |||||||||||||||||||||
09/2013 | 150 | GBP | 96 | GLM | 0 | (5 | ) | (5 | ) | |||||||||||||||||||||
09/2013 | 460 | MXN | 5,681 | JPM | 0 | (25 | ) | (25 | ) | |||||||||||||||||||||
10/2013 | ILS | 240 | $ | 66 | JPM | 0 | 0 | 0 | ||||||||||||||||||||||
10/2013 | KRW | 260,955 | 225 | JPM | 0 | (2 | ) | (2 | ) | |||||||||||||||||||||
10/2013 | PEN | 1,040 | 402 | FBF | 31 | 0 | 31 | |||||||||||||||||||||||
10/2013 | RUB | 4,883 | 150 | BOA | 4 | 0 | 4 | |||||||||||||||||||||||
10/2013 | THB | 3,757 | 121 | UAG | 1 | 0 | 1 | |||||||||||||||||||||||
10/2013 | TRY | 220 | 119 | FBF | 7 | 0 | 7 | |||||||||||||||||||||||
10/2013 | $ | 290 | HKD | 2,251 | JPM | 0 | 0 | 0 | ||||||||||||||||||||||
10/2013 | 342 | INR | 20,189 | HUS | 0 | (10 | ) | (10 | ) | |||||||||||||||||||||
10/2013 | 610 | KRW | 713,017 | UAG | 11 | 0 | 11 | |||||||||||||||||||||||
10/2013 | 175 | MYR | 564 | JPM | 2 | 0 | 2 | |||||||||||||||||||||||
10/2013 | 201 | PEN | 520 | FBF | 0 | (16 | ) | (16 | ) | |||||||||||||||||||||
10/2013 | 318 | PHP | 13,797 | UAG | 2 | 0 | 2 | |||||||||||||||||||||||
|
|
|
|
|
| |||||||||||||||||||||||||
| $ | 161 | $ | (260 | ) | $ | (99 | ) | |||||||||||||||||||||||
|
|
|
|
|
| |||||||||||||||||||||||||
Transactions in written call and put options for the period ended June 30, 2013
| # of Contracts | Notional Amount | Premium | ||||||||||
Balance at 06/30/2012 | 2,638 | $ | 0 | $ | 459 | |||||||
Sales | 5,875 | 1,000 | 583 | |||||||||
Closing Buys | (5,018 | ) | 0 | (572 | ) | |||||||
Expirations | (647 | ) | (1,000 | ) | (142 | ) | ||||||
Exercised | (575 | ) | 0 | (51 | ) | |||||||
|
|
|
|
|
| |||||||
Balance at 06/30/2013 | 2,273 | $ | 0 | $ | 277 | |||||||
|
|
|
|
|
| |||||||
| 70 | PIMCO EQUITY SERIES | See Accompanying Notes |
Table of Contents
June 30, 2013
OTC Swap Agreements:
Credit Default Swaps on Sovereign Issues - Sell Protection (1)
| Reference Entity | Counterparty | Fixed Deal Receive Rate | Maturity Date | Implied Credit Spread at June 30, 2013 (2) | Notional | Market Value | Premiums (Received) | Unrealized Appreciation | ||||||||||||||||||||||||||
China Government International Bond | RYL | 1.000% | 12/20/2016 | 0.805% | $ | 100 | $ | 0 | $ | (5 | ) | $ | 5 | |||||||||||||||||||||
|
|
|
|
|
| |||||||||||||||||||||||||||||
| (1) | If the Fund is a seller of protection and a credit event occurs, as defined under the terms of that particular swap agreement, the Fund will either (i) pay to the buyer of protection an amount equal to the notional amount of the swap and take delivery of the referenced obligation or underlying securities comprising the referenced index or (ii) pay a net settlement amount in the form of cash or securities equal to the notional amount of the swap less the recovery value of the referenced obligation or underlying securities comprising the referenced index. |
| (2) | Implied credit spreads, represented in absolute terms, utilized in determining the market value of credit default swap agreements on sovereign issues as of period end serve as an indicator of the current status of the payment/performance risk and represent the likelihood or risk of default for the credit derivative. The implied credit spread of a particular referenced entity reflects the cost of buying/selling protection and may include upfront payments required to be made to enter into the agreement. Wider credit spreads represent a deterioration of the referenced entity’s credit soundness and a greater likelihood or risk of default or other credit event occurring as defined under the terms of the agreement. |
| (3) | The maximum potential amount the Fund could be required to pay as a seller of credit protection or receive as a buyer of credit protection if a credit event occurs as defined under the terms of that particular swap agreement. |
| Collateral | (Received)/Pledged for OTC Financial Derivative Instruments |
The following is a summary by counterparty of the market value of OTC financial derivative instruments and collateral (received)/pledged as of June 30, 2013:
Counterparty | Total Market Value of OTC Derivatives | Collateral (Received)/Pledged | Net Exposures (4) | Total Market Value of OTC Derivatives | Collateral (Received)/Pledged | Net Exposures (4) | ||||||||||||||||||||||
| PIMCO Emerging Multi-Asset Fund | PIMCO Cayman Commodity V, Ltd. (Subsidiary) | |||||||||||||||||||||||||||
BOA | $ | 33 | $ | 0 | $ | 33 | $ | 0 | $ | 0 | $ | 0 | ||||||||||||||||
BPS | 3 | 0 | 3 | 0 | 0 | 0 | ||||||||||||||||||||||
BRC | (11 | ) | 0 | (11 | ) | 0 | 0 | 0 | ||||||||||||||||||||
CBK | (13 | ) | 0 | (13 | ) | 0 | 0 | 0 | ||||||||||||||||||||
DUB | 2 | 0 | 2 | 0 | 0 | 0 | ||||||||||||||||||||||
FBF | 22 | 0 | 22 | 0 | 0 | 0 | ||||||||||||||||||||||
GLM | (8 | ) | 0 | (8 | ) | 0 | 0 | 0 | ||||||||||||||||||||
HUS | 10 | 0 | 10 | 0 | 0 | 0 | ||||||||||||||||||||||
JPM | (85 | ) | 0 | (85 | ) | 0 | 0 | 0 | ||||||||||||||||||||
RYL | (1 | ) | 0 | (1 | ) | 0 | 0 | 0 | ||||||||||||||||||||
UAG | (51 | ) | 0 | (51 | ) | 0 | 0 | 0 | ||||||||||||||||||||
| (4) | Net Exposures represents the net receivable/(payable) that would be due from/to the counterparty(ies) in the event of default and are not disclosed as assets or liabilities in the Consolidated Statements of Assets and Liabilities. Exposure from OTC derivatives can only be netted across transactions governed under the same master agreement with the same legal entity. The Fund and Subsidiary are recognized as two separate legal entities. As such, exposure cannot be netted. See note 7, Principal Risks, in the Notes to Financial Statements for more information regarding master netting arrangements. |
FAIR VALUE OF FINANCIAL DERIVATIVE INSTRUMENTS (1)
The following is a summary of the fair valuation of the Fund’s derivative instruments categorized by risk exposure:
Fair Values of Financial Derivative Instruments on the Consolidated Statements of Assets and Liabilities as of June 30, 2013:
| Derivatives not accounted for as hedging instruments | ||||||||||||||||||||||||
| Commodity Contracts | Credit Contracts | Equity Contracts | Foreign Exchange Contracts | Interest Rate Contracts | Total | |||||||||||||||||||
Assets: | ||||||||||||||||||||||||
Investments, at value (purchased options) | $ | 0 | $ | 0 | $ | 350 | $ | 0 | $ | 0 | $ | 350 | ||||||||||||
Unrealized appreciation on foreign currency contracts | 0 | 0 | 0 | 161 | 0 | 161 | ||||||||||||||||||
Unrealized appreciation on OTC swap agreements | 0 | 5 | 0 | 0 | 0 | 5 | ||||||||||||||||||
|
|
|
|
|
|
|
|
|
|
|
| |||||||||||||
| $ | 0 | $ | 5 | $ | 350 | $ | 161 | $ | 0 | $ | 516 | |||||||||||||
|
|
|
|
|
|
|
|
|
|
|
| |||||||||||||
Liabilities: | ||||||||||||||||||||||||
Written options outstanding | $ | 0 | $ | 0 | $ | 137 | $ | 0 | $ | 0 | $ | 137 | ||||||||||||
Unrealized depreciation on foreign currency contracts | 0 | 0 | 0 | 260 | 0 | 260 | ||||||||||||||||||
|
|
|
|
|
|
|
|
|
|
|
| |||||||||||||
| $ | 0 | $ | 0 | $ | 137 | $ | 260 | $ | 0 | $ | 397 | |||||||||||||
|
|
|
|
|
|
|
|
|
|
|
| |||||||||||||
| See Accompanying Notes | ANNUAL REPORT | JUNE 30, 2013 | 71 |
Table of Contents
Consolidated Schedule of Investments PIMCO Emerging Multi-Asset Fund (Cont.)
June 30, 2013
The Effect of Financial Derivative Instruments on the Consolidated Statements of Operations for the Period Ended June 30, 2013:
| Derivatives not accounted for as hedging instruments | ||||||||||||||||||||||||
| Commodity Contracts | Credit Contracts | Equity Contracts | Foreign Exchange Contracts | Interest Rate Contracts | Total | |||||||||||||||||||
Realized Gain (Loss) on Derivatives: | ||||||||||||||||||||||||
Net realized (loss) on investments (purchased options) | $ | 0 | $ | 0 | $ | (798 | ) | $ | (16 | ) | $ | 0 | $ | (814 | ) | |||||||||
Net realized gain on futures contracts | 0 | 0 | 13 | 0 | 0 | 13 | ||||||||||||||||||
Net realized gain on written options | 0 | 0 | 488 | 22 | 0 | 510 | ||||||||||||||||||
Net realized gain (loss) on swaps | 0 | 8 | (106 | ) | 0 | 46 | (52 | ) | ||||||||||||||||
Net realized gain on foreign currency transactions | 0 | 0 | 0 | 112 | 0 | 112 | ||||||||||||||||||
|
|
|
|
|
|
|
|
|
|
|
| |||||||||||||
| $ | 0 | $ | 8 | $ | (403 | ) | $ | 118 | $ | 46 | $ | (231 | ) | |||||||||||
|
|
|
|
|
|
|
|
|
|
|
| |||||||||||||
Net Change in Unrealized Appreciation (Depreciation) | ||||||||||||||||||||||||
Net change in unrealized (depreciation) on investments (purchased options) | $ | 0 | $ | 0 | $ | (245 | ) | $ | 0 | $ | 0 | $ | (245 | ) | ||||||||||
Net change in unrealized appreciation on written options | 0 | 0 | 154 | 0 | 0 | 154 | ||||||||||||||||||
Net change in unrealized (depreciation) on swaps | 0 | (4 | ) | 0 | 0 | (37 | ) | (41 | ) | |||||||||||||||
Net change in unrealized (depreciation) on translation of assets and liabilities denominated in foreign currencies | 0 | 0 | 0 | (77 | ) | 0 | (77 | ) | ||||||||||||||||
|
|
|
|
|
|
|
|
|
|
|
| |||||||||||||
| $ | 0 | $ | (4 | ) | $ | (91 | ) | $ | (77 | ) | $ | (37 | ) | $ | (209 | ) | ||||||||
|
|
|
|
|
|
|
|
|
|
|
| |||||||||||||
| (1) | See note 6 in the Notes to Financial Statements for additional information. |
| FAIR | VALUE MEASUREMENTS (1) |
The following is a summary of the fair valuations according to the inputs used as of June 30, 2013 in valuing the Fund’s assets and liabilities:
| Category and Subcategory | Level 1 | Level 2 | Level 3 | Fair Value at 06/30/2013 | ||||||||||||
Investments, at value | ||||||||||||||||
Mutual Funds | ||||||||||||||||
United States | $ | 61,640 | $ | 0 | $ | 0 | $ | 61,640 | ||||||||
Short-Term Instruments | ||||||||||||||||
Repurchase Agreements | 0 | 563 | 0 | 563 | ||||||||||||
U.S. Treasury Bills | 0 | 587 | 0 | 587 | ||||||||||||
Central Funds Used for Cash Management Purposes | 1,723 | 0 | 0 | 1,723 | ||||||||||||
Purchased Options | ||||||||||||||||
Equity Contracts | 0 | 350 | 0 | 350 | ||||||||||||
| $ | 63,363 | $ | 1,500 | $ | 0 | $ | 64,863 | |||||||||
| Category and Subcategory | Level 1 | Level 2 | Level 3 | Fair Value at 06/30/2013 | ||||||||||||
Financial Derivative Instruments - Assets | ||||||||||||||||
Credit Contracts | $ | 0 | $ | 5 | $ | 0 | $ | 5 | ||||||||
Foreign Exchange Contracts | 0 | 161 | 0 | 161 | ||||||||||||
| $ | 0 | $ | 166 | $ | 0 | $ | 166 | |||||||||
Financial Derivative Instruments - Liabilities | ||||||||||||||||
Equity Contracts | 0 | (137 | ) | 0 | (137 | ) | ||||||||||
Foreign Exchange Contracts | 0 | (260 | ) | 0 | (260 | ) | ||||||||||
| $ | 0 | $ | (397 | ) | $ | 0 | $ | (397 | ) | |||||||
Totals | $ | 63,363 | $ | 1,269 | $ | 0 | $ | 64,632 | ||||||||
There were no transfers between Level 1 and 2 during the period ended June 30, 2013.
| (1) | See note 3 in the Notes to Financial Statements for more information regarding pricing inputs, valuation techniques and transfers. |
| 72 | PIMCO EQUITY SERIES | See Accompanying Notes |
Table of Contents
Consolidated Schedule of Investments PIMCO EqS Pathfinder Fund®
June 30, 2013
| SHARES | MARKET VALUE (000S) | |||||||||||
| COMMON STOCKS 92.0% | ||||||||||||
| BELGIUM 1.4% | ||||||||||||
| INDUSTRIALS 1.4% | ||||||||||||
bpost S.A. (a) | 1,436,184 | $ | 26,695 | |||||||||
|
| |||||||||||
Total Belgium | 26,695 | |||||||||||
|
| |||||||||||
| BERMUDA 4.7% | ||||||||||||
| ENERGY 3.0% | ||||||||||||
North Atlantic Drilling Ltd. | 2,482,270 | 21,045 | ||||||||||
Seadrill Ltd. | 848,505 | 34,175 | ||||||||||
|
| |||||||||||
| 55,220 | ||||||||||||
|
| |||||||||||
| FINANCIALS 1.7% | ||||||||||||
Hiscox Ltd. | 3,734,136 | 32,344 | ||||||||||
|
| |||||||||||
Total Bermuda | 87,564 | |||||||||||
|
| |||||||||||
| BRAZIL 0.7% | ||||||||||||
| FINANCIALS 0.7% | ||||||||||||
Itau Unibanco Holding S.A. SP - ADR | 1,032,954 | 13,346 | ||||||||||
|
| |||||||||||
Total Brazil | 13,346 | |||||||||||
|
| |||||||||||
| CANADA 1.1% | ||||||||||||
| ENERGY 0.7% | ||||||||||||
Cameco Corp. | 658,794 | 13,611 | ||||||||||
|
| |||||||||||
| MATERIALS 0.4% | ||||||||||||
Silver Wheaton Corp. | 312,936 | 6,155 | ||||||||||
|
| |||||||||||
Total Canada | 19,766 | |||||||||||
|
| |||||||||||
| DENMARK 1.7% | ||||||||||||
| CONSUMER STAPLES 1.7% | ||||||||||||
Carlsberg A/S ‘B’ | 356,962 | 31,918 | ||||||||||
|
| |||||||||||
Total Denmark | 31,918 | |||||||||||
|
| |||||||||||
| FAEROE ISLANDS 0.7% | ||||||||||||
| CONSUMER STAPLES 0.5% | ||||||||||||
Bakkafrost P/F | 732,908 | 8,778 | ||||||||||
|
| |||||||||||
| FINANCIALS 0.2% | ||||||||||||
BankNordik P/F | 236,546 | 3,963 | ||||||||||
|
| |||||||||||
Total Faeroe Islands | 12,741 | |||||||||||
|
| |||||||||||
| FRANCE 9.1% | ||||||||||||
| CONSUMER DISCRETIONARY 2.0% | ||||||||||||
Eutelsat Communications S.A. | 915,064 | 25,962 | ||||||||||
JCDecaux S.A. | 423,072 | 11,516 | ||||||||||
|
| |||||||||||
| 37,478 | ||||||||||||
|
| |||||||||||
| CONSUMER STAPLES 4.5% | ||||||||||||
Carrefour S.A. | 1,157,391 | 31,790 | ||||||||||
Danone S.A. | 690,970 | 52,008 | ||||||||||
|
| |||||||||||
| 83,798 | ||||||||||||
|
| |||||||||||
| SHARES | MARKET VALUE (000S) | |||||||||||
| ENERGY 1.4% | ||||||||||||
Bourbon S.A. | 373,045 | $ | 9,689 | |||||||||
Total S.A. | 337,629 | 16,491 | ||||||||||
|
| |||||||||||
| 26,180 | ||||||||||||
|
| |||||||||||
| UTILITIES 1.2% | ||||||||||||
Suez Environnement Co. | 1,771,625 | 22,897 | ||||||||||
|
| |||||||||||
Total France | 170,353 | |||||||||||
|
| |||||||||||
| GERMANY 2.3% | ||||||||||||
| HEALTH CARE 1.8% | ||||||||||||
Rhoen Klinikum AG | 1,489,548 | 34,357 | ||||||||||
|
| |||||||||||
| INDUSTRIALS 0.2% | ||||||||||||
Kloeckner & Co. SE | 326,294 | 3,482 | ||||||||||
|
| |||||||||||
| UTILITIES 0.3% | ||||||||||||
E.ON SE | 280,492 | 4,597 | ||||||||||
|
| |||||||||||
Total Germany | 42,436 | |||||||||||
|
| |||||||||||
| HONG KONG 3.8% | ||||||||||||
| CONSUMER DISCRETIONARY 0.4% | ||||||||||||
Television Broadcasts Ltd. | 1,190,000 | 8,213 | ||||||||||
|
| |||||||||||
| FINANCIALS 2.9% | ||||||||||||
AIA Group Ltd. | 10,504,700 | 44,256 | ||||||||||
First Pacific Co. Ltd. | 9,924,000 | 10,596 | ||||||||||
|
| |||||||||||
| 54,852 | ||||||||||||
|
| |||||||||||
| INDUSTRIALS 0.5% | ||||||||||||
Jardine Matheson Holdings Ltd. | 79,300 | 4,786 | ||||||||||
Jardine Strategic Holdings Ltd. | 96,500 | 3,495 | ||||||||||
|
| |||||||||||
| 8,281 | ||||||||||||
|
| |||||||||||
Total Hong Kong | 71,346 | |||||||||||
|
| |||||||||||
| ISRAEL 0.6% | ||||||||||||
| HEALTH CARE 0.6% | ||||||||||||
Teva Pharmaceutical Industries Ltd. SP - ADR | 282,125 | 11,059 | ||||||||||
|
| |||||||||||
Total Israel | 11,059 | |||||||||||
|
| |||||||||||
| JAPAN 2.6% | ||||||||||||
| CONSUMER DISCRETIONARY 0.5% | ||||||||||||
Nissan Motor Co. Ltd. | 956,200 | 9,584 | ||||||||||
|
| |||||||||||
| INDUSTRIALS 0.9% | ||||||||||||
FANUC Corp. | 123,200 | 17,830 | ||||||||||
|
| |||||||||||
| INFORMATION TECHNOLOGY 1.2% | ||||||||||||
Nintendo Co. Ltd. | 184,442 | 21,716 | ||||||||||
|
| |||||||||||
Total Japan | 49,130 | |||||||||||
|
| |||||||||||
| NETHERLANDS 5.0% | ||||||||||||
| CONSUMER STAPLES 2.1% | ||||||||||||
CSM | 1,460,528 | 29,563 | ||||||||||
| SHARES | MARKET VALUE (000S) | |||||||||||
D.E Master Blenders 1753 NV (a) | 577,481 | $ | 9,246 | |||||||||
|
| |||||||||||
| 38,809 | ||||||||||||
|
| |||||||||||
| ENERGY 0.8% | ||||||||||||
Royal Dutch Shell PLC ‘A’ | 449,510 | 14,359 | ||||||||||
|
| |||||||||||
| FINANCIALS 1.5% | ||||||||||||
ING Groep NV - Dutch Certificate (a) | 3,132,117 | 28,625 | ||||||||||
|
| |||||||||||
| INFORMATION TECHNOLOGY 0.6% | ||||||||||||
Gemalto NV | 126,322 | 11,437 | ||||||||||
|
| |||||||||||
Total Netherlands | 93,230 | |||||||||||
|
| |||||||||||
| NORWAY 3.4% | ||||||||||||
| CONSUMER STAPLES 3.4% | ||||||||||||
Cermaq ASA | 1,172,102 | 20,453 | ||||||||||
Marine Harvest ASA | 36,066,492 | 36,662 | ||||||||||
Orkla ASA | 869,468 | 7,119 | ||||||||||
|
| |||||||||||
Total Norway | 64,234 | |||||||||||
|
| |||||||||||
| SINGAPORE 0.8% | ||||||||||||
| FINANCIALS 0.1% | ||||||||||||
Great Eastern Holdings Ltd. | 85,220 | 1,170 | ||||||||||
|
| |||||||||||
| INDUSTRIALS 0.7% | ||||||||||||
Keppel Corp. Ltd. | 1,710,300 | 13,989 | ||||||||||
|
| |||||||||||
Total Singapore | 15,159 | |||||||||||
|
| |||||||||||
| SOUTH AFRICA 0.4% | ||||||||||||
| MATERIALS 0.4% | ||||||||||||
AngloGold Ashanti Ltd. SP - ADR | 549,984 | 7,865 | ||||||||||
|
| |||||||||||
Total South Africa | 7,865 | |||||||||||
|
| |||||||||||
| SOUTH KOREA 0.3% | ||||||||||||
| CONSUMER DISCRETIONARY 0.3% | ||||||||||||
GS Home Shopping, Inc. | 28,795 | 5,963 | ||||||||||
|
| |||||||||||
Total South Korea | 5,963 | |||||||||||
|
| |||||||||||
| SWEDEN 1.2% | ||||||||||||
| INDUSTRIALS 1.2% | ||||||||||||
Loomis AB ‘B’ | 1,140,537 | 21,918 | ||||||||||
|
| |||||||||||
Total Sweden | 21,918 | |||||||||||
|
| |||||||||||
| SWITZERLAND 4.4% | ||||||||||||
| CONSUMER STAPLES 1.4% | ||||||||||||
Nestle S.A. | 394,946 | 25,916 | ||||||||||
|
| |||||||||||
| FINANCIALS 0.7% | ||||||||||||
Swiss Re AG | 171,538 | 12,762 | ||||||||||
|
| |||||||||||
| HEALTH CARE 1.3% | ||||||||||||
Roche Holding AG | 97,245 | 24,136 | ||||||||||
|
| |||||||||||
| See Accompanying Notes | ANNUAL REPORT | JUNE 30, 2013 | 73 |
Table of Contents
Consolidated Schedule of Investments PIMCO EqS Pathfinder Fund® (Cont.)
| SHARES | MARKET VALUE (000S) | |||||||||||
| INFORMATION TECHNOLOGY 0.4% | ||||||||||||
Logitech International S.A. | 1,169,388 | $ | 8,060 | |||||||||
|
| |||||||||||
| MATERIALS 0.6% | ||||||||||||
Sika AG | 4,503 | 11,644 | ||||||||||
|
| |||||||||||
Total Switzerland | 82,518 | |||||||||||
|
| |||||||||||
| UNITED KINGDOM 13.3% | ||||||||||||
| CONSUMER DISCRETIONARY 0.3% | ||||||||||||
Liberty Global PLC (a) | 80,903 | 5,493 | ||||||||||
|
| |||||||||||
| CONSUMER STAPLES 7.8% | ||||||||||||
British American Tobacco PLC | 1,073,400 | 55,054 | ||||||||||
Imperial Tobacco Group PLC | 1,573,175 | 54,549 | ||||||||||
Reckitt Benckiser Group PLC | 503,484 | 35,615 | ||||||||||
|
| |||||||||||
| 145,218 | ||||||||||||
|
| |||||||||||
| ENERGY 2.6% | ||||||||||||
BP PLC | 4,551,859 | 31,589 | ||||||||||
Ensco PLC ‘A’ | 292,787 | 17,017 | ||||||||||
|
| |||||||||||
| 48,606 | ||||||||||||
|
| |||||||||||
| FINANCIALS 2.6% | ||||||||||||
Lancashire Holdings Ltd. | 3,198,526 | 38,573 | ||||||||||
Prudential PLC | 591,542 | 9,656 | ||||||||||
|
| |||||||||||
| 48,229 | ||||||||||||
|
| |||||||||||
Total United Kingdom | 247,546 | |||||||||||
|
| |||||||||||
| UNITED STATES 34.5% | ||||||||||||
| CONSUMER STAPLES 7.3% | ||||||||||||
Altria Group, Inc. | 773,189 | 27,054 | ||||||||||
Lorillard, Inc. | 913,852 | 39,917 | ||||||||||
Philip Morris International, Inc. | 232,535 | 20,142 | ||||||||||
Reynolds American, Inc. | 412,463 | 19,951 | ||||||||||
Smithfield Foods, Inc. (a) | 199,522 | 6,546 | ||||||||||
Wal-Mart Stores, Inc. | 165,524 | 12,330 | ||||||||||
WhiteWave Foods Co. ‘B’ (a) | 711,032 | 10,808 | ||||||||||
|
| |||||||||||
| 136,748 | ||||||||||||
|
| |||||||||||
| ENERGY 2.6% | ||||||||||||
Halliburton Co. | 295,973 | 12,348 | ||||||||||
National Oilwell Varco, Inc. | 275,369 | 18,973 | ||||||||||
Phillips 66 | 188,381 | 11,098 | ||||||||||
Rentech, Inc. | 2,910,142 | 6,111 | ||||||||||
|
| |||||||||||
| 48,530 | ||||||||||||
|
| |||||||||||
| FINANCIALS 11.0% | ||||||||||||
Alleghany Corp. (a) | 51,695 | 19,815 | ||||||||||
BankUnited, Inc. | 401,169 | 10,434 | ||||||||||
Berkshire Hathaway, Inc. ‘B’ (a) | 408,135 | 45,678 | ||||||||||
Genworth Financial, Inc. ‘A’ (a)(f) | 2,099,752 | 23,958 | ||||||||||
Northwest Bancshares, Inc. | 734,363 | 9,921 | ||||||||||
NYSE Euronext | 163,182 | 6,756 | ||||||||||
PHH Corp. (a) | 467,217 | 9,522 | ||||||||||
| SHARES | MARKET VALUE (000S) | |||||||||||
SLM Corp. | 1,036,177 | $ | 23,687 | |||||||||
TFS Financial Corp. (a) | 1,706,301 | 19,111 | ||||||||||
ViewPoint Financial Group, Inc. | 957,887 | 19,934 | ||||||||||
White Mountains Insurance Group Ltd. | 29,951 | 17,220 | ||||||||||
|
| |||||||||||
| 206,036 | ||||||||||||
|
| |||||||||||
| HEALTH CARE 3.2% | ||||||||||||
Life Technologies Corp. (a) | 135,624 | 10,037 | ||||||||||
Merck & Co., Inc. | 257,217 | 11,948 | ||||||||||
Pfizer, Inc. | 1,131,014 | 31,680 | ||||||||||
Zoetis, Inc. | 166,574 | 5,145 | ||||||||||
|
| |||||||||||
| 58,810 | ||||||||||||
|
| |||||||||||
| INDUSTRIALS 4.1% | ||||||||||||
3M Co. | 310,228 | 33,924 | ||||||||||
Deere & Co. | 307,106 | 24,952 | ||||||||||
General Dynamics Corp. | 212,473 | 16,643 | ||||||||||
|
| |||||||||||
| 75,519 | ||||||||||||
|
| |||||||||||
| INFORMATION TECHNOLOGY 6.3% | ||||||||||||
Apple, Inc. | 23,059 | 9,133 | ||||||||||
Dell, Inc. | 380,352 | 5,078 | ||||||||||
Intel Corp. (f) | 2,074,976 | 50,256 | ||||||||||
Microsoft Corp. (f) | 1,544,247 | 53,323 | ||||||||||
|
| |||||||||||
| 117,790 | ||||||||||||
|
| |||||||||||
Total United States | 643,433 | |||||||||||
|
| |||||||||||
Total Common Stocks |
| 1,718,220 | ||||||||||
|
| |||||||||||
| EXCHANGE-TRADED FUNDS 2.8% | ||||||||||||
| UNITED STATES 2.8% | ||||||||||||
SPDR Gold Trust | 440,726 | 52,513 | ||||||||||
|
| |||||||||||
Total Exchange-Traded Funds |
| 52,513 | ||||||||||
|
| |||||||||||
| PREFERRED STOCKS 0.2% | ||||||||||||
| BRAZIL 0.2% | ||||||||||||
| FINANCIALS 0.2% | ||||||||||||
Itau Unibanco Holding S.A. | 346,280 | 4,465 | ||||||||||
|
| |||||||||||
Total Preferred Stocks (Cost $4,350) | 4,465 | |||||||||||
|
| |||||||||||
| REAL ESTATE INVESTMENT TRUSTS 1.3% | ||||||||||||
| SINGAPORE 0.0% | ||||||||||||
Keppel REIT | 342,060 | 349 | ||||||||||
|
| |||||||||||
Total Singapore | 349 | |||||||||||
|
| |||||||||||
| UNITED STATES 1.3% | ||||||||||||
American Capital Agency Corp. | 574,115 | 13,199 | ||||||||||
NorthStar Realty Finance Corp. | 1,082,347 | 9,849 | ||||||||||
|
| |||||||||||
Total United States | 23,048 | |||||||||||
|
| |||||||||||
Total Real Estate Investment Trusts | 23,397 | |||||||||||
|
| |||||||||||
| SHARES | MARKET VALUE (000S) | |||||||||||
| RIGHTS 0.3% | ||||||||||||
| FRANCE 0.3% | ||||||||||||
| HEALTH CARE 0.3% | ||||||||||||
Sanofi - Exp. 12/31/2020 (a) | 2,604,991 | $ | 5,027 | |||||||||
|
| |||||||||||
Total France | 5,027 | |||||||||||
|
| |||||||||||
| HONG KONG 0.0% | ||||||||||||
| FINANCIALS 0.0% | ||||||||||||
First Pacific Co. Ltd. - Exp. 07/03/2013 (a) | 1,240,500 | 24 | ||||||||||
|
| |||||||||||
Total Hong Kong | 24 | |||||||||||
|
| |||||||||||
Total Rights (Cost $5,401) |
| 5,051 | ||||||||||
|
| |||||||||||
| PRINCIPAL AMOUNT (000S) | ||||||||||||
| SHORT-TERM INSTRUMENTS 3.4% | ||||||||||||
| REPURCHASE AGREEMENTS (d) 0.1% | ||||||||||||
| 2,793 | ||||||||||||
|
| |||||||||||
| U.S. TREASURY BILLS 0.5% | ||||||||||||
0.116% due 02/06/2014 - 05/29/2014 (b)(i) | $ | 8,576 | 8,568 | |||||||||
|
| |||||||||||
| SHARES | ||||||||||||
| CENTRAL FUNDS USED FOR CASH MANAGEMENT PURPOSES (c) 2.8% | ||||||||||||
PIMCO Short-Term | 5,246,668 | 52,498 | ||||||||||
|
| |||||||||||
Total Short-Term Instruments | 63,859 | |||||||||||
|
| |||||||||||
| PURCHASED OPTIONS (g) 0.3% | ||||||||||||
(Cost $4,987) | 5,717 | |||||||||||
| Total Investments 100.3% (Cost $1,700,353) | $ | 1,873,222 | ||||||||||
| Securities Sold Short (e) (1.1%) (Proceeds $20,825) | (21,022 | ) | ||||||||||
| Written Options (h) (0.0%) (Premiums $258) | (53 | ) | ||||||||||
| Other Assets and Liabilities (Net) 0.8% | 15,427 | |||||||||||
|
| |||||||||||
| Net Assets 100.0% | $ | 1,867,574 | ||||||||||
|
| |||||||||||
| 74 | PIMCO EQUITY SERIES | See Accompanying Notes |
Table of Contents
June 30, 2013
Notes to Consolidated Schedule of Investments (amounts in thousands*, except number of contracts and shares):
| * | A zero balance may reflect actual amounts rounding to less than one thousand. |
| (a) | Security did not produce income within the last twelve months. |
| (b) | Coupon represents a weighted average yield to maturity. |
| (c) | Affiliated to the Fund. |
BORROWINGS AND OTHER FINANCING TRANSACTIONS
| (d) | Repurchase Agreements: |
| Counterparty | Lending Rate | Settlement Date | Maturity Date | Principal Amount | Collateralized By | Collateral (Received), At Value | Repurchase Agreements, At Value | Repurchase Proceeds (1) | ||||||||||||||||||||
SSB | 0.010% | 06/28/2013 | 07/01/2013 | $ | 2,793 | Fannie Mae 2.200% due 10/17/2022 | $ | (2,853 | ) | $ | 2,793 | $ | 2,793 | |||||||||||||||
|
|
|
|
|
| |||||||||||||||||||||||
| (1) | Includes accrued interest. |
| (e) | Short Sales: |
| (f) | Securities with an aggregate market value of $24,470 and cash of $22,402 have been pledged as collateral as of June 30, 2013 for equity short sales and equity options as governed by prime brokerage agreements and agreements governing listed equity option transactions. |
| Description | Shares | Proceeds | Market Value | |||||||||
IntercontinentalExchange, Inc. | 27,714 | $ | 4,279 | $ | (4,927 | ) | ||||||
Liberty Global PLC | 80,904 | 5,845 | (5,993 | ) | ||||||||
WhiteWave Foods Co. ‘A’ | 621,687 | 10,701 | (10,102 | ) | ||||||||
|
|
|
| |||||||||
| $ | 20,825 | $ | (21,022 | ) | ||||||||
|
|
|
| |||||||||
EXCHANGE-TRADED OR CENTRALLY CLEARED FINANCIAL DERIVATIVE INSTRUMENTS
| (g) | Purchased Options: |
Options on Securities
| Description | Strike Price | Expiration Date | # of Contracts | Cost | Market Value | |||||||||||||||
Call - CBOE Dell, Inc. | $ 15.000 | 08/17/2013 | 7,185 | $ | 94 | $ | 18 | |||||||||||||
Call - CBOE Life Technologies Corp. | 75.000 | 07/20/2013 | 2,334 | 58 | 14 | |||||||||||||||
Put - CBOE Pfizer, Inc. | 35.000 | 07/20/2013 | 6,968 | 4,118 | 4,873 | |||||||||||||||
Put - CBOE Whitewave Foods Co. | 25.000 | 10/19/2013 | 893 | 717 | 812 | |||||||||||||||
|
|
|
| |||||||||||||||||
| $ | 4,987 | $ | 5,717 | |||||||||||||||||
|
|
|
| |||||||||||||||||
| (h) | Written Options: |
Options on Securities
| Description | Strike Price | Expiration Date | # of Contracts | Premium | Market Value | |||||||||||||||
Call - CBOE Intel Corp. | $ 26.000 | 07/20/2013 | 5,405 | $ | 227 | $ | (39 | ) | ||||||||||||
Call - CBOE Pfizer, Inc. | 35.000 | 07/20/2013 | 6,968 | 28 | (1 | ) | ||||||||||||||
Call - CBOE Whitewave Foods Co. | 25.000 | 10/19/2013 | 893 | 3 | (13 | ) | ||||||||||||||
|
|
|
| |||||||||||||||||
| $ | 258 | $ | (53 | ) | ||||||||||||||||
|
|
|
| |||||||||||||||||
OTC FINANCIAL DERIVATIVE INSTRUMENTS
Foreign Currency Contracts:
| Settlement Month | Currency to | Currency to be Received | Counterparty | Unrealized Appreciation | Unrealized (Depreciation) | Net Unrealized Appreciation/ (Depreciation) | ||||||||||||||||||||||||
07/2013 | AUD | 72,077 | $ | 66,983 | CBK | $ | 1,065 | $ | 0 | $ | 1,065 | |||||||||||||||||||
07/2013 | 7,478 | 6,980 | GLM | 141 | 0 | 141 | ||||||||||||||||||||||||
07/2013 | CAD | 5,184 | 4,950 | BPS | 22 | 0 | 22 | |||||||||||||||||||||||
07/2013 | 86,404 | 82,554 | BRC | 398 | 0 | 398 | ||||||||||||||||||||||||
07/2013 | CHF | 4,294 | 4,636 | BRC | 90 | 0 | 90 | |||||||||||||||||||||||
07/2013 | 4,398 | 4,680 | GLM | 24 | 0 | 24 | ||||||||||||||||||||||||
07/2013 | 11,449 | 11,820 | MSC | 0 | (301 | ) | (301 | ) | ||||||||||||||||||||||
07/2013 | DKK | 176,108 | 30,814 | JPM | 80 | 0 | 80 | |||||||||||||||||||||||
| See Accompanying Notes | ANNUAL REPORT | JUNE 30, 2013 | 75 |
Table of Contents
Consolidated Schedule of Investments PIMCO EqS Pathfinder Fund® (Cont.)
Foreign Currency Contracts: (Cont.)
| Settlement Month | Currency to | Currency to be Received | Counterparty | Unrealized Appreciation | Unrealized (Depreciation) | Net Unrealized Appreciation/ (Depreciation) | ||||||||||||||||||||||||
07/2013 | EUR | 21,010 | $ | 27,548 | BRC | $ | 202 | $ | (2 | ) | $ | 200 | ||||||||||||||||||
07/2013 | 5,629 | 7,340 | GLM | 13 | 0 | 13 | ||||||||||||||||||||||||
07/2013 | 83,862 | 108,325 | MSC | 0 | (834 | ) | (834 | ) | ||||||||||||||||||||||
07/2013 | GBP | 3,940 | 6,155 | DUB | 163 | 0 | 163 | |||||||||||||||||||||||
07/2013 | 77,221 | 116,699 | UAG | 0 | (750 | ) | (750 | ) | ||||||||||||||||||||||
07/2013 | HKD | 429,865 | 55,405 | HUS | 0 | (21 | ) | (21 | ) | |||||||||||||||||||||
07/2013 | ILS | 29,038 | 7,943 | MSC | 0 | (39 | ) | (39 | ) | |||||||||||||||||||||
07/2013 | JPY | 1,426,900 | 15,035 | BRC | 648 | 0 | 648 | |||||||||||||||||||||||
07/2013 | 951,882 | 9,760 | GLM | 162 | 0 | 162 | ||||||||||||||||||||||||
07/2013 | 12,335,722 | 126,261 | RYL | 1,884 | 0 | 1,884 | ||||||||||||||||||||||||
07/2013 | KRW | 4,966,241 | 4,466 | UAG | 121 | 0 | 121 | |||||||||||||||||||||||
07/2013 | NOK | 5,825 | 987 | BRC | 28 | 0 | 28 | |||||||||||||||||||||||
07/2013 | 786,173 | 134,652 | FBF | 5,227 | 0 | 5,227 | ||||||||||||||||||||||||
07/2013 | 1,180 | 202 | HUS | 8 | 0 | 8 | ||||||||||||||||||||||||
07/2013 | SEK | 67,212 | 9,987 | CBK | 0 | (36 | ) | (36 | ) | |||||||||||||||||||||
07/2013 | 60,777 | 9,080 | GLM | 17 | 0 | 17 | ||||||||||||||||||||||||
07/2013 | SGD | 1,205 | 971 | FBF | 20 | 0 | 20 | |||||||||||||||||||||||
07/2013 | $ | 34,495 | AUD | 36,038 | BRC | 0 | (1,536 | ) | (1,536 | ) | ||||||||||||||||||||
07/2013 | 34,662 | 36,039 | CBK | 0 | (1,703 | ) | (1,703 | ) | ||||||||||||||||||||||
07/2013 | 83,718 | CAD | 86,404 | BRC | 0 | (1,561 | ) | (1,561 | ) | |||||||||||||||||||||
07/2013 | 16,755 | CHF | 15,743 | FBF | 0 | (88 | ) | (88 | ) | |||||||||||||||||||||
07/2013 | 15,394 | DKK | 88,054 | CBK | 0 | (27 | ) | (27 | ) | |||||||||||||||||||||
07/2013 | 15,393 | 88,054 | FBF | 0 | (26 | ) | (26 | ) | ||||||||||||||||||||||
07/2013 | 1,087 | EUR | 830 | BRC | 0 | (6 | ) | (6 | ) | |||||||||||||||||||||
07/2013 | 130,842 | 100,070 | CBK | 0 | (585 | ) | (585 | ) | ||||||||||||||||||||||
07/2013 | 3,315 | 2,577 | DUB | 39 | 0 | 39 | ||||||||||||||||||||||||
07/2013 | 1,860 | 1,395 | HUS | 0 | (45 | ) | (45 | ) | ||||||||||||||||||||||
07/2013 | 13,123 | GBP | 8,357 | BRC | 0 | (412 | ) | (412 | ) | |||||||||||||||||||||
07/2013 | 112,424 | 72,804 | GLM | 0 | (1,693 | ) | (1,693 | ) | ||||||||||||||||||||||
07/2013 | 8,711 | HKD | 67,601 | DUB | 6 | 0 | 6 | |||||||||||||||||||||||
07/2013 | 44,903 | 348,233 | JPM | 0 | (2 | ) | (2 | ) | ||||||||||||||||||||||
07/2013 | 1,808 | 14,030 | UAG | 1 | 0 | 1 | ||||||||||||||||||||||||
07/2013 | 8,005 | ILS | 29,038 | JPM | 0 | (23 | ) | (23 | ) | |||||||||||||||||||||
07/2013 | 136,264 | JPY | 13,762,622 | BOA | 2,501 | 0 | 2,501 | |||||||||||||||||||||||
07/2013 | 4,265 | KRW | 4,966,241 | BRC | 80 | 0 | 80 | |||||||||||||||||||||||
07/2013 | 1,062 | NOK | 6,480 | BRC | 5 | 0 | 5 | |||||||||||||||||||||||
07/2013 | 324 | 1,910 | CBK | 0 | (10 | ) | (10 | ) | ||||||||||||||||||||||
07/2013 | 281 | 1,615 | DUB | 0 | (15 | ) | (15 | ) | ||||||||||||||||||||||
07/2013 | 64,822 | 391,587 | GLM | 0 | (356 | ) | (356 | ) | ||||||||||||||||||||||
07/2013 | 64,788 | 391,586 | HUS | 0 | (323 | ) | (323 | ) | ||||||||||||||||||||||
07/2013 | 10,229 | SEK | 67,212 | CBK | 0 | (207 | ) | (207 | ) | |||||||||||||||||||||
07/2013 | 387 | SGD | 485 | CBK | 0 | (4 | ) | (4 | ) | |||||||||||||||||||||
07/2013 | 229 | 283 | JPM | 0 | (5 | ) | (5 | ) | ||||||||||||||||||||||
07/2013 | 342 | 436 | UAG | 2 | 0 | 2 | ||||||||||||||||||||||||
07/2013 | ZAR | 172,585 | $ | 18,925 | BOA | 1,536 | 0 | 1,536 | ||||||||||||||||||||||
08/2013 | BRL | 24,571 | 11,613 | UAG | 679 | 0 | 679 | |||||||||||||||||||||||
08/2013 | CHF | 15,743 | 16,760 | FBF | 88 | 0 | 88 | |||||||||||||||||||||||
08/2013 | DKK | 88,054 | 15,399 | CBK | 28 | 0 | 28 | |||||||||||||||||||||||
08/2013 | 88,054 | 15,398 | FBF | 26 | 0 | 26 | ||||||||||||||||||||||||
08/2013 | EUR | 100,070 | 130,857 | CBK | 585 | 0 | 585 | |||||||||||||||||||||||
08/2013 | GBP | 72,804 | 112,401 | GLM | 1,693 | 0 | 1,693 | |||||||||||||||||||||||
08/2013 | NOK | 391,587 | 64,750 | GLM | 352 | 0 | 352 | |||||||||||||||||||||||
08/2013 | 391,586 | 64,717 | HUS | 319 | 0 | 319 | ||||||||||||||||||||||||
08/2013 | PLN | 2,574 | 812 | GLM | 39 | 0 | 39 | |||||||||||||||||||||||
08/2013 | $ | 66,829 | AUD | 72,077 | CBK | 0 | (1,061 | ) | (1,061 | ) | ||||||||||||||||||||
08/2013 | 82,495 | CAD | 86,404 | BRC | 0 | (398 | ) | (398 | ) | |||||||||||||||||||||
08/2013 | 1,830 | CHF | 1,722 | MSC | 0 | (7 | ) | (7 | ) | |||||||||||||||||||||
08/2013 | 1,248 | DKK | 7,155 | MSC | 1 | 0 | 1 | |||||||||||||||||||||||
08/2013 | 1,133 | EUR | 871 | BRC | 1 | 0 | 1 | |||||||||||||||||||||||
08/2013 | 8,082 | 6,213 | MSC | 6 | 0 | 6 | ||||||||||||||||||||||||
08/2013 | 9,821 | GBP | 6,399 | MSC | 0 | (90 | ) | (90 | ) | |||||||||||||||||||||
08/2013 | 1,481 | JPY | 144,100 | MSC | 0 | (27 | ) | (27 | ) | |||||||||||||||||||||
08/2013 | 126,281 | 12,335,722 | RYL | 0 | (1,890 | ) | (1,890 | ) | ||||||||||||||||||||||
08/2013 | 160 | NOK | 975 | BRC | 0 | 0 | 0 | |||||||||||||||||||||||
08/2013 | 9,853 | 60,075 | MSC | 26 | 0 | 26 | ||||||||||||||||||||||||
08/2013 | 9,980 | SEK | 67,212 | CBK | 36 | 0 | 36 | |||||||||||||||||||||||
08/2013 | 742 | 4,990 | MSC | 1 | 0 | 1 | ||||||||||||||||||||||||
09/2013 | GBP | 153 | $ | 233 | BOA | 1 | 0 | 1 | ||||||||||||||||||||||
09/2013 | MXN | 20,160 | 1,577 | HUS | 31 | 0 | 31 | |||||||||||||||||||||||
09/2013 | SGD | 436 | 342 | UAG | 0 | (2 | ) | (2 | ) | |||||||||||||||||||||
| 76 | PIMCO EQUITY SERIES | See Accompanying Notes |
Table of Contents
June 30, 2013
Foreign Currency Contracts: (Cont.)
| Settlement Month | Currency to | Currency to be Received | Counterparty | Unrealized Appreciation | Unrealized (Depreciation) | Net Unrealized Appreciation/ (Depreciation) | ||||||||||||||||||||||||
09/2013 | $ | 33,889 | EUR | 25,270 | JPM | $ | 0 | $ | (986 | ) | $ | (986 | ) | |||||||||||||||||
09/2013 | 21,156 | MXN | 261,217 | JPM | 0 | (1,135 | ) | (1,135 | ) | |||||||||||||||||||||
10/2013 | HKD | 348,233 | $ | 44,912 | JPM | 0 | (4 | ) | (4 | ) | ||||||||||||||||||||
10/2013 | ILS | 29,038 | 7,991 | JPM | 24 | 0 | 24 | |||||||||||||||||||||||
10/2013 | KRW | 4,966,241 | 4,250 | BRC | 0 | (77 | ) | (77 | ) | |||||||||||||||||||||
|
|
|
|
|
| |||||||||||||||||||||||||
| $ | 18,419 | $ | (16,287 | ) | $ | 2,132 | ||||||||||||||||||||||||
|
|
|
|
|
| |||||||||||||||||||||||||
Transactions in written call and put options for the period ended June 30, 2013
| # of Contracts | Notional Amount in EUR | Premium | ||||||||||
Balance at 06/30/2012 | 1,830 | EUR | 438,169 | $ | 3,968 | |||||||
Sales | 65,045 | 0 | 1,462 | |||||||||
Closing Buys | (40,197 | ) | 0 | (935 | ) | |||||||
Expirations | 0 | (438,169 | ) | (3,741 | ) | |||||||
Exercised | (13,412 | ) | 0 | (496 | ) | |||||||
|
|
|
|
|
| |||||||
Balance at 06/30/2013 | 13,266 | EUR | 0 | $ | 258 | |||||||
|
|
|
|
|
| |||||||
OTC Swap Agreements:
Total Return Swaps on Securities
| Pay/Receive | Underlying Reference | # of Shares | Financing Rate | Notional Amount | Maturity Date | Counterparty | Unrealized (Depreciation) | |||||||||||||||||||
| Receive | Kabel Deutschland Holdings AG | 36,179 | 1-Month USD-LIBOR plus a specified spread | EUR | 3,049 | 06/30/2014 | DUB | $ | (4 | ) | ||||||||||||||||
| Receive | Veolia Environnement S.A. | 1,773,696 | 1-Month USD-LIBOR plus a specified spread | 16,607 | 05/07/2014 | JPM | (1,436 | ) | ||||||||||||||||||
| Pay | Rentech Nitrogen Partners LP | 81,078 | 1-Month USD-LIBOR less a specified spread | $ | 2,310 | 08/15/2013 | BOA | (82 | ) | |||||||||||||||||
| Receive | Logitech International S.A. | 700,625 | 1-Month USD-LIBOR less a specified spread | 4,893 | 02/18/2014 | GST | (66 | ) | ||||||||||||||||||
| Receive | Logitech International S.A. | 267,473 | 1-Month USD-LIBOR less a specified spread | 1,859 | 01/29/2014 | JPM | (15 | ) | ||||||||||||||||||
| Receive | Logitech International S.A. | 164,701 | 1-Month USD-LIBOR less a specified spread | 1,150 | 02/05/2014 | JPM | (15 | ) | ||||||||||||||||||
|
| |||||||||||||||||||||||||
| $ | (1,618 | ) | ||||||||||||||||||||||||
|
| |||||||||||||||||||||||||
Collateral (Received)/Pledged for OTC Financial Derivative Instruments
The following is a summary by counterparty of the market value of OTC financial derivative instruments and collateral (received)/pledged as of June 30, 2013:
| (i) | Securities with an aggregate market value of $6,782 have been pledged as collateral for OTC swap agreements and foreign currency contracts as governed by International Swaps and Derivatives Association, Inc. master agreements as of June 30, 2013. |
Counterparty | Total Market Value of OTC Derivatives | Collateral (Received)/Pledged | Net Exposures (1) | Total Market Value of OTC Derivatives | Collateral (Received)/Pledged | Net Exposures (1) | ||||||||||||||||||||||
| PIMCO EqS Pathfinder Fund® | PIMCO Cayman Commodity Fund VI, Ltd. (Subsidiary) | |||||||||||||||||||||||||||
BOA | $ | 3,956 | $ | (5,300 | ) | $ | (1,344 | ) | $ | 0 | $ | 0 | $ | 0 | ||||||||||||||
BPS | 22 | 0 | 22 | 0 | 0 | 0 | ||||||||||||||||||||||
BRC | (2,540 | ) | (610 | ) | (3,150 | ) | 0 | 0 | 0 | |||||||||||||||||||
CBK | (1,919 | ) | 1,378 | (541 | ) | 0 | 0 | 0 | ||||||||||||||||||||
DUB | 189 | (60 | ) | 129 | 0 | 0 | 0 | |||||||||||||||||||||
FBF | 5,247 | (5,140 | ) | 107 | 0 | 0 | 0 | |||||||||||||||||||||
GLM | 392 | (280 | ) | 112 | 0 | 0 | 0 | |||||||||||||||||||||
GST | (66 | ) | (120 | ) | (186 | ) | 0 | 0 | 0 | |||||||||||||||||||
HUS | (31 | ) | 0 | (31 | ) | 0 | 0 | 0 | ||||||||||||||||||||
JPM | (3,517 | ) | 3,562 | 45 | 0 | 0 | 0 | |||||||||||||||||||||
MSC | (1,264 | ) | (254 | ) | (1,518 | ) | 0 | 0 | 0 | |||||||||||||||||||
RYL | (6 | ) | 0 | (6 | ) | 0 | 0 | 0 | ||||||||||||||||||||
UAG | 51 | 591 | 642 | 0 | 0 | 0 | ||||||||||||||||||||||
| (1) | Net Exposures represents the net receivable/(payable) that would be due from/to the counterparty(ies) in the event of default and are not disclosed as assets or liabilities in the Consolidated Statements of Assets and Liabilities. Exposure from OTC derivatives can only be netted across transactions governed under the same master agreement with the same legal entity. The Fund and Subsidiary are recognized as two separate legal entities. As such, exposure cannot be netted. See note 7, Principal Risks, in the Notes to Financial Statements for more information regarding master netting arrangements. |
| See Accompanying Notes | ANNUAL REPORT | JUNE 30, 2013 | 77 |
Table of Contents
Consolidated Schedule of Investments PIMCO EqS Pathfinder Fund® (Cont.)
FAIR VALUE OF FINANCIAL DERIVATIVE INSTRUMENTS (1)
The following is a summary of the fair valuation of the Fund’s derivative instruments categorized by risk exposure:
Fair Values of Financial Derivative Instruments on the Consolidated Statements of Assets and Liabilities as of June 30, 2013:
| Derivatives not accounted for as hedging instruments | ||||||||||||||||||||||||
| Commodity Contracts | Credit Contracts | Equity Contracts | Foreign Exchange Contracts | Interest Rate Contracts | Total | |||||||||||||||||||
Assets: | ||||||||||||||||||||||||
Investments, at value (purchased options) | $ | 0 | $ | 0 | $ | 5,717 | $ | 0 | $ | 0 | $ | 5,717 | ||||||||||||
Unrealized appreciation on foreign currency contracts | 0 | 0 | 0 | 18,419 | 0 | 18,419 | ||||||||||||||||||
|
|
|
|
|
|
|
|
|
|
|
| |||||||||||||
| $ | 0 | $ | 0 | $ | 5,717 | $ | 18,419 | $ | 0 | $ | 24,136 | |||||||||||||
|
|
|
|
|
|
|
|
|
|
|
| |||||||||||||
Liabilities: | ||||||||||||||||||||||||
Written options outstanding | $ | 0 | $ | 0 | $ | 53 | $ | 0 | $ | 0 | $ | 53 | ||||||||||||
Unrealized depreciation on foreign currency contracts | 0 | 0 | 0 | 16,287 | 0 | 16,287 | ||||||||||||||||||
Unrealized depreciation on OTC swap agreements | 0 | 0 | 1,618 | 0 | 0 | 1,618 | ||||||||||||||||||
|
|
|
|
|
|
|
|
|
|
|
| |||||||||||||
| $ | 0 | $ | 0 | $ | 1,671 | $ | 16,287 | $ | 0 | $ | 17,958 | |||||||||||||
|
|
|
|
|
|
|
|
|
|
|
| |||||||||||||
The Effect of Financial Derivative Instruments on the Consolidated Statements of Operations for the Period Ended June 30, 2013:
| Derivatives not accounted for as hedging instruments | ||||||||||||||||||||||||
| Commodity Contracts | Credit Contracts | Equity Contracts | Foreign Exchange Contracts | Interest Rate Contracts | Total | |||||||||||||||||||
Realized Gain (Loss) on Derivatives: | ||||||||||||||||||||||||
Net realized (loss) on investments (purchased options) | $ | 0 | $ | 0 | $ | (9,549 | ) | $ | (90 | ) | $ | 0 | $ | (9,639 | ) | |||||||||
Net realized gain on written options | 0 | 0 | 4,522 | 0 | 0 | 4,522 | ||||||||||||||||||
Net realized gain on swaps | 0 | 0 | 1,060 | 0 | 0 | 1,060 | ||||||||||||||||||
Net realized (loss) on foreign currency transactions | 0 | 0 | 0 | (33,314 | ) | 0 | (33,314 | ) | ||||||||||||||||
|
|
|
|
|
|
|
|
|
|
|
| |||||||||||||
| $ | 0 | $ | 0 | $ | (3,967 | ) | $ | (33,404 | ) | $ | 0 | $ | (37,371 | ) | ||||||||||
|
|
|
|
|
|
|
|
|
|
|
| |||||||||||||
Net Change in Unrealized Appreciation (Depreciation) on Derivatives: | ||||||||||||||||||||||||
Net change in unrealized appreciation on investments (purchased options) | $ | 0 | $ | 0 | $ | 5,063 | $ | 78 | $ | 0 | $ | 5,141 | ||||||||||||
Net change in unrealized (depreciation) on written options | 0 | 0 | (3,389 | ) | 0 | 0 | (3,389 | ) | ||||||||||||||||
Net change in unrealized (depreciation) on swaps | 0 | 0 | (1,922 | ) | 0 | 0 | (1,922 | ) | ||||||||||||||||
Net change in unrealized appreciation on translation of assets and liabilities denominated in foreign currencies | 0 | 0 | 0 | 81 | 0 | 81 | ||||||||||||||||||
|
|
|
|
|
|
|
|
|
|
|
| |||||||||||||
| $ | 0 | $ | 0 | $ | (248 | ) | $ | 159 | $ | 0 | $ | (89 | ) | |||||||||||
|
|
|
|
|
|
|
|
|
|
|
| |||||||||||||
| (1) | See note 6 in the Notes to Financial Statements for additional information. |
FAIR VALUE MEASUREMENTS (1)
The following is a summary of the fair valuations according to the inputs used as of June 30, 2013 in valuing the Fund’s assets and liabilities:
| Category and Subcategory | Level 1 | Level 2 | Level 3 | Fair Value at 06/30/2013 | ||||||||||||
Investments, at value | ||||||||||||||||
Common Stocks | ||||||||||||||||
Belgium | ||||||||||||||||
Industrials | $ | 26,695 | $ | 0 | $ | 0 | $ | 26,695 | ||||||||
Bermuda | ||||||||||||||||
Energy | 21,045 | 34,175 | 0 | 55,220 | ||||||||||||
Financials | 32,344 | 0 | 0 | 32,344 | ||||||||||||
Brazil | ||||||||||||||||
Financials | 13,346 | 0 | 0 | 13,346 | ||||||||||||
Canada | ||||||||||||||||
Energy | 13,611 | 0 | 0 | 13,611 | ||||||||||||
Materials | 6,155 | 0 | 0 | 6,155 | ||||||||||||
Denmark | ||||||||||||||||
Consumer Staples | 0 | 31,918 | 0 | 31,918 | ||||||||||||
Faeroe Islands | ||||||||||||||||
Consumer Staples | 8,778 | 0 | 0 | 8,778 | ||||||||||||
Financials | 3,963 | 0 | 0 | 3,963 | ||||||||||||
| Category and Subcategory | Level 1 | Level 2 | Level 3 | Fair Value at 06/30/2013 | ||||||||||||
France | ||||||||||||||||
Consumer Discretionary | $ | 0 | $ | 37,478 | $ | 0 | $ | 37,478 | ||||||||
Consumer Staples | 0 | 83,798 | 0 | 83,798 | ||||||||||||
Energy | 0 | 26,180 | 0 | 26,180 | ||||||||||||
Utilities | 0 | 22,897 | 0 | 22,897 | ||||||||||||
Germany | ||||||||||||||||
Health Care | 34,357 | 0 | 0 | 34,357 | ||||||||||||
Industrials | 0 | 3,482 | 0 | 3,482 | ||||||||||||
Utilities | 0 | 4,597 | 0 | 4,597 | ||||||||||||
Hong Kong | ||||||||||||||||
Consumer Discretionary | 0 | 8,213 | 0 | 8,213 | ||||||||||||
Financials | 0 | 54,852 | 0 | 54,852 | ||||||||||||
Industrials | 0 | 8,281 | 0 | 8,281 | ||||||||||||
Israel | ||||||||||||||||
Health Care | 11,059 | 0 | 0 | 11,059 | ||||||||||||
Japan | ||||||||||||||||
Consumer Discretionary | 0 | 9,584 | 0 | 9,584 | ||||||||||||
| 78 | PIMCO EQUITY SERIES | See Accompanying Notes |
Table of Contents
June 30, 2013
| Category and Subcategory | Level 1 | Level 2 | Level 3 | Fair Value at 06/30/2013 | ||||||||||||
Industrials | $ | 0 | $ | 17,830 | $ | 0 | $ | 17,830 | ||||||||
Information Technology | 0 | 21,716 | 0 | 21,716 | ||||||||||||
Netherlands | ||||||||||||||||
Consumer Staples | 9,246 | 29,563 | 0 | 38,809 | ||||||||||||
Energy | 0 | 14,359 | 0 | 14,359 | ||||||||||||
Financials | 0 | 28,625 | 0 | 28,625 | ||||||||||||
Information Technology | 11,437 | 0 | 0 | 11,437 | ||||||||||||
Norway | ||||||||||||||||
Consumer Staples | 20,453 | 43,781 | 0 | 64,234 | ||||||||||||
Singapore | ||||||||||||||||
Financials | 0 | 1,170 | 0 | 1,170 | ||||||||||||
Industrials | 0 | 13,989 | 0 | 13,989 | ||||||||||||
South Africa | ||||||||||||||||
Materials | 7,865 | 0 | 0 | 7,865 | ||||||||||||
South Korea | ||||||||||||||||
Consumer Discretionary | 5,963 | 0 | 0 | 5,963 | ||||||||||||
Sweden | ||||||||||||||||
Industrials | 0 | 21,918 | 0 | 21,918 | ||||||||||||
Switzerland | ||||||||||||||||
Consumer Staples | 0 | 25,916 | 0 | 25,916 | ||||||||||||
Financials | 0 | 12,762 | 0 | 12,762 | ||||||||||||
Health Care | 0 | 24,136 | 0 | 24,136 | ||||||||||||
Information Technology | 8,060 | 0 | 0 | 8,060 | ||||||||||||
Materials | 0 | 11,644 | 0 | 11,644 | ||||||||||||
United Kingdom | ||||||||||||||||
Consumer Discretionary | 5,493 | 0 | 0 | 5,493 | ||||||||||||
Consumer Staples | 0 | 145,218 | 0 | 145,218 | ||||||||||||
Energy | 17,017 | 31,589 | 0 | 48,606 | ||||||||||||
Financials | 0 | 48,229 | 0 | 48,229 | ||||||||||||
United States | ||||||||||||||||
Consumer Staples | 136,748 | 0 | 0 | 136,748 | ||||||||||||
Energy | 48,530 | 0 | 0 | 48,530 | ||||||||||||
Financials | 206,036 | 0 | 0 | 206,036 | ||||||||||||
Health Care | 58,810 | 0 | 0 | 58,810 | ||||||||||||
Industrials | 75,519 | 0 | 0 | 75,519 | ||||||||||||
Information Technology | 117,790 | 0 | 0 | 117,790 | ||||||||||||
| Category and Subcategory | Level 1 | Level 2 | Level 3 | Fair Value at 06/30/2013 | ||||||||||||
Exchange-Traded Funds | ||||||||||||||||
United States | $ | 52,513 | $ | 0 | $ | 0 | $ | 52,513 | ||||||||
Preferred Stocks | ||||||||||||||||
Brazil | ||||||||||||||||
Financials | 4,465 | 0 | 0 | 4,465 | ||||||||||||
Real Estate Investment Trusts | ||||||||||||||||
Singapore | 0 | 349 | 0 | 349 | ||||||||||||
United States | 23,048 | 0 | 0 | 23,048 | ||||||||||||
Rights | ||||||||||||||||
France | ||||||||||||||||
Health Care | 5,027 | 0 | 0 | 5,027 | ||||||||||||
Hong Kong | ||||||||||||||||
Financials | 0 | 24 | 0 | 24 | ||||||||||||
Short-Term Instruments | ||||||||||||||||
Repurchase Agreements | 0 | 2,793 | 0 | 2,793 | ||||||||||||
U.S. Treasury Bills | 0 | 8,568 | 0 | 8,568 | ||||||||||||
Central Funds Used for Cash Management Purposes | 52,498 | 0 | 0 | 52,498 | ||||||||||||
Purchased Options | ||||||||||||||||
Equity Contracts | 0 | 5,717 | 0 | 5,717 | ||||||||||||
| $ | 1,037,871 | $ | 835,351 | $ | 0 | $ | 1,873,222 | |||||||||
Short Sales, at value | ||||||||||||||||
Common Stocks | $ | (21,022 | ) | $ | 0 | $ | 0 | $ | (21,022 | ) | ||||||
Financial Derivative Instruments - Assets |
| |||||||||||||||
Foreign Exchange Contracts | $ | 0 | $ | 18,419 | $ | 0 | $ | 18,419 | ||||||||
Financial Derivative Instruments - Liabilities |
| |||||||||||||||
Equity Contracts | (4 | ) | (1,667 | ) | 0 | (1,671 | ) | |||||||||
Foreign Exchange Contracts | 0 | (16,287 | ) | 0 | (16,287 | ) | ||||||||||
| $ | (4 | ) | $ | (17,954 | ) | $ | 0 | $ | (17,958 | ) | ||||||
Totals | $ | 1,016,845 | $ | 835,816 | $ | 0 | $ | 1,852,661 | ||||||||
There were assets and liabilities valued at $55,720 transferred from Level 2 to Level 1 during the period ended June 30, 2013.
| (1) | See note 3 in the Notes to Financial Statements for more information regarding pricing inputs, valuation techniques and transfers. |
| See Accompanying Notes | ANNUAL REPORT | JUNE 30, 2013 | 79 |
Table of Contents
1. ORGANIZATION
PIMCO Equity Series (the “Trust”) was established as a Delaware statutory trust on December 28, 2009. The Trust is registered under the Investment Company Act of 1940, as amended (the “Act”), as an open-end management investment company. Information presented in these financial statements pertains to the Institutional Class, Class P, Administrative Class, Class D, Class A, Class C and Class R shares of the six funds (each a “Fund” and collectively the “Funds”) offered by the Trust.
2. SIGNIFICANT ACCOUNTING POLICIES
The following is a summary of significant accounting policies consistently followed by the Trust in the preparation of its financial statements in conformity with accounting principles generally accepted in the United States of America (“U.S. GAAP”). The preparation of financial statements in accordance with U.S. GAAP requires management to make estimates and assumptions that affect the reported amounts of assets and liabilities and disclosure of contingent assets and liabilities at the date of the financial statements and the reported amounts of increases and decreases in net assets from operations during the reporting period. Actual results could differ from those estimates.
(a) Securities Transactions and Investment Income Securities transactions are recorded as of the trade date for financial reporting purposes. Realized gains and losses from securities sold are recorded on the identified cost basis. Dividend income is recorded on the ex-dividend date, except certain dividends from foreign securities where the ex-dividend date may have passed, which are recorded as soon as the Fund is informed of the ex-dividend date. Interest income, adjusted for the accretion of discounts and amortization of premiums, is recorded on the accrual basis from settlement date. For convertible securities, premiums attributable to the conversion feature are not amortized. Estimated tax liabilities on certain foreign securities are recorded on an accrual basis and are reflected as components of interest income or net change in unrealized gain/loss on investments on the Statements of Operations, as appropriate. Tax liabilities realized as a result of such security sales are reflected as a component of net realized gain/loss on investments on the Statements of Operations. Paydown gains and losses on mortgage related and other asset-backed securities are recorded as components of interest income on the Statements of Operations. Income or short-term capital gain distributions received from underlying funds are recorded as dividend income. Long-term capital gain distributions received from underlying funds are recorded as realized gains.
Debt obligations may be placed on non-accrual status and related interest income may be reduced by ceasing current accruals and
writing off interest receivable when the collection of all or a portion of interest has become doubtful based on consistently applied procedures. A debt obligation is removed from non-accrual status when the issuer resumes interest payments or when collectability of interest is reasonably assured.
(b) Foreign Currency Translation The functional and reporting currency for the Funds is the U.S. dollar. The market values of foreign securities, currency holdings and other assets and liabilities are translated into U.S. dollars based on the current exchange rates each business day. Purchases and sales of securities, income and expense items denominated in foreign currencies are translated into U.S. dollars at the exchange rate in effect on the transaction date. A Fund does not separately report the effect of changes in foreign exchange rates from changes in market prices on securities held. Such changes are included in net realized and unrealized gain or loss from investments on the Statements of Operations. Realized foreign exchange gains or losses arise from sales of foreign currencies, currency gains or losses realized between the trade and settlement dates on securities transactions and the difference between the recorded amounts of dividend, interest, and foreign withholding taxes and the U.S. dollar equivalent of the amounts actually received or paid. Net unrealized foreign exchange gains and losses arise from changes in foreign exchange rates on foreign denominated assets and liabilities other than investments in securities held at the end of the reporting period.
(c) Multiclass Operations Each class offered by the Trust has equal rights as to assets and voting privileges (except that shareholders of a class have exclusive voting rights regarding any matter relating solely to that class of shares). Income and non-class specific expenses are allocated daily to each class on the basis of the relative net assets. Realized and unrealized capital gains and losses are allocated daily based on the relative net assets of each class of the respective Fund. Class specific expenses, where applicable, currently include supervisory and administrative and distribution and servicing fees.
(d) Dividends and Distributions to Shareholders Dividends from net investment income, if any, of each Fund, except the PIMCO Dividend and Income Builder Fund and PIMCO EqS® Dividend Fund, are declared and distributed to shareholders annually. Dividends from net investment income, if any, of the PIMCO Dividend and Income Builder Fund and PIMCO EqS® Dividend Fund are declared daily and distributed to shareholders quarterly. Net realized capital gains earned by each Fund, if any, will be distributed no less frequently than once each year.
Income dividends and capital gain distributions are determined in accordance with income tax regulations which may differ from U.S. GAAP. Differences between tax regulations and U.S. GAAP may cause timing differences between income and capital gain recognition. Examples of events that give rise to timing differences include wash
| 80 | PIMCO EQUITY SERIES |
Table of Contents
June 30, 2013
sales, straddles and capital loss carryforwards. Further, the character of investment income and capital gains may be different for certain transactions under the two methods of accounting. Examples of characterization differences include the treatment of paydowns on mortgage-backed securities, swaps, foreign currency transactions and investments in passive foreign investment companies. As a result, income dividends and capital gain distributions declared during a fiscal period may differ significantly from the net investment income (loss) and realized gains (losses) reported on each Fund’s annual financial statements presented under U.S. GAAP.
Distributions classified as a tax basis return of capital, if any, are reflected on the accompanying Statements of Changes in Net Assets and have been recorded to paid in capital. In addition, other amounts have been reclassified between undistributed net investment income, accumulated undistributed net realized gains or losses and/or paid in capital to more appropriately conform financial accounting to tax characterizations of dividend distributions.
(e) Statement of Cash Flows U.S. GAAP requires entities providing financial statements that report both financial position and results of operations to also provide a statement of cash flows for each period for which results of operations are provided, but exempts investment companies meeting certain conditions. One of the conditions is that substantially all of the enterprise’s investments were carried at fair value during the period and classified as Level 1 or Level 2 measurements in accordance with the requirements of U.S. GAAP. Another condition is that the enterprise had little or no debt, based on the average debt outstanding during the period, in relation to average total assets. Funds with certain degrees of borrowing activity, typically through the use of reverse repurchase agreements, sale-buyback transactions or short sale transactions, have been determined to be at a level requiring a Statement of Cash Flows. Statements of Cash Flows have been prepared using the indirect method which requires net increase in net assets resulting from operations to be adjusted to reconcile to net cash flows from operating activities.
(f) New Accounting Pronouncements In April 2011, the Financial Accounting Standards Board (“FASB”) issued an Accounting Standards Update (“ASU”) related to the accounting for repurchase agreements and similar agreements that both entitle and obligate a transferor to repurchase or redeem financial assets before their maturity. The ASU modifies the criteria for determining effective control of transferred assets. Effective July 1, 2012, the Funds began accounting for the sale and simultaneous agreement to repurchase certain securities (“sale-buybacks”) as financing transactions. These transactions were previously accounted for as purchases and sales. As such, the Funds may have recorded additional interest expense. See Note 9 in the Notes to Financial Statements for additional details.
In May 2011, the FASB issued an ASU to develop common requirements for measuring fair value and for disclosing information about fair value measurements in accordance with U.S. GAAP and International Financial Reporting Standards (“IFRS”). The FASB concluded that the amendments in this ASU will improve the comparability of fair value measurements presented and disclosed in financial statements prepared in accordance with U.S. GAAP and IFRS. The financial statements have been modified to provide enhanced quantitative and qualitative disclosures surrounding fair value measurements. See Fair Value Measurements in the Notes to Schedules of Investments and Note 3 in the Notes to Financial Statements for additional details.
In December 2011, the FASB issued an ASU to enhance disclosures about financial instruments and derivative instruments that are subject to offsetting (“netting”) on the Statements of Assets and Liabilities. This information will enable users of the entity’s financial statements to evaluate the effect or potential effect of netting arrangements on the entity’s financial position. The ASU is effective prospectively during interim or annual periods beginning on or after January 1, 2013. At this time, management is evaluating the implications of these changes on the financial statements.
3. INVESTMENT VALUATION AND FAIR VALUE MEASUREMENTS
(a) Investment Valuation Policies The Net Asset Value (“NAV”) of a Fund’s shares is valued as of the close of regular trading (normally 4:00 p.m., Eastern time) (the “NYSE Close”) on each day that the New York Stock Exchange (“NYSE”) is open (each a “Business Day”). Information that becomes known to a Fund or its agents after the NAV has been calculated on a particular day will not generally be used to retroactively adjust the price of a security or the NAV determined earlier that day.
For purposes of calculating the NAV, portfolio securities and other financial derivative instruments are valued on each Business Day using valuation methods as adopted by the Board of Trustees (the “Board”) of the Trust. Where market quotes are readily available, fair market value is generally determined on the basis of last reported sales prices, or if no sales are reported, based on quotes obtained from a quotation reporting system, established market makers, or pricing services. Where market quotes are not readily available, portfolio securities and other financial derivative instruments are valued at fair value, as determined in good faith by the Board, its Valuation Committee, or the investment adviser (the “Adviser”) pursuant to instructions from the Board or its Valuation Committee.
Market quotes are considered not readily available in circumstances where there is an absence of current or reliable market-based data
| ANNUAL REPORT | JUNE 30, 2013 | 81 |
Table of Contents
Notes to Financial Statements (Cont.)
(e.g., trade information, bid/ask information, or broker quotes), including where events occur after the close of the relevant market, but prior to the NYSE Close, that materially affect the values of a Fund’s securities or financial derivative instruments. In addition, market quotes are considered not readily available when, due to extraordinary circumstances, the exchanges or markets on which securities trade do not open for trading for the entire day and no other market prices are available. The Board has delegated to the Adviser, Pacific Investment Management Company LLC (“PIMCO”), the responsibility for monitoring significant events that may materially affect the values of a Fund’s securities or financial derivative instruments and for determining whether the value of the applicable securities or financial derivative instruments should be re-evaluated in light of such significant events.
The Board has adopted methods for valuing securities and other financial derivative instruments in circumstances where market quotes are not readily available, and has delegated the responsibility for applying the valuation methods to PIMCO. The Valuation Committee has been established by the Board to oversee the implementation of a Fund’s valuation methods and to make fair value determinations on behalf of the Board as instructed. The Board has adopted methods for valuing securities and other financial derivative instruments that may require fair valuation under particular circumstances. The Adviser monitors the continual appropriateness of methods applied and determines if adjustments should be made in light of market changes, events affecting the issuer, or other factors. If the Adviser determines that a valuation method may no longer be appropriate, another valuation method may be selected, or the Valuation Committee will take any appropriate action in accordance with procedures set forth by the Board. The Board shall review the appropriateness of the valuation methods from time to time and these methods may be amended or supplemented from time to time by the Valuation Committee.
For instances in which daily market quotes are not readily available, investments may be valued, pursuant to guidelines established by the Board, with reference to other securities or indices. In the event that the security or asset cannot be valued pursuant to the established guidelines, the value of the security or asset will be determined in good faith by the Valuation Committee of the Board, generally based upon recommendations provided by PIMCO. These methods may require subjective determinations about the value of a security. While the Trust’s policy is intended to result in a calculation of a Fund’s NAV that fairly reflects security values as of the time of pricing, the Trust cannot guarantee that values determined by the Board or persons acting at their direction would accurately reflect the price that a Fund could obtain for a security if it were to dispose of that security as of the time of pricing (for instance, in a forced or distressed sale). The prices used by a Fund may differ from the value that would be realized if the securities were sold.
(b) Fair Value Hierarchy U.S. GAAP defines fair market value as the price that a Fund would receive to sell an asset or pay to transfer a liability in an orderly transaction between market participants at the measurement date. It establishes a fair value hierarchy that prioritizes inputs to valuation methods and requires disclosure of the fair value hierarchy, separately for each major category of assets and liabilities, that segregates fair value measurements into levels (Level 1, 2, and 3). The inputs or methodology used for valuing securities are not necessarily an indication of the risk associated with investing in those securities. Levels 1, 2, and 3 of the fair value hierarchy are defined as follows:
| n | Level 1—Inputs using (unadjusted) quoted prices in active markets or exchanges for identical assets and liabilities. |
| n | Level 2—Significant other observable inputs, which may include, but are not limited to, quoted prices for similar assets or liabilities in markets that are active, quoted prices for identical or similar assets or liabilities in markets that are not active, inputs other than quoted prices that are observable for the assets or liabilities (such as interest rates, yield curves, volatilities, prepayment speeds, loss severities, credit risks and default rates) or other market corroborated inputs. |
| n | Level 3—Significant unobservable inputs based on the best information available in the circumstances, to the extent observable inputs are not available, which may include assumptions made by the Board or persons acting at their direction that are used in determining the fair value of investments. |
Assets or liabilities categorized as Level 1 or 2 as of period end have been transferred between Levels 1 and 2 since the prior period due to changes in the valuation method utilized in valuing the investments. Transfers from Level 1 to Level 2 are a result of a change, in the normal course of business, from the use of an exchange traded price or a trade price on the initial purchase date (Level 1) to valuation methods used by third-party pricing services including valuation adjustments applied to certain securities that are solely traded on a foreign exchange to account for the market movement between the close of the foreign market and the close of the NYSE (Level 2). Transfers from Level 2 to Level 1 are a result of exchange traded products for which quoted prices from an active market were not available (Level 2) and have become available (Level 1). In accordance with the requirements of U.S. GAAP, the amounts of transfers between Levels 1 and 2 and transfers in and out of Level 3, if any, are disclosed in the Notes to Schedule of Investments for each respective Fund.
For fair valuations using significant unobservable inputs, U.S. GAAP requires a reconciliation of the beginning to ending balances for reported fair values that presents changes attributable to total realized
| 82 | PIMCO EQUITY SERIES |
Table of Contents
June 30, 2013
and unrealized gains or losses, purchases and sales, and transfers in or out of the Level 3 category during the period. The end of period timing recognition is used for the transfers between Levels of the Fund’s assets and liabilities. Additionally, U.S. GAAP requires quantitative information regarding the significant unobservable inputs used in the determination of fair value of assets or liabilities categorized as Level 3 in the fair value hierarchy. In accordance with the requirements of U.S. GAAP, a fair value hierarchy, Level 3 reconciliation, and details of significant unobservable inputs, if any, have been included in the Notes to Schedule of Investments for each respective Fund.
(c) Valuation Techniques and the Fair Value Hierarchy Level 1 and Level 2 trading assets and trading liabilities, at fair market value The valuation methods (or “techniques”) and significant inputs used in determining the fair market values of portfolio securities or financial derivative instruments categorized as Level 1 and Level 2 of the fair value hierarchy are as follows:
Fixed income securities including corporate, convertible and municipal bonds and notes, U.S. government agencies, U.S. treasury obligations, sovereign issues, bank loans, convertible preferred securities and non-U.S. bonds are normally valued by pricing service providers that use broker-dealer quotations, reported trades or valuation estimates from their internal pricing models. The service providers’ internal models use inputs that are observable such as issuer details, interest rates, yield curves, prepayment speeds, credit risks/spreads, default rates and quoted prices for similar assets. Securities that use similar valuation techniques and inputs as described above are categorized as Level 2 of the fair value hierarchy.
Mortgage-related and asset-backed securities are usually issued as separate tranches, or classes, of securities within each deal. These securities are also normally valued by pricing service providers that use broker-dealer quotations or valuation estimates from their internal pricing models. The pricing models for these securities usually consider tranche-level attributes, current market data, estimated cash flows and market-based yield spreads for each tranche, and incorporate deal collateral performance, as available. Mortgage-related and asset-backed securities that use similar valuation techniques and inputs as described above are categorized as Level 2 of the fair value hierarchy.
Common stocks, exchange-traded funds, exchange-traded notes and financial derivative instruments, such as futures contracts or options contracts that are traded on a national securities exchange, are stated at the last reported sale or settlement price on the day of valuation. To the extent these securities are actively traded and valuation adjustments are not applied, they are categorized as Level 1 of the fair value hierarchy.
Investments initially valued in currencies other than the U.S. dollar are converted to the U.S. dollar using exchange rates obtained from pricing service providers. As a result, the NAV of a Fund’s shares may be affected by changes in the value of currencies in relation to the U.S. dollar. The value of securities traded in markets outside the United States or denominated in currencies other than the U.S. dollar may be affected significantly on a day that the NYSE is closed and the NAV may change on days when an investor is not able to purchase, redeem or exchange shares. Valuation adjustments may be applied to certain securities that are solely traded on a foreign exchange to account for the market movement between the close of the foreign market and the NYSE Close. These securities are valued using pricing service providers that consider the correlation of the trading patterns of the foreign security to the intraday trading in the U.S. markets for investments. Securities using these valuation adjustments are categorized as Level 2 of the fair value hierarchy. Preferred securities and other equities traded on inactive markets or valued by reference to similar instruments are also categorized as Level 2 of the fair value hierarchy.
Equity-linked securities are valued by referencing the last reported sale or settlement price of the linked referenced equity on the day of valuation. Foreign exchange adjustments are applied to the last reported price to convert the linked equity’s trading currency to the contract’s settling currency. These investments are categorized as Level 2 of the fair value hierarchy.
Investments in registered open-end investment management companies will be valued based upon the NAVs of such investments and are categorized as Level 1 of the fair value hierarchy. Investments in unregistered open-end management investment companies will be calculated based upon the NAVs of such investments and are considered Level 1 provided that the NAVs are observable, calculated daily and are the value at which both purchases and sales will be conducted. Investments in privately held investment funds with significant restrictions on redemptions where the inputs of NAVs are observable will be valued based upon the NAVs of such investments and are categorized as Level 2 of the fair value hierarchy.
Short-term investments having a maturity of 60 days or less and repurchase agreements are generally valued at amortized cost which approximates fair market value. These investments are categorized as Level 2 of the fair value hierarchy.
Equity exchange-traded options and over-the-counter financial derivative instruments, such as foreign currency contracts, options contracts, or swap agreements, derive their value from underlying asset prices, indices, reference rates, and other inputs or a combination of these factors. These contracts are normally valued by independent pricing service providers. Depending on the product and the terms of
| ANNUAL REPORT | JUNE 30, 2013 | 83 |
Table of Contents
Notes to Financial Statements (Cont.)
the transaction, financial derivative instruments can be valued by a pricing service provider using a series of techniques, including simulation pricing models. The pricing models use inputs that are observed from actively quoted markets such as issuer details, indices, spreads, interest rates, yield curves, dividends and exchange rates. Financial derivative instruments that use similar valuation techniques and inputs as described above are categorized as Level 2 of the fair value hierarchy.
Centrally cleared swaps listed or traded on a multilateral or trade facility platform, such as a registered exchange, are valued at the daily settlement price determined by the respective exchange. For centrally cleared credit default swaps the clearing facility requires its members to provide actionable levels across complete term structures. These levels along with external third party prices are used to produce daily settlement prices. These securities are categorized as Level 2 of the fair value hierarchy. Centrally cleared interest rate swaps are valued using a pricing model that references the underlying rates including the overnight index swap rate and London Interbank Offered Rate (“LIBOR”) forward rate to produce the daily settlement price. These securities are categorized as Level 2 of the fair value hierarchy.
Level 3 trading assets and trading liabilities, at fair value When a fair valuation method is applied by PIMCO that uses significant unobservable inputs, securities will be priced by a method that the Board or persons acting at their direction believe accurately reflects fair value and are categorized as Level 3 of the fair value hierarchy. The valuation techniques and significant inputs used in determining the fair values of portfolio assets and liabilities categorized as Level 3 of the fair value hierarchy are as follows:
Investments in privately held investment funds with significant restrictions on redemptions where the inputs of the NAVs are unobservable will be calculated based upon the NAVs of such investments and are categorized as Level 3 of the fair value hierarchy.
If third party evaluated vendor pricing is neither available nor deemed to be indicative of fair value, the Adviser may elect to obtain indicative market quotations (“broker quotes”) directly from the broker-dealer or passed through from a third party vendor. In the event that the source of fair value is from a single sourced broker quote, these securities are categorized as Level 3 of the fair value hierarchy. Broker Quotes are typically received from established market participants. Although independently received, the Adviser does not have the transparency to view the underlying inputs which support the market quotation. Significant changes in the broker quote would have direct and proportional changes in the fair value of the security.
4. SECURITIES AND OTHER INVESTMENTS
(a) Equity-Linked Securities A Fund may purchase equity-linked securities, also known as participation notes, equity swaps, and zero strike calls and warrants. Equity-linked securities are primarily used by a Fund as an alternative means to more efficiently and effectively access what is generally an emerging securities market. A Fund deposits cash with its custodian (or broker, if legally permitted) in an amount near or equal to the selling price of the underlying security in exchange for an equity-linked security. Upon sale, a Fund receives cash from the broker or custodian equal to the value of the underlying security. Aside from market risk of the underlying securities, there is a risk of default by the counterparty to the transaction. In the event of insolvency of the counterparty, a Fund might be unable to obtain its expected benefit. In addition, while a Fund will seek to enter into such transactions only with parties that are capable of entering into closing transactions with the Fund, there can be no assurance that the Fund will be able to close out such a transaction with the counterparty or obtain an offsetting position with any counterparty, at any time prior to the end of the term of the underlying agreement. This may impair a Fund’s ability to enter into other transactions at a time when doing so might be advantageous.
(b) Exchange-Traded Funds The Funds may invest in exchange-traded funds (“ETFs”), which generally are index-based investment companies that hold substantially all of their assets in securities representing their specific index. Shares of ETFs trade throughout the day on an exchange and represent an investment in a portfolio of securities and assets. As a shareholder of another investment company, the Funds would bear their pro rata portion of the other investment company’s expenses, including advisory fees, in addition to the expenses the Funds bear directly in connection with their own operations.
(c) Mortgage-Related and Other Asset-Backed Securities Certain Funds may invest in mortgage-related and other asset-backed securities. These securities include mortgage pass-through securities, collateralized mortgage obligations, commercial mortgage-backed securities, asset-backed securities and other securities that directly or indirectly represent a participation in, or are secured by and payable from, mortgage loans on real property. Mortgage-related and other asset-backed securities are interests in pools of loans or other receivables. Mortgage-related securities are created from pools of residential or commercial mortgage loans, including mortgage loans made by savings and loan institutions, mortgage bankers, commercial banks and others. Asset-backed securities are created from many types of assets, including auto loans, credit card receivables, home equity loans, and student loans. These securities provide a monthly payment which consists of both interest and principal payments. Interest payments may be determined by fixed or adjustable rates. The rate of
| 84 | PIMCO EQUITY SERIES |
Table of Contents
June 30, 2013
prepayments on underlying mortgages will affect the price and volatility of a mortgage-related security, and may have the effect of shortening or extending the effective duration of the security relative to what was anticipated at the time of purchase. The timely payment of principal and interest of certain mortgage-related securities is guaranteed with the full faith and credit of the U.S. Government. Pools created and guaranteed by non-governmental issuers, including government-sponsored corporations, may be supported by various forms of insurance or guarantees, but there can be no assurance that the private insurers or guarantors can meet their obligations under the insurance policies or guarantee arrangements.
Collateralized Mortgage Obligations (“CMOs”) are debt obligations of a legal entity that are collateralized by mortgages and divided into classes. CMOs are structured into multiple classes, often referred to as “tranches,” with each class bearing a different stated maturity and entitled to a different schedule for payments of principal and interest, including prepayments. Commercial Mortgage-Backed Securities (“CMBS”) include securities that reflect an interest in, and are secured by, mortgage loans on commercial real property. Many of the risks of investing in CMBS reflect the risks of investing in the real estate securing the underlying mortgage loans. These risks reflect the effects of local and other economic conditions on real estate markets, the ability of tenants to make loan payments, and the ability of a property to attract and retain tenants. CMOs and CMBS may be less liquid and may exhibit greater price volatility than other types of mortgage-related or asset-backed securities.
(d) U.S. Government Agencies or Government-Sponsored Enterprises Certain Funds may invest in securities of U.S. Government agencies or government-sponsored enterprises. U.S. Government securities are obligations of and, in certain cases, guaranteed by, the U.S. Government, its agencies or instrumentalities. Some U.S. Government securities, such as Treasury bills, notes and bonds, and securities guaranteed by the Government National Mortgage Association (“GNMA” or “Ginnie Mae”), are supported by the full faith and credit of the U.S. Government; others, such as those of the Federal Home Loan Banks, are supported by the right of the issuer to borrow from the U.S. Department of the Treasury (the “U.S. Treasury”); others, such as those of the Federal National Mortgage Association (“FNMA” or “Fannie Mae”), are supported by the discretionary authority of the U.S. Government to purchase the agency’s obligations. U.S. Government securities may include zero coupon securities, which do not distribute interest on a current basis and tend to be subject to greater risk than interest-paying securities of similar maturities.
5. BORROWINGS AND OTHER FINANCING TRANSACTIONS
The following disclosures contain information on a Fund’s ability to lend or borrow cash or securities to the extent permitted under the Act, which may be viewed as borrowing or financing transactions by a Fund. The location and fair value amounts of these instruments are described below. For a detailed description of credit and counterparty risks that can be associated with borrowings and other financing transactions, please see Note 7, Principal Risks.
(a) Repurchase Agreements Each Fund may engage in repurchase agreements. Under the terms of a typical repurchase agreement, a Fund takes possession of an underlying debt obligation (collateral) subject to an obligation of the seller to repurchase, and a Fund to resell, the obligation at an agreed-upon price and time. The underlying securities for all repurchase agreements are held in safekeeping at the Fund’s custodian or designated subcustodians under tri-party repurchase agreements. The market value of the collateral must be equal to or exceed the total amount of the repurchase obligations, including interest. Securities purchased under repurchase agreements are reflected as an asset on the Statements of Assets and Liabilities. Interest earned is recorded as a component of interest income on the Statements of Operations. In periods of increased demand for collateral, a Fund may pay a fee for receipt of collateral, which may result in interest expense to the Fund.
(b) Short Sales Certain Funds may enter into short sales transactions. Short sales are transactions in which a Fund sells a security that it may not own. A Fund may make short sales of securities to (i) offset potential declines in long positions in similar securities, (ii) to increase the flexibility of the Fund, (iii) for investment return, (iv) as part of a risk arbitrage strategy, and (v) as part of its overall portfolio management strategies involving the use of derivative instruments. When a Fund engages in a short sale, it may borrow the security sold short and deliver it to the counterparty. A Fund will ordinarily have to pay a fee or premium to borrow a security and be obligated to repay the lender of the security any dividend or interest that accrues on the security during the period of the loan. Securities sold in short sale transactions and the dividend or interest payable on such securities, if any, are reflected as payable for short sales on the Statements of Assets and Liabilities. Short sales expose a Fund to the risk that it will be required to cover its short position at a time when the security or other asset has appreciated in value, thus resulting in losses to the Fund. A short sale is “against the box” if a Fund holds in its portfolio or has the right to acquire the security sold short at no additional cost. A Fund will be subject to additional risks to the extent that it engages in short sales that are not “against the box.” A Fund’s loss on a short sale could theoretically be unlimited in cases where the Fund is unable, for whatever reason, to close out its short position.
| ANNUAL REPORT | JUNE 30, 2013 | 85 |
Table of Contents
Notes to Financial Statements (Cont.)
6. FINANCIAL DERIVATIVE INSTRUMENTS
The following disclosures contain information on how and why the Funds use financial derivative instruments, the credit-risk-related contingent features in certain financial derivative instruments, and how financial derivative instruments affect the Funds’ financial position, results of operations and cash flows. The location and fair value amounts of these instruments on the Statements of Assets and Liabilities and the realized and changes in unrealized gains and losses on the Statements of Operations, each categorized by type of financial derivative contract and related risk exposure, are included in a table in the Notes to Schedules of Investments. The financial derivative instruments outstanding as of period end as disclosed in the Notes to Schedules of Investments and the amounts of realized and changes in unrealized gains and losses on financial derivative instruments during the period as disclosed on the Statements of Operations serve as indicators of the volume of financial derivative activity for the Funds.
(a) Foreign Currency Contracts Certain Funds may enter into foreign currency contracts in connection with settling planned purchases or sales of securities, to hedge the currency exposure associated with some or all of a Fund’s securities or as a part of an investment strategy. A foreign currency contract is an agreement between two parties to buy and sell a currency at a set price on a future date. The market value of a foreign currency contract fluctuates with changes in foreign currency exchange rates. Foreign currency contracts are marked to market daily and the change in value is recorded by a Fund as an unrealized gain or loss. Realized gains or losses equal to the difference between the value of the contract at the time it was opened and the value at the time it was closed are recorded upon delivery or receipt of the currency. These contracts may involve market risk in excess of the unrealized gain or loss reflected on the Statements of Assets and Liabilities. In addition, a Fund could be exposed to risk if the counterparties are unable to meet the terms of the contracts or if the value of the currency changes unfavorably to the U.S. dollar. In connection with these contracts, securities may be identified as collateral in accordance with the terms of the respective contracts.
(b) Futures Contracts Certain Funds may enter into futures contracts. A Fund may use futures contracts to manage its exposure to the securities markets or to movements in interest rates and currency values. The primary risks associated with the use of futures contracts are the imperfect correlation between the change in market value of the securities held by a Fund and the prices of futures contracts and the possibility of an illiquid market. Futures contracts are valued based upon their quoted daily settlement prices. Upon entering into a futures contract, a Fund is required to deposit with its futures broker, an amount of cash, or U.S. Government and Agency Obligations, or select sovereign debt, in accordance with the initial margin requirements of
the broker or exchange. Futures contracts are marked to market daily and an appropriate payable or receivable for the change in value (“variation margin”) is recorded by the Fund. Gains or losses are recognized but not considered realized until the contracts expire or are closed. Futures contracts involve, to varying degrees, risk of loss in excess of the variation margin disclosed on the Statements of Assets and Liabilities.
(c) Options Contracts Certain Funds may write call and put options on securities and financial derivative instruments they own or in which they may invest. Writing put options tends to increase a Fund’s exposure to the underlying instrument. Writing call options tends to decrease a Fund’s exposure to the underlying instrument. When a Fund writes a call or put, an amount equal to the premium received is recorded as a liability and subsequently marked to market to reflect the current value of the option written. These liabilities are reflected as written options outstanding on the Statements of Assets and Liabilities. Premiums received from writing options which expire are treated as realized gains. Premiums received from writing options which are exercised or closed are added to the proceeds or offset against amounts paid on the underlying futures, swap, security or currency transaction to determine the realized gain or loss. Certain options may be written with premiums to be determined on a future date. The premiums for these options are based upon implied volatility parameters at specified terms. A Fund as a writer of an option has no control over whether the underlying instrument may be sold (call) or purchased (put) and as a result bears the market risk of an unfavorable change in the price of the instrument underlying the written option. There is the risk a Fund may not be able to enter into a closing transaction because of an illiquid market.
Certain Funds may also purchase put and call options. Purchasing call options tends to increase a Fund’s exposure to the underlying instrument. Purchasing put options tends to decrease a Fund’s exposure to the underlying instrument. A Fund pays a premium which is included on the Fund’s Statement of Assets and Liabilities as an investment and subsequently marked to market to reflect the current value of the option. Premiums paid for purchasing options which expire are treated as realized losses. Certain options may be purchased with premiums to be determined on a future date. The premiums for these options are based upon implied volatility parameters at specified terms. The risk associated with purchasing put and call options is limited to the premium paid. Premiums paid for purchasing options which are exercised or closed are added to the amounts paid or offset against the proceeds on the underlying investment transaction to determine the realized gain or loss when the underlying transaction is executed.
Foreign Currency Options Certain Funds may write or purchase foreign currency options. Purchasing foreign currency options gives a
| 86 | PIMCO EQUITY SERIES |
Table of Contents
June 30, 2013
Fund the right, but not the obligation to buy or sell the currency and will specify the amount of currency and a rate of exchange that may be exercised by a specified date. These options may be used as a short or long hedge against possible variations in foreign exchange rates or to gain exposure to foreign currencies.
Options on Securities Certain Funds may write or purchase options on securities. An option uses a specified security as the underlying instrument for the option contract. A Fund may write or purchase options to enhance returns for a Fund or to hedge an existing position or future investment.
Options on Exchange-Traded Funds Certain Funds may write or purchase options on exchange-traded funds (“ETF Option”). An ETF Option uses a specified exchange-traded fund as the underlying instrument for the option contract. A Fund may write or purchase options to enhance returns or to hedge an existing position or future investment.
(d) Swap Agreements Certain Funds may invest in swap agreements. Swap agreements are bilaterally negotiated agreements between a Fund and a counterparty to exchange or swap investment cash flows, assets, foreign currencies or market-linked returns at specified, future intervals. Swap agreements are privately negotiated in the over-the-counter market (“OTC swaps”) or may be executed in a multilateral or other trade facility platform, such as a registered exchange (“centrally cleared swaps”). A Fund may enter into asset, credit default, cross-currency, interest rate, total return, variance and other forms of swap agreements to manage its exposure to credit, currency, interest rate, commodity, equity and inflation risk. In connection with these agreements, securities or cash may be identified as collateral or margin in accordance with the terms of the respective swap agreements to provide assets of value and recourse in the event of default or bankruptcy/insolvency.
Swaps are marked to market daily based upon values from third party vendors, which may include a registered exchange, or quotations from market makers to the extent available. In the event that market quotes are not readily available and the swap cannot be valued pursuant to one of the valuation methods, the value of the swap will be determined in good faith by the Valuation Committee of the Board of Trustees, generally based upon recommendations provided by PIMCO. Changes in market value, if any, are reflected as a component of net changes in unrealized appreciation/(depreciation) on the Statements of Operations. Daily changes in valuation of centrally cleared swaps, if any, are recorded as a receivable or payable for the change in value as appropriate (“variation margin”) on the Statements of Assets and Liabilities. OTC swap payments received or made at the beginning of the measurement period are reflected as such on the Statements of Assets and Liabilities and represent premiums paid or received upon
entering into the swap agreement to compensate for differences between the stated terms of the swap agreement and prevailing market conditions (credit spreads, currency exchange rates, interest rates, and other relevant factors). These upfront premiums are recorded as realized gains or losses on the Statements of Operations upon termination or maturity of the swap. A liquidation payment received or made at the termination of the swap is recorded as realized gain or loss on the Statements of Operations. Net periodic payments received or paid by a Fund are included as part of realized gains or losses on the Statements of Operations.
Entering into these agreements involves, to varying degrees, elements of interest, credit, market and documentation risk in excess of the amounts recognized on the Statements of Assets and Liabilities. Such risks involve the possibility that there will be no liquid market for these agreements, that the counterparty to the agreements may default on its obligation to perform or disagree as to the meaning of contractual terms in the agreements and that there may be unfavorable changes in interest rates.
A Fund’s maximum risk of loss from counterparty credit risk is the discounted net value of the cash flows to be received from the counterparty over the contract’s remaining life, to the extent that amount is positive. The risk is mitigated by having a master netting arrangement between a Fund and the counterparty and by the posting of collateral to a Fund to cover a Fund’s exposure to the counterparty.
Credit Default Swap Agreements Credit default swap agreements involve one party making a stream of payments (referred to as the buyer of protection) to another party (the seller of protection) in exchange for the right to receive a specified return in the event of a default or other credit event for the referenced entity, obligation or index. As a seller of protection on credit default swap agreements, a Fund will generally receive from the buyer of protection a fixed rate of income throughout the term of the swap provided that there is no credit event. As the seller, a Fund would effectively add leverage to its portfolio because, in addition to its total net assets, a Fund would be subject to investment exposure on the notional amount of the swap.
If a Fund is a seller of protection and a credit event occurs, as defined under the terms of that particular swap agreement, a Fund will either (i) pay to the buyer of protection an amount equal to the notional amount of the swap and take delivery of the referenced obligation, other deliverable obligations or underlying securities comprising the referenced index or (ii) pay a net settlement amount in the form of cash or securities equal to the notional amount of the swap less the recovery value of the referenced obligation or underlying securities comprising the referenced index. If a Fund is a buyer of protection and a credit event occurs, as defined under the terms of that particular swap
| ANNUAL REPORT | JUNE 30, 2013 | 87 |
Table of Contents
Notes to Financial Statements (Cont.)
agreement, a Fund will either (i) receive from the seller of protection an amount equal to the notional amount of the swap and deliver the referenced obligation, other deliverable obligations or underlying securities comprising the referenced index or (ii) receive a net settlement amount in the form of cash or securities equal to the notional amount of the swap less the recovery value of the referenced obligation or underlying securities comprising the referenced index. Recovery values are estimated by market makers considering either industry standard recovery rates or entity specific factors and considerations until a credit event occurs. If a credit event has occurred, the recovery value is determined by a facilitated auction whereby a minimum number of allowable broker bids, together with a specified valuation method, are used to calculate the settlement value.
Credit default swap agreements on sovereign issues involve one party making a stream of payments to another party in exchange for the right to receive a specified return in the event of a default or other credit event. If a credit event occurs and cash settlement is not elected, a variety of other deliverable obligations may be delivered in lieu of the specific referenced obligation. The ability to deliver other obligations may result in a cheapest-to-deliver option (the buyer of protection’s right to choose the deliverable obligation with the lowest value following a credit event). A Fund may use credit default swaps on sovereign issues to provide a measure of protection against defaults of the issuers (i.e., to reduce risk where a Fund owns or has exposure to the referenced obligation) or to take an active long or short position with respect to the likelihood of a particular issuer’s default.
Credit default swap agreements on credit indices involve one party making a stream of payments to another party in exchange for the right to receive a specified return in the event of a write-down, principal shortfall, interest shortfall or default of all or part of the referenced entities comprising the credit index. A credit index is a basket of credit instruments or exposures designed to be representative of some part of the credit market as a whole. These indices are made up of reference credits that are judged by a poll of dealers to be the most liquid entities in the credit default swap market based on the sector of the index. Components of the indices may include, but are not limited to, investment grade securities, high yield securities, asset-backed securities, emerging markets, and/or various credit ratings within each sector. Credit indices are traded using credit default swaps with standardized terms including a fixed spread and standard maturity dates. An index credit default swap references all the names in the index, and if there is a default, the credit event is settled based on that name’s weight in the index. The composition of the indices changes periodically, usually every six months, and for most indices, each name has an equal weight in the index. A Fund may use credit default swaps on credit indices to hedge a portfolio of credit default swaps or bonds,
which is less expensive than it would be to buy many credit default swaps to achieve a similar effect. Credit default swaps on indices are instruments for protecting investors owning bonds against default, and traders use them to speculate on changes in credit quality.
Implied credit spreads, represented in absolute terms, utilized in determining the market value of credit default swap agreements on sovereign issues as of period end are disclosed in the Notes to Schedules of Investments. They serve as an indicator of the current status of the payment/performance risk and represent the likelihood or risk of default for the credit derivative. The implied credit spread of a particular referenced entity reflects the cost of buying/selling protection and may include upfront payments required to be made to enter into the agreement. Wider credit spreads represent a deterioration of the referenced entity’s credit soundness and a greater likelihood or risk of default or other credit event occurring as defined under the terms of the agreement. For credit default swap agreements on asset-backed securities and credit indices, the quoted market prices and resulting values serve as the indicator of the current status of the payment/performance risk. Increasing market values, in absolute terms when compared to the notional amount of the swap, represent a deterioration of the referenced entity’s credit soundness and a greater likelihood or risk of default or other credit event occurring as defined under the terms of the agreement.
The maximum potential amount of future payments (undiscounted) that a Fund as a seller of protection could be required to make under a credit default swap agreement would be an amount equal to the notional amount of the agreement. Notional amounts of each individual credit default swap agreement outstanding as of June 30, 2013 for which a Fund is the seller of protection are disclosed in the Notes to Schedules of Investments. These potential amounts would be partially offset by any recovery values of the respective referenced obligations, upfront payments received upon entering into the agreement, or net amounts received from the settlement of buy protection credit default swap agreements entered into by a Fund for the same referenced entity or entities.
Interest Rate Swap Agreements Certain Funds are subject to interest rate risk exposure in the normal course of pursuing their investment objectives. Because a Fund holds fixed rate bonds, the value of these bonds may decrease if interest rates rise. To help hedge against this risk and to maintain its ability to generate income at prevailing market rates, a Fund may enter into interest rate swap agreements. Interest rate swap agreements involve the exchange by a Fund with another party for their respective commitment to pay or receive interest on the notional amount of principal. Certain forms of interest rate swap agreements may include: (i) interest rate caps, under which, in return for a premium, one party agrees to make payments to the other to the
| 88 | PIMCO EQUITY SERIES |
Table of Contents
June 30, 2013
extent that interest rates exceed a specified rate, or “cap”, (ii) interest rate floors, under which, in return for a premium, one party agrees to make payments to the other to the extent that interest rates fall below a specified rate, or “floor”, (iii) interest rate collars, under which a party sells a cap and purchases a floor or vice versa in an attempt to protect itself against interest rate movements exceeding given minimum or maximum levels, (iv) callable interest rate swaps, under which the counterparty may terminate the swap transaction in whole at zero cost at a predetermined date and time prior to the maturity date, (v) spreadlocks, which allow the interest rate swap users to lock in the forward differential (or spread) between the interest rate swap rate and a specified benchmark, or (vi) basis swaps, under which two parties can exchange variable interest rates based on different money markets.
Total Return Swap Agreements Certain Funds may enter into total return swap agreements to gain or mitigate exposure of the underlying reference. Total return swap agreements involve commitments where single or multiple cash flows are exchanged based on the price of an underlying reference and based on a fixed or variable rate. Total return swap agreements may involve commitments to pay interest in exchange for a market-linked return. One counterparty pays out the total return of a specific reference asset, which may include an underlying equity, index, or bond, and in return receives a fixed or variable rate. At the maturity date, a net cash flow is exchanged where the total return is equivalent to the return of the underlying reference less a financing rate, if any. As a receiver, a Fund would receive payments based on any positive total return and would owe payments in the event of a negative total return. As the payer, a Fund would owe payments on any net positive total return, and would receive payment in the event of a negative total return.
7. PRINCIPAL RISKS
In the normal course of business the Funds (or Underlying PIMCO Funds and/or Acquired Funds in the case of the mutual funds that pursue their investment objective by investing in other mutual funds (“PIMCO Fund of Funds”)) trade financial instruments, and enter into financial transactions where risk of potential loss exists due to changes in the market (market risk), or failure or inability of the other party to a transaction to perform (credit and counterparty risk). See below for a detailed description of select principal risks. For a list of potential risks the Funds may be subject to, please see the Important Information About the Funds.
PIMCO Fund of Funds Because the PIMCO Fund of Funds invest substantially all of their respective assets in Underlying PIMCO Funds (or Acquired Funds), the risks associated with investing in the PIMCO Fund of Funds are closely related to the risks associated with the securities and other investments held by the Underlying PIMCO Funds (or Acquired Funds). The ability of the PIMCO Fund of Funds to achieve their respective investment objectives will depend upon the ability of
the Underlying PIMCO Funds (or Acquired Funds) to achieve their respective investment objectives. There can be no assurance that the investment objective of any Underlying PIMCO Fund (or Acquired Fund) will be achieved. The net asset value of a PIMCO Fund of Funds will fluctuate in response to changes in the respective net asset values of the Underlying PIMCO Funds (or Acquired Funds) in which it invests. The extent to which the investment performance and risks associated with the PIMCO Fund of Funds correlate to those of a particular Underlying PIMCO Fund (or Acquired Fund) will depend upon the extent to which the assets of the PIMCO Fund of Funds are allocated from time to time for investment in the Underlying PIMCO Funds (or Acquired Funds), which will vary.
Investing in Underlying PIMCO Funds (or Acquired Funds) involves certain additional expenses and tax results that would not be present in a direct investment in the Underlying PIMCO Funds (or Acquired Funds).
The investment performance depends upon how its assets are allocated and reallocated according to the PIMCO Fund of Fund’s asset allocation targets and ranges. A principal risk of investing in each PIMCO Fund of Funds is that the PIMCO Fund of Fund’s asset allocation sub-adviser will make less than optimal or poor asset allocation decisions. The asset allocation sub-adviser attempts to identify investment allocations for the Underlying PIMCO Funds (or Acquired Funds) that will provide consistent, quality performance for the PIMCO Fund of Funds, but there is no guarantee that such allocation techniques will produce the desired results. It is possible that the asset allocation sub-adviser will focus on an Underlying PIMCO Fund (or Acquired Fund) that performs poorly or underperforms other Underlying PIMCO Funds (or Acquired Funds) under various market conditions.
In the normal course of business the Underlying PIMCO Funds (or Acquired Funds) trade financial instruments, and enter into financial transactions where risk of potential loss exists due to changes in the market (market risk), or failure or inability of the other party to a transaction to perform (credit and counterparty risk).
Market Risks A Fund’s (or Underlying PIMCO Fund’s and/or Acquired Fund’s in the case of the PIMCO Fund of Funds) investments in financial derivatives and other financial instruments expose the Fund to various risks such as, but not limited to, equity, interest rate, foreign currency and commodity risks.
The market values of equities, such as common stocks and preferred securities or equity related investments such as futures and options, may decline due to general market conditions which are not specifically related to a particular company, such as real or perceived adverse economic conditions, changes in the general outlook for corporate earnings, changes in interest or currency rates or adverse investor sentiment generally. They may also decline due to factors which affect
| ANNUAL REPORT | JUNE 30, 2013 | 89 |
Table of Contents
Notes to Financial Statements (Cont.)
a particular industry or industries, such as labor shortages or increased production costs and competitive conditions within an industry. Equity securities and equity related investments generally have greater market price volatility than fixed income securities.
Interest rate risk is the risk that fixed income securities will decline in value because of changes in interest rates. As nominal interest rates rise, the value of certain fixed income securities held by a Fund (or Underlying PIMCO Fund and/or Acquired Fund in the case of the PIMCO Fund of Funds) is likely to decrease. A nominal interest rate can be described as the sum of a real interest rate and an expected inflation rate. Fixed income securities with longer durations tend to be more sensitive to changes in interest rates, usually making them more volatile than securities with shorter durations. Duration is useful primarily as a measure of the sensitivity of a fixed income’s market price to interest rate (i.e. yield) movements.
If a Fund (or Underlying PIMCO Fund and/or Acquired Fund in the case of the PIMCO Fund of Funds) invests directly in foreign currencies or in securities that trade in, and receive revenues in, foreign currencies, or in financial derivatives that provide exposure to foreign currencies, it will be subject to the risk that those currencies will decline in value relative to the base currency of the Fund (or Underlying PIMCO Fund and/or Acquired Fund in the case of the PIMCO Fund of Funds), or, in the case of hedging positions, that the Fund’s (or Underlying PIMCO Fund’s and/or Acquired Fund’s in the case of the PIMCO Fund of Funds) base currency will decline in value relative to the currency being hedged. Currency rates in foreign countries may fluctuate significantly over short periods of time for a number of reasons, including changes in interest rates, intervention (or the failure to intervene) by U.S. or foreign governments, central banks or supranational entities such as the International Monetary Fund, or by the imposition of currency controls or other political developments in the United States or abroad. As a result, a Fund’s (or Underlying PIMCO Fund’s and/or Acquired Fund’s in the case of a PIMCO Fund of Funds) investments in foreign currency denominated securities may reduce the returns of the Fund (or Underlying PIMCO Fund and/or Acquired Fund in the case of the PIMCO Fund of Funds).
A Fund’s (or Underlying PIMCO Fund’s and/or Acquired Fund’s in the case of a PIMCO Fund of Funds) investments in commodity-linked financial derivative instruments may subject the Fund to greater market price volatility than investments in traditional securities. The value of commodity-linked financial derivative instruments may be affected by changes in overall market movements, commodity index volatility, changes in interest rates, or factors affecting a particular industry or commodity, such as drought, floods, weather, livestock disease, embargoes, tariffs and international economic, political and regulatory developments.
Credit and Counterparty Risks A Fund (or Underlying PIMCO Fund and/or Acquired Fund in the case of a PIMCO Fund of Funds) will be exposed to credit risk to parties with whom it trades and will also bear the risk of settlement default. A Fund (or Underlying PIMCO Fund and/or Acquired Fund in the case of a PIMCO Fund of Funds) minimizes concentrations of credit risk by undertaking transactions with a large number of customers and counterparties on recognized and reputable exchanges. A Fund (or Underlying PIMCO Fund and/or Acquired Fund in the case of a PIMCO Fund of Funds) could lose money if the issuer or guarantor of a fixed income security, or the counterparty to a financial derivatives contract, repurchase agreement or a loan of portfolio securities, is unable or unwilling to make timely principal and/or interest payments, or to otherwise honor its obligations. Securities are subject to varying degrees of credit risk, which are often reflected in credit ratings.
Similar to credit risk, a Fund (or Underlying PIMCO Fund and/or Acquired Fund in the case of a PIMCO Fund of Funds) may be exposed to counterparty risk, or the risk that an institution or other entity with which the Fund (or Underlying PIMCO Fund and/or Acquired Fund in the case of the PIMCO Fund of Funds) has unsettled or open transactions will default. Financial assets, which potentially expose a Fund to counterparty risk, consist principally of cash due from counterparties and investments. PIMCO, as the investment adviser, minimizes counterparty risks to the Funds by performing extensive reviews of each counterparty and obtaining approval from the PIMCO Counterparty Risk Committee prior to entering into transactions with a third party. Furthermore, to the extent that unpaid amounts owed to a Fund (or Underlying PIMCO Fund and/or Acquired Fund in the case of a PIMCO Fund of Funds) exceed a predetermined threshold agreed to with the counterparty, such counterparty shall advance collateral to the Fund (or Underlying PIMCO Fund and/or Acquired Fund in the case of the PIMCO Fund of Funds) in the form of cash or cash equivalents equal in value to the unpaid amount owed to the Fund (or Underlying PIMCO Fund and/or Acquired Fund in the case of the PIMCO Fund of Funds). A Fund (or Underlying PIMCO Fund and/or Acquired Fund in the case of a PIMCO Fund of Funds) may invest such collateral in securities or other instruments and will typically pay interest to the counterparty on the collateral received. If the unpaid amount owed to a Fund (or Underlying PIMCO Fund and/or Acquired Fund in the case of a PIMCO Fund of Funds) subsequently decreases, the Fund (or Underlying PIMCO Fund and/or Acquired Fund in the case of the PIMCO Fund of Funds) would be required to return to the counterparty all or a portion of the collateral previously advanced to the Fund (or Underlying PIMCO Fund and/or Acquired Fund in the case of the PIMCO Fund of Funds).
All transactions in listed securities are settled/paid for upon delivery using approved counterparties. The risk of default is considered minimal, as delivery of securities sold is only made once a Fund has
| 90 | PIMCO EQUITY SERIES |
Table of Contents
June 30, 2013
received payment. Payment is made on a purchase once the securities have been delivered by the counterparty. The trade will fail if either party fails to meet its obligation.
Master Netting Arrangements A Fund is subject to various Master Agreements, or netting arrangements, with select counterparties. Master Agreements govern the terms of certain transactions, and reduce the counterparty risk associated with relevant transactions by specifying credit protection mechanisms and providing standardization that improves legal certainty. Since different types of transactions have different mechanics and are sometimes traded out of different legal entities of a particular counterparty organization, each type of transaction may be covered by a different Master Agreement, resulting in the need for multiple agreements with a single counterparty. As the Master Agreements are specific to unique operations of different asset types, they allow a Fund to close out and net its total exposure to a counterparty in the event of a default with respect to all the transactions governed under a single agreement with a counterparty.
Master Agreements can also help limit counterparty risk by specifying collateral posting arrangements at pre-arranged exposure levels. Under the Master Agreements, collateral is routinely transferred if the total net exposure to certain transactions (net of existing collateral already in place) governed under the relevant Master Agreement with a counterparty in a given account exceeds a specified threshold, which typically ranges from zero to $250,000 depending on the counterparty and the type of Master Agreement. United States Treasury Bills and U.S. dollar cash are generally the preferred forms of collateral, although other forms of AAA rated paper or sovereign securities may be used. Securities and cash pledged as collateral are reflected as assets in the Statement of Assets and Liabilities as either a component of Investments at value (securities) or Deposits due from Counterparties (cash). Cash collateral received is not typically held in a segregated account and as such is reflected as a liability in Statement of Assets and Liabilities as Deposits due to Counterparties. The market value of any securities received as collateral are not reflected as a component of net asset value. A Fund’s overall exposure to counterparty risk can change substantially within a short period, as it is affected by each transaction subject to the relevant Master Agreement.
Master Repurchase Agreements and Global Master Repurchase Agreements (individually and collectively “Master Repo Agreements”) govern repurchase, reverse repurchase, and sale-buyback transactions between a Fund and select counterparties. Master Repo Agreements maintain provisions for, among other things, initiation, income payments, events of default, and maintenance of collateral. The market value of transactions under the Master Repo Agreement, collateral pledged or received, and the net exposure by counterparty as of period end are disclosed in the Notes to Schedule of Investments.
Master Securities Forward Transaction Agreements (“Master Forward Agreements”) govern the considerations and factors surrounding the settlement of certain forward settling transactions, such as To-Be-Announced securities, delayed-delivery or sale-buyback transactions by and between a Fund and select counterparties. The Master Forward Agreements maintain provisions for, among other things, initiation and confirmation, payment and transfer, events of default, termination, and maintenance of collateral. The market value of forward settling transactions, collateral pledged or received, and the net exposure by counterparty as of period end is disclosed in the Notes to Schedule of Investments.
Customer Account Agreements and related addendums govern cleared derivatives transactions such as futures, options on futures, and cleared OTC derivatives. Cleared derivative transactions require posting of initial margin as determined by each relevant clearing agency and is segregated at a broker account registered with the Commodities Futures Trading Commission (CFTC), or the applicable regulator. In the US, counterparty risk is significantly reduced as creditors of the futures broker do not have claim to fund assets in the segregated account. Additionally, portability of exposure in the event of default further reduces risk to the funds. Variation margin, or daily changes in market value, are exchanged daily, but may not be netted between futures and cleared OTC derivatives. The market value or accumulated unrealized appreciation or depreciation, initial margin posted, and any unsettled variation margin as of period end is disclosed in the Notes to Schedule of Investments.
Prime Broker Arrangements may be entered into to facilitate execution and/or clearing of listed equity option transactions or short sales of equity securities between a Fund and selected counterparties. The arrangements provide guidelines surrounding the rights, obligations, and other events, including, but not limited to, margin, execution, and settlement. These agreements maintain provisions for, among other things, payments, maintenance of collateral, events of default, and termination. Margin and other assets delivered as collateral are typically in the possession of the prime broker and would offset any obligations due to the prime broker. The market value of listed options and securities sold short and related collateral are disclosed in the Notes to Schedule of Investments.
International Swaps and Derivatives Association, Inc. Master Agreements and Credit Support Annexes (“ISDA Master Agreements”) govern OTC financial derivative transactions entered into by a Fund and select counterparties. ISDA Master Agreements maintain provisions for general obligations, representations, agreements, collateral and events of default or termination. Events of termination include conditions that may entitle counterparties to elect to terminate early and cause settlement of all outstanding transactions under the applicable ISDA
| ANNUAL REPORT | JUNE 30, 2013 | 91 |
Table of Contents
Notes to Financial Statements (Cont.)
Master Agreement. Any election to terminate early could be material to the financial statements. In limited circumstances, the ISDA Master Agreement may contain additional provisions that add additional counterparty protection beyond coverage of existing daily exposure if the counterparty has a decline in credit quality below a predefined
level. These amounts, if any, may be segregated with a third party custodian. The market value of OTC financial derivative instruments, collateral received or pledged and net exposure by counterparty as of period end, is disclosed in the Notes to Schedule of Investments.
8. BASIS FOR CONSOLIDATION FOR THE PIMCO EMERGING MULTI-ASSET FUND AND PIMCO EqS PATHFINDER FUND® (“Consolidated Funds”)
PIMCO Cayman Commodity Fund V and VI (each a “Commodity Subsidiary”), Cayman Islands exempted companies, were incorporated as wholly owned subsidiaries acting as investment vehicles for the Consolidated Funds in order to effect certain investments for the Consolidated Funds consistent with each Consolidated Fund’s investment objectives and policies as specified in their respective prospectus and statement of additional information. Each Consolidated Fund’s investment portfolio has been consolidated and includes the portfolio holdings of the Consolidated Fund and its respective Commodity Subsidiary. The consolidated financial statements include the accounts of the Consolidated Funds and their respective Commodity Subsidiaries. All inter-company transactions and balances have been eliminated. A subscription agreement was entered into between the Consolidated Funds and their respective Commodity Subsidiary, comprising the entire issued share capital of the Commodity Subsidiary with the intent that each Consolidated Fund will remain the sole shareholder and retain all rights. Under the Articles of Association of each Commodity Subsidiary, shares issued by each Commodity Subsidiary confer upon a shareholder the right to receive notice of, to attend and to vote at general meetings of each of the Commodity Subsidiaries and shall confer upon the shareholder rights in a winding-up or repayment of capital and the right to participate in the profits or assets of each of the Commodity Subsidiaries. See the table below for details regarding the structure, incorporation and relationship as of June 30, 2013 of each Commodity Subsidiary to its respective Consolidated Fund (amounts in thousands).
| Fund Name | Subsidiary | Date of Incorporation | Subscription Agreement | Fund Net Assets | Subsidiary Net Assets | % of Fund Net Assets | ||||||||||||||
| PIMCO Emerging Multi-Asset Fund | PIMCO Cayman Commodity Fund V Ltd. | 06/06/2011 | 07/01/2011 | $ | 63,233 | $ | 10 | 1.6 | % | |||||||||||
| PIMCO EqS Pathfinder Fund® | PIMCO Cayman Commodity Fund VI Ltd. | 06/06/2011 | 06/20/2011 | 1,867,574 | 52,597 | 2.8 | ||||||||||||||
9. FEES AND EXPENSES
(a) Investment Advisory Fee PIMCO is a majority-owned subsidiary of Allianz Asset Management of America L.P. (“Allianz Asset Management”) and serves as the Adviser to the Trust, pursuant to an investment advisory contract. The Adviser receives a monthly fee from each Fund at an annual rate based on average daily net assets (the “Investment Advisory Fee”). The Investment Advisory Fee for all classes is charged at an annual rate as noted in the table below.
(b) Supervisory and Administrative Fee PIMCO serves as administrator (the “Administrator”) and provides supervisory and administrative services to the Trust for which it receives a monthly supervisory and administrative fee based on each share class’s average daily net assets (the “Supervisory and Administrative Fee”). As the Administrator, PIMCO bears the costs of various third-party services, including audit, custodial, portfolio accounting, legal, transfer agency and printing costs.
The Investment Advisory and Supervisory and Administrative Fees for all classes are charged at an annual rate as noted in the following table:
| Investment Advisory Fee | Supervisory and Administrative Fee | |||||||||||||||||||||||||||
| Fund Name | All Classes | Institutional Class | Class P | Administrative Class | Class D | A, C and R Classes | ||||||||||||||||||||||
PIMCO Dividend and Income Builder Fund | 0.69% | 0.30% | 0.40% | N/A | 0.40% | 0.40% | ||||||||||||||||||||||
PIMCO EqS® Dividend Fund | 0.69% | 0.30% | 0.40% | N/A | 0.40% | 0.40% | ||||||||||||||||||||||
PIMCO EqS® Emerging Markets Fund | 1.00% | 0.45% | 0.55% | 0.45% | 0.55% | 0.55% | ||||||||||||||||||||||
PIMCO EqS® Long/Short Fund | 1.04% | 0.45% | 0.55% | N/A | 0.55% | 0.55% | ||||||||||||||||||||||
PIMCO Emerging Multi-Asset Fund | 0.90% | 0.45% | 0.55% | 0.45% | 0.55% | 0.55% | ||||||||||||||||||||||
PIMCO EqS Pathfinder Fund® | 0.75% | 0.30% | 0.40% | N/A | 0.40% | 0.40% | ||||||||||||||||||||||
(c) Distribution and Servicing Fees PIMCO Investments LLC (“PI”), a wholly-owned subsidiary of PIMCO, serves as the distributor (“Distributor”) of the Trust’s shares.
| 92 | PIMCO EQUITY SERIES |
Table of Contents
June 30, 2013
The Trust has adopted separate Distribution and Servicing Plans with respect to the Class A, Class C and Class R shares of the Trust pursuant to Rule 12b-1 under the Act. In connection with the distribution of Class C and Class R shares of the Trust, the Distributor receives distribution fees from the Trust of up to 0.75% for Class C shares and 0.25% for Class R shares, and in connection with personal services rendered to Class A, Class C and Class R shareholders and the maintenance of such shareholder accounts, the Distributor receives servicing fees from the Trust of up to 0.25% for each of Class A, Class C and Class R shares (percentages reflect annual rates of the average daily net assets attributable to the applicable class).
The Trust has adopted a Distribution and Servicing Plan with respect to the Class D shares of each Fund pursuant to Rule 12b-1 under the Act (the “Class D Plan”). Under the terms of the Class D Plan, a Fund is permitted to compensate the Distributor out of the assets attributable to the Class D shares of the Fund, in an amount up to 0.25% on an annual basis of the average daily net assets of the Fund’s Class D shares for providing, or procuring through financial intermediaries, distribution, shareholder services, and/or maintenance of shareholder accounts with respect to Class D shareholders of the Fund, some of which may be deemed to be primarily intended to result in the sale of Class D shares.
The Trust has adopted a Distribution and Servicing Plan with respect to the Administrative Class shares of each Fund pursuant to Rule 12b-1 under the Act (the “Administrative Class Plan”). Under the terms of the Administrative Class Plan, a Fund may compensate the Distributor for providing, or procuring through financial intermediaries, distribution, administrative, recordkeeping, shareholder and/or related services with respect to Administrative Class shares. The Administrative Class Plan permits a Fund to make total payments at an annual rate of up to 0.25% of the average daily net assets attributable to the Administrative Class shares.
The Trust paid distribution and servicing fees at effective rates as set forth in the following table (calculated as a percentage of each Fund’s average daily net assets attributable to each class):
| Distribution Fee | Servicing Fee | |||||||||
Administrative Class | — | 0.25% | ||||||||
Class D | — | 0.25% | ||||||||
Class A | — | 0.25% | ||||||||
Class C | 0.75% | 0.25% | ||||||||
Class R | 0.25% | 0.25% | ||||||||
The Distributor also received the proceeds of the initial sales charges paid by the shareholders upon the purchase of Class A shares and the contingent deferred sales charges paid by the shareholders upon
certain redemptions of Class A and Class C Class shares. For the period ended June 30, 2013, the Distributor received $217,555 representing commissions (sales charges) and contingent deferred sales charges from the Trust.
(d) Fund Expenses The Trust is responsible for the following expenses: (i) salaries and other compensation of any of the Trust’s executive officers and employees who are not officers, directors, stockholders or employees of PIMCO or its subsidiaries or affiliates; (ii) taxes and governmental fees; (iii) brokerage fees and commissions and other portfolio transaction expenses; (iv) costs of borrowing money, including interest expense; (v) fees and expenses of the Trustees who are not “interested persons” of PIMCO or the Trust, and any counsel retained exclusively for their benefit; (vi) extraordinary expense, including costs of litigation and indemnification expenses; (vii) organization expenses and (viii) any expenses allocated or allocable to a specific class of shares, which include service fees payable with respect to the Administrative Class Shares, and may include certain other expenses as permitted by the Trust’s Multiple Class Plan adopted pursuant to Rule 18f-3 under the Act and subject to review and approval by the Trustees. The ratio of expenses to average net assets per share class, as disclosed on the Financial Highlights, may differ from the annual fund operating expenses per share class as disclosed in the Prospectus for the reasons set forth above.
Each unaffiliated Trustee receives an annual retainer of $60,000, plus $4,750 for each Board of Trustees meeting attended in person, $375 ($750 in the case of the audit committee chair with respect to audit committee meetings) for each committee meeting attended and $750 for each Board of Trustees meeting attended telephonically, plus reimbursement of related expenses. In addition, the audit committee chair receives an additional annual retainer of $7,500 and each other committee chair receives an additional annual retainer of $750.
These expenses are allocated on a pro-rata basis to each Fund of the Trust according to its respective net assets. The Trust pays no compensation directly to any Trustee or any other officer who is affiliated with the Administrator, all of whom receive remuneration for their services to the Trust from the Administrator or its affiliates.
(e) Expense Limitation PIMCO has agreed to waive a portion of the Funds’ Supervisory and Administrative Fees in each Fund’s first fiscal year, to the extent that the payment of each Fund’s pro rata share of organizational expenses and Trustee Fees cause the actual expense ratio to rise above the rates disclosed in the then-current prospectus plus 0.0049% (calculated as a percentage of each Fund’s average daily net assets attributable to each class).
| ANNUAL REPORT | JUNE 30, 2013 | 93 |
Table of Contents
Notes to Financial Statements (Cont.)
PIMCO has contractually agreed to waive a portion of the Investment Advisory Fee as set forth in the following table (calculated as a percentage of each Fund’s average daily net assets).
| Fund Name | Investment Advisory Fee Waiver | Investment Advisory Waiver Expiration Date | ||||||||
PIMCO Dividend and Income Builder Fund | 0.16% | 10/31/2013 | ||||||||
PIMCO EqS® Dividend Fund | 0.16% | 10/31/2013 | ||||||||
PIMCO EqS® Emerging Markets Fund | 0.20% | 10/31/2013 | ||||||||
PIMCO EqS® Long/Short Fund | 0.09% | 10/31/2013 | ||||||||
PIMCO EqS Pathfinder Fund® | 0.16% | 10/31/2013 | ||||||||
Under the Fee Limitation Agreement, PIMCO is entitled to reimbursement by each Fund of any portion of the Supervisory and Administrative Fee and/or Investment Advisory Fee waived, reduced or reimbursed pursuant to the Fee Limitation Agreement (the “Reimbursement Amount”) during the previous three years, provided that such amount paid to PIMCO will not: 1) together with any recoupment of organizational expenses and pro rata Trustees’ fees pursuant to the Expense Limitation Agreement, exceed the Expense Limit; 2) exceed the total Reimbursement Amount; or 3) include any amounts previously reimbursed to PIMCO. The Fee Limitation Agreement will automatically renew for one-year terms unless PIMCO provides written notice to the Trust at least 30 days prior to the end of the then current term.
PIMCO may be reimbursed for these waived amounts in future periods, not to exceed thirty-six months after the waiver. Expenses that have been waived may still be reimbursed by the Administrator, to the extent the Fund’s annualized total portfolio operating expenses plus the amount reimbursed does not exceed the operating expense limitation. The recoverable amounts to PIMCO at June 30, 2013, were as follows (amounts in thousands):
| Fund Name | Recoverable Amounts | |||||
PIMCO Dividend and Income Builder Fund | $ | 143 | ||||
PIMCO EqS® Dividend Fund | 192 | |||||
PIMCO EqS® Emerging Markets Fund | 200 | |||||
PIMCO EqS® Long/Short Fund | 280 | |||||
PIMCO Emerging Multi-Asset Fund | 145 | |||||
PIMCO EqS Pathfinder Fund® | 429 | |||||
(f) Acquired Fund Fees and Expenses The Underlying PIMCO Fund expenses for the PIMCO Emerging Multi-Asset Fund are based upon an allocation of the PIMCO Emerging Multi-Asset Fund’s assets among the Underlying PIMCO Funds and upon the total annual operating expenses of the Institutional Class shares of these Underlying PIMCO Funds. Underlying PIMCO Fund expenses will vary with changes in the expenses of the Underlying PIMCO Funds, as well as allocation of the PIMCO Emerging Multi-Asset Fund’s assets.
PIMCO has contractually agreed, through October 31, 2013, to waive, first, the Investment Advisory Fee and, second, to the extent necessary, the Supervisory and Administrative Fee it receives from the PIMCO Emerging Multi-Asset Fund in an amount equal to the expenses attributable to Investment Advisory and Supervisory and Administrative Fees of Underlying PIMCO Funds indirectly incurred by the Fund in connection with the Fund’s investments in Underlying PIMCO Funds, to the extent the Investment Advisory Fee and Supervisory and Administrative Fees taken together are greater than or equal to the Investment Advisory Fees and Supervisory and Administrative Fees of the Underlying PIMCO Funds. This agreement renews annually for a full year unless terminated by PIMCO upon at least 30 days’ notice prior to the end of the contract term. The waivers are reflected in the Statements of Operations as a component of Waiver and/or
Reimbursement by PIMCO. For the period ended June 30, 2013, the amount was $596,437.
Each Commodity Subsidiary has entered into a separate contract with PIMCO for the management of each Commodity Subsidiary’s portfolio pursuant to which the Commodity Subsidiary pays PIMCO a management fee and administrative services fee at the annual rates of 0.49% and 0.20%, respectively, of its net assets. PIMCO has contractually agreed to waive the Investment Advisory Fee and Supervisory and Administrative Fees it receives from each Commodity Subsidiary in an amount equal to the management fee and administrative services fee, respectively, paid to PIMCO by each Commodity Subsidiary. This waiver may not be terminated by PIMCO and will remain in effect for as long as PIMCO’s contract with each Commodity Subsidiary is in place. The waiver is reflected in the Consolidated Statements of Operations as a component of Waiver and/or Reimbursement by PIMCO. During the period ended June 30, 2013, the Fund below waived the following fees (amounts in thousands):
| Fund Name | Waived Fees | |||||
PIMCO EqS Pathfinder Fund® | $ | 530 | ||||
PIMCO Emerging Multi-Asset Fund | 0 | * | ||||
| * | Amount is less than $500. |
| 94 | PIMCO EQUITY SERIES |
Table of Contents
June 30, 2013
10. RELATED PARTY TRANSACTIONS
The Adviser, Administrator, and Distributor are related parties. Fees payable to these parties are disclosed in Note 9 and the accrued related party fee amounts are disclosed on the Statements of Assets and Liabilities.
Certain Funds are permitted to purchase or sell securities from or to certain related affiliated funds under specified conditions outlined in procedures adopted by the Board. The procedures have been designed to ensure that any purchase or sale of securities by the Funds from or to another fund or portfolio that are, or could be, considered an
affiliate by virtue of having a common investment adviser (or affiliated investment advisers), common Trustees and/or common officers complies with Rule 17a-7 of the Act. Further, as defined under the procedures, each transaction is effected at the current market price. During the period ended June 30, 2013, the Funds below engaged in purchases and sales of securities pursuant to Rule 17a-7 of the Act (amounts in thousands):
| Fund Name | Purchases | Sales | ||||||||
PIMCO EqS® Dividend Fund | $ | 15,770 | $ | 5,917 | ||||||
PIMCO EqS Pathfinder Fund® | 499 | 14,723 | ||||||||
The PIMCO Emerging Multi-Asset Fund may invest assets in Institutional Class shares of the Underlying PIMCO Funds. The Underlying PIMCO Funds are considered to be affiliated with the PIMCO Emerging Multi-Asset Fund. The table below shows the transactions in and earnings from investments in these affiliated Funds for the period ended June 30, 2013 (amounts in thousands):
PIMCO Emerging Multi-Asset Fund
| Underlying PIMCO Funds | Market Value 06/30/2012 | Purchases at Cost | Proceeds from Sales | Net Realized Gain/(Loss) | Change in Unrealized Appreciation/ (Depreciation) | Market Value 06/30/2013 | Dividend Income | Net Capital Gain Distributions | ||||||||||||||||||||||||||
PIMCO CommoditiesPLUS® Strategy Fund | $ | 436 | $ | 0 | $ | (487 | ) | $ | (14 | ) | $ | 65 | $ | 0 | $ | 0 | $ | 0 | ||||||||||||||||
PIMCO Emerging Local Bond Fund | 12,185 | 9,069 | (2,529 | ) | (101 | ) | (1,520 | ) | 17,104 | 904 | 0 | |||||||||||||||||||||||
PIMCO Emerging Markets Bond Fund | 8,304 | 7,061 | (4,931 | ) | 375 | (785 | ) | 10,024 | 503 | 4 | ||||||||||||||||||||||||
PIMCO Emerging Markets Corporate Bond Fund | 1,472 | 3,537 | (2,634 | ) | 94 | (228 | ) | 2,241 | 102 | 5 | ||||||||||||||||||||||||
PIMCO Emerging Markets Currency Fund | 772 | 1 | (782 | ) | (14 | ) | 23 | 0 | 1 | 0 | ||||||||||||||||||||||||
PIMCO EqS® Emerging Markets Fund | 18,618 | 20,722 | (6,406 | ) | (1,186 | ) | 523 | 32,271 | 241 | 0 | ||||||||||||||||||||||||
PIMCO Short-Term Floating NAV Portfolio | 5,018 | 37,904 | (41,200 | ) | 0 | 1 | 1,723 | 4 | 0 | |||||||||||||||||||||||||
Totals | $ | 46,805 | $ | 78,294 | $ | (58,969 | ) | $ | (846 | ) | $ | (1,921 | ) | $ | 63,363 | $ | 1,755 | $ | 9 | |||||||||||||||
Each Fund may invest in the PIMCO Short-Term Floating NAV Portfolio and PIMCO Short-Term Floating NAV Portfolio III (“Central Funds”) to the extent permitted by the Act and rules thereunder. The Central Funds are registered investment companies created for use solely by the series of the Trust and series of the PIMCO Funds, PIMCO ETF Trust, PIMCO Equity Series, PIMCO Equity Series VIT, and other series of registered investment companies advised by PIMCO, in connection with their cash management activities. The main investments of the Central Funds are money market instruments and short maturity fixed income instruments. The Central Funds may incur expenses related to their investment activities, but do not pay Investment Advisory or Supervisory and Administrative Fees to PIMCO. The Central Funds are considered to be affiliated with the Funds. The table below shows the Fund’s transactions in and earnings from investments in the Central Funds for the period ended June 30, 2013 (amounts in thousands):
Investments in PIMCO Short-Term Floating NAV Portfolio
| Fund Name | Market Value 06/30/2012 | Purchases at Cost | Proceeds from Sales | Net Realized Gain/(Loss) | Change in Unrealized Appreciation/ (Depreciation) | Market Value 06/30/2013 | Dividend Income | Net Capital Gain Distributions | ||||||||||||||||||||||||||
PIMCO Dividend and Income Builder Fund | $ | 1,411 | $ | 205,029 | $ | (177,700 | ) | $ | (8 | ) | $ | 2 | $ | 28,734 | $ | 29 | $ | 0 | ||||||||||||||||
PIMCO EqS® Dividend Fund | 14,024 | 373,654 | (368,100 | ) | (5 | ) | 1 | 19,574 | 54 | 1 | ||||||||||||||||||||||||
PIMCO EqS® Emerging Markets Fund | 52,486 | 306,213 | (348,750 | ) | (51 | ) | 5 | 9,903 | 210 | 3 | ||||||||||||||||||||||||
PIMCO EqS® Long/Short Fund | 61,718 | 708,895 | (633,800 | ) | (119 | ) | 8 | 136,702 | 288 | 7 | ||||||||||||||||||||||||
PIMCO EqS Pathfinder Fund® | 129,357 | 775,828 | (852,500 | ) | (196 | ) | 9 | 52,498 | 614 | 13 | ||||||||||||||||||||||||
11. GUARANTEES AND INDEMNIFICATIONS
Under the Trust’s organizational documents, each Trustee or officer of the Trust is indemnified and each employee or other agent of the Trust (including the Trust’s investment manager) may be indemnified, to the extent permitted by the Act, against certain liabilities that may arise out of
| ANNUAL REPORT | JUNE 30, 2013 | 95 |
Table of Contents
Notes to Financial Statements (Cont.)
performance of their duties to the Funds. Additionally, in the normal course of business, the Funds enter into contracts that contain a variety of indemnification clauses. The Funds’ maximum exposure under these arrangements is unknown as this would involve future claims that may be made against the Funds that have not yet occurred. However, the Funds have not had prior claims or losses pursuant to these contracts.
12. PURCHASES AND SALES OF SECURITIES
The length of time a Fund has held a particular security is not generally a consideration in investment decisions. A change in the securities held by a Fund is known as “portfolio turnover.” Each Fund may engage in frequent and active trading of portfolio securities to achieve its investment objective, particularly during periods of volatile market movements. High portfolio turnover (e.g., over 100%) involves correspondingly greater expenses to a Fund, including brokerage commissions or dealer mark-ups and other transaction costs on the sale of securities and reinvestments in other securities. Such sales may also result in realization of taxable capital gains, including short-term capital gains (which are generally taxed at ordinary income tax rates). The trading costs and tax effects associated with portfolio turnover may adversely affect a Fund’s performance. The portfolio turnover rates are reported in the Financial Highlights.
Purchases and sales of securities (excluding short-term investments) for the period ended June 30, 2013, were as follows (amounts in thousands):
U.S. Government/Agency | All Other | |||||||||||||||||
| Fund Name | Purchases | Sales | Purchases | Sales | ||||||||||||||
PIMCO Dividend and Income Builder Fund | $ | 2,628 | $ | 1,642 | $ | 429,592 | $ | 119,583 | ||||||||||
PIMCO EqS® Dividend Fund | 0 | 0 | 748,951 | 518,665 | ||||||||||||||
PIMCO EqS® Emerging Markets Fund | 859 | 855 | 440,634 | 430,440 | ||||||||||||||
PIMCO EqS® Long/Short Fund | 0 | 0 | 2,097,858 | 2,046,990 | ||||||||||||||
PIMCO Emerging Multi-Asset Fund | 0 | 0 | 49,386 | 30,307 | ||||||||||||||
PIMCO EqS Pathfinder Fund® | 0 | 0 | 569,550 | 950,947 | ||||||||||||||
13. SHARES OF BENEFICIAL INTEREST
The Trust may issue an unlimited number of shares of beneficial interest with a $0.0001 par value. Changes in shares of beneficial interest were as follows (shares and amounts in thousands):
| PIMCO Dividend and Income Builder Fund | PIMCO EqS® Dividend Fund (1) | PIMCO EqS® Emerging Markets Fund (2) | ||||||||||||||||||||||||||||||||||||||||||||||||
| Year Ended 06/30/2013 | Period from 12/14/2011 to 06/30/2012 | Year Ended 06/30/2013 | Period from 12/14/2011 to 06/30/2012 | Year Ended 06/30/2013 | Year Ended 06/30/2012 | |||||||||||||||||||||||||||||||||||||||||||||
| Shares | Amount | Shares | Amount | Shares | Amount | Shares | Amount | Shares | Amount | Shares | Amount | |||||||||||||||||||||||||||||||||||||||
Receipts for shares sold | ||||||||||||||||||||||||||||||||||||||||||||||||||
Institutional Class | 6,368 | $ | 72,769 | 1,288 | $ | 13,265 | 33,254 | $ | 387,790 | 30,124 | $ | 313,756 | 7,691 | $ | 66,152 | 31,969 | $ | 273,119 | ||||||||||||||||||||||||||||||||
Class P | 7,038 | 81,313 | 797 | 8,349 | 179 | 2,067 | 7 | 69 | 943 | 8,577 | 37 | 339 | ||||||||||||||||||||||||||||||||||||||
Administrative Class | 0 | 0 | 0 | 0 | 0 | 0 | 0 | 0 | 2 | 13 | 57 | 490 | ||||||||||||||||||||||||||||||||||||||
Class D | 2,941 | 33,217 | 282 | 2,951 | 689 | 7,851 | 134 | 1,379 | 814 | 7,357 | 910 | 7,718 | ||||||||||||||||||||||||||||||||||||||
Class A | 9,803 | 113,906 | 1,364 | 14,394 | 2,489 | 29,225 | 274 | 2,901 | 413 | 3,589 | 441 | 3,828 | ||||||||||||||||||||||||||||||||||||||
Class C | 7,557 | 87,841 | 789 | 8,296 | 1,538 | 18,044 | 137 | 1,461 | 119 | 1,036 | 97 | 825 | ||||||||||||||||||||||||||||||||||||||
Class R | 2 | 23 | 40 | 422 | 8 | 90 | 1 | 10 | 0 | 0 | 2 | 17 | ||||||||||||||||||||||||||||||||||||||
Issued as reinvestment of distributions | ||||||||||||||||||||||||||||||||||||||||||||||||||
Institutional Class | 131 | 1,511 | 24 | 250 | 1,442 | 16,798 | 334 | 3,511 | 668 | 5,839 | 201 | 1,606 | ||||||||||||||||||||||||||||||||||||||
Class P | 63 | 728 | 6 | 67 | 3 | 32 | 0 | 1 | 0 | 2 | 0 | 0 | ||||||||||||||||||||||||||||||||||||||
Administrative Class | 0 | 0 | 0 | 0 | 0 | 0 | 0 | 0 | 0 | 0 | 0 | 0 | ||||||||||||||||||||||||||||||||||||||
Class D | 54 | 626 | 3 | 32 | 14 | 158 | 1 | 9 | 1 | 10 | 3 | 22 | ||||||||||||||||||||||||||||||||||||||
Class A | 129 | 1,493 | 12 | 122 | 31 | 365 | 3 | 29 | 4 | 32 | 0 | 2 | ||||||||||||||||||||||||||||||||||||||
Class C | 49 | 571 | 4 | 39 | 14 | 164 | 1 | 13 | 1 | 6 | 0 | 0 | ||||||||||||||||||||||||||||||||||||||
Class R | 1 | 8 | 1 | 7 | 0 | 1 | 0 | 0 | 0 | 0 | 0 | 0 | ||||||||||||||||||||||||||||||||||||||
| 96 | PIMCO EQUITY SERIES |
Table of Contents
June 30, 2013
| PIMCO Dividend and Income Builder Fund | PIMCO EqS® Dividend Fund (1) | PIMCO EqS® Emerging Markets Fund (2) | ||||||||||||||||||||||||||||||||||||||||||||||||
| Year Ended 06/30/2013 | Period from 12/14/2011 to 06/30/2012 | Year Ended 06/30/2013 | Period from 12/14/2011 to 06/30/2012 | Year Ended 06/30/2013 | Year Ended 06/30/2012 | |||||||||||||||||||||||||||||||||||||||||||||
| Shares | Amount | Shares | Amount | Shares | Amount | Shares | Amount | Shares | Amount | Shares | Amount | |||||||||||||||||||||||||||||||||||||||
Cost of shares redeemed | ||||||||||||||||||||||||||||||||||||||||||||||||||
Institutional Class | (1,602 | ) | $ | (18,277 | ) | (245 | ) | $ | (2,519 | ) | (16,018 | ) | $ | (191,791 | ) | (323 | ) | $ | (3,420 | ) | (12,854 | ) | $ | (112,211 | ) | (2,236 | ) | $ | (18,635 | ) | ||||||||||||||||||||
Class P | (504 | ) | (5,836 | ) | (20 | ) | (206 | ) | (68 | ) | (799 | ) | 0 | 0 | (27 | ) | (241 | ) | (33 | ) | (299 | ) | ||||||||||||||||||||||||||||
Administrative Class | 0 | 0 | 0 | 0 | 0 | 0 | 0 | 0 | (1 | ) | (6 | ) | (54 | ) | (449 | ) | ||||||||||||||||||||||||||||||||||
Class D | (1,216 | ) | (14,121 | ) | (65 | ) | (660 | ) | (165 | ) | (1,857 | ) | (16 | ) | (161 | ) | (806 | ) | (7,300 | ) | (894 | ) | (7,553 | ) | ||||||||||||||||||||||||||
Class A | (1,074 | ) | (12,458 | ) | (104 | ) | (1,062 | ) | (426 | ) | (5,015 | ) | (36 | ) | (361 | ) | (201 | ) | (1,683 | ) | (205 | ) | (1,695 | ) | ||||||||||||||||||||||||||
Class C | (873 | ) | (9,963 | ) | (28 | ) | (289 | ) | (479 | ) | (5,645 | ) | (16 | ) | (166 | ) | (37 | ) | (310 | ) | (21 | ) | (178 | ) | ||||||||||||||||||||||||||
Class R | (24 | ) | (264 | ) | (1 | ) | (8 | ) | 0 | 0 | 0 | 0 | 0 | 0 | (3 | ) | (24 | ) | ||||||||||||||||||||||||||||||||
Net increase (decrease) resulting from Fund share transactions | 28,843 | $ | 333,087 | 4,147 | $ | 43,450 | 22,505 | $ | 257,478 | 30,625 | $ | 319,031 | (3,270 | ) | $ | (29,138 | ) | 30,271 | $ | 259,133 | ||||||||||||||||||||||||||||||
| PIMCO EqS® Long/Short Fund (3) | PIMCO Emerging Multi-Asset Fund | PIMCO EqS Pathfinder Fund® (4) | ||||||||||||||||||||||||||||||||||||||||||||||||
| Year Ended 06/30/2013 | Period from 04/20/2012 to 06/30/2012 | Year Ended 06/30/2013 | Year Ended 06/30/2012 | Year Ended 06/30/2013 | Year Ended 06/30/2012 | |||||||||||||||||||||||||||||||||||||||||||||
| Shares | Amount | Shares | Amount | Shares | Amount | Shares | Amount | Shares | Amount | Shares | Amount | |||||||||||||||||||||||||||||||||||||||
Receipts for shares sold | ||||||||||||||||||||||||||||||||||||||||||||||||||
Institutional Class | 9,876 | $ | 99,250 | 20,316 | $ | 199,848 | 2,839 | $ | 26,656 | 3,596 | $ | 33,084 | 7,010 | $ | 73,964 | 73,170 | $ | 721,005 | ||||||||||||||||||||||||||||||||
Class P | 1,663 | 17,754 | 1 | 10 | 201 | 1,874 | 1,417 | 12,404 | 2,524 | 26,912 | 10,980 | 106,032 | ||||||||||||||||||||||||||||||||||||||
Administrative Class | 0 | 0 | 0 | 0 | 245 | 2,296 | 3 | 25 | 0 | 0 | 0 | 0 | ||||||||||||||||||||||||||||||||||||||
Class D | 1,219 | 13,332 | 12 | 117 | 579 | 5,376 | 618 | 5,586 | 1,048 | 11,044 | 932 | 9,477 | ||||||||||||||||||||||||||||||||||||||
Class A | 2,511 | 27,131 | 126 | 1,227 | 657 | 6,039 | 1,205 | 10,932 | 1,519 | 16,076 | 3,516 | 35,477 | ||||||||||||||||||||||||||||||||||||||
Class C | 917 | 9,771 | 5 | 53 | 332 | 3,041 | 412 | 3,692 | 601 | 6,376 | 1,284 | 12,707 | ||||||||||||||||||||||||||||||||||||||
Class R | 0 | 0 | 0 | 0 | 5 | 43 | 0 | 0 | 0 | 3 | 2 | 23 | ||||||||||||||||||||||||||||||||||||||
Issued as reinvestment of distributions | ||||||||||||||||||||||||||||||||||||||||||||||||||
Institutional Class | 110 | 1,029 | 0 | 0 | 82 | 758 | 12 | 102 | 5,607 | 57,868 | 1,955 | 18,970 | ||||||||||||||||||||||||||||||||||||||
Class P | 1 | 9 | 0 | 0 | 5 | 47 | 6 | 56 | 127 | 1,307 | 69 | 672 | ||||||||||||||||||||||||||||||||||||||
Administrative Class | 0 | 0 | 0 | 0 | 0 | 2 | 0 | 0 | 0 | 0 | 0 | 0 | ||||||||||||||||||||||||||||||||||||||
Class D | 0 | 2 | 0 | 0 | 9 | 84 | 1 | 8 | 62 | 631 | 16 | 157 | ||||||||||||||||||||||||||||||||||||||
Class A | 2 | 15 | 0 | 0 | 35 | 325 | 3 | 26 | 143 | 1,472 | 57 | 556 | ||||||||||||||||||||||||||||||||||||||
Class C | 0 | 2 | 0 | 0 | 11 | 101 | 0 | 4 | 81 | 820 | 20 | 195 | ||||||||||||||||||||||||||||||||||||||
Class R | 0 | 0 | 0 | 0 | 0 | 1 | 0 | 0 | 0 | 0 | 0 | 1 | ||||||||||||||||||||||||||||||||||||||
Issued in reorganization | ||||||||||||||||||||||||||||||||||||||||||||||||||
Institutional Class | 0 | 0 | 1,570 | 15,696 | 0 | 0 | 0 | 0 | 0 | 0 | 0 | 0 | ||||||||||||||||||||||||||||||||||||||
Cost of shares redeemed | ||||||||||||||||||||||||||||||||||||||||||||||||||
Institutional Class | (2,145 | ) | (21,301 | ) | (15 | ) | (143 | ) | (2,169 | ) | (19,712 | ) | (1,151 | ) | (10,433 | ) | (47,263 | ) | (503,207 | ) | (9,772 | ) | (97,233 | ) | ||||||||||||||||||||||||||
Class P | (251 | ) | (2,460 | ) | 0 | 0 | (205 | ) | (1,899 | ) | (1,198 | ) | (10,854 | ) | (3,603 | ) | (37,955 | ) | (8,614 | ) | (84,122 | ) | ||||||||||||||||||||||||||||
Administrative Class | 0 | 0 | 0 | 0 | (8 | ) | (77 | ) | (1 | ) | (5 | ) | 0 | 0 | 0 | 0 | ||||||||||||||||||||||||||||||||||
Class D | (107 | ) | (1,098 | ) | (1 | ) | (6 | ) | (492 | ) | (4,437 | ) | (332 | ) | (2,910 | ) | (1,296 | ) | (13,691 | ) | (1,406 | ) | (13,801 | ) | ||||||||||||||||||||||||||
Class A | (398 | ) | (4,244 | ) | 0 | 0 | (418 | ) | (3,811 | ) | (221 | ) | (1,971 | ) | (3,052 | ) | (32,290 | ) | (5,057 | ) | (49,897 | ) | ||||||||||||||||||||||||||||
Class C | (54 | ) | (588 | ) | 0 | 0 | (188 | ) | (1,702 | ) | (30 | ) | (280 | ) | (2,031 | ) | (21,199 | ) | (1,385 | ) | (13,532 | ) | ||||||||||||||||||||||||||||
Class R | 0 | 0 | 0 | 0 | (2 | ) | (20 | ) | 0 | 0 | 0 | 0 | (11 | ) | (112 | ) | ||||||||||||||||||||||||||||||||||
Net increase (decrease) resulting from Fund share transactions | 13,344 | $ | 138,604 | 22,014 | $ | 216,802 | 1,518 | $ | 14,985 | 4,340 | $ | 39,466 | (38,523 | ) | $ | (411,869 | ) | 65,756 | $ | 646,575 | ||||||||||||||||||||||||||||||
| (1) | As of June 30, 2013, two shareholders each owned 10% or more of the total Fund’s outstanding shares comprising 58% of the Fund, and each of the two shareholders are related parties of the Fund.* |
| (2) | As of June 30, 2013, three shareholders each owned 10% or more of the total Fund’s outstanding shares comprising 70% of the Fund, and each of the three shareholders are related parties of the Fund.* |
| (3) | As of June 30, 2013, two shareholders each owned 10% or more of the total Fund’s outstanding shares comprising 71% of the Fund, and each of the two shareholders are related parties of the Fund.* |
| (4) | As of June 30, 2013, three shareholders each owned 10% or more of the total Fund’s outstanding shares comprising 75% of the Fund, and each of the three shareholders are related parties of the Fund.* |
| * | Related parties may include, but are not limited to the investment manager and its affiliates, affiliated broker dealers, fund of funds and directors of employees of the Trust or Adviser. |
| ANNUAL REPORT | JUNE 30, 2013 | 97 |
Table of Contents
Notes to Financial Statements (Cont.)
14. REGULATORY AND LITIGATION MATTERS
The Trust is not engaged in any material litigation or arbitration proceedings and is not aware of any material litigation or claim pending or threatened by or against it.
15. FEDERAL INCOME TAX MATTERS
Each Fund intends to qualify as a regulated investment company under Subchapter M of the Internal Revenue Code (the “Code”) and distribute all of its taxable income and net realized gains, if applicable, to shareholders. Accordingly, no provision for Federal income taxes has been made.
In accordance with provisions set forth under U.S. GAAP, the Adviser has reviewed the Funds’ tax positions for all open tax years. As of June 30, 2013, the Funds have recorded no liability for net unrecognized tax benefits relating to uncertain income tax positions they have taken or expect to take in future tax returns.
The Funds file U.S. tax returns. While the statute of limitations remains open to examine the Funds’ U.S. tax returns filed for the fiscal years ending in 2010-2012, no examinations are in progress or anticipated at this time. The Funds are not aware of any tax positions for which it is reasonably possible that the total amounts of unrecognized tax benefits will significantly change in the next twelve months.
The Consolidated Funds may gain exposure to the commodities markets primarily through index-linked notes, and may invest in other commodity-linked derivative investments, including commodity swap agreements, options, futures contracts, options on futures contracts and foreign funds investing in similar commodity-linked derivatives.
One of the requirements for favorable tax treatment as a regulated investment company under the Code is that a Fund must derive at least
90% of its gross income from certain qualifying sources of income. The IRS has issued a revenue ruling which holds that income derived from commodity index-linked swaps is not qualifying income under Subchapter M of the Code. The IRS has also issued private letter rulings in which the IRS specifically concluded that income from certain commodity index-linked notes is qualifying income. The IRS has also issued private rulings in which the IRS specifically concluded that income derived from investment in a subsidiary, which invests primarily in commodity-linked swaps, will also be qualifying income. Based on the reasoning in such rulings, each Fund will continue to seek to gain exposure to the commodity markets primarily through investments in commodity-linked notes and through any investments in its Subsidiary.
It should be noted, however, that the IRS currently has suspended the issuance of such rulings pending further review. There can be no assurance that the IRS will not change its position that income derived from commodity-linked notes and wholly-owned subsidiaries is qualifying income. Furthermore, the tax treatment of commodity-linked notes, other commodity-linked derivatives, and a Fund’s investments in its Subsidiary may otherwise be adversely affected by future legislation, Treasury Regulations and/or guidance issued by the IRS. Such developments could affect the character, timing and/or amount of the Fund’s taxable income or any distributions made by the Fund or result in the inability of the Fund to operate as described in its Prospectus.
If, during a taxable year, the Commodity Subsidiary’s taxable losses (and other deductible items) exceed its income and gains, the net loss will not pass through to the Fund as a deductible amount for income tax purposes. In the event the Commodity Subsidiary’s taxable gains exceed its losses and other deductible items during a taxable year, the net gain will pass through to the Fund as income for Federal income tax purposes.
As of June 30, 2013, the components of distributable taxable earnings are as follows (amounts in thousands):
| Undistributed Ordinary Income | Undistributed Long-Term Capital Gains | Net Tax Basis Unrealized Appreciation/ (Depreciation) (1) | Other Book-to-Tax Accounting Differences (2) | Accumulated Capital Losses (3) | Qualified Post-October Loss Deferral Capital (4) | Qualified Late-Year Loss Deferral Ordinary (5) | ||||||||||||||||||||||||
PIMCO Dividend and Income Builder Fund | $ | 2,223 | $ | — | $ | 6,470 | $ | (833 | ) | $ | (1,590 | ) | $ | — | $ | — | ||||||||||||||
PIMCO EqS® Dividend Fund | 6,108 | 17,214 | 30,667 | (86 | ) | — | — | — | ||||||||||||||||||||||
PIMCO EqS® Emerging Markets Fund | — | — | (23,983 | ) | — | (37,460 | ) | — | (5,188 | ) | ||||||||||||||||||||
PIMCO EqS® Long/Short Fund | 8,882 | 8,581 | 18,653 | — | — | — | — | |||||||||||||||||||||||
PIMCO Emerging Multi-Asset Fund | 305 | — | (5,587 | ) | — | (1,153 | ) | — | — | |||||||||||||||||||||
PIMCO EqS Pathfinder Fund® | 15,299 | — | 171,603 | (87 | ) | (2,030 | ) | — | — | |||||||||||||||||||||
| (1) | Adjusted for open wash sale loss deferrals and accelerated recognition of unrealized gain on certain futures, options and forward contracts for federal income tax purposes. Also adjusted for differences between book and tax realized and unrealized gain/loss on swap contracts. |
| (2) | Represents differences in income tax regulations and financial accounting principles generally accepted in the United States of America, mainly for straddle loss deferrals. |
| (3) | Capital losses available to offset future net capital gains expire in varying amounts in the years shown below. |
| (4) | Capital losses realized during the period November 1, 2012 through June 30, 2013, which the Fund elected to defer to the following taxable year pursuant to income tax regulations. |
| (5) | Specified losses realized during the period November 1, 2012 through June 30, 2013 and Ordinary losses realized during the period January 1, 2013 through June 30, 2013, which the Fund elected to defer to the following taxable year pursuant to income tax regulations. |
| 98 | PIMCO EQUITY SERIES |
Table of Contents
June 30, 2013
Under the recently enacted Regulated Investment Company Modernization Act of 2010, a fund is permitted to carry forward any new capital losses for an unlimited period. Additionally, such capital losses that are carried forward will retain their character as either short-term or long-term capital losses rather than being considered all short-term under previous law. The Fund will resume capital gain distributions in the future to the extent gains are realized in excess of accumulated capital losses. As of June 30, 2013, the Fund had the following post-effective capital losses (amounts in thousands) with no expiration:
| Short-Term | Long-Term | |||||||||
PIMCO Dividend and Income Builder Fund | $ | 1,590 | $ | — | ||||||
PIMCO EqS® Dividend Fund | — | — | ||||||||
PIMCO EqS® Emerging Markets Fund | 36,977 | 484 | ||||||||
PIMCO EqS® Long/Short Fund | — | — | ||||||||
PIMCO Emerging Multi-Asset Fund | 570 | 583 | ||||||||
PIMCO EqS Pathfinder Fund® | 2,030 | — | ||||||||
The components of net assets of PIMCO EqS® Emerging Markets Fund as of June 30, 2012 which were disclosed on the Statement of Assets and Liabilities have been adjusted for a classification error related to accounting for losses from swap investments. As of June 30, 2012 (following amounts in thousands) paid in capital of $627,079 was adjusted to $606,589, undistributed (overdistributed) net investment income of $214 was adjusted to ($905), and accumulated undistributed net realized gain (loss) was adjusted from ($62,047) to ($40,438). These adjustments did not impact net assets as previously reported at June 30, 2012. Additionally, in the Federal Income Tax Matters note to the June 30, 2012 financial statements post-effective, short-term capital losses with no expiration was adjusted from $56,079 to $34,490. The aforementioned adjustments were not considered material to the June 30, 2012 financial statements of PIMCO EqS® Emerging Markets Fund.
As of June 30, 2013, the aggregate cost and the net unrealized appreciation/(depreciation) of investments for federal income tax purposes are as follows (amounts in thousands):
| Federal Tax Cost | Unrealized Appreciation | Unrealized (Depreciation) | Net Unrealized Appreciation/ (Depreciation) (6) | |||||||||||||||
PIMCO Dividend and Income Builder Fund | $ | 383,412 | $ | 15,223 | $ | (8,722 | ) | $ | 6,501 | |||||||||
PIMCO EqS® Dividend Fund | 580,851 | 41,495 | (10,745 | ) | 30,750 | |||||||||||||
PIMCO EqS® Emerging Markets Fund | 534,125 | 35,806 | (59,702 | ) | (23,896 | ) | ||||||||||||
PIMCO EqS® Long/Short Fund | 408,214 | 15,133 | (2,863 | ) | 12,270 | |||||||||||||
PIMCO Emerging Multi-Asset Fund | 70,582 | — | (5,719 | ) | (5,719 | ) | ||||||||||||
PIMCO EqS Pathfinder Fund® | 1,701,645 | 267,038 | (95,461 | ) | 171,577 | |||||||||||||
| (6) | Primary differences, if any, between book and tax net unrealized appreciation/(depreciation) on investments are attributable to open wash sale loss deferrals. |
For the fiscal years ended June 30, 2013 and June 30, 2012, respectively, the Funds made the following tax basis distributions (amounts in thousands):
| June 30, 2013 | June 30, 2012 | |||||||||||||||||||||||||||
| Ordinary Income Distributions (7) | Long-Term Capital Gain Distributions | Return of Capital (8) | Ordinary Income Distributions (7) | Long-Term Capital Gain Distributions | Return of Capital (8) | |||||||||||||||||||||||
PIMCO Dividend and Income Builder Fund | $ | 6,330 | $ | 62 | $ | — | $ | 603 | $ | — | $ | — | ||||||||||||||||
PIMCO EqS® Dividend Fund | 17,225 | 410 | — | 3,578 | — | — | ||||||||||||||||||||||
PIMCO EqS® Emerging Markets Fund | 5,890 | — | — | 1,628 | 2 | — | ||||||||||||||||||||||
PIMCO EqS® Long/Short Fund | 1,057 | — | — | — | — | — | ||||||||||||||||||||||
PIMCO Emerging Multi-Asset Fund | 1,339 | — | — | 200 | — | — | ||||||||||||||||||||||
PIMCO EqS Pathfinder Fund® | 62,835 | — | — | 14,462 | 6,616 | — | ||||||||||||||||||||||
| (7) | Includes short-term capital gains, if any, distributed. |
| (8) | A portion of the distributions made represents a tax return of capital. Return of capital distributions have been reclassified from undistributed net investment income to paid-in capital to more appropriately conform financial accounting to tax accounting. |
| ANNUAL REPORT | JUNE 30, 2013 | 99 |
Table of Contents
Report of Independent Registered Public Accounting Firm
To the Board of Trustees and Shareholders of PIMCO Equity Series®:
In our opinion, the accompanying statements of assets and liabilities, including the schedules of investments, and the related statements of operations, of changes in net assets and of cash flows and the financial highlights present fairly, in all material respects, the financial position of PIMCO Dividend and Income Builder Fund, PIMCO EqS® Dividend Fund, PIMCO EqS® Emerging Markets Fund, PIMCO EqS® Long/Short Fund, PIMCO Emerging Multi-Asset Fund and PIMCO EqS Pathfinder Fund® (constituting PIMCO Equity Series®, hereinafter referred to as the “Funds”) at June 30, 2013, the results of each of their operations and the changes in each of their net assets, the cash flows for PIMCO EqS® Long/Short Fund and the financial highlights of the Funds for each of the periods presented, in conformity with accounting principles generally accepted in the United States of America. These financial statements (consolidated financial statements for PIMCO Emerging Multi-Asset Fund and PIMCO EqS Pathfinder Fund®) and financial highlights (hereafter referred to as “financial statements”) are the responsibility of the Funds’ management; our responsibility is to express an opinion on these financial statements based on our audits. We conducted our audits of these financial statements in accordance with the standards of the Public Company Accounting Oversight Board (United States). Those standards require that we plan and perform the audits to obtain reasonable assurance about whether the financial statements are free of material misstatement. An audit includes examining, on a test basis, evidence supporting the amounts and disclosures in the financial statements, assessing the accounting principles used and significant estimates made by management, and evaluating the overall financial statement presentation. We believe that our audits, which included confirmation of securities at June 30, 2013 by correspondence with the custodian and brokers, provide a reasonable basis for our opinion.
PricewaterhouseCoopers LLP
Kansas City, Missouri
August 16, 2013
| 100 | PIMCO EQUITY SERIES |
Table of Contents
Federal Income Tax Information
(Unaudited)
As required by the Internal Revenue Code (“Code”) and Treasury Regulations, if applicable, shareholders must be notified within 60 days of the Fund‘s fiscal year end regarding the status of qualified dividend income, the dividend received deduction, foreign source income earned by the fund, and any. foreign tax credits being passed through to shareholders.
Qualified Dividend Income. Under the Jobs and Growth Tax Relief Reconciliation Act of 2003 (the “Act”), the following percentages of ordinary dividends paid during the fiscal year ended June 30, 2013 are designated as ”qualified dividend income”, as defined in the Act, subject to reduced tax rates.
PIMCO Dividend and Income Builder Fund | 100.00% | |||||
PIMCO EqS® Dividend Fund | 100.00% | |||||
PIMCO EqS® Emerging Markets Fund | 100.00% | |||||
PIMCO EqS® Long/Short Fund | 100.00% | |||||
PIMCO Emerging Multi-Asset Fund | 13.61% | |||||
PIMCO EqS Pathfinder Fund® | 73.64% |
Dividend Received Deduction. Corporate shareholders are generally entitled to take the dividend received deduction on the portion of a Fund‘s dividend distribution that qualifies under tax law. The percentage of each Fund‘s fiscal 2013 ordinary income dividends that qualifies for the corporate dividend received deduction is set forth below.
PIMCO Dividend and Income Builder Fund | 24.40% | |||||
PIMCO EqS® Dividend Fund | 32.12% | |||||
PIMCO EqS® Emerging Markets Fund | 0.00% | |||||
PIMCO EqS® Long/Short Fund | 100.00% | |||||
PIMCO Emerging Multi-Asset Fund | 0.00% | |||||
PIMCO EqS Pathfinder Fund® | 28.55% |
Qualified Interest Income and Qualified Short-Term Capital Gain (for non-U.S. resident shareholders only). Under the American Jobs Creation Act of 2004, the following amounts of ordinary dividends paid during the fiscal year ended June 30, 2013 are considered to be derived from “qualified interest income,” as defined in Section 871(k)(1)(E) of the Code, and therefore are designated as interest-related dividends, as defined in Section 871(k)(1)(C) of the Code. Further, the following amounts of ordinary dividends paid during the fiscal year ended June 30, 2013 are considered to be derived from “qualified short-term capital gain,” as defined in Section 871(k)(2)(D) of the Code, and therefore are designated as qualified short-term gain dividends, as defined by Section 871(k)(2)(C) of the Code.
| Qualified Interest Income (000s) | Qualfied Short Term Capital Gain (000s) | |||||||||
PIMCO Dividend and Income Builder Fund | $ | 734 | $ | — | ||||||
PIMCO EqS® Dividend Fund | — | — | ||||||||
PIMCO EqS® Emerging Markets Fund | — | — | ||||||||
PIMCO EqS® Long/Short Fund | 38 | — | ||||||||
PIMCO Emerging Multi-Asset Fund | — | — | ||||||||
PIMCO EqS Pathfinder Fund® | — | — | ||||||||
Foreign Taxes. PIMCO EqS® Emerging Markets Fund, PIMCO EqS Pathfinder Fund® PIMCO EqS® Dividend Fund and PIMCO EqS® Dividend and Income Builder Fund earned foreign source income of $16,177,723, $50,641,099, $18,099,761, and $6,350,653 respectively, during the year ended June 30, 2013. The funds have made an election under Internal Revenue Code Section 853 to pass through foreign taxes paid in the amount of $949,751, $2,751,487, $1,322,016, and $505,137 respectively, to shareholders. Shareholders will receive more detailed information along with their Form 1099-DIV.
Shareholders are advised to consult their own tax advisor with respect to the tax consequences of their investment in the Trust. In January 2014, you will be advised on IRS Form 1099-DIV as to the federal tax status of the dividends and distributions received by you in calendar year 2013.
| ANNUAL REPORT | JUNE 30, 2013 | 101 |
Table of Contents
Glossary: (abbreviations that may be used in the preceding statements)
(Unaudited)
| Counterparty Abbreviations: | ||||||||||
| BOA | Bank of America N.A. | GLM | Goldman Sachs Bank USA | RYL | Royal Bank of Scotland Group PLC | |||||
| BPS | BNP Paribas S.A. | GST | Goldman Sachs International | SCX | Standard Chartered Bank | |||||
| BRC | Barclays Bank PLC | HUS | HSBC Bank USA N.A. | SOG | Societe Generale | |||||
| CBK | Citibank N.A. | JPM | JPMorgan Chase Bank N.A. | SSB | State Street Bank and Trust Co. | |||||
| DUB | Deutsche Bank AG | MSC | Morgan Stanley & Co., Inc. | UAG | UBS AG Stamford | |||||
| FBF | Credit Suisse International | RBC | Royal Bank of Canada | ULO | UBS AG London | |||||
| Currency Abbreviations: | ||||||||||
| AUD | Australian Dollar | HKD | Hong Kong Dollar | PHP | Philippine Peso | |||||
| BRL | Brazilian Real | HUF | Hungarian Forint | PLN | Polish Zloty | |||||
| CAD | Canadian Dollar | IDR | Indonesian Rupiah | RUB | Russian Ruble | |||||
| CHF | Swiss Franc | ILS | Israeli Shekel | SEK | Swedish Krona | |||||
| CLP | Chilean Peso | INR | Indian Rupee | SGD | Singapore Dollar | |||||
| CNY | Chinese Renminbi | JPY | Japanese Yen | THB | Thai Baht | |||||
| COP | Colombian Peso | KRW | South Korean Won | TRY | Turkish New Lira | |||||
| CZK | Czech Koruna | MXN | Mexican Peso | TWD | Taiwanese Dollar | |||||
| DKK | Danish Krone | MYR | Malaysian Ringgit | USD | United States Dollar | |||||
| EUR | Euro | NOK | Norwegian Krone | ZAR | South African Rand | |||||
| GBP | British Pound | PEN | Peruvian New Sol | |||||||
| Exchange Abbreviations: | ||||||||||
| CBOE | Chicago Board Options Exchange | OTC | Over-the-Counter | |||||||
| Index Abbreviations: | ||||||||||
| CDX.IG | Credit Derivatives Index - Investment Grade | |||||||||
| Other Abbreviations: | ||||||||||
| ADR | American Depositary Receipt | JSC | Joint Stock Company | REIT | Real Estate Investment Trust | |||||
| ALT | Alternate Loan Trust | LIBOR | London Interbank Offered Rate | SP - ADR | Sponsored American Depositary Receipt | |||||
| CBO | Collateralized Bond Obligation | MSCI | Morgan Stanley Capital International | SP - GDR | Sponsored Global Depositary Receipt | |||||
| GDR | Global Depositary Receipt | OIS | Overnight Index Swap | SPDR | Standard & Poor’s Depository Receipts | |||||
| 102 | PIMCO EQUITY SERIES |
Table of Contents
(Unaudited)
The chart below identifies the Trustees and Officers of the Trust. Each “interested” Trustee as defined by the 1940 Act, is indicated by an asterisk (*). Unless otherwise indicated, the address of all persons below is 840 Newport Center Drive, Newport Beach, CA 92660.
The Fund’s Statement of Additional Information includes more information about the Trustees and Officers. To request a free copy, call PIMCO at (888) 87-PIMCO or visit the Fund’s website at www.pimco.com/investments.
Trustees of the Trust
Name, Year of Birth and Position Held with Trust | Term of Office† and Length of Time Served | Principal Occupation(s) During Past 5 Years | Number of Funds in Fund Complex Overseen by Trustee | Other Directorships Held by Trustee | ||||
Interested Trustees | ||||||||
Brent R. Harris* (1959) Chairman of the Board | 03/2010 to present | Managing Director and member of Executive Committee, PIMCO. | 167 | Chairman and Trustee, PIMCO Funds, PIMCO Variable Insurance Trust, PIMCO ETF Trust, PIMCO Equity Series VIT; Director, StocksPLUS® Management, Inc.; Director, Applied Natural Gas Fuels, Inc. and member of Board of Governors, Investment Company Institute. Board Member and Owner, Harris Holdings, LLC (1992-present). | ||||
Independent Trustees | ||||||||
E. Philip Cannon (1940) Trustee | 03/2010 to present | Private Investor. Formerly, President, Houston Zoo. | 167 | Trustee, PIMCO Equity Series VIT; Trustee, PIMCO ETF Trust; Trustee, PIMCO Funds; and Trustee, PIMCO Variable Insurance Trust. | ||||
Vern O. Curtisà (1934) Trustee | 03/2010 to 06/2013 | Private Investor. | 167 | Trustee, PIMCO Equity Series VIT (2010-2013); Trustee, PIMCO ETF Trust; Trustee, PIMCO Funds; and Trustee, PIMCO Variable Insurance Trust. | ||||
Allan B. Hubbardàà (1947) Trustee | 02/2011 to 08/2013 | Chairman, E&A Holdings, Inc. (Private Holding Company). Formerly, Assistant to the President for Economic Policy and Director, National Economic Council—President George W. Bush administration. | 7 | Trustee, PIMCO Equity Series VIT (2011-2013); Independent Director, Simon Property Group | ||||
Peter B. McCarthy (1950) Trustee | 09/2011 to present | Formerly, Assistant Secretary and Chief Financial Officer, United States Department of Treasury; Deputy Managing Director, Institute of International Finance. | 7 | Trustee, PIMCO Equity Series VIT | ||||
† Trustees serve until their successors are duly elected and qualified.
* Mr. Harris is an “interested person” of the Trust (as that term is defined in the 1940 Act) because of his affiliation with PIMCO.
à Effective June 30, 2013, Mr. Curtis no longer serves as a Trustee of the Trust.
à à Effective August 14, 2013, Mr. Hubbard no longer serves as a Trustee of the Trust.
| ANNUAL REPORT | JUNE 30, 2013 | 103 |
Table of Contents
Management of the Trust (Cont.)
(Unaudited)
Executive Officers
| Name, Year of Birth and Position Held with Trust | Term of Office and Length of Time Served | Principal Occupation(s) During Past 5 Years | ||
Douglas M. Hodge (1957) President | Senior Vice President from 03/2010 to 05/22/2013, President 05/22/2013 to present | Managing Director; Chief Operating Officer (since 7/09); Member of Executive Committee and Head of PIMCO’s Asia Pacific region. Member Global Executive Committee, Allianz Asset Management. | ||
David C. Flattum (1964) Chief Legal Officer | 03/2010 to present | Managing Director and General Counsel, PIMCO. Formerly, Managing Director, Chief Operating Officer and General Counsel, Allianz Asset Management of America L.P. and Partner at Latham & Watkins LLP. | ||
Jennifer E. Durham (1970) Chief Compliance Officer | 03/2010 to present | Managing Director, PIMCO. | ||
William H. Gross (1944) Senior Vice President | 03/2010 to present | Managing Director and Co-Chief Investment Officer, PIMCO. | ||
Mohamed El-Erian (1958) Senior Vice President | 03/2010 to present | Managing Director, Co-Chief Investment Officer and Chief Executive Officer, PIMCO. Formerly, President and CEO of Harvard Management Company. Formerly, Managing Director, PIMCO. | ||
Brent R. Harris (1959) Senior Vice President | 03/2010 to present | Managing Director and member of Executive Committee, PIMCO. | ||
Kevin M. Broadwater (1964) Vice President - Senior Counsel | 05/2012 to present | Executive Vice President and Attorney, PIMCO. | ||
J. Stephen King, Jr. (1962) Vice President - Senior Counsel, Secretary | 03/2010 to present | Senior Vice President and Attorney, PIMCO. Formerly, Associate, Dechert LLP. | ||
Ryan G. Leshaw (1980) Assistant Secretary | 05/2012 to present | Vice President and Attorney, PIMCO. Formerly, Associate, Willkie Farr & Gallagher LLP. | ||
Peter G. Strelow (1970) Vice President | 03/2010 to present | Managing Director, PIMCO. | ||
Henrik P. Larsen (1970) Vice President | 03/2010 to present | Senior Vice President, PIMCO. | ||
Eric D. Johnson (1970) Vice President | 05/2011 to present | Senior Vice President, PIMCO. | ||
Greggory S. Wolf (1970) Vice President | 05/2011 to present | Senior Vice President, PIMCO. | ||
John P. Hardaway (1957) Treasurer | 03/2010 to present | Executive Vice President, PIMCO. | ||
Stacie D. Anctil (1969) Assistant Treasurer | 03/2010 to present | Senior Vice President, PIMCO. | ||
Erik C. Brown (1967) Assistant Treasurer | 03/2010 to present | Senior Vice President, PIMCO. | ||
Trent W. Walker (1974) Assistant Treasurer | 03/2010 to present | Senior Vice President, PIMCO. | ||
| 104 | PIMCO EQUITY SERIES |
Table of Contents
(Unaudited)
The Funds1,2 consider customer privacy to be a fundamental aspect of their relationships with shareholders and are committed to maintaining the confidentiality, integrity and security of their current, prospective and former shareholders’ personal information. The Funds have developed policies that are designed to protect this confidentiality, while allowing shareholder needs to be served.
Obtaining Personal Information
In the course of providing shareholders with products and services, the Funds and certain service providers to the Funds, such as the Funds’ investment adviser (“Adviser”), may obtain non-public personal information about shareholders, which may come from sources such as account applications and other forms, from other written, electronic or verbal correspondence, from shareholder transactions, from a shareholder’s brokerage or financial advisory firm, financial advisor or consultant, and/or from information captured on the Funds’ internet websites.
Respecting Your Privacy
As a matter of policy, the Funds do not disclose any personal or account information provided by shareholders or gathered by the Funds to non-affiliated third parties, except as required or permitted by law or as necessary for such third parties to perform their agreements with respect to the Funds. As is common in the industry, non-affiliated companies may from time to time be used to provide certain services, such as preparing and mailing prospectuses, reports, account statements and other information, conducting research on shareholder satisfaction and gathering shareholder proxies. The Funds’ distributor may also retain non-affiliated companies to market the Funds’ shares or products which use the Funds’ shares and enter into joint marketing arrangements with them and other companies. These companies may have access to a shareholder’s personal and account information, but are permitted to use this information solely to provide the specific service or as otherwise permitted by law. In most cases, the shareholders will be clients of a third party, but the Funds may also provide a shareholder’s personal and account information to the shareholder’s respective brokerage or financial advisory firm and/or financial advisor or consultant.
Sharing Information with Third Parties
The Funds reserve the right to disclose or report personal information to non-affiliated third parties in limited circumstances where the Funds believe in good faith that disclosure is required under law, to cooperate with regulators or law enforcement authorities, to protect their rights or property, or upon reasonable request by any investment fund managed by the Adviser in which a shareholder has invested. In addition, the Funds may disclose information about a shareholder’s accounts to a non-affiliated third party at the shareholder’s request or with the consent of the shareholder.
Sharing Information with Affiliates
The Funds may share shareholder information with their affiliates in connection with servicing shareholders’ accounts, and subject to applicable law may provide shareholders with information about products and services that the Funds or their Adviser, distributors or their affiliates (“Service Affiliates”) believe may be of interest to such shareholders. The information that the Funds may share may include, for example, a shareholder’s participation in the Funds or in other investment programs sponsored by a Service Affiliate, a shareholder’s ownership of certain types of accounts (such as IRAs), information about the Funds’ experiences or transactions with a shareholder, information captured on the Funds’ internet websites, or other data about a shareholder’s accounts, subject to applicable law. The Funds’ Service Affiliates, in turn, are not permitted to share shareholder information with non-affiliated entities, except as required or permitted by law.
Procedures to Safeguard Private Information
The Funds take seriously the obligation to safeguard shareholder non-public personal information. In addition to this policy, the Funds have implemented procedures that are designed to restrict access to a shareholder’s non-public personal information to internal personnel who need to know that information to perform their jobs, such as servicing shareholder accounts or notifying shareholders of new products or services. Physical, electronic and procedural safeguards are in place to guard a shareholder’s non-public personal information.
1 PIMCO Investments LLC (“PI”) serves as the Funds’ distributor. This Privacy Policy applies to the activities of PI to the extent that PI regularly effects or engages in transactions with or for a Fund shareholder who is the record owner of such shares. For purposes of this Privacy Policy, references to “the Funds” shall include PI when acting in this capacity.
2 When distributing this Policy, a Fund may combine the distribution with any similar distribution of its investment adviser’s privacy policy. The distributed, combined, policy may be written in the first person (i.e., by using “we” instead of “the Funds”).
| ANNUAL REPORT | JUNE 30, 2013 | 105 |
Table of Contents
General Information
Investment Adviser and Administrator
Pacific Investment Management Company LLC
840 Newport Center Drive
Newport Beach, CA 92660
Distributor
PIMCO Investments LLC
1633 Broadway
New York, NY 10019
Custodian
State Street Bank and Trust Company
801 Pennsylvania
Kansas City, MO 64105
Transfer Agent
Boston Financial Data Services
Institutional Class, Class P, Administrative Class, Class D
330 W. 9th Street, 5th Floor
Kansas City, MO 64105
Boston Financial Data Services
Class A, Class C, Class R
P.O. Box 55060
Boston, MA 02205-5060
Legal Counsel
Dechert LLP
1900 K Street, N.W.
Washington, D.C. 20006
Independent Registered Public Accounting Firm
PricewaterhouseCoopers LLP
1100 Walnut Street
Kansas City, MO 64106
This report is submitted for the general information of the shareholders of the PIMCO Equity Series.
Table of Contents

Sign up for e-delivery
To get future shareholder reports online and to eliminate mailings, go to: pimco.com/edelivery
pimco.com/investments

PES3001AR_063013
Table of Contents
Item 2. | Code of Ethics. | |||||||||
As of the end of the period covered by this report, the Registrant has adopted a code of ethics (the “Code”) that applies to the Registrant’s principal executive officer and principal financial officer. The Registrant did not grant any waivers, including implicit waivers, from any provisions of the Code to the principal executive officer or principal financial officer during the period covered by this report. | ||||||||||
A copy of the Code is included as an exhibit to this report. | ||||||||||
Item 3. | Audit Committee Financial Expert. | |||||||||
(a) The Board of Trustees has determined that Peter B. McCarthy, who serves on the Board’s audit committee, qualifies as an “audit committee financial expert” as such term is defined in the instructions to this Item 3. The Board has also determined that Mr. McCarthy is “independent” as such term is interpreted under this Item 3. | ||||||||||
Item 4. | Principal Accountant Fees and Services. | |||||||||
(a) | Fiscal Year Ended | Audit Fees | ||||||||
June 30, 2013 | $ | 197,823 | ||||||||
June 30, 2012 | $ | 196,056 | ||||||||
(b) | Fiscal Year Ended | Audit-Related Fees | ||||||||
June 30, 2013 | $ | 4,500 | ||||||||
June 30, 2012 | — | (1) | ||||||||
(c) | Fiscal Year Ended | Tax Fees | ||||||||
June 30, 2013 | $ | 6,000 | ||||||||
June 30, 2012 | — | (2) | ||||||||
(d) | Fiscal Year Ended | All Other Fees(3) | ||||||||
June 30, 2013 | — | |||||||||
June 30, 2012 | — | |||||||||
| “Audit Fees” represents fees billed for each of the last two fiscal years for professional services rendered for the audit of the PIMCO Equity Series (the “Trust” or “Registrant”) annual financial statements for those fiscal years or services that are normally provided by the accountant in connection with statutory or regulatory filings or engagements for those fiscal years. | ||||||||||
| “Audit-Related Fees” represents fees billed for each of the last two fiscal years for assurance and related services reasonably related to the performance of the audit of the Trust’s annual financial statements for those years. | ||||||||||
| “Tax Fees” represents fees billed for each of the last two fiscal years for professional services related to tax compliance, tax advice and tax planning, including review of federal and state income tax returns, review of excise tax distribution requirements and preparation of excise tax returns. | ||||||||||
| “All Other Fees” represents fees, if any, billed for other products and services rendered by the principal accountant to the Trust for the last two fiscal years. | ||||||||||
(1) There were no “Audit-Related Fees” for this fiscal year.
(2) There were no “Tax Fees” for this fiscal year.
(3) There were no “All Other Fees” for the last two fiscal years. | ||||||||||
(e) Pre-approval policies and procedures |
| |||||||||
(1) The Registrant’s Audit Committee has adopted pre-approval policies and procedures (the “Procedures”) to govern the Audit Committee’s pre-approval of (i) all audit services and permissible non-audit services to be provided to the Registrant by its independent accountant, and (ii) all permissible non-audit services to be provided by such independent accountant to the Registrant’s investment adviser and to any entity controlling, controlled by, or under common control with the investment adviser that provides ongoing services to the Registrant (collectively, the “Service Affiliates”) if the services provided directly relate to the Registrant’s operations and financial reporting. In accordance with the Procedures, the Audit Committee is responsible for the engagement of the independent accountant to certify the Registrant’s financial statements for each fiscal year. With respect to the pre-approval of non-audit services provided to the Registrant and its Service Affiliates, the Procedures provide that the Audit Committee may annually pre-approve a list of types or categories of non-audit services that may be provided to the Registrant or its Service Affiliates, or the Audit Committee may pre-approve such services on a project-by-project basis as they arise. Unless a type of service has received general pre-approval, it will require specific pre-approval by the Audit Committee if it is to be provided by the independent accountant. The Procedures also permit the Audit Committee to delegate authority to one or more of its members to pre-approve any proposed non-audit services that have not been previously pre-approved by the Committee, subject to the ratification by the full Audit Committee no later than its next scheduled meeting. | ||||||||||
(2) With respect to the services described in paragraphs (b) through (d) of this Item 4, no amount was approved by the Audit Committee pursuant to paragraph (c)(7)(i)(C) of Rule 2-01 of Regulation S-X. | ||||||||||
(f) Not applicable. | ||||||||||
(g) | ||||||||||
| Aggregate Non-Audit Fees Billed to Entity | ||||||||
Entity | June 30, 2013 | June 30, 2012 | ||||||
PIMCO Equity Series | $ | 10,500 | $ | — | ||||
Pacific Investment Management Company LLC (“PIMCO”) | 5,051,773 | 4,243,854 | ||||||
Allianz Global Investors Fund Management LLC | 650,655 | 843,275 | ||||||
Allianz Asset Management of America L.P. | 4,771,197 | 4,125,377 | ||||||
|
|
|
| |||||
Totals | $ | 10,484,125 | $ | 9,212,506 | ||||
|
|
|
| |||||
(h) The Registrant’s Audit Committee has considered whether the provision of non-audit services that were rendered to the Registrant’s investment adviser, and any entity controlling, controlled by, or under common control with the investment adviser that provides ongoing services to the Registrant which were not pre-approved (not requiring pre-approval) is compatible with maintaining the principal accountant’s independence. | ||||||||
Item 5. | Audit Committee of Listed Registrants. | |||||||
The Registrant has a separately-designated standing audit committee established in accordance with Section 3(a)(58)(A) of the Securities Exchange Act of 1934, as amended. The audit committee is comprised of:
E. Philip Cannon; Allan B. Hubbard; Peter B. McCarthy | ||||||||
Item 6. | Schedule of Investments. | |||||||
| The Schedule of Investments is included as part of the report to shareholders under Item 1. | ||||||||
Table of Contents
Item 7. | Disclosure of Proxy Voting Policies and Procedures for Closed-End Management Investment Companies. | |||||
| Not applicable. | ||||||
Item 8. | Portfolio Managers of Closed-End Management Investment Companies. | |||||
| Not applicable. | ||||||
Item 9. | Purchases of Equity Securities by Closed-End Management Investment Company and Affiliated Purchases. | |||||
| Not applicable. | ||||||
Item 10. | Submission of Matters to a Vote of Security Holders. | |||||
| Not applicable. | ||||||
Item 11. | Controls and Procedures. | |||||
| (a) | The principal executive officer and principal financial officer have concluded that the Registrant’s disclosure controls and procedures (as defined in Rule 30a-3(c) under the Investment Company Act of 1940, as amended (“1940 Act”)) provide reasonable assurances that material information relating to the Trust is made known to them by the appropriate persons, based on their evaluation of these controls and procedures as of a date within 90 days of the filing of this report. | |||||
| (b) | There were no changes in the Registrant’s internal control over financial reporting (as defined in Rule 30a-3(d) under the 1940 Act) that occurred during the second fiscal quarter of the period covered by this report that have materially affected, or are reasonably likely to materially affect, the Registrant’s internal control over financial reporting. | |||||
Item 12. | Exhibits. | |||||
(a)(1) | Exhibit 99.CODE—Code of Ethics pursuant to Section 406 of the Sarbanes-Oxley Act of 2002. | |||||
(a)(2) | Exhibit 99.CERT—Certifications pursuant to Section 302 of the Sarbanes-Oxley Act of 2002. | |||||
(b) | Exhibit 99.906CERT—Certifications pursuant to Section 906 of the Sarbanes-Oxley Act of 2002. | |||||
Table of Contents
Signatures
Pursuant to the requirements of the Securities Exchange Act of 1934 and the Investment Company Act of 1940, the registrant has duly caused this report to be signed on its behalf by the undersigned, thereunto duly authorized.
| PIMCO Equity Series | ||
| By: | /s/ DOUGLAS M. HODGE | |
| Douglas M. Hodge | ||
| Principal Executive Officer | ||
| Date: August 29, 2013 | ||
Pursuant to the requirements of the Securities Exchange Act of 1934 and the Investment Company Act of 1940, this report has been signed below by the following persons on behalf of the registrant and in the capacities and on the dates indicated.
| By: | /s/ DOUGLAS M. HODGE | |
| Douglas M. Hodge | ||
| Principal Executive Officer | ||
| Date: August 29, 2013 | ||
| By: | /s/ JOHN P. HARDAWAY | |
| John P. Hardaway | ||
| Treasurer, Principal Financial Officer | ||
| Date: August 28, 2013 | ||