Table of Contents
UNITED STATES
SECURITIES AND EXCHANGE COMMISSION
Washington, D.C. 20549
FORM N-CSR
CERTIFIED SHAREHOLDER REPORT OF REGISTERED MANAGEMENT
INVESTMENT COMPANIES
Investment Company Act file number: 811-22375
PIMCO Equity Series
(Exact name of registrant as specified in charter)
650 Newport Center Drive, Newport Beach, CA 92660
(Address of principal executive offices)
Trent W. Walker
Treasurer and Principal Financial Officer
PIMCO Equity Series
650 Newport Center Drive
Newport Beach, CA 92660
(Name and address of agent for service)
Copies to:
Brendan C. Fox
Dechert LLP
1900 K Street, N.W.
Washington, D.C. 20006
Registrant’s telephone number, including area code: (888) 877-4626
Date of fiscal year end: June 30
Date of reporting period: June 30, 2014
Form N-CSR is to be used by management investment companies to file reports with the Commission not later than 10 days after the transmission to stockholders of any report that is required to be transmitted to stockholders under Rule 30e-1 under the Investment Company Act of 1940 (17 CFR 270.30e-1). The Commission may use the information provided on Form N-CSR in its regulatory, disclosure review, inspection, and policymaking roles.
A registrant is required to disclose the information specified by Form N-CSR, and the Commission will make this information public. A registrant is not required to respond to the collection of information contained in Form N-CSR unless the Form displays a currently valid Office of Management and Budget (“OMB”) control number. Please direct comments concerning the accuracy of the information collection burden estimate and any suggestions for reducing the burden to Secretary, Securities and Exchange Commission, 450 Fifth Street, NW, Washington, DC 20549-0609. The OMB has reviewed this collection of information under the clearance requirements of 44 U.S.C. § 3507.
Table of Contents
Item 1. | Reports to Stockholders. | |||||||
The following is a copy of the report transmitted to stockholders pursuant to Rule 30e-1 under the Investment Company Act of 1940, as amended (the “1940 Act”) (17 CFR 270.30e-1).
| • | PIMCO Equity Series—Institutional, P, Administrative, D, A, C and R Classes |
Table of Contents

Your Global Investment Authority
PIMCO Equity Series®
Annual Report
June 30, 2014

PIMCO Balanced Income Fund
PIMCO Dividend and Income Builder Fund
PIMCO EqS® Dividend Fund
PIMCO EqS® Emerging Markets Fund
PIMCO EqS® Long/Short Fund
PIMCO Emerging Multi-Asset Fund
PIMCO EqS Pathfinder Fund®
Share Classes
| n | Institutional |
| n | P |
| n | Administrative |
| n | D |
| n | A |
| n | C |
| n | R |

Table of Contents
| Page | ||||||
| 2 | ||||||
| 4 | ||||||
| 29 | ||||||
| 32 | ||||||
| 40 | ||||||
| 42 | ||||||
| 44 | ||||||
| 45 | ||||||
| 46 | ||||||
| 48 | ||||||
| 49 | ||||||
| 94 | ||||||
| 116 | ||||||
| 117 | ||||||
| 119 | ||||||
| 120 | ||||||
| 122 | ||||||
| 123 | ||||||
| Fund | Insights from the Portfolio Managers | Fund Summary | Schedule of Investments | |||||||||
PIMCO Balanced Income Fund | 6 | 8 | 50 | |||||||||
PIMCO Dividend and Income Builder Fund | 9 | 11 | 56 | |||||||||
PIMCO EqS® Dividend Fund | 12 | 14 | 64 | |||||||||
PIMCO EqS® Emerging Markets Fund | 15 | 18 | 68 | |||||||||
PIMCO EqS® Long/Short Fund | 19 | 21 | 76 | |||||||||
PIMCO Emerging Multi-Asset Fund | 22 | 24 | 81 | |||||||||
PIMCO EqS Pathfinder Fund® | 25 | 28 | 87 | |||||||||
This material is authorized for use only when preceded or accompanied by the current PIMCO Equity Series prospectus.
Table of Contents
Dear Shareholder,
Please find enclosed the Annual Report for the PIMCO Equity Series covering the twelve-month reporting period ended June 30, 2014. On the following pages are specific details about the investment performance of each fund and a discussion of the factors that influenced performance during the reporting period. In addition, the letters from the portfolio managers provide a further review of such factors as well as an overview of each fund’s investment strategy.
Over the past twelve months, investors faced periods of heightened market volatility brought on by uncertainty around monetary and fiscal policy, geopolitical tension in the Middle East and Ukraine, growing concern over China’s economic health, and fears of deflation in the Eurozone.
In contrast to the market reaction during the summer of 2013 in which the Federal Reserve’s (“Fed”) new “taper talk” caused significant market turmoil, investor risk appetite returned during the second half of the reporting period due to better clarity regarding central bank policy and an easing of global geopolitical risks towards the latter part of the period.
The outlook for the U.S. economy improved on steady though historically slow employment growth and renewed business investment activity during the reporting period. However, while the Fed noted in its June 2014 meeting that the U.S. economy had “rebounded”, the central bank reiterated its view that the economy still had some distance to go to meet its employment and specific inflation targets. Investors became more comfortable with the idea that the Fed would keep its policy rate lower than historical norms during a recovery.
This sentiment was reinforced by a series of actions announced by the European Central Bank (“ECB”) on June 5, 2014. ECB President Mario Draghi lowered the ECB’s benchmark rate by 10 basis points, reduced its deposit rate into unprecedented negative territory to help mitigate potential deflationary forces (making the ECB the first major central bank to do so), opened a new liquidity channel to help encourage bank lending, and mentioned plans to begin a future quantitative easing asset purchase program. These measures reflected the ECB’s decision to attempt to tackle the threat of deflation in the Eurozone amid slower-than-historical and expected economic growth.
Within Asia, Japan raised its consumption tax, leading to a decline in household spending and retail sales. China, also facing a more challenging growth outlook, launched a mini-stimulus program and continued to finely tune its monetary policies amid lingering concerns regarding shadow banking-related defaults.
Highlights of the financial markets during our twelve-month reporting period include:
| n | Developed market equities posted strong performance over the reporting period as higher-risk assets rallied with the return of investor risk appetite, despite a period marked by uncertainty around central bank policy and geopolitical risks. U.S. equities, as measured by the S&P 500 Index, returned 24.61%. Global equities, as represented by the MSCI All Country World Index Net USD and MSCI World Index, returned 22.95% and 24.05%, respectively. Emerging market (“EM”) equities, as represented by the MSCI Emerging Markets Index (Net Dividends in USD), returned 14.31%. |
| n | U.S. Treasuries, as represented by the Barclays U.S. Treasury Index, returned 2.04% over the reporting period. Investors continued pricing in low policy rates and lower long-term yields in reaction to the Fed signaling towards the latter part of the period that it was in no hurry to start raising interest rates. The benchmark ten-year U.S. Treasury note yielded 2.53%, virtually unchanged, compared to 2.49% on June 30, 2013. The Barclays U.S. Aggregate Index, a widely used index of U.S. investment-grade bonds, returned 4.37% for the period. |
All of our active equity strategies are high-conviction portfolios driven by bottom-up fundamental research. Each strategy is managed by focused equity investors who additionally benefit from PIMCO’s global investment resources and macroeconomic insights. We believe the long-term potential of equities to grow earnings and dividends is an important component of most investors’ overall portfolio.
| 2 | PIMCO EQUITY SERIES |
Table of Contents
If you have any questions regarding the PIMCO Equity Series, please contact your account manager or financial adviser, or call one of our shareholder associates at 888.87.PIMCO (888.877.4626). We also invite you to visit our website at www.pimco.com/investments to learn more about our views and global thought leadership.
Thank you again for the trust you have placed in us. We value your commitment and will continue to work diligently to meet your broad investment needs.
 | Sincerely,
Brent R. Harris Chairman of the Board, PIMCO Equity Series
July 24, 2014 |

| ANNUAL REPORT | JUNE 30, 2014 | 3 |
Table of Contents
Important Information About the Funds
PIMCO Equity Series (the “Trust”) is an open-end management investment company currently consisting of seven separate investment portfolios (the “Funds”). Each Fund is an actively managed equity strategy. While we believe that equity funds have an important role to play in a well diversified investment portfolio, they are subject to notable risks. Among other things, equity and equity-related securities may decline in value due to both real and perceived general market, economic, and industry conditions.
As of the date of this report, interest rates in the U.S. are at or near historically low levels. As such, funds that invest in fixed income securities may currently face an increased exposure to the risks associated with a rising interest rate environment. This is especially true since the Federal Reserve Board has begun tapering its quantitative easing program. Further, while the U.S. bond market has steadily grown over the past three decades, dealer inventories of corporate bonds have remained relatively stagnant. As a result, there has been a significant reduction in the ability of dealers to “make markets.” All of the factors mentioned above, individually or collectively, could lead to increased volatility and/or lower liquidity in the fixed income markets, which could result in losses to a Fund. If the performance of a Fund were to be negatively impacted by rising interest rates, the Fund could face increased redemptions by its shareholders, which could further reduce the value of the Fund.
The Funds may be subject to various risks as described in the Funds’ prospectus. Some of these risks may include, but are not limited to, the following: Acquired Fund risk, allocation risk, equity risk, dividend-oriented stocks risk, value investing risk, foreign (non-U.S.) investment risk, emerging markets risk, market risk, issuer risk, interest rate risk, credit risk, high yield and distressed company risk, cash holdings risk, currency risk, real estate risk, liquidity risk, leveraging risk, management risk, small-cap and mid-cap company risk, arbitrage risk, derivatives risk, mortgage-related and other asset-backed risk, short sale risk, commodity risk, convertible securities risk, tax risk, subsidiary risk, and issuer non-diversification risk. A complete description of these risks and other risks is contained in the Funds’ prospectus. The Funds may use derivative instruments for hedging purposes or as part of an investment strategy. Use of these instruments may involve certain costs and risks such as liquidity risk, interest rate risk, market risk, credit risk, management risk, leverage risk, mispricing or improper valuation risk and the risk that the Funds could not close out a position when it would be most advantageous to do so. Certain derivative transactions may have a leveraging effect on a Fund. For example, a small investment in a derivative instrument may have a significant impact on a Fund’s exposure to interest rates, currency exchange rates or other investments. As a result, a relatively small price movement in a derivative instrument may cause an immediate and substantial loss or
gain. A Fund may engage in such transactions regardless of whether the Fund owns the asset, instrument or components of the index underlying the derivative instrument. A Fund may invest a significant portion of its assets in these types of instruments. If it does, the Fund’s investment exposure could far exceed the value of its portfolio securities and its investment performance could be primarily dependent upon securities it does not own. Investing in non-U.S. securities may entail risk due to non-U.S. economic and political developments; this risk may be increased when investing in emerging markets.
High-yield bonds typically have a lower credit rating than other bonds. Lower-rated bonds generally involve a greater risk to principal than higher-rated bonds. Further, markets for lower-rated bonds are typically less liquid than for higher-rated bonds, and public information is usually less abundant in such markets. Thus, high yield investments increase the chance that the Fund will lose money. The credit quality of a particular security or group of securities does not ensure the stability or safety of the overall portfolio. Mortgage- and Asset-Backed Securities represent ownership interests in “pools” of mortgages or other assets such as consumer loans or receivables. As a general matter, Mortgage- and Asset-Backed Securities are subject to interest rate risk, extension risk, prepayment risk, and credit risk. These risks largely stem from the fact that returns on Mortgage- and Asset-Backed Securities depend on the ability of the underlying assets to generate cash flow.
On each individual Fund Summary page in this Shareholder Report, the Average Annual Total Return table and Cumulative Returns chart measure performance assuming that any dividend and capital gain distributions were reinvested. Class A shares are subject to an initial sales charge. A Contingent Deferred Sales Charge (“CDSC”) may be imposed in certain circumstances on Class A shares that are purchased without an initial sales charge and then redeemed during the first 18 months after purchase. The Cumulative Returns chart reflects only Institutional Class performance. Performance for Class P, Administrative Class, Class D, Class A, Class C and Class R shares is typically lower than Institutional Class performance due to the lower expenses paid by Institutional Class shares. Performance shown is net of fees and expenses. A Fund’s total annual operating expense ratios on each individual Fund summary page are as of the currently effective prospectus, as supplemented to date. The Cumulative Returns chart assumes the initial investment of $1,000,000 was made at the end of the month that the Institutional Class of the relevant Fund commenced operations. The minimum initial investment amount for Institutional Class, Class P and Administrative Class shares is $1,000,000. The minimum initial investment amount for Class A, Class C and Class D shares is $1,000. There is no minimum initial investment for Class R
| 4 | PIMCO EQUITY SERIES |
Table of Contents
shares. Each Fund measures its performance against a broad-based securities market index (“benchmark index”). The benchmark index does not take into account fees, expenses, or taxes. A Fund’s past
performance, before and after taxes, is not necessarily an indication of how the Fund will perform in the future.
The following table discloses the inception dates of each Fund and its respective share classes:
| Fund Name | Fund Inception | Institutional Class | Class P | Administrative Class | Class D | Class A | Class C | Class R | ||||||||||||||||||||||||||
PIMCO Balanced Income Fund | 03/31/14 | 03/31/14 | 03/31/14 | — | 03/31/14 | 03/31/14 | 03/31/14 | — | ||||||||||||||||||||||||||
PIMCO Dividend and Income Builder Fund | 12/14/11 | 12/14/11 | 12/14/11 | — | 12/14/11 | 12/14/11 | 12/14/11 | 12/14/11 | ||||||||||||||||||||||||||
PIMCO EqS® Dividend Fund | 12/14/11 | 12/14/11 | 12/14/11 | — | 12/14/11 | 12/14/11 | 12/14/11 | 12/14/11 | ||||||||||||||||||||||||||
PIMCO EqS® Emerging Markets Fund | 03/22/11 | 03/22/11 | 03/22/11 | 04/19/11 | 03/22/11 | 03/22/11 | 03/22/11 | 03/22/11 | ||||||||||||||||||||||||||
PIMCO EqS® Long/Short Fund | 04/20/12 | 04/20/12 | 04/30/12 | — | 04/30/12 | 04/30/12 | 04/30/12 | — | ||||||||||||||||||||||||||
PIMCO Emerging Multi-Asset Fund | 04/12/11 | 04/12/11 | 04/12/11 | 04/19/11 | 04/12/11 | 04/12/11 | 04/12/11 | 04/12/11 | ||||||||||||||||||||||||||
PIMCO EqS Pathfinder Fund® | 04/14/10 | 04/14/10 | 04/14/10 | — | 04/14/10 | 04/14/10 | 04/14/10 | 04/14/10 | ||||||||||||||||||||||||||
For periods prior to the inception date of the Class P, Administrative Class, Class D, Class A, Class C and Class R shares (if applicable), performance information shown is based on the performance of the Fund’s Institutional Class shares. The prior Institutional Class performance has been adjusted to reflect the distribution and/or service fees and other expenses paid by the Class P, Administrative Class, Class D, Class A, Class C and Class R shares, respectively.
An investment in a Fund is not a bank deposit and is not guaranteed or insured by the Federal Deposit Insurance Corporation (“FDIC”) or any other government agency. It is possible to lose money on investments in a Fund.
PIMCO has adopted written proxy voting policies and procedures (“Proxy Policy”) as required by Rule 206(4)-6 under the Investment Advisers Act of 1940, as amended. The Proxy Policy has been adopted by PIMCO Equity Series as the policies and procedures that PIMCO will use when voting proxies on behalf of a Fund. A description of the
policies and procedures that PIMCO uses to vote proxies relating to portfolio securities of a Fund, and information about how the Fund voted proxies relating to portfolio securities held during the most recent twelve-month period ended June 30th, are available without charge, upon request, by calling the Trust at (888) 87-PIMCO, on the Fund’s website at http://www.pimco.com/investments, and on the Securities and Exchange Commission’s (“SEC”) website at http://www.sec.gov.
PIMCO Equity Series files a complete schedule of each Fund’s portfolio holdings with the SEC for the first and third quarters of each fiscal year on Form N-Q. A copy of a Fund’s Form N-Q is available on the SEC’s website at http://www.sec.gov and may be reviewed and copied at the SEC’s Public Reference Room in Washington, D.C. A Fund’s Form N-Q will also be available without charge, upon request, by calling the Trust at (888) 87-PIMCO and on the Fund’s website at http://www.pimco.com/investments. Information on the operation of the Public Reference Room may be obtained by calling 1-800-SEC-0330.
| ANNUAL REPORT | JUNE 30, 2014 | 5 |
Table of Contents
Insights from the Portfolio Managers PIMCO Balanced Income Fund
Dear Shareholder,
We appreciate your investment in the PIMCO Balanced Income Fund (the “Fund”). In the following letter, please find a discussion of the recent market environment and a review of portfolio performance covering the period since the Fund’s inception on March 31, 2014 through the end of the reporting period on June 30, 2014.
Market Overview
Despite geopolitical tensions between Russia and Ukraine extending into the second quarter and potential oil supply disruptions in Iraq, U.S. equities performed in-line with global equity markets during the quarter. Following a disappointing first quarter GDP reading, second quarter data releases pointed to a more optimistic growth outlook. The Federal Reserve (“Fed”) continued with its taper program, reducing bond purchases by $10 billion per month. While we anticipate an upward path for interest rates, the market and the Fed’s expectations for future interest rates are likely too aggressive in our opinion.
Overall, interest rates declined over the quarter, with the U.S. ten-year U.S. Treasury yield falling nearly 20 basis points. Rate-sensitive stocks outperformed again this quarter, with real estate investment trusts (“REITs”) and utilities up significantly. In Europe, the European Central Bank’s (“ECB”) plans for monetary easing to stimulate growth and combat deflation supported equity markets. The ECB also cut its benchmark interest rate from 0.25% to 0.15%, introduced a negative deposit rate and eased lending requirements for small businesses.
After five consecutive quarters of underperformance, emerging markets (“EM”) outpaced developed markets, with the EM region led by India and Russia. Across sectors, performance was mixed with seven out of ten sectors in the MSCI All Country World Index Net USD lagging the overall benchmark. Performance was strongest in the energy and utilities sectors and weakest in the industrials and financials sectors. Within fixed income, the Barclays Global Aggregate Index rallied as central banks remained accommodative, with developed market yields falling to twelve month lows.
Fund Review
During the period since the Fund’s inception through the end of the reporting period, the Fund paid ordinary quarterly dividends of 8.0 cents per share on its Institutional Class shares. The dividend per share was slightly lower for the other share classes, to account for varying class specific expenses. The Fund’s Institutional Class shares net asset value increased by $0.24 per share (from $10.00 to $10.24) over the period since the Fund’s inception through the end of the reporting period, representing a total return of 3.20% (net of fees).
On a relative basis, the Fund underperformed its benchmark index (a blend of 50% MSCI All Country World Index Net USD/50% Barclays Global Aggregate USD Hedged), which returned 3.52% over the period since the Fund’s inception through the end of the reporting period. Performance was mixed among cyclicals as greater exposure to energy and consumer discretionary sectors weighed on returns, while positioning within telecommunications and materials was additive to performance.
At the security level, the Fund’s position in Golar LNG Partners, the Bermuda-based carrier of liquefied natural gas (“LNG”), was the largest contributor to relative performance as we believe the company stands to benefit from a regulatory approval allowing U.S. LNG to be exported to World Trade Organization (“WTO”) member countries. The company released strong first quarter results and stated that management would recommend a distribution increase of $0.09-0.11 per unit per year to the Board.
The largest detractor for the period was the Fund’s holding of Electricite de France, the French utility provider, as it continues to face some uncertainty regarding future tariffs. The French government cancelled a previously announced tariff increase set for August 1, 2014 and is looking to announce a revision to the formula potentially in October 2014. The company has reiterated its ability to deliver on its long-term earnings and free cash flow objectives.
The Fund’s fixed income allocation underperformed slightly, driven mainly by an underweight to U.S. duration as yields declined across the intermediate and long-end of the U.S. yield curve. An allocation to non-Agency mortgage-backed securities, along with a modest allocation to high yield credit, contributed to relative performance and mitigated losses. Over the quarter, we brought the fixed income allocation up to 26% and cash down to 20%.
Investor Benefits
The Fund seeks to follow a balanced approach that combines the higher capital appreciation and dividend-paying potential of equities with the lower volatility and attractive income potential of fixed income to provide consistent income, as well as capital appreciation over the long term. Potential benefits of the Fund include:
| n | A balanced approach focused on finding what we believe are the most attractive income-producing equity and fixed income investments around the world. |
| n | A well-established investment process focused on comprehensive fundamental, bottom-up research combined with PIMCO’s macroeconomic expertise. |
| n | Active use of PIMCO’s credit, commodity, equity, foreign exchange expertise to enhance individual company analysis and overall portfolio construction. |
| 6 | PIMCO EQUITY SERIES |
Table of Contents
Value of a Balanced Approach
An allocation to the PIMCO Balanced Income Fund may be beneficial for many investors as a part of a diversified portfolio. A balanced approach may offer the attractive return potential of equities with the income and capital preservation potential of fixed income. Perhaps most importantly, many investors expect equities to provide strong real returns over time (after adjusting for inflation) with a high level of liquidity, while fixed income can provide downside risk mitigation during times of market stress.
We thank you for your investment in the Fund.
Sincerely,
 |  |  | ||
 |  |  | ||
| Brad Kinkelaar | Dan Ivascyn | Alfred Murata | ||
Equity Portfolio Manager | Fixed Income Portfolio Manager | Fixed Income Portfolio Manager | ||
Top 10 Holdings1
Target Corp. | 2.2% | |||||
Colony Financial, Inc. | 1.8% | |||||
Cisco Systems, Inc. | 1.7% | |||||
General Motors Co. | 1.6% | |||||
Imperial Tobacco Group PLC | 1.4% | |||||
KeyCorp | 1.4% | |||||
QUALCOMM, Inc. | 1.4% | |||||
Countrywide Home Loan Mortgage Pass-Through Trust | 1.3% | |||||
Prudential Financial, Inc. | 1.2% | |||||
Kohl’s Corp. | 1.2% |
Geographic Breakdown1
United States | 53.8% | |||||
Brazil | 5.1% | |||||
France | 3.8% | |||||
United Kingdom | 3.7% | |||||
Netherlands | 1.7% |
Geographic Breakdown1 (Cont.)
Spain | 1.6% | |||||
Other | 13.6% |
Sector Breakdown1
Financials | 16.3% | |||||
Asset-Backed Securities | 10.1% | |||||
Consumer Discretionary | 9.3% | |||||
Mortgage-Backed Securities | 6.9% | |||||
Industrials | 6.9% | |||||
Information Technology | 5.9% | |||||
Energy | 5.5% | |||||
Consumer Staples | 4.0% | |||||
Utilities | 3.9% | |||||
Sovereign Issues | 3.6% | |||||
Health Care | 3.3% | |||||
Bank Loan Obligations | 3.3% | |||||
Telecommunication Services | 3.2% | |||||
Other | 1.1% |
| 1 | % of Investments, at value as of 06/30/14. Top Holdings, Geographic and Sector Breakdown solely reflect long positions. Securities sold short, financial derivative instruments and short-term instruments are not taken into consideration. |
| ANNUAL REPORT | JUNE 30, 2014 | 7 |
Table of Contents
| Institutional Class - PBITX | Class A - PBIAX | |
| Class P - PBIEX | Class C - PBICX | |
| Class D - PBIDX |
A line graph is not included since the Fund has less than six months of performance.
| Cumulative Total Return for the period ended June 30, 2014 | ||||
| Fund Inception (03/31/2014) | ||||
| PIMCO Balanced Income Fund Institutional Class | 3.20 | % | ||
| PIMCO Balanced Income Fund Class P | 3.18 | % | ||
| PIMCO Balanced Income Fund Class D | 3.21 | % | ||
| PIMCO Balanced Income Fund Class A | 3.21 | % | ||
| PIMCO Balanced Income Fund Class A (adjusted) | -2.45 | % | ||
| PIMCO Balanced Income Fund Class C | 3.03 | % | ||
| PIMCO Balanced Income Fund Class C (adjusted) | 2.03 | % | ||
| MSCI All Country World Index Net USD± | 5.04 | % | ||
| 50% MSCI All Country World Index Net USD/50% Barclays Global Aggregate USD Hedged±± | 3.52 | % | ||
All Fund returns are net of fees and expenses.
± The MSCI All Country World Index Net USD is a free float-adjusted market capitalization weighted index that is designed to measure the equity market performance of developed and emerging markets. The Index consists of 45 country indices comprising 24 developed and 21 emerging market country indices. It is not possible to invest directly in an unmanaged index.
±± The benchmark is a blend of 50% MSCI All Country World Index Net USD/50% Barclays Global Aggregate USD Hedged. The MSCI All Country World Index Net USD is a free float-adjusted market capitalization weighted index that is designed to measure the equity market performance of developed and emerging markets. The index consists of 45 country indices comprising 24 developed and 21 emerging market county indices. Barclays Global Aggregate (USD Hedged) Index provides a broad-based measure of the global investment-grade fixed income markets. The three major components of this index are U.S. Aggregate, the Pan-European Aggregate, and the Asian-Pacific Aggregate Indices. The index also includes Eurodollar and Euro-Yen corporate bonds, Canadian Government securities, and USD investment grade 144A securities. It is not possible to invest directly in an unmanaged index.
Performance quoted represents past performance. Past performance is not a guarantee or a reliable indicator of future results. Current performance may be lower or higher than performance shown. Investment return and the principal value of an investment will fluctuate. Shares may be worth more or less than original cost when redeemed. Returns shown do not reflect the deduction of taxes that a shareholder would pay on fund distributions or the redemption of fund shares. The adjusted returns take into account the maximum sales charge of 5.50% on Class A shares and 1.00% CDSC on Class C shares. The Fund’s total annual operating expense ratio as stated in the Fund’s current prospectus, as supplemented to date, is 1.03% for the Institutional Class shares, 1.13% for the Class P shares, 1.38% for the Class D shares, 1.38% for the Class A shares, and 2.13% for the Class C shares. Details regarding any Fund’s operating expenses can be found in the Fund’s prospectus. For performance current to the most recent month-end, visit www.pimco.com/investments.
Portfolio Insights
| » | The PIMCO Balanced Income Fund seeks to maximize current income while providing long-term capital appreciation by investing under normal circumstances in a diversified portfolio of income-producing equity and fixed income securities, each of which may be represented by forwards or derivatives such as options, futures contracts, or swap agreements. The Fund will typically invest at least 25% of its net assets in equity and equity related securities and at least 25% of its net assets in fixed income securities. The Fund’s investments in equity and equity-related securities include common and preferred stock (and securities convertible into, or that PIMCO expects to be exchanged for, common or preferred stock), as well as securities issued by real estate investment trusts, master limited partnerships and other equity trusts and depositary receipts. |
| » | The Fund commenced operations on March 31, 2014. |
| » | For the period since the Fund’s inception through the end of the reporting period, the Fund’s Institutional Class shares returned 3.20% after fees, and the Fund’s benchmark index, the MSCI All Country World Index Net USD, returned 5.04%. The Fund’s blended benchmark index (50% MSCI All Country World Index Net USD/50% Barclays Global Aggregate USD Hedged) returned 3.52%. |
| » | During the period since the Fund’s inception through the end of the reporting period, the Fund paid ordinary quarterly dividends of 8.0 cents per share on its Institutional Class shares. The dividend per share was slightly lower for the other share classes, to account for varying class specific expenses. The Fund’s net asset value increased by $0.24 per share (from $10.00 to $10.24). |
| » | Security selection was flat to slightly negative for performance. The largest single detractor from relative performance was the Fund’s holding of Electricite de France, the French utility provider. |
| » | The largest single positive contributor to relative performance was the Fund’s holding of Golar LNG Partners, the Bermuda-based owner of liquefied natural gas carriers. |
| » | The Fund’s fixed income allocation performed positively, driven mainly by security selection within non-Agency mortgage-backed securities as prices on these securities generally rose during the reporting period. |
| » | The Fund’s positive cash position detracted from relative performance during a period in which the Fund’s blended benchmark index returned 3.52%. |
| 8 | PIMCO EQUITY SERIES |
Table of Contents
Insights from the Portfolio Managers PIMCO Dividend and Income Builder Fund
Dear Shareholder,
We appreciate your investment in the PIMCO Dividend and Income Builder Fund (the “Fund”). In the following letter, please find a discussion of the recent market environment and a review of portfolio performance over the twelve-month reporting period ended June 30, 2014.
Market Overview
Despite initial uncertainty over the Federal Reserve’s (“Fed”) taper program (i.e., reduced asset purchases), equities rallied in the latter half of 2013 as then Chairman Ben Bernanke communicated that a highly-accommodative monetary policy would remain in place for the foreseeable future. When it was finally announced in December 2013, investors interpreted the taper program as a signal of an improving economy.
Among developed markets, economic reports in Europe continued to suggest the region was slowly exiting its recession. Emerging markets underperformed developed markets on concerns over a China slowdown and widening current accounts deficits in Turkey, South Africa, India, Indonesia and Brazil.
Despite geopolitical tensions between Russia and Ukraine, as well as concerns over potential oil supply disruptions in Iraq, U.S. equities outperformed developed market countries as a whole in the first half of 2014. Following a disappointing first quarter GDP figure largely influenced by a harsh winter, second quarter data pointed to a more optimistic growth outlook. The Fed continued with its taper program, reducing bond purchases by $10 billion per month. In Europe, the European Central Bank’s plans for monetary easing to stimulate growth and combat deflation supported equity markets.
After five consecutive quarters of underperformance, emerging markets outpaced developed markets towards the end of the reporting period, led by India and Russia. Global equity market performance was positive in each of the ten sectors of the MSCI All Country World Index Net USD. Performance was strongest in the information technology (“IT”), health care and energy sectors. Consumer staples, telecommunication services, and financials were the poorest performing sectors.
Fund Review
During the reporting period, the Fund paid ordinary quarterly dividends of 44.8 cents per share on its Institutional Class shares. The dividend per share was slightly lower for the other share classes, to account for varying class specific expenses. The Fund’s Institutional Class shares net asset value increased by $1.52 per share (from $11.60 to $13.12) over the reporting period, representing a total return of 17.23% (net of fees).
On a relative basis, the Fund underperformed its benchmark (a blend of 75% MSCI All Country World Index Net USD/25% Barclays Global Aggregate USD Hedged), which returned 18.95%. Overweights in cyclically-oriented sectors, such as consumer discretionary and financials, presented headwinds, while the Fund’s holdings in the more defensive consumer staples sector outperformed. As the economy continues to improve, we believe that this relative performance should reverse.
At the security level, the Fund’s position in Walgreens, the U.S. retail drugstore operator, was the largest contributor to relative performance, driven by strong earnings and same-store and prescription sales. Walgreens also increased its quarterly dividend, and its management team indicated that the recently acquired Alliance Boots division was performing in-line with expectations and was on track to meet first year synergy targets.
The largest detractor for the period was the Fund’s holding of Staples, the U.S. office supplies retailer. The company announced several strategy shifts, and lowered its expected results in the latter half of 2013, highlighting the secular challenges facing the company. Staples recently reported disappointing earnings, impacted by poor results across its business segments. We exited the position in June.
The Fund’s fixed income allocation performed positively, driven mainly by security selection within non-Agency mortgage-backed securities and high yield credit.
Investment Process and Portfolio Construction
Our bottom-up investment strategy is focused on seeking to provide attractive income today and long-term capital appreciation. Through fundamental research we aim to identify attractively priced companies exhibiting the ability and willingness to increase dividend payments. We then construct a portfolio that is diversified across three types of businesses:
| n | Consistent Earners: Blue-chip industry leaders that consistently create value year after year. |
| n | Basic Value: Traditional value companies, such as cyclicals, turnarounds, and companies with low valuations. |
| n | Emerging Franchises: Companies with the potential to grow significantly over time. |
Our total return focused approach means that we do not advocate selecting equity investments based on yield alone. Instead, we believe that an investment process that seeks out attractively valued income-generating opportunities is critical in an environment where certain sectors may be expensive relative to historical levels. Additionally, we believe that dividend growth can be an important contributor to
| ANNUAL REPORT | JUNE 30, 2014 | 9 |
Table of Contents
Insights from the Portfolio Managers PIMCO Dividend and Income Builder Fund (Cont.)
investment success with benefits including excess returns and an increasing yield on an investor’s original cost over time.
Conclusion
Over the reporting period, we reduced our allocation slightly to Consistent Earners and increased our allocations to Basic Value companies and Emerging Franchises as the market volatility provided opportunities to initiate new positions. We brought down our cash and fixed income allocations from 16% to 10%. We reduced our allocation to health care and materials names and increased our allocation to consumer discretionary names.
Going forward, we believe dividend-paying equities have the potential to be an attractive long-term investment solution, especially given a secular outlook for more modest returns across asset classes. With ten-year U.S. Treasury yields near historical lows, attractively-priced, less interest rate sensitive dividend growth stocks can be particularly beneficial going forward.
We thank you for your investment in the Fund.
Sincerely,
| | | ||
| | | ||
| Brad Kinkelaar | Dan Ivascyn | Alfred Murata | ||
Equity Portfolio Manager | Fixed Income Portfolio Manager | Fixed Income Portfolio Manager | ||
Top 10 Holdings1
Target Corp. | 3.5% | |||||
Colony Financial, Inc. | 2.9% | |||||
Cisco Systems, Inc. | 2.7% | |||||
General Motors Co. | 2.7% | |||||
Imperial Tobacco Group PLC | 2.5% | |||||
ProSafe SE | 2.3% | |||||
KeyCorp | 2.1% | |||||
QUALCOMM, Inc. | 2.1% | |||||
Prudential Financial, Inc. | 2.0% | |||||
CenturyLink, Inc. | 2.0% |
Geographic Breakdown1
United States | 53.8% | |||||
France | 6.1% | |||||
United Kingdom | 6.1% | |||||
Brazil | 4.2% | |||||
Spain | 2.9% | |||||
Netherlands | 2.8% | |||||
Cyprus | 2.3% | |||||
Bermuda | 1.9% | |||||
Japan | 1.8% | |||||
Germany | 1.7% | |||||
Switzerland | 1.7% | |||||
Other | 12.3% |
Sector Breakdown1
Financials | 24.7% | |||||
Consumer Discretionary | 14.9% | |||||
Energy | 10.1% | |||||
Information Technology | 9.3% | |||||
Industrials | 7.7% | |||||
Utilities | 6.6% | |||||
Consumer Staples | 6.6% | |||||
Telecommunication Services | 5.5% | |||||
Health Care | 5.2% | |||||
Mortgage-Backed Securities | 2.7% | |||||
Materials | 1.9% | |||||
Asset-Backed Securities | 1.7% | |||||
Other | 0.7% |
| 1 | % of Investments, at value as of 06/30/14. Top Holdings, Geographic and Sector Breakdown solely reflect long positions. Securities sold short, financial derivative instruments and short-term instruments are not taken into consideration. |
| 10 | PIMCO EQUITY SERIES |
Table of Contents
PIMCO Dividend and Income Builder Fund
| Institutional Class - PQIIX | Class A - PQIZX | |
| Class P - PQIPX | Class C - PQICX | |
| Class D - PQIDX | Class R - PQIBX |
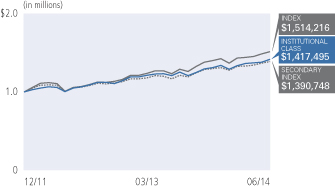
Cumulative Returns Through June 30, 2014
Average Annual Total Return for the period ended June 30, 2014 | ||||||||||
| 1 Year | Fund Inception (12/14/11) | |||||||||
 | PIMCO Dividend and Income Builder Fund Institutional Class | 17.23% | 15.62% | |||||||
| PIMCO Dividend and Income Builder Fund Class P | 17.05% | 15.56% | ||||||||
| PIMCO Dividend and Income Builder Fund Class D | 16.78% | 15.26% | ||||||||
| PIMCO Dividend and Income Builder Fund Class A | 16.78% | 15.26% | ||||||||
| PIMCO Dividend and Income Builder Fund Class A (adjusted) | 10.32% | 12.74% | ||||||||
| PIMCO Dividend and Income Builder Fund Class C | 15.97% | 14.40% | ||||||||
| PIMCO Dividend and Income Builder Fund Class C (adjusted) | 14.97% | 14.40% | ||||||||
| PIMCO Dividend and Income Builder Fund Class R | 16.50% | 15.00% | ||||||||
 | MSCI All Country World Index Net USD± | 22.95% | 19.34% | |||||||
 | 75% MSCI All Country World Index Net USD/25% Barclays Global Aggregate USD Unhedged±± | 18.95% | 15.13% | |||||||
All Fund returns are net of fees and expenses.
± The MSCI All Country World Index Net USD is a free float-adjusted market capitalization weighted index that is designed to measure the equity market performance of developed and emerging markets. The Index consists of 45 country indices comprising 24 developed and 21 emerging market country indices. It is not possible to invest directly in an unmanaged index.
±± The benchmark is a blend of 75% MSCI All Country World Index Net USD/25% Barclays Global Aggregate USD Unhedged. The MSCI All Country World Index Net USD is a free float-adjusted market capitalization weighted index that is designed to measure the equity market performance of developed and emerging markets. The Index consists of 45 country indices comprising 24 developed and 21 emerging market country indices. Barclays Global Aggregate (USD Unhedged) Index provides a broad-based measure of the global investment-grade fixed income markets. The three major components of this index are the U.S. Aggregate, the Pan-European Aggregate, and the Asian-Pacific Aggregate Indices. The index also includes Eurodollar and Euro-Yen corporate bonds, Canadian Government securities, and USD investment grade 144A securities. It is not possible to invest directly in an unmanaged index.
Performance quoted represents past performance. Past performance is not a guarantee or a reliable indicator of future results. Current performance may be lower or higher than performance shown. Investment return and the principal value of an investment will fluctuate. Shares may be worth more or less than original cost when redeemed. Returns shown do not reflect the deduction of taxes that a shareholder would pay on fund distributions or the redemption of fund shares. The adjusted returns take into account the maximum sales charge of 5.50% on Class A shares and 1.00% CDSC on Class C shares. The Fund’s total annual operating expense ratio as stated in the Fund’s current prospectus, as supplemented to date, is 1.20% for the Institutional Class shares, 1.30% for the Class P shares, 1.55% for the Class D shares, 1.55% for the Class A shares, 2.30% for the Class C shares and 1.80% for the Class R shares. Details regarding any Fund’s operating expenses can be found in the Fund’s prospectus. For performance current to the most recent month-end, visit www.pimco.com/investments.
Portfolio Insights
| » | The PIMCO Dividend and Income Builder Fund seeks to provide current income that exceeds the average yield on global stocks, and to provide a growing stream of income per share over time, with a secondary objective to seek to provide long-term capital appreciation, by investing under normal circumstances at least 80% of its assets in a diversified portfolio of income-producing investments, and will typically invest at least 50% of its assets in equity and equity-related securities. The Fund’s investments in equity and equity-related securities include common and preferred stock (and securities convertible into, or that PIMCO expects to be exchanged for, common or preferred stock), as well as securities issued by real estate investment trusts, master limited partnerships and other equity trusts and depositary receipts. |
| » | The Fund’s Institutional Class shares returned 17.23% after fees, and the Fund’s secondary benchmark index, a blend of 75% MSCI All Country World Index Net USD/25% Barclays Global Aggregate USD Unhedged Index, returned 18.95% during the reporting period. |
| » | During the reporting period, the Fund paid ordinary quarterly dividends of 44.8 cents per share and a one-time supplemental dividend of 1 cent per share on its Institutional Class shares. The dividend per share was slightly lower for the other share classes, to account for varying class specific expenses. The Fund’s net asset value increased by $1.52 per share (from $11.60 to $13.12) over the reporting period. |
| » | Security selection detracted from performance. The largest single detractor from relative performance was the Fund’s holding of Staples, the U.S. office supplies retailer. |
| » | The largest single contributor to relative performance was the Fund’s holding of Walgreens, the U.S.-based retail drugstore operator. |
| » | The Fund’s fixed income allocation performed positively, driven mainly by security selection within non-Agency mortgage-backed securities and high yield credit. |
| » | The Fund’s weight in cash detracted from relative performance during a period in which the Fund’s blended benchmark index returned 18.95%. |
| ANNUAL REPORT | JUNE 30, 2014 | 11 |
Table of Contents
Insights from the Portfolio Managers PIMCO EqS® Dividend Fund
Dear Shareholder,
We appreciate your investment in the PIMCO EqS® Dividend Fund (the “Fund”). In the following letter, please find a discussion of the recent market environment and a review of portfolio performance over the twelve-month reporting period ended June 30, 2014.
Market Overview
Despite initial uncertainty over the Federal Reserve’s (“Fed”) taper program (i.e., reduced asset purchases), equities rallied in the latter half of 2013 as Chairman Bernanke communicated that a highly-accommodative monetary policy would remain in place for the foreseeable future. When it was finally announced in December 2013, investors interpreted the taper program as a signal of an improving economy.
Among developed markets, economic reports in Europe continued to suggest the region was slowly exiting its recession. Emerging markets underperformed developed markets on concerns over a China slowdown and widening current account deficits in Turkey, South Africa, India, Indonesia and Brazil.
Despite geopolitical tensions between Russia and Ukraine, as well as concerns over potential oil supply disruptions in Iraq, U.S. equities outperformed developed markets countries in the first half of 2014. Following a disappointing first quarter GDP figure largely influenced by a harsh winter, second quarter data pointed to a more optimistic growth outlook. The Fed continued with its taper program, reducing bond purchases by $10 billion per month. In Europe, the European Central Bank’s plans for monetary easing to stimulate growth and combat deflation supported equity markets.
After five consecutive quarters of underperformance, emerging markets (“EM”) outpaced developed markets towards the end of the period, with the EM region led by India and Russia. In Asia, Chinese authorities continued to combat an economic slowdown by unveiling a series of “mini-stimulus” measures.
Global equity market performance was positive in each of the ten sectors of the MSCI All Country World Index Net USD. Performance was strongest in the information technology (“IT”), health care and energy sectors. Consumer staples, telecommunication services, and financials were the poorest performing sectors.
Fund Review
During the reporting period, the Fund paid ordinary quarterly dividends of 40.1 cents per share on its Institutional Class shares. The dividend per share was slightly lower for the other share classes, to account for varying class specific expenses. The Fund’s Institutional Class shares net asset value increased by $0.94 per share (from
$11.87 to $12.81) over the reporting period, representing a total return of 17.91% (net of fees).
On a relative basis, the Fund underperformed the MSCI All Country World Index Net USD, which returned 22.95%. Overweights in cyclically-oriented sectors, such as consumer discretionary and financials, presented headwinds, while the Fund’s holdings in the more defensive consumer staples sector outperformed. As the economy continues to improve, we believe that this relative performance should reverse.
At the security level, the Fund’s position in Walgreens, the U.S. retail drugstore operator, was the largest contributor to relative performance, driven by strong earnings and same-store and prescription sales. Walgreens also increased its quarterly dividend over the period, and its management team indicated that the recently acquired Alliance Boots division was performing in-line with expectations and was on track to meet first year synergy targets.
The largest detractor for the period was the Fund’s holding of Staples, the U.S. office supplies retailer. The company announced several strategy shifts, and lowered its expected results in the latter half of 2013, highlighting the secular challenges facing the company. Staples recently reported disappointing earnings, impacted by poor results across its business segments. We exited the position in June.
Investment Process and Portfolio Construction
Our bottom-up investment strategy is focused on seeking to provide attractive income today and long-term capital appreciation. Through fundamental research we aim to identify attractively priced companies exhibiting the ability and willingness to increase dividend payments. We then construct a portfolio that is diversified across three types of businesses:
| n | Consistent Earners: Blue-chip industry leaders that consistently create value year after year. |
| n | Basic Value: Traditional value companies, such as cyclicals, turnarounds, and companies with low valuations. |
| n | Emerging Franchises: Companies with the potential to grow significantly over time. |
Our total return focused approach means that we do not advocate selecting equity investments based on yield alone. Instead, we believe that an investment process that seeks out attractively valued income-generating opportunities is critical in an environment where certain sectors may be expensive relative to history. Additionally, we believe that dividend growth is a vital ingredient to investment success with benefits including excess returns over the index and an increasing yield on an investor’s original cost over time.
| 12 | PIMCO EQUITY SERIES |
Table of Contents
Conclusion
Over the reporting period, we reduced our allocation slightly to Consistent Earners that had appreciated in value during the market rally. We also increased our allocations to Basic Value companies and Emerging Franchises as the market volatility provided opportunities to initiate positions in certain compelling investments. At the sector level, we reduced our allocation to health care and materials and increased our allocation to consumer discretionary.
Going forward, we believe dividend-paying equities have the potential to be an attractive long-term investment solution, especially given a secular outlook for more modest returns across asset classes. With ten-year U.S. Treasury yields near historical lows, attractively-priced, less interest rate sensitive dividend growth stocks can be particularly beneficial going forward.
We thank you for your investment in the Fund.
Sincerely,
| ||
 | ||
Brad Kinkelaar Portfolio Manager | ||
Top 10 Holdings1
Target Corp. | 3.9% | |||||
Colony Financial, Inc. | 3.2% | |||||
Cisco Systems, Inc. | 3.0% | |||||
General Motors Co. | 3.0% | |||||
QUALCOMM, Inc. | 2.5% | |||||
KeyCorp | 2.5% | |||||
ProSafe SE | 2.4% | |||||
Imperial Tobacco Group PLC | 2.4% | |||||
Prudential Financial, Inc. | 2.2% | |||||
Kohl’s Corp. | 2.1% |
Geographic Breakdown1
United States | 54.1% | |||||
France | 6.4% | |||||
United Kingdom | 5.8% | |||||
Brazil | 4.0% | |||||
Spain | 3.0% | |||||
Netherlands | 2.9% | |||||
Cyprus | 2.4% | |||||
Bermuda | 2.1% | |||||
Switzerland | 2.0% | |||||
Germany | 1.9% | |||||
Japan | 1.7% | |||||
Taiwan | 1.7% | |||||
South Africa | 1.5% | |||||
China | 1.5% | |||||
Hong Kong | 1.5% | |||||
Other | 6.7% |
Sector Breakdown1
Financials | 23.4% | |||||
Consumer Discretionary | 16.7% | |||||
Energy | 11.0% | |||||
Information Technology | 10.7% | |||||
Industrials | 7.5% | |||||
Consumer Staples | 7.1% | |||||
Utilities | 6.1% | |||||
Health Care | 6.0% | |||||
Telecommunication Services | 5.6% | |||||
Real Estate Investment Trusts | 3.2% | |||||
Materials | 1.9% |
| 1 | % of Investments, at value as of 06/30/14. Top Holdings, Geographic and Sector Breakdown solely reflect long positions. Securities sold short, financial derivative instruments and short-term instruments are not taken into consideration. |
| ANNUAL REPORT | JUNE 30, 2014 | 13 |
Table of Contents
| Institutional Class - PQDIX | Class A - PQDAX | |
| Class P - PQDPX | Class C - PQDCX | |
| Class D - PQDDX | Class R - PQDRX |
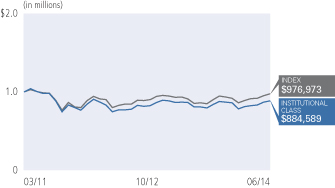
Cumulative Returns Through June 30, 2014

| Average Annual Total Return for the period ended June 30, 2014 | ||||||||||
1 Year | Fund Inception | |||||||||
| PIMCO EqS® Dividend Fund Institutional Class | 17.91% | 16.64% | |||||||
PIMCO EqS® Dividend Fund Class P | 17.84% | 16.58% | ||||||||
PIMCO EqS® Dividend Fund Class D | 17.57% | 16.28% | ||||||||
PIMCO EqS® Dividend Fund Class A | 17.56% | 16.32% | ||||||||
PIMCO EqS® Dividend Fund Class A (adjusted) | 11.09% | 13.76% | ||||||||
PIMCO EqS® Dividend Fund Class C | 16.69% | 15.37% | ||||||||
PIMCO EqS® Dividend Fund Class C (adjusted) | 15.69% | 15.37% | ||||||||
PIMCO EqS® Dividend Fund Class R | 17.29% | 16.02% | ||||||||
| MSCI All Country World Index Net USD± | 22.95% | 19.34% | |||||||
All Fund returns are net of fees and expenses.
± The MSCI All Country World Index Net USD is a free float-adjusted market capitalization weighted index that is designed to measure the equity market performance of developed and emerging markets. The Index consists of 45 country indices comprising 24 developed and 21 emerging market country indices. It is not possible to invest directly in an unmanaged index.
Performance quoted represents past performance. Past performance is not a guarantee or a reliable indicator of future results. Current performance may be lower or higher than performance shown. Investment return and the principal value of an investment will fluctuate. Shares may be worth more or less than original cost when redeemed. Returns shown do not reflect the deduction of taxes that a shareholder would pay on fund distributions or the redemption of fund shares. The adjusted returns take into account the maximum sales charge of 5.50% on Class A shares and 1.00% CDSC on Class C shares. The Fund’s total annual operating expense ratio as stated in the Fund’s current prospectus, as supplemented to date, is 1.18% for the Institutional Class shares, 1.28% for the Class P shares, 1.53% for the Class D shares, 1.53% for the Class A shares, 2.28% for the Class C shares and 1.78% for the Class R shares. Details regarding any Fund’s operating expenses can be found in the Fund’s prospectus. For performance current to the most recent month-end, visit www.pimco.com/investments.
Portfolio Insights
| » | The PIMCO EqS® Dividend Fund seeks to provide current income that exceeds the average yield on global stocks, and as a secondary objective, seeks to provide long-term capital appreciation, by investing under normal circumstances at least 75% of its assets in equity and equity-related securities, including common and preferred stock (and securities convertible into, or that PIMCO expects to be exchanged for, common or preferred stock), as well as securities issued by real estate investment trusts, master limited partnerships and other equity trusts and depositary receipts. |
| » | The Fund’s Institutional Class shares returned 17.91% after fees, and the Fund’s benchmark index, the MSCI All Country World Index Net USD, returned 22.95% during the reporting period. |
| » | During the reporting period, the Fund paid ordinary quarterly dividends of 40.1 cents per share and a one-time supplemental dividend of 7 cents per share on its Institutional Class shares. The dividend per share was slightly lower for the other share classes, to account for varying class specific expenses. The Fund’s net asset value increased by $0.94 per share (from $11.87 to $12.81) over the reporting period. |
| » | Security selection detracted from performance. The largest single detractor from relative performance was the Fund’s holding of Staples, the U.S. office supplies retailer. |
| » | The largest single contributor to relative performance was the Fund’s holding of Walgreens, the U.S.-based retail drugstore operator. |
| » | The Fund’s holdings in cash detracted from relative performance during a period in which the Fund’s benchmark index returned 22.95%. |
| 14 | PIMCO EQUITY SERIES |
Table of Contents
Insights from the Portfolio Managers PIMCO EqS® Emerging Markets Fund
Dear Shareholder,
We appreciate your investment in the PIMCO EqS® Emerging Markets Fund (the “Fund”). In the following letter, please find a discussion of the recent market environment and a review of portfolio performance.
Market Overview
Over the twelve-month reporting period, emerging market (“EM”) equities delivered strong returns, with the MSCI Emerging Markets Index returning 14.31%. However, the index still underperformed its developed market counterpart, the MSCI World Index, which was up 24.05% over the same period.
Continuing the pattern of recent years, markets were heavily influenced by central bank action, beginning in May 2013 with Ben Bernanke’s comments that the Federal Reserve would “taper” its bond purchases. This triggered an increase in the ten-year U.S. Treasury yield from 1.67% at the end of April to close to 3% in September. While this caused some pull-back in developed equities, the biggest impact was felt in emerging markets, where it sparked outflows and currency depreciation. Although emerging markets recovered in the second half of 2013, sentiment remained vulnerable, culminating in a sharp sell-off in January on further fears of rising U.S. interest rates and slowing Chinese growth. Since that point however, EM assets have rallied, aided by modest stimulus measures in China and a perception of U.S. interest rates staying “lower for longer.”
Although we remain cautious of some of the headwinds in the market, particularly slower trend growth and negative operating leverage in pockets of EM economies, we have become more optimistic on cyclical performance. Many countries with large current account deficits have taken steps to reduce imbalances. Technicals remain supportive, with flows beginning to turn positive in the past few months, and there are signs that the earnings cycle may at least be stabilizing. With inexpensive valuations and a secular story that in our view remains firmly intact–strong sovereign balance sheets, higher relative rates of economic growth, growing affluence and uncrowded positioning–we believe that the environment is increasingly supportive for EM investors.
Fund Review
Over the reporting period, the Fund’s Institutional Class shares returned 9.56% net of fees, versus a return of 14.31% for its benchmark, the MSCI Emerging Markets Index.
The beginning of the period was characterized by sharp volatility on the back of the Federal Reserve’s taper announcement, set against a longer term backdrop of declining EM profitability. Although we were mindful of cyclical pressures at the time, we were also confident in the
long-run growth potential of EM, particularly in areas benefiting from consumption growth. However, we were also conscious of the high valuations in many EM consumer sectors and we were beginning to see more opportunity in cyclical areas, such as energy and materials. Consequently, our portfolio was tilted towards growth companies, which we felt had long-term earnings potential, but the Fund also had sizeable positions in tactical value companies with more cyclical characteristics.
Within both areas, we continued to focus on high quality companies, which we define as having high profitability as measured by return on equity (“ROE”) or other equivalents, at attractive valuations. In our view, the market persistently underprices the sustainability of the returns of these businesses.
Over the long-run, we believe that our focus on investing in high profitability businesses will enable us to outperform over the broad emerging markets index. However, over the past twelve months, the Fund lagged its benchmark for a number of reasons.
First, our exposure to growth stocks tied to the Chinese consumer detracted from performance as slower economic growth impacted consumer purchases and the Chinese government’s anti-corruption measures restricted luxury spending. This meant that two of our largest detractors were Kweichou Moutai, a Chinese high-end liquor company, and Prada, a luxury goods company. We believed that the premium brands of both companies would allow them to sustain margins even through a cyclical downturn. Kweichou Moutai in particular represents compelling value given high barriers to market entry, single digit P/E and high levels of return on invested capital. We have used market weakness to add to our position.
Second, slowing Chinese demand also impacted positions in the materials sector, where Iluka Resources, an Australian mining company, was weighed down by exposure to the Chinese property market. We are beginning to see positive signs of stabilization in the market for the firm’s mineral products, and believe that this, together with the oligopolistic structure of the industry, will support a recovery in the share price.
Finally, although we were positioned with a growth tilt in the portfolio, our focus on high profitability at reasonable valuation meant that we lacked exposure to some of the highest growth names in the technology sector. In particular, we avoided Tencent Holdings, a Chinese internet company, as we believed that valuations were unwarranted. Unfortunately these stocks continued to perform well over the period, and given Tencent’s large weight in the MSCI Emerging Markets Index, our avoidance of the stock, as well as a general underweight to technology, was one of the principal detractors.
| ANNUAL REPORT | JUNE 30, 2014 | 15 |
Table of Contents
Insights from the Portfolio Managers PIMCO EqS® Emerging Markets Fund (Cont.)
On the positive side, more cyclical areas where we identified value at the beginning of the period, performed well. Bashneft, an integrated oil and gas producer in Russia, was the top contributor to Fund performance, as the company delivered strong results and continued with its policy of paying out a generous yet sustainable dividend. Holdings in Indian bank, Axis, and car company, Tata Motors, also delivered strong performance, as the prospects for the Indian economy improved on the back of the appointment of a new central bank governor and the election of a new government.
Conclusion
Mid-way through 2014, we remain conscious of headwinds of lower trend global growth, but see positive signs of healing in a number of large EM economies. In particular, pro-market electoral changes in India, Indonesia and potentially in Brazil could bring much needed policy momentum to help those economies attain higher rates of growth. With secular growth trends intact, and with PIMCO forecasting The New Neutral of sustained low interest rates, we think the environment for EM equity remains supportive.
Although the Fund’s performance lagged its benchmark index over the last twelve months, we have seen positive recovery in the second quarter of 2014. We take a long-term approach to investing and evaluate companies over a three- to five-year time horizon, which we believe is most representative of a full market cycle. Over this extended period, we believe that our focus on high profitability businesses should allow us to outperform.
The portfolio remains positioned across growth and value businesses, with high exposure to consumer companies likely to benefit from long-term consumption growth, but also with positions in high quality cyclically-driven businesses. We continue to adopt an unconstrained approach and look for the best opportunities for accessing EM exposure globally, whether through EM domiciled companies or developed market companies with high EM exposure.
We thank you for your continued investment in the Fund and look forward to serving your investment needs.
Sincerely,
Maria (Masha) Gordon Portfolio Manager |

Top 10 Holdings1
Samsung Electronics Co. Ltd. | 4.9% | |||||
Taiwan Semiconductor Manufacturing Co. Ltd. | 4.5% | |||||
AMBEV S.A.—ADR | 3.6% | |||||
AIA Group Ltd. | 3.3% | |||||
Kia Motors Corp. | 3.2% | |||||
Cia Brasileira de Distribuicao Grupo Pao de Acucar | 2.9% | |||||
Marine Harvest ASA | 2.7% | |||||
Hon Hai Precision Industry Co. Ltd. | 2.6% | |||||
Itau Unibanco Holding S.A.—ADR | 2.6% | |||||
MediaTek, Inc. | 2.5% |
Geographic Breakdown1
Brazil | 16.7% | |||||
Taiwan | 11.4% | |||||
China | 9.9% | |||||
India | 8.4% | |||||
South Korea | 8.1% | |||||
Hong Kong | 5.2% | |||||
Japan | 4.0% | |||||
United Kingdom | 3.9% | |||||
Peru | 3.8% | |||||
Cyprus | 3.2% | |||||
Norway | 2.7% | |||||
Indonesia | 2.5% | |||||
Israel | 2.3% | |||||
Cambodia | 2.2% |
| 16 | PIMCO EQUITY SERIES |
Table of Contents
Geographic Breakdown1 (Cont.)
Mexico | 2.2% | |||||
Poland | 1.9% | |||||
Greece | 1.9% | |||||
Russia | 1.7% | |||||
Macau | 1.7% | |||||
Australia | 1.6% | |||||
Other | 3.9% |
Sector Breakdown1
Financials | 27.4% | |||||
Information Technology | 18.7% | |||||
Consumer Discretionary | 16.1% | |||||
Consumer Staples | 13.2% | |||||
Industrials | 8.2% | |||||
Materials | 7.1% | |||||
Energy | 6.2% | |||||
Telecommunication Services | 1.7% | |||||
Other | 0.6% |
| 1 | % of Investments, at value as of 06/30/14. Top Holdings, Geographic and Sector Breakdown solely reflect long positions. Securities sold short, financial derivative instruments and short-term instruments are not taken into consideration. |
| ANNUAL REPORT | JUNE 30, 2014 | 17 |
Table of Contents
PIMCO EqS® Emerging Markets Fund
| Institutional Class - PEQWX | Class A - PEQAX | |
| Class P - PEQQX | Class C - PEQEX | |
| Administrative Class - PEQTX | Class R - PEQHX | |
| Class D - PEQDX |
Cumulative Returns Through June 30, 2014
| Average Annual Total Return for the period ended June 30, 2014 | ||||||||||
| 1 Year | Fund Inception (03/22/11) | |||||||||
| PIMCO EqS® Emerging Markets Fund Institutional Class | 9.56% | -2.60% | |||||||
| PIMCO EqS® Emerging Markets Fund Class P | 9.47% | -2.69% | ||||||||
| PIMCO EqS® Emerging Markets Fund Administrative Class | 9.36% | -2.86% | ||||||||
| PIMCO EqS® Emerging Markets Fund Class D | 9.15% | -2.97% | ||||||||
| PIMCO EqS® Emerging Markets Fund Class A | 9.27% | -2.98% | ||||||||
| PIMCO EqS® Emerging Markets Fund Class A (adjusted) | 3.23% | -4.64% | ||||||||
| PIMCO EqS® Emerging Markets Fund Class C | 8.38% | -3.65% | ||||||||
| PIMCO EqS® Emerging Markets Fund Class C (adjusted) | 7.38% | -3.65% | ||||||||
| PIMCO EqS® Emerging Markets Fund Class R | 8.91% | -3.18% | ||||||||
| MSCI Emerging Markets Index (Net Dividends in USD)± | 14.31% | 0.66% | |||||||
All Fund returns are net of fees and expenses.
± The MSCI Emerging Markets Index (Net Dividends in USD) is a free float-adjusted market capitalization index that is designed to measure equity market performance of emerging markets. It is not possible to invest directly in an unmanaged index.
Performance quoted represents past performance. Past performance is not a guarantee or a reliable indicator of future results. Current performance may be lower or higher than performance shown. Investment return and the principal value of an investment will fluctuate. Shares may be worth more or less than original cost when redeemed. Returns shown do not reflect the deduction of taxes that a shareholder would pay on fund distributions or the redemption of fund shares. The adjusted returns take into account the maximum sales charge of 5.50% on Class A shares and 1.00% CDSC on Class C shares. The Fund’s total annual operating expense ratio as stated in the Fund’s current prospectus, as supplemented to date, is 1.45% for the Institutional Class shares, 1.55% for the Class P shares, 1.70% for the Administrative Class shares, 1.80% for the Class D shares, 1.80% for the Class A shares, 2.55% for the Class C shares and 2.05% for the Class R shares. Details regarding any Fund’s operating expenses can be found in the Fund’s prospectus. For performance current to the most recent month-end, visit www.pimco.com/investments.
Portfolio Insights
| » | The PIMCO EqS® Emerging Markets Fund seeks capital appreciation by investing under normal circumstances at least 80% of its assets in a diversified portfolio of investments economically tied to emerging market countries. The Fund will invest a substantial portion of its assets in equity and equity-related securities, including common and preferred stock (and securities convertible into, or that PIMCO expects to be exchanged for, common or preferred stock). The Fund may also invest in fixed income securities, including debt securities issued by both corporate and government issuers. The Fund may invest in commodity related instruments, including exchange-traded funds, futures and other investment companies. The Fund may also invest in derivative instruments, such as options, futures contracts or swap agreements. |
| » | The Fund’s Institutional Class shares returned 9.56% after fees, and the Fund’s benchmark index, the MSCI Emerging Markets Index, returned 14.31% during the reporting period. |
| » | From a sector perspective, stock selection in the materials sector detracted from relative performance over the reporting period, particularly due to exposure in Iluka Resources in Australia and Cementos Pacasmayo in Peru as these positions underperformed. |
| » | An underweight to the information technology sector, mainly in China and Korea, detracted from performance as the sector outperformed. |
| » | Stock selection within the energy and financials sectors contributed to performance. An overweight to Russian energy positions, led by the Fund’s position in Bashneft, contributed to performance as the sector outperformed. |
| » | An overweight to Brazilian financials, particularly the Fund’s holdings of BB Seguridade Participacoes and Cetip, contributed to performance as the sector outperformed. |
| » | Stock selection within China and Korea detracted from performance, while stock selection within Brazil and Russia contributed to performance. |
| » | Positive cash holdings detracted from performance as the Fund’s benchmark index posted positive returns. |
| 18 | PIMCO EQUITY SERIES |
Table of Contents
Insights from the Portfolio Managers PIMCO EqS® Long/Short Fund
Dear Shareholder,
We appreciate your investment in the PIMCO EqS® Long Short Fund (the “Fund”). In the following letter, please find a discussion of the recent market environment and a review of recent portfolio performance.
Market Overview
U.S. equities rallied strongly over the twelve-month reporting period ended June 30, 2014. The equity rally was largely driven by continued central bank actions on behalf of the Federal Reserve (“Fed”), the European Central Bank (“ECB”) and the Bank of Japan. In January 2014, the Fed began to taper its bond purchase program by $10 billion a month. U.S. markets largely shrugged off concerns of tighter monetary policy as they reached new all-time highs through June 2014, before retreating slightly near the end of the month. This growth was driven by improving economic conditions, and valuations perceived as fair, if no longer cheap.
Although the growth was consistent over the period, markets experienced a slight pull-back in January 2014 as investors reacted to concerns over emerging market growth, lower than expected manufacturing numbers out of China, as well as mixed economic data out of the U.S. Investor sentiment was also tested by geopolitical tensions arising in Russia and the Middle East. Recent economic data in the U.S. has shown signs of improvement as employment and payroll numbers continue to be positive. Although risks remain, slow growth, as opposed to crisis, appears to be the consensus view.
Fund Review
Over the reporting period, the Fund’s Institutional Class shares returned 13.59% net of fees, outperforming its benchmark, 3-Month LIBOR, by 13.34% on an after fees basis.
The Fund’s position in DST Systems was the top contributor to performance. Shares of the mini-conglomerate advanced as the company continued to monetize their non-core assets, increasing cash flow. DST reported strong earnings during the latter half of 2013 and continued its advance well into the first quarter of 2014. The other significant area of contribution was the Fund’s stock selection within the health care industry, where we found opportunities in steady growth healthcare stocks which represent businesses that can perform well in a slower growth environment. These healthcare stocks include Walgreen Co. and DaVita HealthCare Partners Inc. We believe these companies may experience a continued tailwind from the roll-out of the Affordable Care Act, as well as a more secular tailwind resulting from the aging population.
The Fund’s investment in Micron Technology, Inc. and SK Hynix Inc. was consistent with the theme of semiconductor industry consolidation in 2013 creating a tightened supply/demand balance and a newfound discipline for digital random access memory (“DRAM”) pricing. Micron Technology reported consistently strong earnings over the past three quarters as customers began moving away from spot purchases of DRAM and began signing long-term purchasing contracts in order to lock in current prices. We continue to have conviction in these names as it is our opinion that the industry consolidation, rising demand for non-PC markets, as well as improving memory prices will drive profitability for Micron and Hynix. Although we have reduced these positions given their price appreciation, these names remain amongst our top holdings.
These positive results were offset by the Fund’s position in Walter Investment Management, which detracted from returns. Our original thesis on Walter Investment Management was that the company had attractive growth prospects due to changing subprime mortgage servicing rights (“MSR”) dynamics, along with an attractive valuation relative to peers. Due to several new entrants into the MSR market, as well as increased competition for assets within this space, our thesis changed, and subsequently, we decided to close this position. Since exiting the position, regulatory actions have taken place causing the sector’s (Walter Management and its peers) multiples to contract. The shares have yet to recover as investors remain skeptical of MSR business models going forward, in our view.
In addition, our short positions detracted from performance in aggregate due to the strong equity market rally. Our approach to shorting is to generate alpha as opposed to simply hedging market risk. We believe that stock market exposure represents an important expected driver of long-term capital appreciation for many investors. However, equity markets do not always deliver positive returns and often are characterized by periods of high volatility. Consequently, we believe investors can benefit from a strategy that seeks to provide exposure to the long-term growth benefits of owning stocks, while allowing for better downside risk mitigation. To help meet these needs, the Fund aims to provide a positive return with lower volatility than the equity market over the long term. Although the Fund does not explicitly aim to manage short-term volatility, it has greater ability than many traditional long-only strategies to manage downside risk, which provides the opportunity for strong risk-adjusted returns over a full market cycle.
Conclusion
Mid-way through 2014, equity market performance has been strong despite various geopolitical and economic concerns. As U.S. economic growth continues to improve, albeit slowly, we believe that The New
| ANNUAL REPORT | JUNE 30, 2014 | 19 |
Table of Contents
Insights from the Portfolio Managers PIMCO EqS® Long/Short Fund (Cont.)
Neutral low rate environment will be supportive for stocks as companies can take advantage of inexpensive financing. Access to cheap financing is particularly helpful to companies with attractive prospects in a slow growth world. In this low real rate environment, current valuation levels suggest equities are poised to deliver more modest returns, but still attractive relative to other asset classes.
Again, we thank you for your continued investment in the Fund and look forward to serving your investment needs.
Sincerely,


Geoffrey Johnson, CFA
Portfolio Manager
Top 10 Holdings1
American Realty Capital Properties, Inc. | 9.3% | |||||
Micron Technology, Inc. | 5.7% | |||||
SK Hynix, Inc. | 5.2% | |||||
DST Systems, Inc. | 5.0% | |||||
Comcast Corp. ‘A’ | 4.8% | |||||
Monsanto Co. | 4.5% | |||||
DaVita HealthCare Partners, Inc. | 3.9% | |||||
Walgreen Co. | 3.6% | |||||
Valeant Pharmaceuticals International, Inc. | 2.7% | |||||
Foot Locker, Inc. | 2.7% |
Sector Breakdown2
Information Technology | 15.1% | |||||
Consumer Discretionary | 10.1% | |||||
Financials | 9.3% | |||||
Health Care | 9.3% | |||||
Materials | 5.8% | |||||
Consumer Staples | 3.9% | |||||
Industrials | 3.7% | |||||
Other | 0.7% |
| 1 | % of Investments, at value as of 06/30/14. Top Holdings solely reflect long positions. Securities sold short, financial derivative instruments and short-term instruments are not taken into consideration. |
| 2 | % of net exposure (Total Investments less Securities Sold Short) as of 06/30/2014. Financial derivative instruments and short-term instruments are not taken into consideration. |
| 20 | PIMCO EQUITY SERIES |
Table of Contents
| Institutional Class - PMHIX | Class A - PMHAX | |
| Class P - PMHBX | Class C - PMHCX | |
| Class D - PMHDX |
Cumulative Returns Through June 30, 2014
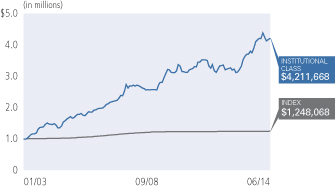
| Average Annual Total Return for the period ended June 30, 2014* | ||||||||||||||||||
| 1 Year | 5 Year | 10 Year | Fund Inception (01/01/03) | |||||||||||||||
| PIMCO EqS® Long/Short Fund Institutional Class | 13.59% | 8.45% | 10.95% | 13.45% | |||||||||||||
| PIMCO EqS® Long/Short Fund Class P | 13.40% | 8.36% | 10.85% | 13.34% | ||||||||||||||
| PIMCO EqS® Long/Short Fund Class D | 13.13% | 8.06% | 10.56% | 13.05% | ||||||||||||||
| PIMCO EqS® Long/Short Fund Class A | 13.17% | 8.06% | 10.56% | 13.05% | ||||||||||||||
| PIMCO EqS® Long/Short Fund Class A (adjusted) | 6.97% | 6.85% | 9.94% | 12.49% | ||||||||||||||
| PIMCO EqS® Long/Short Fund Class C | 12.26% | 7.25% | 9.73% | 12.20% | ||||||||||||||
| PIMCO EqS® Long/Short Fund Class C (adjusted) | 11.26% | 7.25% | 9.73% | 12.20% | ||||||||||||||
| 3 Month USD LIBOR Index± | 0.25% | 0.35% | 2.07% | 1.96% | |||||||||||||
All Fund returns are net of fees and expenses.
± The 3 Month USD LIBOR (London Interbank Offered Rate) Index is an average interest rate, determined by the British Bankers Association, that banks charge one another for the use of short-term money (3 months) in England’s Eurodollar market. It is not possible to invest directly in an unmanaged index.
Performance quoted represents past performance. Past performance is not a guarantee or a reliable indicator of future results. Current performance may be lower or higher than performance shown. Investment return and the principal value of an investment will fluctuate. Shares may be worth more or less than original cost when redeemed. Returns shown do not reflect the deduction of taxes that a shareholder would pay on fund distributions or the redemption of fund shares. The adjusted returns take into account the maximum sales charge of 5.50% on Class A shares and 1.00% CDSC on Class C shares. The Fund’s total annual operating expense ratio as stated in the Fund’s current prospectus, as supplemented to date, is 2.74% for the Institutional Class shares, 2.84% for the Class P shares, 3.09% for the Class D shares, 3.09% for the Class A shares, and 3.84% for the Class C shares. Details regarding any Fund’s operating expenses can be found in the Fund’s prospectus. For performance current to the most recent month-end, visit www.pimco.com/investments.
* For periods prior to April 20, 2012, the Fund’s performance reflects the performance when the Fund was a partnership, net of actual fees and expenses charged to individual partnership accounts in the aggregate. If the performance had been restated to reflect the applicable fees and expenses of each share class, the performance may have been higher or lower. The Fund began operations as a partnership on January 1, 2003 and, on April 20, 2012, was reorganized into a newly-formed fund that was registered as an investment company under the Investment Company Act of 1940. Prior to the reorganization, the Fund had an investment objective, investment strategies, investment guidelines, and restrictions that were substantially similar to those currently applicable to the Fund; however, the Fund was not registered as an investment company under the Investment Company Act of 1940 and was not subject to its requirements or requirements imposed by the Internal Revenue Code of 1986 which, if applicable, may have adversely affected its performance. The performance of Class P, D, A and C shares for the period from April 20, 2012 to April 30, 2012 is based on the performance of the Institutional Class shares of the Fund. The performance of each class of shares will differ as a result of the different levels of fees and expenses applicable to each class of shares.
Portfolio Insights
| » | The PIMCO EqS® Long/Short Fund seeks long-term capital appreciation by investing under normal circumstances in long and short positions of equity and equity-related securities, including common and preferred stock (and securities convertible into, or that PIMCO expects to be exchanged for, common or preferred stock), utilizing a fundamental investing style that integrates bottom-up and top-down research. The Fund will normally invest a substantial portion of its assets in equity and equity-related securities. The Fund may also invest in fixed income securities of varying maturities, cash and cash equivalents. |
| » | The Fund’s Institutional Class shares returned 13.59% after fees, and the Fund’s benchmark index, 3-Month USD LIBOR Index, returned 0.25% during the reporting period. |
| » | The Fund’s long equity positions contributed to absolute returns as prices on these securities generally rose during the reporting period. |
| » | The Fund’s short equity positions detracted from performance (in aggregate) as the overall equity markets rose during the reporting period. |
| » | Over the reporting period, the Fund decreased its short equity positions to 5% and ended the reporting period at 65% net long, raising the overall net equity exposure to 60% of net assets. |
| » | The Fund’s cash position detracted from performance. |
| ANNUAL REPORT | JUNE 30, 2014 | 21 |
Table of Contents
Insights from the Portfolio Managers PIMCO Emerging Multi-Asset Fund
Dear Shareholder,
We appreciate your investment in the PIMCO Emerging Multi-Asset Fund (the “Fund”). Below is our annual update that includes a discussion of our investment outlook with a focus on emerging markets (“EM”) as well as an update on the portfolio over the twelve-month reporting period ended June 30, 2014.
Market Overview and Fund Positioning
Emerging market (“EM”) assets have largely recovered from a challenging 2013 with a sustained rebound during the first half of 2014. During the first half of the reporting period, speculation regarding the beginning of the Federal Reserve’s (“Fed”) tapering of its asset purchase program drove volatility across EM assets as investors assessed the implications that reduced stimulus and liquidity would have on the global economy. While tapering has started, dovish sentiment from developed market central banks has quelled concerns and market volatility. Since the end of January 2014, EM assets have rebounded as fundamentals remained largely intact (with several central banks proactively adjusting policies to address imbalances), as investors sought the higher yields of EM in an environment of low volatility, and as valuations remained attractive relative to comparable asset classes. Additional tailwinds for EM during the reporting period included perceived de-escalating geopolitical tensions, generally market-friendly election outcomes, and signs of economic stabilization in China.
EM equities, as represented by the MSCI Emerging Markets Index, returned 14.31% over the twelve-month reporting period, but lagged their developed market counterpart, as measured by the MSCI World Index, by nearly 10%. While talk of tapering caused some pull back in developed equities, the biggest impact was felt in emerging markets, where it sparked outflows and currency depreciation. Equity returns stabilized in the second half of the period amid the broader EM rally. Within the Fund, we are overweight EM equities, as we believe the asset class, relative to other portions of the capital structure, may disproportionately benefit from increased global growth. In our view, valuations remain attractive (particularly compared to developed markets) and flows and earnings have stabilized.
EM external debt, as represented by the JPMorgan Emerging Markets Bond Index (EMBI) Global, returned 11.05% over the twelve-month reporting period. Tightening index spreads, particularly over the second half of the reporting period, bolstered performance. Index spreads narrowed from 353 basis points over U.S. Treasuries at the start of the period to 285 basis points at the end of the period. As it relates to the Fund, we maintain an underweight position to EM spread duration. We prefer higher yielding quasi-sovereign and EM corporate credits for sovereign issues in fundamentally stronger
countries. Separately, we have kept our broad tactical allocation to the EM corporate debt asset class.
EM local debt, as measured by the JPMorgan Government Bond Index-Emerging Markets Global Diversified Index (Unhedged), returned 3.91% during the reporting period. Renewed interest in carry (or incremental income) as a source of return and a duration rally in the latter portion of the reporting period helped to propel gains. EM currencies, in aggregate, weakened over the period and detracted from total returns. We are neutral local duration with a select number of sizable overweights offset by underweights to most other countries; we continue to favor countries with high nominal rates, positive real rates, or those which serve as higher-quality regional proxies. The Fund is neutral EM currencies in aggregate, preferring higher-carry currencies in countries with strong fundamentals and flexibility to withstand market shocks.
Emerging Markets Outlook
As global liquidity and stimulus are gradually withdrawn, we expect country and corporate differentiation to drive emerging markets performance as investors become more discriminating in assessing fundamental strengths and inherent vulnerabilities. Differentiation is likely given the variation in initial conditions related to issuer balance sheet strength, growth and inflation trajectories, the flexibility of fiscal and monetary policies, and political and social risks.
Central banks across the emerging markets have recently sought to adjust external imbalances while enhancing firepower to combat future shocks. Further, a busy political season has thus far yielded generally market-friendly results, allowing governments to re-focus on passing necessary structural reforms. Market technicals have also improved as retail investors have returned to EM in recent months. We believe valuations across EM assets remain attractive historically compared to developed market (“DM”) alternatives.
While we are constructive on EM assets, certain risks bear watching. In the near-term, volatility may return given the increased correlation of EM bonds to DM central bank actions. Geopolitical risk may continue featuring in headlines, particularly in Ukraine and Iraq. Finally, events in China remain important given the Chinese economy’s considerable footprint and its effect on commodity-exporting countries throughout EM. Nonetheless, we do not expect growth in China to slow to the point where it becomes a drag on the global economy.
In summary, we remain optimistic on the secular outlook for emerging market assets given improvements in initial conditions and fundamentals relative to developed market alternatives. We believe our experienced and expansive team and holistic investment process
| 22 | PIMCO EQUITY SERIES |
Table of Contents
should thrive in an environment of increased country and corporate differentiation while maintaining the discipline required to capitalize on market dislocations.
We thank you once again for your investment in the Fund.
Sincerely,
 |  | |
 |  | |
| Michael Gomez | Maria (Masha) Gordon | |
| Portfolio Manager, Emerging Markets Debt | Portfolio Manager, Emerging Markets Equities | |
 | ||
 | ||
| Curtis Mewbourne | ||
| Portfolio Manager, Generalist | ||
Top Holdings1
PIMCO EqS® Emerging Markets Fund | 51.5% | |||||
PIMCO Emerging Local Bond Fund | 24.5% | |||||
PIMCO Emerging Markets Bond Fund | 14.1% | |||||
PIMCO Emerging Markets Corporate Bond Fund | 6.8% |
| 1 | % of Investments, at value as of 06/30/14. Top Holdings solely reflect long positions. Securities sold short, financial derivative instruments and short-term instruments are not taken into consideration. |
| ANNUAL REPORT | JUNE 30, 2014 | 23 |
Table of Contents
PIMCO Emerging Multi-Asset Fund
| Institutional Class - PEAWX | Class A - PEAAX | |
| Class P - PEAQX | Class C - PEACX | |
| Administrative Class - PEAMX | Class R - PEARX | |
| Class D - PEAEX |
Cumulative Returns Through June 30, 2014
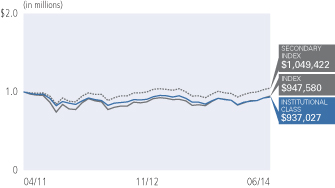
| Average Annual Total Return for the period ended June 30, 2014 | ||||||||||
| 1 Year | Fund Inception (04/12/11) | |||||||||
| PIMCO Emerging Multi-Asset Fund Institutional Class | 7.73% | -1.31% | |||||||
| PIMCO Emerging Multi-Asset Fund Class P | 7.61% | -1.41% | ||||||||
| PIMCO Emerging Multi-Asset Fund Administrative Class | 7.31% | -1.61% | ||||||||
| PIMCO Emerging Multi-Asset Fund Class D | 7.46% | -1.63% | ||||||||
| PIMCO Emerging Multi-Asset Fund Class A | 7.49% | -1.64% | ||||||||
| PIMCO Emerging Multi-Asset Fund Class A (adjusted) | 1.58% | -3.36% | ||||||||
| PIMCO Emerging Multi-Asset Fund Class C | 6.56% | -2.35% | ||||||||
| PIMCO Emerging Multi-Asset Fund Class C (adjusted) | 5.56% | -2.35% | ||||||||
| PIMCO Emerging Multi-Asset Fund Class R | 7.17% | -1.87% | ||||||||
| MSCI Emerging Markets Index (Net Dividends in USD)± | 14.31% | -0.92% | |||||||
| 50% MSCI Emerging Markets Index (Net Dividends in USD), 25% JPMorgan Emerging Markets Bond Index (EMBI) Global, 25% JPMorgan Government Bond Index-Emerging Markets Global Diversified Index (Unhedged)±± | 10.89% | 2.17% | |||||||
All Fund returns are net of fees and expenses.
± The MSCI Emerging Markets Index (Net Dividends in USD) is a free float-adjusted market capitalization index that is designed to measure equity market performance of emerging markets. It is not possible to invest directly in the index.
±± The benchmark is a blend of 50% MSCI Emerging Markets Index (Net Dividends in USD), 25% JPMorgan Emerging Markets Bond Index (EMBI) Global, 25% JPMorgan Government Bond Index-Emerging Markets Global Diversified Index (Unhedged) . MSCI Emerging Markets Index is a free float-adjusted market capitalization index that is designed to measure equity market performance of emerging markets. JPMorgan Emerging Markets Bond Index (EMBI) Global tracks total returns for United States Dollar denominated debt instruments issued by emerging market sovereign and quasi-sovereign entities: Brady bonds, loans, Eurobonds and local market instruments. JPMorgan Government Bond Index-Emerging Markets Global Diversified Index (Unhedged) is a comprehensive global local emerging markets index, and consists of regularly traded, liquid fixed-rate, domestic currency government bonds to which international investors can gain exposure. It is not possible to invest directly in an unmanaged index.
Performance quoted represents past performance. Past performance is not a guarantee or a reliable indicator of future results. Current performance may be lower or higher than performance shown. Investment return and the principal value of an investment will fluctuate. Shares may be worth more or less than original cost when redeemed. Returns shown do not reflect the deduction of taxes that a shareholder would pay on fund distributions or the redemption of fund shares. The adjusted returns take into account the maximum sales charge of 5.50% on Class A shares and 1.00% CDSC on Class C shares. The Fund’s total annual operating expense ratio as stated in the Fund’s current prospectus, as supplemented to date, is 2.36% for the Institutional Class shares, 2.46% for the Class P shares, 2.61% for the Administrative Class shares, 2.71% for the Class D shares, 2.71% for the Class A shares, 3.46% for the Class C shares and 2.96% for the Class R shares. Details regarding any Fund’s operating expenses can be found in the Fund’s prospectus. For performance current to the most recent month-end, visit www.pimco.com/investments.
Portfolio Insights
| » | The PIMCO Emerging Multi-Asset Fund seeks maximum total return, consistent with prudent investment management, by investing under normal circumstances at least 80% of its assets in investments economically tied to emerging market countries. The Fund will typically invest 20% to 80% of its total assets in equity-related instruments (including investments in common stock, preferred stock, and equity-related Underlying PIMCO Funds or Acquired Funds). The Fund is designed to provide concurrent exposure to a broad spectrum of emerging market asset classes, such as equity, fixed income and currencies, and other investments, including commodities. |
| » | The Fund’s Institutional Class shares returned 7.73% after fees, while the Fund’s primary benchmark index (MSCI Emerging Markets Index) returned 14.31%, and the Fund’s secondary benchmark index (a blended index consisting of 50% MSCI Emerging Markets Index/25% JPMorgan Government Bond Index-Emerging Markets (GBI-EM) Global Diversified Index (Unhedged)/25% JPMorgan Emerging Markets Bond Index (EMBI) Global) returned 10.89% during the reporting period. |
| » | Exposure to the PIMCO EqS® Emerging Markets Fund detracted from relative performance as this Underlying PIMCO Fund underperformed its respective primary benchmark, the MSCI Emerging Markets Index, over the reporting period. |
| » | An underweight to external EM debt via the PIMCO Emerging Markets Bond Fund, which is benchmarked to the JPMorgan Emerging Markets Bond Index (EMBI) Global, detracted from relative performance as the JPMorgan EMBI Global outperformed the Fund’s secondary benchmark index during the reporting period. |
| » | Exposure to the PIMCO Emerging Local Bond Fund contributed to relative performance as this Underlying PIMCO Fund outperformed its respective primary benchmark, the JPMorgan Government Bond Index-Emerging Markets (GBI-EM) Global Diversified Index (Unhedged), over the reporting period. |
| » | Exposure to EM equities via the PIMCO EqS® Emerging Markets Fund, contributed to absolute performance as this Underlying PIMCO Fund posted positive returns over the reporting period. |
| 24 | PIMCO EQUITY SERIES |
Table of Contents
Insights from the Portfolio Managers PIMCO EqS Pathfinder Fund®
Dear Shareholder,
It is a pleasure to be speaking with you as we finish the second-half of 2014 and the past year. On behalf of the Pathfinder team, I thank you for your investment in the PIMCO EqS® Pathfinder Fund (the “Fund). Our commitment continues to be to seek an attractive absolute return that beats the market over a full market cycle and to do so with less volatility than the overall market. We have organized our thoughts below to provide you with a review of the equity markets over the past year, the Fund itself, and our outlook for the second half of 2014.
The Last Year in Review
Global equity markets performed well over the twelve-month reporting period ended June 30, 2014, as measured by the MSCI World Index, which returned 24.05%. Returns from the largest developed market regions of the world, the U.S. and Europe, almost identically matched that of the MSCI World Index; however, the return from Japan was roughly half that of the MSCI World Index. Over the reporting period, the Fund’s Institutional Class shares returned 24.62%, which was slightly ahead of the MSCI World Index.
U.S. markets largely shrugged off concerns about tighter monetary policy, with the S&P 500 Index returning 24.61%, driven by improving U.S. economic conditions, and valuations perceived as fair, if no longer cheap. Attractive valuations and the prospect of modest economic improvement also helped European equities which posted positive returns. Japanese markets, however, had a more volatile ride, with the NIKKEI 225 rallying in 2013, but declining over 7% in 2014 as investors questioned the sustainability of Abenomics and whether the “third arrow” of structural reforms could be enacted.
Continuing the pattern of recent years, equity market performance was heavily influenced by central bank action, beginning in May 2013 with Ben Bernanke’s comments that the Federal Reserve would “taper” its bond purchases. This triggered an increase in the ten-year U.S. Treasury yield from 1.67% at the end of April 2013 to 3% in September 2013. While this caused some pull-back in developed equity markets, sentiment nevertheless recovered towards the end of 2013. As central banks signaled their commitment to hold rates low for an extended period and political and structural reforms were perceived positively by investors, interest rates declined again in the first half of 2014. With the ten-year U.S. Treasury yield ending at 2.53% at June 30, 2014, global developed equity markets continued their march higher and the major market indexes posting positive returns.
Pathfinder Fund
The Fund ended the calendar year 2013 almost fully invested with a diversified portfolio of undervalued equities, along with a few merger arbitrage and special situation investments. However, in early 2014, a
number of our undervalued equities began to approach our targets of intrinsic value and we began to exit those positions. Among the positions we exited were Intel, 3M, Nestle, Deere, Suez and Veolia Environnement, White Mountains Insurance Group, and General Dynamics. At the same time, we also found attractive investments in marine liquefied petroleum gas carrier operators, BW LPG and Avance Gas, cleaning services company, Spotless Group, Japanese cosmetics firm, Shiseido, and a number of merger arbitrage situations. Some of our notable performers in the portfolio over the past year were Marine Harvest, Lorillard, and Logitech International.
Marine Harvest, the world’s largest salmon farmer with an estimated market share in excess of 20%, is a good example of a long-held position which we believed was being overlooked by investors. Salmon prices recovered strongly in 2013 due to low supply, and today, with limited supply growth this year and into 2015, we continue to have a strong outlook for salmon prices. Improving salmon prices also enabled the company to announce earnings which were considerably above the consensus analyst estimate.
Shares of Lorillard, the third-largest seller of cigarettes in the U.S., jumped this spring on speculation that Reynolds American Inc. might bid for the company. The combination of the two firms could potentially create the second largest cigarette producer, which would then be able to more effectively compete with its largest U.S. competitor, Altria, in our view. Although a merger between the two companies would be subject to Federal Trade Commission (“FTC”) scrutiny, shrinking industry sales and likely asset disposals to appease regulators might help to secure FTC approval, in our view.
Logitech sells computer peripheral products such as computer mice, keyboards, audio and gaming devices. With 70% of its sales coming from PC peripherals, Logitech has recently benefited from less pressure in its core PC segment. The turnaround plan implemented by the new management team is producing new and successful products such as the iPhone game controller, along with better sales and profit growth.
We also had a few stocks in the portfolio which did not perform as we expected such as Lancashire, Barclays and Cameco.
Lancashire shares retreated in spring 2014 due to concerns about a recent acquisition and insurance policy rates. Additionally, the company announced the planned departure of its CEO, which did little to help assuage investor concerns. Lancashire is a high quality specialty insurance company, built on the idea that superior management and underwriting can deliver outstanding returns to investors. The company maintains very low risk in its investments consistent with a mandate for capital preservation. We continue to hold this company because we believe it is a quality company and it has a current dividend yield of approximately 7.75%.
| ANNUAL REPORT | JUNE 30, 2014 | 25 |
Table of Contents
Insights from the Portfolio Managers PIMCO EqS Pathfinder Fund® (Cont.)
Barclays, the U.K.’s second-largest bank measured by assets, declined over the period due to legal concerns following reports the company would face new lawsuits from the New York Attorney General’s office regarding the firm’s marketing materials and the use of its dark pools by high frequency traders.
After initially surging in price at the start of 2014, uranium producer Cameco retreated in the first half of 2014 as delays in restarting Japan’s nuclear reactors are prolonging a uranium supply glut that has driven the commodity’s price to an eight-year low.
Outlook
Returns for global equity markets over the reporting period were helped in part by the encouraging action and comments by the world’s developed market central banks, the U.S. Federal Reserve, the European Central Bank and the Bank of Japan. Some investors are currently postulating that market valuation is “full,” or the market is “fairly valued.” Although that may or may not be true for equity markets in general, it is not the market, per se, that catches our interest; it is the individual businesses in which we invest. We invest in companies only when we believe it is appropriate to do so, and only when they meet our investment criteria. Having the patience to wait for an investment opportunity to present itself is the mark of a patient and disciplined investor.
We believe the equity markets should continue to evidence some volatility and anticipate this volatility will provide opportunity. We also believe that other opportunities may arise as corporations announce restructurings, such as announcements regarding a new CEO or head of sales, or a capital restructuring, which may include an initial public offering, a spin-off, or a merger or acquisition. These situations attract our interest as they reflect companies involved in the process of change, and that change may also provide an investment opportunity. These are also potential investment opportunities which occur in all markets, regardless of valuation or sentiment.
Earlier this year, my former co-portfolio manager, Chuck Lahr, resigned from the firm to spend time with his family. We have worked with Chuck for over 7 years now, we miss him, and we also wish him all the best as he spends time with his young and growing family.
To close our letter, I repeat my thanks for investing with us in the PIMCO EqS® Pathfinder Fund. We continue to ply our craft and we maintain our value-driven discipline, seeking the twin goals of capital appreciation and downside risk mitigation in our efforts to provide you with risk-adjusted returns. We are privileged to have the opportunity to manage your capital and look forward to the challenges and opportunities in the months and years ahead.
Sincerely,
 |
 |
Anne Gudefin, CFA Portfolio Manager |
Top 10 Holdings1
Marine Harvest ASA | 3.3% | |||||
Imperial Tobacco Group PLC | 3.2% | |||||
Reckitt Benckiser Group PLC | 3.0% | |||||
British American Tobacco PLC | 3.0% | |||||
Lorillard, Inc. | 2.9% | |||||
Microsoft Corp. | 2.7% | |||||
Danone S.A. | 2.6% | |||||
AIA Group Ltd. | 2.5% | |||||
Berkshire Hathaway, Inc. ‘B’ | 2.5% | |||||
Seadrill Ltd. | 2.3% |
Geographic Breakdown1
United States | 30.1% | |||||
United Kingdom | 13.3% | |||||
France | 7.9% | |||||
Norway | 5.8% | |||||
Bermuda | 4.8% | |||||
Netherlands | 4.4% | |||||
Hong Kong | 4.4% | |||||
Switzerland | 3.5% | |||||
Japan | 3.5% | |||||
Singapore | 2.4% | |||||
Belgium | 2.3% | |||||
Germany | 2.1% | |||||
Denmark | 1.9% | |||||
Sweden | 1.9% | |||||
Other | 2.4% |
| 26 | PIMCO EQUITY SERIES |
Table of Contents
Sector Breakdown1
Consumer Staples | 30.4% | |||||
Financials | 17.0% | |||||
Energy | 12.7% | |||||
Industrials | 11.8% | |||||
Information Technology | 8.3% | |||||
Health Care | 5.8% | |||||
Consumer Discretionary | 4.4% | |||||
Other | 0.3% |
| 1 | % of Investments, at value as of 06/30/14. Top Holdings, Geographic and Sector Breakdown solely reflect long positions. Securities sold short, financial derivative instruments and short-term instruments are not taken into consideration. |
| ANNUAL REPORT | JUNE 30, 2014 | 27 |
Table of Contents
| Institutional Class - PTHWX | Class A - PATHX | |
| Class P - PTHPX | Class C - PTHCX | |
| Class D - PTHDX | Class R - PTHRX |
Cumulative Returns Through June 30, 2014
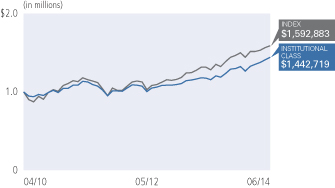
| Average Annual Total Return for the period ended June 30, 2014 | ||||||||||
1 Year | Fund Inception | |||||||||
| PIMCO EqS Pathfinder Fund® Institutional Class | 24.62% | 8.65% | |||||||
PIMCO EqS Pathfinder Fund® Class P | 24.40% | 8.53% | ||||||||
PIMCO EqS Pathfinder Fund® Class D | 24.20% | 8.26% | ||||||||
PIMCO EqS Pathfinder Fund® Class A | 24.12% | 8.26% | ||||||||
PIMCO EqS Pathfinder Fund® Class A (adjusted) | 17.30% | 6.81% | ||||||||
PIMCO EqS Pathfinder Fund® Class C | 23.33% | 7.49% | ||||||||
PIMCO EqS Pathfinder Fund® Class C (adjusted) | 22.33% | 7.49% | ||||||||
PIMCO EqS Pathfinder Fund® Class R | 23.91% | 7.93% | ||||||||
| MSCI World Index± | 24.05% | 10.83% | |||||||
All Fund returns are net of fees and expenses.
± The MSCI World Index is a free float-adjusted market capitalization weighted index that is designed to measure the equity market performance of developed markets. The MSCI World Index consists of 24 developed market country indices. It is not possible to invest directly in an unmanaged index.
Performance quoted represents past performance. Past performance is not a guarantee or a reliable indicator of future results. Current performance may be lower or higher than performance shown. Investment return and the principal value of an investment will fluctuate. Shares may be worth more or less than original cost when redeemed. Returns shown do not reflect the deduction of taxes that a shareholder would pay on fund distributions or the redemption of fund shares. The adjusted returns take into account the maximum sales charge of 5.50% on Class A shares and 1.00% CDSC on Class C shares. The Fund’s total annual operating expense ratio as stated in the Fund’s current prospectus, as supplemented to date, is 1.08% for the Institutional Class shares, 1.18% for the Class P shares, 1.43% for the Class D shares, 1.43% for the Class A shares, 2.18% for the Class C shares and 1.68% for the Class R shares. Details regarding any Fund’s operating expenses can be found in the Fund’s prospectus. For performance current to the most recent month-end, visit www.pimco.com/investments.
Portfolio Insights
| » | The PIMCO EqS Pathfinder Fund® seeks capital appreciation by investing under normal circumstances in equity securities, including common and preferred stock (and securities convertible into, or that PIMCO expects to be exchanged for, common or preferred stock), of issuers that PIMCO believes are undervalued. The Fund’s bottom-up value investment style attempts to identify securities that are undervalued by the market in comparison to PIMCO’s own determination of the company’s value, taking into account criteria such as asset value, book value, cash flow and earnings estimates. |
| » | The Fund’s Institutional Class shares returned 24.62% after fees, and the Fund’s benchmark index, the MSCI World Index, returned 24.05% during the reporting period. |
| » | Security selection in the utilities, industrial and financial sectors contributed positively to performance over the reporting period. In addition, the Fund’s stock selection in the consumer staples and materials sector contributed to returns. |
| » | The Fund’s underweight and security selection in the health care and information technology sectors were the largest detractors from returns. In addition, modest holdings of cash and cash-related securities also detracted from returns as the Fund’s benchmark index rose over the reporting period. |
| » | Holdings in Marine Harvest, Lorillard and ING Groep contributed strongly to performance as prices on these securities appreciated during the reporting period. |
| » | Holdings in Lancashire Holdings, Barclays, and Cameco detracted from returns as prices on these securities declined during the reporting period. |
| » | At the end of the reporting period, the Fund held approximately 90% in equities we believe are undervalued, approximately 5% (on the long side only) in merger arbitrage investments, and held the balance of the portfolio in cash and currency hedges. |
| 28 | PIMCO EQUITY SERIES |
Table of Contents
(Unaudited)
Example
As a shareholder of a Fund, you incur two types of costs: (1) transaction costs, including sales charges (loads) on purchase payments and exchange fees and (2) ongoing costs, including management fees, distribution and/or service (12b-1) fees, and other Fund expenses. The Example is intended to help you understand your ongoing costs (in dollars) of investing in a Fund and to compare these costs with the ongoing costs of investing in other mutual funds.
The Example is based on an investment of $1,000 invested at the beginning of the period and held for the entire period indicated, which for all Funds and share classes is from January 1, 2014 to June 30, 2014 unless noted otherwise in the table and footnotes below.
Actual Expenses
The information in the table under the heading “Actual” provides information about actual account values and actual expenses. You may use the information in these columns, together with the amount you invested, to estimate the expenses that you paid over the period. Simply divide your account value by $1,000 (for example, an $8,600 account value divided by $1,000 = $8.60), then multiply the result by the number in the appropriate column for your share class, in the column entitled “Expenses Paid During Period” to estimate the expenses you paid on your account during this period.
Hypothetical Example for Comparison Purposes
The information in the table under the heading “Hypothetical (5% return before expenses)” provides information about hypothetical account values and hypothetical expenses based on a Fund’s actual expense ratio and an assumed rate of return of 5% per year before expenses, which is not the Fund’s actual return. The hypothetical account values and expenses may not be used to estimate the actual ending account balance or expenses you paid for the period. You may use this information to compare the ongoing costs of investing in a Fund and other funds. To do so, compare this 5% hypothetical example with the 5% hypothetical examples that appear in the shareholder reports of the other funds.
Please note that the expenses shown in the table are meant to highlight your ongoing costs only and do not reflect any transactional costs, such as sales charges (loads) on purchase payments and exchange fees. Therefore, the information under the heading “Hypothetical (5% return before expenses)” is useful in comparing ongoing costs only, and will not help you determine the relative total costs of owning different funds. In addition, if these transactional costs were included, your costs would have been higher.
Expense ratios may vary from period to period because of various factors such as an increase in expenses that are not covered by the management fees, such as fees and expenses of the independent trustees and their counsel, extraordinary expenses and interest expense.
Actual | Hypothetical | |||||||||||||||||||||||||||||||||
| Beginning Account Value (01/01/14) | Ending Account Value (06/30/14) | Expenses Paid During Period* | Beginning Account Value (01/01/14) | Ending Account Value (06/30/14) | Expenses Paid During Period* | Net Annualized Expense Ratio** | ||||||||||||||||||||||||||||
PIMCO Balanced Income Fund(a) | ||||||||||||||||||||||||||||||||||
| Institutional Class | $ | 1,000.00 | $ | 1,032.00 | $ | 1.90 | $ | 1,000.00 | $ | 1,021.08 | $ | 3.76 | 0.75 | % | ||||||||||||||||||||
| Class P | 1,000.00 | 1,031.80 | 2.15 | 1,000.00 | 1,020.58 | 4.26 | 0.85 | |||||||||||||||||||||||||||
| Class D | 1,000.00 | 1,032.10 | 2.79 | 1,000.00 | 1,019.34 | 5.51 | 1.10 | |||||||||||||||||||||||||||
| Class A | 1,000.00 | 1,032.10 | 2.79 | 1,000.00 | 1,019.34 | 5.51 | 1.10 | |||||||||||||||||||||||||||
| Class C | 1,000.00 | 1,030.30 | 4.68 | 1,000.00 | 1,015.62 | 9.25 | 1.85 | |||||||||||||||||||||||||||
PIMCO Dividend and Income Builder Fund | ||||||||||||||||||||||||||||||||||
| Institutional Class | $ | 1,000.00 | $ | 1,057.20 | $ | 4.23 | $ | 1,000.00 | $ | 1,020.68 | $ | 4.16 | 0.83 | % | ||||||||||||||||||||
| Class P | 1,000.00 | 1,056.30 | 4.74 | 1,000.00 | 1,020.18 | 4.66 | 0.93 | |||||||||||||||||||||||||||
| Class D | 1,000.00 | 1,055.10 | 6.01 | 1,000.00 | 1,018.94 | 5.91 | 1.18 | |||||||||||||||||||||||||||
| Class A | 1,000.00 | 1,055.10 | 6.01 | 1,000.00 | 1,018.94 | 5.91 | 1.18 | |||||||||||||||||||||||||||
| Class C | 1,000.00 | 1,052.20 | 9.82 | 1,000.00 | 1,015.22 | 9.64 | 1.93 | |||||||||||||||||||||||||||
| Class R | 1,000.00 | 1,053.80 | 7.28 | 1,000.00 | 1,017.70 | 7.15 | 1.43 | |||||||||||||||||||||||||||
| ANNUAL REPORT | JUNE 30, 2014 | 29 |
Table of Contents
Expense Examples (Cont.)
(Unaudited)
Actual | Hypothetical | |||||||||||||||||||||||||||||||||
| Beginning Account Value (01/01/14) | Ending Account Value (06/30/14) | Expenses Paid During Period* | Beginning Account Value (01/01/14) | Ending Account Value (06/30/14) | Expenses Paid During Period* | Net Annualized Expense Ratio** | ||||||||||||||||||||||||||||
PIMCO EqS® Dividend Fund | ||||||||||||||||||||||||||||||||||
| Institutional Class | $ | 1,000.00 | $ | 1,060.30 | $ | 4.24 | $ | 1,000.00 | $ | 1,020.68 | $ | 4.16 | 0.83 | % | ||||||||||||||||||||
| Class P | 1,000.00 | 1,060.20 | 4.75 | 1,000.00 | 1,020.18 | 4.66 | 0.93 | |||||||||||||||||||||||||||
| Class D | 1,000.00 | 1,058.20 | 6.02 | 1,000.00 | 1,018.94 | 5.91 | 1.18 | |||||||||||||||||||||||||||
| Class A | 1,000.00 | 1,059.00 | 6.02 | 1,000.00 | 1,018.94 | 5.91 | 1.18 | |||||||||||||||||||||||||||
| Class C | 1,000.00 | 1,054.70 | 9.83 | 1,000.00 | 1,015.22 | 9.64 | 1.93 | |||||||||||||||||||||||||||
| Class R | 1,000.00 | 1,057.80 | 7.30 | 1,000.00 | 1,017.70 | 7.15 | 1.43 | |||||||||||||||||||||||||||
PIMCO EqS® Emerging Markets Fund | ||||||||||||||||||||||||||||||||||
| Institutional Class | $ | 1,000.00 | $ | 1,028.40 | $ | 6.29 | $ | 1,000.00 | $ | 1,018.60 | $ | 6.26 | 1.25 | % | ||||||||||||||||||||
| Class P | 1,000.00 | 1,026.20 | 6.78 | 1,000.00 | 1,018.10 | 6.76 | 1.35 | |||||||||||||||||||||||||||
| Administrative Class | 1,000.00 | 1,027.40 | 7.54 | 1,000.00 | 1,017.36 | 7.50 | 1.50 | |||||||||||||||||||||||||||
| Class D | 1,000.00 | 1,025.20 | 8.03 | 1,000.00 | 1,016.86 | 8.00 | 1.60 | |||||||||||||||||||||||||||
| Class A | 1,000.00 | 1,026.30 | 8.04 | 1,000.00 | 1,016.86 | 8.00 | 1.60 | |||||||||||||||||||||||||||
| Class C | 1,000.00 | 1,023.30 | 11.79 | 1,000.00 | 1,013.14 | 11.73 | 2.35 | |||||||||||||||||||||||||||
| Class R | 1,000.00 | 1,025.30 | 9.29 | 1,000.00 | 1,015.62 | 9.25 | 1.85 | |||||||||||||||||||||||||||
PIMCO EqS® Long/Short Fund | ||||||||||||||||||||||||||||||||||
| Institutional Class | $ | 1,000.00 | $ | 998.30 | $ | 9.31 | $ | 1,000.00 | $ | 1,015.47 | $ | 9.39 | 1.88 | % | ||||||||||||||||||||
| Class P | 1,000.00 | 997.50 | 9.81 | 1,000.00 | 1,014.98 | 9.89 | 1.98 | |||||||||||||||||||||||||||
| Class D | 1,000.00 | 996.60 | 11.24 | 1,000.00 | 1,013.54 | 11.33 | 2.27 | |||||||||||||||||||||||||||
| Class A | 1,000.00 | 996.60 | 11.04 | 1,000.00 | 1,013.74 | 11.13 | 2.23 | |||||||||||||||||||||||||||
| Class C | 1,000.00 | 992.30 | 14.67 | 1,000.00 | 1,010.07 | 14.80 | 2.97 | |||||||||||||||||||||||||||
PIMCO Emerging Multi-Asset Fund | ||||||||||||||||||||||||||||||||||
| Institutional Class | $ | 1,000.00 | $ | 1,048.30 | $ | 1.42 | $ | 1,000.00 | $ | 1,023.41 | $ | 1.40 | 0.28 | % | ||||||||||||||||||||
| Class P | 1,000.00 | 1,047.30 | 1.93 | 1,000.00 | 1,022.91 | 1.91 | 0.38 | |||||||||||||||||||||||||||
| Administrative Class | 1,000.00 | 1,045.10 | 2.69 | 1,000.00 | 1,022.17 | 2.66 | 0.53 | |||||||||||||||||||||||||||
| Class D | 1,000.00 | 1,046.10 | 3.20 | 1,000.00 | 1,021.67 | 3.16 | 0.63 | |||||||||||||||||||||||||||
| Class A | 1,000.00 | 1,046.30 | 3.20 | 1,000.00 | 1,021.67 | 3.16 | 0.63 | |||||||||||||||||||||||||||
| Class C | 1,000.00 | 1,042.10 | 6.99 | 1,000.00 | 1,017.95 | 6.90 | 1.38 | |||||||||||||||||||||||||||
| Class R | 1,000.00 | 1,044.10 | 4.46 | 1,000.00 | 1,020.43 | 4.41 | 0.88 | |||||||||||||||||||||||||||
PIMCO EqS Pathfinder Fund® | ||||||||||||||||||||||||||||||||||
| Institutional Class | $ | 1,000.00 | $ | 1,088.60 | $ | 4.66 | $ | 1,000.00 | $ | 1,020.33 | $ | 4.51 | 0.90 | % | ||||||||||||||||||||
| Class P | 1,000.00 | 1,087.90 | 5.18 | 1,000.00 | 1,019.84 | 5.01 | 1.00 | |||||||||||||||||||||||||||
| Class D | 1,000.00 | 1,087.60 | 6.47 | 1,000.00 | 1,018.60 | 6.26 | 1.25 | |||||||||||||||||||||||||||
| Class A | 1,000.00 | 1,086.40 | 6.47 | 1,000.00 | 1,018.60 | 6.26 | 1.25 | |||||||||||||||||||||||||||
| Class C | 1,000.00 | 1,082.80 | 10.33 | 1,000.00 | 1,014.88 | 9.99 | 2.00 | |||||||||||||||||||||||||||
| Class R | 1,000.00 | 1,085.70 | 7.76 | 1,000.00 | 1,017.36 | 7.50 | 1.50 | |||||||||||||||||||||||||||
* Expenses Paid During Period are equal to the net annualized expense ratio for the Fund, multiplied by the average account value over the period, multiplied by 181/365 (to reflect the one-half year period).
** The Net Annualized Expense Ratio is reflective of any applicable waivers related to contractual agreements for contractual fee waivers or voluntary fee waivers. Details regarding fee waivers can be found in Note 9 in the Notes to Financial Statements.
(a) The Beginning Account Value is reflective as of 3/31/14 for Actual Performance. Expenses paid in the Actual Performance section are equal to the net annualized expense ratio for the Fund, multiplied by the average account value over the period, multiplied by 91/365 for the Class shares of the PIMCO Balanced Income Fund (to reflect the period since the inception date of 3/31/14). Hypothetical expenses reflect an amount as if the class had been operational for the entire fiscal half year.
| 30 | PIMCO EQUITY SERIES |
Table of Contents
(THIS PAGE INTENTIONALLY LEFT BLANK)
| ANNUAL REPORT | JUNE 30, 2014 | 31 |
Table of Contents
| Selected Per Share Data for the Year or Period Ended: | | Net Investment Income (Loss) (a) | Net Realized/ Unrealized Gain (Loss) | Total Income (Loss) from Investment Operations | Dividends from Net Investment Income | Distributions from Net Realized Capital Gains | Total Distributions | |||||||||||||||||||||
PIMCO Balanced Income Fund | ||||||||||||||||||||||||||||
| Institutional Class | ||||||||||||||||||||||||||||
03/31/2014 - 06/30/2014 | $ | 10.00 | $ | 0.08 | $ | 0.24 | $ | 0.32 | $ | (0.08 | ) | $ | 0.00 | $ | (0.08 | ) | ||||||||||||
| Class P | ||||||||||||||||||||||||||||
03/31/2014 - 06/30/2014 | 10.00 | 0.08 | 0.24 | 0.32 | (0.08 | ) | 0.00 | (0.08 | ) | |||||||||||||||||||
| Class D | ||||||||||||||||||||||||||||
03/31/2014 - 06/30/2014 | 10.00 | 0.08 | 0.24 | 0.32 | (0.07 | ) | 0.00 | (0.07 | ) | |||||||||||||||||||
| Class A | ||||||||||||||||||||||||||||
03/31/2014 - 06/30/2014 | 10.00 | 0.08 | 0.24 | 0.32 | (0.07 | ) | 0.00 | (0.07 | ) | |||||||||||||||||||
| Class C | ||||||||||||||||||||||||||||
03/31/2014 - 06/30/2014 | 10.00 | 0.07 | 0.23 | 0.30 | (0.05 | ) | 0.00 | (0.05 | ) | |||||||||||||||||||
PIMCO Dividend and Income Builder Fund | ||||||||||||||||||||||||||||
| Institutional Class | ||||||||||||||||||||||||||||
06/30/2014 | $ | 11.60 | $ | 0.44 | $ | 1.54 | $ | 1.98 | $ | (0.46 | ) | $ | 0.00 | $ | (0.46 | ) | ||||||||||||
06/30/2013 | 10.47 | 0.54 | 1.03 | 1.57 | (0.42 | ) | (0.02 | ) | (0.44 | ) | ||||||||||||||||||
12/14/2011 - 06/30/2012 | 10.00 | 0.25 | 0.47 | 0.72 | (0.25 | ) | 0.00 | (0.25 | ) | |||||||||||||||||||
| Class P | ||||||||||||||||||||||||||||
06/30/2014 | 11.62 | 0.44 | 1.52 | 1.96 | (0.45 | ) | 0.00 | (0.45 | ) | |||||||||||||||||||
06/30/2013 | 10.48 | 0.54 | 1.03 | 1.57 | (0.41 | ) | (0.02 | ) | (0.43 | ) | ||||||||||||||||||
12/14/2011 - 06/30/2012 | 10.00 | 0.30 | 0.42 | 0.72 | (0.24 | ) | 0.00 | (0.24 | ) | |||||||||||||||||||
| Class D | ||||||||||||||||||||||||||||
06/30/2014 | 11.61 | 0.40 | 1.53 | 1.93 | (0.42 | ) | 0.00 | (0.42 | ) | |||||||||||||||||||
06/30/2013 | 10.47 | 0.46 | 1.09 | 1.55 | (0.39 | ) | (0.02 | ) | (0.41 | ) | ||||||||||||||||||
12/14/2011 - 06/30/2012 | 10.00 | 0.26 | 0.44 | 0.70 | (0.23 | ) | 0.00 | (0.23 | ) | |||||||||||||||||||
| Class A | ||||||||||||||||||||||||||||
06/30/2014 | 11.61 | 0.42 | 1.51 | 1.93 | (0.42 | ) | 0.00 | (0.42 | ) | |||||||||||||||||||
06/30/2013 | 10.47 | 0.48 | 1.07 | 1.55 | (0.39 | ) | (0.02 | ) | (0.41 | ) | ||||||||||||||||||
12/14/2011 - 06/30/2012 | 10.00 | 0.26 | 0.44 | 0.70 | (0.23 | ) | 0.00 | (0.23 | ) | |||||||||||||||||||
| Class C | ||||||||||||||||||||||||||||
06/30/2014 | 11.59 | 0.33 | 1.51 | 1.84 | (0.33 | ) | 0.00 | (0.33 | ) | |||||||||||||||||||
06/30/2013 | 10.46 | 0.40 | 1.06 | 1.46 | (0.31 | ) | (0.02 | ) | (0.33 | ) | ||||||||||||||||||
12/14/2011 - 06/30/2012 | 10.00 | 0.24 | 0.41 | 0.65 | (0.19 | ) | 0.00 | (0.19 | ) | |||||||||||||||||||
| Class R | ||||||||||||||||||||||||||||
06/30/2014 | 11.61 | 0.38 | 1.52 | 1.90 | (0.39 | ) | 0.00 | (0.39 | ) | |||||||||||||||||||
06/30/2013 | 10.47 | 0.36 | 1.16 | 1.52 | (0.36 | ) | (0.02 | ) | (0.38 | ) | ||||||||||||||||||
12/14/2011 - 06/30/2012 | 10.00 | 0.25 | 0.43 | 0.68 | (0.21 | ) | 0.00 | (0.21 | ) | |||||||||||||||||||
PIMCO EqS® Dividend Fund | ||||||||||||||||||||||||||||
| Institutional Class | ||||||||||||||||||||||||||||
06/30/2014 | $ | 11.87 | $ | 0.39 | $ | 1.65 | $ | 2.04 | $ | (0.48 | ) | $ | (0.62 | ) | $ | (1.10 | ) | |||||||||||
06/30/2013 | 10.47 | 0.43 | 1.37 | 1.80 | (0.37 | ) | (0.03 | ) | (0.40 | ) | ||||||||||||||||||
12/14/2011 - 06/30/2012 | 10.00 | 0.28 | 0.42 | 0.70 | (0.23 | ) | 0.00 | (0.23 | ) | |||||||||||||||||||
| Class P | ||||||||||||||||||||||||||||
06/30/2014 | 11.88 | 0.42 | 1.61 | 2.03 | (0.47 | ) | (0.62 | ) | (1.09 | ) | ||||||||||||||||||
06/30/2013 | 10.48 | 0.47 | 1.32 | 1.79 | (0.36 | ) | (0.03 | ) | (0.39 | ) | ||||||||||||||||||
12/14/2011 - 06/30/2012 | 10.00 | 0.29 | 0.41 | 0.70 | (0.22 | ) | 0.00 | (0.22 | ) | |||||||||||||||||||
| Class D | ||||||||||||||||||||||||||||
06/30/2014 | 11.87 | 0.39 | 1.61 | 2.00 | (0.44 | ) | (0.62 | ) | (1.06 | ) | ||||||||||||||||||
06/30/2013 | 10.48 | 0.40 | 1.36 | 1.76 | (0.34 | ) | (0.03 | ) | (0.37 | ) | ||||||||||||||||||
12/14/2011 - 06/30/2012 | 10.00 | 0.30 | 0.39 | 0.69 | (0.21 | ) | 0.00 | (0.21 | ) | |||||||||||||||||||
| Class A | ||||||||||||||||||||||||||||
06/30/2014 | 11.88 | 0.39 | 1.61 | 2.00 | (0.44 | ) | (0.62 | ) | (1.06 | ) | ||||||||||||||||||
06/30/2013 | 10.48 | 0.42 | 1.35 | 1.77 | (0.34 | ) | (0.03 | ) | (0.37 | ) | ||||||||||||||||||
12/14/2011 - 06/30/2012 | 10.00 | 0.27 | 0.42 | 0.69 | (0.21 | ) | 0.00 | (0.21 | ) | |||||||||||||||||||
Please see footnotes on page 38.
| 32 | PIMCO EQUITY SERIES | See Accompanying Notes |
Table of Contents
| Net Asset Value End of Year or Period | Total Return | Net Assets End of Year or Period (000s) | Ratio of Expenses to Average Net Assets | Ratio of Expenses to Average Net Assets Excluding Waivers | Ratio of Expenses to Average Net Assets Excluding Interest Expense and Dividends on Securities Sold Short | Ratio of Expenses to Average Net Assets Excluding Interest Expense and Dividends on Securities Sold Short and Waivers | Ratio of Net Investment Income (Loss) to Average Net Assets | Portfolio Turnover Rate** | ||||||||||||||||||||||||||
| $ | 10.24 | 3.20 | % | $ | 6,284 | 0.75 | %* | 4.52 | %* | 0.75 | %* | 4.52 | %* | 3.20 | %* | 6 | % | |||||||||||||||||
| 10.24 | 3.18 | 11 | 0.85 | * | 4.62 | * | 0.85 | * | 4.62 | * | 3.03 | * | 6 | |||||||||||||||||||||
| 10.25 | 3.21 | 45 | 1.10 | * | 4.87 | * | 1.10 | * | 4.87 | * | 3.11 | * | 6 | |||||||||||||||||||||
| 10.25 | 3.21 | 319 | 1.10 | * | 4.87 | * | 1.10 | * | 4.87 | * | 3.14 | * | 6 | |||||||||||||||||||||
| 10.25 | 3.03 | 461 | 1.85 | * | 5.62 | * | 1.85 | * | 5.62 | * | 2.87 | * | 6 | |||||||||||||||||||||
| $ | 13.12 | 17.23 | % | $ | 90,408 | 0.84 | % | 1.00 | % | 0.84 | % | 1.00 | % | 3.56 | % | 79 | % | |||||||||||||||||
| 11.60 | 15.17 | 69,203 | 0.83 | 1.00 | 0.83 | 1.00 | 4.66 | 75 | ||||||||||||||||||||||||||
| 10.47 | 7.17 | 11,170 | 0.83 | * | 1.57 | * | 0.83 | * | 1.57 | * | 4.35 | * | 28 | |||||||||||||||||||||
| 13.13 | 17.05 | 158,122 | 0.94 | 1.10 | 0.94 | 1.10 | 3.53 | 79 | ||||||||||||||||||||||||||
| 11.62 | 15.15 | 85,724 | 0.93 | 1.10 | 0.93 | 1.10 | 4.62 | 75 | ||||||||||||||||||||||||||
| 10.48 | 7.21 | 8,207 | 0.93 | * | 2.47 | * | 0.93 | * | 2.47 | * | 5.28 | * | 28 | |||||||||||||||||||||
| 13.12 | 16.78 | 32,523 | 1.19 | 1.35 | 1.19 | 1.35 | 3.19 | 79 | ||||||||||||||||||||||||||
| 11.61 | 14.91 | 23,204 | 1.18 | 1.35 | 1.18 | 1.35 | 4.00 | 75 | ||||||||||||||||||||||||||
| 10.47 | 6.98 | 2,306 | 1.18 | * | 2.26 | * | 1.18 | * | 2.26 | * | 4.52 | * | 28 | |||||||||||||||||||||
| 13.12 | 16.78 | 320,719 | 1.19 | 1.35 | 1.19 | 1.35 | 3.34 | 79 | ||||||||||||||||||||||||||
| 11.61 | 14.91 | 117,579 | 1.18 | 1.35 | 1.18 | 1.35 | 4.18 | 75 | ||||||||||||||||||||||||||
| 10.47 | 6.98 | 13,314 | 1.18 | * | 2.43 | * | 1.18 | * | 2.43 | * | 4.62 | * | 28 | |||||||||||||||||||||
| 13.10 | 15.97 | 353,287 | 1.94 | 2.10 | 1.94 | 2.10 | 2.67 | 79 | ||||||||||||||||||||||||||
| 11.59 | 14.08 | 86,879 | 1.93 | 2.10 | 1.93 | 2.10 | 3.42 | 75 | ||||||||||||||||||||||||||
| 10.46 | 6.46 | 8,000 | 1.93 | * | 3.46 | * | 1.93 | * | 3.46 | * | 4.27 | * | 28 | |||||||||||||||||||||
| 13.12 | 16.50 | 459 | 1.44 | 1.60 | 1.44 | 1.60 | 3.03 | 79 | ||||||||||||||||||||||||||
| 11.61 | 14.66 | 217 | 1.43 | 1.60 | 1.43 | 1.60 | 3.24 | 75 | ||||||||||||||||||||||||||
| 10.47 | 6.84 | 415 | 1.43 | * | 2.32 | * | 1.43 | * | 2.32 | * | 4.30 | * | 28 | |||||||||||||||||||||
| $ | 12.81 | 17.91 | % | $ | 302,088 | 0.84 | % | 1.00 | % | 0.84 | % | 1.00 | % | 3.20 | % | 95 | % | |||||||||||||||||
| 11.87 | 17.32 | 579,198 | 0.83 | 1.00 | 0.83 | 1.00 | 3.74 | 108 | ||||||||||||||||||||||||||
| 10.47 | 6.95 | 315,513 | 0.83 | * | 1.20 | * | 0.83 | * | 1.20 | * | 4.98 | * | 21 | |||||||||||||||||||||
| 12.82 | 17.84 | 3,652 | 0.94 | 1.10 | 0.94 | 1.10 | 3.38 | 95 | ||||||||||||||||||||||||||
| 11.88 | 17.21 | 1,435 | 0.93 | 1.10 | 0.93 | 1.10 | 3.98 | 108 | ||||||||||||||||||||||||||
| 10.48 | 7.00 | 71 | 0.93 | * | 1.33 | * | 0.93 | * | 1.33 | * | 5.11 | * | 21 | |||||||||||||||||||||
| 12.81 | 17.57 | 7,709 | 1.19 | 1.35 | 1.19 | 1.35 | 3.17 | 95 | ||||||||||||||||||||||||||
| 11.87 | 16.85 | 7,801 | 1.18 | 1.35 | 1.18 | 1.35 | 3.41 | 108 | ||||||||||||||||||||||||||
| 10.48 | 6.86 | 1,251 | 1.18 | * | 1.67 | * | 1.18 | * | 1.67 | * | 5.25 | * | 21 | |||||||||||||||||||||
| 12.82 | 17.56 | 59,540 | 1.19 | 1.35 | 1.19 | 1.35 | 3.14 | 95 | ||||||||||||||||||||||||||
| 11.88 | 16.95 | 27,729 | 1.18 | 1.35 | 1.18 | 1.35 | 3.63 | 108 | ||||||||||||||||||||||||||
| 10.48 | 6.86 | 2,529 | 1.18 | * | 1.51 | * | 1.18 | 1.51 | * | 4.74 | * | 21 | ||||||||||||||||||||||
Please see footnotes on page 38.
| ANNUAL REPORT | JUNE 30, 2014 | 33 |
Table of Contents
Financial Highlights (Cont.)
| Selected Per Share Data for the Year or Period Ended: | | Net Investment Income (Loss) (a) | Net Realized/ Unrealized Gain (Loss) | Total Income (Loss) from Investment Operations | Dividends from Net Investment Income | Distributions from Net Realized Capital Gains | Total Distributions | |||||||||||||||||||||
PIMCO EqS® Dividend Fund (Cont.) | ||||||||||||||||||||||||||||
| Class C | ||||||||||||||||||||||||||||
06/30/2014 | $ | 11.84 | $ | 0.30 | $ | 1.60 | $ | 1.90 | $ | (0.35 | ) | $ | (0.62 | ) | $ | (0.97 | ) | |||||||||||
06/30/2013 | 10.45 | 0.36 | 1.32 | 1.68 | (0.26 | ) | (0.03 | ) | (0.29 | ) | ||||||||||||||||||
12/14/2011 - 06/30/2012 | 10.00 | 0.23 | 0.39 | 0.62 | (0.17 | ) | 0.00 | (0.17 | ) | |||||||||||||||||||
| Class R | ||||||||||||||||||||||||||||
06/30/2014 | 11.87 | 0.38 | 1.59 | 1.97 | (0.41 | ) | (0.62 | ) | (1.03 | ) | ||||||||||||||||||
06/30/2013 | 10.47 | 0.36 | 1.38 | 1.74 | (0.31 | ) | (0.03 | ) | (0.34 | ) | ||||||||||||||||||
12/14/2011 - 06/30/2012 | 10.00 | 0.18 | 0.48 | 0.66 | (0.19 | ) | 0.00 | (0.19 | ) | |||||||||||||||||||
PIMCO EqS® Emerging Markets Fund | ||||||||||||||||||||||||||||
| Institutional Class | ||||||||||||||||||||||||||||
06/30/2014 | $ | 8.26 | $ | 0.04 | $ | 0.75 | $ | 0.79 | $ | 0.00 | $ | 0.00 | $ | 0.00 | ||||||||||||||
06/30/2013 | 7.97 | 0.13 | 0.25 | 0.38 | (0.09 | ) | 0.00 | (0.09 | ) | |||||||||||||||||||
06/30/2012 | 10.19 | 0.08 | (2.27 | ) | (2.19 | ) | (0.02 | ) | (0.01 | ) | (0.03 | ) | ||||||||||||||||
03/22/2011 - 06/30/2011 | 10.00 | 0.05 | 0.14 | 0.19 | 0.00 | 0.00 | 0.00 | |||||||||||||||||||||
| Class P | ||||||||||||||||||||||||||||
06/30/2014 | 8.24 | (0.00 | )^ | 0.78 | 0.78 | 0.00 | 0.00 | 0.00 | ||||||||||||||||||||
06/30/2013 | 7.97 | 0.33 | 0.03 | 0.36 | (0.09 | ) | 0.00 | (0.09 | ) | |||||||||||||||||||
06/30/2012 | 10.19 | 0.06 | (2.25 | ) | (2.19 | ) | (0.02 | ) | (0.01 | ) | (0.03 | ) | ||||||||||||||||
03/22/2011 - 06/30/2011 | 10.00 | 0.04 | 0.15 | 0.19 | 0.00 | 0.00 | 0.00 | |||||||||||||||||||||
| Administrative Class | ||||||||||||||||||||||||||||
06/30/2014 | 8.23 | (0.02 | ) | 0.79 | 0.77 | 0.00 | 0.00 | 0.00 | ||||||||||||||||||||
06/30/2013 | 7.96 | 0.11 | 0.24 | 0.35 | (0.08 | ) | 0.00 | (0.08 | ) | |||||||||||||||||||
06/30/2012 | 10.18 | 0.06 | (2.27 | ) | (2.21 | ) | (0.00 | )^ | (0.01 | ) | (0.01 | ) | ||||||||||||||||
04/19/2011 - 06/30/2011 | 10.51 | 0.04 | (0.37 | ) | (0.33 | ) | 0.00 | 0.00 | 0.00 | |||||||||||||||||||
| Class D | ||||||||||||||||||||||||||||
06/30/2014 | 8.20 | 0.03 | 0.72 | 0.75 | 0.00 | 0.00 | 0.00 | |||||||||||||||||||||
06/30/2013 | 7.93 | 0.09 | 0.26 | 0.35 | (0.08 | ) | 0.00 | (0.08 | ) | |||||||||||||||||||
06/30/2012 | 10.18 | 0.00 | ^ | (2.22 | ) | (2.22 | ) | (0.02 | ) | (0.01 | ) | (0.03 | ) | |||||||||||||||
03/22/2011 - 06/30/2011 | 10.00 | 0.06 | 0.12 | 0.18 | 0.00 | 0.00 | 0.00 | |||||||||||||||||||||
| Class A | ||||||||||||||||||||||||||||
06/30/2014 | 8.20 | 0.05 | 0.71 | 0.76 | 0.00 | 0.00 | 0.00 | |||||||||||||||||||||
06/30/2013 | 7.94 | 0.13 | 0.21 | 0.34 | (0.08 | ) | 0.00 | (0.08 | ) | |||||||||||||||||||
06/30/2012 | 10.18 | 0.08 | (2.31 | ) | (2.23 | ) | (0.00 | )^ | (0.01 | ) | (0.01 | ) | ||||||||||||||||
03/22/2011 - 06/30/2011 | 10.00 | 0.05 | 0.13 | 0.18 | 0.00 | 0.00 | 0.00 | |||||||||||||||||||||
| Class C | ||||||||||||||||||||||||||||
06/30/2014 | 8.11 | (0.01 | ) | 0.69 | 0.68 | 0.00 | 0.00 | 0.00 | ||||||||||||||||||||
06/30/2013 | 7.88 | 0.07 | 0.21 | 0.28 | (0.05 | ) | 0.00 | (0.05 | ) | |||||||||||||||||||
06/30/2012 | 10.17 | 0.01 | (2.29 | ) | (2.28 | ) | (0.00 | )^ | (0.01 | ) | (0.01 | ) | ||||||||||||||||
03/22/2011 - 06/30/2011 | 10.00 | 0.03 | 0.14 | 0.17 | 0.00 | 0.00 | 0.00 | |||||||||||||||||||||
| Class R | ||||||||||||||||||||||||||||
06/30/2014 | 8.19 | (0.02 | ) | 0.75 | 0.73 | 0.00 | 0.00 | 0.00 | ||||||||||||||||||||
06/30/2013 | 7.93 | 0.08 | 0.24 | 0.32 | (0.06 | ) | 0.00 | (0.06 | ) | |||||||||||||||||||
06/30/2012 | 10.18 | 0.01 | (2.25 | ) | (2.24 | ) | (0.00 | )^ | (0.01 | ) | (0.01 | ) | ||||||||||||||||
03/22/2011 - 06/30/2011 | 10.00 | 0.06 | 0.12 | 0.18 | 0.00 | 0.00 | 0.00 | |||||||||||||||||||||
PIMCO EqS® Long/Short Fund | ||||||||||||||||||||||||||||
| Institutional Class | ||||||||||||||||||||||||||||
06/30/2014 | $ | 11.09 | $ | (0.10 | ) | $ | 1.60 | $ | 1.50 | $ | (0.06 | ) | $ | (0.61 | ) | $ | (0.67 | ) | ||||||||||
06/30/2013 | 9.71 | 0.15 | 1.27 | 1.42 | (0.04 | ) | 0.00 | (0.04 | ) | |||||||||||||||||||
04/20/2012 - 06/30/2012 | 10.00 | (0.02 | ) | (0.27 | ) | (0.29 | ) | 0.00 | 0.00 | 0.00 | ||||||||||||||||||
| Class P | ||||||||||||||||||||||||||||
06/30/2014 | 11.08 | (0.08 | ) | 1.56 | 1.48 | (0.07 | ) | (0.61 | ) | (0.68 | ) | |||||||||||||||||
06/30/2013 | 9.70 | (0.05 | ) | 1.47 | 1.42 | (0.04 | ) | 0.00 | (0.04 | ) | ||||||||||||||||||
04/30/2012 - 06/30/2012 | 10.00 | (0.02 | ) | (0.28 | ) | (0.30 | ) | 0.00 | 0.00 | 0.00 | ||||||||||||||||||
Please see footnotes on page 38.
| 34 | PIMCO EQUITY SERIES | See Accompanying Notes |
Table of Contents
| Net Asset Value End of Year or Period | Total Return | Net Assets End of Year or Period (000s) | Ratio of Expenses to Average Net Assets | Ratio of Expenses to Average Net Assets Excluding Waivers | Ratio of Expenses to Average Net Assets Excluding Interest Expense and Dividends on Securities Sold Short | Ratio of Expenses to Average Net Assets Excluding Interest Expense and Dividends on Securities Sold Short and Waivers | Ratio of Net Investment Income (Loss) to Average Net Assets | Portfolio Turnover Rate** | ||||||||||||||||||||||||||
| $ | 12.77 | 16.69 | % | $ | 39,359 | 1.94 | % | 2.10 | % | 1.94 | % | 2.10 | % | 2.45 | % | 95 | % | |||||||||||||||||
| 11.84 | 16.14 | 14,150 | 1.93 | 2.10 | 1.93 | 2.10 | 3.05 | 108 | ||||||||||||||||||||||||||
| 10.45 | 6.19 | 1,275 | 1.93 | * | 2.26 | * | 1.93 | * | 2.26 | * | 4.11 | * | 21 | |||||||||||||||||||||
| 12.81 | 17.29 | 192 | 1.44 | 1.60 | 1.44 | 1.60 | 3.08 | 95 | ||||||||||||||||||||||||||
| 11.87 | 16.71 | 100 | 1.43 | 1.60 | 1.43 | 1.60 | 3.05 | 108 | ||||||||||||||||||||||||||
| 10.47 | 6.63 | 11 | 1.43 | * | 1.67 | * | 1.43 | * | 1.67 | * | 3.24 | * | 21 | |||||||||||||||||||||
| $ | 9.05 | 9.56 | % | $ | 108,018 | 1.26 | % | 1.46 | % | 1.26 | % | 1.46 | % | 0.50 | % | 77 | % | |||||||||||||||||
| 8.26 | 4.68 | 496,172 | 1.26 | 1.46 | 1.26 | 1.46 | 1.46 | 85 | ||||||||||||||||||||||||||
| 7.97 | (21.51 | ) | 514,884 | 1.25 | 1.46 | 1.25 | 1.45 | 0.94 | 92 | |||||||||||||||||||||||||
| 10.19 | 1.90 | 353,099 | 1.25 | * | 1.62 | * | 1.25 | * | 1.62 | * | 1.77 | * | 41 | |||||||||||||||||||||
| 9.02 | 9.47 | 70 | 1.36 | 1.56 | 1.36 | 1.56 | (0.00 | )† | 77 | |||||||||||||||||||||||||
| 8.24 | 4.46 | 7,615 | 1.36 | 1.56 | 1.36 | 1.56 | 3.81 | 85 | ||||||||||||||||||||||||||
| 7.97 | (21.52 | ) | 63 | 1.35 | 1.56 | 1.35 | 1.55 | 0.68 | 92 | |||||||||||||||||||||||||
| 10.19 | 1.90 | 37 | 1.35 | * | 1.94 | * | 1.35 | * | 1.94 | * | 1.42 | * | 41 | |||||||||||||||||||||
| 9.00 | 9.36 | 3 | 1.51 | 1.71 | 1.51 | 1.71 | (0.20 | ) | 77 | |||||||||||||||||||||||||
| 8.23 | 4.36 | 42 | 1.51 | 1.71 | 1.51 | 1.71 | 1.32 | 85 | ||||||||||||||||||||||||||
| 7.96 | (21.72 | ) | 34 | 1.50 | 1.72 | 1.50 | 1.72 | 0.74 | 92 | |||||||||||||||||||||||||
| 10.18 | (3.14 | ) | 10 | 1.50 | * | 1.90 | * | 1.50 | * | 1.90 | * | 1.72 | * | 41 | ||||||||||||||||||||
| 8.95 | 9.15 | 827 | 1.61 | 1.81 | 1.61 | 1.81 | 0.32 | 77 | ||||||||||||||||||||||||||
| 8.20 | 4.31 | 1,097 | 1.61 | 1.81 | 1.61 | 1.81 | 0.99 | 85 | ||||||||||||||||||||||||||
| 7.93 | (21.83 | ) | 989 | 1.60 | 1.82 | 1.60 | 1.81 | (0.02 | ) | 92 | ||||||||||||||||||||||||
| 10.18 | 1.80 | 1,080 | 1.60 | * | 2.11 | * | 1.60 | * | 2.11 | * | 1.98 | * | 41 | |||||||||||||||||||||
| 8.96 | 9.27 | 6,393 | 1.61 | 1.81 | 1.61 | 1.81 | 0.61 | 77 | ||||||||||||||||||||||||||
| 8.20 | 4.23 | 4,324 | 1.61 | 1.81 | 1.61 | 1.81 | 1.51 | 85 | ||||||||||||||||||||||||||
| 7.94 | (21.89 | ) | 2,469 | 1.60 | 1.81 | 1.60 | 1.80 | 0.90 | 92 | |||||||||||||||||||||||||
| 10.18 | 1.80 | 764 | 1.60 | * | 2.02 | * | 1.60 | * | 2.02 | * | 1.89 | * | 41 | |||||||||||||||||||||
| 8.79 | 8.38 | 2,028 | 2.36 | 2.56 | 2.36 | 2.56 | (0.12 | ) | 77 | |||||||||||||||||||||||||
| 8.11 | 3.54 | 1,371 | 2.36 | 2.56 | 2.36 | 2.56 | 0.83 | 85 | ||||||||||||||||||||||||||
| 7.88 | (22.43 | ) | 675 | 2.35 | 2.57 | 2.35 | 2.56 | 0.12 | 92 | |||||||||||||||||||||||||
| 10.17 | 1.70 | 98 | 2.35 | * | 2.80 | * | 2.35 | * | 2.80 | * | 0.98 | * | 41 | |||||||||||||||||||||
| 8.92 | 8.91 | 10 | 1.86 | 2.06 | 1.86 | 2.06 | (0.20 | ) | 77 | |||||||||||||||||||||||||
| 8.19 | 4.04 | 25 | 1.86 | 2.06 | 1.86 | 2.06 | 0.92 | 85 | ||||||||||||||||||||||||||
| 7.93 | (22.01 | ) | 24 | 1.85 | 2.07 | 1.85 | 2.06 | 0.06 | 92 | |||||||||||||||||||||||||
| 10.18 | 1.80 | 39 | 1.85 | * | 2.34 | * | 1.85 | * | 2.34 | * | 1.97 | * | 41 | |||||||||||||||||||||
| $ | 11.92 | 13.59 | % | $ | 545,346 | 2.02 | % | 2.04 | % | 1.48 | % | 1.50 | % | (0.82 | )% | 522 | % | |||||||||||||||||
| 11.09 | 14.66 | 329,610 | 2.65 | 2.75 | 1.40 | 1.50 | 1.45 | 528 | ||||||||||||||||||||||||||
| 9.71 | (2.90 | ) | 212,229 | 1.52 | * | 2.41 | * | 1.40 | * | 2.29 | * | (1.30 | )* | 113 | ||||||||||||||||||||
| 11.88 | 13.40 | 277,661 | 2.00 | 2.02 | 1.58 | 1.60 | (0.71 | ) | 522 | |||||||||||||||||||||||||
| 11.08 | 14.77 | 15,664 | 3.94 | 4.04 | 1.50 | 1.60 | (0.48 | ) | 528 | |||||||||||||||||||||||||
| 9.70 | (3.00 | ) | 10 | 1.62 | * | 2.40 | * | 1.50 | * | 2.28 | * | (1.34 | )* | 113 | ||||||||||||||||||||
Please see footnotes on page 38.
| ANNUAL REPORT | JUNE 30, 2014 | 35 |
Table of Contents
Financial Highlights (Cont.)
| Selected Per Share Data for the Year or Period Ended: | | Net Investment Income (Loss) (a) | Net Realized/ Unrealized Gain (Loss) | Total Income (Loss) from Investment Operations | Dividends from Net Investment Income | Distributions from Net Realized Capital Gains | Total Distributions | |||||||||||||||||||||
PIMCO EqS® Long/Short Fund (Cont.) | ||||||||||||||||||||||||||||
| Class D | ||||||||||||||||||||||||||||
06/30/2014 | $ | 11.06 | $ | (0.12 | ) | $ | 1.57 | $ | 1.45 | $ | (0.06 | ) | $ | (0.61 | ) | $ | (0.67 | ) | ||||||||||
06/30/2013 | 9.70 | (0.10 | ) | 1.48 | 1.38 | (0.02 | ) | 0.00 | (0.02 | ) | ||||||||||||||||||
04/30/2012 - 06/30/2012 | 10.00 | (0.03 | ) | (0.27 | ) | (0.30 | ) | 0.00 | 0.00 | 0.00 | ||||||||||||||||||
| Class A | ||||||||||||||||||||||||||||
06/30/2014 | 11.05 | (0.12 | ) | 1.57 | 1.45 | (0.06 | ) | (0.61 | ) | (0.67 | ) | |||||||||||||||||
06/30/2013 | 9.70 | 0.00 | ^ | 1.38 | 1.38 | (0.03 | ) | 0.00 | (0.03 | ) | ||||||||||||||||||
04/30/2012 - 06/30/2012 | 10.00 | (0.03 | ) | (0.27 | ) | (0.30 | ) | 0.00 | 0.00 | 0.00 | ||||||||||||||||||
| Class C | ||||||||||||||||||||||||||||
06/30/2014 | 10.98 | (0.20 | ) | 1.55 | 1.35 | (0.05 | ) | (0.61 | ) | (0.66 | ) | |||||||||||||||||
06/30/2013 | 9.69 | 0.01 | 1.29 | 1.30 | (0.01 | ) | 0.00 | (0.01 | ) | |||||||||||||||||||
04/30/2012 - 06/30/2012 | 10.00 | (0.04 | ) | (0.27 | ) | (0.31 | ) | 0.00 | 0.00 | 0.00 | ||||||||||||||||||
PIMCO Emerging Multi-Asset Fund | ||||||||||||||||||||||||||||
| Institutional Class | ||||||||||||||||||||||||||||
06/30/2014 | $ | 8.60 | $ | 0.18 | $ | 0.48 | $ | 0.66 | $ | (0.15 | ) | $ | 0.00 | $ | (0.15 | ) | ||||||||||||
06/30/2013 | 8.71 | 0.24 | (0.08 | ) | 0.16 | (0.27 | ) | 0.00 | (0.27 | ) | ||||||||||||||||||
06/30/2012 | 9.89 | 0.14 | (1.27 | ) | (1.13 | ) | (0.05 | ) | 0.00 | (0.05 | ) | |||||||||||||||||
04/12/2011 - 06/30/2011 | 10.00 | 0.02 | (0.13 | ) | (0.11 | ) | 0.00 | 0.00 | 0.00 | |||||||||||||||||||
| Class P | ||||||||||||||||||||||||||||
06/30/2014 | 8.58 | 0.17 | 0.48 | 0.65 | (0.15 | ) | 0.00 | (0.15 | ) | |||||||||||||||||||
06/30/2013 | 8.69 | 0.24 | (0.09 | ) | 0.15 | (0.26 | ) | 0.00 | (0.26 | ) | ||||||||||||||||||
06/30/2012 | 9.90 | 0.15 | (1.31 | ) | (1.16 | ) | (0.05 | ) | 0.00 | (0.05 | ) | |||||||||||||||||
04/12/2011 - 06/30/2011 | 10.00 | 0.02 | (0.12 | ) | (0.10 | ) | 0.00 | 0.00 | 0.00 | |||||||||||||||||||
| Administrative Class | ||||||||||||||||||||||||||||
06/30/2014 | 8.55 | 0.19 | 0.43 | 0.62 | (0.14 | ) | 0.00 | (0.14 | ) | |||||||||||||||||||
06/30/2013 | 8.69 | 0.15 | (0.01 | ) | 0.14 | (0.28 | ) | 0.00 | (0.28 | ) | ||||||||||||||||||
06/30/2012 | 9.89 | 0.12 | (1.28 | ) | (1.16 | ) | (0.04 | ) | 0.00 | (0.04 | ) | |||||||||||||||||
04/19/2011 - 06/30/2011 | 10.02 | 0.02 | (0.15 | ) | (0.13 | ) | 0.00 | 0.00 | 0.00 | |||||||||||||||||||
| Class D | ||||||||||||||||||||||||||||
06/30/2014 | 8.57 | 0.15 | 0.48 | 0.63 | (0.13 | ) | 0.00 | (0.13 | ) | |||||||||||||||||||
06/30/2013 | 8.70 | 0.20 | (0.08 | ) | 0.12 | (0.25 | ) | 0.00 | (0.25 | ) | ||||||||||||||||||
06/30/2012 | 9.89 | 0.11 | (1.27 | ) | (1.16 | ) | (0.03 | ) | 0.00 | (0.03 | ) | |||||||||||||||||
04/12/2011 - 06/30/2011 | 10.00 | 0.02 | (0.13 | ) | (0.11 | ) | 0.00 | 0.00 | 0.00 | |||||||||||||||||||
| Class A | ||||||||||||||||||||||||||||
06/30/2014 | 8.54 | 0.15 | 0.48 | 0.63 | (0.13 | ) | 0.00 | (0.13 | ) | |||||||||||||||||||
06/30/2013 | 8.68 | 0.23 | (0.12 | ) | 0.11 | (0.25 | ) | 0.00 | (0.25 | ) | ||||||||||||||||||
06/30/2012 | 9.88 | 0.12 | (1.28 | ) | (1.16 | ) | (0.04 | ) | 0.00 | (0.04 | ) | |||||||||||||||||
04/12/2011 - 06/30/2011 | 10.00 | 0.02 | (0.14 | ) | (0.12 | ) | 0.00 | 0.00 | 0.00 | |||||||||||||||||||
| Class C | ||||||||||||||||||||||||||||
06/30/2014 | 8.46 | 0.08 | 0.47 | 0.55 | (0.10 | ) | 0.00 | (0.10 | ) | |||||||||||||||||||
06/30/2013 | 8.62 | 0.15 | (0.09 | ) | 0.06 | (0.22 | ) | 0.00 | (0.22 | ) | ||||||||||||||||||
06/30/2012 | 9.88 | 0.05 | (1.29 | ) | (1.24 | ) | (0.02 | ) | 0.00 | (0.02 | ) | |||||||||||||||||
04/12/2011 - 06/30/2011 | 10.00 | 0.00 | ^ | (0.12 | ) | (0.12 | ) | 0.00 | 0.00 | 0.00 | ||||||||||||||||||
| Class R | ||||||||||||||||||||||||||||
06/30/2014 | 8.51 | 0.14 | 0.46 | 0.60 | (0.12 | ) | 0.00 | (0.12 | ) | |||||||||||||||||||
06/30/2013 | 8.68 | 0.23 | (0.13 | ) | 0.10 | (0.27 | ) | 0.00 | (0.27 | ) | ||||||||||||||||||
06/30/2012 | 9.88 | 0.09 | (1.27 | ) | (1.18 | ) | (0.02 | ) | 0.00 | (0.02 | ) | |||||||||||||||||
04/12/2011 - 06/30/2011 | 10.00 | 0.01 | (0.13 | ) | (0.12 | ) | 0.00 | 0.00 | 0.00 | |||||||||||||||||||
PIMCO EqS Pathfinder Fund® | ||||||||||||||||||||||||||||
| Institutional Class | ||||||||||||||||||||||||||||
06/30/2014 | $ | 10.82 | $ | 0.23 | $ | 2.39 | $ | 2.62 | $ | (0.18 | ) | $ | (0.23 | ) | $ | (0.41 | ) | |||||||||||
06/30/2013 | 10.11 | 0.25 | 0.77 | 1.02 | (0.31 | ) | 0.00 | (0.31 | ) | |||||||||||||||||||
06/30/2012 | 10.65 | 0.18 | (0.62 | ) | (0.44 | ) | (0.07 | ) | (0.03 | ) | (0.10 | ) | ||||||||||||||||
06/30/2011 | 9.23 | 0.19 | 1.34 | 1.53 | (0.09 | ) | (0.02 | ) | (0.11 | ) | ||||||||||||||||||
04/14/2010 - 06/30/2010 | 10.00 | 0.07 | (0.84 | ) | (0.77 | ) | 0.00 | 0.00 | 0.00 | |||||||||||||||||||
Please see footnotes on page 38.
| 36 | PIMCO EQUITY SERIES | See Accompanying Notes |
Table of Contents
| Net Asset Value End of Year or Period | Total Return | Net Assets End of Year or Period (000s) | Ratio of Expenses to Average Net Assets | Ratio of Expenses to Average Net Assets Excluding Waivers | Ratio of Expenses to Average Net Assets Excluding Interest Expense and Dividends on Securities Sold Short | Ratio of Expenses to Average Net Assets Excluding Interest Expense and Dividends on Securities Sold Short and Waivers | Ratio of Net Investment Income (Loss) to Average Net Assets | Portfolio Turnover Rate** | ||||||||||||||||||||||||||
| $ | 11.84 | 13.13 | % | $ | 77,934 | 2.31 | % | 2.33 | % | 1.83 | % | 1.85 | % | (1.01 | )% | 522 | % | |||||||||||||||||
| 11.06 | 14.31 | 12,421 | 3.95 | 4.05 | 1.75 | 1.85 | (0.97 | ) | 528 | |||||||||||||||||||||||||
| 9.70 | (3.00 | ) | 111 | 1.87 | * | 3.97 | * | 1.77 | * | 3.87 | * | (1.72 | )* | 113 | ||||||||||||||||||||
| 11.83 | 13.17 | 382,160 | 2.27 | 2.29 | 1.83 | 1.85 | (0.98 | ) | 522 | |||||||||||||||||||||||||
| 11.05 | 14.27 | 24,759 | 3.62 | 3.72 | 1.75 | 1.85 | (0.03 | ) | 528 | |||||||||||||||||||||||||
| 9.70 | (3.00 | ) | 1,219 | 1.87 | * | 3.17 | * | 1.74 | * | 3.04 | * | (1.70 | )* | 113 | ||||||||||||||||||||
| 11.67 | 12.26 | 214,485 | 3.00 | 3.02 | 2.58 | 2.60 | (1.71 | ) | 522 | |||||||||||||||||||||||||
| 10.98 | 13.41 | 9,530 | 4.04 | 4.14 | 2.50 | 2.60 | 0.13 | 528 | ||||||||||||||||||||||||||
| 9.69 | (3.10 | ) | 53 | 2.62 | * | 4.50 | * | 2.52 | * | 4.40 | * | (2.46 | )* | 113 | ||||||||||||||||||||
| $ | 9.11 | 7.73 | % | $ | 20,927 | 0.28 | % | 1.36 | % | 0.28 | % | 1.36 | % | 2.11 | % | 20 | % | |||||||||||||||||
| 8.60 | 1.60 | 36,051 | 0.35 | 1.36 | 0.35 | 1.36 | 2.62 | 53 | ||||||||||||||||||||||||||
| 8.71 | (11.45 | ) | 29,987 | 0.53 | 1.38 | 0.53 | 1.38 | 1.62 | 41 | |||||||||||||||||||||||||
| 9.89 | (1.10 | ) | 9,755 | 0.53 | * | 6.96 | * | 0.53 | * | 6.96 | * | 1.13 | * | 0 | ||||||||||||||||||||
| 9.08 | 7.61 | 1,580 | 0.38 | 1.46 | 0.38 | 1.46 | 1.92 | 20 | ||||||||||||||||||||||||||
| 8.58 | 1.53 | 1,998 | 0.45 | 1.46 | 0.45 | 1.46 | 2.62 | 53 | ||||||||||||||||||||||||||
| 8.69 | (11.69 | ) | 2,019 | 0.63 | 1.48 | 0.63 | 1.48 | 1.71 | 41 | |||||||||||||||||||||||||
| 9.90 | (1.00 | ) | 74 | 0.63 | * | 17.34 | * | 0.63 | * | 17.34 | * | 0.96 | * | 0 | ||||||||||||||||||||
| 9.03 | 7.31 | 23 | 0.53 | 1.61 | 0.53 | 1.61 | 2.13 | 20 | ||||||||||||||||||||||||||
| 8.55 | 1.35 | 2,051 | 0.60 | 1.61 | 0.60 | 1.61 | 1.60 | 53 | ||||||||||||||||||||||||||
| 8.69 | (11.75 | ) | 28 | 0.78 | 1.63 | 0.78 | 1.63 | 1.36 | 41 | |||||||||||||||||||||||||
| 9.89 | (1.30 | ) | 10 | 0.78 | * | 6.47 | * | 0.78 | * | 6.47 | * | 0.88 | * | 0 | ||||||||||||||||||||
| 9.07 | 7.46 | 2,466 | 0.63 | 1.71 | 0.63 | 1.71 | 1.78 | 20 | ||||||||||||||||||||||||||
| 8.57 | 1.17 | 5,669 | 0.70 | 1.71 | 0.70 | 1.71 | 2.23 | 53 | ||||||||||||||||||||||||||
| 8.70 | (11.77 | ) | 4,912 | 0.88 | 1.73 | 0.88 | 1.73 | 1.20 | 41 | |||||||||||||||||||||||||
| 9.89 | (1.10 | ) | 2,745 | 0.88 | * | 8.20 | * | 0.88 | * | 8.20 | * | 0.81 | * | 0 | ||||||||||||||||||||
| 9.04 | 7.49 | 7,874 | 0.63 | 1.71 | 0.63 | 1.71 | 1.70 | 20 | ||||||||||||||||||||||||||
| 8.54 | 1.12 | 12,333 | 0.70 | 1.71 | 0.70 | 1.71 | 2.46 | 53 | ||||||||||||||||||||||||||
| 8.68 | (11.72 | ) | 10,147 | 0.88 | 1.73 | 0.88 | 1.73 | 1.32 | 41 | |||||||||||||||||||||||||
| 9.88 | (1.20 | ) | 1,801 | 0.88 | * | 9.28 | * | 0.88 | * | 9.28 | * | 0.82 | * | 0 | ||||||||||||||||||||
| 8.91 | 6.56 | 3,799 | 1.38 | 2.46 | 1.38 | 2.46 | 0.96 | 20 | ||||||||||||||||||||||||||
| 8.46 | 0.56 | 5,101 | 1.45 | 2.46 | 1.45 | 2.46 | 1.68 | 53 | ||||||||||||||||||||||||||
| 8.62 | (12.51 | ) | 3,868 | 1.63 | 2.48 | 1.63 | 2.48 | 0.57 | 41 | |||||||||||||||||||||||||
| 9.88 | (1.20 | ) | 649 | 1.63 | * | 9.73 | * | 1.63 | * | 9.73 | * | 0.08 | * | 0 | ||||||||||||||||||||
| 8.99 | 7.17 | 9 | 0.88 | 1.96 | 0.88 | 1.96 | 1.61 | 20 | ||||||||||||||||||||||||||
| 8.51 | 0.96 | 30 | 0.95 | 1.96 | 0.95 | 1.96 | 2.47 | 53 | ||||||||||||||||||||||||||
| 8.68 | (11.98 | ) | 9 | 1.13 | 1.98 | 1.13 | 1.98 | 0.99 | 41 | |||||||||||||||||||||||||
| 9.88 | (1.20 | ) | 10 | 1.13 | * | 6.40 | * | 1.13 | * | 6.40 | * | 0.50 | * | 0 | ||||||||||||||||||||
| $ | 13.03 | 24.62 | % | $ | 1,255,320 | 0.89 | % | 1.06 | % | 0.89 | % | 1.06 | % | 1.96 | % | 61 | % | |||||||||||||||||
| 10.82 | 10.19 | 1,691,850 | 0.90 | 1.10 | 0.89 | 1.09 | 2.38 | 29 | ||||||||||||||||||||||||||
| 10.11 | (4.09 | ) | 1,930,637 | 0.92 | 1.09 | 0.90 | 1.07 | 1.80 | 32 | |||||||||||||||||||||||||
| 10.65 | 16.68 | 1,338,509 | 0.92 | 1.10 | 0.89 | 1.07 | 1.87 | 35 | ||||||||||||||||||||||||||
| 9.23 | (7.70 | ) | 542,879 | 0.98 | * | 1.21 | * | 0.89 | * | 1.12 | * | 3.53 | * | 4 | ||||||||||||||||||||
Please see footnotes on page 38.
| ANNUAL REPORT | JUNE 30, 2014 | 37 |
Table of Contents
Financial Highlights (Cont.)
| Selected Per Share Data for the Year or Period Ended: | | Net Investment Income (Loss) (a) | Net Realized/ Unrealized Gain (Loss) | Total Income (Loss) from Investment Operations | Dividends from Net Investment Income | Distributions from Net Realized Capital Gains | Total Distributions | |||||||||||||||||||||
PIMCO EqS Pathfinder Fund® (Cont.) | ||||||||||||||||||||||||||||
| Class P | ||||||||||||||||||||||||||||
06/30/2014 | $ | 10.80 | $ | 0.21 | $ | 2.38 | $ | 2.59 | $ | (0.17 | ) | $ | (0.23 | ) | $ | (0.40 | ) | |||||||||||
06/30/2013 | 10.09 | 0.25 | 0.76 | 1.01 | (0.30 | ) | 0.00 | (0.30 | ) | |||||||||||||||||||
06/30/2012 | 10.64 | 0.17 | (0.63 | ) | (0.46 | ) | (0.06 | ) | (0.03 | ) | (0.09 | ) | ||||||||||||||||
06/30/2011 | 9.23 | 0.18 | 1.34 | 1.52 | (0.09 | ) | (0.02 | ) | (0.11 | ) | ||||||||||||||||||
04/14/2010 - 06/30/2010 | 10.00 | 0.07 | (0.84 | ) | (0.77 | ) | 0.00 | 0.00 | 0.00 | |||||||||||||||||||
| Class D | ||||||||||||||||||||||||||||
06/30/2014 | 10.74 | 0.20 | 2.35 | 2.55 | (0.15 | ) | (0.23 | ) | (0.38 | ) | ||||||||||||||||||
06/30/2013 | 10.05 | 0.21 | 0.77 | 0.98 | (0.29 | ) | 0.00 | (0.29 | ) | |||||||||||||||||||
06/30/2012 | 10.61 | 0.13 | (0.61 | ) | (0.48 | ) | (0.05 | ) | (0.03 | ) | (0.08 | ) | ||||||||||||||||
06/30/2011 | 9.21 | 0.16 | 1.34 | 1.50 | (0.08 | ) | (0.02 | ) | (0.10 | ) | ||||||||||||||||||
04/14/2010 - 06/30/2010 | 10.00 | 0.06 | (0.85 | ) | (0.79 | ) | 0.00 | 0.00 | 0.00 | |||||||||||||||||||
| Class A | ||||||||||||||||||||||||||||
06/30/2014 | 10.78 | 0.21 | 2.35 | 2.56 | (0.16 | ) | (0.23 | ) | (0.39 | ) | ||||||||||||||||||
06/30/2013 | 10.08 | 0.22 | 0.76 | 0.98 | (0.28 | ) | 0.00 | (0.28 | ) | |||||||||||||||||||
06/30/2012 | 10.64 | 0.14 | (0.62 | ) | (0.48 | ) | (0.05 | ) | (0.03 | ) | (0.08 | ) | ||||||||||||||||
06/30/2011 | 9.22 | 0.17 | 1.33 | 1.50 | (0.06 | ) | (0.02 | ) | (0.08 | ) | ||||||||||||||||||
04/14/2010 - 06/30/2010 | 10.00 | 0.07 | (0.85 | ) | (0.78 | ) | 0.00 | 0.00 | 0.00 | |||||||||||||||||||
| Class C | ||||||||||||||||||||||||||||
06/30/2014 | 10.60 | 0.13 | 2.30 | 2.43 | (0.12 | ) | (0.23 | ) | (0.35 | ) | ||||||||||||||||||
06/30/2013 | 9.96 | 0.13 | 0.75 | 0.88 | (0.24 | ) | 0.00 | (0.24 | ) | |||||||||||||||||||
06/30/2012 | 10.55 | 0.06 | (0.61 | ) | (0.55 | ) | (0.01 | ) | (0.03 | ) | (0.04 | ) | ||||||||||||||||
06/30/2011 | 9.21 | 0.11 | 1.31 | 1.42 | (0.06 | ) | (0.02 | ) | (0.08 | ) | ||||||||||||||||||
04/14/2010 - 06/30/2010 | 10.00 | 0.05 | (0.84 | ) | (0.79 | ) | 0.00 | 0.00 | 0.00 | |||||||||||||||||||
| Class R | ||||||||||||||||||||||||||||
06/30/2014 | 10.66 | 0.24 | 2.26 | 2.50 | (0.14 | ) | (0.23 | ) | (0.37 | ) | ||||||||||||||||||
06/30/2013 | 10.00 | 0.20 | 0.74 | 0.94 | (0.28 | ) | 0.00 | (0.28 | ) | |||||||||||||||||||
06/30/2012 | 10.59 | 0.07 | (0.59 | ) | (0.52 | ) | (0.04 | ) | (0.03 | ) | (0.07 | ) | ||||||||||||||||
06/30/2011 | 9.21 | 0.12 | 1.35 | 1.47 | (0.07 | ) | (0.02 | ) | (0.09 | ) | ||||||||||||||||||
04/14/2010 - 06/30/2010 | 10.00 | 0.06 | (0.85 | ) | (0.79 | ) | 0.00 | 0.00 | 0.00 | |||||||||||||||||||
| * | Annualized |
| ** | The ratio excludes PIMCO Short-Term Floating NAV Portfolio. |
| ^ | Reflects an amount rounding to less than one cent. |
| † | Reflects an amount rounding to less than 0.005%. |
| (a) | Per share amounts based on average number of shares outstanding during the year or period. |
| 38 | PIMCO EQUITY SERIES | See Accompanying Notes |
Table of Contents
| Net Asset Value End of Year or Period | Total Return | Net Assets End of Year or Period (000s) | Ratio of Expenses to Average Net Assets | Ratio of Expenses to Average Net Assets Excluding Waivers | Ratio of Expenses to Average Net Assets Excluding Interest Expense and Dividends on Securities Sold Short | Ratio of Expenses to Average Net Assets Excluding Interest Expense and Dividends on Securities Sold Short and Waivers | Ratio of Net Investment Income (Loss) to Average Net Assets | Portfolio Turnover Rate** | ||||||||||||||||||||||||||
| $ | 12.99 | 24.40 | % | $ | 31,119 | 0.99 | % | 1.16 | % | 0.99 | % | 1.16 | % | 1.76 | % | 61 | % | |||||||||||||||||
| 10.80 | 10.12 | 62,479 | 1.00 | 1.20 | 0.99 | 1.19 | 2.34 | 29 | ||||||||||||||||||||||||||
| 10.09 | (4.23 | ) | 67,977 | 1.02 | 1.19 | 1.00 | 1.17 | 1.70 | 32 | |||||||||||||||||||||||||
| 10.64 | 16.55 | 45,785 | 1.02 | 1.20 | 0.99 | 1.17 | 1.72 | 35 | ||||||||||||||||||||||||||
| 9.23 | (7.70 | ) | 970 | 1.08 | * | 1.31 | * | 0.99 | * | 1.22 | * | 3.36 | * | 4 | ||||||||||||||||||||
| 12.91 | 24.20 | 14,013 | 1.24 | 1.41 | 1.24 | 1.41 | 1.67 | 61 | ||||||||||||||||||||||||||
| 10.74 | 9.89 | 17,730 | 1.25 | 1.45 | 1.24 | 1.44 | 2.01 | 29 | ||||||||||||||||||||||||||
| 10.05 | (4.52 | ) | 18,469 | 1.27 | 1.45 | 1.26 | 1.42 | 1.33 | 32 | |||||||||||||||||||||||||
| 10.61 | 16.39 | 24,352 | 1.27 | 1.45 | 1.24 | 1.42 | 1.55 | 35 | ||||||||||||||||||||||||||
| 9.21 | (7.90 | ) | 7,084 | 1.33 | * | 1.56 | * | 1.24 | * | 1.47 | * | 3.13 | * | 4 | ||||||||||||||||||||
| 12.95 | 24.12 | 82,689 | 1.24 | 1.41 | 1.24 | 1.41 | 1.80 | 61 | ||||||||||||||||||||||||||
| 10.78 | 9.88 | 59,746 | 1.25 | 1.45 | 1.24 | 1.44 | 2.04 | 29 | ||||||||||||||||||||||||||
| 10.08 | (4.50 | ) | 69,910 | 1.27 | 1.43 | 1.26 | 1.42 | 1.37 | 32 | |||||||||||||||||||||||||
| 10.64 | 16.30 | 89,571 | 1.27 | 1.45 | 1.24 | 1.42 | 1.64 | 35 | ||||||||||||||||||||||||||
| 9.22 | (7.80 | ) | 15,436 | 1.33 | * | 1.56 | * | 1.24 | * | 1.47 | * | 3.28 | * | 4 | ||||||||||||||||||||
| 12.68 | 23.33 | 60,184 | 1.99 | 2.16 | 1.99 | 2.16 | 1.10 | 61 | ||||||||||||||||||||||||||
| 10.60 | 8.95 | 35,754 | 2.00 | 2.20 | 1.99 | 2.19 | 1.24 | 29 | ||||||||||||||||||||||||||
| 9.96 | (5.15 | ) | 47,006 | 2.02 | 2.21 | 2.00 | 2.17 | 0.65 | 32 | |||||||||||||||||||||||||
| 10.55 | 15.50 | 50,672 | 2.02 | 2.20 | 1.99 | 2.17 | 1.04 | 35 | ||||||||||||||||||||||||||
| 9.21 | (7.90 | ) | 6,668 | 2.08 | * | 2.31 | * | 1.99 | * | 2.22 | * | 2.43 | * | 4 | ||||||||||||||||||||
| 12.79 | 23.91 | 65 | 1.49 | 1.66 | 1.49 | 1.66 | 1.98 | 61 | ||||||||||||||||||||||||||
| 10.66 | 9.48 | 15 | 1.50 | 1.70 | 1.49 | 1.69 | 1.92 | 29 | ||||||||||||||||||||||||||
| 10.00 | (4.86 | ) | 11 | 1.52 | 1.67 | 1.51 | 1.66 | 0.71 | 32 | |||||||||||||||||||||||||
| 10.59 | 16.02 | 102 | 1.52 | 1.70 | 1.49 | 1.67 | 1.21 | 35 | ||||||||||||||||||||||||||
| 9.21 | (7.90 | ) | 9 | 1.58 | * | 1.81 | * | 1.49 | * | 1.72 | * | 2.91 | * | 4 | ||||||||||||||||||||
| ANNUAL REPORT | JUNE 30, 2014 | 39 |
Table of Contents
Statements of Assets and Liabilities
| (Amounts in thousands, except per share amounts) | PIMCO Balanced Income Fund | PIMCO Dividend and Income Builder Fund | PIMCO EqS® Dividend Fund | PIMCO EqS® Emerging Markets Fund | PIMCO EqS® Long/Short Fund | |||||||||||||||
Assets: | ||||||||||||||||||||
Investments, at value | ||||||||||||||||||||
Investments in securities* | $ | 6,086 | $ | 938,046 | $ | 408,379 | $ | 106,606 | $ | 1,161,616 | ||||||||||
Investments in Affiliates | 980 | 19,329 | 3,054 | 519 | 402,024 | |||||||||||||||
Financial Derivative Instruments | ||||||||||||||||||||
Exchange-traded or centrally cleared | 0 | 1 | 0 | 0 | 270 | |||||||||||||||
Over the counter | 2 | 208 | 145 | 4,820 | 195 | |||||||||||||||
Cash | 334 | 700 | 1 | 627 | 1,186 | |||||||||||||||
Deposits with counterparty | 0 | 0 | 0 | 0 | 36,372 | |||||||||||||||
Foreign currency, at value | 34 | 5,028 | 852 | 136 | 9 | |||||||||||||||
Receivable for investments sold | 0 | 628 | 0 | 11,565 | 40,739 | |||||||||||||||
Receivable for Fund shares sold | 23 | 2,627 | 893 | 335 | 2,656 | |||||||||||||||
Interest and dividends receivable | 26 | 4,143 | 2,506 | 489 | 661 | |||||||||||||||
Dividends receivable from Affiliates | 0 | 5 | 0 | 1 | 81 | |||||||||||||||
Reimbursement receivable from PIMCO | 0 | 0 | 0 | 0 | 9 | |||||||||||||||
| 7,485 | 970,715 | 415,830 | 125,098 | 1,645,818 | ||||||||||||||||
Liabilities: | ||||||||||||||||||||
Borrowings & Other Financing Transactions | ||||||||||||||||||||
Payable for short sales | $ | 0 | $ | 0 | $ | 0 | $ | 0 | $ | 71,454 | ||||||||||
Financial Derivative Instruments | ||||||||||||||||||||
Exchange-traded or centrally cleared | 0 | 48 | 0 | 0 | 2,620 | |||||||||||||||
Over the counter | 14 | 148 | 111 | 2,848 | 4,183 | |||||||||||||||
Payable for investments purchased | 345 | 9,064 | 2,262 | 1,250 | 63,945 | |||||||||||||||
Payable for investments in Affiliates purchased | 0 | 5 | 0 | 1 | 81 | |||||||||||||||
Deposits from counterparty | 0 | 290 | 0 | 3,460 | 0 | |||||||||||||||
Payable for Fund shares redeemed | 3 | 2,368 | 530 | 0 | 3,737 | |||||||||||||||
Dividends payable | 0 | 2,191 | 26 | 0 | 0 | |||||||||||||||
Accrued investment advisory fees | 2 | 396 | 174 | 80 | 1,245 | |||||||||||||||
Accrued supervisory and administrative fees | 1 | 292 | 107 | 45 | 615 | |||||||||||||||
Accrued distribution fees | 0 | 215 | 25 | 1 | 143 | |||||||||||||||
Accrued servicing fees | 0 | 132 | 19 | 2 | 120 | |||||||||||||||
Reimbursement to PIMCO | 0 | 0 | 12 | 14 | 0 | |||||||||||||||
Other liabilities | 0 | 48 | 24 | 48 | 89 | |||||||||||||||
| 365 | 15,197 | 3,290 | 7,749 | 148,232 | ||||||||||||||||
Net Assets | $ | 7,120 | $ | 955,518 | $ | 412,540 | $ | 117,349 | $ | 1,497,586 | ||||||||||
Net Assets Consist of: | ||||||||||||||||||||
Paid in capital | $ | 7,030 | $ | 862,526 | $ | 329,291 | $ | 154,156 | $ | 1,450,048 | ||||||||||
Undistributed (overdistributed) net investment income | 4 | 312 | (26 | ) | (3,484 | ) | (5,712 | ) | ||||||||||||
Accumulated undistributed net realized gain (loss) | 0 | 12,634 | 32,959 | (35,115 | ) | (30,053 | ) | |||||||||||||
Net unrealized appreciation | 86 | 80,046 | 50,316 | 1,792 | 83,303 | |||||||||||||||
| $ | 7,120 | $ | 955,518 | $ | 412,540 | $ | 117,349 | $ | 1,497,586 | |||||||||||
Cost of Investments in Securities | $ | 5,995 | $ | 857,865 | $ | 358,137 | $ | 106,786 | $ | 1,071,283 | ||||||||||
Cost of Investments in Affiliates | $ | 980 | $ | 19,328 | $ | 3,054 | $ | 519 | $ | 401,987 | ||||||||||
Cost of Foreign Currency Held | $ | 34 | $ | 5,056 | $ | 854 | $ | 135 | $ | 9 | ||||||||||
Proceeds Received on Short Sales | $ | 0 | $ | 0 | $ | 0 | $ | 0 | $ | 70,544 | ||||||||||
Cost or Premiums of Financial Derivative Instruments, net | $ | (7 | ) | $ | 21 | $ | 0 | $ | 0 | $ | (164 | ) | ||||||||
* Includes repurchase agreements of: | $ | 200 | $ | 3,787 | $ | 136 | $ | 0 | $ | 0 | ||||||||||
| 40 | PIMCO EQUITY SERIES | See Accompanying Notes |
Table of Contents
June 30, 2014
| (Amounts in thousands, except per share amounts) | PIMCO Balanced Income Fund | PIMCO Dividend and Income Builder Fund | PIMCO EqS® Dividend Fund | PIMCO EqS® Emerging Markets Fund | PIMCO EqS® Long/Short Fund | |||||||||||||||
Net Assets: | ||||||||||||||||||||
Institutional Class | $ | 6,284 | $ | 90,408 | $ | 302,088 | $ | 108,018 | $ | 545,346 | ||||||||||
Class P | 11 | 158,122 | 3,652 | 70 | 277,661 | |||||||||||||||
Administrative Class | NA | NA | NA | 3 | NA | |||||||||||||||
Class D | 45 | 32,523 | 7,709 | 827 | 77,934 | |||||||||||||||
Class A | 319 | 320,719 | 59,540 | 6,393 | 382,160 | |||||||||||||||
Class C | 461 | 353,287 | 39,359 | 2,028 | 214,485 | |||||||||||||||
Class R | NA | 459 | 192 | 10 | NA | |||||||||||||||
Shares Issued and Outstanding: | ||||||||||||||||||||
Institutional Class | 614 | 6,890 | 23,579 | 11,940 | 45,764 | |||||||||||||||
Class P | 1 | 12,043 | 285 | 8 | 23,371 | |||||||||||||||
Administrative Class | NA | NA | NA | 0 | NA | |||||||||||||||
Class D | 4 | 2,479 | 602 | 92 | 6,584 | |||||||||||||||
Class A | 31 | 24,446 | 4,645 | 714 | 32,312 | |||||||||||||||
Class C | 45 | 26,976 | 3,082 | 231 | 18,376 | |||||||||||||||
Class R | NA | 35 | 15 | 1 | NA | |||||||||||||||
Net Asset Value and Redemption Price^ Per Share Outstanding: | ||||||||||||||||||||
Institutional Class | $ | 10.24 | $ | 13.12 | $ | 12.81 | $ | 9.05 | $ | 11.92 | ||||||||||
Class P | 10.24 | 13.13 | 12.82 | 9.02 | 11.88 | |||||||||||||||
Administrative Class | NA | NA | NA | 9.00 | NA | |||||||||||||||
Class D | 10.25 | 13.12 | 12.81 | 8.95 | 11.84 | |||||||||||||||
Class A | 10.25 | 13.12 | 12.82 | 8.96 | 11.83 | |||||||||||||||
Class C | 10.25 | 13.10 | 12.77 | 8.79 | 11.67 | |||||||||||||||
Class R | NA | 13.12 | 12.81 | 8.92 | NA | |||||||||||||||
| ^ | With respect to the A and C Classes, the redemption price varies by the length of time the shares are held. |
| ANNUAL REPORT | JUNE 30, 2014 | 41 |
Table of Contents
Consolidated Statements of Assets and Liabilities
(Amounts in thousands, except per share amounts) | | PIMCO Emerging Multi-Asset Fund | | | PIMCO EqS Pathfinder Fund | ® | ||
Assets: | ||||||||
Investments, at value | ||||||||
Investments in securities* | $ | 622 | $ | 1,310,674 | ||||
Investments in Affiliates | 36,378 | 133,858 | ||||||
Financial Derivative Instruments | ||||||||
Exchange-traded or centrally cleared | 86 | 0 | ||||||
Over the counter | 137 | 9,401 | ||||||
Cash | 0 | 10 | ||||||
Deposits with counterparty | 42 | 11,849 | ||||||
Foreign currency, at value | 32 | 2,654 | ||||||
Receivable for investments sold | 30 | 2,492 | ||||||
Receivable for Fund shares sold | 26 | 360 | ||||||
Interest and dividends receivable | 0 | 2,545 | ||||||
Dividends receivable from Affiliates | 70 | 23 | ||||||
| 37,423 | 1,473,866 | |||||||
Liabilities: | ||||||||
Borrowings & Other Financing Transactions | ||||||||
Payable for short sales | $ | 0 | $ | 13,273 | ||||
Financial Derivative Instruments | ||||||||
Exchange-traded or centrally cleared | 50 | 0 | ||||||
Over the counter | 103 | 4,463 | ||||||
Payable for investments purchased | 0 | 4,943 | ||||||
Payable for investments in Affiliates purchased | 70 | 23 | ||||||
Deposits from counterparty | 0 | 6,410 | ||||||
Payable for Fund shares redeemed | 500 | 146 | ||||||
Overdraft due to custodian | 3 | 0 | ||||||
Accrued investment advisory fees | 0 | 671 | ||||||
Accrued supervisory and administrative fees | 12 | 356 | ||||||
Accrued distribution fees | 3 | 38 | ||||||
Accrued servicing fees | 2 | 28 | ||||||
Reimbursement to PIMCO | 1 | 52 | ||||||
Other liabilities | 1 | 73 | ||||||
| 745 | 30,476 | |||||||
Net Assets | $ | 36,678 | $ | 1,443,390 | ||||
Net Assets Consist of: | ||||||||
Paid in capital | $ | 41,205 | $ | 984,131 | ||||
Undistributed (overdistributed) net investment income | 576 | (5,845 | ) | |||||
Accumulated undistributed net realized gain (loss) | (4,183 | ) | 253,235 | |||||
Net unrealized appreciation (depreciation) | (920 | ) | 211,869 | |||||
| $ | 36,678 | $ | 1,443,390 | |||||
Cost of Investments in Securities | $ | 622 | $ | 1,102,536 | ||||
Cost of Investments in Affiliates | $ | 37,325 | $ | 133,856 | ||||
Cost of Foreign Currency Held | $ | 31 | $ | 2,632 | ||||
Proceeds Received on Short Sales | $ | 0 | $ | 11,966 | ||||
Cost or Premiums of Financial Derivative Instruments, net | $ | 50 | $ | 0 | ||||
* Includes repurchase agreements of: | $ | 260 | $ | 641 | ||||
| 42 | PIMCO EQUITY SERIES | See Accompanying Notes |
Table of Contents
June 30, 2014
| (Amounts in thousands, except per share amounts) | PIMCO Emerging Multi-Asset Fund | PIMCO EqS Pathfinder Fund® | ||||||
Net Assets: | ||||||||
Institutional Class | $ | 20,927 | $ | 1,255,320 | ||||
Class P | 1,580 | 31,119 | ||||||
Administrative Class | 23 | NA | ||||||
Class D | 2,466 | 14,013 | ||||||
Class A | 7,874 | 82,689 | ||||||
Class C | 3,799 | 60,184 | ||||||
Class R | 9 | 65 | ||||||
Shares Issued and Outstanding: | ||||||||
Institutional Class | 2,298 | 96,330 | ||||||
Class P | 174 | 2,396 | ||||||
Administrative Class | 3 | NA | ||||||
Class D | 272 | 1,086 | ||||||
Class A | 871 | 6,384 | ||||||
Class C | 426 | 4,747 | ||||||
Class R | 1 | 5 | ||||||
Net Asset Value and Redemption Price^ Per Share Outstanding: | ||||||||
Institutional Class | $ | 9.11 | $ | 13.03 | ||||
Class P | 9.08 | 12.99 | ||||||
Administrative Class | 9.03 | NA | ||||||
Class D | 9.07 | 12.91 | ||||||
Class A | 9.04 | 12.95 | ||||||
Class C | 8.91 | 12.68 | ||||||
Class R | 8.99 | 12.79 | ||||||
| ^ | With respect to the A and C Classes, the redemption price varies by the length of time the shares are held. |
| ANNUAL REPORT | JUNE 30, 2014 | 43 |
Table of Contents
| Year or Period Ended June 30, 2014 | ||||||||||||||||||||
| (Amounts in thousands) | PIMCO Balanced Income Fund (1) | PIMCO Dividend and Income Builder Fund | PIMCO EqS® Dividend Fund | PIMCO EqS® Emerging Markets Fund | PIMCO EqS® Long/Short Fund | |||||||||||||||
Investment Income: | ||||||||||||||||||||
Interest | $ | 11 | $ | 3,109 | $ | 0 | $ | 9 | $ | 62 | ||||||||||
Dividends, net of foreign taxes* | 30 | 30,586 | 23,350 | 6,796 | 11,983 | |||||||||||||||
Dividends from Investments in Affiliates | 0 | 78 | 28 | 77 | 490 | |||||||||||||||
Total Income | 41 | 33,773 | 23,378 | 6,882 | 12,535 | |||||||||||||||
Expenses: | ||||||||||||||||||||
Investment advisory fees | 6 | 5,141 | 3,945 | 3,909 | 10,487 | |||||||||||||||
Supervisory and administrative fees | 3 | 2,899 | 1,815 | 1,772 | 5,077 | |||||||||||||||
Distribution and/or servicing fees - Class D | 0 | 75 | 25 | 3 | 154 | |||||||||||||||
Distribution fees - Class C | 0 | 1,955 | 255 | 12 | 875 | |||||||||||||||
Distribution fees - Class R | 0 | 1 | 0 | 0 | 0 | |||||||||||||||
Servicing fees - Class A | 0 | 628 | 129 | 14 | 556 | |||||||||||||||
Servicing fees - Class C | 0 | 651 | 85 | 4 | 292 | |||||||||||||||
Servicing fees - Class R | 0 | 1 | 0 | 0 | 0 | |||||||||||||||
Dividends on short sales | 0 | 0 | 0 | 0 | 3,889 | |||||||||||||||
Trustee fees | 0 | 36 | 14 | 3 | 58 | |||||||||||||||
Organization expense | 150 | 0 | 0 | 0 | 0 | |||||||||||||||
Interest expense | 0 | 4 | 3 | 7 | 1,008 | |||||||||||||||
Miscellaneous expense | 0 | 37 | 30 | 21 | 50 | |||||||||||||||
Total Expenses | 159 | 11,428 | 6,301 | 5,745 | 22,446 | |||||||||||||||
Waiver and/or Reimbursement by PIMCO | (151 | ) | (1,229 | ) | (931 | ) | (787 | ) | (216 | ) | ||||||||||
Net Expenses | 8 | 10,199 | 5,370 | 4,958 | 22,230 | |||||||||||||||
Net Investment Income (Loss) | 33 | 23,574 | 18,008 | 1,924 | (9,695 | ) | ||||||||||||||
Net Realized Gain (Loss): | ||||||||||||||||||||
Investments in securities | (2 | ) | 10,830 | 55,730 | 5,885 | 48,767 | ||||||||||||||
Investments in Affiliates | 0 | (2 | ) | (3 | ) | (11 | ) | (4 | ) | |||||||||||
Exchange-traded or centrally cleared financial derivative instruments | 1 | 1,801 | (1,190 | ) | (1,420 | ) | (13,344 | ) | ||||||||||||
Over the counter financial derivative instruments | 0 | 2,222 | 1,560 | (9,653 | ) | 749 | ||||||||||||||
Short sales | 0 | 0 | 0 | 0 | (25,210 | ) | ||||||||||||||
Foreign currency | 1 | 50 | 53 | 152 | 87 | |||||||||||||||
Net Realized Gain (Loss) | 0 | 14,901 | 56,150 | (5,047 | ) | 11,045 | ||||||||||||||
Net Change in Unrealized Appreciation (Depreciation): | ||||||||||||||||||||
Investments in securities | 91 | 73,276 | 18,058 | 21,406 | 75,095 | |||||||||||||||
Investments in Affiliates | 0 | (1 | ) | 0 | 0 | 36 | ||||||||||||||
Exchange-traded or centrally cleared financial derivative instruments | 0 | (48 | ) | (217 | ) | 0 | (4,383 | ) | ||||||||||||
Over the counter financial derivative instruments | (5 | ) | (295 | ) | (134 | ) | 8,933 | (4,189 | ) | |||||||||||
Short sales | 0 | 0 | 0 | 0 | (7,525 | ) | ||||||||||||||
Foreign currency assets and liabilities | 0 | 34 | 150 | (26 | ) | 246 | ||||||||||||||
Net Change in Unrealized Appreciation | 86 | 72,966 | 17,857 | 30,313 | 59,280 | |||||||||||||||
Net Gain | 86 | 87,867 | 74,007 | 25,266 | 70,325 | |||||||||||||||
Net Increase in Net Assets Resulting from Operations | $ | 119 | $ | 111,441 | $ | 92,015 | $ | 27,190 | $ | 60,630 | ||||||||||
* Foreign tax withholdings - Dividends | $ | 1 | $ | 1,555 | $ | 1,124 | $ | 673 | $ | 17 | ||||||||||
| (1) | Period from March 31, 2014 to June 30, 2014. |
| 44 | PIMCO EQUITY SERIES | See Accompanying Notes |
Table of Contents
Consolidated Statements of Operations
| Year Ended June 30, 2014 | ||||||||
| (Amounts in thousands) | PIMCO Emerging Multi-Asset Fund | PIMCO EqS Pathfinder Fund® | ||||||
Investment Income: | ||||||||
Interest | $ | 0 | $ | 3 | ||||
Dividends, net of foreign taxes* | 0 | 62,904 | ||||||
Dividends from Investments in Affiliates | 1,204 | 323 | ||||||
Total Income | 1,204 | 63,230 | ||||||
Expenses: | ||||||||
Investment advisory fees | 457 | 16,570 | ||||||
Supervisory and administrative fees | 250 | 6,827 | ||||||
Distribution and/or servicing fees - Administrative Class | 3 | 0 | ||||||
Distribution and/or servicing fees - Class D | 13 | 40 | ||||||
Distribution fees - Class C | 33 | 372 | ||||||
Servicing fees - Class A | 27 | 182 | ||||||
Servicing fees - Class C | 11 | 124 | ||||||
Dividends on short sales | 0 | 88 | ||||||
Trustee fees | 1 | 50 | ||||||
Interest expense | 0 | 28 | ||||||
Miscellaneous expense | 3 | 114 | ||||||
Total Expenses | 798 | 24,395 | ||||||
Waiver and/or Reimbursement by PIMCO | (547 | ) | (3,668 | ) | ||||
Net Expenses | 251 | 20,727 | ||||||
Net Investment Income | 953 | 42,503 | ||||||
Net Realized Gain (Loss): | ||||||||
Investments in securities | 156 | 382,252 | ||||||
Investments in Affiliates | (2,552 | ) | 35 | |||||
Net capital gain distributions received from Affiliate investments | 241 | 0 | ||||||
Exchange-traded or centrally cleared financial derivative instruments | (342 | ) | 780 | |||||
Over the counter financial derivative instruments | 90 | (27,857 | ) | |||||
Short sales | 0 | (2,059 | ) | |||||
Foreign currency | (1 | ) | 1,378 | |||||
Net Realized Gain (Loss) | (2,408 | ) | 354,529 | |||||
Net Change in Unrealized Appreciation (Depreciation): | ||||||||
Investments in securities | 0 | 36,000 | ||||||
Investments in Affiliates | 4,041 | 2 | ||||||
Exchange-traded or centrally cleared financial derivative instruments | 35 | (935 | ) | |||||
Over the counter financial derivative instruments | 134 | 4,424 | ||||||
Short sales | 0 | (1,110 | ) | |||||
Foreign currency assets and liabilities | 2 | 153 | ||||||
Net Change in Unrealized Appreciation | 4,212 | 38,534 | ||||||
Net Gain | 1,804 | 393,063 | ||||||
Net Increase in Net Assets Resulting from Operations | $ | 2,757 | $ | 435,566 | ||||
* Foreign tax withholdings - Dividends | $ | 0 | $ | 4,080 | ||||
| ANNUAL REPORT | JUNE 30, 2014 | 45 |
Table of Contents
Statements of Changes in Net Assets
| PIMCO Balanced Income Fund | PIMCO Dividend and Income Builder Fund | PIMCO EqS® Dividend Fund | ||||||||||||||||||
| (Amounts in thousands) | Period from | Year Ended June 30, 2014 | Year Ended June 30, 2013 | Year Ended June 30, 2014 | Year Ended June 30, 2013 | |||||||||||||||
Increase (Decrease) in Net Assets from: | ||||||||||||||||||||
Operations: | ||||||||||||||||||||
Net investment income (loss) | $ | 33 | $ | 23,574 | $ | 6,920 | $ | 18,008 | $ | 18,361 | ||||||||||
Net realized gain (loss) | 0 | 14,901 | (1,730 | ) | 56,150 | 18,234 | ||||||||||||||
Net change in unrealized appreciation | 86 | 72,966 | 7,508 | 17,857 | 33,325 | |||||||||||||||
Net increase resulting from operations | 119 | 111,441 | 12,698 | 92,015 | 69,920 | |||||||||||||||
Distributions to Shareholders: | ||||||||||||||||||||
From net investment income | ||||||||||||||||||||
Institutional Class | (27 | ) | (3,023 | ) | (1,472 | ) | (18,034 | ) | (16,060 | ) | ||||||||||
Class P | (0 | )^ | (4,522 | ) | (1,556 | ) | (152 | ) | (30 | ) | ||||||||||
Administrative Class | 0 | 0 | 0 | 0 | 0 | |||||||||||||||
Class D | (0 | )^ | (1,018 | ) | (604 | ) | (362 | ) | (149 | ) | ||||||||||
Class A | (1 | ) | (8,804 | ) | (1,667 | ) | (1,892 | ) | (359 | ) | ||||||||||
Class C | (1 | ) | (7,339 | ) | (860 | ) | (1,007 | ) | (161 | ) | ||||||||||
Class R | 0 | (12 | ) | (8 | ) | (4 | ) | (1 | ) | |||||||||||
From net realized capital gains | ||||||||||||||||||||
Institutional Class | 0 | 0 | (52 | ) | (25,541 | ) | (839 | ) | ||||||||||||
Class P | 0 | 0 | (48 | ) | (199 | ) | (2 | ) | ||||||||||||
Class D | 0 | 0 | (28 | ) | (465 | ) | (9 | ) | ||||||||||||
Class A | 0 | 0 | (60 | ) | (2,702 | ) | (18 | ) | ||||||||||||
Class C | 0 | 0 | (36 | ) | (1,844 | ) | (7 | ) | ||||||||||||
Class R | 0 | 0 | (0 | )^ | (5 | ) | (0 | )^ | ||||||||||||
Total Distributions | (29 | ) | (24,718 | ) | (6,391 | ) | (52,207 | ) | (17,635 | ) | ||||||||||
Portfolio Share Transactions: | ||||||||||||||||||||
Net increase (decrease) resulting from Fund share transactions** | 7,030 | 485,989 | 333,087 | (257,681 | ) | 257,478 | ||||||||||||||
Total Increase (Decrease) in Net Assets | 7,120 | 572,712 | 339,394 | (217,873 | ) | 309,763 | ||||||||||||||
Net Assets: | ||||||||||||||||||||
Beginning of year or period | 0 | 382,806 | 43,412 | 630,413 | 320,650 | |||||||||||||||
End of year or period* | $ | 7,120 | $ | 955,518 | $ | 382,806 | $ | 412,540 | $ | 630,413 | ||||||||||
* Including undistributed (overdistributed) net investment income of: | $ | 4 | $ | 312 | $ | 1,179 | $ | (26 | ) | $ | 2,827 | |||||||||
| ** | See Note 13 in the Notes to Financial Statements. |
| ^ | Amount is less than $500. |
| 46 | PIMCO EQUITY SERIES | See Accompanying Notes |
Table of Contents
| PIMCO EqS® Emerging Markets Fund | PIMCO EqS® Long/Short Fund | |||||||||||||
| Year Ended June 30, 2014 | Year Ended June 30, 2013 | Year Ended June 30, 2014 | Year Ended June 30, 2013 | |||||||||||
| $ | 1,924 | $ | 8,322 | $ | (9,695 | ) | $ | 3,879 | ||||||
| (5,047 | ) | 627 | 11,045 | 15,236 | ||||||||||
| 30,313 | 17,587 | 59,280 | 21,700 | |||||||||||
| 27,190 | 26,536 | 60,630 | 40,815 | |||||||||||
| 0 | (5,839 | ) | (2,688 | ) | (1,029 | ) | ||||||||
| 0 | (2 | ) | (663 | ) | (9 | ) | ||||||||
| 0 | (0 | )^ | 0 | 0 | ||||||||||
| 0 | (10 | ) | (316 | ) | (2 | ) | ||||||||
| 0 | (33 | ) | (1,080 | ) | (15 | ) | ||||||||
| 0 | (6 | ) | (464 | ) | (2 | ) | ||||||||
| 0 | (0 | )^ | 0 | 0 | ||||||||||
| 0 | 0 | (23,512 | ) | 0 | ||||||||||
| 0 | 0 | (4,678 | ) | 0 | ||||||||||
| 0 | 0 | (2,765 | ) | 0 | ||||||||||
| 0 | 0 | (8,208 | ) | 0 | ||||||||||
| 0 | 0 | (4,823 | ) | 0 | ||||||||||
| 0 | 0 | 0 | 0 | |||||||||||
| 0 | (5,890 | ) | (49,197 | ) | (1,057 | ) | ||||||||
| (420,487 | ) | (29,138 | ) | 1,094,169 | 138,604 | |||||||||
| (393,297 | ) | (8,492 | ) | 1,105,602 | 178,362 | |||||||||
| 510,646 | 519,138 | 391,984 | 213,622 | |||||||||||
| $ | 117,349 | $ | 510,646 | $ | 1,497,586 | $ | 391,984 | |||||||
| $ | (3,484 | ) | $ | 1,664 | $ | (5,712 | ) | $ | 4,891 | |||||
| ANNUAL REPORT | JUNE 30, 2014 | 47 |
Table of Contents
Consolidated Statements of Changes in Net Assets
| PIMCO Emerging Multi-Asset Fund | PIMCO EqS Pathfinder Fund® | |||||||||||||||
| (Amounts in thousands) | Year Ended | Year Ended June 30, 2013 | Year Ended June 30, 2014 | Year Ended June 30, 2013 | ||||||||||||
Increase (Decrease) in Net Assets from: | ||||||||||||||||
Operations: | ||||||||||||||||
Net investment income | $ | 953 | $ | 1,478 | $ | 42,503 | $ | 49,210 | ||||||||
Net realized gain (loss) | (2,408 | ) | (886 | ) | 354,529 | (1,580 | ) | |||||||||
Net change in unrealized appreciation (depreciation) | 4,212 | (1,976 | ) | 38,534 | 160,637 | |||||||||||
Net increase (decrease) resulting from operations | 2,757 | (1,384 | ) | 435,566 | 208,267 | |||||||||||
Distributions to Shareholders: | ||||||||||||||||
From net investment income | ||||||||||||||||
Institutional Class | (469 | ) | (773 | ) | (38,137 | ) | (58,239 | ) | ||||||||
Class P | (33 | ) | (47 | ) | (1,112 | ) | (1,444 | ) | ||||||||
Administrative Class | (31 | ) | (2 | ) | 0 | 0 | ||||||||||
Class D | (89 | ) | (84 | ) | (237 | ) | (632 | ) | ||||||||
Class A | (175 | ) | (327 | ) | (976 | ) | (1,599 | ) | ||||||||
Class C | (53 | ) | (104 | ) | (539 | ) | (920 | ) | ||||||||
Class R | (0 | )^ | (1 | ) | (0 | )^ | (0 | )^ | ||||||||
From net realized capital gains | ||||||||||||||||
Institutional Class | 0 | 0 | (49,062 | ) | 0 | |||||||||||
Class P | 0 | 0 | (1,472 | ) | 0 | |||||||||||
Class D | 0 | 0 | (351 | ) | 0 | |||||||||||
Class A | 0 | 0 | (1,402 | ) | 0 | |||||||||||
Class C | 0 | 0 | (968 | ) | 0 | |||||||||||
Class R | 0 | 0 | (0 | )^ | 0 | |||||||||||
Total Distributions | (850 | ) | (1,338 | ) | (94,256 | ) | (62,834 | ) | ||||||||
Portfolio Share Transactions: | ||||||||||||||||
Net increase (decrease) resulting from Fund share transactions** | (28,462 | ) | 14,985 | (765,494 | ) | (411,869 | ) | |||||||||
Total Increase (Decrease) in Net Assets | (26,555 | ) | 12,263 | (424,184 | ) | (266,436 | ) | |||||||||
Net Assets: | ||||||||||||||||
Beginning of year | 63,233 | 50,970 | 1,867,574 | 2,134,010 | ||||||||||||
End of year* | $ | 36,678 | $ | 63,233 | $ | 1,443,390 | $ | 1,867,574 | ||||||||
* Including undistributed (overdistributed) net investment income of: | $ | 576 | $ | 393 | $ | (5,845 | ) | $ | 15,266 | |||||||
| ** | See Note 13 in the Notes to Financial Statements. |
| ^ | Amount is less than $500. |
| 48 | PIMCO EQUITY SERIES | See Accompanying Notes |
Table of Contents
| Year Ended June 30, 2014 | ||||
| (Amounts in thousands) | PIMCO EqS® Long/Short Fund | |||
Cash flows (used for) operating activities: | ||||
Net increase in net assets resulting from operations | $ | 60,630 | ||
Adjustments to reconcile net increase in net assets from operations to net cash (used for) operating activities: | ||||
Purchases of long-term securities | (4,338,046 | ) | ||
Proceeds from sales of long-term securities | 3,734,784 | |||
Purchases of short-term portfolio investments, net | (422,658 | ) | ||
Decrease in deposits with counterparty | 51,848 | |||
Decrease in receivable for investments sold | 12,217 | |||
(Increase) in interest and dividends receivable | (532 | ) | ||
(Increase) in exchange-traded or centrally cleared derivatives | (12,767 | ) | ||
Decrease in over the counter derivatives | 749 | |||
(Increase) in reimbursement receivable from PIMCO | (23 | ) | ||
Increase in payable for investments purchased | 885 | |||
Increase in accrued investment advisory fees | 973 | |||
Increase in accrued supervisory and administrative fees | 482 | |||
Increase in accrued distribution fee | 138 | |||
Increase in accrued servicing fee | 115 | |||
Increase in other liabilities | 2 | |||
Payments on short sales transactions, net | (66,317 | ) | ||
Proceeds from currency transactions | 332 | |||
Net Realized (Gain) Loss | ||||
Investments in securities | (48,767 | ) | ||
Investments in Affiliates | 4 | |||
Exchange-traded or centrally cleared financial derivative instruments | 13,344 | |||
Over the counter financial derivative instruments | (749 | ) | ||
Short sales | 25,210 | |||
Foreign currency | (87 | ) | ||
Net Change in Unrealized (Appreciation) Depreciation | ||||
Investments in securities | (75,095 | ) | ||
Investments in Affiliates | (36 | ) | ||
Exchange-traded or centrally cleared financial derivative instruments | 4,383 | |||
Over the counter financial derivative instruments | 4,189 | |||
Short sales | 7,525 | |||
Foreign currency assets and liabilities | (246 | ) | ||
Net amortization (accretion) on investments | (41 | ) | ||
Net cash (used for) operating activities | (1,047,554 | ) | ||
Cash flows received from financing activities: | ||||
Proceeds from shares sold | 1,523,253 | |||
Payments on shares redeemed | (474,253 | ) | ||
Cash dividend paid* | (254 | ) | ||
Net cash received from financing activities | 1,048,746 | |||
Net Increase in Cash and Foreign Currency | 1,192 | |||
Cash and Foreign Currency: | ||||
Beginning of year | 3 | |||
End of year | $ | 1,195 | ||
* Reinvestment of dividends | $ | 48,943 | ||
Supplemental disclosure of cash flow information: | ||||
Interest expense paid during year | $ | 1,053 | ||
| ANNUAL REPORT | JUNE 30, 2014 | 49 |
Table of Contents
Schedule of Investments PIMCO Balanced Income Fund
PRINCIPAL AMOUNT (000S) | MARKET VALUE (000S) | |||||||||||
| INVESTMENTS IN SECURITIES 85.4% | ||||||||||||
| ASSET-BACKED SECURITIES 10.1% | ||||||||||||
| CAYMAN ISLANDS 0.5% | ||||||||||||
Crest Ltd. |
| |||||||||||
1.979% due 05/28/2038 | $ | 32 | $ | 32 | ||||||||
Hewett’s Island CLO Ltd. |
| |||||||||||
4.774% due 05/09/2018 | 6 | 5 | ||||||||||
|
| |||||||||||
Total Cayman Islands | 37 | |||||||||||
|
| |||||||||||
| UNITED STATES 9.6% | ||||||||||||
ACE Securities Corp. Home Equity Loan Trust |
| |||||||||||
0.307% due 08/25/2036 | 57 | 50 | ||||||||||
AmeriCredit Automobile Receivables Trust |
| |||||||||||
0.680% due 10/11/2016 | 56 | 56 | ||||||||||
Ameriquest Mortgage Securities, Inc. Asset-Backed Pass-Through Certificates |
| |||||||||||
0.830% due 09/25/2033 | 45 | 43 | ||||||||||
4.016% due 06/25/2033 | 63 | 52 | ||||||||||
Asset-Backed Securities Corp. Home Equity Loan Trust |
| |||||||||||
0.692% due 11/15/2031 | 13 | 12 | ||||||||||
0.902% due 03/25/2035 | 40 | 38 | ||||||||||
College & University Facility Loan Trust |
| |||||||||||
4.000% due 06/01/2018 | 26 | 26 | ||||||||||
Countrywide Asset-Backed Certificates |
| |||||||||||
0.652% due 08/26/2033 | 53 | 45 | ||||||||||
1.127% due 02/25/2034 | 39 | 37 | ||||||||||
Credit-Based Asset Servicing and Securitization LLC |
| |||||||||||
0.410% due 08/25/2035 | 14 | 14 | ||||||||||
Fremont Home Loan Trust |
| |||||||||||
0.332% due 04/25/2036 | 65 | 58 | ||||||||||
JPMorgan Mortgage Acquisition Corp. |
| |||||||||||
0.592% due 09/25/2035 | 33 | 30 | ||||||||||
Lehman ABS Mortgage Loan Trust |
| |||||||||||
0.352% due 06/25/2037 | 88 | 54 | ||||||||||
Merrill Lynch Mortgage Investors Trust |
| |||||||||||
0.342% due 04/25/2047 | 96 | 58 | ||||||||||
Soundview Home Loan Trust |
| |||||||||||
0.232% due 06/25/2037 | 96 | 58 | ||||||||||
Structured Asset Investment Loan Trust |
| |||||||||||
0.302% due 06/25/2036 | 58 | 49 | ||||||||||
|
| |||||||||||
Total United States | 680 | |||||||||||
|
| |||||||||||
Total Asset-Backed Securities (Cost $703) | 717 | |||||||||||
|
| |||||||||||
| BANK LOAN OBLIGATIONS 3.2% | ||||||||||||
| UNITED STATES 3.2% | ||||||||||||
DaVita HealthCare Partners, Inc. |
| |||||||||||
TBD% due 06/24/2021 | 30 | 30 | ||||||||||
Energy Future Intermediate Holding Co |
| |||||||||||
4.250% due 06/19/2016 | 70 | 71 | ||||||||||
Hilton Worldwide Finance LLC |
| |||||||||||
3.500% due 10/26/2020 | 28 | 28 | ||||||||||
New Albertsons, Inc. |
| |||||||||||
TBD% due 06/25/2021 | 30 | 30 | ||||||||||
Seadrill Partners Finco LLC |
| |||||||||||
4.000% due 02/21/2021 | 29 | 29 | ||||||||||
Seventy Seven Operating LLC |
| |||||||||||
TBD% due 06/25/2021 | 21 | 21 | ||||||||||
Univision Communications, Inc. |
| |||||||||||
4.000% due 03/01/2020 | 22 | 22 | ||||||||||
|
| |||||||||||
Total Bank Loan Obligations (Cost $230) | 231 | |||||||||||
|
| |||||||||||
| SHARES | MARKET VALUE (000S) | |||||||||||
| COMMON STOCKS 52.6% | ||||||||||||
| AUSTRALIA 0.5% | ||||||||||||
| INDUSTRIALS 0.5% | ||||||||||||
Spotless Group Holdings Ltd. (a) | 24,214 | $ | 38 | |||||||||
|
| |||||||||||
Total Australia | 38 | |||||||||||
|
| |||||||||||
| BERMUDA 1.1% | ||||||||||||
| ENERGY 1.1% | ||||||||||||
Golar LNG Partners LP | 2,223 | 82 | ||||||||||
|
| |||||||||||
Total Bermuda | 82 | |||||||||||
|
| |||||||||||
| BRAZIL 2.1% | ||||||||||||
| FINANCIALS 0.4% | ||||||||||||
BB Seguridade Participacoes S.A. | 1,900 | 28 | ||||||||||
|
| |||||||||||
| INDUSTRIALS 0.5% | ||||||||||||
Arteris S.A. | 4,700 | 39 | ||||||||||
|
| |||||||||||
| UTILITIES 1.2% | ||||||||||||
Cia de Saneamento Basico do Estado de Sao Paulo - ADR | 4,582 | 49 | ||||||||||
Light S.A. | 3,800 | 37 | ||||||||||
|
| |||||||||||
| 86 | ||||||||||||
|
| |||||||||||
Total Brazil | 153 | |||||||||||
|
| |||||||||||
| CHINA 0.8% | ||||||||||||
| INDUSTRIALS 0.8% | ||||||||||||
Guangshen Railway Co. Ltd. ‘H’ | 52,000 | 19 | ||||||||||
Zhejiang Expressway Co. Ltd. ‘H’ | 38,000 | 39 | ||||||||||
|
| |||||||||||
Total China | 58 | |||||||||||
|
| |||||||||||
| CYPRUS 0.6% | ||||||||||||
| ENERGY 0.6% | ||||||||||||
ProSafe SE | 5,637 | 46 | ||||||||||
|
| |||||||||||
Total Cyprus | 46 | |||||||||||
|
| |||||||||||
| FRANCE 3.8% | ||||||||||||
| ENERGY 0.8% | ||||||||||||
Total S.A. | 808 | 58 | ||||||||||
|
| |||||||||||
| FINANCIALS 1.1% | ||||||||||||
CNP Assurances | 3,690 | 77 | ||||||||||
|
| |||||||||||
| UTILITIES 1.9% | ||||||||||||
Electricite de France | 1,853 | 58 | ||||||||||
Suez Environnement Co. | 3,967 | 76 | ||||||||||
|
| |||||||||||
| 134 | ||||||||||||
|
| |||||||||||
Total France | 269 | |||||||||||
|
| |||||||||||
| GERMANY 1.1% | ||||||||||||
| CONSUMER DISCRETIONARY 1.1% | ||||||||||||
ProSiebenSat.1 Media AG | 1,700 | 76 | ||||||||||
|
| |||||||||||
Total Germany | 76 | |||||||||||
|
| |||||||||||
| SHARES | MARKET VALUE (000S) | |||||||||||
| HONG KONG 0.8% | ||||||||||||
| INDUSTRIALS 0.3% | ||||||||||||
Yuexiu Transport Infrastructure Ltd. | 34,000 | $ | 19 | |||||||||
|
| |||||||||||
| TELECOMMUNICATION SERVICES 0.5% | ||||||||||||
China Mobile Ltd. | 4,000 | 39 | ||||||||||
|
| |||||||||||
Total Hong Kong | 58 | |||||||||||
|
| |||||||||||
| ITALY 0.6% | ||||||||||||
| INDUSTRIALS 0.6% | ||||||||||||
Societa Iniziative Autostradali e Servizi SpA | 3,182 | 41 | ||||||||||
|
| |||||||||||
Total Italy | 41 | |||||||||||
|
| |||||||||||
| JAPAN 1.0% | ||||||||||||
| TELECOMMUNICATION SERVICES 1.0% | ||||||||||||
Nippon Telegraph & Telephone Corp. | 1,100 | 68 | ||||||||||
|
| |||||||||||
Total Japan | 68 | |||||||||||
|
| |||||||||||
| LUXEMBOURG 0.3% | ||||||||||||
| INDUSTRIALS 0.3% | ||||||||||||
Regus PLC | 6,250 | 19 | ||||||||||
|
| |||||||||||
Total Luxembourg | 19 | |||||||||||
|
| |||||||||||
| MEXICO 0.7% | ||||||||||||
| CONSUMER STAPLES 0.7% | ||||||||||||
Wal-Mart de Mexico S.A.B. de C.V. ‘V’ | 18,200 | 49 | ||||||||||
|
| |||||||||||
Total Mexico | 49 | |||||||||||
|
| |||||||||||
| NETHERLANDS 1.6% | ||||||||||||
| FINANCIALS 1.6% | ||||||||||||
Aegon NV | 8,908 | 78 | ||||||||||
Euronext NV (a) | 1,540 | 39 | ||||||||||
|
| |||||||||||
Total Netherlands | 117 | |||||||||||
|
| |||||||||||
| SINGAPORE 0.6% | ||||||||||||
| INDUSTRIALS 0.6% | ||||||||||||
Singapore Airlines Ltd. | 5,000 | 41 | ||||||||||
|
| |||||||||||
Total Singapore | 41 | |||||||||||
|
| |||||||||||
| SOUTH AFRICA 0.8% | ||||||||||||
| HEALTH CARE 0.3% | ||||||||||||
Life Healthcare Group Holdings Ltd. | 4,878 | 19 | ||||||||||
|
| |||||||||||
| TELECOMMUNICATION SERVICES 0.5% | ||||||||||||
MTN Group Ltd. | 1,816 | 38 | ||||||||||
|
| |||||||||||
Total South Africa | 57 | |||||||||||
|
| |||||||||||
| SPAIN 1.6% | ||||||||||||
| CONSUMER STAPLES 0.8% | ||||||||||||
Ebro Foods S.A. | 2,632 | 59 | ||||||||||
|
| |||||||||||
| 50 | PIMCO EQUITY SERIES | See Accompanying Notes |
Table of Contents
June 30, 2014
| SHARES | MARKET VALUE (000S) | |||||||||||
| FINANCIALS 0.8% | ||||||||||||
Banco Santander S.A. | 5,559 | $ | 58 | |||||||||
|
| |||||||||||
Total Spain | 117 | |||||||||||
|
| |||||||||||
| SWEDEN 0.6% | ||||||||||||
| CONSUMER DISCRETIONARY 0.6% | ||||||||||||
Electrolux AB ‘B’ | 1,570 | 40 | ||||||||||
|
| |||||||||||
Total Sweden | 40 | |||||||||||
|
| |||||||||||
| SWITZERLAND 1.1% | ||||||||||||
| HEALTH CARE 1.1% | ||||||||||||
Roche Holding AG | 263 | 78 | ||||||||||
|
| |||||||||||
Total Switzerland | 78 | |||||||||||
|
| |||||||||||
| TAIWAN 1.0% | ||||||||||||
| INFORMATION TECHNOLOGY 1.0% | ||||||||||||
Radiant Opto-Electronics Corp. | 16,000 | 69 | ||||||||||
|
| |||||||||||
Total Taiwan | 69 | |||||||||||
|
| |||||||||||
| TURKEY 0.6% | ||||||||||||
| INDUSTRIALS 0.6% | ||||||||||||
TAV Havalimanlari Holding A/S | 5,156 | 41 | ||||||||||
|
| |||||||||||
Total Turkey | 41 | |||||||||||
|
| |||||||||||
| UNITED KINGDOM 3.4% | ||||||||||||
| CONSUMER STAPLES 1.4% | ||||||||||||
Imperial Tobacco Group PLC | 2,154 | 97 | ||||||||||
|
| |||||||||||
| ENERGY 1.5% | ||||||||||||
Petrofac Ltd. | 2,830 | 58 | ||||||||||
Subsea 7 S.A. | 2,518 | 47 | ||||||||||
|
| |||||||||||
| 105 | ||||||||||||
|
| |||||||||||
| FINANCIALS 0.5% | ||||||||||||
ICAP PLC | 6,143 | 40 | ||||||||||
|
| |||||||||||
Total United Kingdom | 242 | |||||||||||
|
| |||||||||||
| UNITED STATES 27.9% | ||||||||||||
| CONSUMER DISCRETIONARY 7.6% | ||||||||||||
AMC Entertainment Holdings, Inc. ‘A’ | 775 | 19 | ||||||||||
American Eagle Outfitters, Inc. | 3,357 | 38 | ||||||||||
Foot Locker, Inc. | 1,370 | 70 | ||||||||||
General Motors Co. | 3,164 | 115 | ||||||||||
Kohl’s Corp. | 1,635 | 86 | ||||||||||
Regal Entertainment Group ‘A’ | 2,791 | 59 | ||||||||||
Target Corp. | 2,665 | 154 | ||||||||||
|
| |||||||||||
| 541 | ||||||||||||
|
| |||||||||||
| CONSUMER STAPLES 1.1% | ||||||||||||
Walgreen Co. | 1,035 | 77 | ||||||||||
|
| |||||||||||
| ENERGY 1.3% | ||||||||||||
HollyFrontier Corp. | 1,694 | 74 | ||||||||||
LinnCo LLC | 643 | 20 | ||||||||||
|
| |||||||||||
| 94 | ||||||||||||
|
| |||||||||||
| SHARES | MARKET VALUE (000S) | |||||||||||
| FINANCIALS 8.4% | ||||||||||||
Apollo Investment Corp. | 9,175 | $ | 79 | |||||||||
Blackstone Group LP | 1,178 | 39 | ||||||||||
First Niagara Financial Group, Inc. | 4,466 | 39 | ||||||||||
JPMorgan Chase & Co. | 1,351 | 78 | ||||||||||
KeyCorp | 6,735 | 96 | ||||||||||
Navient Corp. | 4,382 | 78 | ||||||||||
Prudential Financial, Inc. | 981 | 87 | ||||||||||
Solar Capital Ltd. | 3,277 | 70 | ||||||||||
Solar Senior Capital Ltd. | 1,716 | 29 | ||||||||||
|
| |||||||||||
| 595 | ||||||||||||
|
| |||||||||||
| HEALTH CARE 1.9% | ||||||||||||
Medtronic, Inc. | 1,229 | 79 | ||||||||||
Merck & Co., Inc. | 991 | 57 | ||||||||||
|
| |||||||||||
| 136 | ||||||||||||
|
| |||||||||||
| INFORMATION TECHNOLOGY 4.9% | ||||||||||||
Cisco Systems, Inc. | 4,703 | 117 | ||||||||||
Microsoft Corp. | 925 | 39 | ||||||||||
QUALCOMM, Inc. | 1,216 | 96 | ||||||||||
Symantec Corp. | 1,776 | 41 | ||||||||||
Western Digital Corp. | 633 | 58 | ||||||||||
|
| |||||||||||
| 351 | ||||||||||||
|
| |||||||||||
| MATERIALS 1.1% | ||||||||||||
Tronox Ltd. ‘A’ | 2,869 | 77 | ||||||||||
|
| |||||||||||
| TELECOMMUNICATION SERVICES 1.1% | ||||||||||||
CenturyLink, Inc. | 2,117 | 77 | ||||||||||
|
| |||||||||||
| UTILITIES 0.5% | ||||||||||||
ONE Gas, Inc. | 1,019 | 38 | ||||||||||
|
| |||||||||||
Total United States | 1,986 | |||||||||||
|
| |||||||||||
Total Common Stocks (Cost $3,688) |
| 3,745 | ||||||||||
|
| |||||||||||
| PRINCIPAL AMOUNT (000S) | ||||||||||||
| CORPORATE BONDS & NOTES 4.5% | ||||||||||||
| COLOMBIA 0.0% | ||||||||||||
| INDUSTRIALS 0.0% | ||||||||||||
Ecopetrol S.A. |
| |||||||||||
5.875% due 09/18/2023 | $ | 1 | 1 | |||||||||
|
| |||||||||||
Total Colombia | 1 | |||||||||||
|
| |||||||||||
| IRELAND 0.0% | ||||||||||||
| BANKING & FINANCE 0.0% | ||||||||||||
AerCap Ireland Capital Ltd. |
| |||||||||||
2.750% due 05/15/2017 | 1 | 1 | ||||||||||
|
| |||||||||||
Total Ireland | 1 | |||||||||||
|
| |||||||||||
| PRINCIPAL AMOUNT (000S) | MARKET VALUE (000S) | |||||||||||
| NORWAY 0.0% | ||||||||||||
| BANKING & FINANCE 0.0% | ||||||||||||
Eksportfinans ASA |
| |||||||||||
2.000% due 09/15/2015 | $ | 2 | $ | 2 | ||||||||
|
| |||||||||||
Total Norway | 2 | |||||||||||
|
| |||||||||||
| UNITED KINGDOM 0.3% | ||||||||||||
| INDUSTRIALS 0.3% | ||||||||||||
Unique Pub Finance Co. PLC |
| |||||||||||
5.659% due 06/30/2027 | GBP | 13 | 23 | |||||||||
|
| |||||||||||
Total United Kingdom | 23 | |||||||||||
|
| |||||||||||
| UNITED STATES 4.2% | ||||||||||||
| BANKING & FINANCE 1.5% | ||||||||||||
Ally Financial, Inc. |
| |||||||||||
4.625% due 06/26/2015 | $ | 15 | 16 | |||||||||
CIT Group, Inc. |
| |||||||||||
5.000% due 05/15/2017 | 15 | 16 | ||||||||||
General Motors Financial Co., Inc. |
| |||||||||||
2.750% due 05/15/2016 | 15 | 15 | ||||||||||
International Lease Finance Corp. |
| |||||||||||
4.875% due 04/01/2015 | 15 | 15 | ||||||||||
SLM Corp. |
| |||||||||||
5.050% due 11/14/2014 | 15 | 15 | ||||||||||
Springleaf Finance Corp. |
| |||||||||||
5.400% due 12/01/2015 | 15 | 16 | ||||||||||
6.000% due 06/01/2020 | 16 | 17 | ||||||||||
|
| |||||||||||
| 110 | ||||||||||||
|
| |||||||||||
| INDUSTRIALS 2.4% | ||||||||||||
Caesars Entertainment Operating Co., Inc. |
| |||||||||||
8.500% due 02/15/2020 | 4 | 3 | ||||||||||
9.000% due 02/15/2020 | 6 | 5 | ||||||||||
Chesapeake Energy Corp. |
| |||||||||||
3.479% due 04/15/2019 | 15 | 15 | ||||||||||
Clear Channel Communications, Inc. |
| |||||||||||
9.000% due 03/01/2021 | 20 | 22 | ||||||||||
DISH DBS Corp. |
| |||||||||||
7.125% due 02/01/2016 | 15 | 16 | ||||||||||
HCA, Inc. |
| |||||||||||
6.375% due 01/15/2015 | 15 | 15 | ||||||||||
MGM Resorts International |
| |||||||||||
6.625% due 07/15/2015 | 15 | 16 | ||||||||||
Tenet Healthcare Corp. |
| |||||||||||
4.375% due 10/01/2021 | 20 | 20 | ||||||||||
Times Square Hotel Trust |
| |||||||||||
8.528% due 08/01/2026 | 15 | 19 | ||||||||||
USG Corp. |
| |||||||||||
9.750% due 01/15/2018 | 30 | 36 | ||||||||||
|
| |||||||||||
| 167 | ||||||||||||
|
| |||||||||||
| UTILITIES 0.3% | ||||||||||||
Sprint Communications, Inc. |
| |||||||||||
9.125% due 03/01/2017 | 15 | 18 | ||||||||||
|
| |||||||||||
Total United States | 295 | |||||||||||
|
| |||||||||||
Total Corporate Bonds & Notes (Cost $320) | 322 | |||||||||||
|
| |||||||||||
| See Accompanying Notes | ANNUAL REPORT | JUNE 30, 2014 | 51 |
Table of Contents
Schedule of Investments PIMCO Balanced Income Fund (Cont.)
| PRINCIPAL AMOUNT (000S) | MARKET VALUE (000S) | |||||||||||
| MORTGAGE-BACKED SECURITIES 6.8% | ||||||||||||
| UNITED STATES 6.8% | ||||||||||||
BAMLL Re-REMIC Trust |
| |||||||||||
5.383% due 11/15/2016 | $ | 23 | $ | 24 | ||||||||
BCAP LLC Trust |
| |||||||||||
2.799% due 07/26/2036 | 82 | 83 | ||||||||||
Countrywide Alternative Loan Trust |
| |||||||||||
6.000% due 08/25/2036 | 57 | 52 | ||||||||||
Countrywide Home Loan Mortgage Pass-Through Trust |
| |||||||||||
5.750% due 12/25/2035 ^ | 96 | 91 | ||||||||||
Credit Suisse Mortgage Capital Certificates |
| |||||||||||
0.514% due 12/27/2035 | 58 | 55 | ||||||||||
HarborView Mortgage Loan Trust |
| |||||||||||
0.395% due 12/19/2036 | 59 | 39 | ||||||||||
IndyMac Mortgage Loan Trust |
| |||||||||||
0.362% due 07/25/2036 | 66 | 52 | ||||||||||
Lehman XS Trust |
| |||||||||||
0.422% due 02/25/2036 | 51 | 44 | ||||||||||
Wachovia Bank Commercial Mortgage Trust |
| |||||||||||
4.982% due 02/15/2035 | 13 | 13 | ||||||||||
Washington Mutual Mortgage Pass-Through Certificates Trust |
| |||||||||||
4.822% due 09/25/2036 | 59 | 35 | ||||||||||
|
| |||||||||||
Total Mortgage-Backed Securities | 488 | |||||||||||
|
| |||||||||||
| SHARES | ||||||||||||
| REAL ESTATE INVESTMENT TRUSTS 1.8% | ||||||||||||
| UNITED STATES 1.8% | ||||||||||||
| FINANCIALS 1.8% | ||||||||||||
Colony Financial, Inc. | 5,479 | 127 | ||||||||||
|
| |||||||||||
Total Real Estate Investment Trusts | 127 | |||||||||||
|
| |||||||||||
| PRINCIPAL AMOUNT (000S) | MARKET VALUE (000S) | |||||||||||
| SOVEREIGN ISSUES 3.6% | ||||||||||||
| BRAZIL 2.9% | ||||||||||||
Brazil Notas do Tesouro Nacional |
| |||||||||||
6.000% due 05/15/2045 | BRL | 51 | $ | 56 | ||||||||
6.000% due 08/15/2050 | 69 | 75 | ||||||||||
10.000% due 01/01/2025 | 190 | 75 | ||||||||||
|
| |||||||||||
Total Brazil | 206 | |||||||||||
|
| |||||||||||
| GREECE 0.1% | ||||||||||||
Hellenic Republic Government International Bond |
| |||||||||||
3.800% due 08/08/2017 | JPY | 1,000 | 10 | |||||||||
|
| |||||||||||
Total Greece | 10 | |||||||||||
|
| |||||||||||
| RUSSIA 0.6% | ||||||||||||
Russia Government International Bond |
| |||||||||||
7.500% due 03/31/2030 | $ | 34 | 40 | |||||||||
|
| |||||||||||
Total Russia | 40 | |||||||||||
|
| |||||||||||
Total Sovereign Issues (Cost $253) |
| 256 | ||||||||||
|
| |||||||||||
| SHORT-TERM INSTRUMENTS 2.8% | ||||||||||||
| REPURCHASE AGREEMENTS (b) 2.8% | ||||||||||||
| 200 | ||||||||||||
|
| |||||||||||
| Total Short-Term Instruments (Cost $200) | 200 | |||||||||||
|
| |||||||||||
| Total Investments in Securities (Cost $5,995) | 6,086 | |||||||||||
|
| |||||||||||
| SHARES | MARKET VALUE (000S) | |||||||||||
| INVESTMENTS IN AFFILIATES 13.8% | ||||||||||||
| SHORT-TERM INSTRUMENTS 13.8% | ||||||||||||
| CENTRAL FUNDS USED FOR CASH MANAGEMENT PURPOSES 13.8% | ||||||||||||
PIMCO Short-Term | 97,979 | $ | 980 | |||||||||
|
| |||||||||||
| Total Short-Term Instruments (Cost $980) | 980 | |||||||||||
|
| |||||||||||
| Total Investments in Affiliates (Cost $980) | 980 | |||||||||||
| Total Investments 99.2% (Cost $6,975) | $ | 7,066 | ||||||||||
Financial Derivative (Cost or Premiums, net $(7)) | (12 | ) | ||||||||||
| Other Assets and Liabilities, net 1.0% | 66 | |||||||||||
|
| |||||||||||
| Net Assets 100.0% | $ | 7,120 | ||||||||||
|
| |||||||||||
NOTES TO SCHEDULE OF INVESTMENTS (AMOUNTS IN THOUSANDS*):
| * | A zero balance may reflect actual amounts rounding to less than one thousand. |
| ^ | Security is in default. |
| (a) | Security did not produce income within the last twelve months. |
BORROWINGS AND OTHER FINANCING TRANSACTIONS
(b) REPURCHASE AGREEMENTS:
| Counterparty | Lending Rate | Settlement Date | Maturity Date | Principal Amount | Collateralized By | Collateral Received, at Value | Repurchase Agreements, at Value | Repurchase Agreement Proceeds to be Received (1) | ||||||||||||||||||||
BPG | 0.150% | 06/30/2014 | 07/01/2014 | $ | 200 | Freddie Mac 3.500% due 06/01/2044 | $ | (207 | ) | $ | 200 | $ | 200 | |||||||||||||||
|
|
|
|
|
| |||||||||||||||||||||||
Total Repurchase Agreements | $ | (207 | ) | $ | 200 | $ | 200 | |||||||||||||||||||||
|
|
|
|
|
| |||||||||||||||||||||||
| (1) | Includes accrued interest. |
| 52 | PIMCO EQUITY SERIES | See Accompanying Notes |
Table of Contents
June 30, 2014
BORROWINGS AND OTHER FINANCING TRANSACTIONS SUMMARY
The following is a summary by counterparty of the market value of Borrowings and Other Financing Transactions and collateral (received) as of June 30, 2014:
| Counterparty | Repurchase Agreement Proceeds to be Received | Payable for Reverse Repurchase Agreements | Payable for Sale-Buyback Transactions | Payable for Short Sales | Total Borrowings and Other Financing Transactions | Collateral (Received) | Net Exposure (2) | |||||||||||||||||||||
Global/Master Repurchase Agreement | ||||||||||||||||||||||||||||
BPG | $ | 200 | $ | 0 | $ | 0 | $ | 0 | $ | 200 | $ | (207 | ) | $ | (7 | ) | ||||||||||||
|
|
|
|
|
|
|
| |||||||||||||||||||||
Total Borrowings and Other Financing Transactions | $ | 200 | $ | 0 | $ | 0 | $ | 0 | ||||||||||||||||||||
|
|
|
|
|
|
|
| |||||||||||||||||||||
| (2) | Net Exposure represents the net receivable/(payable) that would be due from/to the counterparty in the event of default. Exposure from borrowings and other financing transactions can only be netted across transactions governed under the same master agreement with the same legal entity. See Note 7, Principal Risks, in the Notes to Financial Statements for more information regarding master netting arrangements. |
(c) FINANCIAL DERIVATIVE INSTRUMENTS: OVER THE COUNTER
FORWARD FOREIGN CURRENCY CONTRACTS:
Counterparty | Settlement Month | Currency to be Delivered | Currency to be Received | Unrealized Appreciation/ (Depreciation) | ||||||||||||||||||||||||
| Asset | Liability | |||||||||||||||||||||||||||
BOA | 07/2014 | JPY | 103 | $ | 1 | $ | 0 | $ | 0 | |||||||||||||||||||
| 08/2014 | EUR | 27 | 36 | 0 | 0 | |||||||||||||||||||||||
| 08/2014 | JPY | 204 | 2 | 0 | 0 | |||||||||||||||||||||||
BPS | 07/2014 | EUR | 24 | 33 | 0 | 0 | ||||||||||||||||||||||
| 09/2014 | GBP | 14 | 24 | 0 | 0 | |||||||||||||||||||||||
BRC | 07/2014 | BRL | 117 | 52 | 0 | (1 | ) | |||||||||||||||||||||
| 07/2014 | $ | 53 | BRL | 117 | 0 | 0 | ||||||||||||||||||||||
CBK | 07/2014 | JPY | 4,167 | $ | 41 | 0 | 0 | |||||||||||||||||||||
| 08/2014 | EUR | 1 | 2 | 0 | 0 | |||||||||||||||||||||||
| 01/2015 | BRL | 343 | 145 | 0 | (3 | ) | ||||||||||||||||||||||
DUB | 07/2014 | $ | 33 | EUR | 24 | 0 | 0 | |||||||||||||||||||||
| 08/2014 | EUR | 24 | $ | 33 | 0 | 0 | ||||||||||||||||||||||
GLM | 08/2014 | JPY | 102 | 1 | 0 | 0 | ||||||||||||||||||||||
JPM | 07/2014 | BRL | 131 | 59 | 0 | 0 | ||||||||||||||||||||||
| 07/2014 | JPY | 5,616 | 55 | 0 | (1 | ) | ||||||||||||||||||||||
| 07/2014 | $ | 59 | BRL | 131 | 1 | 0 | ||||||||||||||||||||||
| 07/2014 | 97 | JPY | 9,885 | 1 | (1 | ) | ||||||||||||||||||||||
| 07/2014 | 8 | SGD | 10 | 0 | 0 | |||||||||||||||||||||||
| 08/2014 | BRL | 131 | $ | 58 | 0 | (1 | ) | |||||||||||||||||||||
| 08/2014 | EUR | 41 | 55 | 0 | (1 | ) | ||||||||||||||||||||||
| 08/2014 | JPY | 9,885 | 97 | 0 | 0 | |||||||||||||||||||||||
| 01/2015 | BRL | 14 | 6 | 0 | 0 | |||||||||||||||||||||||
MSC | 07/2014 | $ | 2 | BRL | 4 | 0 | 0 | |||||||||||||||||||||
|
|
|
| |||||||||||||||||||||||||
Total Forward Foreign Currency Contracts |
| $ | 2 | $ | (8 | ) | ||||||||||||||||||||||
|
|
|
| |||||||||||||||||||||||||
SWAP AGREEMENTS:
CREDIT DEFAULT SWAPS ON SOVEREIGN ISSUES - SELL PROTECTION (1)
Counterparty | Reference Entity | Fixed Deal Receive Rate | Maturity Date | Implied Credit Spread at June 30, 2014 (2) | Notional Amount (3) | Premiums (Received) | Unrealized Appreciation/ (Depreciation) | Swap Agreements, at Value | ||||||||||||||||||||||||||
| Asset | Liability | |||||||||||||||||||||||||||||||||
| HUS | Russia Government International Bond | 1.000% | 06/20/2019 | 1.717% | $ 50 | $ | (2 | ) | $ | 1 | $ | 0 | $ | (1 | ) | |||||||||||||||||||
Russia Government International Bond | 1.000% | 06/20/2024 | 2.188% | 50 | (5 | ) | 0 | 0 | (5 | ) | ||||||||||||||||||||||||
|
|
|
|
|
|
|
| |||||||||||||||||||||||||||
| Total Swap Agreements | $ | (7 | ) | $ | 1 | $ | 0 | $ | (6 | ) | ||||||||||||||||||||||||
|
|
|
|
|
|
|
| |||||||||||||||||||||||||||
| (1) | If the Fund is a seller of protection and a credit event occurs, as defined under the terms of that particular swap agreement, the Fund will either (i) pay to the buyer of protection an amount equal to the notional amount of the swap and take delivery of the referenced obligation or underlying securities comprising the referenced index or (ii) pay a net settlement amount in the form of cash or securities equal to the notional amount of the swap less the recovery value of the referenced obligation or underlying securities comprising the referenced index. |
| (2) | Implied credit spreads, represented in absolute terms, utilized in determining the market value of credit default swap agreements on sovereign issues as of period end serve as an indicator of the current status of the payment/performance risk and represent the likelihood or risk of default for the credit derivative. The implied credit spread of a particular referenced entity reflects the cost of buying/selling protection and may include upfront payments required to be made to enter into the agreement. Wider credit spreads represent a deterioration of the referenced entity’s credit soundness and a greater likelihood or risk of default or other credit event occurring as defined under the terms of the agreement. |
| (3) | The maximum potential amount the Fund could be required to pay as a seller of credit protection or receive as a buyer of credit protection if a credit event occurs as defined under the terms of that particular swap agreement. |
| See Accompanying Notes | ANNUAL REPORT | JUNE 30, 2014 | 53 |
Table of Contents
Schedule of Investments PIMCO Balanced Income Fund (Cont.)
FINANCIAL DERIVATIVE INSTRUMENTS: OVER THE COUNTER SUMMARY
The following is a summary by counterparty of the market value of OTC financial derivative instruments and collateral (received)/pledged as of June 30, 2014:
| Financial Derivative Assets | Financial Derivative Liabilities | |||||||||||||||||||||||||||||||||||||||||||||
| Counterparty | Forward Foreign Currency Contracts | Purchased Options | Swap Agreements | Total Over the Counter | Forward Foreign Currency Contracts | Written Options | Swap Agreements | Total Over the Counter | Net Market Value of OTC Derivatives | Collateral (Received)/ Pledged | Net Exposure (4) | |||||||||||||||||||||||||||||||||||
BRC | $ | 0 | $ | 0 | $ | 0 | $ | 0 | $ | (1 | ) | $ | 0 | $ | 0 | $ | (1 | ) | $ | (1 | ) | $ | 0 | $ | (1 | ) | ||||||||||||||||||||
CBK | 0 | 0 | 0 | 0 | (3 | ) | 0 | 0 | (3 | ) | (3 | ) | 0 | (3 | ) | |||||||||||||||||||||||||||||||
HUS | 0 | 0 | 0 | 0 | 0 | 0 | (6 | ) | (6 | ) | (6 | ) | 0 | (6 | ) | |||||||||||||||||||||||||||||||
JPM | 2 | 0 | 0 | 2 | (4 | ) | 0 | 0 | (4 | ) | (2 | ) | 0 | (2 | ) | |||||||||||||||||||||||||||||||
|
|
|
|
|
|
|
|
|
|
|
|
|
|
|
| |||||||||||||||||||||||||||||||
Total Over the Counter | $ | 2 | $ | 0 | $ | 0 | $ | 2 | $ | (8 | ) | $ | 0 | $ | (6 | ) | $ | (14 | ) | |||||||||||||||||||||||||||
|
|
|
|
|
|
|
|
|
|
|
|
|
|
|
| |||||||||||||||||||||||||||||||
| (4) | Net Exposure represents the net receivable/(payable) that would be due from/to the counterparty in the event of default. Exposure from OTC financial derivative instruments can only be netted across transactions governed under the same master agreement with the same legal entity. See Note 7, Principal Risks, in the Notes to Financial Statements for more information regarding master netting arrangements. |
FAIR VALUE OF FINANCIAL DERIVATIVE INSTRUMENTS
The following is a summary of the fair valuation of the Fund’s derivative instruments categorized by risk exposure. See Note 7, Principal Risks, in the Notes to Financial Statements on risks of the Fund.
Fair Values of Financial Derivative Instruments on the Statements of Assets and Liabilities as of June 30, 2014:
| Derivatives not accounted for as hedging instruments | ||||||||||||||||||||||||
| Commodity Contracts | Credit Contracts | Equity Contracts | Foreign Exchange Contracts | Interest Rate Contracts | Total | |||||||||||||||||||
Financial Derivative Instruments - Assets | ||||||||||||||||||||||||
Over the counter | ||||||||||||||||||||||||
Forward Foreign Currency Contracts | $ | 0 | $ | 0 | $ | 0 | $ | 2 | $ | 0 | $ | 2 | ||||||||||||
|
|
|
|
|
|
|
|
|
|
|
| |||||||||||||
Financial Derivative Instruments - Liabilities | ||||||||||||||||||||||||
Over the counter | ||||||||||||||||||||||||
Forward Foreign Currency Contracts | $ | 0 | $ | 0 | $ | 0 | $ | 8 | $ | 0 | $ | 8 | ||||||||||||
Swap Agreements | 0 | 6 | 0 | 0 | 0 | 6 | ||||||||||||||||||
|
|
|
|
|
|
|
|
|
|
|
| |||||||||||||
| $ | 0 | $ | 6 | $ | 0 | $ | 8 | $ | 0 | $ | 14 | |||||||||||||
|
|
|
|
|
|
|
|
|
|
|
| |||||||||||||
The Effect of Financial Derivative Instruments on the Statements of Operations for the Period Ended June 30, 2014:
| Derivatives not accounted for as hedging instruments | ||||||||||||||||||||||||
| Commodity Contracts | Credit Contracts | Equity Contracts | Foreign Exchange Contracts | Interest Rate Contracts | Total | |||||||||||||||||||
Net Realized Gain on Financial Derivative Instruments | ||||||||||||||||||||||||
Exchange-traded or centrally cleared | ||||||||||||||||||||||||
Futures | $ | 0 | $ | 0 | $ | 1 | $ | 0 | $ | 0 | $ | 1 | ||||||||||||
|
|
|
|
|
|
|
|
|
|
|
| |||||||||||||
Net Change in Unrealized Appreciation (Depreciation) on Financial Derivative Instruments |
| |||||||||||||||||||||||
Over the counter | ||||||||||||||||||||||||
Forward Foreign Currency Contracts | $ | 0 | $ | 0 | $ | 0 | $ | (6 | ) | $ | 0 | $ | (6 | ) | ||||||||||
Swap Agreements | 0 | 1 | 0 | 0 | 0 | 1 | ||||||||||||||||||
|
|
|
|
|
|
|
|
|
|
|
| |||||||||||||
| $ | 0 | $ | 1 | $ | 0 | $ | (6 | ) | $ | 0 | $ | (5 | ) | |||||||||||
|
|
|
|
|
|
|
|
|
|
|
| |||||||||||||
| 54 | PIMCO EQUITY SERIES | See Accompanying Notes |
Table of Contents
June 30, 2014
FAIR VALUE MEASUREMENTS
The following is a summary of the fair valuations according to the inputs used as of June 30, 2014 in valuing the Fund’s assets and liabilities:
| Category and Subcategory | Level 1 | Level 2 | Level 3 | Fair Value at 06/30/2014 | ||||||||||||
Investments in Securities, at Value | ||||||||||||||||
Asset-Backed Securities | ||||||||||||||||
Cayman Islands | $ | 0 | $ | 37 | $ | 0 | $ | 37 | ||||||||
United States | 0 | 654 | 26 | 680 | ||||||||||||
Bank Loan Obligations | ||||||||||||||||
United States | 0 | 231 | 0 | 231 | ||||||||||||
Common Stocks | ||||||||||||||||
Australia | ||||||||||||||||
Industrials | 38 | 0 | 0 | 38 | ||||||||||||
Bermuda | ||||||||||||||||
Energy | 82 | 0 | 0 | 82 | ||||||||||||
Brazil | ||||||||||||||||
Financials | 28 | 0 | 0 | 28 | ||||||||||||
Industrials | 39 | 0 | 0 | 39 | ||||||||||||
Utilities | 86 | 0 | 0 | 86 | ||||||||||||
China | ||||||||||||||||
Industrials | 39 | 19 | 0 | 58 | ||||||||||||
Cyprus | ||||||||||||||||
Energy | 0 | 46 | 0 | 46 | ||||||||||||
France | ||||||||||||||||
Energy | 0 | 58 | 0 | 58 | ||||||||||||
Financials | 0 | 77 | 0 | 77 | ||||||||||||
Utilities | 0 | 134 | 0 | 134 | ||||||||||||
Germany | ||||||||||||||||
Consumer Discretionary | 0 | 76 | 0 | 76 | ||||||||||||
Hong Kong | ||||||||||||||||
Industrials | 19 | 0 | 0 | 19 | ||||||||||||
Telecommunication Services | 0 | 39 | 0 | 39 | ||||||||||||
Italy | ||||||||||||||||
Industrials | 0 | 41 | 0 | 41 | ||||||||||||
Japan | ||||||||||||||||
Telecommunication Services | 0 | 68 | 0 | 68 | ||||||||||||
Luxembourg | ||||||||||||||||
Industrials | 0 | 19 | 0 | 19 | ||||||||||||
Mexico | ||||||||||||||||
Consumer Staples | 49 | 0 | 0 | 49 | ||||||||||||
Netherlands | ||||||||||||||||
Financials | 39 | 78 | 0 | 117 | ||||||||||||
Singapore | ||||||||||||||||
Industrials | 0 | 41 | 0 | 41 | ||||||||||||
South Africa | ||||||||||||||||
Health Care | 0 | 19 | 0 | 19 | ||||||||||||
Telecommunication Services | 0 | 38 | 0 | 38 | ||||||||||||
Spain | ||||||||||||||||
Consumer Staples | 0 | 59 | 0 | 59 | ||||||||||||
Financials | 0 | 58 | 0 | 58 | ||||||||||||
Sweden | ||||||||||||||||
Consumer Discretionary | 0 | 40 | 0 | 40 | ||||||||||||
Switzerland | ||||||||||||||||
Health Care | 0 | 78 | 0 | 78 | ||||||||||||
Taiwan | ||||||||||||||||
Information Technology | 0 | 69 | 0 | 69 | ||||||||||||
Turkey | ||||||||||||||||
Industrials | 0 | 41 | 0 | 41 | ||||||||||||
United Kingdom | ||||||||||||||||
Consumer Staples | 0 | 97 | 0 | 97 | ||||||||||||
| Category and Subcategory | Level 1 | Level 2 | Level 3 | Fair Value at 06/30/2014 | ||||||||||||
Energy | $ | 0 | $ | 105 | $ | 0 | $ | 105 | ||||||||
Financials | 0 | 40 | 0 | 40 | ||||||||||||
United States | ||||||||||||||||
Consumer Discretionary | 541 | 0 | 0 | 541 | ||||||||||||
Consumer Staples | 77 | 0 | 0 | 77 | ||||||||||||
Energy | 94 | 0 | 0 | 94 | ||||||||||||
Financials | 595 | 0 | 0 | 595 | ||||||||||||
Health Care | 136 | 0 | 0 | 136 | ||||||||||||
Information Technology | 351 | 0 | 0 | 351 | ||||||||||||
Materials | 77 | 0 | 0 | 77 | ||||||||||||
Telecommunication Services | 77 | 0 | 0 | 77 | ||||||||||||
Utilities | 38 | 0 | 0 | 38 | ||||||||||||
Corporate Bonds & Notes | ||||||||||||||||
Colombia | ||||||||||||||||
Industrials | 0 | 1 | 0 | 1 | ||||||||||||
Ireland | ||||||||||||||||
Banking & Finance | 0 | 1 | 0 | 1 | ||||||||||||
Norway | ||||||||||||||||
Banking & Finance | 0 | 2 | 0 | 2 | ||||||||||||
United Kingdom | ||||||||||||||||
Industrials | 0 | 23 | 0 | 23 | ||||||||||||
United States | ||||||||||||||||
Banking & Finance | 0 | 110 | 0 | 110 | ||||||||||||
Industrials | 0 | 167 | 0 | 167 | ||||||||||||
Utilities | 0 | 18 | 0 | 18 | ||||||||||||
Mortgage-Backed Securities | ||||||||||||||||
United States | 0 | 488 | 0 | 488 | ||||||||||||
Real Estate Investment Trusts | ||||||||||||||||
United States | ||||||||||||||||
Financials | 127 | 0 | 0 | 127 | ||||||||||||
Sovereign Issues | ||||||||||||||||
Brazil | 0 | 206 | 0 | 206 | ||||||||||||
Greece | 0 | 10 | 0 | 10 | ||||||||||||
Russia | 0 | 40 | 0 | 40 | ||||||||||||
Short-Term Instruments | ||||||||||||||||
Repurchase Agreements | 0 | 200 | 0 | 200 | ||||||||||||
| $ | 2,532 | $ | 3,528 | $ | 26 | $ | 6,086 | |||||||||
Investments in Affiliates, at Value | ||||||||||||||||
Short-Term Instruments | ||||||||||||||||
Central Funds Used for Cash | $ | 980 | $ | 0 | $ | 0 | $ | 980 | ||||||||
Total Investments | $ | 3,512 | $ | 3,528 | $ | 26 | $ | 7,066 | ||||||||
Financial Derivative Instruments - Assets |
| |||||||||||||||
Over the counter | $ | 0 | $ | 2 | $ | 0 | $ | 2 | ||||||||
Financial Derivative Instruments - Liabilities |
| |||||||||||||||
Over the counter | $ | 0 | $ | (14 | ) | $ | 0 | $ | (14 | ) | ||||||
Totals | $ | 3,512 | $ | 3,516 | $ | 26 | $ | 7,054 | ||||||||
There were no significant transfers between Level 1, 2, and 3 during the period ended June 30, 2014.
| See Accompanying Notes | ANNUAL REPORT | JUNE 30, 2014 | 55 |
Table of Contents
Schedule of Investments PIMCO Dividend and Income Builder Fund
| PRINCIPAL AMOUNT (000S) | MARKET VALUE (000S) | |||||||||||
| INVESTMENTS IN SECURITIES 98.2% | ||||||||||||
| ASSET-BACKED SECURITIES 1.7% | ||||||||||||
| UNITED STATES 1.7% | ||||||||||||
Credit Suisse First Boston Mortgage Securities Corp. |
| |||||||||||
0.770% due 01/25/2032 | $ | 15 | $ | 14 | ||||||||
EMC Mortgage Loan Trust |
| |||||||||||
0.802% due 02/25/2041 | 67 | 62 | ||||||||||
GSAMP Trust |
| |||||||||||
0.302% due 12/25/2046 | 5,125 | 2,986 | ||||||||||
HSI Asset Securitization Corp. Trust |
| |||||||||||
0.322% due 12/25/2036 | 6,469 | 3,096 | ||||||||||
JPMorgan Mortgage Acquisition Trust |
| |||||||||||
5.661% due 11/25/2036 | 200 | 198 | ||||||||||
Morgan Stanley Home Equity Loan Trust |
| |||||||||||
0.252% due 12/25/2036 | 207 | 125 | ||||||||||
Residential Asset Securities Corp. Trust |
| |||||||||||
1.035% due 01/25/2034 | 2,909 | 2,599 | ||||||||||
Structured Asset Investment Loan Trust |
| |||||||||||
0.302% due 09/25/2036 | 8,908 | 7,130 | ||||||||||
|
| |||||||||||
Total Asset-Backed Securities | 16,210 | |||||||||||
|
| |||||||||||
| BANK LOAN OBLIGATIONS 0.3% | ||||||||||||
| BRAZIL 0.0% | ||||||||||||
OGX |
| |||||||||||
TBD% - 8.000% due 04/11/2015 | 14 | 12 | ||||||||||
|
| |||||||||||
Total Brazil | 12 | |||||||||||
|
| |||||||||||
| LUXEMBOURG 0.0% | ||||||||||||
Ortho-Clinical Diagnostics, Inc. |
| |||||||||||
TBD% due 06/30/2021 | 250 | 252 | ||||||||||
|
| |||||||||||
Total Luxembourg | 252 | |||||||||||
|
| |||||||||||
| UNITED STATES 0.3% | ||||||||||||
Clear Channel Communications, Inc. |
| |||||||||||
6.900% due 01/30/2019 | 300 | 299 | ||||||||||
Energy Future Holdings Corp. |
| |||||||||||
4.250% due 06/19/2016 | 2,217 | 2,235 | ||||||||||
|
| |||||||||||
Total United States | 2,534 | |||||||||||
|
| |||||||||||
Total Bank Loan Obligations | 2,798 | |||||||||||
|
| |||||||||||
| SHARES | ||||||||||||
| COMMON STOCKS 87.1% | ||||||||||||
| AUSTRALIA 0.8% | ||||||||||||
| INDUSTRIALS 0.8% | ||||||||||||
Spotless Group Holdings Ltd. (b) | 5,100,423 | 7,936 | ||||||||||
|
| |||||||||||
Total Australia | 7,936 | |||||||||||
|
| |||||||||||
| BERMUDA 2.0% | ||||||||||||
| ENERGY 2.0% | ||||||||||||
Golar LNG Partners LP | 501,855 | 18,493 | ||||||||||
|
| |||||||||||
Total Bermuda | 18,493 | |||||||||||
|
| |||||||||||
| BRAZIL 4.1% | ||||||||||||
| FINANCIALS 0.9% | ||||||||||||
BB Seguridade Participacoes S.A. | 599,708 | 8,805 | ||||||||||
|
| |||||||||||
| SHARES | MARKET VALUE (000S) | |||||||||||
| INDUSTRIALS 0.9% | ||||||||||||
Arteris S.A. | 985,100 | $ | 8,204 | |||||||||
|
| |||||||||||
| UTILITIES 2.3% | ||||||||||||
Cia de Saneamento Basico do Estado de Sao Paulo - ADR | 1,027,583 | 11,016 | ||||||||||
Light S.A. | 1,084,900 | 10,586 | ||||||||||
|
| |||||||||||
| 21,602 | ||||||||||||
|
| |||||||||||
Total Brazil | 38,611 | |||||||||||
|
| |||||||||||
| CHINA 1.2% | ||||||||||||
| INDUSTRIALS 1.2% | ||||||||||||
Guangshen Railway Co. Ltd. ‘H’ | 8,890,000 | 3,304 | ||||||||||
Zhejiang Expressway Co. Ltd. ‘H’ | 8,346,000 | 8,421 | ||||||||||
|
| |||||||||||
Total China | 11,725 | |||||||||||
|
| |||||||||||
| CYPRUS 2.3% | ||||||||||||
| ENERGY 2.3% | ||||||||||||
ProSafe SE | 2,666,699 | 21,979 | ||||||||||
|
| |||||||||||
Total Cyprus | 21,979 | |||||||||||
|
| |||||||||||
| FRANCE 6.0% | ||||||||||||
| ENERGY 1.4% | ||||||||||||
Total S.A. | 183,911 | 13,306 | ||||||||||
|
| |||||||||||
| FINANCIALS 1.6% | ||||||||||||
CNP Assurances | 747,101 | 15,506 | ||||||||||
|
| |||||||||||
| UTILITIES 3.0% | ||||||||||||
Electricite de France | 405,365 | 12,764 | ||||||||||
Suez Environnement Co. | 797,205 | 15,251 | ||||||||||
|
| |||||||||||
| 28,015 | ||||||||||||
|
| |||||||||||
Total France | 56,827 | |||||||||||
|
| |||||||||||
| GERMANY 1.7% | ||||||||||||
| CONSUMER DISCRETIONARY 1.7% | ||||||||||||
ProSiebenSat.1 Media AG | 364,232 | 16,212 | ||||||||||
|
| |||||||||||
Total Germany | 16,212 | |||||||||||
|
| |||||||||||
| HONG KONG 1.3% | ||||||||||||
| INDUSTRIALS 0.4% | ||||||||||||
Yuexiu Transport Infrastructure Ltd. | 7,496,000 | 4,256 | ||||||||||
|
| |||||||||||
| TELECOMMUNICATION SERVICES 0.9% | ||||||||||||
China Mobile Ltd. | 860,000 | 8,353 | ||||||||||
|
| |||||||||||
Total Hong Kong | 12,609 | |||||||||||
|
| |||||||||||
| ITALY 1.0% | ||||||||||||
| INDUSTRIALS 1.0% | ||||||||||||
Societa Iniziative Autostradali e Servizi SpA | 755,603 | 9,696 | ||||||||||
|
| |||||||||||
Total Italy | 9,696 | |||||||||||
|
| |||||||||||
| SHARES | MARKET VALUE (000S) | |||||||||||
| JAPAN 1.8% | ||||||||||||
| TELECOMMUNICATION SERVICES 1.8% | ||||||||||||
Nippon Telegraph & Telephone Corp. | 268,300 | $ | 16,723 | |||||||||
|
| |||||||||||
Total Japan | 16,723 | |||||||||||
|
| |||||||||||
| LUXEMBOURG 0.4% | ||||||||||||
| INDUSTRIALS 0.4% | ||||||||||||
Regus PLC | 1,308,026 | 4,067 | ||||||||||
|
| |||||||||||
Total Luxembourg | 4,067 | |||||||||||
|
| |||||||||||
| MEXICO 1.1% | ||||||||||||
| CONSUMER STAPLES 1.1% | ||||||||||||
Wal-Mart de Mexico S.A.B. de C.V. ‘V’ | 3,899,500 | 10,454 | ||||||||||
|
| |||||||||||
Total Mexico | 10,454 | |||||||||||
|
| |||||||||||
| NETHERLANDS 2.6% | ||||||||||||
| FINANCIALS 2.6% | ||||||||||||
Aegon NV | 1,927,214 | 16,812 | ||||||||||
Euronext NV (b) | 323,589 | 8,228 | ||||||||||
|
| |||||||||||
Total Netherlands | 25,040 | |||||||||||
|
| |||||||||||
| SINGAPORE 0.8% | ||||||||||||
| INDUSTRIALS 0.8% | ||||||||||||
Singapore Airlines Ltd. | 955,000 | 7,938 | ||||||||||
|
| |||||||||||
Total Singapore | 7,938 | |||||||||||
|
| |||||||||||
| SOUTH AFRICA 1.4% | ||||||||||||
| HEALTH CARE 0.5% | ||||||||||||
Life Healthcare Group Holdings Ltd. | 1,154,555 | 4,505 | ||||||||||
|
| |||||||||||
| TELECOMMUNICATION SERVICES 0.9% | ||||||||||||
MTN Group Ltd. | 414,609 | 8,733 | ||||||||||
|
| |||||||||||
Total South Africa | 13,238 | |||||||||||
|
| |||||||||||
| SPAIN 2.6% | ||||||||||||
| CONSUMER STAPLES 1.2% | ||||||||||||
Ebro Foods S.A. | 519,872 | 11,550 | ||||||||||
|
| |||||||||||
| FINANCIALS 1.4% | ||||||||||||
Banco Santander S.A. | 1,278,245 | 13,357 | ||||||||||
|
| |||||||||||
Total Spain | 24,907 | |||||||||||
|
| |||||||||||
| SWEDEN 0.9% | ||||||||||||
| CONSUMER DISCRETIONARY 0.9% | ||||||||||||
Electrolux AB ‘B’ | 346,135 | 8,735 | ||||||||||
|
| |||||||||||
Total Sweden | 8,735 | |||||||||||
|
| |||||||||||
| SWITZERLAND 1.7% | ||||||||||||
| HEALTH CARE 1.7% | ||||||||||||
Roche Holding AG | 54,227 | 16,157 | ||||||||||
|
| |||||||||||
Total Switzerland | 16,157 | |||||||||||
|
| |||||||||||
| 56 | PIMCO EQUITY SERIES | See Accompanying Notes |
Table of Contents
June 30, 2014
| SHARES | MARKET VALUE (000S) | |||||||||||
| TAIWAN 1.4% | ||||||||||||
| INFORMATION TECHNOLOGY 1.4% | ||||||||||||
Radiant Opto-Electronics Corp. | 3,152,590 | $ | 13,527 | |||||||||
|
| |||||||||||
Total Taiwan | 13,527 | |||||||||||
|
| |||||||||||
| TURKEY 0.9% | ||||||||||||
| INDUSTRIALS 0.9% | ||||||||||||
TAV Havalimanlari Holding A/S | 1,113,214 | 8,853 | ||||||||||
|
| |||||||||||
Total Turkey | 8,853 | |||||||||||
|
| |||||||||||
| UNITED KINGDOM 5.5% | ||||||||||||
| CONSUMER STAPLES 2.5% | ||||||||||||
Imperial Tobacco Group PLC | 523,396 | 23,547 | ||||||||||
|
| |||||||||||
| ENERGY 2.3% | ||||||||||||
Petrofac Ltd. | 610,638 | 12,560 | ||||||||||
Subsea 7 S.A. | 503,379 | 9,383 | ||||||||||
|
| |||||||||||
| 21,943 | ||||||||||||
|
| |||||||||||
| FINANCIALS 0.7% | ||||||||||||
ICAP PLC | 1,114,045 | 7,238 | ||||||||||
|
| |||||||||||
Total United Kingdom | 52,728 | |||||||||||
|
| |||||||||||
| UNITED STATES 45.6% | ||||||||||||
| CONSUMER DISCRETIONARY 12.4% | ||||||||||||
AMC Entertainment Holdings, Inc. ‘A’ | 198,204 | 4,930 | ||||||||||
American Eagle Outfitters, Inc. | 737,897 | 8,279 | ||||||||||
Foot Locker, Inc. | 289,765 | 14,697 | ||||||||||
General Motors Co. | 711,796 | 25,838 | ||||||||||
Kohl’s Corp. | 310,104 | 16,336 | ||||||||||
Regal Entertainment Group ‘A’ | 673,268 | 14,206 | ||||||||||
Target Corp. | 584,641 | 33,880 | ||||||||||
|
| |||||||||||
| 118,166 | ||||||||||||
|
| |||||||||||
| CONSUMER STAPLES 1.9% | ||||||||||||
Walgreen Co. | 238,747 | 17,698 | ||||||||||
|
| |||||||||||
| ENERGY 2.2% | ||||||||||||
HollyFrontier Corp. | 375,637 | 16,411 | ||||||||||
LinnCo LLC | 133,385 | 4,174 | ||||||||||
|
| |||||||||||
| 20,585 | ||||||||||||
|
| |||||||||||
| FINANCIALS 13.5% | ||||||||||||
Apollo Investment Corp. | 2,000,731 | 17,226 | ||||||||||
Blackstone Group LP | 250,396 | 8,373 | ||||||||||
First Niagara Financial Group, Inc. | 880,886 | 7,699 | ||||||||||
JPMorgan Chase & Co. | 303,617 | 17,495 | ||||||||||
KeyCorp | 1,408,788 | 20,188 | ||||||||||
Navient Corp. | 994,925 | 17,620 | ||||||||||
Prudential Financial, Inc. | 214,488 | 19,040 | ||||||||||
Solar Capital Ltd. | 735,210 | 15,645 | ||||||||||
Solar Senior Capital Ltd. | 345,495 | 5,832 | ||||||||||
|
| |||||||||||
| 129,118 | ||||||||||||
|
| |||||||||||
| SHARES | MARKET VALUE (000S) | |||||||||||
| HEALTH CARE 3.1% | ||||||||||||
Medtronic, Inc. | 271,597 | $ | 17,317 | |||||||||
Merck & Co., Inc. | 205,604 | 11,894 | ||||||||||
|
| |||||||||||
| 29,211 | ||||||||||||
|
| |||||||||||
| INFORMATION TECHNOLOGY 7.9% | ||||||||||||
Cisco Systems, Inc. | 1,046,360 | 26,002 | ||||||||||
Microsoft Corp. | 202,132 | 8,429 | ||||||||||
QUALCOMM, Inc. | 252,762 | 20,019 | ||||||||||
Symantec Corp. | 365,413 | 8,368 | ||||||||||
Western Digital Corp. | 142,189 | 13,124 | ||||||||||
|
| |||||||||||
| 75,942 | ||||||||||||
|
| |||||||||||
| MATERIALS 1.8% | ||||||||||||
Tronox Ltd. ‘A’ | 656,871 | 17,670 | ||||||||||
|
| |||||||||||
| TELECOMMUNICATION SERVICES 1.9% | ||||||||||||
CenturyLink, Inc. | 514,709 | 18,632 | ||||||||||
|
| |||||||||||
| UTILITIES 0.9% | ||||||||||||
ONE Gas, Inc. | 238,583 | 9,007 | ||||||||||
|
| |||||||||||
Total United States | 436,029 | |||||||||||
|
| |||||||||||
Total Common Stocks | 832,484 | |||||||||||
|
| |||||||||||
| PRINCIPAL AMOUNT (000S) | ||||||||||||
| CORPORATE BONDS & NOTES 2.6% | ||||||||||||
| AUSTRIA 0.0% | ||||||||||||
| INDUSTRIALS 0.0% | ||||||||||||
OGX Austria GmbH | ||||||||||||
8.375% due 04/01/2022 ^ | $ | 200 | 12 | |||||||||
8.500% due 06/01/2018 ^ | 200 | 13 | ||||||||||
|
| |||||||||||
Total Austria | 25 | |||||||||||
|
| |||||||||||
| BRAZIL 0.1% | ||||||||||||
| BANKING & FINANCE 0.0% | ||||||||||||
Banco Votorantim S.A. | ||||||||||||
5.250% due 02/11/2016 | 200 | 209 | ||||||||||
|
| |||||||||||
| UTILITIES 0.1% | ||||||||||||
Centrais Eletricas Brasileiras S.A. |
| |||||||||||
6.875% due 07/30/2019 | 400 | 446 | ||||||||||
|
| |||||||||||
Total Brazil | 655 | |||||||||||
|
| |||||||||||
| CAYMAN ISLANDS 0.0% | ||||||||||||
| UTILITIES 0.0% | ||||||||||||
Odebrecht Drilling Norbe Ltd. |
| |||||||||||
6.350% due 06/30/2021 | 175 | 189 | ||||||||||
|
| |||||||||||
Total Cayman Islands | 189 | |||||||||||
|
| |||||||||||
| COLOMBIA 0.0% | ||||||||||||
| INDUSTRIALS 0.0% | ||||||||||||
Ecopetrol S.A. | ||||||||||||
5.875% due 09/18/2023 | 37 | 42 | ||||||||||
5.875% due 05/28/2045 | 10 | 10 | ||||||||||
|
| |||||||||||
Total Colombia | 52 | |||||||||||
|
| |||||||||||
| PRINCIPAL AMOUNT (000S) | MARKET VALUE (000S) | |||||||||||
| FRANCE 0.2% | ||||||||||||
| BANKING & FINANCE 0.1% | ||||||||||||
BPCE S.A. | ||||||||||||
12.500% due 08/29/2049 | $ | 100 | $ | 138 | ||||||||
12.500% due 09/30/2019 (d) | EUR | 300 | 577 | |||||||||
RCI Banque S.A. | ||||||||||||
4.600% due 04/12/2016 | $ | 100 | 106 | |||||||||
|
| |||||||||||
| 821 | ||||||||||||
|
| |||||||||||
| INDUSTRIALS 0.1% | ||||||||||||
Europcar Groupe S.A. | ||||||||||||
11.500% due 05/15/2017 | EUR | 200 | 316 | |||||||||
Numericable Group S.A. | ||||||||||||
4.875% due 05/15/2019 | $ | 500 | 514 | |||||||||
|
| |||||||||||
| 830 | ||||||||||||
|
| |||||||||||
Total France | 1,651 | |||||||||||
|
| |||||||||||
| GERMANY 0.0% | ||||||||||||
| INDUSTRIALS 0.0% | ||||||||||||
KP Germany Erste GmbH | ||||||||||||
11.625% due 07/15/2017 | EUR | 100 | 155 | |||||||||
Orion Engineered Carbons Bondco GmbH |
| |||||||||||
10.000% due 06/15/2018 | 160 | 236 | ||||||||||
|
| |||||||||||
Total Germany | 391 | |||||||||||
|
| |||||||||||
| GUERNSEY, CHANNEL ISLANDS 0.0% | ||||||||||||
| BANKING & FINANCE 0.0% | ||||||||||||
Doric Nimrod Air Finance Alpha Ltd. Pass-Through Trust |
| |||||||||||
5.125% due 11/30/2024 | $ | 363 | 390 | |||||||||
|
| |||||||||||
Total Guernsey, Channel Islands |
| 390 | ||||||||||
|
| |||||||||||
| IRELAND 0.2% | ||||||||||||
| BANKING & FINANCE 0.0% | ||||||||||||
AerCap Ireland Capital Ltd. |
| |||||||||||
2.750% due 05/15/2017 | 11 | 11 | ||||||||||
|
| |||||||||||
| INDUSTRIALS 0.1% | ||||||||||||
Nara Cable Funding Ltd. |
| |||||||||||
8.875% due 12/01/2018 | EUR | 300 | 439 | |||||||||
Russian Railways via RZD Capital PLC |
| |||||||||||
5.739% due 04/03/2017 | $ | 100 | 108 | |||||||||
Vimpel Communications Via VIP Finance Ireland Ltd. OJSC |
| |||||||||||
6.493% due 02/02/2016 | 400 | 422 | ||||||||||
|
| |||||||||||
| 969 | ||||||||||||
|
| |||||||||||
| UTILITIES 0.1% | ||||||||||||
AK Transneft OJSC Via TransCapitalInvest Ltd. |
| |||||||||||
8.700% due 08/07/2018 | 100 | 120 | ||||||||||
Novatek OAO via Novatek Finance Ltd. |
| |||||||||||
5.326% due 02/03/2016 | 300 | 316 | ||||||||||
|
| |||||||||||
| 436 | ||||||||||||
|
| |||||||||||
Total Ireland | 1,416 | |||||||||||
|
| |||||||||||
| ITALY 0.1% | ||||||||||||
| BANKING & FINANCE 0.1% | ||||||||||||
Intesa Sanpaolo SpA |
| |||||||||||
6.500% due 02/24/2021 | 600 | 710 | ||||||||||
| See Accompanying Notes | ANNUAL REPORT | JUNE 30, 2014 | 57 |
Table of Contents
Schedule of Investments PIMCO Dividend and Income Builder Fund (Cont.)
| PRINCIPAL AMOUNT (000S) | MARKET VALUE (000S) | |||||||||||
3.125% due 01/15/2016 | $ | 100 | $ | 103 | ||||||||
|
| |||||||||||
| 813 | ||||||||||||
|
| |||||||||||
| UTILITIES 0.0% | ||||||||||||
Telecom Italia SpA |
| |||||||||||
6.375% due 06/24/2019 | GBP | 150 | 281 | |||||||||
|
| |||||||||||
Total Italy | 1,094 | |||||||||||
|
| |||||||||||
| LUXEMBOURG 0.4% | ||||||||||||
| BANKING & FINANCE 0.1% | ||||||||||||
Fiat Finance & Trade S.A. |
| |||||||||||
7.625% due 09/15/2014 | EUR | 100 | 139 | |||||||||
Sberbank of Russia Via SB Capital S.A. |
| |||||||||||
6.125% due 02/07/2022 | $ | 200 | 215 | |||||||||
5.717% due 06/16/2021 | 200 | 211 | ||||||||||
|
| |||||||||||
| 565 | ||||||||||||
|
| |||||||||||
| INDUSTRIALS 0.1% | ||||||||||||
Trinseo Materials Operating S.C.A. |
| |||||||||||
8.750% due 02/01/2019 | 31 | 33 | ||||||||||
Wind Acquisition Finance S.A. |
| |||||||||||
7.250% due 02/15/2018 | 400 | 423 | ||||||||||
7.375% due 02/15/2018 | EUR | 100 | 145 | |||||||||
11.750% due 07/15/2017 | 100 | 142 | ||||||||||
|
| |||||||||||
| 743 | ||||||||||||
|
| |||||||||||
| UTILITIES 0.2% | ||||||||||||
Gazprom Neft OAO Via GPN Capital S.A. |
| |||||||||||
4.375% due 09/19/2022 | $ | 300 | 280 | |||||||||
Gazprom OAO Via Gaz Capital S.A. |
| |||||||||||
9.250% due 04/23/2019 | 200 | 244 | ||||||||||
8.625% due 04/28/2034 | 230 | 285 | ||||||||||
6.510% due 03/07/2022 | 900 | 979 | ||||||||||
7.288% due 08/16/2037 | 139 | 156 | ||||||||||
5.999% due 01/23/2021 | 30 | 32 | ||||||||||
|
| |||||||||||
| 1,976 | ||||||||||||
|
| |||||||||||
Total Luxembourg | 3,284 | |||||||||||
|
| |||||||||||
| MEXICO 0.0% | ||||||||||||
| INDUSTRIALS 0.0% | ||||||||||||
Corp. GEO S.A.B. de C.V. |
| |||||||||||
8.875% due 03/27/2022 ^ | 300 | 37 | ||||||||||
9.250% due 06/30/2020 ^ | 100 | 13 | ||||||||||
Desarrolladora Homex S.A.B. de C.V. |
| |||||||||||
7.500% due 09/28/2015 ^ | 300 | 46 | ||||||||||
|
| |||||||||||
Total Mexico | 96 | |||||||||||
|
| |||||||||||
| NETHERLANDS 0.2% | ||||||||||||
| BANKING & FINANCE 0.1% | ||||||||||||
Cooperatieve Centrale Raiffeisen-Boerenleenbank BA |
| |||||||||||
6.875% due 03/19/2020 | EUR | 400 | 661 | |||||||||
GMAC International Finance BV |
| |||||||||||
7.500% due 04/21/2015 | 100 | 144 | ||||||||||
|
| |||||||||||
| 805 | ||||||||||||
|
| |||||||||||
| INDUSTRIALS 0.0% | ||||||||||||
Schaeffler Finance BV | ||||||||||||
7.750% due 02/15/2017 | $ | 100 | 113 | |||||||||
| PRINCIPAL AMOUNT (000S) | MARKET VALUE (000S) | |||||||||||
Schaeffler Holding Finance BV (6.875% Cash or 6.875% PIK) |
| |||||||||||
6.875% due 08/15/2018 (a) | EUR | 100 | $ | 145 | ||||||||
|
| |||||||||||
| 258 | ||||||||||||
|
| |||||||||||
| UTILITIES 0.1% | ||||||||||||
Koninklijke KPN NV |
| |||||||||||
6.125% due 09/14/2018 (d) | 300 | 444 | ||||||||||
|
| |||||||||||
Total Netherlands | 1,507 | |||||||||||
|
| |||||||||||
| NORWAY 0.0% | ||||||||||||
| BANKING & FINANCE 0.0% | ||||||||||||
Eksportfinans ASA |
| |||||||||||
3.000% due 11/17/2014 | $ | 135 | 136 | |||||||||
|
| |||||||||||
Total Norway | 136 | |||||||||||
|
| |||||||||||
| SOUTH AFRICA 0.0% | ||||||||||||
| INDUSTRIALS 0.0% | ||||||||||||
AngloGold Ashanti Holdings PLC |
| |||||||||||
6.500% due 04/15/2040 | 200 | 192 | ||||||||||
|
| |||||||||||
Total South Africa | 192 | |||||||||||
|
| |||||||||||
| SPAIN 0.1% | ||||||||||||
| BANKING & FINANCE 0.1% | ||||||||||||
Bankia S.A. |
| |||||||||||
0.532% due 01/25/2016 | EUR | 400 | 542 | |||||||||
BBVA U.S. Senior S.A.U. | ||||||||||||
4.664% due 10/09/2015 | $ | 300 | 314 | |||||||||
|
| |||||||||||
| 856 | ||||||||||||
|
| |||||||||||
| INDUSTRIALS 0.0% | ||||||||||||
Obrascon Huarte Lain S.A. |
| |||||||||||
8.750% due 03/15/2018 | EUR | 200 | 299 | |||||||||
|
| |||||||||||
Total Spain | 1,155 | |||||||||||
|
| |||||||||||
| UNITED KINGDOM 0.6% | ||||||||||||
| BANKING & FINANCE 0.3% | ||||||||||||
Barclays Bank PLC |
| |||||||||||
14.000% due 06/15/2019 (d) | GBP | 300 | 703 | |||||||||
Co-operative Group Holdings |
| |||||||||||
6.875% due 07/08/2020 | 200 | 365 | ||||||||||
LBG Capital PLC |
| |||||||||||
15.000% due 12/21/2019 | 300 | 747 | ||||||||||
Mitchells & Butlers Finance PLC |
| |||||||||||
1.008% due 12/15/2030 | 172 | 270 | ||||||||||
Royal Bank of Scotland PLC |
| |||||||||||
9.500% due 03/16/2022 | $ | 200 | 235 | |||||||||
6.934% due 04/09/2018 | EUR | 200 | 318 | |||||||||
Virgin Media Secured Finance PLC |
| |||||||||||
5.500% due 01/15/2021 | GBP | 200 | 357 | |||||||||
|
| |||||||||||
| 2,995 | ||||||||||||
|
| |||||||||||
| INDUSTRIALS 0.3% | ||||||||||||
Algeco Scotsman Global Finance PLC |
| |||||||||||
8.500% due 10/15/2018 | $ | 400 | 427 | |||||||||
DFS Furniture Holdings PLC |
| |||||||||||
7.625% due 08/15/2018 | GBP | 200 | 366 | |||||||||
Enterprise Inns PLC |
| |||||||||||
6.875% due 02/15/2021 | 200 | 368 | ||||||||||
Marstons Issuer PLC |
| |||||||||||
5.641% due 07/15/2035 | 200 | 329 | ||||||||||
| PRINCIPAL AMOUNT (000S) | MARKET VALUE (000S) | |||||||||||
Priory Group PLC |
| |||||||||||
8.875% due 02/15/2019 | GBP | 200 | $ | 368 | ||||||||
Spirit Issuer PLC |
| |||||||||||
6.582% due 12/28/2027 | 200 | 361 | ||||||||||
3.253% due 12/28/2031 | 22 | 36 | ||||||||||
|
| |||||||||||
| 2,255 | ||||||||||||
|
| |||||||||||
| UTILITIES 0.0% | ||||||||||||
SSE PLC |
| |||||||||||
5.625% due 10/01/2017 (d) | $ | 200 | 216 | |||||||||
|
| |||||||||||
Total United Kingdom | 5,466 | |||||||||||
|
| |||||||||||
| UNITED STATES 0.6% | ||||||||||||
| BANKING & FINANCE 0.2% | ||||||||||||
American International Group, Inc. |
| |||||||||||
6.765% due 11/15/2017 | GBP | 100 | 195 | |||||||||
Cantor Fitzgerald LP |
| |||||||||||
7.875% due 10/15/2019 | $ | 300 | 334 | |||||||||
International Lease Finance Corp. |
| |||||||||||
7.125% due 09/01/2018 | 325 | 378 | ||||||||||
SLM Corp. |
| |||||||||||
6.250% due 01/25/2016 | 200 | 213 | ||||||||||
8.450% due 06/15/2018 | 200 | 237 | ||||||||||
Springleaf Finance Corp. |
| |||||||||||
5.400% due 12/01/2015 | 500 | 527 | ||||||||||
6.900% due 12/15/2017 | 300 | 334 | ||||||||||
|
| |||||||||||
| 2,218 | ||||||||||||
|
| |||||||||||
| INDUSTRIALS 0.4% | ||||||||||||
Aleris International, Inc. |
| |||||||||||
7.625% due 02/15/2018 | 125 | 130 | ||||||||||
Altria Group, Inc. |
| |||||||||||
10.200% due 02/06/2039 | 65 | 110 | ||||||||||
Caesars Entertainment Operating Co., Inc. |
| |||||||||||
8.500% due 02/15/2020 | 291 | 247 | ||||||||||
9.000% due 02/15/2020 | 244 | 205 | ||||||||||
Clear Channel Communications, Inc. |
| |||||||||||
9.000% due 03/01/2021 | 3 | 3 | ||||||||||
CVS Pass-Through Trust |
| |||||||||||
8.353% due 07/10/2031 | 90 | 119 | ||||||||||
Delta Air Lines Pass-Through Trust |
| |||||||||||
4.750% due 11/07/2021 | 90 | 97 | ||||||||||
First Data Corp. |
| |||||||||||
7.375% due 06/15/2019 | 200 | 215 | ||||||||||
HD Supply, Inc. |
| |||||||||||
8.125% due 04/15/2019 | 100 | 111 | ||||||||||
Hexion U.S. Finance Corp. |
| |||||||||||
8.875% due 02/01/2018 | 300 | 313 | ||||||||||
Reynolds Group Issuer, Inc. |
| |||||||||||
8.500% due 05/15/2018 | 100 | 105 | ||||||||||
Rockies Express Pipeline LLC |
| |||||||||||
6.850% due 07/15/2018 | 100 | 109 | ||||||||||
5.625% due 04/15/2020 | 400 | 414 | ||||||||||
Times Square Hotel Trust |
| |||||||||||
8.528% due 08/01/2026 | 614 | 782 | ||||||||||
U.S. Airways Pass-Through Trust |
| |||||||||||
5.900% due 04/01/2026 | 93 | 105 | ||||||||||
Vector Group Ltd. |
| |||||||||||
7.750% due 02/15/2021 | 300 | 321 | ||||||||||
Warner Chilcott Co. LLC |
| |||||||||||
7.750% due 09/15/2018 | 100 | 105 | ||||||||||
|
| |||||||||||
| 3,491 | ||||||||||||
|
| |||||||||||
| 58 | PIMCO EQUITY SERIES | See Accompanying Notes |
Table of Contents
June 30, 2014
| PRINCIPAL AMOUNT (000S) | MARKET VALUE (000S) | |||||||||||
| UTILITIES 0.0% | ||||||||||||
AES Corp. |
| |||||||||||
3.229% due 06/01/2019 | $ | 58 | $ | 59 | ||||||||
NGPL PipeCo LLC |
| |||||||||||
9.625% due 06/01/2019 | 200 | 220 | ||||||||||
|
| |||||||||||
| 279 | ||||||||||||
|
| |||||||||||
Total United States | 5,988 | |||||||||||
|
| |||||||||||
| VENEZUELA 0.1% | ||||||||||||
| INDUSTRIALS 0.1% | ||||||||||||
Petroleos de Venezuela S.A. |
| |||||||||||
8.500% due 11/02/2017 | 600 | 557 | ||||||||||
|
| |||||||||||
Total Venezuela | 557 | |||||||||||
|
| |||||||||||
| VIRGIN ISLANDS (BRITISH) 0.0% | ||||||||||||
| INDUSTRIALS 0.0% | ||||||||||||
Gold Fields Orogen Holding BVI Ltd. |
| |||||||||||
4.875% due 10/07/2020 | 400 | 370 | ||||||||||
|
| |||||||||||
Total Virgin Islands (British) | 370 | |||||||||||
|
| |||||||||||
Total Corporate Bonds & Notes | 24,614 | |||||||||||
|
| |||||||||||
| MORTGAGE-BACKED SECURITIES 2.7% | ||||||||||||
| UNITED STATES 2.7% | ||||||||||||
American Home Mortgage Assets Trust |
| |||||||||||
6.250% due 06/25/2037 | 185 | 127 | ||||||||||
Banc of America Alternative Loan Trust |
| |||||||||||
6.000% due 04/25/2036 | 108 | 98 | ||||||||||
6.000% due 06/25/2046 | 131 | 108 | ||||||||||
6.000% due 07/25/2046 | 221 | 182 | ||||||||||
Banc of America Funding Corp. |
| |||||||||||
5.354% due 05/20/2036 | 52 | 51 | ||||||||||
6.000% due 08/25/2037 ^ | 248 | 221 | ||||||||||
Banc of America Mortgage Trust |
| |||||||||||
5.516% due 11/20/2046 ^ | 33 | 29 | ||||||||||
6.000% due 10/25/2036 ^ | 64 | 56 | ||||||||||
Bear Stearns Alt-A Trust |
| |||||||||||
2.789% due 05/25/2036 | 230 | 137 | ||||||||||
4.928% due 09/25/2035 | 159 | 129 | ||||||||||
Bear Stearns Mortgage Funding Trust |
| |||||||||||
7.000% due 08/25/2036 | 295 | 244 | ||||||||||
Chase Mortgage Finance Trust |
| |||||||||||
2.698% due 09/25/2036 | 118 | 103 | ||||||||||
Citigroup Mortgage Loan Trust, Inc. |
| |||||||||||
3.684% due 07/25/2046 ^ | 28 | 23 | ||||||||||
CitiMortgage Alternative Loan Trust |
| |||||||||||
6.000% due 01/25/2037 | 158 | 133 | ||||||||||
Countrywide Alternative Loan Trust |
| |||||||||||
0.852% due 10/25/2037 | 7,679 | 4,114 | ||||||||||
6.000% due 03/25/2036 | 62 | 53 | ||||||||||
6.000% due 05/25/2036 | 3,285 | 2,783 | ||||||||||
6.000% due 05/25/2036 ^ | 265 | 218 | ||||||||||
6.000% due 06/25/2036 | 291 | 231 | ||||||||||
6.000% due 02/25/2037 ^ | 248 | 192 | ||||||||||
6.000% due 03/25/2037 ^ | 82 | 68 | ||||||||||
6.000% due 05/25/2037 ^ | 24 | 20 | ||||||||||
6.000% due 05/25/2037 | 317 | 267 | ||||||||||
6.000% due 06/25/2037 ^ | 826 | 702 | ||||||||||
6.250% due 12/25/2036 ^ | 51 | 42 | ||||||||||
6.500% due 12/25/2036 | 2,327 | 1,877 | ||||||||||
6.500% due 11/25/2037 ^ | 84 | 72 | ||||||||||
Countrywide Home Loan Mortgage Pass-Through Trust |
| |||||||||||
0.652% due 07/25/2037 ^ | 56 | 41 | ||||||||||
4.969% due 09/25/2037 ^ | 141 | 124 | ||||||||||
| PRINCIPAL AMOUNT (000S) | MARKET VALUE (000S) | |||||||||||
Credit Suisse First Boston Mortgage Securities Corp. |
| |||||||||||
6.000% due 11/25/2035 ^ | $ | 29 | $ | 20 | ||||||||
6.000% due 01/25/2036 | 84 | 66 | ||||||||||
Credit Suisse Mortgage Capital Certificates |
| |||||||||||
6.054% due 12/29/2037 | 229 | 122 | ||||||||||
CSMC Mortgage-Backed Trust |
| |||||||||||
5.000% due 03/25/2037 ^ | 7 | 7 | ||||||||||
6.500% due 10/25/2021 | 168 | 151 | ||||||||||
6.750% due 08/25/2036 ^ | 34 | 28 | ||||||||||
Deutsche ALT-A Securities, Inc. |
| |||||||||||
0.352% due 02/25/2047 | 34 | 28 | ||||||||||
First Horizon Alternative Mortgage Securities Trust |
| |||||||||||
2.243% due 06/25/2036 | 858 | 666 | ||||||||||
HarborView Mortgage Loan Trust |
| |||||||||||
0.493% due 06/20/2035 | 8 | 8 | ||||||||||
4.901% due 06/19/2036 ^ | 34 | 24 | ||||||||||
HSI Asset Loan Obligation Trust |
| |||||||||||
6.000% due 06/25/2037 | 32 | 28 | ||||||||||
IndyMac Mortgage Loan Trust |
| |||||||||||
2.272% due 06/25/2037 | 280 | 151 | ||||||||||
2.849% due 05/25/2037 | 187 | 132 | ||||||||||
4.584% due 08/25/2035 | 132 | 112 | ||||||||||
4.584% due 08/25/2035 ^ | 263 | 223 | ||||||||||
JPMorgan Alternative Loan Trust |
| |||||||||||
5.701% due 05/26/2037 | 151 | 125 | ||||||||||
JPMorgan Mortgage Trust |
| |||||||||||
6.500% due 07/25/2036 | 139 | 122 | ||||||||||
Merrill Lynch Mortgage Investors Trust |
| |||||||||||
2.461% due 02/25/2036 | 18 | 17 | ||||||||||
2.778% due 03/25/2036 ^ | 27 | 19 | ||||||||||
Morgan Stanley Mortgage Loan Trust |
| |||||||||||
2.541% due 06/25/2037 | 835 | 547 | ||||||||||
6.000% due 10/25/2037 ^ | 3,001 | 2,457 | ||||||||||
RBSSP Resecuritization Trust |
| |||||||||||
49.921% due 06/26/2037 | 300 | 182 | ||||||||||
Residential Accredit Loans, Inc. Trust |
| |||||||||||
0.552% due 10/25/2045 | 199 | 156 | ||||||||||
5.500% due 03/25/2037 | 1,015 | 796 | ||||||||||
6.000% due 08/25/2036 | 191 | 153 | ||||||||||
6.000% due 08/25/2036 ^ | 163 | 132 | ||||||||||
6.250% due 03/25/2037 ^ | 85 | 60 | ||||||||||
Residential Funding Mortgage Securities, Inc. Trust |
| |||||||||||
6.000% due 10/25/2036 | 24 | 21 | ||||||||||
Structured Adjustable Rate Mortgage Loan Trust |
| |||||||||||
2.561% due 10/25/2036 | 4,683 | 3,596 | ||||||||||
Wachovia Bank Commercial Mortgage Trust |
| |||||||||||
4.982% due 02/15/2035 | 572 | 572 | ||||||||||
Wells Fargo Alternative Loan Trust |
| |||||||||||
2.619% due 07/25/2037 | 3,032 | 2,590 | ||||||||||
6.250% due 11/25/2037 ^ | 432 | 412 | ||||||||||
|
| |||||||||||
Total Mortgage-Backed Securities |
| 26,168 | ||||||||||
|
| |||||||||||
| MUNICIPAL BONDS & NOTES 0.1% | ||||||||||||
| MICHIGAN 0.0% | ||||||||||||
Michigan Tobacco Settlement Finance Authority Revenue Bonds, Series 2006 |
| |||||||||||
7.309% due 06/01/2034 | 95 | 82 | ||||||||||
|
| |||||||||||
Total Michigan | 82 | |||||||||||
|
| |||||||||||
| VIRGINIA 0.0% | ||||||||||||
Tobacco Settlement Financing Corp., Virginia Revenue Bonds, Series 2007 |
| |||||||||||
6.706% due 06/01/2046 | 390 | 291 | ||||||||||
|
| |||||||||||
Total Virginia | 291 | |||||||||||
|
| |||||||||||
| PRINCIPAL AMOUNT (000S) | MARKET VALUE (000S) | |||||||||||
| WEST VIRGINIA 0.1% | ||||||||||||
Tobacco Settlement Finance Authority, West Virginia Revenue Bonds, Series 2007 |
| |||||||||||
7.467% due 06/01/2047 | $ | 375 | $ | 322 | ||||||||
|
| |||||||||||
Total West Virginia | 322 | |||||||||||
|
| |||||||||||
Total Municipal Bonds & Notes | 695 | |||||||||||
|
| |||||||||||
| SHARES | ||||||||||||
| PREFERRED SECURITIES 0.1% | ||||||||||||
| UNITED STATES 0.1% | ||||||||||||
| UTILITIES 0.1% | ||||||||||||
DTE Energy Co. |
| |||||||||||
5.250% due 12/01/2062 | 5,150 | 123 | ||||||||||
Entergy Louisiana LLC |
| |||||||||||
4.700% due 06/01/2063 | 25,000 | 552 | ||||||||||
|
| |||||||||||
Total Preferred Securities | 675 | |||||||||||
|
| |||||||||||
| REAL ESTATE INVESTMENT TRUSTS 2.9% | ||||||||||||
| UNITED STATES 2.9% | ||||||||||||
| FINANCIALS 2.9% | ||||||||||||
Colony Financial, Inc. | 1,189,031 | 27,609 | ||||||||||
|
| |||||||||||
Total Real Estate Investment Trusts |
| 27,609 | ||||||||||
|
| |||||||||||
| PRINCIPAL AMOUNT (000S) | ||||||||||||
| SOVEREIGN ISSUES 0.3% | ||||||||||||
| BRAZIL 0.1% | ||||||||||||
Brazil Notas do Tesouro Nacional Inflation Linked |
| |||||||||||
6.000% due 05/15/2045 | BRL | 500 | 543 | |||||||||
6.000% due 08/15/2050 | 259 | 280 | ||||||||||
|
| |||||||||||
Total Brazil | 823 | |||||||||||
|
| |||||||||||
| GREECE 0.1% | ||||||||||||
Hellenic Republic Government International Bond |
| |||||||||||
3.800% due 08/08/2017 | JPY | 29,000 | 276 | |||||||||
4.500% due 07/03/2017 | 10,000 | 95 | ||||||||||
|
| |||||||||||
Total Greece | 371 | |||||||||||
|
| |||||||||||
| RUSSIA 0.0% | ||||||||||||
Russia Government International Bond |
| |||||||||||
5.000% due 04/29/2020 | $ | 200 | 214 | |||||||||
7.500% due 03/31/2030 | 55 | 64 | ||||||||||
|
| |||||||||||
Total Russia | 278 | |||||||||||
|
| |||||||||||
| SPAIN 0.1% | ||||||||||||
Autonomous Community of Catalonia |
| |||||||||||
3.875% due 04/07/2015 | EUR | 100 | 140 | |||||||||
4.750% due 06/04/2018 | 300 | 457 | ||||||||||
Autonomous Community of Madrid |
| |||||||||||
5.750% due 02/01/2018 | 100 | 158 | ||||||||||
Autonomous Community of Valencia |
| |||||||||||
3.250% due 07/06/2015 | 50 | 70 | ||||||||||
4.375% due 07/16/2015 | 200 | 283 | ||||||||||
|
| |||||||||||
Total Spain | 1,108 | |||||||||||
|
| |||||||||||
| See Accompanying Notes | ANNUAL REPORT | JUNE 30, 2014 | 59 |
Table of Contents
Schedule of Investments PIMCO Dividend and Income Builder Fund (Cont.)
| PRINCIPAL AMOUNT (000S) | MARKET VALUE (000S) | |||||||||||
| VENEZUELA 0.0% | ||||||||||||
Venezuela Government International Bond |
| |||||||||||
7.650% due 04/21/2025 | $ | 100 | $ | 77 | ||||||||
7.750% due 10/13/2019 | 200 | 173 | ||||||||||
|
| |||||||||||
Total Venezuela | 250 | |||||||||||
|
| |||||||||||
Total Sovereign Issues (Cost $2,688) | 2,830 | |||||||||||
|
| |||||||||||
| SHORT-TERM INSTRUMENTS 0.4% | ||||||||||||
| REPURCHASE AGREEMENTS (e) 0.4% | ||||||||||||
| 3,787 | ||||||||||||
|
| |||||||||||
| U.S. TREASURY BILLS 0.0% | ||||||||||||
0.043% due 10/30/2014 - 11/06/2014 (c)(g) | 176 | 176 | ||||||||||
|
| |||||||||||
| Total Short-Term Instruments (Cost $3,963) | 3,963 | |||||||||||
|
| |||||||||||
| Total Investments in Securities (Cost $857,865) | 938,046 | |||||||||||
|
| |||||||||||
| SHARES | MARKET VALUE (000S) | |||||||||||
| INVESTMENTS IN AFFILIATES 2.0% | ||||||||||||
| SHORT-TERM INSTRUMENTS 2.0% | ||||||||||||
| CENTRAL FUNDS USED FOR CASH MANAGEMENT PURPOSES 2.0% | ||||||||||||
PIMCO Short-Term Floating NAV Portfolio | 1,931,700 | $ | 19,329 | |||||||||
|
| |||||||||||
| Total Short-Term Instruments (Cost $19,328) | 19,329 | |||||||||||
|
| |||||||||||
| Total Investments in Affiliates (Cost $19,328) | 19,329 | |||||||||||
| Total Investments 100.2% (Cost $877,193) | $ | 957,375 | ||||||||||
Financial Derivative (Cost or Premiums, net $21) | 13 | |||||||||||
| Other Assets and Liabilities, net (0.2%) | (1,870 | ) | ||||||||||
|
| |||||||||||
| Net Assets 100.0% | $ | 955,518 | ||||||||||
|
| |||||||||||
NOTES TO SCHEDULE OF INVESTMENTS (AMOUNTS IN THOUSANDS*, EXCEPT NUMBER OF CONTRACTS AND SHARES):
| * | A zero balance may reflect actual amounts rounding to less than one thousand. |
| ^ | Security is in default. |
| (a) | Payment in-kind bond security. |
| (b) | Security did not produce income within the last twelve months. |
| (c) | Coupon represents a weighted average yield to maturity. |
| (d) | Perpetual maturity; date shown, if applicable, represents next contractual call date. |
BORROWINGS AND OTHER FINANCING TRANSACTIONS
(e) REPURCHASE AGREEMENTS:
| Counterparty | Lending Rate | Settlement Date | Maturity Date | Principal Amount | Collateralized By | Collateral Received, at Value | Repurchase Agreements, at Value | Repurchase Agreement Proceeds to be Received (1) | ||||||||||||||||||||
BOS | 0.140% | 06/30/2014 | 07/01/2014 | $ | 3,400 | U.S. Treasury Notes 1.625% due 06/30/2019 | $ | (3,469 | ) | $ | 3,400 | $ | 3,400 | |||||||||||||||
SSB | 0.000% | 06/30/2014 | 07/01/2014 | 387 | Fannie Mae 2.110% due 11/07/2022 | (395 | ) | 387 | 387 | |||||||||||||||||||
|
|
|
|
|
| |||||||||||||||||||||||
Total Repurchase Agreements |
| $ | (3,864 | ) | $ | 3,787 | $ | 3,787 | ||||||||||||||||||||
|
|
|
|
|
| |||||||||||||||||||||||
| (1) | Includes accrued interest. |
BORROWINGS AND OTHER FINANCING TRANSACTIONS SUMMARY
The following is a summary by counterparty of the market value of Borrowings and Other Financing Transactions and collateral (received) as of June 30, 2014:
| Counterparty | Repurchase Agreement Proceeds to be Received | Payable for Reverse Repurchase Agreements | Payable for Sale-Buyback Transactions | Payable for Short Sales | Total Borrowings and Other Financing Transactions | Collateral (Received) | Net Exposure (2) | |||||||||||||||||||||
Global/Master Repurchase Agreement | ||||||||||||||||||||||||||||
BOS | $ | 3,400 | $ | 0 | $ | 0 | $ | 0 | $ | 3,400 | $ | (3,469 | ) | $ | (69 | ) | ||||||||||||
SSB | 387 | 0 | 0 | 0 | 387 | (395 | ) | (8 | ) | |||||||||||||||||||
|
|
|
|
|
|
|
| |||||||||||||||||||||
Total Borrowings and Other Financing Transactions | $ | 3,787 | $ | 0 | $ | 0 | $ | 0 | ||||||||||||||||||||
|
|
|
|
|
|
|
| |||||||||||||||||||||
| (2) | Net Exposure represents the net receivable/(payable) that would be due from/to the counterparty in the event of default. Exposure from borrowings and other financing transactions can only be netted across transactions governed under the same master agreement with the same legal entity. See Note 7, Principal Risks, in the Notes to Financial Statements for more information regarding master netting arrangements. |
| 60 | PIMCO EQUITY SERIES | See Accompanying Notes |
Table of Contents
June 30, 2014
(f) FINANCIAL DERIVATIVE INSTRUMENTS: EXCHANGE-TRADED OR CENTRALLY CLEARED
FUTURES CONTRACTS:
Description | Type | Expiration Month | # of Contracts | Unrealized (Depreciation) | Variation Margin | |||||||||||||||||
| Asset | Liability | |||||||||||||||||||||
British pound currency September Futures | Short | 09/2014 | 45 | $ | (99 | ) | $ | 0 | $ | (24 | ) | |||||||||||
Euro currency September Futures | Short | 09/2014 | 39 | (74 | ) | 0 | (24 | ) | ||||||||||||||
Mexican peso currency September Futures | Short | 09/2014 | 11 | (2 | ) | 1 | 0 | |||||||||||||||
|
|
|
|
|
| |||||||||||||||||
Total Futures Contracts | $ | (175 | ) | $ | 1 | $ | (48 | ) | ||||||||||||||
|
|
|
|
|
| |||||||||||||||||
FINANCIAL DERIVATIVE INSTRUMENTS: EXCHANGE-TRADED OR CENTRALLY CLEARED SUMMARY
The following is a summary of the market value and variation margin of Exchange-Traded or Centrally Cleared Financial Derivative Instruments as of June 30, 2014:
| (g) | Securities with an aggregate market value of $176 have been pledged as collateral for exchange-traded and centrally cleared financial derivative instruments as of June 30, 2014. See Note 7, Principal Risks, in the Notes to Financial Statements for more information regarding master netting arrangements. |
| Financial Derivative Assets | Financial Derivative Liabilities | |||||||||||||||||||||||||||||||||
| Market Value | Variation Margin Asset | Total | Market Value | Variation Margin Liability | Total | |||||||||||||||||||||||||||||
| Purchased Options | Futures | Swap Agreements | Written Options | Futures | Swap Agreements | |||||||||||||||||||||||||||||
Total Exchange-Traded or Centrally Cleared | $ | 0 | $ | 1 | $ | 0 | $ | 1 | $ | 0 | $ | (48) | $ | 0 | $ | (48) | ||||||||||||||||||
|
|
|
|
|
|
|
|
|
|
|
|
|
|
|
| |||||||||||||||||||
(h) FINANCIAL DERIVATIVE INSTRUMENTS: OVER THE COUNTER
FORWARD FOREIGN CURRENCY CONTRACTS:
Counterparty | Settlement | Currency to | Currency to | Unrealized Appreciation/ (Depreciation) | ||||||||||||||||||||||||
| Asset | Liability | |||||||||||||||||||||||||||
BOA | 08/2014 | $ | 5,721 | EUR | 4,193 | $ | 21 | $ | 0 | |||||||||||||||||||
DUB | 07/2014 | 19,722 | 14,511 | 148 | 0 | |||||||||||||||||||||||
| 08/2014 | EUR | 14,511 | $ | 19,724 | 0 | (148 | ) | |||||||||||||||||||||
FBF | 07/2014 | $ | 801 | THB | 26,118 | 3 | 0 | |||||||||||||||||||||
GLM | 07/2014 | EUR | 14,511 | $ | 19,874 | 4 | 0 | |||||||||||||||||||||
JPM | 07/2014 | THB | 26,118 | 804 | 0 | 0 | ||||||||||||||||||||||
|
|
|
| |||||||||||||||||||||||||
Total Forward Foreign Currency Contracts |
| $ | 176 | $ | (148 | ) | ||||||||||||||||||||||
|
|
|
| |||||||||||||||||||||||||
SWAP AGREEMENTS:
TOTAL RETURN SWAPS ON CONVERTIBLE SECURITIES
| Counterparty | Pay/Receive | Underlying Reference | # of Shares | Financing Rate | Maturity Date | Notional Amount | Premiums Paid | Unrealized Appreciation | Swap Agreements, at Value | |||||||||||||||||||||||||
| Asset | Liability | |||||||||||||||||||||||||||||||||
| DUB | Receive | OGX Petroleo e Gas Participaceos S.A. | 138 | Not Applicable, | 02/11/2015 | $ 21 | $ | 21 | $ | 11 | $ | 32 | $ | 0 | ||||||||||||||||||||
|
|
|
|
|
| |||||||||||||||||||||||||||||
Total Swap Agreements | $ | 11 | $ | 32 | $ | 0 | ||||||||||||||||||||||||||||
|
|
|
|
|
| |||||||||||||||||||||||||||||
FINANCIAL DERIVATIVE INSTRUMENTS: OVER THE COUNTER SUMMARY
The following is a summary by counterparty of the market value of OTC financial derivative instruments and collateral (received)/pledged as of June 30, 2014:
| Financial Derivative Assets | Financial Derivative Liabilities | |||||||||||||||||||||||||||||||||||||||||||||
| Counterparty | Forward Foreign Currency Contracts | Purchased Options | Swap Agreements | Total Over the Counter | Forward Foreign Currency Contracts | Written Options | Swap Agreements | Total Over the Counter | Net Market Value of OTC Derivatives | Collateral (Received)/ Pledged | Net Exposure (1) | |||||||||||||||||||||||||||||||||||
BOA | $ | 21 | $ | 0 | $ | 0 | $ | 21 | $ | 0 | $ | 0 | $ | 0 | $ | 0 | $ | 21 | $ | 0 | $ | 21 | ||||||||||||||||||||||||
DUB | 148 | 0 | 32 | 180 | (148 | ) | 0 | 0 | (148 | ) | 32 | 0 | 32 | |||||||||||||||||||||||||||||||||
FBF | 3 | 0 | 0 | 3 | 0 | 0 | 0 | 0 | 3 | 0 | 3 | |||||||||||||||||||||||||||||||||||
GLM | 4 | 0 | 0 | 4 | 0 | 0 | 0 | 0 | 4 | 0 | 4 | |||||||||||||||||||||||||||||||||||
HUS | 0 | 0 | 0 | 0 | 0 | 0 | 0 | 0 | 0 | (290 | ) | (290 | ) | |||||||||||||||||||||||||||||||||
|
|
|
|
|
|
|
|
|
|
|
|
|
|
|
| |||||||||||||||||||||||||||||||
Total Over the Counter | $ | 176 | $ | 0 | $ | 32 | $ | 208 | $ | (148 | ) | $ | 0 | $ | 0 | $ | (148 | ) | ||||||||||||||||||||||||||||
|
|
|
|
|
|
|
|
|
|
|
|
|
|
|
| |||||||||||||||||||||||||||||||
| (1) | Net Exposure represents the net receivable/(payable) that would be due from/to the counterparty in the event of default. Exposure from OTC financial derivative instruments can only be netted across transactions governed under the same master agreement with the same legal entity. See Note 7, Principal Risks, in the Notes to Financial Statements for more information regarding master netting arrangements. |
| See Accompanying Notes | ANNUAL REPORT | JUNE 30, 2014 | 61 |
Table of Contents
Schedule of Investments PIMCO Dividend and Income Builder Fund (Cont.)
FAIR VALUE OF FINANCIAL DERIVATIVE INSTRUMENTS
The following is a summary of the fair valuation of the Fund’s derivative instruments categorized by risk exposure. See Note 7, Principal Risks, in the Notes to Financial Statements on risks of the Fund.
Fair Values of Financial Derivative Instruments on the Statements of Assets and Liabilities as of June 30, 2014:
| Derivatives not accounted for as hedging instruments | ||||||||||||||||||||||||
| Commodity Contracts | Credit Contracts | Equity Contracts | Foreign Exchange Contracts | Interest Rate Contracts | Total | |||||||||||||||||||
Financial Derivative Instruments - Assets | ||||||||||||||||||||||||
Exchange-traded or centrally cleared | ||||||||||||||||||||||||
Futures | $ | 0 | $ | 0 | $ | 0 | $ | 1 | $ | 0 | $ | 1 | ||||||||||||
|
|
|
|
|
|
|
|
|
|
|
| |||||||||||||
Over the counter | ||||||||||||||||||||||||
Forward Foreign Currency Contracts | $ | 0 | $ | 0 | $ | 0 | $ | 176 | $ | 0 | $ | 176 | ||||||||||||
Swap Agreements | 0 | 32 | 0 | 0 | 0 | 32 | ||||||||||||||||||
|
|
|
|
|
|
|
|
|
|
|
| |||||||||||||
| $ | 0 | $ | 32 | $ | 0 | $ | 176 | $ | 0 | $ | 208 | |||||||||||||
|
|
|
|
|
|
|
|
|
|
|
| |||||||||||||
| $ | 0 | $ | 32 | $ | 0 | $ | 177 | $ | 0 | $ | 209 | |||||||||||||
|
|
|
|
|
|
|
|
|
|
|
| |||||||||||||
Financial Derivative Instruments - Liabilities | ||||||||||||||||||||||||
Exchange-traded or centrally cleared | ||||||||||||||||||||||||
Futures | $ | 0 | $ | 0 | $ | 0 | $ | 48 | $ | 0 | $ | 48 | ||||||||||||
|
|
|
|
|
|
|
|
|
|
|
| |||||||||||||
Over the counter | ||||||||||||||||||||||||
Forward Foreign Currency Contracts | $ | 0 | $ | 0 | $ | 0 | $ | 148 | $ | 0 | $ | 148 | ||||||||||||
|
|
|
|
|
|
|
|
|
|
|
| |||||||||||||
| $ | 0 | $ | 0 | $ | 0 | $ | 196 | $ | 0 | $ | 196 | |||||||||||||
|
|
|
|
|
|
|
|
|
|
|
| |||||||||||||
The Effect of Financial Derivative Instruments on the Statements of Operations for the Period Ended June 30, 2014:
| Derivatives not accounted for as hedging instruments | ||||||||||||||||||||||||
| Commodity Contracts | Credit Contracts | Equity Contracts | Foreign Exchange Contracts | Interest Rate Contracts | Total | |||||||||||||||||||
Net Realized Gain (Loss) on Financial Derivative Instruments | ||||||||||||||||||||||||
Exchange-traded or centrally cleared | ||||||||||||||||||||||||
Futures | $ | 0 | $ | 0 | $ | 4,944 | $ | (3,143 | ) | $ | 0 | $ | 1,801 | |||||||||||
|
|
|
|
|
|
|
|
|
|
|
| |||||||||||||
Over the counter | ||||||||||||||||||||||||
Forward Foreign Currency Contracts | $ | 0 | $ | 0 | $ | 0 | $ | 2,222 | $ | 0 | $ | 2,222 | ||||||||||||
|
|
|
|
|
|
|
|
|
|
|
| |||||||||||||
| $ | 0 | $ | 0 | $ | 4,944 | $ | (921 | ) | $ | 0 | $ | 4,023 | ||||||||||||
|
|
|
|
|
|
|
|
|
|
|
| |||||||||||||
Net Change in Unrealized Appreciation (Depreciation) on Financial Derivative Instruments |
| |||||||||||||||||||||||
Exchange-traded or centrally cleared | ||||||||||||||||||||||||
Futures | $ | 0 | $ | 0 | $ | 0 | $ | (48 | ) | $ | 0 | $ | (48 | ) | ||||||||||
|
|
|
|
|
|
|
|
|
|
|
| |||||||||||||
Over the counter | ||||||||||||||||||||||||
Forward Foreign Currency Contracts | $ | 0 | $ | 0 | $ | 0 | $ | (306 | ) | $ | 0 | $ | (306 | ) | ||||||||||
Swap Agreements | 0 | 11 | 0 | 0 | 0 | 11 | ||||||||||||||||||
|
|
|
|
|
|
|
|
|
|
|
| |||||||||||||
| $ | 0 | $ | 11 | $ | 0 | $ | (306 | ) | $ | 0 | $ | (295 | ) | |||||||||||
|
|
|
|
|
|
|
|
|
|
|
| |||||||||||||
| $ | 0 | $ | 11 | $ | 0 | $ | (354 | ) | $ | 0 | $ | (343 | ) | |||||||||||
|
|
|
|
|
|
|
|
|
|
|
| |||||||||||||
FAIR VALUE MEASUREMENTS
The following is a summary of the fair valuations according to the inputs used as of June 30, 2014 in valuing the Fund’s assets and liabilities:
| Category and Subcategory | Level 1 | Level 2 | Level 3 | Fair Value at 06/30/2014 | ||||||||||||
Investments in Securities, at Value |
| |||||||||||||||
Asset-Backed Securities | ||||||||||||||||
United States | $ | 0 | $ | 16,210 | $ | 0 | $ | 16,210 | ||||||||
Bank Loan Obligations | ||||||||||||||||
Brazil | 0 | 0 | 12 | 12 | ||||||||||||
Luxembourg | 0 | 252 | 0 | 252 | ||||||||||||
United States | 0 | 2,534 | 0 | 2,534 | ||||||||||||
Common Stocks | ||||||||||||||||
Australia | ||||||||||||||||
Industrials | 7,936 | 0 | 0 | 7,936 | ||||||||||||
Bermuda | ||||||||||||||||
Energy | 18,493 | 0 | 0 | 18,493 | ||||||||||||
| Category and Subcategory | Level 1 | Level 2 | Level 3 | Fair Value at 06/30/2014 | ||||||||||||
Brazil | ||||||||||||||||
Financials | $ | 8,805 | $ | 0 | $ | 0 | $ | 8,805 | ||||||||
Industrials | 8,204 | 0 | 0 | 8,204 | ||||||||||||
Utilities | 21,602 | 0 | 0 | 21,602 | ||||||||||||
China | ||||||||||||||||
Industrials | 8,421 | 3,304 | 0 | 11,725 | ||||||||||||
Cyprus | ||||||||||||||||
Energy | 0 | 21,979 | 0 | 21,979 | ||||||||||||
France | ||||||||||||||||
Energy | 0 | 13,306 | 0 | 13,306 | ||||||||||||
Financials | 0 | 15,506 | 0 | 15,506 | ||||||||||||
Utilities | 0 | 28,015 | 0 | 28,015 | ||||||||||||
| 62 | PIMCO EQUITY SERIES | See Accompanying Notes |
Table of Contents
June 30, 2014
| Category and Subcategory | Level 1 | Level 2 | Level 3 | Fair Value at 06/30/2014 | ||||||||||||
Germany | ||||||||||||||||
Consumer Discretionary | $ | 0 | $ | 16,212 | $ | 0 | $ | 16,212 | ||||||||
Hong Kong | ||||||||||||||||
Industrials | 4,256 | 0 | 0 | 4,256 | ||||||||||||
Telecommunication Services | 0 | 8,353 | 0 | 8,353 | ||||||||||||
Italy | ||||||||||||||||
Industrials | 0 | 9,696 | 0 | 9,696 | ||||||||||||
Japan | ||||||||||||||||
Telecommunication Services | 0 | 16,723 | 0 | 16,723 | ||||||||||||
Luxembourg | ||||||||||||||||
Industrials | 0 | 4,067 | 0 | 4,067 | ||||||||||||
Mexico | ||||||||||||||||
Consumer Staples | 10,454 | 0 | 0 | 10,454 | ||||||||||||
Netherlands | ||||||||||||||||
Financials | 8,228 | 16,812 | 0 | 25,040 | ||||||||||||
Singapore | ||||||||||||||||
Industrials | 0 | 7,938 | 0 | 7,938 | ||||||||||||
South Africa | ||||||||||||||||
Health Care | 0 | 4,505 | 0 | 4,505 | ||||||||||||
Telecommunication Services | 0 | 8,733 | 0 | 8,733 | ||||||||||||
Spain | ||||||||||||||||
Consumer Staples | 0 | 11,550 | 0 | 11,550 | ||||||||||||
Financials | 0 | 13,357 | 0 | 13,357 | ||||||||||||
Sweden | ||||||||||||||||
Consumer Discretionary | 0 | 8,735 | 0 | 8,735 | ||||||||||||
Switzerland | ||||||||||||||||
Health Care | 0 | 16,157 | 0 | 16,157 | ||||||||||||
Taiwan | ||||||||||||||||
Information Technology | 0 | 13,527 | 0 | 13,527 | ||||||||||||
Turkey | ||||||||||||||||
Industrials | 0 | 8,853 | 0 | 8,853 | ||||||||||||
United Kingdom | ||||||||||||||||
Consumer Staples | 0 | 23,547 | 0 | 23,547 | ||||||||||||
Energy | 0 | 21,943 | 0 | 21,943 | ||||||||||||
Financials | 0 | 7,238 | 0 | 7,238 | ||||||||||||
United States | ||||||||||||||||
Consumer Discretionary | 118,166 | 0 | 0 | 118,166 | ||||||||||||
Consumer Staples | 17,698 | 0 | 0 | 17,698 | ||||||||||||
Energy | 20,585 | 0 | 0 | 20,585 | ||||||||||||
Financials | 129,118 | 0 | 0 | 129,118 | ||||||||||||
Health Care | 29,211 | 0 | 0 | 29,211 | ||||||||||||
Information Technology | 75,942 | 0 | 0 | 75,942 | ||||||||||||
Materials | 17,670 | 0 | 0 | 17,670 | ||||||||||||
Telecommunication Services | 18,632 | 0 | 0 | 18,632 | ||||||||||||
Utilities | 9,007 | 0 | 0 | 9,007 | ||||||||||||
Corporate Bonds & Notes | ||||||||||||||||
Austria | ||||||||||||||||
Industrials | 0 | 25 | 0 | 25 | ||||||||||||
Brazil | ||||||||||||||||
Banking & Finance | 0 | 209 | 0 | 209 | ||||||||||||
Utilities | 0 | 446 | 0 | 446 | ||||||||||||
Cayman Islands | ||||||||||||||||
Utilities | 0 | 189 | 0 | 189 | ||||||||||||
Colombia | ||||||||||||||||
Industrials | 0 | 52 | 0 | 52 | ||||||||||||
France | ||||||||||||||||
Banking & Finance | 0 | 821 | 0 | 821 | ||||||||||||
Industrials | 0 | 830 | 0 | 830 | ||||||||||||
Germany | ||||||||||||||||
Industrials | 0 | 391 | 0 | 391 | ||||||||||||
Guernsey, Channel Islands | ||||||||||||||||
Banking & Finance | 0 | 390 | 0 | 390 | ||||||||||||
Ireland | ||||||||||||||||
Banking & Finance | 0 | 11 | 0 | 11 | ||||||||||||
Industrials | 0 | 969 | 0 | 969 | ||||||||||||
Utilities | 0 | 436 | 0 | 436 | ||||||||||||
Italy | ||||||||||||||||
Banking & Finance | 0 | 813 | 0 | 813 | ||||||||||||
Utilities | 0 | 281 | 0 | 281 | ||||||||||||
Luxembourg | ||||||||||||||||
Banking & Finance | 0 | 565 | 0 | 565 | ||||||||||||
| Category and Subcategory | Level 1 | Level 2 | Level 3 | Fair Value at 06/30/2014 | ||||||||||||
Industrials | $ | 0 | $ | 743 | $ | 0 | $ | 743 | ||||||||
Utilities | 0 | 1,976 | 0 | 1,976 | ||||||||||||
Mexico | ||||||||||||||||
Industrials | 0 | 96 | 0 | 96 | ||||||||||||
Netherlands | ||||||||||||||||
Banking & Finance | 0 | 805 | 0 | 805 | ||||||||||||
Industrials | 0 | 258 | 0 | 258 | ||||||||||||
Utilities | 0 | 444 | 0 | 444 | ||||||||||||
Norway | ||||||||||||||||
Banking & Finance | 0 | 136 | 0 | 136 | ||||||||||||
South Africa | ||||||||||||||||
Industrials | 0 | 192 | 0 | 192 | ||||||||||||
Spain | ||||||||||||||||
Banking & Finance | 0 | 856 | 0 | 856 | ||||||||||||
Industrials | 0 | 299 | 0 | 299 | ||||||||||||
United Kingdom | ||||||||||||||||
Banking & Finance | 0 | 2,995 | 0 | 2,995 | ||||||||||||
Industrials | 0 | 2,255 | 0 | 2,255 | ||||||||||||
Utilities | 0 | 216 | 0 | 216 | ||||||||||||
United States | ||||||||||||||||
Banking & Finance | 0 | 2,218 | 0 | 2,218 | ||||||||||||
Industrials | 0 | 3,289 | 202 | 3,491 | ||||||||||||
Utilities | 0 | 279 | 0 | 279 | ||||||||||||
Venezuela | ||||||||||||||||
Industrials | 0 | 557 | 0 | 557 | ||||||||||||
Virgin Islands (British) | ||||||||||||||||
Industrials | 0 | 370 | 0 | 370 | ||||||||||||
Mortgage-Backed Securities | ||||||||||||||||
United States | 0 | 26,168 | 0 | 26,168 | ||||||||||||
Municipal Bonds & Notes | ||||||||||||||||
Michigan | 0 | 82 | 0 | 82 | ||||||||||||
Virginia | 0 | 291 | 0 | 291 | ||||||||||||
West Virginia | 0 | 322 | 0 | 322 | ||||||||||||
Preferred Securities | ||||||||||||||||
United States | ||||||||||||||||
Utilities | 675 | 0 | 0 | 675 | ||||||||||||
Real Estate Investment Trusts | ||||||||||||||||
United States | ||||||||||||||||
Financials | 27,609 | 0 | 0 | 27,609 | ||||||||||||
Sovereign Issues | ||||||||||||||||
Brazil | 0 | 823 | 0 | 823 | ||||||||||||
Greece | 0 | 371 | 0 | 371 | ||||||||||||
Russia | 0 | 278 | 0 | 278 | ||||||||||||
Spain | 0 | 1,108 | 0 | 1,108 | ||||||||||||
Venezuela | 0 | 250 | 0 | 250 | ||||||||||||
Short-Term Instruments | ||||||||||||||||
Repurchase Agreements | 0 | 3,787 | 0 | 3,787 | ||||||||||||
U.S. Treasury Bills | 0 | 176 | 0 | 176 | ||||||||||||
| $ | 560,712 | $ | 377,120 | $ | 214 | $ | 938,046 | |||||||||
Investments in Affiliates, at Value |
| |||||||||||||||
Short-Term Instruments | ||||||||||||||||
Central Funds Used for Cash Management Purposes | $ | 19,329 | $ | 0 | $ | 0 | $ | 19,329 | ||||||||
Total Investments | $ | 580,041 | $ | 377,120 | $ | 214 | $ | 957,375 | ||||||||
Financial Derivative Instruments - Assets |
| |||||||||||||||
Exchange-traded or centrally cleared | 1 | 0 | 0 | 1 | ||||||||||||
Over the counter | 0 | 176 | 32 | 208 | ||||||||||||
| $ | 1 | $ | 176 | $ | 32 | $ | 209 | |||||||||
Financial Derivative Instruments - Liabilities |
| |||||||||||||||
Exchange-traded or centrally cleared | (48 | ) | 0 | 0 | (48 | ) | ||||||||||
Over the counter | 0 | (148 | ) | 0 | (148 | ) | ||||||||||
| $ | (48 | ) | $ | (148 | ) | $ | 0 | $ | (196 | ) | ||||||
Totals | $ | 579,994 | $ | 377,148 | $ | 246 | $ | 957,388 | ||||||||
There were assets and liabilities valued at $12,677 transferred from Level 2 to Level 1 during the period ended June 30, 2014. There were no significant assets and liabilities transferred from Level 1 to Level 2 during the period ended June 30, 2014. There were no significant transfers between Level 2 and 3 during the period ended June 30, 2014.
| See Accompanying Notes | ANNUAL REPORT | JUNE 30, 2014 | 63 |
Table of Contents
Schedule of Investments PIMCO EqS® Dividend Fund
| SHARES | MARKET VALUE (000S) | |||||||||||
| INVESTMENTS IN SECURITIES 99.0% | �� | |||||||||||
| COMMON STOCKS 95.8% | ||||||||||||
| AUSTRALIA 0.9% | ||||||||||||
| INDUSTRIALS 0.9% | ||||||||||||
Spotless Group Holdings Ltd. (a) | 2,488,748 | $ | 3,872 | |||||||||
|
| |||||||||||
Total Australia | 3,872 | |||||||||||
|
| |||||||||||
| BERMUDA 2.1% | ||||||||||||
| ENERGY 2.1% | ||||||||||||
Golar LNG Partners LP | 234,828 | 8,653 | ||||||||||
|
| |||||||||||
Total Bermuda | 8,653 | |||||||||||
|
| |||||||||||
| BRAZIL 4.0% | ||||||||||||
| FINANCIALS 0.8% | ||||||||||||
BB Seguridade Participacoes S.A. | 213,665 | 3,137 | ||||||||||
|
| |||||||||||
| INDUSTRIALS 1.0% | ||||||||||||
Arteris S.A. | 505,100 | 4,207 | ||||||||||
|
| |||||||||||
| UTILITIES 2.2% | ||||||||||||
Cia de Saneamento Basico do Estado de Sao Paulo - ADR | 465,946 | 4,995 | ||||||||||
Light S.A. | 403,800 | 3,940 | ||||||||||
|
| |||||||||||
| 8,935 | ||||||||||||
|
| |||||||||||
Total Brazil | 16,279 | |||||||||||
|
| |||||||||||
| CHINA 1.5% | ||||||||||||
| INDUSTRIALS 1.5% | ||||||||||||
Guangshen Railway Co. Ltd. ‘H’ | 6,096,000 | 2,266 | ||||||||||
Zhejiang Expressway Co. Ltd. ‘H’ | 3,974,000 | 4,010 | ||||||||||
|
| |||||||||||
| 6,276 | ||||||||||||
|
| |||||||||||
Total China | 6,276 | |||||||||||
|
| |||||||||||
| CYPRUS 2.4% | ||||||||||||
| ENERGY 2.4% | ||||||||||||
ProSafe SE | 1,198,004 | 9,874 | ||||||||||
|
| |||||||||||
Total Cyprus | 9,874 | |||||||||||
|
| |||||||||||
| FRANCE 6.4% | ||||||||||||
| ENERGY 1.5% | ||||||||||||
Total S.A. | 87,812 | 6,353 | ||||||||||
|
| |||||||||||
| FINANCIALS 1.9% | ||||||||||||
CNP Assurances | 384,207 | 7,974 | ||||||||||
|
| |||||||||||
| UTILITIES 3.0% | ||||||||||||
Electricite de France | 156,109 | 4,916 | ||||||||||
Suez Environnement Co. | 381,038 | 7,289 | ||||||||||
|
| |||||||||||
| 12,205 | ||||||||||||
|
| |||||||||||
Total France | 26,532 | |||||||||||
|
| |||||||||||
| SHARES | MARKET VALUE (000S) | |||||||||||
| GERMANY 1.9% | ||||||||||||
| CONSUMER DISCRETIONARY 1.9% | ||||||||||||
ProSiebenSat.1 Media AG | 172,808 | $ | 7,692 | |||||||||
|
| |||||||||||
Total Germany | 7,692 | |||||||||||
|
| |||||||||||
| HONG KONG 1.5% | ||||||||||||
| INDUSTRIALS 0.5% | ||||||||||||
Yuexiu Transport Infrastructure Ltd. | 3,776,000 | 2,144 | ||||||||||
|
| |||||||||||
| TELECOMMUNICATION SERVICES 1.0% | ||||||||||||
China Mobile Ltd. | 413,000 | 4,011 | ||||||||||
|
| |||||||||||
Total Hong Kong | 6,155 | |||||||||||
|
| |||||||||||
| ITALY 1.0% | ||||||||||||
| INDUSTRIALS 1.0% | ||||||||||||
Societa Iniziative Autostradali e Servizi SpA | 304,928 | 3,913 | ||||||||||
|
| |||||||||||
Total Italy | 3,913 | |||||||||||
|
| |||||||||||
| JAPAN 1.7% | ||||||||||||
| TELECOMMUNICATION SERVICES 1.7% | ||||||||||||
Nippon Telegraph & Telephone Corp. | 114,000 | 7,105 | ||||||||||
|
| |||||||||||
Total Japan | 7,105 | |||||||||||
|
| |||||||||||
| LUXEMBOURG 0.5% | ||||||||||||
| INDUSTRIALS 0.5% | ||||||||||||
Regus PLC | 615,834 | 1,915 | ||||||||||
|
| |||||||||||
Total Luxembourg | 1,915 | |||||||||||
|
| |||||||||||
| MEXICO 1.2% | ||||||||||||
| CONSUMER STAPLES 1.2% | ||||||||||||
Wal-Mart de Mexico S.A.B. de C.V. ‘V’ | 1,861,600 | 4,991 | ||||||||||
|
| |||||||||||
Total Mexico | 4,991 | |||||||||||
|
| |||||||||||
| NETHERLANDS 2.9% | ||||||||||||
| FINANCIALS 2.9% | ||||||||||||
Aegon NV | 918,188 | 8,010 | ||||||||||
Euronext NV (a) | 154,928 | 3,939 | ||||||||||
|
| |||||||||||
| 11,949 | ||||||||||||
|
| |||||||||||
Total Netherlands | 11,949 | |||||||||||
|
| |||||||||||
| SINGAPORE 1.0% | ||||||||||||
| INDUSTRIALS 1.0% | ||||||||||||
Singapore Airlines Ltd. | 511,000 | 4,248 | ||||||||||
|
| |||||||||||
Total Singapore | 4,248 | |||||||||||
|
| |||||||||||
| SOUTH AFRICA 1.5% | ||||||||||||
| HEALTH CARE 0.6% | ||||||||||||
Life Healthcare Group Holdings Ltd. | 610,606 | 2,382 | ||||||||||
|
| |||||||||||
| SHARES | MARKET VALUE (000S) | |||||||||||
| TELECOMMUNICATION SERVICES 0.9% | ||||||||||||
MTN Group Ltd. | 185,295 | $ | 3,903 | |||||||||
|
| |||||||||||
Total South Africa | 6,285 | |||||||||||
|
| |||||||||||
| SPAIN 3.0% | ||||||||||||
| CONSUMER STAPLES 1.5% | ||||||||||||
Ebro Foods S.A. | 284,105 | 6,312 | ||||||||||
|
| |||||||||||
| FINANCIALS 1.5% | ||||||||||||
Banco Santander S.A. | 568,005 | 5,935 | ||||||||||
|
| |||||||||||
Total Spain | 12,247 | |||||||||||
|
| |||||||||||
| SWEDEN 1.1% | ||||||||||||
| CONSUMER DISCRETIONARY 1.1% | ||||||||||||
Electrolux AB ‘B’ | 171,206 | 4,321 | ||||||||||
|
| |||||||||||
Total Sweden | 4,321 | |||||||||||
|
| |||||||||||
| SWITZERLAND 2.0% | ||||||||||||
| HEALTH CARE 2.0% | ||||||||||||
Roche Holding AG | 27,709 | 8,256 | ||||||||||
|
| |||||||||||
Total Switzerland | 8,256 | |||||||||||
|
| |||||||||||
| TAIWAN 1.7% | ||||||||||||
| INFORMATION TECHNOLOGY 1.7% | ||||||||||||
Radiant Opto-Electronics Corp. | 1,641,360 | 7,043 | ||||||||||
|
| |||||||||||
Total Taiwan | 7,043 | |||||||||||
|
| |||||||||||
| TURKEY 1.0% | ||||||||||||
| INDUSTRIALS 1.0% | ||||||||||||
TAV Havalimanlari Holding A/S | 538,166 | 4,280 | ||||||||||
|
| |||||||||||
Total Turkey | 4,280 | |||||||||||
|
| |||||||||||
| UNITED KINGDOM 5.8% | ||||||||||||
| CONSUMER STAPLES 2.4% | ||||||||||||
Imperial Tobacco Group PLC | 217,203 | 9,771 | ||||||||||
|
| |||||||||||
| ENERGY 2.5% | ||||||||||||
Petrofac Ltd. | 281,216 | 5,784 | ||||||||||
Subsea 7 S.A. | 240,165 | 4,477 | ||||||||||
|
| |||||||||||
| 10,261 | ||||||||||||
|
| |||||||||||
| FINANCIALS 0.9% | ||||||||||||
ICAP PLC | 600,249 | 3,900 | ||||||||||
|
| |||||||||||
Total United Kingdom | 23,932 | |||||||||||
|
| |||||||||||
| UNITED STATES 50.7% | ||||||||||||
| CONSUMER DISCRETIONARY 13.7% | ||||||||||||
AMC Entertainment Holdings, Inc. ‘A’ | 83,149 | 2,068 | ||||||||||
American Eagle Outfitters, Inc. | 359,125 | 4,029 | ||||||||||
Foot Locker, Inc. | 143,512 | 7,279 | ||||||||||
General Motors Co. | 336,774 | 12,225 | ||||||||||
Kohl’s Corp. | 167,252 | 8,811 | ||||||||||
Regal Entertainment Group ‘A’ | 289,946 | 6,118 | ||||||||||
| 64 | PIMCO EQUITY SERIES | See Accompanying Notes |
Table of Contents
June 30, 2014
| SHARES | MARKET VALUE (000S) | |||||||||||
Target Corp. | 277,718 | $ | 16,094 | |||||||||
|
| |||||||||||
| 56,624 | ||||||||||||
|
| |||||||||||
| CONSUMER STAPLES 1.9% | ||||||||||||
Walgreen Co. | 107,183 | 7,945 | ||||||||||
|
| |||||||||||
| ENERGY 2.5% | ||||||||||||
HollyFrontier Corp. | 175,182 | 7,654 | ||||||||||
LinnCo LLC | 80,746 | 2,526 | ||||||||||
|
| |||||||||||
| 10,180 | ||||||||||||
|
| |||||||||||
| FINANCIALS 15.4% | ||||||||||||
Apollo Investment Corp. | 943,481 | 8,123 | ||||||||||
Blackstone Group LP | 126,330 | 4,225 | ||||||||||
First Niagara Financial Group, Inc. | 501,787 | 4,386 | ||||||||||
JPMorgan Chase & Co. | 144,034 | 8,299 | ||||||||||
KeyCorp | 714,057 | 10,232 | ||||||||||
Navient Corp. | 468,330 | 8,294 | ||||||||||
Prudential Financial, Inc. | 100,597 | 8,930 | ||||||||||
Solar Capital Ltd. | 354,116 | 7,536 | ||||||||||
Solar Senior Capital Ltd. | 199,425 | 3,366 | ||||||||||
|
| |||||||||||
| 63,391 | ||||||||||||
|
| |||||||||||
| HEALTH CARE 3.4% | ||||||||||||
Medtronic, Inc. | 127,455 | 8,127 | ||||||||||
Merck & Co., Inc. | 102,818 | 5,948 | ||||||||||
|
| |||||||||||
| 14,075 | ||||||||||||
|
| |||||||||||
| SHARES | MARKET VALUE (000S) | |||||||||||
| INFORMATION TECHNOLOGY 9.0% | ||||||||||||
Cisco Systems, Inc. | 495,068 | $ | 12,303 | |||||||||
Microsoft Corp. | 98,783 | 4,119 | ||||||||||
QUALCOMM, Inc. | 129,507 | 10,257 | ||||||||||
Symantec Corp. | 178,577 | 4,089 | ||||||||||
Western Digital Corp. | 66,830 | 6,168 | ||||||||||
|
| |||||||||||
| 36,936 | ||||||||||||
|
| |||||||||||
| MATERIALS 1.9% | ||||||||||||
Tronox Ltd. ‘A’ | 298,292 | 8,024 | ||||||||||
|
| |||||||||||
| TELECOMMUNICATION SERVICES 1.9% | ||||||||||||
CenturyLink, Inc. | 219,939 | 7,962 | ||||||||||
|
| |||||||||||
| UTILITIES 1.0% | ||||||||||||
ONE Gas, Inc. | 107,969 | 4,076 | ||||||||||
|
| |||||||||||
Total United States | 209,213 | |||||||||||
|
| |||||||||||
Total Common Stocks (Cost $345,537) | 395,031 | |||||||||||
|
| |||||||||||
| REAL ESTATE INVESTMENT TRUSTS 3.2% | ||||||||||||
| UNITED STATES 3.2% | ||||||||||||
| FINANCIALS 3.2% | ||||||||||||
Colony Financial, Inc. | 568,993 | 13,212 | ||||||||||
|
| |||||||||||
Total Real Estate Investment Trusts | 13,212 | |||||||||||
|
| |||||||||||
| PRINCIPAL AMOUNT (000S) | MARKET VALUE (000S) | |||||||||||
| SHORT-TERM INSTRUMENTS 0.0% | ||||||||||||
| REPURCHASE AGREEMENTS (b) 0.0% | ||||||||||||
| $ | 136 | |||||||||||
|
| |||||||||||
| Total Short-Term Instruments (Cost $136) | 136 | |||||||||||
|
| |||||||||||
| Total Investments in Securities (Cost $358,137) | 408,379 | |||||||||||
|
| |||||||||||
| SHARES | ||||||||||||
| INVESTMENTS IN AFFILIATES 0.7% | ||||||||||||
| SHORT-TERM INSTRUMENTS 0.7% | ||||||||||||
| CENTRAL FUNDS USED FOR CASH MANAGEMENT PURPOSES 0.7% | ||||||||||||
PIMCO Short-Term Floating NAV Portfolio | 305,255 | 3,054 | ||||||||||
|
| |||||||||||
| Total Short-Term Instruments (Cost $3,054) | 3,054 | |||||||||||
|
| |||||||||||
Total Investments in Affiliates (Cost $3,054) |
| 3,054 | ||||||||||
Total Investments 99.7% (Cost $361,191) |
| $ | 411,433 | |||||||||
Financial Derivative (Cost or Premiums, net $0) | 34 | |||||||||||
| Other Assets and Liabilities, net 0.3% | 1,073 | |||||||||||
|
| |||||||||||
| Net Assets 100.0% | $ | 412,540 | ||||||||||
|
| |||||||||||
NOTES TO SCHEDULE OF INVESTMENTS (AMOUNTS IN THOUSANDS*):
| * | A zero balance may reflect actual amounts rounding to less than one thousand. |
| (a) | Security did not produce income within the last twelve months. |
BORROWINGS AND OTHER FINANCING TRANSACTIONS
(b) REPURCHASE AGREEMENTS:
| Counterparty | Lending Rate | Settlement Date | Maturity Date | Principal Amount | Collateralized By | Collateral Received, at Value | Repurchase Agreements, at Value | Repurchase Agreement Proceeds to be Received (1) | ||||||||||||||||||||
SSB | 0.000% | 06/30/2014 | 07/01/2014 | $ | 136 | Fannie Mae 2.110% due 11/07/2022 | $ | (141 | ) | $ | 136 | $ | 136 | |||||||||||||||
|
|
|
|
|
| |||||||||||||||||||||||
Total Repurchase Agreements |
| $ | (141 | ) | $ | 136 | $ | 136 | ||||||||||||||||||||
|
|
|
|
|
| |||||||||||||||||||||||
| (1) | Includes accrued interest. |
BORROWINGS AND OTHER FINANCING TRANSACTIONS SUMMARY
The following is a summary by counterparty of the market value of Borrowings and Other Financing Transactions and collateral (received) as of June 30, 2014:
| Counterparty | Repurchase Agreement Proceeds to be Received | Payable for Reverse Repurchase Agreements | Payable for Sale-Buyback Transactions | Payable for Short Sales | Total Borrowings and Other Financing Transactions | Collateral (Received) | Net Exposure (2) | |||||||||||||||||||||
Global/Master Repurchase Agreement | ||||||||||||||||||||||||||||
SSB | $ | 136 | $ | 0 | $ | 0 | $ | 0 | $ | 136 | $ | (141 | ) | $ | (5 | ) | ||||||||||||
|
|
|
|
|
|
|
| |||||||||||||||||||||
Total Borrowings and Other Financing Transactions | $ | 136 | $ | 0 | $ | 0 | $ | 0 | ||||||||||||||||||||
|
|
|
|
|
|
|
| |||||||||||||||||||||
| (2) | Net Exposure represents the net receivable/(payable) that would be due from/to the counterparty in the event of default. Exposure from borrowings and other financing transactions can only be netted across transactions governed under the same master agreement with the same legal entity. See Note 7, Principal Risks, in the Notes to Financial Statements for more information regarding master netting arrangements. |
| See Accompanying Notes | ANNUAL REPORT | JUNE 30, 2014 | 65 |
Table of Contents
Schedule of Investments PIMCO EqS® Dividend Fund (Cont.)
(c) FINANCIAL DERIVATIVE INSTRUMENTS: OVER THE COUNTER
FORWARD FOREIGN CURRENCY CONTRACTS:
| Counterparty | Settlement Month | Currency to be Delivered | Currency to | Unrealized Appreciation/ (Depreciation) | ||||||||||||||||||||||||
| Asset | Liability | |||||||||||||||||||||||||||
BOA | 08/2014 | $ | 8,084 | EUR | 5,925 | $ | 30 | $ | 0 | |||||||||||||||||||
DUB | 07/2014 | 14,790 | 10,882 | 111 | 0 | |||||||||||||||||||||||
| 08/2014 | EUR | 10,882 | $ | 14,792 | 0 | (111 | ) | |||||||||||||||||||||
FBF | 07/2014 | $ | 560 | THB | 18,232 | 1 | 0 | |||||||||||||||||||||
GLM | 07/2014 | EUR | 10,882 | $ | 14,904 | 3 | 0 | |||||||||||||||||||||
JPM | 07/2014 | THB | 18,232 | 561 | 0 | 0 | ||||||||||||||||||||||
|
|
|
| |||||||||||||||||||||||||
Total Forward Foreign Currency Contracts |
| $ | 145 | $ | (111 | ) | ||||||||||||||||||||||
|
|
|
| |||||||||||||||||||||||||
FINANCIAL DERIVATIVE INSTRUMENTS: OVER THE COUNTER SUMMARY
The following is a summary by counterparty of the market value of OTC financial derivative instruments and collateral (received)/pledged as of June 30, 2014:
| Financial Derivative Assets | Financial Derivative Liabilities | |||||||||||||||||||||||||||||||||||||||||||||
| Counterparty | Forward Foreign Currency Contracts | Purchased Options | Swap Agreements | Total Over the Counter | Forward Foreign Currency Contracts | Written Options | Swap Agreements | Total Over the Counter | Net Market Value of OTC Derivatives | Collateral (Received)/ Pledged | Net Exposure (1) | |||||||||||||||||||||||||||||||||||
BOA | $ | 30 | $ | 0 | $ | 0 | $ | 30 | $ | 0 | $ | 0 | $ | 0 | $ | 0 | $ | 30 | $ | 0 | $ | 30 | ||||||||||||||||||||||||
DUB | 111 | 0 | 0 | 111 | (111 | ) | 0 | 0 | (111 | ) | 0 | 0 | 0 | |||||||||||||||||||||||||||||||||
FBF | 1 | 0 | 0 | 1 | 0 | 0 | 0 | 0 | 1 | 0 | 1 | |||||||||||||||||||||||||||||||||||
GLM | 3 | 0 | 0 | 3 | 0 | 0 | 0 | 0 | 3 | 0 | 3 | |||||||||||||||||||||||||||||||||||
|
|
|
|
|
|
|
|
|
|
|
|
|
|
|
| |||||||||||||||||||||||||||||||
Total Over the Counter | $ | 145 | $ | 0 | $ | 0 | $ | 145 | $ | (111 | ) | $ | 0 | $ | 0 | $ | (111 | ) | ||||||||||||||||||||||||||||
|
|
|
|
|
|
|
|
|
|
|
|
|
|
|
| |||||||||||||||||||||||||||||||
| (1) | Net Exposure represents the net receivable/(payable) that would be due from/to the counterparty in the event of default. Exposure from OTC financial derivative instruments can only be netted across transactions governed under the same master agreement with the same legal entity. See Note 7, Principal Risks, in the Notes to Financial Statements for more information regarding master netting arrangements. |
FAIR VALUE OF FINANCIAL DERIVATIVE INSTRUMENTS
The following is a summary of the fair valuation of the Fund’s derivative instruments categorized by risk exposure. See Note 7, Principal Risks, in the Notes to Financial Statements on risks of the Fund.
Fair Values of Financial Derivative Instruments on the Statements of Assets and Liabilities as of June 30, 2014:
| Derivatives not accounted for as hedging instruments | ||||||||||||||||||||||||
| Commodity Contracts | Credit Contracts | Equity Contracts | Foreign Exchange Contracts | Interest Rate Contracts | Total | |||||||||||||||||||
Financial Derivative Instruments - Assets | ||||||||||||||||||||||||
Over the counter | ||||||||||||||||||||||||
Forward Foreign Currency Contracts | $ | 0 | $ | 0 | $ | 0 | $ | 145 | $ | 0 | $ | 145 | ||||||||||||
|
|
|
|
|
|
|
|
|
|
|
| |||||||||||||
Financial Derivative Instruments - Liabilities | ||||||||||||||||||||||||
Over the counter | ||||||||||||||||||||||||
Forward Foreign Currency Contracts | $ | 0 | $ | 0 | $ | 0 | $ | 111 | $ | 0 | $ | 111 | ||||||||||||
|
|
|
|
|
|
|
|
|
|
|
| |||||||||||||
The Effect of Financial Derivative Instruments on the Statements of Operations for the Period Ended June 30, 2014:
| Derivatives not accounted for as hedging instruments | ||||||||||||||||||||||||
| Commodity Contracts | Credit Contracts | Equity Contracts | Foreign Exchange Contracts | Interest Rate Contracts | Total | |||||||||||||||||||
Net Realized Gain (Loss) on Financial Derivative Instruments | ||||||||||||||||||||||||
Exchange-traded or centrally cleared | ||||||||||||||||||||||||
Futures | $ | 0 | $ | 0 | $ | 1,982 | $ | (3,172 | ) | $ | 0 | $ | (1,190 | ) | ||||||||||
|
|
|
|
|
|
|
|
|
|
|
| |||||||||||||
Over the counter | ||||||||||||||||||||||||
Forward Foreign Currency Contracts | $ | 0 | $ | 0 | $ | 0 | $ | 1,560 | $ | 0 | $ | 1,560 | ||||||||||||
|
|
|
|
|
|
|
|
|
|
|
| |||||||||||||
| $ | 0 | $ | 0 | $ | 1,982 | $ | (1,612 | ) | $ | 0 | $ | 370 | ||||||||||||
|
|
|
|
|
|
|
|
|
|
|
| |||||||||||||
Net Change in Unrealized (Depreciation) on Financial Derivative Instruments |
| |||||||||||||||||||||||
Exchange-traded or centrally cleared | ||||||||||||||||||||||||
Futures | $ | 0 | $ | 0 | $ | 0 | $ | (217 | ) | $ | 0 | $ | (217 | ) | ||||||||||
|
|
|
|
|
|
|
|
|
|
|
| |||||||||||||
Over the counter | ||||||||||||||||||||||||
Forward Foreign Currency Contracts | $ | 0 | $ | 0 | $ | 0 | $ | (134 | ) | $ | 0 | $ | (134 | ) | ||||||||||
|
|
|
|
|
|
|
|
|
|
|
| |||||||||||||
| $ | 0 | $ | 0 | $ | 0 | $ | (351 | ) | $ | 0 | $ | (351 | ) | |||||||||||
|
|
|
|
|
|
|
|
|
|
|
| |||||||||||||
| 66 | PIMCO EQUITY SERIES | See Accompanying Notes |
Table of Contents
June 30, 2014
FAIR VALUE MEASUREMENTS
The following is a summary of the fair valuations according to the inputs used as of June 30, 2014 in valuing the Fund’s assets and liabilities:
| Category and Subcategory | Level 1 | Level 2 | Level 3 | Fair Value at 06/30/2014 | ||||||||||||
Investments in Securities, at Value |
| |||||||||||||||
Common Stocks | ||||||||||||||||
Australia | ||||||||||||||||
Industrials | $ | 3,872 | $ | 0 | $ | 0 | $ | 3,872 | ||||||||
Bermuda | ||||||||||||||||
Energy | 8,653 | 0 | 0 | 8,653 | ||||||||||||
Brazil | ||||||||||||||||
Financials | 3,137 | 0 | 0 | 3,137 | ||||||||||||
Industrials | 4,207 | 0 | 0 | 4,207 | ||||||||||||
Utilities | 8,935 | 0 | 0 | 8,935 | ||||||||||||
China | ||||||||||||||||
Industrials | 4,010 | 2,266 | 0 | 6,276 | ||||||||||||
Cyprus | ||||||||||||||||
Energy | 0 | 9,874 | 0 | 9,874 | ||||||||||||
France | ||||||||||||||||
Energy | 0 | 6,353 | 0 | 6,353 | ||||||||||||
Financials | 0 | 7,974 | 0 | 7,974 | ||||||||||||
Utilities | 0 | 12,205 | 0 | 12,205 | ||||||||||||
Germany | ||||||||||||||||
Consumer Discretionary | 0 | 7,692 | 0 | 7,692 | ||||||||||||
Hong Kong | ||||||||||||||||
Industrials | 2,144 | 0 | 0 | 2,144 | ||||||||||||
Telecommunication Services | 0 | 4,011 | 0 | 4,011 | ||||||||||||
Italy | ||||||||||||||||
Industrials | 0 | 3,913 | 0 | 3,913 | ||||||||||||
Japan | ||||||||||||||||
Telecommunication Services | 0 | 7,105 | 0 | 7,105 | ||||||||||||
Luxembourg | ||||||||||||||||
Industrials | 0 | 1,915 | 0 | 1,915 | ||||||||||||
Mexico | ||||||||||||||||
Consumer Staples | 4,991 | 0 | 0 | 4,991 | ||||||||||||
Netherlands | ||||||||||||||||
Financials | 3,939 | 8,010 | 0 | 11,949 | ||||||||||||
Singapore | ||||||||||||||||
Industrials | 0 | 4,248 | 0 | 4,248 | ||||||||||||
South Africa | ||||||||||||||||
Health Care | 0 | 2,382 | 0 | 2,382 | ||||||||||||
Telecommunication Services | 0 | 3,903 | 0 | 3,903 | ||||||||||||
Spain | ||||||||||||||||
Consumer Staples | 0 | 6,312 | 0 | 6,312 | ||||||||||||
Financials | 0 | 5,935 | 0 | 5,935 | ||||||||||||
Sweden | ||||||||||||||||
Consumer Discretionary | 0 | 4,321 | 0 | 4,321 | ||||||||||||
| Category and Subcategory | Level 1 | Level 2 | Level 3 | Fair Value at 06/30/2014 | ||||||||||||
Switzerland | ||||||||||||||||
Health Care | $ | 0 | $ | 8,256 | $ | 0 | $ | 8,256 | ||||||||
Taiwan | ||||||||||||||||
Information Technology | 0 | 7,043 | 0 | 7,043 | ||||||||||||
Turkey | ||||||||||||||||
Industrials | 0 | 4,280 | 0 | 4,280 | ||||||||||||
United Kingdom | ||||||||||||||||
Consumer Staples | 0 | 9,771 | 0 | 9,771 | ||||||||||||
Energy | 0 | 10,261 | 0 | 10,261 | ||||||||||||
Financials | 0 | 3,900 | 0 | 3,900 | ||||||||||||
United States | ||||||||||||||||
Consumer Discretionary | 56,624 | 0 | 0 | 56,624 | ||||||||||||
Consumer Staples | 7,945 | 0 | 0 | 7,945 | ||||||||||||
Energy | 10,180 | 0 | 0 | 10,180 | ||||||||||||
Financials | 63,391 | 0 | 0 | 63,391 | ||||||||||||
Health Care | 14,075 | 0 | 0 | 14,075 | ||||||||||||
Information Technology | 36,936 | 0 | 0 | 36,936 | ||||||||||||
Materials | 8,024 | 0 | 0 | 8,024 | ||||||||||||
Telecommunication Services | 7,962 | 0 | 0 | 7,962 | ||||||||||||
Utilities | 4,076 | 0 | 0 | 4,076 | ||||||||||||
Real Estate Investment Trusts | ||||||||||||||||
United States | ||||||||||||||||
Financials | 13,212 | 0 | 0 | 13,212 | ||||||||||||
Short-Term Instruments | ||||||||||||||||
Repurchase Agreements | 0 | 136 | 0 | 136 | ||||||||||||
| $ | 266,313 | $ | 142,066 | $ | 0 | $ | 408,379 | |||||||||
Investments in Affiliates, at Value |
| |||||||||||||||
Short-Term Instruments | ||||||||||||||||
Central Funds Used for Cash Management Purposes | $ | 3,054 | $ | 0 | $ | 0 | $ | 3,054 | ||||||||
Total Investments | $ | 269,367 | $ | 142,066 | $ | 0 | $ | 411,433 | ||||||||
Financial Derivative Instruments - Assets |
| |||||||||||||||
Over the counter | $ | 0 | $ | 145 | $ | 0 | $ | 145 | ||||||||
Financial Derivative Instruments - Liabilities |
| |||||||||||||||
Over the counter | $ | 0 | $ | (111 | ) | $ | 0 | $ | (111 | ) | ||||||
Totals | $ | 269,367 | $ | 142,100 | $ | 0 | $ | 411,467 | ||||||||
There were assets and liabilities valued at $6,153 transferred from Level 2 to Level 1 during the period ended June 30, 2014. There were no significant assets and liabilities transferred from Level 1 to Level 2 during the period ended June 30, 2014. There were no significant transfers between Level 2 and 3 during the period ended June 30, 2014.
| See Accompanying Notes | ANNUAL REPORT | JUNE 30, 2014 | 67 |
Table of Contents
Schedule of Investments PIMCO EqS® Emerging Markets Fund
| SHARES | MARKET VALUE (000S) | |||||||||||
| INVESTMENTS IN SECURITIES 90.9% | ||||||||||||
| COMMON STOCKS 85.0% | ||||||||||||
| AUSTRALIA 1.4% | ||||||||||||
| MATERIALS 1.4% | ||||||||||||
Iluka Resources Ltd. | 221,613 | $ | 1,703 | |||||||||
|
| |||||||||||
Total Australia | 1,703 | |||||||||||
|
| |||||||||||
| BRAZIL 12.6% | ||||||||||||
| CONSUMER DISCRETIONARY 1.6% | ||||||||||||
Anhanguera Educacional Participacoes S.A. | 224,700 | 1,871 | ||||||||||
|
| |||||||||||
| CONSUMER STAPLES 3.3% | ||||||||||||
AMBEV S.A. - ADR | 550,240 | 3,874 | ||||||||||
|
| |||||||||||
| FINANCIALS 6.2% | ||||||||||||
BB Seguridade Participacoes S.A. | 64,527 | 947 | ||||||||||
CETIP S.A. - Balcao Organizado | 56 | 1 | ||||||||||
CETIP S.A. - Mercados Organizados | 132,261 | 1,883 | ||||||||||
Itau Unibanco Holding S.A. - ADR | 189,463 | 2,724 | ||||||||||
Multiplan Empreendimentos Imobiliarios S.A. | 73,100 | 1,697 | ||||||||||
|
| |||||||||||
| 7,252 | ||||||||||||
|
| |||||||||||
| INDUSTRIALS 1.5% | ||||||||||||
CCR S.A. | 223,300 | 1,819 | ||||||||||
|
| |||||||||||
Total Brazil | 14,816 | |||||||||||
|
| |||||||||||
| CAMBODIA 2.0% | ||||||||||||
| CONSUMER DISCRETIONARY 2.0% | ||||||||||||
NagaCorp Ltd. | 2,710,000 | 2,388 | ||||||||||
|
| |||||||||||
Total Cambodia | 2,388 | |||||||||||
|
| |||||||||||
| CANADA 1.0% | ||||||||||||
| MATERIALS 1.0% | ||||||||||||
Turquoise Hill Resources Ltd. (a) | 339,296 | 1,133 | ||||||||||
|
| |||||||||||
Total Canada | 1,133 | |||||||||||
|
| |||||||||||
| CHINA 9.0% | ||||||||||||
| CONSUMER STAPLES 0.3% | ||||||||||||
Shenguan Holdings Group Ltd. | 886,000 | 374 | ||||||||||
|
| |||||||||||
| ENERGY 3.5% | ||||||||||||
China Petroleum & Chemical Corp. ‘H’ | 1,942,000 | 1,849 | ||||||||||
China Shenhua Energy Co. Ltd. ‘H’ | 410,500 | 1,186 | ||||||||||
SPT Energy Group, Inc. | 2,056,000 | 1,078 | ||||||||||
|
| |||||||||||
| 4,113 | ||||||||||||
|
| |||||||||||
| FINANCIALS 2.7% | ||||||||||||
China Pacific Insurance Group Co. Ltd. ‘H’ | 256,600 | 907 | ||||||||||
Industrial & Commercial Bank of China Ltd. ‘H’ | 3,472,000 | 2,196 | ||||||||||
|
| |||||||||||
| 3,103 | ||||||||||||
|
| |||||||||||
| SHARES | MARKET VALUE (000S) | |||||||||||
| INDUSTRIALS 1.4% | ||||||||||||
First Tractor Co. Ltd. ‘H’ | 2,556,000 | $ | 1,676 | |||||||||
|
| |||||||||||
| INFORMATION TECHNOLOGY 0.6% | ||||||||||||
Baidu, Inc. SP - ADR (a) | 3,480 | 650 | ||||||||||
|
| |||||||||||
| MATERIALS 0.5% | ||||||||||||
China Shanshui Cement Group Ltd. | 1,768,000 | 622 | ||||||||||
|
| |||||||||||
Total China | 10,538 | |||||||||||
|
| |||||||||||
| CYPRUS 2.9% | ||||||||||||
| ENERGY 1.1% | ||||||||||||
Eurasia Drilling Co. Ltd. - GDR | 41,839 | 1,318 | ||||||||||
|
| |||||||||||
| INDUSTRIALS 1.8% | ||||||||||||
Global Ports Investments PLC - GDR | 89,088 | 958 | ||||||||||
Globaltrans Investment PLC - GDR | 103,753 | 1,188 | ||||||||||
|
| |||||||||||
| 2,146 | ||||||||||||
|
| |||||||||||
Total Cyprus | 3,464 | |||||||||||
|
| |||||||||||
| GREECE 1.7% | ||||||||||||
| FINANCIALS 1.7% | ||||||||||||
Eurobank Ergasias S.A. (a) | 3,997,371 | 2,017 | ||||||||||
|
| |||||||||||
Total Greece | 2,017 | |||||||||||
|
| |||||||||||
| HONG KONG 4.8% | ||||||||||||
| FINANCIALS 4.2% | ||||||||||||
AIA Group Ltd. | 689,984 | 3,471 | ||||||||||
China Overseas Land & Investment Ltd. | 608,000 | 1,475 | ||||||||||
|
| |||||||||||
| 4,946 | ||||||||||||
|
| |||||||||||
| INFORMATION TECHNOLOGY 0.6% | ||||||||||||
China High Precision Automation Group Ltd. | 8,446,000 | 665 | ||||||||||
|
| |||||||||||
Total Hong Kong | 5,611 | |||||||||||
|
| |||||||||||
| INDIA 7.7% | ||||||||||||
| CONSUMER DISCRETIONARY 3.6% | ||||||||||||
Bajaj Auto Ltd. | 52,856 | 2,018 | ||||||||||
Tata Motors Ltd. | 301,436 | 2,166 | ||||||||||
|
| |||||||||||
| 4,184 | ||||||||||||
|
| |||||||||||
| FINANCIALS 4.1% | ||||||||||||
Axis Bank Ltd. | 72,733 | 2,320 | ||||||||||
Housing Development Finance Corp. | 151,180 | 2,482 | ||||||||||
|
| |||||||||||
| 4,802 | ||||||||||||
|
| |||||||||||
Total India | 8,986 | |||||||||||
|
| |||||||||||
| INDONESIA 2.3% | ||||||||||||
| CONSUMER DISCRETIONARY 2.3% | ||||||||||||
Matahari Department Store Tbk PT | 2,299,600 | 2,678 | ||||||||||
|
| |||||||||||
Total Indonesia | 2,678 | |||||||||||
|
| |||||||||||
| SHARES | MARKET VALUE (000S) | |||||||||||
| ISRAEL 2.1% | ||||||||||||
| MATERIALS 2.1% | ||||||||||||
Israel Chemicals Ltd. | 281,770 | $ | 2,414 | |||||||||
|
| |||||||||||
Total Israel | 2,414 | |||||||||||
|
| |||||||||||
| JAPAN 3.7% | ||||||||||||
| INDUSTRIALS 2.7% | ||||||||||||
Mitsubishi Electric Corp. | 110,000 | 1,359 | ||||||||||
NSK Ltd. | 135,000 | 1,757 | ||||||||||
|
| |||||||||||
| 3,116 | ||||||||||||
|
| |||||||||||
| INFORMATION TECHNOLOGY 1.0% | ||||||||||||
Omron Corp. | 28,600 | 1,206 | ||||||||||
|
| |||||||||||
Total Japan | 4,322 | |||||||||||
|
| |||||||||||
| MACAU 1.5% | ||||||||||||
| CONSUMER DISCRETIONARY 1.5% | ||||||||||||
Wynn Macau Ltd. | 454,000 | 1,784 | ||||||||||
|
| |||||||||||
Total Macau | 1,784 | |||||||||||
|
| |||||||||||
| MEXICO 2.0% | ||||||||||||
| FINANCIALS 2.0% | ||||||||||||
Bolsa Mexicana de Valores S.A.B. de C.V. | 1,117,300 | 2,367 | ||||||||||
|
| |||||||||||
Total Mexico | 2,367 | |||||||||||
|
| |||||||||||
| NORWAY 2.5% | ||||||||||||
| CONSUMER STAPLES 2.5% | ||||||||||||
Marine Harvest ASA | 211,768 | 2,890 | ||||||||||
|
| |||||||||||
Total Norway | 2,890 | |||||||||||
|
| |||||||||||
| PERU 3.5% | ||||||||||||
| FINANCIALS 2.0% | ||||||||||||
Credicorp Ltd. | 14,797 | 2,300 | ||||||||||
|
| |||||||||||
| MATERIALS 1.5% | ||||||||||||
Cementos Pacasmayo S.A.A. - ADR | 208,724 | 1,760 | ||||||||||
|
| |||||||||||
Total Peru | 4,060 | |||||||||||
|
| |||||||||||
| PHILIPPINES 0.5% | ||||||||||||
| UTILITIES 0.5% | ||||||||||||
First Gen Corp. | 1,193,600 | 594 | ||||||||||
|
| |||||||||||
Total Philippines | 594 | |||||||||||
|
| |||||||||||
| POLAND 1.7% | ||||||||||||
| FINANCIALS 1.7% | ||||||||||||
Powszechna Kasa Oszczednosci Bank Polski S.A. | 163,336 | 2,028 | ||||||||||
|
| |||||||||||
Total Poland | 2,028 | |||||||||||
|
| |||||||||||
| RUSSIA 1.6% | ||||||||||||
| TELECOMMUNICATION SERVICES 1.6% | ||||||||||||
MegaFon OAO - GDR | 59,043 | 1,860 | ||||||||||
|
| |||||||||||
Total Russia | 1,860 | |||||||||||
|
| |||||||||||
| 68 | PIMCO EQUITY SERIES | See Accompanying Notes |
Table of Contents
June 30, 2014
| SHARES | MARKET VALUE (000S) | |||||||||||
| SOUTH AFRICA 0.8% | ||||||||||||
| CONSUMER STAPLES 0.8% | ||||||||||||
Tongaat Hulett Ltd. | 64,386 | $ | 899 | |||||||||
|
| |||||||||||
Total South Africa | 899 | |||||||||||
|
| |||||||||||
| SOUTH KOREA 7.4% | ||||||||||||
| CONSUMER DISCRETIONARY 2.9% | ||||||||||||
Kia Motors Corp. | 61,174 | 3,422 | ||||||||||
|
| |||||||||||
| INFORMATION TECHNOLOGY 4.5% | ||||||||||||
Samsung Electronics Co. Ltd. | 4,027 | 5,259 | ||||||||||
|
| |||||||||||
Total South Korea | 8,681 | |||||||||||
|
| |||||||||||
| TAIWAN 10.4% | ||||||||||||
| INFORMATION TECHNOLOGY 10.4% | ||||||||||||
Chicony Electronics Co. Ltd. | 686,725 | 1,855 | ||||||||||
Hon Hai Precision Industry Co. Ltd. | 842,000 | 2,823 | ||||||||||
MediaTek, Inc. | 159,000 | 2,689 | ||||||||||
Taiwan Semiconductor Manufacturing Co. Ltd. | 1,147,000 | 4,854 | ||||||||||
|
| |||||||||||
| 12,221 | ||||||||||||
|
| |||||||||||
Total Taiwan | 12,221 | |||||||||||
|
| |||||||||||
| UNITED KINGDOM 1.9% | ||||||||||||
| CONSUMER STAPLES 0.9% | ||||||||||||
British American Tobacco PLC | 18,732 | 1,115 | ||||||||||
|
| |||||||||||
| ENERGY 1.0% | ||||||||||||
Afren PLC (a) | 470,452 | 1,165 | ||||||||||
|
| |||||||||||
Total United Kingdom | 2,280 | |||||||||||
|
| |||||||||||
Total Common Stocks (Cost $100,840) |
| 99,734 | ||||||||||
|
| |||||||||||
| UNITS | MARKET VALUE (000S) | |||||||||||
| EQUITY-LINKED SECURITIES 1.6% | ||||||||||||
| UNITED KINGDOM 1.6% | ||||||||||||
| CONSUMER STAPLES 1.6% | ||||||||||||
HSBC Bank PLC, Nigerian Breweries PLC - Exp. 12/09/2014 | 1,746,232 | $ | 1,843 | |||||||||
|
| |||||||||||
Total Equity-Linked Securities (Cost $1,070) | 1,843 | |||||||||||
|
| |||||||||||
| SHARES | ||||||||||||
| PREFERRED STOCKS 2.6% | ||||||||||||
| BRAZIL 2.6% | ||||||||||||
| CONSUMER STAPLES 2.6% | ||||||||||||
Cia Brasileira de Distribuicao Grupo Pao de Acucar | 66,442 | 3,097 | ||||||||||
|
| |||||||||||
Total Preferred Stocks (Cost $2,957) | 3,097 | |||||||||||
|
| |||||||||||
| WARRANTS 1.3% | ||||||||||||
| UNITED STATES 1.3% | ||||||||||||
| CONSUMER DISCRETIONARY 0.8% | ||||||||||||
Kweichow Moutai Co. Ltd. - Exp. 01/20/2015 | 41,400 | 947 | ||||||||||
|
| |||||||||||
| FINANCIALS 0.5% | ||||||||||||
China Construction Bank | 864,904 | 576 | ||||||||||
|
| |||||||||||
Total Warrants (Cost $1,510) | 1,523 | |||||||||||
|
| |||||||||||
| PRINCIPAL AMOUNT (000S) | MARKET VALUE (000s) | |||||||||||
| SHORT-TERM INSTRUMENTS 0.4% | ||||||||||||
| U.S. TREASURY BILLS 0.4% | ||||||||||||
0.050% due 11/13/2014 - 12/11/2014 (b)(d) | $ | 409 | $ | 409 | ||||||||
|
| |||||||||||
| Total Short-Term Instruments (Cost $409) | 409 | |||||||||||
|
| |||||||||||
| Total Investments in Securities (Cost $106,786) | 106,606 | |||||||||||
|
| |||||||||||
| SHARES | ||||||||||||
| INVESTMENTS IN AFFILIATES 0.4% | ||||||||||||
| SHORT-TERM INSTRUMENTS 0.4% | ||||||||||||
| CENTRAL FUNDS USED FOR CASH MANAGEMENT PURPOSES 0.4% | ||||||||||||
PIMCO Short-Term Floating NAV Portfolio | 51,833 | 519 | ||||||||||
|
| |||||||||||
| Total Short-Term Instruments (Cost $519) | 519 | |||||||||||
|
| |||||||||||
| Total Investments in Affiliates (Cost $519) | 519 | |||||||||||
| Total Investments 91.3% (Cost $107,305) | $ | 107,125 | ||||||||||
Financial Derivative (Cost or Premiums, net $0) | 1,972 | |||||||||||
| Other Assets and Liabilities, net 7.0% | 8,252 | |||||||||||
|
| |||||||||||
| Net Assets 100.0% | $ | 117,349 | ||||||||||
|
| |||||||||||
NOTES TO SCHEDULE OF INVESTMENTS (AMOUNTS IN THOUSANDS*, EXCEPT NUMBER OF CONTRACTS, UNITS AND SHARES):
| * | A zero balance may reflect actual amounts rounding to less than one thousand. |
| (a) | Security did not produce income within the last twelve months. |
| (b) | Coupon represents a weighted average yield to maturity. |
(c) FINANCIAL DERIVATIVE INSTRUMENTS: OVER THE COUNTER
FORWARD FOREIGN CURRENCY CONTRACTS:
| Counterparty | Settlement Month | Currency to be Delivered | Currency to be Received | Unrealized Appreciation/ (Depreciation) | ||||||||||||||||||||||||
| Asset | Liability | |||||||||||||||||||||||||||
AZD | 07/2014 | $ | 444 | AUD | 482 | $ | 10 | $ | 0 | |||||||||||||||||||
BOA | 07/2014 | BRL | 9,668 | $ | 4,315 | 0 | (61 | ) | ||||||||||||||||||||
| 07/2014 | HKD | 110,832 | 14,297 | 1 | 0 | |||||||||||||||||||||||
| 07/2014 | $ | 939 | AUD | 1,014 | 18 | 0 | ||||||||||||||||||||||
| 07/2014 | 4,390 | BRL | 9,668 | 0 | (14 | ) | ||||||||||||||||||||||
| 07/2014 | 3,733 | HKD | 28,939 | 0 | 0 | |||||||||||||||||||||||
| 07/2014 | 1,236 | KRW | 1,257,964 | 7 | 0 | |||||||||||||||||||||||
| 07/2014 | 24,294 | TWD | 738,980 | 465 | 0 | |||||||||||||||||||||||
| 08/2014 | GBP | 46 | $ | 77 | 0 | (1 | ) | |||||||||||||||||||||
| 08/2014 | NOK | 1,647 | 275 | 7 | 0 | |||||||||||||||||||||||
| 08/2014 | $ | 403 | JPY | 41,046 | 2 | 0 | ||||||||||||||||||||||
| 08/2014 | 873 | NOK | 5,220 | 0 | (24 | ) | ||||||||||||||||||||||
| 08/2014 | 303 | RUB | 10,669 | 8 | 0 | |||||||||||||||||||||||
| See Accompanying Notes | ANNUAL REPORT | JUNE 30, 2014 | 69 |
Table of Contents
Schedule of Investments PIMCO EqS® Emerging Markets Fund (Cont.)
| Counterparty | Settlement Month | Currency to be Delivered | Currency to be Received | Unrealized Appreciation/ (Depreciation) | ||||||||||||||||||||||||
| Asset | Liability | |||||||||||||||||||||||||||
BPS | 07/2014 | BRL | 7,670 | $ | 3,444 | $ | 0 | $ | (27 | ) | ||||||||||||||||||
| 07/2014 | PLN | 3,520 | 1,154 | 2 | (5 | ) | ||||||||||||||||||||||
| 07/2014 | $ | 3,451 | BRL | 7,670 | 26 | (6 | ) | |||||||||||||||||||||
| 07/2014 | 1,351 | HKD | 10,470 | 0 | 0 | |||||||||||||||||||||||
| 07/2014 | 1,843 | MXN | 24,343 | 31 | 0 | |||||||||||||||||||||||
| 07/2014 | 35 | PHP | 1,522 | 0 | 0 | |||||||||||||||||||||||
| 07/2014 | 3,398 | THB | 110,136 | 0 | (7 | ) | ||||||||||||||||||||||
| 08/2014 | DKK | 808 | $ | 148 | 0 | (1 | ) | |||||||||||||||||||||
| 08/2014 | NOK | 6,502 | 1,070 | 12 | 0 | |||||||||||||||||||||||
| 08/2014 | $ | 2,911 | BRL | 6,539 | 19 | 0 | ||||||||||||||||||||||
| 08/2014 | 777 | EUR | 570 | 3 | 0 | |||||||||||||||||||||||
| 08/2014 | 1,771 | NOK | 10,685 | 1 | (33 | ) | ||||||||||||||||||||||
| 08/2014 | 978 | RUB | 34,269 | 20 | 0 | |||||||||||||||||||||||
| 10/2014 | ZAR | 1,774 | $ | 164 | 0 | 0 | ||||||||||||||||||||||
BRC | 07/2014 | BRL | 5,544 | 2,477 | 0 | (32 | ) | |||||||||||||||||||||
| 07/2014 | HKD | 7,944 | 1,025 | 0 | 0 | |||||||||||||||||||||||
| 07/2014 | MXN | 173 | 13 | 0 | 0 | |||||||||||||||||||||||
| 07/2014 | $ | 2,466 | BRL | 5,544 | 44 | (1 | ) | |||||||||||||||||||||
| 07/2014 | 14,406 | HKD | 111,671 | 0 | (1 | ) | ||||||||||||||||||||||
| 07/2014 | 1,199 | IDR | 14,268,100 | 2 | 0 | |||||||||||||||||||||||
| 07/2014 | 430 | PLN | 1,315 | 2 | 0 | |||||||||||||||||||||||
| 08/2014 | GBP | 2,307 | $ | 3,875 | 0 | (72 | ) | |||||||||||||||||||||
| 08/2014 | IDR | 24,729,938 | 2,079 | 6 | 0 | |||||||||||||||||||||||
| 08/2014 | JPY | 1,008,220 | 9,956 | 0 | 0 | |||||||||||||||||||||||
| 08/2014 | NOK | 26,038 | 4,359 | 122 | 0 | |||||||||||||||||||||||
| 08/2014 | RUB | 1,898 | 53 | 0 | (2 | ) | ||||||||||||||||||||||
| 08/2014 | $ | 148 | DKK | 807 | 0 | 0 | ||||||||||||||||||||||
| 08/2014 | 539 | GBP | 320 | 9 | 0 | |||||||||||||||||||||||
| 08/2014 | 1,196 | RUB | 41,489 | 14 | 0 | |||||||||||||||||||||||
| 10/2014 | 12,897 | ZAR | 141,135 | 146 | (4 | ) | ||||||||||||||||||||||
| 10/2014 | ZAR | 6,192 | $ | 566 | 0 | (6 | ) | |||||||||||||||||||||
CBK | 07/2014 | BRL | 2,464 | 1,119 | 4 | 0 | ||||||||||||||||||||||
| 07/2014 | HKD | 14,465 | 1,866 | 0 | 0 | |||||||||||||||||||||||
| 07/2014 | INR | 51,799 | 843 | 0 | (16 | ) | ||||||||||||||||||||||
| 07/2014 | KRW | 1,195,412 | 1,157 | 0 | (24 | ) | ||||||||||||||||||||||
| 07/2014 | MYR | 5,455 | 1,689 | 0 | (10 | ) | ||||||||||||||||||||||
| 07/2014 | PHP | 35,947 | 816 | 0 | (8 | ) | ||||||||||||||||||||||
| 07/2014 | PLN | 2,052 | 672 | 0 | (2 | ) | ||||||||||||||||||||||
| 07/2014 | TWD | 5,948 | 198 | 0 | (1 | ) | ||||||||||||||||||||||
| 07/2014 | $ | 1,100 | BRL | 2,464 | 15 | 0 | ||||||||||||||||||||||
| 07/2014 | 517 | CNY | 3,201 | 1 | 0 | |||||||||||||||||||||||
| 07/2014 | 2,471 | INR | 150,477 | 25 | 0 | |||||||||||||||||||||||
| 07/2014 | 368 | KRW | 384,277 | 12 | 0 | |||||||||||||||||||||||
| 07/2014 | 172 | MYR | 555 | 1 | 0 | |||||||||||||||||||||||
| 07/2014 | 768 | PHP | 34,484 | 23 | 0 | |||||||||||||||||||||||
| 07/2014 | 1,189 | PLN | 3,629 | 4 | 0 | |||||||||||||||||||||||
| 08/2014 | CLP | 88,864 | $ | 160 | 0 | 0 | ||||||||||||||||||||||
| 08/2014 | EUR | 123 | 169 | 0 | 0 | |||||||||||||||||||||||
| 08/2014 | $ | 66 | CLP | 36,630 | 0 | 0 | ||||||||||||||||||||||
| 08/2014 | 653 | EUR | 479 | 3 | 0 | |||||||||||||||||||||||
| 08/2014 | 581 | GBP | 347 | 13 | 0 | |||||||||||||||||||||||
| 08/2014 | 1,377 | JPY | 139,721 | 3 | 0 | |||||||||||||||||||||||
| 10/2014 | COP | 159,180 | $ | 84 | 0 | 0 | ||||||||||||||||||||||
| 10/2014 | $ | 2,192 | ZAR | 23,593 | 4 | (16 | ) | |||||||||||||||||||||
DUB | 07/2014 | HKD | 22,986 | $ | 2,965 | 0 | (1 | ) | ||||||||||||||||||||
| 07/2014 | IDR | 17,869,085 | 1,512 | 7 | 0 | |||||||||||||||||||||||
| 07/2014 | TWD | 149,889 | 4,955 | 0 | (67 | ) | ||||||||||||||||||||||
| 07/2014 | $ | 104 | HKD | 806 | 0 | 0 | ||||||||||||||||||||||
| 07/2014 | 922 | IDR | 10,697,018 | 0 | (21 | ) | ||||||||||||||||||||||
| 07/2014 | 344 | PLN | 1,054 | 3 | 0 | |||||||||||||||||||||||
| 08/2014 | RUB | 295,664 | $ | 8,434 | 0 | (190 | ) | |||||||||||||||||||||
| 08/2014 | $ | 216 | GBP | 129 | 5 | 0 | ||||||||||||||||||||||
| 08/2014 | 1,266 | JPY | 129,100 | 9 | 0 | |||||||||||||||||||||||
| 09/2014 | ILS | 9,109 | $ | 2,619 | 0 | (34 | ) | |||||||||||||||||||||
| 09/2014 | PEN | 11,359 | 4,022 | 0 | 0 | |||||||||||||||||||||||
| 10/2014 | $ | 4,532 | COP | 8,876,947 | 157 | 0 | ||||||||||||||||||||||
| 10/2014 | 1,681 | ZAR | 18,307 | 18 | (7 | ) | ||||||||||||||||||||||
| 10/2014 | ZAR | 57,174 | $ | 5,308 | 49 | (23 | ) | |||||||||||||||||||||
| 70 | PIMCO EQUITY SERIES | See Accompanying Notes |
Table of Contents
June 30, 2014
| Counterparty | Settlement Month | Currency to be Delivered | Currency to be Received | Unrealized Appreciation/ (Depreciation) | ||||||||||||||||||||||||
| Asset | Liability | |||||||||||||||||||||||||||
FBF | 07/2014 | BRL | 5,563 | $ | 2,526 | $ | 8 | $ | 0 | |||||||||||||||||||
| 07/2014 | CZK | 8,707 | 433 | 0 | �� | (2 | ) | |||||||||||||||||||||
| 07/2014 | INR | 30,981 | 504 | 0 | (10 | ) | ||||||||||||||||||||||
| 07/2014 | KRW | 4,399,161 | 4,241 | 0 | (104 | ) | ||||||||||||||||||||||
| 07/2014 | MXN | 4,822 | 371 | 0 | 0 | |||||||||||||||||||||||
| 07/2014 | MYR | 15,480 | 4,753 | 0 | (66 | ) | ||||||||||||||||||||||
| 07/2014 | TWD | 66,760 | 2,204 | 0 | (33 | ) | ||||||||||||||||||||||
| 07/2014 | $ | 2,471 | BRL | 5,563 | 47 | 0 | ||||||||||||||||||||||
| 07/2014 | 3,169 | CNY | 19,620 | 8 | 0 | |||||||||||||||||||||||
| 07/2014 | 992 | INR | 58,736 | 0 | (18 | ) | ||||||||||||||||||||||
| 07/2014 | 303 | KRW | 310,575 | 4 | 0 | |||||||||||||||||||||||
| 07/2014 | 14,618 | MYR | 48,633 | 523 | 0 | |||||||||||||||||||||||
| 07/2014 | 3,705 | THB | 120,609 | 8 | 0 | |||||||||||||||||||||||
| 08/2014 | BRL | 5,563 | $ | 2,448 | 0 | (46 | ) | |||||||||||||||||||||
| 08/2014 | $ | 718 | BRL | 1,593 | 0 | (4 | ) | |||||||||||||||||||||
| 08/2014 | 868 | EUR | 640 | 8 | 0 | |||||||||||||||||||||||
| 10/2014 | COP | 6,429,168 | $ | 3,349 | 0 | (47 | ) | |||||||||||||||||||||
GLM | 07/2014 | CZK | 1,451 | 72 | 0 | 0 | ||||||||||||||||||||||
| 07/2014 | PLN | 5,297 | 1,736 | 1 | (6 | ) | ||||||||||||||||||||||
| 07/2014 | $ | 453 | AUD | 490 | 9 | 0 | ||||||||||||||||||||||
| 08/2014 | GBP | 40 | $ | 67 | 0 | (1 | ) | |||||||||||||||||||||
| 08/2014 | NOK | 794 | 133 | 4 | 0 | |||||||||||||||||||||||
| 08/2014 | $ | 59 | AUD | 63 | 0 | 0 | ||||||||||||||||||||||
| 08/2014 | 1,083 | EUR | 795 | 6 | 0 | |||||||||||||||||||||||
| 08/2014 | 7,381 | MXN | 97,222 | 86 | 0 | |||||||||||||||||||||||
| 09/2014 | MXN | 36,748 | $ | 2,817 | 1 | 0 | ||||||||||||||||||||||
| 09/2014 | $ | 752 | MXN | 9,758 | 0 | (4 | ) | |||||||||||||||||||||
| 10/2014 | MXN | 3,769 | $ | 289 | 1 | 0 | ||||||||||||||||||||||
| 10/2014 | ZAR | 48,672 | 4,459 | 0 | (38 | ) | ||||||||||||||||||||||
HUS | 07/2014 | HKD | 82,651 | 10,662 | 1 | 0 | ||||||||||||||||||||||
| 07/2014 | $ | 3,236 | HKD | 25,091 | 0 | 0 | ||||||||||||||||||||||
JPM | 07/2014 | BRL | 7,071 | $ | 3,210 | 10 | 0 | |||||||||||||||||||||
| 07/2014 | CZK | 3,954 | 199 | 2 | 0 | |||||||||||||||||||||||
| 07/2014 | HKD | 7,237 | 934 | 0 | 0 | |||||||||||||||||||||||
| 07/2014 | IDR | 1,240,738 | 103 | 0 | (1 | ) | ||||||||||||||||||||||
| 07/2014 | INR | 139,035 | 2,294 | 6 | (18 | ) | ||||||||||||||||||||||
| 07/2014 | KRW | 15,991,591 | 15,471 | 0 | (324 | ) | ||||||||||||||||||||||
| 07/2014 | MYR | 9,997 | 3,080 | 0 | (33 | ) | ||||||||||||||||||||||
| 07/2014 | PHP | 41,254 | 938 | 0 | (8 | ) | ||||||||||||||||||||||
| 07/2014 | PLN | 5,328 | 1,747 | 0 | (4 | ) | ||||||||||||||||||||||
| 07/2014 | THB | 56,948 | 1,745 | 1 | (9 | ) | ||||||||||||||||||||||
| 07/2014 | TWD | 199,409 | 6,647 | 0 | (35 | ) | ||||||||||||||||||||||
| 07/2014 | $ | 3,153 | BRL | 7,071 | 47 | 0 | ||||||||||||||||||||||
| 07/2014 | 4,369 | CNY | 27,042 | 9 | 0 | |||||||||||||||||||||||
| 07/2014 | 1,249 | CZK | 24,764 | 0 | (13 | ) | ||||||||||||||||||||||
| 07/2014 | 19,884 | HKD | 154,119 | 0 | (4 | ) | ||||||||||||||||||||||
| 07/2014 | 4,016 | INR | 241,271 | 0 | (14 | ) | ||||||||||||||||||||||
| 07/2014 | 2,122 | KRW | 2,267,781 | 118 | 0 | |||||||||||||||||||||||
| 07/2014 | 386 | MYR | 1,269 | 9 | 0 | |||||||||||||||||||||||
| 07/2014 | 1,108 | PHP | 48,760 | 10 | 0 | |||||||||||||||||||||||
| 07/2014 | 3,539 | PLN | 10,786 | 6 | 0 | |||||||||||||||||||||||
| 07/2014 | 143 | THB | 4,630 | 0 | (1 | ) | ||||||||||||||||||||||
| 07/2014 | 2,095 | TRY | 4,464 | 6 | 0 | |||||||||||||||||||||||
| 08/2014 | BRL | 7,071 | $ | 3,124 | 0 | (46 | ) | |||||||||||||||||||||
| 08/2014 | RUB | 134,165 | 3,860 | 0 | (54 | ) | ||||||||||||||||||||||
| 08/2014 | $ | 558 | EUR | 412 | 6 | 0 | ||||||||||||||||||||||
| 08/2014 | 3,909 | RUB | 136,737 | 85 | (6 | ) | ||||||||||||||||||||||
| 09/2014 | ILS | 876 | $ | 255 | 0 | 0 | ||||||||||||||||||||||
| 09/2014 | MXN | 13,828 | 1,064 | 4 | 0 | |||||||||||||||||||||||
| 10/2014 | $ | 17,219 | ZAR | 188,460 | 207 | (15 | ) | |||||||||||||||||||||
| 10/2014 | ZAR | 62,030 | $ | 5,674 | 0 | (57 | ) | |||||||||||||||||||||
MSC | 07/2014 | BRL | 2,443 | 1,113 | 8 | 0 | ||||||||||||||||||||||
| 07/2014 | CNY | 1,194 | 193 | 0 | (1 | ) | ||||||||||||||||||||||
| 07/2014 | HKD | 224,831 | 29,002 | 2 | (1 | ) | ||||||||||||||||||||||
| 07/2014 | INR | 267,738 | 4,305 | 0 | (136 | ) | ||||||||||||||||||||||
| 07/2014 | KRW | 1,157,649 | 1,115 | 0 | (28 | ) | ||||||||||||||||||||||
| 07/2014 | MYR | 5,301 | 1,615 | 0 | (35 | ) | ||||||||||||||||||||||
| 07/2014 | PHP | 14,440 | 331 | 0 | 0 | |||||||||||||||||||||||
| 07/2014 | THB | 109,242 | 3,356 | 2 | (9 | ) | ||||||||||||||||||||||
| 07/2014 | TRY | 266 | 125 | 0 | 0 | |||||||||||||||||||||||
| See Accompanying Notes | ANNUAL REPORT | JUNE 30, 2014 | 71 |
Table of Contents
Schedule of Investments PIMCO EqS® Emerging Markets Fund (Cont.)
| Counterparty | Settlement Month | Currency to be Delivered | Currency to be Received | Unrealized Appreciation/ (Depreciation) | ||||||||||||||||||||||||
| Asset | Liability | |||||||||||||||||||||||||||
| 07/2014 | TWD | 212,431 | $ | 7,018 | $ | 0 | $ | (100 | ) | |||||||||||||||||||
| 07/2014 | $ | 417 | HKD | 3,232 | 0 | 0 | ||||||||||||||||||||||
| 07/2014 | 942 | INR | 57,914 | 19 | 0 | |||||||||||||||||||||||
| 07/2014 | 1,005 | KRW | 1,049,019 | 31 | 0 | |||||||||||||||||||||||
| 07/2014 | 274 | TWD | 8,294 | 4 | 0 | |||||||||||||||||||||||
| 08/2014 | 1,856 | CLP | 1,044,414 | 23 | 0 | |||||||||||||||||||||||
| 10/2014 | ZAR | 6,105 | $ | 566 | 2 | 0 | ||||||||||||||||||||||
RBC | 07/2014 | CZK | 4,683 | 235 | 2 | 0 | ||||||||||||||||||||||
| 07/2014 | HKD | 26,353 | 3,400 | 1 | 0 | |||||||||||||||||||||||
| 07/2014 | KRW | 810,308 | 747 | 0 | (53 | ) | ||||||||||||||||||||||
| 07/2014 | PLN | 345 | 113 | 0 | (1 | ) | ||||||||||||||||||||||
| 07/2014 | TWD | 50,692 | 1,683 | 0 | (16 | ) | ||||||||||||||||||||||
| 09/2014 | MXN | 25,696 | 1,975 | 5 | 0 | |||||||||||||||||||||||
| 10/2014 | ZAR | 21,044 | 1,994 | 50 | 0 | |||||||||||||||||||||||
SCX | 07/2014 | PHP | 72,938 | 1,627 | 0 | (45 | ) | |||||||||||||||||||||
| 07/2014 | $ | 2,696 | HKD | 20,903 | 0 | 0 | ||||||||||||||||||||||
| 07/2014 | 2,882 | IDR | 33,828,737 | 0 | (34 | ) | ||||||||||||||||||||||
| 07/2014 | 941 | PHP | 41,190 | 3 | 0 | |||||||||||||||||||||||
SOG | 07/2014 | AUD | 4,929 | $ | 4,551 | 0 | (96 | ) | ||||||||||||||||||||
| 07/2014 | $ | 2,775 | AUD | 2,943 | 0 | 0 | ||||||||||||||||||||||
| 08/2014 | AUD | 2,942 | $ | 2,768 | 0 | (1 | ) | |||||||||||||||||||||
| 08/2014 | $ | 774 | EUR | 566 | 1 | 0 | ||||||||||||||||||||||
| 08/2014 | 1,617 | JPY | 164,700 | 10 | 0 | |||||||||||||||||||||||
| 10/2014 | ZAR | 43,380 | $ | 4,022 | 14 | 0 | ||||||||||||||||||||||
UAG | 07/2014 | BRL | 9,599 | 4,265 | 0 | (81 | ) | |||||||||||||||||||||
| 07/2014 | CNY | 97,639 | 15,783 | 0 | (26 | ) | ||||||||||||||||||||||
| 07/2014 | IDR | 15,627,802 | 1,362 | 47 | 0 | |||||||||||||||||||||||
| 07/2014 | PLN | 1,056 | 348 | 1 | 0 | |||||||||||||||||||||||
| 07/2014 | $ | 4,279 | BRL | 9,600 | 66 | 0 | ||||||||||||||||||||||
| 07/2014 | 1,491 | CNY | 9,207 | 0 | 0 | |||||||||||||||||||||||
| 07/2014 | 23,188 | HKD | 179,958 | 25 | 0 | |||||||||||||||||||||||
| 07/2014 | 219 | IDR | 2,561,496 | 0 | (3 | ) | ||||||||||||||||||||||
| 07/2014 | 875 | INR | 54,861 | 35 | 0 | |||||||||||||||||||||||
| 07/2014 | 25,655 | KRW | 27,604,759 | 1,609 | 0 | |||||||||||||||||||||||
| 07/2014 | 1,393 | PHP | 62,019 | 29 | 0 | |||||||||||||||||||||||
| 08/2014 | BRL | 5,584 | $ | 2,470 | 0 | (33 | ) | |||||||||||||||||||||
| 08/2014 | EUR | 4,286 | 5,880 | 10 | 0 | |||||||||||||||||||||||
| 09/2014 | $ | 498 | ILS | 1,734 | 7 | 0 | ||||||||||||||||||||||
| 10/2014 | ZAR | 38,023 | $ | 3,547 | 35 | (1 | ) | |||||||||||||||||||||
|
|
|
| |||||||||||||||||||||||||
Total Forward Foreign Currency Contracts |
| $ | 4,615 | $ | (2,438 | ) | ||||||||||||||||||||||
|
|
|
| |||||||||||||||||||||||||
WRITTEN OPTIONS:
AS OF JUNE 30, 2014 THERE WERE NO OPEN WRITTEN OPTIONS. TRANSACTIONS IN WRITTEN CALL AND PUT OPTIONS FOR THE PERIOD ENDED JUNE 30, 2014:
| Notional Amount in $ | Notional Amount in HKD | Notional Amount in TWD | Premiums | |||||||||||||
Balance at Beginning of Period | $ | 0 | HKD | 110,062 | TWD | 0 | $ | (108 | ) | |||||||
Sales | 36,620 | 1,306 | 9,628 | (524 | ) | |||||||||||
Closing Buys | 0 | (653 | ) | 0 | 179 | |||||||||||
Expirations | (36,620 | ) | (110,715 | ) | (9,628 | ) | 453 | |||||||||
Exercised | 0 | 0 | 0 | 0 | ||||||||||||
|
|
|
|
|
|
|
| |||||||||
Balance at End of Period | $ | 0 | HKD | 0 | TWD | 0 | $ | 0 | ||||||||
|
|
|
|
|
|
|
| |||||||||
SWAP AGREEMENTS:
TOTAL RETURN SWAPS ON SECURITIES
| Counterparty | Pay/Receive (1) | Underlying Reference | # of Shares | Financing Rate | Maturity Date | Notional Amount | Unrealized Appreciation/ (Depreciation) | Swap Agreements, at Value | ||||||||||||||||||||||
| Asset | Liability | |||||||||||||||||||||||||||||
| BOA | Receive | Alrosa AO | 1,238,758 | 1-Month USD-LIBOR plus a specified spread | 10/28/2014 | $ | 1,431 | $ | 86 | $ | 86 | $ | 0 | |||||||||||||||||
Receive | NovaTek OAO | 69,680 | 1-Month USD-LIBOR plus a specified spread | 10/28/2014 | 820 | 43 | 43 | 0 | ||||||||||||||||||||||
| DUB | Receive | KCell JSC | 159,489 | 3-Month USD-LIBOR plus a specified spread | 08/25/2014 | 2,396 | 4 | 4 | 0 | |||||||||||||||||||||
Receive | Magnitogorsk Iron & Steel Works | 441,595 | 3-Month USD-LIBOR plus a specified spread | 08/26/2014 | 1,124 | 30 | 30 | 0 | ||||||||||||||||||||||
| 72 | PIMCO EQUITY SERIES | See Accompanying Notes |
Table of Contents
June 30, 2014
| Counterparty | Pay/Receive (1) | Underlying Reference | # of Shares | Financing Rate | Maturity Date | Notional Amount | Unrealized Appreciation/ (Depreciation) | Swap Agreements, at Value | ||||||||||||||||||||||
| Asset | Liability | |||||||||||||||||||||||||||||
| FBF | Pay | RTS Index | 937 | 1-Month USD-LIBOR plus a specified spread | 09/15/2014 | $ | 2,436 | $ | (18 | ) | $ | 0 | $ | (18 | ) | |||||||||||||||
| SOG | Receive | China Construction Bank Corp. | 2,004,835 | 1-Month USD-LIBOR plus a specified spread | 07/30/2015 | 1,344 | 0 | 0 | 0 | |||||||||||||||||||||
Receive | Kweichow Moutai Co. Ltd. | 95,964 | 1-Month USD-LIBOR plus a specified spread | 07/30/2015 | 2,212 | 0 | 0 | 0 | ||||||||||||||||||||||
| UAG | Receive | Bashneft OAO | 68,981 | 1-Month USD-LIBOR plus a specified spread | 09/23/2014 | 3,679 | (373 | ) | 0 | (373 | ) | |||||||||||||||||||
Receive | Alrosa AO | 606,261 | 1-Month USD-LIBOR plus a specified spread | 10/02/2014 | 701 | 42 | 42 | 0 | ||||||||||||||||||||||
Receive | Bashneft OAO | 23,227 | 1-Month USD-LIBOR plus a specified spread | 12/18/2014 | 1,656 | (19 | ) | 0 | (19 | ) | ||||||||||||||||||||
|
|
|
|
|
| |||||||||||||||||||||||||
| $ | (205 | ) | $ | 205 | $ | (410 | ) | |||||||||||||||||||||||
|
|
|
|
|
| |||||||||||||||||||||||||
Total Swap Agreements | $ | (205 | ) | $ | 205 | $ | (410 | ) | ||||||||||||||||||||||
|
|
|
|
|
| |||||||||||||||||||||||||
| (1) | Receive represents that the Fund receives payments for any positive return on the underlying reference. The Fund makes payments for any negative return on such underlying reference. Pay represents that the Fund receives payments for any negative return on the underlying reference. The Fund makes payments for any positive return on such underlying reference. |
FINANCIAL DERIVATIVE INSTRUMENTS: OVER THE COUNTER SUMMARY
The following is a summary by counterparty of the market value of OTC financial derivative instruments and collateral (received)/pledged as of June 30, 2014:
| (d) | Securities with an aggregate market value of $119 have been pledged as collateral for financial derivative instruments as governed by International Swaps and Derivatives Association, Inc. master agreements as of June 30, 2014. |
| Financial Derivative Assets | Financial Derivative Liabilities | |||||||||||||||||||||||||||||||||||||||||||||
| Counterparty | Forward Foreign Currency Contracts | Purchased Options | Swap Agreements | Total Over the Counter | Forward Foreign Currency Contracts | Written Options | Swap Agreements | Total Over the Counter | Net Market Value of OTC Derivatives | Collateral (Received)/ Pledged | Net Exposure (2) | |||||||||||||||||||||||||||||||||||
AZD | $ | 10 | $ | 0 | $ | 0 | $ | 10 | $ | 0 | $ | 0 | $ | 0 | $ | 0 | $ | 10 | $ | 0 | $ | 10 | ||||||||||||||||||||||||
BOA | 508 | 0 | 129 | 637 | (100 | ) | 0 | 0 | (100 | ) | 537 | (550 | ) | (13 | ) | |||||||||||||||||||||||||||||||
BPS | 114 | 0 | 0 | 114 | (79 | ) | 0 | 0 | (79 | ) | 35 | 0 | 35 | |||||||||||||||||||||||||||||||||
BRC | 345 | 0 | 0 | 345 | (118 | ) | 0 | 0 | (118 | ) | 227 | (310 | ) | (83 | ) | |||||||||||||||||||||||||||||||
CBK | 108 | 0 | 0 | 108 | (77 | ) | 0 | 0 | (77 | ) | 31 | 0 | 31 | |||||||||||||||||||||||||||||||||
DUB | 248 | 0 | 34 | 282 | (343 | ) | 0 | 0 | (343 | ) | (61 | ) | (80 | ) | (141 | ) | ||||||||||||||||||||||||||||||
FBF | 606 | 0 | 0 | 606 | (330 | ) | 0 | (18 | ) | (348 | ) | 258 | (350 | ) | (92 | ) | ||||||||||||||||||||||||||||||
GLM | 108 | 0 | 0 | 108 | (49 | ) | 0 | 0 | (49 | ) | 59 | (260 | ) | (201 | ) | |||||||||||||||||||||||||||||||
HUS | 1 | 0 | 0 | 1 | 0 | 0 | 0 | 0 | 1 | 0 | 1 | |||||||||||||||||||||||||||||||||||
JPM | 526 | 0 | 0 | 526 | (642 | ) | 0 | 0 | (642 | ) | (116 | ) | 119 | 3 | ||||||||||||||||||||||||||||||||
MSC | 91 | 0 | 0 | 91 | (310 | ) | 0 | 0 | (310 | ) | (219 | ) | 0 | (219 | ) | |||||||||||||||||||||||||||||||
RBC | 58 | 0 | 0 | 58 | (70 | ) | 0 | 0 | (70 | ) | (12 | ) | 0 | (12 | ) | |||||||||||||||||||||||||||||||
SCX | 3 | 0 | 0 | 3 | (79 | ) | 0 | 0 | (79 | ) | (76 | ) | 0 | (76 | ) | |||||||||||||||||||||||||||||||
SOG | 25 | 0 | 0 | 25 | (97 | ) | 0 | 0 | (97 | ) | (72 | ) | 0 | (72 | ) | |||||||||||||||||||||||||||||||
UAG | 1,864 | 0 | 42 | 1,906 | (144 | ) | 0 | (392 | ) | (536 | ) | 1,370 | (1,910 | ) | (540 | ) | ||||||||||||||||||||||||||||||
|
|
|
|
|
|
|
|
|
|
|
|
|
|
|
| |||||||||||||||||||||||||||||||
Total Over the Counter | $ | 4,615 | $ | 0 | $ | 205 | $ | 4,820 | $ | (2,438 | ) | $ | 0 | $ | (410 | ) | $ | (2,848 | ) | |||||||||||||||||||||||||||
|
|
|
|
|
|
|
|
|
|
|
|
|
|
|
| |||||||||||||||||||||||||||||||
| (2) | Net Exposure represents the net receivable/(payable) that would be due from/to the counterparty in the event of default. Exposure from OTC financial derivative instruments can only be netted across transactions governed under the same master agreement with the same legal entity. See Note 7, Principal Risks, in the Notes to Financial Statements for more information regarding master netting arrangements. |
| See Accompanying Notes | ANNUAL REPORT | JUNE 30, 2014 | 73 |
Table of Contents
Schedule of Investments PIMCO EqS® Emerging Markets Fund (Cont.)
FAIR VALUE OF FINANCIAL DERIVATIVE INSTRUMENTS
The following is a summary of the fair valuation of the Fund’s derivative instruments categorized by risk exposure. See Note 7, Principal Risks, in the Notes to Financial Statements on risks of the Fund.
Fair Values of Financial Derivative Instruments on the Statements of Assets and Liabilities as of June 30, 2014:
| Derivatives not accounted for as hedging instruments | ||||||||||||||||||||||||
| Commodity Contracts | Credit Contracts | Equity Contracts | Foreign Exchange Contracts | Interest Rate Contracts | Total | |||||||||||||||||||
Financial Derivative Instruments - Assets | ||||||||||||||||||||||||
Over the counter | ||||||||||||||||||||||||
Forward Foreign Currency Contracts | $ | 0 | $ | 0 | $ | 0 | $ | 4,615 | $ | 0 | $ | 4,615 | ||||||||||||
Swap Agreements | 0 | 0 | 205 | 0 | 0 | 205 | ||||||||||||||||||
|
|
|
|
|
|
|
|
|
|
|
| |||||||||||||
| $ | 0 | $ | 0 | $ | 205 | $ | 4,615 | $ | 0 | $ | 4,820 | |||||||||||||
|
|
|
|
|
|
|
|
|
|
|
| |||||||||||||
Financial Derivative Instruments - Liabilities | ||||||||||||||||||||||||
Over the counter | ||||||||||||||||||||||||
Forward Foreign Currency Contracts | $ | 0 | $ | 0 | $ | 0 | $ | 2,438 | $ | 0 | $ | 2,438 | ||||||||||||
Swap Agreements | 0 | 0 | 410 | 0 | 0 | 410 | ||||||||||||||||||
|
|
|
|
|
|
|
|
|
|
|
| |||||||||||||
| $ | 0 | $ | 0 | $ | 410 | $ | 2,438 | $ | 0 | $ | 2,848 | |||||||||||||
|
|
|
|
|
|
|
|
|
|
|
| |||||||||||||
The Effect of Financial Derivative Instruments on the Statements of Operations for the Period Ended June 30, 2014:
| Derivatives not accounted for as hedging instruments | ||||||||||||||||||||||||
| Commodity Contracts | Credit Contracts | Equity Contracts | Foreign Exchange Contracts | Interest Rate Contracts | Total | |||||||||||||||||||
Net Realized Gain (Loss) on Financial Derivative Instruments |
| |||||||||||||||||||||||
Exchange-traded or centrally cleared | ||||||||||||||||||||||||
Purchased Options | $ | 0 | $ | 0 | $ | (243 | ) | $ | 0 | $ | 0 | $ | (243 | ) | ||||||||||
Written Options | 0 | 0 | 2 | 0 | 0 | 2 | ||||||||||||||||||
Futures | 0 | 0 | (1,161 | ) | 0 | (230 | ) | (1,391 | ) | |||||||||||||||
Swap Agreements | 0 | 0 | 0 | 0 | 212 | 212 | ||||||||||||||||||
|
|
|
|
|
|
|
|
|
|
|
| |||||||||||||
| $ | 0 | $ | 0 | $ | (1,402 | ) | $ | 0 | $ | (18 | ) | $ | (1,420 | ) | ||||||||||
|
|
|
|
|
|
|
|
|
|
|
| |||||||||||||
Over the counter | ||||||||||||||||||||||||
Forward Foreign Currency Contracts | $ | 0 | $ | 0 | $ | 0 | $ | (10,671 | ) | $ | 0 | $ | (10,671 | ) | ||||||||||
Purchased Options | 0 | 0 | (208 | ) | 0 | 0 | (208 | ) | ||||||||||||||||
Written Options | 0 | 0 | 591 | 0 | 0 | 591 | ||||||||||||||||||
Swap Agreements | 0 | (90 | ) | 725 | 0 | 0 | 635 | |||||||||||||||||
|
|
|
|
|
|
|
|
|
|
|
| |||||||||||||
| $ | 0 | $ | (90 | ) | $ | 1,108 | $ | (10,671 | ) | $ | 0 | $ | (9,653 | ) | ||||||||||
|
|
|
|
|
|
|
|
|
|
|
| |||||||||||||
| $ | 0 | $ | (90 | ) | $ | (294 | ) | $ | (10,671 | ) | $ | (18 | ) | $ | (11,073 | ) | ||||||||
|
|
|
|
|
|
|
|
|
|
|
| |||||||||||||
Net Change in Unrealized Appreciation on Financial Derivative Instruments |
| |||||||||||||||||||||||
Over the counter | ||||||||||||||||||||||||
Forward Foreign Currency Contracts | $ | 0 | $ | 0 | $ | 0 | $ | 6,348 | $ | 0 | $ | 6,348 | ||||||||||||
Written Options | 0 | 0 | 0 | 0 | 423 | 423 | ||||||||||||||||||
Swap Agreements | 0 | 42 | 2,120 | 0 | 0 | 2,162 | ||||||||||||||||||
|
|
|
|
|
|
|
|
|
|
|
| |||||||||||||
| $ | 0 | $ | 42 | $ | 2,120 | $ | 6,348 | $ | 423 | $ | 8,933 | |||||||||||||
|
|
|
|
|
|
|
|
|
|
|
| |||||||||||||
FAIR VALUE MEASUREMENTS
The following is a summary of the fair valuations according to the inputs used as of June 30, 2014 in valuing the Fund’s assets and liabilities:
| Category and Subcategory | Level 1 | Level 2 | Level 3 | Fair Value at 06/30/2014 | ||||||||||||
Investments in Securities, at Value | ||||||||||||||||
Common Stocks | ||||||||||||||||
Australia | ||||||||||||||||
Materials | $ | 0 | $ | 1,703 | $ | 0 | $ | 1,703 | ||||||||
Brazil | ||||||||||||||||
Consumer Discretionary | 1,871 | 0 | 0 | 1,871 | ||||||||||||
Consumer Staples | 3,874 | 0 | 0 | 3,874 | ||||||||||||
Financials | 7,251 | 0 | 1 | 7,252 | ||||||||||||
Industrials | 1,819 | 0 | 0 | 1,819 | ||||||||||||
Cambodia | ||||||||||||||||
Consumer Discretionary | 0 | 2,388 | 0 | 2,388 | ||||||||||||
| Category and Subcategory | Level 1 | Level 2 | Level 3 | Fair Value at 06/30/2014 | ||||||||||||
Canada | ||||||||||||||||
Materials | $ | 1,133 | $ | 0 | $ | 0 | $ | 1,133 | ||||||||
China | ||||||||||||||||
Consumer Staples | 0 | 374 | 0 | 374 | ||||||||||||
Energy | 0 | 4,113 | 0 | 4,113 | ||||||||||||
Financials | 0 | 3,103 | 0 | 3,103 | ||||||||||||
Industrials | 0 | 1,676 | 0 | 1,676 | ||||||||||||
Information Technology | 650 | 0 | 0 | 650 | ||||||||||||
Materials | 0 | 622 | 0 | 622 | ||||||||||||
Cyprus | ||||||||||||||||
Energy | 1,318 | 0 | 0 | 1,318 | ||||||||||||
Industrials | 2,146 | 0 | 0 | 2,146 | ||||||||||||
| 74 | PIMCO EQUITY SERIES | See Accompanying Notes |
Table of Contents
June 30, 2014
| Category and Subcategory | Level 1 | Level 2 | Level 3 | Fair Value at 06/30/2014 | ||||||||||||
Greece | ||||||||||||||||
Financials | $ | 0 | $ | 2,017 | $ | 0 | $ | 2,017 | ||||||||
Hong Kong | ||||||||||||||||
Financials | 0 | 4,946 | 0 | 4,946 | ||||||||||||
Information Technology | 0 | 0 | 665 | 665 | ||||||||||||
India | ||||||||||||||||
Consumer Discretionary | 0 | 4,184 | 0 | 4,184 | ||||||||||||
Financials | 0 | 4,802 | 0 | 4,802 | ||||||||||||
Indonesia | ||||||||||||||||
Consumer Discretionary | 0 | 2,678 | 0 | 2,678 | ||||||||||||
Israel | ||||||||||||||||
Materials | 0 | 2,414 | 0 | 2,414 | ||||||||||||
Japan | ||||||||||||||||
Industrials | 0 | 3,116 | 0 | 3,116 | ||||||||||||
Information Technology | 0 | 1,206 | 0 | 1,206 | ||||||||||||
Macau | ||||||||||||||||
Consumer Discretionary | 0 | 1,784 | 0 | 1,784 | ||||||||||||
Mexico | ||||||||||||||||
Financials | 2,367 | 0 | 0 | 2,367 | ||||||||||||
Norway | ||||||||||||||||
Consumer Staples | 0 | 2,890 | 0 | 2,890 | ||||||||||||
Peru | ||||||||||||||||
Financials | 2,300 | 0 | 0 | 2,300 | ||||||||||||
Materials | 1,760 | 0 | 0 | 1,760 | ||||||||||||
Philippines | ||||||||||||||||
Utilities | 0 | 594 | 0 | 594 | ||||||||||||
Poland | ||||||||||||||||
Financials | 0 | 2,028 | 0 | 2,028 | ||||||||||||
Russia | ||||||||||||||||
Telecommunication Services | 1,860 | 0 | 0 | 1,860 | ||||||||||||
South Africa | ||||||||||||||||
Consumer Staples | 0 | 899 | 0 | 899 | ||||||||||||
South Korea | ||||||||||||||||
Consumer Discretionary | 0 | 3,422 | 0 | 3,422 | ||||||||||||
Information Technology | 0 | 5,259 | 0 | 5,259 | ||||||||||||
| Category and Subcategory | Level 1 | Level 2 | Level 3 | Fair Value at 06/30/2014 | ||||||||||||
Taiwan | ||||||||||||||||
Information Technology | $ | 0 | $ | 12,221 | $ | 0 | $ | 12,221 | ||||||||
United Kingdom | ||||||||||||||||
Consumer Staples | 0 | 1,115 | 0 | 1,115 | ||||||||||||
Energy | 0 | 1,165 | 0 | 1,165 | ||||||||||||
Equity-Linked Securities | ||||||||||||||||
United Kingdom | ||||||||||||||||
Consumer Staples | 1,843 | 0 | 0 | 1,843 | ||||||||||||
Preferred Stocks | ||||||||||||||||
Brazil | ||||||||||||||||
Consumer Staples | 3,097 | 0 | 0 | 3,097 | ||||||||||||
Warrants | ||||||||||||||||
United States | ||||||||||||||||
Consumer Discretionary | 947 | 0 | 0 | 947 | ||||||||||||
Financials | 576 | 0 | 0 | 576 | ||||||||||||
Short-Term Instruments | ||||||||||||||||
U.S. Treasury Bills | 0 | 409 | 0 | 409 | ||||||||||||
| $ | 34,812 | $ | �� 71,128 | $ | 666 | $ | 106,606 | |||||||||
Investments in Affiliates, at Value | ||||||||||||||||
Short-Term Instruments | ||||||||||||||||
Central Funds Used for Cash Management Purposes | $ | 519 | $ | 0 | $ | 0 | $ | 519 | ||||||||
Total Investments | $ | 35,331 | $ | 71,128 | $ | 666 | $ | 107,125 | ||||||||
Financial Derivative Instruments - Assets |
| |||||||||||||||
Over the counter | $ | 0 | $ | 4,820 | $ | 0 | $ | 4,820 | ||||||||
Financial Derivative Instruments - Liabilities |
| |||||||||||||||
Over the counter | $ | 0 | $ | (2,848 | ) | $ | 0 | $ | (2,848 | ) | ||||||
Totals | $ | 35,331 | $ | 73,100 | $ | 666 | $ | 109,097 | ||||||||
There were assets and liabilities valued at $2,240 transferred from Level 2 to Level 1 during the period ended June 30, 2014. There were no significant assets and liabilities transferred from Level 1 to Level 2 during the period ended June 30, 2014. There were no significant transfers between Level 2 and 3 during the period ended June 30, 2014.
| See Accompanying Notes | ANNUAL REPORT | JUNE 30, 2014 | 75 |
Table of Contents
Schedule of Investments PIMCO EqS® Long/Short Fund
| SHARES | MARKET VALUE (000S) | |||||||||||
| INVESTMENTS IN SECURITIES 77.6% | ||||||||||||
| COMMON STOCKS 55.5% | ||||||||||||
| FRANCE 2.0% | ||||||||||||
| INDUSTRIALS 2.0% | ||||||||||||
Airbus Group NV | 440,000 | $ | 29,501 | |||||||||
|
| |||||||||||
Total France | 29,501 | |||||||||||
|
| |||||||||||
| GREECE 0.3% | ||||||||||||
| INDUSTRIALS 0.3% | ||||||||||||
Paragon Shipping, Inc. ‘A’ (a) | 800,000 | 4,728 | ||||||||||
|
| |||||||||||
Total Greece | 4,728 | |||||||||||
|
| |||||||||||
| NETHERLANDS 0.0% | ||||||||||||
| INDUSTRIALS 0.0% | ||||||||||||
Chicago Bridge & Iron Co. NV | 5,000 | 341 | ||||||||||
|
| |||||||||||
Total Netherlands | 341 | |||||||||||
|
| |||||||||||
| SOUTH KOREA 5.5% | ||||||||||||
| INFORMATION TECHNOLOGY 5.5% | ||||||||||||
SK Hynix, Inc. (a) | 1,700,000 | 81,630 | ||||||||||
|
| |||||||||||
Total South Korea | 81,630 | |||||||||||
|
| |||||||||||
| UNITED KINGDOM 0.5% | ||||||||||||
| HEALTH CARE 0.5% | ||||||||||||
AstraZeneca PLC ADR | 105,000 | 7,803 | ||||||||||
|
| |||||||||||
Total United Kingdom | 7,803 | |||||||||||
|
| |||||||||||
| UNITED STATES 47.2% | ||||||||||||
| CONSUMER DISCRETIONARY 13.3% | ||||||||||||
CBS Corp. ‘B’ | 200,000 | 12,428 | ||||||||||
Comcast Corp. ‘A’ (d) | 1,400,000 | 75,152 | ||||||||||
Deckers Outdoor Corp. (a) | 421,717 | 36,407 | ||||||||||
Foot Locker, Inc. | 832,871 | 42,243 | ||||||||||
MDC Partners, Inc. | 260,000 | 5,587 | ||||||||||
Sinclair Broadcast Group, Inc. | 328,000 | 11,398 | ||||||||||
Time Warner, Inc. | 215,000 | 15,104 | ||||||||||
Time, Inc. (a) | 14,375 | 348 | ||||||||||
|
| |||||||||||
| 198,667 | ||||||||||||
|
| |||||||||||
| CONSUMER STAPLES 4.1% | ||||||||||||
Tyson Foods, Inc. ‘A’ | 100,000 | 3,754 | ||||||||||
Walgreen Co. (d) | 765,000 | 56,709 | ||||||||||
|
| |||||||||||
| 60,463 | ||||||||||||
|
| |||||||||||
| SHARES | MARKET VALUE (000S) | |||||||||||
| ENERGY 1.6% | ||||||||||||
Marathon Petroleum Corp. | 180,000 | $ | 14,053 | |||||||||
Valero Energy Corp. | 200,000 | 10,020 | ||||||||||
|
| |||||||||||
| 24,073 | ||||||||||||
|
| |||||||||||
| HEALTH CARE 9.4% | ||||||||||||
Brookdale Senior Living, Inc. (a) | 100,000 | 3,334 | ||||||||||
DaVita HealthCare Partners, Inc. (a) | 850,000 | 61,472 | ||||||||||
HealthSouth Corp. | 910,000 | 32,642 | ||||||||||
Valeant Pharmaceuticals International, Inc. (a) | 340,000 | 42,881 | ||||||||||
|
| |||||||||||
| 140,329 | ||||||||||||
|
| |||||||||||
| INDUSTRIALS 1.7% | ||||||||||||
ADT Corp. | 280,000 | 9,783 | ||||||||||
KAR Auction Services, Inc. | 264,739 | 8,437 | ||||||||||
MasTec, Inc. (a) | 250,000 | 7,705 | ||||||||||
|
| |||||||||||
| 25,925 | ||||||||||||
|
| |||||||||||
| INFORMATION TECHNOLOGY 11.1% | ||||||||||||
DST Systems, Inc. (d) | 843,045 | 77,704 | ||||||||||
Micron Technology, Inc. (a) | 2,700,000 | 88,965 | ||||||||||
|
| |||||||||||
| 166,669 | ||||||||||||
|
| |||||||||||
| MATERIALS 6.0% | ||||||||||||
Monsanto Co. | 560,000 | 69,854 | ||||||||||
Sealed Air Corp. | 600,000 | 20,502 | ||||||||||
|
| |||||||||||
| 90,356 | ||||||||||||
|
| |||||||||||
Total United States | 706,482 | |||||||||||
|
| |||||||||||
Total Common Stocks (Cost $737,696) |
| 830,485 | ||||||||||
|
| |||||||||||
| REAL ESTATE INVESTMENT TRUSTS 9.7% | ||||||||||||
| UNITED STATES 9.7% | ||||||||||||
| FINANCIALS 9.7% | ||||||||||||
American Realty Capital Properties, Inc. (d) | 11,600,000 | 145,347 | ||||||||||
|
| |||||||||||
Total Real Estate Investment Trusts |
| 145,347 | ||||||||||
|
| |||||||||||
| PRINCIPAL AMOUNT (000S) | MARKET VALUE (000S) | |||||||||||
| SHORT-TERM INSTRUMENTS 12.4% | ||||||||||||
| SHORT-TERM NOTES 12.2% | ||||||||||||
Fannie Mae |
| |||||||||||
0.060% due 10/01/2014 - 10/06/2014 | $ | 56,900 | $ | 56,894 | ||||||||
0.080% due 11/17/2014 | 16,800 | 16,797 | ||||||||||
Federal Home Loan Bank |
| |||||||||||
0.075% due 10/29/2014 - 11/05/2014 | 18,200 | 18,197 | ||||||||||
0.076% due 10/29/2014 - 11/14/2014 | 37,600 | 37,594 | ||||||||||
0.078% due 11/05/2014 | 14,000 | 13,998 | ||||||||||
Freddie Mac |
| |||||||||||
0.060% due 10/17/2014 | 24,100 | 24,097 | ||||||||||
0.075% due 10/16/2014 | 14,800 | 14,798 | ||||||||||
|
| |||||||||||
| 182,375 | ||||||||||||
|
| |||||||||||
| U.S. TREASURY BILLS 0.2% | ||||||||||||
0.042% due 07/03/2014 - 12/26/2014 (b)(g) | 3,409 | 3,409 | ||||||||||
|
| |||||||||||
| Total Short-Term Instruments (Cost $185,769) | 185,784 | |||||||||||
|
| |||||||||||
| Total Investments in Securities (Cost $1,071,283) | 1,161,616 | |||||||||||
|
| |||||||||||
| SHARES | ||||||||||||
| INVESTMENTS IN AFFILIATES 26.8% | ||||||||||||
| SHORT-TERM INSTRUMENTS 26.8% | ||||||||||||
| CENTRAL FUNDS USED FOR CASH MANAGEMENT PURPOSES 26.8% | ||||||||||||
PIMCO Short-Term Floating NAV Portfolio | 40,178,250 | 402,024 | ||||||||||
|
| |||||||||||
| Total Short-Term Instruments (Cost $401,987) | 402,024 | |||||||||||
|
| |||||||||||
| Total Investments in Affiliates (Cost $401,987) | 402,024 | |||||||||||
| Total Investments 104.4% (Cost $1,473,270) | $ | 1,563,640 | ||||||||||
| Securities Sold Short (c) (4.8%) (Proceeds $70,544) | (71,454 | ) | ||||||||||
Financial Derivative Instruments (e)(f) (0.4%) (Cost or Premiums, net $(164)) | (6,338 | ) | ||||||||||
| Other Assets and Liabilities, net 0.8% | 11,738 | |||||||||||
|
| |||||||||||
| Net Assets 100.0% | $ | 1,497,586 | ||||||||||
|
| |||||||||||
NOTES TO SCHEDULE OF INVESTMENTS (AMOUNTS IN THOUSANDS*, EXCEPT NUMBER OF CONTRACTS AND SHARES):
| * | A zero balance may reflect actual amounts rounding to less than one thousand. |
| (a) | Security did not produce income within the last twelve months. |
| (b) | Coupon represents a weighted average yield to maturity. |
| 76 | PIMCO EQUITY SERIES | See Accompanying Notes |
Table of Contents
June 30, 2014
BORROWINGS AND OTHER FINANCING TRANSACTIONS
(c) SECURITIES SOLD SHORT:
| (d) | Securities with an aggregate market value of $111,727 and cash of $46,683 have been pledged as collateral as of June 30, 2014 for equity short sales and equity options as governed by prime brokerage agreements and agreements governing listed equity option transactions. |
| Counterparty | Description | Shares | Proceeds | Payable for Short Sales (1) | ||||||||||
Common Stocks | ||||||||||||||
Argentina | ||||||||||||||
Information Technology | ||||||||||||||
GSC | MercadoLibre, Inc. | 55,000 | $ | (4,806 | ) | $ | (5,256 | ) | ||||||
Bermuda | ||||||||||||||
Energy | ||||||||||||||
Seadrill Ltd. | 250,000 | (9,749 | ) | (9,988 | ) | |||||||||
United States | ||||||||||||||
Consumer Discretionary | ||||||||||||||
Buckle, Inc. | 105,000 | (4,801 | ) | (4,658 | ) | |||||||||
Cabela’s, Inc. | 155,000 | (10,233 | ) | (9,671 | ) | |||||||||
FOB | Cablevision Systems Corp. ‘A’ | 300,000 | (5,205 | ) | (5,295 | ) | ||||||||
GSC | PetSmart, Inc. | 90,000 | (5,386 | ) | (5,382 | ) | ||||||||
MSC | Sonic Corp. | 200,000 | (4,460 | ) | (4,416 | ) | ||||||||
FOB | Tractor Supply Co. | 35,000 | (2,136 | ) | (2,114 | ) | ||||||||
GSC | Weight Watchers International, Inc. | 400,000 | (8,503 | ) | (8,068 | ) | ||||||||
MSC | Weight Watchers International, Inc. | 60,000 | (1,246 | ) | (1,210 | ) | ||||||||
Health Care | ||||||||||||||
FOB | Insulet Corp. | 80,000 | (3,177 | ) | (3,174 | ) | ||||||||
Industrials | ||||||||||||||
CH Robinson Worldwide, Inc. | 5,036 | (297 | ) | (323 | ) | |||||||||
GSC | Trinity Industries, Inc. | 60,000 | (2,482 | ) | (2,623 | ) | ||||||||
Information Technology | ||||||||||||||
RealPage, Inc. | 300,000 | (5,566 | ) | (6,744 | ) | |||||||||
Utilities | ||||||||||||||
MSC | Hawaiian Electric Industries, Inc. | 100,000 | (2,497 | ) | (2,532 | ) | ||||||||
|
| |||||||||||||
Total Short Sales | $ | (70,544 | ) | $ | (71,454 | ) | ||||||||
|
| |||||||||||||
| (1) | Payable for short sales includes $11 of dividends payable. |
BORROWINGS AND OTHER FINANCING TRANSACTIONS SUMMARY
The following is a summary by counterparty of the market value of Borrowings and Other Financing Transactions and collateral pledged as of June 30, 2014:
| Counterparty | Repurchase Agreement Proceeds to be Received | Payable for Reverse Repurchase Agreements | Payable for Sale-Buyback Transactions | Payable for Short Sales | Total Borrowings and Other Financing Transactions | Collateral Pledged | Net Exposure (2) | |||||||||||||||||||||
Prime Brokerage Agreement | ||||||||||||||||||||||||||||
FOB | $ | 0 | $ | 0 | $ | 0 | $ | (10,906 | ) | $ | (10,906 | ) | $ | 34,964 | $ | 24,058 | ||||||||||||
GSC | 0 | 0 | 0 | (52,390 | ) | (52,390 | ) | 89,437 | 37,047 | |||||||||||||||||||
MRJ | 0 | 0 | 0 | 0 | 0 | 1 | 1 | |||||||||||||||||||||
MSC | 0 | 0 | 0 | (8,158 | ) | (8,158 | ) | 33,964 | 25,806 | |||||||||||||||||||
UBS | 0 | 0 | 0 | 0 | 0 | 43 | 43 | |||||||||||||||||||||
|
|
|
|
|
|
|
| |||||||||||||||||||||
Total Borrowings and Other Financing Transactions | $ | 0 | $ | 0 | $ | 0 | $ | (71,454 | ) | |||||||||||||||||||
|
|
|
|
|
|
|
| |||||||||||||||||||||
| (2) | Net Exposure represents the net receivable/(payable) that would be due from/to the counterparty in the event of default. Exposure from borrowings and other financing transactions can only be netted across transactions governed under the same master agreement with the same legal entity. See Note 7, Principal Risks, in the Notes to Financial Statements for more information regarding master netting arrangements. |
(e) FINANCIAL DERIVATIVE INSTRUMENTS: EXCHANGE-TRADED OR CENTRALLY CLEARED
PURCHASED OPTIONS:
OPTIONS ON SECURITIES
| Description | Strike Price | Expiration Date | # of Contracts | Cost | Market Value | |||||||||||||
Put - CBOE Comcast Corp. | $ 50.000 | 10/18/2014 | 3,500 | $ | 844 | $ | 270 | |||||||||||
|
|
|
| |||||||||||||||
Total Purchased Options | $ | 844 | $ | 270 | ||||||||||||||
|
|
|
| |||||||||||||||
| See Accompanying Notes | ANNUAL REPORT | JUNE 30, 2014 | 77 |
Table of Contents
Schedule of Investments PIMCO EqS® Long/Short Fund (Cont.)
WRITTEN OPTIONS:
OPTIONS ON SECURITIES
| Description | Strike Price | Expiration Date | # of Contracts | Premiums (Received) | Market Value | |||||||||||||||
Call - CBOE Deckers Outdoor Corp. | $ | 80.000 | 07/19/2014 | 4,000 | $ | (1,008 | ) | $ | (2,620 | ) | ||||||||||
|
|
|
| |||||||||||||||||
Total Written Options | $ | (1,008 | ) | $ | (2,620 | ) | ||||||||||||||
|
|
|
| |||||||||||||||||
FINANCIAL DERIVATIVE INSTRUMENTS: EXCHANGE-TRADED OR CENTRALLY CLEARED SUMMARY
The following is a summary of the market value and variation margin of Exchange-Traded or Centrally Cleared Financial Derivative Instruments as of June 30, 2014:
| Financial Derivative Assets | Financial Derivative Liabilities | |||||||||||||||||||||||||||||||||
| Market Value | Variation Margin Asset | Total | Market Value | Variation Margin Liability | Total | |||||||||||||||||||||||||||||
| Purchased Options | Futures | Swap Agreements | Written Options | Futures | Swap Agreements | |||||||||||||||||||||||||||||
Total Exchange-Traded or Centrally Cleared | $ | 270 | $ | 0 | $ | 0 | $ | 270 | $ | (2,620 | ) | $ | 0 | $ | 0 | $ | (2,620 | ) | ||||||||||||||||
|
|
|
|
|
|
|
|
|
|
|
|
|
|
|
| |||||||||||||||||||
(f) FINANCIAL DERIVATIVE INSTRUMENTS: OVER THE COUNTER
FORWARD FOREIGN CURRENCY CONTRACTS:
| Counterparty | Settlement Month | Currency to be Delivered | Currency to be Received | Unrealized Appreciation/ (Depreciation) | ||||||||||||||||||||||||
| Asset | Liability | |||||||||||||||||||||||||||
BRC | 07/2014 | EUR | 5,922 | $ | 8,084 | $ | 0 | $ | (25 | ) | ||||||||||||||||||
CBK | 07/2014 | KRW | 10,526,731 | 10,277 | 0 | (120 | ) | |||||||||||||||||||||
| 07/2014 | $ | 20,991 | HKD | 162,757 | 2 | 0 | ||||||||||||||||||||||
DUB | 07/2014 | 8,049 | EUR | 5,922 | 60 | 0 | ||||||||||||||||||||||
| 08/2014 | EUR | 5,922 | $ | 8,050 | 0 | (60 | ) | |||||||||||||||||||||
FBF | 07/2014 | KRW | 23,842,949 | 22,943 | 0 | (606 | ) | |||||||||||||||||||||
| 07/2014 | $ | 8,138 | KRW | 8,374,002 | 133 | 0 | ||||||||||||||||||||||
GLM | 08/2014 | EUR | 16,823 | $ | 22,852 | 0 | (187 | ) | ||||||||||||||||||||
UAG | 07/2014 | HKD | 162,757 | 20,970 | 0 | (24 | ) | |||||||||||||||||||||
| 07/2014 | KRW | 46,816,549 | 43,077 | 0 | (3,161 | ) | ||||||||||||||||||||||
|
|
|
| |||||||||||||||||||||||||
Total Forward Foreign Currency Contracts |
| $ | 195 | $ | (4,183 | ) | ||||||||||||||||||||||
|
|
|
| |||||||||||||||||||||||||
WRITTEN OPTIONS:
TRANSACTIONS IN WRITTEN CALL AND PUT OPTIONS FOR THE PERIOD ENDED JUNE 30, 2014:
| # of Contracts | Notional | Premiums | ||||||||||
Balance at Beginning of Period | 0 | $ | 0 | $ | 0 | |||||||
Sales | 63,230 | 17,500 | (10,728 | ) | ||||||||
Closing Buys | (50,800 | ) | (17,500 | ) | 8,457 | |||||||
Expirations | (6,430 | ) | 0 | 1,085 | ||||||||
Exercised | (2,000 | ) | 0 | 178 | ||||||||
|
|
|
|
|
| |||||||
Balance at End of Period | 4,000 | $ | 0 | $ | (1,008 | ) | ||||||
|
|
|
|
|
| |||||||
| 78 | PIMCO EQUITY SERIES | See Accompanying Notes |
Table of Contents
June 30, 2014
FINANCIAL DERIVATIVE INSTRUMENTS: OVER THE COUNTER SUMMARY
The following is a summary by counterparty of the market value of OTC financial derivative instruments and collateral pledged as of June 30, 2014:
| (g) | Securities with an aggregate market value of $3,149 have been pledged as collateral for financial derivative instruments as governed by International Swaps and Derivatives Association, Inc. master agreements as of June 30, 2014. |
| Financial Derivative Assets | Financial Derivative Liabilities | |||||||||||||||||||||||||||||||||||||||||||||||
| Counterparty | Forward Foreign Currency Contracts | Purchased Options | Swap Agreements | Total Over the Counter | Forward Foreign Currency Contracts | Written Options | Swap Agreements | Total Over the Counter | Net Market Value of OTC Derivatives | Collateral (Received)/ Pledged | Net Exposure (1) | |||||||||||||||||||||||||||||||||||||
BRC | $ | 0 | $ | 0 | $ | 0 | $ | 0 | $ | (25 | ) | $ | 0 | $ | 0 | $ | (25 | ) | $ | (25 | ) | $ | 0 | $ | (25 | ) | ||||||||||||||||||||||
CBK | 2 | 0 | 0 | 2 | (120 | ) | 0 | 0 | (120 | ) | (118 | ) | 0 | (118 | ) | |||||||||||||||||||||||||||||||||
DUB | 60 | 0 | 0 | 60 | (60 | ) | 0 | 0 | (60 | ) | 0 | 0 | 0 | |||||||||||||||||||||||||||||||||||
FBF | 133 | 0 | 0 | 133 | (606 | ) | 0 | 0 | (606 | ) | (473 | ) | 280 | (193 | ) | |||||||||||||||||||||||||||||||||
GLM | 0 | 0 | 0 | 0 | (187 | ) | 0 | 0 | (187 | ) | (187 | ) | 0 | (187 | ) | |||||||||||||||||||||||||||||||||
UAG | 0 | 0 | 0 | 0 | (3,185 | ) | 0 | 0 | (3,185 | ) | (3,185 | ) | 2,869 | (316 | ) | |||||||||||||||||||||||||||||||||
|
|
|
|
|
|
|
|
|
|
|
|
|
|
|
|
| ||||||||||||||||||||||||||||||||
Total Over the Counter | $ | 195 | $ | 0 | $ | 0 | $ | 195 | $ | (4,183 | ) | $ | 0 | $ | 0 | $ | (4,183 | ) | ||||||||||||||||||||||||||||||
|
|
|
|
|
|
|
|
|
|
|
|
|
|
|
|
| ||||||||||||||||||||||||||||||||
| (1) | Net Exposure represents the net receivable/(payable) that would be due from/to the counterparty in the event of default. Exposure from OTC financial derivative instruments can only be netted across transactions governed under the same master agreement with the same legal entity. See Note 7, Principal Risks, in the Notes to Financial Statements for more information regarding master netting arrangements. |
FAIR VALUE OF FINANCIAL DERIVATIVE INSTRUMENTS
The following is a summary of the fair valuation of the Fund’s derivative instruments categorized by risk exposure. See Note 7, Principal Risks, in the Notes to Financial Statements on risks of the Fund.
Fair Values of Financial Derivative Instruments on the Statements of Assets and Liabilities as of June 30, 2014:
| Derivatives not accounted for as hedging instruments | ||||||||||||||||||||||||
| Commodity Contracts | Credit Contracts | Equity Contracts | Foreign Exchange Contracts | Interest Rate Contracts | Total | |||||||||||||||||||
Financial Derivative Instruments - Assets | ||||||||||||||||||||||||
Exchange-traded or centrally cleared | ||||||||||||||||||||||||
Purchased Options | $ | 0 | $ | 0 | $ | 270 | $ | 0 | $ | 0 | $ | 270 | ||||||||||||
|
|
|
|
|
|
|
|
|
|
|
| |||||||||||||
Over the counter | ||||||||||||||||||||||||
Forward Foreign Currency Contracts | $ | 0 | $ | 0 | $ | 0 | $ | 195 | $ | 0 | $ | 195 | ||||||||||||
|
|
|
|
|
|
|
|
|
|
|
| |||||||||||||
| $ | 0 | $ | 0 | $ | 270 | $ | 195 | $ | 0 | $ | 465 | |||||||||||||
|
|
|
|
|
|
|
|
|
|
|
| |||||||||||||
Financial Derivative Instruments - Liabilities | ||||||||||||||||||||||||
Exchange-traded or centrally cleared | ||||||||||||||||||||||||
Written Options | $ | 0 | $ | 0 | $ | 2,620 | $ | 0 | $ | 0 | $ | 2,620 | ||||||||||||
|
|
|
|
|
|
|
|
|
|
|
| |||||||||||||
Over the counter | ||||||||||||||||||||||||
Forward Foreign Currency Contracts | $ | 0 | $ | 0 | $ | 0 | $ | 4,183 | $ | 0 | $ | 4,183 | ||||||||||||
|
|
|
|
|
|
|
|
|
|
|
| |||||||||||||
| $ | 0 | $ | 0 | $ | 2,620 | $ | 4,183 | $ | 0 | $ | 6,803 | |||||||||||||
|
|
|
|
|
|
|
|
|
|
|
| |||||||||||||
| See Accompanying Notes | ANNUAL REPORT | JUNE 30, 2014 | 79 |
Table of Contents
Schedule of Investments PIMCO EqS® Long/Short Fund (Cont.)
June 30, 2014
The Effect of Financial Derivative Instruments on the Statements of Operations for the Period Ended June 30, 2014:
| Derivatives not accounted for as hedging instruments | ||||||||||||||||||||||||
| Commodity Contracts | Credit Contracts | Equity Contracts | Foreign Exchange Contracts | Interest Rate Contracts | Total | |||||||||||||||||||
Net Realized Gain (Loss) on Financial Derivative Instruments | ||||||||||||||||||||||||
Exchange-traded or centrally cleared | ||||||||||||||||||||||||
Purchased Options | $ | 0 | $ | 0 | $ | (5,923 | ) | $ | 0 | $ | 0 | $ | (5,923 | ) | ||||||||||
Written Options | 0 | 0 | 6,117 | 0 | 0 | 6,117 | ||||||||||||||||||
Futures | (568 | ) | 0 | (12,970 | ) | 0 | 0 | (13,538 | ) | |||||||||||||||
|
|
|
|
|
|
|
|
|
|
|
| |||||||||||||
| $ | (568 | ) | $ | 0 | $ | (12,776 | ) | $ | 0 | $ | 0 | $ | (13,344 | ) | ||||||||||
|
|
|
|
|
|
|
|
|
|
|
| |||||||||||||
Over the counter | ||||||||||||||||||||||||
Forward Foreign Currency Contracts | $ | 0 | $ | 0 | $ | 0 | $ | 731 | $ | 0 | $ | 731 | ||||||||||||
Purchased Options | 0 | 0 | 6 | 0 | 0 | 6 | ||||||||||||||||||
Written Options | 0 | 0 | 12 | 0 | 0 | 12 | ||||||||||||||||||
|
|
|
|
|
|
|
|
|
|
|
| |||||||||||||
| $ | 0 | $ | 0 | $ | 18 | $ | 731 | $ | 0 | $ | 749 | |||||||||||||
|
|
|
|
|
|
|
|
|
|
|
| |||||||||||||
| $ | (568 | ) | $ | 0 | $ | (12,758 | ) | $ | 731 | $ | 0 | $ | (12,595 | ) | ||||||||||
|
|
|
|
|
|
|
|
|
|
|
| |||||||||||||
Net Change in Unrealized (Depreciation) on Financial Derivative Instruments |
| |||||||||||||||||||||||
Exchange-traded or centrally cleared | ||||||||||||||||||||||||
Purchased Options | $ | 0 | $ | 0 | $ | (2,771 | ) | $ | 0 | $ | 0 | $ | (2,771 | ) | ||||||||||
Written Options | 0 | 0 | (1,612 | ) | 0 | 0 | (1,612 | ) | ||||||||||||||||
|
|
|
|
|
|
|
|
|
|
|
| |||||||||||||
| $ | 0 | $ | 0 | $ | (4,383 | ) | $ | 0 | $ | 0 | $ | (4,383 | ) | |||||||||||
|
|
|
|
|
|
|
|
|
|
|
| |||||||||||||
Over the counter | ||||||||||||||||||||||||
Forward Foreign Currency Contracts | $ | 0 | $ | 0 | $ | 0 | $ | (4,189 | ) | $ | 0 | $ | (4,189 | ) | ||||||||||
|
|
|
|
|
|
|
|
|
|
|
| |||||||||||||
| $ | 0 | $ | 0 | $ | (4,383 | ) | $ | (4,189 | ) | $ | 0 | $ | (8,572 | ) | ||||||||||
|
|
|
|
|
|
|
|
|
|
|
| |||||||||||||
FAIR VALUE MEASUREMENTS
The following is a summary of the fair valuations according to the inputs used as of June 30, 2014 in valuing the Fund’s assets and liabilities:
| Category and Subcategory | Level 1 | Level 2 | Level 3 | Fair Value at 06/30/2014 | ||||||||||||
Investments in Securities, at Value |
| |||||||||||||||
Common Stocks | ||||||||||||||||
France | ||||||||||||||||
Industrials | $ | 0 | $ | 29,501 | $ | 0 | $ | 29,501 | ||||||||
Greece | ||||||||||||||||
Industrials | 4,728 | 0 | 0 | 4,728 | ||||||||||||
Netherlands | ||||||||||||||||
Industrials | 341 | 0 | 0 | 341 | ||||||||||||
South Korea | ||||||||||||||||
Information Technology | 0 | 81,630 | 0 | 81,630 | ||||||||||||
United Kingdom | ||||||||||||||||
Health Care | 7,803 | 0 | 0 | 7,803 | ||||||||||||
United States | ||||||||||||||||
Consumer Discretionary | 198,667 | 0 | 0 | 198,667 | ||||||||||||
Consumer Staples | 60,463 | 0 | 0 | 60,463 | ||||||||||||
Energy | 24,073 | 0 | 0 | 24,073 | ||||||||||||
Health Care | 140,329 | 0 | 0 | 140,329 | ||||||||||||
Industrials | 25,925 | 0 | 0 | 25,925 | ||||||||||||
Information Technology | 166,669 | 0 | 0 | 166,669 | ||||||||||||
Materials | 90,356 | 0 | 0 | 90,356 | ||||||||||||
Real Estate Investment Trusts | ||||||||||||||||
United States | ||||||||||||||||
Financials | 145,347 | 0 | 0 | 145,347 | ||||||||||||
Short-Term Instruments | ||||||||||||||||
Short-Term Notes | 0 | 182,375 | 0 | 182,375 | ||||||||||||
U.S. Treasury Bills | 0 | 3,409 | 0 | 3,409 | ||||||||||||
| $ | 864,701 | $ | 296,915 | $ | 0 | $ | 1,161,616 | |||||||||
Investments in Affiliates, at Value |
| |||||||||||||||
Short-Term Instruments | ||||||||||||||||
Central Funds Used for Cash Management Purposes | $ | 402,024 | $ | 0 | $ | 0 | $ | 402,024 | ||||||||
Total Investments | $ | 1,266,725 | $ | 296,915 | $ | 0 | $ | 1,563,640 | ||||||||
| Category and Subcategory | Level 1 | Level 2 | Level 3 | Fair Value at 06/30/2014 | ||||||||||||
Short Sales, at Value - Liabilities |
| |||||||||||||||
Common Stocks | ||||||||||||||||
Argentina | ||||||||||||||||
Information Technology | $ | (5,256 | ) | $ | 0 | $ | 0 | $ | (5,256 | ) | ||||||
Bermuda | ||||||||||||||||
Energy | (9,988 | ) | 0 | 0 | (9,988 | ) | ||||||||||
United States | ||||||||||||||||
Consumer Discretionary | (40,814 | ) | 0 | 0 | (40,814 | ) | ||||||||||
Health Care | (3,174 | ) | 0 | 0 | (3,174 | ) | ||||||||||
Industrials | (2,946 | ) | 0 | 0 | (2,946 | ) | ||||||||||
Information Technology | (6,744 | ) | 0 | 0 | (6,744 | ) | ||||||||||
Utilities | (2,532 | ) | 0 | 0 | (2,532 | ) | ||||||||||
| $ | (71,454 | ) | $ | 0 | $ | 0 | $ | (71,454 | ) | |||||||
Financial Derivative Instruments - Assets |
| |||||||||||||||
Exchange-traded or centrally cleared | 0 | 270 | 0 | 270 | ||||||||||||
Over the counter | 0 | 195 | 0 | 195 | ||||||||||||
| $ | 0 | $ | 465 | $ | 0 | $ | 465 | |||||||||
Financial Derivative Instruments - Liabilities |
| |||||||||||||||
Exchange-traded or centrally cleared | 0 | (2,620 | ) | 0 | (2,620 | ) | ||||||||||
Over the counter | 0 | (4,183 | ) | 0 | (4,183 | ) | ||||||||||
| $ | 0 | $ | (6,803 | ) | $ | 0 | $ | (6,803 | ) | |||||||
Totals | $ | 1,195,271 | $ | 290,577 | $ | 0 | $ | 1,485,848 | ||||||||
There were no significant transfers between Level 1, 2, and 3 during the period ended June 30, 2014.
| 80 | PIMCO EQUITY SERIES | See Accompanying Notes |
Table of Contents
Consolidated Schedule of Investments PIMCO Emerging Multi-Asset Fund
June 30, 2014
| PRINCIPAL AMOUNT (000S) | MARKET VALUE (000S) | |||||||||||
| INVESTMENTS IN SECURITIES 1.7% | ||||||||||||
| SHORT-TERM INSTRUMENTS 1.7% | ||||||||||||
| REPURCHASE AGREEMENTS (c) 0.7% | ||||||||||||
| $ | 260 | |||||||||||
|
| |||||||||||
| U.S. TREASURY BILLS 1.0% | ||||||||||||
0.061% due 11/13/2014 - 12/11/2014 (a)(e) | $ | 362 | 362 | |||||||||
|
| |||||||||||
| Total Short-Term Instruments (Cost $622) | 622 | |||||||||||
|
| |||||||||||
| Total Investments in Securities (Cost $622) | 622 | |||||||||||
|
| |||||||||||
| SHARES | ||||||||||||
| INVESTMENTS IN AFFILIATES 99.2% | ||||||||||||
| MUTUAL FUNDS (b) 97.8% | ||||||||||||
| UNITED STATES 97.8% | ||||||||||||
PIMCO Emerging Local Bond Fund | 937,314 | 9,092 | ||||||||||
PIMCO Emerging Markets Bond Fund | 459,208 | 5,207 | ||||||||||
PIMCO Emerging Markets Corporate Bond Fund | 214,565 | 2,517 | ||||||||||
PIMCO EqS® Emerging Markets Fund | 2,104,973 | 19,050 | ||||||||||
|
| |||||||||||
Total Mutual Funds (Cost $36,813) |
| 35,866 | ||||||||||
|
| |||||||||||
| SHARES | MARKET VALUE (000S) | |||||||||||
| SHORT-TERM INSTRUMENTS 1.4% | ||||||||||||
| CENTRAL FUNDS USED FOR CASH MANAGEMENT PURPOSES 1.4% | ||||||||||||
PIMCO Short-Term Floating NAV Portfolio | 51,166 | $ | 512 | |||||||||
|
| |||||||||||
| Total Short-Term Instruments (Cost $512) | 512 | |||||||||||
|
| |||||||||||
| Total Investments in Affiliates (Cost $37,325) | 36,378 | |||||||||||
| Total Investments 100.9% (Cost $37,947) | $ | 37,000 | ||||||||||
Financial Derivative Instruments (d)(f) 0.2% (Cost or Premiums, net $50) | 70 | |||||||||||
| Other Assets and Liabilities, net (1.1%) | (392 | ) | ||||||||||
|
| |||||||||||
| Net Assets 100.0% | $ | 36,678 | ||||||||||
|
| |||||||||||
NOTES TO SCHEDULE OF INVESTMENTS (AMOUNTS IN THOUSANDS*, EXCEPT NUMBER OF CONTRACTS, UNITS, AND SHARES):
| * | A zero balance may reflect actual amounts rounding to less than one thousand. |
| (a) | Coupon represents a weighted average yield to maturity. |
| (b) | Institutional Class Shares of each Fund. |
BORROWINGS AND OTHER FINANCING TRANSACTIONS
(c) REPURCHASE AGREEMENTS:
| Counterparty | Lending Rate | Settlement Date | Maturity Date | Principal Amount | Collateralized By | Collateral Received, at Value | Repurchase Agreements, at Value | Repurchase Agreement Proceeds to be Received (1) | ||||||||||||||||||||
SSB | 0.000% | 06/30/2014 | 07/01/2014 | $ | 260 | Fannie Mae 2.110% due 11/07/2022 | $ | (268 | ) | $ | 260 | $ | 260 | |||||||||||||||
|
|
|
|
|
| |||||||||||||||||||||||
Total Repurchase Agreements |
| $ | (268 | ) | $ | 260 | $ | 260 | ||||||||||||||||||||
|
|
|
|
|
| |||||||||||||||||||||||
| (1) | Includes accrued interest. |
BORROWINGS AND OTHER FINANCING TRANSACTIONS SUMMARY
The following is a summary by counterparty of the market value of Borrowings and Other Financing Transactions and collateral (received)/pledged as of June 30, 2014:
| Counterparty | Repurchase Agreement Proceeds to be Received | Payable for Reverse Repurchase Agreements | Payable for Sale-Buyback Transactions | Payable for Short Sales | Total Borrowings and Other Financing Transactions | Collateral (Received)/Pledged | Net Exposure (2) | |||||||||||||||||||||
Global/Master Repurchase Agreement | ||||||||||||||||||||||||||||
SSB | $ | 260 | $ | 0 | $ | 0 | $ | 0 | $ | 260 | $ | (268 | ) | $ | (8 | ) | ||||||||||||
|
|
|
|
|
|
|
| |||||||||||||||||||||
Total Borrowings and Other Financing Transactions | $ | 260 | $ | 0 | $ | 0 | $ | 0 | ||||||||||||||||||||
|
|
|
|
|
|
|
| |||||||||||||||||||||
| (2) | Net Exposure represents the net receivable/(payable) that would be due from/to the counterparty in the event of default. Exposure from borrowings and other financing transactions can only be netted across transactions governed under the same master agreement with the same legal entity. See Note 7, Principal Risks, in the Notes to Financial Statements for more information regarding master netting arrangements. |
| See Accompanying Notes | ANNUAL REPORT | JUNE 30, 2014 | 81 |
Table of Contents
Consolidated Schedule of Investments PIMCO Emerging Multi-Asset Fund (Cont.)
(d) FINANCIAL DERIVATIVE INSTRUMENTS: EXCHANGE-TRADED OR CENTRALLY CLEARED
PURCHASED OPTIONS:
OPTIONS ON EXCHANGE-TRADED FUNDS
| Description | Strike Price | Expiration Date | # of Contracts | Cost | Market Value | |||||||||||||||
Put - CBOE iShares MSCI Emerging Markets Index Fund | $ | 39.000 | 11/22/2014 | 1,487 | $ | 129 | $ | 85 | ||||||||||||
|
|
|
| |||||||||||||||||
Total Purchased Options | $ | 129 | $ | 85 | ||||||||||||||||
|
|
|
| |||||||||||||||||
WRITTEN OPTIONS:
OPTIONS ON EXCHANGE-TRADED FUNDS
| Description | Strike Price | Expiration Date | # of Contracts | Premiums (Received) | Market Value | |||||||||||||||
Put - CBOE iShares MSCI Emerging Markets Index Fund | $ | 35.000 | 11/22/2014 | 2,230 | $ | (73 | ) | $ | (50 | ) | ||||||||||
|
|
|
| |||||||||||||||||
Total Written Options | $ | (73 | ) | $ | (50 | ) | ||||||||||||||
|
|
|
| |||||||||||||||||
FUTURES CONTRACTS:
| Description | Type | Expiration Month | # of Contracts | Unrealized Appreciation/ (Depreciation) | Variation Margin | |||||||||||||||||
| Asset | Liability | |||||||||||||||||||||
E-mini S&P 500 Index September Futures | Long | 09/2014 | 2 | $ | 1 | $ | 0 | $ | 0 | |||||||||||||
Mini MSCI Emerging Markets Index September Futures | Long | 09/2014 | 3 | (1 | ) | 0 | 0 | |||||||||||||||
U.S. Treasury 10-Year Note September Futures | Long | 09/2014 | 11 | 8 | 1 | 0 | ||||||||||||||||
|
|
|
|
|
| |||||||||||||||||
Total Futures Contracts | $ | 8 | $ | 1 | $ | 0 | ||||||||||||||||
|
|
|
|
|
| |||||||||||||||||
FINANCIAL DERIVATIVE INSTRUMENTS: EXCHANGE-TRADED OR CENTRALLY CLEARED SUMMARY
The following is a summary of the market value and variation margin of Exchange-Traded or Centrally Cleared Financial Derivative Instruments as of June 30, 2014:
| (e) | Securities with an aggregate market value of $360 have been pledged as collateral as of June 30, 2014 for equity short sales and equity options as governed by prime brokerage agreements and agreements governing listed equity option transactions. |
Cash of $42 has been pledged as collateral for exchange-traded and centrally cleared financial derivative instruments as of June 30, 2014. See Note 7, Principal Risks, in the Notes to Financial Statements for more information regarding master netting arrangements.
| Financial Derivative Assets | Financial Derivative Liabilities | |||||||||||||||||||||||||||||||||
| Market Value | Variation Margin Asset | Total | Market Value | Variation Margin Liability | Total | |||||||||||||||||||||||||||||
| Purchased Options | Futures | Swap Agreements | Written Options | Futures | Swap Agreements | |||||||||||||||||||||||||||||
Total Exchange-Traded or Centrally Cleared | $ | 85 | $ | 1 | $ | 0 | $ | 86 | $ | (50) | $ | 0 | $ | 0 | $ | (50) | ||||||||||||||||||
|
|
|
|
|
|
|
|
|
|
|
|
|
|
|
| |||||||||||||||||||
(f) FINANCIAL DERIVATIVE INSTRUMENTS: OVER THE COUNTER
FORWARD FOREIGN CURRENCY CONTRACTS:
| Counterparty | Settlement Month | Currency to be Delivered | Currency to be Received | Unrealized Appreciation/ (Depreciation) | ||||||||||||||||||||||||
| Asset | Liability | |||||||||||||||||||||||||||
BOA | 07/2014 | TWD | 21,842 | $ | 718 | $ | 0 | $ | (14 | ) | ||||||||||||||||||
| 07/2014 | $ | 160 | AUD | 173 | 3 | 0 | ||||||||||||||||||||||
| 08/2014 | CLP | 38,048 | $ | 68 | 0 | (1 | ) | |||||||||||||||||||||
BPS | 07/2014 | $ | 177 | HKD | 1,372 | 0 | 0 | |||||||||||||||||||||
BRC | 07/2014 | HUF | 149,344 | $ | 668 | 8 | 0 | |||||||||||||||||||||
| 07/2014 | TRY | 401 | 186 | 0 | (3 | ) | ||||||||||||||||||||||
| 07/2014 | $ | 455 | KRW | 494,036 | 33 | 0 | ||||||||||||||||||||||
| 07/2014 | 87 | PLN | 265 | 0 | 0 | |||||||||||||||||||||||
| 08/2014 | EUR | 15 | $ | 21 | 0 | 0 | ||||||||||||||||||||||
| 08/2014 | $ | 1 | IDR | 14,683 | 0 | 0 | ||||||||||||||||||||||
CBK | 07/2014 | 157 | CZK | 3,124 | 0 | (1 | ) | |||||||||||||||||||||
| 07/2014 | 151 | HUF | 33,401 | 0 | (3 | ) | ||||||||||||||||||||||
| 07/2014 | 54 | PLN | 165 | 0 | 0 | |||||||||||||||||||||||
| 82 | PIMCO EQUITY SERIES | See Accompanying Notes |
Table of Contents
June 30, 2014
| Counterparty | Settlement Month | Currency to be Delivered | Currency to be Received | Unrealized Appreciation/ (Depreciation) | ||||||||||||||||||||||||
| Asset | Liability | |||||||||||||||||||||||||||
DUB | 07/2014 | HKD | 3,180 | $ | 410 | $ | 0 | $ | 0 | |||||||||||||||||||
| 07/2014 | $ | 25 | IDR | 294,474 | 0 | 0 | ||||||||||||||||||||||
| 07/2014 | 31 | PHP | 1,393 | 1 | 0 | |||||||||||||||||||||||
| 08/2014 | 1 | IDR | 12,869 | 0 | 0 | |||||||||||||||||||||||
| 09/2014 | 16 | 190,301 | 0 | 0 | ||||||||||||||||||||||||
| 10/2014 | COP | 36,844 | $ | 19 | 0 | (1 | ) | |||||||||||||||||||||
FBF | 07/2014 | BRL | 895 | 406 | 1 | 0 | ||||||||||||||||||||||
| 07/2014 | KRW | 483,705 | 450 | 0 | (28 | ) | ||||||||||||||||||||||
| 07/2014 | THB | 10,889 | 335 | 0 | (1 | ) | ||||||||||||||||||||||
| 07/2014 | $ | 400 | BRL | 895 | 5 | 0 | ||||||||||||||||||||||
| 07/2014 | 1 | IDR | 12,932 | 0 | 0 | |||||||||||||||||||||||
GLM | 08/2014 | 543 | MXN | 7,156 | 6 | 0 | ||||||||||||||||||||||
| 09/2014 | MXN | 1,185 | $ | 91 | 0 | 0 | ||||||||||||||||||||||
HUS | 07/2014 | $ | 172 | TRY | 364 | 0 | 0 | |||||||||||||||||||||
JPM | 07/2014 | BRL | 369 | $ | 164 | 0 | (3 | ) | ||||||||||||||||||||
| 07/2014 | CNY | 437 | 70 | 0 | 0 | |||||||||||||||||||||||
| 07/2014 | CZK | 14,451 | 729 | 8 | 0 | |||||||||||||||||||||||
| 07/2014 | JPY | 19,327 | 190 | 0 | (1 | ) | ||||||||||||||||||||||
| 07/2014 | KRW | 270,704 | 260 | 0 | (7 | ) | ||||||||||||||||||||||
| 07/2014 | MYR | 331 | 103 | 0 | 0 | |||||||||||||||||||||||
| 07/2014 | PHP | 10,733 | 240 | 0 | (6 | ) | ||||||||||||||||||||||
| 07/2014 | TWD | 4,261 | 142 | 0 | (1 | ) | ||||||||||||||||||||||
| 07/2014 | $ | 166 | BRL | 369 | 1 | 0 | ||||||||||||||||||||||
| 07/2014 | 261 | CNY | 1,615 | 1 | 0 | |||||||||||||||||||||||
| 07/2014 | 190 | JPY | 19,327 | 1 | 0 | |||||||||||||||||||||||
| 07/2014 | 47 | TWD | 1,414 | 0 | 0 | |||||||||||||||||||||||
| 08/2014 | BRL | 180 | $ | 80 | 0 | (1 | ) | |||||||||||||||||||||
| 08/2014 | JPY | 19,327 | 190 | 0 | (1 | ) | ||||||||||||||||||||||
| 08/2014 | RUB | 6,123 | 176 | 0 | (3 | ) | ||||||||||||||||||||||
| 10/2014 | $ | 680 | ZAR | 7,459 | 10 | 0 | ||||||||||||||||||||||
| 10/2014 | ZAR | 7,803 | $ | 710 | 0 | (11 | ) | |||||||||||||||||||||
RBC | 07/2014 | HKD | 2,659 | 343 | 0 | 0 | ||||||||||||||||||||||
| 07/2014 | INR | 23,247 | 395 | 10 | 0 | |||||||||||||||||||||||
| 09/2014 | ILS | 233 | 67 | 0 | (1 | ) | ||||||||||||||||||||||
SCX | 07/2014 | HKD | 2,242 | 289 | 0 | 0 | ||||||||||||||||||||||
| 07/2014 | $ | 169 | MYR | 564 | 6 | 0 | ||||||||||||||||||||||
UAG | 07/2014 | BRL | 1,075 | $ | 477 | 0 | (9 | ) | ||||||||||||||||||||
| 07/2014 | IDR | 189,948 | 16 | 0 | 0 | |||||||||||||||||||||||
| 07/2014 | $ | 485 | BRL | 1,075 | 2 | (1 | ) | |||||||||||||||||||||
| 07/2014 | 96 | INR | 6,059 | 4 | 0 | |||||||||||||||||||||||
| 08/2014 | BRL | 368 | $ | 163 | 0 | (2 | ) | |||||||||||||||||||||
| 08/2014 | $ | 17 | IDR | 202,553 | 0 | 0 | ||||||||||||||||||||||
|
|
|
| |||||||||||||||||||||||||
Total Forward Foreign Currency Contracts |
| $ | 100 | $ | (99 | ) | ||||||||||||||||||||||
|
|
|
| |||||||||||||||||||||||||
WRITTEN OPTIONS:
TRANSACTIONS IN WRITTEN CALL AND PUT OPTIONS FOR THE PERIOD ENDED JUNE 30, 2014:
| # of Contracts | Premiums | |||||||
Balance at Beginning of Period | 2,273 | $ | (277 | ) | ||||
Sales | 3,323 | (122 | ) | |||||
Closing Buys | (3,366 | ) | 326 | |||||
Expirations | 0 | 0 | ||||||
Exercised | 0 | 0 | ||||||
|
|
|
| |||||
Balance at End of Period | 2,230 | $ | (73 | ) | ||||
|
|
|
| |||||
| See Accompanying Notes | ANNUAL REPORT | JUNE 30, 2014 | 83 |
Table of Contents
Consolidated Schedule of Investments PIMCO Emerging Multi-Asset Fund (Cont.)
SWAP AGREEMENTS:
CREDIT DEFAULT SWAPS ON SOVEREIGN ISSUES - SELL PROTECTION (1)
| Counterparty | Reference Entity | Fixed Deal Receive Rate | Maturity Date | Implied Credit Spread at June 30, 2014 (2) | Notional Amount (3) | Premiums Paid/(Received) | Unrealized Appreciation | Swap Agreements, at Value | ||||||||||||||||||||||||||
| Asset | Liability | |||||||||||||||||||||||||||||||||
| BOA | South Africa Government International Bond | 1.000% | 09/20/2014 | 0.388% | $ 600 | $ | 0 | $ | 1 | $ | 1 | $ | 0 | |||||||||||||||||||||
| CBK | Turkey Government International Bond | 1.000% | 09/20/2014 | 0.487% | 600 | 0 | 1 | 1 | 0 | |||||||||||||||||||||||||
| FBF | Russia Government International Bond | 1.000% | 09/20/2015 | 0.940% | 600 | (1 | ) | 1 | 0 | 0 | ||||||||||||||||||||||||
| RYL | China Government International Bond | 1.000% | 12/20/2016 | 0.299% | 100 | (5 | ) | 7 | 2 | 0 | ||||||||||||||||||||||||
|
|
|
|
|
|
|
| |||||||||||||||||||||||||||
| $ | (6 | ) | $ | 10 | $ | 4 | $ | 0 | ||||||||||||||||||||||||||
|
|
|
|
|
|
|
| |||||||||||||||||||||||||||
| (1) | If the Fund is a seller of protection and a credit event occurs, as defined under the terms of that particular swap agreement, the Fund will either (i) pay to the buyer of protection an amount equal to the notional amount of the swap and take delivery of the referenced obligation or underlying securities comprising the referenced index or (ii) pay a net settlement amount in the form of cash or securities equal to the notional amount of the swap less the recovery value of the referenced obligation or underlying securities comprising the referenced index. |
| (2) | Implied credit spreads, represented in absolute terms, utilized in determining the market value of credit default swap agreements on sovereign issues as of period end serve as an indicator of the current status of the payment/performance risk and represent the likelihood or risk of default for the credit derivative. The implied credit spread of a particular referenced entity reflects the cost of buying/selling protection and may include upfront payments required to be made to enter into the agreement. Wider credit spreads represent a deterioration of the referenced entity’s credit soundness and a greater likelihood or risk of default or other credit event occurring as defined under the terms of the agreement. |
| (3) | The maximum potential amount the Fund could be required to pay as a seller of credit protection or receive as a buyer of credit protection if a credit event occurs as defined under the terms of that particular swap agreement. |
TOTAL RETURN SWAPS ON INDICES
| Counterparty | Pay/Receive (4) | Underlying Reference | # of Units | Financing Rate | Maturity Date | Notional Amount | Unrealized (Depreciation) | Swap Agreements, at Value | ||||||||||||||||||||||||||
| Asset | Liability | |||||||||||||||||||||||||||||||||
| BOA | Receive | KOSPI 200 Index | 2,000,000 | 3-Month USD-LIBOR plus a specified spread | 09/11/2014 | KRW 524,934 | $ | (4 | ) | $ | 0 | $ | (4 | ) | ||||||||||||||||||||
|
|
|
|
|
| |||||||||||||||||||||||||||||
TOTAL RETURN SWAPS ON EXCHANGE-TRADED FUNDS AND SECURITIES
|
| |||||||||||||||||||||||||||||||||
| Counterparty | Pay/Receive (4) | Underlying Reference | # of Shares | Financing Rate | Maturity Date | Notional | Premiums Paid/ (Received) | Unrealized Appreciation/ (Depreciation) | Swap Agreements, at Value | |||||||||||||||||||||||||
| Asset | Liability | |||||||||||||||||||||||||||||||||
| BPS | Receive | iShares MSCI Emerging Markets ETF | 47,227 | 3-Month USD-LIBOR less a specified spread | 08/15/2014 | $ 3,121 | $ | $ | 33 | $ | 33 | $ | 0 | |||||||||||||||||||||
|
|
|
|
|
| |||||||||||||||||||||||||||||
Total Swap Agreements | $ | (6 | ) | $ | 39 | $ | 37 | $ | (4 | ) | ||||||||||||||||||||||||
|
|
|
|
|
|
|
| |||||||||||||||||||||||||||
| (4) | Receive represents that the Fund receives payments for any positive return on the underlying reference. The Fund makes payments for any negative return on such underlying reference. Pay represents that the Fund receives payments for any negative return on the underlying reference. The Fund makes payments for any positive return on such underlying reference. |
FINANCIAL DERIVATIVE INSTRUMENTS: OVER THE COUNTER SUMMARY
The following is a summary by counterparty of the market value of OTC financial derivative instruments and collateral (received)/pledged as of June 30, 2014:
| Financial Derivative Assets | Financial Derivative Liabilities | |||||||||||||||||||||||||||||||||||||||||||||
| Counterparty | Forward Foreign Currency Contracts | Purchased Options | Swap Agreements | Total Over the Counter | Forward Foreign Currency Contracts | Written Options | Swap Agreements | Total Over the Counter | Net Market Value of OTC Derivatives | Collateral (Received)/ Pledged | Net Exposure (5) | |||||||||||||||||||||||||||||||||||
BOA | $ | 3 | $ | 0 | $ | 1 | $ | 4 | $ | (15 | ) | $ | 0 | $ | (4 | ) | $ | (19 | ) | $ | (15 | ) | $ | 0 | $ | (15 | ) | |||||||||||||||||||
BPS | 0 | 0 | 33 | 33 | 0 | 0 | 0 | 0 | 33 | 0 | 33 | |||||||||||||||||||||||||||||||||||
BRC | 41 | 0 | 0 | 41 | (3 | ) | 0 | 0 | (3 | ) | 38 | 0 | 38 | |||||||||||||||||||||||||||||||||
CBK | 0 | 0 | 1 | 1 | (4 | ) | 0 | 0 | (4 | ) | (3 | ) | 0 | (3 | ) | |||||||||||||||||||||||||||||||
DUB | 1 | 0 | 0 | 1 | (1 | ) | 0 | 0 | (1 | ) | 0 | 0 | 0 | |||||||||||||||||||||||||||||||||
FBF | 6 | 0 | 0 | 6 | (29 | ) | 0 | 0 | (29 | ) | (23 | ) | 0 | (23 | ) | |||||||||||||||||||||||||||||||
GLM | 6 | 0 | 0 | 6 | 0 | 0 | 0 | 0 | 6 | 0 | 6 | |||||||||||||||||||||||||||||||||||
JPM | 21 | 0 | 0 | 21 | (34 | ) | 0 | 0 | (34 | ) | (13 | ) | 0 | (13 | ) | |||||||||||||||||||||||||||||||
RBC | 10 | 0 | 0 | 10 | (1 | ) | 0 | 0 | (1 | ) | 9 | 0 | 9 | |||||||||||||||||||||||||||||||||
RYL | 0 | 0 | 2 | 2 | 0 | 0 | 0 | 0 | 2 | 0 | 2 | |||||||||||||||||||||||||||||||||||
SCX | 6 | 0 | 0 | 6 | 0 | 0 | 0 | 0 | 6 | 0 | 6 | |||||||||||||||||||||||||||||||||||
UAG | 6 | 0 | 0 | 6 | (12 | ) | 0 | 0 | (12 | ) | (6 | ) | 0 | (6 | ) | |||||||||||||||||||||||||||||||
|
|
|
|
|
|
|
|
|
|
|
|
|
|
|
| |||||||||||||||||||||||||||||||
Total Over the Counter | $ | 100 | $ | 0 | $ | 37 | $ | 137 | $ | (99 | ) | $ | 0 | $ | (4 | ) | $ | (103 | ) | |||||||||||||||||||||||||||
|
|
|
|
|
|
|
|
|
|
|
|
|
|
|
| |||||||||||||||||||||||||||||||
| (5) | Net Exposure represents the net receivable/(payable) that would be due from/to the counterparty in the event of default. Exposure from OTC financial derivative instruments can only be netted across transactions governed under the same master agreement with the same legal entity. See Note 7, Principal Risks, in the Notes to Financial Statements for more information regarding master netting arrangements. |
| 84 | PIMCO EQUITY SERIES | See Accompanying Notes |
Table of Contents
June 30, 2014
FAIR VALUE OF FINANCIAL DERIVATIVE INSTRUMENTS
The following is a summary of the fair valuation of the Fund’s derivative instruments categorized by risk exposure. See Note 7, Principal Risks, in the Notes to Financial Statements on risks of the Fund.
Fair Values of Financial Derivative Instruments on the Consolidated Statements of Assets and Liabilities as of June 30, 2014:
| Derivatives not accounted for as hedging instruments | ||||||||||||||||||||||||
| Commodity Contracts | Credit Contracts | Equity Contracts | Foreign Exchange Contracts | Interest Rate Contracts | Total | |||||||||||||||||||
Financial Derivative Instruments - Assets | ||||||||||||||||||||||||
Exchange-traded or centrally cleared | ||||||||||||||||||||||||
Purchased Options | $ | 0 | $ | 0 | $ | 85 | $ | 0 | $ | 0 | $ | 85 | ||||||||||||
Futures | 0 | 0 | 0 | 0 | 1 | 1 | ||||||||||||||||||
|
|
|
|
|
|
|
|
|
|
|
| |||||||||||||
| $ | 0 | $ | 0 | $ | 85 | $ | 0 | $ | 1 | $ | 86 | |||||||||||||
|
|
|
|
|
|
|
|
|
|
|
| |||||||||||||
Over the counter | ||||||||||||||||||||||||
Forward Foreign Currency Contracts | $ | 0 | $ | 0 | $ | 0 | $ | 100 | $ | 0 | $ | 100 | ||||||||||||
Swap Agreements | 0 | 4 | 33 | 0 | 0 | 37 | ||||||||||||||||||
|
|
|
|
|
|
|
|
|
|
|
| |||||||||||||
| $ | 0 | $ | 4 | $ | 33 | $ | 100 | $ | 0 | $ | 137 | |||||||||||||
|
|
|
|
|
|
|
|
|
|
|
| |||||||||||||
| $ | 0 | $ | 4 | $ | 118 | $ | 100 | $ | 1 | $ | 223 | |||||||||||||
|
|
|
|
|
|
|
|
|
|
|
| |||||||||||||
Financial Derivative Instruments - Liabilities | ||||||||||||||||||||||||
Exchange-traded or centrally cleared | ||||||||||||||||||||||||
Written Options | $ | 0 | $ | 0 | $ | 50 | $ | 0 | $ | 0 | $ | 50 | ||||||||||||
|
|
|
|
|
|
|
|
|
|
|
| |||||||||||||
Over the counter | ||||||||||||||||||||||||
Forward Foreign Currency Contracts | $ | 0 | $ | 0 | $ | 0 | $ | 99 | $ | 0 | $ | 99 | ||||||||||||
Swap Agreements | 0 | 0 | 4 | 0 | 0 | 4 | ||||||||||||||||||
|
|
|
|
|
|
|
|
|
|
|
| |||||||||||||
| $ | 0 | $ | 0 | $ | 4 | $ | 99 | $ | 0 | $ | 103 | |||||||||||||
|
|
|
|
|
|
|
|
|
|
|
| |||||||||||||
| $ | 0 | $ | 0 | $ | 54 | $ | 99 | $ | 0 | $ | 153 | |||||||||||||
|
|
|
|
|
|
|
|
|
|
|
| |||||||||||||
The Effect of Financial Derivative Instruments on the Consolidated Statements of Operations for the Period Ended June 30, 2014:
| Derivatives not accounted for as hedging instruments | ||||||||||||||||||||||||
| Commodity Contracts | Credit Contracts | Equity Contracts | Foreign Exchange Contracts | Interest Rate Contracts | Total | |||||||||||||||||||
Net Realized Gain (Loss) on Financial Derivative Instruments | ||||||||||||||||||||||||
Exchange-traded or centrally cleared | ||||||||||||||||||||||||
Purchased Options | $ | 0 | $ | 0 | $ | (646 | ) | $ | 0 | $ | 0 | $ | (646 | ) | ||||||||||
Written Options | 0 | 0 | 311 | 0 | 0 | 311 | ||||||||||||||||||
Futures | 0 | 0 | (2 | ) | 0 | (5 | ) | (7 | ) | |||||||||||||||
|
|
|
|
|
|
|
|
|
|
|
| |||||||||||||
| $ | 0 | $ | 0 | $ | (337 | ) | $ | 0 | $ | (5 | ) | $ | (342 | ) | ||||||||||
|
|
|
|
|
|
|
|
|
|
|
| |||||||||||||
Over the counter | ||||||||||||||||||||||||
Forward Foreign Currency Contracts | $ | 0 | $ | 0 | $ | 0 | $ | (53 | ) | $ | 0 | $ | (53 | ) | ||||||||||
Purchased Options | 0 | 0 | 0 | 0 | (5 | ) | (5 | ) | ||||||||||||||||
Swap Agreements | 0 | 31 | 117 | 0 | 0 | 148 | ||||||||||||||||||
|
|
|
|
|
|
|
|
|
|
|
| |||||||||||||
| $ | 0 | $ | 31 | $ | 117 | $ | (53 | ) | $ | (5 | ) | $ | 90 | |||||||||||
|
|
|
|
|
|
|
|
|
|
|
| |||||||||||||
| $ | 0 | $ | 31 | $ | (220 | ) | $ | (53 | ) | $ | (10 | ) | $ | (252 | ) | |||||||||
|
|
|
|
|
|
|
|
|
|
|
| |||||||||||||
Net Change in Unrealized Appreciation (Depreciation) on Financial Derivative Instruments |
| |||||||||||||||||||||||
Exchange-traded or centrally cleared | ||||||||||||||||||||||||
Purchased Options | $ | 0 | $ | 0 | $ | 144 | $ | 0 | $ | 0 | $ | 144 | ||||||||||||
Written Options | 0 | 0 | (117 | ) | 0 | 0 | (117 | ) | ||||||||||||||||
Futures | 0 | 0 | 0 | 0 | 8 | 8 | ||||||||||||||||||
|
|
|
|
|
|
|
|
|
|
|
| |||||||||||||
| $ | 0 | $ | 0 | $ | 27 | $ | 0 | $ | 8 | $ | 35 | |||||||||||||
|
|
|
|
|
|
|
|
|
|
|
| |||||||||||||
Over the counter | ||||||||||||||||||||||||
Forward Foreign Currency Contracts | $ | 0 | $ | 0 | $ | 0 | $ | 100 | $ | 0 | $ | 100 | ||||||||||||
Swap Agreements | 0 | 5 | 29 | 0 | 0 | 34 | ||||||||||||||||||
|
|
|
|
|
|
|
|
|
|
|
| |||||||||||||
| $ | 0 | $ | 5 | $ | 29 | $ | 100 | $ | 0 | $ | 134 | |||||||||||||
|
|
|
|
|
|
|
|
|
|
|
| |||||||||||||
| $ | 0 | $ | 5 | $ | 56 | $ | 100 | $ | 8 | $ | 169 | |||||||||||||
|
|
|
|
|
|
|
|
|
|
|
| |||||||||||||
| See Accompanying Notes | ANNUAL REPORT | JUNE 30, 2014 | 85 |
Table of Contents
Consolidated Schedule of Investments PIMCO Emerging Multi-Asset Fund (Cont.)
June 30, 2014
FAIR VALUE MEASUREMENTS
The following is a summary of the fair valuations according to the inputs used as of June 30, 2014 in valuing the Fund’s assets and liabilities:
| Category and Subcategory | Level 1 | Level 2 | Level 3 | Fair Value at 06/30/2014 | ||||||||||||
Investments in Securities, at Value | ||||||||||||||||
Short-Term Instruments | ||||||||||||||||
Repurchase Agreements | $ | 0 | $ | 260 | $ | 0 | $ | 260 | ||||||||
U.S. Treasury Bills | 0 | 362 | 0 | 362 | ||||||||||||
| $ | 0 | $ | 622 | $ | 0 | $ | 622 | |||||||||
Investments in Affiliates, at Value | ||||||||||||||||
Mutual Funds | ||||||||||||||||
United States | 35,866 | 0 | 0 | 35,866 | ||||||||||||
Short-Term Instruments | ||||||||||||||||
Central Funds Used for Cash Management Purposes | 512 | 0 | 0 | 512 | ||||||||||||
| $ | 36,378 | $ | 0 | $ | 0 | $ | 36,378 | |||||||||
Total Investments | $ | 36,378 | $ | 622 | $ | 0 | $ | 37,000 | ||||||||
| Category and Subcategory | Level 1 | Level 2 | Level 3 | Fair Value at 06/30/2014 | ||||||||||||
Financial Derivative Instruments - Assets | ||||||||||||||||
Exchange-traded or centrally cleared | $ | 1 | $ | 85 | $ | 0 | $ | 86 | ||||||||
Over the counter | 0 | 137 | 0 | 137 | ||||||||||||
| $ | 1 | $ | 222 | $ | 0 | $ | 223 | |||||||||
Financial Derivative Instruments - Liabilities |
| |||||||||||||||
Exchange-traded or centrally cleared | 0 | (50 | ) | 0 | (50 | ) | ||||||||||
Over the counter | 0 | (103 | ) | 0 | (103 | ) | ||||||||||
| $ | 0 | $ | (153 | ) | $ | 0 | $ | (153 | ) | |||||||
Totals | $ | 36,379 | $ | 691 | $ | 0 | $ | 37,070 | ||||||||
There were no significant transfers between Level 1, 2, and 3 during the period ended June 30, 2014.
| 86 | PIMCO EQUITY SERIES | See Accompanying Notes |
Table of Contents
Consolidated Schedule of Investments PIMCO EqS Pathfinder Fund®
June 30, 2014
| SHARES | MARKET VALUE (000S) | |||||||||||
| INVESTMENTS IN SECURITIES 90.8% | ||||||||||||
| COMMON STOCKS 89.7% | ||||||||||||
| AUSTRALIA 0.7% | ||||||||||||
| INDUSTRIALS 0.7% | ||||||||||||
Spotless Group Holdings Ltd. (a) | 6,765,676 | $ | 10,527 | |||||||||
|
| |||||||||||
Total Australia | 10,527 | |||||||||||
|
| |||||||||||
| BELGIUM 2.3% | ||||||||||||
| INDUSTRIALS 2.3% | ||||||||||||
bpost S.A. | 1,314,147 | 33,200 | ||||||||||
|
| |||||||||||
Total Belgium | 33,200 | |||||||||||
|
| |||||||||||
| BERMUDA 4.8% | ||||||||||||
| ENERGY 4.8% | ||||||||||||
Avance Gas Holding Ltd. | 656,789 | 16,811 | ||||||||||
North Atlantic Drilling Ltd. | 1,845,308 | 19,597 | ||||||||||
Seadrill Ltd. | 845,024 | 33,489 | ||||||||||
|
| |||||||||||
| 69,897 | ||||||||||||
|
| |||||||||||
Total Bermuda | 69,897 | |||||||||||
|
| |||||||||||
| CANADA 0.7% | ||||||||||||
| ENERGY 0.7% | ||||||||||||
Cameco Corp. | 502,373 | 9,852 | ||||||||||
|
| |||||||||||
Total Canada | 9,852 | |||||||||||
|
| |||||||||||
| DENMARK 1.9% | ||||||||||||
| CONSUMER STAPLES 1.9% | ||||||||||||
Carlsberg A/S ‘B’ | 254,808 | 27,444 | ||||||||||
|
| |||||||||||
Total Denmark | 27,444 | |||||||||||
|
| |||||||||||
| FAROE ISLANDS 0.7% | ||||||||||||
| CONSUMER STAPLES 0.7% | ||||||||||||
Bakkafrost P/F | 501,539 | 9,768 | ||||||||||
|
| |||||||||||
Total Faroe Islands | 9,768 | |||||||||||
|
| |||||||||||
| FRANCE 7.7% | ||||||||||||
| CONSUMER DISCRETIONARY 2.4% | ||||||||||||
Eutelsat Communications S.A. | 614,214 | 21,343 | ||||||||||
JCDecaux S.A. | 353,448 | 13,201 | ||||||||||
|
| |||||||||||
| 34,544 | ||||||||||||
|
| |||||||||||
| CONSUMER STAPLES 4.6% | ||||||||||||
Carrefour S.A. | 786,120 | 28,988 | ||||||||||
Danone S.A. | 503,521 | 37,441 | ||||||||||
|
| |||||||||||
| 66,429 | ||||||||||||
|
| |||||||||||
| ENERGY 0.7% | ||||||||||||
Total S.A. | 146,247 | 10,581 | ||||||||||
|
| |||||||||||
Total France | 111,554 | |||||||||||
|
| |||||||||||
| GERMANY 2.1% | ||||||||||||
| HEALTH CARE 2.1% | ||||||||||||
Rhoen Klinikum AG | 917,073 | 30,278 | ||||||||||
|
| |||||||||||
Total Germany | 30,278 | |||||||||||
|
| |||||||||||
| SHARES | MARKET VALUE (000S) | |||||||||||
| HONG KONG 4.4% | ||||||||||||
| CONSUMER DISCRETIONARY 0.7% | ||||||||||||
Television Broadcasts Ltd. | 1,421,400 | $ | 9,225 | |||||||||
|
| |||||||||||
| FINANCIALS 3.2% | ||||||||||||
AIA Group Ltd. | 7,305,300 | 36,753 | ||||||||||
First Pacific Co. Ltd. | 8,806,500 | 9,899 | ||||||||||
|
| |||||||||||
| 46,652 | ||||||||||||
|
| |||||||||||
| INDUSTRIALS 0.5% | ||||||||||||
Jardine Matheson Holdings Ltd. | 72,500 | 4,302 | ||||||||||
Jardine Strategic Holdings Ltd. | 96,500 | 3,450 | ||||||||||
|
| |||||||||||
| 7,752 | ||||||||||||
|
| |||||||||||
Total Hong Kong | 63,629 | |||||||||||
|
| |||||||||||
| JAPAN 3.5% | ||||||||||||
| CONSUMER DISCRETIONARY 0.5% | ||||||||||||
Toyota Motor Corp. | 122,000 | 7,304 | ||||||||||
|
| |||||||||||
| CONSUMER STAPLES 0.8% | ||||||||||||
Kao Corp. | 252,100 | 9,929 | ||||||||||
Shiseido Co. Ltd. | 95,900 | 1,749 | ||||||||||
|
| |||||||||||
| 11,678 | ||||||||||||
|
| |||||||||||
| INDUSTRIALS 0.6% | ||||||||||||
Komatsu Ltd. | 349,000 | 8,101 | ||||||||||
|
| |||||||||||
| INFORMATION TECHNOLOGY 1.6% | ||||||||||||
Nintendo Co. Ltd. | 108,142 | 12,987 | ||||||||||
Tokyo Electron Ltd. - ADR | 575,320 | 9,832 | ||||||||||
|
| |||||||||||
| 22,819 | ||||||||||||
|
| |||||||||||
Total Japan | 49,902 | |||||||||||
|
| |||||||||||
| NETHERLANDS 4.4% | ||||||||||||
| CONSUMER STAPLES 1.7% | ||||||||||||
Corbion NV | 1,149,687 | 24,229 | ||||||||||
|
| |||||||||||
| FINANCIALS 2.0% | ||||||||||||
ING Groep NV - Dutch Certificate (a) | 2,054,664 | 28,832 | ||||||||||
|
| |||||||||||
| INFORMATION TECHNOLOGY 0.7% | ||||||||||||
Gemalto NV | 107,712 | 11,165 | ||||||||||
|
| |||||||||||
Total Netherlands | 64,226 | |||||||||||
|
| |||||||||||
| NORWAY 5.8% | ||||||||||||
| CONSUMER STAPLES 4.2% | ||||||||||||
Cermaq ASA | 983,149 | 13,544 | ||||||||||
Marine Harvest ASA | 3,435,710 | 46,882 | ||||||||||
|
| |||||||||||
| 60,426 | ||||||||||||
|
| |||||||||||
| ENERGY 1.6% | ||||||||||||
BW LPG Ltd. | 1,579,525 | 23,149 | ||||||||||
|
| |||||||||||
Total Norway | 83,575 | |||||||||||
|
| |||||||||||
| SHARES | MARKET VALUE (000S) | |||||||||||
| SINGAPORE 2.4% | ||||||||||||
| INDUSTRIALS 2.4% | ||||||||||||
ComfortDelGro Corp. Ltd. | 11,255,000 | $ | 22,570 | |||||||||
Keppel Corp. Ltd. | 1,347,300 | 11,663 | ||||||||||
|
| |||||||||||
| 34,233 | ||||||||||||
�� |
| |||||||||||
Total Singapore | 34,233 | |||||||||||
|
| |||||||||||
| SOUTH KOREA 0.3% | ||||||||||||
| CONSUMER DISCRETIONARY 0.3% | ||||||||||||
GS Home Shopping, Inc. | 19,542 | 4,658 | ||||||||||
|
| |||||||||||
Total South Korea | 4,658 | |||||||||||
|
| |||||||||||
| SWEDEN 1.8% | ||||||||||||
| INDUSTRIALS 1.8% | ||||||||||||
Loomis AB ‘B’ | 867,587 | 26,653 | ||||||||||
|
| |||||||||||
Total Sweden | 26,653 | |||||||||||
|
| |||||||||||
| SWITZERLAND 3.5% | ||||||||||||
| FINANCIALS 0.9% | ||||||||||||
Swiss Re AG | 143,654 | 12,774 | ||||||||||
|
| |||||||||||
| HEALTH CARE 1.4% | ||||||||||||
Roche Holding AG | 68,182 | 20,315 | ||||||||||
|
| |||||||||||
| INFORMATION TECHNOLOGY 1.2% | ||||||||||||
Logitech International S.A. | 1,340,844 | 17,426 | ||||||||||
|
| |||||||||||
Total Switzerland | 50,515 | |||||||||||
|
| |||||||||||
| UNITED KINGDOM 13.4% | ||||||||||||
| CONSUMER STAPLES 9.2% | ||||||||||||
British American Tobacco PLC | 716,844 | 42,654 | ||||||||||
Imperial Tobacco Group PLC | 1,034,793 | 46,553 | ||||||||||
Reckitt Benckiser Group PLC | 493,628 | 43,042 | ||||||||||
|
| |||||||||||
| 132,249 | ||||||||||||
|
| |||||||||||
| ENERGY 2.6% | ||||||||||||
BP PLC | 2,975,929 | 26,206 | ||||||||||
Ensco PLC ‘A’ | 215,606 | 11,981 | ||||||||||
|
| |||||||||||
| 38,187 | ||||||||||||
|
| |||||||||||
| FINANCIALS 1.6% | ||||||||||||
Barclays PLC | 3,594,497 | 13,094 | ||||||||||
Prudential PLC | 410,982 | 9,416 | ||||||||||
|
| |||||||||||
| 22,510 | ||||||||||||
|
| |||||||||||
Total United Kingdom | 192,946 | |||||||||||
|
| |||||||||||
| UNITED STATES 29.3% | ||||||||||||
| CONSUMER DISCRETIONARY 0.5% | ||||||||||||
Time Warner Cable, Inc. | 48,412 | 7,131 | ||||||||||
|
| |||||||||||
| CONSUMER STAPLES 7.4% | ||||||||||||
Altria Group, Inc. | 519,707 | 21,797 | ||||||||||
Lorillard, Inc. | 678,713 | 41,381 | ||||||||||
| See Accompanying Notes | ANNUAL REPORT | JUNE 30, 2014 | 87 |
Table of Contents
Consolidated Schedule of Investments PIMCO EqS Pathfinder Fund® (Cont.)
| SHARES | MARKET VALUE (000S) | |||||||||||
Philip Morris International, Inc. | 166,730 | $ | 14,057 | |||||||||
Reynolds American, Inc. | 317,763 | 19,177 | ||||||||||
Wal-Mart Stores, Inc. | 130,451 | 9,793 | ||||||||||
|
| |||||||||||
| 106,205 | ||||||||||||
|
| |||||||||||
| ENERGY 2.2% | ||||||||||||
Halliburton Co. | 223,427 | 15,865 | ||||||||||
National Oilwell Varco, Inc. | 200,424 | 16,505 | ||||||||||
|
| |||||||||||
| 32,370 | ||||||||||||
|
| |||||||||||
| FINANCIALS 8.5% | ||||||||||||
Alleghany Corp. (a) | 37,791 | 16,557 | ||||||||||
Berkshire Hathaway, Inc. ‘B’ (a) | 279,725 | 35,402 | ||||||||||
Genworth Financial, Inc. ‘A’ (a)(e) | 1,393,393 | 24,245 | ||||||||||
Navient Corp. | 731,952 | 12,963 | ||||||||||
PHH Corp. (a) | 374,455 | 8,605 | ||||||||||
SLM Corp. | 777,759 | 6,463 | ||||||||||
ViewPoint Financial Group, Inc. | 678,094 | 18,248 | ||||||||||
|
| |||||||||||
| 122,483 | ||||||||||||
|
| |||||||||||
| HEALTH CARE 2.2% | ||||||||||||
Allergan, Inc. | 43,309 | 7,329 | ||||||||||
Merck & Co., Inc. | 196,994 | 11,396 | ||||||||||
Pfizer, Inc. | 424,528 | 12,600 | ||||||||||
|
| |||||||||||
| 31,325 | ||||||||||||
|
| |||||||||||
| INDUSTRIALS 3.4% | ||||||||||||
3M Co. | 104,889 | 15,024 | ||||||||||
Brink’s Co. | 718,768 | 20,284 | ||||||||||
NOW, Inc. (a) | 383,198 | 13,875 | ||||||||||
|
| |||||||||||
| 49,183 | ||||||||||||
|
| |||||||||||
| SHARES | MARKET VALUE (000S) | |||||||||||
| INFORMATION TECHNOLOGY 4.8% | ||||||||||||
International Business Machines Corp. | 112,534 | $ | 20,399 | |||||||||
Microsoft Corp. (e) | 917,557 | 38,262 | ||||||||||
Oracle Corp. | 248,579 | 10,075 | ||||||||||
|
| |||||||||||
| 68,736 | ||||||||||||
|
| |||||||||||
| MATERIALS 0.3% | ||||||||||||
Rentech, Inc. (a) | 1,843,981 | 4,776 | ||||||||||
|
| |||||||||||
Total United States | 422,209 | |||||||||||
|
| |||||||||||
Total Common Stocks (Cost $1,088,486) | 1,295,066 | |||||||||||
|
| |||||||||||
| REAL ESTATE INVESTMENT TRUSTS 0.9% | ||||||||||||
| SINGAPORE 0.0% | ||||||||||||
| FINANCIALS 0.0% | ||||||||||||
Keppel REIT Management Ltd. | 478,884 | 492 | ||||||||||
|
| |||||||||||
Total Singapore | 492 | |||||||||||
|
| |||||||||||
| UNITED STATES 0.9% | ||||||||||||
| FINANCIALS 0.9% | ||||||||||||
NorthStar Realty Finance Corp. | 696,678 | 12,108 | ||||||||||
|
| |||||||||||
Total United States | 12,108 | |||||||||||
|
| |||||||||||
Total Real Estate Investment Trusts | 12,600 | |||||||||||
|
| |||||||||||
| RIGHTS 0.2% | ||||||||||||
| FRANCE 0.2% | ||||||||||||
| HEALTH CARE 0.2% | ||||||||||||
Sanofi - Exp. 12/31/2020 | 4,078,469 | 2,039 | ||||||||||
|
| |||||||||||
Total Rights (Cost $6,155) | 2,039 | |||||||||||
|
| |||||||||||
| PRINCIPAL AMOUNT (000S) | MARKET VALUE (000S) | |||||||||||
| SHORT-TERM INSTRUMENTS 0.0% | ||||||||||||
REPURCHASE AGREEMENTS (c) 0.0% |
| |||||||||||
| $ | 641 | |||||||||||
|
| |||||||||||
| U.S. TREASURY BILLS 0.0% | ||||||||||||
0.041% due 10/30/2014 - 11/06/2014 (b)(g) | $ | 328 | 328 | |||||||||
|
| |||||||||||
| Total Short-Term Instruments (Cost $969) | 969 | |||||||||||
|
| |||||||||||
| Total Investments in Securities (Cost $1,102,536) | 1,310,674 | |||||||||||
|
| |||||||||||
| SHARES | ||||||||||||
| INVESTMENTS IN AFFILIATES 9.3% | ||||||||||||
| SHORT-TERM INSTRUMENTS 9.3% | ||||||||||||
| CENTRAL FUNDS USED FOR CASH MANAGEMENT PURPOSES 9.3% | ||||||||||||
PIMCO Short-Term Floating NAV Portfolio | 13,377,774 | 133,858 | ||||||||||
|
| |||||||||||
| Total Short-Term Instruments (Cost $133,856) | 133,858 | |||||||||||
|
| |||||||||||
| Total Investments in Affiliates (Cost $133,856) | 133,858 | |||||||||||
| Total Investments 100.1% (Cost $1,236,392) | $ | 1,444,532 | ||||||||||
| Securities Sold Short (d) (0.9%) (Proceeds $11,966) | (13,273 | ) | ||||||||||
Financial Derivative Instruments (f) 0.3% (Cost or Premiums, net $0) | 4,938 | |||||||||||
| Other Assets and Liabilities, net 0.5% | 7,193 | |||||||||||
|
| |||||||||||
| Net Assets 100.0% | $ | 1,443,390 | ||||||||||
|
| |||||||||||
NOTES TO CONSOLIDATED SCHEDULE OF INVESTMENTS (AMOUNTS IN THOUSANDS*, EXCEPT NUMBER OF SHARES):
| * | A zero balance may reflect actual amounts rounding to less than one thousand. |
| (a) | Security did not produce income within the last twelve months. |
| (b) | Coupon represents a weighted average yield to maturity. |
BORROWINGS AND OTHER FINANCING TRANSACTIONS
(c) REPURCHASE AGREEMENTS:
| Counterparty | Lending Rate | Settlement Date | Maturity Date | Principal Amount | Collateralized By | Collateral Received, at Value | Repurchase Agreements, at Value | Repurchase Agreement Proceeds to be Received (1) | ||||||||||||||||||||
SSB | 0.000% | 06/30/2014 | 07/01/2014 | $ | 641 | Fannie Mae 2.110% due 11/07/2022 | $ | (654 | ) | $ | 641 | $ | 641 | |||||||||||||||
|
|
|
|
|
| |||||||||||||||||||||||
Total Repurchase Agreements |
| $ | (654 | ) | $ | 641 | $ | 641 | ||||||||||||||||||||
|
|
|
|
|
| |||||||||||||||||||||||
| (1) | Includes accrued interest. |
| 88 | PIMCO EQUITY SERIES | See Accompanying Notes |
Table of Contents
June 30, 2014
(d) SECURITIES SOLD SHORT:
| (e) | Securities with an aggregate market value of $14,726 and cash of $11,850 have been pledged as collateral as of June 30, 2014 for equity short sales and equity options as governed by prime brokerage agreements and agreements governing listed equity option transactions. |
| Counterparty | Description | Shares | Proceeds | Payable for Short Sales | ||||||||||
| Common Stocks | ||||||||||||||
| United States | ||||||||||||||
| Health Care | ||||||||||||||
| GSC | Valeant Pharmaceuticals International, Inc. | 21,655 | $ | (2,746 | ) | $ | (2,731 | ) | ||||||
| Information Technology | ||||||||||||||
| Applied Materials, Inc. | 467,473 | (9,220 | ) | (10,542 | ) | |||||||||
|
|
|
| |||||||||||
Total Short Sales | $ | (11,966 | ) | $ | (13,273 | ) | ||||||||
|
|
|
| |||||||||||
BORROWINGS AND OTHER FINANCING TRANSACTIONS SUMMARY
The following is a summary by counterparty of the market value of Borrowings and Other Financing Transactions and collateral (received)/pledged as of June 30, 2014:
| Counterparty | Repurchase Agreement Proceeds to be Received | Payable for Reverse Repurchase Agreements | Payable for Sale-Buyback Transactions | Payable for Short Sales | Total Borrowings and Other Financing Transactions | Collateral (Received)/Pledged | Net Exposure (2) | |||||||||||||||||||||
PIMCO EqS Pathfinder Fund® | ||||||||||||||||||||||||||||
Global/Master Repurchase Agreement | ||||||||||||||||||||||||||||
SSB | $ | 641 | $ | 0 | $ | 0 | $ | 0 | $ | 641 | $ | (654 | ) | $ | (13 | ) | ||||||||||||
Prime Brokerage Agreement | ||||||||||||||||||||||||||||
GSC | 0 | 0 | 0 | (13,273 | ) | (13,273 | ) | 25,402 | 12,129 | |||||||||||||||||||
MSC | 0 | 0 | 0 | 0 | 0 | 1,173 | 1,173 | |||||||||||||||||||||
|
|
|
|
|
|
|
| |||||||||||||||||||||
Total Borrowings and Other Financing Transactions | $ | 641 | $ | 0 | $ | 0 | $ | (13,273 | ) | |||||||||||||||||||
|
|
|
|
|
|
|
| |||||||||||||||||||||
| (2) | Net Exposure represents the net receivable/(payable) that would be due from/to the counterparty in the event of default. Exposure from borrowings and other financing transactions can only be netted across transactions governed under the same master agreement with the same legal entity. The Fund and Subsidiary are recognized as two separate legal entities. As such, exposure cannot be netted. See Note 7, Principal Risks, in the Notes to Financial Statements for more information regarding master netting arrangements. |
(f) FINANCIAL DERIVATIVE INSTRUMENTS: OVER THE COUNTER
FORWARD FOREIGN CURRENCY CONTRACTS:
| Counterparty | Settlement Month | Currency to be Delivered | Currency to be Received | Unrealized Appreciation/ (Depreciation) | ||||||||||||||||||||||||
| Asset | Liability | |||||||||||||||||||||||||||
BOA | 07/2014 | DKK | 90,087 | $ | 16,412 | $ | 0 | $ | (133 | ) | ||||||||||||||||||
| 07/2014 | $ | 54,533 | GBP | 32,127 | 449 | 0 | ||||||||||||||||||||||
| 08/2014 | GBP | 32,127 | $ | 54,519 | 0 | (448 | ) | |||||||||||||||||||||
BPS | 07/2014 | AUD | 4,710 | 4,352 | 0 | (89 | ) | |||||||||||||||||||||
| 07/2014 | CHF | 1,951 | 2,179 | 0 | (21 | ) | ||||||||||||||||||||||
| 07/2014 | GBP | 32,127 | 54,096 | 0 | (886 | ) | ||||||||||||||||||||||
| 07/2014 | NOK | 378,355 | 63,454 | 1,771 | 0 | |||||||||||||||||||||||
| 07/2014 | $ | 9,739 | HKD | 75,495 | 0 | (1 | ) | |||||||||||||||||||||
| 07/2014 | 3,236 | NOK | 19,530 | 2 | (54 | ) | ||||||||||||||||||||||
| 08/2014 | 2,180 | CHF | 1,951 | 22 | 0 | |||||||||||||||||||||||
| 08/2014 | 205 | NOK | 1,260 | 0 | 0 | |||||||||||||||||||||||
BRC | 07/2014 | KRW | 4,966,241 | $ | 4,570 | 0 | (335 | ) | ||||||||||||||||||||
| 07/2014 | PLN | 2,574 | 845 | 0 | (1 | ) | ||||||||||||||||||||||
| 07/2014 | $ | 2,453 | EUR | 1,800 | 12 | 0 | ||||||||||||||||||||||
| 07/2014 | 6,364 | HKD | 49,334 | 1 | (1 | ) | ||||||||||||||||||||||
| 07/2014 | 7,518 | JPY | 770,300 | 86 | 0 | |||||||||||||||||||||||
| 08/2014 | NOK | 259,491 | $ | 42,241 | 0 | (11 | ) | |||||||||||||||||||||
| 09/2014 | SGD | 29,488 | 23,434 | 0 | (216 | ) | ||||||||||||||||||||||
CBK | 07/2014 | NOK | 349,930 | 58,690 | 1,641 | 0 | ||||||||||||||||||||||
| 07/2014 | $ | 2,439 | CHF | 2,183 | 22 | 0 | ||||||||||||||||||||||
| 07/2014 | 18,977 | DKK | 103,670 | 63 | 0 | |||||||||||||||||||||||
| 07/2014 | 5,601 | HKD | 43,423 | 1 | (1 | ) | ||||||||||||||||||||||
| 08/2014 | DKK | 103,670 | $ | 18,981 | 0 | (63 | ) | |||||||||||||||||||||
| 08/2014 | GBP | 973 | 1,656 | 0 | (9 | ) | ||||||||||||||||||||||
| 08/2014 | NOK | 259,492 | 42,265 | 13 | 0 | |||||||||||||||||||||||
| 08/2014 | SEK | 46,399 | 6,898 | 0 | (44 | ) | ||||||||||||||||||||||
| See Accompanying Notes | ANNUAL REPORT | JUNE 30, 2014 | 89 |
Table of Contents
Consolidated Schedule of Investments PIMCO EqS Pathfinder Fund® (Cont.)
| Counterparty | Settlement Month | Currency to be Delivered | Currency to be Received | Unrealized Appreciation/ (Depreciation) | ||||||||||||||||||||||||
| Asset | Liability | |||||||||||||||||||||||||||
DUB | 07/2014 | CHF | 232 | $ | 259 | $ | 0 | $ | (2 | ) | ||||||||||||||||||
| 07/2014 | HKD | 22,378 | 2,886 | 0 | 0 | |||||||||||||||||||||||
| 07/2014 | $ | 58,305 | CAD | 63,516 | 1,220 | 0 | ||||||||||||||||||||||
| 07/2014 | 67,263 | EUR | 49,490 | 504 | 0 | |||||||||||||||||||||||
| 08/2014 | EUR | 47,894 | $ | 65,101 | 0 | (489 | ) | |||||||||||||||||||||
| 09/2014 | $ | 3,372 | ILS | 11,726 | 44 | 0 | ||||||||||||||||||||||
FBF | 07/2014 | 1,084 | EUR | 796 | 6 | 0 | ||||||||||||||||||||||
GLM | 07/2014 | DKK | 13,583 | $ | 2,481 | 0 | (14 | ) | ||||||||||||||||||||
| 07/2014 | EUR | 59,033 | 80,849 | 15 | 0 | |||||||||||||||||||||||
| 07/2014 | NOK | 44,787 | 7,458 | 156 | 0 | |||||||||||||||||||||||
| 07/2014 | $ | 2,925 | EUR | 2,144 | 10 | 0 | ||||||||||||||||||||||
| 07/2014 | 5,517 | JPY | 563,792 | 48 | 0 | |||||||||||||||||||||||
| 08/2014 | NOK | 1,260 | $ | 205 | 0 | 0 | ||||||||||||||||||||||
| 10/2014 | $ | 9,013 | ZAR | 99,030 | 136 | 0 | ||||||||||||||||||||||
JPM | 07/2014 | JPY | 6,762,082 | $ | 66,583 | 0 | (167 | ) | ||||||||||||||||||||
| 07/2014 | NOK | 25,781 | 4,294 | 91 | 0 | |||||||||||||||||||||||
| 07/2014 | $ | 6,507 | EUR | 4,803 | 70 | 0 | ||||||||||||||||||||||
| 07/2014 | 53,288 | JPY | 5,427,990 | 293 | 0 | |||||||||||||||||||||||
| 08/2014 | 66,598 | 6,762,082 | 168 | 0 | ||||||||||||||||||||||||
| 10/2014 | ZAR | 99,223 | $ | 9,042 | 0 | (125 | ) | |||||||||||||||||||||
MSC | 07/2014 | CAD | 63,516 | 59,399 | 0 | (126 | ) | |||||||||||||||||||||
| 07/2014 | HKD | 93,934 | 12,117 | 1 | 0 | |||||||||||||||||||||||
| 07/2014 | SEK | 46,399 | 6,981 | 37 | 0 | |||||||||||||||||||||||
| 07/2014 | $ | 4,738 | HKD | 36,735 | 0 | 0 | ||||||||||||||||||||||
| 08/2014 | 59,347 | CAD | 63,516 | 129 | 0 | |||||||||||||||||||||||
RBC | 07/2014 | AUD | 5,788 | $ | 5,325 | 0 | (132 | ) | ||||||||||||||||||||
SOG | 07/2014 | 37,435 | 35,293 | 0 | (6 | ) | ||||||||||||||||||||||
| 07/2014 | $ | 44,263 | AUD | 47,933 | 935 | 0 | ||||||||||||||||||||||
| 07/2014 | 140 | NOK | 845 | 0 | (3 | ) | ||||||||||||||||||||||
| 08/2014 | 35,207 | AUD | 37,435 | 6 | 0 | |||||||||||||||||||||||
UAG | 07/2014 | HKD | 431,764 | $ | 55,629 | 0 | (63 | ) | ||||||||||||||||||||
| 07/2014 | $ | 4,535 | HKD | 35,164 | 1 | 0 | ||||||||||||||||||||||
| 08/2014 | NOK | 259,492 | $ | 42,259 | 7 | 0 | ||||||||||||||||||||||
|
|
|
| |||||||||||||||||||||||||
Total Forward Foreign Currency Contracts |
| $ | 7,960 | $ | (3,440 | ) | ||||||||||||||||||||||
|
|
|
| |||||||||||||||||||||||||
WRITTEN OPTIONS:
AS OF JUNE 30, 2014 THERE WERE NO OPEN WRITTEN OPTIONS. TRANSACTIONS IN WRITTEN CALL AND PUT OPTIONS FOR THE PERIOD ENDED JUNE 30, 2014:
| # of Contracts | Premiums | |||||||
Balance at Beginning of Period | 13,266 | $ | (258 | ) | ||||
Sales | 10,739 | (1,201 | ) | |||||
Closing Buys | (11,632 | ) | 1,204 | |||||
Expirations | (12,373 | ) | 255 | |||||
Exercised | 0 | 0 | ||||||
|
|
|
| |||||
Balance at End of Period | 0 | $ | 0 | |||||
|
|
|
| |||||
SWAP AGREEMENTS:
TOTAL RETURN SWAPS ON SECURITIES
| Counterparty | Pay/Receive (1) | Underlying Reference | # of Shares | Financing Rate | Maturity Date | Notional | Unrealized Appreciation/ (Depreciation) | Swap Agreements, at Value | ||||||||||||||||||||||||||
| Asset | Liability | |||||||||||||||||||||||||||||||||
| BOA | Receive | Lancashire Holdings Ltd. | 1,904,203 | 1-Month USD-LIBOR plus a specified spread | 09/05/2014 | GBP | 12,320 | $ | 222 | $ | 222 | $ | 0 | |||||||||||||||||||||
Pay | Rentech Nitrogen Partners LP | 24,547 | 1-Month USD-LIBOR less a specified spread | 08/15/2014 | $ | 393 | (24 | ) | 0 | (24 | ) | |||||||||||||||||||||||
| CBK | Pay | Liberty Global PLC ‘A’ | 44,684 | 1-Month EUR-EURIBOR less a specified spread | 02/09/2015 | EUR | 1,407 | (49 | ) | 0 | (49 | ) | ||||||||||||||||||||||
Pay | Liberty Global PLC ‘C’ | 110,247 | 1-Month EUR-EURIBOR less a specified spread | 02/09/2015 | 3,368 | (51 | ) | 0 | (51 | ) | ||||||||||||||||||||||||
Receive | Ziggo NV | 195,814 | 1-Month EUR-EURIBOR plus a specified spread | 02/09/2015 | 6,559 | 74 | 74 | 0 | ||||||||||||||||||||||||||
| GST | Receive | AstraZeneca PLC | 114,031 | 1-Month USD-LIBOR plus a specified spread | 04/30/2015 | GBP | 4,969 | (23 | ) | 0 | (23 | ) | ||||||||||||||||||||||
| 90 | PIMCO EQUITY SERIES | See Accompanying Notes |
Table of Contents
June 30, 2014
| Counterparty | Pay/Receive (1) | Underlying Reference | # of Shares | Financing Rate | Maturity Date | Notional | Unrealized Appreciation/ (Depreciation) | Swap Agreements, at Value | ||||||||||||||||||||||||||
| Asset | Liability | |||||||||||||||||||||||||||||||||
| JPM | Pay | Expedia, Inc. | 55,616 | 1-Month USD-LIBOR less a specified spread | 04/29/2015 | $ | 4,160 | $ | (221 | ) | $ | 0 | $ | (221 | ) | |||||||||||||||||||
Receive | Liberty Ventures ‘A’ | 182,534 | 1-Month USD-LIBOR plus a specified spread | 04/29/2015 | 12,610 | 859 | 859 | 0 | ||||||||||||||||||||||||||
Pay | TripAdvisor, Inc. | 74,654 | 1-Month USD-LIBOR less a specified spread | 04/29/2015 | 7,765 | (348 | ) | 0 | (348 | ) | ||||||||||||||||||||||||
Receive | Covidien PLC | 82,476 | 1-Month USD-LIBOR plus a specified spread | 06/16/2015 | 7,150 | 286 | 286 | 0 | ||||||||||||||||||||||||||
Pay | Medtronic, Inc. | 78,847 | 1-Month USD-LIBOR less a specified spread | 06/16/2015 | 4,722 | (307 | ) | 0 | (307 | ) | ||||||||||||||||||||||||
|
|
|
|
|
| |||||||||||||||||||||||||||||
Total Swap Agreements | $ | 418 | $ | 1,441 | $ | (1,023 | ) | |||||||||||||||||||||||||||
|
|
|
|
|
| |||||||||||||||||||||||||||||
| (1) | Receive represents that the Fund receives payments for any positive return on the underlying reference. The Fund makes payments for any negative return on such underlying reference. Pay represents that the Fund receives payments for any negative return on the underlying reference. The Fund makes payments for any positive return on such underlying reference. |
FINANCIAL DERIVATIVE INSTRUMENTS: OVER THE COUNTER SUMMARY
The following is a summary by counterparty of the market value of OTC financial derivative instruments and collateral (received)/pledged as of June 30, 2014:
��
| (g) | Securities with an aggregate market value of $328 have been pledged as collateral for financial derivative instruments as governed by International Swaps and Derivatives Association, Inc. master agreements as of June 30, 2014. |
| Financial Derivative Assets | Financial Derivative Liabilities | |||||||||||||||||||||||||||||||||||||||||||||
| Counterparty | Forward Foreign Currency Contracts | Purchased Options | Swap Agreements | Total Over the Counter | Forward Foreign Currency Contracts | Written Options | Swap Agreements | Total Over the Counter | Net Market Value of OTC Derivatives | Collateral (Received)/ Pledged | Net Exposure (2) | |||||||||||||||||||||||||||||||||||
PIMCO EqS Pathfinder Fund® | ||||||||||||||||||||||||||||||||||||||||||||||
BOA | $ | 449 | $ | 0 | $ | 222 | $ | 671 | $ | (581 | ) | $ | 0 | $ | (24 | ) | $ | (605 | ) | $ | 66 | $ | (230 | ) | $ | (164 | ) | |||||||||||||||||||
BPS | 1,795 | 0 | 0 | 1,795 | (1,051 | ) | 0 | 0 | (1,051 | ) | 744 | (1,090 | ) | (346 | ) | |||||||||||||||||||||||||||||||
BRC | 99 | 0 | 0 | 99 | (564 | ) | 0 | 0 | (564 | ) | (465 | ) | 260 | (205 | ) | |||||||||||||||||||||||||||||||
CBK | 1,740 | 0 | 74 | 1,814 | (117 | ) | 0 | (100 | ) | (217 | ) | 1,597 | (1,600 | ) | (3 | ) | ||||||||||||||||||||||||||||||
DUB | 1,768 | 0 | 0 | 1,768 | (491 | ) | 0 | 0 | (491 | ) | 1,277 | (1,010 | ) | 267 | ||||||||||||||||||||||||||||||||
FBF | 6 | 0 | 0 | 6 | 0 | 0 | 0 | 0 | 6 | 0 | 6 | |||||||||||||||||||||||||||||||||||
GLM | 365 | 0 | 0 | 365 | (14 | ) | 0 | 0 | (14 | ) | 351 | (830 | ) | (479 | ) | |||||||||||||||||||||||||||||||
GST | 0 | 0 | 0 | 0 | 0 | 0 | (23 | ) | (23 | ) | (23 | ) | (600 | ) | (623 | ) | ||||||||||||||||||||||||||||||
JPM | 622 | 0 | 1,145 | 1,767 | (292 | ) | 0 | (876 | ) | (1,168 | ) | 599 | (280 | ) | 319 | |||||||||||||||||||||||||||||||
MSC | 167 | 0 | 0 | 167 | (126 | ) | 0 | 0 | (126 | ) | 41 | 0 | 41 | |||||||||||||||||||||||||||||||||
RBC | 0 | 0 | 0 | 0 | (132 | ) | 0 | 0 | (132 | ) | (132 | ) | 0 | (132 | ) | |||||||||||||||||||||||||||||||
SOG | 941 | 0 | 0 | 941 | (9 | ) | 0 | 0 | (9 | ) | 932 | (770 | ) | 162 | ||||||||||||||||||||||||||||||||
UAG | 8 | 0 | 0 | 8 | (63 | ) | 0 | 0 | (63 | ) | (55 | ) | 68 | 13 | ||||||||||||||||||||||||||||||||
|
|
|
|
|
|
|
|
|
|
|
|
|
|
|
| |||||||||||||||||||||||||||||||
Total Over the Counter | $ | 7,960 | $ | 0 | $ | 1,441 | $ | 9,401 | $ | (3,440 | ) | $ | 0 | $ | (1,023 | ) | $ | (4,463 | ) | |||||||||||||||||||||||||||
|
|
|
|
|
|
|
|
|
|
|
|
|
|
|
| |||||||||||||||||||||||||||||||
| (2) | Net Exposure represents the net receivable/(payable) that would be due from/to the counterparty in the event of default . Exposure from OTC derivatives can only be netted across transactions governed under the same master agreement with the same legal entity. The Fund and Subsidiary are recognized as two separate legal entities. As such, exposure cannot be netted. See note 7, Principal Risks, in the Notes to Financial Statements for more information regarding master netting agreements. |
FAIR VALUE OF FINANCIAL DERIVATIVE INSTRUMENTS
The following is a summary of the fair valuation of the Fund’s derivative instruments categorized by risk exposure. See Note 7, Principal Risks, in the Notes to Financial Statements on risks of the Fund.
Fair Values of Financial Derivative Instruments on the Consolidated Statements of Assets and Liabilities as of June 30, 2014:
| Derivatives not accounted for as hedging instruments | ||||||||||||||||||||||||
| Commodity Contracts | Credit Contracts | Equity Contracts | Foreign Exchange Contracts | Interest Rate Contracts | Total | |||||||||||||||||||
Financial Derivative Instruments - Assets | ||||||||||||||||||||||||
Over the counter | ||||||||||||||||||||||||
Forward Foreign Currency Contracts | $ | 0 | $ | 0 | $ | 0 | $ | 7,960 | $ | 0 | $ | 7,960 | ||||||||||||
Swap Agreements | 0 | 0 | 1,441 | 0 | 0 | 1,441 | ||||||||||||||||||
|
|
|
|
|
|
|
|
|
|
|
| |||||||||||||
| $ | 0 | $ | 0 | $ | 1,441 | $ | 7,960 | $ | 0 | $ | 9,401 | |||||||||||||
|
|
|
|
|
|
|
|
|
|
|
| |||||||||||||
Financial Derivative Instruments - Liabilities | ||||||||||||||||||||||||
Over the counter | ||||||||||||||||||||||||
Forward Foreign Currency Contracts | $ | 0 | $ | 0 | $ | 0 | $ | 3,440 | $ | 0 | $ | 3,440 | ||||||||||||
Swap Agreements | 0 | 0 | 1,023 | 0 | 0 | 1,023 | ||||||||||||||||||
|
|
|
|
|
|
|
|
|
|
|
| |||||||||||||
| $ | 0 | $ | 0 | $ | 1,023 | $ | 3,440 | $ | 0 | $ | 4,463 | |||||||||||||
|
|
|
|
|
|
|
|
|
|
|
| |||||||||||||
| See Accompanying Notes | ANNUAL REPORT | JUNE 30, 2014 | 91 |
Table of Contents
Consolidated Schedule of Investments PIMCO EqS Pathfinder Fund® (Cont.)
The Effect of Financial Derivative Instruments on the Consolidated Statements of Operations for the Period Ended June 30, 2014:
| Derivatives not accounted for as hedging instruments | ||||||||||||||||||||||||
| Commodity Contracts | Credit Contracts | Equity Contracts | Foreign Exchange Contracts | Interest Rate Contracts | Total | |||||||||||||||||||
Net Realized Gain (Loss) on Financial Derivative Instruments | ||||||||||||||||||||||||
Exchange-traded or centrally cleared | ||||||||||||||||||||||||
Purchased Options | $ | 0 | $ | 0 | $ | (256 | ) | $ | 0 | $ | 0 | $ | (256 | ) | ||||||||||
Written Options | 0 | 0 | 1,036 | 0 | 0 | 1,036 | ||||||||||||||||||
|
|
|
|
|
|
|
|
|
|
|
| |||||||||||||
| $ | 0 | $ | 0 | $ | 780 | $ | 0 | $ | 0 | $ | 780 | |||||||||||||
|
|
|
|
|
|
|
|
|
|
|
| |||||||||||||
Over the counter | ||||||||||||||||||||||||
Forward Foreign Currency Contracts | $ | 0 | $ | 0 | $ | 0 | $ | (30,967 | ) | $ | 0 | $ | (30,967 | ) | ||||||||||
Swap Agreements | 0 | 0 | 3,110 | 0 | 0 | 3,110 | ||||||||||||||||||
|
|
|
|
|
|
|
|
|
|
|
| |||||||||||||
| $ | 0 | $ | 0 | $ | 3,110 | $ | (30,967 | ) | $ | 0 | $ | (27,857 | ) | |||||||||||
|
|
|
|
|
|
|
|
|
|
|
| |||||||||||||
| $ | 0 | $ | 0 | $ | 3,890 | $ | (30,967 | ) | $ | 0 | $ | (27,077 | ) | |||||||||||
|
|
|
|
|
|
|
|
|
|
|
| |||||||||||||
Net Change in Unrealized Appreciation (Depreciation) on Financial Derivative Instruments |
| |||||||||||||||||||||||
Exchange-traded or centrally cleared | ||||||||||||||||||||||||
Purchased Options | $ | 0 | $ | 0 | $ | (730 | ) | $ | 0 | $ | 0 | $ | (730 | ) | ||||||||||
Written Options | 0 | 0 | (205 | ) | 0 | 0 | (205 | ) | ||||||||||||||||
|
|
|
|
|
|
|
|
|
|
|
| |||||||||||||
| $ | 0 | $ | 0 | $ | (935 | ) | $ | 0 | $ | 0 | $ | (935 | ) | |||||||||||
|
|
|
|
|
|
|
|
|
|
|
| |||||||||||||
Over the counter | ||||||||||||||||||||||||
Forward Foreign Currency Contracts | $ | 0 | $ | 0 | $ | 0 | $ | 2,388 | $ | 0 | $ | 2,388 | ||||||||||||
Swap Agreements | 0 | 0 | 2,036 | 0 | 0 | 2,036 | ||||||||||||||||||
|
|
|
|
|
|
|
|
|
|
|
| |||||||||||||
| $ | 0 | $ | 0 | $ | 2,036 | $ | 2,388 | $ | 0 | $ | 4,424 | |||||||||||||
|
|
|
|
|
|
|
|
|
|
|
| |||||||||||||
| $ | 0 | $ | 0 | $ | 1,101 | $ | 2,388 | $ | 0 | $ | 3,489 | |||||||||||||
|
|
|
|
|
|
|
|
|
|
|
| |||||||||||||
FAIR VALUE MEASUREMENTS
The following is a summary of the fair valuations according to the inputs used as of June 30, 2014 in valuing the Fund’s assets and liabilities:
| Category and Subcategory | Level 1 | Level 2 | Level 3 | Fair Value at 06/30/2014 | ||||||||||||
Investments in Securities, at Value | ||||||||||||||||
Common Stocks | ||||||||||||||||
Australia | ||||||||||||||||
Industrials | $ | 10,527 | $ | 0 | $ | 0 | $ | 10,527 | ||||||||
Belgium | ||||||||||||||||
Industrials | 33,200 | 0 | 0 | 33,200 | ||||||||||||
Bermuda | ||||||||||||||||
Energy | 36,408 | 33,489 | 0 | 69,897 | ||||||||||||
Canada | ||||||||||||||||
Energy | 9,852 | 0 | 0 | 9,852 | ||||||||||||
Denmark | ||||||||||||||||
Consumer Staples | 0 | 27,444 | 0 | 27,444 | ||||||||||||
Faroe Islands | ||||||||||||||||
Consumer Staples | 0 | 9,768 | 0 | 9,768 | ||||||||||||
France | ||||||||||||||||
Consumer Discretionary | 0 | 34,544 | 0 | 34,544 | ||||||||||||
Consumer Staples | 0 | 66,429 | 0 | 66,429 | ||||||||||||
Energy | 0 | 10,581 | 0 | 10,581 | ||||||||||||
Germany | ||||||||||||||||
Health Care | 0 | 30,278 | 0 | 30,278 | ||||||||||||
Hong Kong | ||||||||||||||||
Consumer Discretionary | 9,225 | 0 | 0 | 9,225 | ||||||||||||
Financials | 0 | 46,652 | 0 | 46,652 | ||||||||||||
Industrials | 0 | 7,752 | 0 | 7,752 | ||||||||||||
Japan | ||||||||||||||||
Consumer Discretionary | 0 | 7,304 | 0 | 7,304 | ||||||||||||
Consumer Staples | 0 | 11,678 | 0 | 11,678 | ||||||||||||
Industrials | 0 | 8,101 | 0 | 8,101 | ||||||||||||
Information Technology | 9,832 | 12,987 | 0 | 22,819 | ||||||||||||
Netherlands | ||||||||||||||||
Consumer Staples | 0 | 24,229 | 0 | 24,229 | ||||||||||||
Financials | 0 | 28,832 | 0 | 28,832 | ||||||||||||
Information Technology | 11,165 | 0 | 0 | 11,165 | ||||||||||||
Norway | ||||||||||||||||
Consumer Staples | 13,544 | 46,882 | 0 | 60,426 | ||||||||||||
Energy | 0 | 23,149 | 0 | 23,149 | ||||||||||||
| Category and Subcategory | Level 1 | Level 2 | Level 3 | Fair Value at 06/30/2014 | ||||||||||||
Singapore | ||||||||||||||||
Industrials | $ | 0 | $ | 34,233 | $ | 0 | $ | 34,233 | ||||||||
South Korea | ||||||||||||||||
Consumer Discretionary | 0 | 4,658 | 0 | 4,658 | ||||||||||||
Sweden | ||||||||||||||||
Industrials | 0 | 26,653 | 0 | 26,653 | ||||||||||||
Switzerland | ||||||||||||||||
Financials | 0 | 12,774 | 0 | 12,774 | ||||||||||||
Health Care | 0 | 20,315 | 0 | 20,315 | ||||||||||||
Information Technology | 0 | 17,426 | 0 | 17,426 | ||||||||||||
United Kingdom | ||||||||||||||||
Consumer Staples | 0 | 132,249 | 0 | 132,249 | ||||||||||||
Energy | 11,981 | 26,206 | 0 | 38,187 | ||||||||||||
Financials | 0 | 22,510 | 0 | 22,510 | ||||||||||||
United States | ||||||||||||||||
Consumer Discretionary | 7,131 | 0 | 0 | 7,131 | ||||||||||||
Consumer Staples | 106,205 | 0 | 0 | 106,205 | ||||||||||||
Energy | 32,370 | 0 | 0 | 32,370 | ||||||||||||
Financials | 122,483 | 0 | 0 | 122,483 | ||||||||||||
Health Care | 31,325 | 0 | 0 | 31,325 | ||||||||||||
Industrials | 49,183 | 0 | 0 | 49,183 | ||||||||||||
Information Technology | 68,736 | 0 | 0 | 68,736 | ||||||||||||
Materials | 4,776 | 0 | 0 | 4,776 | ||||||||||||
Real Estate Investment Trusts | ||||||||||||||||
Singapore | ||||||||||||||||
Financials | 0 | 492 | 0 | 492 | ||||||||||||
United States | ||||||||||||||||
Financials | 12,108 | 0 | 0 | 12,108 | ||||||||||||
Rights | ||||||||||||||||
France | ||||||||||||||||
Health Care | 2,039 | 0 | 0 | 2,039 | ||||||||||||
Short-Term Instruments | ||||||||||||||||
Repurchase Agreements | 0 | 641 | 0 | 641 | ||||||||||||
U.S. Treasury Bills | 0 | 328 | 0 | 328 | ||||||||||||
| $ | 582,090 | $ | 728,584 | $ | 0 | $ | 1,310,674 | |||||||||
| 92 | PIMCO EQUITY SERIES | See Accompanying Notes |
Table of Contents
June 30, 2014
| Category and Subcategory | Level 1 | Level 2 | Level 3 | Fair Value at 06/30/2014 | ||||||||||||
Investments in Affiliates, at Value | ||||||||||||||||
Short-Term Instruments | ||||||||||||||||
Central Funds Used for Cash Management Purposes | $ | 133,858 | $ | 0 | $ | 0 | $ | 133,858 | ||||||||
Total Investments | $ | 715,948 | $ | 728,584 | $ | 0 | $ | 1,444,532 | ||||||||
Short Sales, at Value - Liabilities | ||||||||||||||||
Common Stocks | ||||||||||||||||
United States | ||||||||||||||||
Health Care | (2,731 | ) | 0 | 0 | (2,731 | ) | ||||||||||
| Category and Subcategory | Level 1 | Level 2 | Level 3 | Fair Value at 06/30/2014 | ||||||||||||
Information Technology | $ | (10,542 | ) | $ | 0 | $ | 0 | $ | (10,542 | ) | ||||||
| $ | (13,273 | ) | $ | 0 | $ | 0 | $ | (13,273 | ) | |||||||
Financial Derivative Instruments - Assets |
| |||||||||||||||
Over the counter | $ | 0 | $ | 9,401 | $ | 0 | $ | 9,401 | ||||||||
Financial Derivative Instruments - Liabilities |
| |||||||||||||||
Over the counter | $ | 0 | $ | (4,463 | ) | $ | 0 | $ | (4,463 | ) | ||||||
Totals | $ | 702,675 | $ | 733,522 | $ | 0 | $ | 1,436,197 | ||||||||
There were assets and liabilities valued at $9,225 transferred from Level 2 to Level 1 during the period ended June 30, 2014. There were assets and liabilities valued at $62,131 transferred from Level 1 to Level 2 during the period ended June 30, 2014. There were no significant transfers between Level 2 and 3 during the period ended June 30, 2014.
| See Accompanying Notes | ANNUAL REPORT | JUNE 30, 2014 | 93 |
Table of Contents
1. ORGANIZATION
PIMCO Equity Series (the “Trust”) was established as a Delaware statutory trust on December 28, 2009. The Trust is registered under the Investment Company Act of 1940, as amended (the “Act”), as an open-end management investment company. Information presented in these financial statements pertains to the Institutional Class, Class P, Administrative Class, Class D, Class A, Class C and Class R shares of the seven funds (each a “Fund” and collectively the “Funds”) offered by the Trust. Pacific Investment Management Company LLC (“PIMCO” or “Manager”) serves as the investment adviser for the Funds.
2. SIGNIFICANT ACCOUNTING POLICIES
The following is a summary of significant accounting policies consistently followed by the Trust in the preparation of its financial statements in conformity with accounting principles generally accepted in the United States of America (“U.S. GAAP”). The preparation of financial statements in accordance with U.S. GAAP requires management to make estimates and assumptions that affect the reported amounts of assets and liabilities and disclosure of contingent assets and liabilities at the date of the financial statements and the reported amounts of increases and decreases in net assets from operations during the reporting period. Actual results could differ from those estimates.
(a) Securities Transactions and Investment Income Securities transactions are recorded as of the trade date for financial reporting purposes. Realized gains and losses from securities sold are recorded on the identified cost basis. Dividend income is recorded on the ex-dividend date, except certain dividends from foreign securities where the ex-dividend date may have passed, which are recorded as soon as the Fund is informed of the ex-dividend date. Interest income, adjusted for the accretion of discounts and amortization of premiums, is recorded on the accrual basis from settlement date. For convertible securities, premiums attributable to the conversion feature are not amortized. Estimated tax liabilities on certain foreign securities are recorded on an accrual basis and are reflected as components of interest income or net change in unrealized gain/loss on investments on the Statements of Operations, as appropriate. Tax liabilities realized as a result of such security sales are reflected as a component of net realized gain/loss on investments on the Statements of Operations. Income or short-term capital gain distributions received from underlying funds are recorded as dividend income. Long-term capital gain distributions received from underlying funds are recorded as realized gains.
Debt obligations may be placed on non-accrual status and related interest income may be reduced by ceasing current accruals and writing off interest receivable when the collection of all or a portion of interest
has become doubtful based on consistently applied procedures. A debt obligation is removed from non-accrual status when the issuer resumes interest payments or when collectability of interest is probable.
(b) Cash and Foreign Currency The functional and reporting currency for the Funds is the U.S. dollar. The market values of foreign securities, currency holdings and other assets and liabilities are translated into U.S. dollars based on the current exchange rates each business day. Purchases and sales of securities and income and expense items denominated in foreign currencies are translated into U.S. dollars at the exchange rate in effect on the transaction date. The Funds do not separately report the effects of changes in foreign exchange rates from changes in market prices on securities held. Such changes are included in net realized and net changes in unrealized gain or loss from investments on the Statements of Operations. The Funds may invest in foreign currency-denominated securities and may engage in foreign currency transactions either on a spot (cash) basis at the rate prevailing in the currency exchange market at the time or through a forward foreign currency contract (see financial derivative instruments). Realized foreign exchange gains or losses arising from sales of spot foreign currencies, currency gains or losses realized between the trade and settlement dates on securities transactions and the difference between the recorded amounts of dividends, interest, and foreign withholding taxes and the U.S. dollar equivalent of the amounts actually received or paid are included in net realized gain or loss on foreign currency transactions on the Statements of Operations. Net unrealized foreign exchange gains and losses arising from changes in foreign exchange rates on foreign denominated assets and liabilities other than investments in securities held at the end of the reporting period are included in net change in unrealized appreciation or depreciation on foreign currency assets and liabilities on the Statements of Operations.
(c) Multiclass Operations Each class offered by the Trust has equal rights as to assets and voting privileges (except that shareholders of a class have exclusive voting rights regarding any matter relating solely to that class of shares). Income and non-class specific expenses are allocated daily to each class on the basis of relative net assets. Realized and unrealized capital gains and losses are allocated daily based on the relative net assets of each class of the respective Fund. Class specific expenses, where applicable, currently include supervisory and administrative and distribution and servicing fees.
(d) Dividends and Distributions to Shareholders Dividends from net investment income, if any, of each Fund, except the PIMCO Balanced Income Fund, PIMCO Dividend and Income Builder Fund and PIMCO EqS® Dividend Fund, are declared and distributed to shareholders annually. Dividends from net investment income, if any, of the PIMCO Balanced Income Fund, PIMCO Dividend and Income Builder Fund and PIMCO EqS® Dividend Fund are declared daily and distributed to
| 94 | PIMCO EQUITY SERIES |
Table of Contents
June 30, 2014
shareholders quarterly. Net realized capital gains earned by each Fund, if any, will be distributed no less frequently than once each year.
Income dividends and capital gain distributions are determined in accordance with income tax regulations which may differ from U.S. GAAP. Differences between tax regulations and U.S. GAAP may cause timing differences between income and capital gain recognition. Examples of events that give rise to timing differences include wash sales, straddles and capital loss carryforwards. Further, the character of investment income and capital gains may be different for certain transactions under the two methods of accounting. Examples of characterization differences include the treatment of paydowns on mortgage-backed securities, swaps, foreign currency transactions and investments in passive foreign investment companies. As a result, income dividends and capital gain distributions declared during a fiscal period may differ significantly from the net investment income (loss) and realized gains (losses) reported on each Fund’s annual financial statements presented under U.S. GAAP.
Distributions classified as a tax basis return of capital, if any, are reflected on the accompanying Statements of Changes in Net Assets and have been recorded to paid in capital. In addition, other amounts have been reclassified between undistributed net investment income, accumulated undistributed net realized gains or losses and/or paid in capital to more appropriately conform financial accounting to tax characterizations of dividend distributions.
(e) Statement of Cash Flows U.S. GAAP requires entities providing financial statements that report both financial position and results of operations to also provide a statement of cash flows for each period for which results of operations are provided, but exempts investment companies meeting certain conditions. One of the conditions is that substantially all of the enterprise’s investments were carried at fair value during the period and classified as Level 1 or Level 2 in the fair value hierarchy in accordance with the requirements of U.S. GAAP. Another condition is that the enterprise had little or no debt, based on the average debt outstanding during the period, in relation to average total assets. Funds with certain degrees of borrowing activity, typically through the use of reverse repurchase agreements, sale-buyback transactions or short sale transactions have been determined to be at a level requiring a Statement of Cash Flows. Statements of Cash Flows, as applicable, have been prepared using the indirect method which requires net change in net assets resulting from operations to be adjusted to reconcile to net cash flows from operating activities.
(f) New Accounting Pronouncements In December 2011, the Financial Accounting Standards Board (“FASB”) issued an Accounting Standards Update (“ASU”) to enhance disclosures about financial instruments and derivative instruments that are subject to offsetting
(“netting”) on the Statements of Assets and Liabilities. This information will enable users of the entity’s financial statements to evaluate the effect or potential effect of netting arrangements on the entity’s financial position. The ASU is effective for interim or annual periods beginning on or after January 1, 2013. The financial statements have been modified to provide enhanced quantitative and qualitative disclosures surrounding counterparty exposure and master netting arrangements. See the Notes to Schedule of Investments and Note 7, Principal Risks for additional details.
In June 2013, the FASB issued an ASU providing updated guidance for assessing whether an entity is an investment company and for the measurement of noncontrolling ownership interests in other investment companies. This update is effective prospectively during interim or annual periods beginning on or after December 15, 2013. The PIMCO Balanced Income Fund has adopted the ASU for the fiscal year ended June 30, 2014 as it follows the investment company reporting requirements under U.S. GAAP and did not have an impact on the Fund’s financial statements. At this time, management is evaluating the ASU to determine whether it will impact the financial statements for the following funds: PIMCO Dividend and Income Builder Fund, PIMCO EqS® Dividend Fund, PIMCO EqS® Emerging Markets Fund, PIMCO EqS® Long/Short Fund, PIMCO Emerging Multi-Asset Fund, and PIMCO EqS Pathfinder Fund®.
In June 2014, the FASB issued an ASU that expands secured borrowing accounting for certain repurchase agreements. The ASU also sets forth additional disclosure requirements for certain transactions accounted for as sales, in order to provide financial statement users with information to compare to similar transactions accounted for as secured borrowings. The ASU is effective prospectively during interim or annual periods beginning after December 15, 2014. At this time, management is evaluating the implications of these changes on the financial statements.
3. INVESTMENT VALUATION AND FAIR VALUE MEASUREMENTS
(a) Investment Valuation Policies The Net Asset Value (“NAV”) of a Fund’s shares is valued as of the close of regular trading (normally 4:00 p.m., Eastern time) (the “NYSE Close”) on each day that the New York Stock Exchange (“NYSE”) is open (each a “Business Day”). Information that becomes known to a Fund or its agents after the NAV has been calculated on a particular day will not generally be used to retroactively adjust the price of a security or the NAV determined earlier that day.
For purposes of calculating the NAV, portfolio securities and other financial derivative instruments are valued on each Business Day using valuation methods as adopted by the Board of Trustees (the “Board”) of the Trust. The Board has formed a Valuation Committee whose function is to monitor the valuation of portfolio securities and other
| ANNUAL REPORT | JUNE 30, 2014 | 95 |
Table of Contents
Notes to Financial Statements (Cont.)
financial derivative instruments and, as required by the Trust’s valuation policies, determine in good faith the fair value of portfolio holdings after consideration of all relevant factors, including recommendations provided by the Adviser. The Board has delegated responsibility for applying the valuation methods to the investment adviser (the “Adviser”). The Adviser monitors the continual appropriateness of methods applied and determines if adjustments should be made in light of market factor changes and events affecting issuers.
Where market quotes are readily available, fair market value is generally determined on the basis of official closing prices or the last reported sales prices, or if no sales are reported, based on quotes obtained from a quotation reporting system, established market makers, or pricing services. Where market quotes are not readily available, portfolio securities and other financial derivative instruments are valued at fair value, as determined in good faith by the Board, its Valuation Committee, or the Adviser pursuant to instructions from the Board or its Valuation Committee. Market quotes are considered not readily available in circumstances where there is an absence of current or reliable market-based data (e.g., trade information, bid/ask information, or broker quotes), including where events occur after the close of the relevant market, but prior to the NYSE Close, that materially affect the values of a Fund’s securities or financial derivative instruments. In addition, market quotes are considered not readily available when, due to extraordinary circumstances, the exchanges or markets on which securities trade do not open for trading for the entire day and no other market prices are available. The Board has delegated to the Adviser, PIMCO, the responsibility for monitoring significant events that may materially affect the values of a Fund’s securities or financial derivative instruments and for determining whether the value of the applicable securities or financial derivative instruments should be re-evaluated in light of such significant events.
The Board has adopted methods for valuing securities and other financial derivative instruments that may require fair valuation under particular circumstances. The Adviser monitors the continual appropriateness of fair valuation methods applied and determines if adjustments should be made in light of market changes, events affecting the issuer, or other factors. If the Adviser determines that a fair valuation method may no longer be appropriate, another valuation method may be selected, or the Valuation Committee will take any appropriate action in accordance with procedures set forth by the Board. The Board reviews the appropriateness of the valuation methods from time to time and these methods may be amended or supplemented from time to time by the Valuation Committee.
In circumstances in which daily market quotes are not readily available, investments may be valued pursuant to guidelines established by the
Board. In the event that the security or asset cannot be valued pursuant to the established guidelines, the value of the security or other financial derivative instrument will be determined in good faith by the Valuation Committee of the Board, generally based upon recommendations provided by PIMCO. These methods may require subjective determinations about the value of a security. While the Trust’s policy is intended to result in a calculation of a Fund’s NAV that fairly reflects security values as of the time of pricing, the Trust cannot guarantee that values determined by the Board or persons acting at their direction would accurately reflect the price that a Fund could obtain for a security if it were to dispose of that security as of the time of pricing (for instance, in a forced or distressed sale). The prices used by a Fund may differ from the value that would be realized if the securities were sold.
(b) Fair Value Hierarchy U.S. GAAP describes fair market value as the price that a Fund would receive to sell an asset or pay to transfer a liability in an orderly transaction between market participants at the measurement date. It establishes a fair value hierarchy that prioritizes inputs to valuation methods and requires disclosure of the fair value hierarchy, separately for each major category of assets and liabilities, that segregates fair value measurements into levels (Level 1, 2, and 3). The inputs or methodology used for valuing securities are not necessarily an indication of the risk associated with investing in those securities. Levels 1, 2, and 3 of the fair value hierarchy are defined as follows:
| n | Level 1—Inputs using (unadjusted) quoted prices in active markets or exchanges for identical assets and liabilities. |
| n | Level 2—Significant other observable inputs, which may include, but are not limited to, quoted prices for similar assets or liabilities in markets that are active, quoted prices for identical or similar assets or liabilities in markets that are not active, inputs other than quoted prices that are observable for the assets or liabilities (such as interest rates, yield curves, volatilities, prepayment speeds, loss severities, credit risks and default rates) or other market corroborated inputs. |
| n | Level 3—Significant unobservable inputs based on the best information available in the circumstances, to the extent observable inputs are not available, which may include assumptions made by the Board or persons acting at their direction that are used in determining the fair value of investments. |
Assets or liabilities categorized as Level 1 or 2 as of period end have been transferred between Levels 1 and 2 since the prior period due to changes in the valuation method utilized in valuing the investments. Transfers from Level 1 to Level 2 are a result of a change, in the normal course of business, from the use of an exchange traded price or a trade price on the initial purchase date (Level 1) to valuation methods used by third-party pricing services including valuation adjustments applied
| 96 | PIMCO EQUITY SERIES |
Table of Contents
June 30, 2014
to certain securities that are solely traded on a foreign exchange to account for the market movement between the close of the foreign market and the close of the NYSE (Level 2). Transfers from Level 2 to Level 1 are a result of exchange traded products for which quoted prices from an active market were not available (Level 2) and have become available (Level 1). In accordance with the requirements of U.S. GAAP, the amounts of transfers between Levels 1 and 2 and transfers in and out of Level 3, if any, are disclosed in the Notes to Schedule of Investments for each respective Fund.
For fair valuations using significant unobservable inputs, U.S. GAAP requires a reconciliation of the beginning to ending balances for reported fair values that presents changes attributable to total realized and unrealized gains or losses, purchases and sales, and transfers in or out of the Level 3 category during the period. The end of period timing recognition is used for the transfers between Levels of the Fund’s assets and liabilities. Additionally, U.S. GAAP requires quantitative information regarding the significant unobservable inputs used in the determination of fair value of assets or liabilities categorized as Level 3 in the fair value hierarchy. In accordance with the requirements of U.S. GAAP, a fair value hierarchy, Level 3 reconciliation, and details of significant unobservable inputs, if any, have been included in the Notes to Schedule of Investments for each respective Fund.
(c) Valuation Techniques and the Fair Value Hierarchy
Level 1 and Level 2 trading assets and trading liabilities, at fair market value The valuation methods (or “techniques”) and significant inputs used in determining the fair market values of portfolio securities or financial derivative instruments categorized as Level 1 and Level 2 of the fair value hierarchy are as follows:
Fixed income securities including corporate, convertible and municipal bonds and notes, U.S. government agencies, U.S. treasury obligations, sovereign issues, bank loans, convertible preferred securities and non-U.S. bonds are normally valued by pricing service providers that use broker-dealer quotations, reported trades or valuation estimates from their internal pricing models. The service providers’ internal models use inputs that are observable such as issuer details, interest rates, yield curves, prepayment speeds, credit risks/spreads, default rates and quoted prices for similar assets. Securities that use similar valuation techniques and inputs as described above are categorized as Level 2 of the fair value hierarchy.
Fixed income securities purchased on a delayed-delivery basis or as a repurchase commitment in a sale-buyback transaction are marked to market daily until settlement at the forward settlement date and are categorized as Level 2 of the fair value hierarchy.
Mortgage-related and asset-backed securities are usually issued as separate tranches, or classes, of securities within each deal. These
securities are also normally valued by pricing service providers that use broker-dealer quotations or valuation estimates from their internal pricing models. The pricing models for these securities usually consider tranche-level attributes, current market data, estimated cash flows and market-based yield spreads for each tranche, and incorporate deal collateral performance, as available. Mortgage-related and asset-backed securities that use similar valuation techniques and inputs as described above are categorized as Level 2 of the fair value hierarchy.
Common stocks, exchange-traded funds, exchange-traded notes and financial derivative instruments, such as futures contracts or options on futures that are traded on a national securities exchange, are stated at the last reported sale or settlement price on the day of valuation. To the extent these securities are actively traded and valuation adjustments are not applied, they are categorized as Level 1 of the fair value hierarchy.
Investments initially valued in currencies other than the U.S. dollar are converted to the U.S. dollar using exchange rates obtained from pricing service providers. As a result, the NAV of a Fund’s shares may be affected by changes in the value of currencies in relation to the U.S. dollar. The value of securities traded in markets outside the United States or denominated in currencies other than the U.S. dollar may be affected significantly on a day that the NYSE is closed and the NAV may change on days when an investor is not able to purchase, redeem or exchange shares. Valuation adjustments may be applied to certain securities that are solely traded on a foreign exchange to account for the market movement between the close of the foreign market and the NYSE Close. These securities are valued using pricing service providers that consider the correlation of the trading patterns of the foreign security to the intraday trading in the U.S. markets for investments. Securities using these valuation adjustments are categorized as Level 2 of the fair value hierarchy. Preferred securities and other equities traded on inactive markets or valued by reference to similar instruments are also categorized as Level 2 of the fair value hierarchy.
Equity-linked securities are valued by referencing the last reported sale or settlement price of the linked referenced equity on the day of valuation. Foreign exchange adjustments are applied to the last reported price to convert the linked equity’s trading currency to the contract’s settling currency. These investments are categorized as Level 2 of the fair value hierarchy.
Investments in registered open-end investment companies will be valued based upon the NAVs of such investments and are categorized as Level 1 of the fair value hierarchy. Investments in unregistered open-end investment companies will be calculated based upon the NAVs of such investments and are considered Level 1 provided that the NAVs are observable, calculated daily and are the value at which both
| ANNUAL REPORT | JUNE 30, 2014 | 97 |
Table of Contents
Notes to Financial Statements (Cont.)
purchases and sales will be conducted. Investments in privately held investment funds with significant restrictions on redemption where the inputs to the NAVs are observable will be valued based upon the NAVs of such investments and are categorized as Level 2 of the fair value hierarchy.
Short-term investments having a maturity of 60 days or less and repurchase agreements are generally valued at amortized cost which approximates fair market value. These investments are categorized as Level 2 of the fair value hierarchy.
Equity exchange-traded options and over the counter financial derivative instruments, such as foreign currency contracts, options contracts, or swap agreements, derive their value from underlying asset prices, indices, reference rates, and other inputs or a combination of these factors. These contracts are normally valued by independent pricing service providers. Depending on the product and the terms of the transaction, financial derivative instruments can be valued by a pricing service provider using a series of techniques, including simulation pricing models. The pricing models use inputs that are observed from actively quoted markets such as issuer details, indices, spreads, interest rates, yield curves, dividends and exchange rates. Financial derivative instruments that use similar valuation techniques and inputs as described above are categorized as Level 2 of the fair value hierarchy.
Centrally cleared swaps listed or traded on a multilateral or trade facility platform, such as a registered exchange, are valued at the daily settlement price determined by the respective exchange. For centrally cleared credit default swaps the clearing facility requires its members to provide actionable price levels across complete term structures. These levels along with external third-party prices are used to produce daily settlement prices. These securities are categorized as Level 2 of the fair value hierarchy. Centrally cleared interest rate swaps are valued using a pricing model that references the underlying rates including the overnight index swap rate and London Interbank Offered Rate (“LIBOR”) forward rate to produce the daily settlement price. These securities are categorized as Level 2 of the fair value hierarchy.
Level 3 trading assets and trading liabilities, at fair value When a fair valuation method is applied by PIMCO that uses significant unobservable inputs, securities will be priced by a method that the Board or persons acting at their direction believe reflects fair value and are categorized as Level 3 of the fair value hierarchy. The valuation techniques and significant inputs used in determining the fair values of portfolio assets and liabilities categorized as Level 3 of the fair value hierarchy are as follows:
Benchmark pricing procedures set the base price of a fixed income security and subsequently adjust the price proportionally to market
value changes of a pre-determined security deemed to be comparable in duration, generally a U.S. Treasury or sovereign note based on country of issuance. The base price may be a broker-dealer quote, transaction price, or an internal value as derived by analysis of market data. The base price of the security may be reset on a periodic basis based on the availability of market data and procedures approved by the Valuation Committee. Significant changes in the unobservable inputs of the benchmark pricing process (the base price) would result in direct and proportional changes in the fair value of the security. These securities are categorized as Level 3 of the fair value hierarchy. The validity of the fair value is reviewed by PIMCO on a periodic basis and may be amended as the availability of market data indicates a material change.
If third-party evaluated vendor pricing is not available or not deemed to be indicative of fair value, the investment advisor may elect to obtain indicative market quotations (“broker quotes”) directly from the broker-dealer or passed through from a third-party vendor. In the event that fair value is based upon a single sourced broker quote, these securities are categorized as Level 3 of the fair value hierarchy. Broker quotes are typically received from established market participants. Although independently received, the investment advisor does not have the transparency to view the underlying inputs which support the market quotation. Significant changes in the broker quote would have direct and proportional changes in the fair value of the security.
4. SECURITIES AND OTHER INVESTMENTS
(a) Investments in Securities
Equity-Linked Securities Certain Funds may purchase equity-linked securities, also known as participation notes, equity swaps, and zero strike calls and warrants. Equity-linked securities are primarily used by a Fund as an alternative means to more efficiently and effectively access what is generally an emerging securities market. A Fund deposits cash with its custodian (or broker, if legally permitted) in an amount near or equal to the selling price of the underlying security in exchange for an equity-linked security. Upon sale, a Fund receives cash from the broker or custodian equal to the value of the underlying security. Aside from market risk of the underlying securities, there is a risk of default by the counterparty to the transaction. In the event of insolvency of the counterparty, a Fund might be unable to obtain its expected benefit. In addition, while a Fund will seek to enter into such transactions only with parties that are capable of entering into closing transactions with the Fund, there can be no assurance that the Fund will be able to close out such a transaction with the counterparty or obtain an offsetting position with any counterparty, at any time prior to the end of the term of the underlying agreement. This may impair a Fund’s ability to enter into other transactions at a time when doing so might be advantageous.
| 98 | PIMCO EQUITY SERIES |
Table of Contents
June 30, 2014
Loan Participations and Assignments Certain Funds may invest in direct debt instruments which are interests in amounts owed to lenders or lending syndicates by corporate, governmental, or other borrowers. A Fund’s investments in loans may be in the form of participations in loans or assignments of all or a portion of loans from third parties. A loan is often administered by a bank or other financial institution (the “lender”) that acts as agent for all holders. The agent administers the terms of the loan, as specified in the loan agreement. A Fund may invest in multiple series or tranches of a loan, which may have varying terms and carry different associated risks. A Fund generally has no right to enforce compliance with the terms of the loan agreement with the borrower. As a result, a Fund may be subject to the credit risk of both the borrower and the lender that is selling the loan agreement. When a Fund purchases assignments from lenders it acquires direct rights against the borrower of the loan. These loans may include participations in bridge loans, which are loans taken out by borrowers for a short period (typically less than one year) pending arrangement of more permanent financing through, for example, the issuance of bonds, frequently high yield bonds issued for the purpose of acquisitions. Certain Funds may also enter into unfunded loan commitments, which are contractual obligations for future funding.
Unfunded loan commitments may include revolving credit facilities, which may obligate Funds to supply additional cash to the borrower on demand. Unfunded loan commitments represent a future obligation in full, even though a percentage of the committed amount may not be utilized by the borrower. When investing in a loan participation, a Fund has the right to receive payments of principal, interest and any fees to which it is entitled only from the lender selling the loan agreement and only upon receipt of payments by the lender from the borrower. A Fund may receive a commitment fee based on the undrawn portion of the underlying line of credit portion of a loan. In certain circumstances, a Fund may receive a penalty fee upon the prepayment of a loan by a borrower. Fees earned or paid are recorded as a component of interest income or interest expense, respectively, on the Statements of Operations. As of June 30, 2014, the Funds had no unfunded loan commitments outstanding.
Mortgage-Related and Other Asset-Backed Securities Certain Funds may invest in mortgage-related and other asset-backed securities. These securities include mortgage pass-through securities, collateralized mortgage obligations, commercial mortgage-backed securities, asset-backed securities, and other securities that directly or indirectly represent a participation in, or are secured by and payable from, mortgage loans on real property. Mortgage-related and other asset-backed securities are interests in pools of loans or other receivables. Mortgage-related securities are created from pools of residential or commercial mortgage loans, including mortgage loans
made by savings and loan institutions, mortgage bankers, commercial banks and others. Asset-backed securities are created from many types of assets, including auto loans, credit card receivables, home equity loans, and student loans. These securities provide a monthly payment which consists of both interest and principal. Interest may be determined by fixed or adjustable rates. The rate of prepayments on underlying mortgages will affect the price and volatility of a mortgage-related security, and may have the effect of shortening or extending the effective duration of the security relative to what was anticipated at the time of purchase. The timely payment of principal and interest of certain mortgage-related securities is guaranteed with the full faith and credit of the U.S. Government. Pools created and guaranteed by non-governmental issuers, including government-sponsored corporations, may be supported by various forms of insurance or guarantees, but there can be no assurance that private insurers or guarantors can meet their obligations under the insurance policies or guarantee arrangements.
Collateralized Mortgage Obligations (“CMOs”) are debt obligations of a legal entity that are collateralized by mortgages and divided into classes. CMOs are structured into multiple classes, often referred to as “tranches,” with each class bearing a different stated maturity and entitled to a different schedule for payments of principal and interest, including prepayments. Commercial Mortgage-Backed Securities (“CMBS”) include securities that reflect an interest in, and are secured by, mortgage loans on commercial real property. Many of the risks of investing in CMBS reflect the risks of investing in the real estate securing the underlying mortgage loans. These risks reflect the effects of local and other economic conditions on real estate markets, the ability of tenants to make loan payments, and the ability of a property to attract and retain tenants. CMOs and CMBS may be less liquid and may exhibit greater price volatility than other types of mortgage-related or asset-backed securities.
Collateralized Debt Obligations (“CDOs”) include Collateralized Bond Obligations (“CBOs”), Collateralized Loan Obligations (“CLOs”) and other similarly structured securities. CBOs and CLOs are types of asset-backed securities. A CBO is a trust which is backed by a diversified pool of high risk, below investment grade fixed income securities. A CLO is a trust typically collateralized by a pool of loans, which may include, among others, domestic and foreign senior secured loans, senior unsecured loans, and subordinate corporate loans, including loans that may be rated below investment grade or equivalent unrated loans. The risks of an investment in a CDO depend largely on the type of the collateral securities and the class of the CDO in which a Portfolio invests. CDOs carry additional risks including, but not limited to, (i) the possibility that distributions from collateral securities will not be adequate to make interest or other payments, (ii) the collateral may
| ANNUAL REPORT | JUNE 30, 2014 | 99 |
Table of Contents
Notes to Financial Statements (Cont.)
decline in value or default, (iii) a Portfolio may invest in CDOs that are subordinate to other classes, and (iv) the complex structure of the security may not be fully understood at the time of investment and may produce disputes with the issuer or unexpected investment results.
Payment In-Kind Securities Certain Funds may invest in payment in-kind securities (“PIKs”). PIKs may give the issuer the option at each interest payment date of making interest payments in either cash or additional debt securities. Those additional debt securities usually have the same terms, including maturity dates and interest rates, and associated risks as the original bonds. The daily market quotations of the original bonds may include the accrued interest (referred to as a dirty price) and require a pro-rata adjustment from the unrealized appreciation or depreciation on investments to interest receivable on the Statements of Assets and Liabilities.
U.S. Government Agencies or Government-Sponsored Enterprises Certain Funds may invest in securities of U.S. Government agencies or government-sponsored enterprises. U.S. Government securities are obligations of and, in certain cases, guaranteed by, the U.S. Government, its agencies or instrumentalities. Some U.S. Government securities, such as Treasury bills, notes and bonds, and securities guaranteed by the Government National Mortgage Association (“GNMA” or “Ginnie Mae”), are supported by the full faith and credit of the U.S. Government; others, such as those of the Federal Home Loan Banks, are supported by the right of the issuer to borrow from the
U.S. Department of the Treasury (the “U.S. Treasury”); and others, such as those of the Federal National Mortgage Association (“FNMA” or “Fannie Mae”), are supported by the discretionary authority of the U.S. Government to purchase the agency’s obligations. U.S. Government securities may include zero coupon securities, which do not distribute interest on a current basis and tend to be subject to greater risk than interest-paying securities of similar maturities.
Government-related guarantors (i.e., not backed by the full faith and credit of the U.S. Government) include FNMA and the Federal Home Loan Mortgage Corporation (“FHLMC” or “Freddie Mac”). FNMA is a government-sponsored corporation. FNMA purchases conventional (i.e., not insured or guaranteed by any government agency) residential mortgages from a list of approved seller/servicers which include state and federally chartered savings and loan associations, mutual savings banks, commercial banks and credit unions and mortgage bankers. Pass-through securities issued by FNMA are guaranteed as to timely payment of principal and interest by FNMA, but are not backed by the full faith and credit of the U.S. Government. FHLMC issues Participation Certificates (“PCs”), which are pass-through securities, each representing an undivided interest in a pool of residential mortgages. FHLMC guarantees the timely payment of interest and ultimate collection of principal, but PCs are not backed by the full faith and credit of the U.S. Government.
(b) Investments in Affiliates
The PIMCO Emerging Multi-Asset Fund may invest assets in Institutional Class shares of the Underlying PIMCO Funds. The Underlying PIMCO Funds are considered to be affiliated with the PIMCO Emerging Multi-Asset Fund. The table below shows the transactions in and earnings from investments in these affiliated Funds for the period ended June 30, 2014 (amounts in thousands):
PIMCO Emerging Multi-Asset Fund
| Underlying PIMCO Funds | Market Value 06/30/2013 | Purchases at Cost | Proceeds from Sales | Net Realized Gain/(Loss) | Change in Unrealized Appreciation/ (Depreciation) | Market Value 06/30/2014 | Dividend Income | Net Capital Gain Distributions | ||||||||||||||||||||||||||
PIMCO Emerging Local Bond Fund | $ | 17,104 | $ | 1,985 | $ | (9,493 | ) | $ | (1,283 | ) | $ | 779 | $ | 9,092 | $ | 631 | $ | 0 | ||||||||||||||||
PIMCO Emerging Markets Bond Fund | 10,024 | 2,102 | (6,889 | ) | (413 | ) | 383 | 5,207 | 414 | 213 | ||||||||||||||||||||||||
PIMCO Emerging Markets Corporate Bond Fund | 2,241 | 2,611 | (2,392 | ) | (156 | ) | 213 | 2,517 | 158 | 28 | ||||||||||||||||||||||||
PIMCO EqS® Emerging Markets Fund | 32,271 | 2,745 | (17,932 | ) | (700 | ) | 2,666 | 19,050 | 0 | 0 | ||||||||||||||||||||||||
PIMCO Short-Term Floating NAV Portfolio | 1,723 | 9,201 | (10,412 | ) | 0 | 0 | 512 | 1 | 0 | |||||||||||||||||||||||||
Totals | $ | 63,363 | $ | 18,644 | $ | (47,118 | ) | $ | (2,552 | ) | $ | 4,041 | $ | 36,378 | $ | 1,204 | $ | 241 | ||||||||||||||||
Each Fund may invest in the PIMCO Short-Term Floating NAV Portfolio and PIMCO Short-Term Floating NAV Portfolio III (“Central Funds”) to the extent permitted by the Act and rules thereunder. The Central Funds are registered investment companies created for use solely by the series of the Trust and series of the PIMCO Funds, PIMCO ETF Trust, PIMCO Variable Insurance Trust, PIMCO Equity Series VIT, and other series of registered investment companies advised by PIMCO, in connection with their cash management activities. The main investments of the Central Funds are money market instruments and short maturity fixed income instruments. The Central Funds may incur expenses related to their investment activities,
| 100 | PIMCO EQUITY SERIES |
Table of Contents
June 30, 2014
but do not pay Investment Advisory or Supervisory and Administrative Fees to PIMCO. The Central Funds are considered to be affiliated with the Funds. The table below shows the Fund’s transactions in and earnings from investments in the Central Funds for the period ended June 30, 2014 (amounts in thousands):
Investments in PIMCO Short-Term Floating NAV Portfolio
| Fund Name | Market Value 06/30/2013 | Purchases at Cost | Proceeds from Sales | Net Realized Gain/(Loss) | Change in Unrealized Appreciation/ (Depreciation) | Market Value 06/30/2014 | Dividend Income | Net Capital Gain Distributions | ||||||||||||||||||||||||||
PIMCO Balanced Income Fund | $ | 0 | $ | 2,200 | $ | (1,220 | ) | $ | 0 | $ | 0 | $ | 980 | $ | 0 | $ | 0 | |||||||||||||||||
PIMCO Dividend and Income Builder Fund | 28,734 | 529,178 | (538,580 | ) | (2 | ) | (1 | ) | 19,329 | 78 | 0 | |||||||||||||||||||||||
PIMCO EqS Pathfinder Fund® | 52,498 | 2,093,323 | (2,012,000 | ) | 35 | 2 | 133,858 | 323 | 0 | |||||||||||||||||||||||||
PIMCO EqS® Dividend Fund | 19,574 | 325,028 | (341,545 | ) | (3 | ) | 0 | 3,054 | 28 | 0 | ||||||||||||||||||||||||
PIMCO EqS® Emerging Markets Fund | 9,903 | 421,877 | (431,250 | ) | (11 | ) | 0 | 519 | 77 | 0 | ||||||||||||||||||||||||
PIMCO EqS® Long/Short Fund | 136,702 | 2,156,990 | (1,891,700 | ) | (4 | ) | 36 | 402,024 | 490 | 0 | ||||||||||||||||||||||||
An affiliate includes any company in which a Fund owns 5% or more of a company’s outstanding voting shares. The table below represents transactions in and earnings from these affiliated issuers at June 30, 2014.
PIMCO EqS® Long/Short Fund
| Security Name | Shares Held at 06/30/2013 | Shares Purchased | Shares Sold | Shares Held at 06/30/2014 | Net Realized Gain/(Loss) on Sale of Shares | Dividend Income | Market Value 06/30/2014 | |||||||||||||||||||||||
Paragon Shipping, Inc. ‘A’ (1) | 0 | 1,365 | (565 | ) | 800 | $ | (931 | ) | $ | 0 | $ | 4,728 | ||||||||||||||||||
| (1) | Not affiliated at June 30, 2014 |
5. BORROWINGS AND OTHER FINANCING TRANSACTIONS
The following disclosures contain information on a Fund’s ability to lend or borrow cash or securities to the extent permitted under the Act, which may be viewed as borrowing or financing transactions by a Fund. The location and fair value amounts of these instruments are described below. For a detailed description of credit and counterparty risks that can be associated with borrowings and other financing transactions, please see Note 7, Principal Risks.
(a) Repurchase Agreements Certain Funds may engage in repurchase agreements. Under the terms of a typical repurchase agreement, a Fund takes possession of an underlying debt obligation (collateral) subject to an obligation of the seller to repurchase, and a Fund to resell, the obligation at an agreed-upon price and time. The underlying securities for all repurchase agreements are held in safekeeping at the Fund’s custodian or designated subcustodians under tri-party repurchase agreements. The market value of the collateral must be equal to or exceed the total amount of the repurchase obligations, including interest. Repurchase agreements, including accrued interest, are included on the Statements of Assets and Liabilities. Interest earned is recorded as a component of interest income on the Statements of Operations. In periods of increased demand for collateral, a Fund may pay a fee for receipt of collateral, which may result in interest expense to the Fund.
(b) Short Sales Certain Funds may enter into short sales transactions. Short sales are transactions in which a Fund sells a security that it may not own. A Fund may make short sales of securities to (i) offset potential declines in long positions in similar securities, (ii) to increase the flexibility of the Fund, (iii) for investment return, (iv) as part of a risk arbitrage strategy, and (v) as part of its overall portfolio management strategies involving the use of derivative instruments. When a Fund engages in a short sale, it may borrow the security sold short and deliver it to the counterparty. A Fund will ordinarily have to pay a fee or premium to borrow a security and be obligated to repay the lender of the security any dividend or interest that accrues on the security during the period of the loan. Securities sold in short sale transactions and the dividend or interest payable on such securities, if any, are reflected as payable for short sales on the Statements of Assets and Liabilities. Short sales expose a Fund to the risk that it will be required to cover its short position at a time when the security or other asset has appreciated in value, thus resulting in losses to the Fund. A short sale is “against the box” if a Fund holds in its portfolio or has the right to acquire the security sold short at no additional cost. A Fund will be subject to additional risks to the extent that it engages in short sales that are not “against the box.” A Fund’s loss on a short sale could theoretically be unlimited in cases where the Fund is unable, for whatever reason, to close out its short position.
| ANNUAL REPORT | JUNE 30, 2014 | 101 |
Table of Contents
Notes to Financial Statements (Cont.)
6. FINANCIAL DERIVATIVE INSTRUMENTS
The following disclosures contain information on how and why the Funds use financial derivative instruments, the credit-risk-related contingent features in certain financial derivative instruments, and how financial derivative instruments affect the Funds’ financial position, results of operations and cash flows. The location and fair value amounts of these instruments on the Statements of Assets and Liabilities and the realized and changes in unrealized gains and losses on the Statements of Operations, each categorized by type of financial derivative contract and related risk exposure, are included in a table in the Notes to Schedules of Investments. The financial derivative instruments outstanding as of period end and the amounts of realized and changes in unrealized gains and losses on financial derivative instruments during the period, as disclosed in the Notes to Schedules of Investments, serve as indicators of the volume of financial derivative activity for the Funds.
(a) Forward Foreign Currency Contracts Certain Funds may enter into forward foreign currency contracts in connection with settling planned purchases or sales of securities, to hedge the currency exposure associated with some or all of a Fund’s securities or as a part of an investment strategy. A forward foreign currency contract is an agreement between two parties to buy and sell a currency at a set price on a future date. The market value of a forward foreign currency contract fluctuates with changes in foreign currency exchange rates. Forward foreign currency contracts are marked to market daily and the change in value is recorded by a Fund as an unrealized gain or loss. Realized gains or losses equal to the difference between the value of the contract at the time it was opened and the value at the time it was closed are recorded upon delivery or receipt of the currency. These contracts may involve market risk in excess of the unrealized gain or loss reflected on the Statements of Assets and Liabilities. In addition, a Fund could be exposed to risk if the counterparties are unable to meet the terms of the contracts or if the value of the currency changes unfavorably to the U.S. dollar. In connection with these contracts, cash or securities may be identified as collateral in accordance with the terms of the respective contracts.
(b) Futures Contracts Certain Funds may enter into futures contracts. A Fund may use futures contracts to manage its exposure to the securities markets or to movements in interest rates and currency values. The primary risks associated with the use of futures contracts are the imperfect correlation between the change in market value of the securities held by a Fund and the prices of futures contracts and the possibility of an illiquid market. Futures contracts are valued based upon their quoted daily settlement prices. Upon entering into a futures contract, a Fund is required to deposit with its futures broker an amount of cash, U.S. Government and Agency Obligations, or select
sovereign debt, in accordance with the initial margin requirements of the broker or exchange. Futures contracts are marked to market daily and an appropriate payable or receivable for the change in value (“variation margin”) is recorded by the Fund. Gains or losses are recognized but not considered realized until the contracts expire or are closed. Futures contracts involve, to varying degrees, risk of loss in excess of the variation margin disclosed on the Statements of Assets and Liabilities.
(c) Options Contracts Certain Funds may write call and put options on securities and financial derivative instruments they own or in which they may invest. Writing put options tends to increase a Fund’s exposure to the underlying instrument. Writing call options tends to decrease a Fund’s exposure to the underlying instrument. When a Fund writes a call or put, an amount equal to the premium received is recorded as a liability and subsequently marked to market to reflect the current value of the option written. These liabilities are included on the Statements of Assets and Liabilities. Premiums received from writing options which expire are treated as realized gains. Premiums received from writing options which are exercised or closed are added to the proceeds or offset against amounts paid on the underlying futures, swap, security or currency transaction to determine the realized gain or loss. Certain options may be written with premiums to be determined on a future date. The premiums for these options are based upon implied volatility parameters at specified terms. A Fund as a writer of an option has no control over whether the underlying instrument may be sold (call) or purchased (put) and as a result bears the market risk of an unfavorable change in the price of the instrument underlying the written option. There is the risk a Fund may not be able to enter into a closing transaction because of an illiquid market.
Certain Funds may also purchase put and call options. Purchasing call options tends to increase a Fund’s exposure to the underlying instrument. Purchasing put options tends to decrease a Fund’s exposure to the underlying instrument. A Fund pays a premium which is included as an asset on the Statement of Assets and Liabilities and subsequently marked to market to reflect the current value of the option. Premiums paid for purchasing options which expire are treated as realized losses. Certain options may be purchased with premiums to be determined on a future date. The premiums for these options are based upon implied volatility parameters at specified terms. The risk associated with purchasing put and call options is limited to the premium paid. Premiums paid for purchasing options which are exercised or closed are added to the amounts paid or offset against the proceeds on the underlying investment transaction to determine the realized gain or loss when the underlying transaction is executed.
Options on Securities Certain Funds may write or purchase options on securities. An option uses a specified security as the underlying
| 102 | PIMCO EQUITY SERIES |
Table of Contents
June 30, 2014
instrument for the option contract. A Fund may write or purchase options to enhance returns or to hedge an existing position or future investment.
Options on Exchange-Traded Funds Certain Funds may write or purchase options on exchange-traded funds (“ETF Option”). An ETF Option uses a specified exchange-traded fund as the underlying instrument for the option contract. A Fund may write or purchase options to enhance returns or to hedge an existing position or future investment.
(d) Swap Agreements Certain Funds may invest in swap agreements. Swap agreements are bilaterally negotiated agreements between a Fund and a counterparty to exchange or swap investment cash flows, assets, foreign currencies or market-linked returns at specified, future intervals. Swap agreements are privately negotiated in the over the counter market (“OTC swaps”) or may be executed in a multilateral or other trade facility platform, such as a registered exchange (“centrally cleared swaps”). A Fund may enter into asset, credit default, cross-currency, interest rate, total return, variance and other forms of swap agreements to manage its exposure to credit, currency, interest rate, commodity, equity and inflation risk. In connection with these agreements, securities or cash may be identified as collateral or margin in accordance with the terms of the respective swap agreements to provide assets of value and recourse in the event of default or bankruptcy/insolvency.
Swaps are marked to market daily based upon values from third-party vendors, which may include a registered exchange, or quotations from market makers to the extent available. In the event that market quotes are not readily available and the swap cannot be valued pursuant to one of the valuation methods, the value of the swap will be determined in good faith by the Valuation Committee of the Board of Trustees, generally based upon recommendations provided by PIMCO. Changes in market value, if any, are reflected as a component of net change in unrealized appreciation/(depreciation) on the Statements of Operations. Daily changes in valuation of centrally cleared swaps, if any, are recorded as a receivable or payable for the change in value as appropriate (“variation margin”) on the Statements of Assets and Liabilities. OTC swap payments received or paid at the beginning of the measurement period are included on the Statements of Assets and Liabilities and represent premiums paid or received upon entering into the swap agreement to compensate for differences between the stated terms of the swap agreement and prevailing market conditions (credit spreads, currency exchange rates, interest rates, and other relevant factors). Upfront premiums received (paid) are initially recorded as liabilities (assets) and subsequently marked to market to reflect the current value of the swap. These upfront premiums are recorded as realized gains or losses on the Statements of Operations upon
termination or maturity of the swap. A liquidation payment received or made at the termination of the swap is recorded as realized gain or loss on the Statements of Operations. Net periodic payments received or paid by a Fund are included as part of realized gains or losses on the Statements of Operations.
Entering into these agreements involves, to varying degrees, elements of interest, credit, market and documentation risk in excess of the amounts recognized on the Statements of Assets and Liabilities. Such risks involve the possibility that there will be no liquid market for these agreements, that the counterparty to the agreements may default on its obligation to perform or disagree as to the meaning of contractual terms in the agreements and that there may be unfavorable changes in interest rates.
A Fund’s maximum risk of loss from counterparty credit risk is the discounted net value of the cash flows to be received from the counterparty over the contract’s remaining life, to the extent that amount is positive. The risk is mitigated by having a master netting arrangement between a Fund and the counterparty and by the posting of collateral to a Fund to cover a Fund’s exposure to the counterparty.
Credit Default Swap Agreements Credit default swap agreements involve one party making a stream of payments (referred to as the buyer of protection) to another party (the seller of protection) in exchange for the right to receive a specified return in the event of a default or other credit event for the referenced entity, obligation or index. As a seller of protection on credit default swap agreements, a Fund will generally receive from the buyer of protection a fixed rate of income throughout the term of the swap provided that there is no credit event. As the seller, a Fund would effectively add leverage to its portfolio because, in addition to its total net assets, a Fund would be subject to investment exposure on the notional amount of the swap.
If a Fund is a seller of protection and a credit event occurs, as defined under the terms of that particular swap agreement, a Fund will either (i) pay to the buyer of protection an amount equal to the notional amount of the swap and take delivery of the referenced obligation, other deliverable obligations or underlying securities comprising the referenced index or (ii) pay a net settlement amount in the form of cash or securities equal to the notional amount of the swap less the recovery value of the referenced obligation or underlying securities comprising the referenced index. If a Fund is a buyer of protection and a credit event occurs, as defined under the terms of that particular swap agreement, a Fund will either (i) receive from the seller of protection an amount equal to the notional amount of the swap and deliver the referenced obligation, other deliverable obligations or underlying securities comprising the referenced index or (ii) receive a net settlement amount in the form of cash or securities equal to the
| ANNUAL REPORT | JUNE 30, 2014 | 103 |
Table of Contents
Notes to Financial Statements (Cont.)
notional amount of the swap less the recovery value of the referenced obligation or underlying securities comprising the referenced index. Recovery values are estimated by market makers considering either industry standard recovery rates or entity specific factors and considerations until a credit event occurs. If a credit event has occurred, the recovery value is determined by a facilitated auction whereby a minimum number of allowable broker bids, together with a specified valuation method, are used to calculate the settlement value.
Credit default swap agreements on sovereign issues involve one party making a stream of payments to another party in exchange for the right to receive a specified return in the event of a default or other credit event. If a credit event occurs and cash settlement is not elected, a variety of other deliverable obligations may be delivered in lieu of the specific referenced obligation. The ability to deliver other obligations may result in a cheapest-to-deliver option (the buyer of protection’s right to choose the deliverable obligation with the lowest value following a credit event). A Fund may use credit default swaps on sovereign issues to provide a measure of protection against defaults of the issuers (i.e., to reduce risk where a Fund owns or has exposure to the referenced obligation) or to take an active long or short position with respect to the likelihood of a particular issuer’s default.
Implied credit spreads, represented in absolute terms, utilized in determining the market value of credit default swap agreements on sovereign issues as of period end are disclosed in the Notes to Schedules of Investments. They serve as an indicator of the current status of payment/performance risk and represent the likelihood or risk of default for the reference entity. The implied credit spread of a particular referenced entity reflects the cost of buying/selling protection and may include upfront payments required to be made to enter into the agreement. Wider credit spreads represent a deterioration of the referenced entity’s credit soundness and a greater likelihood or risk of default or other credit event occurring as defined under the terms of the agreement. For credit default swap agreements on asset-backed securities and credit indices, the quoted market prices and resulting values serve as the indicator of the current status of the payment/performance risk. Increasing market values, in absolute terms when compared to the notional amount of the swap, represent a deterioration of the referenced entity’s credit soundness and a greater likelihood or risk of default or other credit event occurring as defined under the terms of the agreement.
The maximum potential amount of future payments (undiscounted) that a Fund as a seller of protection could be required to make under a credit default swap agreement equals the notional amount of the agreement. Notional amounts of each individual credit default swap agreement outstanding as of period end for which a Fund is the seller of protection are disclosed in the Notes to Schedules of Investments. These potential amounts would be partially offset by any recovery
values of the respective referenced obligations, upfront payments received upon entering into the agreement, or net amounts received from the settlement of buy protection credit default swap agreements entered into by a Fund for the same referenced entity or entities.
Total Return Swap Agreements Certain Funds may enter into total return swap agreements to gain or mitigate exposure to the underlying reference. Total return swap agreements involve commitments where single or multiple cash flows are exchanged based on the price of an underlying reference and on a fixed or variable interest rate. Total return swap agreements may involve commitments to pay interest in exchange for a market-linked return. One counterparty pays out the total return of a specific reference asset, which may include an underlying equity, index, or bond, and in return receives a fixed or variable rate. At the maturity date, a net cash flow is exchanged where the total return is equivalent to the return of the underlying reference less a financing rate, if any. As a receiver, a Fund would receive payments based on any positive total return and would owe payments in the event of a negative total return. As the payer, a Fund would owe payments on any net positive total return, and would receive payment in the event of a negative total return.
7. PRINCIPAL RISKS
In the normal course of business the Funds (or Acquired Funds) trade financial instruments and enter into financial transactions where risk of potential loss exists due to such things as changes in the market (market risk) or failure or inability of the other party to a transaction to perform (credit and counterparty risk). See below for a detailed description of select principal risks. For a more comprehensive list of potential risks the Funds may be subject to, please see the Important Information About the Funds.
Investments in Mutual Funds To the extent that certain Funds invest substantially all of their respective assets in certain series of PIMCO Funds and certain series of PIMCO Equity Series, each an affiliated investment company also managed by PIMCO, (“Acquired Funds”), the risks associated with investing in these Funds will be closely related to the risks associated with the securities and other investments held by the Acquired Funds. The ability of the Funds to achieve their respective investment objectives may depend upon the ability of the Acquired Funds to achieve their respective investment objectives. There can be no assurance that the investment objective of any Acquired Fund will be achieved. The net asset value of each Fund will fluctuate in response to changes in the respective net asset values of the Acquired Funds in which it invests. The extent to which the investment performance and risks associated with the Funds correlate to those of a particular Acquired Fund will depend upon the extent to which the assets of the Funds are allocated from time to time for investment in the Acquired Funds, which will vary.
| 104 | PIMCO EQUITY SERIES |
Table of Contents
June 30, 2014
Investing in Acquired Funds involves certain additional expenses and tax results that would not be present in a direct investment in the Acquired Funds.
Market Risks A Fund’s (or Acquired Fund’s) investments in financial derivatives and other financial instruments expose the Fund to various risks such as, but not limited to, equity, interest rate, foreign currency and commodity risks.
The market values of equities, such as common stocks and preferred securities or equity related investments such as futures and options, have historically risen and fallen in periodic cycles and may decline due to general market conditions which are not specifically related to a particular company, such as real or perceived adverse economic conditions, changes in the general outlook for corporate earnings, changes in interest or currency rates or adverse investor sentiment generally. They may also decline due to factors which affect a particular industry or industries, such as labor shortages or increased production costs and competitive conditions within an industry. Different types of equity securities may react differently to these developments. Equity securities and equity related investments generally have greater market price volatility than fixed income securities.
Interest rate risk is the risk that fixed income securities will decline in value because of an increase in interest rates. As nominal interest rates rise, the value of certain fixed income securities held by a Fund (or Acquired Fund) is likely to decrease. A nominal interest rate can be described as the sum of a real interest rate and an expected inflation rate. Interest rate changes can be sudden and unpredictable, and a Fund may lose money if these changes are not anticipated by Fund management. A Fund may not be able to hedge against changes in interest rates or may choose not to do so for cost or other reasons. In addition, any hedges may not work as intended. Fixed income securities with longer durations tend to be more sensitive to changes in interest rates, usually making them more volatile than securities with shorter durations. Duration is useful primarily as a measure of the sensitivity of a security’s market price to interest rate (i.e., yield) movements. A wide variety of factors can cause interest rates to rise (e.g., central bank monetary policies, inflation rates, general economic conditions, etc.). At present, the U.S. is experiencing historically low interest rates. This, combined with recent economic recovery and the Federal Reserve Board’s tapering of its quantitative easing program, could potentially increase the probability of an upward interest rate environment in the near future. Further, while U.S. bond markets have steadily grown over the past three decades, dealer “market making” ability has remained relatively stagnant. Given the importance of intermediary “market making” in creating a robust and active market, fixed income securities may face increased volatility and liquidity risks. All of these factors, collectively and/or individually, could cause a Fund to lose value. If a Fund lost enough value, the Fund could face
increased redemptions by shareholders, which could further impair its performance.
Certain Funds may invest in securities and instruments that are economically tied to Russia. Investments in Russia are subject to political, economic, legal, market and currency risks. The risks include uncertain political and economic policies, short-term market volatility, poor accounting standards, corruption and crime, an inadequate regulatory system, and unpredictable taxation. Investments in Russia are particularly subject to the risk that economic sanctions may be imposed by the United States and/or other countries. Such sanctions—which may impact companies in many sectors, including energy, financial services and defense, among others—may negatively impact the Fund’s performance and/or ability to achieve its investment objective.
The geographical classification of foreign securities in this report are classified by the country of incorporation of a holding. In certain instances, a security’s country of incorporation may be different from its country of economic exposure.
If a Fund (or Acquired Fund) invests directly in foreign currencies or in securities that trade in, and receive revenues in, foreign currencies, or in financial derivatives that provide exposure to foreign currencies, it will be subject to the risk that those currencies will decline in value relative to the base currency of the Fund (or Acquired Fund), or, in the case of hedging positions, that the Fund’s (or Acquired Fund’s) base currency will decline in value relative to the currency being hedged. Currency rates in foreign countries may fluctuate significantly over short periods of time for a number of reasons, including changes in interest rates, intervention (or the failure to intervene) by U.S. or foreign governments, central banks or supranational entities such as the International Monetary Fund, or by the imposition of currency controls or other political developments in the United States or abroad. As a result, a Fund’s (or Acquired Fund’s) investments in foreign currency denominated securities may reduce the returns of the Fund (or Acquired Fund).
A Fund’s (or Acquired Fund’s) investments in commodity-linked financial derivative instruments may subject the Fund to greater market price volatility than investments in traditional securities. The value of commodity-linked financial derivative instruments may be affected by changes in overall market movements, commodity index volatility, changes in interest rates, or factors affecting a particular industry or commodity, such as drought, floods, weather, livestock disease, embargoes, tariffs and international economic, political and regulatory developments.
Credit and Counterparty Risks A Fund (or Acquired Fund) will be exposed to credit risk to parties with whom it trades and will also bear the risk of settlement default. A Fund (or Acquired Fund) minimizes concentrations of credit risk by undertaking transactions with a large number of customers and counterparties on recognized and reputable exchanges. A Fund (or Acquired Fund) could lose money if the issuer or guarantor of a fixed income security, or the counterparty to a financial
| ANNUAL REPORT | JUNE 30, 2014 | 105 |
Table of Contents
Notes to Financial Statements (Cont.)
derivatives contract, repurchase agreement or a loan of portfolio securities, is unable or unwilling to make timely principal and/or interest payments, or to otherwise honor its obligations. Securities are subject to varying degrees of credit risk, which are often reflected in credit ratings.
Similar to credit risk, a Fund (or Acquired Fund) may be exposed to counterparty risk, or the risk that an institution or other entity with which the Fund (or Acquired Fund) has unsettled or open transactions will default. Financial assets, which potentially expose a Fund to counterparty risk, consist principally of cash due from counterparties and investments. PIMCO, as the investment adviser, minimizes counterparty risks to the Funds by performing extensive reviews of each counterparty and obtaining approval from the PIMCO Counterparty Risk Committee prior to entering into transactions with a third-party. Furthermore, to the extent that unpaid amounts owed to a Fund (or Acquired Fund) exceed a predetermined threshold agreed to with the counterparty, such counterparty shall advance collateral to the Fund (or Acquired Fund) in the form of cash or cash equivalents equal in value to the unpaid amount owed to the Fund (or Acquired Fund). A Fund (or Acquired Fund) may invest such collateral in securities or other instruments and will typically pay interest to the counterparty on the collateral received. If the unpaid amount owed to a Fund (or Acquired Fund) subsequently decreases, the Fund (or Acquired Fund) would be required to return to the counterparty all or a portion of the collateral previously advanced to the Fund (or Acquired Fund).
All transactions in listed securities are settled/paid for upon delivery using approved counterparties. The risk of default is considered minimal, as delivery of securities sold is only made once a Fund has received payment. Payment is made on a purchase once the securities have been delivered by the counterparty. The trade will fail if either party fails to meet its obligation.
Master Netting Arrangements A Fund is subject to various netting arrangements with select counterparties (“Master Agreements”). Master Agreements govern the terms of certain transactions, and reduce the counterparty risk associated with relevant transactions by specifying credit protection mechanisms and providing standardization that improves legal certainty. Since different types of transactions have different mechanics and are sometimes traded out of different legal entities of a particular counterparty organization, each type of transaction may be covered by a different Master Agreement, resulting in the need for multiple agreements with a single counterparty. As the Master Agreements are specific to unique operations of different asset types, they allow a Fund to close out and net its total exposure to a counterparty in the event of a default with respect to all the transactions governed under a single agreement with a counterparty.
Master Agreements can also help limit counterparty risk by specifying collateral posting arrangements at pre-arranged exposure levels. Under
the Master Agreements, collateral is routinely transferred if the total net exposure to certain transactions (net of existing collateral already in place) governed under the relevant Master Agreement with a counterparty in a given account exceeds a specified threshold, which typically ranges from zero to $250,000 depending on the counterparty and the type of Master Agreement. United States Treasury Bills and U.S. dollar cash are generally the preferred forms of collateral, although other forms of AAA rated paper or sovereign securities may be used. Securities and cash pledged as collateral are reflected as assets in the Statement of Assets and Liabilities as either a component of Investments at value (securities) or Deposits due from Counterparties (cash). Cash collateral received is not typically held in a segregated account and as such is reflected as a liability in the Statement of Assets and Liabilities as Deposits due to Counterparties. The market value of any securities received as collateral is not reflected as a component of net asset value. A Fund’s overall exposure to counterparty risk can change substantially within a short period, as it is affected by each transaction subject to the relevant Master Agreement.
Master Repurchase Agreements and Global Master Repurchase Agreements (individually and collectively “Master Repo Agreements”) govern repurchase, reverse repurchase, and sale-buyback transactions between a Fund and select counterparties. Master Repo Agreements maintain provisions for, among other things, initiation, income payments, events of default, and maintenance of collateral. The market value of transactions under the Master Repo Agreement, collateral pledged or received, and the net exposure by counterparty as of period end are disclosed in the Notes to Schedule of Investments.
Master Securities Forward Transaction Agreements (“Master Forward Agreements”) govern the considerations and factors surrounding the settlement of certain forward settling transactions, such as To-Be-Announced securities, delayed-delivery or sale-buyback transactions by and between a Fund and select counterparties. The Master Forward Agreements maintain provisions for, among other things, initiation and confirmation, payment and transfer, events of default, termination, and maintenance of collateral. The market value of forward settling transactions, collateral pledged or received, and the net exposure by counterparty as of period end is disclosed in the Notes to Schedule of Investments.
Customer Account Agreements and related addendums govern cleared derivatives transactions such as futures, options on futures, and cleared OTC derivatives. Cleared derivative transactions require posting of initial margin as determined by each relevant clearing agency which is segregated at a broker account registered with the Commodity Futures Trading Commission (CFTC), or the applicable regulator. In the US, counterparty risk is significantly reduced as creditors of the futures broker do not have claim to Fund assets in the segregated account. Additionally,
| 106 | PIMCO EQUITY SERIES |
Table of Contents
June 30, 2014
portability of exposure in the event of default further reduces risk to the Funds. Variation margin, or changes in market value, are exchanged daily, but may not be netted between futures and cleared OTC derivatives. The market value or accumulated unrealized appreciation or depreciation, initial margin posted, and any unsettled variation margin as of period end is disclosed in the Notes to Schedule of Investments.
Prime Broker Arrangements may be entered into to facilitate execution and/or clearing of listed equity option transactions or short sales of equity securities between a Fund and selected counterparties. The arrangements provide guidelines surrounding the rights, obligations, and other events, including, but not limited to, margin, execution, and settlement. These agreements maintain provisions for, among other things, payments, maintenance of collateral, events of default, and termination. Margin and other assets delivered as collateral are typically in the possession of the prime broker and would offset any obligations due to the prime broker. The market values of listed options and securities sold short and related collateral are disclosed in the Notes to Schedule of Investments.
International Swaps and Derivatives Association, Inc. Master Agreements and Credit Support Annexes (“ISDA Master Agreements”) govern OTC financial derivative transactions entered into by a Fund and select counterparties. ISDA Master Agreements maintain provisions for general obligations, representations, agreements, collateral and events of default or termination. Events of termination include conditions that may entitle counterparties to elect to terminate early and cause settlement of all outstanding transactions under the applicable ISDA Master Agreement. Any election to terminate early could be material to the financial statements. In limited circumstances, the ISDA Master Agreement may contain additional provisions that add counterparty protection beyond coverage of existing daily exposure if the counterparty has a decline in credit quality below a predefined level. These amounts, if any, may be segregated with a third-party custodian. The market value of OTC financial derivative instruments, collateral received or pledged, and net exposure by counterparty as of period end are disclosed in the Notes to Schedule of Investments.
8. BASIS FOR CONSOLIDATION FOR THE PIMCO EMERGING MULTI-ASSET FUND AND PIMCO EqS PATHFINDER FUND® (“Consolidated Funds”)
PIMCO Cayman Commodity Fund V and VI, Ltd. (each a “Commodity Subsidiary”), Cayman Islands exempted companies, were incorporated as wholly owned subsidiaries acting as investment vehicles for the Consolidated Funds in order to effect certain investments for the Consolidated Funds consistent with each Consolidated Fund’s investment objectives and policies as specified in their respective prospectus and statement of additional information. Each Consolidated Fund’s investment portfolio has been consolidated and includes the portfolio holdings of the Consolidated Fund and its respective Commodity Subsidiary. PIMCO Cayman Commodity Fund V, Ltd. was liquidated on May 30, 2014 at its net asset value. The Commodity Subsidiary’s operations have been consolidated with the operations of the Consolidated Fund through its liquidation date. The consolidated financial statements include the accounts of the Consolidated Funds and their respective Commodity Subsidiaries. All inter-company transactions and balances have been eliminated. A subscription agreement was entered into between the Consolidated Funds and their respective Commodity Subsidiary, comprising the entire issued share capital of the Commodity Subsidiary, with the intent that each Consolidated Fund will remain the sole shareholder and retain all rights. Under the Memorandum and Articles of Association of each Commodity Subsidiary, shares issued by each Commodity Subsidiary confer upon a shareholder the right to receive notice of, to attend and to vote at general meetings of the respective Commodity Subsidiaries and shall confer upon the shareholder rights in a winding-up or repayment of capital and the right to participate in the profits or assets of the respective Commodity Subsidiaries. See the table below for details regarding the structure, incorporation and relationship as of period end of each Commodity Subsidiary to its respective Consolidated Fund (amounts in thousands).
| PIMCO Emerging Multi- Asset Fund | PIMCO EqS Pathfinder Fund® | |||||||||
| PIMCO Cayman Commodity Fund V, Ltd. | PIMCO Cayman Commodity Fund VI, Ltd. | |||||||||
Date of Incorporation | 06/06/2011 | 06/06/2011 | ||||||||
Subscription Agreement | 07/01/2011 | 06/20/2011 | ||||||||
Fund Net Assets | $ | 36,678 | $ | 1,443,390 | ||||||
Subsidiary % of Fund Net Assets | 0.0% | 0.0% | ||||||||
Subsidiary Financial Statement Information | ||||||||||
Total assets | $ | 0 | $ | 10 | ||||||
Total liabilities | 0 | 0 | ||||||||
Net assets | 0 | 10 | ||||||||
Total income | 0 | 0 | ||||||||
Net investment income (loss) | 0 | (90 | ) | |||||||
Net realized gain (loss) | 0 | (13,202 | ) | |||||||
Net change in unrealized appreciation (depreciation) | 0 | 16,466 | ||||||||
Increase (decrease) in net assets resulting from operations | $ | 0 | $ | 3,174 | ||||||
| ANNUAL REPORT | JUNE 30, 2014 | 107 |
Table of Contents
Notes to Financial Statements (Cont.)
9. FEES AND EXPENSES
(a) Investment Advisory Fee PIMCO is a majority-owned subsidiary of Allianz Asset Management of America L.P. (“Allianz Asset Management”) and serves as the Adviser to the Trust, pursuant to an investment advisory contract. The Adviser receives a monthly fee from each Fund at an annual rate based on average daily net assets (the “Investment Advisory Fee”). The Investment Advisory Fee for all classes is charged at an annual rate as noted in the table below.
(b) Supervisory and Administrative Fee PIMCO serves as administrator (the “Administrator”) and provides supervisory and administrative services to the Trust for which it receives a monthly supervisory and administrative fee based on each share class’s average daily net assets (the “Supervisory and Administrative Fee”). As the Administrator, PIMCO bears the costs of various third-party services, including audit, custodial, portfolio accounting, legal, transfer agency and printing costs.
The Investment Advisory and Supervisory and Administrative Fees for all classes are charged at an annual rate as noted in the following table:
| Investment Advisory Fee | Supervisory and Administrative Fee | |||||||||||||||||||||||||||
| Fund Name | All Classes | Institutional Class | Class P | Administrative Class | Class D | A, C and R Classes | ||||||||||||||||||||||
PIMCO Balanced Income Fund | 0.60% | 0.30% | 0.40% | N/A | 0.40% | 0.40% | ||||||||||||||||||||||
PIMCO Dividend and Income Builder Fund | 0.69% | 0.30% | 0.40% | N/A | 0.40% | 0.40% | ||||||||||||||||||||||
PIMCO EqS® Dividend Fund | 0.69% | 0.30% | 0.40% | N/A | 0.40% | 0.40% | ||||||||||||||||||||||
PIMCO EqS® Emerging Markets Fund | 1.00% | 0.45% | 0.55% | 0.45% | 0.55% | 0.55% | ||||||||||||||||||||||
PIMCO EqS® Long/Short Fund | 1.04% | 0.45% | 0.55% | N/A | 0.55% | 0.55% | ||||||||||||||||||||||
PIMCO Emerging Multi-Asset Fund | 0.90% | 0.45% | 0.55% | 0.45% | 0.55% | 0.55% | ||||||||||||||||||||||
PIMCO EqS Pathfinder Fund® | 0.75% | 0.30% | 0.40% | N/A | 0.40% | 0.40% | ||||||||||||||||||||||
(c) Distribution and Servicing Fees PIMCO Investments LLC (“PI”), a wholly-owned subsidiary of PIMCO, serves as the distributor (“Distributor”) of the Trust’s shares.
The Trust has adopted separate Distribution and Servicing Plans with respect to the Class A, Class C and Class R shares of the Trust pursuant to Rule 12b-1 under the Act. In connection with the distribution of Class C and Class R shares of the Trust, the Distributor receives distribution fees from the Trust of up to 0.75% for Class C shares and 0.25% for Class R shares, and in connection with personal services rendered to Class A, Class C and Class R shareholders and the maintenance of such shareholder accounts, the Distributor receives servicing fees from the Trust of up to 0.25% for each of Class A, Class C and Class R shares (percentages reflect annual rates of the average daily net assets attributable to the applicable class).
The Trust has adopted a Distribution and Servicing Plan with respect to the Class D shares of each Fund pursuant to Rule 12b-1 under the Act (the “Class D Plan”). Under the terms of the Class D Plan, a Fund is permitted to compensate the Distributor out of the assets attributable to the Class D shares of the Fund, in an amount up to 0.25% on an annual basis of the average daily net assets of the Fund’s Class D shares for providing, or procuring through financial intermediaries, distribution, shareholder services, and/or maintenance of shareholder accounts with respect to Class D shareholders of the Fund, some of which may be deemed to be primarily intended to result in the sale of Class D shares.
The Trust has adopted a Distribution and Servicing Plan with respect to the Administrative Class shares of each Fund pursuant to Rule 12b-1 under the Act (the “Administrative Class Plan”). Under the terms of the Administrative Class Plan, a Fund may compensate the Distributor for providing, or procuring through financial intermediaries, distribution, administrative, recordkeeping, shareholder and/or related services with respect to Administrative Class shares. The Administrative Class Plan permits a Fund to make total payments at an annual rate of up to 0.25% of the average daily net assets attributable to the Administrative Class shares.
The Trust paid distribution and servicing fees at effective rates as set forth in the following table (calculated as a percentage of each Fund’s average daily net assets attributable to each class):
| Distribution Fee | Servicing Fee | |||||||||
Administrative Class | — | 0.25% | ||||||||
Class D | — | 0.25% | ||||||||
Class A | — | 0.25% | ||||||||
Class C | 0.75% | 0.25% | ||||||||
Class R | 0.25% | 0.25% | ||||||||
The Distributor also received the proceeds of the initial sales charges paid by the shareholders upon the purchase of Class A shares and the contingent deferred sales charges paid by the shareholders upon certain redemptions of Class A and Class C Class shares. For the period ended June 30, 2014, the Distributor received $586,256 representing commissions (sales charges) and contingent deferred sales charges from the Trust.
| 108 | PIMCO EQUITY SERIES |
Table of Contents
June 30, 2014
(d) Fund Expenses The Trust is responsible for the following expenses: (i) salaries and other compensation of any of the Trust’s executive officers and employees who are not officers, directors, stockholders or employees of PIMCO or its subsidiaries or affiliates; (ii) taxes and governmental fees; (iii) brokerage fees and commissions and other portfolio transaction expenses; (iv) costs of borrowing money, including interest expense; (v) fees and expenses of the Trustees who are not “interested persons” of PIMCO or the Trust, and any counsel retained exclusively for their benefit; (vi) extraordinary expense, including costs of litigation and indemnification expenses; (vii) organization expenses and (viii) any expenses allocated or allocable to a specific class of shares, which include service fees payable with respect to the Administrative Class Shares, and may include certain other expenses as permitted by the Trust’s Multi-Class Plan adopted pursuant to Rule 18f-3 under the Act and subject to review and approval by the Trustees. The ratio of expenses to average net assets per share class, as disclosed on the Financial Highlights, may differ from the annual fund operating expenses per share class as disclosed in the Prospectus for the reasons set forth above.
Each unaffiliated Trustee receives an annual retainer of $60,000, plus $4,750 for each Board of Trustees meeting attended in person, $375 ($750 in the case of the audit committee chair with respect to audit committee meetings) for each committee meeting attended and $750 for each Board of Trustees meeting attended telephonically, plus reimbursement of related expenses. In addition, the audit committee chair receives an additional annual retainer of $7,500 and each other committee chair receives an additional annual retainer of $750.
These expenses are allocated on a pro-rata basis to each Fund of the Trust according to its respective net assets. The Trust pays no compensation directly to any Trustee or any other officer who is affiliated with the Administrator, all of whom receive remuneration for their services to the Trust from the Administrator or its affiliates.
(e) Expense Limitation PIMCO has agreed to waive a portion of the Funds’ Supervisory and Administrative Fees in each Fund’s first fiscal year, to the extent that the payment of each Fund’s pro rata share of organizational expenses and Trustee Fees cause the actual expense ratio to rise above the rates disclosed in the then-current prospectus plus 0.0049% (calculated as a percentage of each Fund’s average daily net assets attributable to each class).
PIMCO has contractually agreed to waive a portion of the Investment Advisory Fee as set forth in the following table (calculated as a percentage of each Fund’s average daily net assets).
| Fund Name | Fee Waiver | Date | ||||||||
PIMCO Balanced Income Fund | 0.15% | 10/31/2015 | ||||||||
PIMCO Dividend and Income Builder Fund | 0.16% | 10/31/2014 | ||||||||
PIMCO EqS® Dividend Fund | 0.16% | 10/31/2014 | ||||||||
PIMCO EqS® Emerging Markets Fund | 0.20% | 10/31/2014 | ||||||||
| Fund Name | Fee Waiver | Date | ||||||||
PIMCO EqS® Long/Short Fund (1) | 0.09% | 10/31/2013 | ||||||||
PIMCO EqS Pathfinder Fund® | 0.16% | 10/31/2014 | ||||||||
| (1) | The 0.09% advisory fee waiver expired on 10/31/2013. |
Under the Fee Limitation Agreement, PIMCO is entitled to reimbursement by each Fund of any portion of the Supervisory and Administrative Fee and/or Investment Advisory Fee waived, reduced or reimbursed pursuant to the Fee Limitation Agreement (the “Reimbursement Amount”) during the previous three years, provided that such amount paid to PIMCO will not: 1) together with any recoupment of organizational expenses and pro rata Trustees’ fees pursuant to the Expense Limitation Agreement, exceed the Expense Limit; 2) exceed the total Reimbursement Amount; or 3) include any amounts previously reimbursed to PIMCO. The Fee Limitation Agreement will automatically renew for one-year terms unless PIMCO provides written notice to the Trust at least 30 days prior to the end of the then current term.
PIMCO may be reimbursed for these waived amounts in future periods, not to exceed thirty-six months after the waiver. Expenses that have been waived may still be reimbursed by the Administrator, to the extent the Fund’s annualized total portfolio operating expenses plus the amount reimbursed does not exceed the operating expense limitation. The recoverable amounts to PIMCO at June 30, 2014, were as follows (amounts in thousands):
| Fund Name | Recoverable Amounts | |||||
PIMCO Balanced Income Fund | $ | 150 | ||||
PIMCO Dividend and Income Builder Fund | 142 | |||||
PIMCO EqS® Dividend Fund | 178 | |||||
PIMCO EqS® Emerging Markets Fund | 115 | |||||
PIMCO EqS® Long/Short Fund | 288 | |||||
PIMCO Emerging Multi-Asset Fund | 14 | |||||
PIMCO EqS Pathfinder Fund® | 298 | |||||
(f) Acquired Fund Fees and Expenses The Underlying PIMCO Fund expenses for the PIMCO Emerging Multi-Asset Fund are based upon an allocation of the PIMCO Emerging Multi-Asset Fund’s assets among the Underlying PIMCO Funds and upon the total annual operating expenses of the Institutional Class shares of these Underlying PIMCO Funds. Underlying PIMCO Fund expenses will vary with changes in the expenses of the Underlying PIMCO Funds, as well as the allocation of the PIMCO Emerging Multi-Asset Fund’s assets.
PIMCO has contractually agreed, through October 31, 2014, to waive, first, the Investment Advisory Fee and, second, to the extent necessary, the Supervisory and Administrative Fee it receives from the PIMCO
Emerging Multi-Asset Fund in an amount equal to the expenses attributable to Investment Advisory and Supervisory and Administrative
Fees of Underlying PIMCO Funds indirectly incurred by the Fund in connection with the Fund’s investments in Underlying PIMCO Funds, to
| ANNUAL REPORT | JUNE 30, 2014 | 109 |
Table of Contents
Notes to Financial Statements (Cont.)
the extent the Investment Advisory Fee and Supervisory and Administrative Fees taken together are greater than or equal to the Investment Advisory Fees and Supervisory and Administrative Fees of the Underlying PIMCO Funds. This agreement renews annually for a full year unless terminated by PIMCO upon at least 30 days’ notice prior to the end of the contract term. The waivers are reflected in the Statements of Operations as a component of Waiver and/or Reimbursement by PIMCO. For the period ended June 30, 2014, the amount was $545,475.
Each Commodity Subsidiary has entered into a separate contract with PIMCO for the management of each Commodity Subsidiary’s portfolio pursuant to which the Commodity Subsidiary pays PIMCO a management fee and administrative services fee at the annual rates of 0.49% and 0.20%, respectively, of its net assets. PIMCO has contractually agreed to waive the Investment Advisory Fee and Supervisory and Administrative Fees it receives from each Commodity Subsidiary in an amount equal to the management fee and administrative services fee, respectively, paid to PIMCO by each Commodity Subsidiary. This waiver may not be terminated by PIMCO and will remain in effect for as long as PIMCO’s contract with each Commodity Subsidiary is in place. The waiver is reflected in the Consolidated Statements of Operations as a component of Waiver and/or Reimbursement by PIMCO. During the period ended June 30, 2014, the Funds below waived the following fees (amounts in thousands):
| Fund Name | Waived Fees | |||||
PIMCO Emerging Multi-Asset Fund | $ | 0 | * | |||
PIMCO EqS Pathfinder Fund® | 90 | |||||
| * | Amount is less than $500 |
10. RELATED PARTY TRANSACTIONS
The Adviser, Administrator, and Distributor are related parties. Fees payable to these parties are disclosed in Note 9 and the accrued related party fee amounts are disclosed on the Statements of Assets and Liabilities.
Certain Funds are permitted to purchase or sell securities from or to certain related affiliated funds under specified conditions outlined in procedures adopted by the Board of Trustees of the Trust. The procedures have been designed to ensure that any purchase or sale of securities by the Funds from or to another fund or portfolio that are, or
could be, considered an affiliate by virtue of having a common investment adviser (or affiliated investment advisers), common Trustees and/or common officers complies with Rule 17a-7 of the Act. Further, as defined under the procedures, each transaction is effected at the current market price. During the period ended June 30, 2014, the Funds below engaged in purchases and sales of securities pursuant to Rule 17a-7 of the Act (amounts in thousands):
| Fund Name | Purchases | Sales | ||||||||
PIMCO EqS® Dividend Fund | $ | 852 | $ | 412 | ||||||
PIMCO EqS® Emerging Markets Fund | 3,589 | 521 | ||||||||
PIMCO EqS® Long/Short Fund | 2,899 | 0 | ||||||||
PIMCO EqS Pathfinder Fund® | 1,526 | 3,494 | ||||||||
11. GUARANTEES AND INDEMNIFICATIONS
Under the Trust’s organizational documents, each Trustee or officer of the Trust is indemnified and each employee or other agent of the Trust (including the Trust’s investment manager) may be indemnified, to the extent permitted by the Act, against certain liabilities that may arise out of performance of their duties to the Funds. Additionally, in the normal course of business, the Funds enter into contracts that contain a variety of indemnification clauses. The Funds’ maximum exposure under these arrangements is unknown as this would involve future claims that may be made against the Funds that have not yet occurred. However, the Funds have not had prior claims or losses pursuant to these contracts.
12. PURCHASES AND SALES OF SECURITIES
The length of time a Fund has held a particular security is not generally a consideration in investment decisions. A change in the securities held by a Fund is known as “portfolio turnover.” Each Fund may engage in frequent and active trading of portfolio securities to achieve its investment objective, particularly during periods of volatile market movements. High portfolio turnover involves correspondingly greater expenses to a Fund, including brokerage commissions or dealer mark-ups and other transaction costs on the sale of securities and reinvestments in other securities. Such sales may also result in realization of taxable capital gains, including short-term capital gains (which are generally taxed at ordinary income tax rates). The trading costs and tax effects associated with portfolio turnover may adversely affect a Fund’s performance. The portfolio turnover rates are reported in the Financial Highlights.
Purchases and sales of securities (excluding short-term investments) for the period ended June 30, 2014, were as follows (amounts in thousands):
| U.S. Government/Agency | All Other | |||||||||||||||||
| Fund Name | Purchases | Sales | Purchases | Sales | ||||||||||||||
PIMCO Balanced Income Fund | $ | 0 | $ | 0 | $ | 5,976 | $ | 190 | ||||||||||
PIMCO Dividend and Income Builder Fund | 200 | 300 | 1,049,539 | 552,605 | ||||||||||||||
PIMCO EqS® Dividend Fund | 0 | 0 | 522,522 | 775,710 | ||||||||||||||
PIMCO EqS® Emerging Markets Fund | 0 | 4 | 260,019 | 670,630 | ||||||||||||||
PIMCO EqS® Long/Short Fund | 0 | 0 | 6,702,793 | 6,050,435 | ||||||||||||||
PIMCO Emerging Multi-Asset Fund | 0 | 0 | 9,924 | 37,343 | ||||||||||||||
PIMCO EqS Pathfinder Fund® | 0 | 0 | 1,208,865 | 2,114,997 | ||||||||||||||
| 110 | PIMCO EQUITY SERIES |
Table of Contents
June 30, 2014
13. SHARES OF BENEFICIAL INTEREST
The Trust may issue an unlimited number of shares of beneficial interest with a $0.0001 par value. Changes in shares of beneficial interest were as follows (shares and amounts in thousands):
| PIMCO Balanced Income Fund (1) | PIMCO Dividend and Income Builder Fund (2) | PIMCO EqS® Dividend Fund (3) | ||||||||||||||||||||||||||||||||||||||||
Period From 03/31/2014 to 06/30/2014 | Year Ended 06/30/2014 | Year Ended 06/30/2013 | Year Ended 06/30/2014 | Year Ended 06/30/2013 | ||||||||||||||||||||||||||||||||||||||
| Shares | Amount | Shares | Amount | Shares | Amount | Shares | Amount | Shares | Amount | |||||||||||||||||||||||||||||||||
Receipts for shares sold | ||||||||||||||||||||||||||||||||||||||||||
Institutional Class | 612 | $ | 6,184 | 4,189 | $ | 51,343 | 6,368 | $ | 72,769 | 3,183 | $ | 38,926 | 33,254 | $ | 387,790 | |||||||||||||||||||||||||||
Class P | 1 | 11 | 7,009 | 86,769 | 7,038 | 81,313 | 476 | 5,837 | 179 | 2,067 | ||||||||||||||||||||||||||||||||
Class D | 5 | 49 | 1,576 | 19,423 | 2,941 | 33,217 | 346 | 4,217 | 689 | 7,851 | ||||||||||||||||||||||||||||||||
Class A | 31 | 316 | 20,666 | 252,920 | 9,803 | 113,906 | 4,048 | 49,865 | 2,489 | 29,225 | ||||||||||||||||||||||||||||||||
Class C | 45 | 456 | 24,024 | 292,937 | 7,557 | 87,841 | 3,424 | 41,893 | 1,538 | 18,044 | ||||||||||||||||||||||||||||||||
Class R | 0 | 0 | 18 | 214 | 2 | 23 | 5 | 72 | 8 | 90 | ||||||||||||||||||||||||||||||||
Issued as reinvestment of distributions | ||||||||||||||||||||||||||||||||||||||||||
Institutional Class | 3 | 27 | 236 | 2,997 | 131 | 1,511 | 3,588 | 43,261 | 1,442 | 16,798 | ||||||||||||||||||||||||||||||||
Class P | 0 | 0 | 155 | 1,980 | 63 | 728 | 29 | 350 | 3 | 32 | ||||||||||||||||||||||||||||||||
Class D | 0 | 0 | 79 | 1,000 | 54 | 626 | 68 | 827 | 14 | 158 | ||||||||||||||||||||||||||||||||
Class A | 0 | 1 | 579 | 7,382 | 129 | 1,493 | 378 | 4,569 | 31 | 365 | ||||||||||||||||||||||||||||||||
Class C | 0 | 1 | 424 | 5,424 | 49 | 571 | 234 | 2,814 | 14 | 164 | ||||||||||||||||||||||||||||||||
Class R | 0 | 0 | 1 | 12 | 1 | 8 | 1 | 9 | 0 | 1 | ||||||||||||||||||||||||||||||||
Cost of shares redeemed | ||||||||||||||||||||||||||||||||||||||||||
Institutional Class | (1 | ) | (6 | ) | (3,499 | ) | (43,248 | ) | (1,602 | ) | (18,277 | ) | (32,005 | ) | (393,029 | ) | (16,018 | ) | (191,791 | ) | ||||||||||||||||||||||
Class P | 0 | 0 | (2,501 | ) | (31,140 | ) | (504 | ) | (5,836 | ) | (341 | ) | (4,165 | ) | (68 | ) | (799 | ) | ||||||||||||||||||||||||
Class D | (1 | ) | (5 | ) | (1,175 | ) | (14,640 | ) | (1,216 | ) | (14,121 | ) | (469 | ) | (5,867 | ) | (165 | ) | (1,857 | ) | ||||||||||||||||||||||
Class A | 0 | (4 | ) | (6,929 | ) | (85,647 | ) | (1,074 | ) | (12,458 | ) | (2,116 | ) | (25,890 | ) | (426 | ) | (5,015 | ) | |||||||||||||||||||||||
Class C | 0 | 0 | (4,970 | ) | (61,707 | ) | (873 | ) | (9,963 | ) | (1,771 | ) | (21,370 | ) | (479 | ) | (5,645 | ) | ||||||||||||||||||||||||
Class R | 0 | 0 | (3 | ) | (30 | ) | (24 | ) | (264 | ) | 0 | 0 | 0 | 0 | ||||||||||||||||||||||||||||
Net increase (decrease) resulting from Fund share transactions | 695 | $ | 7,030 | 39,879 | $ | 485,989 | 28,843 | $ | 333,087 | (20,922 | ) | $ | (257,681 | ) | 22,505 | $ | 257,478 | |||||||||||||||||||||||||
| ANNUAL REPORT | JUNE 30, 2014 | 111 |
Table of Contents
Notes to Financial Statements (Cont.)
| PIMCO EqS® Emerging Markets Fund (4) | PIMCO EqS® Long/Short Fund (5) | PIMCO Emerging Multi-Asset Fund (6) | ||||||||||||||||||||||||||||||||||||||||||||||||
| Year Ended 06/30/2014 | Year Ended 06/30/2013 | Year Ended 06/30/2014 | Year Ended 06/30/2013 | Year Ended 06/30/2014 | Year Ended 06/30/2013 | |||||||||||||||||||||||||||||||||||||||||||||
| Shares | Amount | Shares | Amount | Shares | Amount | Shares | Amount | Shares | Amount | Shares | Amount | |||||||||||||||||||||||||||||||||||||||
Receipts for shares sold | ||||||||||||||||||||||||||||||||||||||||||||||||||
Institutional Class | 13,465 | $ | 112,700 | 7,691 | $ | 66,152 | 25,485 | $ | 307,495 | 9,876 | $ | 99,250 | 395 | $ | 3,452 | 2,839 | $ | 26,656 | ||||||||||||||||||||||||||||||||
Class P | 299 | 2,635 | 943 | 8,577 | 28,084 | 337,222 | 1,663 | 17,754 | 79 | 685 | 201 | 1,874 | ||||||||||||||||||||||||||||||||||||||
Administrative Class | 0 | 2 | 2 | 13 | 0 | 0 | 0 | 0 | 13 | 107 | 245 | 2,296 | ||||||||||||||||||||||||||||||||||||||
Class D | 250 | 2,104 | 814 | 7,357 | 14,367 | 171,591 | 1,219 | 13,332 | 175 | 1,521 | 579 | 5,376 | ||||||||||||||||||||||||||||||||||||||
Class A | 410 | 3,496 | 413 | 3,589 | 39,367 | 468,634 | 2,511 | 27,131 | 378 | 3,256 | 657 | 6,039 | ||||||||||||||||||||||||||||||||||||||
Class C | 161 | 1,368 | 119 | 1,036 | 20,087 | 237,386 | 917 | 9,771 | 121 | 1,041 | 332 | 3,041 | ||||||||||||||||||||||||||||||||||||||
Class R | 0 | 1 | 0 | 0 | 0 | 0 | 0 | 0 | 0 | 0 | 5 | 43 | ||||||||||||||||||||||||||||||||||||||
Issued as reinvestment of distributions | ||||||||||||||||||||||||||||||||||||||||||||||||||
Institutional Class | 0 | 0 | 668 | 5,839 | 2,198 | 26,087 | 110 | 1,029 | 54 | 469 | 82 | 758 | ||||||||||||||||||||||||||||||||||||||
Class P | 0 | 0 | 0 | 2 | 449 | 5,314 | 1 | 9 | 4 | 33 | 5 | 47 | ||||||||||||||||||||||||||||||||||||||
Administrative Class | 0 | 0 | 0 | 0 | 0 | 0 | 0 | 0 | 4 | 31 | 0 | 2 | ||||||||||||||||||||||||||||||||||||||
Class D | 0 | 0 | 1 | 10 | 261 | �� | 3,080 | 0 | 2 | 10 | 89 | 9 | 84 | |||||||||||||||||||||||||||||||||||||
Class A | 0 | 0 | 4 | 32 | 779 | 9,186 | 2 | 15 | 20 | 175 | 35 | 325 | ||||||||||||||||||||||||||||||||||||||
Class C | 0 | 0 | 1 | 6 | 452 | 5,276 | 0 | 2 | 6 | 53 | 11 | 101 | ||||||||||||||||||||||||||||||||||||||
Class R | 0 | 0 | 0 | 0 | 0 | 0 | 0 | 0 | 0 | 0 | 0 | 1 | ||||||||||||||||||||||||||||||||||||||
Cost of shares redeemed | ||||||||||||||||||||||||||||||||||||||||||||||||||
Institutional Class | (61,620 | ) | (527,651 | ) | (12,854 | ) | (112,211 | ) | (11,631 | ) | (138,097 | ) | (2,145 | ) | (21,301 | ) | (2,346 | ) | (20,139 | ) | (2,169 | ) | (19,712 | ) | ||||||||||||||||||||||||||
Class P | (1,215 | ) | (9,891 | ) | (27 | ) | (241 | ) | (6,576 | ) | (77,557 | ) | (251 | ) | (2,460 | ) | (142 | ) | (1,224 | ) | (205 | ) | (1,899 | ) | ||||||||||||||||||||||||||
Administrative Class | (5 | ) | (42 | ) | (1 | ) | (6 | ) | 0 | 0 | 0 | 0 | (254 | ) | (2,122 | ) | (8 | ) | (77 | ) | ||||||||||||||||||||||||||||||
Class D | (292 | ) | (2,491 | ) | (806 | ) | (7,300 | ) | (9,167 | ) | (107,763 | ) | (107 | ) | (1,098 | ) | (574 | ) | (4,944 | ) | (492 | ) | (4,437 | ) | ||||||||||||||||||||||||||
Class A | (223 | ) | (1,892 | ) | (201 | ) | (1,683 | ) | (10,075 | ) | (118,408 | ) | (398 | ) | (4,244 | ) | (970 | ) | (8,347 | ) | (418 | ) | (3,811 | ) | ||||||||||||||||||||||||||
Class C | (99 | ) | (810 | ) | (37 | ) | (310 | ) | (3,031 | ) | (35,277 | ) | (54 | ) | (588 | ) | (304 | ) | (2,577 | ) | (188 | ) | (1,702 | ) | ||||||||||||||||||||||||||
Class R | (2 | ) | (16 | ) | 0 | 0 | 0 | 0 | 0 | 0 | (3 | ) | (21 | ) | (2 | ) | (20 | ) | ||||||||||||||||||||||||||||||||
Net increase (decrease) resulting from Fund share transactions | | (48,871 | ) | $ | (420,487 | ) | (3,270 | ) | $ | (29,138 | ) | 91,049 | $ | 1,094,169 | 13,344 | $ | 138,604 | (3,334 | ) | $ | (28,462 | ) | 1,518 | $ | 14,985 | |||||||||||||||||||||||||
| 112 | PIMCO EQUITY SERIES |
Table of Contents
June 30, 2014
| PIMCO EqS Pathfinder Fund® (7) | ||||||||||||||||||
| Year Ended 06/30/2014 | Year Ended 06/30/2013 | |||||||||||||||||
| Shares | Amount | Shares | Amount | |||||||||||||||
Receipts for shares sold | ||||||||||||||||||
Institutional Class | 75,318 | $ | 884,620 | 7,010 | $ | 73,964 | ||||||||||||
Class P | 2,101 | 24,607 | 2,524 | 26,912 | ||||||||||||||
Administrative Class | 0 | 0 | 0 | 0 | ||||||||||||||
Class D | 390 | 4,500 | 1,048 | 11,044 | ||||||||||||||
Class A | 2,414 | 28,403 | 1,519 | 16,076 | ||||||||||||||
Class C | 2,336 | 26,962 | 601 | 6,376 | ||||||||||||||
Class R | 4 | 43 | 0 | 3 | ||||||||||||||
Issued as reinvestment of distributions | ||||||||||||||||||
Institutional Class | 7,387 | 86,726 | 5,607 | 57,868 | ||||||||||||||
Class P | 205 | 2,400 | 127 | 1,307 | ||||||||||||||
Administrative Class | 0 | 0 | 0 | 0 | ||||||||||||||
Class D | 50 | 587 | 62 | 631 | ||||||||||||||
Class A | 189 | 2,209 | 143 | 1,472 | ||||||||||||||
Class C | 116 | 1,324 | 81 | 820 | ||||||||||||||
Class R | 0 | 0 | 0 | 0 | ||||||||||||||
Cost of shares redeemed | ||||||||||||||||||
Institutional Class | (142,724 | ) | (1,714,685 | ) | (47,263 | ) | (503,207 | ) | ||||||||||
Class P | (5,697 | ) | (68,114 | ) | (3,603 | ) | (37,955 | ) | ||||||||||
Administrative Class | 0 | 0 | 0 | 0 | ||||||||||||||
Class D | (1,005 | ) | (11,718 | ) | (1,296 | ) | (13,691 | ) | ||||||||||
Class A | (1,763 | ) | (20,894 | ) | (3,052 | ) | (32,290 | ) | ||||||||||
Class C | (1,076 | ) | (12,464 | ) | (2,031 | ) | (21,199 | ) | ||||||||||
Class R | 0 | 0 | 0 | 0 | ||||||||||||||
Net increase (decrease) resulting from Fund share transactions | (61,755 | ) | $ | (765,494 | ) | (38,523 | ) | $ | (411,869 | ) | ||||||||
| (1) | As of June 30, 2014, two shareholders each owned 10% or more of the total Fund’s outstanding shares comprising 86% of the Fund. One shareholder is a related party of the Fund and comprises 44% of the Fund.* |
| (2) | As of June 30, 2014, two shareholders each owned 10% or more of the total Fund’s outstanding shares comprising 27% of the Fund. |
| (3) | As of June 30, 2014, three shareholders each owned 10% or more of the total Fund’s outstanding shares comprising 57% of the Fund. |
| (4) | As of June 30, 2014, three shareholders each owned 10% or more of the total Fund’s outstanding shares comprising 56% of the Fund. |
| (5) | As of June 30, 2014, four shareholders each owned 10% or more of the total Fund’s outstanding shares comprising 46% of the Fund. One shareholder is a related party of the Fund and comprises 11% of the Fund.* |
| (6) | As of June 30, 2014, two shareholders each owned 10% or more of the total Fund’s outstanding shares comprising 63% of the Fund. |
| (7) | As of June 30, 2014, two shareholders each owned 10% or more of the total Fund’s outstanding shares comprising 72% of the Fund, and each of the two shareholders are related parties of the Fund.* |
| * | Related parties may include, but are not limited to, the investment manager and its affiliates, affiliated broker dealers, fund of funds and directors or employees of the Trust or Adviser. |
14. REGULATORY AND LITIGATION MATTERS
The Trust is not engaged in any material litigation or arbitration proceedings and is not aware of any material litigation or claim pending or threatened by or against it.
15. FEDERAL INCOME TAX MATTERS
Each Fund intends to qualify as a regulated investment company under Subchapter M of the Internal Revenue Code (the “Code”) and distribute all of its taxable income and net realized gains, if applicable, to shareholders. Accordingly, no provision for Federal income taxes has been made.
In accordance with provisions set forth under U.S. GAAP, the Adviser has reviewed the Funds’ tax positions for all open tax years. As of June 30, 2014, the Funds have recorded no liability for net unrecognized tax benefits relating to uncertain income tax positions they have taken or expect to take in future tax returns.
The Funds file U.S. tax returns. While the statute of limitations remains open to examine the Funds’ U.S. tax returns filed for the fiscal years ending in 2011-2013, no examinations are in progress or anticipated at this time. The Funds are not aware of any tax positions for which it is reasonably possible that the total amounts of unrecognized tax benefits will significantly change in the next twelve months.
| ANNUAL REPORT | JUNE 30, 2014 | 113 |
Table of Contents
Notes to Financial Statements (Cont.)
The Consolidated Funds may gain exposure to the commodities markets primarily through index-linked notes, and may invest in other commodity-linked derivative investments, including commodity swap agreements, options, futures contracts, options on futures contracts and foreign funds investing in similar commodity-linked derivatives.
One of the requirements for favorable tax treatment as a regulated investment company under the Code is that a Fund must derive at least 90% of its gross income from certain qualifying sources of income. The IRS has issued a revenue ruling which holds that income derived from commodity index-linked swaps is not qualifying income under Subchapter M of the Code. The IRS has also issued private letter rulings in which the IRS specifically concluded that income from certain commodity index-linked notes is qualifying income. The IRS has also issued private rulings in which the IRS specifically concluded that income derived from investment in a subsidiary, which invests primarily in commodity-linked swaps, will also be qualifying income. Based on the reasoning in such rulings, each Fund will continue to seek to gain exposure to the commodity markets primarily through investments in commodity-linked notes and through any investments in its Subsidiary.
It should be noted, however, that the IRS currently has suspended the issuance of such rulings pending further review. There can be no assurance that the IRS will not change its position that income derived from commodity-linked notes and wholly-owned subsidiaries is qualifying income. Furthermore, the tax treatment of commodity-linked notes, other commodity-linked derivatives, and a Fund’s investments in its Subsidiary may otherwise be adversely affected by future legislation, Treasury Regulations and/or guidance issued by the IRS. Such developments could affect the character, timing and/or amount of the Fund’s taxable income or any distributions made by the Fund or result in the inability of the Fund to operate as described in its Prospectus.
If, during a taxable year, the Commodity Subsidiary’s taxable losses (and other deductible items) exceed its income and gains, the net loss will not pass through to the Fund as a deductible amount for income tax purposes. In the event the Commodity Subsidiary’s taxable gains exceed its losses and other deductible items during a taxable year, the net gain will pass through to the Fund as income for Federal income tax purposes.
As of June 30, 2014, the components of distributable taxable earnings are as follows (amounts in thousands):
| Undistributed Ordinary Income | Undistributed Long-Term Capital Gains | Net Tax Basis Unrealized Appreciation/ (Depreciation) (1) | Other Book-to-Tax Accounting Differences (2) | Accumulated Capital Losses (3) | Qualified Post-October Loss Deferral Capital (4) | Qualified Late-Year Loss Deferral Ordinary (5) | ||||||||||||||||||||||||
PIMCO Balanced Income Fund | $ | 5 | $ | — | $ | 90 | $ | (4 | ) | $ | — | $ | — | $ | — | |||||||||||||||
PIMCO Dividend and Income Builder Fund | 2,578 | 13,736 | 78,945 | (2,266 | ) | — | — | — | ||||||||||||||||||||||
PIMCO EqS® Dividend Fund | 5,489 | 29,476 | 48,310 | (26 | ) | — | — | — | ||||||||||||||||||||||
PIMCO EqS® Emerging Markets Fund | — | — | (2,496 | ) | — | (32,046 | ) | — | (2,267 | ) | ||||||||||||||||||||
PIMCO EqS® Long/Short Fund | — | 5,138 | 86,049 | — | — | (33,971 | ) | (9,678 | ) | |||||||||||||||||||||
PIMCO Emerging Multi-Asset Fund | 625 | — | (2,320 | ) | — | (2,832 | ) | — | — | |||||||||||||||||||||
PIMCO EqS Pathfinder Fund® | 27,161 | 227,298 | 204,804 | (3 | ) | — | — | — | ||||||||||||||||||||||
| (1) | Adjusted for open wash sale loss deferrals and accelerated recognition of unrealized gain on certain futures, forward contracts, partnership investments, adjustments for real estate investment trusts, short dividend expenditures, and passive foreign investment companies for federal income tax purposes. Also adjusted for differences between book and tax realized and unrealized gain/loss on swap contracts. |
| (2) | Represents differences in income tax regulations and financial accounting principles generally accepted in the United States of America, mainly for straddle loss deferrals and distribution payables. |
| (3) | Capital losses available to offset future net capital gains expire in varying amounts in the years shown below. |
| (4) | Capital losses realized during the period November 1, 2013 through June 30, 2014, which the Fund elected to defer to the following taxable year pursuant to income tax regulations. |
| (5) | Specified losses realized during the period November 1, 2013 through June 30, 2014 and Ordinary losses realized during the period January 1, 2014 through June 30, 2014, which the Fund elected to defer to the following taxable year pursuant to income tax regulations. |
As of June 30, 2014, the Fund had accumulated capital losses expiring in the following years (amounts in thousands).
The Fund will resume capital gain distributions in the future to the extent gains are realized in excess of accumulated capital losses.
| 114 | PIMCO EQUITY SERIES |
Table of Contents
June 30, 2014
Under the Regulated Investment Company Modernization Act of 2010, a fund is permitted to carry forward any new capital losses for an unlimited period. Additionally, such capital losses that are carried forward will retain their character as either short-term or long-term capital losses rather than being considereed all short-term under previous law.
As of June 30, 2014, the Fund had the following post-effective capital losses with no expiration:
| Short-Term | Long-Term | |||||||||
PIMCO Balanced Income Fund | $ | — | $ | — | ||||||
PIMCO Dividend and Income Builder Fund | — | — | ||||||||
PIMCO EqS® Dividend Fund | — | — | ||||||||
PIMCO EqS® Emerging Markets Fund* | 31,562 | 484 | ||||||||
PIMCO EqS® Long/Short Fund | — | — | ||||||||
PIMCO Emerging Multi-Asset Fund | 313 | 2,519 | ||||||||
PIMCO EqS Pathfinder Fund® | — | — | ||||||||
| * | Portion of amount represents realized loss under IRC 382-383, which is carried forward to future years to offset future realized gain subject to certain limitations. |
As of June 30, 2014, the aggregate cost and the net unrealized appreciation/(depreciation) of investments for federal income tax purposes are as follows (amounts in thousands):
| Federal Tax Cost | Unrealized Appreciation | Unrealized (Depreciation) | Net Unrealized Appreciation/ (Depreciation) (6) | |||||||||||||||
PIMCO Balanced Income Fund | $ | 6,977 | $ | 139 | $ | (50 | ) | $ | 89 | |||||||||
PIMCO Dividend and Income Builder Fund | 878,452 | 97,842 | (18,919 | ) | 78,923 | |||||||||||||
PIMCO EqS® Dividend Fund | 363,165 | 55,977 | (7,709 | ) | 48,268 | |||||||||||||
PIMCO EqS® Emerging Markets Fund | 110,374 | 9,981 | (13,230 | ) | (3,249 | ) | ||||||||||||
PIMCO EqS® Long/Short Fund | 1,474,490 | 94,412 | (5,262 | ) | 89,150 | |||||||||||||
PIMCO Emerging Multi-Asset Fund | 39,291 | 102 | (2,393 | ) | (2,291 | ) | ||||||||||||
PIMCO EqS Pathfinder Fund® | 1,238,093 | 218,722 | (12,283 | ) | 206,439 | |||||||||||||
| (6) | Primary differences, if any, between book and tax net unrealized appreciation/(depreciation) on investments are attributable to open wash sale loss deferrals, partnership investments, adjustments for real estate investment trusts, short dividend expenditures, and passive foreign investment companies. |
For the fiscal years ended June 30, 2014 and June 30, 2013, respectively, the Funds made the following tax basis distributions (amounts in thousands):
| June 30, 2014 | June 30, 2013 | |||||||||||||||||||||||||
| Ordinary Income Distributions (7) | Long-Term Capital Gain Distributions | Return of Capital (8) | Ordinary Income Distributions (7) | Long-Term Capital Gain Distributions | Return of Capital (8) | |||||||||||||||||||||
PIMCO Balanced Income Fund | $ | 29 | $ | — | $ | — | $ | — | $ | — | $ | — | ||||||||||||||
PIMCO Dividend and Income Builder Fund | 24,718 | — | — | 6,330 | 62 | — | ||||||||||||||||||||
PIMCO EqS® Dividend Fund | 31,423 | 20,784 | — | 17,225 | 410 | — | ||||||||||||||||||||
PIMCO EqS® Emerging Markets Fund | — | — | — | 5,890 | — | — | ||||||||||||||||||||
PIMCO EqS® Long/Short Fund | 30,906 | 18,291 | — | 1,057 | — | — | ||||||||||||||||||||
PIMCO Emerging Multi-Asset Fund | 850 | — | — | 1,339 | — | — | ||||||||||||||||||||
PIMCO EqS Pathfinder Fund® | 42,766 | 51,490 | — | 62,835 | — | — | ||||||||||||||||||||
| (7) | Includes short-term capital gains, if any, distributed. |
| (8) | A portion of the distributions made represents a tax return of of capital. Return of capital distributions have been reclassified from undistributed net investment income to paid-in capital to more appropriately conform financial accounting to tax accounting. |
| ANNUAL REPORT | JUNE 30, 2014 | 115 |
Table of Contents
Report of Independent Registered Public Accounting Firm
To the Board of Trustees and Shareholders of the PIMCO Equity Series:
In our opinion, the accompanying statements of assets and liabilities, including the schedules of investments, and the related statements of operations, of changes in net assets and of cash flows and the financial highlights present fairly, in all material respects, the financial position of PIMCO Balanced Income Fund, PIMCO Dividend and Income Builder Fund, PIMCO EqS® Dividend Fund, PIMCO EqS® Emerging Markets Fund, PIMCO EqS® Long/Short Fund, PIMCO Emerging Multi-Asset Fund and PIMCO EqS Pathfinder Fund® (constituting PIMCO Equity Series®, hereinafter referred to as the “Funds”) at June 30, 2014, the results of their operations, the changes in each of their net assets, the cash flows for PIMCO EqS Long/Short Fund, and financial highlights of the Funds for each of the periods presented, in conformity with accounting principles generally accepted in the United States of America. These financial statements (consolidated financial statements for PIMCO Emerging Multi-Asset Fund and PIMCO EqS Pathfinder Fund®) and financial highlights (hereafter referred to as “financial statements”) are the responsibility of the Funds’ management. Our responsibility is to express an opinion on these financial statements based on our audits. We conducted our audits of these financial statements in accordance with the standards of the Public Company Accounting Oversight Board (United States). Those standards require that we plan and perform the audits to obtain reasonable assurance about whether the financial statements are free of material misstatement. An audit includes examining, on a test basis, evidence supporting the amounts and disclosures in the financial statements, assessing the accounting principles used and significant estimates made by management, and evaluating the overall financial statement presentation. We believe that our audits, which included confirmation of securities at June 30, 2014 by correspondence with the custodian and brokers, provide a reasonable basis for our opinion.
PricewaterhouseCoopers LLP
Kansas City, Missouri
August 15, 2014
| 116 | PIMCO EQUITY SERIES |
Table of Contents
Federal Income Tax Information
(Unaudited)
As required by the Internal Revenue Code (“Code”) and Treasury Regulations, if applicable, shareholders must be notified within 60 days of the Fund’s fiscal year end regarding the status of qualified dividend income, the dividend received deduction, foreign source income earned by the fund, and any. foreign tax credits being passed through to shareholders.
Qualified Dividend Income. Under the Jobs and Growth Tax Relief Reconciliation Act of 2003 (the “Act”), the following percentages of ordinary dividends paid during the fiscal year ended June 30, 2014 are designated as “qualified dividend income”, as defined in the Act, subject to reduced tax rates.
PIMCO Balanced Income Fund | 65.32% | |||||
PIMCO Dividend and Income Builder Fund | 90.07% | |||||
PIMCO EqS® Dividend Fund | 56.39% | |||||
PIMCO EqS® Emerging Markets Fund | 0.00% | |||||
PIMCO EqS® Long/Short Fund | 14.14% | |||||
PIMCO Emerging Multi-Asset Fund | 0.00% | |||||
PIMCO EqS Pathfinder Fund® | 100.00% |
Dividend Received Deduction. Corporate shareholders are generally entitled to take the dividend received deduction on the portion of a Fund’s dividend distribution that qualifies under tax law. The percentage of each Fund’s fiscal 2014 ordinary income dividends that qualifies for the corporate dividend received deduction is set forth below.
PIMCO Balanced Income Fund | 28.31% | |||||
PIMCO Dividend and Income Builder Fund | 41.30% | |||||
PIMCO EqS® Dividend Fund | 26.50% | |||||
PIMCO EqS® Emerging Markets Fund | 0.00% | |||||
PIMCO EqS® Long/Short Fund | 14.34% | |||||
PIMCO Emerging Multi-Asset Fund | 0.00% | |||||
PIMCO EqS Pathfinder Fund® | 39.43% |
Qualified Interest Income and Qualified Short-Term Capital Gain (for non-U.S. resident shareholders only). Under the American Jobs Creation Act of 2004, the following amounts of ordinary dividends paid during the fiscal year ended June 30, 2014 are considered to be derived from “qualified interest income,” as defined in Section 871(k)(1)(E) of the Code, and therefore are designated as interest-related dividends, as defined in Section 871(k)(1)(C) of the Code. Further, the following amounts of ordinary dividends paid during the fiscal year ended June 30, 2014 are considered to be derived from “qualified short-term capital gain,” as defined in Section 871(k)(2)(D) of the Code, and therefore are designated as qualified short-term gain dividends, as defined by Section 871(k)(2)(C)of the code.
| Qualified Interest Income (000s) | Qualified Short Term Capital Gain (000s) | |||||||||
PIMCO Balanced Income Fund | $ | — | $ | — | ||||||
PIMCO Dividend and Income Builder Fund | 2,567 | — | ||||||||
PIMCO EqS® Dividend Fund | — | 9,972 | ||||||||
PIMCO EqS® Emerging Markets Fund | — | — | ||||||||
PIMCO EqS® Long/Short Fund | — | 27,487 | ||||||||
PIMCO Emerging Multi-Asset Fund | 849 | — | ||||||||
PIMCO EqS Pathfinder Fund® | — | 1,764 | ||||||||
| ANNUAL REPORT | JUNE 30, 2014 | 117 |
Table of Contents
Federal Income Tax Information (Cont.)
(Unaudited)
The following Funds designate the amounts below as long term capital gain dividends paid during the year ended June 30, 2014 (amounts in thousands):
PIMCO Balanced Income Fund | $ | — | ||||
PIMCO Dividend and Income Builder Fund | — | |||||
PIMCO EqS® Dividend Fund | 27,812 | |||||
PIMCO EqS® Emerging Markets Fund | — | |||||
PIMCO EqS® Long/Short Fund | 18,291 | |||||
PIMCO Emerging Multi-Asset Fund | — | |||||
PIMCO EqS Pathfinder Fund® | 124,904 |
Foreign Taxes. PIMCO EqS® Emerging Markets Fund and PIMCO EqS Pathfinder Fund® earned foreign source income of $7,332,517 and $46,481,807 respectively, during the year ended June 30, 2014. The funds have made an election under Internal Revenue Code Section 853 to pass through foreign taxes paid in the amount of $652,652 and $3,949,254 respectively, to shareholders. Shareholders will receive more detailed information along with their Form 1099-DIV.
Shareholders are advised to consult their own tax advisor with respect to the tax consequences of their investment in the Trust. In January 2015, you will be advised on IRS Form 1099-DIV as to the federal tax status of the dividends and distributions received by you in calendar year 2014.
| 118 | PIMCO EQUITY SERIES |
Table of Contents
Glossary: (abbreviations that may be used in the preceding statements)
(Unaudited)
| Counterparty Abbreviations: | ||||||||||
| AZD | Australia and New Zealand Banking Group | FBF | Credit Suisse International | RBC | Royal Bank of Canada | |||||
| BOA | Bank of America N.A. | FOB | Credit Suisse Securities (USA) LLC | RYL | Royal Bank of Scotland Group PLC | |||||
| BOS | Banc of America Securities LLC | GLM | Goldman Sachs Bank USA | SCX | Standard Chartered Bank | |||||
| BPG | BNP Paribas Securities Corp. | GSC | Goldman Sachs & Co. | SOG | Societe Generale | |||||
| BPS | BNP Paribas S.A. | GST | Goldman Sachs International | SSB | State Street Bank and Trust Co. | |||||
| BRC | Barclays Bank PLC | HUS | HSBC Bank USA N.A. | UAG | UBS AG Stamford | |||||
| CBK | Citibank N.A. | JPM | JPMorgan Chase Bank N.A. | UBS | UBS Securities LLC | |||||
| DUB | Deutsche Bank AG | MSC | Morgan Stanley & Co., Inc. | |||||||
| Currency Abbreviations: | ||||||||||
| AUD | Australian Dollar | HKD | Hong Kong Dollar | PHP | Philippine Peso | |||||
| BRL | Brazilian Real | HUF | Hungarian Forint | PLN | Polish Zloty | |||||
| CAD | Canadian Dollar | IDR | Indonesian Rupiah | RUB | Russian Ruble | |||||
| CHF | Swiss Franc | ILS | Israeli Shekel | SEK | Swedish Krona | |||||
| CLP | Chilean Peso | INR | Indian Rupee | SGD | Singapore Dollar | |||||
| CNY | Chinese Renminbi | JPY | Japanese Yen | THB | Thai Baht | |||||
| COP | Colombian Peso | KRW | South Korean Won | TRY | Turkish New Lira | |||||
| CZK | Czech Koruna | MXN | Mexican Peso | TWD | Taiwanese Dollar | |||||
| DKK | Danish Krone | MYR | Malaysian Ringgit | USD (or $) | United States Dollar | |||||
| EUR | Euro | NOK | Norwegian Krone | ZAR | South African Rand | |||||
| GBP | British Pound | PEN | Peruvian New Sol | |||||||
| Exchange Abbreviations: | ||||||||||
| CBOE | Chicago Board Options Exchange | |||||||||
| Index Abbreviations: | ||||||||||
| KOSPI | Korea Composite Stock Price Index | |||||||||
| Other Abbreviations: | ||||||||||
| ABS | Asset-Backed Security | JSC | Joint Stock Company | RBOB | Reformulated Blendstock for Oxygenate Blending | |||||
| ADR | American Depositary Receipt | LIBOR | London Interbank Offered Rate | REIT | Real Estate Investment Trust | |||||
| ALT | Alternate Loan Trust | MSCI | Morgan Stanley Capital International | SP - ADR | Sponsored American Depositary Receipt | |||||
| EURIBOR | Euro Interbank Offered Rate | PIK | Payment-in-Kind | TBD | To Be Determined | |||||
| GDR | Global Depositary Receipt | |||||||||
| ANNUAL REPORT | JUNE 30, 2014 | 119 |
Table of Contents
The chart below identifies the Trustees and Officers of the Trust. Each “interested” Trustee as defined by the 1940 Act, is indicated by an asterisk (*). Unless otherwise indicated, the address of all persons below is 650 Newport Center Drive, Newport Beach, CA 92660.
The Fund’s Statement of Additional Information includes more information about the Trustees and Officers. To request a free copy, call PIMCO at (888) 87-PIMCO or visit the Fund’s website at www.pimco.com/investments.
Trustees of the Trust
Name, Year of Birth and Position Held with Trust | Term of Office† and Length of Time Served | Principal Occupation(s) During Past 5 Years | Number of Funds in Fund Complex Overseen by Trustee | Other Directorships Held by Trustee | ||||
Interested Trustees | ||||||||
Brent R. Harris* (1959) Chairman of the Board | 03/2010 to present | Managing Director and member of Executive Committee, PIMCO. | 175 | Chairman and Trustee, PIMCO Funds, PIMCO Variable Insurance Trust, PIMCO ETF Trust, PIMCO Equity Series VIT; Director, StocksPLUS® Management, Inc.; Director, Applied Natural Gas Fuels, Inc. and member of Board of Governors, Investment Company Institute. Board Member and Owner, Harris Holdings, LLC (1992-present); Director, Applied Natural Gas Fuels, Inc. (2012-present) | ||||
Independent Trustees | ||||||||
E. Philip Cannon (1940) Trustee | 03/2010 to present | Private Investor. Formerly, President, Houston Zoo. | 175 | Trustee, PIMCO Equity Series VIT; Trustee, PIMCO ETF Trust; Trustee, PIMCO Funds; and Trustee, PIMCO Variable Insurance Trust. | ||||
Peter B. McCarthy (1950) Trustee | 09/2011 to present | Formerly, Assistant Secretary and Chief Financial Officer, United States Department of Treasury; Deputy Managing Director, Institute of International Finance. | 8 | Trustee, PIMCO Equity Series VIT | ||||
† Trustees serve until their successors are duly elected and qualified.
* Mr. Harris is an “interested person” of the Trust (as that term is defined in the 1940 Act) because of his affiliation with PIMCO.
| 120 | PIMCO EQUITY SERIES |
Table of Contents
(Unaudited)
Executive Officers
| Name, Year of Birth and Position Held with Trust | Term of Office and Length of Time Served | Principal Occupation(s) During Past 5 Years | ||
Peter G. Strelow (1970) President | 02/2014 to Present Senior Vice President 11/2013 to 02/2014 | Managing Director, PIMCO. | ||
David C. Flattum (1964) Chief Legal Officer | 03/2010 to Present | Managing Director and General Counsel, PIMCO. Formerly, Managing Director, Chief Operating Officer and General Counsel, Allianz Asset Management of America L.P. and Partner at Latham & Watkins LLP. | ||
Jennifer E. Durham (1970) Chief Compliance Officer | 03/2010 to Present | Managing Director, PIMCO. | ||
William H. Gross (1944) Senior Vice President | 03/2010 to Present | Managing Director and Chief Investment Officer, PIMCO. | ||
Brent R. Harris (1959) Senior Vice President | 03/2010 to Present | Managing Director and member of Executive Committee, PIMCO. | ||
Douglas M. Hodge (1957) Senior Vice President | 02/2014 to Present President | Managing Director, Chief Executive Officer, PIMCO (Since 2/14) and Chief Operating Officer, PIMCO (7/09-2/14); Member of Executive Committee and Head of PIMCO’s Asia Pacific region. Member Global Executive Committee, Allianz Asset Management. | ||
William G. Galipeau (1974) Vice President | 11/2013 to Present | Senior Vice President, PIMCO. | ||
Eric D. Johnson (1970) Vice President | 05/2011 to Present | Executive Vice President, PIMCO. | ||
Henrik P. Larsen (1970) Vice President | 03/2010 to Present | Senior Vice President, PIMCO. | ||
Greggory S. Wolf (1970) Vice President | 05/2011 to Present | Senior Vice President, PIMCO. | ||
Kevin M. Broadwater (1964) Vice President - Senior Counsel | 05/2012 to Present | Executive Vice President and Attorney, PIMCO. | ||
Joshua D. Ratner (1976) Vice President - Senior Counsel, Secretary | 11/2013 to Present Assistant Secretary 03/2010 to 01/2011 | Senior Vice President and Attorney, PIMCO. | ||
Ryan G. Leshaw (1980) Assistant Secretary | 05/2012 to Present | Vice President and Attorney, PIMCO. Formerly, Associate, Willkie Farr & Gallagher LLP. | ||
Trent W. Walker (1974) Treasurer | 11/2013 to Present Assistant Treasurer 03/2010 to 11/2013 | Senior Vice President, PIMCO. | ||
Stacie D. Anctil (1969) Assistant Treasurer | 03/2010 to Present | Senior Vice President, PIMCO. | ||
Erik C. Brown (1967) Assistant Treasurer | 03/2010 to Present | Senior Vice President, PIMCO. | ||
| ANNUAL REPORT | JUNE 30, 2014 | 121 |
Table of Contents
(Unaudited)
The Funds1,2 consider customer privacy to be a fundamental aspect of their relationships with shareholders and are committed to maintaining the confidentiality, integrity and security of its current, prospective and former shareholders’ personal information. The Funds have developed policies that are designed to protect this confidentiality, while allowing shareholder needs to be served.
Obtaining Personal Information
In the course of providing shareholders with products and services, the Funds and certain service providers to the Funds, such as the Funds’ investment adviser (“Adviser”), may obtain non-public personal information about shareholders, which may come from sources such as account applications and other forms, from other written, electronic or verbal correspondence, from shareholder transactions, from a shareholder’s brokerage or financial advisory firm, financial advisor or consultant, and/or from information captured on the Funds’ internet websites.
Respecting Your Privacy
As a matter of policy, the Funds do not disclose any personal or account information provided by shareholders or gathered by the Funds to non-affiliated third parties, except as required or permitted by law or as necessary for such third parties to perform their agreements with respect to the Funds. As is common in the industry, non-affiliated companies may from time to time be used to provide certain services, such as preparing and mailing prospectuses, reports, account statements and other information, conducting research on shareholder satisfaction and gathering shareholder proxies. The Funds’ distributor may also retain non-affiliated companies to market the Funds’ shares or products which use the Funds’ shares and enter into joint marketing arrangements with them and other companies. These companies may have access to a shareholder’s personal and account information, but are permitted to use this information solely to provide the specific service or as otherwise permitted by law. In most cases, the shareholders will be clients of a third party, but the Funds may also provide a shareholder’s personal and account information to the shareholder’s respective brokerage or financial advisory firm and/or financial advisor or consultant.
Sharing Information with Third Parties
The Funds reserve the right to disclose or report personal information to non-affiliated third parties in limited circumstances where the Funds believe in good faith that disclosure is required under law, to cooperate with regulators or law enforcement authorities, to protect its rights or property, or upon reasonable request by any investment fund managed by the Adviser in which a shareholder has invested. In addition, the Funds may disclose information about a shareholder’s accounts to a non-affiliated third party at the shareholder’s request or with the consent of the shareholder.
Sharing Information with Affiliates
The Funds may share shareholder information with its affiliates in connection with servicing shareholders’ accounts, and subject to applicable law may provide shareholders with information about products and services that the Funds or their Adviser, distributors or their affiliates (“Service Affiliates”) believe may be of interest to such shareholders. The information that the Funds may share may include, for example, a shareholder’s participation in the Funds or in other investment programs sponsored by a Service Affiliate, a shareholder’s ownership of certain types of accounts (such as IRAs), information about the Funds’ experiences or transactions with a shareholder, information captured on the Funds’ internet websites, or other data about a shareholder’s accounts, subject to applicable law. The Funds’ Service Affiliates, in turn, are not permitted to share shareholder information with non-affiliated entities, except as required or permitted by law.
Procedures to Safeguard Private Information
The Funds take seriously the obligation to safeguard shareholder non-public personal information. In addition to this policy, the Funds have implemented procedures that are designed to restrict access to a shareholder’s non-public personal information to internal personnel who need to know that information to perform their jobs, such as servicing shareholder accounts or notifying shareholders of new products or services. Physical, electronic and procedural safeguards are in place to guard a shareholder’s non-public personal information.
1 PIMCO Investments LLC (“PI”) serves as the Funds’ distributor. This Privacy Policy applies to the activities of PI to the extent that PI regularly effects or engages in transactions with or for a Fund shareholder who is the record owner of such shares. For purposes of this Privacy Policy, references to “the Funds” shall include PI when acting in this capacity.
2 When distributing this Policy, a Fund may combine the distribution with any similar distribution of its investment adviser’s privacy policy. The distributed, combined, policy may be written in the first person (i.e., by using “we” instead of “the Funds”).
| 122 | PIMCO EQUITY SERIES |
Table of Contents
Approval of Investment Management Agreement
(Unaudited)
Approval of the Investment Advisory Contract and Second Amended and Restated Supervision and Administration Agreement for PIMCO Balanced Income Fund
On November 7, 2013, the Board of Trustees (the “Board”) of PIMCO Equity Series (the “Trust”), including all of the independent Trustees (the “Independent Trustees”), approved the Investment Advisory Contract and the Second Amended and Restated Supervision and Administration Agreement (the “Supervision and Administration Agreement” and together with the Investment Advisory Contract, the “Agreements”) with Pacific Investment Management Company LLC (“PIMCO”) on behalf of the PIMCO Balanced Income Fund, a new series of the Trust (the “New Fund”), for an initial two-year term.
The information, material factors and conclusions that formed the basis for the Board’s approvals are described below.
| 1. | INFORMATION RECEIVED |
(a) Materials Reviewed: The Trustees received a wide variety of materials relating to the services to be provided by PIMCO, both in connection with the New Fund’s meeting and the August 14, 2013 meeting at which the Trustees considered the renewal of the Agreements between PIMCO and the existing series of the Trust. The Board reviewed information relating to proposed fund operations, including the New Fund’s compliance program, shareholder services, valuation, custody, distribution, and other information relating to the nature, extent and quality of services proposed to be provided by PIMCO.1 In considering whether or not to approve the Agreements, the Board also reviewed materials provided by PIMCO, which included, among other things, comparative industry data with regard to expense ratios of funds with investment objectives and policies similar to those of the New Fund.2 The Board also reviewed material provided by counsel to the Trust and the Independent Trustees, which included, among other things, memoranda outlining legal duties of the Board.3 The Board also reviewed information about the personnel who would be providing investment management and administrative services to the New Fund.4
(b) Review Process: In connection with the approval of the Agreements, the Board reviewed written materials prepared by
1 Memorandum from Pacific Investment Management Company LLC to PIMCO Equity Series Board of Trustees regarding Approval of the Investment Advisory and Supervision and Administration Arrangements for the PIMCO Balanced Income Fund (October 28, 2013) (the “Proposal Memorandum”).
2 Lipper Comparative Fund Analysis included in the materials provided to the Board in connection with the Organizational Meeting of the Board of PIMCO Equity Series held on November 7, 2013 (the “Lipper Report”).
3 Memorandum from Dechert LLP to the Trustees of the PIMCO Equity Series, regarding Duties and Standards of Review in Connection with the Approval of the Investment Advisory and Supervision and Administration Arrangements for the PIMCO Balanced Income Fund (October 23, 2013) (the “Gartenberg Memo”).
4 Proposal Memorandum.
PIMCO, which included, among other things, comparative fee data prepared at the Board’s request by Lipper, Inc. (“Lipper”), an independent provider of investment company performance and fee and expense data.5 The Board also requested and received assistance and advice regarding applicable legal standards from Trust counsel.6 The Board also heard oral presentations on matters related to the Agreements.7 The approval determinations were made on the basis of each Trustee’s business judgment after consideration of all the information presented. Individual Trustees may have given different weights to certain factors and assigned various degrees of materiality to information received in connection with the approval process. In deciding to approve the Agreements, the Board did not identify any single factor or particular information that, in isolation, was controlling. This summary describes the most important, but not all, of the factors considered by the Board.
| 2. | NATURE, EXTENT AND QUALITY OF SERVICES |
(a) PIMCO, its Personnel, and Resources: The Board considered the depth and quality of PIMCO’s investment management process, including: the experience, capability and integrity of its senior management and other personnel; the turnover rates of its key personnel; the overall financial strength and stability of its organization; and the ability of its organizational structure to address the recent growth in PIMCO’s assets under management.8 The Board also considered that PIMCO makes available to its investment professionals a variety of resources and systems relating to investment management, compliance, trading, performance and portfolio accounting.9 The Board considered PIMCO’s commitment to investing in information technology supporting investment management and compliance, as well as PIMCO’s continuing efforts to attract and retain qualified personnel, including personnel with relevant equities experience, and to maintain and enhance its resources and systems.10 The Board considered PIMCO’s policies, procedures and systems to assure compliance with applicable laws and regulations and its commitment to these programs; its efforts to keep the Trustees informed about matters relevant to the New Fund and its shareholders; and its attention to matters that may involve conflicts of interest between the New Fund’s investments and those of other
5 Lipper Report.
6 Gartenberg Memo.
7 Minutes of the Organizational Meeting of the Board of Trustees of PIMCO Equity Series, on behalf of the PIMCO Balanced Income Fund, held on November 7, 2013 (the “Organizational Minutes”).
8 Id.
9 Id.
10 Id.
| ANNUAL REPORT | JUNE 30, 2014 | 123 |
Table of Contents
Approval of Investment Management Agreement (Cont.)
accounts.11 Ultimately, the Board concluded that the nature, extent and quality of services proposed to be provided by PIMCO under the Agreements are likely to benefit the New Fund and its shareholders.12
(b) Other Services: The Board considered the terms of the Trust’s Supervision and Administration Agreement, under which the New Fund will pay for the supervisory and administrative services it requires under what is essentially an all-in fee structure (the “unified fee”).13 In return, PIMCO would provide or procure supervisory and administrative services and bear the costs of various third party services required by the New Fund, including audit, custodial, portfolio accounting, legal, transfer agency and printing costs.14 The Board considered PIMCO’s provision of these services to other series of the Trust and its supervision of the Trust’s third party service providers to assure that these service providers continue to provide a high level of service relative to alternatives in the market.15
Ultimately, the Board concluded that the nature, extent and quality of the services to be provided by PIMCO would likely benefit the New Fund and its shareholders.
| 3. | INVESTMENT PERFORMANCE |
As the New Fund had not yet commenced operations at the time the Agreements were considered, the Trustees did not receive or consider investment performance information.
| 4. | ADVISORY FEES, SUPERVISORY AND ADMINISTRATIVE FEES AND TOTAL EXPENSES |
PIMCO reported to the Board that, in proposing fees for the New Fund or class of shares, it considers a number of factors, including the type and complexity of the services to be provided, the cost of providing services, the risk assumed by PIMCO in the provision of services, the impact on potential returns from different levels of fees, the competitive marketplace for financial products, and the attractiveness of potential returns to prospective investors in the New Fund.16 Fees proposed for the New Fund for advisory services and supervisory and administrative services may vary in light of these various factors.
The Board reviewed the proposed advisory fee, supervisory and administrative fee and estimated total expenses of the New Fund (each as a percentage of average net assets) and compared such amounts with the average and median fees and expense levels of other similar funds.17 With respect to advisory fees, the Board
11 Id.
12 Id.
13 Id.
14 Organizational Minutes.
15 Sections C.1 and F.1 of Renewal Proposal Memorandum.
16 Organizational Minutes.
17 Organizational Minutes; Proposal Memorandum; Lipper Report.
reviewed data from Lipper that compared the average and median advisory fees of other funds in a “Peer Group” of comparable funds, as well as the universe of other similar funds.18 The Board compared the New Fund’s total expenses to other funds in the Peer Group provided by Lipper and found the New Fund’s total expenses to be reasonable.19
At the time the Board considered the Agreements, PIMCO did not manage any separate accounts with similar investment strategies to the New Fund; therefore, the Board did not consider the fees charged by PIMCO to comparable separate accounts.20
The Board also considered the New Fund’s proposed supervisory and administrative fees, comparing them to similar funds in the report supplied by Lipper.21 The Board considered the Trust’s unified fee structure, under which the New Fund would pay for the supervisory and administrative services it requires for one set fee, and in return, PIMCO would provide or procure supervisory and administrative services and bear the costs of various third party services required by the New Fund, including audit, custodial, portfolio accounting, legal, transfer agency and printing costs.22 The Board considered that the unified supervisory and administrative fee leads to fund fees that are fixed, rather than variable.23 The Board concluded that the New Fund’s supervisory and administrative fees were reasonable in relation to the value of the services provided, including the services provided to different classes of shareholders, and that the expenses assumed contractually by PIMCO under the Supervision and Administration Agreement represent, in effect, a cap on overall fund expenses, which is beneficial to the New Fund and its shareholders.
The Board also noted that PIMCO had contractually agreed to reduce total annual fund operating expenses for each class of the New Fund by waiving a portion of its supervisory and administrative fee, or reimbursing the New Fund, to the extent that any organizational expenses and the pro rata share of the Trustees’ fees attributable to a class of the New Fund exceeds 0.49 basis points in any year.24 Furthermore, the Board noted that PIMCO had contractually agreed to reduce the New Fund’s advisory fee by 15 basis points through October 31, 2015.25
Based on the information presented by PIMCO and Lipper, members of the Board then determined, in the exercise of their business judgment, that the level of the advisory and supervisory and administrative fees to be charged by PIMCO, as well as the estimated total expenses of
18 Lipper Report; Organizational Minutes.
19 Id.
20 Organizational Minutes.
21 Lipper Report.
22 Organizational Minutes.
23 Id.
24 Proposal Memorandum.
25 Id.
| 124 | PIMCO EQUITY SERIES |
Table of Contents
(Unaudited)
the New Fund, are reasonable and approval of the Agreements would likely benefit the New Fund and its shareholders.
| 5. | ADVISER COSTS, LEVEL OF PROFITS AND ECONOMIES OF SCALE |
As the New Fund is newly organized, information regarding PIMCO’s costs in providing services to the New Fund and the profitability of PIMCO’s relationship with the New Fund was not available.
With respect to potential economies of scale, the Board noted that, although the unified fee structure does not have breakpoints, it implicitly reflects economies of scale by fixing the absolute level of the New Fund’s expenses at competitive levels from the outset, in effect, setting the fees as if the New Fund was already at scale.26
The Board concluded that the New Fund’s proposed cost structure was reasonable and that the unified fee structure inherently involves the sharing of economies of scale between PIMCO and the New Fund, to the benefit of the New Fund’s shareholders.
| 6. | ANCILLARY BENEFITS |
The Board considered other benefits received by PIMCO and its affiliates as a result of PIMCO’s relationship with the Trust, including possible ancillary benefits to PIMCO’s institutional investment
26 Organizational Minutes; Gartenberg Memo.
management business due to the reputation and market penetration of the Trust.27 The Board also considered that affiliates of PIMCO will provide distribution and shareholder services to the New Fund and its shareholders, for which they may be compensated under the unified fee, or through distribution fees paid pursuant to the New Fund’s Rule 12b-1 plans.28 The Board reviewed PIMCO’s soft dollar policies and procedures, noting that while PIMCO has the authority to receive the benefit of research provided by broker-dealers executing portfolio transactions on behalf of the New Fund, it has adopted a policy not to enter into contractual soft dollar arrangements.29
| 7. | CONCLUSIONS |
Based on its review, including its consideration of each of the factors referred to above, the Board concluded that the nature, extent and quality of the services to be rendered to the New Fund by PIMCO supported the approval of the Agreements. The Board concluded that the Agreements were fair and reasonable to the New Fund and its shareholders, that the New Fund’s shareholders would likely receive reasonable value in return for the advisory fees and other amounts paid to PIMCO by the New Fund, and that the approval of the Agreements was in the best interests of the New Fund and its shareholders.
27 Section E.6 of Renewal Proposal Memorandum.
28 Section D.10 of Renewal Proposal Memorandum.
29 Exhibit 6 of Supplemental 15(c) Materials.
| ANNUAL REPORT | JUNE 30, 2014 | 125 |
Table of Contents
General Information
Investment Adviser and Administrator
Pacific Investment Management Company LLC
650 Newport Center Drive
Newport Beach, CA 92660
Distributor
PIMCO Investments LLC
1633 Broadway
New York, NY 10019
Custodian
State Street Bank and Trust Company
801 Pennsylvania
Kansas City, MO 64105
Transfer Agent
Boston Financial Data Services
Institutional Class, Class P, Administrative Class, Class D
330 W. 9th Street, 5th Floor
Kansas City, MO 64105
Boston Financial Data Services
Class A, Class C, Class R
P.O. Box 55060
Boston, MA 02205-5060
Legal Counsel
Dechert LLP
1900 K Street, N.W.
Washington, D.C. 20006
Independent Registered Public Accounting Firm
PricewaterhouseCoopers LLP
1100 Walnut Street, Suite 1300
Kansas City, MO 64106
This report is submitted for the general information of the shareholders of the PIMCO Equity Series.
Table of Contents

Sign up for e-delivery
To get future shareholder reports online and to eliminate mailings, go to: pimco.com/edelivery
pimco.com/investments

PES3001AR_063014
Table of Contents
Item 2. | Code of Ethics. | |||||||||
As of the end of the period covered by this report, the Registrant has adopted a code of ethics (the “Code”) that applies to the Registrant’s principal executive officer and principal financial officer. The Registrant did not grant any waivers, including implicit waivers, from any provisions of the Code to the principal executive officer or principal financial officer during the period covered by this report. | ||||||||||
A copy of the Code is included as an exhibit to this report. | ||||||||||
Item 3. | Audit Committee Financial Expert. | |||||||||
(a) The Board of Trustees has determined that Peter B. McCarthy, who serves on the Board’s audit committee, qualifies as an “audit committee financial expert” as such term is defined in the instructions to this Item 3. The Board has also determined that Mr. McCarthy is “independent” as such term is interpreted under this Item 3. | ||||||||||
Item 4. | Principal Accountant Fees and Services. | |||||||||
(a) | Fiscal Year Ended | Audit Fees | ||||||||
June 30, 2014 | $ | 161,099 | ||||||||
June 30, 2013 | $ | 197,823 | ||||||||
(b) | Fiscal Year Ended | Audit-Related Fees | ||||||||
June 30, 2014 | $ | 4,500 | ||||||||
June 30, 2013 | 4,500 | |||||||||
(c) | Fiscal Year Ended | Tax Fees | ||||||||
June 30, 2014 | $ | 14,700 | ||||||||
June 30, 2013 | 6,000 | |||||||||
(d) | Fiscal Year Ended | All Other Fees(3) | ||||||||
June 30, 2014 | — | |||||||||
June 30, 2013 | — | |||||||||
| “Audit Fees” represents fees billed for each of the last two fiscal years for professional services rendered for the audit of the PIMCO Equity Series (the “Trust” or “Registrant”) annual financial statements for those fiscal years or services that are normally provided by the accountant in connection with statutory or regulatory filings or engagements for those fiscal years. | ||||||||||
| “Audit-Related Fees” represents fees billed for each of the last two fiscal years for assurance and related services reasonably related to the performance of the audit of the Trust’s annual financial statements for those years. | ||||||||||
| “Tax Fees” represents fees billed for each of the last two fiscal years for professional services related to tax compliance, tax advice and tax planning, including review of federal and state income tax returns, review of excise tax distribution requirements and preparation of excise tax returns. | ||||||||||
| “All Other Fees” represents fees, if any, billed for other products and services rendered by the principal accountant to the Trust for the last two fiscal years. | ||||||||||
(1) There were no “All Other Fees” for the last two fiscal years. | ||||||||||
(e) Pre-approval policies and procedures |
| |||||||||
(1) The Registrant’s Audit Committee has adopted pre-approval policies and procedures (the “Procedures”) to govern the Audit Committee’s pre-approval of (i) all audit services and permissible non-audit services to be provided to the Registrant by its independent accountant, and (ii) all permissible non-audit services to be provided by such independent accountant to the Registrant’s investment adviser and to any entity controlling, controlled by, or under common control with the investment adviser that provides ongoing services to the Registrant (collectively, the “Service Affiliates”) if the services provided directly relate to the Registrant’s operations and financial reporting. In accordance with the Procedures, the Audit Committee is responsible for the engagement of the independent accountant to certify the Registrant’s financial statements for each fiscal year. With respect to the pre-approval of non-audit services provided to the Registrant and its Service Affiliates, the Procedures provide that the Audit Committee may annually pre-approve a list of types or categories of non-audit services that may be provided to the Registrant or its Service Affiliates, or the Audit Committee may pre-approve such services on a project-by-project basis as they arise. Unless a type of service has received general pre-approval, it will require specific pre-approval by the Audit Committee if it is to be provided by the independent accountant. The Procedures also permit the Audit Committee to delegate authority to one or more of its members to pre-approve any proposed non-audit services that have not been previously pre-approved by the Committee, subject to the ratification by the full Audit Committee no later than its next scheduled meeting. | ||||||||||
(2) With respect to the services described in paragraphs (b) through (d) of this Item 4, no amount was approved by the Audit Committee pursuant to paragraph (c)(7)(i)(C) of Rule 2-01 of Regulation S-X. | ||||||||||
(f) Not applicable. | ||||||||||
(g) | ||||||||||
| Aggregate Non-Audit Fees Billed to Entity | ||||||||
Entity | June 30, 2014 | June 30, 2013 | ||||||
PIMCO Equity Series | $ | 19,200 | $ | 10,500 | ||||
Pacific Investment Management Company LLC (“PIMCO”) | 6,674,889 | 5,051,773 | ||||||
Allianz Global Investors Fund Management LLC | 1,210,657 | 650,655 | ||||||
Allianz Asset Management of America L.P. | 4,621,625 | 4,771,197 | ||||||
|
|
|
| |||||
Totals | $ | 12,526,371 | $ | 10,484,125 | ||||
|
|
|
| |||||
(h) The Registrant’s Audit Committee has considered whether the provision of non-audit services that were rendered to the Registrant’s investment adviser, and any entity controlling, controlled by, or under common control with the investment adviser that provides ongoing services to the Registrant which were not pre-approved (not requiring pre-approval) is compatible with maintaining the principal accountant’s independence. | ||||||||
Item 5. | Audit Committee of Listed Registrants. | |||||||
The Registrant has a separately-designated standing audit committee established in accordance with Section 3(a)(58)(A) of the Securities Exchange Act of 1934, as amended. The audit committee is comprised of:
E. Philip Cannon; Allan B. Hubbard; Peter B. McCarthy | ||||||||
Item 6. | Schedule of Investments. | |||||||
| The Schedule of Investments is included as part of the report to shareholders under Item 1. | ||||||||
Table of Contents
Item 7. | Disclosure of Proxy Voting Policies and Procedures for Closed-End Management Investment Companies. | |||||
| Not applicable. | ||||||
Item 8. | Portfolio Managers of Closed-End Management Investment Companies. | |||||
| Not applicable. | ||||||
Item 9. | Purchases of Equity Securities by Closed-End Management Investment Company and Affiliated Purchases. | |||||
| Not applicable. | ||||||
Item 10. | Submission of Matters to a Vote of Security Holders. | |||||
| Not applicable. | ||||||
Item 11. | Controls and Procedures. | |||||
| (a) | The principal executive officer and principal financial officer have concluded that the Registrant’s disclosure controls and procedures (as defined in Rule 30a-3(c) under the Investment Company Act of 1940, as amended (“1940 Act”)) provide reasonable assurances that material information relating to the Trust is made known to them by the appropriate persons, based on their evaluation of these controls and procedures as of a date within 90 days of the filing of this report. | |||||
| (b) | There were no changes in the Registrant’s internal control over financial reporting (as defined in Rule 30a-3(d) under the 1940 Act) that occurred during the second fiscal quarter of the period covered by this report that have materially affected, or are reasonably likely to materially affect, the Registrant’s internal control over financial reporting. | |||||
Item 12. | Exhibits. | |||||
(a)(1) | Exhibit 99.CODE—Code of Ethics pursuant to Section 406 of the Sarbanes-Oxley Act of 2002. | |||||
(a)(2) | Exhibit 99.CERT—Certifications pursuant to Section 302 of the Sarbanes-Oxley Act of 2002. | |||||
(b) | Exhibit 99.906CERT—Certifications pursuant to Section 906 of the Sarbanes-Oxley Act of 2002. | |||||
Table of Contents
Signatures
Pursuant to the requirements of the Securities Exchange Act of 1934 and the Investment Company Act of 1940, the registrant has duly caused this report to be signed on its behalf by the undersigned, thereunto duly authorized.
| PIMCO Equity Series | ||
| By: | /s/ PETER G. STRELOW | |
Peter G. Strelow | ||
| Principal Executive Officer | ||
| Date: August 27, 2014 | ||
Pursuant to the requirements of the Securities Exchange Act of 1934 and the Investment Company Act of 1940, this report has been signed below by the following persons on behalf of the registrant and in the capacities and on the dates indicated.
| By: | /s/ PETER G. STRELOW | |
Peter G. Strelow | ||
| Principal Executive Officer | ||
| Date: August 27, 2014 | ||
| By: | /s/ TRENT W. WALKER | |
Trent W. Walker | ||
| Treasurer, Principal Financial Officer | ||
| Date: August 26, 2014 | ||